BRCFS Technical Summary Report - Queensland ...
142
Technical Summary Report Comprehensive Hydrologic and Hydraulic Assessments Brisbane River Catchment Flood Study Prepared for the State of Queensland FINAL
-
Upload
khangminh22 -
Category
Documents
-
view
2 -
download
0
Transcript of BRCFS Technical Summary Report - Queensland ...

Technical Summary ReportComprehensive Hydrologic and Hydraulic Assessments Brisbane River Catchment Flood Study
Prepared for the State of Queensland
FINAL
B:\B20702 BRCFS Hydraulics\__ Admin\R.B20702.007.02.MR7.Technical Summary_FINAL.docx FINAL
BRCFS Technical Summary Report
Hydrologic and Hydraulic Assessments
Prepared for: State of Queensland
Prepared by: BMT WBM Pty Ltd (Member of the BMT group of companies)
Offices
Brisbane Denver London Mackay Melbourne Newcastle Perth Sydney Vancouver
B:\B20702 BRCFS Hydraulics\__ Admin\R.B20702.007.02.MR7.Technical Summary_FINAL.docx FINAL
Document Control Sheet
BMT WBM Pty Ltd Level 8, 200 Creek Street Brisbane Qld 4000 Australia PO Box 203, Spring Hill 4004
Tel: +61 7 3831 6744 Fax: + 61 7 3832 3627
ABN 54 010 830 421
www.bmtwbm.com.au
Document: R.B20702.007.02.MR7.TechnicalSummary_FINAL.docx
Title: BRCFS Technical Summary Report - Hydrologic and Hydraulic Assessments
Project Manager: Bill Syme
Author: BMT WBM: Bill Syme, Cathie Barton, Barry Rodgers
Aurecon: Rob Ayre, Luke Toombes
Deltares: Ferdinand Diermanse
Client: State of Queensland
Client Contact: Dr Wai-Tong Wong (DNRM)
Dr Pushpa Onta (DNRM)
Client Reference: DILGP-2327-14
Synopsis: A Technical Summary Report for the Brisbane River Catchment Flood Study (BRCFS) providing
an overview of the Hydrologic and Hydraulic Assessments
REVISION/CHECKING HISTORY
Revision Number
Date Checked by Issued by
0 4th November 2016 CLB WJS
1 14th December 2016 CLB WJS
2 13th February 2017 CLB WJS
RPEQ CERTIFICATION
Hydrologic Assessment Robert Ayre – 04887
Hydraulic Assessment Cathie Barton – 18071
DISTRIBUTION
Destination Revision
0 1 2 3 4 5 6 7 8 9 10
State of Queensland
BMT WBM File
BMT WBM Library
B:\B20702 BRCFS Hydraulics\__ Admin\R.B20702.007.02.MR7.Technical Summary_FINAL.docx FINAL
Acknowledgements
This report has been prepared as part of the Brisbane River Catchment Flood Study which was funded by
the Queensland State Government, Brisbane City Council, Ipswich City Council, Somerset Regional Council
and Lockyer Valley Regional Council.
The on-going involvement and review by the Technical Working Group, consisting of the following
organisations, are appreciated:
Department of Natural Resources and Mines
Department of Science, Information Technology and Innovation
Department of Energy and Water Supply
Department of Infrastructure, Local Government and Planning
Queensland Reconstruction Authority (post June 2016)
Seqwater
Brisbane City Council
Ipswich City Council
Somerset Regional Council
Lockyer Valley Regional Council
Bureau of Meteorology.
Copyright Notice
“The State of Queensland [Department of Natural Resources and Mines] supports and encourages the dissemination and exchange of information provided in this publication and has endorsed the use of the Australian Governments' Open Access and Licensing Framework.
Save for the content on this website supplied by third parties, the Department logo, the Queensland Coat of Arms, any material protected by a trademark, XXXX [ie third party copyright material] and where otherwise noted, The Department has applied the Creative Commons Attribution 4.0 International licence. The details of the relevant licence conditions are available on the Creative Commons website (accessible using the links provided) as is the full legal code for the CC BY 4.0 International licence.
The parties assert the right to be attributed as authors of the original material in the following manner: © State of Queensland [Department of Natural Resources and Mines] 2017
As far as practicable, third party material has been clearly identified. The Department has made all reasonable efforts to ensure that this material has been reproduced on this website with the full consent of the copyright owners. Their permission may be required to use the material.”
BRCFS Technical Summary Report - Hydrologic and Hydraulic Assessments i
Caveats and Use of Report
B:\B20702 BRCFS Hydraulics\__ Admin\R.B20702.007.02.MR7.Technical Summary_FINAL.docx FINAL
Caveats and Use of Report
This report is the Technical Summary Report for the Brisbane River Catchment Flood Study (BRCFS). The
document provides an overview of the Hydrologic and Hydraulic Assessments and draws out key concepts
and findings.
It should be noted that this Study is for the assessment of riverine flooding downstream of Wivenhoe Dam.
For local creek flooding refer to the local councils.
For readers who desire more detail, refer to the series of detailed technical reports as follows (for references
see Section 12.1):
Hydrologic Assessment Technical Reports:
Hydrologic Milestone Report 1: Data, Rating Curve and Historical Review Report.
Hydrologic Milestone Report 2: Hydrologic Model Calibration and Validation Review Report.
Hydrologic Milestone Report 3: Hydrologic Model Recalibration Report.
Hydrologic Milestone Report 4: Assessment of Implications of Climate Change on Flood Estimation.
Hydrologic Milestone Report 5: Dam Operations Module Implementation Report.
Hydrologic Milestone Report 6: Flood Frequency Analysis Report.
Hydrologic Milestone Report 7: Design Event Approach Report.
Hydrologic Milestone Report 8: Monte Carlo Simulation Report.
Hydrologic Milestone Report 9: Reconciled and Recommended Flood Frequency Estimates Report.
Hydrologic Milestone Report 10: Draft Final Hydrology Report
Hydraulic Assessment Technical Reports:
Hydraulic Milestone Report 1: Data Review and Modelling Methodology
Hydraulic Milestone Report 2: Fast Model Development and Calibration
Hydraulic Milestone Report 3: Detailed Model Development and Calibration
Hydraulic Milestone Report 4: Fast Model Results and Design Events Selection
Hydraulic Milestone Report 5: Detailed Model Results
Hydraulic Milestone Report 6: Hydraulics Report
BRCFS Technical Summary Report - Hydrologic and Hydraulic Assessments ii
Executive Summary
B:\B20702 BRCFS Hydraulics\__ Admin\R.B20702.007.02.MR7.Technical Summary_FINAL.docx FINAL
Executive Summary
Introduction
The Queensland Floods Commission of Inquiry Final Report issued in March 2012, contains a
recommendation 2.2 to conduct a flood study of the Brisbane River catchment. In accordance with this
recommendation, the State of Queensland has undertaken the Brisbane River Catchment Flood Study
(BRCFS) in phases:
Phase 1: Data Collection, Collation, Review and Storage of Existing Data
Phase 2A: Comprehensive Hydrologic Assessment
Phase 2B: Comprehensive Hydraulic Assessment
Following the completion of the BRCFS the Brisbane River Catchment Floodplain Management Study
(BRCFMS) and Brisbane River Catchment Strategic Floodplain Management Plan (BRCSFMP) are to be
carried out. This Technical Summary Report presents an overview of Phases 2A and 2B, namely the
Hydrologic and Hydraulic Assessments.
The Hydrologic and Hydraulic Assessments were carried out in accordance with their respective Invitations
to Offer (the study briefs or ITOs). The work was advised and reviewed by a Technical Working Group
(TWG) and an Independent Panel of Experts (IPE), and overseen by a Steering Committee under a
governance arrangement with most members involved for the full duration of the BRCFS. The Department
of Infrastructure, Local Government and Planning (DILGP) administered the assessments along with the
Department of Natural Resources and Mines (DNRM) as project manager. A key requirement was that the
Hydrologic and Hydraulic Assessments interfaced closely.
The assessments are the most comprehensive, up-to-date and accurate analysis of Brisbane River riverine
flooding. The latest available data was used to develop computer models, and these models were validated
by calibrating and verifying their results against well documented historical floods. Industry leading
techniques were used to derive floods of different probability of occurrence that take into account the effects
on flood behaviour caused by variations in: rainfall and antecedent catchment conditions; Somerset and
Wivenhoe Dam reservoir levels and operations; and ocean tidal conditions. The outcome is best practice
hydrologic and hydraulic modelling that provides reliable information and a sound foundation for the
BRCFMS and BRCSFMP.
Objective
As stated in the ITOs, the objective and scope of the BRCFS is to “provide an up-to-date, consistent, robust
and agreed set of methodologies (including hydrologic and hydraulic models) and flood estimation for the
Brisbane River catchment and is being undertaken as the Queensland Government’s response to the
Recommendation 2.2 of the Queensland Floods Commission of Inquiry (QFCI) Final Report.” The intent
being to deliver best practice estimates of Brisbane River flooding for different probabilities of occurrence, for
example, the 1 in 100 AEP (Annual Exceedance Probability) flood, which has a 1% chance of being equalled
or exceeded within every year.
BRCFS Technical Summary Report - Hydrologic and Hydraulic Assessments iii
Executive Summary
B:\B20702 BRCFS Hydraulics\__ Admin\R.B20702.007.02.MR7.Technical Summary_FINAL.docx FINAL
Achieving the above objective requires:
Calibrated hydrologic models that convert catchment rainfall into creek/river flow at various points of
interest, and includes representations of different forms of flood storage (e.g. floodplains, reservoirs).
Development and application of state-of-the-art methods and analytical techniques that provide best
practice estimates of flood flows and volumes for a wide range of exceedance probabilities across the
entire Brisbane River catchment system.
A high resolution, calibrated hydraulic model that accurately defines the flood behaviour of the Brisbane
River below Wivenhoe Dam, and the lower sections of the major tributaries of Lockyer Creek and the
Bremer River, for a wide range of floods from small to extreme. The hydraulic model must be able to
accurately simulate the flood progression and produce flood levels, depths and velocities (water speeds)
along the waterways and over the floodplains.
Leading edge and innovative statistical analyses to derive synthetic floods of different AEPs that take into
account the complexity and variability of Brisbane River catchment flooding.
Rating curve consistency where the hydrologic modelling transitions to the hydraulic modelling. For the
two types of modelling to be compatible in the transition from hydrologic to hydraulic modelling, the
stage-discharge relationship (water level versus flow relationship, i.e. a rating curve) must be consistent
between both types of modelling.
The BRCFS has engaged a wide-ranging and thorough approach by encompassing the latest proven and
established techniques; innovation through use of the Monte Carlo Simulation method; and model testing
through validation to historical floods.
Of special note is the Monte Carlo Simulation method, which is used for calculating probabilities of
“something” occurring (e.g. a flood) when there are uncertainties and/or variability in the variables that
combine to produce that “something”. For flooding, it is applied by generating thousands of synthetic floods
based upon random sampling of variables, such as rainfall, dryness of the catchment and dam reservoir
levels. From this database of synthetic floods a probabilistic analysis can be carried out to determine the
AEP of a flood.
By taking this wide-ranging and thorough approach in scope, along with an exceptionally high level of
technical review via the Technical Working Group (TWG) and Independent Panel of Experts (IPE), the
BRCFS is the most complex and comprehensive flood study undertaken in Australia to-date.
Riverine versus Local Flooding
The focus of the BRCFS is to quantify flooding caused by Brisbane River riverine flooding, which includes
areas that experience inundation caused or exacerbated by elevated water levels in the Brisbane River.
Therefore, the lower sections of Lockyer Creek and the Bremer River extending up into Warrill and Purga
Creeks, and all smaller side tributaries, need to be included in the hydraulic modelling.
Localised flooding caused by concentrated rainfall within a tributary’s catchment, is a different flooding
mechanism, and may cause higher or lower flood levels, and different flood behaviour compared with riverine
flooding. For example, a local creek may be prone to flash flooding with little warning time and rapidly rising
flood levels, which contrasts with riverine flooding that rises slowly and steadily as the Brisbane River rises.

BRCFS Technical Summary Report - Hydrologic and Hydraulic Assessments iv
Executive Summary
B:\B20702 BRCFS Hydraulics\__ Admin\R.B20702.007.02.MR7.Technical Summary_FINAL.docx FINAL
The modelling carried out for the BRCFS is for Brisbane River riverine flooding, and not for local flooding.
When information is sought on flooding in Brisbane River tributaries, both riverine and local flooding needs to
be considered, with advice sought from the local council in regards to local flooding.
Outcomes
Key outcomes from the BRCFS Hydrologic and Hydraulic Assessments are:
Calibrated hydrologic models for deriving floods from design rainfall events covering the entire Brisbane
River Catchment, and which interface with the hydraulic modelling.
A simplified Wivenhoe and Somerset Dam operations model integrated with the hydrologic models,
allowing the hydrologic simulation of the entire Brisbane River catchment.
A framework integrating the hydrologic and dam operation models for generating tens of thousands of
synthetic rainfall and storm tide events, from which flood flow estimates for different AEPs using the
Monte Carlo Simulation (MCS) method are derived. The framework also considers the joint probability of
floods occurring in the Brisbane and Bremer Rivers (and other major tributaries as appropriate). The
Monte Carlo/joint probability analysis framework is the most comprehensive, leading-edge analysis of its
kind in Australia.
A hydraulic model (the Fast Model) that simulates a flood in around 5 minutes. The model is capable of
accurately reproducing the flood behaviour along the main rivers and creeks including the Brisbane River
below Wivenhoe Dam, and the lower sections of Lockyer Creek and the Bremer River. It was used for
deriving estimates of different flood level AEPs using the Monte Carlo method.
The Detailed Model, the most comprehensive and accurate hydraulic model yet developed for simulating
riverine flooding caused by the Brisbane River below Wivenhoe Dam, including that which occurs in the
lower sections of Lockyer Creek, the Bremer River and other downstream creek tributaries that are
subject to flooding from high levels in the Brisbane River. The model is of a much higher resolution and
accuracy than the Fast Model, and is therefore not suited for use in a Monte Carlo analysis due to its long
compute times. The Detailed Model was designed and is used for producing high quality hydraulic output
at a fine resolution and accuracy for different AEPs, including flood levels, depths and velocities.
Successful calibration and verification of the hydrologic and hydraulic models to the historical floods of
1974, 1996, 1999, 2011, 2013 and tidal conditions, using in each model a single set of industry standard
parameters. The calibration and verification of models was highly meticulous, involving the matching of
the models’ results with thousands of flood level recordings and flow measurements.
The development of a Monte Carlo statistical analysis for deriving indicative peak flood levels for different
AEPs using the results from the Fast Model for tens of thousands of synthetic floods.
The development of a process for selecting a small sub-set of the synthetic floods that are representative
of the AEP peak flood levels derived from the Monte Carlo analysis. The resulting 60 synthetic floods
cover 11 AEPs from the 1 in 2 to the 1 in 100,000 AEP, with each AEP being an ensemble of 4 to 7
synthetic floods. The peak flood level at any one location is taken as the highest flood level of all the
floods in an ensemble.
The 60 synthetic floods were simulated through the Detailed Model to produce high resolution maps of
peak flood levels, depths, velocities and hazard, and other outputs including tables of peak levels and
BRCFS Technical Summary Report - Hydrologic and Hydraulic Assessments v
Executive Summary
B:\B20702 BRCFS Hydraulics\__ Admin\R.B20702.007.02.MR7.Technical Summary_FINAL.docx FINAL
flows and a variety of charts. The Detailed Model and its results form the hydraulic modelling foundation
for the BRCFMS.
Sensitivity tests were carried out using the Detailed Model to provide indicative estimates on changes to
flood behaviour resulting from: (a) a hypothetical future floodplain development case; (b) potential climate
change influence on storm rainfall intensity and ocean levels; (c) Brisbane River bed level changes; and
(d) the effect of the major dams on historical floods. These tests provide insight to the likely change in
flood levels, flow patterns and hydraulic hazard as a consequence of these scenarios.
Stream flow rating curves at gauging stations that were revised for the Hydrologic Assessment have been
reconciled and are in alignment with the Hydraulic Assessment. This adds increased confidence to the
quality and limitations of use of the rating curves for dam operations, and for flood forecasting and
warning.
Hydrologic Assessment
The Hydrologic Assessment developed and applied consistent and robust hydrologic models using rainfall-
runoff-routing software known as URBS. This software simulates rainfall falling on catchments to produce
surface runoff and the accumulation of runoff to streams as flood flow. The assessment then used analytical
techniques to provide the best estimates of flood flows and flood volumes for different probabilities of
occurrence across the entire Brisbane River catchment. A simplified Wivenhoe and Somerset Dam
operations model based on certain assumptions was developed and integrated within the hydrologic
modelling. The outcomes from the Hydrologic Assessment are a critical input to the Hydraulic Assessment.
Hydrologic Assessment Approach
Three approaches were used to estimate peak discharges and flow volumes throughout the catchment for a
range of AEPs, followed by a reconciliation of the results from the three methods to arrive at best estimates
of the different AEP flows at locations across the catchment. The three methods utilised are known as the:
Flood Frequency Analysis (FFA)
Design Event Approach (DEA)
Monte Carlo Simulation (MCS) method
MCS is the only approach that is able to meet the objectives of the BRCFS. However, MCS is relatively new
to flood modelling, so the first two industry established approaches were used to demonstrate and reconcile
whether MCS produces defendable results by comparison of the three methods at locations within the
catchment unaffected by dams.
DEA and MCS are both referred to as ‘rainfall based methods’, as they both rely on rainfall statistics in
combination with a rainfall-runoff (hydrologic) model to compute peak flows and flow volumes at locations of
interest. For FFA, peak flows and flow volumes for given AEPs are derived directly from statistical analysis
of estimated historical flood flows from observed historical flood levels at stream gauging sites and the
corresponding gauge rating curves.
MCS uses probability distributions of variables (unknowns) to generate large data sets of synthetic floods. In
effect, MCS is akin to generating thousands of years of synthetic flood records from which, for example, the
1 in 100 AEP flood flow or level can be derived. MCS was efficiently implemented in a Delft-FEWS
framework.
BRCFS Technical Summary Report - Hydrologic and Hydraulic Assessments vi
Executive Summary
B:\B20702 BRCFS Hydraulics\__ Admin\R.B20702.007.02.MR7.Technical Summary_FINAL.docx FINAL
The MCS approach for deriving different AEP flood flow and level estimates has significant advantages over
traditional approaches in that it can consider relevant physical processes that contribute to flooding. The
MCS technique is particularly applicable to the Brisbane River catchment as it can cater for variations in
factors that influence river flooding, namely variations in: spatial and temporal rainfall; antecedent (wet to dry)
catchment conditions; initial reservoir levels; dam operations; and storm surge and tidal conditions. MCS
can also address joint probability of occurrence of variables such as flows in the Brisbane and Bremer
Rivers. The main practical disadvantage of using MCS is that it is more complex and time-consuming to
implement, however, these challenges were overcome in the BRCFS through innovative developments in
both the Hydrologic and Hydraulic Assessments.
Two scenarios were examined in the Hydrologic Assessment: a ‘no-dams condition’ and a ‘with-dams
condition’. The dams referred to are Somerset Dam and Wivenhoe Dam, both of which have flood mitigation
capability in addition to water supply functions, as well as Cressbrook Creek, Lake Manchester, Moogerah
and Perseverance dams. These latter four dams do not actively provide flood mitigation, but can have a
measurable but minor influence on flooding depending on the level of their reservoirs at the onset of a flood.
For the ‘no-dams condition’, DEA and MCS results were generated for 22 hydrologic reporting locations
across the entire Brisbane River catchment. FFA results were produced for 18 locations, as other locations
had limited or no reliable available historical (observed) data, which is required for undertaking an FFA.
For the ‘with-dams condition’, the number of years of historical records available since the construction of
Wivenhoe Dam is not sufficient to justify conducting an FFA, as an FFA is a statistical assessment requiring
a sufficient period of record. Further, industry standard flood frequency analyses are not necessarily
appropriate for sites influenced by flood mitigation dams. Therefore, only DEA and MCS results were
generated for the ‘with-dams condition’, although these estimates were compared against available rated
flow records where possible. The ‘with-dams condition’ estimates were derived for the Stanley River at
Somerset Dam; six locations along the Lower Brisbane River: Wivenhoe Dam, Savages Crossing, Mt Crosby
Weir, Moggill, Centenary Bridge and Brisbane City; and for the Bremer River at Ipswich.
For both the ‘no-dams condition’ and ‘with-dams condition’, the flow estimates for varying AEPs from the
different methods were reconciled at each location to arrive at the best estimate of flow versus AEP.
Hydrologic Assessment Outcomes
The Hydrologic Assessment outputs and findings are summarised as follows:
Recalibrated hydrologic models of the sub-catchments, suitable for AEP flood estimation by DEA and
Monte Carlo Simulation (MCS) for the no-dams and with-dams scenarios.
Estimates of different AEP peak flood flows and volumes ranging from the 1 in 2 AEP to extreme floods
for PMP rainfall (the largest rainfall depth that could conceivably occur over the catchment). These
estimates were produced for the ‘no-dams condition’ and the ‘with-dams condition’ at locations across the
catchment.
Ensembles of statistically generated AEP flood hydrographs (i.e. time history of flow) suitable for input to
hydraulic models.
Ensembles of statistically generated AEP ocean water level hydrographs, including a storm surge
component, suitable for input to hydraulic models.
BRCFS Technical Summary Report - Hydrologic and Hydraulic Assessments vii
Executive Summary
B:\B20702 BRCFS Hydraulics\__ Admin\R.B20702.007.02.MR7.Technical Summary_FINAL.docx FINAL
Flood flow estimates at locations across the catchment for a range of AEPs based upon the standard
DEA currently used by the industry.
Estimates of peak flow and flood volume flood frequency curves (and their confidence limits) at the
nominated locations.
Stream gauge rating curves for key gauging station locations adopted for the hydrologic study.
An evaluation of the overall performance of three alternative methods: FFA, DEA and MCS over the
range of floods investigated.
Estimates of the AEP of significant historic (actual) floods.
A comparison of the combined effect of the dams shows that the dams can reduce peak flow rates for the
1 in 100 AEP flood by 29% to 42% immediately downstream of Wivenhoe Dam, with this effect
diminishing downstream. The mitigation effect of the dams on Brisbane River flows extends over the full
range of flood magnitudes, but lessens for larger floods. Flows in Lockyer Creek are not affected outside
the areas influenced by flooding from the Brisbane River. For the ‘with-dams’ scenario, Moogerah Dam
slightly reduces peak flows in the Bremer River.
The estimates derived from MCS reflect the wide range of natural variability in contributing factors such
as: rainfall depth and distribution in time and space; antecedent catchment conditions including
catchment wetness (rainfall loss rates); and initial reservoir levels. Available records of past floods do not
cover this wide range of variability, and traditional methods of flood estimation have thus proved
inadequate for the Brisbane River catchment.
Hydraulic Assessment
Using outputs from the Hydrologic Assessment, the Hydraulic Assessment used hydraulic models to produce
flood levels, depths and velocities along the waterways and over the floodplains. Two hydraulic models were
developed and calibrated using the TUFLOW software, namely: the Fast Model and the Detailed Model. The
Fast Model is a simplistic model designed for use in a MCS, while the Detailed Model is intended for high
resolution, accurate calculation of flood behaviour.
Hydraulic Models
The Fast Model is a purely one-dimensional (1D) hydraulic model with a target run time of 15 minutes or less
per simulation as specified in the ITO. 1D models use the most simplified form of the free-surface fluid flow
equations and are quick to compute. The Fast Model’s primary purpose is to simulate thousands of
synthetically generated floods for a Monte Carlo analysis (hence the need for a quick compute time). The
peak flood levels from these synthetic floods were used to determine AEP flood levels at locations
downstream of Wivenhoe Dam.
The Detailed Model is a 1D/2D hydraulic model that is designed to reproduce the hydraulic behaviour of the
rivers, creeks and floodplains at a significantly higher resolution and accuracy than the 1D only Fast Model.
The Detailed Model primarily uses the 2D form of the free-surface fluid flow equations, which are significantly
more accurate in reproducing complex flow effects (such as occurs in the Brisbane River) than the 1D form,
but take significantly longer to compute. The Detailed Model is used for producing flood maps and 3D
surfaces of flood levels, depths, velocities and hydraulic hazard (a component of flood risk).
The Fast and Detailed Models were calibrated and verified to five historical floods, namely those of 1974,
1996, 1999, 2011 and 2013, and to tidal conditions with no flood flows. The calibration parameters were
BRCFS Technical Summary Report - Hydrologic and Hydraulic Assessments viii
Executive Summary
B:\B20702 BRCFS Hydraulics\__ Admin\R.B20702.007.02.MR7.Technical Summary_FINAL.docx FINAL
derived through thousands of simulations testing different combinations, whilst remaining consistent with
Brisbane River’s physical characteristics. Importantly, the final parameters are consistent with industry
standard values, and for each model, a single set of parameters produces a reproduction of all five historical
floods across all flow regimes ranging from tidal flows to the major floods of 1974 and 2011.
Both Fast and Detailed Models were subject to rigorous internal quality assurance processes including
model reviews and checks for consistency on modelled volumes and mass error. All simulated floods
performed within the acceptable criteria as stipulated in the ITO and the hydraulic modelling calibration has
been endorsed by the IPE. As such, the results from the hydraulic modelling should be considered
significantly more reliable than any previous regional scale Brisbane River hydraulic assessment.
Monte Carlo Peak Flood Level Analysis
After completion of the Fast Model’s development and calibration, approximately 1.1 million hydrographs1,
including outflows from Wivenhoe Dam, were transferred from the Hydrologic Assessment’s MCS to simulate
11,3402 synthetic floods through the Fast Model. Peak flood levels and hydrographs from the 11,340
simulations were extracted at 28 hydraulic reporting locations distributed along the main rivers and creeks. A
Monte Carlo peak flood level statistical analysis was undertaken at each location to determine indicative AEP
flood levels.
From the 11,340 synthetic floods, 60 were selected that together are representative of the Fast Model AEP
peak flood levels at all 28 locations, across 11 AEPs ranging from 1 in 2 to 1 in 100,000 AEP. Each AEP is
represented not by a single flood, but by an ensemble made up of 4 to 7 floods. Representation of the
variation in rainfall duration and catchment response was also taken into consideration in selecting the 60
floods through manual checks of other factors, such as rate of rise, hydrograph shape and volume.
The 60 synthetic floods that make up the 11 AEP ensembles were simulated through the Detailed Model to
produce hydraulic outputs for each AEP ensemble. The hydraulic output types are peak flood level, depth,
velocity and hydraulic hazard. Hydraulic hazard is the depth multiplied by velocity; a measure of the hazard
of deep and/or fast flowing water. The peaks of each output type are tracked independently throughout each
synthetic flood, therefore the peak flow, peak velocity, or peak hydraulic hazard, may not occur at the same
time as the peak level.
AEP Flood Levels and Results
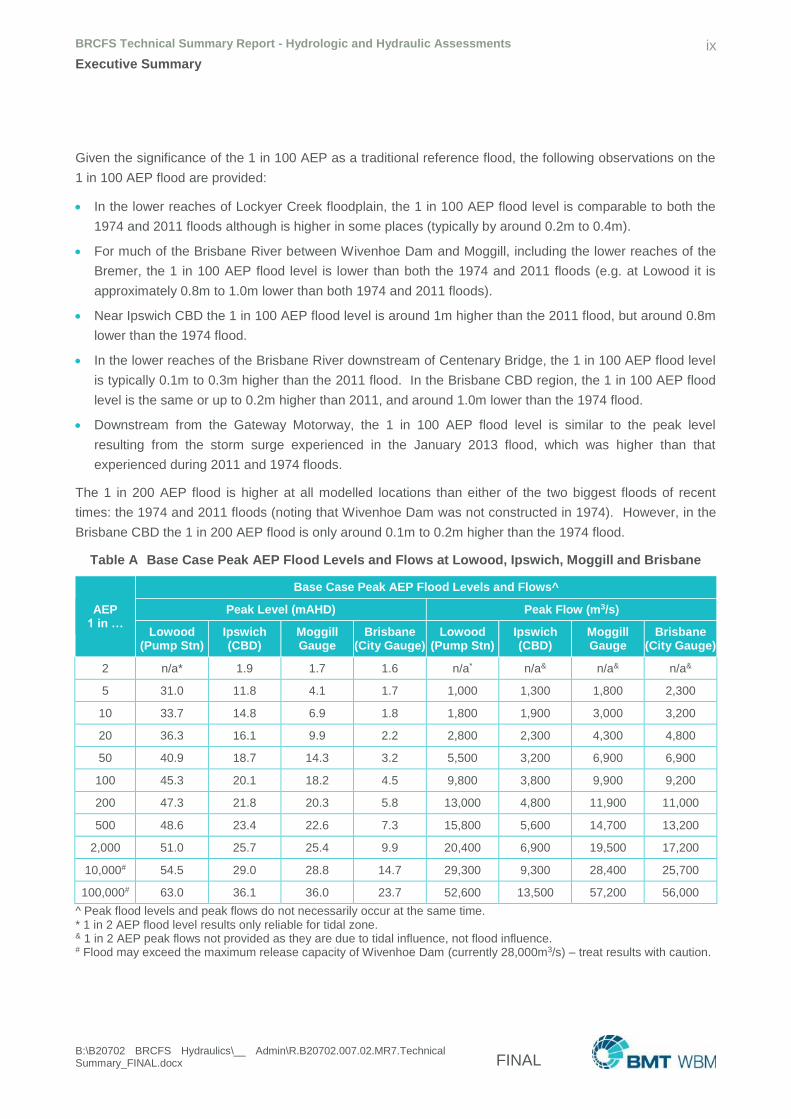
Table A provides a summary of the AEP peak flood levels and flows as calculated by the Detailed Model at
Lowood, Ipswich, Moggill and Brisbane CBD for the Base Case, which represents present day (2015)
conditions.
It is important to note that floods will occur that exceed the 1 in 100 AEP flood level, and provision for this
residual risk should be taken into account. Due to the nature of the Brisbane River being an incised river
system with only minor floodplains, the residual risk can be substantial with significant increases in flood
levels and flood extent between AEPs. For rare floods (e.g. 1 in 500 AEP, or 1 in 2,000 AEP) the flood levels
are a few metres higher and the flood extent is much larger. The 1 in 500 AEP flood has a rare chance of
occurring in one year, but the chance of 1 in 500 AEP flood level occurring within a 50 year exposure period
is about 10%.
1 Approximately 100 inflow hydrographs for each of the 11,340 events. 2 Consists of 21 simulations per AEP for 60 AEPs; and 9 event durations (12 hours to 168 hours).
BRCFS Technical Summary Report - Hydrologic and Hydraulic Assessments ix
Executive Summary
B:\B20702 BRCFS Hydraulics\__ Admin\R.B20702.007.02.MR7.Technical Summary_FINAL.docx FINAL
Given the significance of the 1 in 100 AEP as a traditional reference flood, the following observations on the
1 in 100 AEP flood are provided:
In the lower reaches of Lockyer Creek floodplain, the 1 in 100 AEP flood level is comparable to both the
1974 and 2011 floods although is higher in some places (typically by around 0.2m to 0.4m).
For much of the Brisbane River between Wivenhoe Dam and Moggill, including the lower reaches of the
Bremer, the 1 in 100 AEP flood level is lower than both the 1974 and 2011 floods (e.g. at Lowood it is
approximately 0.8m to 1.0m lower than both 1974 and 2011 floods).
Near Ipswich CBD the 1 in 100 AEP flood level is around 1m higher than the 2011 flood, but around 0.8m
lower than the 1974 flood.
In the lower reaches of the Brisbane River downstream of Centenary Bridge, the 1 in 100 AEP flood level
is typically 0.1m to 0.3m higher than the 2011 flood. In the Brisbane CBD region, the 1 in 100 AEP flood
level is the same or up to 0.2m higher than 2011, and around 1.0m lower than the 1974 flood.
Downstream from the Gateway Motorway, the 1 in 100 AEP flood level is similar to the peak level
resulting from the storm surge experienced in the January 2013 flood, which was higher than that
experienced during 2011 and 1974 floods.
The 1 in 200 AEP flood is higher at all modelled locations than either of the two biggest floods of recent
times: the 1974 and 2011 floods (noting that Wivenhoe Dam was not constructed in 1974). However, in the
Brisbane CBD the 1 in 200 AEP flood is only around 0.1m to 0.2m higher than the 1974 flood.
Table A Base Case Peak AEP Flood Levels and Flows at Lowood, Ipswich, Moggill and Brisbane
AEP 1 in …
Base Case Peak AEP Flood Levels and Flows^
Peak Level (mAHD) Peak Flow (m3/s)
Lowood (Pump Stn)
Ipswich (CBD)
Moggill Gauge
Brisbane (City Gauge)
Lowood (Pump Stn)
Ipswich (CBD)
Moggill Gauge
Brisbane (City Gauge)
2 n/a* 1.9 1.7 1.6 n/a* n/a& n/a& n/a&
5 31.0 11.8 4.1 1.7 1,000 1,300 1,800 2,300
10 33.7 14.8 6.9 1.8 1,800 1,900 3,000 3,200
20 36.3 16.1 9.9 2.2 2,800 2,300 4,300 4,800
50 40.9 18.7 14.3 3.2 5,500 3,200 6,900 6,900
100 45.3 20.1 18.2 4.5 9,800 3,800 9,900 9,200
200 47.3 21.8 20.3 5.8 13,000 4,800 11,900 11,000
500 48.6 23.4 22.6 7.3 15,800 5,600 14,700 13,200
2,000 51.0 25.7 25.4 9.9 20,400 6,900 19,500 17,200
10,000# 54.5 29.0 28.8 14.7 29,300 9,300 28,400 25,700
100,000# 63.0 36.1 36.0 23.7 52,600 13,500 57,200 56,000
^ Peak flood levels and peak flows do not necessarily occur at the same time. * 1 in 2 AEP flood level results only reliable for tidal zone. & 1 in 2 AEP peak flows not provided as they are due to tidal influence, not flood influence. # Flood may exceed the maximum release capacity of Wivenhoe Dam (currently 28,000m3/s) – treat results with caution.
BRCFS Technical Summary Report - Hydrologic and Hydraulic Assessments x
Executive Summary
B:\B20702 BRCFS Hydraulics\__ Admin\R.B20702.007.02.MR7.Technical Summary_FINAL.docx FINAL
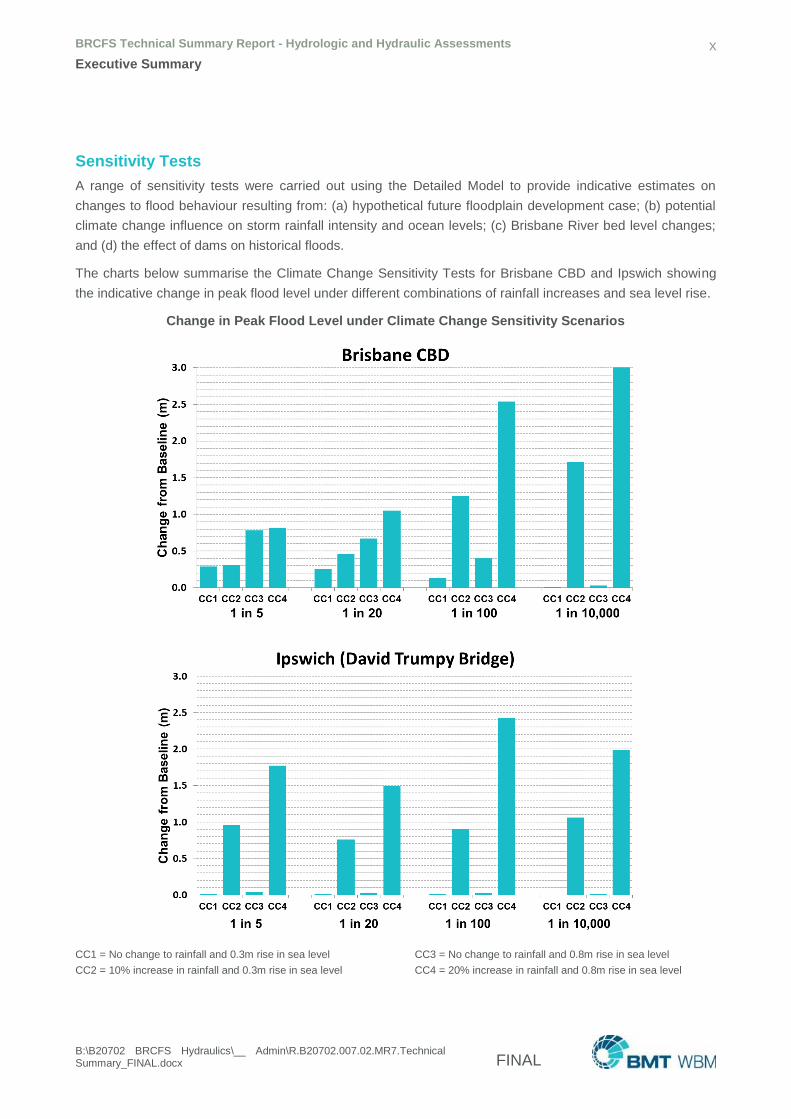
Sensitivity Tests
A range of sensitivity tests were carried out using the Detailed Model to provide indicative estimates on
changes to flood behaviour resulting from: (a) hypothetical future floodplain development case; (b) potential
climate change influence on storm rainfall intensity and ocean levels; (c) Brisbane River bed level changes;
and (d) the effect of dams on historical floods.
The charts below summarise the Climate Change Sensitivity Tests for Brisbane CBD and Ipswich showing
the indicative change in peak flood level under different combinations of rainfall increases and sea level rise.
Change in Peak Flood Level under Climate Change Sensitivity Scenarios
CC1 = No change to rainfall and 0.3m rise in sea level CC3 = No change to rainfall and 0.8m rise in sea level
CC2 = 10% increase in rainfall and 0.3m rise in sea level CC4 = 20% increase in rainfall and 0.8m rise in sea level
BRCFS Technical Summary Report - Hydrologic and Hydraulic Assessments xi
Executive Summary
B:\B20702 BRCFS Hydraulics\__ Admin\R.B20702.007.02.MR7.Technical Summary_FINAL.docx FINAL
Rating Curve Reconciliation
Reviews of the rating curves used in the hydrologic modelling with the water level versus flow (stage-
discharge) outputs from the hydraulic modelling were carried out at several key stages during the
development, calibration and AEP flood modelling using the Fast and Detailed Models. The reviews
demonstrate that the hydraulic modelling is commensurate with the rating curves from the Hydrologic
Assessment, a key requirement to ensure the hydrologic and hydraulic modelling are consistent. They also
provide useful insights to the validity or refinement of the rating curves under backwater effects and under
extreme flows.
Conclusion
The BRCFS is the most comprehensive, up-to-date and accurate assessment of Brisbane River riverine
flooding for AEPs ranging from 1 in 2 to 1 in 100,000. The latest available data was used to develop
hydrologic and hydraulic models, and these models were validated by calibrating and verifying their results
against well documented historical floods and tidal conditions. Industry leading techniques were used to
derive AEP floods that take into account the complex effects on flood behaviour caused by variations in:
rainfall and antecedent catchment conditions; Somerset and Wivenhoe Dam reservoir levels and operations;
and ocean tidal conditions, along with the joint probability of occurrence of these variables.
The outcome is best practice hydrologic and hydraulic modelling that will provide key information and form a
reliable basis for the BRCFMS and BRCSFMP and for the foreseeable future. Triggers that may initiate a
review or rework of some components of the Hydrologic and/or Hydraulic Assessments are documented for
future reference. For example, if Wivenhoe Dam is raised, this is likely to have a significant effect on
Brisbane River flooding, thus necessitating a rework of affected components.
The nature of modelling is that there are sources of uncertainty and constraints of use, and these are
documented in the technical reports. Of most importance, is that an accurate understanding and
appreciation of the hydrologic and hydraulic processes, and of the modelling methodology and assumptions
utilised, is essential to correctly interpreting and applying the outcomes of the BRCFS.

BRCFS Technical Summary Report - Hydrologic and Hydraulic Assessments xii
Contents
B:\B20702 BRCFS Hydraulics\__ Admin\R.B20702.007.02.MR7.Technical Summary_FINAL.docx FINAL
Contents
Caveats and Use of Report i
Executive Summary ii
Glossary and Explanation xvii
1 Introduction 1
1.1 Background 1
1.2 Objectives and Scope 1
1.3 Study Overview 2
1.4 Report Structure 5
2 Brisbane River Catchment 6
2.1 Catchment Description 6
2.2 History of Flooding 8
2.3 Flooding Characteristics and Representation in Models 9
2.4 Moreton Bay Storm Tide 10
2.5 Wivenhoe and Somerset Dams 10
2.6 Previous Studies 12
3 Study Approach 14
3.1 Overview 14
3.2 Hydrologic Assessment 15
3.3 Consistency between Hydrologic/Hydraulic Assessments 16
3.4 Hydraulic Assessment 17
4 Data Collection and Collation 19
4.1 Rainfall 19
4.2 Historical Flood Records 20
4.2.1 Stream Gauges 20
4.2.2 Flood Marks 20
4.2.3 Flow Gaugings at Centenary Bridge 20
4.2.4 Flood Extents 20
4.2.5 Anecdotal Information 21
4.3 Topographic Data 22
4.3.1 LiDAR Data 22
4.3.2 Breaklines 23
4.3.3 Bathymetric Data 23
4.4 Hydraulic Structures 24

BRCFS Technical Summary Report - Hydrologic and Hydraulic Assessments xiii
Contents
B:\B20702 BRCFS Hydraulics\__ Admin\R.B20702.007.02.MR7.Technical Summary_FINAL.docx FINAL
4.5 Land Use Data 26
4.6 Tidal Data 26
5 Hydrologic Assessment 27
5.1 Introduction 27
5.2 Rating Curve Review 27
5.2.1 Rating curve review process 28
5.2.2 Selection and treatment of Brisbane River gauge ratings 29
5.3 Types of Hydrologic Models 31
5.3.1 Runoff-routing Models 31
5.3.2 Simplified Dam Operations Model 32
5.4 Calibration to Historical Events 35
5.4.1 Available Historical Events 35
5.4.2 Re-calibration Approach and Outcome 35
5.5 Hydrologic Assessment Methodologies 37
5.5.1 Approaches Investigated 37
5.5.2 Scenarios (No-Dams, With-Dams) 37
5.5.3 Design Event Approach (DEA) 38
5.5.4 Flood Frequency Analysis (FFA) 39
5.5.5 Monte Carlo Simulation (MCS) 41
5.6 Design Peak Flow Assessments – With and No Dams 43
5.6.1 Reconciliation Process 43
5.6.2 Peak Flow Estimates 47
5.6.3 Critical Storm Durations 47
5.6.4 Flood Volume Estimates 48
5.6.5 Limitations 48
5.7 Hydrologic and Hydraulic Modelling Interfacing 49
6 Hydraulic Models and Selection of AEP Ensembles 52
6.1 Sources of Flooding 52
6.2 Types and Objectives of Hydraulic Models 53
6.2.1 Updated Disaster Management Tool (UDMT) 53
6.2.2 Fast Model 54
6.2.3 Detailed Model 54
6.3 Calibration to Historical Events 55
6.3.1 Introduction 55
6.3.2 Calibration Approach 57
6.3.3 Calibration Outputs 58
BRCFS Technical Summary Report - Hydrologic and Hydraulic Assessments xivContents
B:\B20702 BRCFS Hydraulics\__ Admin\R.B20702.007.02.MR7.Technical Summary_FINAL.docx FINAL
6.3.4 Hydraulic Model Calibration Accuracy 58
6.3.5 Rating Curve Cross Checks 62
6.4 Derivation of AEP Ensembles 63
6.4.1 Overview 63
6.4.2 Fast Model Monte Carlo Simulations 64
6.4.3 Annual Exceedance Probability (AEP) Analysis 64
6.4.4 Selection of Fast Model AEP Ensembles 66
6.5 AEP Ensembles 66
7 Design Riverine Flood Results 68
7.1 Overview 68
7.2 Mapping 70
7.3 Hydrographs 72
7.4 Backflow Prevention Devices 73
7.5 Rating Curve Reconciliation 73
8 Sensitivity Analysis 76
8.1 Introduction 76
8.2 With and No Dams 76
8.3 Climate Change 77
8.4 Bed Level Change 79
8.5 Future Floodplain 80
9 How BRCFS Addresses QFCol Recommendation 2.2 81
10 Study Limitations and Uncertainties 83
11 Conclusions 85
12 References 87
12.1 BRCFS Technical Report References 87
12.2 General References 88
Appendix A IPE Endorsement A-1
Appendix B BRCFS – List of Committees B-1
Map Addendum MA-1
BRCFS Technical Summary Report - Hydrologic and Hydraulic Assessments xv
Contents
B:\B20702 BRCFS Hydraulics\__ Admin\R.B20702.007.02.MR7.Technical Summary_FINAL.docx FINAL
List of Figures
Figure 1-1 Brisbane River Catchment Flood Studies 3
Figure 1-2 Brisbane River Catchment and Hydraulic Assessment Study Area 4
Figure 2-1 Brisbane River Sub-Catchments 7
Figure 2-2 Wivenhoe Dam Spillway Releases (October 2010) 11
Figure 3-1 Current Governance for BRCFS (DNRM, 2016) 14
Figure 3-2 BRCFS Key Modelling Steps in Hydrologic and Hydraulic Assessments 16
Figure 4-1 Aerial Imagery of the 2011 Flood at Suncorp Stadium 21
Figure 4-2 Terrain Data: Inner Brisbane 22
Figure 4-3 Bathymetric Updates: Bremer River in Ipswich 23
Figure 4-4 Structure Data Collection from Design Drawings (above) and Field Investigations (below) 24
Figure 4-5 Structure Data Summarised in Hydraulic Structure Reference Sheets 25
Figure 4-6 Example of the Detailed Spatial Differentiation of Land Uses 26
Figure 5-1 Rating Comparison – Brisbane River @ Gregors Creek (full range) 30
Figure 5-2 Brisbane River Catchment – Sub-Catchments and Hydrology Assessment Reporting Locations 34
Figure 5-3 Computational steps of the Monte Carlo Simulation framework 42
Figure 5-4 Design peak flows and flow volumes at location Savages Crossing as derived with the three methods; ‘no-dams conditions’ 45
Figure 5-5 Design peak flows and flow volumes at location Savages crossing as derived with the two methods; ‘with-dams conditions’. 46
Figure 6-1 Fast Model Schematisation using UDMT Hazard Output: Lockyer Creek near Mt Tarampa 56
Figure 6-2 Example of Detailed Model Hydraulic Modelling for the 1974 Flood Verification: Tennyson 56
Figure 6-3 2011 Event at Brisbane City Gauge – Fast and Detailed Model vs Observed 59
Figure 6-4 2011 Detailed Model Calibration - Statistical Assessment of Differences between Observed & Modelled Peak Flood Levels 59
Figure 6-5 Reproduction of Superelevation at Story Bridge Bend – 2011 Flood 60
Figure 6-6 Examples of Calibration Mapping to Recorded Flood Marks 61
Figure 6-7 Comparison of Hydraulic Modelling with Rating Curves at Savages Crossing 62
Figure 6-8 Derived Level Frequency Relationships for Sites along the Lower Reaches of the Brisbane River 65
Figure 6-9 Comparison of Flood Frequency Relationships based on Results Obtained from the Hydrologic and Hydraulic Assessments 65
Figure 6-10 Flow Chart of MC Event Selection Methodology 66
BRCFS Technical Summary Report - Hydrologic and Hydraulic Assessments xvi
Contents
B:\B20702 BRCFS Hydraulics\__ Admin\R.B20702.007.02.MR7.Technical Summary_FINAL.docx FINAL
Figure 6-11 Example of an Ensemble (1 in 100 AEP at Moggill) 67
Figure 7-1 Ipswich CBD Design and Historic Flood Levels 69
Figure 7-2 Brisbane CBD (City Gauge) Design and Historic Flood Levels 70
Figure 7-3 Example Map Output for the 1 in 100 AEP Flood 71
Figure 7-4 Hydrograph (Stage and Flow) at Brisbane City Gauge for the 1 in 100 AEP Ensemble (5 Events) 72
Figure 7-5 Rating Curves at Savages Crossing, Brisbane River 74
Figure 7-6 Rating Curves at Amberley, Warrill Creek 75
Figure 8-1 Change in Peak Flood Level under Climate Change Sensitivity Scenarios 78
Figure 8-2 Brisbane CBD: Bed Level Sensitivity, 1 in 100 AEP Flood 79
List of Tables
Table 2-1 Summary of Major Studies of Relevance 12
Table 5-1 Brisbane River gauge ratings reviewed as part of BRCFS 30
Table 5-2 With-Dam Condition Reservoirs 38
Table 5-3 Peak Flow (m3/s) versus AEP - Reconciled No-dams Condition Peak Flows 50
Table 5-4 Peak Flows (m3/s) versus AEP - Reconciled With-dams Condition Peak Flows 51
Table 6-1 Fast and Detailed Model Calibration to Levels at Key Locations 58
Table 6-2 Design Flood AEPs 63
Table 6-3 Events in each AEP Ensemble after Fine-Tuning Selection using Detailed Model 67
Table 7-1 Summary of Peak Design Flood Levels and Flows at Lowood, Ipswich, Brisbane and Moggill 69
Table 8-1 No Dams: Brisbane City Gauge 77
Table 8-2 Parameters used in the BRCFS Climate Change Sensitivity 77
Table 8-3 Future Floodplain Condition Scenario Results at Brisbane and Ipswich 80
Table 9-1 BRCFS Treatment of QFCoI Recommendation 2.2 Components 81
BRCFS Technical Summary Report - Hydrologic and Hydraulic Assessments xvii
Glossary and Explanation
B:\B20702 BRCFS Hydraulics\__ Admin\R.B20702.007.02.MR7.Technical Summary_FINAL.docx FINAL
Glossary and Explanation
1D One dimensional
2D Two dimensional
3D Three dimensional
AEP Annual Exceedance Probability
AEP ensemble A collection of Monte Carlo events that together comprise an ensemble for a given Annual Exceedance Probability (AEP) in relation to peak flood levels.
AHD Australian Height Datum
ARR Australian Rainfall and Runoff
B15 Base Case circa 2015
BCC Brisbane City Council
BCC (CPO) Brisbane City Council (City Projects Office)
BL1 Bed Level Scenario 1
BL2 Bed Level Scenario 2
BoM Bureau of Meteorology
BRCFMS Brisbane River Catchment Floodplain Management Study
BRCSFMP Brisbane River Catchment Strategic Floodplain Management Plan
BRCFS Brisbane River Catchment Flood Study
Breaklines Survey strings used to define continuous linear features
CC1 Climate Change Sensitivity Scenario 1
CC2 Climate Change Sensitivity Scenario 2
CC3 Climate Change Sensitivity Scenario 3
CC4 Climate Change Sensitivity Scenario 4
CBD Central Business District
CEWG Community and Engagement Working Group
CND Calibration event with No Dams
CPO City Projects Office
CPU Central Processing Unit
CSIRO Commonwealth Scientific and Industrial Research Organisation
DCS BRCFS Data Collection Study (Aurecon, 2013)
DEA Design Event Approach. A semi-probabilistic approach to establish flood levels, which only accounts for the variability of the rainfall intensity
DEM Digital Elevation Model – a fixed grid of elevations sampled from a DTM
Delft-FEWS Delft-FEWS is an open data handling platform developed by Deltares. The Monte Carlo framework for the BRCFS Hydrologic Assessment was implemented in Delft-FEWS
Design Flood Hypothetical floods used for planning and floodplain management investigations. They may be comprised of a single design event or multiple events grouped into an ensemble. A design flood is defined by its probability of occurrence, for example the 1 in 100 Annual Exceedance Probability (AEP).
DILGP Department of Infrastructure, Local Government and Planning DILGP (formerly the Department of State Development, Infrastructure and Planning, DSDIP)
BRCFS Technical Summary Report - Hydrologic and Hydraulic Assessments xviii
Glossary and Explanation
B:\B20702 BRCFS Hydraulics\__ Admin\R.B20702.007.02.MR7.Technical Summary_FINAL.docx FINAL
DMT Disaster Management Tool (BCC CPO, BCC 2014a and BCC 2014b)
DMT DEM Digital Elevation Model developed and used in the Brisbane River Catchment Disaster Management Tool study (BCC CPO , BCC 2014a and BCC 2014b)
DNRM Department of Natural Resources and Mines
DPI Department of Primary Industries (former)
DTM Digital Terrain Model – a triangulation of raw elevation data points
DxV Hydraulic flood hazard equal to Depth x Velocity. DxV is tracked separately at every 2D
cell at every computational timestep during a model simulation to produce maps of peak DxV.
Event (Flood) Used (in the context of this study) to describe a flood occurrence. It can be a historical flood event, a design flood event or a Monte Carlo (MC) flood event.
FEWS Flood Early Warning System
FF1 Floodplain Future Condition Scenario 1
FFA Flood Frequency Analysis. A statistical analysis technique used to estimate the magnitude or frequency of flooding.
GIS Geographic Information System
GSDM Generalised Short Duration Method of extreme precipitation estimation for storms of less than 6 hour duration and catchments of less than 1,000 km2. (BoM, 2003)
GTSMR Revised Generalised Tropical Storm Method of extreme precipitation estimation for storms of tropical origin. Applicable to storm durations of up to 168 hours and catchments up to 150,000km2 (BoM, 2003).
Hydraulic Assessment BRCFS Comprehensive Hydraulic Assessment (BMT WBM, 2016)
Hydraulic Milestone Report
One of the technical milestone reports produce for the Hydraulic Assessment. These are numbered with corresponding titles, which are provided in Section 12 References.
Hydrologic Assessment BRCFS Comprehensive Hydrologic Assessment (Aurecon, 2015)
Hydrologic Milestone Report
One of the technical milestone reports produce for the Hydrologic Assessment. These are numbered with corresponding titles, which are provided in Section 12 References.
ICC Ipswich City Council
IFD Intensity-Frequency-Duration
ITO Invitation to Offer, i.e. the Hydrologic and Hydraulic Assessment Briefs (DSDIP, 2013 and DILGP, 2014 respectively)
IPE Independent Panel of Experts
LiDAR Light Detection and Ranging, an aerial ground survey technique
LOC Loss of Communications dam operating procedure
LVRC Lockyer Valley Regional Council
MC Event Monte Carlo event – one of the event realisations applied in a MCS – also see definition of “event” above. Each event has a stochastic set of variables, with each variable (e.g. rainfall) having a random probability distribution or pattern.
MCS Monte Carlo Simulation – application of the Monte Carlo (MC) method
PMF Probable Maximum Flood (nominally the 1 in 100,000 AEP in the Hydraulic Assessment)
PMP Probable Maximum Precipitation - the greatest depth of precipitation for a given duration meteorologically possible over a given size storm area at a particular location at a particular time of year, with no allowance made for long-term climatic trends (CSIRO, 2000; EA 2003; WMO, 2009)
QC Quality Control
QFCoI Queensland Floods Commission of Inquiry (QFCoI, 2012)

BRCFS Technical Summary Report - Hydrologic and Hydraulic Assessments xix
Glossary and Explanation
B:\B20702 BRCFS Hydraulics\__ Admin\R.B20702.007.02.MR7.Technical Summary_FINAL.docx FINAL
QRA Queensland Reconstruction Authority
SEQ South-East Queensland
SPP State Planning Policy
SRC Somerset Regional Council
TWG Technical Working Group
URBS Unified River Basin Simulator. A rainfall runoff routing hydrologic model (Carroll, 2012a)
WSDOS Wivenhoe and Somerset Dams Optimisation Study
BRCFS Technical Summary Report - Hydrologic and Hydraulic Assessments 1
Introduction
B:\B20702 BRCFS Hydraulics\__ Admin\R.B20702.007.02.MR7.Technical Summary_FINAL.docx FINAL
1 Introduction
1.1 Background
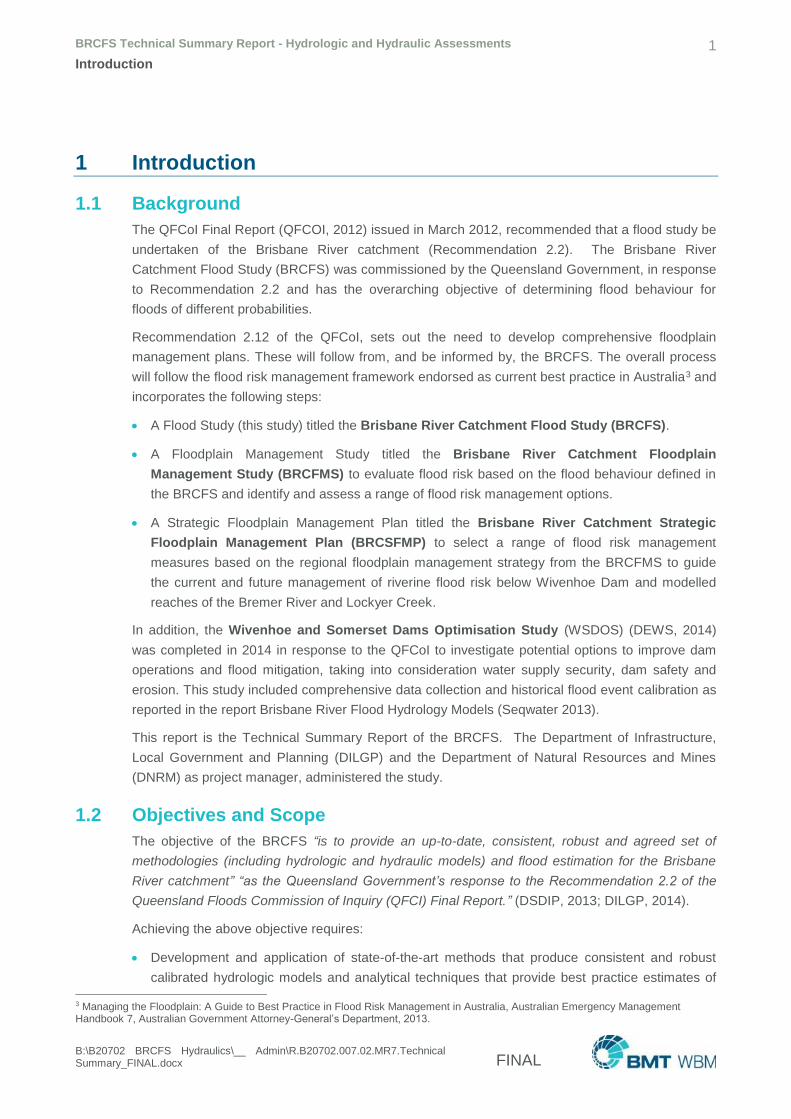
The QFCoI Final Report (QFCOI, 2012) issued in March 2012, recommended that a flood study be
undertaken of the Brisbane River catchment (Recommendation 2.2). The Brisbane River
Catchment Flood Study (BRCFS) was commissioned by the Queensland Government, in response
to Recommendation 2.2 and has the overarching objective of determining flood behaviour for
floods of different probabilities.
Recommendation 2.12 of the QFCoI, sets out the need to develop comprehensive floodplain
management plans. These will follow from, and be informed by, the BRCFS. The overall process
will follow the flood risk management framework endorsed as current best practice in Australia3 and
incorporates the following steps:
A Flood Study (this study) titled the Brisbane River Catchment Flood Study (BRCFS).
A Floodplain Management Study titled the Brisbane River Catchment Floodplain
Management Study (BRCFMS) to evaluate flood risk based on the flood behaviour defined in
the BRCFS and identify and assess a range of flood risk management options.
A Strategic Floodplain Management Plan titled the Brisbane River Catchment Strategic
Floodplain Management Plan (BRCSFMP) to select a range of flood risk management
measures based on the regional floodplain management strategy from the BRCFMS to guide
the current and future management of riverine flood risk below Wivenhoe Dam and modelled
reaches of the Bremer River and Lockyer Creek.
In addition, the Wivenhoe and Somerset Dams Optimisation Study (WSDOS) (DEWS, 2014)
was completed in 2014 in response to the QFCoI to investigate potential options to improve dam
operations and flood mitigation, taking into consideration water supply security, dam safety and
erosion. This study included comprehensive data collection and historical flood event calibration as
reported in the report Brisbane River Flood Hydrology Models (Seqwater 2013).
This report is the Technical Summary Report of the BRCFS. The Department of Infrastructure,
Local Government and Planning (DILGP) and the Department of Natural Resources and Mines
(DNRM) as project manager, administered the study.
1.2 Objectives and Scope
The objective of the BRCFS “is to provide an up-to-date, consistent, robust and agreed set of
methodologies (including hydrologic and hydraulic models) and flood estimation for the Brisbane
River catchment” “as the Queensland Government’s response to the Recommendation 2.2 of the
Queensland Floods Commission of Inquiry (QFCI) Final Report.” (DSDIP, 2013; DILGP, 2014).
Achieving the above objective requires:
Development and application of state-of-the-art methods that produce consistent and robust
calibrated hydrologic models and analytical techniques that provide best practice estimates of 3 Managing the Floodplain: A Guide to Best Practice in Flood Risk Management in Australia, Australian Emergency Management Handbook 7, Australian Government Attorney-General’s Department, 2013.
BRCFS Technical Summary Report - Hydrologic and Hydraulic Assessments 2
Introduction
B:\B20702 BRCFS Hydraulics\__ Admin\R.B20702.007.02.MR7.Technical Summary_FINAL.docx FINAL
flood flows and volumes for a wide range of probabilities across the entire Brisbane River
system.
Development of a high resolution calibrated hydraulic model that accurately defines the flood
behaviour of the Brisbane River below Wivenhoe Dam, including the major tributaries of Lockyer
Creek and the Bremer River for a wide range of flood events from minor to major to extreme.
Consistency between the hydrologic and hydraulic modelling. The hydrologic modelling
simulates the rainfall-runoff process and the effect of dam storages and operations to produce
flow hydrographs (discharge over time) for the hydraulic model. The hydraulic model uses
these flow hydrographs to simulate the progression of a flood to produce flood levels, depths
and velocities (water speeds) along the waterways and over the floodplains. For the hydrologic
modelling to be commensurate with the hydraulic modelling, the stage-discharge relationship
(i.e. a rating curve) at key locations where these two types of modelling overlap needs to be
consistent.
Leading edge and innovative statistical analyses to derive floods of different exceedance
probability (the design floods) that take into account the substantial complexity and variability of
Brisbane River catchment flooding, as these cannot be adequately evaluated using traditional
industry approaches. In particular, the statistical analyses need to address variations in: spatial
and temporal rainfall; antecedent (wet to dry) catchment conditions; initial Wivenhoe and
Somerset lake levels (which affect flooding downstream and dam operations); and storm surge
and tidal conditions.
While new data, advances in numerical techniques and continued improvements in computer
hardware and software mean that hydrologic and hydraulic modelling are always evolving, the
BRCFS encompasses: the latest proven and established innovation; and modelling that is validated
to historical Brisbane River flood events. By taking this wide-ranging and thorough approach in
scope, along with an exceptionally high level of technical review via the Technical Working Group
(TWG) and Independent Panel of Experts (IPE), the BRCFS aims to produce the most
comprehensive study feasible.
1.3 Study Overview
The BRCFS was completed in three separate phases. These were the:
Phase 1: Data Collection Study (DCS)
Phase 2A: Comprehensive Hydrologic Assessment
Phase 2B: Comprehensive Hydraulic Assessment.
The Data Collection Study (Aurecon, 2013) was completed in August 2013 and identified, compiled
and reviewed readily available data and metadata, including a gap analysis.
The Comprehensive Hydrologic Assessment (Aurecon, 2015) commenced in 2013 and was
finalised in May 2015. It defines flood flows for the Brisbane River catchment based on Flood
Frequency Analyses (FFA), the Design Event Approach (DEA) and a hydrologic modelling
approach that caters for temporal and spatial variations in rainfall patterns, initial reservoir levels
and other factors that affect catchment runoff using the (Monte Carlo Simulation (MCS) method.
BRCFS Technical Summary Report - Hydrologic and Hydraulic Assessments 3
Introduction
B:\B20702 BRCFS Hydraulics\__ Admin\R.B20702.007.02.MR7.Technical Summary_FINAL.docx FINAL
The Comprehensive Hydraulic Assessment completed in February 2017 defines the flood
behaviour of the Brisbane River below Wivenhoe Dam, and the lower sections of the major
tributaries of Lockyer Creek and the Bremer River, for a wide range of flood events from small to
extreme. The assessment establishes flood extents, depths, velocities and hydraulic hazard (a
measure of the hazard of deep and/or fast flowing water) across the full extent of the floodplain for
eleven statistical flood events ranging from the 1 in 2 to the 1 in 100,000 AEP (Annual Exceedance
Probability).
In addition to the above phases the State Government, as part of the BRCFS, commissioned the
Disaster Management Tool (DMT) Study (BCC, 2014a and 2014b) as an interim measure until the
more comprehensive Hydrologic and Hydraulic Assessments were completed. The DMT study
was carried out by Brisbane City Council City Projects Office (BCC CPO) to produce interim flood
inundation maps for emergency planning. The DMT study also identified critical data gaps and led
to the commission of hydrographic survey of the Lower Brisbane and Lower Bremer Rivers
undertaken by the Port of Brisbane (PoB) (PoB, 2014).
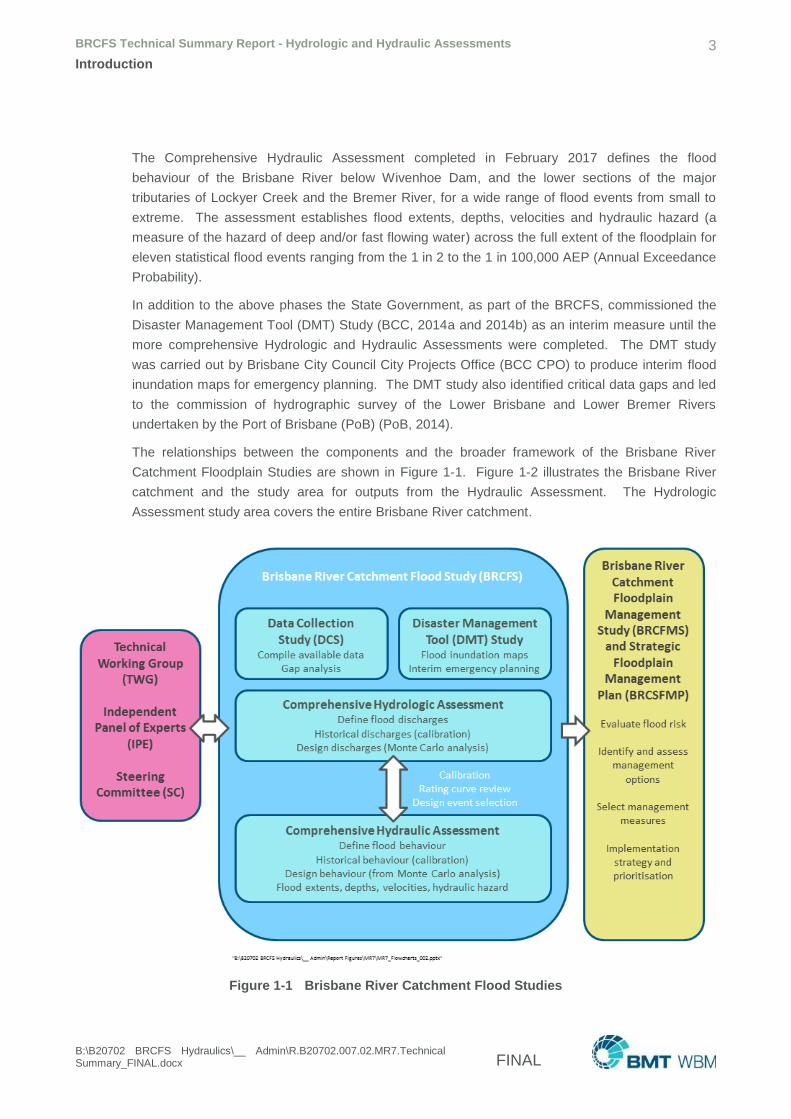
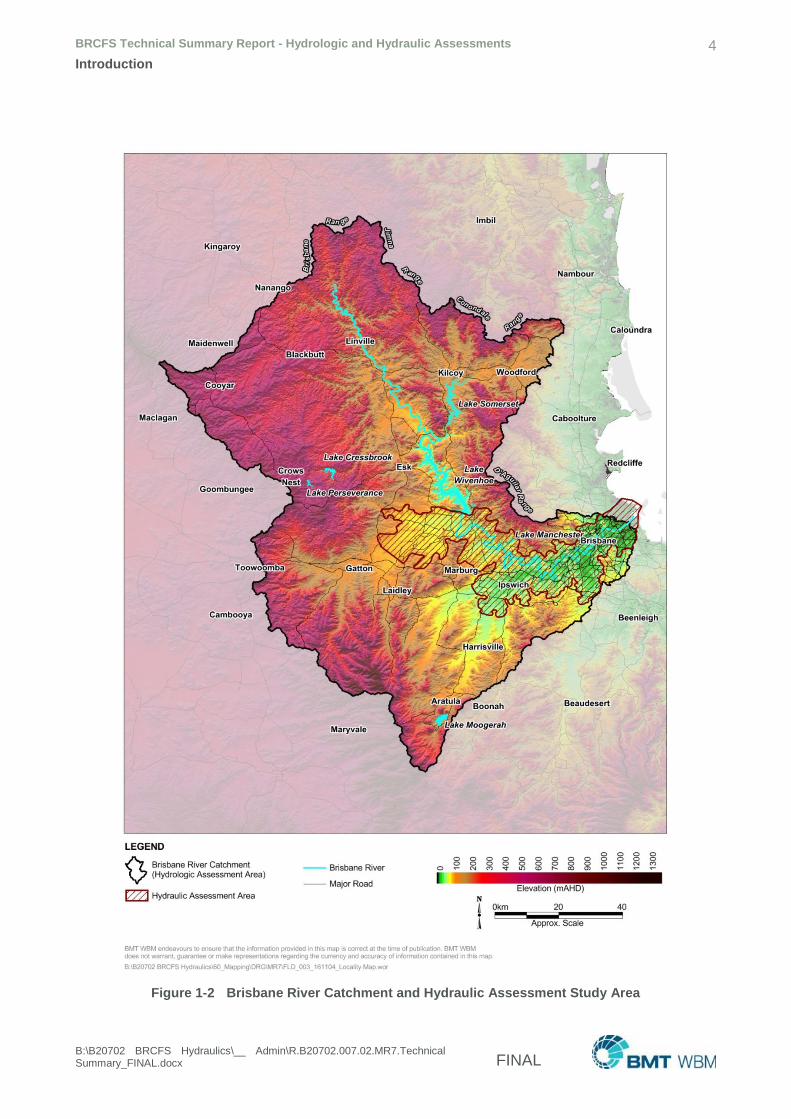
The relationships between the components and the broader framework of the Brisbane River
Catchment Floodplain Studies are shown in Figure 1-1. Figure 1-2 illustrates the Brisbane River
catchment and the study area for outputs from the Hydraulic Assessment. The Hydrologic
Assessment study area covers the entire Brisbane River catchment.
Figure 1-1 Brisbane River Catchment Flood Studies
BRCFS Technical Summary Report - Hydrologic and Hydraulic Assessments 4
Introduction
B:\B20702 BRCFS Hydraulics\__ Admin\R.B20702.007.02.MR7.Technical Summary_FINAL.docx FINAL
Figure 1-2 Brisbane River Catchment and Hydraulic Assessment Study Area
BRCFS Technical Summary Report - Hydrologic and Hydraulic Assessments 5
Introduction
B:\B20702 BRCFS Hydraulics\__ Admin\R.B20702.007.02.MR7.Technical Summary_FINAL.docx FINAL
1.4 Report Structure
This document is a technical summary of the BRCFS Hydrologic and Hydraulic Assessments.
The remainder of this document is structured as follows:
Section 2 describes the Brisbane River catchment, its history of flooding, hydrologic and
hydraulic modelling and previous studies.
Section 3 sets out the approach to the BRCFS with an overview of the Hydrologic Assessment
and Hydraulic Assessments’ tasks, and the interface between the two assessments.
Section 4 summarises key datasets used in the study and the various sources of these
datasets.
Section 5 presents a summary of the Hydrologic Assessment including adopted methodologies,
choice of methods, hydrologic modelling, model calibration and a summary of hydrologic
modelling results.
Section 6 provides an overview of the Hydraulic Assessment including hydraulic model
development, calibration and application of the hydraulic models, and application of the Monte
Carlo method and the simulation of AEP ensembles.
Section 7 contains a summary of the hydraulic flood modelling results including design flood
mapping. These results represent the primary end outputs of the BRCFS.
Section 8 describes how the hydraulic modelling has been used to test and quantify the change
in flooding due to varying conditions. Scenarios tested include several climate change
consequences, effect of river bed level deposition/excavation and with/without dams.
Section 9 sets out how the BRCFS has addressed the expectations of the Queensland Floods
Commission of Inquiry.
Section 10 outlines high level limitations and constraints of the work carried out so that the
outputs and outcomes are interpreted and applied within context.
Section 11 summarises the main conclusions of the study.
BRCFS Technical Summary Report - Hydrologic and Hydraulic Assessments 6
Brisbane River Catchment
B:\B20702 BRCFS Hydraulics\__ Admin\R.B20702.007.02.MR7.Technical Summary_FINAL.docx FINAL
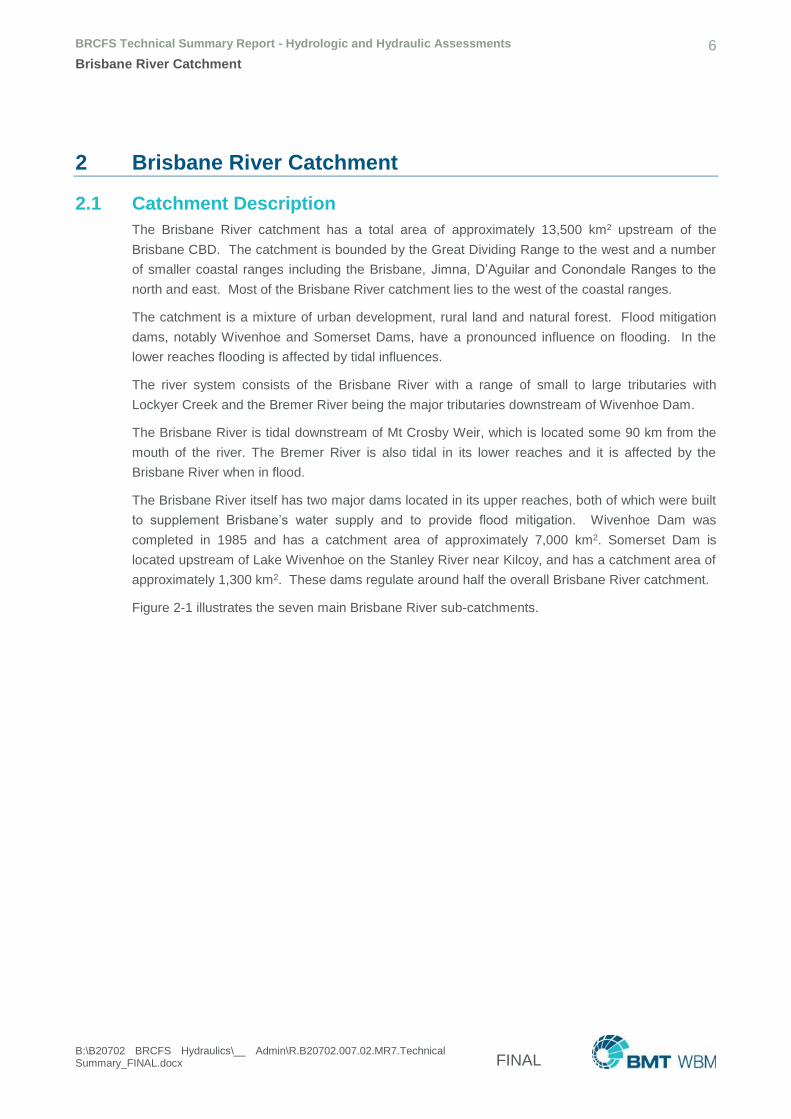
2 Brisbane River Catchment
2.1 Catchment Description
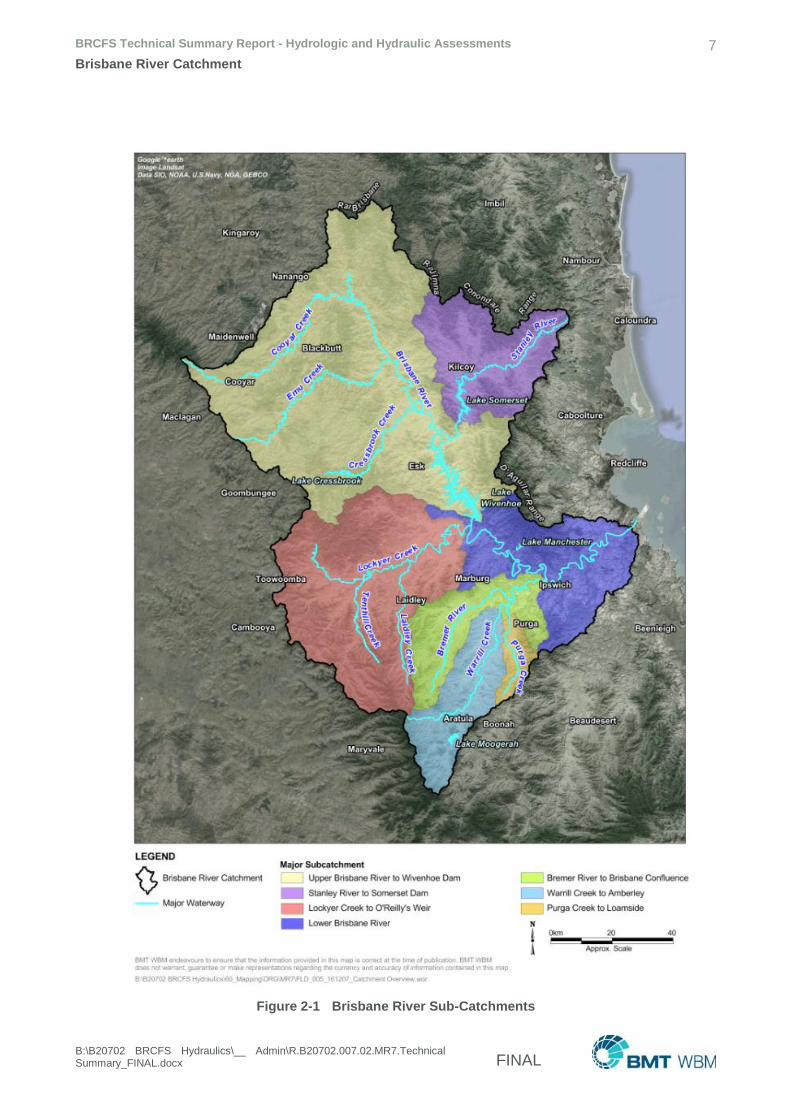
The Brisbane River catchment has a total area of approximately 13,500 km2 upstream of the
Brisbane CBD. The catchment is bounded by the Great Dividing Range to the west and a number
of smaller coastal ranges including the Brisbane, Jimna, D’Aguilar and Conondale Ranges to the
north and east. Most of the Brisbane River catchment lies to the west of the coastal ranges.
The catchment is a mixture of urban development, rural land and natural forest. Flood mitigation
dams, notably Wivenhoe and Somerset Dams, have a pronounced influence on flooding. In the
lower reaches flooding is affected by tidal influences.
The river system consists of the Brisbane River with a range of small to large tributaries with
Lockyer Creek and the Bremer River being the major tributaries downstream of Wivenhoe Dam.
The Brisbane River is tidal downstream of Mt Crosby Weir, which is located some 90 km from the
mouth of the river. The Bremer River is also tidal in its lower reaches and it is affected by the
Brisbane River when in flood.
The Brisbane River itself has two major dams located in its upper reaches, both of which were built
to supplement Brisbane’s water supply and to provide flood mitigation. Wivenhoe Dam was
completed in 1985 and has a catchment area of approximately 7,000 km2. Somerset Dam is
located upstream of Lake Wivenhoe on the Stanley River near Kilcoy, and has a catchment area of
approximately 1,300 km2. These dams regulate around half the overall Brisbane River catchment.
Figure 2-1 illustrates the seven main Brisbane River sub-catchments.
BRCFS Technical Summary Report - Hydrologic and Hydraulic Assessments 7
Brisbane River Catchment
B:\B20702 BRCFS Hydraulics\__ Admin\R.B20702.007.02.MR7.Technical Summary_FINAL.docx FINAL
Figure 2-1 Brisbane River Sub-Catchments
BRCFS Technical Summary Report - Hydrologic and Hydraulic Assessments 8
Brisbane River Catchment
B:\B20702 BRCFS Hydraulics\__ Admin\R.B20702.007.02.MR7.Technical Summary_FINAL.docx FINAL
2.2 History of Flooding
The Brisbane River has an extensive documented history of recorded floods since European
settlement, with records dating back to the early exploration of the river by John Oxley in 1824.
Pre-European settlement there is oral history from the local Yuggera people that indicates a flood
(larger than the largest known on the record) that occurred possibly around the 1700’s to 1800’s
(anecdotal).
The largest floods recorded for the Brisbane River since official flood records began in 1841 have
occurred in the 19th century, notably in 1841 and two major events in 1893. After the 1890s, the
next largest floods were in 1974 and 2011. The 1841 and 1893 floods reached similar levels at the
Brisbane CBD and remain the largest on record by a significant margin. Up until the mid-1950s the
quantity and quality of recorded rainfall and flood level data is very limited.
The 1974 flood caused major flooding throughout the Brisbane River catchment. In response, and
due to increasing water demand from the growing urban population, Wivenhoe Dam was
constructed to provide a dual role of water supply and flood mitigation. Completed in 1986, the
dam has a substantial influence on flooding and can more than double its full supply level capacity
to mitigate and alleviate flood flows that coincide with the uncontrolled flows from the Lockyer and
Bremer tributaries downstream.
Following the construction of Wivenhoe Dam, minor to major floods have occurred on the Brisbane
River with the most notable being in 1996, 1999, 2011 and 2013. Wivenhoe Dam played a
significant role in reducing the flood peak and modifying the flood behaviour downstream in all
these events.
The historical flood records show that floods can occur at any time of year. The summer season
produces the highest frequency of floods often associated with cyclones, monsoon, and troughs.
Significant floods have also occurred in autumn, winter and spring often associated with east coast
lows. Records of rainfall patterns have also showed that floods have occurred with rainfall moving
into the catchment from any direction. Some rainfall events producing flooding in South East
Queensland have rain originating offshore from the east or north east (e.g. Jan 2011), over land
from the west to east (e.g. Nov 2008), or down from the north (e.g. Jan 2013). The variability of the
movement of the rainfall patterns is particularly important for the Brisbane River catchment as it
produces variability in the relative timing of flood flows from different tributaries in the catchment.
This means that the traditional approach of applying a uniform temporal pattern of rainfall over the
entire catchment would not adequately represent the variability of potential flooding from rainfall
events.
Due to the availability of good quality data, the flood events of 1974, 1996, 1999, 2011 and 2013
were used for calibration and verification of the hydrologic and hydraulic modelling.
An extensive summary of the flood history of the Brisbane River can be found on the Bureau of
Meteorology website4. Note that the flood record presented does not take into account the flood
mitigation effects of Somerset and Wivenhoe Dams, therefore, floods occurring prior to the
4 http://www.bom.gov.au/qld/flood/fld_history/brisbane_history.shtml
BRCFS Technical Summary Report - Hydrologic and Hydraulic Assessments 9
Brisbane River Catchment
B:\B20702 BRCFS Hydraulics\__ Admin\R.B20702.007.02.MR7.Technical Summary_FINAL.docx FINAL
construction of these dams would attain a different (lower) level today than that recorded. Other
changes such as river/port dredging and catchment land-use would also affect flood levels.
2.3 Flooding Characteristics and Representation in Models
The Brisbane River catchment has a wide range of complexities that make it very interesting and
challenging to hydrologically and hydraulically model. Approximately half of the total catchment
area drains into Wivenhoe Dam, located on the Brisbane River, and the dam therefore has a
significant influence on flooding. The catchment downstream of Wivenhoe Dam has three major
branches, namely the main Brisbane River branch, and the major tributaries of Lockyer Creek and
the Bremer River. The timing and magnitude of flood peaks in the three major branches is highly
influential on the peak magnitude of flooding in the major urban centres of Ipswich and Brisbane.
The spatial and temporal variability of rainfall across the Brisbane River catchment can result in
very different runoff responses within the catchment. It is extremely important to recognise this
variability and to try to take into account the effects of storm movement when assessing the
likelihood and magnitude of flooding within the catchment.
The Hydrologic Assessment covers the whole of the Brisbane River catchment and was able to
draw upon work conducted by Seqwater (2013) which was undertaken for the Wivenhoe Somerset
Dam Optimisation Study, (DEWS, 2014). Although there is significant overlap, the BRCFS
hydrologic model has a different purpose and focus, including but not limited to:
Increased emphasis on catchments downstream from Wivenhoe Dam
Ability to model synthetic flood events much larger than those for which the Seqwater model
was calibrated.
This required several amendments to the hydrologic model. Some challenging aspects of the
refinement of the hydrologic model was to ensure that storage routing in the Lower Brisbane River
was effectively represented as there were limited locations at which the model could be calibrated.
There were also considerable difficulties in establishing consistent rating curves in the tidally
affected reaches, due to the lack of high stage records. Re-calibration of the model to a number of
flood events provides some confidence that the resultant model parameters are representative, but
it is acknowledged that each event had a unique set of parameters that provided the best fit.
The Monte Carlo Framework is ideal at capturing the variability of the flood generating factors in
the Brisbane River catchment through the establishment of the relevant statistical properties,
including mutual correlations of each of the factors.
Hydraulic modelling commences below Wivenhoe Dam (see Figure 1-1) where the hydraulic
characteristics of the Brisbane River valley are a mixture of conveyance and storage dominated
reaches. A reach is conveyance dominated where there is little storage volume due to no, or
relatively small, floodplains that can be inundated by flood water. These typically do not attenuate
the flood. A storage dominated reach is where there are substantial floodplain areas that provide
temporary storage for flood waters and attenuate the flood. The lower reaches of Lockyer Creek
are a good example of a storage dominated system with its large flat and wide floodplains. The
Brisbane River from Pine Mountain to Mt Crosby is predominantly conveyance dominated, with
relatively minor floodplains, and floodwaters largely confined to an incised river valley.
BRCFS Technical Summary Report - Hydrologic and Hydraulic Assessments 10
Brisbane River Catchment
B:\B20702 BRCFS Hydraulics\__ Admin\R.B20702.007.02.MR7.Technical Summary_FINAL.docx FINAL
Conveyance dominated reaches experience high velocities and steep gradients, while floodwater in
storage dominated sections tends to be slower rising and typically exhibits lower velocities.
The lower Brisbane River, unlike most large east coast Australian rivers, has few natural
meanders, with many of the river’s reaches controlled by the hilly terrain. There are also relatively
few floodplains to attenuate the flood peak. The hydraulic consequence is that substantially higher
velocities driven by a steep flood gradient develop along the Brisbane River during a flood. In
places, the Brisbane River banks are sometimes formed by rock and bends can literally be a sharp
180º (e.g. Kangaroo Point), with the entire flood flow often solely confined between the river banks
with relatively little or no overbank flows. In large to extreme floods, overbank flowpaths can
develop that change the flood behaviour from gentle backwater inundation to a short-circuit
flowpath with fast flowing water that becomes a severe flood hazard.
The hydraulic modelling needs to account for all of these effects along with the interaction between
flood and tide or storm tide surge in the lower tidal reaches. This is suited to the application of
Monte Carlo approach (see Section 3.1).
2.4 Moreton Bay Storm Tide
Moreton Bay ocean tide levels and timing, and the probability of a storm surge occurring during a
flood event, affect flooding characteristics in the lower tidal reaches of the Brisbane River. The
effect is most pronounced near the mouth of the Brisbane River; progressively dissipating
upstream. The effect of the tide decreases in larger flows. For example, in the smaller floods of
1996, 1999 and 2013 tidal effects were evident up as far as Centenary Bridge/Jindalee gauges,
while in the 1974 and 2011 events the influence of the tide was slight at the Brisbane City Gauge
and non-evident at the Oxley Creek gauge, which is well downstream of Jindalee.
Tidal and storm surge effects and propagation up the Brisbane River need to be considered and
included in the hydraulic modelling to produce reliable flood levels for the lower reaches of the
Brisbane River, and low lying areas of affected tributaries such as Norman, Breakfast and Bulimba
Creeks.
2.5 Wivenhoe and Somerset Dams
Wivenhoe and Somerset dams were both built to supplement Brisbane’s water supply and provide
flood mitigation. Somerset Dam was completed in 1953 and is located upstream of Lake Wivenhoe
on the Stanley River. Wivenhoe Dam was completed in 1985 and, with a catchment area of
approximately 7,000 km2 (including the Somerset Dam catchment), represents half of the overall
Brisbane River catchment.
Wivenhoe Dam has a maximum combined water supply storage and floodwater storage to the level
of the dam crest at 80.0 mAHD of 3,135,000 ML, of which 37% is allocated to water supply and
63% to flood mitigation. Somerset Dam’s maximum combined water supply storage and floodwater
storage to the level of the dam crest at 107.5 mAHD is 904,000 ML of which 379,000 ML (41%) is
water supply storage and 524,000 ML (59% is flood water storage).
Wivenhoe and Somerset dams have a significant impact on flooding by their capacity to temporarily
store flood water and regulate the outflow in small and moderate floods. In large to rare and
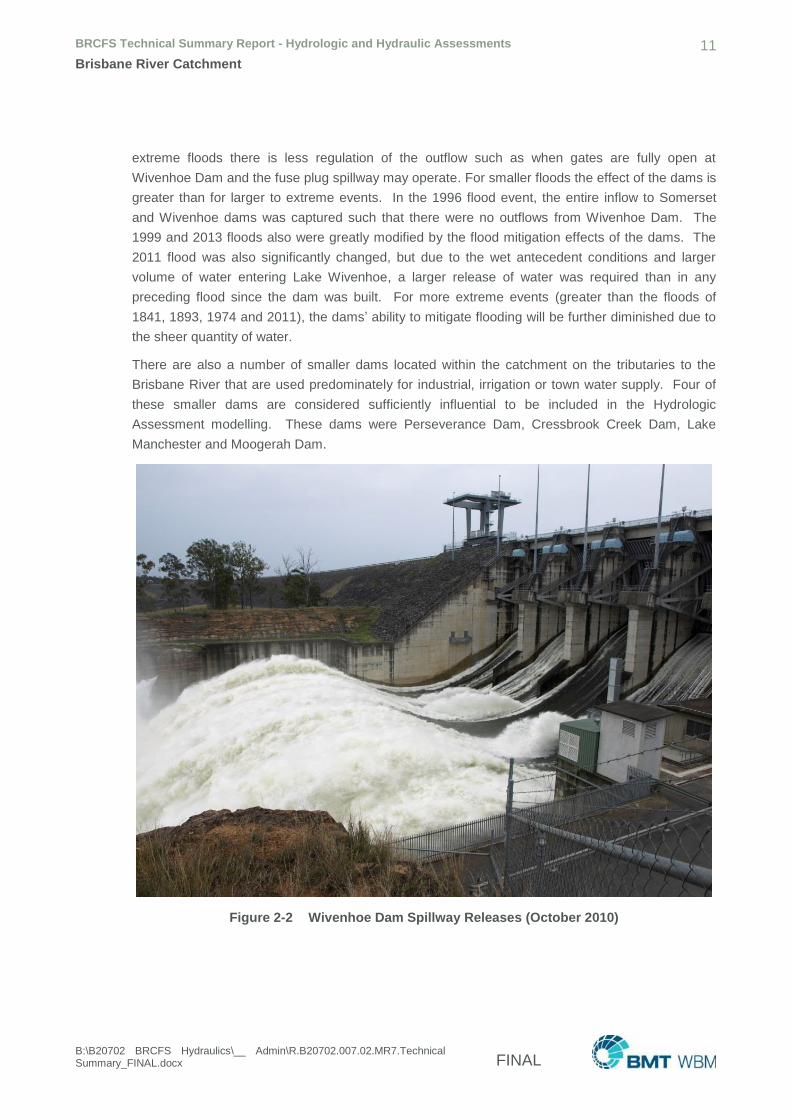
BRCFS Technical Summary Report - Hydrologic and Hydraulic Assessments 11
Brisbane River Catchment
B:\B20702 BRCFS Hydraulics\__ Admin\R.B20702.007.02.MR7.Technical Summary_FINAL.docx FINAL
extreme floods there is less regulation of the outflow such as when gates are fully open at
Wivenhoe Dam and the fuse plug spillway may operate. For smaller floods the effect of the dams is
greater than for larger to extreme events. In the 1996 flood event, the entire inflow to Somerset
and Wivenhoe dams was captured such that there were no outflows from Wivenhoe Dam. The
1999 and 2013 floods also were greatly modified by the flood mitigation effects of the dams. The
2011 flood was also significantly changed, but due to the wet antecedent conditions and larger
volume of water entering Lake Wivenhoe, a larger release of water was required than in any
preceding flood since the dam was built. For more extreme events (greater than the floods of
1841, 1893, 1974 and 2011), the dams’ ability to mitigate flooding will be further diminished due to
the sheer quantity of water.
There are also a number of smaller dams located within the catchment on the tributaries to the
Brisbane River that are used predominately for industrial, irrigation or town water supply. Four of
these smaller dams are considered sufficiently influential to be included in the Hydrologic
Assessment modelling. These dams were Perseverance Dam, Cressbrook Creek Dam, Lake
Manchester and Moogerah Dam.
Figure 2-2 Wivenhoe Dam Spillway Releases (October 2010)
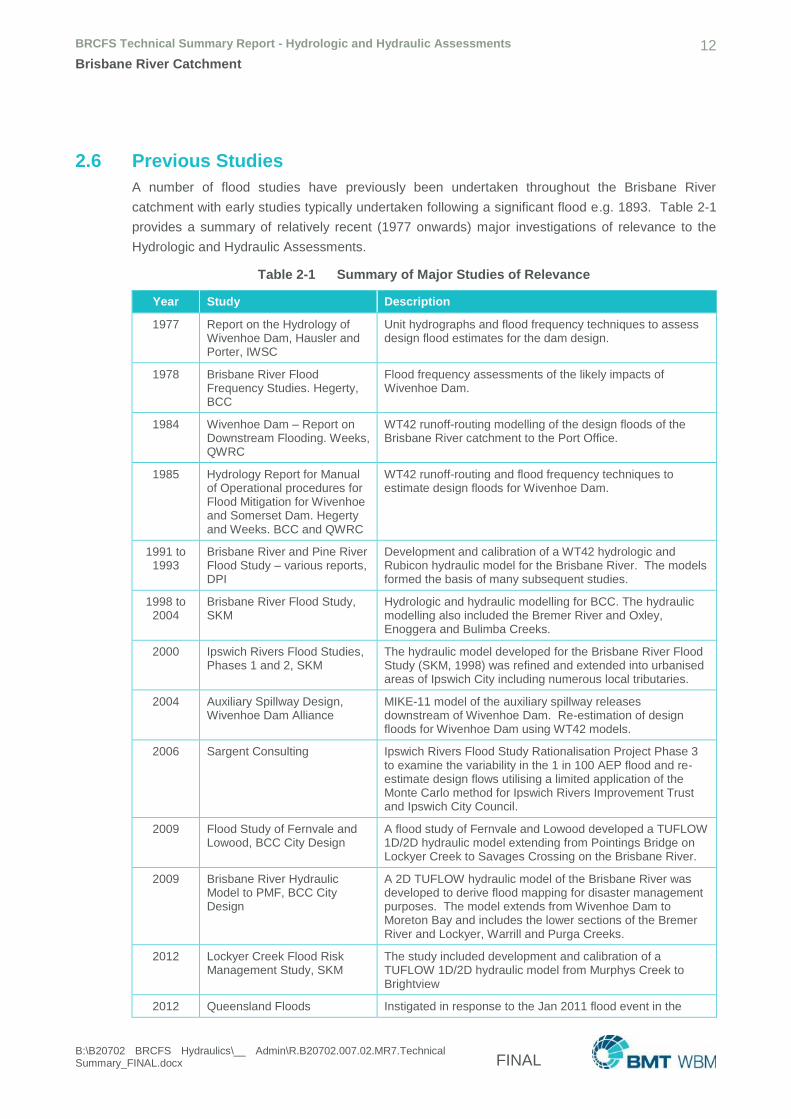
BRCFS Technical Summary Report - Hydrologic and Hydraulic Assessments 12
Brisbane River Catchment
B:\B20702 BRCFS Hydraulics\__ Admin\R.B20702.007.02.MR7.Technical Summary_FINAL.docx FINAL
2.6 Previous Studies
A number of flood studies have previously been undertaken throughout the Brisbane River
catchment with early studies typically undertaken following a significant flood e.g. 1893. Table 2-1
provides a summary of relatively recent (1977 onwards) major investigations of relevance to the
Hydrologic and Hydraulic Assessments.
Table 2-1 Summary of Major Studies of Relevance
Year Study Description
1977 Report on the Hydrology of Wivenhoe Dam, Hausler and Porter, IWSC
Unit hydrographs and flood frequency techniques to assess design flood estimates for the dam design.
1978 Brisbane River Flood Frequency Studies. Hegerty, BCC
Flood frequency assessments of the likely impacts of Wivenhoe Dam.
1984 Wivenhoe Dam – Report on Downstream Flooding. Weeks, QWRC
WT42 runoff-routing modelling of the design floods of the Brisbane River catchment to the Port Office.
1985 Hydrology Report for Manual of Operational procedures for Flood Mitigation for Wivenhoe and Somerset Dam. Hegerty and Weeks. BCC and QWRC
WT42 runoff-routing and flood frequency techniques to estimate design floods for Wivenhoe Dam.
1991 to 1993
Brisbane River and Pine River Flood Study – various reports, DPI
Development and calibration of a WT42 hydrologic and Rubicon hydraulic model for the Brisbane River. The models formed the basis of many subsequent studies.
1998 to 2004
Brisbane River Flood Study, SKM
Hydrologic and hydraulic modelling for BCC. The hydraulic modelling also included the Bremer River and Oxley, Enoggera and Bulimba Creeks.
2000 Ipswich Rivers Flood Studies, Phases 1 and 2, SKM
The hydraulic model developed for the Brisbane River Flood Study (SKM, 1998) was refined and extended into urbanised areas of Ipswich City including numerous local tributaries.
2004 Auxiliary Spillway Design, Wivenhoe Dam Alliance
MIKE-11 model of the auxiliary spillway releases downstream of Wivenhoe Dam. Re-estimation of design floods for Wivenhoe Dam using WT42 models.
2006 Sargent Consulting Ipswich Rivers Flood Study Rationalisation Project Phase 3 to examine the variability in the 1 in 100 AEP flood and re-estimate design flows utilising a limited application of the Monte Carlo method for Ipswich Rivers Improvement Trust and Ipswich City Council.
2009 Flood Study of Fernvale and Lowood, BCC City Design
A flood study of Fernvale and Lowood developed a TUFLOW 1D/2D hydraulic model extending from Pointings Bridge on Lockyer Creek to Savages Crossing on the Brisbane River.
2009 Brisbane River Hydraulic Model to PMF, BCC City Design
A 2D TUFLOW hydraulic model of the Brisbane River was developed to derive flood mapping for disaster management purposes. The model extends from Wivenhoe Dam to Moreton Bay and includes the lower sections of the Bremer River and Lockyer, Warrill and Purga Creeks.
2012 Lockyer Creek Flood Risk Management Study, SKM
The study included development and calibration of a TUFLOW 1D/2D hydraulic model from Murphys Creek to Brightview
2012 Queensland Floods Instigated in response to the Jan 2011 flood event in the
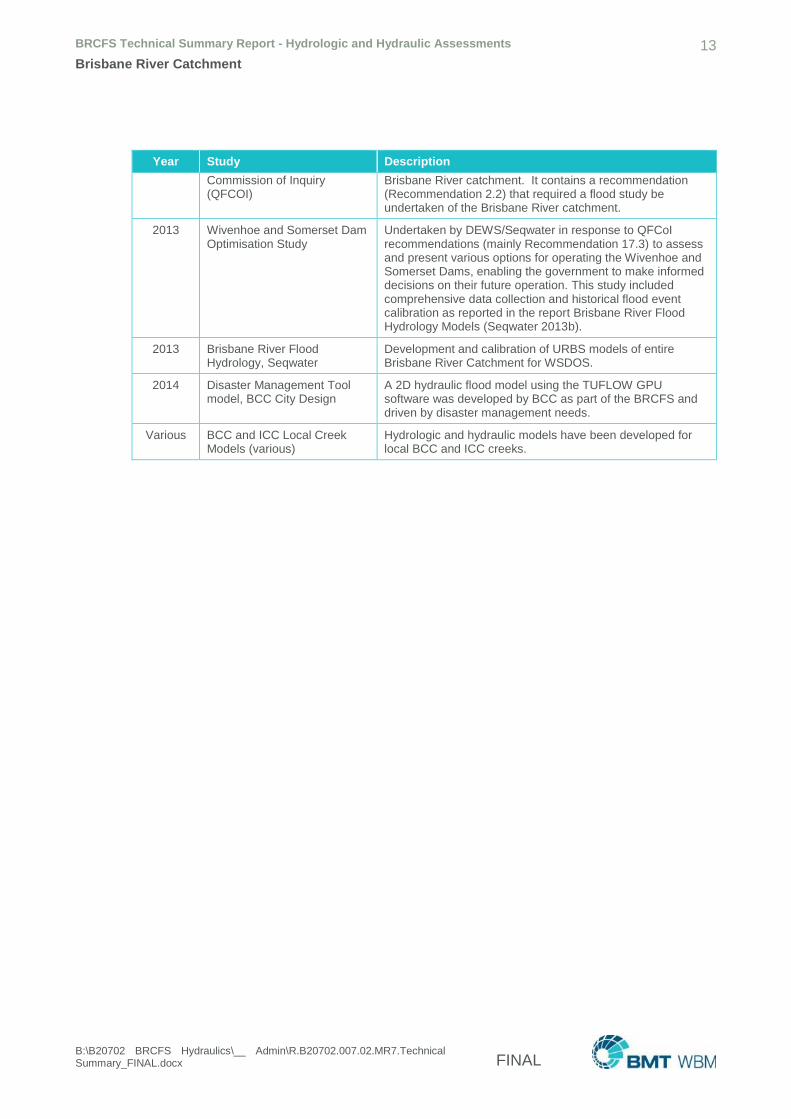
BRCFS Technical Summary Report - Hydrologic and Hydraulic Assessments 13
Brisbane River Catchment
B:\B20702 BRCFS Hydraulics\__ Admin\R.B20702.007.02.MR7.Technical Summary_FINAL.docx FINAL
Year Study Description
Commission of Inquiry (QFCOI)
Brisbane River catchment. It contains a recommendation (Recommendation 2.2) that required a flood study be undertaken of the Brisbane River catchment.
2013 Wivenhoe and Somerset Dam Optimisation Study
Undertaken by DEWS/Seqwater in response to QFCoI recommendations (mainly Recommendation 17.3) to assess and present various options for operating the Wivenhoe and Somerset Dams, enabling the government to make informed decisions on their future operation. This study included comprehensive data collection and historical flood event calibration as reported in the report Brisbane River Flood Hydrology Models (Seqwater 2013b).
2013 Brisbane River Flood Hydrology, Seqwater
Development and calibration of URBS models of entire Brisbane River Catchment for WSDOS.
2014 Disaster Management Tool model, BCC City Design
A 2D hydraulic flood model using the TUFLOW GPU software was developed by BCC as part of the BRCFS and driven by disaster management needs.
Various BCC and ICC Local Creek Models (various)
Hydrologic and hydraulic models have been developed for local BCC and ICC creeks.
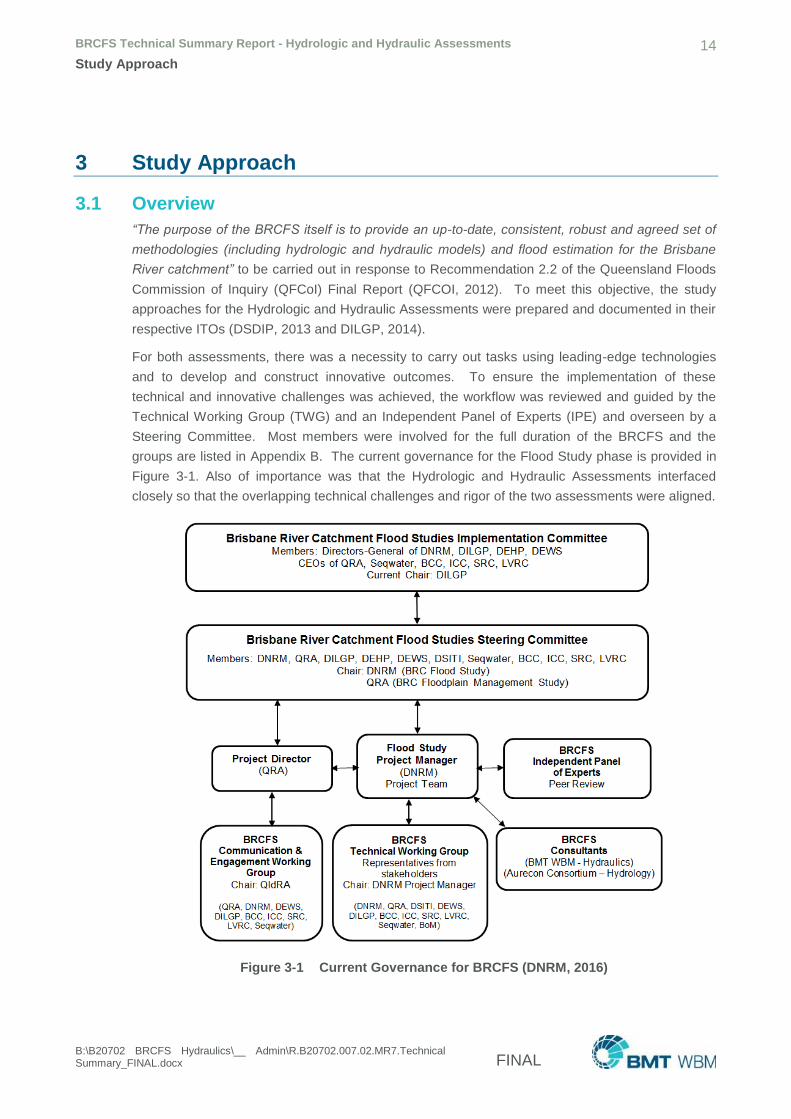
BRCFS Technical Summary Report - Hydrologic and Hydraulic Assessments 14
Study Approach
B:\B20702 BRCFS Hydraulics\__ Admin\R.B20702.007.02.MR7.Technical Summary_FINAL.docx FINAL
3 Study Approach
3.1 Overview
“The purpose of the BRCFS itself is to provide an up-to-date, consistent, robust and agreed set of
methodologies (including hydrologic and hydraulic models) and flood estimation for the Brisbane
River catchment” to be carried out in response to Recommendation 2.2 of the Queensland Floods
Commission of Inquiry (QFCoI) Final Report (QFCOI, 2012). To meet this objective, the study
approaches for the Hydrologic and Hydraulic Assessments were prepared and documented in their
respective ITOs (DSDIP, 2013 and DILGP, 2014).
For both assessments, there was a necessity to carry out tasks using leading-edge technologies
and to develop and construct innovative outcomes. To ensure the implementation of these
technical and innovative challenges was achieved, the workflow was reviewed and guided by the
Technical Working Group (TWG) and an Independent Panel of Experts (IPE) and overseen by a
Steering Committee. Most members were involved for the full duration of the BRCFS and the
groups are listed in Appendix B. The current governance for the Flood Study phase is provided in
Figure 3-1. Also of importance was that the Hydrologic and Hydraulic Assessments interfaced
closely so that the overlapping technical challenges and rigor of the two assessments were aligned.
Figure 3-1 Current Governance for BRCFS (DNRM, 2016)

BRCFS Technical Summary Report - Hydrologic and Hydraulic Assessments 15
Study Approach
B:\B20702 BRCFS Hydraulics\__ Admin\R.B20702.007.02.MR7.Technical Summary_FINAL.docx FINAL
At the core of both the Hydrologic and Hydraulic Assessments is the use of the Monte Carlo
Simulations (MCS) method. The Monte Carlo concept is used for calculating probabilities of
“something” occurring (e.g. a flood), when there are uncertainties and/or variability in the variables
that combine to produce that “something”. For flooding, it is applied by generating thousands of
synthetic floods based upon random sampling of variables, such as rainfall, dryness of the
catchment and dam reservoir levels. From this database of synthetic floods a probabilistic analysis
can be carried out to determine the AEP of a flood.
The MCS method as applied to the BRCFS uses probability distributions of variables (unknowns) to
generate a large number of unique flood events with different combinations of contributing factors
such as rainfall patterns, losses and initial dam levels from which, for example, the 1 in 100 AEP
flood flows and levels can be derived. MCS is particularly useful in flood modelling where variable
combinations of contributing factors to flood magnitude are not readily represented in traditional
approaches, as is the case for the Brisbane River catchment.
By using the MCS approach, allowance was made for variations in: spatial and temporal rainfall;
antecedent (wet to dry) catchment conditions; initial Wivenhoe and Somerset lake levels (which
affect flooding downstream and dam operations); and storm surge and tidal conditions.
Historically, the challenge in using MCS methods is that they have much greater computational
demands and are laborious to implement. However, with the advent of faster computers and
improved MCS statistical methods, along with innovative approaches implemented during the
Hydrologic and Hydraulic Assessments, a MCS approach to the complex and challenging Brisbane
River catchment was achieved.
Figure 3-2 presents a simplified overall flowchart of the key modelling steps in the hydrologic and
hydraulic phases. Key processes are further explained in the appropriate sections of this report.
3.2 Hydrologic Assessment
The purpose of the Hydrologic Assessment is to develop and apply state of the art methods that
produce consistent and robust hydrologic models and analytical techniques that provide best
estimates of a range of flood flows and flood volumes for annual exceedance probabilities (AEP)
across the entire Brisbane River system.
The study has produced a number of tools including consolidated stream flow rating curves, a
comprehensive set of calibrated hydrologic models of the entire Brisbane River Catchment, a dam
operations model of the flood mitigation dams and a Monte Carlo Simulation (MCS) framework for
estimating stochastic design flood estimates.
A reconciliation process has been adopted to assimilate the estimates of peak flows and flood
volumes for the different assessment methods (DEA, FFA, MCS) for the various locations
nominated for investigation. This process has endeavoured to make use of the strengths of each of
the assessment techniques and the best use of the available data/information to produce
consistent and robust estimates across the entire flood frequency range.

BRCFS Technical Summary Report - Hydrologic and Hydraulic Assessments 16
Study Approach
B:\B20702 BRCFS Hydraulics\__ Admin\R.B20702.007.02.MR7.Technical Summary_FINAL.docx FINAL
Figure 3-2 BRCFS Key Modelling Steps in Hydrologic and Hydraulic Assessments
The resultant Monte-Carlo Simulation framework is considered to have advantages over more
“traditional” approaches in flood risk analysis in that it explicitly considers variability of significant
factors that contribute to the magnitude of flood events. A practical disadvantage is that it is
generally more complex to implement, but this has been addressed by constructing the MCS
framework in the Delft-FEWS environment that enables efficient data management, manipulation
and visualisation.
3.3 Consistency between Hydrologic/Hydraulic Assessments
As the Hydrologic and Hydraulic Assessments were carried out as separate undertakings, a joint
development and calibration of the hydrologic and hydraulic modelling was not feasible. Therefore,
to check and demonstrate consistency between the hydrologic and hydraulic modelling, flow versus
water level (the stage-discharge relationship) output from the hydraulic models was compared with
the rating curves derived and adopted by the hydrologic modelling at key locations. Should an
unacceptable mismatch between the rating curves used by the hydrologic modelling and the stage-
discharge output from the hydraulic modelling have occurred, the need to revise and fine-tune the
hydrologic modelling would have been triggered, followed by a fine-tuning of the hydraulic
modelling. Therefore, a critical component of the Hydraulic Assessment was to review and check
BRCFS Technical Summary Report - Hydrologic and Hydraulic Assessments 17
Study Approach
B:\B20702 BRCFS Hydraulics\__ Admin\R.B20702.007.02.MR7.Technical Summary_FINAL.docx FINAL
the performance of the hydraulic modelling against the Hydrologic Assessment rating curves at
several key stages.
3.4 Hydraulic Assessment
The Hydraulic Assessment “will provide up-to-date, consistent and robust hydraulic models and
analysis tools for the development of the Brisbane River Catchment Floodplain Management Study
and Plan (BRCFMS and BRCSFMP)” (Hydraulic ITO (DILGP, 2014), Section 3.1.3). This was
achieved using the approach discussed below.
Good quality data was sourced for the Hydraulic Assessment via the DCS (Aurecon, 2013) and
DMT Study by BCC CPO (BCC 2014a, BCC 2014b). Data was also collected during the
assessment if gaps became apparent. These data included: LiDAR, bathymetric and
road/rail/embankment surveys; recorded hydrometric data for model calibration/verification; land
use data; bridge/culvert structure details; urban drainage infrastructure; and incorporated future
developments. The latest and most up-to-date data sets were utilised for the design flood
simulations.
Two hydraulic models using the TUFLOW software were developed and calibrated: the Fast Model
and the Detailed Model. The Fast Model is used to screen the large set of Monte Carlo Simulation
outputs to a more manageable set of representative events to be run through the Detailed Model.
The Fast Model, as the name implies, required a target run time of 15 minutes or less per
simulation, so as to simulate in the order of 500 statistically generated MC flood events. From the
large number of MC flood simulations using the Fast Model a statistical analysis at 28 locations
(referred to as the Reporting Locations) along the main waterways was carried out to derive AEP
peak flood level estimates. During the course of the Hydraulic Assessment it because feasible to
increase the number of MC events for simulation in the Fast Model from 500 to 11,340 (see
Section 6.4.2). This substantially improved the robustness of the AEP peak flood level estimates.
As the Detailed Model has much longer run times it is not practical to simulate all 11,340 MC
events. Therefore, a sub-set of 60 MC events was selected to form 11 AEP ensembles ranging
from the 1 in 2 AEP to the 1 in 100,000 AEP flood. These ensembles were selected to match the
AEP flood levels at the Reporting Locations and then enable mapping of AEP flood levels across
the floodplain to include areas between the reporting locations.
The Detailed Model is a 1D/2D hydraulic model that has a significantly higher resolution and much
better accuracy over the floodplains than the Fast Model. Its prime purpose is for producing flood
maps and 3D surfaces of flood levels, depths, velocities and hazard. The Detailed Model is the
most comprehensive and complex hydraulic model developed for the Brisbane River catchment.
The Fast and Detailed Models were calibrated and verified to five historical events of 1974, 1996,
1999, 2011 and 2013, and to tidal conditions. This validation of the hydraulic models using industry
standard parameters is critical to demonstrating the models’ authenticity and robustness.
The 60 MC events that make up the 11 AEP ensembles were simulated through the Detailed
Model, and the peak hydraulic outputs for each AEP ensemble were generated. The hydraulic
results produced were peak flood level, depth, velocity and hydraulic hazard (DxV or depth
multiplied by velocity), and were presented in the form of maps, tables and a variety of charts.

BRCFS Technical Summary Report - Hydrologic and Hydraulic Assessments 18
Study Approach
B:\B20702 BRCFS Hydraulics\__ Admin\R.B20702.007.02.MR7.Technical Summary_FINAL.docx FINAL
Sensitivity test scenarios were simulated using the Detailed Model to estimate indicative changes
to flooding from: (a) a hypothetical future floodplain development case; (b) climate change; (c)
Brisbane River bed level changes; and (d) the effect of major dams on historical events.
BRCFS Technical Summary Report - Hydrologic and Hydraulic Assessments 19
Data Collection and Collation
B:\B20702 BRCFS Hydraulics\__ Admin\R.B20702.007.02.MR7.Technical Summary_FINAL.docx FINAL
4 Data Collection and Collation
A data collection and collation exercise was undertaken to inform the study and hydrologic and
hydraulic model development. This section summarises the key categories of source data utilised
in the study. Some of the datasets within these categories are not used directly by the models but
have been used to inform model design and therefore remain a key dataset for the purposes of the
study.
4.1 Rainfall
Historical rainfall data in the form of daily rainfall and pluviograph records is required for the
calibration of the hydrologic model and as input into the MCS analysis. This information was
sourced from the Bureau of Meteorology (BoM) and also from Seqwater (Seqwater, 2013). Data
received from BoM and Seqwater were of varied quality. However the Seqwater data was already
processed into 48 flood events and was of most use for the assessment.
Intensity-frequency-duration (IFD) data is required for input to the Design Event Approach (DEA)
and Monte Carlo Simulation (MCS) analyses. This data is available for two separate IFD datasets:
that produced for the 1987 version of Australian Rainfall and Runoff (ARR), (Engineers Australia,
1987); and that produced in 2013 for the current update of ARR (BoM, 2013). On the
recommendation of the IPE, the 2013 IFD data set was adopted for the purpose of this study. This
data covers the range of design rainfalls from 1 in 2 AEP to 1 in 100 AEP.
The BoM released its final update of IFD data for ARR (BoM, 2016) in November 2016 for the 1 in
2 to 1 in 100 AEP rainfall events. The IFD data for the 1 in 200 to 1 in 2000 AEP rainfall events is
scheduled to be released in about February 2017.
For the large to rare flood magnitude range, CRC-Forge (Hargraves, 2005) design rainfall
estimates were used. This covers the range of rainfall estimates up to the 1 in 2,000 AEP, the limit
of credible extrapolation. For extreme rainfall estimates (Probable Maximum Precipitation), the
generalised techniques described by the GSDM and GTSMR (BoM, 2003) were adopted. The
techniques specified in Book VI of ARR (Engineers Australia, 2003), have been used to interpolate
design rainfall estimates between the 1 in 2,000 AEP and the Probable Maximum Precipitation
(PMP).
Temporal patterns for the DEA were obtained from ARR (Engineers Australia, 1987) for the North-
East Coast Zone and also from the GTSMR and GSDM extreme rainfall estimation guidebooks.
For the MCS, temporal and spatial rainfall patterns were obtained from stochastically generated
space-time patterns developed by the BoM and Jacobs (2013) for Seqwater.
BRCFS Technical Summary Report - Hydrologic and Hydraulic Assessments 20
Data Collection and Collation
B:\B20702 BRCFS Hydraulics\__ Admin\R.B20702.007.02.MR7.Technical Summary_FINAL.docx FINAL
4.2 Historical Flood Records
4.2.1 Stream Gauges
Up-to-date continuous gauge recordings for DNRM gauges were collected from the DNRM
website. Limited continuous gauge recordings were collected from BoM. This information is
required for determining peak flow and volumetric flood frequency analyses and is used in the re-
calibration of the hydrologic model and calibration of the hydraulic models.
4.2.2 Flood Marks
Historical flood mark records exist for the 1974, 2011 and 2013 flood events. These marks are
considered to be peak flood levels at spot locations. The flood marks were surveyed after the
event and are typically based on debris marks or watermarks. It is important to realise that debris
and watermarks can be inaccurate for a number of reasons including:
Dynamic hydraulic effects such as waves, eddies, pressure surges, bores or transient effects,
which may not be accounted for in the model. For example, if the debris mark is located within
a region of fast flowing floodwater it is possible that the floodwater has pushed the debris up
against an obstacle, lodging it at a higher level than the surrounding flood level.
Lodgement of debris at a level lower than the peak flood level. The reason for this is that for
debris to be deposited, it needs to have somewhere to lodge and this elevation is not always at
the peak flood level.
4.2.3 Flow Gaugings at Centenary Bridge
Flow gauging carried out on the downstream side of Centenary Bridge during the 1974, 2011 and
2013 floods provides valuable data on the actual flows close to the peaks of these floods and also
during the rising and falling stages. For the 2011 and 2013 floods, flows were also measured
during the “steady-state” post flood Wivenhoe Dam releases, once again providing a check on
discharges during controlled releases from Wivenhoe Dam. Of note is that the 1974 flow
measurements are considered to be of lesser accuracy due to the use of older technology. Water
levels off the downstream side were also recorded whilst the flow measurements were taken.
4.2.4 Flood Extents
Information on historical flood extents has been sourced for the major flood events of 1974 and
2011. This has been obtained from a variety of sources including the Queensland Government
Information Service and direct from local Councils. Some aerial imagery was available which was
captured during the flood events (see Figure 4-1). Extents and imagery were used to inform the
hydraulic model calibration.
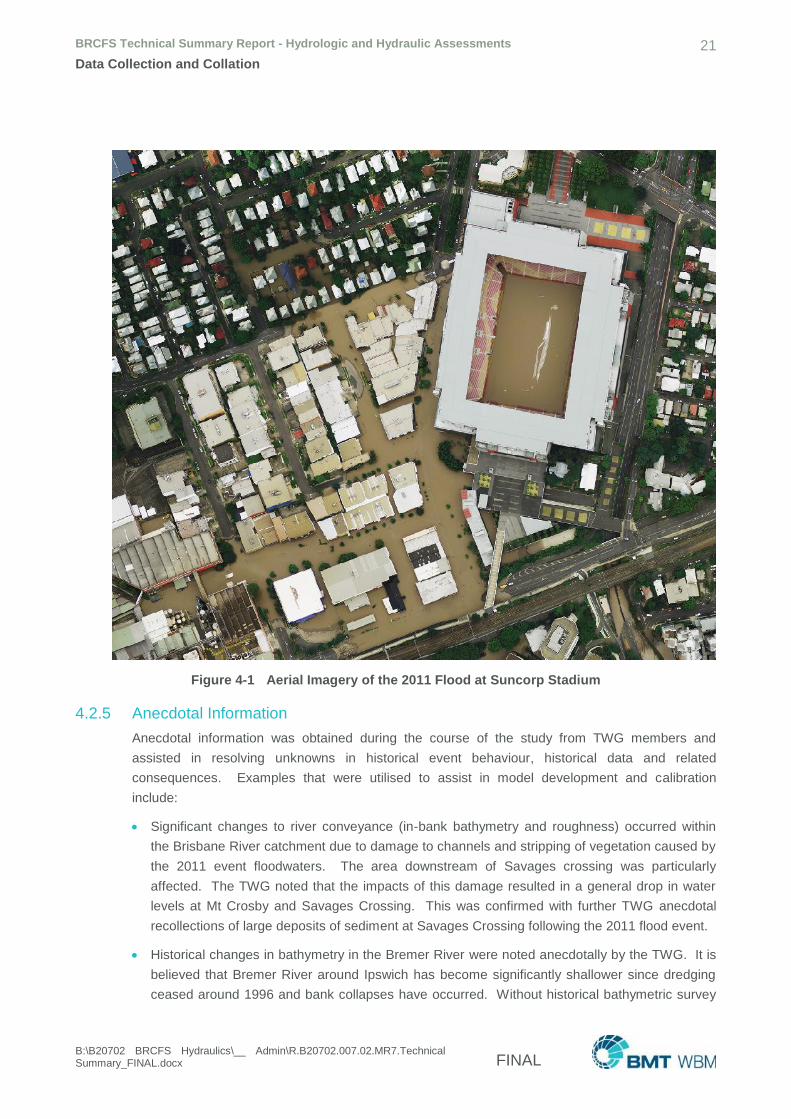
BRCFS Technical Summary Report - Hydrologic and Hydraulic Assessments 21
Data Collection and Collation
B:\B20702 BRCFS Hydraulics\__ Admin\R.B20702.007.02.MR7.Technical Summary_FINAL.docx FINAL
Figure 4-1 Aerial Imagery of the 2011 Flood at Suncorp Stadium
4.2.5 Anecdotal Information
Anecdotal information was obtained during the course of the study from TWG members and
assisted in resolving unknowns in historical event behaviour, historical data and related
consequences. Examples that were utilised to assist in model development and calibration
include:
Significant changes to river conveyance (in-bank bathymetry and roughness) occurred within
the Brisbane River catchment due to damage to channels and stripping of vegetation caused by
the 2011 event floodwaters. The area downstream of Savages crossing was particularly
affected. The TWG noted that the impacts of this damage resulted in a general drop in water
levels at Mt Crosby and Savages Crossing. This was confirmed with further TWG anecdotal
recollections of large deposits of sediment at Savages Crossing following the 2011 flood event.
Historical changes in bathymetry in the Bremer River were noted anecdotally by the TWG. It is
believed that Bremer River around Ipswich has become significantly shallower since dredging
ceased around 1996 and bank collapses have occurred. Without historical bathymetric survey
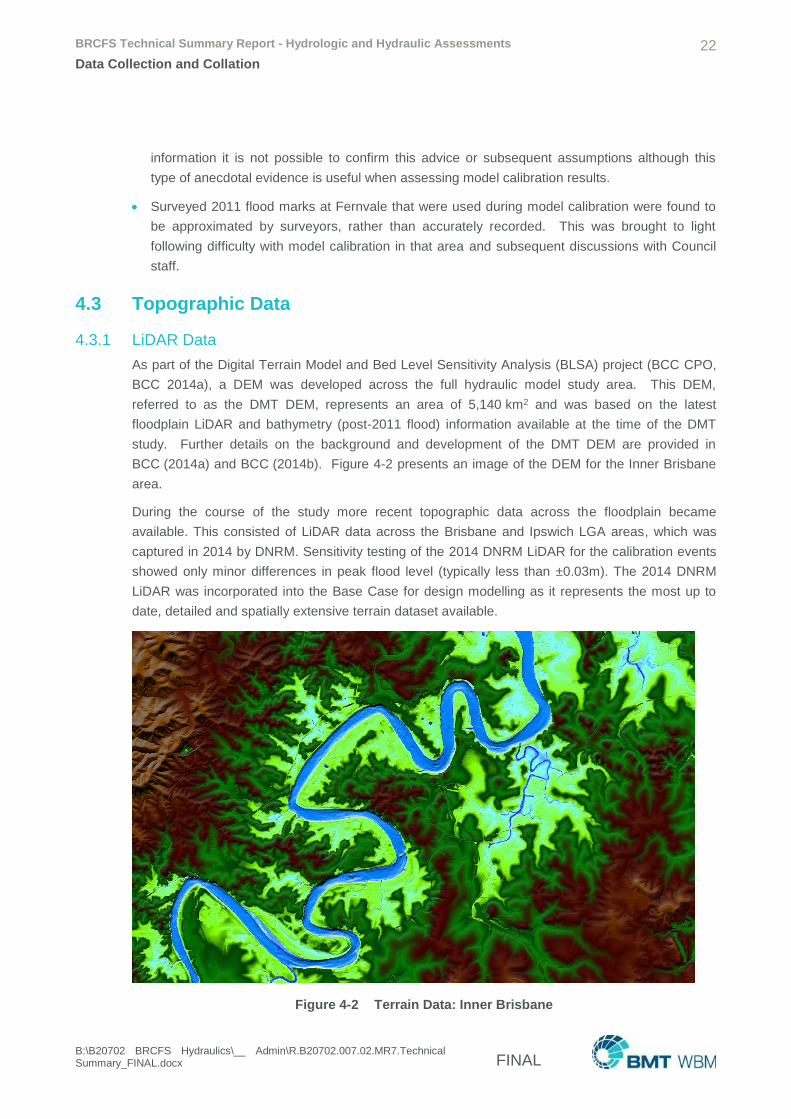
BRCFS Technical Summary Report - Hydrologic and Hydraulic Assessments 22
Data Collection and Collation
B:\B20702 BRCFS Hydraulics\__ Admin\R.B20702.007.02.MR7.Technical Summary_FINAL.docx FINAL
information it is not possible to confirm this advice or subsequent assumptions although this
type of anecdotal evidence is useful when assessing model calibration results.
Surveyed 2011 flood marks at Fernvale that were used during model calibration were found to
be approximated by surveyors, rather than accurately recorded. This was brought to light
following difficulty with model calibration in that area and subsequent discussions with Council
staff.
4.3 Topographic Data
4.3.1 LiDAR Data
As part of the Digital Terrain Model and Bed Level Sensitivity Analysis (BLSA) project (BCC CPO,
BCC 2014a), a DEM was developed across the full hydraulic model study area. This DEM,
referred to as the DMT DEM, represents an area of 5,140 km2 and was based on the latest
floodplain LiDAR and bathymetry (post-2011 flood) information available at the time of the DMT
study. Further details on the background and development of the DMT DEM are provided in
BCC (2014a) and BCC (2014b). Figure 4-2 presents an image of the DEM for the Inner Brisbane
area.
During the course of the study more recent topographic data across the floodplain became
available. This consisted of LiDAR data across the Brisbane and Ipswich LGA areas, which was
captured in 2014 by DNRM. Sensitivity testing of the 2014 DNRM LiDAR for the calibration events
showed only minor differences in peak flood level (typically less than ±0.03m). The 2014 DNRM
LiDAR was incorporated into the Base Case for design modelling as it represents the most up to
date, detailed and spatially extensive terrain dataset available.
Figure 4-2 Terrain Data: Inner Brisbane
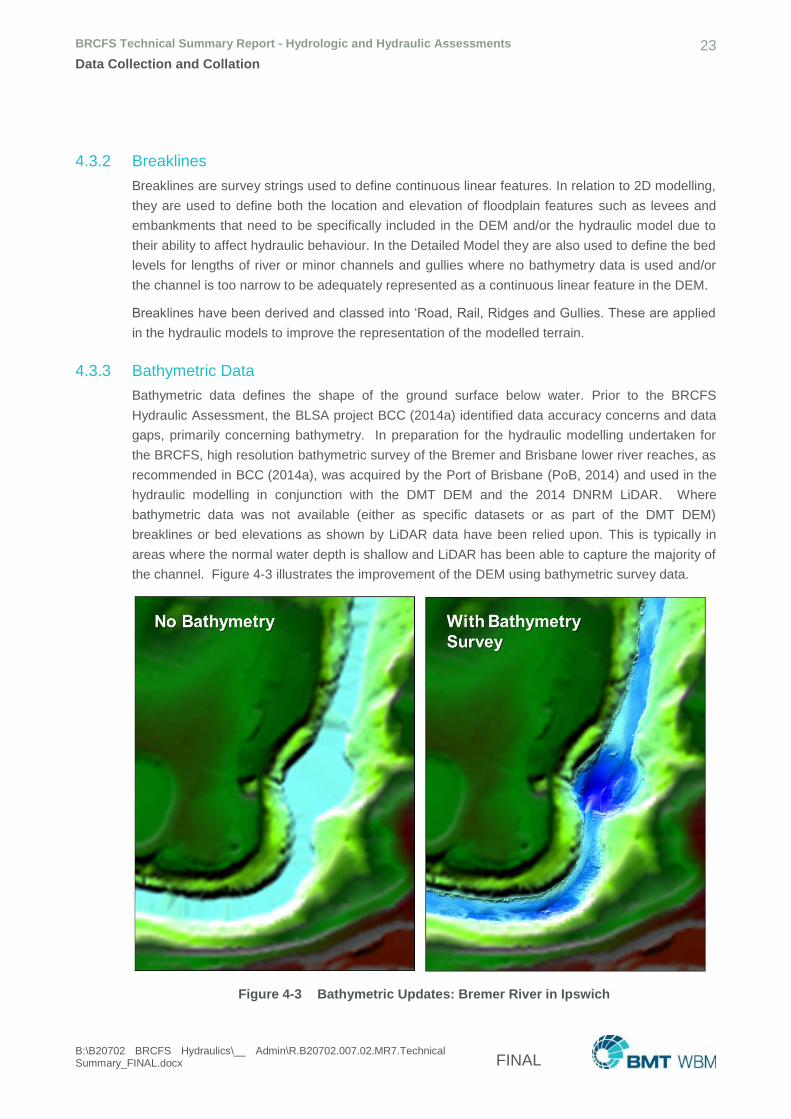
BRCFS Technical Summary Report - Hydrologic and Hydraulic Assessments 23
Data Collection and Collation
B:\B20702 BRCFS Hydraulics\__ Admin\R.B20702.007.02.MR7.Technical Summary_FINAL.docx FINAL
4.3.2 Breaklines
Breaklines are survey strings used to define continuous linear features. In relation to 2D modelling,
they are used to define both the location and elevation of floodplain features such as levees and
embankments that need to be specifically included in the DEM and/or the hydraulic model due to
their ability to affect hydraulic behaviour. In the Detailed Model they are also used to define the bed
levels for lengths of river or minor channels and gullies where no bathymetry data is used and/or
the channel is too narrow to be adequately represented as a continuous linear feature in the DEM.
Breaklines have been derived and classed into ‘Road, Rail, Ridges and Gullies. These are applied
in the hydraulic models to improve the representation of the modelled terrain.
4.3.3 Bathymetric Data
Bathymetric data defines the shape of the ground surface below water. Prior to the BRCFS
Hydraulic Assessment, the BLSA project BCC (2014a) identified data accuracy concerns and data
gaps, primarily concerning bathymetry. In preparation for the hydraulic modelling undertaken for
the BRCFS, high resolution bathymetric survey of the Bremer and Brisbane lower river reaches, as
recommended in BCC (2014a), was acquired by the Port of Brisbane (PoB, 2014) and used in the
hydraulic modelling in conjunction with the DMT DEM and the 2014 DNRM LiDAR. Where
bathymetric data was not available (either as specific datasets or as part of the DMT DEM)
breaklines or bed elevations as shown by LiDAR data have been relied upon. This is typically in
areas where the normal water depth is shallow and LiDAR has been able to capture the majority of
the channel. Figure 4-3 illustrates the improvement of the DEM using bathymetric survey data.
Figure 4-3 Bathymetric Updates: Bremer River in Ipswich
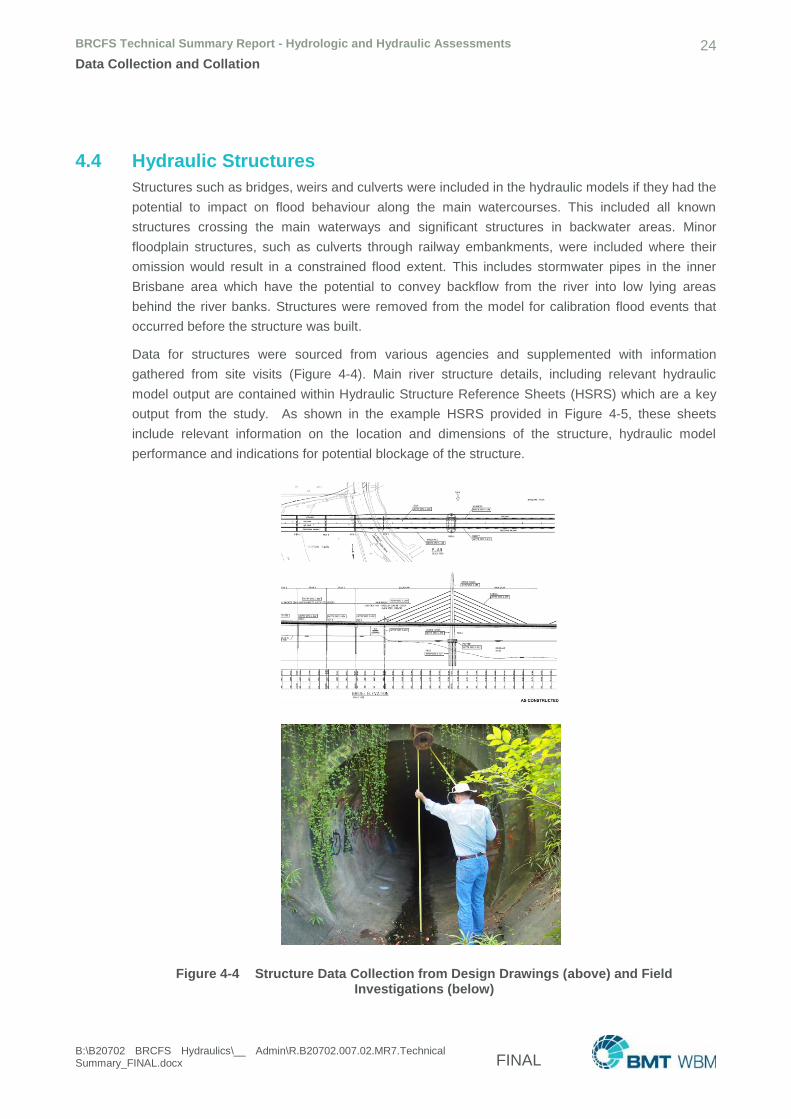
BRCFS Technical Summary Report - Hydrologic and Hydraulic Assessments 24
Data Collection and Collation
B:\B20702 BRCFS Hydraulics\__ Admin\R.B20702.007.02.MR7.Technical Summary_FINAL.docx FINAL
4.4 Hydraulic Structures
Structures such as bridges, weirs and culverts were included in the hydraulic models if they had the
potential to impact on flood behaviour along the main watercourses. This included all known
structures crossing the main waterways and significant structures in backwater areas. Minor
floodplain structures, such as culverts through railway embankments, were included where their
omission would result in a constrained flood extent. This includes stormwater pipes in the inner
Brisbane area which have the potential to convey backflow from the river into low lying areas
behind the river banks. Structures were removed from the model for calibration flood events that
occurred before the structure was built.
Data for structures were sourced from various agencies and supplemented with information
gathered from site visits (Figure 4-4). Main river structure details, including relevant hydraulic
model output are contained within Hydraulic Structure Reference Sheets (HSRS) which are a key
output from the study. As shown in the example HSRS provided in Figure 4-5, these sheets
include relevant information on the location and dimensions of the structure, hydraulic model
performance and indications for potential blockage of the structure.
Figure 4-4 Structure Data Collection from Design Drawings (above) and Field Investigations (below)
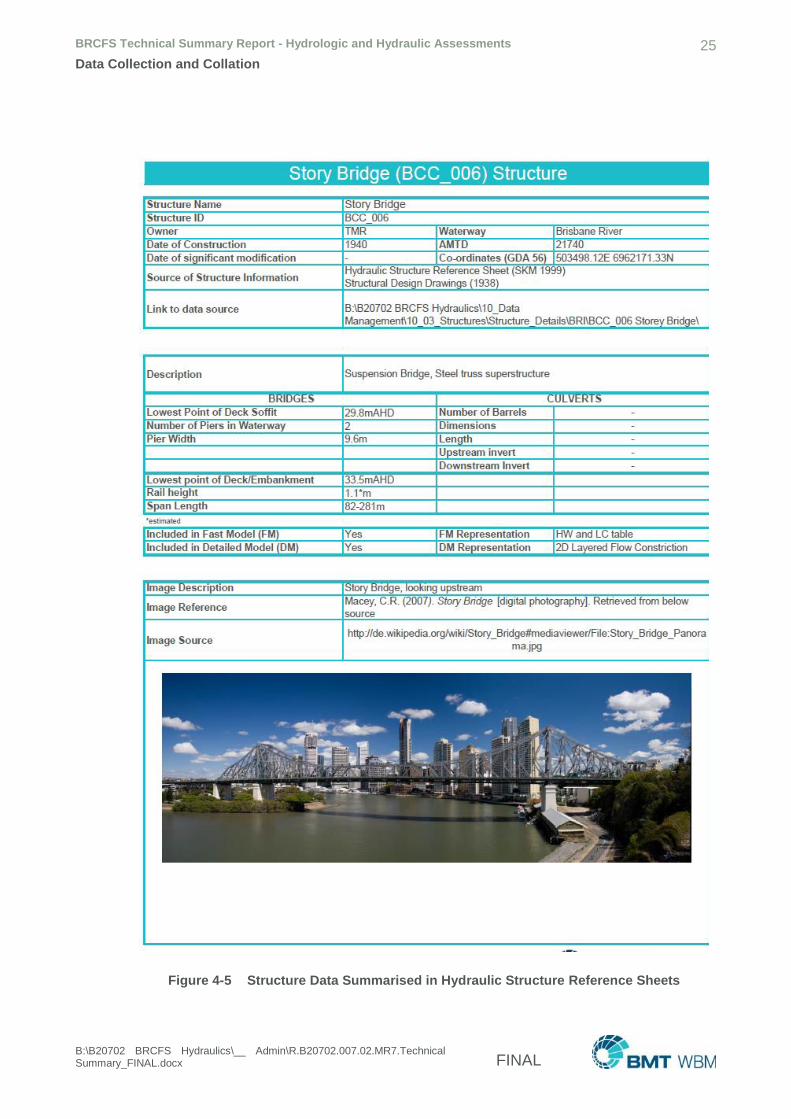
BRCFS Technical Summary Report - Hydrologic and Hydraulic Assessments 25
Data Collection and Collation
B:\B20702 BRCFS Hydraulics\__ Admin\R.B20702.007.02.MR7.Technical Summary_FINAL.docx FINAL
Figure 4-5 Structure Data Summarised in Hydraulic Structure Reference Sheets

BRCFS Technical Summary Report - Hydrologic and Hydraulic Assessments 26
Data Collection and Collation
B:\B20702 BRCFS Hydraulics\__ Admin\R.B20702.007.02.MR7.Technical Summary_FINAL.docx FINAL
4.5 Land Use Data
Spatial land use data is used to assist in determining impervious areas for hydrologic modelling
and for attributing surface roughness values in hydraulic modelling. For the purposes of the
hydraulic modelling for current conditions, land use extents available from existing datasets were
updated by manual digitisation using aerial photographs to improve land use categorisation,
particularly in areas adjacent to major waterways. An example of the refined land use delineation
following the manual digitisation process is provided in Figure 4-6.
Figure 4-6 Example of the Detailed Spatial Differentiation of Land Uses
4.6 Tidal Data
Predicted series of tide levels for the mouth of the Brisbane River were obtained from the BoM
publication of standard astronomical tide data, which is available on the BoM website. Estimates of
the storm surge were obtained from the Coastal Plan Implementation Study (Draft) carried out for
Brisbane City Council by GHD (GHD, 2014). As part of the Hydrologic Assessment, The storm
surge estimates were combined with an astronomical tide series taken from a monthly series of
‘average’ tidal conditions. Multiple time series of combined tide and surge were generated in this
way with different combinations of peak ocean water level and timings of the peak of the surge with
the tide.
BRCFS Technical Summary Report - Hydrologic and Hydraulic Assessments 27
Hydrologic Assessment
B:\B20702 BRCFS Hydraulics\__ Admin\R.B20702.007.02.MR7.Technical Summary_FINAL.docx FINAL
5 Hydrologic Assessment
5.1 Introduction
The primary objective of the Hydrologic Assessment is to develop and apply analytical techniques,
including calibrating reliable hydrologic models and to provide:
Best estimates and indications of uncertainty in peak flow and flood volume estimates at
Hydrologic Assessment Reporting Locations throughout the Brisbane River catchment; and
Sets of hydrographs generated by MCS at input locations to the hydraulic models.
Three independent assessment techniques are used to estimate peak discharges and flow
volumes for a range of Annual Exceedance Probabilities (AEP):
(1) Flood Frequency Analysis (FFA)
(2) Design Event Approach (DEA)
(3) Monte Carlo Simulation (MCS).
The DEA and MCS methods are both referred to as ‘rainfall based methods’, as they both rely on
rainfall statistics in combination with a rainfall-runoff model to compute peak flows and flow
volumes at locations of interest. With the FFA method, peak flows and flow volumes for given AEPs
are derived directly from observed flows.
A reconciliation process has been adopted to assimilate the estimates of peak flows and flood
volumes for the different assessment methods for the various locations nominated for investigation.
This process has endeavoured to make use of the strengths of each of the assessment techniques
and the best use of the available data/information to produce consistent and robust estimates
across the entire flood frequency range.
5.2 Rating Curve Review
Understanding the relationship between water level and flow at gauge stations and the derivation of
accurate discharge rating curves is a fundamental step to developing a robust catchment
hydrologic assessment. Accurate high flow rating curves provide the basis for site specific flood
frequency and historic event flow estimation.
The Brisbane River catchment contains over 70 currently active flood level gauges as well as
numerous other gauges that have operated historically. The gauges are operated by different
stakeholders (DNRM, Seqwater and BoM) and provide records that are of varying quality, reliability
and usefulness to the BRCFS. The objectives of the rating curve review were therefore to:
Identify key stream gauges that are of use to the BRCFS.
Identify and improve if possible the level of confidence in the at-site gauge rating.
Ensure catchment-wide consistency between the gauges.
BRCFS Technical Summary Report - Hydrologic and Hydraulic Assessments 28
Hydrologic Assessment
B:\B20702 BRCFS Hydraulics\__ Admin\R.B20702.007.02.MR7.Technical Summary_FINAL.docx FINAL
5.2.1 Rating curve review process
The initial task of the rating curve review process was to compile and review available data at each
of the major gauges within the catchment and to classify the flood gauges according to their
proposed priority of usage. The gauges were assessed in terms of: singularity of control (having a
direct and consistent relationship between gauge level and stream flow); the significance of the
gauge to the hydrologic modelling; the availability and reliability of calibration data at the site; and
the length and quality of flood record at the site. Using these criteria, gauges were classed as
either primary or secondary, with the method and detail of analysis applied to each classification
discussed below.
Gauge rating curves form the link between recorded flood levels and discharge at the gauge. The
data used to develop these ratings can be obtained by a variety of methods, including:
Flow gauging – An estimate of discharge obtained from physically measured flow properties
corresponding to measured water levels. Flow measurements may be obtained by a number of
different methods, but are typically based on measured flow velocity and cross-section area.
Accuracy of the flow estimate can therefore vary significantly depending on the data capture
method. Nevertheless, flow gauging is the only method that provides simultaneous flow and
level measurement, and is thus independent of numerical modelling. Except in rare
circumstances, flow gauging data is typically only available for low to mid-range flows.
Reverse reservoir routing – The Brisbane River catchment contains several reservoirs, of which
six have been considered by Seqwater to have an influence on flood behaviour. These include
the major Wivenhoe and Somerset Dams and the smaller Moogerah, Cressbrook Creek, Lake
Manchester and Perseverance Dams. These reservoirs generally have well-defined
relationships between reservoir level, volume and outflow from which inflows into the reservoir
can be estimated by back analysis of the continuity equation.
Hydraulic modelling – Hydraulic models calculate water level for a known discharge. The
reliability is dependent on how well the numerical model can represent the actual physical flow
conditions. Confidence in the hydraulic model predictions can be improved by calibrating the
model to flow gauging or other data.
Hydrologic modelling – Hydrologic models estimate discharge based on recorded rainfall data
that can then be matched to recorded stream levels. Results of the hydrologic model are
influenced by multiple factors, which include the model parameters, assumed losses and rainfall
data that may vary significantly across the catchment and not be captured reliably by the rainfall
gauges. Additionally, because this method is wholly dependent on the output of the hydrologic
model, using rating curves derived in this manner to calibrate the hydrologic model can lead to a
circular reasoning, and must therefore be treated with caution. Nevertheless, hydrologic
modelling can be used to evaluate consistency between gauges within a catchment, and
greater confidence can be placed if the catchment model can be well calibrated to a nearby
reliable gauge. Hydrologic modelling is particularly useful to evaluate consistency between
upstream and downstream gauges. As with the hydraulic model, the results can be calibrated to
flow gauging data and used to extrapolate the rating to higher discharges, however this
extrapolation is based on the catchment-wide properties and empirical formulations inherent in

BRCFS Technical Summary Report - Hydrologic and Hydraulic Assessments 29
Hydrologic Assessment
B:\B20702 BRCFS Hydraulics\__ Admin\R.B20702.007.02.MR7.Technical Summary_FINAL.docx FINAL
the hydrologic model rather than the more realistic and specific local site conditions of a
hydraulic model.
Correlation of gauge data – Provided that the additional contributing catchment between the
gauges is small, gauges in close proximity can be correlated to allow flows from a well-
documented site to be translated to a less data rich site, or to potentially identify discrepancies
or outliers in the data.
The methods above are listed in order of perceived reliability, and thus the order of priority used
when determining or reviewing reliability of the gauge ratings. It should be noted that no one
method is considered completely reliable, and that the highest confidence can only be reached by
comparison of and achieving consistency between all the available data.
5.2.2 Selection and treatment of Brisbane River gauge ratings
Primary gauges were considered to be of high importance for the hydrologic modelling. Eight
gauges were given this classification as listed in Table 5-1, including at least one gauge in each of
the seven catchments to provide a reliable control for the URBS model calibration. In addition to
the review of existing data and ratings, a detailed hydraulic assessment of the rating curve was
conducted for the primary gauges. With the exception of the lower Brisbane River gauges
downstream of Wivenhoe Dam, this entailed development of an independent two-dimensional
hydraulic model of the gauge site. Where recorded stream gauge level and flow measurement
were available, the hydraulic models were calibrated to match this data and then used to extend
the rating curve to levels/flows in excess of the largest observed flood at the site.
Secondary gauges were considered to be those for which a reliable rating curve is desirable, but
not essential for the hydrologic model calibration, or limited by availability of data or other factors
adversely affecting development of a reliable rating. Preliminary analysis of secondary gauge
ratings was initially limited to review of existing data, including flow gauging data, gauge ratings,
and hydrologic model results. This data was assessed to identify the range and reliability of the
existing rating. Once calibration of the hydrologic models had been undertaken, the secondary
ratings were subsequently reviewed. Figure 5-1 shows the treatment of a secondary gauge rating
at Gregors Creek, including available stream flow gauging’s and hydrologic model results, as well
as previous ratings adopted for the gauge by DNRM and Seqwater. This data was reviewed and
assimilated to adopt a final consistent set of ratings for the catchments.
Ratings have been developed for the five main gauge locations in the Lower Brisbane River
(Savages Crossing, Mt Crosby, Moggill, Centenary Bridge and Brisbane City) using results from a
two-dimensional TUFLOW model of the lower Brisbane River developed by BCC CPO on behalf of
DSDIP during 2014 for use as a disaster management tool (DMT) (BCC, 2014b).
The DMT model results identify that much of the lower Brisbane River between Wivenhoe and
Brisbane City is subject to noticeable dynamic effects (e.g. hysteresis) that become increasingly
more pronounced with flood magnitude and with distance downstream. The ratings derived from
the DMT model were compared to available calibration data at each site, including flow
measurements, steady-state Wivenhoe releases and the Hydrologic Assessment’s hydrologic
model results.

BRCFS Technical Summary Report - Hydrologic and Hydraulic Assessments 30
Hydrologic Assessment
B:\B20702 BRCFS Hydraulics\__ Admin\R.B20702.007.02.MR7.Technical Summary_FINAL.docx FINAL
Figure 5-1 Rating Comparison – Brisbane River @ Gregors Creek (full range)
Table 5-1 Brisbane River gauge ratings reviewed as part of BRCFS
Catchment Primary Gauge Sites Secondary Gauge sites
Stanley River to Somerset Stanley River at Woodford Stanley River at Peachester
Kilcoy Creek at Mt Kilcoy
Brisbane River to Wivenhoe Brisbane River at Linville Brisbane River at Gregors Creek
Brisbane River at Caboonbah
Brisbane River at Middle Creek
Lockyer Creek to O’Reilly’s Weir Lockyer Creek at Glenore Grove Lockyer Creek at Gatton
Lockyer Creek at Gatton Weir
Lockyer Creek Helidon
Laidley Creek at Warrego Hwy
Bremer River to Walloon Bremer River at Walloon Bremer River at Adams Bridge
Bremer River at Rosewood
Warrill Creek to Amberley Warrill Creek at Amberley Warrill Creek at Junction Weir
Purga Creek to Loamside Purga Creek at Loamside Purga Creek at Peak Crossing
Lower Brisbane River Brisbane River at Mt Crosby Weir
Brisbane River Centenary Bridge
Brisbane River at Savages Crossing
Brisbane River at Moggill
Brisbane River at Brisbane City
BRCFS Technical Summary Report - Hydrologic and Hydraulic Assessments 31
Hydrologic Assessment
B:\B20702 BRCFS Hydraulics\__ Admin\R.B20702.007.02.MR7.Technical Summary_FINAL.docx FINAL
Hydrologic model and flood frequency results were also compared to ensure as much as possible
consistency between the gauge ratings along the river. The resulting ratings are therefore
consistent with the current hydrologic modelling, but it is important to recognise that the only
independent point of truthing in the high flow ratings is the flow gauging undertaken at Centenary
Bridge, and that the uncertainty increases with distance from this site as storage attenuation and
other effects may not be properly represented in the current hydrologic models.
5.3 Types of Hydrologic Models
Hydrologic models are simplified, conceptual representations of a part of the hydrologic cycle that
are used to simulate the hydrological processes of interest. In flood modelling, the primary interest
is to simulate the process of rainfall running off a catchment and being transported (routed) as a
flood hydrograph down the creek or river. Two major types of hydrologic models can be
distinguished:
Process-Based Models. These models aim to represent the physical processes observed in the
real world. Typically, such models contain representations of surface runoff, subsurface flow,
evapotranspiration, and channel flow, but they can be far more complicated. These models can
be subdivided into single-event models (e.g. a single flood) and continuous simulation models
(e.g. long-term simulation for months/years).
Conceptual Models. These models are based on data and use mathematical and statistical
concepts to transform a certain input (for instance rainfall) to the model output (for instance
runoff). Commonly used techniques are regression, transfer functions, neural networks and
system identification. These models are known as conceptual hydrology models.
Process models and conceptual models can be used for either deterministic simulation or
stochastic simulation. Deterministic simulation is conducted using a fixed set of inputs to obtain a
single output value, (e.g. a hydrograph at a location of interest). Stochastic analysis is performed
using multiple simulations with inputs sampled from probability distributions of the input parameters
which produces multiple outputs.
5.3.1 Runoff-routing Models
For flood hydrology assessment runoff-routing conceptual models are typically used. They are
deterministic single event hydrologic models that represent the storage effects of a catchment by a
series of linked conceptual storages. An input representing rainfall excess is routed through the
model to provide an output that represents the resulting surface runoff hydrograph. These types of
models are used to estimate flood flow hydrographs at nominated locations within the catchment
based upon rainfall inputs.
The hydrologic model application adopted for this assessment is the URBS hydrological model
(Carroll, 2012a). URBS is a semi-distributed runoff-routing networked model of sub-catchments
based on centroidal inflows. URBS can be run in a mode which describes catchment and channel
storage routing behaviour separately.
This arrangement allows the model to represent non-uniform rainfall across the catchment such as
is necessary for historical event calibration. The node-link concept of a semi-distributed model also
BRCFS Technical Summary Report - Hydrologic and Hydraulic Assessments 32
Hydrologic Assessment
B:\B20702 BRCFS Hydraulics\__ Admin\R.B20702.007.02.MR7.Technical Summary_FINAL.docx FINAL
means that it is possible to obtain output flow hydrographs at multiple locations in the catchment
which is valuable for historical event calibration and for obtaining design flood simulation results at
multiple locations.
Design flood estimates were derived using the URBS hydrological model of the Brisbane River
catchment as developed by Seqwater (2013b). This model was modified during the course of the
BRCFS to better suit the objectives of the study.
Seqwater divided the Brisbane River catchment into seven distinct sub-catchment models based
on review of topography, drainage patterns, and major dam locations. Seqwater also considered
the key locations of interest for operation of the flood mitigation dams in the catchment and the best
use of available data including water level gauges. These seven catchments were further divided
into sub-areas to provide adequate delineation of the storage and channel routing characteristics of
each catchment.
Refer to Figure 5-2 for the sub-catchment layout adopted.
5.3.2 Simplified Dam Operations Model
Somerset and Wivenhoe Dams are multi-purpose storages that provide urban water supplies
(including drinking water) to South East Queensland, as well as flood mitigation benefits to areas
below Wivenhoe Dam. The dams are equipped with gates (either on the spillway as at Wivenhoe
Dam, or as sluices through the dam as at Somerset Dam), which allow the release of flood water to
be varied in accordance with prescribed operational procedures.
In addition to the main gated spillway at Wivenhoe Dam there is an auxiliary spillway that was
constructed in 2005 as part of an upgrade to improve flood adequacy of this storage. The auxiliary
spillway consists of a three bay fuse plug spillway located on the right abutment. The various fuse
plug embankments are triggered at different lake levels during rare to extreme flood events. The
main spillway gates are intended to be fully opened prior to the initiation of the fuse plug
embankments.
A Dam Operations Module was developed as part of the study to represent the effect that
Wivenhoe and Somerset Dams have on flood flows that pass through the system under a ‘with-
dam’ condition.
The Dam Operations Module is a reservoir simulation model based upon the Loss of
Communications (LOC) emergency flood operation procedure described in the Flood Manual. This
procedure is outlined in the Manual of Operation Procedures for Flood Mitigation at Wivenhoe Dam
and Somerset Dam Revision 11 (Seqwater, 2013a). The Dam Operations Module is incorporated
into the Delft-FEWS Model Framework (Werner et al., 2013) by using the Real Time Control (RTC)
Tools software. Delft-FEWS is a component-based modelling framework that incorporates a wide
range of general data handling utilities and open interfaces to many hydrological and hydraulic
models that are commonly used around the world, including the URBS hydrological model and
RTC tools for reservoir modelling.
Under a LOC operating procedure the decision making process is only dependent on lake levels
with no regard to downstream flows. Appropriate radial gate openings at Wivenhoe Dam are
determined by following the radial gate operating sequence as set out in the Flood Manual.
BRCFS Technical Summary Report - Hydrologic and Hydraulic Assessments 33
Hydrologic Assessment
B:\B20702 BRCFS Hydraulics\__ Admin\R.B20702.007.02.MR7.Technical Summary_FINAL.docx FINAL
The BRCFS flood hydrology simulation of the decision making process at Somerset Dam (which
flows into Wivenhoe Dam) takes into consideration the behaviour in Lake Wivenhoe. This is
achieved using a process documented in the Revision 11 Flood Manual whereby an ’interaction
diagram’ is used to compare lake levels in Somerset and Wivenhoe Dams at a given time. The
diagram is used to decide if more floodwater should be stored in Somerset Dam or if the floodwater
should be released into Wivenhoe Dam. This approach aims to balance flood storage between the
dams, however the crest gates are not operated at Somerset Dam so achieving a balance is not
always possible in some floods. The use of the LOC procedure, on average, results in slightly
‘conservative’ estimates of peak downstream flow in the Mid Brisbane River and Lower Brisbane
River when compared with the operations procedure that are used when the operations are
directed from the Flood Operation Centre documented in the Flood Manual. The downstream peak
flows are in the order of 5 to 10% higher on average using the LOC procedure. This means the
derived AEP peak flows for the ‘with-dams condition’ scenario will likely be conservative.
The other dams included in the URBS hydrologic model, namely Moogerah, Lake Manchester,
Perseverance and Cressbrook Creek Dams, have fixed crest spillways and are not subject to
manual operations. As such, they are not included in the simplified dam operations model.
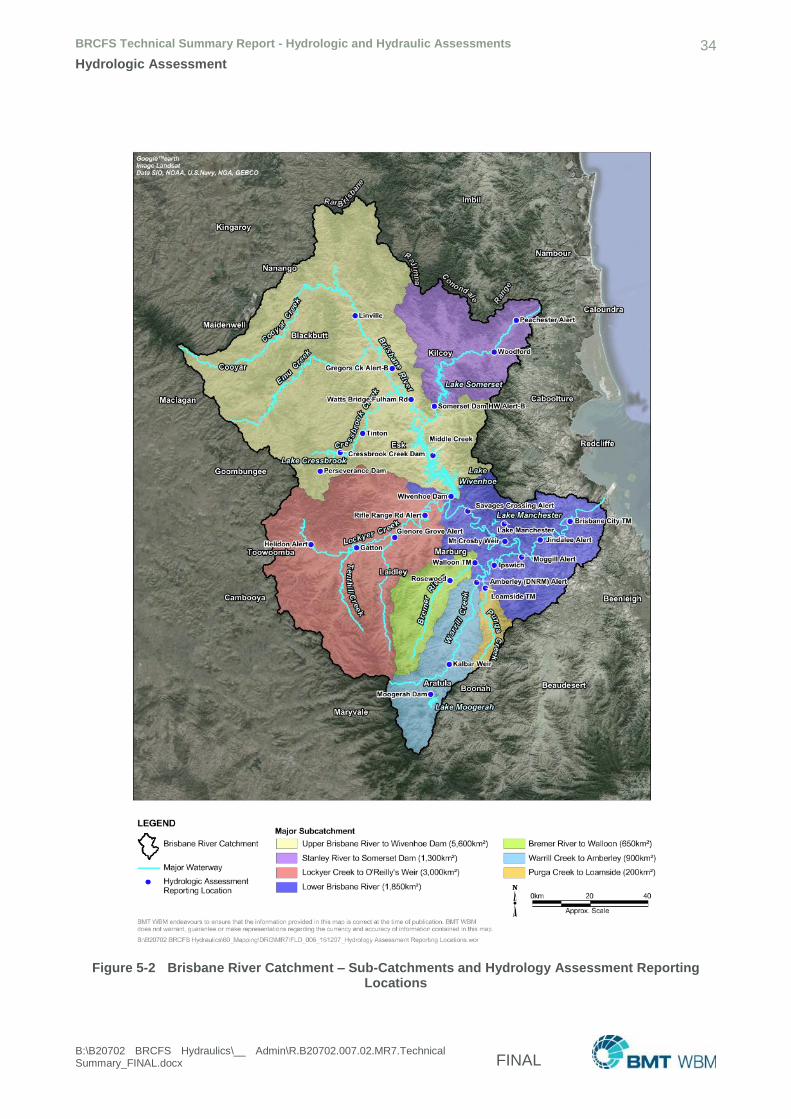
BRCFS Technical Summary Report - Hydrologic and Hydraulic Assessments 34
Hydrologic Assessment
B:\B20702 BRCFS Hydraulics\__ Admin\R.B20702.007.02.MR7.Technical Summary_FINAL.docx FINAL
Figure 5-2 Brisbane River Catchment – Sub-Catchments and Hydrology Assessment Reporting Locations

BRCFS Technical Summary Report - Hydrologic and Hydraulic Assessments 35
Hydrologic Assessment
B:\B20702 BRCFS Hydraulics\__ Admin\R.B20702.007.02.MR7.Technical Summary_FINAL.docx FINAL
5.4 Calibration to Historical Events
As mentioned in Section 5.3.1, hydrologic modelling for the BRCFS was undertaken using an
URBS model initially developed by Seqwater (2013b). Review of this model was required as the
purposes of the BRCFS investigation are different from those for which the model was developed.
In particular, it was necessary for the URBS model to be able to appropriately model a broader
range of event magnitudes, from small to extreme events.
A review of the rating curves generated by Seqwater, DNRM, BoM and other sources was also
undertaken as part of the BRCFS (see Section 5.2).
As a result of these reviews, modification and subsequent re-calibration of the URBS model was
undertaken. The calibration process resulted in a single set of model parameters that achieve a
reasonable calibration across a wide range of flood event types and magnitudes as summarised in
the following sections.
5.4.1 Available Historical Events
Calibration of the URBS models is conducted by performing runoff routing of recorded historical
rainfall events and adjusting the rainfall loss and flood routing parameters to best represent
observed river flow characteristics recorded during those events. As part of the original calibration
process conducted by Seqwater (2013b), the models were calibrated using recorded rainfall and
stream gauge data from 38 historical flood events that occurred between 1955 and 2013, with
verification to a further 10 events between 1893 and 1947. The recalibration for the BRCFS
focussed on the five recent events of January 1974, May 1996, February 1999, January 2011 and
January 2013, whilst verification was undertaken to the 43 remaining events used by Seqwater.
5.4.2 Re-calibration Approach and Outcome
Following a detailed review, the URBS models were updated with revised stream gauge ratings,
and a number of changes to the model schematisation made to ensure that it best represented flow
characteristics in particular areas of interest. The most significant changes to the models were:
Modification of the routing of the lower Lockyer Creek floodplain downstream of Glenore Grove
to include the main channel and three separate bypass locations. In this area the main channel
is perched (the river banks are higher than the surrounding floodplain) and breakout flows travel
across the floodplain by a different route and at a different speed to the main channel. This
behaviour was estimated by observing the timing of flood peaks between Glenore Grove and
Savages Crossing.
Adjustment of the routing parameters for the main Brisbane River channel downstream of
Wivenhoe by applying a reach length scaling factor to reduce the routing time to match
observed travel times between the main stream gauges (Wivenhoe, Savages Crossing, Mt
Crosby Weir, Moggill, Centenary Bridge and Brisbane City). Additional storage was provided at
key locations using storage-discharge relationships directly related to physical properties of the
river and floodplain and determined by combining level-volume relationships taken from the
DTM with level-flow relationships estimated from the main gauge rating.
BRCFS Technical Summary Report - Hydrologic and Hydraulic Assessments 36
Hydrologic Assessment
B:\B20702 BRCFS Hydraulics\__ Admin\R.B20702.007.02.MR7.Technical Summary_FINAL.docx FINAL
The adopted calibration process was relatively similar to the methodology developed by Seqwater.
Availability and reliability of stream gauge data was reviewed to identify primary and secondary
calibration points, with the primary (more reliable) locations used to guide selection of calibration
parameters and the secondary (less reliable) locations used for review and confirmation. The
primary and secondary calibration points were generally aligned with those from the rating curve
review process.
Model parameters for each of the seven sub-catchment models were adjusted to obtain a best fit of
the recorded data at the primary calibration sites. Typically this involved using the URBS routing
parameters (alpha and beta) to adjust the timing and shape of the hydrograph and rainfall losses
(initial and continuing) to match the observed flood peak. The calibration performance at other
gauges was reviewed to confirm that an acceptable match was achieved. This procedure was
conducted independently for each of the five main calibration events. Due to the differing nature of
the events, the optimisation procedure tended to produce slightly different parameters for each
event.
Performance of the calibration was assessed using ranking and weighting criteria developed by
Seqwater (2013b) that considered quantitative measures of the flood hydrograph calibration as well
as a qualitative assessment of the quality of data and magnitude of the flood event. Five
performance criteria were assessed, including the ratio of peak flows, the ratio of cumulative flow
volume and the Nash-Sutcliffe value (a measurement of the match of the hydrograph shape and
timing), as well as an overall assessment of the magnitude of the flood event and the availability
and reliability of the calibration data. These criteria were then used to weight the parameters for
each event calibration to derive a single set of parameters for each model.
Once a single reconciled set of parameters was obtained, the model performance was verified
using the recommended parameters for all 48 available historical events, including the five selected
calibration events, the remaining 33 post 1955 events and 10 pre-1955 events that include the
1893 record flood in the Brisbane River.
The outcome of the recalibration process is a set of calibrated hydrologic models based on the
compilation of numerous events at multiple locations.
The recalibration process has generally seen either an improved or equivalent quality of calibration
for all catchments when compared to the previous Seqwater calibration. The changes can
generally be attributed to revision of the stream gauge rating curves and changes to the
schematisation of the models.
Comparison of modelled and estimated (rated) peak flow rates and volumes at each gauge site
indicates a good correlation between the modelled and estimated values, with no obvious flowrate
related bias.
BRCFS Technical Summary Report - Hydrologic and Hydraulic Assessments 37
Hydrologic Assessment
B:\B20702 BRCFS Hydraulics\__ Admin\R.B20702.007.02.MR7.Technical Summary_FINAL.docx FINAL
5.5 Hydrologic Assessment Methodologies
5.5.1 Approaches Investigated
The Hydrologic Assessment investigated multiple alternative methods for estimating design floods
throughout the Brisbane River catchment. The techniques considered include:
Flood Frequency Analysis (FFA)
Design Event Approach (DEA)
Monte Carlo Simulation (MCS) method.
FFA methods derive statistics of peak flows and flow volumes directly from observed flow records,
whereas the DEA and MCS methods both rely on rainfall statistics in combination with a hydrologic
model to compute peak flows and flow volumes at locations of interest.
The DEA is a well-established, traditional rainfall-based method documented in Australian Rainfall
and Runoff (Engineers Australia, 1987) that relies on a number of simplifications including the
application of uniform temporal variations of rainfall over the catchment and the assumption that
the resultant flood peak annual exceedance probability (AEP) is the same as the input rainfall AEP
(i.e. assumes that the transformation of design rainfall to a peak flood flow is AEP neutral).
The MCS method removes many of the assumptions and limitations common to DEA
methodologies through the use of correlations between contributing variables. Applying the MCS
method involves statistically generating or running thousands of flood events.
There are however considerable challenges associated with capturing the influence of the main
flood forcing factors in a realistic manner for this catchment, given the spatial and temporal aspects
of the rainfall and the location of the main mitigation dams in relation to the downstream tributaries
and urban centres, which are the focus of the dam flood mitigation operations. The interaction of
the various factors results in a large range of possible design flood estimates due to the variability
of key inputs.
The three methods were applied to estimate design flood flows throughout the 13,500km2
catchment of the Brisbane River for two different scenarios: ‘no-dams’ and ‘with-dams’ conditions.
5.5.2 Scenarios (No-Dams, With-Dams)
Two dam scenarios have been investigated by the Hydrologic Assessment; referred to as ‘with-
dams condition’ and ‘no-dams condition’. These catchment conditions reflect the catchment
response with/without the influence of existing major dams and their reservoirs represented in their
2013 configuration respectively. The dams referred to are the major water storages that exist within
the catchment (Perseverance, Cressbrook Creek, Lake Manchester, Somerset, Wivenhoe and
Moogerah Dams). The scenarios do not consider any of the other minor dams within the catchment
as the smaller dams have minimal influence on riverine flooding at the required flood assessment
locations. The dams included are summarised in Table 5-2.

BRCFS Technical Summary Report - Hydrologic and Hydraulic Assessments 38
Hydrologic Assessment
B:\B20702 BRCFS Hydraulics\__ Admin\R.B20702.007.02.MR7.Technical Summary_FINAL.docx FINAL
Table 5-2 With-Dam Condition Reservoirs
Reservoir Year Completed
Water Supply Capacity at FSL
(ML)
Flood Mitigation Capacity (ML)
Surface Area (ha)
Lake Manchester 1916 25,690 0 281
Somerset Dam 1953 379,000 524,000 4,350
Moogerah Dam 1961 83,700 0 827
Perseverence Dam 1965 30,140 0 220
Cressbrook Creek Dam 1983 81,840 0 517
Wivenhoe Dam 1985 1,165,000 1,970,000 10,800
Total 1,755,370 2,494,000 16,995
Moogerah, Lake Manchester, Perseverance and Cressbrook Dams are modelled in the URBS
hydrological model as level pool storages with fixed crest spillway relationships. The storage
representation and associated relationships are consistent with the description contained in the
Brisbane River Flood Models, Seqwater (2013). No alterations have been made to the URBS
model with respect to these four dams.
Somerset Dam and Wivenhoe Dam were represented by use of the RTC Tool in the MCS
Framework because of the interaction of the dam operations during flood events (see
Section 5.2.2).
The ‘no-dams condition’ models have been modified to remove all representation of the dams,
including storage details and reduced reach length factors for drowned reaches. The catchment
data has also been adjusted to remove the effect of impervious areas associated with the
reservoirs. The design flood modelling for the ‘no-dams condition’ is not considered a pre-
development scenario; as it represents the current catchment conditions simply with the major
dams removed.
5.5.3 Design Event Approach (DEA)
The DEA is a rainfall based design peak flow and hydrograph estimation methodology. The
methodology was recommended in Australian Rainfall and Runoff (ARR) (Engineers Australia,
1987) and is used widely by practitioners. The DEA uses one probabilistic input, that is the rainfall
depth, for a given Annual Exceedance Probability (AEP) and duration.
Rainfall data is based on IFD relationships discussed in Section 4.1.
Rainfall depths are modified by subtracting losses to allow for storage and infiltration. A standard
initial and constant continuing loss model was adopted. Typical losses were selected for the
design events based on experience and comparison with other methods including FFA and MCS.
Although design event losses are not directly relatable to specific historical events the magnitude of
losses observed for the calibration events were used as an indicative guide to suitable losses for
each catchment.
BRCFS Technical Summary Report - Hydrologic and Hydraulic Assessments 39
Hydrologic Assessment
B:\B20702 BRCFS Hydraulics\__ Admin\R.B20702.007.02.MR7.Technical Summary_FINAL.docx FINAL
In accordance with the ARR methodology a single temporal pattern has been applied across the
entire catchment for each event and for each duration. Temporal patterns for events up to and
including the 1 in 100 AEP were based on standard 1987 ARR temporal patterns, with the Brisbane
River catchment situated within Zone 3. The PMP temporal pattern was determined using
methodologies described in the GTSMR or GSDM Guidebook (BoM, 2003a). Temporal patterns for
the intermediate range of flood magnitudes were interpolated using normalised curves of the
cumulative temporal patterns. This approach was adopted to avoid anomalies between flood
magnitudes within the transition.
In estimating peak design flows for a specified location and AEP, design rainfalls for a number of
durations are routed through a rainfall runoff-routing model. The duration that yields the largest
peak flow rate is deemed the critical duration and its associated peak flow rate and hydrograph are
used for subsequent hydrologic and hydraulic analyses. The main shortcomings of this
methodology are that:
It is assumed that the design peak flow for a specified AEP is associated with a design critical
duration rainfall event of the same AEP with fixed hydrologic inputs.
The temporal pattern and point rainfall AEP are assumed to be uniform over the entire
catchment which does not reflect the temporal and spatial variability inherent in real storm
events, particularly for large or complex catchments.
The hydrologic inputs are fixed and assumed to be probability neutral.
5.5.4 Flood Frequency Analysis (FFA)
FFA of the Brisbane River catchment stream gauges involves compilation and statistical analysis of
historical flow data. This flow data has been collected from multiple sources, including stream
gauge and URBS hydrologic modelling, and reliability of the data can vary significantly. Stream
gauges record water level and the resulting flow estimates are dependent on the both the accuracy
of the level measurement and the reliability of the flow rating curve, which may vary as site
conditions change.
The URBS model provides a method of estimating flow data for selected historical flood events
based on rainfall records. The flow estimates are therefore dependent on the accuracy of the
rainfall data, which varies across the catchment, and the calibration of the model. Nevertheless,
the results can provide useful information, particularly if the model can be calibrated against other
gauges. Additionally, the hydrologic record at a number of the sites has been affected by
construction of dams, and this effect must be removed to provide a homogenous sample
representing ‘no-dam conditions’.
The assessment methodology was developed to use current best practice techniques and taking
advantage of automated Bayesian fitting techniques implemented in the FLIKE flood frequency
analysis software developed by the University of Newcastle. The initial stage of the methodology
required the collection and review of available flow data from all sources. Reliable FFA requires
three criteria to be satisfied:

BRCFS Technical Summary Report - Hydrologic and Hydraulic Assessments 40
Hydrologic Assessment
B:\B20702 BRCFS Hydraulics\__ Admin\R.B20702.007.02.MR7.Technical Summary_FINAL.docx FINAL
The gauge site must have a reasonable period of uninterrupted record, as the amount of
confidence in the statistical analysis increases with the length of the sample period.
The record must be homogeneous. It must consistently identify all floods (above a certain
magnitude) within the period of record, and if parts of the record are influenced by dams or other
changes in catchment properties then this influence must be removed.
The flow estimates themselves must be reliable through the use of a reliable rating curve or
other flow estimation method.
Ten gauge locations throughout the catchment were considered to have a good combination of
characteristics suitable for a reliable FFA.
For sites where the stream flow data has been influenced by upstream dams, ‘no-dams conditions’
peak flow estimates were obtained by calibrating the hydrologic models (with dams) to match the
recorded flood peaks, then removing the dams from the models and running with the same
parameters to estimate the flood conditions that would have occurred if the dams were not present.
The annual peak flow records were assessed to identify and filter outliers and errors from the
gauge records and/or extend or supplement the at-site data record using historical and/or
translated flood records where appropriate to make optimum use of the available data.
An initial FFA was conducted for each of the gauge sites considered to be most reliable. Analysis
was conducted using both the Log-Pearson III and GEV probability distributions, two of the most
common probability functions applied for FFA in Australia. Analysis at the Brisbane River
catchment sites identified that in most situations the Log-Pearson III distribution provided a better
overall representation of the data set, as well as being relatively consistent with the DEA and MCS
methodologies.
Regional analysis techniques that draw upon better gauge records from nearby and/or
hydrologically similar sites can help improve results derived at a location where the historically
monitored information is inadequate for FFA, or may result in improvements in terms of consistency
(between the locations), robustness and reliability. Due to the unavailability of other methods (e.g.
the new ARR Project 5 Regional Analysis Tool) at the time the BRCFS was conducted, an
alternate approach loosely based on the Index Flood Method was adopted for the BRCFS analysis
as follows.
An unbiased FFA of a range of primary gauges considered to have reliable record length and
flow estimates was undertaken.
The frequency distribution parameters (skew and standard deviation) were analysed to
determine if consistent catchment-wide values or trends could be identified.
These catchment values were then returned back into the site analyses as Gaussian prior
distribution parameters used with the Bayesian inference method adopted by the FLIKE flood
frequency analysis software.
BRCFS Technical Summary Report - Hydrologic and Hydraulic Assessments 41
Hydrologic Assessment
B:\B20702 BRCFS Hydraulics\__ Admin\R.B20702.007.02.MR7.Technical Summary_FINAL.docx FINAL
5.5.5 Monte Carlo Simulation (MCS)
MCS is a method for calculating probabilities in the field of numerical computing. In the MCS
approach for the Brisbane River catchment, a large number of potential events is simulated with
the combination of a hydrologic model and a reservoir simulation model. Exceedance probabilities
of peak discharges and flow volumes at key river locations are derived from the model simulation
results. The method has the advantage over FFA and DEA approaches in that it explicitly considers
the natural variability of all relevant physical processes that contribute to flood events. A practical
disadvantage is that it is generally more complex to implement and that it requires longer
simulation times.
The main challenge in the MCS approach is to generate realistic and representative potential flood
events. This means the potential events should correctly account for probabilities of occurrence of
factors contributing to flood flows such as rainfall (depth, duration, spatial and temporal patterns),
antecedent moisture conditions, initial reservoir volumes and ocean water levels. Furthermore, the
likelihood of combined occurrences (correlations) of these factors needs to be taken into account.
The generated events then need to be simulated within a model capable of representing the
relevant physical processes in the catchment during flood events.
The computation scheme shown in Figure 5-3 provides a broad outline of the MCS framework,
which consists of the following three components:
(1) Pre-processing: a combination of advanced statistical techniques to generate a large set of
realistic and representative synthetic flood events. These events are characterised by
rainfall, initial losses, initial reservoir volumes and ocean water levels.
(2) Processing: simulation of the synthetic events with a combination of a hydrologic model
(URBS) and a reservoir simulation model (RTC tools) to obtain peak discharges and flow
volumes at each location of interest.
(3) Post-processing: statistical techniques to combine the results of (1) and (2) to derive design
peak flows, flow volumes and hydrographs for a range of AEPs across the entire Brisbane
River system.
The computational procedure in Figure 5-3 is carried out separately for each river location/gauge of
interest. The scheme is applied for a Total Probability Theorem (TPT) based sampling method
(Rahman et al, 2002), but other sampling schemes can be implemented as well.
As part of component (1), stochastically generated estimates of variations in rainfall in both space
and time were used. This data was provided for use in the BRCFS by Seqwater with the associated
methodology described in SKM (2013). A world-leading multiplicative-random cascade approach or
STEPS (Short Term Ensemble Prediction System) was applied that utilised radar data on 9 events
resulting in 600 space-time patterns. A further 60 space-time patterns were derived specifically for
the BRCFS using an additional event in January 2013 (Jacobs, 2014). These data were used in the
MCS to provide more realistic representations of spatial and temporal variability of storm rainfall
throughout the entire Brisbane River catchment.
The stochastic space-time rainfall patterns are used in the MCS framework for rainfall events with
an AEP of less than 1 in 2,000. These stochastically generated space-time patterns were used in
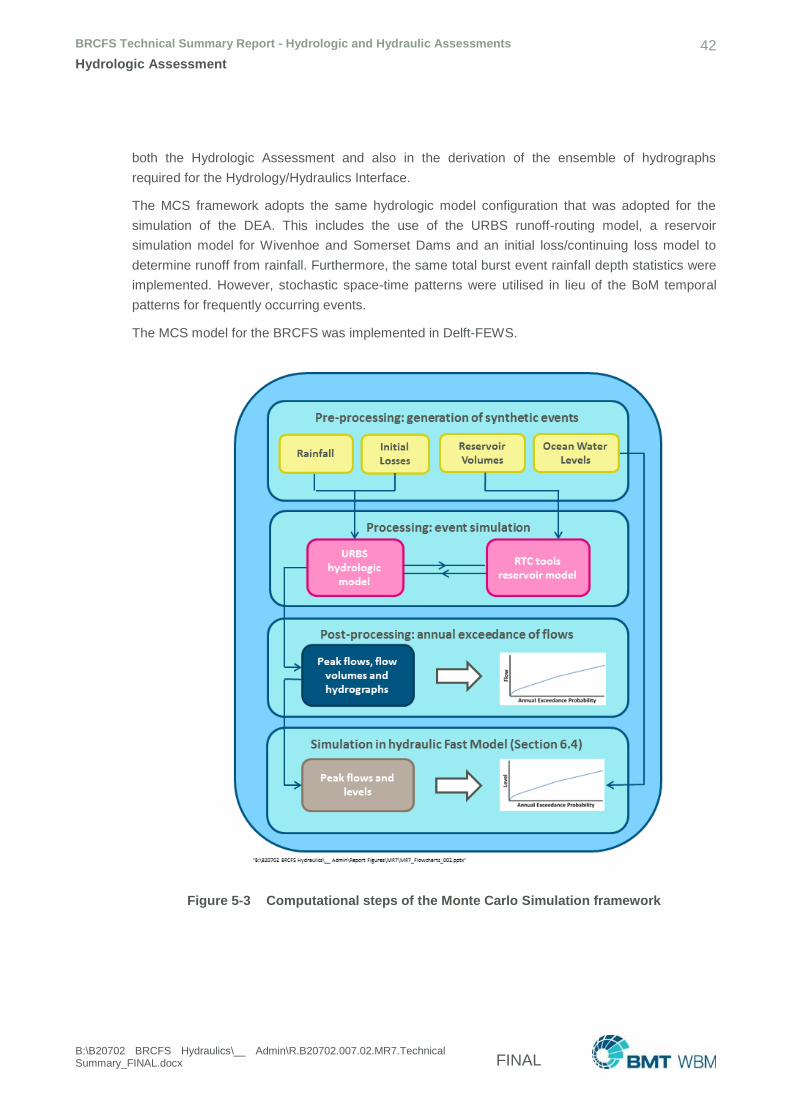
BRCFS Technical Summary Report - Hydrologic and Hydraulic Assessments 42
Hydrologic Assessment
B:\B20702 BRCFS Hydraulics\__ Admin\R.B20702.007.02.MR7.Technical Summary_FINAL.docx FINAL
both the Hydrologic Assessment and also in the derivation of the ensemble of hydrographs
required for the Hydrology/Hydraulics Interface.
The MCS framework adopts the same hydrologic model configuration that was adopted for the
simulation of the DEA. This includes the use of the URBS runoff-routing model, a reservoir
simulation model for Wivenhoe and Somerset Dams and an initial loss/continuing loss model to
determine runoff from rainfall. Furthermore, the same total burst event rainfall depth statistics were
implemented. However, stochastic space-time patterns were utilised in lieu of the BoM temporal
patterns for frequently occurring events.
The MCS model for the BRCFS was implemented in Delft-FEWS.
Figure 5-3 Computational steps of the Monte Carlo Simulation framework
BRCFS Technical Summary Report - Hydrologic and Hydraulic Assessments 43
Hydrologic Assessment
B:\B20702 BRCFS Hydraulics\__ Admin\R.B20702.007.02.MR7.Technical Summary_FINAL.docx FINAL
5.6 Design Peak Flow Assessments – With and No Dams
5.6.1 Reconciliation Process
A reconciliation process was undertaken in order to assimilate the design flood estimates from the
various methods that were applied (FFA, DEA and MCS). The main objective of this process is to
determine, for each location of interest and each annual exceedance probability, which of the three
methods is expected to provide the most reliable design flow estimate.
Significant effort was spent on obtaining mutual consistency in results for the three methods and on
the validation of the methods using data records. Furthermore, estimated design flows were
verified extensively for mutual consistency between results of different locations.
When reconciling the available design flood estimates it is important to recognise the strengths and
limitations of each method. For example, provided sufficient records exist, FFA is often considered
most reliable for frequent flood events, but extrapolation to large and rare events can be strongly
influenced by the presence (or lack of) extreme events in the data record.
For the ‘no-dams’ condition, the reconciled design flows for the majority of the locations are based
on a combination of:
Empirical estimates from rated flows for frequent events or high values of AEP
FFA results for frequent to large events or intermediate values of AEP
MCS results for large to extreme events or low values of AEP.
To reconcile between the estimates obtained from the three independent techniques, ranges or
bounds of AEP were adopted to distinguish which techniques were most appropriate. For
example, FFA estimates were considered most reliable for ‘high’ (i.e. 1 in 2 to 1 in 10 AEP ranges),
whereas the DEA and MCS approaches were considered more appropriate for the ‘intermediate’
and ‘low’ ranges. The choice of bounds between the ‘high’, ‘intermediate’ and ‘low’ range of AEPs
differed per location.
For locations for which limited or no (reliable) data on peak discharges were available and, hence,
no FFA results, the reconciled design flows for the high and intermediate range of AEP values were
based on data and FFA results of nearby stations.
The choice of bounds between the ‘high’, ‘intermediate’ and ‘low’ range of AEPs differed per
location. Refer to Figure 5-4 for an example of the comparison of estimates for the three
approaches and the reconciled estimates for the location at Savages Crossing for the no-dams
condition.
The top plot shows results for peaks, the bottom plot shows results for volumes. In this example,
the bound between ‘high’ and ‘intermediate’ was 1 in 5 AEP and the bound between ‘intermediate
and ‘low’ was 1 in 50 AEP. So, for AEPs > 1 in 5 AEP the empirical estimates were selected; for
AEPs< 1 in 50 the MCS estimates were selected and for AEPs between 1 in 5 and 1 in 50 the FFA
estimates were selected.
FFA of stream gauge records for the ‘with-dams’ condition is considered to be of limited benefit,
particularly for the locations on the Brisbane River downstream of Wivenhoe as:
BRCFS Technical Summary Report - Hydrologic and Hydraulic Assessments 44
Hydrologic Assessment
B:\B20702 BRCFS Hydraulics\__ Admin\R.B20702.007.02.MR7.Technical Summary_FINAL.docx FINAL
Consistent post-dam data record length is limited (approximately 30 years)
The data will not fit a known statistical distribution
Data is influenced by dam operations and is therefore not fully homogeneous.
Because of these issues, traditional FFA methods, including calculation of a probability distribution
and the subsequent fitting of confidence limits cannot be conducted.
For the ‘with-dams’ condition, the reconciled design flows for these locations are therefore based
on a combination of:
Empirical estimates from rated flows for (very) frequent events or high values of AEP
MCS results for frequent events to extreme events or intermediate to low values of AEP.
Figure 5-5 provides an example of the comparison of estimates for the two approaches for the
location at Savages Crossing for the ‘with-dams’ condition. The top plot shows results for peaks,
the bottom plot shows results for volumes.
The reconciled ‘with-dams’ estimates were successfully validated for spatial consistency by
comparing plots of peak flow versus catchment area and (peak flow/catchment area) versus
catchment area.
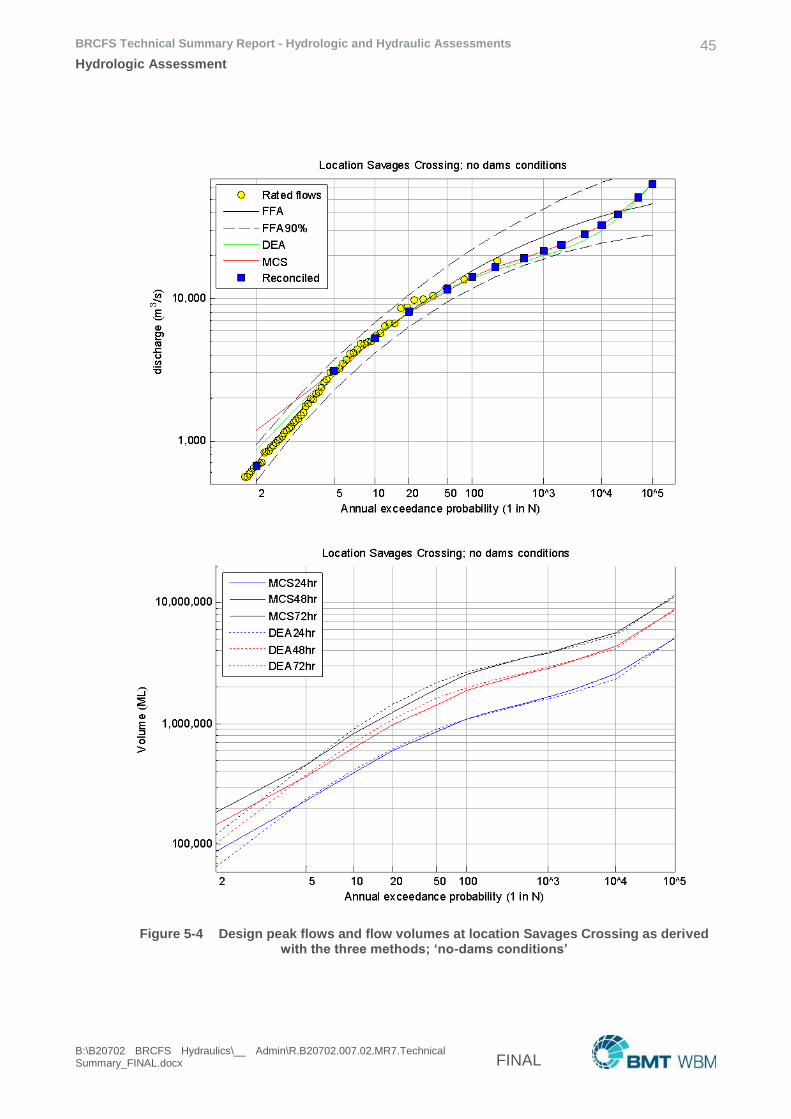
BRCFS Technical Summary Report - Hydrologic and Hydraulic Assessments 45
Hydrologic Assessment
B:\B20702 BRCFS Hydraulics\__ Admin\R.B20702.007.02.MR7.Technical Summary_FINAL.docx FINAL
Figure 5-4 Design peak flows and flow volumes at location Savages Crossing as derived with the three methods; ‘no-dams conditions’
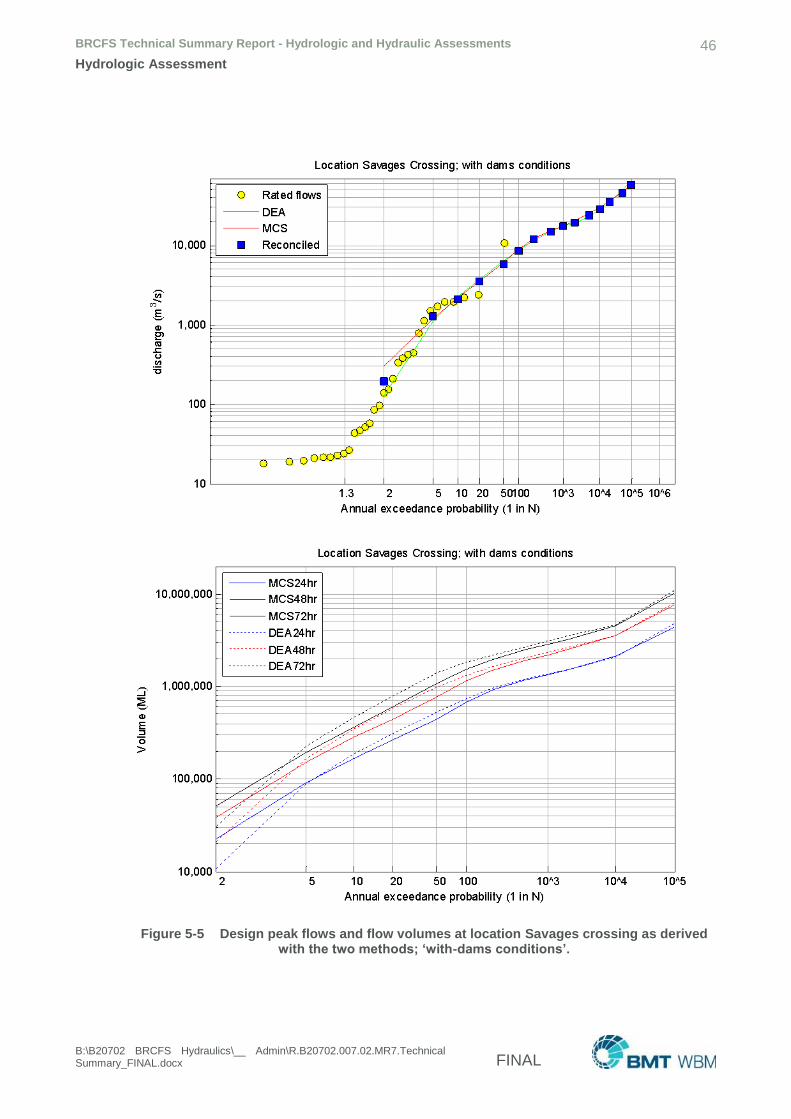
BRCFS Technical Summary Report - Hydrologic and Hydraulic Assessments 46
Hydrologic Assessment
B:\B20702 BRCFS Hydraulics\__ Admin\R.B20702.007.02.MR7.Technical Summary_FINAL.docx FINAL
Figure 5-5 Design peak flows and flow volumes at location Savages crossing as derived with the two methods; ‘with-dams conditions’.
BRCFS Technical Summary Report - Hydrologic and Hydraulic Assessments 47
Hydrologic Assessment
B:\B20702 BRCFS Hydraulics\__ Admin\R.B20702.007.02.MR7.Technical Summary_FINAL.docx FINAL
5.6.2 Peak Flow Estimates
The reconciled and recommended estimates for the nominated locations within the Brisbane River
Catchment for the design peak flow estimates are summarised in Table 5-3 and Table 5-4 for the
‘no-dams’ conditions and ‘with-dams’ conditions respectively.
It is observed that the existence of the dams result in the following reduction in 1 in 100 AEP peak
flows:
Nearly 50% at Somerset Dam and Wivenhoe Dam
Between 29% and 41% at locations along the Brisbane River downstream of Wivenhoe Dam
8% in the peak Bremer River flow at Ipswich, due to the influence of Moogerah Dam.
Typically the operation of Somerset and Wivenhoe Dam in accordance with the Flood Manual
results in a reduction in peak flow of around 30% downstream of Wivenhoe Dam. However, it is
important to note that the reduction in peak flow is not uniform in every flood and is highly
dependent on the rainfall patterns upstream and downstream of the dams. In some floods the
reduction in the peak flow will be significantly less than 30% and other floods could be significantly
more. The mitigation of peak flow extends over the full flood frequency range, although it
diminishes for larger events. It should be recognised that for releases from Wivenhoe Dam that are
in excess of 28,000 m3/s (the maximum capacity of the main and auxiliary spillways), it is assumed
that Wivenhoe Dam will not fail even though the dam will be overtopped by these larger events.
This is a non-conservative assumption and so the estimates in excess of this value downstream of
Wivenhoe Dam should be treated with caution.
The estimates for Ipswich are based only upon flows emanating from the Bremer River catchment,
and therefore do not necessarily reflect the effects of the Brisbane River. Reference should be
made to the Hydraulic Assessment for updated estimates due to the complex interaction of
hydraulic effects at this location.
5.6.3 Critical Storm Durations
In the MCS approach, several burst durations have been considered. For a given location and
AEP, the duration that results in the highest design flow is referred to as the ‘critical duration’.
Frequency curves for all locations were derived for eight storm durations, ranging from 3 hours to
168 hours depending on the catchment area.
For ‘no-dams’ conditions, the following was observed:
Burst durations of 3 hours and 6 hours are never critical, except in some cases for PMP
conditions.
For AEPs of 1 in 2 and 1 in 5, longer durations are generally more critical. This is due to the fact
that short duration / high AEP events have a relatively low rainfall depth. A large proportion of
the rainfall does not reach the river system for these events due to rainfall losses.
For catchments < 1,000 km2, critical durations are in the range of 12-24 hours.
For catchments between 1,000 km2 and 5,000 km2, critical durations are in the range of 18-48
hours.
BRCFS Technical Summary Report - Hydrologic and Hydraulic Assessments 48
Hydrologic Assessment
B:\B20702 BRCFS Hydraulics\__ Admin\R.B20702.007.02.MR7.Technical Summary_FINAL.docx FINAL
For catchments between 5,000 km2 and 10,000 km2, critical durations are in the range of 36-72
hours.
For catchments >10,000 km2, critical durations are in the range of 48-96 hours.
For ‘with-dams’ conditions, the following was observed:
Critical durations are generally higher than critical durations for ‘no dams’ conditions
Burst durations of 120 hours are in a substantial number of cases critical.
The last observation raises the question if durations above 120 hours should have been considered
in the MCS simulation runs. Therefore, a sensitivity analysis was carried out in which results were
compared of two TPT runs: a run in which burst durations up to 120 hours were considered and a
run in which burst durations up to 168 hours were considered. The comparison shows that the
influence of the larger durations on the frequency curves is negligible. The applied upper limit in the
current study for considered burst durations of 120 hours is therefore considered acceptable.
5.6.4 Flood Volume Estimates
Flow volumes for different durations can be derived directly from the hydrographs that are
produced with the MCS and DEA approaches for both conditions. Subsequently, frequency curves
can be derived in the same manner as frequency curves are derived for peak discharges.
Mutual differences between design flow volumes of the various methods for the ‘no-dams condition’
are consistent with the mutual differences observed for design peak flows.
Similarly, DEA and MCS flow volumes for the ‘with-dams condition’ are generally in good
agreement.
5.6.5 Limitations
It needs to be recognised that a significant degree of uncertainty remains with the derived design
flood flows, particularly for the range of rare to extreme events. For example the extreme peak flow
estimates below Wivenhoe Dam in excess of 28,000 m3/s (the current available release capacity of
the dam) rely on the fact that the existing embankment will not fail. The hydrologic models have
also only been calibrated to events that have peak flows of 16,000 m3/s in the Lower Brisbane
River.
More frequently occurring flood peak flows (such as the 1 in 2 AEP flood) should also be treated
with some caution due to the variability of these estimates as evidenced by the wide scatter of
MCS results. These results are very sensitive to the adopted contributing factors and should be
regarded as indicative estimates. However, some greater reliance can be placed on estimates for
locations where there is consistency between the three independent methods.
It was not possible to reconcile the design flood estimates for some locations such as the Bremer,
Warrill and Purga Creek catchments. This is because of the inconsistency between FFA and the
rainfall based approaches due to a possible underestimation of the underlying design rainfall
Intensity-Frequency-Duration (IFD) data.
BRCFS Technical Summary Report - Hydrologic and Hydraulic Assessments 49
Hydrologic Assessment
B:\B20702 BRCFS Hydraulics\__ Admin\R.B20702.007.02.MR7.Technical Summary_FINAL.docx FINAL
Less confidence can also be placed in the Lockyer Creek catchment estimates due to higher
uncertainty in the high stage rating of these sites which occurs when flow exceeds the main
channel capacity when it spills into the extensive floodplain.
Overall, the estimates derived from the MCS exhibit wide variability, which is a reflection of the
variation in contributing factors such as rainfall depth, rainfall spatial distribution, rainfall temporal
distribution, and antecedent catchment conditions, which includes catchment wetness (rainfall loss
rates) and initial reservoir levels.
5.7 Hydrologic and Hydraulic Modelling Interfacing
The simulated flows generated within the MCS framework were used as input for hydraulic
modelling. In order to do so, the MCS framework had to be adapted so as to generate flow
hydrographs at around 100 locations for input to the hydraulic modelling. These flows were agreed
in consultation with the TWG and IPEs from both the Hydrologic and Hydraulic Assessments to be
based on the MCS settings for the Brisbane City output location.
The URBS hydrologic model used by the MCS was adapted to provide flow hydrographs for the
inflow boundaries being used for the hydraulic modelling. Quality control checks were carried out to
verify that the changes did not affect the MCS hydrologic calculations.
A total of 11,340 MC flood events were generated using the MCS framework (Aurecon, 2015b) to
provide input to the hydraulic modelling. Each hydrologic simulation was carried out with the
combination of the URBS runoff-routing model and a reservoir model for simulating the operation of
Wivenhoe and Somerset dams. The 11,340 events is 9 x 60 x 21 being the combination of:
9 rainfall burst durations: 12, 18, 24, 36, 48, 72, 96, 120 and 168 hours.
60 different classes of area-average rainfall depth, corresponding to 60 pre-defined AEP values
ranging from 0.8 to the AEP of the probable maximum flood (PMF).
21 simulations per combination of burst duration and rainfall depth, each with different
statistically generated combinations of different starting reservoir volumes, rainfall initial losses,
ocean water levels and spatio-temporal rainfall patterns.
The 9 burst durations were selected with the aim to cover the whole range of durations that are
considered relevant for the focus area of the hydraulics phase. Values of rainfall depth where
derived from rainfall statistics which, for each burst duration, describe a one-to-one relation
between AEP and rainfall depth.
For each simulated event, the output of the combined hydrologic and reservoir modelling consists
of hourly discharge time series (240 hours, or ten days, in total) at each boundary location of the
river network resulting in delivery of around 1.1 million hydrographs. Meta-data was also provided
for each flood event that included: event ID; burst duration; area-average rainfall depth and
associated AEP; initial losses and continuing losses per sub-catchment; initial reservoir volumes for
the six modelled reservoirs; and derived peak flows and flow volumes at key locations.
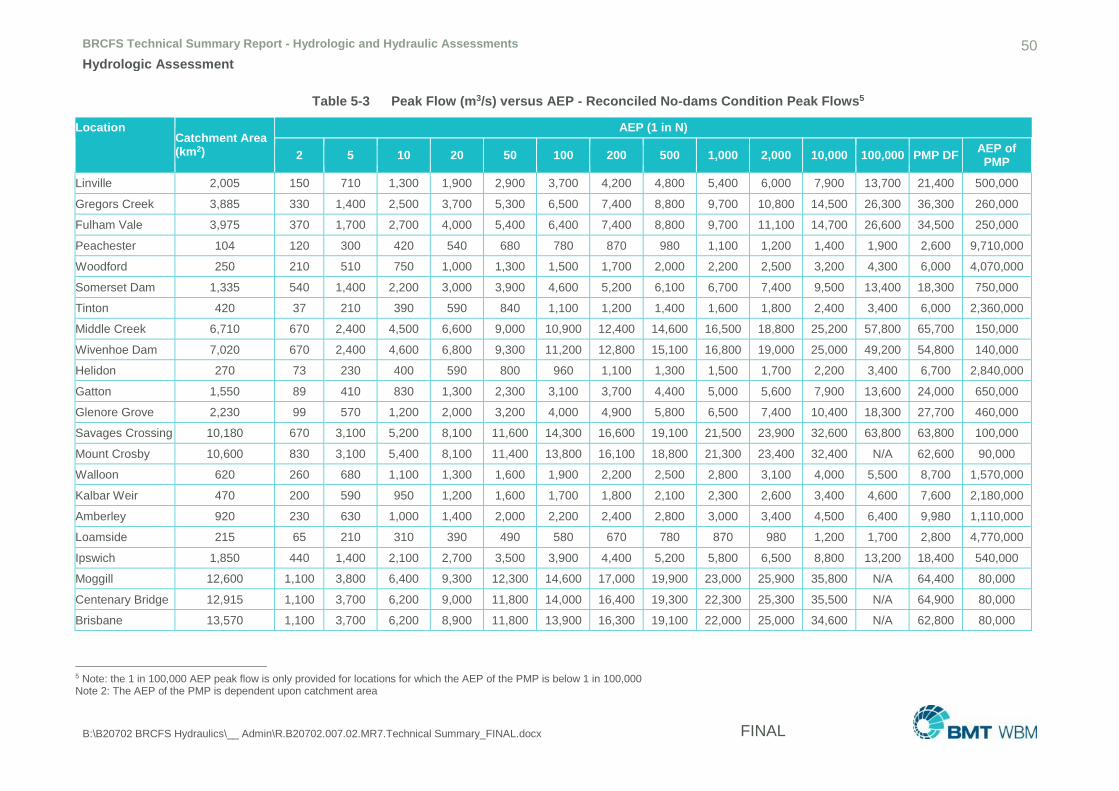
BRCFS Technical Summary Report - Hydrologic and Hydraulic Assessments 50
Hydrologic Assessment
B:\B20702 BRCFS Hydraulics\__ Admin\R.B20702.007.02.MR7.Technical Summary_FINAL.docx FINAL
Table 5-3 Peak Flow (m3/s) versus AEP - Reconciled No-dams Condition Peak Flows5
Location Catchment Area (km2)
AEP (1 in N)
2 5 10 20 50 100 200 500 1,000 2,000 10,000 100,000 PMP DF AEP of PMP
Linville 2,005 150 710 1,300 1,900 2,900 3,700 4,200 4,800 5,400 6,000 7,900 13,700 21,400 500,000
Gregors Creek 3,885 330 1,400 2,500 3,700 5,300 6,500 7,400 8,800 9,700 10,800 14,500 26,300 36,300 260,000
Fulham Vale 3,975 370 1,700 2,700 4,000 5,400 6,400 7,400 8,800 9,700 11,100 14,700 26,600 34,500 250,000
Peachester 104 120 300 420 540 680 780 870 980 1,100 1,200 1,400 1,900 2,600 9,710,000
Woodford 250 210 510 750 1,000 1,300 1,500 1,700 2,000 2,200 2,500 3,200 4,300 6,000 4,070,000
Somerset Dam 1,335 540 1,400 2,200 3,000 3,900 4,600 5,200 6,100 6,700 7,400 9,500 13,400 18,300 750,000
Tinton 420 37 210 390 590 840 1,100 1,200 1,400 1,600 1,800 2,400 3,400 6,000 2,360,000
Middle Creek 6,710 670 2,400 4,500 6,600 9,000 10,900 12,400 14,600 16,500 18,800 25,200 57,800 65,700 150,000
Wivenhoe Dam 7,020 670 2,400 4,600 6,800 9,300 11,200 12,800 15,100 16,800 19,000 25,000 49,200 54,800 140,000
Helidon 270 73 230 400 590 800 960 1,100 1,300 1,500 1,700 2,200 3,400 6,700 2,840,000
Gatton 1,550 89 410 830 1,300 2,300 3,100 3,700 4,400 5,000 5,600 7,900 13,600 24,000 650,000
Glenore Grove 2,230 99 570 1,200 2,000 3,200 4,000 4,900 5,800 6,500 7,400 10,400 18,300 27,700 460,000
Savages Crossing 10,180 670 3,100 5,200 8,100 11,600 14,300 16,600 19,100 21,500 23,900 32,600 63,800 63,800 100,000
Mount Crosby 10,600 830 3,100 5,400 8,100 11,400 13,800 16,100 18,800 21,300 23,400 32,400 N/A 62,600 90,000
Walloon 620 260 680 1,100 1,300 1,600 1,900 2,200 2,500 2,800 3,100 4,000 5,500 8,700 1,570,000
Kalbar Weir 470 200 590 950 1,200 1,600 1,700 1,800 2,100 2,300 2,600 3,400 4,600 7,600 2,180,000
Amberley 920 230 630 1,000 1,400 2,000 2,200 2,400 2,800 3,000 3,400 4,500 6,400 9,980 1,110,000
Loamside 215 65 210 310 390 490 580 670 780 870 980 1,200 1,700 2,800 4,770,000
Ipswich 1,850 440 1,400 2,100 2,700 3,500 3,900 4,400 5,200 5,800 6,500 8,800 13,200 18,400 540,000
Moggill 12,600 1,100 3,800 6,400 9,300 12,300 14,600 17,000 19,900 23,000 25,900 35,800 N/A 64,400 80,000
Centenary Bridge 12,915 1,100 3,700 6,200 9,000 11,800 14,000 16,400 19,300 22,300 25,300 35,500 N/A 64,900 80,000
Brisbane 13,570 1,100 3,700 6,200 8,900 11,800 13,900 16,300 19,100 22,000 25,000 34,600 N/A 62,800 80,000
5 Note: the 1 in 100,000 AEP peak flow is only provided for locations for which the AEP of the PMP is below 1 in 100,000 Note 2: The AEP of the PMP is dependent upon catchment area

BRCFS Technical Summary Report - Hydrologic and Hydraulic Assessments 51
Hydrologic Assessment
B:\B20702 BRCFS Hydraulics\__ Admin\R.B20702.007.02.MR7.Technical Summary_FINAL.docx FINAL
Table 5-4 Peak Flows (m3/s) versus AEP - Reconciled With-dams Condition Peak Flows6
Location
AEP (1 in N)
2 5 10 20 50 100 200 500 1,000 2,000 10,000 100,000 PMP DF AEP of PMP
Somerset Dam 0 800 1,300 1,800 2,200 2,500 3,000 3,300 3,600 4,000 5,400 10,700 20,900 750,000
Wivenhoe Dam 0 470 930 1,700 3,300 6,300 8,800 10,300 12,500 12,900 21,200 35,800 43,700 140,000
Savages Crossing 190 1,300 2,100 3,500 5,800 8,500 11,800 15,000 17,500 19,500 29,000 56,900 56,900 100,000
Mount Crosby 200 1,300 2,200 3,600 6,000 8,600 11,700 14,800 17,100 19,700 27,200 N/A 55,500 90,000
Ipswich 390 1,300 2,000 2,500 3,300 3,600 4,000 5,000 5,600 6,000 8,300 12,000 16,700 540,000
Moggill 630 2,100 3,300 4,800 7,300 10,200 12,400 15,700 18,000 20,400 29,300 N/A 57,600 80,000
Centenary Bridge 640 2,100 3,300 4,800 7,100 9,900 11,900 15,000 17,700 19,900 28,500 N/A 55,900 80,000
Brisbane 700 2,200 3,300 4,800 7,100 9,900 12,000 14,900 17,500 19,700 27,600 N/A 53,800 80,000
Note 1: Estimates shown in red are above 28,000m3/s which exceed the maximum release capacity of Wivenhoe Dam. These estimates should be treated with caution.
Note 2: The estimates shown in blue for Somerset Dam should also be regarded with caution as they represent the flows associated with the design floods specific to Wivenhoe Dam.
Note 3: The AEP adopted in the Hydraulics Assessment is a notional 1 in 100,000 AEP event based upon the application of the MC method to the levels. This should not be confused
with the AEP of the PMP which is based upon the catchment area versus AEP relationship defined in Book 8 of ARR
6 Note: the 1 in 100,000 AEP peak flows is only provided for locations for which the AEP of the PMP is below 1 in 100,000
BRCFS Technical Summary Report - Hydrologic and Hydraulic Assessments 52
Hydraulic Models and Selection of AEP Ensembles
B:\B20702 BRCFS Hydraulics\__ Admin\R.B20702.007.02.MR7.Technical Summary_FINAL.docx FINAL
6 Hydraulic Models and Selection of AEP Ensembles
The BRCFS Hydraulic Assessment developed and calibrated an integrated suite of hydraulic
models, which were used to select and simulate MC events to define flood behaviour, peak flood
level surfaces and other key outputs across the study area. This section summarises the approach
taken in producing the hydraulic models and selecting the AEP design floods.
6.1 Sources of Flooding
Flooding may be attributable to a number of sources and/or mechanisms including:
Overtopping the banks of rivers, creeks or other drainage channels.
Overland (exceedance) flow resulting from:
○ heavy rainfall exceeding the ability of the surface to infiltrate the water; or
○ the rate of surface water runoff exceeding the ability of an urban drainage network to capture
or convey the flow and which can be exacerbated by blockage.
Tidal/ Storm surge flooding caused by elevated ocean levels that propagates into low lying river
catchments.
Flooding from groundwater due to a raised water table following prolonged rainfall.
Failure of infrastructure such as dams or water mains.
Often, a flood event is a combination of two or more of these mechanisms. For example elevated
river levels may restrict the outfalls of piped drainage networks limiting the ability of those networks
to convey flow. If river levels continue to rise then river water can propagate back up piped
networks and surcharge out of connecting drains. This is sometimes managed through use of back
flow devices (flap gates) installed on pipe outlets that only permit flow in one direction.
The BRCFS is concerned with flooding from the main branches of the Brisbane River downstream
of Wivenhoe Dam, the lower sections of Bremer River including Warrill and Purga Creeks, and the
lower areas of Lockyer Creek. The floodplains are included to the extent that inundation caused by
elevated river levels extend fully into the low lying areas of Brisbane River tributaries. This is often
referred to as backwater flooding and includes the inundation of numerous smaller side tributaries.
A distinction is drawn between Brisbane River riverine flooding and localised flooding. Localised
flooding is caused by rainfall within a tributary’s catchment and is a different flooding mechanism to
riverine flooding. For example, a local creek may also be prone to flash flooding with little warning
time and rapidly rising flood levels, which would contrast with backwater riverine flooding that
slowly and steadily rises as the Brisbane River rises.
Localised flooding is not considered as part of the BRCFS and reference should be made to local
authorities for further guidance.
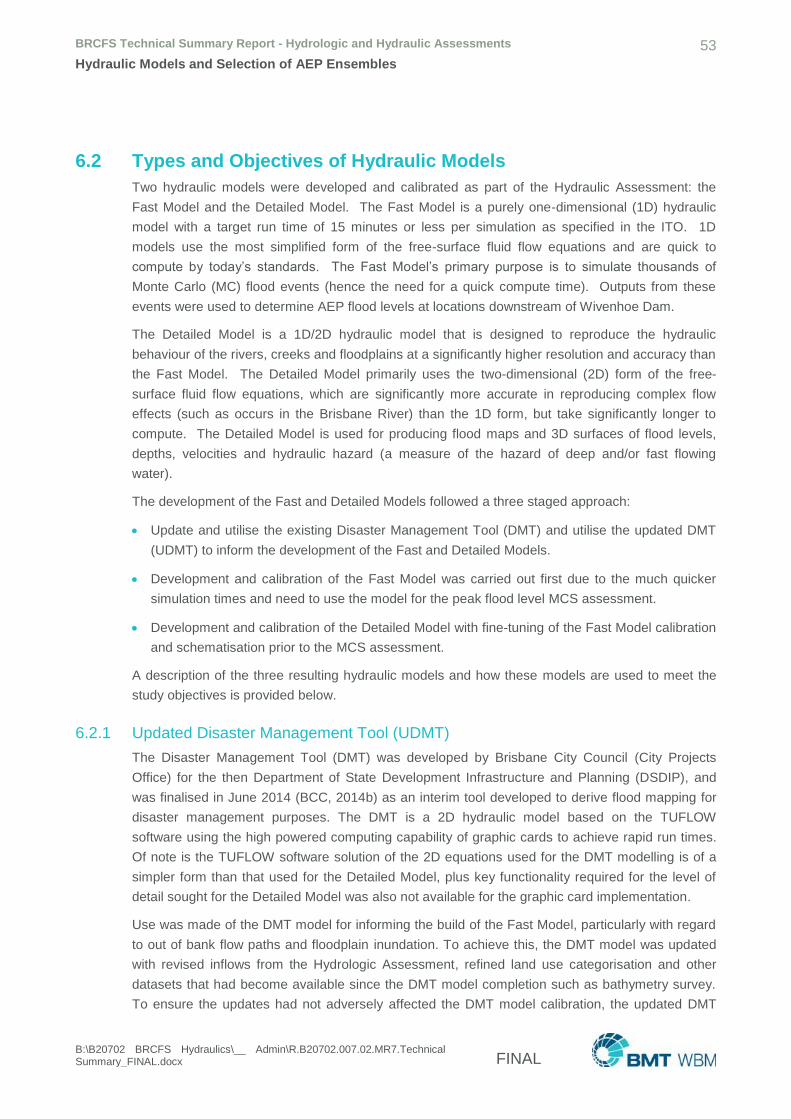
BRCFS Technical Summary Report - Hydrologic and Hydraulic Assessments 53
Hydraulic Models and Selection of AEP Ensembles
B:\B20702 BRCFS Hydraulics\__ Admin\R.B20702.007.02.MR7.Technical Summary_FINAL.docx FINAL
6.2 Types and Objectives of Hydraulic Models
Two hydraulic models were developed and calibrated as part of the Hydraulic Assessment: the
Fast Model and the Detailed Model. The Fast Model is a purely one-dimensional (1D) hydraulic
model with a target run time of 15 minutes or less per simulation as specified in the ITO. 1D
models use the most simplified form of the free-surface fluid flow equations and are quick to
compute by today’s standards. The Fast Model’s primary purpose is to simulate thousands of
Monte Carlo (MC) flood events (hence the need for a quick compute time). Outputs from these
events were used to determine AEP flood levels at locations downstream of Wivenhoe Dam.
The Detailed Model is a 1D/2D hydraulic model that is designed to reproduce the hydraulic
behaviour of the rivers, creeks and floodplains at a significantly higher resolution and accuracy than
the Fast Model. The Detailed Model primarily uses the two-dimensional (2D) form of the free-
surface fluid flow equations, which are significantly more accurate in reproducing complex flow
effects (such as occurs in the Brisbane River) than the 1D form, but take significantly longer to
compute. The Detailed Model is used for producing flood maps and 3D surfaces of flood levels,
depths, velocities and hydraulic hazard (a measure of the hazard of deep and/or fast flowing
water).
The development of the Fast and Detailed Models followed a three staged approach:
Update and utilise the existing Disaster Management Tool (DMT) and utilise the updated DMT
(UDMT) to inform the development of the Fast and Detailed Models.
Development and calibration of the Fast Model was carried out first due to the much quicker
simulation times and need to use the model for the peak flood level MCS assessment.
Development and calibration of the Detailed Model with fine-tuning of the Fast Model calibration
and schematisation prior to the MCS assessment.
A description of the three resulting hydraulic models and how these models are used to meet the
study objectives is provided below.
6.2.1 Updated Disaster Management Tool (UDMT)
The Disaster Management Tool (DMT) was developed by Brisbane City Council (City Projects
Office) for the then Department of State Development Infrastructure and Planning (DSDIP), and
was finalised in June 2014 (BCC, 2014b) as an interim tool developed to derive flood mapping for
disaster management purposes. The DMT is a 2D hydraulic model based on the TUFLOW
software using the high powered computing capability of graphic cards to achieve rapid run times.
Of note is the TUFLOW software solution of the 2D equations used for the DMT modelling is of a
simpler form than that used for the Detailed Model, plus key functionality required for the level of
detail sought for the Detailed Model was also not available for the graphic card implementation.
Use was made of the DMT model for informing the build of the Fast Model, particularly with regard
to out of bank flow paths and floodplain inundation. To achieve this, the DMT model was updated
with revised inflows from the Hydrologic Assessment, refined land use categorisation and other
datasets that had become available since the DMT model completion such as bathymetry survey.
To ensure the updates had not adversely affected the DMT model calibration, the updated DMT
BRCFS Technical Summary Report - Hydrologic and Hydraulic Assessments 54
Hydraulic Models and Selection of AEP Ensembles
B:\B20702 BRCFS Hydraulics\__ Admin\R.B20702.007.02.MR7.Technical Summary_FINAL.docx FINAL
(UDMT) was simulated for the 1974, 2011 and 2013 events, with the results remaining comparable
to the original model.
A key use of the UDMT was to simulate hypothetical extreme flood events by scaling the 1974
event inflows by up to a factor of eight. This allowed for the identification of extreme flow breakouts
and overland flow paths to be identified, which helped inform the Fast Model development.
6.2.2 Fast Model
The Fast Model is a purely 1D hydraulic model with a target run time of 15 minutes or less per
simulation as specified in the Hydraulic Assessment ITO. Its primary purpose, as stipulated by the
ITO, is to simulate 500 MC events as provided by the Hydrologic Assessment, however, this was
extended to 11,340 events to produce a more reliable Annual Exceedance Probability (AEP) flood
level frequency analysis.
The Fast Model is based on the TUFLOW software using the well-established hydraulic modelling
approach of using a network of 1D channels’ and storage nodes that was commonplace prior to 2D
flood modelling. The channels hydraulic conveyance properties are based on cross-sections, which
are extracted from digital elevation models, principally the DMT DEM and bathymetry datasets (see
Section 4).
The nodes represent the storage of the system. Each node has a surface area versus height table
defining the volume of water that a node can hold. For nodes connecting the in-bank river and
creek channels, the storage is derived by multiplying the cross-section widths by half the in-bank
channel lengths at varying heights. For nodes on the floodplain the storage is extracted from the
DMT DEM.
Main river structures such as bridges and floodplain structures such as underpasses or large
culverts through embankments are represented in the model.
The schematisation of the channels and nodes, particularly in the floodplains is informed by the
UDMT model. Figure 6-1 provides an example of the model schematisation in the lower floodplain
of Lockyer Creek with the hydraulic hazard mapping from the UDMT shown in the background.
The Fast Model included over 2,300 channels with a run time of around 4 minutes for an 8 day
flood on a standard single CPU core.
6.2.3 Detailed Model
The Detailed Model is a 1D/2D hydraulic model based on the TUFLOW software that is designed to
reproduce the hydraulic behaviour of the rivers, creeks and floodplains at a significantly higher
resolution and accuracy than the Fast Model. The objectives of the Detailed Model are to:
Accurately reproduce the flood behaviour of the Brisbane River, Lockyer Creek and Bremer
River at a sufficiently high resolution to produce mapping of flood levels, depths, velocities and
hazard for regional planning purposes.
Use the model into the future to quantify the impacts or changes in flood levels, depths and
velocities and hazard due to:
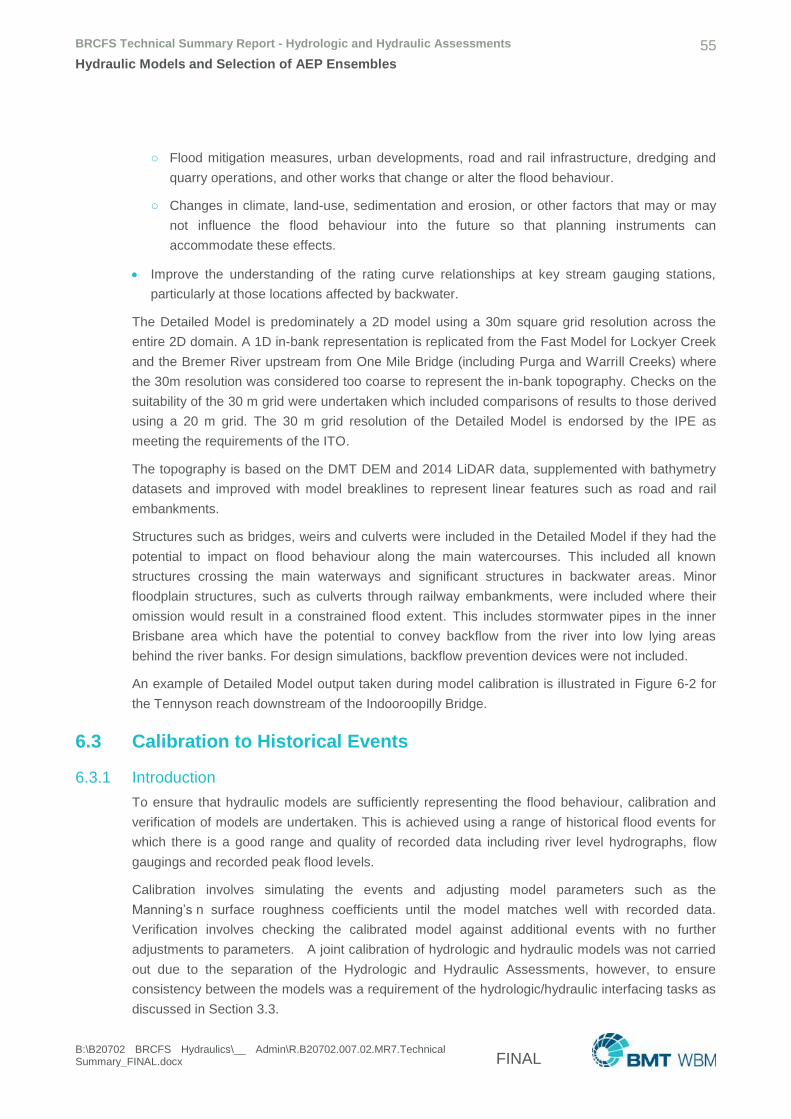
BRCFS Technical Summary Report - Hydrologic and Hydraulic Assessments 55
Hydraulic Models and Selection of AEP Ensembles
B:\B20702 BRCFS Hydraulics\__ Admin\R.B20702.007.02.MR7.Technical Summary_FINAL.docx FINAL
○ Flood mitigation measures, urban developments, road and rail infrastructure, dredging and
quarry operations, and other works that change or alter the flood behaviour.
○ Changes in climate, land-use, sedimentation and erosion, or other factors that may or may
not influence the flood behaviour into the future so that planning instruments can
accommodate these effects.
Improve the understanding of the rating curve relationships at key stream gauging stations,
particularly at those locations affected by backwater.
The Detailed Model is predominately a 2D model using a 30m square grid resolution across the
entire 2D domain. A 1D in-bank representation is replicated from the Fast Model for Lockyer Creek
and the Bremer River upstream from One Mile Bridge (including Purga and Warrill Creeks) where
the 30m resolution was considered too coarse to represent the in-bank topography. Checks on the
suitability of the 30 m grid were undertaken which included comparisons of results to those derived
using a 20 m grid. The 30 m grid resolution of the Detailed Model is endorsed by the IPE as
meeting the requirements of the ITO.
The topography is based on the DMT DEM and 2014 LiDAR data, supplemented with bathymetry
datasets and improved with model breaklines to represent linear features such as road and rail
embankments.
Structures such as bridges, weirs and culverts were included in the Detailed Model if they had the
potential to impact on flood behaviour along the main watercourses. This included all known
structures crossing the main waterways and significant structures in backwater areas. Minor
floodplain structures, such as culverts through railway embankments, were included where their
omission would result in a constrained flood extent. This includes stormwater pipes in the inner
Brisbane area which have the potential to convey backflow from the river into low lying areas
behind the river banks. For design simulations, backflow prevention devices were not included.
An example of Detailed Model output taken during model calibration is illustrated in Figure 6-2 for
the Tennyson reach downstream of the Indooroopilly Bridge.
6.3 Calibration to Historical Events
6.3.1 Introduction
To ensure that hydraulic models are sufficiently representing the flood behaviour, calibration and
verification of models are undertaken. This is achieved using a range of historical flood events for
which there is a good range and quality of recorded data including river level hydrographs, flow
gaugings and recorded peak flood levels.
Calibration involves simulating the events and adjusting model parameters such as the
Manning’s n surface roughness coefficients until the model matches well with recorded data.
Verification involves checking the calibrated model against additional events with no further
adjustments to parameters. A joint calibration of hydrologic and hydraulic models was not carried
out due to the separation of the Hydrologic and Hydraulic Assessments, however, to ensure
consistency between the models was a requirement of the hydrologic/hydraulic interfacing tasks as
discussed in Section 3.3.
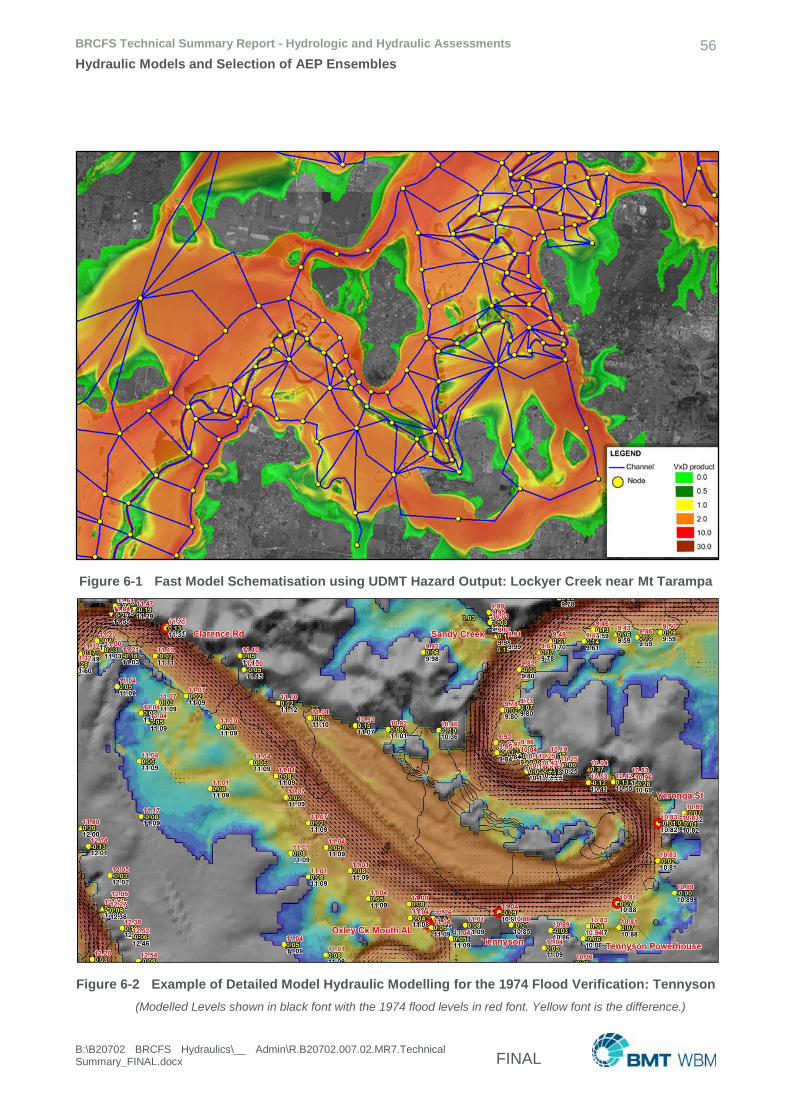
BRCFS Technical Summary Report - Hydrologic and Hydraulic Assessments 56
Hydraulic Models and Selection of AEP Ensembles
B:\B20702 BRCFS Hydraulics\__ Admin\R.B20702.007.02.MR7.Technical Summary_FINAL.docx FINAL
Figure 6-1 Fast Model Schematisation using UDMT Hazard Output: Lockyer Creek near Mt Tarampa
Figure 6-2 Example of Detailed Model Hydraulic Modelling for the 1974 Flood Verification: Tennyson
(Modelled Levels shown in black font with the 1974 flood levels in red font. Yellow font is the difference.)
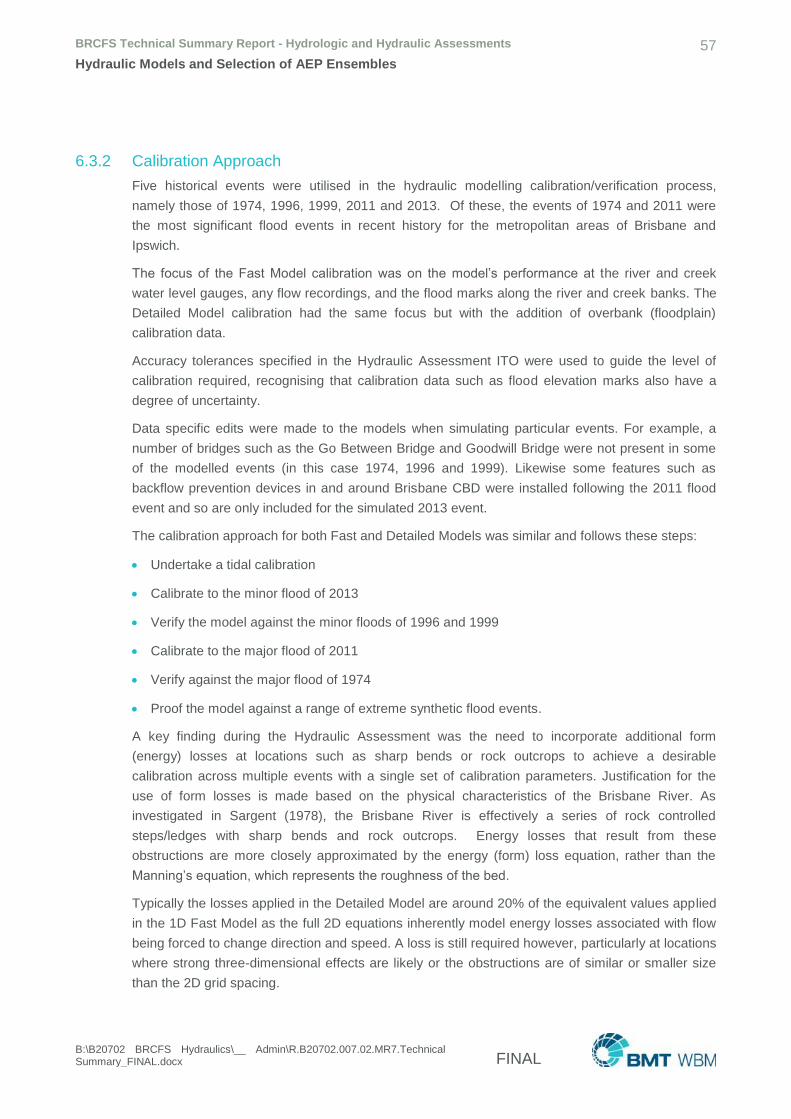
BRCFS Technical Summary Report - Hydrologic and Hydraulic Assessments 57
Hydraulic Models and Selection of AEP Ensembles
B:\B20702 BRCFS Hydraulics\__ Admin\R.B20702.007.02.MR7.Technical Summary_FINAL.docx FINAL
6.3.2 Calibration Approach
Five historical events were utilised in the hydraulic modelling calibration/verification process,
namely those of 1974, 1996, 1999, 2011 and 2013. Of these, the events of 1974 and 2011 were
the most significant flood events in recent history for the metropolitan areas of Brisbane and
Ipswich.
The focus of the Fast Model calibration was on the model’s performance at the river and creek
water level gauges, any flow recordings, and the flood marks along the river and creek banks. The
Detailed Model calibration had the same focus but with the addition of overbank (floodplain)
calibration data.
Accuracy tolerances specified in the Hydraulic Assessment ITO were used to guide the level of
calibration required, recognising that calibration data such as flood elevation marks also have a
degree of uncertainty.
Data specific edits were made to the models when simulating particular events. For example, a
number of bridges such as the Go Between Bridge and Goodwill Bridge were not present in some
of the modelled events (in this case 1974, 1996 and 1999). Likewise some features such as
backflow prevention devices in and around Brisbane CBD were installed following the 2011 flood
event and so are only included for the simulated 2013 event.
The calibration approach for both Fast and Detailed Models was similar and follows these steps:
Undertake a tidal calibration
Calibrate to the minor flood of 2013
Verify the model against the minor floods of 1996 and 1999
Calibrate to the major flood of 2011
Verify against the major flood of 1974
Proof the model against a range of extreme synthetic flood events.
A key finding during the Hydraulic Assessment was the need to incorporate additional form
(energy) losses at locations such as sharp bends or rock outcrops to achieve a desirable
calibration across multiple events with a single set of calibration parameters. Justification for the
use of form losses is made based on the physical characteristics of the Brisbane River. As
investigated in Sargent (1978), the Brisbane River is effectively a series of rock controlled
steps/ledges with sharp bends and rock outcrops. Energy losses that result from these
obstructions are more closely approximated by the energy (form) loss equation, rather than the
Manning’s equation, which represents the roughness of the bed.
Typically the losses applied in the Detailed Model are around 20% of the equivalent values applied
in the 1D Fast Model as the full 2D equations inherently model energy losses associated with flow
being forced to change direction and speed. A loss is still required however, particularly at locations
where strong three-dimensional effects are likely or the obstructions are of similar or smaller size
than the 2D grid spacing.

BRCFS Technical Summary Report - Hydrologic and Hydraulic Assessments 58
Hydraulic Models and Selection of AEP Ensembles
B:\B20702 BRCFS Hydraulics\__ Admin\R.B20702.007.02.MR7.Technical Summary_FINAL.docx FINAL
For each model the calibration resulted in a single set of parameter values (Manning’s n and form
loss) for that model. The calibration parameters were derived through thousands of simulations
testing different combinations of parameters, whilst remaining consistent with Brisbane River’s
physical characteristics. Importantly, the final parameters are in agreement with industry standard
values, and the same set of parameters produces a reproduction of all five historical events across
all flow regimes ranging from tidal flows to the major floods of 1974 and 2011.
6.3.3 Calibration Outputs
Calibration output is presented as a series of hydrograph plots, long sections, tables and mapping
of flood extents. The mapping includes comparison of recorded flood levels with modelled levels.
Example output is provided in Figure 6-3 to Figure 6-5 for the January 2011 event. Figure 6-6
shows examples of calibration point mapping to flood marks for both the 2011 and 1974 events.
Table 6-1 shows the comparison between the calibration/verification events to the recorded data
for Brisbane City, Ipswich, Lowood and Moggill.
The Fast and Detailed Model calibrations were endorsed by the IPE as suitable for the objectives
of the BRCFS.
Table 6-1 Fast and Detailed Model Calibration to Levels at Key Locations
Peak Water Level (mAHD)
Lowood Ipswich at David Trumpy Bridge
Moggill Brisbane City
Actual FM DM Actual FM DM Actual FM DM Actual FM DM
1974 n/a 46.0 45.9 20.7 21.5 20.9 19.9 20.5 20.1 5.5 5.6 5.6
1996 34.0 34.5 35.2 11.3 12.3 13.8 7.1 8.3 8.5 2.1 2.1 1.9
1999 33.6 33.1 33.6 6.6 6.6 7.8 n/a 4.8 4.9 1.4 1.5 1.5
2011 46.3 46.3 46.1 19.3 19.2 19.2 18.2 18.2 18.4 4.5 4.4 4.5
2013 35.3 34.3 34.6 13.9 13.1 14.1 8.0 8.3 8.1 2.3 2.4 2.3
6.3.4 Hydraulic Model Calibration Accuracy
For the calibration of the Detailed Model, given that the significant majority of levels, including flood
marks, fall within the desired ITO tolerances for the model calibration and verification events,
including tidal flows, and that these events represent a reasonably wide range in terms of flood
magnitudes and behaviour, the ITO tolerances are considered to be indicative of the confidence
limits of the accuracy of the hydraulic modelling for these calibration events. The tolerances are:
Brisbane River downstream of Oxley Creek ± 0.15 m
Brisbane River between Goodna and Oxley Creek ± 0.30 m
Ipswich urban area ± 0.30 m
Brisbane River and tributaries upstream of Goodna (for non-urban areas), including Bremer
River and Lockyer Creek ± 0.50 m.
The above target tolerances were achieved within different reaches across the whole modelled
area for all the calibration events. For events outside the range of the calibration events, these

BRCFS Technical Summary Report - Hydrologic and Hydraulic Assessments 59
Hydraulic Models and Selection of AEP Ensembles
B:\B20702 BRCFS Hydraulics\__ Admin\R.B20702.007.02.MR7.Technical Summary_FINAL.docx FINAL
tolerances, from a hydraulic modelling viewpoint, would increase due to lack of good quality
calibration data, but by how much is difficult to quantify. However, the more extreme the event, the
greater the uncertainties and therefore the appropriate tolerances. It should also be noted that for
these extreme events, there is greater uncertainty in the hydrologic derivation of the flows.
Figure 6-3 2011 Event at Brisbane City Gauge – Fast and Detailed Model vs Observed
Figure 6-4 2011 Detailed Model Calibration - Statistical Assessment of Differences between Observed & Modelled Peak Flood Levels
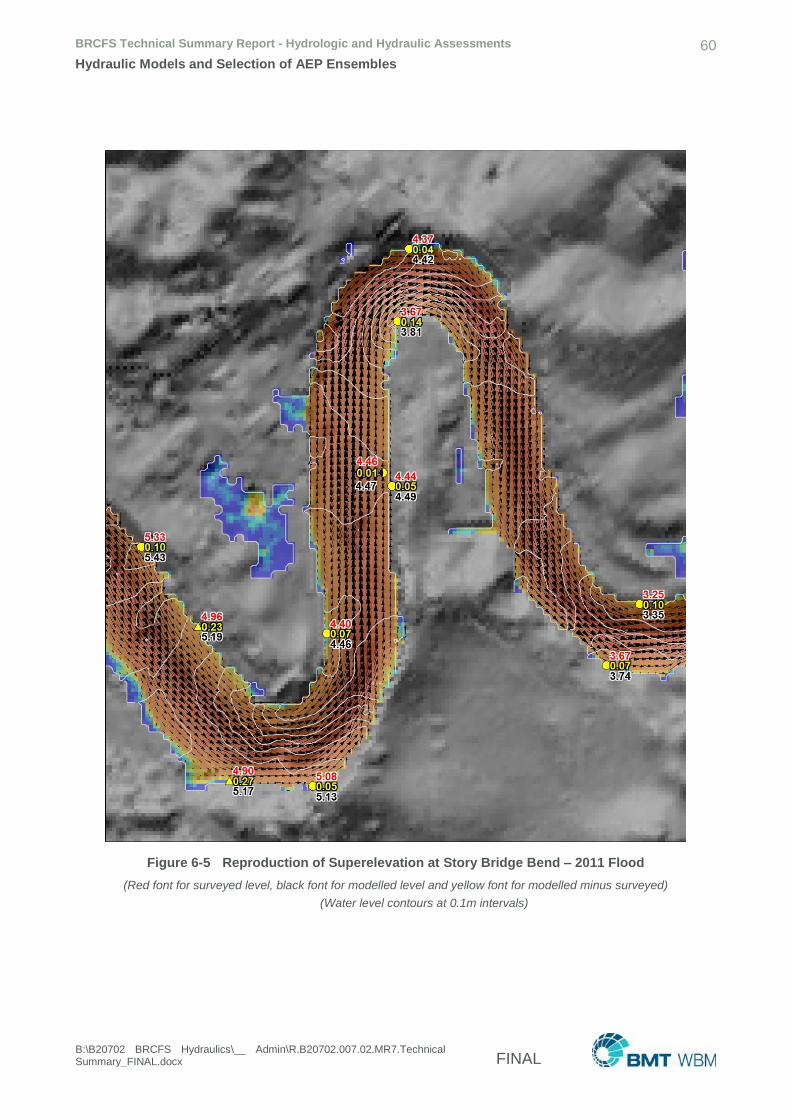
BRCFS Technical Summary Report - Hydrologic and Hydraulic Assessments 60
Hydraulic Models and Selection of AEP Ensembles
B:\B20702 BRCFS Hydraulics\__ Admin\R.B20702.007.02.MR7.Technical Summary_FINAL.docx FINAL
Figure 6-5 Reproduction of Superelevation at Story Bridge Bend – 2011 Flood
(Red font for surveyed level, black font for modelled level and yellow font for modelled minus surveyed)
(Water level contours at 0.1m intervals)
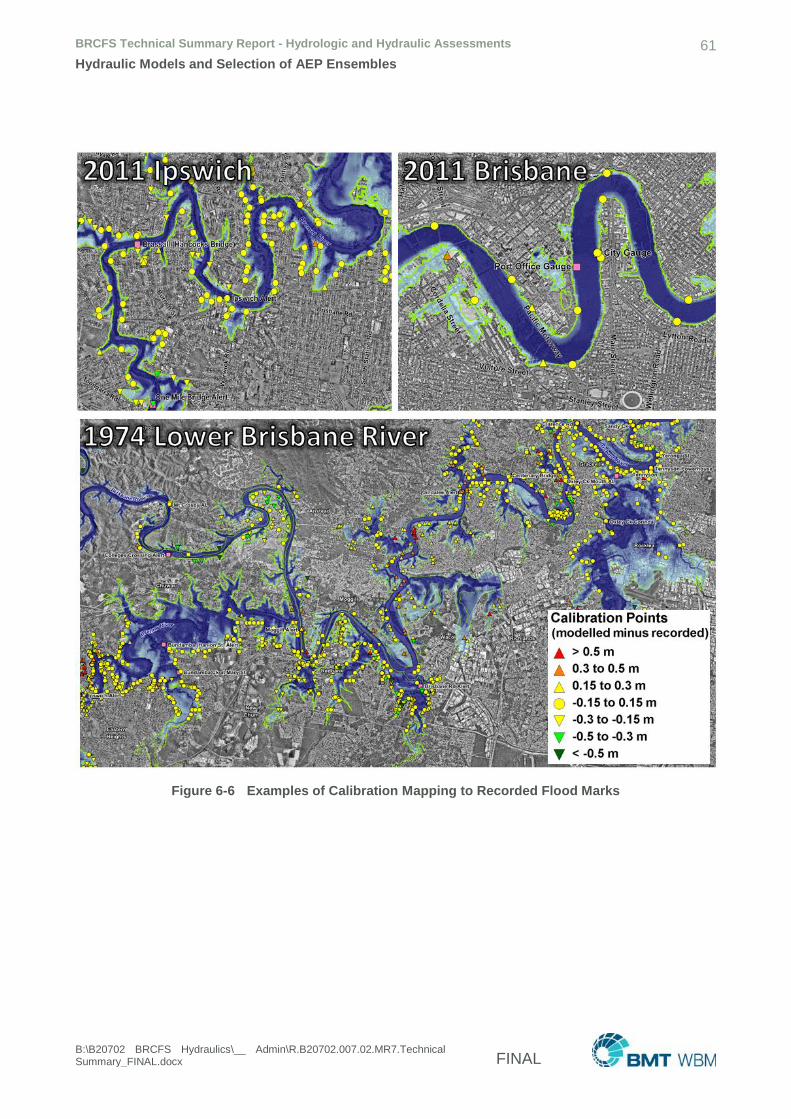
BRCFS Technical Summary Report - Hydrologic and Hydraulic Assessments 61
Hydraulic Models and Selection of AEP Ensembles
B:\B20702 BRCFS Hydraulics\__ Admin\R.B20702.007.02.MR7.Technical Summary_FINAL.docx FINAL
Figure 6-6 Examples of Calibration Mapping to Recorded Flood Marks

BRCFS Technical Summary Report - Hydrologic and Hydraulic Assessments 62
Hydraulic Models and Selection of AEP Ensembles
B:\B20702 BRCFS Hydraulics\__ Admin\R.B20702.007.02.MR7.Technical Summary_FINAL.docx FINAL
6.3.5 Rating Curve Cross Checks
Additional cross checking of model performance was undertaken by comparing the Fast and
Detailed Model stage-discharge relationships at key locations, with the operational rating curves
used by Seqwater and those derived by the Hydrologic Assessment. Where available, stream
gauging measurements were also shown and compared. The comparisons showed consistency
between Fast and Detailed Models results, the rating curves and gaugings if available, thereby
demonstrating consistency between the hydrologic and hydraulic modelling.
Figure 6-7 presents an example of a comparison for Savages Crossing on the Brisbane River, a
key location where consistency between hydrologic and hydraulic modelling should be evident. The
Hydrologic rating curves are shown as light and dark blue circles, field measurements as yellow
circles and the Fast and Detailed Model results as alternating red and green symbols respectively
with a different symbol for each event.
Figure 6-7 Comparison of Hydraulic Modelling with Rating Curves at Savages Crossing
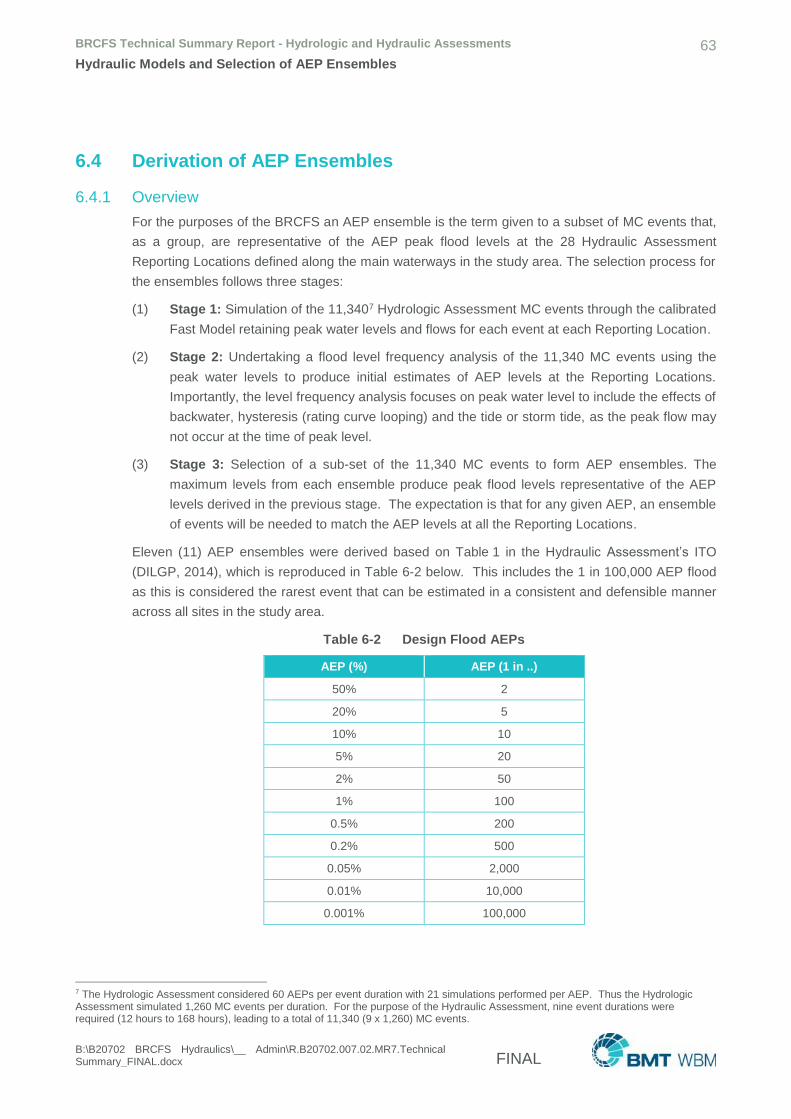
BRCFS Technical Summary Report - Hydrologic and Hydraulic Assessments 63
Hydraulic Models and Selection of AEP Ensembles
B:\B20702 BRCFS Hydraulics\__ Admin\R.B20702.007.02.MR7.Technical Summary_FINAL.docx FINAL
6.4 Derivation of AEP Ensembles
6.4.1 Overview
For the purposes of the BRCFS an AEP ensemble is the term given to a subset of MC events that,
as a group, are representative of the AEP peak flood levels at the 28 Hydraulic Assessment
Reporting Locations defined along the main waterways in the study area. The selection process for
the ensembles follows three stages:
(1) Stage 1: Simulation of the 11,3407 Hydrologic Assessment MC events through the calibrated
Fast Model retaining peak water levels and flows for each event at each Reporting Location.
(2) Stage 2: Undertaking a flood level frequency analysis of the 11,340 MC events using the
peak water levels to produce initial estimates of AEP levels at the Reporting Locations.
Importantly, the level frequency analysis focuses on peak water level to include the effects of
backwater, hysteresis (rating curve looping) and the tide or storm tide, as the peak flow may
not occur at the time of peak level.
(3) Stage 3: Selection of a sub-set of the 11,340 MC events to form AEP ensembles. The
maximum levels from each ensemble produce peak flood levels representative of the AEP
levels derived in the previous stage. The expectation is that for any given AEP, an ensemble
of events will be needed to match the AEP levels at all the Reporting Locations.
Eleven (11) AEP ensembles were derived based on Table 1 in the Hydraulic Assessment’s ITO
(DILGP, 2014), which is reproduced in Table 6-2 below. This includes the 1 in 100,000 AEP flood
as this is considered the rarest event that can be estimated in a consistent and defensible manner
across all sites in the study area.
Table 6-2 Design Flood AEPs
AEP (%) AEP (1 in ..)
50% 2
20% 5
10% 10
5% 20
2% 50
1% 100
0.5% 200
0.2% 500
0.05% 2,000
0.01% 10,000
0.001% 100,000
7 The Hydrologic Assessment considered 60 AEPs per event duration with 21 simulations performed per AEP. Thus the Hydrologic Assessment simulated 1,260 MC events per duration. For the purpose of the Hydraulic Assessment, nine event durations were required (12 hours to 168 hours), leading to a total of 11,340 (9 x 1,260) MC events.
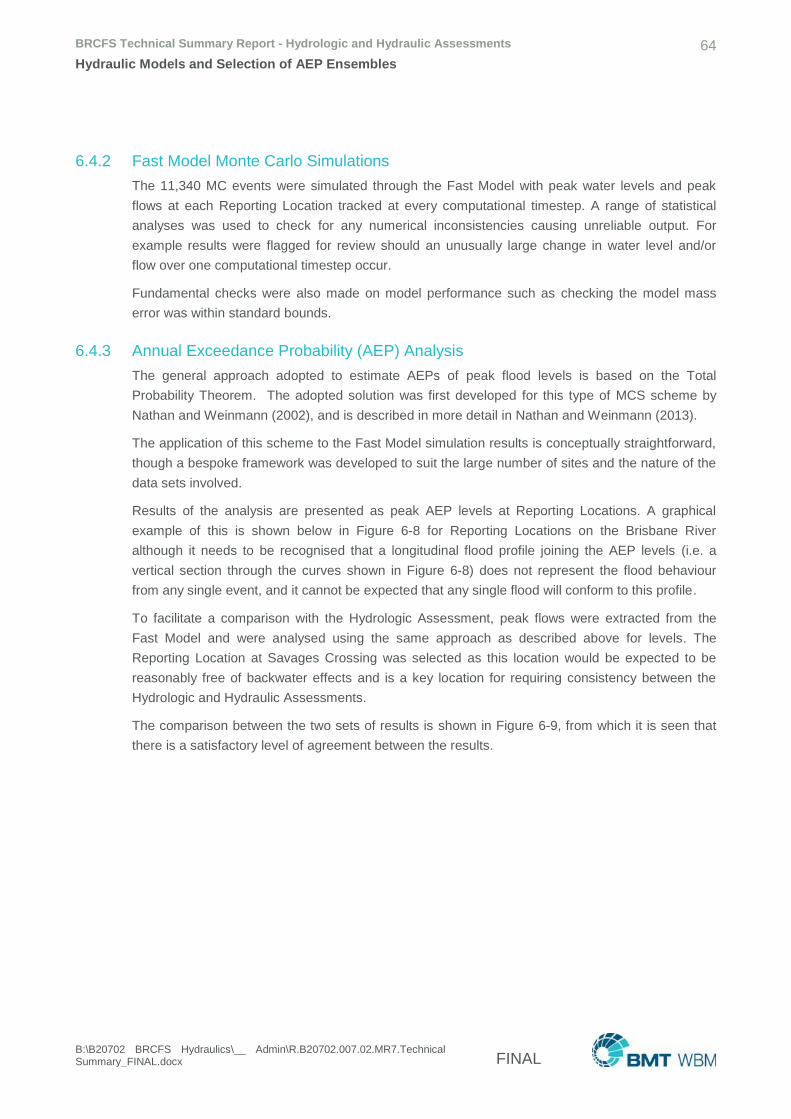
BRCFS Technical Summary Report - Hydrologic and Hydraulic Assessments 64
Hydraulic Models and Selection of AEP Ensembles
B:\B20702 BRCFS Hydraulics\__ Admin\R.B20702.007.02.MR7.Technical Summary_FINAL.docx FINAL
6.4.2 Fast Model Monte Carlo Simulations
The 11,340 MC events were simulated through the Fast Model with peak water levels and peak
flows at each Reporting Location tracked at every computational timestep. A range of statistical
analyses was used to check for any numerical inconsistencies causing unreliable output. For
example results were flagged for review should an unusually large change in water level and/or
flow over one computational timestep occur.
Fundamental checks were also made on model performance such as checking the model mass
error was within standard bounds.
6.4.3 Annual Exceedance Probability (AEP) Analysis
The general approach adopted to estimate AEPs of peak flood levels is based on the Total
Probability Theorem. The adopted solution was first developed for this type of MCS scheme by
Nathan and Weinmann (2002), and is described in more detail in Nathan and Weinmann (2013).
The application of this scheme to the Fast Model simulation results is conceptually straightforward,
though a bespoke framework was developed to suit the large number of sites and the nature of the
data sets involved.
Results of the analysis are presented as peak AEP levels at Reporting Locations. A graphical
example of this is shown below in Figure 6-8 for Reporting Locations on the Brisbane River
although it needs to be recognised that a longitudinal flood profile joining the AEP levels (i.e. a
vertical section through the curves shown in Figure 6-8) does not represent the flood behaviour
from any single event, and it cannot be expected that any single flood will conform to this profile.
To facilitate a comparison with the Hydrologic Assessment, peak flows were extracted from the
Fast Model and were analysed using the same approach as described above for levels. The
Reporting Location at Savages Crossing was selected as this location would be expected to be
reasonably free of backwater effects and is a key location for requiring consistency between the
Hydrologic and Hydraulic Assessments.
The comparison between the two sets of results is shown in Figure 6-9, from which it is seen that
there is a satisfactory level of agreement between the results.
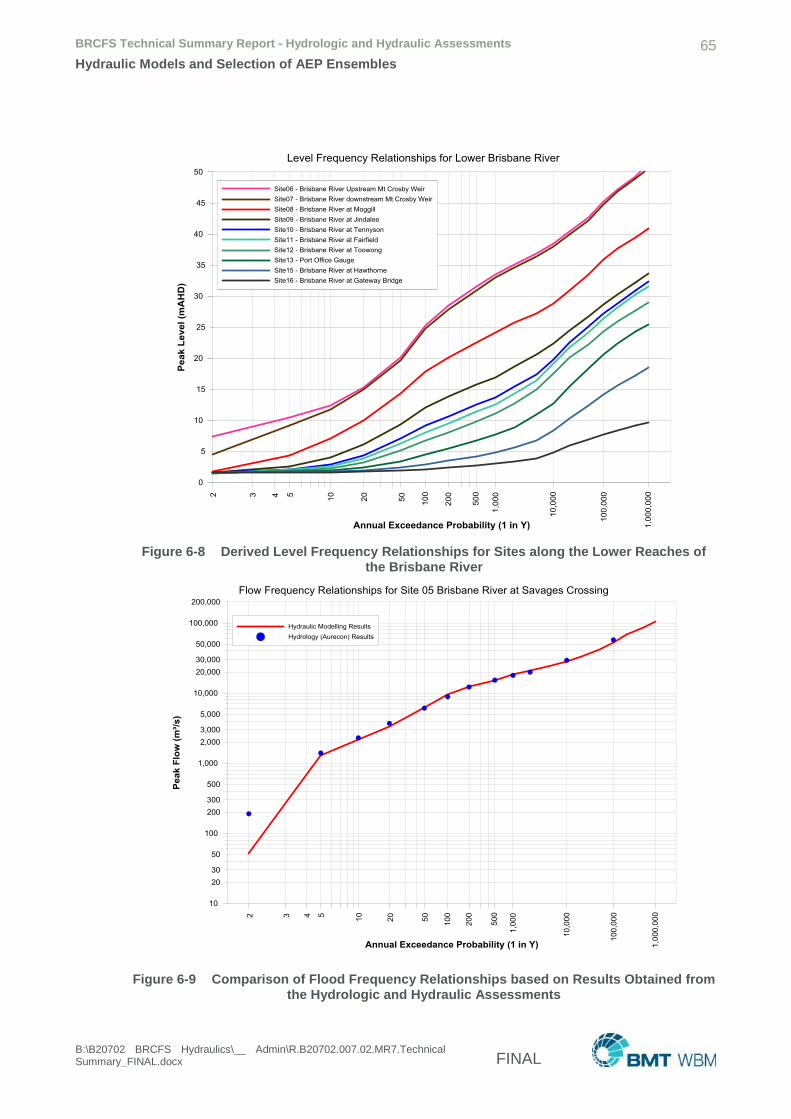
BRCFS Technical Summary Report - Hydrologic and Hydraulic Assessments 65
Hydraulic Models and Selection of AEP Ensembles
B:\B20702 BRCFS Hydraulics\__ Admin\R.B20702.007.02.MR7.Technical Summary_FINAL.docx FINAL
Figure 6-8 Derived Level Frequency Relationships for Sites along the Lower Reaches of the Brisbane River
Figure 6-9 Comparison of Flood Frequency Relationships based on Results Obtained from the Hydrologic and Hydraulic Assessments
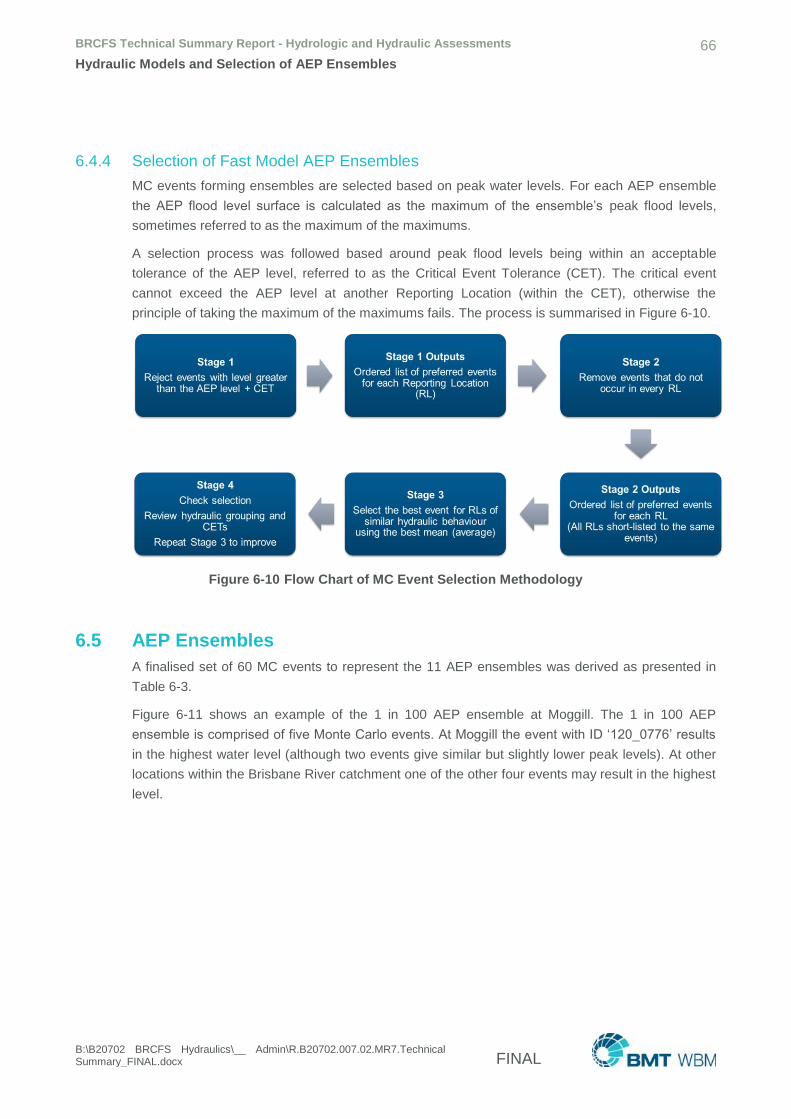
BRCFS Technical Summary Report - Hydrologic and Hydraulic Assessments 66
Hydraulic Models and Selection of AEP Ensembles
B:\B20702 BRCFS Hydraulics\__ Admin\R.B20702.007.02.MR7.Technical Summary_FINAL.docx FINAL
6.4.4 Selection of Fast Model AEP Ensembles
MC events forming ensembles are selected based on peak water levels. For each AEP ensemble
the AEP flood level surface is calculated as the maximum of the ensemble’s peak flood levels,
sometimes referred to as the maximum of the maximums.
A selection process was followed based around peak flood levels being within an acceptable
tolerance of the AEP level, referred to as the Critical Event Tolerance (CET). The critical event
cannot exceed the AEP level at another Reporting Location (within the CET), otherwise the
principle of taking the maximum of the maximums fails. The process is summarised in Figure 6-10.
Figure 6-10 Flow Chart of MC Event Selection Methodology
6.5 AEP Ensembles
A finalised set of 60 MC events to represent the 11 AEP ensembles was derived as presented in
Table 6-3.
Figure 6-11 shows an example of the 1 in 100 AEP ensemble at Moggill. The 1 in 100 AEP
ensemble is comprised of five Monte Carlo events. At Moggill the event with ID ‘120_0776’ results
in the highest water level (although two events give similar but slightly lower peak levels). At other
locations within the Brisbane River catchment one of the other four events may result in the highest
level.
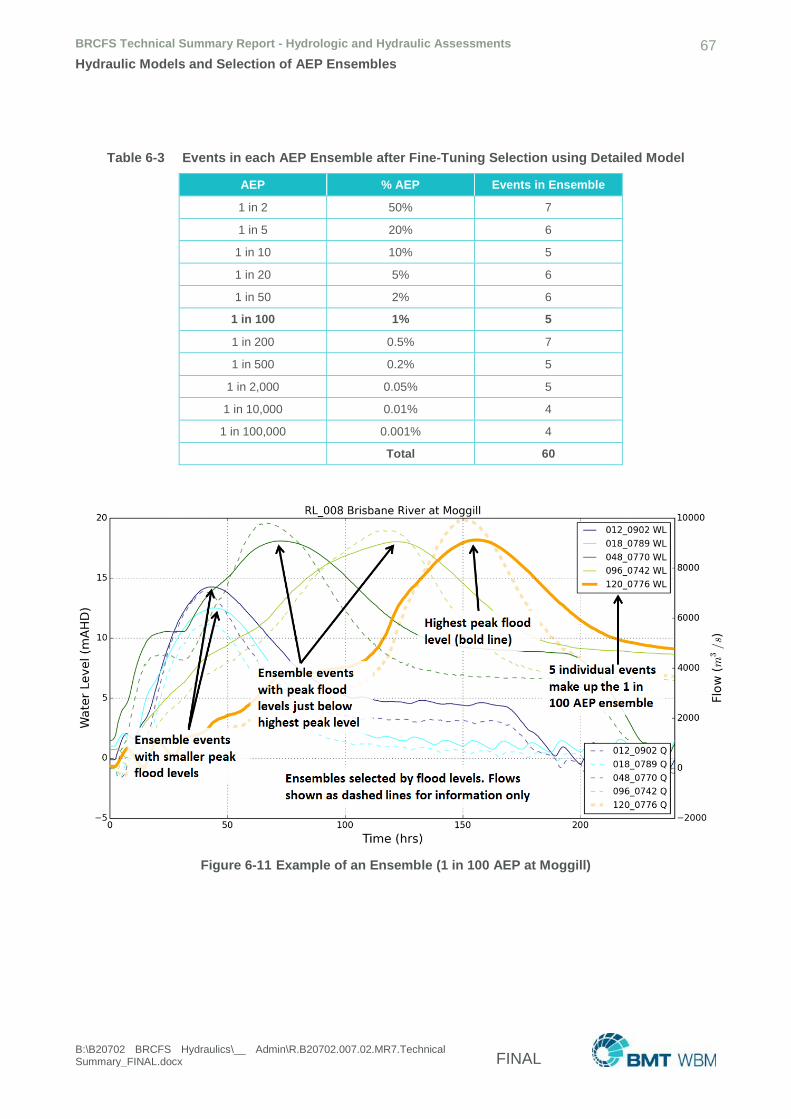
BRCFS Technical Summary Report - Hydrologic and Hydraulic Assessments 67
Hydraulic Models and Selection of AEP Ensembles
B:\B20702 BRCFS Hydraulics\__ Admin\R.B20702.007.02.MR7.Technical Summary_FINAL.docx FINAL
Table 6-3 Events in each AEP Ensemble after Fine-Tuning Selection using Detailed Model
AEP % AEP Events in Ensemble
1 in 2 50% 7
1 in 5 20% 6
1 in 10 10% 5
1 in 20 5% 6
1 in 50 2% 6
1 in 100 1% 5
1 in 200 0.5% 7
1 in 500 0.2% 5
1 in 2,000 0.05% 5
1 in 10,000 0.01% 4
1 in 100,000 0.001% 4
Total 60
Figure 6-11 Example of an Ensemble (1 in 100 AEP at Moggill)
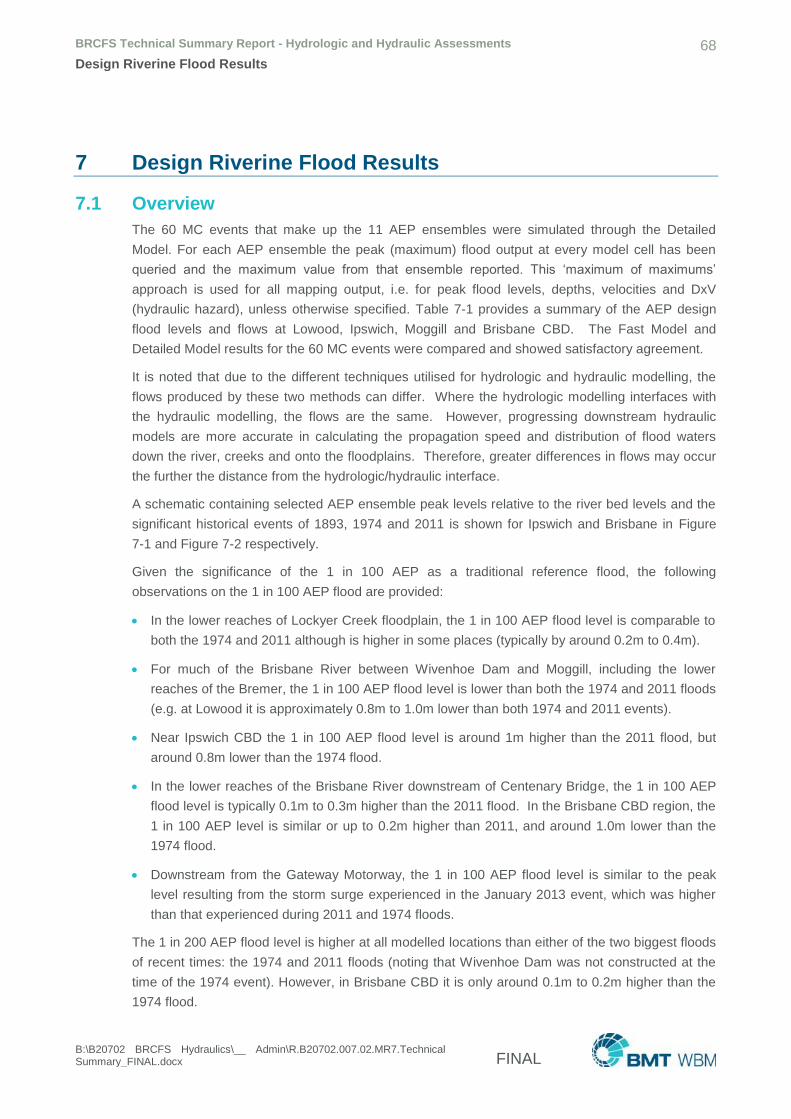
BRCFS Technical Summary Report - Hydrologic and Hydraulic Assessments 68
Design Riverine Flood Results
B:\B20702 BRCFS Hydraulics\__ Admin\R.B20702.007.02.MR7.Technical Summary_FINAL.docx FINAL
7 Design Riverine Flood Results
7.1 Overview
The 60 MC events that make up the 11 AEP ensembles were simulated through the Detailed
Model. For each AEP ensemble the peak (maximum) flood output at every model cell has been
queried and the maximum value from that ensemble reported. This ‘maximum of maximums’
approach is used for all mapping output, i.e. for peak flood levels, depths, velocities and DxV
(hydraulic hazard), unless otherwise specified. Table 7-1 provides a summary of the AEP design
flood levels and flows at Lowood, Ipswich, Moggill and Brisbane CBD. The Fast Model and
Detailed Model results for the 60 MC events were compared and showed satisfactory agreement.
It is noted that due to the different techniques utilised for hydrologic and hydraulic modelling, the
flows produced by these two methods can differ. Where the hydrologic modelling interfaces with
the hydraulic modelling, the flows are the same. However, progressing downstream hydraulic
models are more accurate in calculating the propagation speed and distribution of flood waters
down the river, creeks and onto the floodplains. Therefore, greater differences in flows may occur
the further the distance from the hydrologic/hydraulic interface.
A schematic containing selected AEP ensemble peak levels relative to the river bed levels and the
significant historical events of 1893, 1974 and 2011 is shown for Ipswich and Brisbane in Figure
7-1 and Figure 7-2 respectively.
Given the significance of the 1 in 100 AEP as a traditional reference flood, the following
observations on the 1 in 100 AEP flood are provided:
In the lower reaches of Lockyer Creek floodplain, the 1 in 100 AEP flood level is comparable to
both the 1974 and 2011 although is higher in some places (typically by around 0.2m to 0.4m).
For much of the Brisbane River between Wivenhoe Dam and Moggill, including the lower
reaches of the Bremer, the 1 in 100 AEP flood level is lower than both the 1974 and 2011 floods
(e.g. at Lowood it is approximately 0.8m to 1.0m lower than both 1974 and 2011 events).
Near Ipswich CBD the 1 in 100 AEP flood level is around 1m higher than the 2011 flood, but
around 0.8m lower than the 1974 flood.
In the lower reaches of the Brisbane River downstream of Centenary Bridge, the 1 in 100 AEP
flood level is typically 0.1m to 0.3m higher than the 2011 flood. In the Brisbane CBD region, the
1 in 100 AEP level is similar or up to 0.2m higher than 2011, and around 1.0m lower than the
1974 flood.
Downstream from the Gateway Motorway, the 1 in 100 AEP flood level is similar to the peak
level resulting from the storm surge experienced in the January 2013 event, which was higher
than that experienced during 2011 and 1974 floods.
The 1 in 200 AEP flood level is higher at all modelled locations than either of the two biggest floods
of recent times: the 1974 and 2011 floods (noting that Wivenhoe Dam was not constructed at the
time of the 1974 event). However, in Brisbane CBD it is only around 0.1m to 0.2m higher than the
1974 flood.
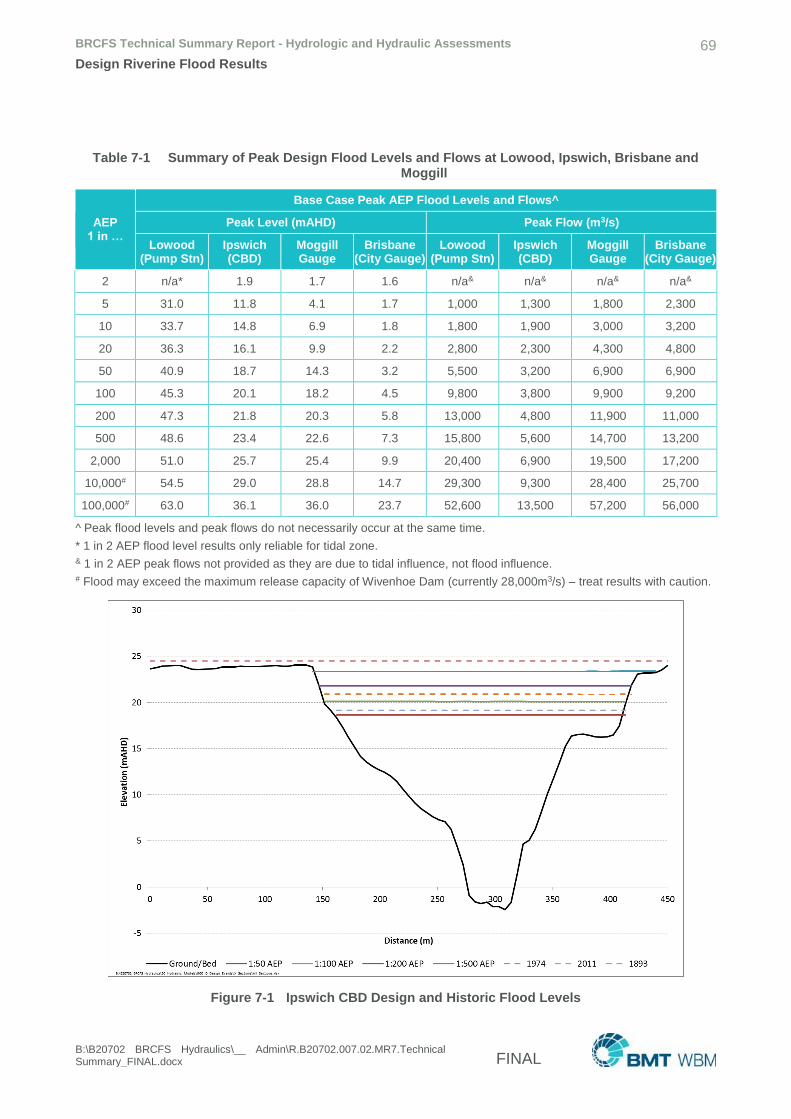
BRCFS Technical Summary Report - Hydrologic and Hydraulic Assessments 69
Design Riverine Flood Results
B:\B20702 BRCFS Hydraulics\__ Admin\R.B20702.007.02.MR7.Technical Summary_FINAL.docx FINAL
Table 7-1 Summary of Peak Design Flood Levels and Flows at Lowood, Ipswich, Brisbane and Moggill
AEP 1 in …
Base Case Peak AEP Flood Levels and Flows^
Peak Level (mAHD) Peak Flow (m3/s)
Lowood (Pump Stn)
Ipswich (CBD)
Moggill Gauge
Brisbane (City Gauge)
Lowood (Pump Stn)
Ipswich (CBD)
Moggill Gauge
Brisbane (City Gauge)
2 n/a* 1.9 1.7 1.6 n/a& n/a& n/a& n/a&
5 31.0 11.8 4.1 1.7 1,000 1,300 1,800 2,300
10 33.7 14.8 6.9 1.8 1,800 1,900 3,000 3,200
20 36.3 16.1 9.9 2.2 2,800 2,300 4,300 4,800
50 40.9 18.7 14.3 3.2 5,500 3,200 6,900 6,900
100 45.3 20.1 18.2 4.5 9,800 3,800 9,900 9,200
200 47.3 21.8 20.3 5.8 13,000 4,800 11,900 11,000
500 48.6 23.4 22.6 7.3 15,800 5,600 14,700 13,200
2,000 51.0 25.7 25.4 9.9 20,400 6,900 19,500 17,200
10,000# 54.5 29.0 28.8 14.7 29,300 9,300 28,400 25,700
100,000# 63.0 36.1 36.0 23.7 52,600 13,500 57,200 56,000
^ Peak flood levels and peak flows do not necessarily occur at the same time.
* 1 in 2 AEP flood level results only reliable for tidal zone. & 1 in 2 AEP peak flows not provided as they are due to tidal influence, not flood influence. # Flood may exceed the maximum release capacity of Wivenhoe Dam (currently 28,000m3/s) – treat results with caution.
Figure 7-1 Ipswich CBD Design and Historic Flood Levels

BRCFS Technical Summary Report - Hydrologic and Hydraulic Assessments 70
Design Riverine Flood Results
B:\B20702 BRCFS Hydraulics\__ Admin\R.B20702.007.02.MR7.Technical Summary_FINAL.docx FINAL
Figure 7-2 Brisbane CBD (City Gauge) Design and Historic Flood Levels
7.2 Mapping
The Hydraulic Assessment provides peak outputs across the assessment area digitally for all AEP
floods. Drawings are divided into AEP floods and then further divided into five regions with one A3
page per region. A key sheet identifying the regions is provided in Map 1.
Four model outputs are presented as follows; with examples shown in Figure 7-3.
Peak Water Surface Levels – the flood extent is shown with 1m interval contours giving peak
level to mAHD. Examples provided in this report (Map 2 to Map 6) showing the 1 in 100 AEP
mapping additionally including intermediate 0.5m contour intervals.
Peak Flood Depth Maps – blue shaded mapping indicating five intervals of flood depth.
Peak Flood Velocity Maps – multi-colour shaded mapping with six intervals of velocity.
Peak Depth x Velocity (DxV or Hydraulic Hazard) Maps – multi-colour shaded mapping with five
intervals of hydraulic hazard. Hydraulic hazard is the product of flood depth and the depth
averaged velocity. The peak hydraulic hazard is tracked during the model simulation and
occurs when the product of flood depth and depth averaged velocity is greatest.
All mapping also includes the following:
A yellow dashed line showing the ‘extreme flood’ extent, nominally taken as the 1 in 100,000
AEP flood.
Limit of mapping lines defining the upstream limits of where the design riverine flood mapping is
considered applicable.
BRCFS Technical Summary Report - Hydrologic and Hydraulic Assessments 71
Design Riverine Flood Results
B:\B20702 BRCFS Hydraulics\__ Admin\R.B20702.007.02.MR7.Technical Summary_FINAL.docx FINAL
A hatched area across flood extents shown in the Lockyer Valley Regional Council (LVRC) area
and extending part way into Somerset Regional Council (SRC) area. This area is beyond the
area specified in the Hydraulic ITO to be mapped and may be subject to higher localised creek
flooding, therefore flood levels for design and planning purposes should be checked with the
local council. The mapping is provided because it adds valuable insight into flood behaviour on
the complex Lockyer Creek floodplain from the backwater interaction between Lockyer Creek
and Brisbane River.
Mapping for the 1 in 100 AEP flood is included in the A3 Map Addendum at the end of this report
(see Map 2 to Map 21).
Figure 7-3 Example Map Output for the 1 in 100 AEP Flood

BRCFS Technical Summary Report - Hydrologic and Hydraulic Assessments 72
Design Riverine Flood Results
B:\B20702 BRCFS Hydraulics\__ Admin\R.B20702.007.02.MR7.Technical Summary_FINAL.docx FINAL
7.3 Hydrographs
Plot output for the modelling includes:
Time-series plots of flows/levels at Reporting Locations.
Longitudinal peak water surface profiles.
Rating curve (flow vs level) plots at gauges.
An example time series plot for Brisbane City Gauge is shown in Figure 7-4 for the 1 in 100 AEP
ensemble. It contains both water levels (WL) and flows (Q). All five MC events that comprise the 1
in 100 AEP ensemble are included on the plot labelled with a unique event identifier. A thick line is
used to indicate that individual MC event that results in the highest peak flood level at the location.
It can be seen that in this case, three MC events give peak levels close to the maximum peak of
4.5 mAHD but the events differ in their timing and in the rate of rise. Therefore, the individual MC
event within an ensemble that results in the highest flood level at any given location for that
ensemble may not be the event that exhibits the fastest rate of rise or longest duration of
inundation at that location.
For this reason, it is recommended that if rate of rise or duration of inundation is of specific interest
in future studies, then consideration be given as to whether a suitable rate of rise at a particular
location for a given AEP is given by: a) the critical event that provides the peak flood level AEP; or
b) one of the AEP ensemble events; or c) one of the 11,340 MC events. Whether or not a rate of
rise estimated by one of these three options is suitable is dependent upon the accuracy required.
Figure 7-4 Hydrograph (Stage and Flow) at Brisbane City Gauge for the 1 in 100 AEP Ensemble (5 Events)
BRCFS Technical Summary Report - Hydrologic and Hydraulic Assessments 73
Design Riverine Flood Results
B:\B20702 BRCFS Hydraulics\__ Admin\R.B20702.007.02.MR7.Technical Summary_FINAL.docx FINAL
7.4 Backflow Prevention Devices
Following the 2011 event, a programme began to fit a number of large drainage pipes in inner
Brisbane with backwater prevention devices, which are designed to prevent river water backing up
into low-lying areas. Such devices do not provide protection for all floods for the following reasons:
The device may fail - the device becomes blocked or unable to fully close.
The river bank is breached or overtopped - major riverine floods can still overtop river banks
when flood levels in the river are high enough.
As it is not possible to eliminate all flood risk for the reasons outlined above, it was assumed (in
agreement with the TWG) that no backflow prevention devices were fitted to the stormwater pipes
or trunk drainage systems, for the design flood modelling.
Mapped output may therefore show flooding in areas for which backflow prevention devices would
otherwise provide protection. In this regard, the mapping can be considered conservative in these
areas.
7.5 Rating Curve Reconciliation
The Fast and Detailed Models, as hydraulic models, produce data on how flow varies with water
level (the stage-discharge relationship), from which the existing rating curves including those
adopted for the Hydrologic Assessment can be compared and refined as appropriate.
The stage-discharge relationship at a site can vary, sometimes significantly, resulting in different
flows for a given water level. This variation known as hysteresis or looping in the curve occurs
where the flood surface gradient and/or backwater effects vary during the flood. For example,
flows are usually higher on the rising limb than the falling limb due to the steeper flood surface
gradient on the flood rise.
Of importance is that where there is little or no hysteresis in the relationship, a reliable rating curve
can be derived. Where hysteresis does occur there is no single rating curve that can represent the
stage-discharge relationship. In lieu of these factors, a single rating curve per site was not
produced using hydraulic model results. Instead, the results from the hydraulic modelling are
presented along with the effects of any looping or hysteresis as this can be used to help inform
agencies of the sensitivity and uncertainty when adopting a single rating curve at a hydraulically
complex site.
For ten nominated sites a rating review has been undertaken and contrasted to a review of the
Hydrologic Assessment rating curves. The review concluded that the Hydrologic Assessment rating
curves are commensurate with the hydraulic modelling stage-discharge relationships within the
bounds of data inaccuracies, modelling uncertainties, hysteresis effects, and variations in hydraulic
behaviour of the different calibration events. On this basis it was agreed and endorsed by the IPE
that there was no justifiable benefit in seeking to further refine the hydrologic and hydraulic
modelling calibrations.
Contrasting examples are shown below for the rating curves at two nominated sites: Savages
Crossing on the Brisbane River (Figure 7-5); a relatively consistent rating at a site not subject to
any notable backwater influences, and at Amberley on Warrill Creek (Figure 7-6); a site subject to
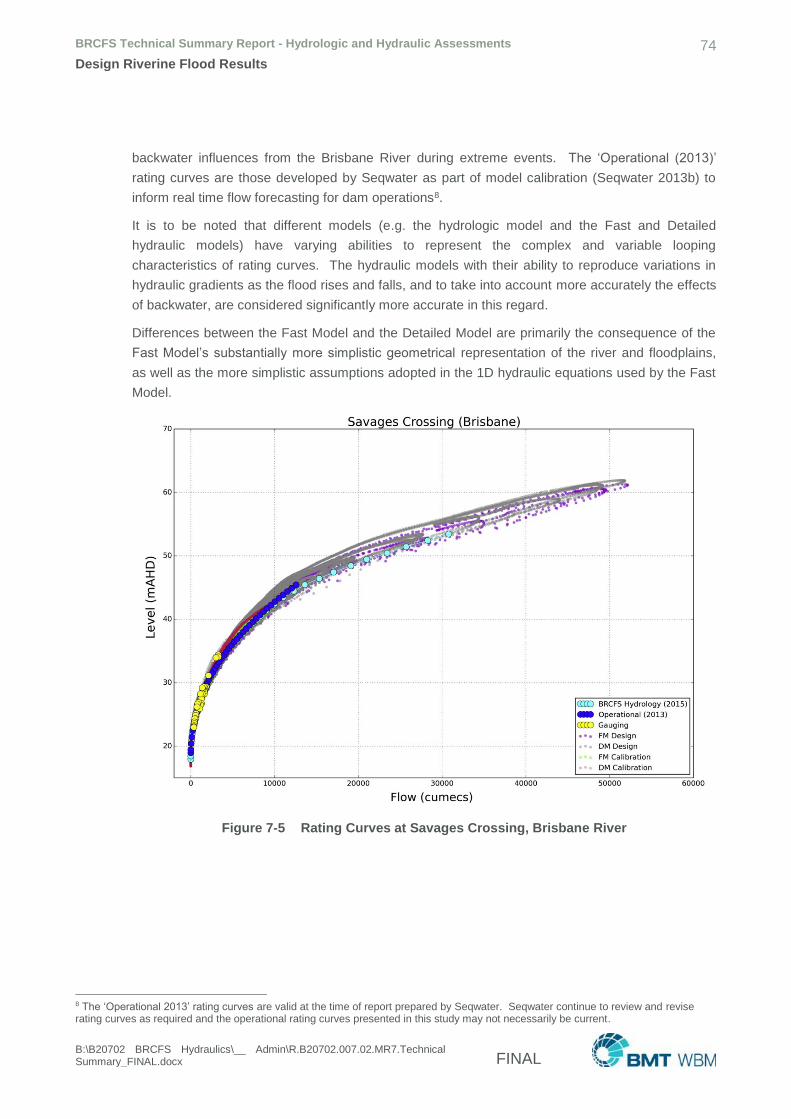
BRCFS Technical Summary Report - Hydrologic and Hydraulic Assessments 74
Design Riverine Flood Results
B:\B20702 BRCFS Hydraulics\__ Admin\R.B20702.007.02.MR7.Technical Summary_FINAL.docx FINAL
backwater influences from the Brisbane River during extreme events. The ‘Operational (2013)’
rating curves are those developed by Seqwater as part of model calibration (Seqwater 2013b) to
inform real time flow forecasting for dam operations8.
It is to be noted that different models (e.g. the hydrologic model and the Fast and Detailed
hydraulic models) have varying abilities to represent the complex and variable looping
characteristics of rating curves. The hydraulic models with their ability to reproduce variations in
hydraulic gradients as the flood rises and falls, and to take into account more accurately the effects
of backwater, are considered significantly more accurate in this regard.
Differences between the Fast Model and the Detailed Model are primarily the consequence of the
Fast Model’s substantially more simplistic geometrical representation of the river and floodplains,
as well as the more simplistic assumptions adopted in the 1D hydraulic equations used by the Fast
Model.
Figure 7-5 Rating Curves at Savages Crossing, Brisbane River
8 The ‘Operational 2013’ rating curves are valid at the time of report prepared by Seqwater. Seqwater continue to review and revise rating curves as required and the operational rating curves presented in this study may not necessarily be current.
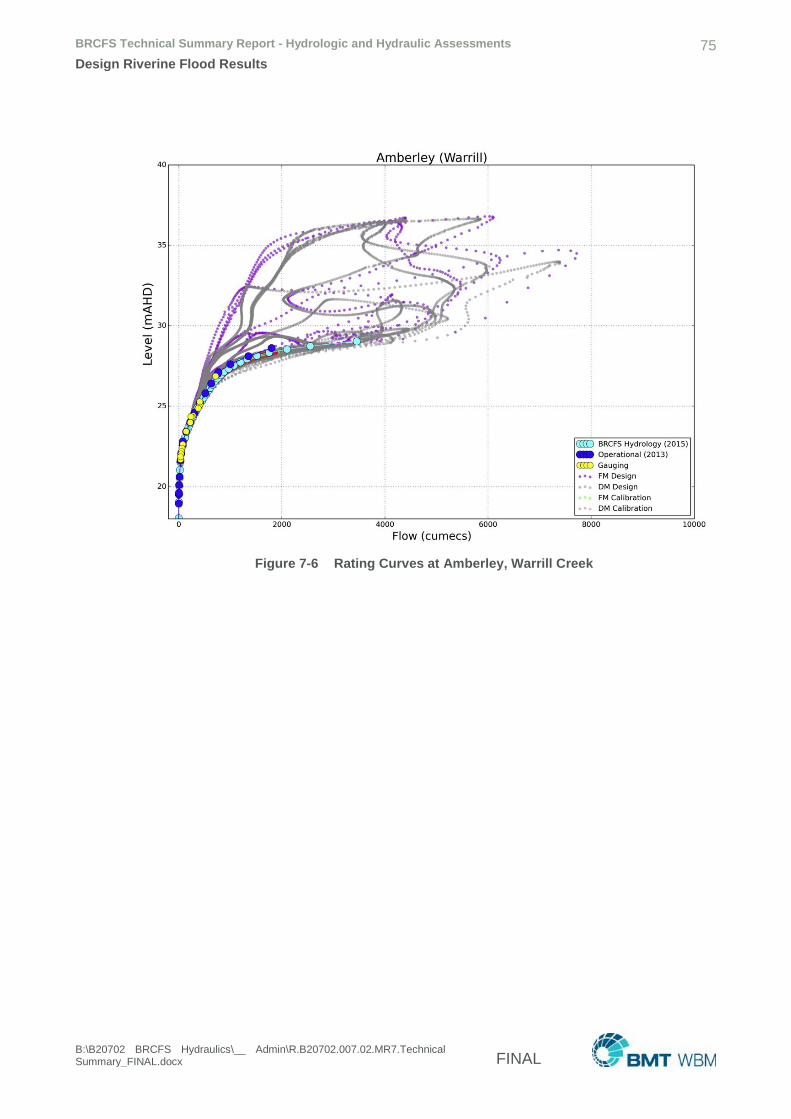
BRCFS Technical Summary Report - Hydrologic and Hydraulic Assessments 75
Design Riverine Flood Results
B:\B20702 BRCFS Hydraulics\__ Admin\R.B20702.007.02.MR7.Technical Summary_FINAL.docx FINAL
Figure 7-6 Rating Curves at Amberley, Warrill Creek
BRCFS Technical Summary Report - Hydrologic and Hydraulic Assessments 76
Sensitivity Analysis
B:\B20702 BRCFS Hydraulics\__ Admin\R.B20702.007.02.MR7.Technical Summary_FINAL.docx FINAL
8 Sensitivity Analysis
8.1 Introduction
Sensitivity scenarios have been simulated to ascertain the sensitivity of the Base Case design flood
levels to potential changes in the catchment that may occur due to direct human influence,
geomorphic or climatic processes for each of the selected events.
It is important to clarify that when the sensitivity scenarios are simulated using pre-selected AEP
ensembles, the flood modelling outputs represent the impacts on only those individual ensemble
events. The sensitivity scenarios do not produce equivalent AEP peak flood levels for that scenario
and must be regarded as indicative only.
In general, four categories of sensitivity test have been undertaken as follows:
Calibration events No/With Dams scenarios (CND, CWD)
Climate Change scenarios (CC1, CC2, CC3, CC4)
Bed Level scenarios (BL1, BL2)
Floodplain Future Condition (FF1).
8.2 With and No Dams
A ‘no dams’ scenario, in which the influence of the major storages of Wivenhoe, Somerset,
Cressbrook, Perseverence, Manchester and Moogerah Dams was removed, was compared to a
‘with dams’ scenario. This was undertaken for the five calibration events namely 1974, 1996, 1999,
2011 and 2013.
For all events other than 1974, the ‘with dams’ simulation is the same as that used in calibration i.e.
all the dams listed above were in place at the time of the event. For the 1974 event an additional
simulation was required in which Wivenhoe Dam was assumed present9. This allows for a ‘like for
like’ comparison of the dams’ influences on the five calibration events.
Table 8-1 presents a summary of the peak levels for the ‘no dams’ and ‘with dams’ scenarios at
Brisbane and Ipswich CBDs respectively. It can be seen that under the ‘with dams’ scenarios all
five simulated events show lower peak flood levels than would have otherwise occurred under a ‘no
dams’ scenario.
For the 2011 event, the dams reduced the flood peak by approximately 2.0m in Brisbane and 2.8m
at Ipswich for the model conditions simulated.
9 The assumed management of the dam used simulated Wivenhoe Dam outflows from the Wivenhoe and Somerset Dams Optimisation Study (WSDOS) based on the ‘Alternate Urban 3’ assumed operation. Dam outflows were supplied by Seqwater.
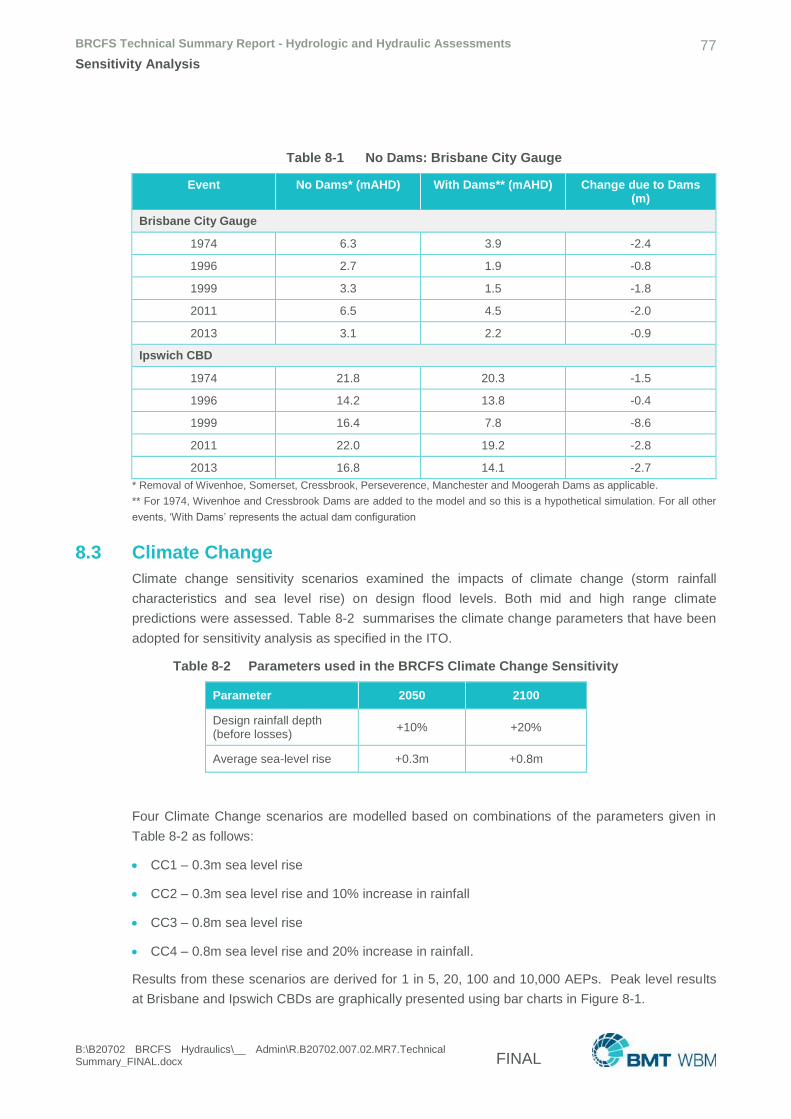
BRCFS Technical Summary Report - Hydrologic and Hydraulic Assessments 77
Sensitivity Analysis
B:\B20702 BRCFS Hydraulics\__ Admin\R.B20702.007.02.MR7.Technical Summary_FINAL.docx FINAL
Table 8-1 No Dams: Brisbane City Gauge
Event No Dams* (mAHD) With Dams** (mAHD) Change due to Dams (m)
Brisbane City Gauge
1974 6.3 3.9 -2.4
1996 2.7 1.9 -0.8
1999 3.3 1.5 -1.8
2011 6.5 4.5 -2.0
2013 3.1 2.2 -0.9
Ipswich CBD
1974 21.8 20.3 -1.5
1996 14.2 13.8 -0.4
1999 16.4 7.8 -8.6
2011 22.0 19.2 -2.8
2013 16.8 14.1 -2.7
* Removal of Wivenhoe, Somerset, Cressbrook, Perseverence, Manchester and Moogerah Dams as applicable.
** For 1974, Wivenhoe and Cressbrook Dams are added to the model and so this is a hypothetical simulation. For all other
events, ‘With Dams’ represents the actual dam configuration
8.3 Climate Change
Climate change sensitivity scenarios examined the impacts of climate change (storm rainfall
characteristics and sea level rise) on design flood levels. Both mid and high range climate
predictions were assessed. Table 8-2 summarises the climate change parameters that have been
adopted for sensitivity analysis as specified in the ITO.
Table 8-2 Parameters used in the BRCFS Climate Change Sensitivity
Parameter 2050 2100
Design rainfall depth (before losses)
+10% +20%
Average sea-level rise +0.3m +0.8m
Four Climate Change scenarios are modelled based on combinations of the parameters given in
Table 8-2 as follows:
CC1 – 0.3m sea level rise
CC2 – 0.3m sea level rise and 10% increase in rainfall
CC3 – 0.8m sea level rise
CC4 – 0.8m sea level rise and 20% increase in rainfall.
Results from these scenarios are derived for 1 in 5, 20, 100 and 10,000 AEPs. Peak level results
at Brisbane and Ipswich CBDs are graphically presented using bar charts in Figure 8-1.
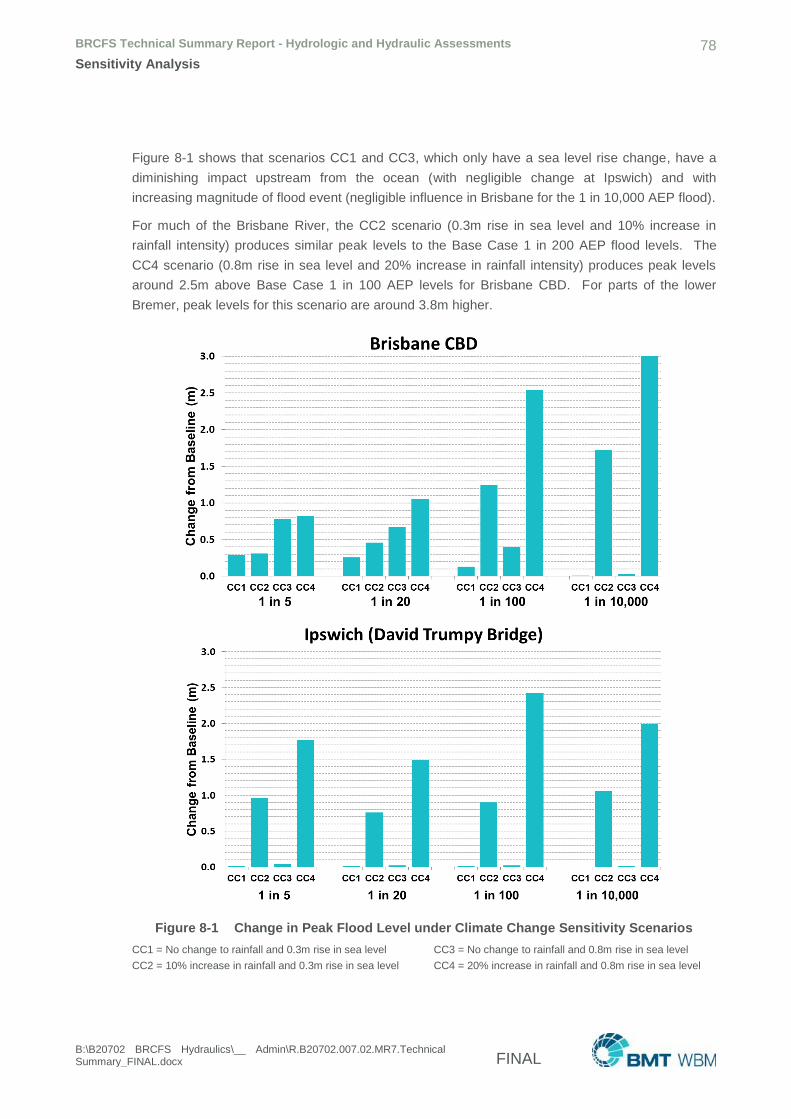
BRCFS Technical Summary Report - Hydrologic and Hydraulic Assessments 78
Sensitivity Analysis
B:\B20702 BRCFS Hydraulics\__ Admin\R.B20702.007.02.MR7.Technical Summary_FINAL.docx FINAL
Figure 8-1 shows that scenarios CC1 and CC3, which only have a sea level rise change, have a
diminishing impact upstream from the ocean (with negligible change at Ipswich) and with
increasing magnitude of flood event (negligible influence in Brisbane for the 1 in 10,000 AEP flood).
For much of the Brisbane River, the CC2 scenario (0.3m rise in sea level and 10% increase in
rainfall intensity) produces similar peak levels to the Base Case 1 in 200 AEP flood levels. The
CC4 scenario (0.8m rise in sea level and 20% increase in rainfall intensity) produces peak levels
around 2.5m above Base Case 1 in 100 AEP levels for Brisbane CBD. For parts of the lower
Bremer, peak levels for this scenario are around 3.8m higher.
Figure 8-1 Change in Peak Flood Level under Climate Change Sensitivity Scenarios
CC1 = No change to rainfall and 0.3m rise in sea level CC3 = No change to rainfall and 0.8m rise in sea level
CC2 = 10% increase in rainfall and 0.3m rise in sea level CC4 = 20% increase in rainfall and 0.8m rise in sea level
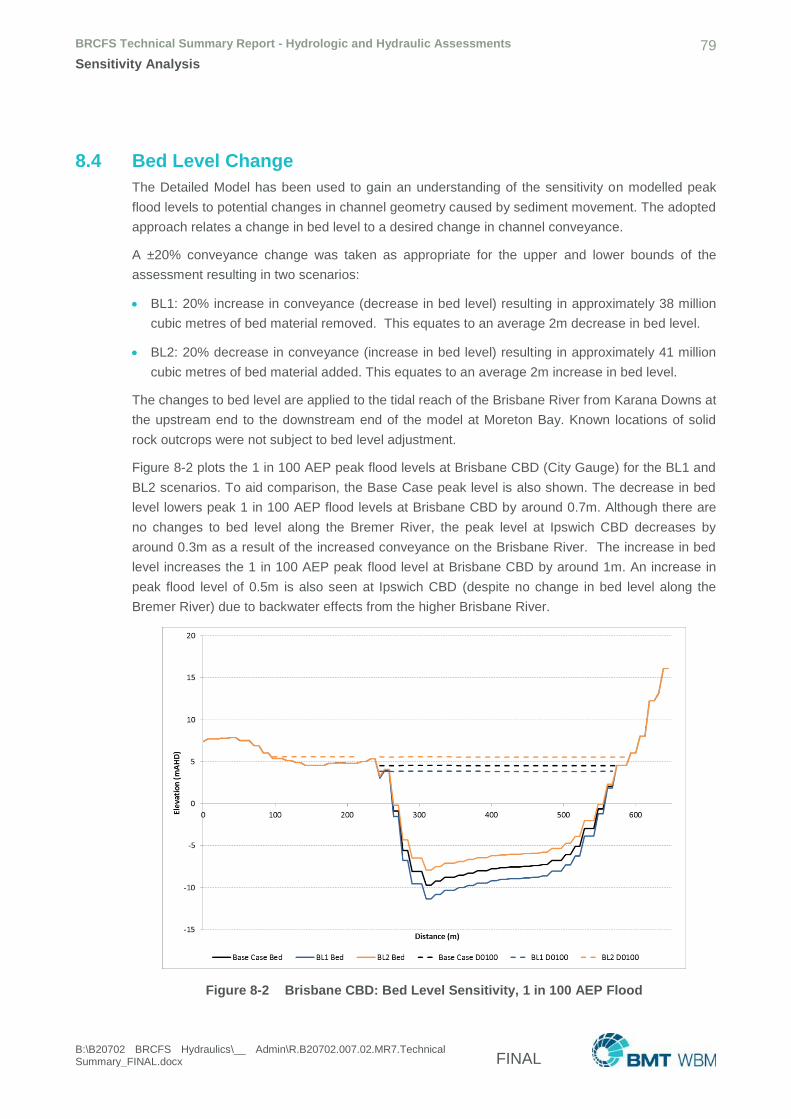
BRCFS Technical Summary Report - Hydrologic and Hydraulic Assessments 79
Sensitivity Analysis
B:\B20702 BRCFS Hydraulics\__ Admin\R.B20702.007.02.MR7.Technical Summary_FINAL.docx FINAL
8.4 Bed Level Change
The Detailed Model has been used to gain an understanding of the sensitivity on modelled peak
flood levels to potential changes in channel geometry caused by sediment movement. The adopted
approach relates a change in bed level to a desired change in channel conveyance.
A ±20% conveyance change was taken as appropriate for the upper and lower bounds of the
assessment resulting in two scenarios:
BL1: 20% increase in conveyance (decrease in bed level) resulting in approximately 38 million
cubic metres of bed material removed. This equates to an average 2m decrease in bed level.
BL2: 20% decrease in conveyance (increase in bed level) resulting in approximately 41 million
cubic metres of bed material added. This equates to an average 2m increase in bed level.
The changes to bed level are applied to the tidal reach of the Brisbane River from Karana Downs at
the upstream end to the downstream end of the model at Moreton Bay. Known locations of solid
rock outcrops were not subject to bed level adjustment.
Figure 8-2 plots the 1 in 100 AEP peak flood levels at Brisbane CBD (City Gauge) for the BL1 and
BL2 scenarios. To aid comparison, the Base Case peak level is also shown. The decrease in bed
level lowers peak 1 in 100 AEP flood levels at Brisbane CBD by around 0.7m. Although there are
no changes to bed level along the Bremer River, the peak level at Ipswich CBD decreases by
around 0.3m as a result of the increased conveyance on the Brisbane River. The increase in bed
level increases the 1 in 100 AEP peak flood level at Brisbane CBD by around 1m. An increase in
peak flood level of 0.5m is also seen at Ipswich CBD (despite no change in bed level along the
Bremer River) due to backwater effects from the higher Brisbane River.
Figure 8-2 Brisbane CBD: Bed Level Sensitivity, 1 in 100 AEP Flood
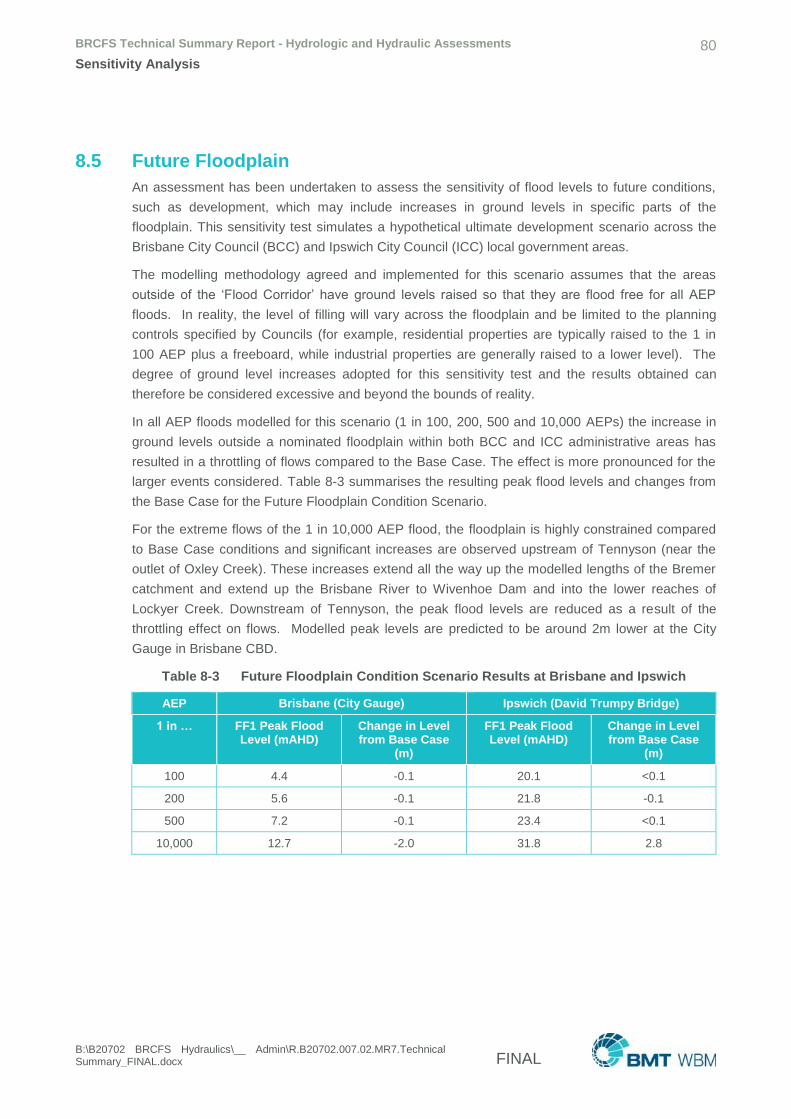
BRCFS Technical Summary Report - Hydrologic and Hydraulic Assessments 80
Sensitivity Analysis
B:\B20702 BRCFS Hydraulics\__ Admin\R.B20702.007.02.MR7.Technical Summary_FINAL.docx FINAL
8.5 Future Floodplain
An assessment has been undertaken to assess the sensitivity of flood levels to future conditions,
such as development, which may include increases in ground levels in specific parts of the
floodplain. This sensitivity test simulates a hypothetical ultimate development scenario across the
Brisbane City Council (BCC) and Ipswich City Council (ICC) local government areas.
The modelling methodology agreed and implemented for this scenario assumes that the areas
outside of the ‘Flood Corridor’ have ground levels raised so that they are flood free for all AEP
floods. In reality, the level of filling will vary across the floodplain and be limited to the planning
controls specified by Councils (for example, residential properties are typically raised to the 1 in
100 AEP plus a freeboard, while industrial properties are generally raised to a lower level). The
degree of ground level increases adopted for this sensitivity test and the results obtained can
therefore be considered excessive and beyond the bounds of reality.
In all AEP floods modelled for this scenario (1 in 100, 200, 500 and 10,000 AEPs) the increase in
ground levels outside a nominated floodplain within both BCC and ICC administrative areas has
resulted in a throttling of flows compared to the Base Case. The effect is more pronounced for the
larger events considered. Table 8-3 summarises the resulting peak flood levels and changes from
the Base Case for the Future Floodplain Condition Scenario.
For the extreme flows of the 1 in 10,000 AEP flood, the floodplain is highly constrained compared
to Base Case conditions and significant increases are observed upstream of Tennyson (near the
outlet of Oxley Creek). These increases extend all the way up the modelled lengths of the Bremer
catchment and extend up the Brisbane River to Wivenhoe Dam and into the lower reaches of
Lockyer Creek. Downstream of Tennyson, the peak flood levels are reduced as a result of the
throttling effect on flows. Modelled peak levels are predicted to be around 2m lower at the City
Gauge in Brisbane CBD.
Table 8-3 Future Floodplain Condition Scenario Results at Brisbane and Ipswich
AEP Brisbane (City Gauge) Ipswich (David Trumpy Bridge)
1 in … FF1 Peak Flood Level (mAHD)
Change in Level from Base Case
(m)
FF1 Peak Flood Level (mAHD)
Change in Level from Base Case
(m)
100 4.4 -0.1 20.1 <0.1
200 5.6 -0.1 21.8 -0.1
500 7.2 -0.1 23.4 <0.1
10,000 12.7 -2.0 31.8 2.8
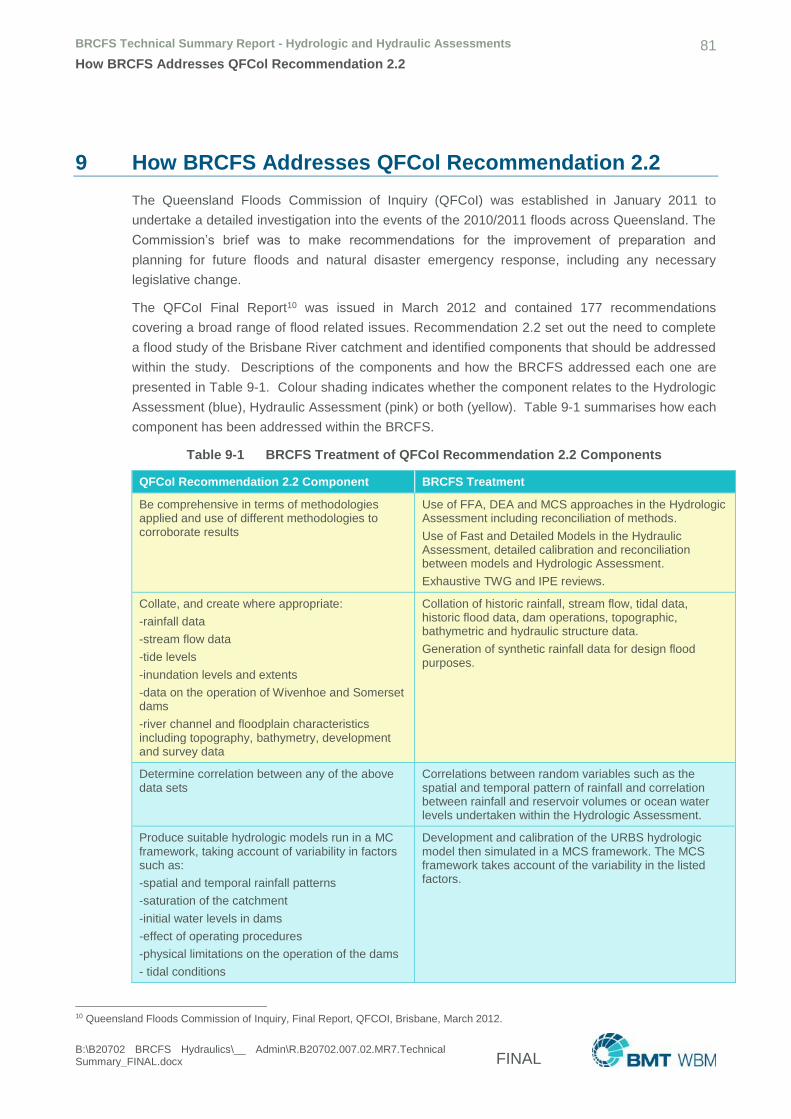
BRCFS Technical Summary Report - Hydrologic and Hydraulic Assessments 81
How BRCFS Addresses QFCol Recommendation 2.2
B:\B20702 BRCFS Hydraulics\__ Admin\R.B20702.007.02.MR7.Technical Summary_FINAL.docx FINAL
9 How BRCFS Addresses QFCol Recommendation 2.2
The Queensland Floods Commission of Inquiry (QFCoI) was established in January 2011 to
undertake a detailed investigation into the events of the 2010/2011 floods across Queensland. The
Commission’s brief was to make recommendations for the improvement of preparation and
planning for future floods and natural disaster emergency response, including any necessary
legislative change.
The QFCoI Final Report10 was issued in March 2012 and contained 177 recommendations
covering a broad range of flood related issues. Recommendation 2.2 set out the need to complete
a flood study of the Brisbane River catchment and identified components that should be addressed
within the study. Descriptions of the components and how the BRCFS addressed each one are
presented in Table 9-1. Colour shading indicates whether the component relates to the Hydrologic
Assessment (blue), Hydraulic Assessment (pink) or both (yellow). Table 9-1 summarises how each
component has been addressed within the BRCFS.
Table 9-1 BRCFS Treatment of QFCoI Recommendation 2.2 Components
QFCoI Recommendation 2.2 Component BRCFS Treatment
Be comprehensive in terms of methodologies applied and use of different methodologies to corroborate results
Use of FFA, DEA and MCS approaches in the Hydrologic Assessment including reconciliation of methods.
Use of Fast and Detailed Models in the Hydraulic Assessment, detailed calibration and reconciliation between models and Hydrologic Assessment.
Exhaustive TWG and IPE reviews.
Collate, and create where appropriate:
-rainfall data
-stream flow data
-tide levels
-inundation levels and extents
-data on the operation of Wivenhoe and Somerset dams
-river channel and floodplain characteristics including topography, bathymetry, development and survey data
Collation of historic rainfall, stream flow, tidal data, historic flood data, dam operations, topographic, bathymetric and hydraulic structure data.
Generation of synthetic rainfall data for design flood purposes.
Determine correlation between any of the above data sets
Correlations between random variables such as the spatial and temporal pattern of rainfall and correlation between rainfall and reservoir volumes or ocean water levels undertaken within the Hydrologic Assessment.
Produce suitable hydrologic models run in a MC framework, taking account of variability in factors such as:
-spatial and temporal rainfall patterns
-saturation of the catchment
-initial water levels in dams
-effect of operating procedures
-physical limitations on the operation of the dams
- tidal conditions
Development and calibration of the URBS hydrologic model then simulated in a MCS framework. The MCS framework takes account of the variability in the listed factors.
10 Queensland Floods Commission of Inquiry, Final Report, QFCOI, Brisbane, March 2012.

BRCFS Technical Summary Report - Hydrologic and Hydraulic Assessments 82
How BRCFS Addresses QFCol Recommendation 2.2
B:\B20702 BRCFS Hydraulics\__ Admin\R.B20702.007.02.MR7.Technical Summary_FINAL.docx FINAL
QFCoI Recommendation 2.2 Component BRCFS Treatment
- closely occurring rainfall events
Validate hydrologic models to ensure they reproduce:
-observed hydrograph attenuation
-probability distributions of observed values for total flood volume and peak flow
-timing of major tributary flows
-observed flood behaviour under no dams conditions and current conditions
Calibration of the hydrologic model to five events with validation to a further 43 events. ‘No dams’ and ‘with dams’ (current) conditions assessed.
Produce a suitable hydraulic model or models that :
-are able to determine flood heights, extents of inundation, velocities, rate of rise and duration of inundation for floods of different probabilities
-are able to deal with movement of sediment and changes in river beds during floods
-are able to assess historical changes to river bathymetry
-are able to be run in a short time to allow detailed calibration and assessment work
-characterise the backwater effect at the confluence of the Brisbane and Bremer rivers and other confluences as appropriate
‘Fast’ and ‘Detailed’ models developed. Both models can be used for determination of flood heights, velocities, rate of rise and duration of inundation for small to extreme flood events. Detailed model can additionally be used for mapping flood extents.
In agreement with the TWG and IPE the Detailed Model was used to gain an understanding of the sensitivity of modelled peak flows and peak levels to changes in channel geometry (bathymetry) rather than perform morphological (dynamic change in river bed levels) modelling due to lack of bed level change data.
Model run times are suitable for facilitating a Detailed Model calibration and further assessment. Models calibrated/validated to five historical flood events and tested for extreme hypothetical flood events.
Backwater effects of the Brisbane River (downstream of Wivenhoe Dam) on all tributaries are fully accounted for.
Analyse joint probability of floods occurring in the Brisbane and Bremer rivers (and any other pair of rivers if considered appropriate)
Accounted for through the MCS methodology that encompasses thousands of resulting flood combinations.
Be iterative and obtain short-term estimate of the characteristics of floods of different probabilities in all significant locations in the catchment (at least Brisbane City, Ipswich City and at Wivenhoe Dam) in order to determine the priorities for the rest of the study.
The DMT study (BCC CPO, BCC 2014b) carried out before the Hydraulic Assessment provided this insight, which was subsequently utilised for the Hydrologic and Hydraulic Assessments.
The Hydrologic and Hydraulic Assessments were delivered in multiple stages with each stage assessed on its own merits and priorities established for the subsequent stages.
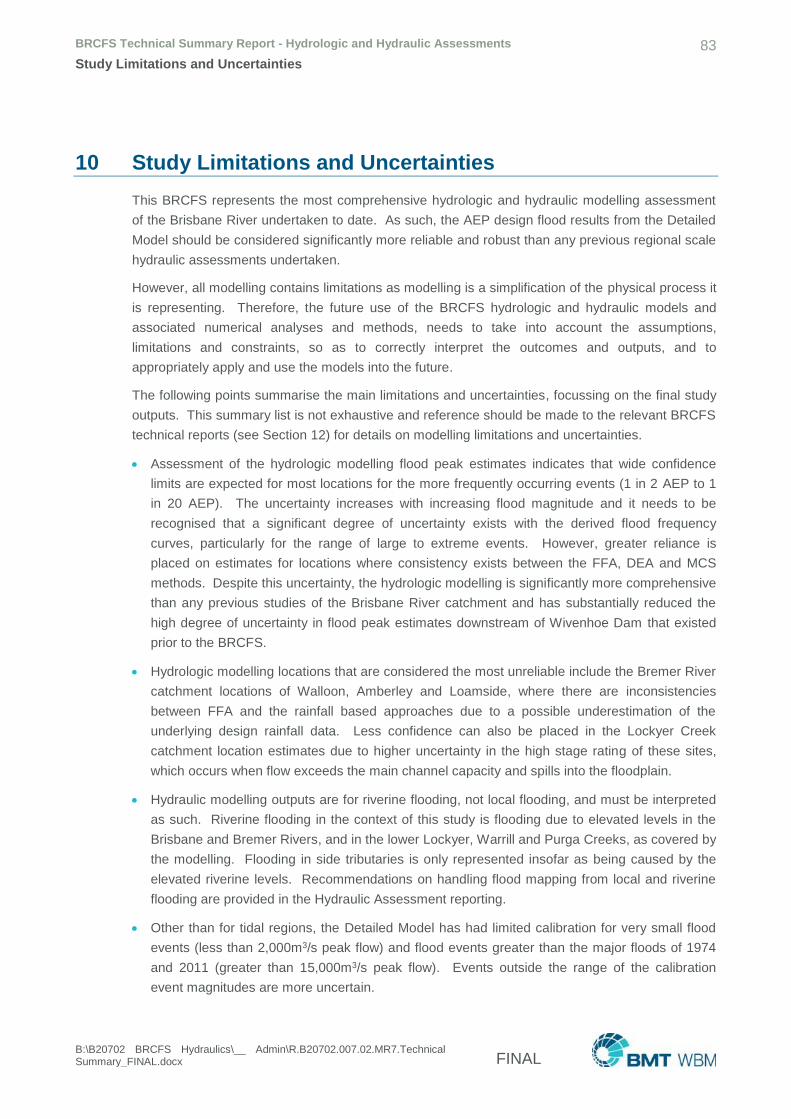
BRCFS Technical Summary Report - Hydrologic and Hydraulic Assessments 83
Study Limitations and Uncertainties
B:\B20702 BRCFS Hydraulics\__ Admin\R.B20702.007.02.MR7.Technical Summary_FINAL.docx FINAL
10 Study Limitations and Uncertainties
This BRCFS represents the most comprehensive hydrologic and hydraulic modelling assessment
of the Brisbane River undertaken to date. As such, the AEP design flood results from the Detailed
Model should be considered significantly more reliable and robust than any previous regional scale
hydraulic assessments undertaken.
However, all modelling contains limitations as modelling is a simplification of the physical process it
is representing. Therefore, the future use of the BRCFS hydrologic and hydraulic models and
associated numerical analyses and methods, needs to take into account the assumptions,
limitations and constraints, so as to correctly interpret the outcomes and outputs, and to
appropriately apply and use the models into the future.
The following points summarise the main limitations and uncertainties, focussing on the final study
outputs. This summary list is not exhaustive and reference should be made to the relevant BRCFS
technical reports (see Section 12) for details on modelling limitations and uncertainties.
Assessment of the hydrologic modelling flood peak estimates indicates that wide confidence
limits are expected for most locations for the more frequently occurring events (1 in 2 AEP to 1
in 20 AEP). The uncertainty increases with increasing flood magnitude and it needs to be
recognised that a significant degree of uncertainty exists with the derived flood frequency
curves, particularly for the range of large to extreme events. However, greater reliance is
placed on estimates for locations where consistency exists between the FFA, DEA and MCS
methods. Despite this uncertainty, the hydrologic modelling is significantly more comprehensive
than any previous studies of the Brisbane River catchment and has substantially reduced the
high degree of uncertainty in flood peak estimates downstream of Wivenhoe Dam that existed
prior to the BRCFS.
Hydrologic modelling locations that are considered the most unreliable include the Bremer River
catchment locations of Walloon, Amberley and Loamside, where there are inconsistencies
between FFA and the rainfall based approaches due to a possible underestimation of the
underlying design rainfall data. Less confidence can also be placed in the Lockyer Creek
catchment location estimates due to higher uncertainty in the high stage rating of these sites,
which occurs when flow exceeds the main channel capacity and spills into the floodplain.
Hydraulic modelling outputs are for riverine flooding, not local flooding, and must be interpreted
as such. Riverine flooding in the context of this study is flooding due to elevated levels in the
Brisbane and Bremer Rivers, and in the lower Lockyer, Warrill and Purga Creeks, as covered by
the modelling. Flooding in side tributaries is only represented insofar as being caused by the
elevated riverine levels. Recommendations on handling flood mapping from local and riverine
flooding are provided in the Hydraulic Assessment reporting.
Other than for tidal regions, the Detailed Model has had limited calibration for very small flood
events (less than 2,000m3/s peak flow) and flood events greater than the major floods of 1974
and 2011 (greater than 15,000m3/s peak flow). Events outside the range of the calibration
event magnitudes are more uncertain.

BRCFS Technical Summary Report - Hydrologic and Hydraulic Assessments 84
Study Limitations and Uncertainties
B:\B20702 BRCFS Hydraulics\__ Admin\R.B20702.007.02.MR7.Technical Summary_FINAL.docx FINAL
The derivation of design flood levels from the hydraulic models for each AEP was established
using the MCS statistical method at 28 locations (the Hydraulic Assessment Reporting
Locations) along the main rivers and creeks. Outside the area covered by these Reporting
Locations, the AEP level estimates may have less accuracy than AEP level estimates at
Reporting Locations.
The Detailed Model is designed for regional flood mapping, planning and development control,
and should only be used for modelling features that have a measureable influence on Brisbane
River riverine flooding. The model is not designed for assessing flood impacts from individual
property scale works. However, it is suitable for determining riverine AEP flood levels at the
property scale noting any limitations on the mapping.
The Detailed Model assumes that no backflow prevention devices are fitted to the stormwater
pipes or trunk drainage systems for the Base Case modelling. This will result in a conservative
(worst case) modelled riverine flood level and extent in those areas that are typically protected
by the backflow prevention devices.
To ensure continuing relevance and useability of the BRCFS models, future maintenance and
custodianship of the models should be managed by appropriate experienced professional(s). It is
understood that this matter is being addressed by the Queensland Government in conjunction with
the local governments, with DSITI as the data custodian.
Whilst the Hydraulic Assessment is a highly comprehensive detailed investigation, the models
represent a point in time and the current situation can change. Triggers for revisiting or reworking
will depend on the significance of change to the study outcomes which will need to be assessed
accordingly. Such triggers could include major flood events, improvements to design rainfalls,
increased certainty on the effects of climate change, significant advancements in modelling
techniques and major civil works such as large dams or extensive levee work.

BRCFS Technical Summary Report - Hydrologic and Hydraulic Assessments 85
Conclusions
B:\B20702 BRCFS Hydraulics\__ Admin\R.B20702.007.02.MR7.Technical Summary_FINAL.docx FINAL
11 Conclusions
The BRCFS Hydrologic and Hydraulic Assessments have conducted through a wide-ranging and
thorough approach using the latest proven and established techniques, innovation through the use
of the Monte Carlo Simulation (MCS) statistical method and modelling that has been subject to a
robust calibration to historical flood events of varying magnitude. By taking this wide-ranging and
thorough approach in scope, along with an exceptionally high level of technical review via the
Technical Working Group (TWG) and Independent Panel of Experts (IPE), the BRCFS is the most
complex and comprehensive flood study undertaken of the Brisbane River catchment and most
likely, undertaken in Australia to-date.
The key outcomes from the BRCFS Hydrologic and Hydraulic Assessments are:
Consolidated stream flow rating curves that are reconciled and endorsed by the hydraulic
modelling.
Calibrated hydrologic models for the purpose of deriving floods from design rainfall events and
which cover the entire Brisbane River Catchment providing flow hydrographs for input to the
hydraulic modelling.
A simplified Wivenhoe and Somerset Dam operations model integrated with the hydrologic
modelling.
A statistical framework for deriving design flood flow estimates using the MCS method with a
data set covering more than 230,000 statistically derived flood events across the entire
catchment.
The “Fast Model”, a hydraulic model that simulates a flood event in around 5 minutes, and
accurately reproduces the flood wave along the main waterways below Wivenhoe Dam.
The “Detailed Model”, a hydraulic model that uses world leading software and technology to
produce a high resolution, accurate reproduction of Brisbane River flood characteristics.
Successful calibration and verification of the hydrologic and hydraulic models to the historical
events of 1974, 1996, 1999, 2011, 2013 and tidal only conditions, using in each model a single
set of industry standard parameters for that model.
Statistical analysis of 11,340 statistically derived events using the Fast Model to derive interim
AEP peak flood levels at 28 locations below Wivenhoe Dam using the MCS method.
Selection of a set of 60 MC events from the 11,340 MC events that produce peak levels at the
28 locations that match the derived interim AEP flood levels. The 60 MC events form 11 AEP
ensembles ranging from the 1 in 2 to the 1 in 100,000 AEP. Each AEP is an ensemble of 4 to 7
MC events.
Simulation of the 60 MC events through the Detailed Model to produce high resolution maps of
peak flood levels, depths, velocities and hydraulic hazard (a measure used for evaluating the
flood risk). Other outputs include tables of peak levels and flows, and charts in a variety of
formats.
BRCFS Technical Summary Report - Hydrologic and Hydraulic Assessments 86
Conclusions
B:\B20702 BRCFS Hydraulics\__ Admin\R.B20702.007.02.MR7.Technical Summary_FINAL.docx FINAL
Sensitivity tests using the Detailed Model to provide indicative estimates on changes to flood
behaviour resulting from: (a) a hypothetical future floodplain development case; (b) climate
change; (c) Brisbane River bed level changes; and (d) the effect of major dams on historical
flood events.
The BRCFS is the most comprehensive, up-to-date and accurate assessment of Brisbane River
riverine flooding for AEPs ranging from 1 in 2 to 1 in 100,000. The latest available data was used
to develop hydrologic and hydraulic models, and these models were validated by calibrating and
verifying their results against well documented historical floods and tidal conditions. Industry
leading techniques were used to derive AEP design floods that take into account the complex
effects on flood behaviour caused by: variations in rainfall and antecedent catchment conditions;
Somerset and Wivenhoe Dams; ocean tidal conditions and joint probability of occurrence of
variables. The outcome is best practice hydrologic and hydraulic modelling that provides key
information and forms the basis for the BRCFMS and BRCSFMP.
However, as with all modelling, the modelling accuracy is subject to sources of uncertainty and
limitations as documented in the technical reports. Importantly, an accurate understanding and
appreciation of the hydrologic and hydraulic processes and of the modelling methodology and
assumptions is essential to correctly interpret and apply the outcomes of the BRCFS.
BRCFS Technical Summary Report - Hydrologic and Hydraulic Assessments 87
References
B:\B20702 BRCFS Hydraulics\__ Admin\R.B20702.007.02.MR7.Technical Summary_FINAL.docx FINAL
12 References
12.1 BRCFS Technical Report References
Aurecon et. al. (2015) – BRCFS Hydrologic Assessment Technical Reports
Hydrologic Milestone Report 1: Data, Rating Curve and Historical Review Report, May 2015.
Hydrologic Milestone Report 2: Hydrologic Model Calibration and Validation Review Report,
May 2015.
Hydrologic Milestone Report 3: Hydrologic Model Recalibration Report, May 2015.
Hydrologic Milestone Report 4: Assessment of Implications of Climate Change on Flood
Estimation, May 2015.
Hydrologic Milestone Report 5: Dam Operations Module Implementation Report, May 2015.
Hydrologic Milestone Report 6: Flood Frequency Analysis Report, May 2015.
Hydrologic Milestone Report 7: Design Event Approach Report, May 2015.
Hydrologic Milestone Report 8: Monte Carlo Simulation Report, May 2015.
Hydrologic Milestone Report 9: Reconciled and Recommended Flood Frequency Estimates
Report, May 2015.
Hydrologic Milestone Report 10: Draft Final Hydrology Report, May 2015.
Hydrologic Milestone Report 11: Final Hydrology Handover Report, May 2015.
BMT WBM (2016) – BRCFS Hydraulic Assessment Technical Reports
Hydraulic Milestone Report 1: Data Review and Modelling Methodology, Draft Final, October
2014.
Hydraulic Milestone Report 2: Fast Model Development and Calibration, Draft Final, April
2015.
Hydraulic Milestone Report 3: Detailed Model Development and Calibration, Draft Final,
September 2015.
Hydraulic Milestone Report 4: Fast Model Results and Design Events Selection, Draft Final,
August 2016.
Hydraulic Milestone Report 5: Detailed Model Results, Draft Final, October 2016.
Hydraulic Milestone Report 6: Hydraulics Report, Draft Final, December 2016.
BRCFS Technical Summary Report - Hydrologic and Hydraulic Assessments 88
References
B:\B20702 BRCFS Hydraulics\__ Admin\R.B20702.007.02.MR7.Technical Summary_FINAL.docx FINAL
12.2 General References
Aurecon (2013), Collection, Collation, Review and Storage of Existing Data – FINAL, Brisbane
River Catchment Flood Study, Aurecon, Royal Haskoning DHV, Hydrobiology, Deltares, Don
Carroll PM, April 2013.
Aurecon et. al. (2015b): H&H Interface Quality Control Report Stage 3 – With Additional
Comparisons
BCC (2014a), Brisbane River Catchment Flood Study Digital Terrain Model Development and Bed
Level Sensitivity Analysis Final Report, Prepared for Department of State Development
Infrastructure and Planning by Flood Management Unit, City Projects Office, Brisbane
Infrastructure Division, Brisbane City Council, 19 June 2014.
BCC (2014b), Brisbane River Catchment Disaster Management Tool Model Development and
Calibration Outcomes Final Report, Prepared for Department of State Development Infrastructure
and Planning by Flood Management Unit, City Projects Office, Brisbane Infrastructure Division,
Brisbane City Council, 19 June 2014.
BoM (2003), Guidebook to the Estimation of Probable Maximum Precipitation: Generalised Short
Duration Method, Bureau of Meteorology, November 2003.
BoM (2003), The Estimation of Probable Maximum Precipitation in Australia: Generalised Short-
Duration Method, Bureau of Meteorology, Melbourne, Australia, June 2003, (39pp).
BoM (2016), 2016 Rainfall IFD System, http://www.bom.gov.au/water/designRainfalls/revised-
ifd/?year=2016.
Carroll, D.G. (2012a), URBS (Unified River Basin Simulator) V 5.00 December 2012.
Carroll, D.G. (2012b), URBS Monte Carlo Modelling Training Notes.
DEWS (2014), Wivenhoe and Somerset Dam Optimisation Study Report, DEWS, Brisbane, March
2014.
DPI (1994), Brisbane River and Pine River Flood Study, Prepared for South East Queensland
Water Board by Qld Department of Primary Industries (DPI), 1994.
DILGP (2014), Invitation to Offer No. DILGP-2327-14 - For the provision of a Comprehensive
Hydraulic Assessment as part of the Brisbane River Catchment Flood Study, Version 005, State of
Queensland, 14 February 2014.
DSDIP (2013), Invitation to Offer No. DSDIP-2077-13, for the provision of a comprehensive
hydrologic assessment as part of the Brisbane River Catchment Flood Study, Version 005, DSDIP,
Brisbane, July 2013.
Engineers Australia (1987), Australian Rainfall and Runoff, A Guide to Flood Estimation, Volume
2, Engineers Australia, Barton ACT, 1987.
Engineers Australia (2003), Australian Rainfall and Runoff, A Guide to Flood Estimation, Book 6,
Engineers Australia, Barton ACT, 2003.
BRCFS Technical Summary Report - Hydrologic and Hydraulic Assessments 89
References
B:\B20702 BRCFS Hydraulics\__ Admin\R.B20702.007.02.MR7.Technical Summary_FINAL.docx FINAL
GHD (2014), Coastal Plan Implementation Study Draft Report, Prepared for Brisbane City Council
by GHD, September 2014.
Hargraves (2005), Final Report Extreme Rainfall Estimation Project, Resource Sciences Centre,
Brisbane 2005.
Jacobs (2014), Additional Stochastic Space-Time Rainfall Replicates for Brisbane River
Catchment, Prepared for Aurecon, SKM Melbourne, May 2014.
Nathan, R.J., Weinmann, P.E. and Hill, P.I. (2002), Use Of A Monte Carlo Framework To
Characterise Hydrological Risk, ANCOLD Bulletin - Issue No. 122, 55-64.
Nathan RJ and Weinmann, PE (2013), Monte Carlo Simulation Techniques. Australian Rainfall
and Runoff Discussion Paper, Report D2. Engineers Australia, 41pp.
Port of Brisbane (PoB), (2014), Hydrographic survey of the Lower Brisbane and Bremer Rivers
QFCOI (2012), Queensland Floods Commission of Inquiry, Final Report, QFCOI, Brisbane, March
2012.
Seqwater (2013a), Manual of Operation Procedures for Flood Mitigation at Wivenhoe Dam and
Somerset Dam, Revision 11, November 2013.
Seqwater (2013b), Brisbane River Flood Hydrology Models, Main Report, Seqwater, December
2013.
SKM (1998), Brisbane River Flood Study, Final Report, for Brisbane City Council, June 1998.
SKM (2013), Brisbane River Catchment Dams and Operational Alternatives Study, October 2013.
Werner, M., Schellekens, J., Gijbers, P., van Dijk, M., van den Akker, O., Heynert, K. (2013),
The Delft-FEWS flow forecasting system. In: Environmental Modelling & Soft-ware, Vol. 40, pp. 65-
77. - ISSN 1364-8152
World Meteorological Organization (2009), Manual for Estimation of Probable Maximum
Precipitation, 3rd edition, WMO - No. 1045, Geneva.

BRCFS Technical Summary Report - Hydrologic and Hydraulic Assessments A-1
IPE Endorsement
B:\B20702 BRCFS Hydraulics\__ Admin\R.B20702.007.02.MR7.Technical Summary_FINAL.docx FINAL
Appendix A IPE Endorsement
Independent Panel of Experts for the Brisbane River Catchment Flood Study
Review of the BRCFS Technical Summary Report (MR7 Report)
Introduction The MR7 report by BMT-WBM and Aurecon Consortium summarises the work carried out in the hydrology and hydraulics phases of the Brisbane River Catchment Flood Study (BRCFS). The outputs of the hydrology phase were presented in ten reports labelled MR1 to MR10. Each aspect of this work was reviewed by a three-member team that formed the Independent Panel of Experts (IPE). Similarly the outputs of the hydraulics phase, consisting of reports MR1 to MR6, were reviewed by a three-member Independent Panel of Experts. Two members of the IPE were common to each phase. The IPE terms of reference were not to just review the completed work but to also provide independent technical advice to the project.
During each phase of the project the IPE have attended a series of workshops where approaches were outlined, interim findings presented and final results discussed. The IPE have also reviewed the technical aspects of each draft report and, while this is not a core part of the IPE terms of reference, some feedback has been provided on editorial and presentational aspects.
This review of the MR7 report first addresses the question if the approaches adopted in the hydrologic and hydraulic assessments, as summarised in the report, have been appropriate and sufficient to address the BRCFS objectives. It then discusses the results obtained and any limitations and qualifications that need to be kept in mind when applying the study outputs. The review also comments on whether the MR7 report is appropriately targeted at the intended audience and clear in its reporting of methods, results and guidance on the use of the study outputs.
Overall study approach As clearly outlined in the report, for the BRCFS to achieve its objectives, the hydrologic and hydraulic assessments had to be in depth, and they required the development and application of state-of-the-art analytical and modelling methods to deal adequately with the complexity and variability of flooding in the Brisbane River catchment.
Flooding on the Brisbane River catchment is particularly complex because:
large floods can be generated by a range of different storm mechanisms that produce very different rainfall distributions and types of floods
Wivenhoe and Somerset dams play a significant flood mitigation role and their construction and operation has altered the natural flooding regime
there are complex interactions between flooding in the Brisbane River and its lower tributaries much of the Brisbane River is deeply incised and hydraulically quite steep with unusually high
velocities and little over bank storage significant natural flood storage areas are present in the Lockyer Creek, Bremer River and
lower Brisbane River tributaries.
To adequately deal with these requirements and complexities, the selected overall study approach had to involve the following key steps, and their documentation in the MR7 report is as indicated in italics:
1. Developing a clear understanding of the special features of the Brisbane River catchment and the key factors influencing flooding – Chapter 2 Brisbane River Catchment.
1
2
2. Collation and quality control of all relevant flood data and related information –Chapter 4 Data Collection and Collation, with additional material on checking of rating curves in Sections 5.7 and 7.5.
3. Developing and calibrating hydrologic models to represent the response of the different Brisbane River sub-catchments to heavy rainfalls and the flood mitigation impacts of dams – Sections 5.2 Types and Objectives of Catchment Modelling, and 5.4 Calibration to Historical Events.
4. Applying traditional analytical and modelling methods to derive hydrologic design flood estimates – Sections 5.5.3 Design Event Approach and 5.5.4 Flood Frequency Analysis.
5. Developing and applying a hydrologic modelling framework that more fully captures the range variability of contributing factors beyond what is directly reflected in the flood observations – Section 5.5.5 Monte Carlo Simulation.
6. Combining estimates from a range of hydrologic design flood estimation methods to make maximum use of all the relevant data/information, applying a systematic reconciliation approach to resolve potential discrepancies between results from different methods – Section 5.6 Design Peak Flow Assessments – With and No Dams.
7. Integrating the hydrologic and hydraulic modelling phases by carrying the Monte Carlo simulation through to the hydraulic modelling – Section 5.8 Hydrologic and Hydraulic Model Interfacing.
8. Selecting appropriate hydraulic modelling systems for the different study phases (UDMT, Fast Model and Detailed Model) – Section 6.2 Types and Objectives of Hydraulic Models.
9. Calibrating the Fast Model and the Detailed Model to ensure that they provide a realistic representation of the floodplain hydraulics of the Brisbane River and its lower tributaries– Section 6.3 Calibration to Historical Events.
10. Analysing the numerous Monte Carlo Simulation outputs and condensing them to a representative set of event ensembles for running through the Detailed Hydraulic Model – Sections 6.4 and 6.5 Design Event Ensembles.
11. Running the Design Event Ensembles through the Detailed Hydraulic Model to derive the required study outputs: peak design flood levels at key locations and maps of flood levels, flood depths, flood extents, flood velocities and hydraulic hazard – Chapter 7 Design Riverine Flood Results.
12. Analysing and clearly documenting the sensitivity of study results to hypothetical changes in the catchment that may occur due to direct human interference, geomorphic or climatic processes. – Chapter 8 Sensitivity Analysis.
The IPE considers that this overall study approach has been well matched to the requirements of the BRCFS and, within the constraints of the information currently available, has been able to deal appropriately with the complexities of the flooding situation in the Brisbane River catchment.
The MR7 report can only provide a brief summary of the methods adopted in each step of the overall approach and the extensive work involved; more detailed documentation has been provided in the milestone reports prepared progressively during the conduct of the hydrologic and hydraulic assessments. The IPE also notes that a number of the steps involved significant development and testing of novel methods.

3
Limitations and qualifications In earlier review reports on the Hydrologic Assessment the IPE has raised a number of issues that required clarification as part of the Hydraulic Assessment. The following comments indicate to what extent the IPE considers these issues as having been resolved by subsequent work:
1. Bremer River tributaries: o Uncertainty in rating curves for gauges on Bremer River and tributaries (backwater
effects during larger floods):
Rating curve reviews based on all information including the Detailed Model results indicated that the rating curves at these locations are reasonable for flows up to the largest available for calibration. However, for larger flow hysteresis occurs and the effects vary depending on the nature of each flood event.
o Unresolved discrepancies in reconciliation process, probably due to underestimation of the design rainfalls used in the DEA and MCS methods:
Anticipated new information on design rainfalls is not available at the time of this report.
2. Lockyer Creek: o Uncertainty in rating curves for flood events affected by backwater from Wivenhoe
releases:
The hydraulic modelling has shown that there are no significant hysteresis effects, even for extreme events, but the accuracy of the rating curve is uncertain for flows that extend on to the floodplain.
o Lack of survey info on creek bathymetry:
The in-bank topography at the gauge site remains uncertain since it is based on LiDAR.
3. Lower Brisbane River o Uncertainty in rating curves due to flood storage areas and backwater effects:
Review of rating curves on the Lower Brisbane River at Savages Crossing, Mt Crosby Weir, and Moggill showed good matching between the rating curves derived from the hydrology studies and the rising limbs of the stage-discharge relationships from the Detailed Model. Revision or refinement of the associated Hydrologic Assessment work is not considered warranted.
As stated in the last para, p 47, Section 5.7.1 " Hydrologic model and flood frequency results were also compared to ensure as much as possible consistency between the gauge ratings along the river. The resultant ratings are therefore consistent with the current hydrologic modelling, but it is important to recognise that the only independent point of truthing in the high flow ratings is the flow gauging undertaken at Centenary Bridge.
o Uncertainty in the amount of extra storage used in URBS to represent the floodplain of the Lower Brisbane River reaches (particularly for very large events):
This has been resolved as the upstream inputs from URBS have been routed through the hydraulic models (rather than through URBS).
[The operational URBS model used by Seqwater may need adjustment based on hydraulic modelling results.]
It is also clear that some results are affected by sources of uncertainty related to the complex flood hydrology and hydraulics of the Brisbane River catchment and the relatively short flood history, which
4
particularly affect the flood estimates for rare to extreme events. Reducing these uncertainties remains a task for future research, based on the availability of additional rainfall and flood data for the Brisbane River catchment.
The IPE recognises that resolution of the following issues is clearly outside the scope of this study:
Lockyer Creek flooding upstream of backwater influence from Brisbane River Local creek flooding in Lower Brisbane River area and upper parts of Bremer River tributaries
Throughout all of the hydraulics phase of BRCFS, the IPE was kept fully informed on the details of the hydraulic modelling and of its application. Any suggestion made by the IPE for minor improvement or revision was acted on satisfactorily. Each of the individual Final reports, MR1-MR6 was reviewed closely by the IPE and was endorsed by it.
The Future of the BRCFS Because of Australia's relatively short flood record each new large flood event on a large catchment will lead to increased understanding of flood behaviour. Despite this limitation the BRCFS is expected to be a reliable basis for flood planning for a considerable period of time. The techniques adopted are leading edge and are consistent with best practice recommended in Australian Rainfall and Runoff 2016. More importantly the studies have made best use of all available data and demonstrated that the techniques adopted reproduce at site flood frequency analysis. When an approach can be validated against observed floods and at site flood frequency analysis at multiple sites it demonstrates that the modelling approach is robust and reproducing the key processes. This also removes the need to update the modelling for recent minor changes to design rainfall released by the Bureau of Meteorology in late November 2016.
Conclusions The BRCFS has been carried out in two phases; the hydrology phase and the hydraulics phase. Throughout each phase the relevant IPE has been kept fully informed on the details of the methodologies of the developing study and on the results being generated. This has been achieved through the IPE participation in all of the Workshops where discussions of the methodologies and results took place and through detailed review of each of the ten reports MR1-MR10 produced during the hydrology phase and of each of the six reports MR1-MR6 produced during the hydraulics phase.
Any recommendations and suggestions for minor improvements/changes made by the IPE were taken into account in the production of each final report. Each of the individual Final reports, hydrology MR1-MR10 and hydraulics MR1-MR6 was reviewed closely by the relevant IPE and was endorsed by it.
The techniques adopted in the BRCFS are leading edge and are consistent with best practice recommended in Australian Rainfall and Runoff 2016. More importantly the studies have made best use of all available data and demonstrated that the techniques adopted reproduce at site flood frequency analysis. The BRCFS is expected to be a reliable basis for flood planning in the Brisbane River catchment for a considerable period of time ahead.

5
17 November 2016 Hydrology IPE
Erwin Weinmann (Chair) Prof Colin Apelt OAM Mark Babister Independent Consultant Emeritus Prof UQ
UniQuest Pty Ltd Managing Director WMAWater
Hydraulics IPE
Mark Babister (Chair) Prof Colin Apelt OAM Dr John Macintosh
Managing Director WMAWater
Emeritus Prof UQ UniQuest Pty Ltd
Director Water Solutions
BRCFS Technical Summary Report - Hydrologic and Hydraulic Assessments B-1BRCFS – List of Committees
B:\B20702 BRCFS Hydraulics\__ Admin\R.B20702.007.02.MR7.Technical Summary_FINAL.docx FINAL
Appendix B BRCFS – List of Committees
Independent Panel of Experts
Hydrologic Assessment
Erwin Weinmann (Chair)
Mark Babister
Emeritus Professor Colin Apelt OAM
Hydraulic Assessment
Mark Babister (Chair)
Emeritus Professor Colin Apelt OAM
Dr John Macintosh
Technical Working Group
BCC
Evan Caswell
James Charalambous
Ouswatta Perera
BoM
Chris MacGeorge (to Oct 2016)
Paul Birch (from Oct 2016)
DEWS
Russell Cuerel
DSITI
John Ruffini
ICC
Tony Dileo (to Jul 2014)
Hoy Sung Yau
LVRC
Quentin Underwood
Seqwater
Terry Malone (to Nov 2014)
Lindsay Millard
Michel Raymond
SRC
Tony Jacobs
Steering Committee
BCC
Mark Tinnion (BCC) (from June 2015)
Saul Martinez (BCC) (from July 2015)
Ellen Davidge (BCC) (to June 2015)
DNRM
Lyall Hinrichsen (Chair, Steering Committee)
Leanne Barbeler (from Sept 2015)
Mandy Downes (from Sept 2016)
DEHP
John Lane (from Sept 2015)
DEWS
Richard Priman
DILGP
Susan M Nightingale (DILGP) (from April
2016)
Dean Misso (DILGP) (to August 2013)
Mark Saunders (DILGP) (to April 2016)
Lynn Sawtell (DILGP) (to June 2015)
DSITI
John Ruffini
ICC
Bryce Hines (from June 2014)
Tony Dileo (to June 2014)
Nick Vass-Bowen (to June 2014)
LVRC
Quentin Underwood
QRA
Graeme Milligan (from June 2016)
Seqwater
Rob Drury
SRC
Tony Jacobs
Project Team
DNRM
Saji Joseph
Dr Pushpa Onta
Dr Wai-Tong Wong
DILGP
Con de Groot (to May 2016)
Dr Roger Brewster (to June 2016)
QRA
Dr Roger Brewster (from July 2016)
Greg Scroope (from June 2016)
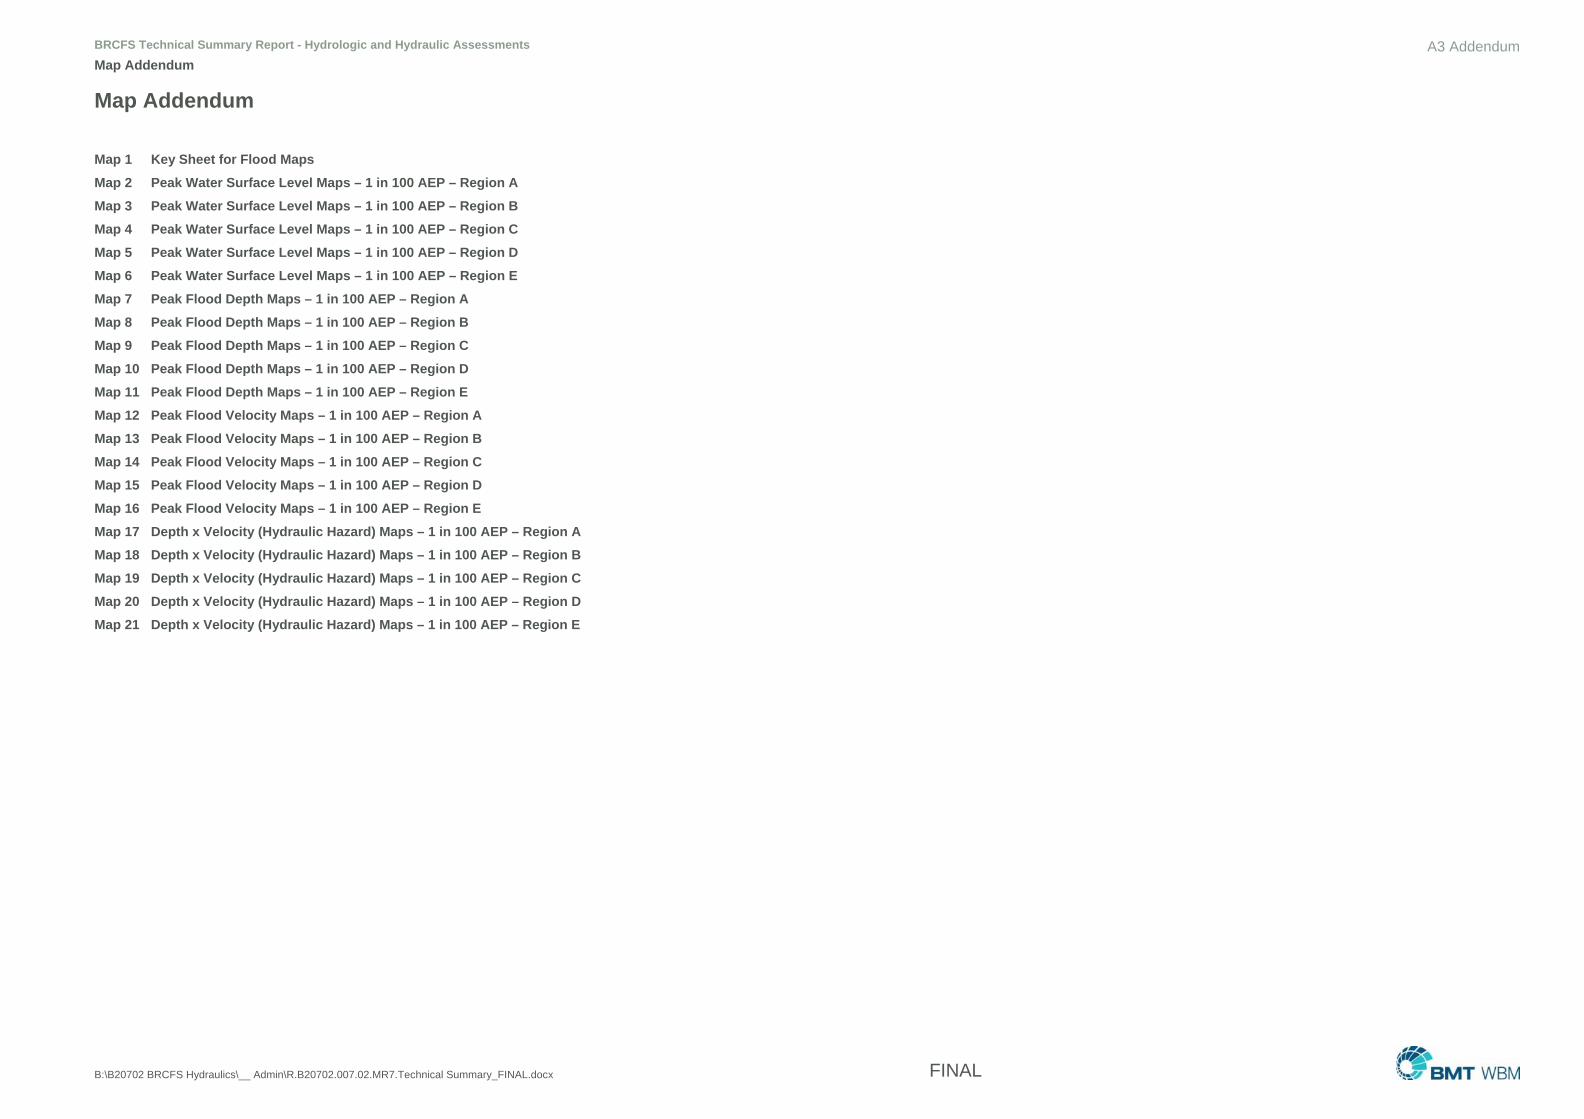
BRCFS Technical Summary Report - Hydrologic and Hydraulic Assessments A3 AddendumMap Addendum
B:\B20702 BRCFS Hydraulics\__ Admin\R.B20702.007.02.MR7.Technical Summary_FINAL.docx FINAL
Map Addendum
Map 1 Key Sheet for Flood Maps
Map 2 Peak Water Surface Level Maps – 1 in 100 AEP – Region A
Map 3 Peak Water Surface Level Maps – 1 in 100 AEP – Region B
Map 4 Peak Water Surface Level Maps – 1 in 100 AEP – Region C
Map 5 Peak Water Surface Level Maps – 1 in 100 AEP – Region D
Map 6 Peak Water Surface Level Maps – 1 in 100 AEP – Region E
Map 7 Peak Flood Depth Maps – 1 in 100 AEP – Region A
Map 8 Peak Flood Depth Maps – 1 in 100 AEP – Region B
Map 9 Peak Flood Depth Maps – 1 in 100 AEP – Region C
Map 10 Peak Flood Depth Maps – 1 in 100 AEP – Region D
Map 11 Peak Flood Depth Maps – 1 in 100 AEP – Region E
Map 12 Peak Flood Velocity Maps – 1 in 100 AEP – Region A
Map 13 Peak Flood Velocity Maps – 1 in 100 AEP – Region B
Map 14 Peak Flood Velocity Maps – 1 in 100 AEP – Region C
Map 15 Peak Flood Velocity Maps – 1 in 100 AEP – Region D
Map 16 Peak Flood Velocity Maps – 1 in 100 AEP – Region E
Map 17 Depth x Velocity (Hydraulic Hazard) Maps – 1 in 100 AEP – Region A
Map 18 Depth x Velocity (Hydraulic Hazard) Maps – 1 in 100 AEP – Region B
Map 19 Depth x Velocity (Hydraulic Hazard) Maps – 1 in 100 AEP – Region C
Map 20 Depth x Velocity (Hydraulic Hazard) Maps – 1 in 100 AEP – Region D
Map 21 Depth x Velocity (Hydraulic Hazard) Maps – 1 in 100 AEP – Region E
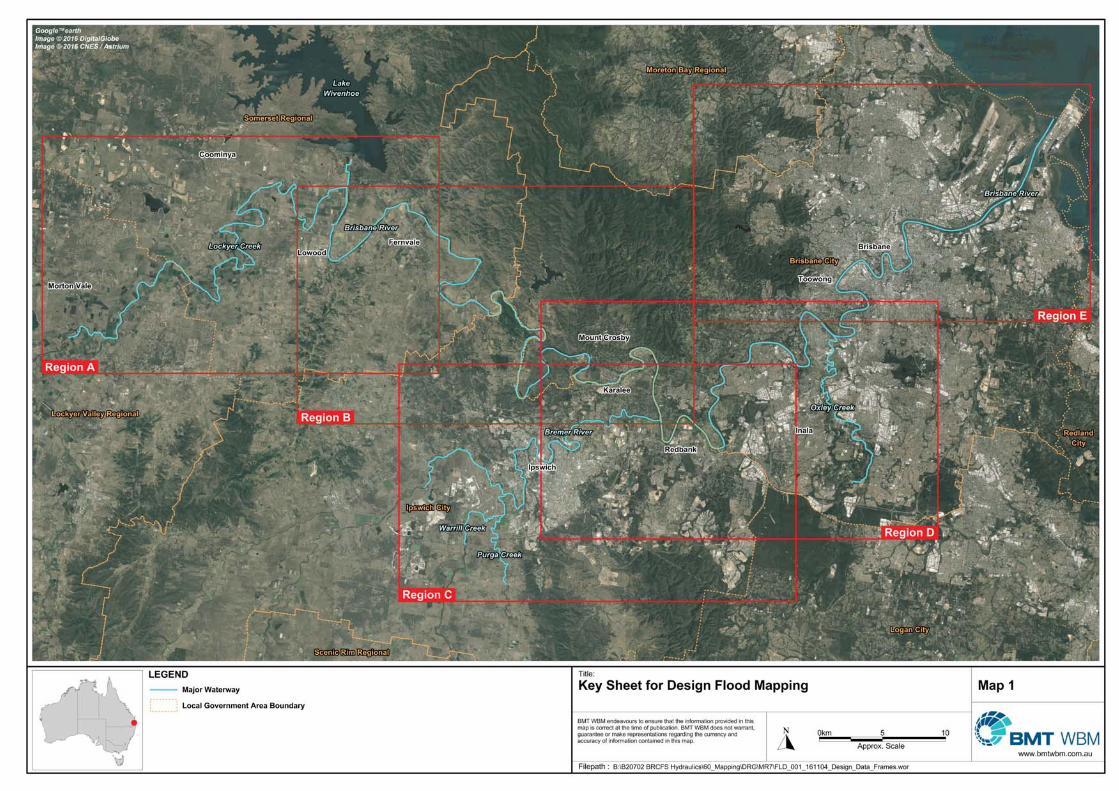
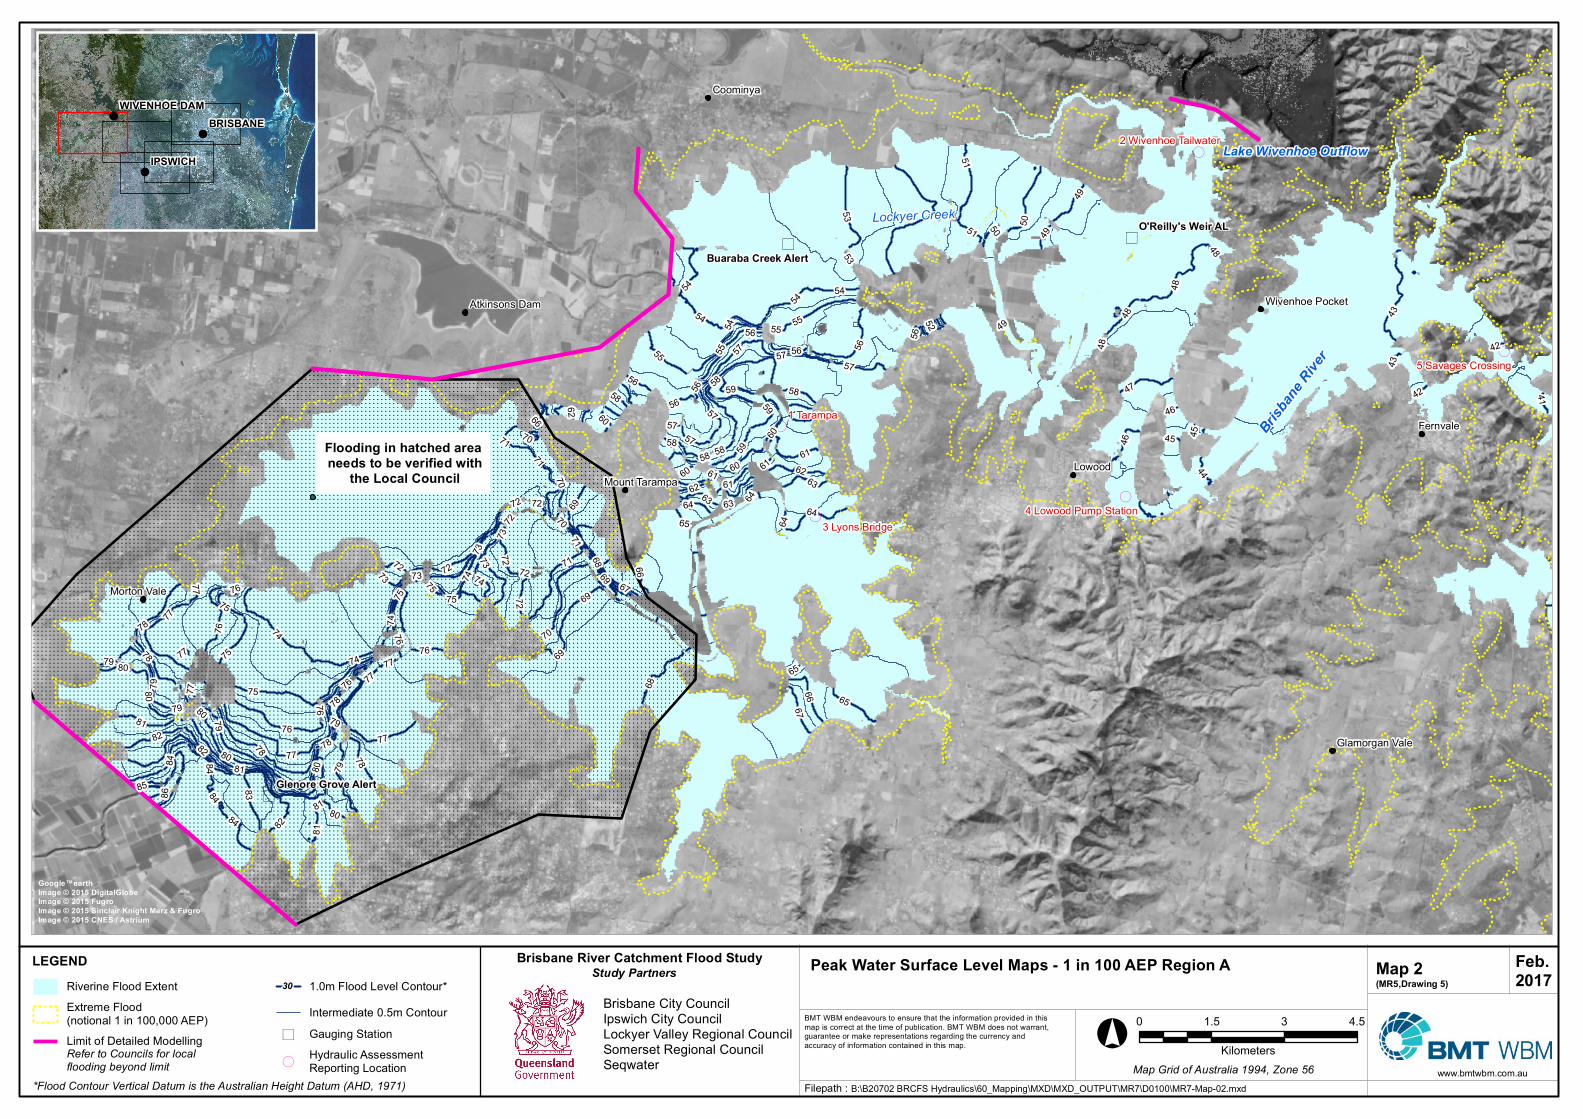
www.bmtwbm.com.au
Peak Water Surface Level Maps - 1 in 100 AEP Reg io n A Map 2(MR5,Drawin g 5)
BMT WBM endeavours to ensure that the information provided in thismap is correct at the time of publication. BMT WBM does not warrant,guarantee or make representations regarding the currency andaccuracy of information contained in this map.
Filepath :
LEGEND
)
)
)
(
(
(
(
(
Lockyer Creek
Brisban
e Rive
r
Lake Wivenhoe Outflow
1 Tarampa
3 Lyons Bridge
5 Savages Crossing
2 Wivenhoe Tailwater
4 Lowood Pump Station
O'Reilly's Weir AL
Buaraba Creek Alert
Glen o re Gro ve Alert
Flo o din g in h atch ed area n eeds to be verified with
th e Lo cal Co un cil Lowood
Fernvale
Coominya
Morton Vale
Mount Tarampa
Atkinsons Dam
Glamorgan Vale
Wivenhoe Pocket
81
83
808479
52
77
7882
72
76
48
70
75
43
71
5355 57
74
56
50
73
5169
68
58
54
62
47
66 6567
49
63
59 6160
64
46
44
85
86
41
45
42
51
80
60
58
79
71
72
60
59
64
66
57
80
82
63
67
57
70
77
63
69
65
70
73
72
73
58
75
73
76
80
81
59
77
57
7854
75
76
69
53
79
76
74
56
78
76
50 49
79
56
48
62
57
78
58
66
64
78
57
58
56
7977
80
74
697272
48
77
75
5581
43
64
74
62
75
72
84
56
45
46
54
61
81
74
4955
76
71
54
76
7980
73
61
42
78
61
48
75
54
70
56
84
77
56
60
55
58
68
82
77
84
72
72
71
77
65
B:\B20702 BRCFS Hydraulics\60_Mapping\MXD\MXD_OUTPUT\MR7\D0100\MR7-Map-02.mxd
Brisban e River Catch m en t Flo o d Study
Brisbane City CouncilIpswich City CouncilLockyer Valley Regional CouncilSomerset Regional CouncilSeqwater
Go o g le™earthIm ag e © 2015 Dig italGlo beIm ag e © 2015 Fug roIm ag e © 2015 Sin clair Kn ig h t Merz & Fug roIm ag e © 2015 CNES / Astrium
Riverine Flood ExtentExtreme Flood(notional 1 in 100,000 AEP)Limit of Detailed Modelling
1.0m Flood Level Contour*Intermediate 0.5m Contour
) Gauging Station
(Hydraulic AssessmentReporting Location
Study Partners
Refer to Councils for localflooding beyond limit
Feb.2017
!
!
!
IPSWICH
BRISBANEWIV ENHOE DAM
°0 1.5 3 4.5
KilometersMap Grid of Australia 1994, Zone 56
*Flood Contour Vertical Datum is the Australian Height Datum (AHD, 1971)
30
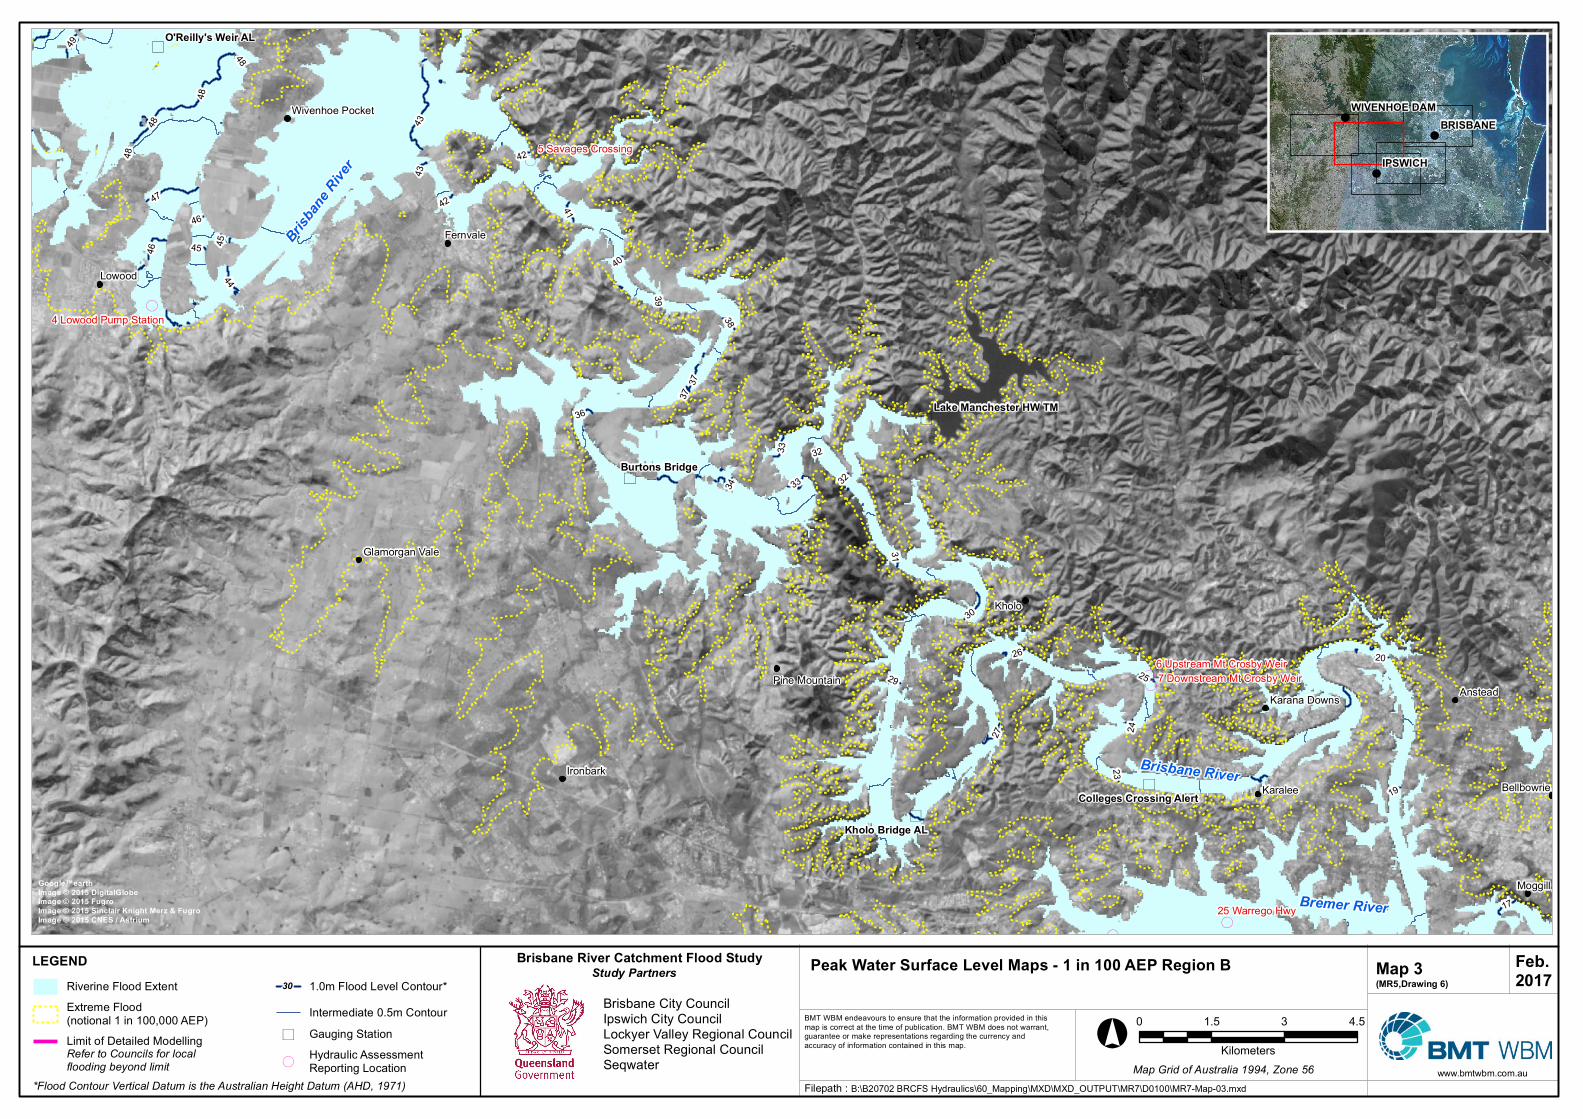
www.bmtwbm.com.au
Pe ak Wate r Surfac e Le ve l Maps - 1 in 100 AEP R e gion B Map 3(MR 5,Drawing 6)
BMT WBM endeavours to ensure that the information provided in thismap is correct at the time of publication. BMT WBM does not warrant,guarantee or make representations regarding the currency andaccuracy of information contained in this map.
Filepath :
LEGEND
)
)
)
)
)
(
(
((
(((
(
Brisban
e Rive
r
Bremer River
Brisbane River
25 Warrego Hwy
5 Savages Crossing
4 Lowood Pump Station
6 Upstream Mt Crosby Weir7 Downstream Mt Crosby Weir
Burtons Brid ge
Kh olo Brid ge AL
O'R e illy's We ir AL
Lak e Manc h e ste r HW TM
Colle ge s Crossing Ale rt
Kholo
Lowood
Karalee
Anstead
Moggill
Ironbark
Fernvale
Bellbowrie
Karana DownsPine Mountain
Glamorgan Vale
Wivenhoe Pocket
48
43
47
30
37
46
44
27
33
17
41
45
36
25
42
38
49
31
2026
19
29
24
34 32
40
23
39
48
33
48
46
37
45
48 42
43
32
B:\B20702 BRCFS Hydraulics\60_Mapping\MXD\MXD_OUTPUT\MR7\D0100\MR7-Map-03.mxd
Brisbane R ive r Catc h m e nt Flood Stud y
Brisbane City CouncilIpswich City CouncilLockyer Valley Regional CouncilSomerset Regional CouncilSeqwater
Google ™e arthIm age © 2015 DigitalGlobeIm age © 2015 FugroIm age © 2015 Sinc lair Knigh t Me rz & FugroIm age © 2015 CNES / Astrium
Riverine Flood ExtentExtreme Flood(notional 1 in 100,000 AEP)Limit of Detailed Modelling
1.0m Flood Level Contour*Intermediate 0.5m Contour
) Gauging Station
(Hydraulic AssessmentReporting Location
Study Partners
Refer to Councils for localflooding beyond limit
Fe b.2017
!
!
!
IPSWICH
BR ISBANEWIVENHOE DAM
°0 1.5 3 4.5
KilometersMap Grid of Australia 1994, Zone 56
*Flood Contour Vertical Datum is the Australian Height Datum (AHD, 1971)
30
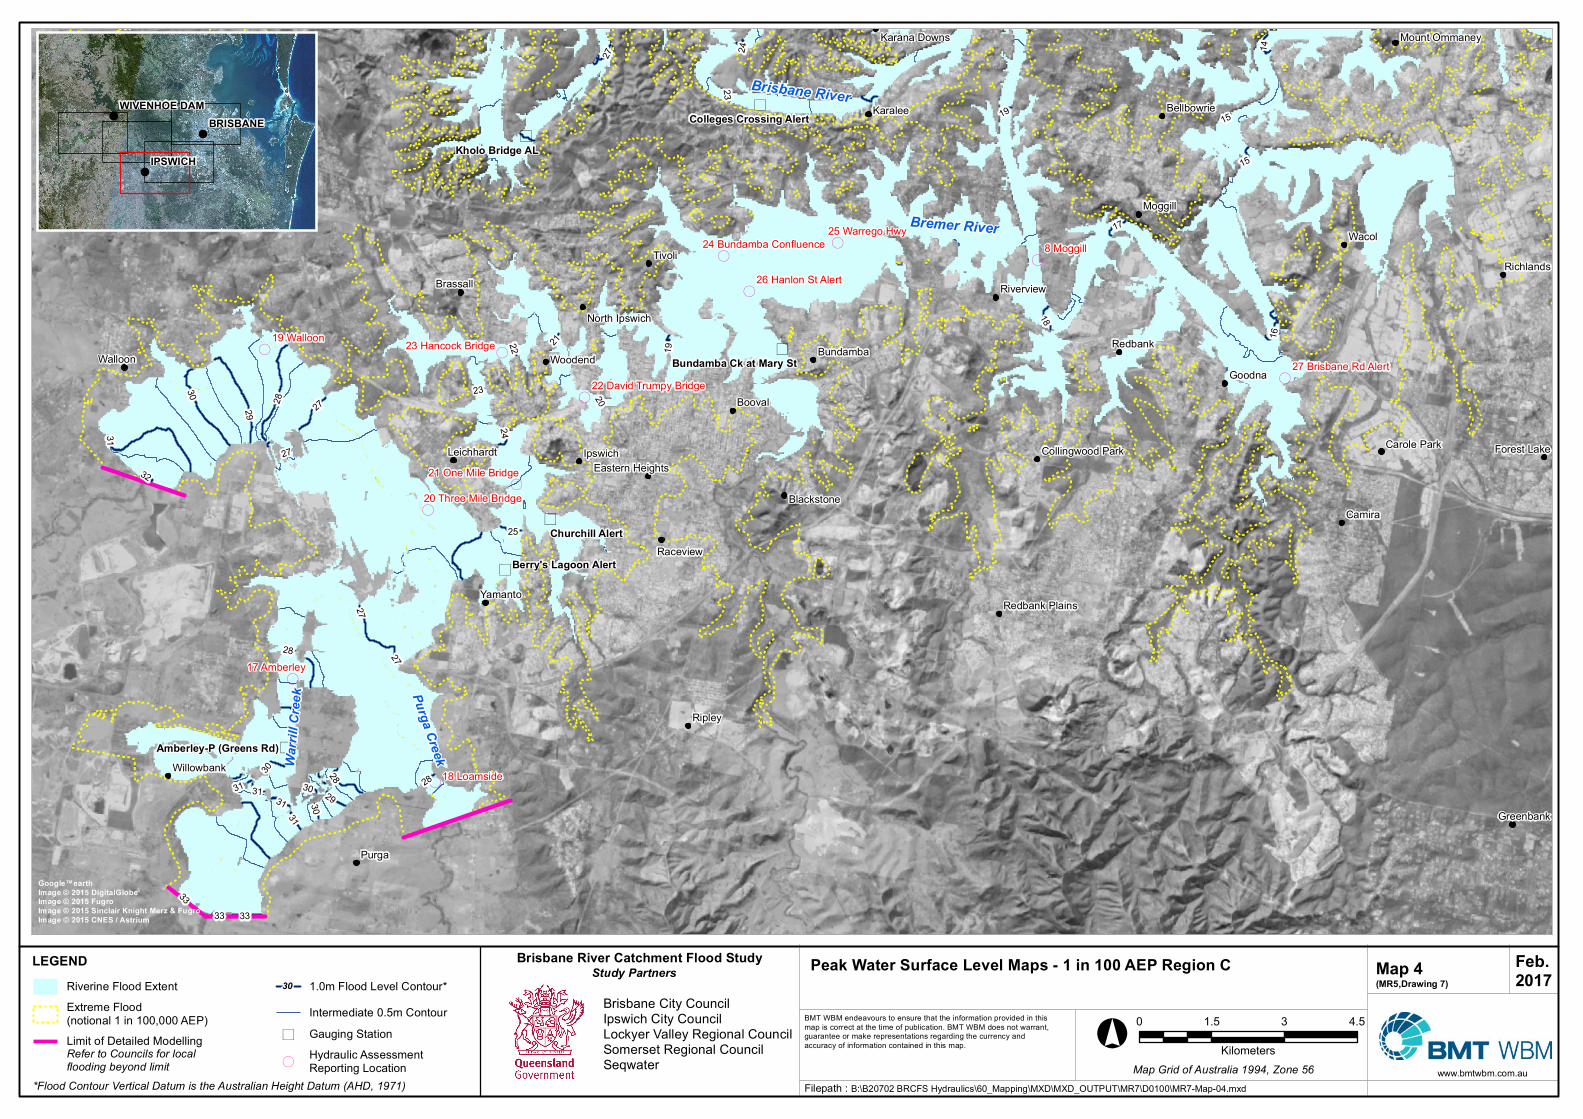
www.bmtwbm.com.au
Pe ak Wate r S urface Le ve l Maps - 1 in 100 AEP Re g ion C Map 4(MR5,Draw in g 7)
BMT WBM endeavours to ensure that the information provided in thismap is correct at the time of publication. BMT WBM does not warrant,guarantee or make representations regarding the currency andaccuracy of information contained in this map.
Filepath :
LEGEND
)
)
)
)
)
)
((
(
(
(
(
(
(
(
(
((
(
(
Bremer River
Warri
ll Cree
k Purga Creek
Brisbane River
8 Moggill
19 Walloon
18 Loamside
17 Amberley
25 Warrego Hwy
23 Hancock Bridge
26 Hanlon St Alert
21 One Mile Bridge
27 Brisbane Rd Alert
20 Three Mile Bridge
24 Bundamba Confluence
22 David Trumpy Bridge
Kholo Bridg e AL
Churchill Ale rt
Be rry's Lag oon Ale rt
Am be rle y-P (Gre e n s Rd)
Bun dam ba Ck at Mary S t
Colle g e s Crossin g Ale rt
Purga
WacolTivoli
Ripley
Camira
Goodna
Booval
Woodend
Yamanto
Karalee
RedbankWalloon
Ipswich
Moggill
Raceview
Ironbark
Bundamba
Brassall Riverview
Greenbank
Richlands
Blackstone
Leichhardt
Willowbank
Bellbowrie
Carole Park Forest Lake
Karana Downs
North Ipswich
Mount Ommaney
Redbank Plains
Eastern HeightsCollingwood Park
2829
30
31
32
27
33
1825
17
16
19
14
24
15
22 21
23 20
15
31
23
27
28
24
28
30
30
33
19
3028
2931
27
27
31
27
31
33
B:\B20702 BRCFS Hydraulics\60_Mapping\MXD\MXD_OUTPUT\MR7\D0100\MR7-Map-04.mxd
Brisban e Rive r Catchm e n t Flood S tudy
Brisbane City CouncilIpswich City CouncilLockyer Valley Regional CouncilSomerset Regional CouncilSeqwater
Goog le ™e arthIm ag e © 2015 Dig italGlobeIm ag e © 2015 Fug roIm ag e © 2015 S in clair Kn ig ht Me rz & Fug roIm ag e © 2015 CNES / Astrium
Riverine Flood ExtentExtreme Flood(notional 1 in 100,000 AEP)Limit of Detailed Modelling
1.0m Flood Level Contour*Intermediate 0.5m Contour
) Gauging Station
(Hydraulic AssessmentReporting Location
Study Partners
Refer to Councils for localflooding beyond limit
Fe b.2017
!
!
!
IPS WICH
BRIS BANEWIVENHOE DAM
°0 1.5 3 4.5
KilometersMap Grid of Australia 1994, Zone 56
*Flood Contour Vertical Datum is the Australian Height Datum (AHD, 1971)
30

www.bmtwbm.com.au
Peak Water Surface Level Maps - 1 in 100 AEP Reg io n D Map 5(MR5,Drawin g 8)
BMT WBM endeavours to ensure that the information provided in thismap is correct at the time of publication. BMT WBM does not warrant,guarantee or make representations regarding the currency andaccuracy of information contained in this map.
Filepath :
LEGEND
)
)
)
)
)
((
(
(
(
(
(
((
(
(
(
(
Bremer River
Brisbane River
Brisbane River
Oxley Creek8 Moggill
28 Rocklea9 Jindalee
10 Tennyson
29 Beatty Rd
11 Fairfield
25 Warrego Hwy
26 Hanlon St Alert
27 Brisbane Rd Alert
24 Bundamba Confluence
22 David Trumpy Bridge
6 Upstream Mt Crosby Weir7 Downstream Mt Crosby Weir
Oxley Ck Co rin da
Oxley Ck Mo uth AL
Bun dam ba Ck at Mary St
Co lleg es Cro ssin g Alert Oxley
Wacol
Kholo
Tivoli
Camira
Goodna
Booval
Karalee
Kenmore
Anstead
Redbank
Rocklea
Ipswich
Moggill
Raceview
Bundamba
Sherwood
Riverview
Calamvale
Richlands
Blackstone
Bellbowrie
Graceville
Carole Park Forest Lake
Greenslopes
Karana Downs
Acacia Ridge
Indooroopilly
North Ipswich
Mount Ommaney
Redbank Plains
Eastern HeightsCollingwood Park
Walter Taylor Bridge
30
13
9
27
18
8
11
17
10
12
16
19
25
14
15
202624
23
13
20
9
19
9
13
9
15
B:\B20702 BRCFS Hydraulics\60_Mapping\MXD\MXD_OUTPUT\MR7\D0100\MR7-Map-05.mxd
Brisban e River Catch m en t Flo o d Study
Brisbane City CouncilIpswich City CouncilLockyer Valley Regional CouncilSomerset Regional CouncilSeqwater
Go o g le™earthIm ag e © 2015 Dig italGlo beIm ag e © 2015 Fug roIm ag e © 2015 Sin clair Kn ig h t Merz & Fug roIm ag e © 2015 CNES / Astrium
Riverine Flood ExtentExtreme Flood(notional 1 in 100,000 AEP)Limit of Detailed Modelling
1.0m Flood Level Contour*Intermediate 0.5m Contour
) Gauging Station
(Hydraulic AssessmentReporting Location
Study Partners
Refer to Councils for localflooding beyond limit
Feb.2017
!
!
!
IPSWICH
BRISBANEWIV ENHOE DAM
°0 1.5 3 4.5
KilometersMap Grid of Australia 1994, Zone 56
*Flood Contour Vertical Datum is the Australian Height Datum (AHD, 1971)
30
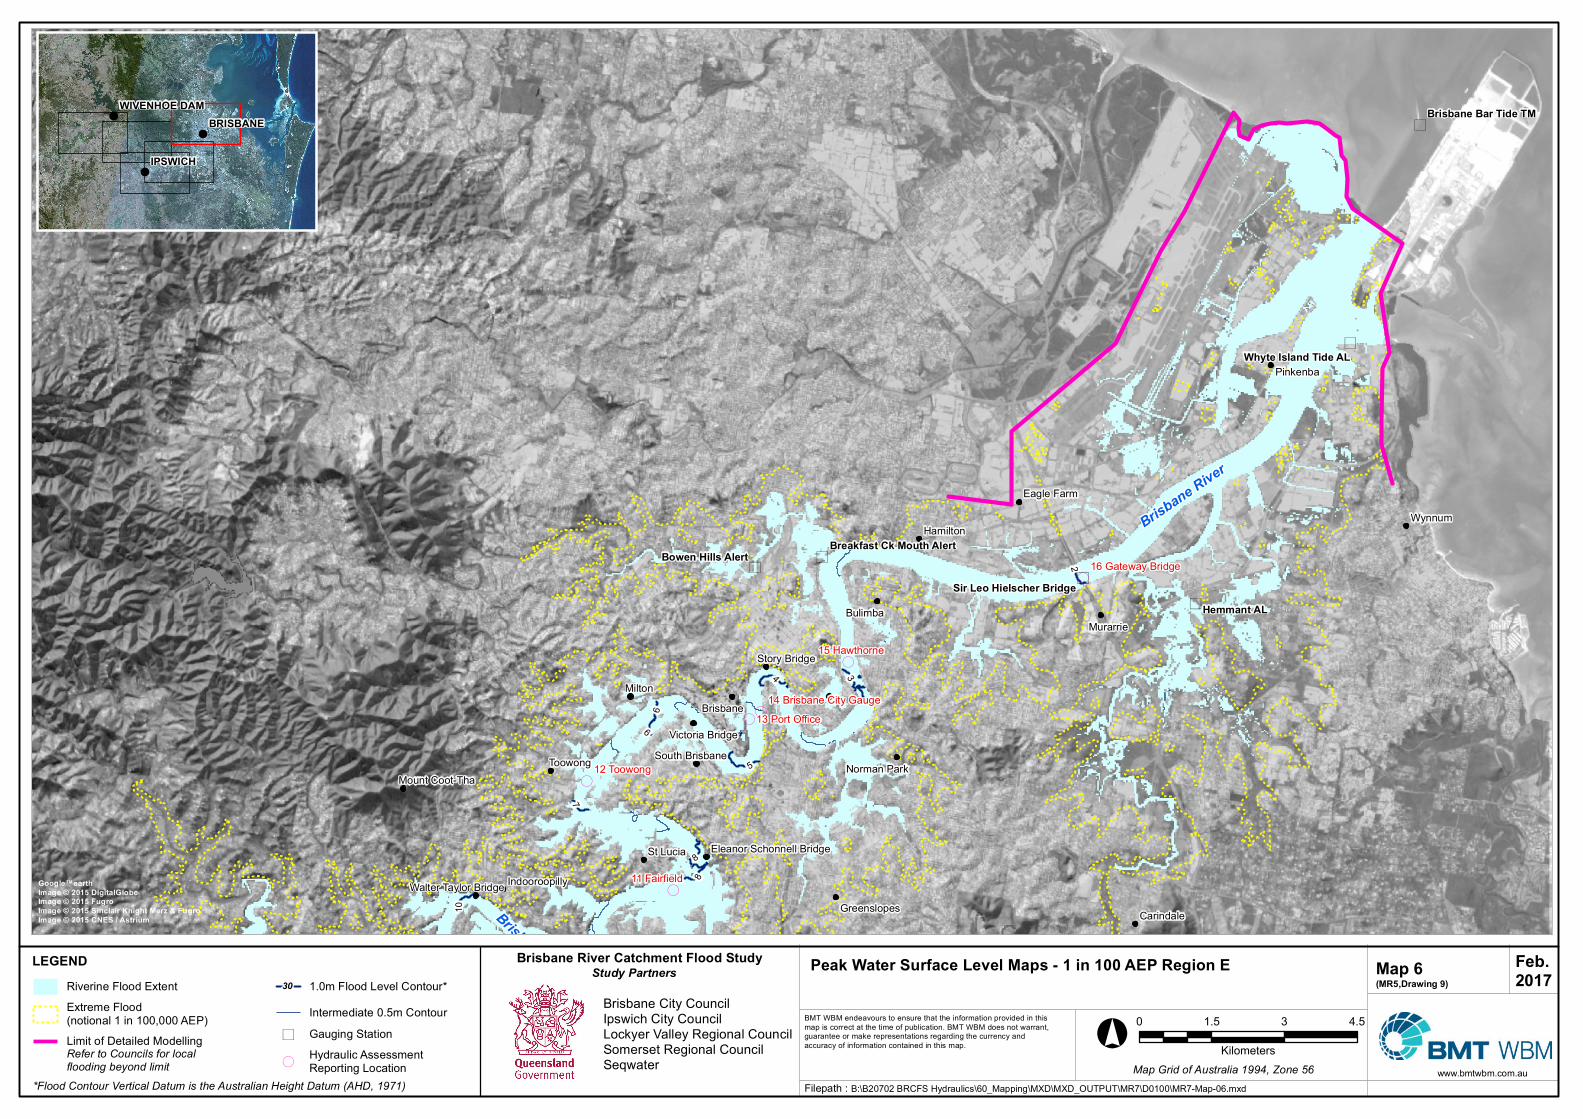
www.bmtwbm.com.au
Pe ak Wate r S urface Le ve l Maps - 1 in 100 AEP Re gion E Map 6(MR5,Drawing 9)
BMT WBM endeavours to ensure that the information provided in thismap is correct at the time of publication. BMT WBM does not warrant,guarantee or make representations regarding the currency andaccuracy of information contained in this map.
Filepath :
LEGEND
)
)
)
)
))
(
(
(
(
(
(
Brisbane River
Brisbane River
12 Toowong
15 Hawthorne
11 Fairfield
13 Port Office
16 Gateway Bridge
14 Brisbane City Gauge
He m m ant AL
Bowe n Hills Ale rt
Brisbane Bar Tide TM
Whyte Island Tide AL
Bre ak fast Ck Mouth Ale rt
S ir Le o Hie lsche r Bridge
Milton
Wynnum
Toowong
BulimbaMurarrie
St Lucia
Hamilton
Pinkenba
Brisbane
Carindale
Eagle Farm
Greenslopes
Norman Park
Story Bridge
Indooroopilly
South BrisbaneMount Coot-Tha
Victoria Bridge
Walter Taylor Bridge
Eleanor Schonnell Bridge
5
6
8
4
2
3
7
10
6
8
B:\B20702 BRCFS Hydraulics\60_Mapping\MXD\MXD_OUTPUT\MR7\D0100\MR7-Map-06.mxd
Brisbane Rive r Catchm e nt Flood S tudy
Brisbane City CouncilIpswich City CouncilLockyer Valley Regional CouncilSomerset Regional CouncilSeqwater
Google ™e arthIm age © 2015 DigitalGlobeIm age © 2015 FugroIm age © 2015 S inclair Knight Me rz & FugroIm age © 2015 CNES / Astrium
Riverine Flood ExtentExtreme Flood(notional 1 in 100,000 AEP)Limit of Detailed Modelling
1.0m Flood Level Contour*Intermediate 0.5m Contour
) Gauging Station
(Hydraulic AssessmentReporting Location
Study Partners
Refer to Councils for localflooding beyond limit
Fe b.2017
!
!
!
IPS WICH
BRIS BANEWIVENHOE DAM
°0 1.5 3 4.5
KilometersMap Grid of Australia 1994, Zone 56
*Flood Contour Vertical Datum is the Australian Height Datum (AHD, 1971)
30
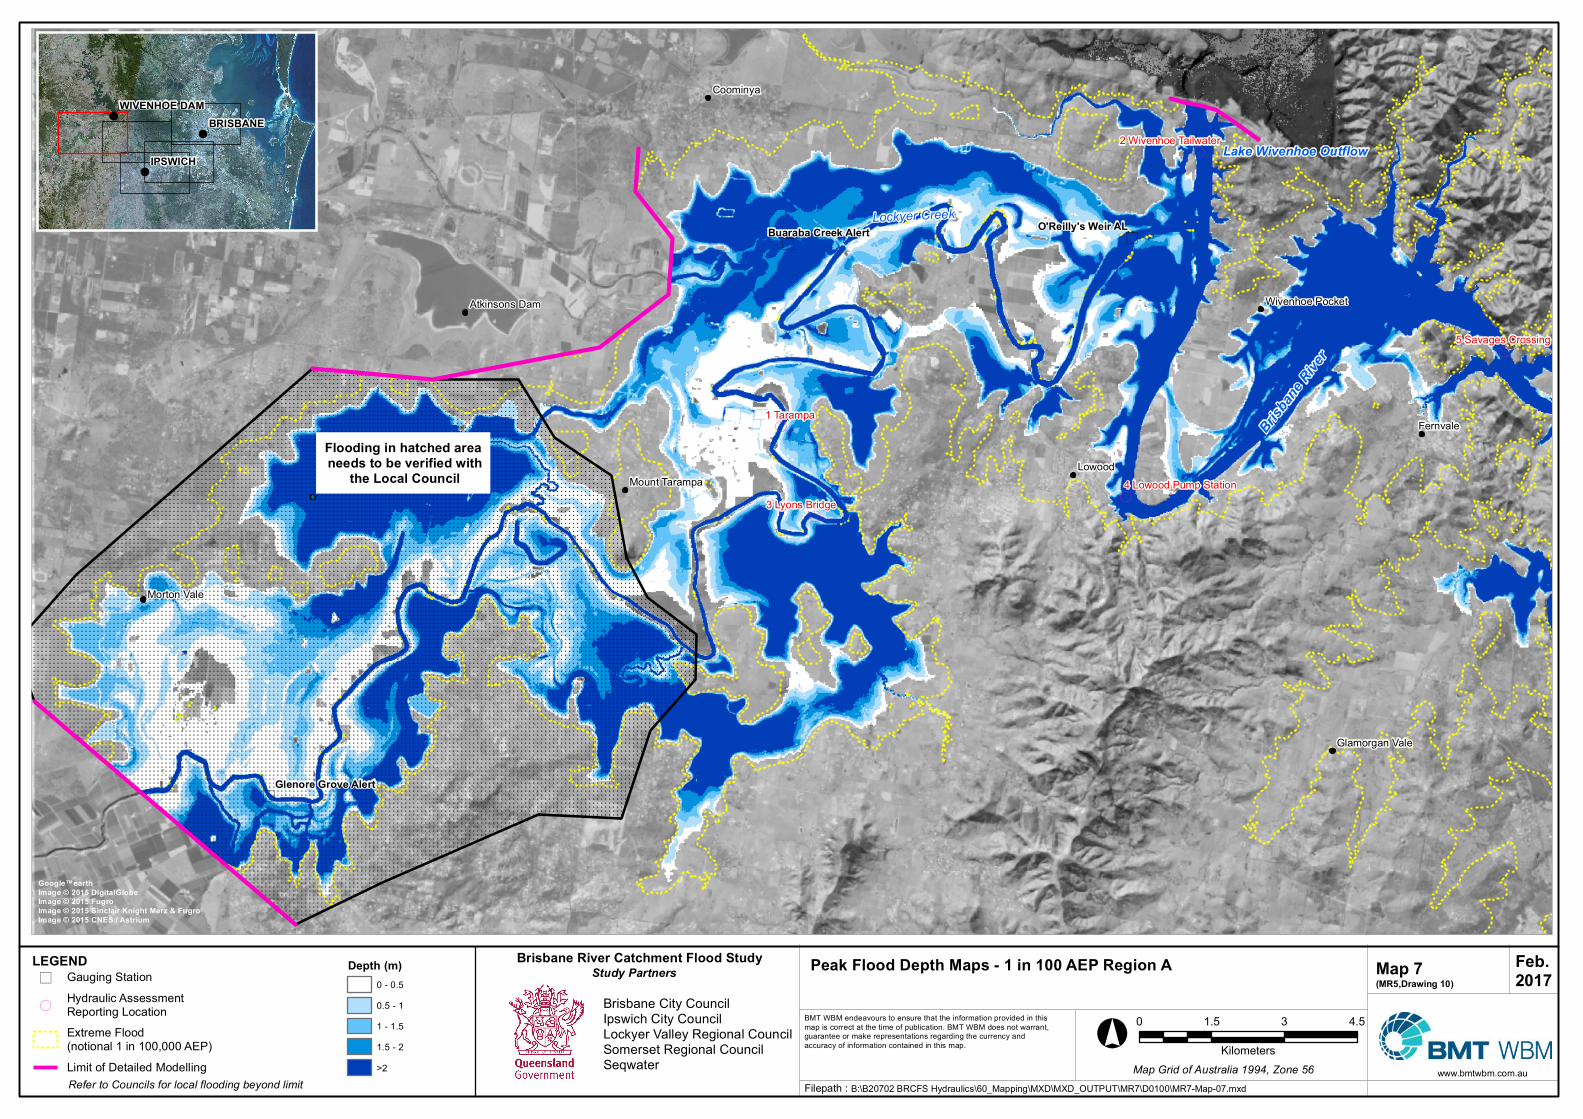
www.bmtwbm.com.au
Peak Flo o d Depth Maps - 1 in 100 AEP Reg io n A Map 7(MR5,Drawin g 10)
BMT WBM endeavours to ensure that the information provided in thismap is correct at the time of publication. BMT WBM does not warrant,guarantee or make representations regarding the currency andaccuracy of information contained in this map.
Filepath :
LEGEND
)
)
)
(
(
(
(
(
Lockyer Creek
Brisban
e Rive
r
Lake Wivenhoe Outflow
O'Reilly's Weir ALBuaraba Creek Alert
Glen o re Gro ve Alert
1 Tarampa
3 Lyons Bridge
5 Savages Crossing
2 Wivenhoe Tailwater
4 Lowood Pump Station
Flo o din g in h atch ed area n eeds to be verified with
th e Lo cal Co un cil Lowood
Fernvale
Coominya
Morton Vale
Mount Tarampa
Atkinsons Dam
Glamorgan Vale
Wivenhoe Pocket
B:\B20702 BRCFS Hydraulics\60_Mapping\MXD\MXD_OUTPUT\MR7\D0100\MR7-Map-07.mxd
Brisban e River Catch m en t Flo o d Study
Brisbane City CouncilIpswich City CouncilLockyer Valley Regional CouncilSomerset Regional CouncilSeqwater
Go o g le™earthIm ag e © 2015 Dig italGlo beIm ag e © 2015 Fug roIm ag e © 2015 Sin clair Kn ig h t Merz & Fug roIm ag e © 2015 CNES / Astrium
) Gauging Station
(Hydraulic AssessmentReporting LocationExtreme Flood(notional 1 in 100,000 AEP)Limit of Detailed Modelling
Study Partners
Refer to Councils for local flooding beyond limit
Depth (m )0 - 0.50.5 - 11 - 1.51.5 - 2>2
!
!
!
IPSWICH
BRISBANEWIV ENHOE DAM
Feb.2017
°0 1.5 3 4.5
KilometersMap Grid of Australia 1994, Zone 56
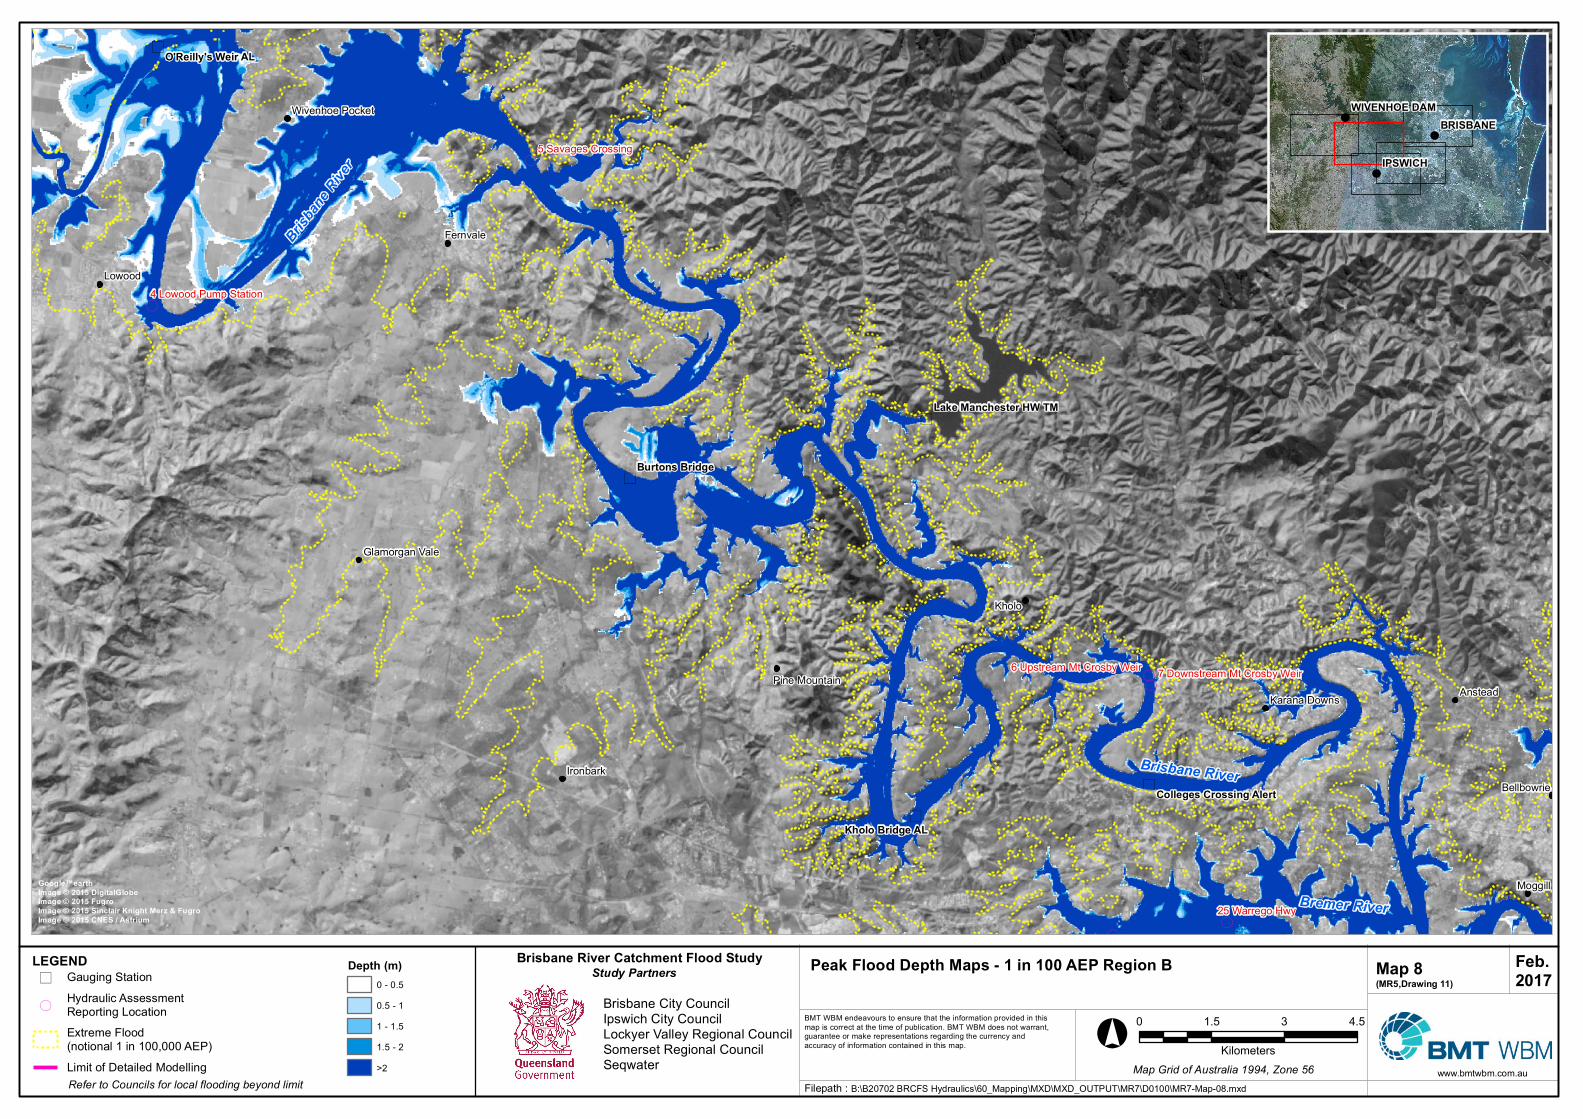
www.bmtwbm.com.au
Pe ak Flood De pth Maps - 1 in 100 AEP Re g ion B Map 8(MR5,Draw in g 11)
BMT WBM endeavours to ensure that the information provided in thismap is correct at the time of publication. BMT WBM does not warrant,guarantee or make representations regarding the currency andaccuracy of information contained in this map.
Filepath :
LEGEND
)
)
)
)
)
(
(
((
(((
(
Brisban
e Rive
r
Bremer River
Brisbane River
Burton s Brid g e
Kholo Brid g e AL
O'Re illy's We ir AL
Lak e Man che ste r HW TM
Colle g e s Crossin g Ale rt
25 Warrego Hwy
5 Savages Crossing
4 Lowood Pump Station
6 Upstream Mt Crosby Weir 7 Downstream Mt Crosby Weir
Kholo
Lowood
Anstead
Moggill
Ironbark
Fernvale
Bellbowrie
Karana DownsPine Mountain
Glamorgan Vale
Wivenhoe Pocket
B:\B20702 BRCFS Hydraulics\60_Mapping\MXD\MXD_OUTPUT\MR7\D0100\MR7-Map-08.mxd
Brisban e Rive r Catchm e n t Flood S tud y
Brisbane City CouncilIpswich City CouncilLockyer Valley Regional CouncilSomerset Regional CouncilSeqwater
Goog le ™e arthIm ag e © 2015 Dig italGlobeIm ag e © 2015 Fug roIm ag e © 2015 S in clair Kn ig ht Me rz & Fug roIm ag e © 2015 CNES / Astrium
) Gauging Station
(Hydraulic AssessmentReporting LocationExtreme Flood(notional 1 in 100,000 AEP)Limit of Detailed Modelling
Study Partners
Refer to Councils for local flooding beyond limit
De pth (m )0 - 0.50.5 - 11 - 1.51.5 - 2>2
!
!
!
IPS WICH
BRIS BANEWIVENHOE DAM
Fe b.2017
°0 1.5 3 4.5
KilometersMap Grid of Australia 1994, Zone 56
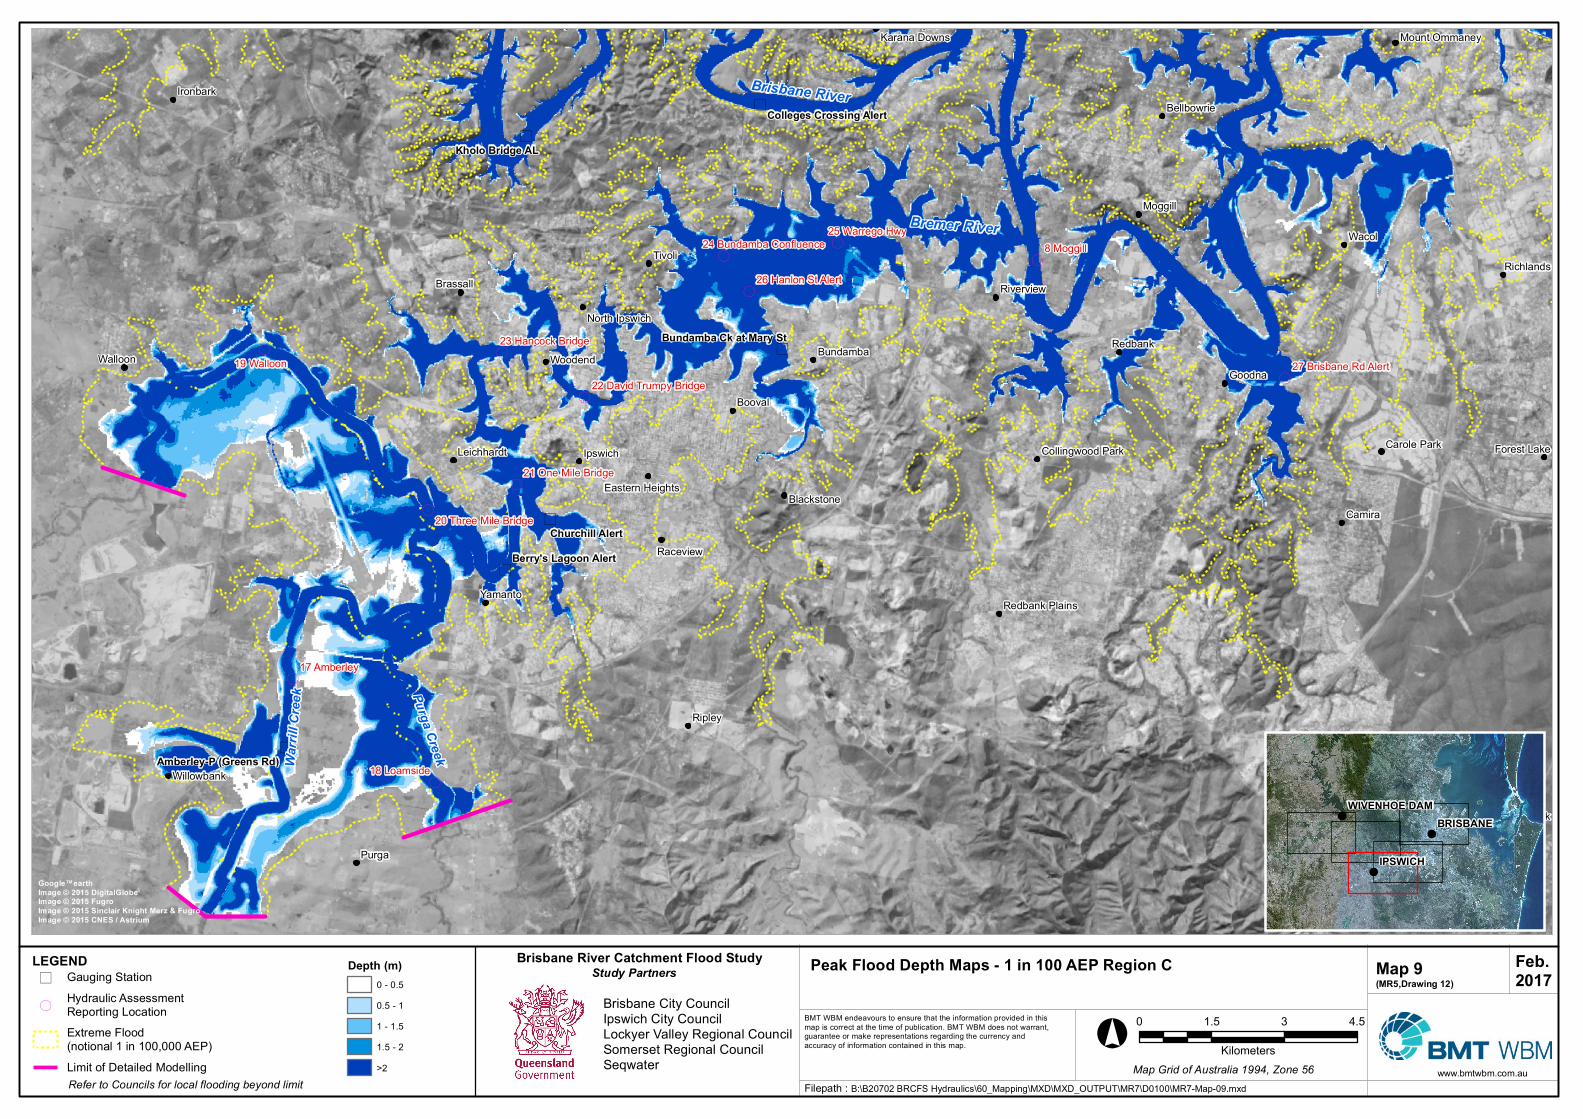
www.bmtwbm.com.au
Pe ak Flo o d De pth Maps - 1 in 100 AEP Re g io n C Map 9(MR5,Drawin g 12)
BMT WBM endeavours to ensure that the information provided in thismap is correct at the time of publication. BMT WBM does not warrant,guarantee or make representations regarding the currency andaccuracy of information contained in this map.
Filepath :
LEGEND
)
)
)
)
)
)
((
(
(
(
(
(
(
(
(
((
(
(
Bremer River
Warri
ll Cree
k Purga Creek
Brisbane River
Kh o lo Bridg e AL
Ch urch ill Ale rtBe rry's Lag o o n Ale rt
Am be rle y-P (Gre e n s Rd)
Bun dam ba Ck at Mary S t
Co lle g e s Cro ssin g Ale rt
8 Moggill
19 Walloon
18 Loamside
17 Amberley
25 Warrego Hwy
23 Hancock Bridge
26 Hanlon St Alert
21 One Mile Bridge
27 Brisbane Rd Alert
20 Three Mile Bridge
24 Bundamba Confluence
22 David Trumpy Bridge
Purga
WacolTivoli
Ripley
Camira
Goodna
Booval
Woodend
Yamanto
RedbankWalloon
Ipswich
Moggill
Raceview
Ironbark
Bundamba
Brassall Riverview
Greenbank
Richlands
Blackstone
Leichhardt
Willowbank
Bellbowrie
Carole Park Forest Lake
Karana Downs
North Ipswich
Mount Ommaney
Redbank Plains
Eastern Heights
Collingwood Park
B:\B20702 BRCFS Hydraulics\60_Mapping\MXD\MXD_OUTPUT\MR7\D0100\MR7-Map-09.mxd
Brisban e Rive r Catch m e n t Flo o d S tudy
Brisbane City CouncilIpswich City CouncilLockyer Valley Regional CouncilSomerset Regional CouncilSeqwater
Go o g le ™e arthIm ag e © 2015 Dig italGlo beIm ag e © 2015 Fug roIm ag e © 2015 S in clair Kn ig h t Me rz & Fug roIm ag e © 2015 CNES / Astrium
) Gauging Station
(Hydraulic AssessmentReporting LocationExtreme Flood(notional 1 in 100,000 AEP)Limit of Detailed Modelling
Study Partners
Refer to Councils for local flooding beyond limit
De pth (m )0 - 0.50.5 - 11 - 1.51.5 - 2>2
!
!
!
IPS WICH
BRIS BANEWIVENHOE DAM
Fe b.2017
°0 1.5 3 4.5
KilometersMap Grid of Australia 1994, Zone 56
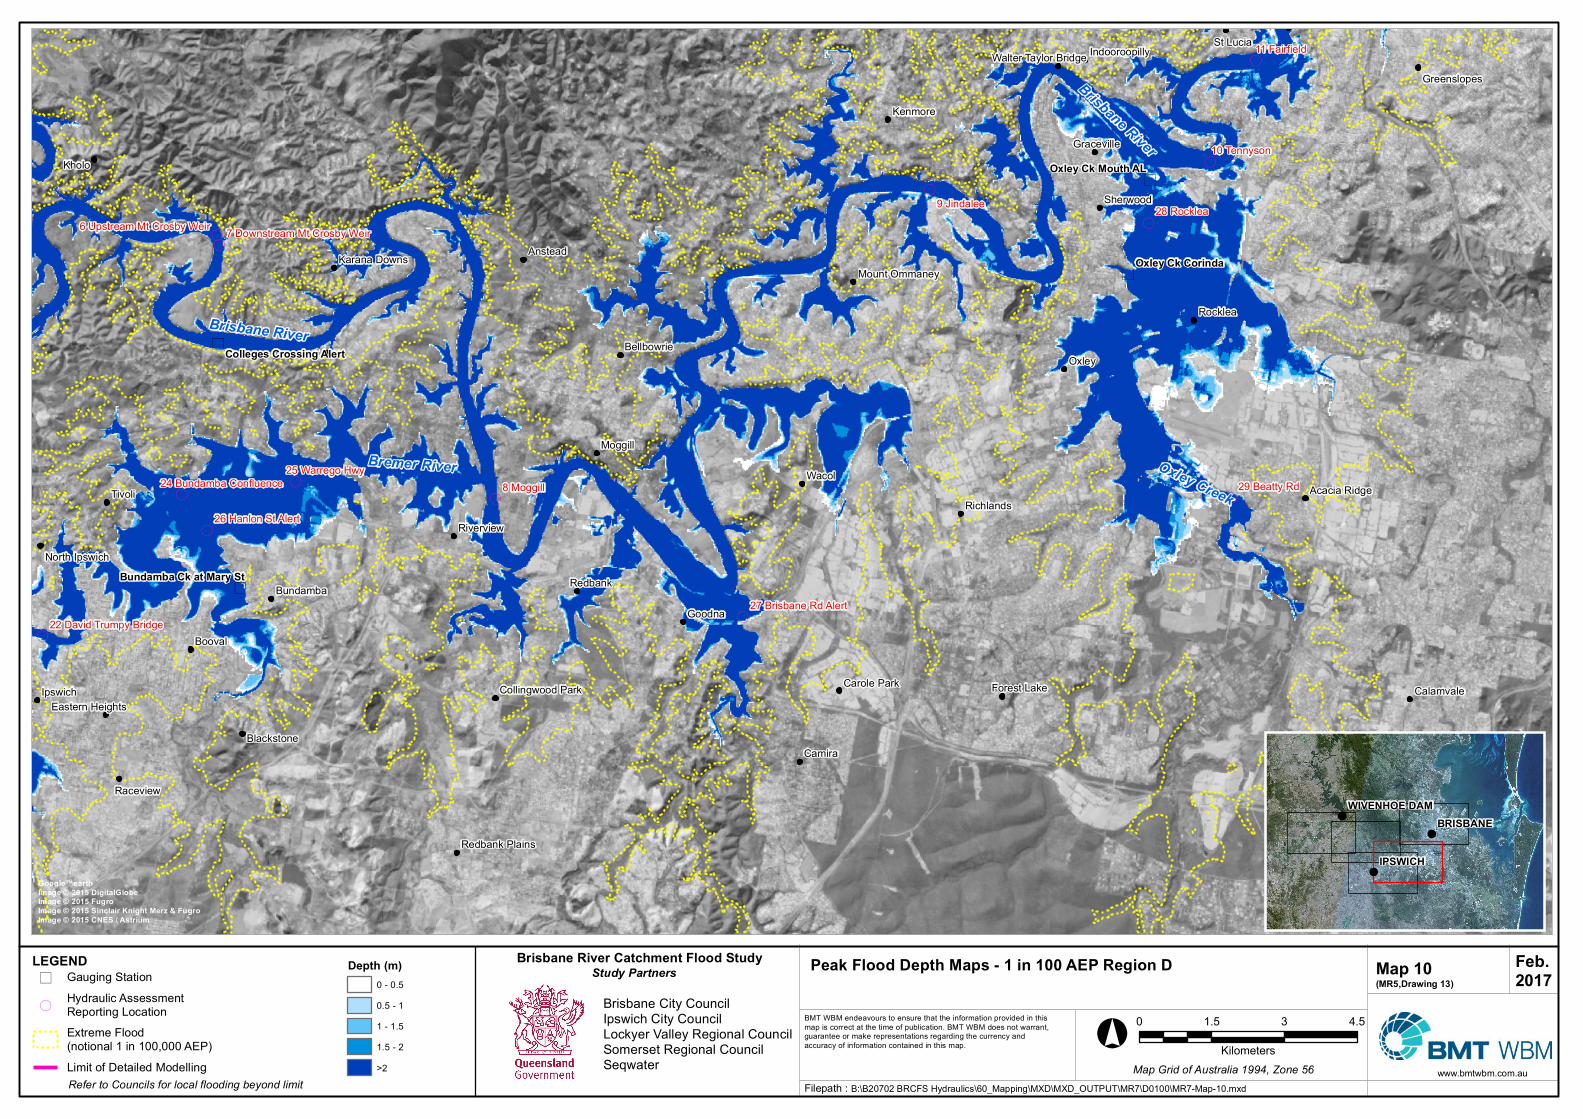
www.bmtwbm.com.au
Peak Flo o d Dep th Map s - 1 in 100 AEP Regio n D Map 10(MR5,Draw in g 13)
BMT WBM endeavours to ensure that the information provided in thismap is correct at the time of publication. BMT WBM does not warrant,guarantee or make representations regarding the currency andaccuracy of information contained in this map.
Filepath :
LEGEND
)
)
)
)
)
((
(
(
(
(
(
((
(
(
(
(
Bremer River
Brisbane River
Brisbane River
Oxley Creek
Oxley Ck Co rin da
Oxley Ck Mo uth AL
Bun dam ba Ck at Mary St
Co lleges Cro ssin g Alert
8 Moggill
28 Rocklea9 Jindalee
10 Tennyson
29 Beatty Rd
11 Fairfield
25 Warrego Hwy
26 Hanlon St Alert
27 Brisbane Rd Alert
24 Bundamba Confluence
22 David Trumpy Bridge
6 Upstream Mt Crosby Weir 7 Downstream Mt Crosby Weir
Oxley
Wacol
Kholo
Tivoli
Camira
Goodna
Booval
Kenmore
Anstead
Redbank
Rocklea
Ipswich
Moggill
Raceview
St Lucia
Bundamba
Sherwood
Riverview
Calamvale
Richlands
Blackstone
Bellbowrie
Graceville
Carole Park Forest Lake
Greenslopes
Karana Downs
Acacia Ridge
Indooroopilly
North Ipswich
Mount Ommaney
Redbank Plains
Eastern HeightsCollingwood Park
Walter Taylor Bridge
B:\B20702 BRCFS Hydraulics\60_Mapping\MXD\MXD_OUTPUT\MR7\D0100\MR7-Map-10.mxd
Brisban e River Catch m en t Flo o d Study
Brisbane City CouncilIpswich City CouncilLockyer Valley Regional CouncilSomerset Regional CouncilSeqwater
Go o gle™earthIm age © 2015 DigitalGlo beIm age © 2015 FugroIm age © 2015 Sin clair Kn igh t Merz & FugroIm age © 2015 CNES / Astrium
) Gauging Station
(Hydraulic AssessmentReporting LocationExtreme Flood(notional 1 in 100,000 AEP)Limit of Detailed Modelling
Study Partners
Refer to Councils for local flooding beyond limit
Dep th (m )0 - 0.50.5 - 11 - 1.51.5 - 2>2
!
!
!
IPSWICH
BRISBANEWIV ENHOE DAM
Feb.2017
°0 1.5 3 4.5
KilometersMap Grid of Australia 1994, Zone 56
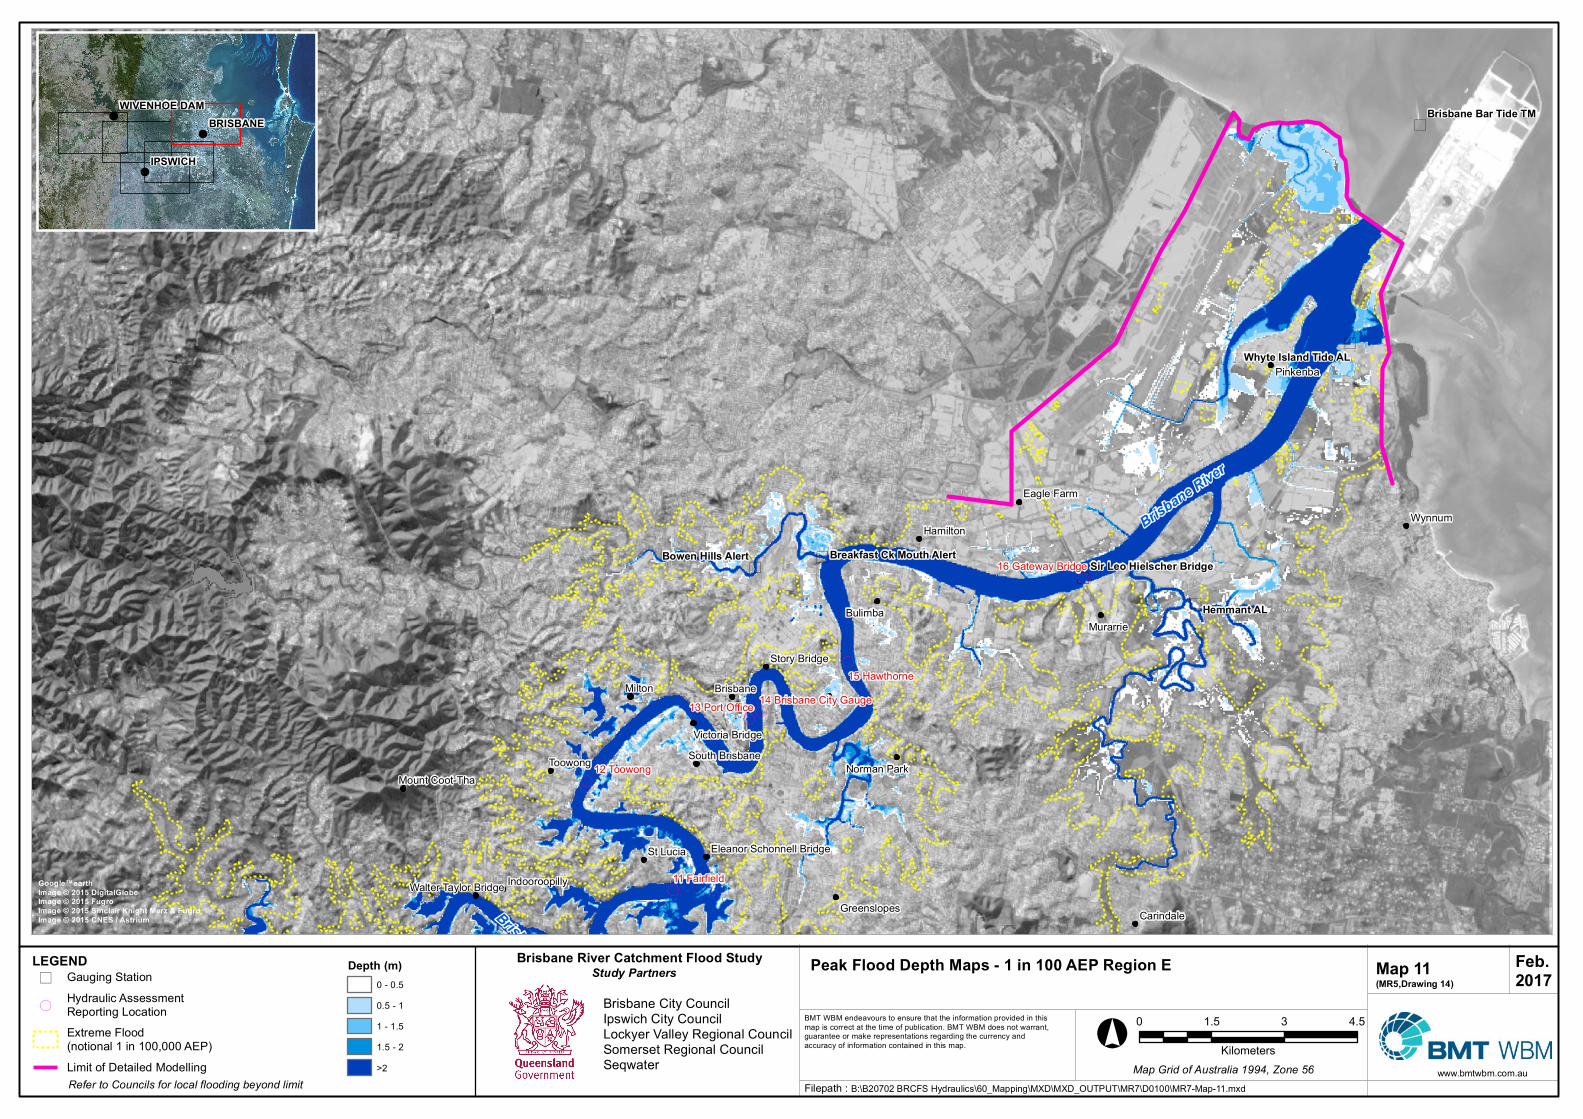
www.bmtwbm.com.au
Peak Flood Depth Maps - 1 in 100 AEP Reg ion E Map 11(MR5,Draw in g 14)
BMT WBM endeavours to ensure that the information provided in thismap is correct at the time of publication. BMT WBM does not warrant,guarantee or make representations regarding the currency andaccuracy of information contained in this map.
Filepath :
LEGEND
)
)
)
)
))
(
(
(
(
(
(
Brisbane River
Brisbane River
Hem m an t AL
Bow en Hills Alert
Brisban e Bar T ide T M
Whyte Islan d T ide AL
Break fast Ck Mouth AlertSir Leo Hielscher Bridg e
12 Toowong
15 Hawthorne
11 Fairfield
13 Port Office
16 Gateway Bridge
14 Brisbane City GaugeMilton
Wynnum
Toowong
BulimbaMurarrie
St Lucia
Hamilton
Pinkenba
Brisbane
Carindale
Eagle Farm
Greenslopes
Norman Park
Story Bridge
Indooroopilly
South BrisbaneMount Coot-Tha
Victoria Bridge
Walter Taylor Bridge
Eleanor Schonnell Bridge
B:\B20702 BRCFS Hydraulics\60_Mapping\MXD\MXD_OUTPUT\MR7\D0100\MR7-Map-11.mxd
Brisban e River Catchm en t Flood Study
Brisbane City CouncilIpswich City CouncilLockyer Valley Regional CouncilSomerset Regional CouncilSeqwater
Goog le™earthIm ag e © 2015 Dig italGlobeIm ag e © 2015 Fug roIm ag e © 2015 Sin clair Kn ig ht Merz & Fug roIm ag e © 2015 CNES / Astrium
) Gauging Station
(Hydraulic AssessmentReporting LocationExtreme Flood(notional 1 in 100,000 AEP)Limit of Detailed Modelling
Study Partners
Refer to Councils for local flooding beyond limit
Depth (m )0 - 0.50.5 - 11 - 1.51.5 - 2>2
!
!
!
IPSWICH
BRISBANEWIVENHOE DAM
Feb.2017
°0 1.5 3 4.5
KilometersMap Grid of Australia 1994, Zone 56
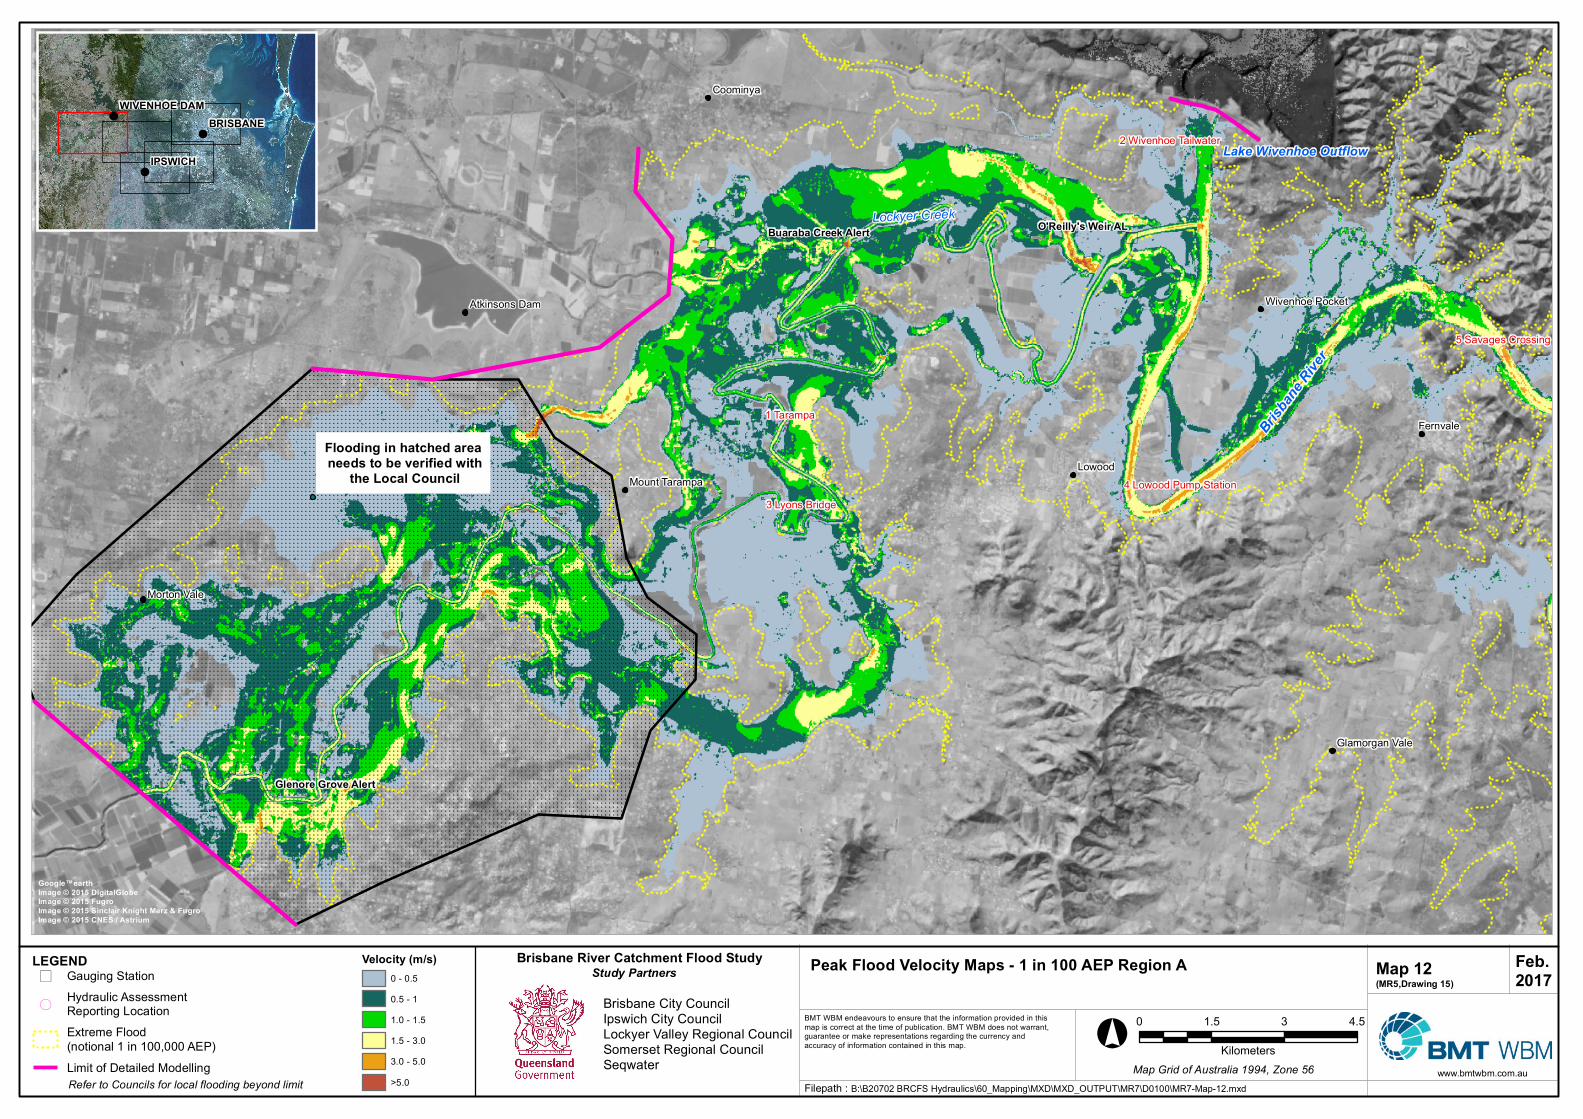
www.bmtwbm.com.au
Peak Flo o d V elo city Maps - 1 in 100 AEP Reg io n A Map 12(MR5,Drawin g 15)
BMT WBM endeavours to ensure that the information provided in thismap is correct at the time of publication. BMT WBM does not warrant,guarantee or make representations regarding the currency andaccuracy of information contained in this map.
Filepath :
LEGEND
)
)
)
(
(
(
(
(
Lockyer Creek
Brisban
e Rive
r
Lake Wivenhoe Outflow
O'Reilly's Weir ALBuaraba Creek Alert
Glen o re Gro ve Alert
1 Tarampa
3 Lyons Bridge
5 Savages Crossing
2 Wivenhoe Tailwater
4 Lowood Pump Station
Flo o din g in h atch ed area n eeds to be verified with
th e Lo cal Co un cil Lowood
Fernvale
Coominya
Morton Vale
Mount Tarampa
Atkinsons Dam
Glamorgan Vale
Wivenhoe Pocket
B:\B20702 BRCFS Hydraulics\60_Mapping\MXD\MXD_OUTPUT\MR7\D0100\MR7-Map-12.mxd
Brisban e River Catch m en t Flo o d Study
Brisbane City CouncilIpswich City CouncilLockyer Valley Regional CouncilSomerset Regional CouncilSeqwater
Go o g le™earthIm ag e © 2015 Dig italGlo beIm ag e © 2015 Fug roIm ag e © 2015 Sin clair Kn ig h t Merz & Fug roIm ag e © 2015 CNES / Astrium
) Gauging Station
(Hydraulic AssessmentReporting LocationExtreme Flood(notional 1 in 100,000 AEP)Limit of Detailed Modelling
Study Partners
Refer to Councils for local flooding beyond limit
V elo city (m /s)0 - 0.50.5 - 11.0 - 1.51.5 - 3.03.0 - 5.0>5.0
!
!
!
IPSWICH
BRISBANEWIV ENHOE DAM
Feb.2017
°0 1.5 3 4.5
KilometersMap Grid of Australia 1994, Zone 56
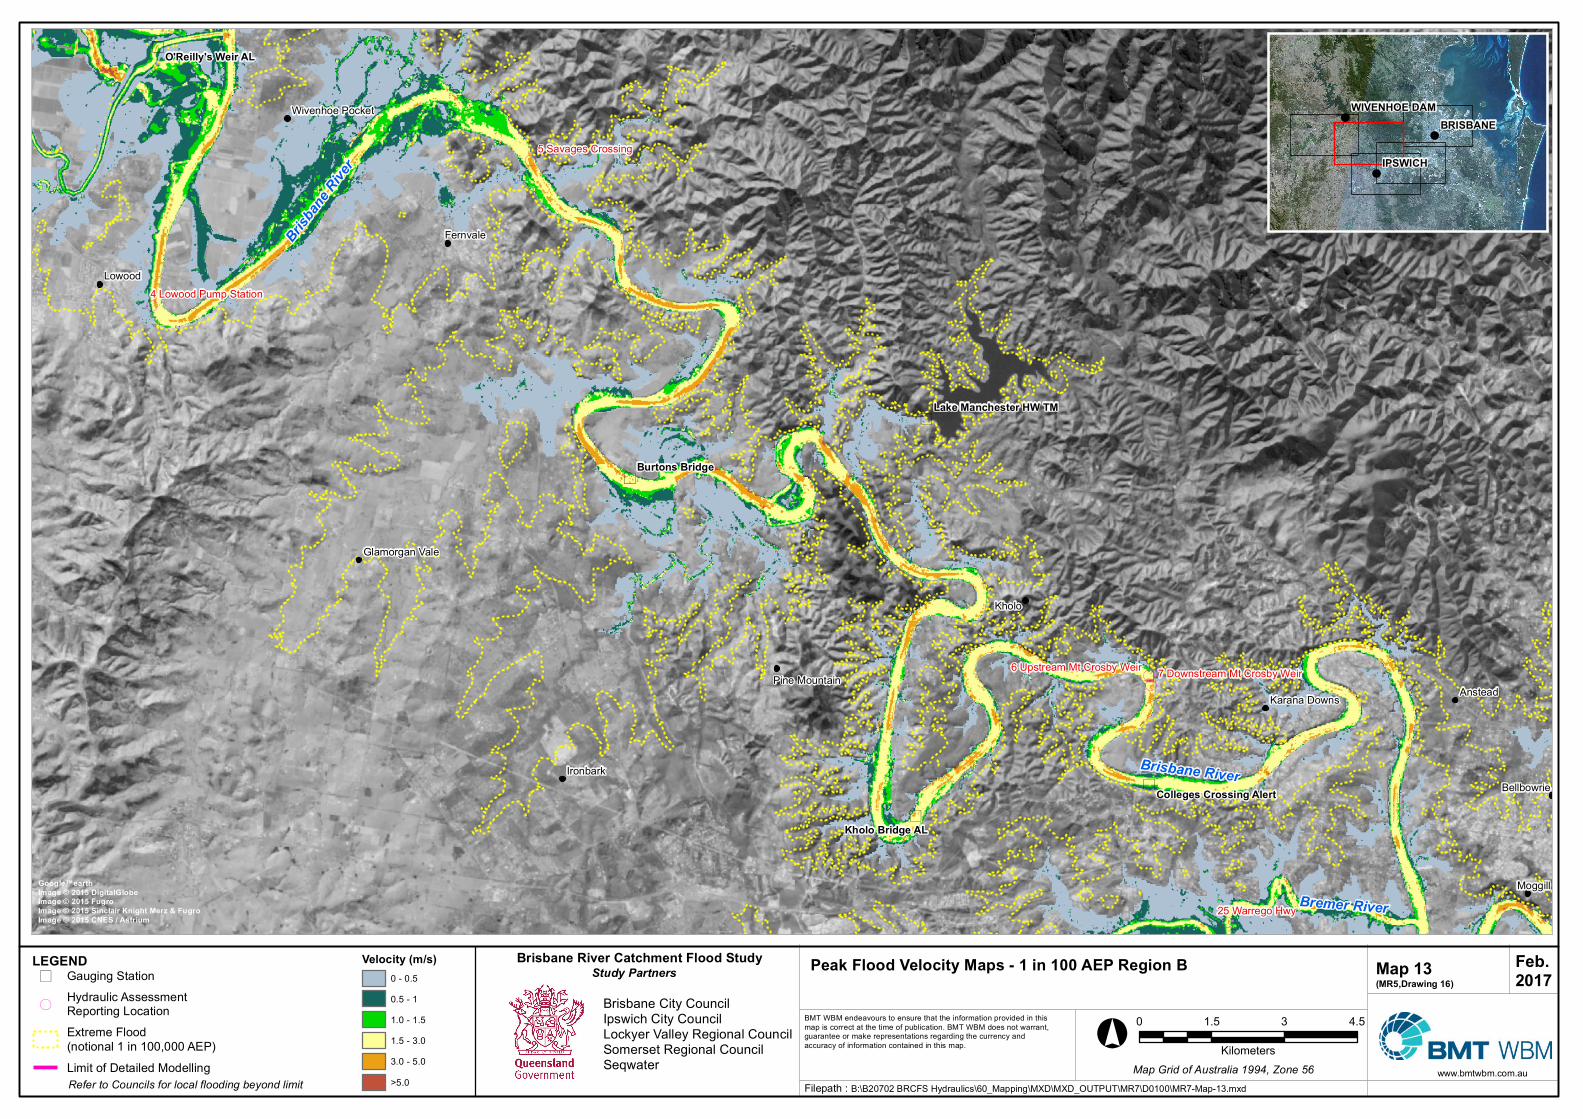
www.bmtwbm.com.au
Pe ak Flood Ve loc ity Maps - 1 in 100 AEP R e gion B Map 13(MR 5,Drawing 16)
BMT WBM endeavours to ensure that the information provided in thismap is correct at the time of publication. BMT WBM does not warrant,guarantee or make representations regarding the currency andaccuracy of information contained in this map.
Filepath :
LEGEND
)
)
)
)
)
(
(
((
(((
(
Brisban
e Rive
r
Bremer River
Brisbane River
Burtons Brid ge
Kholo Brid ge AL
O'R e illy's We ir AL
Lak e Manc he ste r HW TM
Colle ge s Crossing Ale rt
25 Warrego Hwy
5 Savages Crossing
4 Lowood Pump Station
6 Upstream Mt Crosby Weir 7 Downstream Mt Crosby Weir
Kholo
Lowood
Anstead
Moggill
Ironbark
Fernvale
Bellbowrie
Karana DownsPine Mountain
Glamorgan Vale
Wivenhoe Pocket
B:\B20702 BRCFS Hydraulics\60_Mapping\MXD\MXD_OUTPUT\MR7\D0100\MR7-Map-13.mxd
Brisbane R ive r Catc hm e nt Flood Stud y
Brisbane City CouncilIpswich City CouncilLockyer Valley Regional CouncilSomerset Regional CouncilSeqwater
Google ™e arthIm age © 2015 DigitalGlobeIm age © 2015 FugroIm age © 2015 Sinc lair Knight Me rz & FugroIm age © 2015 CNES / Astrium
) Gauging Station
(Hydraulic AssessmentReporting LocationExtreme Flood(notional 1 in 100,000 AEP)Limit of Detailed Modelling
Study Partners
Refer to Councils for local flooding beyond limit
Ve loc ity (m /s)0 - 0.50.5 - 11.0 - 1.51.5 - 3.03.0 - 5.0>5.0
!
!
!
IPSWICH
BR ISBANEWIVENHOE DAM
Fe b.2017
°0 1.5 3 4.5
KilometersMap Grid of Australia 1994, Zone 56
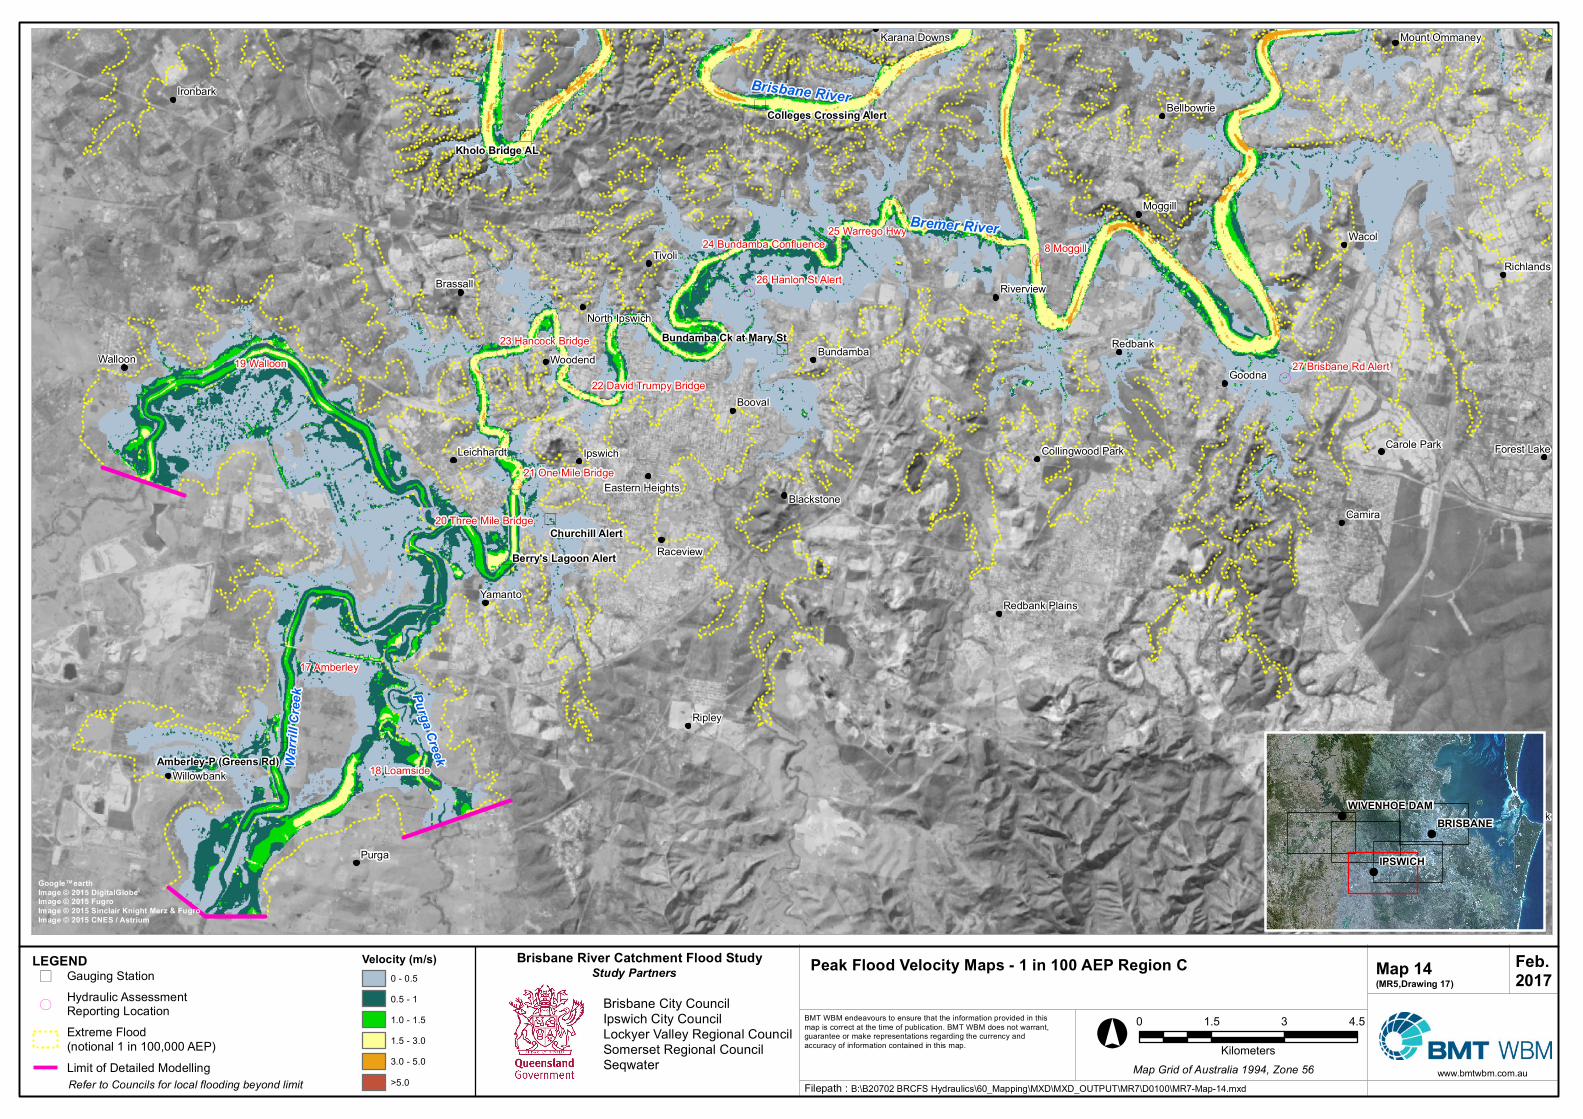
www.bmtwbm.com.au
Pe ak Flo o d Ve lo city Maps - 1 in 100 AEP Re g io n C Map 14(MR5,Drawin g 17)
BMT WBM endeavours to ensure that the information provided in thismap is correct at the time of publication. BMT WBM does not warrant,guarantee or make representations regarding the currency andaccuracy of information contained in this map.
Filepath :
LEGEND
)
)
)
)
)
)
((
(
(
(
(
(
(
(
(
((
(
(
Bremer River
Warri
ll Cree
k Purga Creek
Brisbane River
Kh o lo Bridg e AL
Ch urch ill Ale rtBe rry's Lag o o n Ale rt
Am be rle y-P (Gre e n s Rd)
Bun dam ba Ck at Mary S t
Co lle g e s Cro ssin g Ale rt
8 Moggill
19 Walloon
18 Loamside
17 Amberley
25 Warrego Hwy
23 Hancock Bridge
26 Hanlon St Alert
21 One Mile Bridge
27 Brisbane Rd Alert
20 Three Mile Bridge
24 Bundamba Confluence
22 David Trumpy Bridge
Purga
WacolTivoli
Ripley
Camira
Goodna
Booval
Woodend
Yamanto
RedbankWalloon
Ipswich
Moggill
Raceview
Ironbark
Bundamba
Brassall Riverview
Greenbank
Richlands
Blackstone
Leichhardt
Willowbank
Bellbowrie
Carole Park Forest Lake
Karana Downs
North Ipswich
Mount Ommaney
Redbank Plains
Eastern Heights
Collingwood Park
B:\B20702 BRCFS Hydraulics\60_Mapping\MXD\MXD_OUTPUT\MR7\D0100\MR7-Map-14.mxd
Brisban e Rive r Catch m e n t Flo o d S tudy
Brisbane City CouncilIpswich City CouncilLockyer Valley Regional CouncilSomerset Regional CouncilSeqwater
Go o g le ™e arthIm ag e © 2015 Dig italGlo beIm ag e © 2015 Fug roIm ag e © 2015 S in clair Kn ig h t Me rz & Fug roIm ag e © 2015 CNES / Astrium
) Gauging Station
(Hydraulic AssessmentReporting LocationExtreme Flood(notional 1 in 100,000 AEP)Limit of Detailed Modelling
Study Partners
Refer to Councils for local flooding beyond limit
Ve lo city (m /s)0 - 0.50.5 - 11.0 - 1.51.5 - 3.03.0 - 5.0>5.0
!
!
!
IPS WICH
BRIS BANEWIVENHOE DAM
Fe b.2017
°0 1.5 3 4.5
KilometersMap Grid of Australia 1994, Zone 56
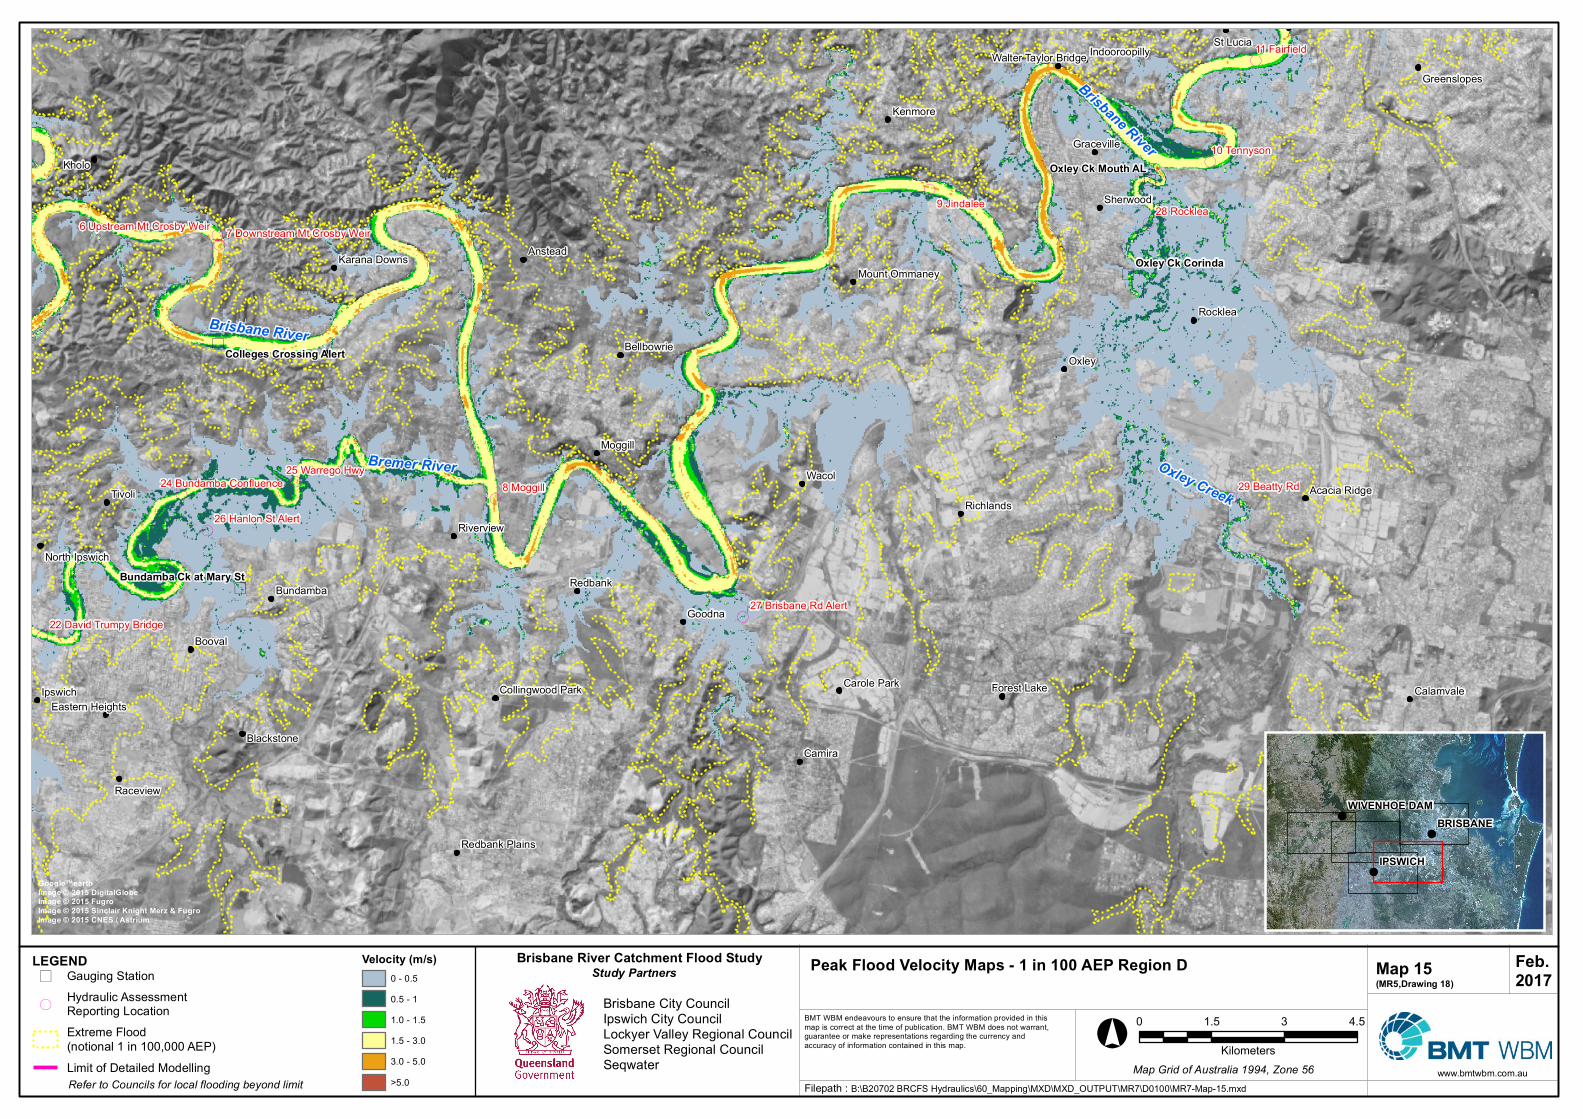
www.bmtwbm.com.au
Peak Flo o d V elo city Map s - 1 in 100 AEP Regio n D Map 15(MR5,Draw in g 18)
BMT WBM endeavours to ensure that the information provided in thismap is correct at the time of publication. BMT WBM does not warrant,guarantee or make representations regarding the currency andaccuracy of information contained in this map.
Filepath :
LEGEND
)
)
)
)
)
((
(
(
(
(
(
((
(
(
(
(
Bremer River
Brisbane River
Brisbane River
Oxley Creek
Oxley Ck Co rin da
Oxley Ck Mo uth AL
Bun dam ba Ck at Mary St
Co lleges Cro ssin g Alert
8 Moggill
28 Rocklea9 Jindalee
10 Tennyson
29 Beatty Rd
11 Fairfield
25 Warrego Hwy
26 Hanlon St Alert
27 Brisbane Rd Alert
24 Bundamba Confluence
22 David Trumpy Bridge
6 Upstream Mt Crosby Weir 7 Downstream Mt Crosby Weir
Oxley
Wacol
Kholo
Tivoli
Camira
Goodna
Booval
Kenmore
Anstead
Redbank
Rocklea
Ipswich
Moggill
Raceview
St Lucia
Bundamba
Sherwood
Riverview
Calamvale
Richlands
Blackstone
Bellbowrie
Graceville
Carole Park Forest Lake
Greenslopes
Karana Downs
Acacia Ridge
Indooroopilly
North Ipswich
Mount Ommaney
Redbank Plains
Eastern HeightsCollingwood Park
Walter Taylor Bridge
B:\B20702 BRCFS Hydraulics\60_Mapping\MXD\MXD_OUTPUT\MR7\D0100\MR7-Map-15.mxd
Brisban e River Catch m en t Flo o d Study
Brisbane City CouncilIpswich City CouncilLockyer Valley Regional CouncilSomerset Regional CouncilSeqwater
Go o gle™earthIm age © 2015 DigitalGlo beIm age © 2015 FugroIm age © 2015 Sin clair Kn igh t Merz & FugroIm age © 2015 CNES / Astrium
) Gauging Station
(Hydraulic AssessmentReporting LocationExtreme Flood(notional 1 in 100,000 AEP)Limit of Detailed Modelling
Study Partners
Refer to Councils for local flooding beyond limit
V elo city (m /s)0 - 0.50.5 - 11.0 - 1.51.5 - 3.03.0 - 5.0>5.0
!
!
!
IPSWICH
BRISBANEWIV ENHOE DAM
Feb.2017
°0 1.5 3 4.5
KilometersMap Grid of Australia 1994, Zone 56

www.bmtwbm.com.au
Pe ak Flood Ve locity Maps - 1 in 100 AEP Re gion E Map 16(MR5,Drawing 19)
BMT WBM endeavours to ensure that the information provided in thismap is correct at the time of publication. BMT WBM does not warrant,guarantee or make representations regarding the currency andaccuracy of information contained in this map.
Filepath :
LEGEND
)
)
)
)
))
(
(
(
(
(
(
Brisbane River
Brisbane River
He m m ant AL
Bowe n Hills Ale rt
Brisbane Bar Tide TM
Whyte Island Tide AL
Bre ak fast Ck Mouth Ale rtS ir Le o Hie lsche r Bridge
12 Toowong
15 Hawthorne
11 Fairfield
13 Port Office
16 Gateway Bridge
14 Brisbane City GaugeMilton
Wynnum
Toowong
BulimbaMurarrie
St Lucia
Hamilton
Pinkenba
Brisbane
Carindale
Eagle Farm
Greenslopes
Norman Park
Story Bridge
Indooroopilly
South BrisbaneMount Coot-Tha
Victoria Bridge
Walter Taylor Bridge
Eleanor Schonnell Bridge
B:\B20702 BRCFS Hydraulics\60_Mapping\MXD\MXD_OUTPUT\MR7\D0100\MR7-Map-16.mxd
Brisbane Rive r Catchm e nt Flood S tudy
Brisbane City CouncilIpswich City CouncilLockyer Valley Regional CouncilSomerset Regional CouncilSeqwater
Google ™e arthIm age © 2015 DigitalGlobeIm age © 2015 FugroIm age © 2015 S inclair Knight Me rz & FugroIm age © 2015 CNES / Astrium
) Gauging Station
(Hydraulic AssessmentReporting LocationExtreme Flood(notional 1 in 100,000 AEP)Limit of Detailed Modelling
Study Partners
Refer to Councils for local flooding beyond limit
Ve locity (m /s)0 - 0.50.5 - 11.0 - 1.51.5 - 3.03.0 - 5.0>5.0
!
!
!
IPS WICH
BRIS BANEWIVENHOE DAM
Fe b.2017
°0 1.5 3 4.5
KilometersMap Grid of Australia 1994, Zone 56

www.bmtwbm.com.au
Peak Depth x V elo city (Hydraulic Hazard) Maps - 1 in 100 AEP Reg io n A Map 17(MR5,Drawin g 20)
BMT WBM endeavours to ensure that the information provided in thismap is correct at the time of publication. BMT WBM does not warrant,guarantee or make representations regarding the currency andaccuracy of information contained in this map.
Filepath :
LEGEND
)
)
)
(
(
(
(
(
Lockyer Creek
Brisban
e Rive
r
Lake Wivenhoe Outflow
O'Reilly's Weir ALBuaraba Creek Alert
Glen o re Gro ve Alert
1 Tarampa
3 Lyons Bridge
5 Savages Crossing
2 Wivenhoe Tailwater
4 Lowood Pump Station
Flo o din g in h atch ed area n eeds to be verified with
th e Lo cal Co un cil Lowood
Fernvale
Coominya
Morton Vale
Mount Tarampa
Atkinsons Dam
Glamorgan Vale
Wivenhoe Pocket
B:\B20702 BRCFS Hydraulics\60_Mapping\MXD\MXD_OUTPUT\MR7\D0100\MR7-Map-17.mxd
Brisban e River Catch m en t Flo o d Study
Brisbane City CouncilIpswich City CouncilLockyer Valley Regional CouncilSomerset Regional CouncilSeqwater
Go o g le™earthIm ag e © 2015 Dig italGlo beIm ag e © 2015 Fug roIm ag e © 2015 Sin clair Kn ig h t Merz & Fug roIm ag e © 2015 CNES / Astrium
) Gauging Station
(Hydraulic AssessmentReporting LocationExtreme Flood(notional 1 in 100,000 AEP)Limit of Detailed Modelling
Study Partners
Refer to Councils for local flooding beyond limit
Depth x V elo city (m 2 /s)0 - 0.40.4 - 0.60.6 - 0.80.8 - 1.2>1.2
!
!
!
IPSWICH
BRISBANEWIV ENHOE DAM
Feb.2017
°0 1.5 3 4.5
KilometersMap Grid of Australia 1994, Zone 56
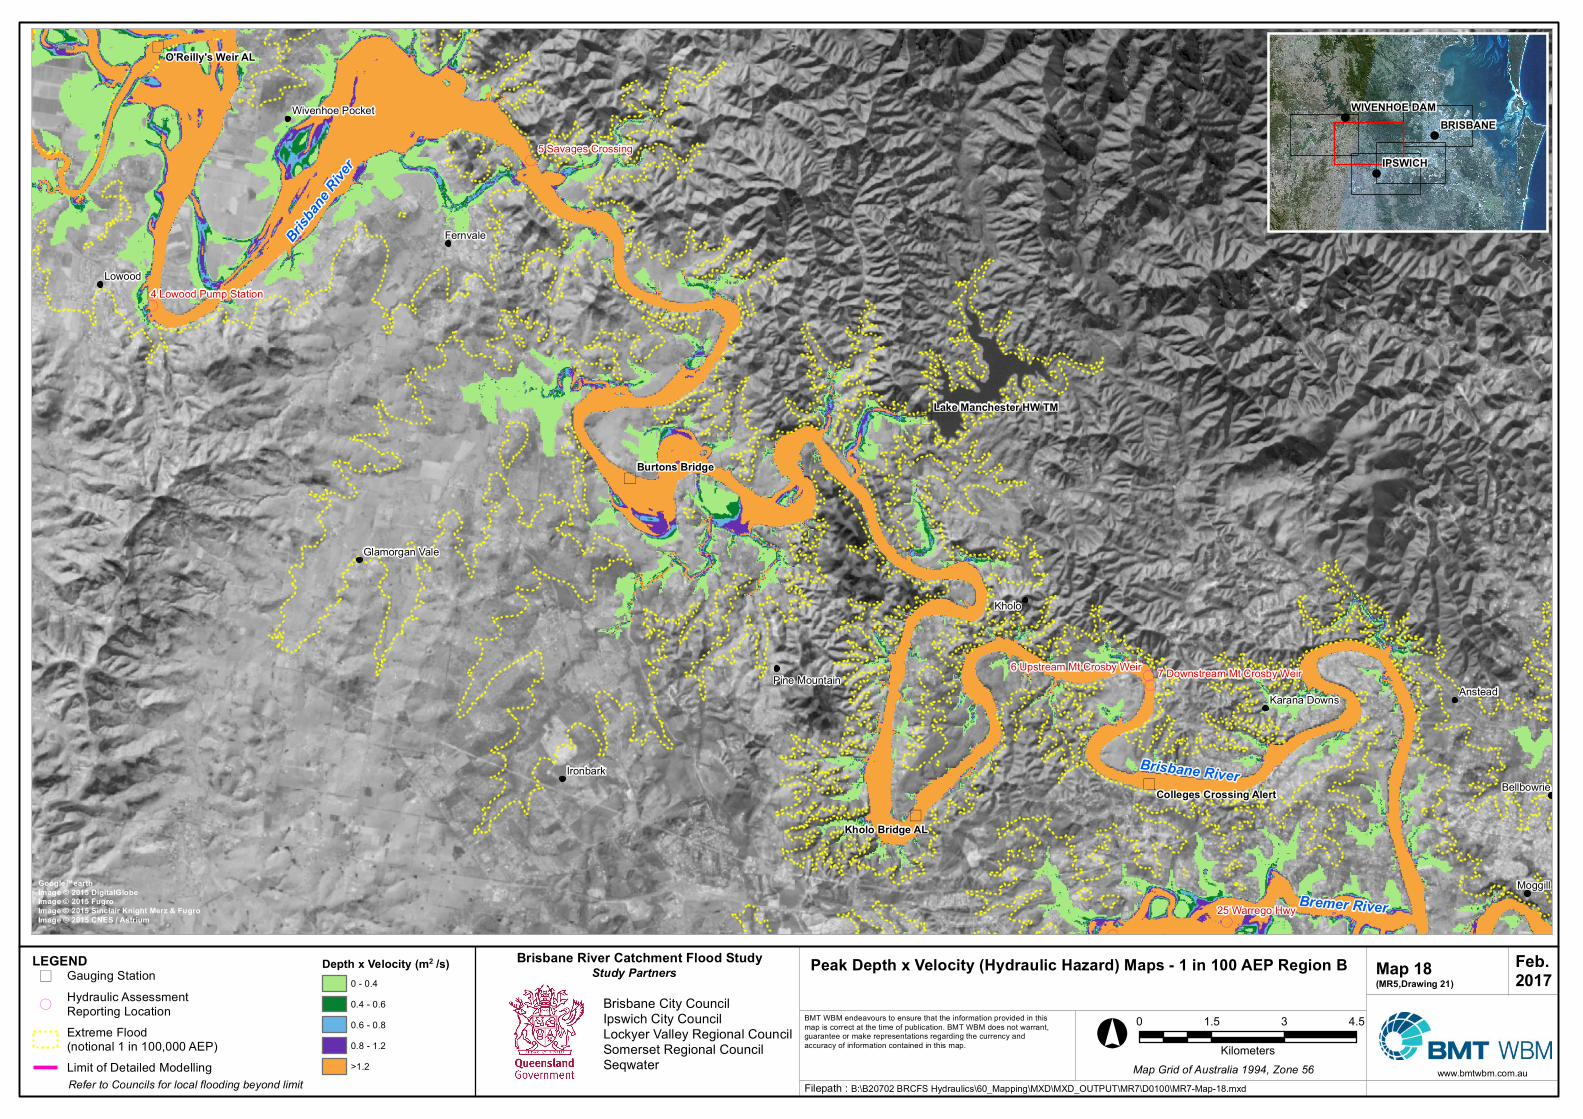
www.bmtwbm.com.au
Pe ak De pth x Ve locity (Hyd raulic Hazard ) Maps - 1 in 100 AEP Re g ion B Map 18(MR5,Draw in g 21)
BMT WBM endeavours to ensure that the information provided in thismap is correct at the time of publication. BMT WBM does not warrant,guarantee or make representations regarding the currency andaccuracy of information contained in this map.
Filepath :
LEGEND
)
)
)
)
)
(
(
((
(((
(
Brisban
e Rive
r
Bremer River
Brisbane River
Burton s Brid g e
Kholo Brid g e AL
O'Re illy's We ir AL
Lak e Man che ste r HW TM
Colle g e s Crossin g Ale rt
25 Warrego Hwy
5 Savages Crossing
4 Lowood Pump Station
6 Upstream Mt Crosby Weir 7 Downstream Mt Crosby Weir
Kholo
Lowood
Anstead
Moggill
Ironbark
Fernvale
Bellbowrie
Karana DownsPine Mountain
Glamorgan Vale
Wivenhoe Pocket
B:\B20702 BRCFS Hydraulics\60_Mapping\MXD\MXD_OUTPUT\MR7\D0100\MR7-Map-18.mxd
Brisban e Rive r Catchm e n t Flood S tud y
Brisbane City CouncilIpswich City CouncilLockyer Valley Regional CouncilSomerset Regional CouncilSeqwater
Goog le ™e arthIm ag e © 2015 Dig italGlobeIm ag e © 2015 Fug roIm ag e © 2015 S in clair Kn ig ht Me rz & Fug roIm ag e © 2015 CNES / Astrium
) Gauging Station
(Hydraulic AssessmentReporting LocationExtreme Flood(notional 1 in 100,000 AEP)Limit of Detailed Modelling
Study Partners
Refer to Councils for local flooding beyond limit
De pth x Ve locity (m 2 /s)0 - 0.40.4 - 0.60.6 - 0.80.8 - 1.2>1.2
!
!
!
IPS WICH
BRIS BANEWIVENHOE DAM
Fe b.2017
°0 1.5 3 4.5
KilometersMap Grid of Australia 1994, Zone 56
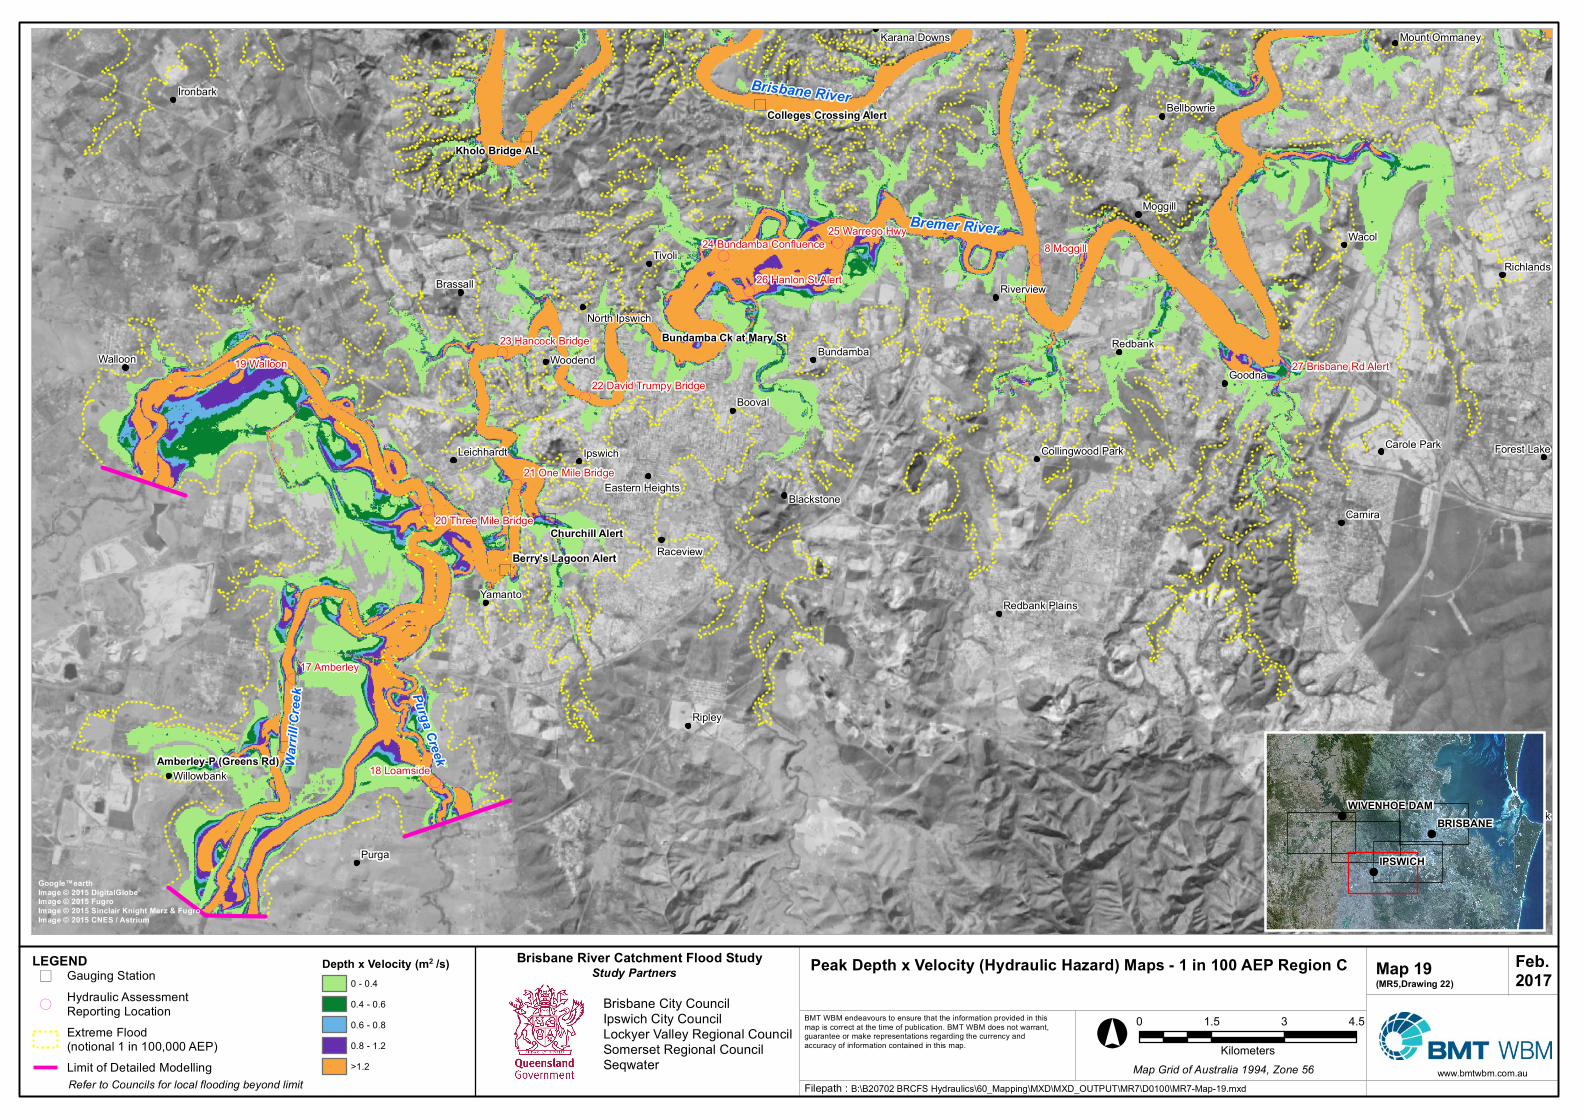
www.bmtwbm.com.au
Pe ak De pth x Ve lo city (Hydraulic Hazard) Maps - 1 in 100 AEP Re g io n C Map 19(MR5,Drawin g 22)
BMT WBM endeavours to ensure that the information provided in thismap is correct at the time of publication. BMT WBM does not warrant,guarantee or make representations regarding the currency andaccuracy of information contained in this map.
Filepath :
LEGEND
)
)
)
)
)
)
((
(
(
(
(
(
(
(
(
((
(
(
Bremer River
Warri
ll Cree
k Purga Creek
Brisbane River
Kh o lo Bridg e AL
Ch urch ill Ale rtBe rry's Lag o o n Ale rt
Am be rle y-P (Gre e n s Rd)
Bun dam ba Ck at Mary S t
Co lle g e s Cro ssin g Ale rt
8 Moggill
19 Walloon
18 Loamside
17 Amberley
25 Warrego Hwy
23 Hancock Bridge
26 Hanlon St Alert
21 One Mile Bridge
27 Brisbane Rd Alert
20 Three Mile Bridge
24 Bundamba Confluence
22 David Trumpy Bridge
Purga
WacolTivoli
Ripley
Camira
Goodna
Booval
Woodend
Yamanto
RedbankWalloon
Ipswich
Moggill
Raceview
Ironbark
Bundamba
Brassall Riverview
Greenbank
Richlands
Blackstone
Leichhardt
Willowbank
Bellbowrie
Carole Park Forest Lake
Karana Downs
North Ipswich
Mount Ommaney
Redbank Plains
Eastern Heights
Collingwood Park
B:\B20702 BRCFS Hydraulics\60_Mapping\MXD\MXD_OUTPUT\MR7\D0100\MR7-Map-19.mxd
Brisban e Rive r Catch m e n t Flo o d S tudy
Brisbane City CouncilIpswich City CouncilLockyer Valley Regional CouncilSomerset Regional CouncilSeqwater
Go o g le ™e arthIm ag e © 2015 Dig italGlo beIm ag e © 2015 Fug roIm ag e © 2015 S in clair Kn ig h t Me rz & Fug roIm ag e © 2015 CNES / Astrium
) Gauging Station
(Hydraulic AssessmentReporting LocationExtreme Flood(notional 1 in 100,000 AEP)Limit of Detailed Modelling
Study Partners
Refer to Councils for local flooding beyond limit
De pth x Ve lo city (m 2 /s)0 - 0.40.4 - 0.60.6 - 0.80.8 - 1.2>1.2
!
!
!
IPS WICH
BRIS BANEWIVENHOE DAM
Fe b.2017
°0 1.5 3 4.5
KilometersMap Grid of Australia 1994, Zone 56
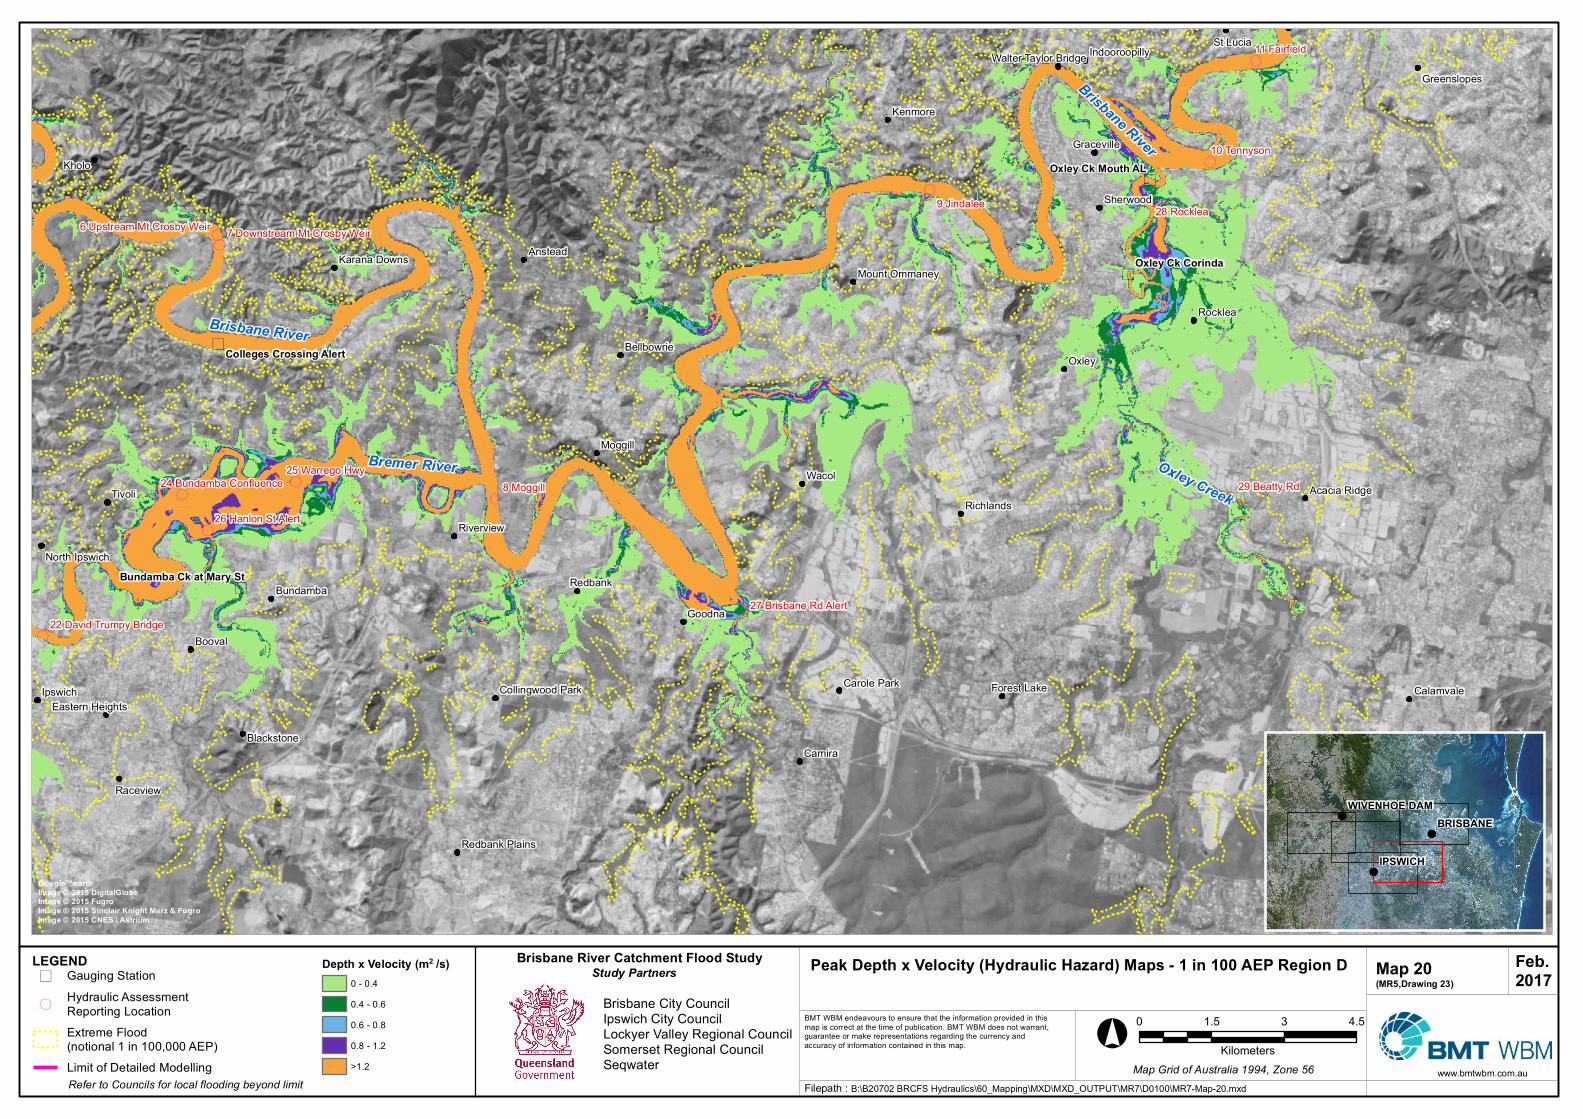
www.bmtwbm.com.au
Peak Dep th x V elo city (Hydraulic Hazard) Map s - 1 in 100 AEP Regio n D Map 20(MR5,Draw in g 23)
BMT WBM endeavours to ensure that the information provided in thismap is correct at the time of publication. BMT WBM does not warrant,guarantee or make representations regarding the currency andaccuracy of information contained in this map.
Filepath :
LEGEND
)
)
)
)
)
((
(
(
(
(
(
((
(
(
(
(
Bremer River
Brisbane River
Brisbane River
Oxley Creek
Oxley Ck Co rin da
Oxley Ck Mo uth AL
Bun dam ba Ck at Mary St
Co lleges Cro ssin g Alert
8 Moggill
28 Rocklea9 Jindalee
10 Tennyson
29 Beatty Rd
11 Fairfield
25 Warrego Hwy
26 Hanlon St Alert
27 Brisbane Rd Alert
24 Bundamba Confluence
22 David Trumpy Bridge
6 Upstream Mt Crosby Weir 7 Downstream Mt Crosby Weir
Oxley
Wacol
Kholo
Tivoli
Camira
Goodna
Booval
Kenmore
Anstead
Redbank
Rocklea
Ipswich
Moggill
Raceview
St Lucia
Bundamba
Sherwood
Riverview
Calamvale
Richlands
Blackstone
Bellbowrie
Graceville
Carole Park Forest Lake
Greenslopes
Karana Downs
Acacia Ridge
Indooroopilly
North Ipswich
Mount Ommaney
Redbank Plains
Eastern HeightsCollingwood Park
Walter Taylor Bridge
B:\B20702 BRCFS Hydraulics\60_Mapping\MXD\MXD_OUTPUT\MR7\D0100\MR7-Map-20.mxd
Brisban e River Catch m en t Flo o d Study
Brisbane City CouncilIpswich City CouncilLockyer Valley Regional CouncilSomerset Regional CouncilSeqwater
Go o gle™earthIm age © 2015 DigitalGlo beIm age © 2015 FugroIm age © 2015 Sin clair Kn igh t Merz & FugroIm age © 2015 CNES / Astrium
) Gauging Station
(Hydraulic AssessmentReporting LocationExtreme Flood(notional 1 in 100,000 AEP)Limit of Detailed Modelling
Study Partners
Refer to Councils for local flooding beyond limit
Dep th x V elo city (m 2 /s)0 - 0.40.4 - 0.60.6 - 0.80.8 - 1.2>1.2
!
!
!
IPSWICH
BRISBANEWIV ENHOE DAM
Feb.2017
°0 1.5 3 4.5
KilometersMap Grid of Australia 1994, Zone 56
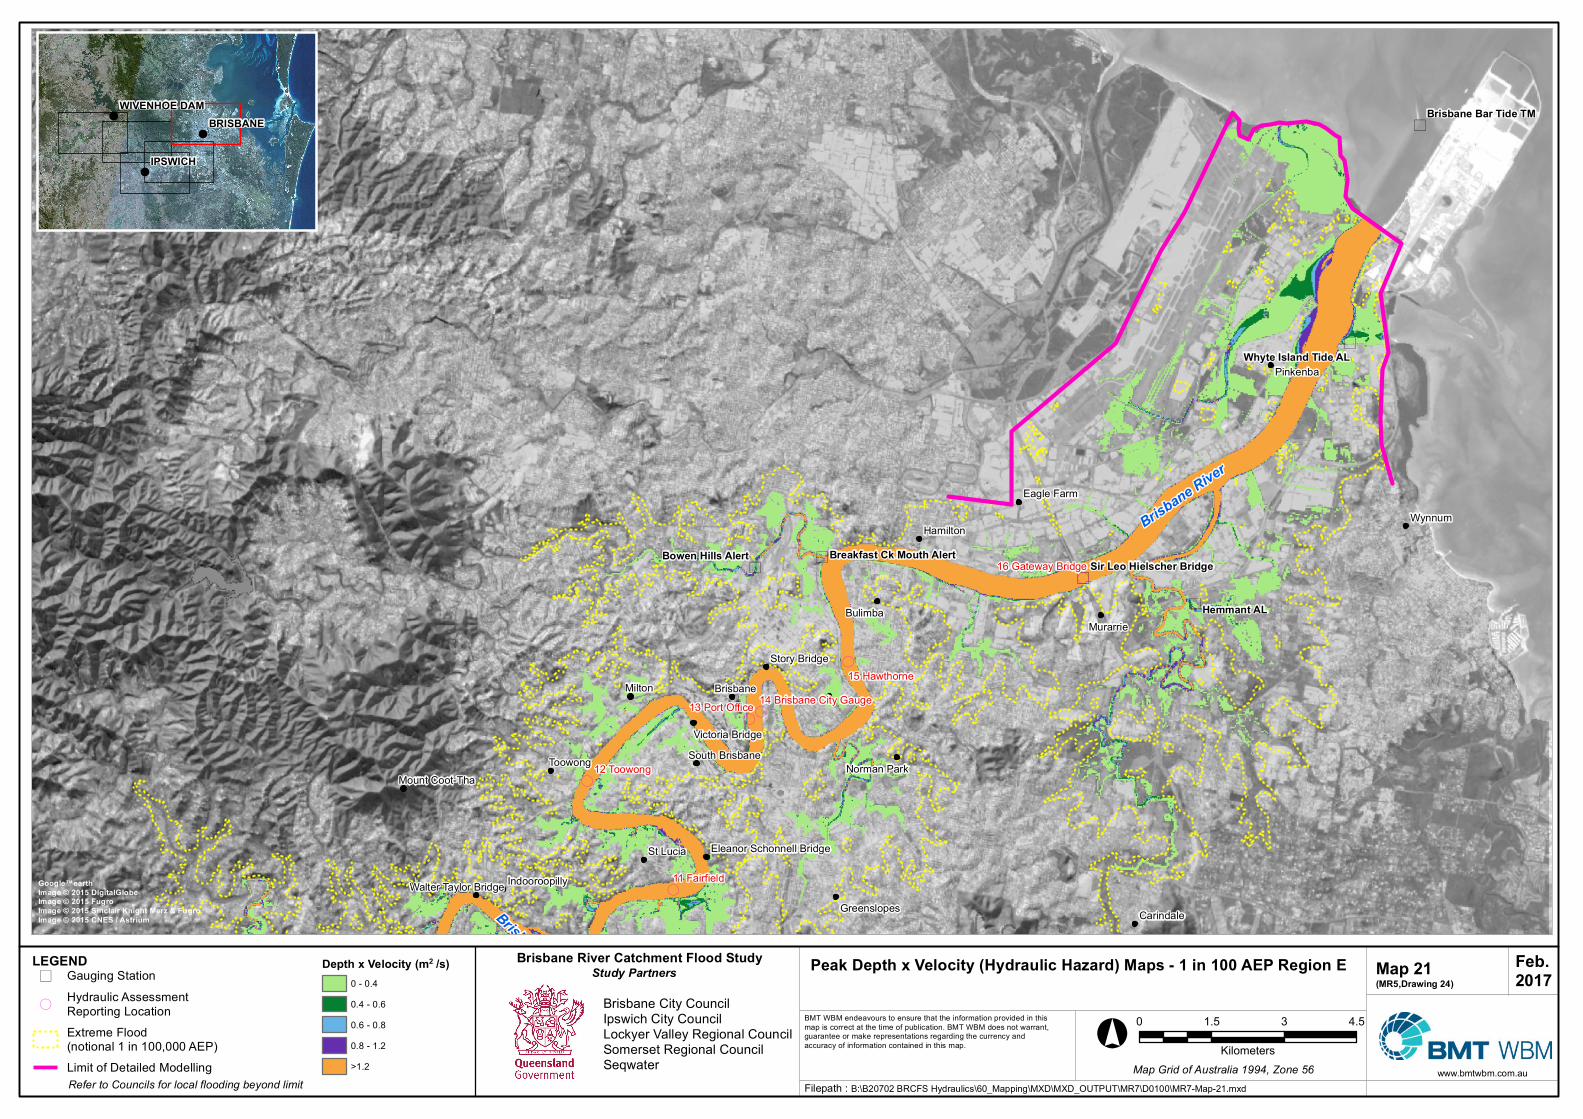
www.bmtwbm.com.au
Peak Depth x Velocity (Hydraulic Hazard) Maps - 1 in 100 AEP Reg ion E Map 21(MR5,Draw in g 24)
BMT WBM endeavours to ensure that the information provided in thismap is correct at the time of publication. BMT WBM does not warrant,guarantee or make representations regarding the currency andaccuracy of information contained in this map.
Filepath :
LEGEND
)
)
)
)
))
(
(
(
(
(
(
Brisbane River
Brisbane River
Hem m an t AL
Bow en Hills Alert
Brisban e Bar T ide T M
Whyte Islan d T ide AL
Break fast Ck Mouth AlertSir Leo Hielscher Bridg e
12 Toowong
15 Hawthorne
11 Fairfield
13 Port Office
16 Gateway Bridge
14 Brisbane City GaugeMilton
Wynnum
Toowong
BulimbaMurarrie
St Lucia
Hamilton
Pinkenba
Brisbane
Carindale
Eagle Farm
Greenslopes
Norman Park
Story Bridge
Indooroopilly
South BrisbaneMount Coot-Tha
Victoria Bridge
Walter Taylor Bridge
Eleanor Schonnell Bridge
B:\B20702 BRCFS Hydraulics\60_Mapping\MXD\MXD_OUTPUT\MR7\D0100\MR7-Map-21.mxd
Brisban e River Catchm en t Flood Study
Brisbane City CouncilIpswich City CouncilLockyer Valley Regional CouncilSomerset Regional CouncilSeqwater
Goog le™earthIm ag e © 2015 Dig italGlobeIm ag e © 2015 Fug roIm ag e © 2015 Sin clair Kn ig ht Merz & Fug roIm ag e © 2015 CNES / Astrium
) Gauging Station
(Hydraulic AssessmentReporting LocationExtreme Flood(notional 1 in 100,000 AEP)Limit of Detailed Modelling
Study Partners
Refer to Councils for local flooding beyond limit
Depth x Velocity (m 2 /s)0 - 0.40.4 - 0.60.6 - 0.80.8 - 1.2>1.2
!
!
!
IPSWICH
BRISBANEWIVENHOE DAM
Feb.2017
°0 1.5 3 4.5
KilometersMap Grid of Australia 1994, Zone 56

BMT WBM Bangalow 6/20 Byron Street, Bangalow 2479
Tel +61 2 6687 0466 Fax +61 2 66870422 Email [email protected] Web www.bmtwbm.com.au
BMT WBM Brisbane Level 8, 200 Creek Street, Brisbane 4000 PO Box 203, Spring Hill QLD 4004 Tel +61 7 3831 6744 Fax +61 7 3832 3627 Email [email protected] Web www.bmtwbm.com.au
BMT WBM Denver 8200 S. Akron Street, #B120 Centennial, Denver Colorado 80112 USA Tel +1 303 792 9814 Fax +1 303 792 9742 Email [email protected] Web www.bmtwbm.com
BMT WBM London International House, 1st Floor St Katharine’s Way, London E1W 1AY Email [email protected] Web www.bmtwbm.com
BMT WBM Mackay PO Box 4447, Mackay QLD 4740 Tel +61 7 4953 5144 Fax +61 7 4953 5132 Email [email protected] Web www.bmtwbm.com.au
BMT WBM Melbourne Level 5, 99 King Street, Melbourne 3000 PO Box 604, Collins Street West VIC 8007 Tel +61 3 8620 6100 Fax +61 3 8620 6105 Email [email protected] Web www.bmtwbm.com.au
BMT WBM Newcastle 126 Belford Street, Broadmeadow 2292 PO Box 266, Broadmeadow NSW 2292 Tel +61 2 4940 8882 Fax +61 2 4940 8887 Email [email protected] Web www.bmtwbm.com.au
BMT WBM Perth Level 3, 20 Parkland Road, Osborne, WA 6017 PO Box 1027, Innaloo WA 6918 Tel +61 8 9328 2029 Fax +61 8 9486 7588 Email [email protected] Web www.bmtwbm.com.au
BMT WBM Sydney Suite G2, 13-15 Smail Street, Ultimo, Sydney 2007 Tel +61 2 8960 7755 Fax +61 2 8960 7745 Email [email protected] Web www.bmtwbm.com.au
BMT WBM Vancouver Suite 401, 611 Alexander Street Vancouver British Columbia V6A 1E1 Canada Tel +1 604 683 5777 Fax +1 604 608 3232 Email [email protected] Web www.bmtwbm.com