Attachment - Downcomer Boiling Technical Summary.
18
Attachment
-
Upload
khangminh22 -
Category
Documents
-
view
3 -
download
0
Transcript of Attachment - Downcomer Boiling Technical Summary.

Attachment
Downcomer Boiling
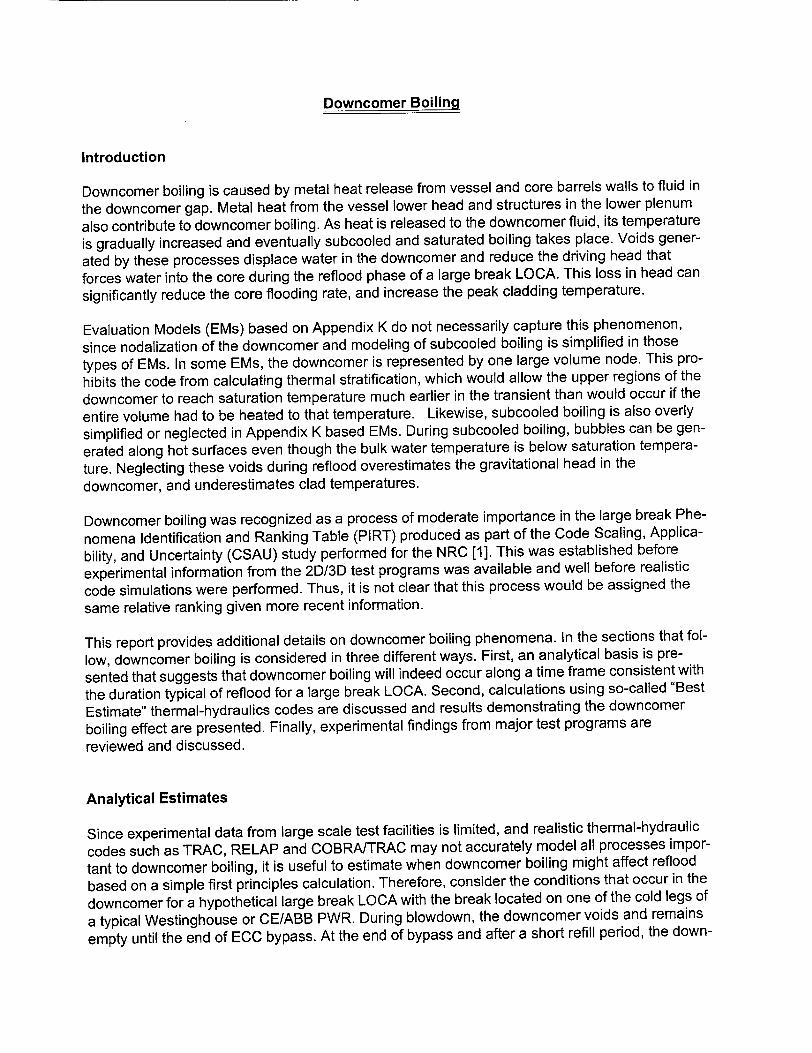
Introduction
Downcomer boiling is caused by metal heat release from vessel and core barrels walls to fluid in
the downcomer gap. Metal heat from the vessel lower head and structures in the lower plenum
also contribute to downcomer boiling. As heat is released to the downcomer fluid, its temperature
is gradually increased and eventually subcooled and saturated boiling takes place. Voids gener
ated by these processes displace water in the downcomer and reduce the driving head that
forces water into the core during the reflood phase of a large break LOCA. This loss in head can
significantly reduce the core flooding rate, and increase the peak cladding temperature.
Evaluation Models (EMs) based on Appendix K do not necessarily capture this phenomenon,
since nodalization of the downcomer and modeling of subcooled boiling is simplified in those
types of EMs. In some EMs, the downcomer is represented by one large volume node. This pro
hibits the code from calculating thermal stratification, which would allow the upper regions of the
downcomer to reach saturation temperature much earlier in the transient than would occur if the
entire volume had to be heated to that temperature. Likewise, subcooled boiling is also overly
simplified or neglected in Appendix K based EMs. During subcooled boiling, bubbles can be gen
erated along hot surfaces even though the bulk water temperature is below saturation tempera
ture. Neglecting these voids during reflood overestimates the gravitational head in the
downcomer, and underestimates clad temperatures.
Downcomer boiling was recognized as a process of moderate importance in the large break Phe
nomena Identification and Ranking Table (PIRT) produced as part of the Code Scaling, Applica
bility, and Uncertainty (CSAU) study performed for the NRC [1]. This was established before
experimental information from the 2D/3D test programs was available and well before realistic
code simulations were performed. Thus, it is not clear that this process would be assigned the
same relative ranking given more recent information.
This report provides additional details on downcomer boiling phenomena. In the sections that fol
low, downcomer boiling is considered in three different ways. First, an analytical basis is pre
sented that suggests that downcomer boiling will indeed occur along a time frame consistent with
the duration typical of reflood for a large break LOCA. Second, calculations using so-called "Best
Estimate" thermal-hydraulics codes are discussed and results demonstrating the downcomer
boiling effect are presented. Finally, experimental findings from major test programs are
reviewed and discussed.
Analytical Estimates
Since experimental data from large scale test facilities is limited, and realistic thermal-hydraulic
codes such as TRAC, RELAP and COBRA/TRAC may not accurately model all processes impor
tant to downcomer boiling, it is useful to estimate when downcomer boiling might affect reflood
based on a simple first principles calculation. Therefore, consider the conditions that occur in the
downcomer for a hypothetical large break LOCA with the break located on one of the cold legs of
a typical Westinghouse or CE/ABB PWR. During blowdown, the downcomer voids and remains
empty until the end of ECC bypass. At the end of bypass and after a short refill period, the down-

comer rapidly refills to the level of the cold legs with water from the accumulators. The bottom of
the core quenches at this time (BOC), and the reflood period begins.
Stored heat in thick metal structures is released slowly due to the thickness of the structures, and
wall-to-fluid heat transfer coefficients. The time necessary to raise a volume of fluid to saturation
can be estimated by considering transient conduction from a thick metal slab representing the
reactor vessel wall. Figure 1 shows the simplified geometry. The outer surface of the vessel is
represented as a slab, and is assumed to be well insulated. Heat transfer from the core barrel is
ignored. Nominal dimensions assumed for the downcomer gap Lgap and wall thickness Lw are
Lgap = Lw = 0.254 m (10 inches).
To simplify the calculation assume that the vessel wall temperature does not change significantly
during blowdown and refill, and that the initial downcomer water temperature is equal to the
accumulator temperature. Thus, at the start of reflood the vessel wall and downcomer water tem
peratures are approximately Tw, i = Told = 566 K (559 F), and Tf i = Tsi = 322 K (120 F).
At 0.138 MPa (20 psia), the saturation temperature is 382 K (228 F).
For a slab of thickness 2Lw, exposed to a sudden change in surface temperature on both sur
faces the Biot number is,
hLw Bi- kw
where kw is the thermal conductivity of the slab. (Note that this is the same as one should use for
a slab of thickness Lw with one of the surfaces insulated.) Assuming a thermal conductivity
kw = 40 W/m-K for carbon steel [23 and a wall to fluid heat transfer coefficient of h = 1200 W/
m2-K, the Biot number for the vessel wall is Bi = 7.6. (The heat transfer coefficient corresponds
to forced convection to liquid with a mean velocity of just under 0.2 m/s.) The high value of Bi
indicates that the process is conduction limited.
The internal energy change of the vessel wall necessary to raise the entire downcomer volume of
water to saturation can be estimated to be,
Qo= Mt'CpJ(Tsat- TSI) = Pf t(DvLg ap)Lgap =0.34
Q0 MwCp, w(Ti - Tsat) pw•7(D, - Lw,)LwH
for a vessel with an internal diameter of 3.99 m (157 inches). In this expression Mf represents
the downcomer fluid mass, and Mw the vessel wall metal mass.
Using Heisler charts such as Figure D.3 in Reference [2], the Fourier number, Fo = O~tILw ,
for this energy change is approximately, Fo = 0.16. The term a, represents the wall thermal
diffusivity. From these values of Bi and Fo, it can be shown that the temperature of the entire

volume of initially cold downcomer water can be raised to saturation in approximately 575 sec
onds from vessel wall stored heat alone.
This estimate represents a crude upper bound on the time it should take for downcomer boiling to
begin. Metal heat release from the core barrel wall and from structures in the lower plenum are
ignored, and the estimation assumes that all of the downcomer fluid must be brought to satura
tion before boiling begins. In actuality, thermal stratification of downcomer fluid will occur allowing
boiling to begin in the upper regions of the downcomer before the entire mass reaches satura
tion. Stored heat in the core barrel wall, neutron pads increase the rate at which the downcomer
fluid is heated. Thus, it is reasonable to expect that downcomer boiling effects will be apparent in
a transient within the first few hundred seconds.
Realistic Code Calculations
The issue of downcomer boiling was reported to the staff in by Westinghouse in two meetings, on
June 28, 2000 [3] and March 27, 2001 [4]. Westinghouse that noted in their large break LOCA
calculations using a realistic thermal-hydraulics code that a second reflood clad temperature
maximum and the PCT frequently occurred after several hundred seconds. This second reflood
peak was caused by voiding in the downcomer that occurred as fluid in the downcomer thermally
stratified and approached saturation.
Examples of downcomer boiling and their impact of large break LOCA calculations using Best
Estimate thermal-hydraulic codes are available in the public domain. Reference [5] documents a
calculation for a 4-loop Westinghouse PWR where downcomer boiling initiates a secondary
reflood temperature excursion and an increase in the peak cladding temperature. Figure 2 shows
the peak cladding temperatures on the hot rod, and other representative rods in the core. Each
rod shows three distinct peaks; a blowdown PCT which occurs a few seconds following the break
(which occurs at 20 seconds in the figure), a first reflood PCT which occurs between 95 and 110
seconds for all but the rods on the core periphery, and a second reflood PCT which occurs at 288
seconds.
Figure 3 shows liquid and saturation temperatures at a location near the bottom of the down
comer. The liquid becomes saturated at approximately 180 seconds. Just before fluid near the
bottom of the downcomer becomes saturated, the peak cladding temperature is seen to
increase. This increase continues and the PCT for this case is reached at 288 seconds. Thus,
this second reflood PCT, is a direct result of downcomer boiling and the loss in hydraulic head to
force liquid into the core. Comparing the first and second reflood PCTs, from Figure 2 shows the
increase in PCT as a result of downcomer boiling to be approximately 222 K (400 F). If down
comer boiling had not been accounted for, the PCT for this transient would have been the first
reflood PCT. The PCT "penalty" due to downcomer boiling therefore is APCT=+400 F.
The Watts Bar example is not unique to that particular unit or thermal-hydraulic code. Similar
effects can be seen for a CE/ABB System 80+ unit in References [5] and [6]. In Reference 5, a
recent version of RELAP5/MOD3 was used to make the simulations. Particularly significant in the
sensitivity studies performed in Reference 5 was the PCT response following downcomer boiling.
Figure 4 shows the average liquid level in the downcomer. (The three curves show in the figure
are for different time step size limits. For discussion, the study using a maximum time step size to
0.002 seconds is used as the reference.) Downcomer boiling began at 150 seconds, and imme
diately afterward there was a significant decrease in the downcomer water level. The PCT
response, shown in Figure 5, resulted an increase of approximately 450 K (810 F). Thus, for this

case the downcomer boiling "penalty" is APCT=+810 F. With regards to downcomer boiling, the
study reached the following conclusions:
(a) To capture downcomer boiling, a two-dimensional representation of the downcomer is
required. Conventional industry ECCS licensing models employing a single downcomer vol
ume are considered inadequate since they preclude the potential for downcomer boiling.
(b) Results of the calculations show that considerable downcomer boiling takes place at about
200 seconds when the accumulators empty. This boiling persists, with decreasing intensity,
until the core is eventually quenched by pumped flow injection. Quench times due to down
comer boiling are greatly extended, for example, to 1500 seconds into the event compared to
350 to 500 seconds for plants without downcomer boiling.
(c) PCTs may occur during very late reflood, exceeding the blowdown and early reflood peaks
currently computed by industry. PCTs may even exceed the 10 CFR 50.46 limit of 2200 F,
while the peak local oxidation is expected to also increase significantly due to the lengthy
time periods when the top of the core remains at elevated temperatures.
It should be noted that the study specifically applies to a CE/ABB System 80+ PWR, none of
which are in operation in the U.S. Thus, conclusion (c) should not be considered appropriate to
other reactor designs. Overall however, the study in Reference 3 indicates that downcomer boil
ing has a significant impact on a large break LOCA transient and ignoring the process will result
in an underprediction of the peak cladding temperature.
Reference 6 also simulated a CE System 80+ PWR. In that investigation, the WCOBRA/TRAC
thermal-hydraulic code was used to make the simulations. Figures 6 and 7 are from that study.
Downcomer boiling was predicted to begin before 200 seconds. After downcomer boiling began,
a second reflood PCT was reached at 420 seconds. The net loss of downcomer inventory due to
downcomer boiling is seen in Figure 7. From 150 to 250 seconds the collapsed liquid level
decreases reaching a minimum slightly before the PCT occurs. In this case, the first reflood PCT
at 82 seconds was 972 K (1290 F) and the second reflood PCT was 1007 K (1353 F). Thus, the
downcomer boiling "penalty" was APCT= 1007 - 972 = +35 K (+63 F). Compete core quench did
not occur until 950 seconds.
The magnitude of the increase in PCT in Reference 6 is much smaller than that in Reference 7
because of the decay heat models used in the analysis. In Reference 6 the 1971 ANS decay
heat standard with a 1.2 multiplier was used, while in Reference 7 the 1979 ANS decay heat
standard was used. As a result, the overall temperatures were much higher in the Reference 6
simulations and the results were sensitive to metal-water reaction and other non-linearities that
occur at temperatures above 1900 F.
Each of the calculations cited in this section demonstrate that downcomer boiling results in a sec
ond reflood PCT. The hydraulic head in the downcomer is significantly reduced when boiling
occurs, and the second PCT is direct result of the reduction in core flooding rate. In each case
discussed here, the second reflood PCT exceeded the first PCT. The magnitude of this differ
ence can be significant, and will depend on the specific plant; its power and safety system, and
on the code used to simulate the LOCA. The three cases cited show that prediction of down
comer boiling is not restricted to one particular thermal-hydraulic code, nor any one particular
type of PWR.

Experimental Verification
Experimental verification of downcomer boiling is limited. Most reflood test facilities have been
designed for low pressure operation. As a result, downcomer metal heat is non-conservatively
scaled in most facilities. In facilities with sufficient downcomer metal heat, an increase in cladding
temperatures and reduction in reflood rate is apparent. This section discusses experimental
results in which the effects of downcomer boiling has been observed.
The effect of downcomer wall temperature on reflood was investigated in the Cylindrical Core
Test Facility (CCTF). The CCTF is a 1/21.4 scale experimental facility representing a 1000 MWe
pressurized water reactor (PWR). It has a full height core, with four primary loops and their com
ponents. Two experiments were conducted which provide a sensitivity relevant to downcomer
boiling; Test C1-2 and C1-3. Test C1-2 was performed with the downcomer wall initially super
heated. The initial temperature was 460 K to provide approximately 70 K initial superheating.
Test C1-3 was performed with the downcomer wall initially at the saturation temperature of 388
K.
Figure 8 compares the downcomer void fractions, as evaluated from measured differential pres
sures at several elevations for these two tests. Since the flow rates in the downcomer are rela
tively low, the differential pressures are due to the static water head only. The test begins with
the downcomer empty, and the void fraction is high everywhere. After emergency core cooling
(ECC) injection the void fractions decrease, starting with the elevations near the bottom of the
downcomer. Of most interest, are the void fraction comparisons higher in the downcomer. After
100 seconds, the void fractions for the saturated wall test decrease to lower values than those in
the superheated wall test. This penalizes the core in two ways. First, as shown in Figure 9, the
total static head in the downcomer is lower in the superheated wall test than in the saturated wall
test, which reduced the core flooding rate. Second, as seen in Figure 10, the core inlet subcool
ing is less in the superheated wall test than in the saturated wall test, which decreases the core
heat transfer.
The effect of downcomer boiling on the core in CCTF Tests C1 -2 and C1 -3 was a slight increase
in the cladding temperatures, and an increase in the quench times. This is shown in Figure 11.
The increase in PCT and quench times are small because of the relatively low initial core temper
atures. Note in Figure 2, for an actual PWR, the clad temperatures following blowdown in the hot
assembly are much higher than those in CCTF. The effects become magnified as the clad tem
peratures increase above 1900 F and metal-water reaction becomes important.
A detailed description of the CCTF tests and the observed downcomer effect is provided by Ref
erence 7.
Another important evaluation concerning downcomer hydraulics during reflood was performed
using data from the Upper Plenum Test Facility (UPTF) [8]. Tests in UPTF provided experimental
data on the three-dimensional thermal-hydraulic behavior for a full scale PWR. The facility was
used to conduct separate effects tests with cold leg injection for a simulated cold leg break to
examine flows in the downcomer. The main objective of Test 25 was to investigate downcomer
water level and ECC entrainment to the break due to circumferential steam flow from the intact
loops. Conditions in the test were intended to represent those expected during the reflood period
of a large break LOCA.

The test itself consisted of two major steady state phases, each with several subperiods in which
the steam flow rate was varied. Phase A included four subperiods designed to address water
level and entrainment with superheated downcomer walls. In Phase B, one of the subperiods
was run with no wall superheat. (The other Phase B subperiods were designed to examine cold
leg flow regimes.)
The evaluation of Test 25 data concluded that downcomer water level and hence the driving
head available for core reflooding is affected by both ECC entrainment in the loop steam flow and
by boiling on superheated downcomer walls. Figure 12 shows an estimation of the downcomer
water level in a PWR. The report further concluded that assuming the downcomer remains com
pletely filled to the bottom of the cold leg nozzles during reflood is a nonconservative assumption,
but expected the increase in PCT due to downcomer boiling to be small based on a sensitivity
using CCTF data.
Scaling Considerations
Neither the CCTF nor the UPTF experiments investigating the downcomer boiling effect are com
pletely satisfactory. Both facilities were designed for maximum pressures typical of the refill and
reflood phases of a large break LOCA, and because of that design limitation were not capable of
initializing the downcomer with the superheat expected in a full scale PWR. As a result the down
comer boiling effect may be underestimated by the CCTF and UPTF data.
Figure 13, from Reference 8, compares the conduction-limited heat wall release for UPTF and a
typical PWR. Note that the PWR heat release is significantly greater than that in UPTF due to the
excess wall superheat available in the full scale plant. This can be expected to increase the void
ing in the downcomer during reflood and reduce the flooding rate well beyond that estimated by
the UPTF and CCTF data.
In order to quantify the differences between the CCTF and UPTF facilities and the PWR, a scal
ing ratio to indicate the potential for downcomer boiling to occur in a transient can be defined as
the ratio of the energy available in the surrounding metal walls to the energy necessary to raise
the downcomer water to saturation:
(MCp)wATSH _ MCp' .(Ti - Tsat) _ Energy available in DC metal
(MCp)fATsub MfCp,j( Tsat - TSi) Energy required to cause boiling
where, TI = wall initial temperature, Tsat = saturation temperature corresponding to contain
ment pressure during reflood, TSI = temperature of accumulator / safety injection water.
For a typical PWR, the initial downcomer wall temperature = Tcold, and reflooding occurs at 20
approximately psia. So,
"(Mcp)wATSH1 3.7
_(Mcp)fA Tsub _ P WR
For CCTF, using the maximum attainable test pressure, this value is,

[(MCp)wATSH] 1.0
L(Mcp) A TS~,bj CCTF
For UPTF, using values for Test 25, this value is,
L (MCp)wATSH] 0.72
(MCp)fATSb_- UPTF
Thus, in the PWR there is significantly more energy available for downcomer boiling than there
could have been in either CCTF or UPTF. The effect of downcomer boiling thus can be expected
to be greater in a PWR than that in the experiments. Therefore, downcomer boiling is non-con
servatively scaled in experiment relative to the PWR.
The only facilities that utilized an annular downcomer and were capable of initializing a down
comer walls with an appropriate amount of superheat were Semiscale and LOFT. Both facilities
were part height. The Semiscale Mod-I facility was intentionally scaled to be a counterpart test to
LOFT. Because the facilities were only part height, the transients took place faster than they
would at full scale. Quench generally occurred within 100 seconds following the break.
As part of the Semiscale MODI program [9] however, several tests were conducted to investi
gate reflood for a large break LOCA. In those tests, a second reflood peak, similar to that pre
dicted by realistic codes was observed. Figure 14 shows clad and fluid temperatures for
Semiscale Mod-I test S-04-5L. The downcomer reached saturation at approximately 100 sec
onds in this experiment. As soon as the downcomer boiling occurred, the clad temperatures
stopped decreasing, and began increasing again due to the loss of downcomer head. Quench
was significantly delayed.
Conclusions
Downcomer boiling is a physical process that has the effect of increasing the peak cladding tem
perature in a large break LOCA. It has been observed in experiments, but due to poor scaling of
the initial wall stored heat in reflood test facilities its effect on separate effects tests is significantly
less than what it may be in a hypothetical large break in a PWR. The downcomer boiling effect is
predicted to be significant by realistic codes such as WCOBRA/TRAC and RELAP. Both experi
mental and numerical studies have shown that neglecting downcomer boiling in a large LOCA is
a nonconservative assumption.
The findings discussed in this report are not meant to imply that calculations made using Appen
dix K based Evaluation Models underestimate the peak cladding temperature (PCT) or equiva
lent clad reacted (ECR) in a large break LOCA. Appendix K requires the use of the 1971 ANS
decay heat standard, which is known to be very conservative. Appendix K also requires several
other conservative modeling assumptions. The conservatism associated with the 1971 decay
heat model and these other Appendix K requirements sufficiently compensates for the down
comer boiling effect.

References
[1] Technical Program Group, "Quantifying Reactor Safety Margins, Application of Code Scaling
Applicability, and Uncertainty Methodology to a Large Break Loss of Coolant Accident," NUREG/
CR-5249, December 1989.
[21 Holman, J. R., Heat Transfer, McGraw Hill, 4th Ed., 1976.
[3] Memorandum from G. S. Shukla, Project Manager, Section 2, PDIV&D, to S. A. Richards,
Director, PDIV&D, "Summary of March 27, 2001 Meeting with Westinghouse on Downcomer
Boiling Modeling," April 16, 2001.
[4] Watts Bar Nuclear Plant Final Safety Analysis, UFSAR Amendment 2.
[5] Palazov, V. V., and Ward, L. W., "A System 80+ RELAP5/MOD3 Model for Downcomer Boil
ing Following a Large Break LOCA," ISL-NSAD-NRC-01-009, Jan. 2002.
[6] Pottorf, J., and Bajorek, S. M., "Large Break LOCA Safety Injection Sensitivity for a CE/ABB
System 80+ PWR," Proc. of the 10th International Conference on Nuclear Engineering,
ICONE10-22519, April 2002.
[7] MPR Associates, Inc., "Research Information Report on the Results of the Core I Test Series
at the Japan Atomic Energy Research Institute Cylindrical Core Test Facility, " MPR-863, Octo
ber 1985.
[8] MPR Associates, Inc., "Summary of Results From the UPTF Downcomer Separate Effects
Tests, Comparison to Previous Scaled Tests, and Application to U. S. Pressurized Water Reac
tors, " MPR-1163, July 1990.
[9] Ball, L. J., Dietz, K. A., Hanson, D. J., and Olson, D. J., "Semiscale Program Description,
NUREG/CR-0172, May 1978.
Lgap L Adiabatic Adiabaticl
H Tsi,i = 322 K Tw,' = 566K
h
Figure 1. Transient Conduction in Vessel Wall.

A-HOT ROD 9---- HOT ASSEMBLY ROD ----- GUIDE TUBES
I ---- SUPPORT COLUMNS E .------ LOW POWER REGION
1800- -
1600
1400
1200 -" .
1000 - _ _
CL800 K -E
I-I 600 ,
400 - --
200 -
Figure 2. Watts Bar FSAR Peak Cladding Temperature (PCT) [4].

A- LIQUID TEMPERATURE IN CHANNEL 5/2 s---- SATURATION TEMPERATURE IN CHANNEL 5/2
700
I
600 -_ _ _ _ _ _ _
- !
-
I
La 500
1, 00 1 1 1 A-1 2 4o00
-o5 1 0 20 5
Figure 3. Watts Bar FSAR Downcomer Fluid Temperature and Saturation Temperature [4].

25
j20
115
10
so5 100 150 200 ý250 300 350 'n me 01)
Figure 4. Predicted Downcomer Water Level for CE System 80+ PWR Using RELAP5/MOD3 [5]
I
1750
1500
1250
1000
750
500
0 200 400 600 800 1000 1200 1400 -nime(s)
Figure 5, Predicted POT Response for CE System 80+ PWR Using RELAP5/MOD3 [5].
,3 r% n

480
460
V
"440 L
O 420 Q1)
E 400
"5 380
360
340
1100
C_
E 0) E
F
FE
n
Time (s)
Figure 6. Downcomer liquid and saturation temperatures for CE System 80+ using WCOBRA/TRAC [6]. The downcomer fluid reaches saturation at approximately 160 seconds.
10
2•2
0
0 I I I I I I I I I I
0 200 400 600 800 100 1200 Time (s)
Figure 7. Downcomer collapsed liquid level for CE System 80+ using WCOBRA/TRAC [6].

1.0
0.5
50 t00 150 200
Time after flood250
(S)Figure 8. Effect of Downcomer Wall Temperature on Core Void Fraction [7].
40
30
20
10
Oto
00.
I , , ,10
100 200 300 400 500
Time after flood (s) Figure 9. Comparison of Core Inlet Subcooling in CCTF Tests C1-2 and C1-3 [7].
C 0
0 �m.
'4-.
C
0 U

80
"S'll-ov level (Bottom of cold leg nozzle) 10
40 " Superheated waIl test
Saturated wall test f20S2
t00 200 300 400 500 Time after flood (s)
Figure 10. Comparison of Downcomer Water Head in CCTF Tests C1-2 and C1-3 [7].
1300 •
!100 - Superheated wall test 1600 - Saturated wall test
2.44 m 1300 2900
9N.. i.Elevation 010 70 1.83 °
5•zt . _ 00 N- 0 38 300
Time after flood (s )
Figure 11. Comparison of Clad Temperatures in CCTF Tests C1-2 and C1-3 [7].

5.
0 ,J
44a
-'U
I-
0 •
0Downcomer Liquid. Level.
(Aecc= 240 kg/s) Ali - 2.8 m
AH - 2.6 -m
Tfime After Downcomer'Fills (S)
Figure 12. Estimated PWR Downcomer Water Level During Reflood [8].

30 T u t1 137*C. S]To S.
Downcomer Diameter - 4.5 m
25*
Typical PWR,.[Carbon steel vessel wall 20t O ; Stainless steel core barrel (t= 55mm); Effective height= Sm; Tj= 2870 C]
cc
8
10Sucoe onmeInetr6 10•/ //••:/// •/--PWR Heat Release fo.r "•
LU
UPTF [Stainless steel vessel-wail (t= 55 mm) 2 and core barre.1.(t= - 5 m) Effective,
• hei ght = 3 m; Ti:- 2130(l
0 "0 0100 200 300 400 O0 600
Time After Down[comer Fislls (s)
Figure 13. Conduction-Limited Wall Heat Release Rate in the Downcomer for UPTF and a Typical PWR [8].

Semiscale S-04-5L
2
"Time (s)
Figure 14. Clad temperatures in Semiscale Mod-I Test S-04-5L. The downcomer fluid reaches
saturation at approximately 120 seconds.