Gold Nanoparticles Tethered to Gold Surfaces Using Nitroxyl Radicals
Upload
khangminh22Category
view
0download
0
INITIAL ASSESSMENT
TECHNICAL REPORT SUMMARY
for the
GOLDEN MILE PROPERTY
MINERAL COUNTY, NEVADA
for
GRC NEVADA INC.
(a wholly-owned subsidiary of Fortitude Gold Corp.)
Signed by:
FRED H. BROWN, PGeo Consulting Geologist, Independent BARRY D. DEVLIN, PGeo Vice President, Exploration, Fortitude Gold Corp. JOY L. LESTER, SME-RM Chief Geologist, Fortitude Gold Corp.
Effective Date: September 30, 2021 Report Date: November 9, 2021
2021 INITIAL ASSESSMENT TECHNICAL REPORT SUMMARY FOR THE GOLDEN MILE PROPERTY, NEVADA
1
TABLE OF CONTENTS
1 EXECUTIVE SUMMARY …………………………………………………………………………………………………………….10
1.1 Introduction ...………………………………………………………………………………………………………….10
1.2 Property Description and Ownership .………………………………………………………………………10
1.3 Geology and Mineralization ….……….……………………………………………………………………….11
1.4 Exploration .……………………………………………………………………………………………………………12
1.5 Metallurgical Testing ………………………………………………………………………………………………..12
1.6 Mineral Resource Estimates ……………………………………………………………………………………13
1.7 Interpretation and Conclusions ....……………………………………………………………………14
1.8 Recommendations ………………………………………………………………………………………………..15
2 INTRODUCTION …………………………………………………………………………………………………………….17
2.1 Terms of Reference and Purpose of Report …………………………………………...……………..17
2.2 Qualifications of Qualified Persons ……………………………………………………………………….17
2.3 Details of Inspection ………………………………………………………………………………………………..19
2.4 Sources of Information ………………………………………………………………………………………………..19
2.5 Effective Date …………………………………………………………………………………………………………….19
2.6 Units of Measure ………………………………………………………………………………………………..19
3 PROPERTY DESCRIPTION ………………………………………………………………………………………………..20
3.1 Property Location ………………………………………………………………………………………………..20
3.2 Mineral Titles …….………………………………………………………………………………………………………22
3.3 Royalties, Agreements and Encumbrances …………………………………………………………..31
3.4 Environmental Liabilities and Permitting …………………………………………………………..32
3.4.1 Environmental Liabilities ……………………………………………………………………….32
3.4.2 Required Permits and Status ……………………………………………………………………….32
3.5 Other Significant Factors and Risks ……………………………………………………………………….35
4 ACCESSIBILITY, CLIMATE, LOCAL RESOURCES, INFRASTRUCTURE AND PHYSIOGRAPHY …………36
4.1 Topography, Elevation and Vegetation ……………………………………………………………………….36
4.2 Accessibility and Transportation to the Property ………………………………………………36
4.3 Climate …………………………………………………………………………………………………………………………37
4.4 Sufficiency of Surface Rights ……………………………………………………………………………………37
4.5 Infrastructure Availability and Sources ……………………………………………………………………….38
4.5.1 Power …………………………………………………………………………………………………………….38
4.5.2 Water …………………………………………………………………………………………………………….38

2021 INITIAL ASSESSMENT TECHNICAL REPORT SUMMARY FOR THE GOLDEN MILE PROPERTY, NEVADA
2
5 HISTORY …………………………………………………………………………………………………………………………39
5.1 Prior Ownership and Ownership Changes …………………………………………………………..39
5.2 Historical Exploration and Development …………………………………………………………..40
5.2.1 Early Exploration Work ……………………………………………………………………………………42
5.2.2 Teck …………………………………………………………………………………………………………….44
5.2.3 Cordex …………………………………………………………………………………………………………….45
5.2.4 Portage …………………………………………………………………………………………………………….48
5.2.5 Roscan …………………………………………………………………………………………………………….48
5.2.6 NMPII …………………………………………………………………………………………………………….49
5.2.7 Kinross …………………………………………………………………………………………………………….49
5.3 Geophysics ……………………………………………………………………………………………………………;52
5.4 Historical Production ………………………………………………………………………………………………..54
6 GEOLOGICAL SETTING, MINERALIZATION AND DEPOSIT ………………………………………………55
6.1 Regional Geology ………………………………………………………………………………………………..55
6.2 Local and Property Geology ……………………………………………………………………………………58
6.2.1 Lithology ………………………………………………………………………………………………..61
6.2.1.1 Sedimentary Rocks ……………………………………………………………………….61
6.2.1.2 Volcanic Rocks ……………………………………………………………………………………62
6.2.1.3 Intrusive Rocks ……………………………………………………………………………………63
6.2.2 Structural Geology ……………………………………………………………………………………64
6.2.3 Alteration and Mineralization ……………………………………………………………………….69
6.2.3.1 Main Zone ……………………………………………………………………………………69
6.2.3.2 Stockwork Zones ……………………………………………………………………….70
6.2.3.3 Detailed Description of Skarn Alteration ………………………………….70
6.2.3.3.1 Exoskarn ………………………………………………71
6.2.3.3.2 Endoskarn ………………………………………………72
6.2.4 Petrography ………………………………………………………………………………………………..75
6.3 Deposit …………………………………………………………………………………………………………….80
6.3.1 Extents and Continuity ……………………………………………………………………………………80
7 EXPLORATION …………………………………………………………………………………………………………………………82
7.1 Exploration Work by GRCN ……………………………………………………………………………………82
7.1.1 Remote Sensing ……………………………………………………………………………………83
7.2 Drilling …………………………………………………………………………………………………………………………84
7.2.1 Core Drilling ………………………………………………………………………………………………..84
2021 INITIAL ASSESSMENT TECHNICAL REPORT SUMMARY FOR THE GOLDEN MILE PROPERTY, NEVADA
3
7.2.2 RC Drilling ………………………………………………………………………………………………..85
7.3 Downhole Surveying ……………………………………………………….……………………………………….85
7.4 GRCN Drilling Results ………………………………………………………………………………………………..85
7.4.1 Core Drilling Results ……………………………………………………………………………………86
7.4.2 RC Drilling Results ……………………………………………………………………………………88
7.5 Interpretation …………………………………………………………………………………………………………….90
8 SAMPLE PREPARATION, ANALYSIS AND SECURITY …………………………………………………………..92
8.1 Historic Procedures ………………………………………………………………………………………………..92
8.1.1 Cordex 2006 ………………………………………………………………………………………………..92
8.1.2 Roscan 2011 ………………………………………………………………………………………………..93
8.2 GRCN Procedures ………………………………………………………………………………………………..93
8.2.1 Security Measures ……………………………………………………………………………………93
8.2.2 Sample Preparation and Analysis …………………………………………………………..94
8.2.3 Quality Assurance/Quality Control Procedures ……………………………………………...94
8.2.4 Check Assays ………………………………………………………………………………………………100
8.3 Opinion on Adequacy ………………………………………………………………………………………………101
9 DATA VERIFICATION …………………………………………………………………………………………………………..102
9.1 Historic Property Evaluation and Data Verification …………………………………………….102
9.1.1 Teck …………………………………………………………………………………………………………..102
9.1.2 Cordex …………………………………………………………………………………………………………..102
9.1.3 Portage …………………………………………………………………………………………………………..103
9.2 GRCN Data Verification ………………………………………………………………………………………………104
9.2.1 GRCN Check Samples ………………………………………………………………………………….104
9.2.2 Drilling Database ………………………………………………………………………………….106
9.3 Opinion on Data Adequacy ………………………………………………………………………………….106
10 MINERAL PROCESSING AND METALLURGICAL TESTING …………………………………………….107
10.1 Historic Metallurgical Testing .…………………………………………………………………………………107
10.2 GRCN Metallurgical Testing …………………………………………………………………………………109
10.2.1 GRCN Initial Cyanide Bottle Roll Leach Testing ……..…………………………………….109
10.2.2 Metallic Screen Assays ……………………………….....................................................110
10.2.3 2021 Metallurgical Testing (KCA) …………………………………………………………112
10.2.3.1 Head Analyses ……………………………………………………………………..112
10.2.3.2 Head Screen Analysis with Assays by Size Fraction ……….117
10.2.3.3 Comminution Test Work …………………………………………….119

2021 INITIAL ASSESSMENT TECHNICAL REPORT SUMMARY FOR THE GOLDEN MILE PROPERTY, NEVADA
4
10.2.3.4 Characterization Test Work …………………………………………….119
10.2.3.5 Agglomeration Test Work …………………………………………….120
10.2.3.6 Percent Slump and Final Apparent Bulk Density ……………………121
10.2.3.7 Cyanide Bottle Roll Tests …………………………………………….122
10.2.3.8 Column Leach Test Work …………………………………………….126
11 MINERAL RESOURCE ESTIMATES ………………………………………………………………………………….129
11.1 Introduction ……………………………………………………………………………………………………….….129
11.2 Mineral Resource Definitions …………………………………………………………………………………129
11.2.1 Inferred Mineral Resource ………………………………………………………………………….130
11.2.2 Indicated Mineral Resource …………………………………………………………………………..130
11.2.3 Measured Mineral Resource ………………………………………………………………………...130
11.3 Database …………………………………………………………………………………………………………..130
11.3.1 Drill Data ………………………………………………………………………………………………132
11.4 Bulk Density …………………………………………………………………………………………………………..133
11.5 Wireframe Modeling ………………………………………………………………………………………………134
11.5.1 Topography ………………………………………………………………………………………………134
11.5.2 Mineralization Envelopes ………………………………………………………………..……136
11.6 Compositing ………………………………………………………………………………………………………..…136
11.7 Exploratory Data Analysis ………………………………………………………………………………….137
11.8 Treatment of Extreme Values ………………………………………………………………………………….138
11.9 Continuity Analysis ………………………………………………………………………………………………140
11.10 Block Model …………………………………………………………………………………………………………..141
11.11 Estimation and Classification ………………………………………………………………………………….141
11.12 Mineral Resource Estimate…………………………………………………………………………………………143
11.13 Mineral Resource Estimate Sensitivity ……………………………………………………………………..144
11.14 Risk Factors …………………………………………………………………………………………………………..145
11.15 Opinion on Adequacy ………………………………………………………………………………………………145
12 MINERAL RESERVE ESTIMATES ………………………………………………………………………………………………146
13 MINING METHODS …………………………………………………………………………………………………………..147
14 PROCESSING AND RECOVERY METHODS ……………………………………………………………………..148
15 INFRASTRUCTURE …………………………………………………………………………………………………………..149
16 MARKET STUDIES …………………………………………………………………………………………………………..150
17 ENVIRONMENTAL STUDIES, PERMITTING, AND PLANS, NEGOTIATIONS, OR AGREEMENTS WITH
LOCAL INDIVIDUALS OR GROUPS ………………………………………………………………………………………………151

2021 INITIAL ASSESSMENT TECHNICAL REPORT SUMMARY FOR THE GOLDEN MILE PROPERTY, NEVADA
5
18 CAPITAL AND OPERATING COSTS ………………………………………………………………………………….152
19 ECONOMIC ANALYSIS …………………………………………………………………………………………………………..153
20 ADJACENT PROPERTIES ………………………………………………………………………………………………154
20.1 Registrant Properties ………………………………………………………………………………………………154
20.1.1 Mina Gold ………………………………………………………………………………………………155
20.2 Adjacent Properties ………………………………………………………………………………………………155
21 OTHER RELEVANT DATA AND INFORMATION ……………………………………………………………………..156
22 INTERPRETATION AND CONCLUSIONS ………………………………………………………………………………….157
22.1 Interpretation …………………………………………………………………………………………………………..157
22.2 Conclusions ….……………………………………………………………………………………………………….158
23 RECOMMENDATIONS …………………………………………………………………………………………………………..160
23.1 Proposed Exploration Program ………………………………………………………………………………….160
23.2 Proposed Technical Studies ………………………………………………………………………………….162
24 REFERENCES ……………………………………………………………………………………………………………………….163
25 RELIANCE ON INFORMATION PROVIDED BY THE REGISTRANT……………………………………………….166
APPENDIX A: GLOSSARY …………………………………………………………………………………………………………..167
A.1 Definition of Terms ………………………………………………………………………………………………167
A.2 Abbreviations ……………………………………………………………………………………………………….….169
APPENDIX B: CERTIFICATES OF QUALIFIED PERSONS ……………………………………………………………………..171

2021 INITIAL ASSESSMENT TECHNICAL REPORT SUMMARY FOR THE GOLDEN MILE PROPERTY, NEVADA
6
LIST OF TABLES
Table 1.1 Mineral Resource Inventory at Golden Mile, Mineral County, NV, USA ……………………………………14
Table 1.2 Budget for Proposed Exploration Work at the Golden Mile Property ………………………………………16
Table 1.3 Budget for Proposed Technical Studies at the Golden Mile Property ………………………………………16
Table 3.1 List of Unpatented Lode Mineral Claims for the Golden Mile Property …………………………………….23
Table 3.2 List of Patented Mineral Claims for the Golden Mile Property ………………………………………………….31
Table 5.1 Summary of Historic Drilling Completed at the Golden Mile Property ……………………………………41
Table 5.2 Summary of Significant Historic Drilling Intercepts* …………………………………………………………………42
Table 5.3 Teck Significant Surface Rock Chip Samples (>500 ppb Au) ……………………………………………………..45
Table 5.4 Cordex Significant Surface Rock Chip Samples (>500 ppb Au) …………………………………………………46
Table 5.5 Significant Results from Cordex Drilling .……………………………….…………………………………………………47
Table 5.6 Significant Results from Roscan Drilling ………………………………..……………………………………………….49
Table 5.7 Significant Results from Kinross Drilling 2017-2019 …………………………………………………………………50
Table 5.8 Comparing average assay values for various parts of the Golden Mile Stock …………………..……..52
Table 5.9 1936 Production Assays …………………………….…………………………………………………………………………..54 Table 6.1 Summary Table of Petrography on Samples from Golden Mile ……………..................……………….77 Table 7.1 Summary of GRCN Drilling Completed at the Golden Mile Property ……………………………………….86 Table 7.2 Significant Results for GRCN 2020-2021 Core Drilling at Golden Mile ……………………………………..87 Table 7.3 Significant Results for GRCN 2021 RC Drilling at Golden Mile …………………………………………………89 Table 8.1 GRCN 2020-2021 Standard Reference Material (SRM) …………………………………………………………….94 Table 8.2 GRCN 2020-2021 QA/QC SRM Results for DDH Drill Holes ……………………………………………………..95 Table 8.3 GRCN 2020-2021 QA/QC Blanks Results for DDH Drill Holes …………………………………………………….96 Table 8.4 2020-2021 SRM Failures …………………………………………………………………………………………………………98 Table 8.5 2020-2021 Blank Material Failures ………………………………………………………………………………………….99 Table 9.1 Cordex Significant Rock Chip Samples (>500 ppb Au) …………………………………………………………….103 Table 9.2 Portage Rock Chip Samples (>500 ppb Au) …………………………………………………………………………….104 Table 9.3 GRCN Rock Chip Check Samples …………………………………………………………………………………………….105 Table 10.1 Cyanide Bottle Roll Tests on Pulverized Material ………..........……………………………………………..108 Table 10.2 GRCN Initial Cyanide Bottle Roll Tests on Pulverized Material ……………………………………………..108 Table 10.3 Metallic Screen Assays on Pulverized Material ……………………………………………………………………111 Table 10.4 Golden Mile Composite Core Samples Selected for Metallurgical Testing …………………………..112 Table 10.5 Gold Head Analyses for Golden Mile Sample Composites …………………………………………………….113 Table 10.6 Silver Head Analyses for Golden Mile Sample Composites ………………………………………………….113 Table 10.7 Mercury and Copper Head Analyses for Golden Mile Sample Composites ………….......………..113 Table 10.8 Carbon and Sulfur Head Analyses for Golden Mile Sample Composites ...................…………..114 Table 10.9 Head Analyses – Multi-Element ...................……………………………………………………………………….115 Table 10.10 Head Analyses - Whole Rock ..................…………………………………………………………………………..116 Table 10.11 Head Analyses – Cyanide Shake Tests ...................…………………………………………………………….117 Table 10.12 Summary of Head Screen Analyses …………………………………………………………………………………..118 Table 10.13 Summary of Comminution Test Work ...................……………………………………………………………119 Table 10.14 Summary of QXRD Analyses ...................…………………………………………………………………………..119 Table 10.15 Summary of Agglomeration Test Work ...................………………………………………………………….121 Table 10.16 Percent Slump and Final Apparent Bulk Density ....................…………………………………………….121 Table 10.17 Summary Direct Agitated Cyanidation (Bottle Roll) Gold-and Silver Test Results ..…………….123

2021 INITIAL ASSESSMENT TECHNICAL REPORT SUMMARY FOR THE GOLDEN MILE PROPERTY, NEVADA
7
Table 10.18 Summary of Metal Extractions and Chemical Consumptions – Gold ………………..………………127 Table 10.19 Summary of Metal Extractions and Chemical Consumptions – Silver…………………..……………127 Table 11.1 Golden Mile Drill Hole Database Summary ………………………………………………………………………….131 Table 11.2 Golden Mile Assay Database Summary ……………………………………………………………………………….131 Table 11.3 Summary Assay Statistics ……………………………………………………………………………………………………133 Table 11.4 GCP Geolocation Errors……………………………………………………………………………………………………….135
Table 11.5 Constrained Composite Statistics for Gold Values………………………………………………………………..137
Table 11.6 Capping Thresholds…………………………………………………………………………………………………………….140
Table 11.7 Block Model Setup………………………………………………………………………………………………………………141
Table 11.8 Parameters Used for Mineral Resources Cutoff Calculation………………………………………………….143
Table 11.9 Mineral Resource Inventory at Golden Mile, Mineral County, Nevada, USA ………………………..144
Table 11.10 Cutoff Grade Sensitivity for the Golden Mile Deposit …………………………………………………………144
Table 11.11 Mineral Resource Estimation Risk Factors………………………………………………………………………….145
Table 23.1 Budget for Proposed Exploration at Golden Mile Property …………………………………………………161
Table 23.2 Budget for Proposed Technical Studies at Golden Mile Property …………………………………………162

2021 INITIAL ASSESSMENT TECHNICAL REPORT SUMMARY FOR THE GOLDEN MILE PROPERTY, NEVADA
8
LIST OF FIGURES
Figure 3.1 General Location Map of the Golden Mile Property ……………………………………………………………….21
Figure 3.2 Golden Mile Property Mineral Claims Map ……………………………………………………………………………22
Figure 3.3 Hydrographic Basins in the Golden Mile Property area …………………………………………………………34
Figure 4.1 Golden Mile Property Access………………………………………………………………………………………………….37
Figure 5.1 Location Map of Historic Drill Holes Completed on the Golden Mile Property …………………………41
Figure 5.2 Photos looking North at Main Zone of Golden Mile Property ………………………………………………….43
Figure 5.3 Location Map of Geophysical Surveys Completed on the Golden Mile Property ……………………..53
Figure 6.1 Generalized Geologic Map of Nevada showing location of Golden Mile Property ………………….56
Figure 6.2 Shaded relief map of western North America with state boundaries in white..………………………57
Figure 6.3 Geologic Map of the Golden Mile Property Area …………………………………………………………………….59
Figure 6.4 Schematic cross-section looking northeast at Golden Mile ..………………………………………………….60
Figure 6.5 Geologic Map of the Main Zone Deposit Area of the Golden Mile Property
………………………………………………………………………………………………………………………………………………………………60
Figure 6.6 Stratigraphic Column showing Geology and Alteration at the Golden Mile Property
………………………………………………………………………………………………………………………………………………………………61
Figure 6.7 Magnetite-Copper Skarn of the Main Zone at Golden Mile….………………………………………………..62
Figure 6.8 Road Fault mylonite breccia (Hole GMDD-13 @ 315 ft) ………………………………………………………….65
Figure 6.9 3D Structural Interpretation of the Southwest, Central and Northeast Structural Grade Zones of
the Main Zone at Golden Mile………………………..………………………………………………………………………………………66
Fig. 6.10 Examples of high-grade gold intercepts from the Center Grade Zone………………………………………67
Figure 6.11 Conceptual Structural Model showing the structural fabrics of faults and veins related to splays
the dextral-slip Road Fault model…………………………………………………………………………………………………………..68
Figure 6.12 Alteration and Mineralization Types Observed at Golden Mile …………………………………………..74
Figure 6.13 Photomicrographs of Typical Skarn from Golden Mile (Sample GR-427……………….………………79
Figure 6.14 Conceptual Model for Formation of the Golden Mile Deposit …………………………………………….81
Figure 7.1 Resource Areas and Drill Ready Targets Identified on the Golden Mile Property …………………..82
Figure 7.2 Golden Mile Property Map Highlighting Hydrothermal Alteration and Exploration Target Areas
………………………………………………………………………………………………………………………………………………………………84
Figure 7.3 Location Map for Diamond Core (including MET) and RC Holes Drilled by GRCN at the Main Zone
of the Golden Mile Property ………………………………………………………………………….………………………………………86
Figure 8.1 2020-2021 SRM Performance for DDH …………………………………………………………………………………..98
Figure 8.2 2020-2021 SRM Performance for RC ………………………………………………………………………………………99
Figure 8.3 2020-2021Blank Material Performance………………………………………………………………………………..100
Figure 8.4 Au Field Duplicate Control Plot……………………………………………………………………………………………..101
Figure 8.5 Au Min Max Field Duplicate Control Plot……………………………………………………………………………...101
Figure 9.1 Location Map of GRCN Rock Chip Check Samples Collected from the Golden Mile Property …105
Figure 10.1 Example of Cyanide Bottle Roll Test Results for GRCN Check Sample #3082802 …………………110
Figure 10.2 Head Screen Analyses Showing Cumulative Weight Percent Passing Crush Size ...............…118
Figure 10.3 Overall Gold Extraction for the Golden Mile Bottle Roll Tests………………….…………………………124

2021 INITIAL ASSESSMENT TECHNICAL REPORT SUMMARY FOR THE GOLDEN MILE PROPERTY, NEVADA
9
Figure 10.4 Bottle Roll Test Results Showing % Gold Extraction During Leach Period …………………………..125
Figure 10.5 Bottle Roll Test Results Showing % Silver Extraction During Leach Period .. ……………………….125
Figure 10.6 Column Leach Test Apparatus ……………………………………………………………………………………………126
Figure 10.7 Cyanide Leach Test Work. Gold Extraction vs. Days of Leach ...................………………………….127
Figure 11.1 3D Isometric View Looking Northwest at Golden Mile Drill Holes ………………………………………132
Figure 11.2 Plot of RQD vs. Elevation…………………………………………………………………………………………………….134
Figure 11.3 Aerial Photometry with Ground Control Points…………………………………………………………………..135
Figure 11.4 3D Isometric Geologic Model View Looking Northwest showing the Main Zone are of the
Golden Mile Property ………………………………………………………………………………………………………………………….136
Figure 11.5 Plot of Constrained Assay Sample Lengths………………………………………………………………………….137
Figure 11.6 RC vs. DDH Drilling Results…………………………………………………………………………………………………138
Figure 11.7 Log-Probability Plots of Composite Capping Thresholds……………………………………………………..139
Figure 11.8 Main Zone Variography ……………………………………………………………………………………………………..140
Figure 11.9 Typical Cross-section of Golden Mile Main Zone Looking NW Showing Gold Grades ……..….142
Figure 11.10 3D Isometric View of the Optimized Pit Shell for Golden Mile Deposit ……………………………..143
Figure 20.1 Map of the Properties in the Vicinity of the Golden Mile Property ………………………………………154

2021 INITIAL ASSESSMENT TECHNICAL REPORT SUMMARY FOR THE GOLDEN MILE PROPERTY, NEVADA
10
1 EXECUTIVE SUMMARY
1.1 Introduction
This is an Initial Assessment Technical Report Summary (TRS) for GRC Nevada Inc. (GRCN), a wholly-owned
subsidiary of Fortitude Gold Corporation (FGC), on its 100%-controlled Golden Mile property, an advanced
exploration property in Mineral County, Nevada. The report provides a summary of the detailed
assessment of Mineral Resources and other relevant considerations of the Golden Mile property.
On October 31, 2018, the SEC announced that it was adopting amendments to modernize the property
disclosure requirements for mining registrants, and related guidance, under the Securities Act of 1933 and
the Securities Exchange Act of 1934. Under the new rules (“New Rules”), a registrant with material mining
operations must disclose specified information in Securities Act and Exchange Act filings concerning its
Mineral Resources, in addition to its Mineral Reserves. The new rules required a registrant to comply with
the new rules during its first fiscal year beginning on or after January 1, 2021. GRCN and FGC have adopted
the New Rules as required and will disclose the estimate of resources contained herein in a future SEC
filing.
1.2 Property Description and Ownership
The Golden Mile property is located within the Bell Mining District (also known as the Cedar Mountain
District), Mineral County, west-central Nevada. The property lies along the northeast foothills of the Cedar
Mountain Range and the closest towns with full services are Hawthorne located 80 km (50 mi) to the west
and Tonopah located 88 km (55 mi) to the southeast. The property has good connections to the
infrastructure of west-central Nevada, with access roads to the property linking to Nevada state route 361
and US Route 95, the main highway between Reno and Las Vegas. The approximate center of the Main
Zone deposit area on the Golden Mile property is Latitude 38° 30.69' North and Longitude 117° 45.98'W.
The property area covers approximately 4,780 hectares (11,811 acres) and consists of 599 contiguous
unpatented lode mineral claims and 5 patented mineral claims, 4 owned and one leased. The unpatented
claims are situated on land owned by the U.S. government and administered by the BLM. There are no
Tribal, State of Nevada or U.S. Forest Service lands within the property area.
GRCN controls 100% interest in all unpatented claims and 4 of the patented claims comprising the Golden
Mile property, subject to a net smelter return royalty (NSR) of 3% on future production from the property
claims. A separate, single patented claim (Copper Queen) is held under lease by GRCN. This lease has
annual advance royalty payments of $10,000 and a 3% NSR payable to the lessors.

2021 INITIAL ASSESSMENT TECHNICAL REPORT SUMMARY FOR THE GOLDEN MILE PROPERTY, NEVADA
11
1.3 Geology and Mineralization
The Golden Mile property is located in the central portion of the Walker Lane trend, a major northwest-
aligned structurally deformed zone on the western border of Nevada characterized by a series of closely
spaced dextral strike-slip faults active throughout much of the middle to late Cenozoic. It is a complex
accommodation zone up to 300 km (186 mi) wide and approximately 1,000 km (620 mi) long positioned
between the western boundary of the extensional Basin and Range Province and the Sierra Nevada
microplate. This area remains tectonically active at present.
Regionally, the Golden Mile property is situated along the eastern flanks of the Cedar Mountains. The
Cedar Mountains are underlain by Triassic to Jurassic aged carbonates and clastic rocks which have been
intruded by Cretaceous to Tertiary diorite to granitic intrusive rocks. Quartz monzonite intrusives are most
common. These rocks are overlain by Miocene to Pliocene age rhyolitic to basaltic volcanics and
volcaniclastics. Miocene-Pliocene lake beds, including diatomite deposits, lap onto the edge of the range.
Quaternary alluvium largely consisting of alluvial fans spreading from major drainages into adjacent
valleys covers much of region. Large-scale folding of basement rocks have been mapped within the range
which may be associated with the Sevier Orogeny. The main regional structure is an easterly plunging
overturned syncline traceable 13 km (8 mi) to the east. Principal faults on a regional scale are Tertiary-
aged northwest-trending strike-slip faults associated with the Walker Lane trend.
Locally, the oldest rocks are the Triassic Luning Formation, a thin bedded to massive sedimentary
sequence of calcareous siltstone, thin- to medium-bedded limestone and dolomitic limestone, argillite
and sandstone. The Luning Formation is unconformably overlain by Jurassic-age siliciclastic and lesser
calcareous sedimentary rocks of the Dunlap Formation. Both formations have been folded with bedding
that is now steeply- to sub-vertically inclined.
The sedimentary units have been intruded by various granitoid stocks, sills and dikes that include quartz
diorite, granodiorite, quartz monzonite and felsic quartz-feldspar porphyry. The intrusive rocks play a role
in the gold mineralization. The property is locally covered by Tertiary volcanic rocks, consisting mostly of
a bimodal suite of felsic to mafic flows and tuffs.
Gold mineralization is variably associated with various skarn styles of mineralization, dominantly as calc-
silicate skarn, magnetite skarn, more structurally controlled sericitic equivalents, and in limonite-calcite-
silica stockworks within the distal brittle host rocks. Copper accompanies the gold mineralization
associated with magnetite skarn locally. The magnetite skarn in the area known as the “Main Zone” at
Golden Mile was the primary source of the limited amount of historical production on the property.
Recent studies, however, suggest that steep, NW-SE striking structures may be the first order control of
economic gold mineralization.

2021 INITIAL ASSESSMENT TECHNICAL REPORT SUMMARY FOR THE GOLDEN MILE PROPERTY, NEVADA
12
1.4 Exploration
The Golden Mile property has had a considerable amount of recent exploration activity including mapping,
surface and underground sampling, geophysical surveys and drilling. A total of 20,158.2 m (66,131 ft) of
air rotary, reverse circulation (RC), and diamond core drilling has been performed at the Golden Mile
property prior to acquisition by GRCN. This included work by Standard Slag, the Elmwood JV, Battle
Mountain, USMX, Teck, Cordex, Roscan and Kinross companies. The vast majority of the drilling has been
directed towards the Main Zone, located on the patented mineral claims.
Prior to GRCN’s acquisition, Kinross Gold USA Inc. (Kinross) had identified at least 11 gold prospect sites
on the Golden Mile property. Upon acquisition, GRCN immediately began evaluation of these targets for
exploration. GRCN also utilized spectral data for vectoring to hydrothermal alteration and mineral-bearing
rocks for ground follow-up. Potential mineral targets are mostly aligned with major EW and NW-trending
structures and have spectral and vegetation anomalies. The Golden Mile Main Zone deposit and Spring
(PS) mineral occurence (a satellite gold mineralized zone along the northwest trend) are considered the
highest priority prospects with already delineated resource potential.
In late 2020 and early 2021, GRCN completed 14 diamond core drill holes totaling of 1,719.7 m (5,642 ft)
at the Golden Mile property. This drilling was directed towards the Main Zone located on the patented
mineral claims with primary objectives to confirm historic drill assays and geological data collected by
previous explorers, conduct geological and resource modeling and to collect representative mineralized
ore grade samples in the Main Zone area in sufficient quantity to conduct metallurgical testing. Significant
results from GRCN’s drilling included up to 3.60 grams per metric tonne (g/t) Au (0.11 ounce per short ton
(opst) Au) over 20.1 m (66 ft) including 13.00 g/t Au (0.38 opst Au) over 3.0 m (10 ft) in Hole GMDD-002
and 2.77 g/t Au (0.08 opst Au) over 21.21 m (70 ft) including 8.96 g/t Au (0.26 opst Au) over 4.45 m (15 ft)
in Hole GMDD-012.
From late June through August 2021, GRCN completed 42 RC drill holes totaling 4,870.7 m (15,980 ft) in
the Main Zone area at Golden Mile. The goals of this program were to add to the known mineralization
by testing the undrilled areas between gold-bearing intercepts returned from historic holes and for the
estimation of Mineral Resources reported herein. Significant intercepts included 6.10 m (20 ft) of 5.93 g/t
Au (0.173 opst) and 16.76 m (55 ft) of 3.31 g/t Au (0.097 opst) including 1.52 m (5 ft) of 27.50 g/t Au (0.803
opst) in Hole GMRC-026. Another notable intercept included 24.38 m (80 ft) of 1.69 g/t Au (0.049 opst)
including 3.05 m (10 ft) of 5.92 g/t Au (0.173 opst) in Hole GMRC-013.
1.5 Metallurgical Testing
Preliminary metallurgical testing was completed by Kappes, Cassidy & Associates (KCA) in 1982. Four
cyanide bottle roll leach tests were run with recoveries varying from 81.4% to 87% on ‐6 mesh oxidized
drill cuttings.

2021 INITIAL ASSESSMENT TECHNICAL REPORT SUMMARY FOR THE GOLDEN MILE PROPERTY, NEVADA
13
In 2020, GRCN had cyanide bottle roll leach tests conducted by Inspectorate on six representative surface
rock chip samples collected during the initial property visit. Gold recoveries ranged from 53% to 100%
averaging 82%. Silver recoveries ranged from 48% to 73% averaging 64%.
In 2021, GRCN completed four PQ-size core holes in the Main Zone deposit at Golden Mile for
metallurgical testing. Metallurgical composite samples were sent to the KCA facility in Reno, Nevada for
the purpose to evaluate process requirements to recover gold using conventional heap leaching
technology. The test work completed on these composites consisted of head screen analysis (including,
whole rock and QXRD), screen analysis by size fraction, comminution, bottle roll, agglomeration, percent
slump and final apparent bulk density measurements and column leach testing.
The extraction results of the KCA 2021 bottle roll tests showed gold recoveries ranging from 38% to 94%
with finer fractions (<0.075 mm; 0.003 in) typically between 90% and 94%. Silver recoveries ranged from
33% to 64% with finer fractions (<0.075 mm; 0.003 in) around 61%. Leach kinetics for both 2020 and 2021
cyanide bottle roll leach tests were relatively fast achieving plus 65% of the total gold recovery in 2 hours.
Column leach test work was conducted on the 2021 composite core samples crushed to a target size of
80% passing 25 mm and 80% passing 6.3 mm. Gold extraction for coarse (<37.5 mm) column leach tests
was 80% based on calculated heads which ranged from 1.639 g/t (0.048 opst) to 1.806 g/t (0.053 opst)
Au. The sodium cyanide consumptions ranged from 1.70 kg (3.75 lb) to 1.92 kg (4.23 lb) per metric tonne.
Gold extractions for the fine (<9.5 mm; 1.5 in) column leach tests ranged from 51% to 86% based on
calculated heads which ranged from 1.328 g/t (0.039 opst) to 4.506 g/t (0.132 opst) Au. Silver extractions
were generally good, ranging from 53% to 92% but typically in the mid 70% to mid 80% range. The column
leach test results exhibited rapid leach kinetics with 80% to 90% of total gold and silver recovery occurring
in the first 10 days of leaching.
1.6 Mineral Resource Estimates
The modeling and estimation of Mineral Resources presented herein is based on technical data and
information available as of September 30, 2021.
As part of its modernization of the property disclosure requirements for mining registrants, the SEC is
adopting the Combined Reserves International Reporting Standards Committee (CRIRSCO) framework for
reporting Mineral Resources. According to CRIRSCO, a Mineral Resource is a concentration or occurrence
of material of intrinsic economic interest in or on the Earth’s crust (a deposit) in such form, grade or
quality, and quantity that there are reasonable prospects for eventual economic extraction. The location,
quantity, grade, geological characteristics and continuity of a Mineral Resource are known, estimated or
interpreted from specific geological evidence and knowledge. Mineral Resources are sub-divided, in order
of increasing geological confidence, into Inferred, Indicated and Measured categories. Portions of a
deposit that do not have reasonable prospects for eventual economic extraction must not be included in
a Mineral Resource.

2021 INITIAL ASSESSMENT TECHNICAL REPORT SUMMARY FOR THE GOLDEN MILE PROPERTY, NEVADA
14
The modeling and estimation of Mineral Resources utilized a portion of the drill hole database compiled
by GRCN containing 150 unique collar records and consisting of:
• RC: 131 reverse circulation drill holes for 14,597 m (47,889 ft)
• DDH: 19 diamond drill holes for 2,843 m (9,327 ft)
Mineral Resource modeling was carried out on capped composites using Inverse Distance Cubed (“ID3”)
and Nearest Neighbor (“NN”) estimation methods. A minimum of four and a maximum of nine composites
were used for estimation, with a maximum of three composites from a single drill hole. The search
ellipsoid oriented parallel with each defined mineralization domain and extending a maximum of 91.4 m
(300 ft) The major and semi-major axes approximate the average strike and dip directions of the
mineralization. Both gold and silver were modeled and estimated, but Ag is not included in the Mineral
Resource due to limited information on this commodity.
Mineral Resources at Golden Mile are further defined by GRCN as Mineral Resources within a constraining
pit shell and above a defined cutoff value. The Mineral Resources reported herein have been constrained
within a Lerchs-Grossman (LG) optimized pit shell and reported at a cutoff grade of 0.34 g/t Au (0.010
opst).
Indicated Mineral Resources reported at Golden Mile contain 2.16 million tonnes (2.38 million short tons)
of material at an average gold grade of 1.13 g/t (0.033 opst). Inferred Mineral Resources reported are 2.40
million tonnes (2.64 million short tons) of material at an average gold grade of 1.10 g/t (0.032 opst) (Table
1.1).
Table 1.1 Mineral Resource Inventory at Golden Mile, Mineral County, Nevada, USA (as of September 30, 2021)1 2 3 4
Class Tonnes Short Tons Au (g/t) Au (opst) Au (oz)
Indicated 2,160,000 2,380,000 1.13 0.033 78,500
Inferred 2,400,000 2,640,000 1.10 0.032 84,500 1. Reported at a cutoff of 0.34 g/t Au (0.010 opst).
2. Whole block diluted estimates are reported within an optimized pit shell.
3. Mineral Resources do not have demonstrated economic viability.
4. Totals may not sum exactly due to rounding.
1.7 Interpretation and Conclusions
Golden Mile is an advanced exploration property hosting a moderate-sized, mineralized gold (+ silver-
copper-iron) system with potential for developing gold resources and additional exploration targets.
Historic surface and underground rock sampling, together with previous and current drilling, have defined
significant, high-grade, gold values locally in association with magnetite skarn with minor silver-copper
mineralization.

2021 INITIAL ASSESSMENT TECHNICAL REPORT SUMMARY FOR THE GOLDEN MILE PROPERTY, NEVADA
15
Mineral Resources described herein have been delineated by appropriate drilling and/or sampling to
establish continuity and supports an estimate of tonnage and an average grade of the selected metals.
GRCN has evaluated and performed verification of the historic and recent Golden Mile drill hole database
and considers the assay data to be adequate for the estimation of the Mineral Resources. Golden Mile
has a favorable economic projection based on Mineral Resources estimated and reported herein.
Several factors may affect the estimation of Mineral Resources including changes to the geological,
geotechnical and geometallurgical models. In particular, the resource model showed a large proportion
of the contained metal is derived from a small number of samples and fracture style mineralization may
overestimate metal content at the mining scale. Additonal infill drilling to convert material to a higher
classification is recommended to mitigate these risks.
1.8 Recommendations
The QP’s preparing this report for GRCN recommend that the Golden Mile property proceed with a
prefeasibility study to move the property forward to a production decision.
The conceptualized plan being evaluated is open pit mining and heap leaching of the gold deposit, taking
the gold to carbon stage from a process plant to be built at Golden Mile, and then hauling the carbon for
further processing at the parent company’s permitted and operating absorption/desorption recovery
(ADR) facility at its nearby Isabella Pearl mine for final doré production.
Review of recently completed metallurgical test results needs to be finalized, together with on-going
engineering, base line and background studies which include process facility layout, open-pit design and
infrastructure evaluations. Some additional studies are also recommended that may improve value and
optimizations including additional drilling to convert Mineral Resources to Mineral Reserves, and
additional geotechnical studies to possibly steepen pit slopes.
The Golden Mile mineralization remains open on strike and at depth. For future exploration, particularly
in the vicinity of the Main Zone deposit north of the Road Fault, it will be important to better understand
the structure of the northwest-trending gold-bearing quartz-pyrite-chlorite veins and the stratigraphy and
resulting alteration mineralogy of the Dunlap and Luning Formations. This would include additional
surface mapping to define location and geometry of carbonate host rocks and preparation of stratigraphic
cross-sections to help define the subsurface extent of the carbonate host rocks, particularly near the
granodiorite-quartz feldspar porphyry intrusions. Mineralization appears to extend north and northwest
under post-mineral volcanic cover as well as open at depth and additional drilling is also warranted in
these directions. Soil sampling at 100-meter orthogonal spacings should also be undertaken over the area
south of the Tertiary volcanic cover. Geophysical studies, especially magnetic surveys, are also useful in
tracing the granodiorite and quartz feldspar porphyry intrusions beneath volcanic cover.
The proposed exploration program for the Golden Mile property is shown in Table 1.2. The estimated cost
of the recommended exploration program is $2.5 M. The proposed budget includes for 12,192 m (40,000
ft) of RC drilling for Mineral Resource expansion and exploration outside of the Main Zone deposit area.

2021 INITIAL ASSESSMENT TECHNICAL REPORT SUMMARY FOR THE GOLDEN MILE PROPERTY, NEVADA
16
Recommendations for continued engineering, geotechnical, metallurgical, base line and background
studies at Golden Mile are shown in Table 1.3. The estimated cost of the recommendations total $1.0 M.
Table 1.2 Budget for Proposed Exploration at Golden Mile Property
Description Total Cost ($)
Salaries and Wages 120,000
Vacation Days 3,000
Health Insurance 3,000
401K Expense 3,600
Payroll Taxes Employer 12,000
Workers Compensation Insurance 6,000
Contractors Drilling (RC) – 12,192 m (40,000 ft) 1,100,000
Contractors Maintenance 60,000
Contractors Services 200,000
Material Used by Contractors 200,000
Topographical Studies 12,000
Environmental Studies 60,000
Laboratory Assays 500,000
Maintenance Vehicles 600
Software & Licenses (non-cap) 3,000 Consulting Services 60,000
Airfare 1,200
Lodging 12,000
Meals 6,000
Other Travel Expenses 6,000
Gasoline 3,000 Field Supplies and Materials 36,000
Allocation of Labor Costs 90,000
Golden Mile Property Exploration Total 2,497,400
Table 1.3 Budget for Proposed Technical Studies at Golden Mile Property
Description Total Cost ($)
Core Drilling & Geotechnical Study 300,000
Blasting Fragmentation Study 50,000
Metallurgical Test Work 60,000
Geometallurgical Study 40,000
Waste Rock Characterization 30,000
Hydrogeologic Study 20,000
Water Well Drilling 400,000
Monitor Well Drilling 100,000
Total 1,000,000
2021 INITIAL ASSESSMENT TECHNICAL REPORT SUMMARY FOR THE GOLDEN MILE PROPERTY, NEVADA
17
2 INTRODUCTION
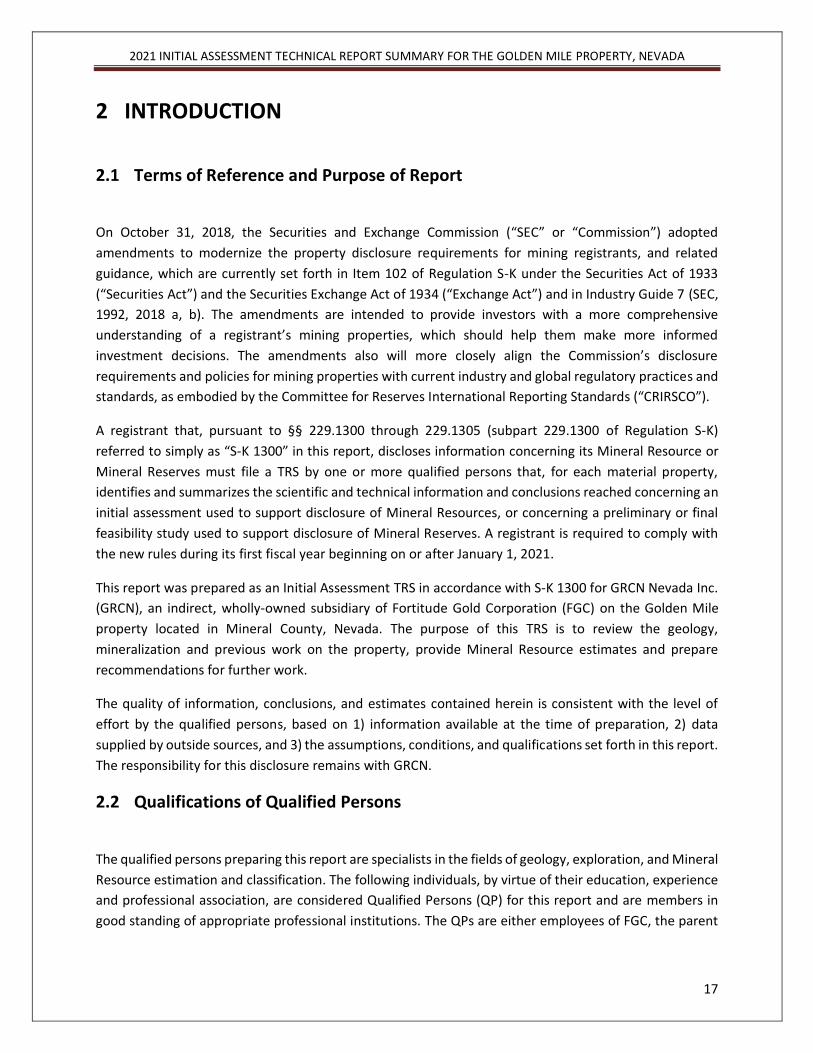
2.1 Terms of Reference and Purpose of Report
On October 31, 2018, the Securities and Exchange Commission (“SEC” or “Commission”) adopted
amendments to modernize the property disclosure requirements for mining registrants, and related
guidance, which are currently set forth in Item 102 of Regulation S-K under the Securities Act of 1933
(“Securities Act”) and the Securities Exchange Act of 1934 (“Exchange Act”) and in Industry Guide 7 (SEC,
1992, 2018 a, b). The amendments are intended to provide investors with a more comprehensive
understanding of a registrant’s mining properties, which should help them make more informed
investment decisions. The amendments also will more closely align the Commission’s disclosure
requirements and policies for mining properties with current industry and global regulatory practices and
standards, as embodied by the Committee for Reserves International Reporting Standards (“CRIRSCO”).
A registrant that, pursuant to §§ 229.1300 through 229.1305 (subpart 229.1300 of Regulation S-K)
referred to simply as “S-K 1300” in this report, discloses information concerning its Mineral Resource or
Mineral Reserves must file a TRS by one or more qualified persons that, for each material property,
identifies and summarizes the scientific and technical information and conclusions reached concerning an
initial assessment used to support disclosure of Mineral Resources, or concerning a preliminary or final
feasibility study used to support disclosure of Mineral Reserves. A registrant is required to comply with
the new rules during its first fiscal year beginning on or after January 1, 2021.
This report was prepared as an Initial Assessment TRS in accordance with S-K 1300 for GRCN Nevada Inc.
(GRCN), an indirect, wholly-owned subsidiary of Fortitude Gold Corporation (FGC) on the Golden Mile
property located in Mineral County, Nevada. The purpose of this TRS is to review the geology,
mineralization and previous work on the property, provide Mineral Resource estimates and prepare
recommendations for further work.
The quality of information, conclusions, and estimates contained herein is consistent with the level of
effort by the qualified persons, based on 1) information available at the time of preparation, 2) data
supplied by outside sources, and 3) the assumptions, conditions, and qualifications set forth in this report.
The responsibility for this disclosure remains with GRCN.
2.2 Qualifications of Qualified Persons
The qualified persons preparing this report are specialists in the fields of geology, exploration, and Mineral
Resource estimation and classification. The following individuals, by virtue of their education, experience
and professional association, are considered Qualified Persons (QP) for this report and are members in
good standing of appropriate professional institutions. The QPs are either employees of FGC, the parent

2021 INITIAL ASSESSMENT TECHNICAL REPORT SUMMARY FOR THE GOLDEN MILE PROPERTY, NEVADA
18
company of GRCN, a wholly-owned subsidiary of FGC, and therefore, not independent of GRCN, or an
independent consultant, independent of GRCN. QP certificates of authors are provided in Appendix B.
Mr. Brown graduated with a Bachelor of Science (B.Sc.) degree in Geology from New Mexico State
University in 1987, obtained a Graduate Diploma in Engineering (Mining) in 1997 from the University of
the Witwatersrand and a Master of Science (M.Sc.) in Engineering (Civil) from the University of the
Witwatersrand in 2005. He is registered with Engineers and Geoscientists British Columbia (EGBC) as a
Professional Geoscientist and the Society for Mining, Metallurgy and Exploration (SME) as a Registered
Member. Mr. Brown has also worked as an Underground Mine Geologist, Mineral Resource Manager,
Resident Geologist and Chief Geologist at several mines in South Africa operated by Anglo American,
Anglogold and De Beers. From 2004 to 2017, Mr. Brown was a Consulting Geologist specializing in Mineral
Resource and Mineral Reserve estimations and reporting. In 2017, he joined GRCN as Senior Resource
Geologist. On July 1, 2021, Mr. Brown resigned from GRCN and is now independent of GRCN and FGC.
Mr. Devlin holds a B.Sc. degree with honors in Geology, 1981, and a M.Sc., 1987, from the University of
British Columbia, Vancouver Canada. He is also a Professional Geologist registered with EGBC and is a
Member of the SME and Fellow of both the Society of Economic Geologist (SEG) and the Geological
Association of Canada (GAC). Mr. Devlin has worked 40 years in both exploration and mine production
which includes working for several USA-companies, including US Borax and Chemical Corp., Hecla Mining
Company and Gold Resource Corporation (GRC). From 2013 through 2020, he served as Vice President of
Exploration for GRC, responsible for all exploration activities at their Oaxaca Mexico and Nevada
operations. On March 1, 2021, Mr. Devlin assumed the role of Vice President of Exploration for FGC,
responsible for all exploration activities of the company.
Ms. Lester holds a B.Sc. in Geology and a M.Sc. in Geology from the South Dakota School of Mines and
Technology, Rapid City, South Dakota. Ms. Lester’s industry experiences span more than 20 years and are
rooted by traditional field techniques, best practices, and supplemented by modern
technologies/research and includes extensive geologic mapping, hydrologic investigations, drill program
design, interpretation and management, 3-D modeling, and scoping, prefeasibility, and resource and
reserve reporting. Ms. Lester’s background in mining and exploration includes positions ranging from
Independent Consultant, Exploration Geologist, Project Manager, and Chief Geologist for companies
including Hecla Mining Company, Patagonia Gold S.A., Gold Reserve Inc. and GRC. From 2014 through
2020, she served as Chief Geologist for GRC, overseeing exploration activities at their Oaxaca Mexico and
Nevada operations. On January 1, 2021, Ms. Lester assumed the role of Chief Geologist for FGC,
overseeing exploration activities of the company.
Technical data and information used in the preparation of this report also included some documents
prepared by third party contractors. The authors sourced information from referenced documents as cited
in the text and listed in References section of this report.

2021 INITIAL ASSESSMENT TECHNICAL REPORT SUMMARY FOR THE GOLDEN MILE PROPERTY, NEVADA
19
2.3 Details of Inspection
The QP’s referenced above and in Appendix B have visited the Golden Mile property on numerous
occasions since 2019. Historic mineralized workings were examined as well as the location of many historic
drill collars, mainly drilled by Cordex Exploration Company (Cordex). The authors have also examined data
from previous workers including skeleton core from a five‐hole diamond drilling program conducted in
2011 by Roscan Minerals Corporation (Roscan) and chip trays containing reverse circulation drill cuttings
completed by Battle Mountain Gold Corporation (BMG) from 1987 to 1989 and by Cordex during 2006
and 2007.
2.4 Sources of Information
Information reviewed for this report includes published and unpublished reports, maps, geochemical,
geophysical, and other data available from past workers. The records and data from past workers are not
entirely complete, however, much of the drill data geophysical, geochemical, and geologic data are
available. This report is relying on property reports prepared by Meghan O'Donnell for Columbus Gold
Corporation (Columbus) in 2006, and a more recent property report completed by Robert Suda on behalf
of Portage Mineral Inc. in 2009 (O’Donnell, 2006; Suda, 2009). This TRS draws much of its content from
the previous historical reports.
2.5 Effective Date
The effective date of this report is September 30, 2021.
2.6 Units of Measure
The metric system for weights and units has been used in this report with tons reported in metric tons
(“tonnes”) consisting of 1,000 kilograms (kg) per tonne (unless otherwise called out and noted as short
tons). Gold and silver ounces are reported in troy ounces converted using 31.1035 grams (g) per troy
ounce. All currency is in U.S. dollars ($) unless otherwise stated. The capital letter M is used for millions
of $ . The abbreviation, g/t is used for grams per tonne.

2021 INITIAL ASSESSMENT TECHNICAL REPORT SUMMARY FOR THE GOLDEN MILE PROPERTY, NEVADA
20
3 PROPERTY DESCRIPTION
This section addresses the property land holdings, corporate agreements, existing environmental
liabilities and the permitting process.
3.1 Property Location
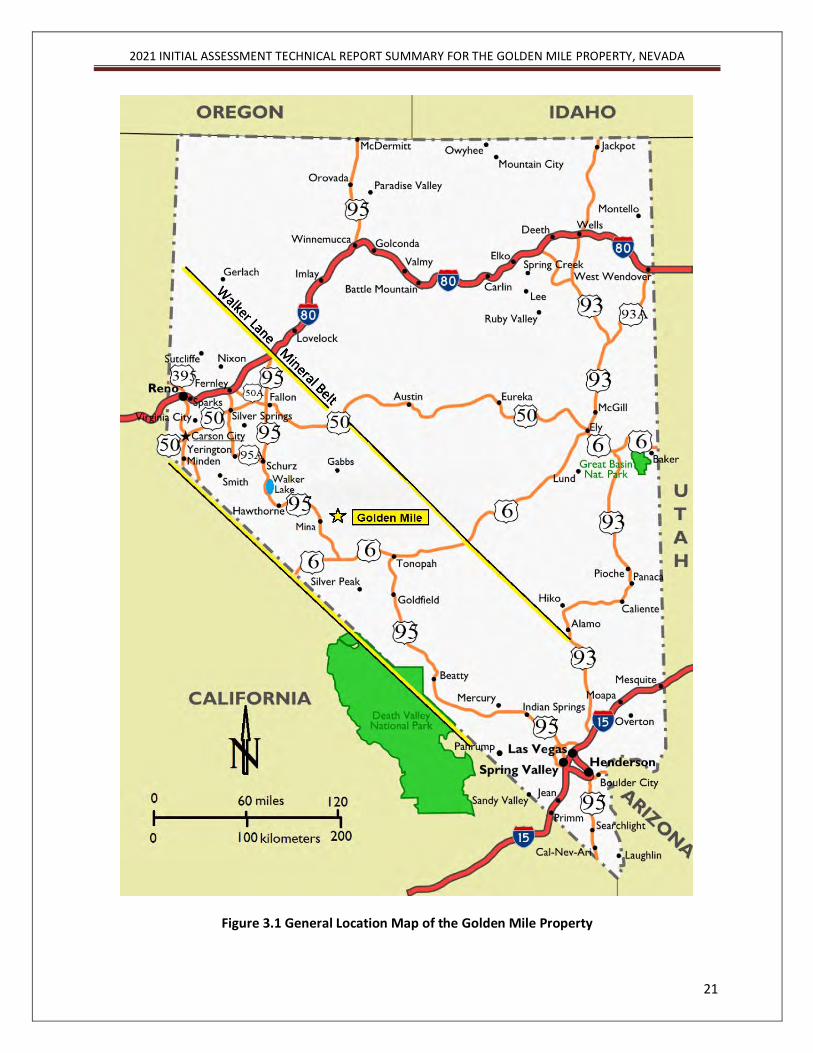
The Golden Mile property is located within the Bell Mining District (also known as the Cedar Mountain
District), Mineral County, west-central Nevada. The property lies along the northeast foothills of the Cedar
Mountain Range and the closest towns with full services are Hawthorne located 80 km (50 mi) to the west
and Tonopah located 88 km (55 mi) to the southeast (Fig. 3.1). The property has good connections to the
infrastructure of west-central Nevada, with access roads to the property linking to Nevada state route 361
and US Route 95, the main highway between Reno and Las Vegas. The Golden Mile property is located
approximately 37 km (23 mi) east-southeast of GRCN’s parent company’s (FGC) Isabella Pearl mining
operations.
The property is located within all or portions of the following Townships, Ranges and Sections relative to
the Mount Diablo Baseline and Meridian:
Township 8 North, Range 37 ½ East, Sections19,20, 28, 29,30,31, 32, and 33, Township 7 North, Range 37 ½ East, Sections 6, 5, 4
Township 8 North, Range 37 East Sections, 36, 35,34, 27, 26, 25,22, 23, 24, 16, 15, 14 13
Township 7 North, Range 37 East Sections, 2, 1,
Township 8 North, Range 38E, Section 30, 31
Township 7 North, Range 38 East Sections 6
The approximate center of the Main Zone deposit area on the Golden Mile property is Latitude 38° 30.69'
North and Longitude 117° 45.98'W.
2021 INITIAL ASSESSMENT TECHNICAL REPORT SUMMARY FOR THE GOLDEN MILE PROPERTY, NEVADA
21
Figure 3.1 General Location Map of the Golden Mile Property

2021 INITIAL ASSESSMENT TECHNICAL REPORT SUMMARY FOR THE GOLDEN MILE PROPERTY, NEVADA
22
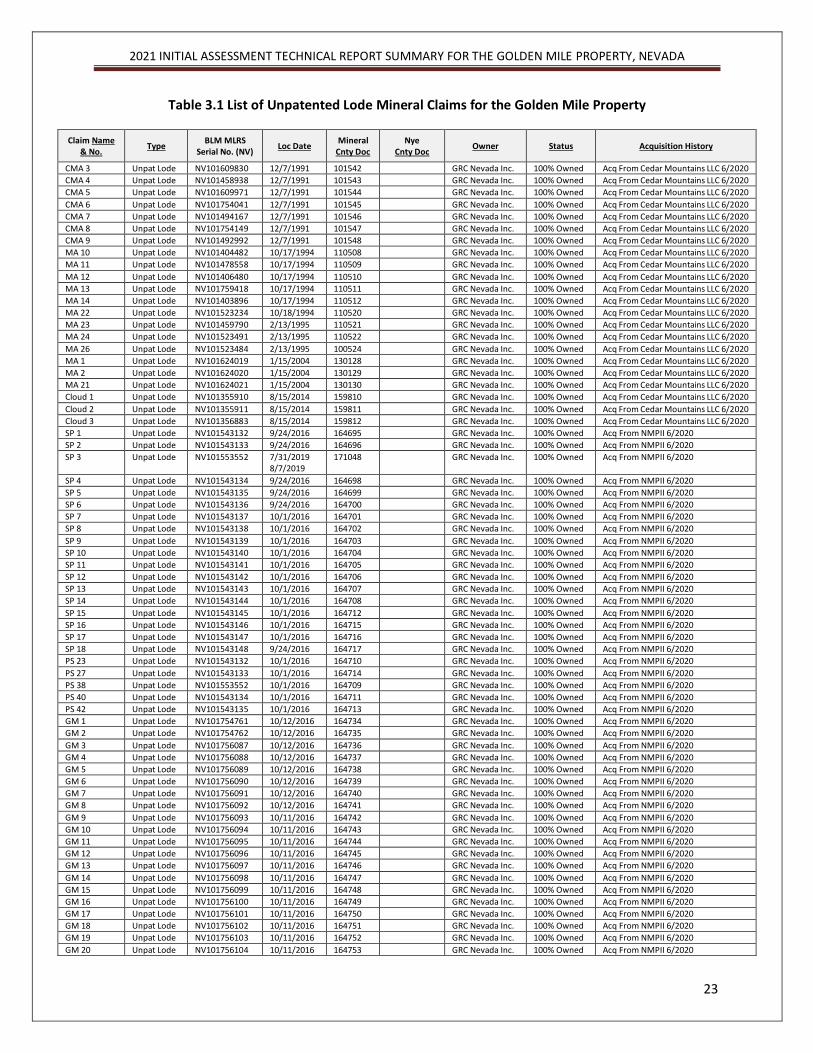
3.2 Mineral Titles
The property area covers approximately 4,780 hectares (11,811 acres) and consists of 599 contiguous
unpatented lode mineral claims and 5 patented mineral claims, 4 owned and one leased. The unpatented
claims are situated on land owned by the U.S. government and administered by the BLM. Unpatented and
patented mineral claims in the property area are shown on Figure 3.2. Reviews of mineral tenure and
status were completed during 2019 and 2021. A title report was prepared, and a legal land survey
completed, on the patented claims in 2020. The property boundaries were georeferenced with survey
data for verification/validation within company database. A list of unpatented mineral lode claims within
the property boundary controlled by GRCN is in Table 3.1 and patented mineral claims are in Table 3.2.
The mineral claim listings are current as of September 1, 2021.
There are no Tribal, State of Nevada or U.S. Forest Service lands within the property area.
Figure 3.2 Golden Mile Property Mineral Claims Map (patented claims insert)
2021 INITIAL ASSESSMENT TECHNICAL REPORT SUMMARY FOR THE GOLDEN MILE PROPERTY, NEVADA
23
Table 3.1 List of Unpatented Lode Mineral Claims for the Golden Mile Property
Claim Name & No.
Type BLM MLRS
Serial No. (NV) Loc Date
Mineral Cnty Doc
Nye Cnty Doc
Owner Status Acquisition History
CMA 3 Unpat Lode NV101609830 12/7/1991 101542 GRC Nevada Inc. 100% Owned Acq From Cedar Mountains LLC 6/2020
CMA 4 Unpat Lode NV101458938 12/7/1991 101543 GRC Nevada Inc. 100% Owned Acq From Cedar Mountains LLC 6/2020
CMA 5 Unpat Lode NV101609971 12/7/1991 101544 GRC Nevada Inc. 100% Owned Acq From Cedar Mountains LLC 6/2020
CMA 6 Unpat Lode NV101754041 12/7/1991 101545 GRC Nevada Inc. 100% Owned Acq From Cedar Mountains LLC 6/2020
CMA 7 Unpat Lode NV101494167 12/7/1991 101546 GRC Nevada Inc. 100% Owned Acq From Cedar Mountains LLC 6/2020
CMA 8 Unpat Lode NV101754149 12/7/1991 101547 GRC Nevada Inc. 100% Owned Acq From Cedar Mountains LLC 6/2020
CMA 9 Unpat Lode NV101492992 12/7/1991 101548 GRC Nevada Inc. 100% Owned Acq From Cedar Mountains LLC 6/2020
MA 10 Unpat Lode NV101404482 10/17/1994 110508 GRC Nevada Inc. 100% Owned Acq From Cedar Mountains LLC 6/2020
MA 11 Unpat Lode NV101478558 10/17/1994 110509 GRC Nevada Inc. 100% Owned Acq From Cedar Mountains LLC 6/2020
MA 12 Unpat Lode NV101406480 10/17/1994 110510 GRC Nevada Inc. 100% Owned Acq From Cedar Mountains LLC 6/2020
MA 13 Unpat Lode NV101759418 10/17/1994 110511 GRC Nevada Inc. 100% Owned Acq From Cedar Mountains LLC 6/2020
MA 14 Unpat Lode NV101403896 10/17/1994 110512 GRC Nevada Inc. 100% Owned Acq From Cedar Mountains LLC 6/2020
MA 22 Unpat Lode NV101523234 10/18/1994 110520 GRC Nevada Inc. 100% Owned Acq From Cedar Mountains LLC 6/2020
MA 23 Unpat Lode NV101459790 2/13/1995 110521 GRC Nevada Inc. 100% Owned Acq From Cedar Mountains LLC 6/2020
MA 24 Unpat Lode NV101523491 2/13/1995 110522 GRC Nevada Inc. 100% Owned Acq From Cedar Mountains LLC 6/2020
MA 26 Unpat Lode NV101523484 2/13/1995 100524 GRC Nevada Inc. 100% Owned Acq From Cedar Mountains LLC 6/2020
MA 1 Unpat Lode NV101624019 1/15/2004 130128 GRC Nevada Inc. 100% Owned Acq From Cedar Mountains LLC 6/2020
MA 2 Unpat Lode NV101624020 1/15/2004 130129 GRC Nevada Inc. 100% Owned Acq From Cedar Mountains LLC 6/2020
MA 21 Unpat Lode NV101624021 1/15/2004 130130 GRC Nevada Inc. 100% Owned Acq From Cedar Mountains LLC 6/2020
Cloud 1 Unpat Lode NV101355910 8/15/2014 159810 GRC Nevada Inc. 100% Owned Acq From Cedar Mountains LLC 6/2020
Cloud 2 Unpat Lode NV101355911 8/15/2014 159811 GRC Nevada Inc. 100% Owned Acq From Cedar Mountains LLC 6/2020
Cloud 3 Unpat Lode NV101356883 8/15/2014 159812 GRC Nevada Inc. 100% Owned Acq From Cedar Mountains LLC 6/2020
SP 1 Unpat Lode NV101543132 9/24/2016 164695 GRC Nevada Inc. 100% Owned Acq From NMPII 6/2020
SP 2 Unpat Lode NV101543133 9/24/2016 164696 GRC Nevada Inc. 100% Owned Acq From NMPII 6/2020
SP 3 Unpat Lode NV101553552 7/31/2019 8/7/2019
171048 GRC Nevada Inc. 100% Owned Acq From NMPII 6/2020
SP 4 Unpat Lode NV101543134 9/24/2016 164698 GRC Nevada Inc. 100% Owned Acq From NMPII 6/2020
SP 5 Unpat Lode NV101543135 9/24/2016 164699 GRC Nevada Inc. 100% Owned Acq From NMPII 6/2020
SP 6 Unpat Lode NV101543136 9/24/2016 164700 GRC Nevada Inc. 100% Owned Acq From NMPII 6/2020
SP 7 Unpat Lode NV101543137 10/1/2016 164701 GRC Nevada Inc. 100% Owned Acq From NMPII 6/2020
SP 8 Unpat Lode NV101543138 10/1/2016 164702 GRC Nevada Inc. 100% Owned Acq From NMPII 6/2020
SP 9 Unpat Lode NV101543139 10/1/2016 164703 GRC Nevada Inc. 100% Owned Acq From NMPII 6/2020
SP 10 Unpat Lode NV101543140 10/1/2016 164704 GRC Nevada Inc. 100% Owned Acq From NMPII 6/2020
SP 11 Unpat Lode NV101543141 10/1/2016 164705 GRC Nevada Inc. 100% Owned Acq From NMPII 6/2020
SP 12 Unpat Lode NV101543142 10/1/2016 164706 GRC Nevada Inc. 100% Owned Acq From NMPII 6/2020
SP 13 Unpat Lode NV101543143 10/1/2016 164707 GRC Nevada Inc. 100% Owned Acq From NMPII 6/2020
SP 14 Unpat Lode NV101543144 10/1/2016 164708 GRC Nevada Inc. 100% Owned Acq From NMPII 6/2020
SP 15 Unpat Lode NV101543145 10/1/2016 164712 GRC Nevada Inc. 100% Owned Acq From NMPII 6/2020
SP 16 Unpat Lode NV101543146 10/1/2016 164715 GRC Nevada Inc. 100% Owned Acq From NMPII 6/2020
SP 17 Unpat Lode NV101543147 10/1/2016 164716 GRC Nevada Inc. 100% Owned Acq From NMPII 6/2020
SP 18 Unpat Lode NV101543148 9/24/2016 164717 GRC Nevada Inc. 100% Owned Acq From NMPII 6/2020
PS 23 Unpat Lode NV101543132 10/1/2016 164710 GRC Nevada Inc. 100% Owned Acq From NMPII 6/2020
PS 27 Unpat Lode NV101543133 10/1/2016 164714 GRC Nevada Inc. 100% Owned Acq From NMPII 6/2020
PS 38 Unpat Lode NV101553552 10/1/2016 164709 GRC Nevada Inc. 100% Owned Acq From NMPII 6/2020
PS 40 Unpat Lode NV101543134 10/1/2016 164711 GRC Nevada Inc. 100% Owned Acq From NMPII 6/2020
PS 42 Unpat Lode NV101543135 10/1/2016 164713 GRC Nevada Inc. 100% Owned Acq From NMPII 6/2020
GM 1 Unpat Lode NV101754761 10/12/2016 164734 GRC Nevada Inc. 100% Owned Acq From NMPII 6/2020
GM 2 Unpat Lode NV101754762 10/12/2016 164735 GRC Nevada Inc. 100% Owned Acq From NMPII 6/2020
GM 3 Unpat Lode NV101756087 10/12/2016 164736 GRC Nevada Inc. 100% Owned Acq From NMPII 6/2020
GM 4 Unpat Lode NV101756088 10/12/2016 164737 GRC Nevada Inc. 100% Owned Acq From NMPII 6/2020
GM 5 Unpat Lode NV101756089 10/12/2016 164738 GRC Nevada Inc. 100% Owned Acq From NMPII 6/2020
GM 6 Unpat Lode NV101756090 10/12/2016 164739 GRC Nevada Inc. 100% Owned Acq From NMPII 6/2020
GM 7 Unpat Lode NV101756091 10/12/2016 164740 GRC Nevada Inc. 100% Owned Acq From NMPII 6/2020
GM 8 Unpat Lode NV101756092 10/12/2016 164741 GRC Nevada Inc. 100% Owned Acq From NMPII 6/2020
GM 9 Unpat Lode NV101756093 10/11/2016 164742 GRC Nevada Inc. 100% Owned Acq From NMPII 6/2020
GM 10 Unpat Lode NV101756094 10/11/2016 164743 GRC Nevada Inc. 100% Owned Acq From NMPII 6/2020
GM 11 Unpat Lode NV101756095 10/11/2016 164744 GRC Nevada Inc. 100% Owned Acq From NMPII 6/2020
GM 12 Unpat Lode NV101756096 10/11/2016 164745 GRC Nevada Inc. 100% Owned Acq From NMPII 6/2020
GM 13 Unpat Lode NV101756097 10/11/2016 164746 GRC Nevada Inc. 100% Owned Acq From NMPII 6/2020
GM 14 Unpat Lode NV101756098 10/11/2016 164747 GRC Nevada Inc. 100% Owned Acq From NMPII 6/2020
GM 15 Unpat Lode NV101756099 10/11/2016 164748 GRC Nevada Inc. 100% Owned Acq From NMPII 6/2020
GM 16 Unpat Lode NV101756100 10/11/2016 164749 GRC Nevada Inc. 100% Owned Acq From NMPII 6/2020
GM 17 Unpat Lode NV101756101 10/11/2016 164750 GRC Nevada Inc. 100% Owned Acq From NMPII 6/2020
GM 18 Unpat Lode NV101756102 10/11/2016 164751 GRC Nevada Inc. 100% Owned Acq From NMPII 6/2020
GM 19 Unpat Lode NV101756103 10/11/2016 164752 GRC Nevada Inc. 100% Owned Acq From NMPII 6/2020
GM 20 Unpat Lode NV101756104 10/11/2016 164753 GRC Nevada Inc. 100% Owned Acq From NMPII 6/2020

2021 INITIAL ASSESSMENT TECHNICAL REPORT SUMMARY FOR THE GOLDEN MILE PROPERTY, NEVADA
24
GM 21 Unpat Lode NV101756105 10/11/2016 164754 GRC Nevada Inc. 100% Owned Acq From NMPII 6/2020
GM 22 Unpat Lode NV101756106 10/11/2016 164755 GRC Nevada Inc. 100% Owned Acq From NMPII 6/2020
GM 23 Unpat Lode NV101756107 10/11/2016 164756 GRC Nevada Inc. 100% Owned Acq From NMPII 6/2020
GM 24 Unpat Lode NV101757430 10/11/2016 164757 GRC Nevada Inc. 100% Owned Acq From NMPII 6/2020
GM 25 Unpat Lode NV101757431 10/11/2016 164758 GRC Nevada Inc. 100% Owned Acq From NMPII 6/2020
GM 26 Unpat Lode NV101757432 10/11/2016 164759 GRC Nevada Inc. 100% Owned Acq From NMPII 6/2020
GM 27 Unpat Lode NV101757433 10/11/2016 164760 GRC Nevada Inc. 100% Owned Acq From NMPII 6/2020
GM 28 Unpat Lode NV101757434 10/11/2016 164761 GRC Nevada Inc. 100% Owned Acq From NMPII 6/2020
GM 29 Unpat Lode NV101757435 10/11/2016 164762 GRC Nevada Inc. 100% Owned Acq From NMPII 6/2020
GM 30 Unpat Lode NV101757436 10/11/2016 164763 GRC Nevada Inc. 100% Owned Acq From NMPII 6/2020
GM 31 Unpat Lode NV101757437 10/12/2016 164764 GRC Nevada Inc. 100% Owned Acq From NMPII 6/2020
GM 32 Unpat Lode NV101757438 10/12/2016 164765 GRC Nevada Inc. 100% Owned Acq From NMPII 6/2020
GM 33 Unpat Lode NV101757439 10/12/2016 164766 GRC Nevada Inc. 100% Owned Acq From NMPII 6/2020
GM 34 Unpat Lode NV101757440 10/12/2016 164767 GRC Nevada Inc. 100% Owned Acq From NMPII 6/2020
GM 35 Unpat Lode NV101757441 10/12/2016 164768 GRC Nevada Inc. 100% Owned Acq From NMPII 6/2020
GM 36 Unpat Lode NV101757442 10/12/2016 164769 GRC Nevada Inc. 100% Owned Acq From NMPII 6/2020
GM 37 Unpat Lode NV101757443 10/12/2016 164770 GRC Nevada Inc. 100% Owned Acq From NMPII 6/2020
GM 38 Unpat Lode NV101757444 10/12/2016 164771 GRC Nevada Inc. 100% Owned Acq From NMPII 6/2020
GM 39 Unpat Lode NV101781502 10/12/2016 164772 GRC Nevada Inc. 100% Owned Acq From NMPII 6/2020
GM 40 Unpat Lode NV101781503 10/12/2016 164773 GRC Nevada Inc. 100% Owned Acq From NMPII 6/2020
GM 41 Unpat Lode NV101781504 10/12/2016 164774 GRC Nevada Inc. 100% Owned Acq From NMPII 6/2020
GM 42 Unpat Lode NV101781505 10/12/2016 164775 GRC Nevada Inc. 100% Owned Acq From NMPII 6/2020
GM 43 Unpat Lode NV101781506 10/11/2016 164776 GRC Nevada Inc. 100% Owned Acq From NMPII 6/2020
GM 44 Unpat Lode NV101781507 10/11/2016 164777 GRC Nevada Inc. 100% Owned Acq From NMPII 6/2020
GM 45 Unpat Lode NV101781508 10/11/2016 164778 GRC Nevada Inc. 100% Owned Acq From NMPII 6/2020
GM 46 Unpat Lode NV101781509 10/11/2016 164779 GRC Nevada Inc. 100% Owned Acq From NMPII 6/2020
GM 47 Unpat Lode NV101541409 10/11/2016 164780 GRC Nevada Inc. 100% Owned Acq From NMPII 6/2020
GM 48 Unpat Lode NV101541410 10/11/2016 164781 GRC Nevada Inc. 100% Owned Acq From NMPII 6/2020
GM 49 Unpat Lode NV101541411 10/13/2016 164782 GRC Nevada Inc. 100% Owned Acq From NMPII 6/2020
GM 50 Unpat Lode NV101541412 10/13/2016 164783 GRC Nevada Inc. 100% Owned Acq From NMPII 6/2020
GM 51 Unpat Lode NV101541413 10/13/2016 164784 GRC Nevada Inc. 100% Owned Acq From NMPII 6/2020
GM 52 Unpat Lode NV101541414 10/13/2016 164785 GRC Nevada Inc. 100% Owned Acq From NMPII 6/2020
GM 53 Unpat Lode NV101541415 10/13/2016 164786 GRC Nevada Inc. 100% Owned Acq From NMPII 6/2020
GM 54 Unpat Lode NV101541416 10/13/2016 164787 GRC Nevada Inc. 100% Owned Acq From NMPII 6/2020
GM 55 Unpat Lode NV101541417 10/13/2016 164788 GRC Nevada Inc. 100% Owned Acq From NMPII 6/2020
GM 56 Unpat Lode NV101541418 10/13/2016 164789 GRC Nevada Inc. 100% Owned Acq From NMPII 6/2020
GM 57 Unpat Lode NV101541419 10/13/2016 164790 GRC Nevada Inc. 100% Owned Acq From NMPII 6/2020
GM 58 Unpat Lode NV101541420 10/13/2016 164791 GRC Nevada Inc. 100% Owned Acq From NMPII 6/2020
GM 59 Unpat Lode NV101541421 10/13/2016 164792 GRC Nevada Inc. 100% Owned Acq From NMPII 6/2020
GM 60 Unpat Lode NV101541422 10/13/2016 164793 GRC Nevada Inc. 100% Owned Acq From NMPII 6/2020
GM 61 Unpat Lode NV101541423 10/13/2016 164794 GRC Nevada Inc. 100% Owned Acq From NMPII 6/2020
GM 62 Unpat Lode NV101541424 10/13/2016 164795 GRC Nevada Inc. 100% Owned Acq From NMPII 6/2020
GM 63 Unpat Lode NV101541425 10/13/2016 164796 GRC Nevada Inc. 100% Owned Acq From NMPII 6/2020
GM 64 Unpat Lode NV101541426 10/13/2016 164797 GRC Nevada Inc. 100% Owned Acq From NMPII 6/2020
GM 65 Unpat Lode NV101541427 10/13/2016 164798 GRC Nevada Inc. 100% Owned Acq From NMPII 6/2020
GM 66 Unpat Lode NV101783413 2/16/2017 165548 GRC Nevada Inc. 100% Owned Acq From NMPII 6/2020
GM 67 Unpat Lode NV101783414 2/16/2017 165549 GRC Nevada Inc. 100% Owned Acq From NMPII 6/2020
GM 68 Unpat Lode NV101783415 2/16/2017 165550 GRC Nevada Inc. 100% Owned Acq From NMPII 6/2020
GM 69 Unpat Lode NV101783416 2/16/2017 165551 GRC Nevada Inc. 100% Owned Acq From NMPII 6/2020
GM 70 Unpat Lode NV101783417 2/16/2017 165552 GRC Nevada Inc. 100% Owned Acq From NMPII 6/2020
GM 71 Unpat Lode NV101783418 2/16/2017 165553 GRC Nevada Inc. 100% Owned Acq From NMPII 6/2020
GM 72 Unpat Lode NV101783419 2/16/2017 165554 GRC Nevada Inc. 100% Owned Acq From NMPII 6/2020
GM 73 Unpat Lode NV101783420 2/16/2017 165555 GRC Nevada Inc. 100% Owned Acq From NMPII 6/2020
GM 74 Unpat Lode NV101783421 2/15/2017 165556 GRC Nevada Inc. 100% Owned Acq From NMPII 6/2020
GM 75 Unpat Lode NV101783422 2/15/2017 165557 GRC Nevada Inc. 100% Owned Acq From NMPII 6/2020
GM 76 Unpat Lode NV101783423 2/15/2017 165558 GRC Nevada Inc. 100% Owned Acq From NMPII 6/2020
GM 77 Unpat Lode NV101783424 2/15/2017 165559 GRC Nevada Inc. 100% Owned Acq From NMPII 6/2020
GM 78 Unpat Lode NV101783425 2/15/2017 165560 GRC Nevada Inc. 100% Owned Acq From NMPII 6/2020
GM 79 Unpat Lode NV101783426 2/15/2017 165561 GRC Nevada Inc. 100% Owned Acq From NMPII 6/2020
GM 80 Unpat Lode NV101783427 2/15/2017 165562 GRC Nevada Inc. 100% Owned Acq From NMPII 6/2020
GM 81 Unpat Lode NV101783428 2/15/2017 165563 GRC Nevada Inc. 100% Owned Acq From NMPII 6/2020
GM 82 Unpat Lode NV101783429 2/15/2017 165564 GRC Nevada Inc. 100% Owned Acq From NMPII 6/2020
GM 83 Unpat Lode NV101783430 2/15/2017 165565 GRC Nevada Inc. 100% Owned Acq From NMPII 6/2020
GM 84 Unpat Lode NV101784638 2/15/2017 165566 GRC Nevada Inc. 100% Owned Acq From NMPII 6/2020
GM 85 Unpat Lode NV101784639 2/15/2017 165567 GRC Nevada Inc. 100% Owned Acq From NMPII 6/2020
GM 86 Unpat Lode NV101784640 2/15/2017 165568 GRC Nevada Inc. 100% Owned Acq From NMPII 6/2020
GM 87 Unpat Lode NV101784641 2/15/2017 165569 GRC Nevada Inc. 100% Owned Acq From NMPII 6/2020
GM 88 Unpat Lode NV101784642 2/15/2017 165570 GRC Nevada Inc. 100% Owned Acq From NMPII 6/2020
GM 89 Unpat Lode NV101784643 2/15/2017 165571 GRC Nevada Inc. 100% Owned Acq From NMPII 6/2020
GM 90 Unpat Lode NV101784644 2/16/2017 165572 GRC Nevada Inc. 100% Owned Acq From NMPII 6/2020
GM 91 Unpat Lode NV101784645 2/16/2017 165573 GRC Nevada Inc. 100% Owned Acq From NMPII 6/2020

2021 INITIAL ASSESSMENT TECHNICAL REPORT SUMMARY FOR THE GOLDEN MILE PROPERTY, NEVADA
25
GM 92 Unpat Lode NV101784646 2/16/2017 165574 GRC Nevada Inc. 100% Owned Acq From NMPII 6/2020
GM 93 Unpat Lode NV101784647 2/16/2017 165575 GRC Nevada Inc. 100% Owned Acq From NMPII 6/2020
GM 94 Unpat Lode NV101784648 2/16/2017 165576 GRC Nevada Inc. 100% Owned Acq From NMPII 6/2020
GM 95 Unpat Lode NV101784649 2/16/2017 165577 GRC Nevada Inc. 100% Owned Acq From NMPII 6/2020
GM 96 Unpat Lode NV101784650 2/16/2017 165578 GRC Nevada Inc. 100% Owned Acq From NMPII 6/2020
GM 97 Unpat Lode NV101784651 2/16/2017 165579 GRC Nevada Inc. 100% Owned Acq From NMPII 6/2020
GM 98 Unpat Lode NV101784652 2/15/2017 165580 GRC Nevada Inc. 100% Owned Acq From NMPII 6/2020
GM 99 Unpat Lode NV101784653 2/15/2017 165581 GRC Nevada Inc. 100% Owned Acq From NMPII 6/2020
GM 100 Unpat Lode NV101784654 2/15/2017 165582 GRC Nevada Inc. 100% Owned Acq From NMPII 6/2020
GM 101 Unpat Lode NV101784655 2/15/2017 165583 GRC Nevada Inc. 100% Owned Acq From NMPII 6/2020
GM 102 Unpat Lode NV101784656 2/15/2017 165584 GRC Nevada Inc. 100% Owned Acq From NMPII 6/2020
GM 103 Unpat Lode NV101784657 2/15/2017 165585 GRC Nevada Inc. 100% Owned Acq From NMPII 6/2020
GM 104 Unpat Lode NV101784658 2/16/2017 165586 GRC Nevada Inc. 100% Owned Acq From NMPII 6/2020
GM 105 Unpat Lode NV101785843 2/16/2017 165587 GRC Nevada Inc. 100% Owned Acq From NMPII 6/2020
GM 106 Unpat Lode NV101785844 2/16/2017 165588 GRC Nevada Inc. 100% Owned Acq From NMPII 6/2020
GM 107 Unpat Lode NV101785845 2/16/2017 165589 GRC Nevada Inc. 100% Owned Acq From NMPII 6/2020
GM 108 Unpat Lode NV101785846 2/16/2017 165590 GRC Nevada Inc. 100% Owned Acq From NMPII 6/2020
GM 109 Unpat Lode NV101785847 2/16/2017 165591 GRC Nevada Inc. 100% Owned Acq From NMPII 6/2020
GM 110 Unpat Lode NV101884786 2/16/2018 168261 GRC Nevada Inc. 100% Owned Acq From NMPII 6/2020
GM 111 Unpat Lode NV101884787 2/16/2018 168262 GRC Nevada Inc. 100% Owned Acq From NMPII 6/2020
GM 112 Unpat Lode NV101884788 2/16/2018 168263 GRC Nevada Inc. 100% Owned Acq From NMPII 6/2020
GM 113 Unpat Lode NV101884789 2/16/2018 168264 GRC Nevada Inc. 100% Owned Acq From NMPII 6/2020
GM 114 Unpat Lode NV101884790 2/16/2018 168265 GRC Nevada Inc. 100% Owned Acq From NMPII 6/2020
GM 115 Unpat Lode NV101884791 2/16/2018 168266 GRC Nevada Inc. 100% Owned Acq From NMPII 6/2020
GM 116 Unpat Lode NV101884792 2/16/2018 168267 GRC Nevada Inc. 100% Owned Acq From NMPII 6/2020
GM 117 Unpat Lode NV101884793 2/15/2018 168268 GRC Nevada Inc. 100% Owned Acq From NMPII 6/2020
GM 118 Unpat Lode NV101884794 2/15/2018 168269 GRC Nevada Inc. 100% Owned Acq From NMPII 6/2020
GM 119 Unpat Lode NV101884795 2/15/2018 168270 GRC Nevada Inc. 100% Owned Acq From NMPII 6/2020
GM 120 Unpat Lode NV101884796 2/15/2018 168271 GRC Nevada Inc. 100% Owned Acq From NMPII 6/2020
GM 121 Unpat Lode NV101884180 2/16/2018 168272 GRC Nevada Inc. 100% Owned Acq From NMPII 6/2020
GM 122 Unpat Lode NV101884181 2/15/2018 168273 GRC Nevada Inc. 100% Owned Acq From NMPII 6/2020
GM 123 Unpat Lode NV101884182 2/16/2018 168274 GRC Nevada Inc. 100% Owned Acq From NMPII 6/2020
GM 124 Unpat Lode NV101884183 2/16/2018 168275 GRC Nevada Inc. 100% Owned Acq From NMPII 6/2020
GM 125 Unpat Lode NV101884184 2/16/2018 168276 GRC Nevada Inc. 100% Owned Acq From NMPII 6/2020
GM 126 Unpat Lode NV101884185 2/16/2018 168277 GRC Nevada Inc. 100% Owned Acq From NMPII 6/2020
GM 127 Unpat Lode NV101884186 2/16/2018 168278 GRC Nevada Inc. 100% Owned Acq From NMPII 6/2020
GM 128 Unpat Lode NV101884187 2/16/2018 168279 GRC Nevada Inc. 100% Owned Acq From NMPII 6/2020
GM 129 Unpat Lode NV101884188 2/16/2018 168280 GRC Nevada Inc. 100% Owned Acq From NMPII 6/2020
GM 130 Unpat Lode NV101884189 2/16/2018 168281 GRC Nevada Inc. 100% Owned Acq From NMPII 6/2020
GM 131 Unpat Lode NV101884190 2/16/2018 168282 GRC Nevada Inc. 100% Owned Acq From NMPII 6/2020
GM 132 Unpat Lode NV101884191 2/16/2018 168283 GRC Nevada Inc. 100% Owned Acq From NMPII 6/2020
GM 133 Unpat Lode NV101884192 2/16/2018 168284 GRC Nevada Inc. 100% Owned Acq From NMPII 6/2020
GM 134 Unpat Lode NV101884193 2/16/2018 168285 GRC Nevada Inc. 100% Owned Acq From NMPII 6/2020
GM 135 Unpat Lode NV101884194 2/16/2018 168286 GRC Nevada Inc. 100% Owned Acq From NMPII 6/2020
GM 136 Unpat Lode NV101884195 2/16/2018 168287 GRC Nevada Inc. 100% Owned Acq From NMPII 6/2020
GM 137 Unpat Lode NV101884196 2/16/2018 168288 GRC Nevada Inc. 100% Owned Acq From NMPII 6/2020
GM 138 Unpat Lode NV101884197 2/16/2018 168289 GRC Nevada Inc. 100% Owned Acq From NMPII 6/2020
GM 139 Unpat Lode NV101884198 2/16/2018 168290 GRC Nevada Inc. 100% Owned Acq From NMPII 6/2020
GM 140 Unpat Lode NV101884199 2/16/2018 168291 GRC Nevada Inc. 100% Owned Acq From NMPII 6/2020
GM 141 Unpat Lode NV101884200 2/15/2018 168292 GRC Nevada Inc. 100% Owned Acq From NMPII 6/2020
GM 142 Unpat Lode NV101884797 2/15/2018 168293 GRC Nevada Inc. 100% Owned Acq From NMPII 6/2020
GM 143 Unpat Lode NV101884798 2/15/2018 168294 GRC Nevada Inc. 100% Owned Acq From NMPII 6/2020
GM 144 Unpat Lode NV101884799 2/15/2018 168295 GRC Nevada Inc. 100% Owned Acq From NMPII 6/2020
GM 145 Unpat Lode NV101884800 2/15/2018 168296 GRC Nevada Inc. 100% Owned Acq From NMPII 6/2020
GM 146 Unpat Lode NV101884924 2/15/2018 168297 GRC Nevada Inc. 100% Owned Acq From NMPII 6/2020
GM 147 Unpat Lode NV101884925 2/15/2018 168298 GRC Nevada Inc. 100% Owned Acq From NMPII 6/2020
GM 148 Unpat Lode NV101884926 2/15/2018 168299 GRC Nevada Inc. 100% Owned Acq From NMPII 6/2020
GM 149 Unpat Lode NV101884927 2/15/2018 168300 GRC Nevada Inc. 100% Owned Acq From NMPII 6/2020
GM 150 Unpat Lode NV101884928 2/15/2018 168301 GRC Nevada Inc. 100% Owned Acq From NMPII 6/2020
GM 151 Unpat Lode NV101884929 2/15/2018 168302 GRC Nevada Inc. 100% Owned Acq From NMPII 6/2020
GM 152 Unpat Lode NV101884930 2/15/2018 168303 GRC Nevada Inc. 100% Owned Acq From NMPII 6/2020
GM 153 Unpat Lode NV101884931 2/15/2018 168304 GRC Nevada Inc. 100% Owned Acq From NMPII 6/2020
GM 154 Unpat Lode NV101884932 2/15/2018 168305 GRC Nevada Inc. 100% Owned Acq From NMPII 6/2020
GM 155 Unpat Lode NV101884933 2/15/2018 168306 GRC Nevada Inc. 100% Owned Acq From NMPII 6/2020
GM 156 Unpat Lode NV101884934 2/15/2018 168307 GRC Nevada Inc. 100% Owned Acq From NMPII 6/2020
GM 157 Unpat Lode NV101884935 2/15/2018 168308 GRC Nevada Inc. 100% Owned Acq From NMPII 6/2020
GM 158 Unpat Lode NV101884936 2/15/2018 168309 GRC Nevada Inc. 100% Owned Acq From NMPII 6/2020
GM 159 Unpat Lode NV101884937 2/15/2018 168310 GRC Nevada Inc. 100% Owned Acq From NMPII 6/2020
GM 160 Unpat Lode NV101884938 2/15/2018 168311 GRC Nevada Inc. 100% Owned Acq From NMPII 6/2020
GM 161 Unpat Lode NV101884939 2/15/2018 168312 GRC Nevada Inc. 100% Owned Acq From NMPII 6/2020
GM 162 Unpat Lode NV101884940 2/15/2018 168313 GRC Nevada Inc. 100% Owned Acq From NMPII 6/2020

2021 INITIAL ASSESSMENT TECHNICAL REPORT SUMMARY FOR THE GOLDEN MILE PROPERTY, NEVADA
26
GM 163 Unpat Lode NV101884941 2/15/2018 168314 GRC Nevada Inc. 100% Owned Acq From NMPII 6/2020
GM 164 Unpat Lode NV101884942 2/15/2018 168315 GRC Nevada Inc. 100% Owned Acq From NMPII 6/2020
GM 165 Unpat Lode NV101884943 2/15/2018 168316 GRC Nevada Inc. 100% Owned Acq From NMPII 6/2020
GM 166 Unpat Lode NV101884944 2/15/2018 168317 GRC Nevada Inc. 100% Owned Acq From NMPII 6/2020
GM 167 Unpat Lode NV101884945 2/15/2018 168318 GRC Nevada Inc. 100% Owned Acq From NMPII 6/2020
GM 168 Unpat Lode NV101884946 2/15/2018 168319 GRC Nevada Inc. 100% Owned Acq From NMPII 6/2020
GM 169 Unpat Lode NV101884947 2/15/2018 168320 GRC Nevada Inc. 100% Owned Acq From NMPII 6/2020
GM 170 Unpat Lode NV101884948 2/15/2018 168321 GRC Nevada Inc. 100% Owned Acq From NMPII 6/2020
GM 171 Unpat Lode NV101884949 2/15/2018 168322 GRC Nevada Inc. 100% Owned Acq From NMPII 6/2020
GM 172 Unpat Lode NV101884950 2/15/2018 168323 GRC Nevada Inc. 100% Owned Acq From NMPII 6/2020
GM 173 Unpat Lode NV101884951 2/15/2018 168324 GRC Nevada Inc. 100% Owned Acq From NMPII 6/2020
GM 174 Unpat Lode NV101884952 2/15/2018 168325 GRC Nevada Inc. 100% Owned Acq From NMPII 6/2020
GM 175 Unpat Lode NV101884953 2/15/2018 168326 GRC Nevada Inc. 100% Owned Acq From NMPII 6/2020
GM 176 Unpat Lode NV101884954 2/15/2018 168327 GRC Nevada Inc. 100% Owned Acq From NMPII 6/2020
GM 177 Unpat Lode NV101884955 2/15/2018 168328 GRC Nevada Inc. 100% Owned Acq From NMPII 6/2020
GM 178 Unpat Lode NV101884956 2/15/2018 168329 GRC Nevada Inc. 100% Owned Acq From NMPII 6/2020
GM 179 Unpat Lode NV101884957 2/15/2018 168330 GRC Nevada Inc. 100% Owned Acq From NMPII 6/2020
GM 180 Unpat Lode NV101884958 2/15/2018 168331 GRC Nevada Inc. 100% Owned Acq From NMPII 6/2020
GM 181 Unpat Lode NV101884959 2/15/2018 168332 GRC Nevada Inc. 100% Owned Acq From NMPII 6/2020
GM 182 Unpat Lode NV101884960 2/15/2018 168333 GRC Nevada Inc. 100% Owned Acq From NMPII 6/2020
GM 183 Unpat Lode NV101884961 2/15/2018 168334 GRC Nevada Inc. 100% Owned Acq From NMPII 6/2020
GM 184 Unpat Lode NV101885534 2/17/2018 168335 GRC Nevada Inc. 100% Owned Acq From NMPII 6/2020
GM 185 Unpat Lode NV101885535 2/17/2018 168336 GRC Nevada Inc. 100% Owned Acq From NMPII 6/2020
GM 186 Unpat Lode NV101885536 2/17/2018 168337 GRC Nevada Inc. 100% Owned Acq From NMPII 6/2020
GM 187 Unpat Lode NV101885537 2/17/2018 168338 GRC Nevada Inc. 100% Owned Acq From NMPII 6/2020
GM 188 Unpat Lode NV101885538 2/17/2018 168339 GRC Nevada Inc. 100% Owned Acq From NMPII 6/2020
GM 189 Unpat Lode NV101885539 2/17/2018 168340 GRC Nevada Inc. 100% Owned Acq From NMPII 6/2020
GM 190 Unpat Lode NV101834201 2/17/2018 168341 GRC Nevada Inc. 100% Owned Acq From NMPII 6/2020
GM 191 Unpat Lode NV101834202 2/17/2018 168342 GRC Nevada Inc. 100% Owned Acq From NMPII 6/2020
GM 192 Unpat Lode NV101834203 2/17/2018 168343 GRC Nevada Inc. 100% Owned Acq From NMPII 6/2020
GM 193 Unpat Lode NV101834204 2/17/2018 168344 GRC Nevada Inc. 100% Owned Acq From NMPII 6/2020
GM 194 Unpat Lode NV101834205 2/17/2018 168345 GRC Nevada Inc. 100% Owned Acq From NMPII 6/2020
GM 195 Unpat Lode NV101834206 2/17/2018 168346 GRC Nevada Inc. 100% Owned Acq From NMPII 6/2020
GM 196 Unpat Lode NV101834207 2/17/2018 168347 GRC Nevada Inc. 100% Owned Acq From NMPII 6/2020
GM 197 Unpat Lode NV101834208 2/17/2018 168348 GRC Nevada Inc. 100% Owned Acq From NMPII 6/2020
GM 198 Unpat Lode NV101834209 2/17/2018 168349 GRC Nevada Inc. 100% Owned Acq From NMPII 6/2020
GM 199 Unpat Lode NV101834210 2/17/2018 168350 GRC Nevada Inc. 100% Owned Acq From NMPII 6/2020
GM 200 Unpat Lode NV101834211 2/17/2018 168351 GRC Nevada Inc. 100% Owned Acq From NMPII 6/2020
GM 201 Unpat Lode NV101834212 2/17/2018 168352 GRC Nevada Inc. 100% Owned Acq From NMPII 6/2020
GM 202 Unpat Lode NV101834213 2/17/2018 168353 GRC Nevada Inc. 100% Owned Acq From NMPII 6/2020
GM 203 Unpat Lode NV101834214 2/17/2018 168354 GRC Nevada Inc. 100% Owned Acq From NMPII 6/2020
GM 204 Unpat Lode NV101834215 2/17/2018 168355 GRC Nevada Inc. 100% Owned Acq From NMPII 6/2020
GM 205 Unpat Lode NV101834216 2/17/2018 168356 GRC Nevada Inc. 100% Owned Acq From NMPII 6/2020
GM 206 Unpat Lode NV101834217 2/17/2018 168357 GRC Nevada Inc. 100% Owned Acq From NMPII 6/2020
GM 207 Unpat Lode NV101834218 2/17/2018 168358 GRC Nevada Inc. 100% Owned Acq From NMPII 6/2020
GM 208 Unpat Lode NV101834219 2/17/2018 168359 GRC Nevada Inc. 100% Owned Acq From NMPII 6/2020
GM 209 Unpat Lode NV101834220 2/17/2018 168360 GRC Nevada Inc. 100% Owned Acq From NMPII 6/2020
GM 210 Unpat Lode NV101834221 2/18/2018 168361 GRC Nevada Inc. 100% Owned Acq From NMPII 6/2020
GM 211 Unpat Lode NV101834801 2/18/2018 168362 GRC Nevada Inc. 100% Owned Acq From NMPII 6/2020
GM 212 Unpat Lode NV101834802 2/18/2018 168363 GRC Nevada Inc. 100% Owned Acq From NMPII 6/2020
GM 213 Unpat Lode NV101834803 2/18/2018 168364 GRC Nevada Inc. 100% Owned Acq From NMPII 6/2020
GM 214 Unpat Lode NV101834804 2/18/2018 168365 GRC Nevada Inc. 100% Owned Acq From NMPII 6/2020
GM 215 Unpat Lode NV101834805 2/18/2018 168366 GRC Nevada Inc. 100% Owned Acq From NMPII 6/2020
GM 216 Unpat Lode NV101834806 2/18/2018 168367 GRC Nevada Inc. 100% Owned Acq From NMPII 6/2020
GM 217 Unpat Lode NV101834807 2/18/2018 168368 GRC Nevada Inc. 100% Owned Acq From NMPII 6/2020
GM 218 Unpat Lode NV101834808 2/18/2018 168369 GRC Nevada Inc. 100% Owned Acq From NMPII 6/2020
GM 219 Unpat Lode NV101834809 2/18/2018 168370 GRC Nevada Inc. 100% Owned Acq From NMPII 6/2020
GM 220 Unpat Lode NV101834810 2/18/2018 168371 GRC Nevada Inc. 100% Owned Acq From NMPII 6/2020
GM 221 Unpat Lode NV101834811 2/18/2018 168372 GRC Nevada Inc. 100% Owned Acq From NMPII 6/2020
GM 222 Unpat Lode NV101834812 2/18/2018 168373 GRC Nevada Inc. 100% Owned Acq From NMPII 6/2020
GM 223 Unpat Lode NV101834813 2/18/2018 168374 GRC Nevada Inc. 100% Owned Acq From NMPII 6/2020
GM 224 Unpat Lode NV101834814 2/18/2018 168375 GRC Nevada Inc. 100% Owned Acq From NMPII 6/2020
GM 225 Unpat Lode NV101834815 2/18/2018 168376 GRC Nevada Inc. 100% Owned Acq From NMPII 6/2020
GM 226 Unpat Lode NV101834816 2/18/2018 168377 GRC Nevada Inc. 100% Owned Acq From NMPII 6/2020
GM 227 Unpat Lode NV101834817 2/18/2018 168378 GRC Nevada Inc. 100% Owned Acq From NMPII 6/2020
GM 228 Unpat Lode NV101834818 2/18/2018 168379 GRC Nevada Inc. 100% Owned Acq From NMPII 6/2020
GM 229 Unpat Lode NV101834819 2/18/2018 168380 GRC Nevada Inc. 100% Owned Acq From NMPII 6/2020
GM 230 Unpat Lode NV101834820 2/18/2018 168381 GRC Nevada Inc. 100% Owned Acq From NMPII 6/2020
GM 231 Unpat Lode NV101834821 2/18/2018 168382 GRC Nevada Inc. 100% Owned Acq From NMPII 6/2020
GM 232 Unpat Lode NV101835401 2/18/2018 168383 GRC Nevada Inc. 100% Owned Acq From NMPII 6/2020
GM 233 Unpat Lode NV101835402 2/18/2018 168384 GRC Nevada Inc. 100% Owned Acq From NMPII 6/2020

2021 INITIAL ASSESSMENT TECHNICAL REPORT SUMMARY FOR THE GOLDEN MILE PROPERTY, NEVADA
27
GM 234 Unpat Lode NV101835403 2/18/2018 168385 GRC Nevada Inc. 100% Owned Acq From NMPII 6/2020
GM 235 Unpat Lode NV101835404 2/18/2018 168386 GRC Nevada Inc. 100% Owned Acq From NMPII 6/2020
GM 236 Unpat Lode NV101835405 2/18/2018 168387 GRC Nevada Inc. 100% Owned Acq From NMPII 6/2020
GM 237 Unpat Lode NV101835406 2/18/2018 168388 GRC Nevada Inc. 100% Owned Acq From NMPII 6/2020
GM 238 Unpat Lode NV101835407 2/18/2018 168389 GRC Nevada Inc. 100% Owned Acq From NMPII 6/2020
GM 239 Unpat Lode NV101835408 2/18/2018 168390 GRC Nevada Inc. 100% Owned Acq From NMPII 6/2020
GM 240 Unpat Lode NV101835409 2/18/2018 168391 GRC Nevada Inc. 100% Owned Acq From NMPII 6/2020
GM 241 Unpat Lode NV101835410 2/18/2018 168392 GRC Nevada Inc. 100% Owned Acq From NMPII 6/2020
GM 242 Unpat Lode NV101835411 2/18/2018 168393 GRC Nevada Inc. 100% Owned Acq From NMPII 6/2020
GM 243 Unpat Lode NV101835412 2/18/2018 168394 GRC Nevada Inc. 100% Owned Acq From NMPII 6/2020
GM 244 Unpat Lode NV101835413 2/18/2018 168395 GRC Nevada Inc. 100% Owned Acq From NMPII 6/2020
GM 245 Unpat Lode NV101835414 2/18/2018 168396 GRC Nevada Inc. 100% Owned Acq From NMPII 6/2020
GM 246 Unpat Lode NV101835415 2/18/2018 168397 GRC Nevada Inc. 100% Owned Acq From NMPII 6/2020
GM 247 Unpat Lode NV101835416 2/18/2018 168398 GRC Nevada Inc. 100% Owned Acq From NMPII 6/2020
GM 248 Unpat Lode NV101835417 2/18/2018 168399 GRC Nevada Inc. 100% Owned Acq From NMPII 6/2020
GM 249 Unpat Lode NV101835418 2/18/2018 168400 GRC Nevada Inc. 100% Owned Acq From NMPII 6/2020
GM 250 Unpat Lode NV101835419 2/18/2018 168401 GRC Nevada Inc. 100% Owned Acq From NMPII 6/2020
GM 251 Unpat Lode NV101835420 2/18/2018 168402 GRC Nevada Inc. 100% Owned Acq From NMPII 6/2020
GM 252 Unpat Lode NV101835421 2/18/2018 168403 GRC Nevada Inc. 100% Owned Acq From NMPII 6/2020
GM 253 Unpat Lode NV101836001 2/18/2018 168404 GRC Nevada Inc. 100% Owned Acq From NMPII 6/2020
GM 254 Unpat Lode NV101836002 2/20/2018 168405 GRC Nevada Inc. 100% Owned Acq From NMPII 6/2020
GM 255 Unpat Lode NV101836003 2/20/2018 168406 GRC Nevada Inc. 100% Owned Acq From NMPII 6/2020
GM 256 Unpat Lode NV101836004 2/20/2018 168407 GRC Nevada Inc. 100% Owned Acq From NMPII 6/2020
GM 257 Unpat Lode NV101836005 2/20/2018 168408 GRC Nevada Inc. 100% Owned Acq From NMPII 6/2020
GM 258 Unpat Lode NV101836006 2/20/2018 168409 GRC Nevada Inc. 100% Owned Acq From NMPII 6/2020
GM 259 Unpat Lode NV101836007 2/20/2018 168410 GRC Nevada Inc. 100% Owned Acq From NMPII 6/2020
GM 260 Unpat Lode NV101836008 2/20/2018 168411 GRC Nevada Inc. 100% Owned Acq From NMPII 6/2020
GM 261 Unpat Lode NV101836009 2/20/2018 168412 GRC Nevada Inc. 100% Owned Acq From NMPII 6/2020
GM 262 Unpat Lode NV101836010 2/20/2018 168413 GRC Nevada Inc. 100% Owned Acq From NMPII 6/2020
GM 263 Unpat Lode NV101836011 2/20/2018 168414 GRC Nevada Inc. 100% Owned Acq From NMPII 6/2020
GM 264 Unpat Lode NV101836012 2/20/2018 168415 GRC Nevada Inc. 100% Owned Acq From NMPII 6/2020
GM 265 Unpat Lode NV101836013 2/20/2018 168416 GRC Nevada Inc. 100% Owned Acq From NMPII 6/2020
GM 266 Unpat Lode NV101836014 2/20/2018 168417 GRC Nevada Inc. 100% Owned Acq From NMPII 6/2020
GM 267 Unpat Lode NV101836015 2/20/2018 168418 GRC Nevada Inc. 100% Owned Acq From NMPII 6/2020
GM 268 Unpat Lode NV101836016 2/20/2018 168419 GRC Nevada Inc. 100% Owned Acq From NMPII 6/2020
GM 269 Unpat Lode NV101836017 2/20/2018 168420 GRC Nevada Inc. 100% Owned Acq From NMPII 6/2020
GM 270 Unpat Lode NV101836018 2/20/2018 168421 GRC Nevada Inc. 100% Owned Acq From NMPII 6/2020
GM 271 Unpat Lode NV101836019 2/20/2018 168422 GRC Nevada Inc. 100% Owned Acq From NMPII 6/2020
GM 272 Unpat Lode NV101836020 2/20/2018 168423 GRC Nevada Inc. 100% Owned Acq From NMPII 6/2020
GM 273 Unpat Lode NV101836021 2/20/2018 168424 GRC Nevada Inc. 100% Owned Acq From NMPII 6/2020
GM 274 Unpat Lode NV101836601 2/20/2018 168425 GRC Nevada Inc. 100% Owned Acq From NMPII 6/2020
GM 275 Unpat Lode NV101836602 2/20/2018 168426 GRC Nevada Inc. 100% Owned Acq From NMPII 6/2020
GM 276 Unpat Lode NV101836603 2/20/2018 168427 GRC Nevada Inc. 100% Owned Acq From NMPII 6/2020
GM 277 Unpat Lode NV101836604 2/20/2018 168428 GRC Nevada Inc. 100% Owned Acq From NMPII 6/2020
GM 278 Unpat Lode NV101836605 2/20/2018 168429 GRC Nevada Inc. 100% Owned Acq From NMPII 6/2020
GM 279 Unpat Lode NV101836606 2/20/2018 168430 GRC Nevada Inc. 100% Owned Acq From NMPII 6/2020
GM 280 Unpat Lode NV101836607 2/20/2018 168431 GRC Nevada Inc. 100% Owned Acq From NMPII 6/2020
GM 281 Unpat Lode NV101836608 2/20/2018 168432 GRC Nevada Inc. 100% Owned Acq From NMPII 6/2020
GM 282 Unpat Lode NV101836609 2/20/2018 168433 GRC Nevada Inc. 100% Owned Acq From NMPII 6/2020
GM 283 Unpat Lode NV101836610 2/20/2018 168434 GRC Nevada Inc. 100% Owned Acq From NMPII 6/2020
GM 284 Unpat Lode NV101836611 2/20/2018 168435 GRC Nevada Inc. 100% Owned Acq From NMPII 6/2020
GM 285 Unpat Lode NV101836612 2/20/2018 168436 GRC Nevada Inc. 100% Owned Acq From NMPII 6/2020
GM 286 Unpat Lode NV101836613 2/20/2018 168437 GRC Nevada Inc. 100% Owned Acq From NMPII 6/2020
GM 287 Unpat Lode NV101836614 2/20/2018 168438 GRC Nevada Inc. 100% Owned Acq From NMPII 6/2020
GM 288 Unpat Lode NV101836615 2/20/2018 168439 GRC Nevada Inc. 100% Owned Acq From NMPII 6/2020
GM 289 Unpat Lode NV101836616 2/20/2018 168440 GRC Nevada Inc. 100% Owned Acq From NMPII 6/2020
GM 290 Unpat Lode NV101836617 2/20/2018 168441 GRC Nevada Inc. 100% Owned Acq From NMPII 6/2020
GM 291 Unpat Lode NV101836618 2/20/2018 168442 GRC Nevada Inc. 100% Owned Acq From NMPII 6/2020
GM 292 Unpat Lode NV101836619 2/20/2018 168443 GRC Nevada Inc. 100% Owned Acq From NMPII 6/2020
GM 293 Unpat Lode NV101836620 2/20/2018 168444 GRC Nevada Inc. 100% Owned Acq From NMPII 6/2020
GM 294 Unpat Lode NV101836621 2/20/2018 168445 GRC Nevada Inc. 100% Owned Acq From NMPII 6/2020
GM 295 Unpat Lode NV101837001 2/21/2018 168446 GRC Nevada Inc. 100% Owned Acq From NMPII 6/2020
GM 296 Unpat Lode NV101837002 2/21/2018 168447 GRC Nevada Inc. 100% Owned Acq From NMPII 6/2020
GM 297 Unpat Lode NV101837003 2/21/2018 168448 GRC Nevada Inc. 100% Owned Acq From NMPII 6/2020
GM 298 Unpat Lode NV101837004 2/21/2018 168449 GRC Nevada Inc. 100% Owned Acq From NMPII 6/2020
GM 299 Unpat Lode NV101837005 2/21/2018 168450 GRC Nevada Inc. 100% Owned Acq From NMPII 6/2020
GM 300 Unpat Lode NV101837006 2/21/2018 168451 GRC Nevada Inc. 100% Owned Acq From NMPII 6/2020
GM 301 Unpat Lode NV101837007 2/21/2018 168452 GRC Nevada Inc. 100% Owned Acq From NMPII 6/2020
GM 302 Unpat Lode NV101837008 2/21/2018 168453 GRC Nevada Inc. 100% Owned Acq From NMPII 6/2020
GM 303 Unpat Lode NV101837201 2/21/2018 168454 GRC Nevada Inc. 100% Owned Acq From NMPII 6/2020
GM 304 Unpat Lode NV101837202 2/21/2018 168455 GRC Nevada Inc. 100% Owned Acq From NMPII 6/2020

2021 INITIAL ASSESSMENT TECHNICAL REPORT SUMMARY FOR THE GOLDEN MILE PROPERTY, NEVADA
28
GM 305 Unpat Lode NV101837203 2/21/2018 168456 GRC Nevada Inc. 100% Owned Acq From NMPII 6/2020
GM 306 Unpat Lode NV101837204 2/21/2018 168457 GRC Nevada Inc. 100% Owned Acq From NMPII 6/2020
GM 307 Unpat Lode NV101837205 2/21/2018 168458 GRC Nevada Inc. 100% Owned Acq From NMPII 6/2020
GM 308 Unpat Lode NV101837206 2/21/2018 168459 GRC Nevada Inc. 100% Owned Acq From NMPII 6/2020
GM 309 Unpat Lode NV101837207 2/21/2018 168460 GRC Nevada Inc. 100% Owned Acq From NMPII 6/2020
GM 310 Unpat Lode NV101837208 2/21/2018 168461 GRC Nevada Inc. 100% Owned Acq From NMPII 6/2020
GM 311 Unpat Lode NV101837209 2/21/2018 168462 GRC Nevada Inc. 100% Owned Acq From NMPII 6/2020
GM 312 Unpat Lode NV101837210 2/21/2018 168463 GRC Nevada Inc. 100% Owned Acq From NMPII 6/2020
GM 313 Unpat Lode NV101837211 2/21/2018 168464 GRC Nevada Inc. 100% Owned Acq From NMPII 6/2020
GM 314 Unpat Lode NV101837212 2/21/2018 168465 GRC Nevada Inc. 100% Owned Acq From NMPII 6/2020
GM 315 Unpat Lode NV101837213 2/21/2018 168466 GRC Nevada Inc. 100% Owned Acq From NMPII 6/2020
GM 316 Unpat Lode NV101837601 2/21/2018 168467 GRC Nevada Inc. 100% Owned Acq From NMPII 6/2020
GM 317 Unpat Lode NV101837602 2/21/2018 168468 GRC Nevada Inc. 100% Owned Acq From NMPII 6/2020
GM 318 Unpat Lode NV101837603 2/21/2018 168469 GRC Nevada Inc. 100% Owned Acq From NMPII 6/2020
GM 319 Unpat Lode NV101837604 2/21/2018 168470 GRC Nevada Inc. 100% Owned Acq From NMPII 6/2020
GM 321 Unpat Lode NV101764810 9/1/2018 169562 GRC Nevada Inc. 100% Owned Acq From NMPII 6/2020
GM 322 Unpat Lode NV101764811 9/1/2018 169563 GRC Nevada Inc. 100% Owned Acq From NMPII 6/2020
GM 323 Unpat Lode NV101764812 9/1/2018 169564 GRC Nevada Inc. 100% Owned Acq From NMPII 6/2020
GM 324 Unpat Lode NV101764813 9/1/2018 169565 GRC Nevada Inc. 100% Owned Acq From NMPII 6/2020
GM 325 Unpat Lode NV101764814 9/1/2018 169566 GRC Nevada Inc. 100% Owned Acq From NMPII 6/2020
GM 326 Unpat Lode NV101764815 9/1/2018 169567 GRC Nevada Inc. 100% Owned Acq From NMPII 6/2020
GM 327 Unpat Lode NV101764816 9/1/2018 169568 GRC Nevada Inc. 100% Owned Acq From NMPII 6/2020
GM 328 Unpat Lode NV101764817 9/1/2018 169569 GRC Nevada Inc. 100% Owned Acq From NMPII 6/2020
GM 329 Unpat Lode NV101764818 9/1/2018 169570 GRC Nevada Inc. 100% Owned Acq From NMPII 6/2020
GM 330 Unpat Lode NV101764819 9/1/2018 169571 GRC Nevada Inc. 100% Owned Acq From NMPII 6/2020
GM 331 Unpat Lode NV101764820 9/1/2018 169572 GRC Nevada Inc. 100% Owned Acq From NMPII 6/2020
GM 332 Unpat Lode NV101764821 9/1/2018 169573 GRC Nevada Inc. 100% Owned Acq From NMPII 6/2020
GM 333 Unpat Lode NV101764822 9/1/2018 169574 GRC Nevada Inc. 100% Owned Acq From NMPII 6/2020
GM 334 Unpat Lode NV101764823 9/1/2018 169575 GRC Nevada Inc. 100% Owned Acq From NMPII 6/2020
GM 335 Unpat Lode NV101764824 9/1/2018 169576 GRC Nevada Inc. 100% Owned Acq From NMPII 6/2020
GM 336 Unpat Lode NV101764825 9/1/2018 169577 GRC Nevada Inc. 100% Owned Acq From NMPII 6/2020
GM 337 Unpat Lode NV101765070 9/1/2018 169578 GRC Nevada Inc. 100% Owned Acq From NMPII 6/2020
GM 338 Unpat Lode NV101765071 9/1/2018 169579 GRC Nevada Inc. 100% Owned Acq From NMPII 6/2020
GM 339 Unpat Lode NV101765072 9/1/2018 169580 GRC Nevada Inc. 100% Owned Acq From NMPII 6/2020
GM 340 Unpat Lode NV101765073 9/1/2018 169581 GRC Nevada Inc. 100% Owned Acq From NMPII 6/2020
GM 341 Unpat Lode NV101765074 9/1/2018 169582 GRC Nevada Inc. 100% Owned Acq From NMPII 6/2020
GM 342 Unpat Lode NV101765075 9/1/2018 169583 GRC Nevada Inc. 100% Owned Acq From NMPII 6/2020
GM 343 Unpat Lode NV101765076 9/1/2018 169584 GRC Nevada Inc. 100% Owned Acq From NMPII 6/2020
GM 344 Unpat Lode NV101765077 9/1/2018 169585 GRC Nevada Inc. 100% Owned Acq From NMPII 6/2020
GM 345 Unpat Lode NV101765078 9/1/2018 169586 GRC Nevada Inc. 100% Owned Acq From NMPII 6/2020
GM 346 Unpat Lode NV101765079 9/1/2018 169587 GRC Nevada Inc. 100% Owned Acq From NMPII 6/2020
GM 347 Unpat Lode NV101765080 9/1/2018 169588 GRC Nevada Inc. 100% Owned Acq From NMPII 6/2020
GM 348 Unpat Lode NV101765081 9/1/2018 169589 GRC Nevada Inc. 100% Owned Acq From NMPII 6/2020
GM 349 Unpat Lode NV101765082 9/1/2018 169590 GRC Nevada Inc. 100% Owned Acq From NMPII 6/2020
GM 350 Unpat Lode NV101765083 9/1/2018 169591 GRC Nevada Inc. 100% Owned Acq From NMPII 6/2020
GM 351 Unpat Lode NV101765084 9/1/2018 169592 GRC Nevada Inc. 100% Owned Acq From NMPII 6/2020
GM 352 Unpat Lode NV101765085 9/1/2018 169593 GRC Nevada Inc. 100% Owned Acq From NMPII 6/2020
GM 353 Unpat Lode NV101765086 9/1/2018 169594 GRC Nevada Inc. 100% Owned Acq From NMPII 6/2020
GM 354 Unpat Lode NV101765201 9/1/2018 169595 GRC Nevada Inc. 100% Owned Acq From NMPII 6/2020
GM 355 Unpat Lode NV101765202 9/1/2018 169596 GRC Nevada Inc. 100% Owned Acq From NMPII 6/2020
GM 356 Unpat Lode NV101765203 9/1/2018 169597 GRC Nevada Inc. 100% Owned Acq From NMPII 6/2020
GM 357 Unpat Lode NV101765204 9/1/2018 169598 GRC Nevada Inc. 100% Owned Acq From NMPII 6/2020
GM 358 Unpat Lode NV101762759 9/1/2018 169599 GRC Nevada Inc. 100% Owned Acq From NMPII 6/2020
GM 359 Unpat Lode NV101762760 9/1/2018 169600 GRC Nevada Inc. 100% Owned Acq From NMPII 6/2020
GM 360 Unpat Lode NV101762761 9/1/2018 169601 GRC Nevada Inc. 100% Owned Acq From NMPII 6/2020
GM 361 Unpat Lode NV101762762 9/1/2018 169602 GRC Nevada Inc. 100% Owned Acq From NMPII 6/2020
GM 362 Unpat Lode NV101762763 9/1/2018 169603 GRC Nevada Inc. 100% Owned Acq From NMPII 6/2020
GM 363 Unpat Lode NV101762764 9/1/2018 169604 GRC Nevada Inc. 100% Owned Acq From NMPII 6/2020
GM 364 Unpat Lode NV101762765 9/1/2018 169605 GRC Nevada Inc. 100% Owned Acq From NMPII 6/2020
MN 19 Unpat Lode NV101615129 12/11/2019 172318 GRC Nevada Inc. 100% Owned GRC Staked 12-2019
MN 20 Unpat Lode NV101615130 12/11/2019 172319 GRC Nevada Inc. 100% Owned GRC Staked 12-2019
MN 21 Unpat Lode NV101615131 12/11/2019 172320 GRC Nevada Inc. 100% Owned GRC Staked 12-2019
MN 22 Unpat Lode NV101615876 12/11/2019 172321 GRC Nevada Inc. 100% Owned GRC Staked 12-2019
MN 23 Unpat Lode NV101615877 12/11/2019 172322 GRC Nevada Inc. 100% Owned GRC Staked 12-2019
MN 24 Unpat Lode NV101615878 12/11/2019 172323 GRC Nevada Inc. 100% Owned GRC Staked 12-2019
MN 25 Unpat Lode NV101615879 12/11/2019 172324 GRC Nevada Inc. 100% Owned GRC Staked 12-2019
MN 26 Unpat Lode NV101615880 12/11/2019 172325 GRC Nevada Inc. 100% Owned GRC Staked 12-2019
MN 27 Unpat Lode NV101615881 12/11/2019 172326 GRC Nevada Inc. 100% Owned GRC Staked 12-2019
MN 28 Unpat Lode NV101615882 12/11/2019 172327 GRC Nevada Inc. 100% Owned GRC Staked 12-2019
MN 29 Unpat Lode NV101615883 12/11/2019 172328 GRC Nevada Inc. 100% Owned GRC Staked 12-2019
MN 30 Unpat Lode NV101615884 12/11/2019 172329 GRC Nevada Inc. 100% Owned GRC Staked 12-2019

2021 INITIAL ASSESSMENT TECHNICAL REPORT SUMMARY FOR THE GOLDEN MILE PROPERTY, NEVADA
29
MN 31 Unpat Lode NV101615885 12/11/2019 172330 GRC Nevada Inc. 100% Owned GRC Staked 12-2019
MN 32 Unpat Lode NV101615886 12/11/2019 172331 GRC Nevada Inc. 100% Owned GRC Staked 12-2019
MN 33 Unpat Lode NV101615887 12/11/2019 172332 GRC Nevada Inc. 100% Owned GRC Staked 12-2019
MN 34 Unpat Lode NV101615888 12/11/2019 172333 GRC Nevada Inc. 100% Owned GRC Staked 12-2019
MN 35 Unpat Lode NV101615889 12/11/2019 172334 GRC Nevada Inc. 100% Owned GRC Staked 12-2019
MN 36 Unpat Lode NV101615890 12/11/2019 172335 GRC Nevada Inc. 100% Owned GRC Staked 12-2019
MN 37 Unpat Lode NV101615891 12/11/2019 172336 GRC Nevada Inc. 100% Owned GRC Staked 12-2019
MN 38 Unpat Lode NV101615892 12/11/2019 172337 GRC Nevada Inc. 100% Owned GRC Staked 12-2019
MN 39 Unpat Lode NV101615893 12/11/2019 172338 GRC Nevada Inc. 100% Owned GRC Staked 12-2019
MN 40 Unpat Lode NV101615894 12/11/2019 172339 GRC Nevada Inc. 100% Owned GRC Staked 12-2019
MN 41 Unpat Lode NV101615895 12/11/2019 172340 GRC Nevada Inc. 100% Owned GRC Staked 12-2019
MN 42 Unpat Lode NV101615896 12/11/2019 172341 GRC Nevada Inc. 100% Owned GRC Staked 12-2019
MN 43 Unpat Lode NV101616505 12/11/2019 172342 GRC Nevada Inc. 100% Owned GRC Staked 12-2019
MN 44 Unpat Lode NV101616506 12/11/2019 172343 GRC Nevada Inc. 100% Owned GRC Staked 12-2019
MN 45 Unpat Lode NV101616507 12/11/2019 172344 GRC Nevada Inc. 100% Owned GRC Staked 12-2019
MN 46 Unpat Lode NV101616601 12/11/2019 172345 GRC Nevada Inc. 100% Owned GRC Staked 12-2019
MN 47 Unpat Lode NV101616602 12/11/2019 172346 GRC Nevada Inc. 100% Owned GRC Staked 12-2019
MN 48 Unpat Lode NV101616603 12/11/2019 172347 GRC Nevada Inc. 100% Owned GRC Staked 12-2019
MN 49 Unpat Lode NV101616604 12/12/2019 172348 GRC Nevada Inc. 100% Owned GRC Staked 12-2019
MN 50 Unpat Lode NV101616605 12/12/2019 172349 GRC Nevada Inc. 100% Owned GRC Staked 12-2019
MN 51 Unpat Lode NV101616606 12/12/2019 172350 GRC Nevada Inc. 100% Owned GRC Staked 12-2019
MN 52 Unpat Lode NV101616607 12/12/2019 172351 GRC Nevada Inc. 100% Owned GRC Staked 12-2019
MN 53 Unpat Lode NV101616608 12/12/2019 172352 GRC Nevada Inc. 100% Owned GRC Staked 12-2019
MN 54 Unpat Lode NV101616609 12/12/2019 172353 GRC Nevada Inc. 100% Owned GRC Staked 12-2019
MN 55 Unpat Lode NV101616610 12/12/2019 172354 GRC Nevada Inc. 100% Owned GRC Staked 12-2019
MN 56 Unpat Lode NV101616611 12/12/2019 172355 GRC Nevada Inc. 100% Owned GRC Staked 12-2019
MN 57 Unpat Lode NV101616612 12/13/2019 172356 GRC Nevada Inc. 100% Owned GRC Staked 12-2019
MN 58 Unpat Lode NV101616613 12/13/2019 172357 GRC Nevada Inc. 100% Owned GRC Staked 12-2019
MN 59 Unpat Lode NV101616614 12/13/2019 172358 GRC Nevada Inc. 100% Owned GRC Staked 12-2019
MN 60 Unpat Lode NV101616615 12/13/2019 172359 GRC Nevada Inc. 100% Owned GRC Staked 12-2019
MN 61 Unpat Lode NV101616616 12/13/2019 172360 GRC Nevada Inc. 100% Owned GRC Staked 12-2019
GMN-1 Unpat Lode NV102154419 10/7/2020 174617 GRC Nevada Inc. 100% Owned GRC Staked 10-2020
GMN-2 Unpat Lode NV102154420 10/7/2020 174618 GRC Nevada Inc. 100% Owned GRC Staked 10-2020
GMN-3 Unpat Lode NV102154421 10/7/2020 174619 GRC Nevada Inc. 100% Owned GRC Staked 10-2020
GMN-4 Unpat Lode NV102154422 10/7/2020 174620 GRC Nevada Inc. 100% Owned GRC Staked 10-2020
GMN-5 Unpat Lode NV102154423 10/7/2020 174621 GRC Nevada Inc. 100% Owned GRC Staked 10-2020
GMN-6 Unpat Lode NV102154424 10/7/2020 174622 GRC Nevada Inc. 100% Owned GRC Staked 10-2020
GMN-7 Unpat Lode NV102154425 10/7/2020 174623 GRC Nevada Inc. 100% Owned GRC Staked 10-2020
GMN-8 Unpat Lode NV102154426 10/7/2020 174624 GRC Nevada Inc. 100% Owned GRC Staked 10-2020
GMN-9 Unpat Lode NV102154427 10/7/2020 174625 GRC Nevada Inc. 100% Owned GRC Staked 10-2020
GMN-10 Unpat Lode NV102154428 10/7/2020 174626 GRC Nevada Inc. 100% Owned GRC Staked 10-2020
GMN-11 Unpat Lode NV102154429 10/7/2020 174627 GRC Nevada Inc. 100% Owned GRC Staked 10-2020
GMN-12 Unpat Lode NV102154643 10/7/2020 174628 GRC Nevada Inc. 100% Owned GRC Staked 10-2020
GMN-13 Unpat Lode NV102154644 10/7/2020 174629 GRC Nevada Inc. 100% Owned GRC Staked 10-2020
GMN-14 Unpat Lode NV102154645 10/7/2020 174630 GRC Nevada Inc. 100% Owned GRC Staked 10-2020
GMN-15 Unpat Lode NV102154646 10/7/2020 174631 GRC Nevada Inc. 100% Owned GRC Staked 10-2020
GMN-16 Unpat Lode NV102154647 10/7/2020 174632 GRC Nevada Inc. 100% Owned GRC Staked 10-2020
GMN-17 Unpat Lode NV102154648 10/10/2020 174633 GRC Nevada Inc. 100% Owned GRC Staked 10-2020
GMN-18 Unpat Lode NV102154649 10/10/2020 174634 GRC Nevada Inc. 100% Owned GRC Staked 10-2020
GMN-19 Unpat Lode NV102154650 10/7/2020 174635 GRC Nevada Inc. 100% Owned GRC Staked 10-2020
GMN-20 Unpat Lode NV102154651 10/7/2020 174636 GRC Nevada Inc. 100% Owned GRC Staked 10-2020
GMN-21 Unpat Lode NV102154652 10/7/2020 174637 GRC Nevada Inc. 100% Owned GRC Staked 10-2020
GMN-22 Unpat Lode NV102154653 10/7/2020 174638 GRC Nevada Inc. 100% Owned GRC Staked 10-2020
GMN-23 Unpat Lode NV102154654 10/7/2020 174639 GRC Nevada Inc. 100% Owned GRC Staked 10-2020
GMN-24 Unpat Lode NV102154655 10/7/2020 174640 GRC Nevada Inc. 100% Owned GRC Staked 10-2020
GMN-25 Unpat Lode NV102154656 10/7/2020 174641 GRC Nevada Inc. 100% Owned GRC Staked 10-2020
GMN-26 Unpat Lode NV102154657 10/7/2020 174642 GRC Nevada Inc. 100% Owned GRC Staked 10-2020
GMN-27 Unpat Lode NV102154658 10/7/2020 174643 GRC Nevada Inc. 100% Owned GRC Staked 10-2020
GMN-28 Unpat Lode NV102154659 10/7/2020 174644 GRC Nevada Inc. 100% Owned GRC Staked 10-2020
GMN-29 Unpat Lode NV102154660 10/7/2020 174645 GRC Nevada Inc. 100% Owned GRC Staked 10-2020
GMN-30 Unpat Lode NV102154661 10/7/2020 174646 GRC Nevada Inc. 100% Owned GRC Staked 10-2020
GMN-31 Unpat Lode NV102154662 10/7/2020 174647 GRC Nevada Inc. 100% Owned GRC Staked 10-2020
GMN-32 Unpat Lode NV102154663 10/7/2020 174648 GRC Nevada Inc. 100% Owned GRC Staked 10-2020
GMN-33 Unpat Lode NV102154664 10/10/2020 174649 GRC Nevada Inc. 100% Owned GRC Staked 10-2020
GMN-34 Unpat Lode NV102154665 10/10/2020 174650 GRC Nevada Inc. 100% Owned GRC Staked 10-2020
GMN-35 Unpat Lode NV102154666 10/8/2020 174651 GRC Nevada Inc. 100% Owned GRC Staked 10-2020
GMN-36 Unpat Lode NV102154667 10/8/2020 174652 GRC Nevada Inc. 100% Owned GRC Staked 10-2020
GMN-37 Unpat Lode NV102154668 10/8/2020 174653 GRC Nevada Inc. 100% Owned GRC Staked 10-2020
GMN-38 Unpat Lode NV102154669 10/8/2020 174654 GRC Nevada Inc. 100% Owned GRC Staked 10-2020
GMN-39 Unpat Lode NV102154822 10/8/2020 174655 GRC Nevada Inc. 100% Owned GRC Staked 10-2020
GMN-40 Unpat Lode NV102154823 10/8/2020 174656 GRC Nevada Inc. 100% Owned GRC Staked 10-2020

2021 INITIAL ASSESSMENT TECHNICAL REPORT SUMMARY FOR THE GOLDEN MILE PROPERTY, NEVADA
30
GMN-41 Unpat Lode NV102154824 10/8/2020 174657 GRC Nevada Inc. 100% Owned GRC Staked 10-2020
GMN-42 Unpat Lode NV102154825 10/8/2020 174658 GRC Nevada Inc. 100% Owned GRC Staked 10-2020
GMN-43 Unpat Lode NV102154826 10/8/2020 174659 GRC Nevada Inc. 100% Owned GRC Staked 10-2020
GMN-44 Unpat Lode NV102154827 10/8/2020 174660 GRC Nevada Inc. 100% Owned GRC Staked 10-2020
GMN-45 Unpat Lode NV102154828 10/8/2020 174661 GRC Nevada Inc. 100% Owned GRC Staked 10-2020
GMN-46 Unpat Lode NV102154829 10/8/2020 174662 GRC Nevada Inc. 100% Owned GRC Staked 10-2020
GMN-47 Unpat Lode NV102154830 10/8/2020 174663 GRC Nevada Inc. 100% Owned GRC Staked 10-2020
GMN-48 Unpat Lode NV102154831 10/8/2020 174664 GRC Nevada Inc. 100% Owned GRC Staked 10-2020
GMN-49 Unpat Lode NV102154832 10/8/2020 174665 GRC Nevada Inc. 100% Owned GRC Staked 10-2020
GMN-50 Unpat Lode NV102154833 10/8/2020 174666 GRC Nevada Inc. 100% Owned GRC Staked 10-2020
GMN-51 Unpat Lode NV102154834 10/8/2020 174667 GRC Nevada Inc. 100% Owned GRC Staked 10-2020
GMN-52 Unpat Lode NV102154835 10/8/2020 174668 GRC Nevada Inc. 100% Owned GRC Staked 10-2020
GMN-53 Unpat Lode NV102154836 10/8/2020 174669 GRC Nevada Inc. 100% Owned GRC Staked 10-2020
GMN-54 Unpat Lode NV102154837 10/8/2020 174670 GRC Nevada Inc. 100% Owned GRC Staked 10-2020
GMW-1 Unpat Lode NV102154838 10/5/2020 174671 GRC Nevada Inc. 100% Owned GRC Staked 10-2020
GMW-2 Unpat Lode NV102154839 10/5/2020 174672 GRC Nevada Inc. 100% Owned GRC Staked 10-2020
GMW-3 Unpat Lode NV102154840 10/5/2020 174673 GRC Nevada Inc. 100% Owned GRC Staked 10-2020
GMW-4 Unpat Lode NV102154841 10/5/2020 174674 GRC Nevada Inc. 100% Owned GRC Staked 10-2020
GMW-5 Unpat Lode NV102154842 10/5/2020 174675 GRC Nevada Inc. 100% Owned GRC Staked 10-2020
GMW-6 Unpat Lode NV102154843 10/5/2020 174676 GRC Nevada Inc. 100% Owned GRC Staked 10-2020
GMW-7 Unpat Lode NV102154844 10/5/2020 174677 GRC Nevada Inc. 100% Owned GRC Staked 10-2020
GMW-8 Unpat Lode NV102154845 10/5/2020 174678 GRC Nevada Inc. 100% Owned GRC Staked 10-2020
GMW-9 Unpat Lode NV102154846 10/5/2020 174679 GRC Nevada Inc. 100% Owned GRC Staked 10-2020
GMW-10 Unpat Lode NV102154847 10/5/2020 174680 GRC Nevada Inc. 100% Owned GRC Staked 10-2020
GMW-11 Unpat Lode NV102154848 10/5/2020 174681 GRC Nevada Inc. 100% Owned GRC Staked 10-2020
GMW-12 Unpat Lode NV102154849 10/5/2020 174682 GRC Nevada Inc. 100% Owned GRC Staked 10-2020
GMW-13 Unpat Lode NV102154850 10/5/2020 174683 GRC Nevada Inc. 100% Owned GRC Staked 10-2020
GMW-14 Unpat Lode NV102154851 10/5/2020 174684 GRC Nevada Inc. 100% Owned GRC Staked 10-2020
GMW-15 Unpat Lode NV102155022 10/5/2020 174685 GRC Nevada Inc. 100% Owned GRC Staked 10-2020
GMW-16 Unpat Lode NV102155023 10/5/2020 174686 GRC Nevada Inc. 100% Owned GRC Staked 10-2020
GMW-17 Unpat Lode NV102155024 10/5/2020 174687 GRC Nevada Inc. 100% Owned GRC Staked 10-2020
GMW-18 Unpat Lode NV102155025 10/5/2020 174688 GRC Nevada Inc. 100% Owned GRC Staked 10-2020
GMW-19 Unpat Lode NV102155026 10/5/2020 174689 GRC Nevada Inc. 100% Owned GRC Staked 10-2020
GMW-20 Unpat Lode NV102155027 10/5/2020 174690 GRC Nevada Inc. 100% Owned GRC Staked 10-2020
GMW-21 Unpat Lode NV102155028 10/5/2020 174691 GRC Nevada Inc. 100% Owned GRC Staked 10-2020
GMW-22 Unpat Lode NV102155029 10/5/2020 174692 GRC Nevada Inc. 100% Owned GRC Staked 10-2020
GMW-23 Unpat Lode NV102155030 10/5/2020 174693 GRC Nevada Inc. 100% Owned GRC Staked 10-2020
GMW-24 Unpat Lode NV102155031 10/5/2020 174694 GRC Nevada Inc. 100% Owned GRC Staked 10-2020
GMW-25 Unpat Lode NV102155032 10/5/2020 174695 GRC Nevada Inc. 100% Owned GRC Staked 10-2020
GMW-26 Unpat Lode NV102155033 10/5/2020 174696 GRC Nevada Inc. 100% Owned GRC Staked 10-2020
GMW-27 Unpat Lode NV102155034 10/5/2020 174697 GRC Nevada Inc. 100% Owned GRC Staked 10-2020
GMW-28 Unpat Lode NV102155035 10/5/2020 174698 GRC Nevada Inc. 100% Owned GRC Staked 10-2020
GMW-29 Unpat Lode NV102155036 10/6/2020 174699 GRC Nevada Inc. 100% Owned GRC Staked 10-2020
GMW-30 Unpat Lode NV102155037 10/6/2020 174700 GRC Nevada Inc. 100% Owned GRC Staked 10-2020
GMW-31 Unpat Lode NV102155038 10/6/2020 174701 GRC Nevada Inc. 100% Owned GRC Staked 10-2020
MN-62 Unpat Lode NV102155039 10/19/2020 174702 GRC Nevada Inc. 100% Owned GRC Staked 10-2020
MN-63 Unpat Lode NV102155040 10/19/2020 174703 GRC Nevada Inc. 100% Owned GRC Staked 10-2020
MN-64 Unpat Lode NV102155041 10/19/2020 174704 GRC Nevada Inc. 100% Owned GRC Staked 10-2020
GME 1 Unpat Lode NV105244488 5/18/2021 177638 - GRC Nevada Inc. 100% Owned GRC Staked 5-2021
GME 2 Unpat Lode NV105244489 5/18/2021 177639 - GRC Nevada Inc. 100% Owned GRC Staked 5-2021
GME 3 Unpat Lode NV105244490 5/18/2021 177640 - GRC Nevada Inc. 100% Owned GRC Staked 5-2021
GME 4 Unpat Lode NV105244491 5/18/2021 177641 - GRC Nevada Inc. 100% Owned GRC Staked 5-2021
GME 5 Unpat Lode NV105244492 5/18/2021 177642 - GRC Nevada Inc. 100% Owned GRC Staked 5-2021
GME 6 Unpat Lode NV105244493 5/18/2021 177643 - GRC Nevada Inc. 100% Owned GRC Staked 5-2021
GME 7 Unpat Lode NV105244494 5/18/2021 177644 - GRC Nevada Inc. 100% Owned GRC Staked 5-2021
GME 8 Unpat Lode NV105244495 5/18/2021 177645 - GRC Nevada Inc. 100% Owned GRC Staked 5-2021
GME 9 Unpat Lode NV105244496 5/18/2021 177646 - GRC Nevada Inc. 100% Owned GRC Staked 5-2021
GME 10 Unpat Lode NV105244497 5/18/2021 177647 - GRC Nevada Inc. 100% Owned GRC Staked 5-2021
GME 11 Unpat Lode NV105245082 6/14/2021 177729 957564 GRC Nevada Inc. 100% Owned GRC Staked 6-2021
GME 12 Unpat Lode NV105245083 6/14/2021 177730 957565 GRC Nevada Inc. 100% Owned GRC Staked 6-2021
GME 13 Unpat Lode NV105244498 5/18/2021 177648 - GRC Nevada Inc. 100% Owned GRC Staked 5-2021
GME 14 Unpat Lode NV105245084 6/14/2021 177731 957566 GRC Nevada Inc. 100% Owned GRC Staked 6-2021
GME 15 Unpat Lode NV105244499 5/18/2021 177649 - GRC Nevada Inc. 100% Owned GRC Staked 5-2021
GME 16 Unpat Lode NV105244500 5/18/2021 177650 - GRC Nevada Inc. 100% Owned GRC Staked 5-2021
GME 17 Unpat Lode NV105244501 5/18/2021 177651 - GRC Nevada Inc. 100% Owned GRC Staked 5-2021
GME 18 Unpat Lode NV105244502 5/18/2021 177652 - GRC Nevada Inc. 100% Owned GRC Staked 5-2021
GME 19 Unpat Lode NV105244503 5/18/2021 177653 - GRC Nevada Inc. 100% Owned GRC Staked 5-2021
GME 20 Unpat Lode NV105244504 5/18/2021 177654 - GRC Nevada Inc. 100% Owned GRC Staked 5-2021
GME 21 Unpat Lode NV105244505 5/18/2021 177655 - GRC Nevada Inc. 100% Owned GRC Staked 5-2021
GME 22 Unpat Lode NV105244506 5/18/2021 177656 - GRC Nevada Inc. 100% Owned GRC Staked 5-2021
GME 23 Unpat Lode NV105244507 5/18/2021 177657 - GRC Nevada Inc. 100% Owned GRC Staked 5-2021

2021 INITIAL ASSESSMENT TECHNICAL REPORT SUMMARY FOR THE GOLDEN MILE PROPERTY, NEVADA
31
GME 24 Unpat Lode NV105244508 5/18/2021 177658 - GRC Nevada Inc. 100% Owned GRC Staked 5-2021
GME 25 Unpat Lode NV105244509 5/18/2021 177659 - GRC Nevada Inc. 100% Owned GRC Staked 5-2021
GME 26 Unpat Lode NV105244510 5/18/2021 177660 - GRC Nevada Inc. 100% Owned GRC Staked 5-2021
GME 27 Unpat Lode NV105244511 5/17/2021 177661 - GRC Nevada Inc. 100% Owned GRC Staked 5-2021
GME 28 Unpat Lode NV105244512 5/17/2021 177662 - GRC Nevada Inc. 100% Owned GRC Staked 5-2021
GME 29 Unpat Lode NV105244513 5/17/2021 177663 - GRC Nevada Inc. 100% Owned GRC Staked 5-2021
GME 30 Unpat Lode NV105244514 5/17/2021 177664 - GRC Nevada Inc. 100% Owned GRC Staked 5-2021
GME 31 Unpat Lode NV105244515 5/17/2021 177665 - GRC Nevada Inc. 100% Owned GRC Staked 5-2021
GME 32 Unpat Lode NV105244516 5/17/2021 177666 - GRC Nevada Inc. 100% Owned GRC Staked 5-2021
GME 33 Unpat Lode NV105244517 5/17/2021 177667 - GRC Nevada Inc. 100% Owned GRC Staked 5-2021
GME 34 Unpat Lode NV105244518 5/17/2021 177668 - GRC Nevada Inc. 100% Owned GRC Staked 5-2021
GME 35 Unpat Lode NV105244519 5/17/2021 177669 - GRC Nevada Inc. 100% Owned GRC Staked 5-2021
GME 36 Unpat Lode NV105244520 5/17/2021 177670 - GRC Nevada Inc. 100% Owned GRC Staked 5-2021
GME 37 Unpat Lode NV105244521 5/17/2021 177671 - GRC Nevada Inc. 100% Owned GRC Staked 5-2021
GME 38 Unpat Lode NV105244522 5/17/2021 177672 - GRC Nevada Inc. 100% Owned GRC Staked 5-2021
GME 39 Unpat Lode NV105244523 5/17/2021 177673 - GRC Nevada Inc. 100% Owned GRC Staked 5-2021
GME 40 Unpat Lode NV105244524 5/17/2021 177674 - GRC Nevada Inc. 100% Owned GRC Staked 5-2021
GME 41 Unpat Lode NV105244525 5/17/2021 177675 - GRC Nevada Inc. 100% Owned GRC Staked 5-2021
GME 42 Unpat Lode NV105244526 5/17/2021 177676 - GRC Nevada Inc. 100% Owned GRC Staked 5-2021
GME 43 Unpat Lode NV105244527 5/17/2021 177677 - GRC Nevada Inc. 100% Owned GRC Staked 5-2021
GME 44 Unpat Lode NV105244528 5/17/2021 177678 - GRC Nevada Inc. 100% Owned GRC Staked 5-2021
GME 45 Unpat Lode NV105244529 5/17/2021 177679 - GRC Nevada Inc. 100% Owned GRC Staked 5-2021
GME 46 Unpat Lode NV105244530 5/17/2021 177680 - GRC Nevada Inc. 100% Owned GRC Staked 5-2021
GME 47 Unpat Lode NV105244531 5/17/2021 177681 - GRC Nevada Inc. 100% Owned GRC Staked 5-2021
GME 48 Unpat Lode NV105244532 5/17/2021 177682 - GRC Nevada Inc. 100% Owned GRC Staked 5-2021
GME 49 Unpat Lode NV105244533 5/17/2021 177683 - GRC Nevada Inc. 100% Owned GRC Staked 5-2021
GME 50 Unpat Lode NV105244534 5/17/2021 177684 - GRC Nevada Inc. 100% Owned GRC Staked 5-2021
GME 51 Unpat Lode NV105244535 5/17/2021 177685 - GRC Nevada Inc. 100% Owned GRC Staked 5-2021
GME 52 Unpat Lode NV105244536 5/17/2021 177686 - GRC Nevada Inc. 100% Owned GRC Staked 5-2021
GME 53 Unpat Lode NV105244537 5/17/2021 177687 - GRC Nevada Inc. 100% Owned GRC Staked 5-2021
GME 54 Unpat Lode NV105244538 5/17/2021 177688 - GRC Nevada Inc. 100% Owned GRC Staked 5-2021
GME 55 Unpat Lode NV105244539 5/18/2021 177689 - GRC Nevada Inc. 100% Owned GRC Staked 5-2021
GME 56 Unpat Lode NV105244540 5/18/2021 177690 - GRC Nevada Inc. 100% Owned GRC Staked 5-2021
GME 57 Unpat Lode NV105244541 5/18/2021 177691 - GRC Nevada Inc. 100% Owned GRC Staked 5-2021
GME 58 Unpat Lode NV105244542 5/18/2021 177692 - GRC Nevada Inc. 100% Owned GRC Staked 5-2021
GME 59 Unpat Lode NV105245085 6/14/2021 177732 957567 GRC Nevada Inc. 100% Owned GRC Staked 6-2021
GME 60 Unpat Lode NV105245086 6/14/2021 177733 957568 GRC Nevada Inc. 100% Owned GRC Staked 6-2021
Table 3.2 List of Patented Mineral Claims for the Golden Mile Property
Claim Name & No.
Property Owner Status Acquisition History
Long Shot, Cypress, Scorpion, Copper King - APN 009-020-02
Golden Mile GRC Nevada Inc. 100% Owned Acq From NMPII 6/2020
Copper Queen APN 009-020-04. Golden Mile GRC Nevada Inc. Leased - Vize/Crum Lease Assigned from NMPII 6/2020
3.3 Royalties, Agreements and Encumbrances
GRCN acquired 100% interest in the Golden Mile property from two separate business entities in June
2020. Total consideration was $650,000, consisting of $550,000 cash and $100,000 worth of stock
issuance. The sellers retained a net smelter return royalty (NSR) of 3% on future production from the
property claims. GRCN has the right to buy down 1% of the NSR on the claims for $1,500,000. A separate,
single patented claim (Copper Queen) is held under lease by GRCN. This lease has annual advance royalty
payments of $10,000 and a 3% NSR payable to Georgia L. Vize as Trustee of the Georgia L. Vize Family
Trust dated June 5, 2001 and John Crum, an individual.

2021 INITIAL ASSESSMENT TECHNICAL REPORT SUMMARY FOR THE GOLDEN MILE PROPERTY, NEVADA
32
The 599 GRCN unpatented mining claims are on U.S. Federal lands administered by the BLM. The
unpatented claims in the Golden Mile property are current and in good standing. Maintenance fees
totaling $98,835 were paid to the BLM prior to August 31, 2021. Affidavits of Assessment documents were
also recorded with Mineral County ($7,200) and Nye County ($72), both in Nevada, with a filing fee of
$12.00 paid per claim located in each county.
Real property taxes on the purchased patented mining claims, Long Shot, Cypress, Scorpion, Copper King
(APN 009-020-02), was $73.20 for 2021 -2022 and have been paid to Mineral County.
Real property taxes for the Copper Queen lease (APN 009-020-04) are paid by the Lessor.
3.4 Environmental Liabilities and Permitting
3.4.1 Environmental Liabilities
Most of the past mineral exploration activities on BLM administered ground at the Golden Mile property
have been reclaimed by previous operators. GRCN is not currently liable for reclamation of any remaining
associated disturbances from past activities.
GRCN commenced mineral exploration activities at the Golden Mile property and is currently liable for
reclamation of the associated disturbances. Liabilities associated with the exploration activities shall be
incorporated into the Plan of Operations and approved by both the BLM and the State of Nevada.
3.4.2 Required Permits and Status
The location and current land ownership position (i.e., public land ownership) of the Golden Mile property
means that it will be held to permitting requirements that are determined to be necessary by Mineral
County, the State of Nevada, and the U.S. Department of the Interior BLM, Stillwater District Office,
Stillwater Field Office.
In August 2020, GRCN initiated an environmental scoping exercise in preparation for submitting a Plan of
Operations (POO) in support of an Environmental Assessment (EA) with the Stillwater Field Office of the
BLM.
GRCN is engaged in evaluating the property area for environmental resources. The evaluation was based
upon information derived from the following sources:
• US Fish & Wildlife Service (USFWS),
• US Geological Survey (USGS),
• Nevada BLM,
• Nevada State GIS database, and
• US Department of Agriculture (USDA).

2021 INITIAL ASSESSMENT TECHNICAL REPORT SUMMARY FOR THE GOLDEN MILE PROPERTY, NEVADA
33
Using the same template used by the Nevada BLM offices, GRCN put together an Interdisciplinary Team
Checklist (IDT Checklist). This checklist follows the guidelines set in the National Environmental Policy Act
(NEPA) for the evaluation of environmental resources for potential impacts. The determination for
potential impact were as follows:
NP = not present in the area impacted by the proposed or alternative actions
NI = present, but not affected to a degree that detailed analysis is required
PI = present with potential for relevant impact that need to be analyzed in detail in the EA
Based upon the results of the initial scoping, GRCN determined which environmental resources needed
to be evaluated, and to what level of detail that evaluation should take place.
The checklist for survey deliverables will address the following environmental resources:
• Floodplains
• Surface Water Resources
• Recreation
• Cultural Resources (will meet partial requirements)
• Rangeland Health Standards
• Vegetation
• Woodland/Forestry
• Fuels/Fire Management
• Lands/Access
Also derived from the flight deliverables will include:
• Raw flight data (georeferenced)
• 2-ft contour map (.dxf format)
• ‘Bare Earth’ map
• Survey data for known and located Section corners
Permitting activities completed as of the effective date of this report include:
• Panels were set out and the area flown. Panels were set along roads every 914 m (3,000 ft) within
the property area in order to create a quality control database for the point cloud data,
• Processing the point cloud information in Pix4D mapping software,
• Generation of a 2-ft contour map,
• Quality control checks by RWC’s Nevada licensed Professional Land Surveyor,
• Aerial imagery checked for quality control, and
• Completion of aerial imagery maps for Floodplains, Soils, Surface Water, Recreation and
Vegetation.

2021 INITIAL ASSESSMENT TECHNICAL REPORT SUMMARY FOR THE GOLDEN MILE PROPERTY, NEVADA
34
Water resources are also prioritized as a high-level necessity. As such, GRCN performed a desktop review
using the Nevada Division of Water Resources (NDWR) online database. Within the Golden Mile property
area, there has been very little points of diversion identified, and those found are largely for stock water
usage, and thus are of very low yield and of no particular interest to GRCN. There are no points of diversion
within a one-mile radius of the Golden Mile Private land holdings. The property resides within four distinct
Hydrographic basins (Fig. 3.3):
• Gabbs Valley
• Ione Valley
• Monte Cristo Valley
• Big Smokey Valley
According to the NDWR online website, the Ione Valley basin was also found to be open for allocation
with the perennial yield, according to the Hydrographic Area Summary, is 2,500 acre-feet per year, while
the current allocation is only 189 acre-feet per year. According to the Office of the State Engineer of the
State of Nevada, Interim Order #1308, GRCN may rightfully apply for water rights within the Ione Valley
Hydrographic Basin. The Ione Basin is shown on Figure 3.3 and encompasses most of the Golden Mile
property area including the main resource area. An application for allocation of water rights within the
Ione Valley Hydrographic Basin was completed by the effective date of this report.
Figure 3.3 Hydrographic Basins in the Golden Mile Property area. Golden Mile Patented Claims in center
of map (shown in blue outline), straddling the Ione Valley and Big Smokey Valley Hydrographic Basins.

2021 INITIAL ASSESSMENT TECHNICAL REPORT SUMMARY FOR THE GOLDEN MILE PROPERTY, NEVADA
35
3.5 Other Significant Factors and Risks
Considerable effort has been expended on conducting surface inventories within the Golden Mile
property site. For the most part, these surveys have focused on surface features and artifacts. No finds of
significance have been identified to-date. Given the number of cultural and archeological resources in the
region, it is possible for subsurface discoveries to be made during construction of future mine facilities.
Such a discovery would require mitigation that could impact development of a mine.

2021 INITIAL ASSESSMENT TECHNICAL REPORT SUMMARY FOR THE GOLDEN MILE PROPERTY, NEVADA
36
4 ACCESSIBILITY, CLIMATE, LOCAL RESOURCES,
INFRASTRUCTURE AND PHYSIOGRAPHY
4.1 Topography, Elevation and Vegetation
The Golden Mile property is within the Basin and Range province, a major physiographic region of the
western United States. The region is typified by north-northeast trending mountain ranges separated by
broad, flat alluvium filled valleys. Locally, the mountain ranges trend northwesterly, making this area
rather anomalous in relation to typical Nevada physiography. Much of the northern portion of the
property is alluvial covered with volcanic rock outcrops.
The Golden Mile property lies on the northeastern slope and foothills of the Cedar Mountains. Elevations
on the property site range from a minimum of 2,011 m (6,600 ft) in the valley to a maximum of 2,463 m
(8,080 ft) at the uppermost elevation. The approximate elevation of the area known as the “Main Zone”
on the Golden Mile patented claims is 2,134 m (7,000 ft).
Sagebrush, grasses, and scattered juniper are the dominant vegetation in the area which supports sparse
deer and jackrabbit populations. No permitting problematic flora or fauna, such as Greater Sage-Grouse
and Desert Tortoise, have been discovered on the property to-date.
4.2 Accessibility and Transportation to the Property
The Golden Mile property is accessible, in part, by highway and maintained county dirt and gravel roads
(Fig. 4.1). The property can be reached from Hawthorne via Highway 95 east to Luning, then northeast on
Nevada Highway 361, then south on gravel Nevada State Road 89 about 39 km (24 mi) to an unimproved
dirt road which leads westward to the property. Alternatively, from Tonopah, travel 5 km (3 mi) west on
U.S. Highway 95 to gravel Road 89, then northwest to about 69 km (43 mi) to the unimproved road leading
west to the property. Regional roads are shown on the USGS lone Valley 1:100,000 topographic map. The
immediate property area is shown on the USGS Simon 1:24,000 topographic map.
Both Hawthorne and Tonopah offer motel accommodations, restaurants, grocery stores and other
services as well as fuel and other supplies. They are each the county seat for the respective counties of
Mineral and Nye.

2021 INITIAL ASSESSMENT TECHNICAL REPORT SUMMARY FOR THE GOLDEN MILE PROPERTY, NEVADA
37
Figure 4.1 Golden Mile Property Access (Location of the Main Zone Deposit is shown as a yellow star).
4.3 Climate
The climate for the Golden Mile property is dry, semi-arid, with annual precipitation of approximately 11.4
cm (4.5 in), as documented at the nearby Mina Meteorological Station. Average temperatures range from
a low of -6.7° C (20° F) to an average high temperature of 38° C (100° F) during July. Light snow may cover
the area from January to April in an average year. Generally, field operations can be conducted year-
round.
4.4 Sufficiency of Surface Rights
Mineral Resources in this report are located on patented claims controlled by GRCN. As described
elsewhere in this report, GRCN has secured and maintained the necessary permits for exploration of the
Golden Mile property.

2021 INITIAL ASSESSMENT TECHNICAL REPORT SUMMARY FOR THE GOLDEN MILE PROPERTY, NEVADA
38
4.5 Infrastructure Availability and Sources
4.5.1 Power
The closest power lines are located 8 km (5 mi) to the east in lone Valley. Future power needs for a
proposed project at Golden Mile would likely require diesel powered generation.
4.5.2 Water
Perennial streams are not present in the Golden Mile property area. Water is currently available from
springs and shallow surface wells located to east and to the west of the Main Zone deposit area. Drilling
activities and hydrogeologic studies have identified potential groundwater sources for any future mine
production and processing requirements.

2021 INITIAL ASSESSMENT TECHNICAL REPORT SUMMARY FOR THE GOLDEN MILE PROPERTY, NEVADA
39
5 HISTORY
The Golden Mile property has a long history which includes limited mining development, as well as a
considerable amount of recent exploration activity including mapping, surface and underground sampling,
geophysical surveys and drilling. This exploration activity was completed by several companies and has
defined a significant area of gold mineralization associated with skarn development and gold stockwork
mineralization along intrusive contact zones with surrounding sediments.
5.1 Prior Ownership and Ownership Changes
The most recent documented ownership of the Golden Mile property begins in 1973 with Colorado Energy
Corporation. Exploratory work at that time included initial geological mapping, rock sampling and small
magnetic survey on the J claims in what is now the Golden Mile property area. Late in 1974, the property
was farmed out to Standard Slag Company (Standard Slag). Standard Slag relinquished their option in
November 1975. No work is reported on the property between 1975 and 1981.
During 1982 to 1988, a consortium of companies including Elmwood Resources Ltd., Blythwood
Consolidated Resources Ltd., Silver Acorn Developments Ltd. and Luxor Explorations Inc. (referred to as
Elmwood JV) leased the Golden Mile property from Colorado Energy Corporation. In 1988 - 1989, Battle
Mountain Exploration Company (Battle Mountain) optioned the Golden Mile property from the Elmwood
Resources et al. consortium. Battle Mountain dropped their option on the property in 1989 and the
unpatented claims were allowed to lapse.
In 1991, Nevada Mine Properties (NMP) acquired the property by staking and eventually signing an
agreement with the private patented claim holders. This included forming a partnership on the four
patented claims thereby eliminating former onerous advance royalty payments and NSR terms.
US Minerals Exploration Company (USMX) leased the property from NMP in 1993. The property was
turned back after one year and NMP dropped the lease on the patented claim portion of the property.
During 1994-1996, Hemlo Gold Mines Inc. (Hemlo), after merging with Battle Mountain, leased part of the
property. Hemlo did no drilling, instead, performed data compilation, re-logging and re-assaying of RC
chips and undertook limited thin section petrography. Free gold was identified within chlorite rich skarn,
and an exploration model was constructed identifying retrograde skarn alteration. However, the property
was dropped when Hemlo was unable to acquire key patented claims and decided against exploring only
the unpatented claims only. In 1997, Prism Resources Inc. (Prism) leased the property from NMP. In 1998,
Teck Resources Inc. (Teck) entered into an option to joint venture with Prism. Following the 1999 program,
Teck relinquished its option in 2000 and Prism subsequently terminated its lease.
In 2002, Cordex, then Cordilleran Exploration, performed surface rock sampling on the property. Late in
2003, Purple Vein Resources Ltd. leased the Golden Mile property including the five patented claims from
NMP. Three additional unpatented claims staked for NMP were added to the property in 2004. In

2021 INITIAL ASSESSMENT TECHNICAL REPORT SUMMARY FOR THE GOLDEN MILE PROPERTY, NEVADA
40
December 2004, the corporate name Purple Vein Resources Ltd. was changed to Columbus Gold
Corporation (Columbus). Cordex, funded by Columbus, explored the property from 2004 to 2006. The
patented claims were also reacquired through a lease with the various parties.
In 2006, Cordex determined that lease payments on the patented property were too expensive to
continue exploration of the Golden Mile property. Cordex (Columbus) subleased the property to Portage
Minerals Inc. (Portage) in 2007. Portage compiled and reviewed property data, evaluated drill hole data
and relogged drill holes and prepared cross-sections with the purpose of planning further exploration.
Portage also completed a NI43-101 report in preparation for going public. Portage subsequently farmed
their interest in the property to Roscan in 2010. Roscan terminated its interest in the property in 2011.
The unpatented claims were subsequently conveyed by Columbus to a new company, Nevada Mine
Properties II Inc. (NMPII), and patented claims reverting back to underlying owners.
In 2015, NMPII signed an operating agreement (called “Cedar Mountain LLC”) with the owners of the Long
Shot, Cypress, Scorpion, Copper King patented claims and a mining lease with the owners of the Copper
Queen patented claim. These agreements successfully consolidated unpatented and patented claim
interests on the Golden Mile property.
In November 2016, Kinross entered into a Mining Lease and Assignment covering the patented and
unpatented mining claims held by Cedar Mountain LLC. No details for these transactions are available in
the public record. In October 2019, Kinross terminated all interest lease agreements covering patented
and unpatented claims at Golden Mile. Upon termination of the lease agreements, Kinross conveyed 363
unpatented mining claims to NMPII.
5.2 Historical Exploration and Development
A total of 20,158.2 m (66,131 ft) of air rotary or reverse circulation (RC) drilling and core has been
performed at the Golden Mile property prior to acquisition by GRCN. This included work by Standard Slag,
the Elmwood JV, Battle Mountain, USMX, Teck, Cordex, Roscan and Kinross (Table 5.1). All of these holes
were located within the boundaries of the present-day Golden Mile property (Fig. 5.1). The vast majority
of the drilling, however, has been directed towards the Main Zone located on the patented mineral claims.
The following is available for examination:
• Skeleton core from a 5‐hole diamond drilling program conducted by Roscan in 2011, and
• Chip trays containing RC drill cuttings completed by Battle Mountain Gold Corporation (1988‐89),
Cordex (2006-2007) and Kinross (2017-2019).

2021 INITIAL ASSESSMENT TECHNICAL REPORT SUMMARY FOR THE GOLDEN MILE PROPERTY, NEVADA
41
TABLE 5.1 Summary of Historic Drilling Completed at the Golden Mile Property
Company Year No. of
Holes
Type Total
Feet
Total
Meters Results
Standard Slag 1975 7 Air track 268 81.7 2 holes strong gold
Elmwood JV 1982-1988 18 Air track 1,141 347.8 11 holes with high Au
Battle Mtn 1988-1989 29 RC 11,650 3,551.8 11 holes with high Au
USMX 1993 15 RC 4,880 1,487.8 best intercept 0.124 opt
Teck 1999 5 RC 3,474 1,059.1 Weak Au in 4 holes
Cordex 2006-2007 28 RC 14,170 4,319 Weak-stringer Au in 22 holes
Roscan 2011 5 Core 3,146 958.9 Visible Au
Kinross 2017-2019 36 RC 27,402 8,352.1 Deep conceptual targets
Total 143 66,131 20,158.2
Figure 5.1 Location Map of Historic Drill Holes Completed on the Golden Mile Property

2021 INITIAL ASSESSMENT TECHNICAL REPORT SUMMARY FOR THE GOLDEN MILE PROPERTY, NEVADA
42
Significant results from historic drilling included up to 10.26 g/t Au (0.30 opst Au) over 36.6 m (120 ft)
including 34.89 g/t Au (1.02 opst Au) over 9.1 m (30 ft) and 6.04 g/t Au (0.19 opst Au) over 16.7 m (55 ft)
including 29.75 g/t Au (0.87 opst Au) over 3.0 m (10 ft) in Hole CMA89-7 (Battle Mountain) and 46.53 g/t
Au (1.36 opst Au) over 6.1 m (20 ft) including 91.00 g/t Au (2.66 opst Au) over 3.1 m (10 ft) in Hole GMC002
(Roscan). Significant results of historic drilling programs are summarized in Table 5.2. A significant portion
of the information gained from this drilling has been used for estimation of the initial resources reported
herein.
Table 5.2 Summary of Significant Historic Drilling Intercepts*
*Historic HoleID prefixes were designated by the following operators: CMA (USMX), CMA88 & CMA89 (Battle
Mountain Exploration), GM (Elmwood Joint Venture), GMC (Roscan) & MI (Cordex).
The following generally describes the exploration and development work undertaken by previous owners
and/or operators.
5.2.1 Early Exploration Work
The earliest documented exploration work was in 1973 by Colorado Energy Corporation who conducted
initial geological mapping rock sampling and small magnetic survey on the claims in what is now the

2021 INITIAL ASSESSMENT TECHNICAL REPORT SUMMARY FOR THE GOLDEN MILE PROPERTY, NEVADA
43
Golden Mile area. In 1975, Standard Slag drilled seven air track drill holes totaling 81.7 m (268 ft) in the
area of historic magnetite/copper workings in the Main Zone of the Golden Mile property (Fig. 5.2). The
deepest hole penetrated to depth of 18.3 m (60 ft) but several holes were lost in the underground
workings.
Figure 5.2 Photos looking north at Main Zone of the Golden Mile property (left) and closeup of
magnetite-copper mineralization exposed in small, historic open pit (right)
Standard Slag reported interceptions including 9.59 g/t Au (0.28 opst Au) over 3.1 m (10 ft) in Drill Hole
AT-2B, and 7.19 g/t Au (0.21 opst Au) over 7.6 m (25 ft) in Drill Hole AT-1A, an inclined hole which drilled
along strike (Jaramillo, 1975). All the remaining holes reportedly cut poorly mineralized limestone.
Standard Slag relinquished their option in November 1975 and no further work was reported on the
property between 1975 and 1982.
From 1982 to 1988, a joint venture comprised of Elmwood Resources Ltd, Blythwood Consolidated
Resources Ltd, Silver Acorn Developments Ltd and Luxor Explorations Inc (Elmwood JV) performed
geological mapping, a limited ground magnetic survey, and drilled 18 shallow air track holes totaling 347.8
m (1,141 ft). Elevated gold values were reported in 11 of the 18 holes including 9.59 g/t Au (0.28 opst Au
over 15.2 m (50 ft) in hole GM15 and 3.46 g/t Au (0.101 opst Au) over 14.0 m (46 ft) in hole GM13 (Pegg,
1988). All holes were drilled within the Main Zone and in similarly altered rock to the west of the Main
Zone and mineralized intercepts were within 30 m (100 ft) of surface. Two cyanide bottle roll tests were
also completed early in the program returning gold recoveries of 84% and 81% after a 24-hour period (Dix,
1982).
During 1988 and 1989, Battle Mountain Exploration Company (Battle Mountain) completed rock sampling,
wide-spaced ground magnetic and VLF-EM surveys and drilled 29 RC drill holes totaling 3,551.8 m (11,650
ft). Fifteen of the holes were drilled vertically and the remainder were angled holes. Holes were primarily
drilled in the Main Zone and along the intrusive contact to the northeast. Several vertical holes were also
drilled through post-mineral volcanic cover to the north and northeast extending the known mineralized
zone to the northeast for at least a 100 m (300 ft). Elevated gold values were reported in 13 of the drill

2021 INITIAL ASSESSMENT TECHNICAL REPORT SUMMARY FOR THE GOLDEN MILE PROPERTY, NEVADA
44
holes, including 28.96 m (95 ft) grading 19.86 g/t Au (0.580 opst Au) in drill hole 89-7, which included
46.92 g/t Au (1.37 opst Au) over 9.1 m (30 ft), and 8.90 g/t Au (0.26 opst Au) over 4.57 m (15 ft) in drill
hole 88-2 (Gatchell, 1989).
In 1993, US Minerals Exploration Company (USMX) drilled 15 RC holes totaling 1,487.8 m (4,880 ft) mainly
testing down-dip extensions of the mineralization intersected by Battle Mountain. The best intercept
reported was 4.25 g/t Au (0.124 opst Au) over 13.7 m (45 ft) (Kern, 1998).
5.2.2 Teck
During 1998 and 1999, Teck Resources Inc. (Teck) completed a major exploration program including 4 km2
geological mapping and surface rock geochemical sampling (Hudson, 1998). Geophysical work was also
conducted including 7.5 line-km of controlled-source, audio-frequency magneto-telluric (CSAMT), four
linekm of dipole-dipole induced polarization (IP) and 38 line-km of ground magnetometer surveys.
Teck completed geological mapping over the entire property area at a scale of 1:6,000. Mesozoic rocks in
the immediate mine area were mapped at 1:1,200, using an existing grid for control.
Teck also performed petrographic studies on four thin sections taken from cuttings from drill holes GMT-
2 and GMT-3. Hudson (1999) described a variety of skarn assemblages from GMT-2, including garnet-
diopside skarn with retrograde calcite-white mica in sandy or interbedded limestone, calcite-diopside-
idocrase white mica skarn, and caicite-1, wollastonite skarn. From 1% to 5% fine-grained disseminated
anhedral pyrite was also present in the chips. GMT-3 intercepted altered pyroxene diorite or gabbro
(AnS0) with about 1% quartz. The diorite is weakly and variably altered to chlorite-epidote-calcite-clay
assemblages. In some cases, the pyroxene has been replaced by actinolite. In other chips, pyroxene is
replaced by calcite-epidote-chlorite. Bicchulite, (Ca2Al(SiAl)O7H2O) is tentatively identified as replacing
plagioclase and pyroxene in some chips. The diorite hosts garnet diopside- calcite (+quartz) endoskarn
with trace pyrrhotite. Quartz-calcite-filled fractures crosscut the garnet. Exoskarn chips in limestone are
also present.
During 1998, Teck also collected 87 surface rock samples from the Golden Mile area, of which 67 were
located within the boundaries of the present-day Golden Mile property. Of these 67 samples, gold results
ranged from below detection (<5 ppb Au) to a maximum of 6,120 ppb Au (CDR-136.) Ten of these samples
exceeded 500 ppb Au. Results for these highest ten samples are presented in Table 5.3.

2021 INITIAL ASSESSMENT TECHNICAL REPORT SUMMARY FOR THE GOLDEN MILE PROPERTY, NEVADA
45
TABLE 5.3 Teck Significant Surface Rock Chip Samples (>500 ppb Au)
Sample Au (ppb) Ag (ppm} As (ppm) Bi (ppm) Cu (ppm) Sb (ppm) Zn (ppm)
CDR 136 6,120 3.8 394 28 2,750 72 2,540
CDR 132 5,460 7.8 5,350 62 4,100 84 132
CDR 129 4,160 7.0 358 10 6,130 38 328
CDR 133 1,850 9.8 8,110 530 2,670 72 48
CDR 8 1,455 3.6 590 0 2,200 40 136
CDR 135 1,260 4.8 2,690 394 3,050 2 26
CDR 130 905 5.8 792 20 3,530 18 112
CDR 6 730 3.0 296 Inf >10,000 12 298
CDR 7 645 2.0 2,630 Inf >10,000 98 1,855
CDR 18 535 1.4 1,650 Inf 19 72 136
In 1999, Teck drilled five RC holes totaling 1,059.1 m (3,474 ft) testing extensions and new targets on the
Golden Mile property, outside the Main zone. These holes were angled to depths of 165 m (540 ft) to 262
m (860 ft) targeting geophysical anomalies within the unpatented claim block. Two holes (GMT-3 & GMT-
5) failed to reach the desired target and remained in volcanic rock. The northeast extension of the breccia
zone also remained untested. Several of their holes cut relatively thick zones of low-grade gold
approximately 457 m (1,500 ft) north and east of the Main Zone. At least one hole penetrated over 122
m (400 ft) of magnetite rich sediments with associated anomalous gold. This hole tested a large magnetic
anomaly located on the east side of the property. Teck, as was the case with Battle Mountain, could not
renegotiate lease terms with the patented claim owners in a timely manner and therefore no Teck drilling
was collared on patented claims.
The most significant results were returned from Hole GMT-2 designed to test a magnetic high on the ridge,
east of the Main Zone. A previous drill hole by Battle Mountain had encountered massive magnetite in
this area. Silicified breccia and a CSAMT resistivity anomaly are also present on this ridge. Teck reported
encountering 122 m (400 ft) of magnetitegarnet-sericite-calcite skarn in GMT-2 (Kuzma, 1999). Short
intervals of elevated gold values were intersected within the skarn including 0.79 g/ Au (0.023 opst Au)
over 6.1 m (20 ft) starting 189m (620 ft) downhole, and 0.465 g/t Au (0.014 opst Au over 3.1 m (10 ft)
starting 226 m (740 ft) downhole.
5.2.3 Cordex
in 2002, Cordex, then Cordilleran Exploration Company, performed surface rock sampling on the property.
Late in 2003, Purple Vein Resources Ltd leased the Golden Mile property including the five patented
claims. In December 2004, the corporate name Purple Vein Resources Ltd was changed to Columbus Gold
Corporation (Columbus).
In 2006, Cordex commenced an exploration program on the Golden Mile property funded by Columbus.
Cordex conducted surface geological mapping at a scale of 200 feet to the inch (1:2,400) and detailed the

2021 INITIAL ASSESSMENT TECHNICAL REPORT SUMMARY FOR THE GOLDEN MILE PROPERTY, NEVADA
46
distribution of rock types and outcrops and features related to mineralization, including structures,
distribution of skarn alteration, and limonite. Cordex also mapped accessible underground workings at a
scale of 20 feet to one inch (1:240). Geologic features were recorded, and representative underground
rock-chip assay samples were collected across the back and along the walls of the workings. The geologic
information collected, integrated with surface and subsurface data on distribution of gold mineralization,
indicated that gold is located along northeast structural trend that lies along the contact of limestone with
quartz diorite. Some northwest structures were also mapped and appeared to be related to the northeast-
trending contact of the quartz diorite.
In 2002, Cordex collected 38 rock chip samples from within the current Golden Mile property boundaries.
Five of the samples were RC cuttings from either the Teck or Battle Mountain drill holes. Results ranged
up to 10,880 ppb Au. Four rock samples and four samples of cuttings returned gold values exceeding 500
ppb Au (Table 5.4).
TABLE 5.4 Cordex Significant Rock Chip Samples (>500 ppb Au)
Sample Au
(ppb)
Ag
(ppm)
As
(ppm)
Bi
(ppm)
Cu
(ppm)
Sb
(ppm)
Zn
(ppm) Description
3578 10,880 7.6 1,012 3870 2808 132 100 o/c near adit, feox, mod sil
3575 6,341 2.6 1,447 135 1094 18 21 SLTw/Vcc gray, feox
3588 5,411 5.9 123 14 3273 10 234 sheared bleached SLT mt, feox, feox
3571 2,728 0.6 29 -1 4 4 10 DH cuttings GMT-3 660-665 (1080 ppb)
3570 1,856 0.5 104 5 52 -2 10 DH cuttings GMT-3 590-595 (1300 ppb)
3582 1,301 0.6 150 11 44 2 12 GMT-3 cuttings 590-595; gray QDR
3583 1,233 0.7 25 3 10 2 11 cuttings wk ox, tr veinqtz
3568 713 2.7 413 19 1994 11 103 dump, PY
Columbus also funded Cordex to drill 28 RC holes totaling 4,319m (14,170 ft) in 2006. The principal
objectives of the drill program were to establish lateral continuity of gold mineralization, determine the
width and length of mineralized trends, and to achieve the understanding of the distribution and controls
on gold mineralization. This program also tested down-dip and strike extensions of better grade
mineralization identified from earlier drilling, primarily to the north and northeast under post-mineral
volcanic cover. The most significant results were returned from Holes MI-06 and MI-12. Hole MI-06
intercepted 9.1 m (30 ft) averaging 3.54 g/t Au (0.103 opst Au) starting at 61.0 m (200 ft) down-hole and
Hole MI-12 encountered 18.3 m (60 ft) averaging 7.14 g/t Au (0.208 g/t Au) starting at 51.8 m (170 ft)
down-hole. Several holes intercepted >30 m (>100 ft) thick continuous zones of low-grade gold
mineralization, approximately 0.3 g/t Au (0.01 opst Au).

2021 INITIAL ASSESSMENT TECHNICAL REPORT SUMMARY FOR THE GOLDEN MILE PROPERTY, NEVADA
47
Significant results of the Cordex RC drilling program are summarized in Table 5.5.
TABLE 5.5 Significant Results from Cordex Drilling (from Suda, 2009)
Drill
Hole
Incl. Bearing
Total Depth ft
Total Depth
m
Intercept
ft
Intercept
m
Interval
ft
Interval
m
Au
opst
Au
g/t
Ml-01 -50, N60W 550 167.6 00-15 0.0-4.6 15 4.57 0.018 0.6
29.0-36.6 25 7.62 0.038 1.291
Ml-02
-50, N55W 450 137.2 00-85 0.0-25.9 85 25.91 0.036 1.222
includes 00-50 0.0-15.2 50 15.24 0.058 2.002
295-310 89.9-94.5 15 4.57 0.042 1.423
Ml-03 -50, N60W 185 56.4 00-30 0.0-09.1 30 9.14 0.053 1.35
Ml-04 -50, N60W 495 150.9 125-130 38.8-39.6 5 1.52 0.018 0.622
Ml-05 -50, N60W 465 141.7 No assays >500 ppb
Ml-06
-50, N60W 595 181.3 200-230 61.0-70.1 30 9.14 0.103 3.54
265-270 80.8-83.3 5 1.52 0.023 0.95
390-395 118.9-120.4 5 1.52 0.025 0.866
590-595 179.8-181.3 5 1.52 0.029 0.988
Ml-07 -50, N60W 550 167.6 230-235 70.1-71.6 5 1.52 0.026 0.882
Ml-08
-50, N60W 505 153.9 05.0-10.0 1.5-3.0 5 1.52 0.119 4.105
150-155 45.7-47.2 5 1.52 0.027 0.942
195-200 59.4-61.0 5 1.52 0.029 0.979
Ml-09 -90 545 166.1 No assays >500 ppb
Ml-10 -90 525 160 185-190 56.4-57.9 5 1.52 0.023 0.772
Ml-11 -50, N60W 495 150.9 No assays >500 ppb
Ml-12
-50, N60W 395 120.4 130-135 39.6-41.1 5 1.52 0.017 0.571
170-230 51.8-70.1 60 18.29 0.208 7.139
includes 170-200 51.8-61.0 30 9.14 0.402 13.807
365-370 111.2-112.8 5 1.52 0.025 0.851
380-390 115.8-118.9 10 3.05 0.028 0.932
Ml-13
-50, N60W 685 208.8 205-215 62.5-65.5 10 3.05 0.106 3.62
255-260 77.7-79.2 5 1.52 0.175 6
275-280 83.8-91.9 5 1.52 0.018 0.608
405-410 123.4-125.0 5 1.52 0.023 0.802
600-605 182.9-184.4 5 1.52 0.067 1.518
MI-14
-50, N60W 585 178.3 210-215 64.0-65.5 5 1.52 0.016 0.53
300-305 91.4-93.0 5 1.52 0.029 0.987
410-420 125.0-128.0 10 305 0.022 0.754
470-485 143.2-147.8 15 4.57 0.017 0.569
525-535 160.0-163.1 10 3.05 0.031 1.059
MI-15 -90 665 202.7 415-420 126.5-128.0 5 1.52 0.046 1.559
Ml-16
-50, N60W 556 169.2 195-200 59.5-61.9 5 1.52 0.037 1.277 215-300 66.5-91.5 85 25.91 0.022 0.786
215-275 65.5-83.4 60 18.29 0.017 0.569
275-300 83.4-91.5 25 7.62 0.038 1.307
435-440 132.6-134.1 5 1.52 0.017 0.567
Ml-17 -50. N62W 495 150.9 415-425 455-470
126.5-129.6 138.7-143.3
10 15
3.05 4.57
0.015 0.019
0.542 0.774
Ml-18
-50, N60W 525 160 380-385 115.9-117.4 5 1.52 0.029 1.007 455-460 138.7-140.2 5 1.52 0.043 1.472
495-500 150.9-152.4 5 1.52 0.015 0.52
Ml-19
-50, N60W 503 153 210-215 64.0-65.5 5 1.52 0.022 0.75 280-290 85.4-88.4 10 3.05 0.022 0.769
415-425 126.5-129.6 10 3.05 0.038 1.286
440-445 134.1-135.7 5 1.52 0.096 3.28
495-503 150.9-153.4 8 2.44 0.033 1.145
Ml-20 -50, N61W 555 169.2 No assays > 500 ppb
Ml-21 -50, N60W 500 152.4 75-90 22.9-27.4 15 4.57 0.037 1.273

2021 INITIAL ASSESSMENT TECHNICAL REPORT SUMMARY FOR THE GOLDEN MILE PROPERTY, NEVADA
48
85-90
135-145
230-255 465-480
25.9-27.4
41.2-44.2
70.1-77.7 141.8-146.3
5
10
25 15
1.52
3.05
7.62 4.57
0.065
0.017
0.015 0.024
2.214
0.568
0.502 0.829
Ml-22 -50, N60W 500 152.4
includes
150-340
150-190
180-185
210-230
240-270
285-300
360-365 390-400
45.7-103.7
45.7-57.9
54.7-56.4
64.0-70.1
73.2-82.3
86.9-91.5
109.8-111.3 118.9-122.0
190
40
5
20
30
15
5 10
58
12.19
1.52
6.1
9.14
4.57
1.52 3.05
0.019
0.020
0.088
0.074
0.015
0.028
0.092 0.013
0.644
0.673
2.508
0.514
0.943
3.134
0.529
Ml-23 -50, N60W 495 150.9 255-260
335-355 335-340
77.7-79.3
102.1-108.2 102.1-103.7
5
20 5
1.52
6.1 1.52
0.089
0.027 0.073
3.032
0.913 2.492
Ml-24 -50, N60W 500 152.4 No assays > 500 ppb
Ml-25 -50, S25W 500 152.4 includes
380-395 385-390
115.9-120.4 117.3-118.9
15 5
4.57 1.52
0.025 0.053
0.859 1.805
MI-26 -50, S26W 500 152.4 220-225 315-320
67.1-68.6 96.0-97.6
5 5
1.52 1.52
0.031 0.04
1.067 1.384
Ml-27 -50, S50W 410 125 No assays > 500 ppb
Ml-28 -50. S45E 445 135.7 No assays > 500 ppb
5.2.4 Portage
Portage Minerals Inc (Portage) optioned the Golden Mile property from Columbus in late 2007. Portage
completed a detailed data review and evaluated drill-hole data and cross sections with the purpose of
planning further exploration. Portage also commissioned the preparation of a NI 43-101 Technical Report
for the property (Suda, 2009). This report incorporated the findings of a proprietary report by Dr Richard
Nielsen of Scott Wilson-Roscoe Postle Associates on behalf of Portage in 2008. GRCN has not obtained a
copy of this proprietary report.
5.2.5 Roscan
In 2011, Roscan drilled five diamond core (HQ-size) holes totaling 958.9m (3,146 ft) on the Golden Mile
property (Roscan, 2011). Four of the holes were drilled as twin holes to RC holes drilled by previous
explorers (mainly Battle Mountain and Cordex) to compare assay results and to determine controls on
gold mineralization. One hole was drilled to test a mapped north-northwest trending shear zone. The core
holes drilled to twin previously drilled RC holes were located as close to each respective hole as practical.
“Twins” may have been as far as 15m (50 ft) from the original hole mainly due to previous site reclamation
and lack of adequate surveying of original collars. Both the RC holes and the core holes were sampled on
1.52m (5 ft) intervals.
All Roscan core holes cut ore-grade to significant gold mineralization (Table 5.6). Drill holes intercepted
up to 6.1 m (20.0 ft) averaging 46.40 g/t Au (1.353 opst Au) in Drill Hole GMC002, which twinned a previous
RC hole that intersected 9.1 m (30.0 ft) averaging 46.97 g/t Au (1.37 opst Au). High-grade gold
mineralization was observed to be concentrated in iron oxide veinlet zones that represent weathered
pyrite veinlet zones that trend north-northwest within calcareous sandstone and quartz diorite. Hole

2021 INITIAL ASSESSMENT TECHNICAL REPORT SUMMARY FOR THE GOLDEN MILE PROPERTY, NEVADA
49
GMC002 also intercepted 22.9m (75 ft) grading 0.74 g/t Au (0.022 opst Au) starting 86.7 m (285 ft) down-
hole.
Generally, the core holes intersected narrower and, locally, lower-grade intercepts relative to the earlier
rotary drilling. In some cases, grades exceeded the nearby RC holes. Based on the limited data on recovery
and the condition of the core, it is reasonable to assume that some recovery problems with core were
experienced within the mineralized zones.
TABLE 5.6 Significant Results from Roscan Drilling (from Roscan, 2011)
5.2.6 NMPII
In 2014, NMPII completed a reevaluation of past drilling activities including compilation of a digital
database which identified numerous deficiencies in the drill data (NMPII, 2014). In particular, the assay
data showed that mineralization was erratic. During the last four of five drill programs completed before
2014, duplicate assaying was done on higher grade samples. Gold values were found to have reasonable
repeatability at lower grades. Higher grade intervals (>1 g/t Au), however, tended to vary as much as 200%
when reassayed. NMPII reported that it was not uncommon to see values ranging from 15 g/t Au (0.438
opst) to over 50 g/t Au (1.46 opst) from the same sample. These samples included reassay of pulps, rejects
and second samples collected during drilling. Free gold was noted drill cuttings and core by several past
exploration groups and a pronounced nugget effect most likely accounts for the discrepancy in the high-
grade samples.

2021 INITIAL ASSESSMENT TECHNICAL REPORT SUMMARY FOR THE GOLDEN MILE PROPERTY, NEVADA
50
5.2.7 Kinross
During the lease period 2016-2019, NMPII reported that Kinross provided no interpretive data and very
few reports on their exploration activities. Kinross developed an initial exploration model and identified
targets over time as they enlarged the claim block. Kinross concluded that their geologic model did not
comport to their exploration findings. This included drill testing of a significant IP chargeability
high/resistivity low, south of Golden Mile skarn.
In summary, from 2016 to 2019 Kinross performed the following exploration work on the Golden Mile
property:
1. Rock and Soil Sampling 2. Airborne VTEM geophysical survey (resistivity and magnetics) 3. Ground gravity survey 4. IP-Resistivity survey (one line) completed by Zonge Geoscience Inc. (Zonge) 5. Geologic mapping by John Norby and Gerry Ray 6. Petrographic studies 7. 36 RC drill holes totaling 8,352.1 m (27,402 ft); included drill testing of IP chargeability
high/resistivity low, south of Golden Mile skarn.
In general, RC drilling by Kinross returned only elevated gold values with the most significant results
returned from drill hole GM19-15. This hole was drilled in the vicinity of the Golden Mile Main Zone and
intersected 12.19 m (40.0 ft) averaging 0.47 g/t Au (0.01 opst Au) including 4.57 m (15 ft) averaging 0.79
g/t (0.02 opst Au).
Significant results of the Kinross RC drilling program are summarized in Table 5.7.
TABLE 5.7 Significant Results from Kinross Drilling 2017-2019
Target DH ID From To Interval Au
m m m g/t
GM GM17-01 28.96 30.48 1.52 0.266
BELL BL18-06 227.08 234.70 7.62 0.375
inc. 228.60 230.12 1.52 0.867
GM
GM19-02 38.10 41.15 3.05 0.271
GM19-09 71.63 73.15 1.52 1.020
GM19-10 193.55 196.60 3.05 0.337
GM19-15
6.10 10.67 4.57 0.413
inc. 6.10 7.62 1.52 0.837
24.38 27.43 3.05 0.288
inc. 24.38 25.91 1.52 0.512
35.05 44.20 9.14 0.271
inc. 35.05 38.10 3.05 0.489
41.15 44.20 3.05 0.263
59.44 71.63 12.19 0.470
inc. 62.48 67.06 4.57 0.789
68.58 70.10 1.52 0.844
79.25 105.16 25.91 0.212
inc. 83.82 85.34 1.52 0.502
97.54 99.06 1.52 0.455

2021 INITIAL ASSESSMENT TECHNICAL REPORT SUMMARY FOR THE GOLDEN MILE PROPERTY, NEVADA
51
In June 2016, Kinross contracted consulting geologist Gerry Ray to examine the geology, the various styles
of alteration and the Au-bearing Cu-Fe skarn mineralization on the Golden Mile property (Ray, 2016). A
total of 59 rock chip or grab samples were collected representing all types of hydrothermal and non-
hydrothermal alteration. The samples were submitted to ALS USA Inc. (ALS) in Reno for whole rock and
trace element analysis, including for gold and silver assay. Assays showed that all 7 samples taken from
the Main Zone were anomalous in gold (minimum 266 ppb to a maximum of 2,390 ppb Au) and that most
samples contain significant amounts of copper (maximum 9 % Cu). In addition, many Main Zone samples
were anomalous in other elements including silver (up to 12.1 ppm Ag) together with As, Zn, Bi, Sb, Te,
and Co. However, apart from the Main Zone, no Dunlap Formation rocks outcropping on surface within
the Golden Mile Stock thermal aureole contain significant amounts of gold or base metal mineralization;
this includes the more extensive areas of hornfels (Unit HF) and silicification (Unit S) as well as those with
more limited and sporadic exoskarn alteration (Unit SK). Most of the Luning Formation samples were also
barren, including beds cut by veins of Fe carbonate. One exception occurs in the southernmost elongate
unit of impure limestone where there are several small workings including a vertical shaft. Assays of this
hematite-goethite-rich material, as seen on the shaft dump contains up to 5.5% Cu with anomalous
quantities of Zn, As, Bi, Sb, Se, Co and Ag (the latter up to 8.5 ppm Ag). However, gold values are very low
with a maximum of 20 ppb Au. Most of the Golden Mile Stock, including parts with dense quartz-feldspar
stockwork veins and rusty weathering zones are barren of base and precious metal mineralization. By
contrast, the 5 endoskarn samples contain anomalous amounts of gold and other elements, particularly
samples from the western portion of the stock.
Table 5.8 below compares the average values of the major elements in the endoskarn and non-
endoskarn-altered Golden Mile Stock. The endoskarn has noticeably higher amounts of Fe, Ca, Mg and
LoI, and considerably lower values of Si, Al, Na and K (Ray, 2016).

2021 INITIAL ASSESSMENT TECHNICAL REPORT SUMMARY FOR THE GOLDEN MILE PROPERTY, NEVADA
52
TABLE 5.8 Comparing average assay values for various parts of the Golden Mile Stock (Ray, 2016): (1)
Stock with few or no veins: (2) Stock with abundant stockworks: (3) Endoskarn. Anomalous values in red
5.3 Geophysics
Various types of geophysical surveys have been carried out on the Golden Mile property since the 1980’s.
The earliest documented surveys were carried out by Battle Mountain in 1988-1989 and Teck Resources
in 1999. These surveys included a ground magnetic (GMAG) survey using a hand-held magnetometer,
controlled source audio magneto-telluric (CSAMT) and induced polarization (IP).
In late 2016, Kinross contracted Zonge Geosciences (Zonge) to fly a Versatile Time Domain
Electromagnetic (VTEM) survey over the Golden Mile property, which also included both electromagnetic
and magnetic data. Gold related skarn mineralization was the main target type sought. Kinross also had
Zonge complete a gravity survey in the spring of 2017 and an IP/Resistivity survey in the winter of 2018.
The primary objective of these surveys was lithologic/structural definition and alteration delineation in
support of the gold exploration program.
The location of geophysical surveys completed to-date are shown in Figure 5.3.
The reader is referred to reports by previous operators for descriptions of results and interpretation of
historical geophysical studies at Golden Mile.

2021 INITIAL ASSESSMENT TECHNICAL REPORT SUMMARY FOR THE GOLDEN MILE PROPERTY, NEVADA
53
Figure 5.3 Location Map of Geophysical Surveys Completed on the Golden Mile Property

2021 INITIAL ASSESSMENT TECHNICAL REPORT SUMMARY FOR THE GOLDEN MILE PROPERTY, NEVADA
54
5.4 Historical Production
Gold and copper mineralization were first discovered in the Golden Mile area by Jesse Workman in 1902
(O’Donnell, 2006.). J. L. Walsh acquired the property in about 1916, but the property lay dormant from
about 1918 to 1935. The bulk of the recorded historical production took place in 1935 and 1936. Ore was
mined from a small open cut approximately 91 m (300 ft) x 30 m (100 ft) x 12 m (40 ft) deep, and from
shallow underground workings beneath it. Total production at that time is reported to have been about
9,100 tonnes (10,000 short tons) at a gold grade of approximately 3.4 g/t Au (0.10 opst Au). Assays from
two shipments of hand sorted ore shipped to the ASARCO smelter in Salt Lake City in 1936 are reported
in Vanderburg (1937) as tabulated in Table 5.9. This mined material was copper-bearing magnetite skarn
taken from the Main Zone at Golden Mile. Gangue material for this rock is described as iron oxide and
calcite containing an average of 30% iron.
Table 5.9 1936 Production Assays (Vanderburg, 1937)
Reported Assays, 1936 Gold (opst) Silver (opst) Copper (%) Arsenic (%)
Asarco Settlement Assay 0.345 1.15 1.66 0.3
Union Assay Report 0.26 1.2 1.06 Trace

2021 INITIAL ASSESSMENT TECHNICAL REPORT SUMMARY FOR THE GOLDEN MILE PROPERTY, NEVADA
55
6 GEOLOGICAL SETTING, MINERALIZATION, AND DEPOSIT
6.1 Regional Geology
The Golden Mile property is located in the central portion of the Walker Lane trend, a major northwest-
aligned structurally deformed zone on the western border of Nevada characterized by a series of closely
spaced dextral strike-slip faults that have been active throughout much of the middle to late Cenozoic
(Figs. 6.1 and 6.2). It is a complex accommodation zone up to 300 km (186 mi) wide and approximately
1,000 km (620 mi) long positioned between the western boundary of the extensional Basin and Range
Province and the Sierra Nevada microplate. Translation along this boundary has been shown to
accommodate nearly 20% of North American and Pacific plate translational motion (Ferranti et al., 2009;
Carlson et al., 2013). This area remains tectonically active at present.
The Walker Lane trend is documented to be at least as old as 28 Ma and deformation has varied over
time, with initial extension in a north to north-northeast direction and characterized by west-northwest
to northwest-trending strike-slip faults. Locally these faults serve as the primary controls for
mineralization at Golden Mile. Important regional structural timing (Albino and Boyer, 1992; Anderson et
al., 2012; Colgan et al., 2006) of events includes:
➢ 26 Ma: Initiation of Walker Lane (east-west alignments)
➢ 19 Ma: Middle stage Walker Lane (northwesterly alignment of faults, with possible left-
lateral movements on NW aligned faults)
➢ 17–12 Ma: Basin and Range extension and late tilting (western Nevada) (N-NE trending
structures)
➢ Post–17 Ma possible left-lateral strike-slip faulting, reactivation of basement faults?
Regionally, the Golden Mile property is situated along the eastern flanks of the Cedar Mountains. The
Cedar Mountains are underlain by Triassic to Jurassic aged carbonates and clastic rocks which have been
intruded by Cretaceous to Tertiary dioritic to granitic intrusives (Kern, 1998). Quartz monzonite intrusives
are most common. These rocks are overlain by Miocene to Pliocene age rhyolitic to basaltic volcanics and
volcaniclastics. Miocene-Pliocene lake beds, including diatomite deposits, lap onto the edge of the range.
Quaternary alluvium largely consisting of alluvial fans spreading from major drainages into adjacent
valleys covers much of region. Large-scale folding of basement rocks has been mapped within the range
which may be associated with the Sevier Orogeny. Principal faults on a regional scale are Tertiary-aged
northwest-trending strike-slip faults of the Walker Lane trend.

2021 INITIAL ASSESSMENT TECHNICAL REPORT SUMMARY FOR THE GOLDEN MILE PROPERTY, NEVADA
56
Figure 6.1 Generalized Geologic Map of Nevada showing location of Golden Mile property (from Tingley,
1999).

2021 INITIAL ASSESSMENT TECHNICAL REPORT SUMMARY FOR THE GOLDEN MILE PROPERTY, NEVADA
57
Figure 6.2 Shaded relief map of western North America with state boundaries in white. Yellow shade
indicates extent of Walker Lane defined by Carlson et. al. 2013. Fault zones are shown in red and defined
as: ECSZ-Eastern California shear zone; SAFZ-San Andres fault zone, GFZ-Garlock fault zone. Golden Mile
property location is indicated with a red star (after Carlson et. al., 2013). Red box denotes Central
Walker Lane.

2021 INITIAL ASSESSMENT TECHNICAL REPORT SUMMARY FOR THE GOLDEN MILE PROPERTY, NEVADA
58
6.2 Local and Property Geology
The oldest rocks on the Golden Mile property are the Triassic Luning Formation, composed of a thin
bedded to massive sedimentary sequence of calcareous siltstone, thin- to medium-bedded limestone and
dolomitic limestone, argillite and sandstone (Ray, 2016). The upper 150 m are dominantly carbonate
rocks, locally quite fossiliferous.
The Luning Formation is unconformably overlain by Jurassic-age siliciclastic and lesser calcareous
sedimentary rocks of the Dunlap Formation. Both formations have been folded and are now steeply to
sub-vertically inclined. Both units have been intruded by various granitoid stocks, sills and dikes that
include quartz diorite, granodiorite, quartz monzonite and felsic quartz-feldspar porphyry. One quartz
diorite-granodiorite body is named “the Golden Mile Stock” and may be responsible for the Au-Cu (Fe)
skarn mineralization (Ray, 2016). The stock is only exposed on surface in three small areas because most
of its northern extent is covered by younger Tertiary volcanic rock. Most of the latter are a bimodal suite
of felsic to mafic volcanic flows and tuffs.
The magnetite skarn in the Main Zone at Golden Mile was the primary source of historical production on
the property. The vast majority of the exploration drilling has been directed towards the Main Zone,
located on the patented mineral claims.
Geologic map of the Golden Mile property area showing the location of the Golden Mile Main Zone
deposit is presented in Figure 6.3. Schematic cross-section looking northeast at Golden Mile is shown on
Figure 6.4.
See Figure 6.5 for a map of the Main Zone deposit area of the Golden Mile property and Figure 6.6 for a
stratigraphic column showing geology and alteration of the Main Zone area of the Golden Mile property.

2021 INITIAL ASSESSMENT TECHNICAL REPORT SUMMARY FOR THE GOLDEN MILE PROPERTY, NEVADA
59
Figure 6.3 Geologic Map of the Golden Mile Property Area (Location of Golden Mile Main Zone deposit
shown as yellow star). Abbreviations: GM Stock = Golden Mile Stock, Jd = Jurassic Dunlap Fm, Qal =
Quaternary Alluvium, TRL = Triassic Luning Fm, Ta = Tertiary andesite, Tb = Tertiary basalt, Tgd = Tertiary
granodiorite, Tqm = Tertiary quartz monzonite, Tt = Tertiary tuff, Tv = Tertiary volcanics, fi and mi =
undifferentiated age; felsic dike/alaskite (?) and porphyritic andesite (?), respectively.

2021 INITIAL ASSESSMENT TECHNICAL REPORT SUMMARY FOR THE GOLDEN MILE PROPERTY, NEVADA
60
Figure 6.4 Schematic cross-section looking northeast at Golden Mile (Location of cross-section shown
on Figure 6.3).
Figure 6.5 Geologic Map of the Main Zone deposit area of the Golden Mile Property (Lithologic units
described in Figure 6.6).

2021 INITIAL ASSESSMENT TECHNICAL REPORT SUMMARY FOR THE GOLDEN MILE PROPERTY, NEVADA
61
Figure 6.6 Stratigraphic Column Showing Geology and Alteration at the Golden Mile Property
6.2.1 Lithology
6.2.1.1 Sedimentary Rocks
The Luning Formation is well exposed south and SW of the Golden Mile Stock separated by a 50 to 250
m-wide belt of Jurassic- age Dunlap Formation (Ray, 2016). In the Main Zone area, the Luning Formation
is marked by three prominent beds of impure limestone that lie 200 m apart and which occupy low
topographic ridges. The bedded units trend SW to WSW, dip steeply either NW or SE and can be traced
discontinuously along strike for up to 300 m. At their NE extremities, close to the contact with the Dunlap
Formation, the limestone outcrops are 5 to 15 m wide but to the SW the three individual beds tend to

2021 INITIAL ASSESSMENT TECHNICAL REPORT SUMMARY FOR THE GOLDEN MILE PROPERTY, NEVADA
62
thicken and are up to 25 m wide. Locally, the limestones contain numerous veins of yellow-brown colored
Fe carbonate that both follow and cross-cut the bedding. The southernmost limestone unit contains some
Cu and Fe oxide showings that have been developed in shallow underground workings.
Several authors (O’Donnell, 2006; Suda, 2009) mention the presence in the district of the Triassic-age
Gabbs Formation which conformably overlies the Luning rocks. Hudson (1998) describes the formation as
being up to 75 m thick and comprising reddish, tan to green shale, siltstone and minor limestone. Hematite
stain is common in these rocks.
The Jurassic-age Dunlap Formation unconformably overlies the Triassic rocks but where observed the
contact between the two formations is marked by shearing and brittle faulting. This formation also forms
a belt of variably altered sedimentary rocks that separate the Luning rocks from the Golden Mile Stock
further north. The Dunlap Formation consists of massive marble to poorly bedded siliciclastic siltstones
and quartzites with some minor, thin beds of limestone. Calcareous arkose and greywacke are also
assigned to the Dunlap Formation. Many of these units are silicified and due to contact metamorphism
hornfels rocks are present, presumably related to the intrusion of the Golden Mile Stock. The hornfels
rocks also host the most prominent, structurally- controlled magnetite-Cu-Au exoskarn, exposed in the
Golden Mile Main Zone (Fig. 6.7).
Figure 6.7 Magnetite-Copper Skarn of the Main Zone at Golden Mile. Photo on right shows
metasomatic bands of mainly magnetite and calcite.
6.2.1.2 Volcanic Rocks
A series of Tertiary-aged post-mineral rhyolitic ash flow crystal tuffs and dark andesitic to basaltic flows
overlie the Mesozoic rocks at Golden Mile. Some of the volcanic rocks, especially the more mafic flows,
host magnetite. Synvolcanic intrusive rocks including a rhyolitic plug, quartz porphyry dykes and andesitic
dykes are also reported in the area. Thin veneers of basalt flows cap some of the hills in the property area.

2021 INITIAL ASSESSMENT TECHNICAL REPORT SUMMARY FOR THE GOLDEN MILE PROPERTY, NEVADA
63
6.2.1.3 Intrusive Rocks
High-level plutons, dikes and sills, assumed to be either Cretaceous or Tertiary age, intrude the Mesozoic
sedimentary rocks. Ferguson and Muller (1949) estimated the age of the intrusions in the northern Cedar
Mountains as Jurassic. Two age dates were subsequently performed on the rocks of the Cedar Pass pluton.
The first date was 40 + 10 Ma (Eocene) using the lead alpha method from zircon from the granitic mass
about 8 km (5 mi) southeast of the Simon mine on Cedar Mountain (Ross, 1961). The second date was a
K-Ar age run on a biotite separate from a small pod of quartz monzodiorite that crops out on the southern
contact of the Cedar Pass pluton (Pullman,1983). The biotite separate yielded a date of 24.2 + 1.0 Ma
(Oligocene). The known margins and extent of the intrusions are poorly constrained owing to widespread
extent of post-mineral volcanic cover rocks, but their age definitely appears to be Tertiary.
Hornfels and garnet-magnetite skarns are developed along the margins of the intrusive bodies. Skarn
rocks are present along structures in both sedimentary and intrusive rocks. An elongate dike-like body of
quartz porphyry or rhyolite composition cuts the Mesozoic sediments and parallels the main trend of
mineralization. This highly siliceous and hydrothermally altered fine-grained rock may contain 2-4%
disseminated pyrite. Its age is assumed to be Cretaceous or Tertiary and relationship to the quartz diorite
plutons is uncertain.
In the Main Zone area at Golden Mile mineralization appears associated with two larger intrusive bodies,
the most economically important being the Golden Mile Stock which is the probable source of the
mineralizing skarn fluids (Ray, 2016). Another much larger but much less mineralized felsic body lies NW
of the Golden Mile Stock and is named the “Northwest Pluton”.
The Golden Mile Stock is only exposed in three small areas, however to the north it is unconformably
overlain by the suite of Tertiary volcanics. According to Ray (2016), some historic drilling though the
volcanics into the underlying stock show that the volcanic cover is often very thin (<25 m). Thus, prior to
the volcanic eruption the stock was probably erosionally recessive resulting in topographic low ground
which was infilled by the volcanic flows. The three separate surface exposures of the Golden Mile Stock
are believed to belong to a single large body that extends northwards beneath the Tertiary cover and also
possibly southwards below the sedimentary siliciclastic Dunlap Formation. Thus, the stock could be a
relatively large body, and any reactive limey rocks adjacent to the stock’s margin beneath the Tertiary
flows or Dunlap Formation could host mineralized skarn or replacement deposits.
The Golden Mile stock is comprised of dark, massive, medium to coarse-grained quartz-diorite-
granodiorite that is locally quartz-rich; it is estimated to contain between 8% to 15% hornblende with
trace biotite (Ray, 2016). It can be moderately porphyritic with larger crystals of feldspar and
ferromagnesian minerals. In places close to the stock’s contact with the Dunlap Formation the intrusive
rocks tend to be lighter colored and finer grained. In many places the stock is cut by stockwork veins of
thin quartz and feldspar, some of which contain small quantities of pyrite and trace chalcopyrite. In two
areas the stock is overprinted by garnet endoskarn alteration, the most westerly of these areas also
includes the presence of magnetite and significant gold mineralization.

2021 INITIAL ASSESSMENT TECHNICAL REPORT SUMMARY FOR THE GOLDEN MILE PROPERTY, NEVADA
64
The Northwest Pluton is a pale pink to white colored, leucocratic quartzo-feldspathic rock of probable
quartz monzonite composition. The ground mass varies from fine to medium grained and the rock
contains scattered phenocrysts of rounded, glassy quartz that reach 0.2 cm in diameter. Lesser amounts
of feldspar phenocrysts are also present, together with minute traces of a small, dark, unidentified ferro-
magnesian mineral that when weathered leaves small pits. Some trace fine grained sericite is also present.
Many outcrops of the Northwest Pluton are cut by veins and veinlets of gray vuggy quartz up to 0.5 cm in
thickness and spaced 1 to 5 cm apart. Many veins have a NW to NNW orientation which is sub-parallel to
a prominent fault in the area. In addition to the veins, the weathered pluton is also marked by thin zones
and spots of jarosite staining, many of which lie sub-parallel to the quartz veins.
Also present in the area are several widely scattered dikes and sills. Between the Main Zone and margin
of the Golden Mile Stock at least two thin (<5 m; 16 ft) dikes of hornblende porphyry granodiorite are
seen; these are probably related to the stock, and the altered siliciclastic rocks immediately adjacent to
one dike has Cu and Fe oxide staining. In addition, there are highly leucocratic, quartz-feldspar-rich dikes.
One of the larger dikes is at least 60 m (197 ft) long and 15 m (49 ft) wide and trends NE, sub- parallel to
the Main Zone, as do other thinner dikes located further west in the Luning Formation (Ray, 2016).
Another noteworthy set of dikes cuts the Northwest Pluton, NW of the Golden Mile Stock. These dikes
are comprised of an unaltered, medium to dark grey, feldspar-porphyritic, medium to coarse grained rock
of granodiorite composition. Locally, these dikes have abundant glassy quartz, and the feldspar
phenocrysts reach 0.3 mm in size. Some outcrops have small (<1.5 cm), rounded dark xenoliths that when
weathered become jarosite-stained. Another distinctive feature is that many elongate feldspars have a
sub-parallel orientation and locally the rocks contain thin flow-bands that reach 2 mm in width. At least
four outcrops have been observed and are believed to represent two dikes, each < 5 m (16 ft) thick which
trend NW-SE, parallel to the quartz veinlets in the Northwest Pluton and a fault in the Main Zone area.
The age of the dikes is unknown although they could represent feeders for some of the more siliceous
overlying Tertiary volcanics (Ray, 2016).
6.2.2 Structural Geology
There are two dominant structural trends on the property, namely (i) NW-SE which is parallel to the
Walker Lane Fault Zone and (ii) NNE to NE which is nearly orthogonal to the Walker Lane. The latter
appears to be the trend of the Main Zone which is spatially associated with the strongest exoskarn
mineralization seen on surface. Some northeast trending faults are occupied by dykes. The true dip of the
200 to 300 m-long Main Zone Fault is unknown and at its southern end it is sharply truncated by the NW-
trending “Road Fault” which appears to be a major dextral feature (Fig. 6.8).
The Road Fault separates the Dunlap rocks from the Luning and surface mapping and drilling in the Main
Zone indicates the Road Fault dips steeply to the northeast. The Road Fault is not apparently mineralized.
Northwest faults, like the Road Fault, appear to offset the northeast faults with dextral displacement and
offset extensions of the northeast structures may be possible drill targets. Past workers had interpreted
the Road Fault to be part of the Tertiary Walker Lane generation of structures, assigning northeast dips

2021 INITIAL ASSESSMENT TECHNICAL REPORT SUMMARY FOR THE GOLDEN MILE PROPERTY, NEVADA
65
and possibly substantial post-mineral right lateral offsets. Teck geologists (Kuzma, 1999) have suggested
this fault is in fact older - a thrust fault along which a nappe of Luning-Gabbs-Dunlap rock is thrust over
the Dunlap. They suggest that the thrust was subsequently rotated into a high angle orientation, possibly
during folding.
Figure 6.8 Road Fault mylonite breccia (Hole GMDD-13 @ 315 ft)
Where exposed, the rocks of both the Luning and Dunlap Formations mostly strike SW-NE and are steeply
inclined (50 degrees to sub-vertical) with dips either to the NW or SE. No small-scale folds were seen but
the northernmost elongate limestone unit of the Luning Formation has a pronounced fracture cleavage.
Although abundant structural data is lacking, Ray (2016) noted it is possible that the three elongate
limestone units of the Luning represent part of a single bedded horizon that was deformed by tight folds
having SW to WSW trending axial planes and wavelengths of 200 m (575 ft).
Fractures associated with the Walker Lane NW-SE trend are observed cutting the Northwest Pluton (Ray,
2016). This includes a 0.6 m (2 ft) -wide, NW striking fault that dips 62 degrees NE. This rusty zone contains
tectonic slices of silicified, Fe-oxide-stained rock and quartz vein material. There are also some post fault
quartz veins up to 2 cm (0.79 in) thick; these have crystal-lined vugs up to 0.75 cm (0.30 in) in diameter.
Two narrow flow-banded granodiorite dikes were also observed by Ray to intrude the NW striking fault
set.
A recent detailed oriented core study was undertaken in conjunction with Oriented Targeting Systems
and Burtner (2021) concluded that gold grade is controlled by a mix of structural and lithological factors.
He defined three structural grade zones: Southwest, Central and Northeast (Fig. 6.9). Although well-

2021 INITIAL ASSESSMENT TECHNICAL REPORT SUMMARY FOR THE GOLDEN MILE PROPERTY, NEVADA
66
defined spatially, the structural zones do not fully explain the grade geometry. The strongest steep, NW-
SE striking structures may be the first order control of gold grade.
Figure 6.9 3D Structural Interpretation of the Southwest, Central and Northeast Structural Grade Zones
of the Main Zone at Golden Mile (Burtner, 2021).
The “SW Grade Zone” is restricted to magnetite skarn alteration. Grade does not appear to be strongly
correlated with veining. The skarn alteration is likely to have a structural control, but it’s timing is unclear.
According to Burtner (2021), if the magnetite skarn is related to the Jurassic intrusions, it is unlikely to be
related to the more recent dextral faulting. If the skarn is related to the Tertiary intrusions, there may be
an association with the Road Fault tectonics.
The “Central Grade Zone” is controlled by splays associated with dextral Road Fault motion. The dominant
steep, NW-SE striking splay fabric forms a primary control on localizing high-grade zones (Fig. 6.10). This
Central Zone may be bounded by a fault on the eastside (East Margin fault), but the limit is less clear to
the west. Depending on the nature of the western margin, this zone may be a diffuse damage zone in the
hanging wall of the East Margin fault, or a zone of distributed damage between two dextral fault splays.
Within the high-grade corridor, grade is strongly correlated to steep NW-dipping vein arrays, roughly
orthogonal to bounding faults. Within the splay-controlled corridors, lithologic control was also evident
from the oriented core study and the Dunlap unit hosts much of the veining, while the quartz diorite unit
appears much less favorable.

2021 INITIAL ASSESSMENT TECHNICAL REPORT SUMMARY FOR THE GOLDEN MILE PROPERTY, NEVADA
67
Fig. 6.10 Examples of high-grade gold intercepts from the Center Grade Zone, A) Hole GMDD-002, 8.5
– 10.1 m (28-33 ft); assay 17.45 ppm (0.51 opst) Au, B) Hole GMDD-004, 64.6-66.1 m (212-217 ft);
assay 8.66 ppm (0.25 opst) Au (Burtner, 2021)

2021 INITIAL ASSESSMENT TECHNICAL REPORT SUMMARY FOR THE GOLDEN MILE PROPERTY, NEVADA
68
The “NE Grade Zone” is also lithologically controlled. There appears to be a spatial association between
the high-grade intervals and the quartz diorite-Dunlap contacts, with gold concentrated more favorably
in the Dunlap unit. Some degree of structural control may also be present in this zone, with higher grades
associated with intersections between the NW-SE splay fabric and the quartz diorite-Dunlap contact.
Burtner (2021) suggested that structural fabrics, both faults and veins, agree with a complex dextral-slip
fault model of the Road Fault (Fig. 6.11) with primary splays control the Central Grade Zone and smaller,
possible subsidiary faults. These correspond to the dominant NW-SE striking, steep faults. In the Central
Grade Zone, these splays are represented by the interpreted East Margin and West Margin Faults. The P-
splays are orthogonal to a mineralized NW-dipping fabric that locally controls the highest gold grades
within the Central Grade trend. This fabric corresponds to the NW-dipping veins and is reflected in the
NW-dipping fault population.
Figure 6.11 Conceptual Structural Model showing the structural fabrics of faults and veins related to
splays the dextral-slip Road Fault model. Splays represented by interpreted East Margin Fault (solid
green) and West Margin Fault (dashed green) from Burtner (2021).
2021 INITIAL ASSESSMENT TECHNICAL REPORT SUMMARY FOR THE GOLDEN MILE PROPERTY, NEVADA
69
6.2.3 Alteration and Mineralization
Gold mineralization is variably associated with calc-silicate skarn, magnetite skarn, and structurally
controlled limonite-calcite-silica stockworks. Copper is associated with the gold mineralization in the
magnetite skarn in the Main Zone. However, gold-only mineralization is also present on the property,
particularly in the more distal quartz-sericite-limonite stockworks.
Calc-silicate skarn minerals include fine disseminated, spotty, or banded garnet present in the calcareous
siltstones adjacent to the quartz diorite. A pyroxene-garnet skarn (in various ratios) is present in the
carbonate rocks and in the intrusions themselves (as endoskarn). Biotite hornfels overprinting the main
host rock Dunlap Formation locally forms ubiquitous contact metamorphic aureoles surrounding the
intrusions. Retrograde assemblages of chlorite-epidote-calcite and quartz-sericite-calcite-clay are also
noted in the intrusive rocks and along structures in the skarns developed in sediments.
Gold bearing calc-silicate skarn assemblages are overprinted and replaced by magnetite and copper-gold
skarn assemblages near quartz diorite. Magnetite skarn has been encountered in three places on the
Golden Mile property thus far:
1. in the Main Zone associated with a quartz monzonite intrusion
2. beneath a partly silicified ridge east of the Main Zone associated with a magnetic high
3. west of the Main Zone, associated with another occurrence of quartz diorite.
Calcite, sericite, and pyrite are associated with these skarn assemblages, particularly in siliciclastic rocks.
Distal to the intrusion(s), along permeable structures and breccia, alteration associated with the
metasomatic and mineralizing fluids is expressed as quartz stockworks with associated iron oxides, calcite
and green sericite. Gold is also present in this setting, but copper values are low.
A series of narrow, northwest-trending bands of pervasive silicification and silicified breccia are present
in locally calcareous siltstones along a northeast-trending ridge east of the historical workings. Limonite
coated fractures and elevated gold values associated with arsenic and bismuth suggests a distal expression
of the mineralized system. Pyrite and propylitic alteration with calcite are present in the Tertiary volcanic
rocks. However, these assemblages are interpreted to be younger than the main mineralizing event.
6.2.3.1 Main Zone
The Main Zone consists of irregular replacement pods and veins hosted in the Luning limestone and the
Dunlap calcareous siltstone along a northeast trending margin of a granodiorite intrusion. The Main Zone
is exposed in small open pits and trenches and can be traced for about 300 m (984 ft) in a northeasterly
direction. The mineralization includes assemblages of magnetite, garnet, biotite, sericite, calcite, pyrite
and chalcopyrite. Sulfides frequently exceed 5% by volume. Intrusive rocks in this area display pyroxene
garnet skarn assemblages, and in some places return elevated gold values in the 0.3 g/t Au (0.009 opst)
range. Copper and silver values accompany gold values in the vicinity of the historical workings. Free gold

2021 INITIAL ASSESSMENT TECHNICAL REPORT SUMMARY FOR THE GOLDEN MILE PROPERTY, NEVADA
70
is reported in the Main Zone and in the stockwork zones to the northeast. Distribution of the highest-
grade gold values is interpreted to be related to northwest-trending structures.
6.2.3.2 Stockwork Zones
To the northeast of the Main Zone, a series of steep structures trending at 030° are mineralized with gold-
bearing stockworks of quartz-sericite-pyrite-calcite veinlets in siltstone (Suda, 2009). Three drill holes are
reported by Battle Mountain to have intercepted high-grade gold values in this material ranging from 1.2
g/t Au (0.034 opst) over 7.6 m (25 ft) in Hole 89-20, up to 16.4 g/t Au (0.478 opst) over 29 m (95 ft) in Hole
89-7 occurring in sericite-iron oxide-quartz-gold veinlets cutting sericitized siltstone (Gatchell, 1989).
Further along the extension of the structure to the northeast, a stockwork of calcite-pyrite-limonite
quartz occurs in dioritic rocks. This mineralization is not exposed at surface but was intersected by drilling
through volcanic cover rocks.
6.2.3.3 Detailed Description of Skarn Alteration
Ray (2016) described in more detail the skarn alteration types noted on the Golden Mile property:
• Hornfels and/or silicification with abundant silica, moderate amounts of epidote and trace to very
rare quantities of fine-grained garnet and biotite. This mostly overprints the siliciclastic rocks of
the Dunlap Formation and is believed to be mainly related to the emplacement of the Golden
Mile Stock.
• Exoskarn with variable amounts of quartz, pale brown to green garnet, magnetite, epidote,
chlorite, amphibole, Cu and Fe oxides and gold. Exoskarn formed in the more dolomitic
carbonates may contain abundant phlogopite with traces of brucite and serpentinite. On surface,
fault-controlled exoskarn alteration is best seen along the Main Zone where the magnesian
mineral phlogopite may be locally abundant.
• Endoskarn alteration in the Golden Mile Stock marked by minor amounts of garnet, epidote,
quartz and pyrite along narrow fractures, or as massive replacement by garnet, quartz, epidote,
amphibole, disseminated magnetite and possible some clinopyroxene. This massive endoskarn
alteration yielded the highest gold values of the 59 rock samples collected by Ray (2016),
containing between 4.5 and 11.5 g/t Au (0.131 and 0.336 opst).
• Massive magnetite lenses and pods which only occur along the Main Zone. Pods may be up to 10
m (33 ft) wide and 25 m (82 ft) long and were subjected to shallow historic mining for their
associated Cu sulfides, Cu oxides and gold.
• Marble is not particularly common on surface. It is seen in the Luning Formation immediately SW
of the Road Fault where the rock is fault brecciated with calcite veining and strong jarosite
staining. Marble was also seen at one location in the Dunlap where the silicious hornfels contains
a 1.5 m (4.9 ft) thick unit of thinly bedded marble.
• Quartz-feldspar vein stockworks occur in the Golden Mile Stock. Many parts of the stock are cut
by a network of thin (< 4 cm; 1.6 in) quartz-feldspar veins that locally carry minor calcite, pyrite
2021 INITIAL ASSESSMENT TECHNICAL REPORT SUMMARY FOR THE GOLDEN MILE PROPERTY, NEVADA
71
and trace chalcopyrite. Veins may have narrow bleached haloes and in some outcrops the stock
has rusty weathering zones that are presumable after pyrite.
• Quartz veinlets are developed in the Northwest Pluton. It comprises veins and veinlets of gray
vuggy quartz up to 0.5 cm (0.2 in) in thickness that are spaced 1 to 5 cm (0.4 to 2.0 in) apart. In
addition, the weathered pluton also has thin zones and spots of jarosite staining, many of which
lie sub-parallel to the quartz veins. Samples of the veined and jarosite-stained rock showed no
evidence of gold mineralization.
• Yellow-brown Fe carbonate veining is observed in the western parts of the Luning limestone.
These veins both cross-cut and follow the bedding and are generally < 15 cm (5.9 in) in thickness
although in some rare instances they reach 0.75 m (0.3 in). Most have sharp contacts with the
impure limestone. Initially it was thought possible that the veins were a distal expression of the
Golden Mile skarn system, but sampling showed they are barren of any base or precious metals.
6.2.3.3.1 Exoskarn
On surface, all of the alteration within the Golden Mile Stock thermal aureole is hosted by the Dunlap
Formation and there is no evidence that the Luning Formation rocks are skarn-altered (Ray, 2016). In the
Dunlap rocks away from the Main Zone it is often difficult to distinguish between the abundant and
widespread silica-rich hornfels and true fine-grained exoskarn related to hydrothermal fluids. Overall,
exoskarn is uncommon apart from along or close to the Main Zone. The local abundance of phlogopite
along the Main Zone suggests that some of the alteration along this structure represents magnesian skarn.
This may be one reason why massive magnetite lenses preferentially formed along this structure since Fe
skarn-development tends to favor magnesian rather than calcic skarn systems (Einaudi et al., 1981).
The exoskarn and alteration seen on surface and that observed in some of the drill core are very different.
In the holes there are thick intersections of pale brown, medium to coarse grained, grossular garnet-rich
skarn that presumably replaced massive limestone beds. This exoskarn in the core is locally cut by thin
sulfide veins and veinlets containing pyrite and trace chalcopyrite. The veins are also surrounded by
bleached haloes that reach 1.5 cm in width. On surface by contrast, massive, coarse grained garnet skarn
similar to that seen in the drill holes is virtually absent. Instead, with the exception of rocks in the Main
Zone, exoskarn is rarely seen on the property and when present it comprises silicified or hornfels meta-
sediments that may contain patches of fracture-controlled fine-grained, pale brown garnet that are
presumed to be hydrothermal in origin. This surface exoskarn is locally retrograde altered to epidote ±
chlorite ± amphibole, and in rare instances it may contain some trace chalcopyrite with Cu oxides and
pyrite but is generally unmineralized. In a few localities these silica-rich, hornfelsic rocks contain thin veins
(< 10 cm) of garnet-pyrite ± epidote exoskarn which have followed the remnant bedding planes in the
Dunlap Formation.
The probable reason for the abundance of massive garnet-rich exoskarn observed in drill holes and the
generally garnet-poor alteration observed on surface is due to the host rocks at the latter mostly represent
Dunlap Formation siliciclastic sediments that reacted poorly to the skarn-forming fluids. Thus, major
differences exist between the sedimentary geology on surface compared to the originally limestone-rich
rocks (intersected at depth).

2021 INITIAL ASSESSMENT TECHNICAL REPORT SUMMARY FOR THE GOLDEN MILE PROPERTY, NEVADA
72
The Main Zone is a 200 m (656 ft)-long linear feature of exoskarn alteration that varies from 20 to 50 m
66 to 164 ft) in width. It is marked by large pods and lenses of massive to semi- massive magnetite that
reach 10 m in thickness and 15 to 25 m (49 to 82 ft) in length. The magnetite is spatially associated with
variable quantities of quartz veining, pyrite and chalcopyrite, and many outcrops have brilliant displays of
Cu oxides and silicates that include malachite, azurite, chrysocolla and minor turquoise, as well as some
Mn wad and black Cu-Mn oxides. The magnetite lenses are marked by open pits and some shallow
underground workings that were driven to extract the copper and possibly also the gold. All six samples
collected by Ray from the Main Zone were anomalous in gold (266 ppb to 2390 ppb) as well as having high
values of copper (maximum 9 % Cu). The samples were also anomalous in As, Ag, Zn, Sb, Se and
sporadically anomalous in Te.
The Main Zone is believed to be a pre-skarn structure that was a conduit for the hydrothermal fluids. On
surface, however, the meta-sediments lying between the Golden Mile Stock and the Main Zone largely
comprise a 50 to 70 m (164 to 230 ft) wide belt of Dunlap Formation siliciclastic rocks that are hornfels or
overprinted by varying degrees of silicification with minor sporadic garnet exoskarn, but no significant
mineralization.
6.2.3.3.2 Endoskarn
Garnet-bearing endoskarn was observed by Ray (2016) at two locations in the Golden Mile Stock. Here
there is an adit that has been driven in an ESE direction into dark, quartz-rich rock, close to the southern
margin of the Golden Mile Stock. The intrusive rocks are strongly epidotized and there are small patches
of brown garnet endoskarn alteration. Also, some N-S striking fractures and joints contain thin (< 1.5 cm;
0.6 in) veins with quartz, epidote and pale green garnet. Locally in the veins there appears to also be trace
wollastonite.
A larger and better mineralized area of endoskarn alteration lies 200 m (656 ft) further west where there
are several small shallow pits and one adit. The outcrops and subcrops in this vicinity comprise a coarse
grained dark green rock that contains both a pale green glassy garnet and lesser amounts of pale brown
garnet. Also present are quartz, remnant igneous feldspar and some epidote, as well as possibly some
clino-pyroxene. Trace to minor quantities of chalcopyrite, pyrite and Cu oxides also occur. One notable
feature about this area is that the endoskarn contains scattered clots of magnetite up to 1 cm (0.4 in) in
diameter that in places are surrounded by thin haloes of gray quartz. Locally there are also rounded
crystals or clots of quartz up to 0.3 m (1 ft) wide as well as rusty-weathering zones that are 2 to 3 cm (0.8
to 1.2 in) in diameter. Three of the five endoskarn samples taken from this vicinity contained the highest
gold values of all 59 samples collected by Ray (2016). The gold content in these three samples ranged
between 4.54 to 11.5 g/t Au (0.133 to 0.335 opst), and the latter was taken from an outcrop at the adit
entrance with strong Cu and Fe oxide staining. In addition to Au, the samples contain anomalous values
of Ag (maximum 16.6 ppm), Cu (up to 7060 ppm) as well as As, Bi, Sb, Se and Te. Significantly the gold-
rich samples are not particularly enriched in Cu which suggests that some of the gold may not be carried
in chalcopyrite.

2021 INITIAL ASSESSMENT TECHNICAL REPORT SUMMARY FOR THE GOLDEN MILE PROPERTY, NEVADA
73
The presence of gold-rich endoskarn is one highly unusual feature of the Golden Mile skarn system.
According to Ray (2016), in virtually all skarn deposits worldwide, it is the exoskarn rather than the
endoskarn that forms the most significant mining resource. Nevertheless, the Golden Mile endoskarn
should be further explored since it may extend northwards beneath the Tertiary volcanic and perhaps
represent an open pit or underground mining target.
In June 2021, Lawrence Meinert, renowned expert on skarn deposits, visited the Golden Mile property
(Meinert, 2021). Based on drill holes examined and outcrops observed in the field, it was determined that
there are two main types of alteration at Golden Mile, hornfels and skarn. Meinert (2021) also concluded
that hornfels is the more extensive alteration type and consists of a background biotite hornfels in clastic
rocks of the Dunlap Formation (Fig 6.12 A & B). All examined exposures of Dunlap Formation on surface
and in drill core have been converted to biotite hornfels. As with most gold skarns, this likely forms an
aureole around the ore deposit.
The other main alteration type observed is skarn formed from carbonate rocks. From the observed
mineralogy, most of the skarn protolith in the Golden Mile district was dolomitic. This results in magnesian
skarn minerals such as forsterite (Mg2SiO4), monticellite (CaMgSiO4), diopside (CaMgSi2O6) (Fig. 6.12 C),
spinel (MgAl2O4), periclase (MgO), humite ((Mg,Fe2+)7(SiO4)3(F,OH)2), clinohumite (Mg9(SiO4)4F2),
chondrodite (Mg5(SiO4)2F2), phlogopite (KMg3(AlSi3O10)(OH)2) (Fig. 6.12 D), tremolite
({Ca2}{Mg5}(Si8O22)(OH)2), pargasite (NaCa2(Mg4Al)(Si6Al2)O22(OH)2), ludwigite (Mg2Fe3+(BO3)O2),
chondrodite (Mg5(SiO4)2F2), talc (Mg3Si4O10(OH)2), serpentine (Mg3[Si2O5](OH)4), and brucite
(Mg(OH)2) (Fig. 6.12 E). Because of the dominance of Mg rather than Fe in the skarn minerals, the excess
Fe typically forms abundant magnetite, as observed in the Main Zone pit. The magnetite is particularly
important as a reactant for later, lower temperature Au-bearing fluids.
A variety of igneous rock types are exposed on the surface and in drill core at Golden Mile. The coarse-
grained equigranular granodiorite and quartz monzonite plutons to the northwest of the Golden Mile
district, Meinert (2021) believed are likely unrelated to Golden Mile alteration and mineralization, due to
their igneous texture and interpreted >5km (3 mi) depth of emplacement. Instead, the two igneous rock
types most likely to be related to alteration and mineralization are the porphyritic granodiorite (also called
microgranodiorite, (Fig. 6.12 F & G) and the quartz monzonite porphyry (sometimes called quartz feldspar
porphyry when exact mineralogy/composition is not visible (Fig. 6.12 H).

2021 INITIAL ASSESSMENT TECHNICAL REPORT SUMMARY FOR THE GOLDEN MILE PROPERTY, NEVADA
74
Figure 6.12 Alteration and Mineralization Types Observed at Golden Mile (Meinert, 2021). A) Biotite
hornfels cut by pyroxene veins (Hole GMDD-2 @ 51 m (168 ft); assay 2.7 g/t (0.079 opst) Au, B) Biotite
hornfels cut by quartz-chlorite-pyrite (Au) veins with feldspar-clay envelope (Hole GMDD-3 @ 58 m
(190 ft), C) Biotite hornfels cut by quartz-chlorite-pyrite veins with pyroxene-feldspar envelope (Hole
GMDD-3 @ 146 m (478 ft), D) Thin quartz-chlorite-phlogopite (Au) vein, E) Lime-green brucite
replacing magnesium skarn minerals such as olivine-pyroxene, F) Microgranodiorite with veins of
pyroxene-epidote (Hole GMDD-2 @ 109 m (358 ft), G) Granodiorite cut by quartz-pyrite-chlorite vein
with feldspar-clay envelope (Hole GMDD-6 @80 m (263 ft); assay 1.75 g/t (0.051 opst) Au, H) Quartz-
feldspar porphyry (Hole GMDD-2 @ 28 m (93 ft).

2021 INITIAL ASSESSMENT TECHNICAL REPORT SUMMARY FOR THE GOLDEN MILE PROPERTY, NEVADA
75
6.2.4 Petrography
A limited amount of historic petrographic work was completed for Golden Mile. However, one report
completed included a petrographic description of thin sections prepared from RC drill cuttings of two
holes drilled by Teck (Hudson, 1999). Highlights of the descriptions include:
• A gold mineralized sample (0.99 g/t Au; 0.029 opst) studied by Hudson contained chips of garnet-
rich skarn with 60 to 90% very pale green garnet (possibly grossularite) with subhedral grains up
to 0.7 mm (0.3 in) across; the original rock was probably limestone.
• A sample containing coarse blocky calcite with poikilitic inclusions of diopside, anhedral calcite
grains were as large as 2 mm (0.8 in) and diopside grain sized ranged from 0.1 to 0.5 mm (0.004
to 0.02 in). Minor white mica and wollastonite were also observed in some chips. Hudson
interpreted this calcite-diopside skarn to be a reaction skarn of dolomitic limestone with quartz
in the limestone or siliceous beds (quartzite or chert) close by. The granular calcite was believed
to be a retrograde alteration of the silicate minerals.
• A few thin sections studied contained chips of weakly altered, equigranular pyroxene diorite (or
gabbro) with up to 65% subhedral to anhedral plagioclase (An50) and varying amounts anhedral
diopside (possibly hypersthene). In some chips, the pyroxene had been variably replaced by
actinolite associated with minor amounts of calcite, epidote and chlorite.
Hudson also reported that in some thin sections pyroxene has been replaced by an isotropic, moderate
relief mineral, possibly bicchulite (Ca2Al(SiAl)O7H2O). Bicchulite probably resulted from some endoskarn
formation at the contact of the diorite with limestone and skarn formation resulted from a consider able
influx of silica and alumina. Hudson believed the kaolin in both the endoskarn and exoskarn represents a
late, low temperature hydration event, possiblyas a result of the gold depositing stage.
A more recent petrographic study was completed on 15 rock grab samples and 6 drill core samples
collected from the Golden Mile property (Dunne, 2017) and included transmitted and reflected light
observations, description of lithology, alteration, and mineralization. Dunne (2017) also reported results
for samples submitted for XRD-Rietveld analyses at the Department of Earth, Ocean and Atmospheric
Sciences, University of British Columbia, Vancouver, Canada and for Terraspec spectroradiometer
analyses.
Samples studied by Dunne (2017) consisted of a varied and complex assemblage of lithologies, contact
metamorphic assemblages, metasomatic alteration minerals, retrograde alteration minerals, veins and
microfractures, mineralization and weathered mineralogy. Samples included intrusive rock, carbonate
sedimentary rock, variably silicified and hornfels siliciclastic rocks as well as prograde garnet and
clinopyroxene skarn, massive magnetite, retrograde skarn alteration, semi-massive sulfide, late veinlets,
microfractures and oxidized and argillized zones.

2021 INITIAL ASSESSMENT TECHNICAL REPORT SUMMARY FOR THE GOLDEN MILE PROPERTY, NEVADA
76
Lithologies studied included:
• Intrusive Rock: variably altered granitoid and rhyolite porphyry
• Carbonate Sedimentary Rock: bioclastic wackestone (Luning) including a variety of skeletal
particles in a matrix supported carbonate sediment
• Silicified and Hornfels Siliciclastic Rock: including calc-silicate hornfels and hornfelsic
metasandstone
Types of alteration identified in the suite of samples studied included:
• Potassic/Hornfels
• Magnetite Skarn
• Endoskarn
• Exoskarn
• Retrograde Skarn
• Secondary Alteration (argillic, propylitic, oxide)
Mineralization identified in the suite of samples studied by Dunne (2017) included sulfides and gold.
Sulfide commonly occurs in trace amounts as fine to very fine-grained chalcopyrite + (rare
chalcocite+covellite+ possible bornite), platy molybdenite, arsenopyrite, marcasite, pyrite and/or
pyrrhotite. Sulfide minerals occur either as disseminations, within veinlets/microfractures or in semi-
massive form. Rare traces of gold were optically visible and reported in many of the samples. Gold was
demonstrated to occur in a variety of settings including with sulfide minerals, oxide, and clay-rich zones.
A variety of veinlets and late microfractures were also observed in the samples. Mineralization is
documented in some garnet-bearing veinlets, quartz-K-feldspar veinlets and in some quartz-calcite and
carbonate microfractures (Dunne, 2017).
Table 6.1 summarizes petrographic observations for individual samples studied from the Golden Mile
property (Dunne, 2017). Figure 6.13 shows photomicrographs of a typical altered skarn.

2021 INITIAL ASSESSMENT TECHNICAL REPORT SUMMARY FOR THE GOLDEN MILE PROPERTY, NEVADA
77
Table 6.1 Summary Table of Petrography on Samples from Golden Mile (from Dunne, 2017)

2021 INITIAL ASSESSMENT TECHNICAL REPORT SUMMARY FOR THE GOLDEN MILE PROPERTY, NEVADA
78
Table 6.1 Summary Table of Petrography on Samples from Golden Mile (from Dunne, 2017) (con’t)

2021 INITIAL ASSESSMENT TECHNICAL REPORT SUMMARY FOR THE GOLDEN MILE PROPERTY, NEVADA
79
Figure 6.13 Photomicrographs of Typical Skarn from Golden Mile (Sample GR-427). Note strong brittle
fracturing of garnet and clinopyroxene, possible patchy gypsum alteration and clay-gypsum and Fe-ox
filled microfractures. Field of View = 2.9 mm (0.11 in), A) Polarized Light, B) Cross-Polarized Light;
Abbreviations: cpx = clinopyroxene, phl = phlogopite, gn = garnet, gyp = possible gypsum (from Dunne,
2017).

2021 INITIAL ASSESSMENT TECHNICAL REPORT SUMMARY FOR THE GOLDEN MILE PROPERTY, NEVADA
80
6.3 DEPOSIT
Gold and gold-copper mineralization on the Golden Mile property is intrusion-related with different styles
depending on setting. Mineralization occurs as skarn, massive replacements and structurally controlled
stockwork and breccia zones in permeable rocks. Gold and gold-copper mineralization is mainly hosted in
carbonate-bearing metasedimentary rocks, which remain the primary exploration target on the property.
Secondary targets include the structural zones, within both sedimentary and intrusive hosts. Low-grade
disseminated gold mineralization within the quartz diorite intrusions also is indicated as a possible target
based upon the results of drilling.
Typically, intrusive-related and skarn-hosted gold deposits are challenging exploration targets because it
is difficult to define coherent concentrations of economic gold mineralization within the overall body of
the intrusion and skarn. However, several notable mines have been developed on gold skarns, including
the Fortitude Mine in the Battle Mountain District, which produced 77 tonnes (2.5 million ounces) of gold
from 10.9 Mt (12M short tons) of ore at an average grade of 7.1 g/t (0.21 opst) gold (Doebrich and
Theodore, 1996). The adjacent Phoenix deposit was a low-grade gold deposit that reportedly yielded over
2 million ounces of gold with associated copper and silver. The Buckhorn Mountain gold deposit in
Washington State was another notable gold skarn deposit (Hickey, 1992). Disseminated gold
mineralization, together with related structure-controlled gold in granitic host rocks, has been defined as
a deposit type with significant potential. An example is the Fort Knox deposit in central Alaska, which has
produced nearly 8 million ounces of gold since mining began in 1996 (Wikipedia, 2021).
6.3.1 Extents and Continuity
Within the Golden Mile property area, the approximate extents of Main Zone mineralization are 900 m
(3,000 ft) long by 500 m (1,500 ft) wide. The deposit shows internal geological and grade continuity, with
a consistent direction of mineralization. The approximate dimensions of the deposit are based on a grade
shell constructed at a nominal cutoff grade of 0.34 g/t Au (0.010 opst) used to limit grade interpolation in
the 3D block model.
Figure 6.14 demonstrates a conceptual ore deposit model for Golden Mile.

2021 INITIAL ASSESSMENT TECHNICAL REPORT SUMMARY FOR THE GOLDEN MILE PROPERTY, NEVADA
81
Figure 6.14 Conceptual Model for Formation of the Golden Mile Deposit (Cox and Singer, 1986)

2021 INITIAL ASSESSMENT TECHNICAL REPORT SUMMARY FOR THE GOLDEN MILE PROPERTY, NEVADA
82
7 EXPLORATION
Past exploration programs have been summarized in Section 5 (History). Section 7 herein describes the
nature and extent of all relevant exploration work conducted by GRCN.
7.1 Exploration Work by GRCN
Prior to GRCN’s acquisition, Kinross had identified at least 11 gold prospect sites on the property. Figure
7.1 show the land position of Kinross from 2017 to 2019, at the time of their lease, and highlights
significant prospects identified for targeting. Upon acquisition, GRCN immediately began evaluating of
these targets for exploration. The Golden Mile Main Zone deposit and Spring (PS) mineral occurrence are
considered the highest priority prospects with already delineated resource potential.
Figure 7.1 Resource Areas and Drill Ready Targets Identified on the Golden Mile Property (from Kinross,
2019). Resources for Golden Mile and PS targets, in oz Au, are only estimates by Kinross to indicate
exploration potential.

2021 INITIAL ASSESSMENT TECHNICAL REPORT SUMMARY FOR THE GOLDEN MILE PROPERTY, NEVADA
83
7.1.1 Remote Sensing
The initial exploration approach by GRCN was to use spectral data for vectoring to higher temperature alteration which can be very useful given the documented alteration footprint. In addition, to local targeting with grid sampling and spectral analysis, regional targeting for gold exploration can search for the products of hydrothermal alteration where mineral-bearing rocks were displaced by strong geothermal systems.
In July 2020, GRCN contracted Terra Modelling Services Inc. (TMS) to conduct an analysis of available
ASTER (Advanced Spaceborne Thermal Emission and Reflection Radiometer) satellite data for the Golden
Mile property. The deliverables of this analysis included:
1. Date and time of the ASTER data set used;
2. Copies of raw data;
3. GranuleID from the raw data;
4. Band identifiers, both ASTER band and USGS reference;
5. Band ratios used and spatial resolution charts.
6. Structural interpretation;
7. Quartz content map;
8. Differentiations of argillic, phyllic, propylitic, and silicic alterations;
9. Characterization of areas for illite, crystalline kaolinite, dickite and possible vegetation anomalies;
10. All ferric and non-ferric oxides (jarosite, goethite, hematite);
11. False color composites (map);
12. Powerpoint-style report accompanying the data, highlighting results.
Anomalous high hydrothermal alteration spectral analysis identified numerous target areas for ground
follow-up on the Golden Mile property (Fig. 7.2). Potential mineral targets are mostly aligned with major
EW and NW-trending structures and have spectral and vegetation anomalies.

2021 INITIAL ASSESSMENT TECHNICAL REPORT SUMMARY FOR THE GOLDEN MILE PROPERTY, NEVADA
84
Figure 7.2 Golden Mile Property Map Highlighting Hydrothermal Alteration and Exploration Target
Areas Identified from ASTER Analysis (Golden Mile deposit and Spring mineral occurrence are shown;
faults shown as dashed black lines)
7.2 Drilling
7.2.1 Core Drilling
GRCN 2020 – 2021 core drilling was performed on diurnal shifts (24 hours/7 days per week) by Ruen
Drilling (Ruen), Clark Fork, Montana. Two sizes of DDH drill core were utilized: a large diameter “PQ” 85.0
mm (3.35 in) for metallurgical testing, and a smaller “HQ” 63.5 mm (2.50 in) for core sample and routine
laboratory analyses. DDH depth penetration was to 500 m (1,500 ft), utilizing traditional mud-lubricated
drilling methods. Casing utilized was 12.7 cm (5 in) and was utilized generally 3 – 6 m (10-20 ft) for collar
stability, however in some cases hole stabilization required up to 10 m (30 ft) of casing. Occasionally
overburden was tri-cone drilled; no core was recovered from these cased intervals. All recovered drill core
was generally completed using a 3.05 m (10 ft) core barrel. A split-tube inner-sleeve was used and core
was pressure removed when possible (in fractured ground) otherwise handled traditionally with rubber

2021 INITIAL ASSESSMENT TECHNICAL REPORT SUMMARY FOR THE GOLDEN MILE PROPERTY, NEVADA
85
mallet percussion to remove. Core was place in standard wax-coated boxes. Depth, rod change, and loss
zones were noted on wood blocks in place with the drill core. Core was shipped to a GRCN locked storage
in Mina, Nevada twice daily at drilling shift change. After drilling holes were surveyed with the Gyro-Reflex
tool (described in next section). The drilling contractor conducted all operations to industry standard
practices.
7.2.2 RC Drilling
In June 2021, GRCN commenced RC drilling at Golden Mile for Mineral Resource estimation. In general,
RC drilling equipment typically consists of track drills capable of drilling angled holes to 500 m (1,500 ft).
The drill is equipped with an air compressor capable of delivering sufficient free air at high enough
pressure for drilling with a dual-tube drill pipe. The setup is usually complete with cyclone assembly with
discharge through a rotary wet splitter. Drill bit size is 13.3 cm (5.25 in). The drill pipe was 10.2 cm (4 in)
diameter in 3.04m (10 ft) lengths. The method employed utilized the double wall drill pipe, interchange
hammer, and hammer bits to drill and sample the geologic formations. The samples were recovered
through the center of the double walled pipe and the sample discharged via a cyclone. Water/fluid was
injected into the airflow on an intermitted to continuous basis to assist with recovery of the sample
through the wet rotating splitter. Appropriate sample bags are provided by company geologists and
collected, bagged and tagged under geologist supervision during the drilling. The contractor conducted all
operations to industry standard practices.
All holes labeled and capped so they can be readily identified in the field.
7.3 Downhole Surveying
Core and RC holes drilled by GRCN in 2020-2021 were surveyed by the drillers upon completion of each
hole using a Reflex EZ-GYRO tool. Downhole surveys were taken at approximately 15 m (50 ft) intervals as
per industry standard. The data was reviewed by a competent geologist and approved for entry into the
company database. The holes tended to deviate <1 to 1.9 degrees deviation on the dip and up to 7.02
degrees deviation on azimuth. The database contains down-hole survey data for the 14 core and 42 RC
holes completed by GRCN.
7.4 GRCN Drilling Results
In late 2020 and through August 2021, GRCN completed 14 diamond core drill holes totaling of 1,719.7 m
(5,642 ft) and 42 RC drill holes totaling 4,870.7 m (15,980 ft) at the Golden Mile property (Table 7.1). Most
of this drilling was directed towards the Main Zone located on the patented mineral claims (Fig. 7.3).
Either half or quarter core from the 14 diamond drill holes completed by GRCN, and chip trays for the 42
RC drill holes, are available for examination.

2021 INITIAL ASSESSMENT TECHNICAL REPORT SUMMARY FOR THE GOLDEN MILE PROPERTY, NEVADA
86
TABLE 7.1 Summary of GRCN Drilling Completed at the Golden Mile Property
Company Year No. of
Holes
Type Total
Feet
Total
Meters Results
GRCN 2020-2021 14 Core 5,642 1,719.7
Main Zone confirmation 42 RC 15,980 4,870.7
Total 56 21,622 6,590.4
Figure 7.3 Location Map for Diamond Core (including Met) and RC Holes Drilled by GRCN at the Main
Zone of the Golden Mile Property (patented claims shown shaded light blue and outlined in red)
7.4.1 Core Drilling Results
In November 2020, GRCN commenced a core drilling program to confirm historic drill assays and
geological data collected by previous explorers, conduct geological and resource modeling and to collect
representative mineralized ore grade samples in the Main Zone area in sufficient quantity to conduct
metallurgical testing.

2021 INITIAL ASSESSMENT TECHNICAL REPORT SUMMARY FOR THE GOLDEN MILE PROPERTY, NEVADA
87
Significant results from GRCN’s core drilling included up to 3.60 g/t Au (0.11 opst Au) over 20.1 m (66 ft)
including 13.00 g/t Au (0.38 opst Au) over 3.0 m (10 ft) in Hole GMDD-002 and 2.77 g/t Au (0.08 opst Au)
over 21.21 m (70 ft) including 8.96 g/t Au (0.26 opst Au) over 4.45 m (15 ft) in Hole GMDD-012. Significant
results of the GRCN core drilling program are summarized in Table 7.2. All of the information gained has
been included in the resource estimate.
Table 7.2 Significant Results for GRCN 2020-2021 Core Drilling at Golden Mile
Hole # Angle From To Interval Au
deg m m m g/t
GMDD-002 -60
0.61 20.7 20.10 3.60
incl. 8.50 10.1 1.52 17.45
incl. 13.1 16.2 3.05 13.00
37.5 46.6 9.14 3.99
incl. 37.5 43.4 5.90 5.89
51.2 52.7 1.52 2.70
64.9 66.4 1.52 0.89
72.5 75.6 3.05 0.42
GMDD-003 -45
0.61 5.2 4.57 1.24
incl. 0.61 3.66 3.05 1.62
70.71 76.81 6.10 0.56
incl. 75.29 76.81 1.52 1.07
85.95 87.48 1.52 0.50
102.72 104.24 1.52 0.51
107.29 108.81 1.52 0.39
121.01 139.29 18.29 1.03
incl. 128.63 133.20 4.57 2.81
143.87 146.91 3.05 0.74
incl. 143.87 145.39 1.52 1.18
GMDD-004 -50
5.18 18.90 13.72 0.45 28.04 29.57 1.52 2.96
38.71 40.23 1.52 0.71
46.33 47.85 1.52 3.81
53.95 55.47 1.52 0.40
61.57 66.14 4.57 3.10
incl. 64.62 66.14 1.52 8.66
72.74 73.76 1.52 0.56
89.00 90.53 1.52 0.69
98.15 107.29 9.14 1.28
incl. 102.72 104.24 1.52 4.89
151.49 153.01 1.52 1.07
GMDD-005 -45
49.38 53.95 4.57 0.36 64.62 78.33 13.72 1.68
incl. 70.71 72.24 1.52 2.47
incl. 76.81 78.33 1.52 6.42
81.38 89.00 7.62 0.45
101.19 111.86 10.67 1.61
incl. 110.34 111.86 1.52 10.00
122.53 124.05 1.52 0.45
GMDD-006 -50
58.83 67.97 9.14 1.17
incl. 60.35 63.40 3.05 2.45
75.59 83.21 7.62 0.77
incl. 80.16 83.21 3.05 1.42 106.07 107.59 1.52 0.62
150.27 151.79 1.52 0.45
GMDD-007 -45
12.19 22.25 10.06 1.73
incl. 13.72 15.24 1.52 2.15
incl. 16.76 19.81 3.05 3.76
96.01 97.54 1.52 0.40
112.78 114.30 1.52 0.68

2021 INITIAL ASSESSMENT TECHNICAL REPORT SUMMARY FOR THE GOLDEN MILE PROPERTY, NEVADA
88
7.4.2 RC Drilling Results
From late June through August 2021, GRCN completed a RC drilling program for geological and resource
modeling of the Main Zone area at Golden Mile. The goals of this program were to add to the known
mineralization by testing the undrilled areas between gold-bearing intercepts returned from historic holes
and for the estimation of Mineral Resources reported herein. Significant intercepts included 6.10 m of
5.93 g/t Au (0.173 opst) and 16.76 m of 3.31 g/t Au (0.097 opst) including 1.52 m of 27.50 g/t Au (0.803
opst) in Hole GMRC-026. Another notable intercept included 24.38 m of 1.69 g/t Au (0.049 opst) including
3.05 m of 5.92 g/t Au (0.173 opst) in Hole GMRC-013.
118.87 121.92 3.05 1.17
incl. 118.87 120.40 1.52 2.05
134.11 135.64 1.52 0.75
GMDD-008 -50 37.19 38.71 1.52 0.53
69.19 70.71 1.52 0.98
GMDD-009 -90
1.43 10.06 8.63 0.45
incl. 8.53 10.06 1.52 1.73
20.73 22.25 1.52 1.94
35.97 37.49 1.52 0.99
42.06 43.59 1.52 2.32
141.12 142.65 1.52 0.37
GMDD-010 -90
0.00 6.46 6.46 0.65
incl. 3.05 4.57 1.52 1.95
11.25 17.28 6.04 1.60
incl. 14.02 17.28 3.26 2.77
24.38 35.05 10.67 1.88
incl. 28.96 35.05 6.10 3.21
43.46 49.13 5.67 0.74
incl. 43.46 44.81 1.34 2.62
59.44 63.76 4.33 1.05
incl. 60.96 62.48 1.52 1.85
81.38 90.53 9.14 2.82
incl. 81.38 82.91 1.52 1.19
incl. 87.48 90.53 3.05 7.71
GMDD-011 -90 91.44 96.01 4.57 0.67
incl. 91.44 92.96 1.52 1.12
GMDD-012 -90
8.78 9.30 0.52 15.80
19.32 40.54 21.21 2.77
incl. 19.32 23.77 4.45 8.96
incl. 34.44 35.97 1.52 4.16
82.60 84.12 1.52 0.41
100.89 106.98 6.10 0.42
GMDD-013 -90
8.17 16.15 7.99 2.11
incl. 10.06 11.58 1.52 4.63
22.25 23.77 1.52 8.77
GMDD-014 -45
26.82 36.03 9.20 1.40
incl. 29.87 31.39 1.52 3.88
39.01 42.06 3.05 2.43
incl. 39.01 40.54 1.52 3.95
93.88 97.84 3.96 0.72
incl. 96.93 97.84 0.91 2.50
124.36 127.41 3.05 1.61
incl. 125.88 127.41 1.52 2.53

2021 INITIAL ASSESSMENT TECHNICAL REPORT SUMMARY FOR THE GOLDEN MILE PROPERTY, NEVADA
89
Significant results of the GRCN RC drilling program are summarized in Table 7.3. All of the information
gained has also been included in the resource estimate.
Table 7.3 Significant Results for GRCN 2021 RC Drilling at Golden Mile
Hole # Angle From To Interval Au
Hole # Angle From To Interval Au
deg m m m g/t deg m m m g/t
GMRC-001 -45
77.72 80.77 3.05 0.399
GMRC-025 -45
0.00 4.57 4.57 0.889
117.35 118.87 1.52 0.364 incl. 0.00 3.05 3.05 1.098
123.44 126.49 3.05 0.434 22.86 24.38 1.52 0.357
GMRC-003 -45
15.24 33.53 18.29 0.848 41.15 42.67 1.52 0.469
incl. 22.86 24.38 1.52 1.830 56.39 57.91 1.52 1.170
incl. 27.43 30.48 3.05 1.720 67.06 91.44 24.38 1.040
incl. 32.00 33.53 1.52 1.310 incl. 68.58 73.15 4.57 2.007
GMRC-004 -45 27.43 33.53 6.10 0.320 incl. 77.72 79.25 1.52 5.760
51.82 56.39 4.57 0.337 incl. 82.30 83.82 1.52 1.345
GMRC-005 -45 70.10 76.20 6.10 0.438 99.06 103.63 4.57 0.696
GMRC-006 -45
3.05 22.86 19.81 0.931 incl. 102.11 103.63 1.52 1.730
incl. 3.05 6.10 3.05 3.545
GMRC-026 -45
0.00 6.10 6.10 5.929
incl. 19.81 21.34 1.52 1.095 incl. 0.00 1.52 1.52 22.800
GMRC-007 -45
0.00 12.19 12.19 0.423 18.29 22.86 4.57 0.565
16.76 25.91 9.14 0.871 33.53 38.10 4.57 0.882
incl. 19.81 22.86 3.05 1.853 incl. 36.58 38.10 1.52 1.885
GMRC-008 -45
7.62 12.19 4.57 0.529 50.29 51.82 1.52 0.770
19.81 21.34 1.52 0.547 56.39 73.15 16.76 3.305
32.00 39.62 7.62 0.390 incl. 62.48 64.01 1.52 27.500
GMRC-010 -45 83.82 85.34 1.52 0.370 77.72 80.77 3.05 0.522
GMRC-011 -45
15.24 18.29 3.05 0.300 106.68 120.40 13.72 0.345
22.86 25.91 3.05 0.315 131.06 134.11 3.05 0.308
33.53 39.62 6.10 0.387
GMRC-027 -45
10.67 25.91 15.24 1.904
GMRC-012 -45
15.24 22.86 7.62 0.599 incl. 10.67 15.24 4.57 5.423
incl. 21.34 22.86 1.52 1.620 47.24 48.77 1.52 0.466
45.72 50.29 4.57 0.682 53.34 54.86 1.52 0.745
incl. 45.72 47.24 1.52 1.010 59.44 60.96 1.52 2.390
GMRC-013 -45
10.67 12.19 1.52 0.489 65.53 67.06 1.52 0.506
18.29 19.81 1.52 0.402 70.10 83.82 13.72 0.766
30.48 54.86 24.38 1.694 incl. 70.10 71.63 1.52 1.960
incl. 32.00 35.05 3.05 5.920 incl. 77.72 79.25 1.52 1.430
incl. 44.20 47.24 3.05 2.225 incl. 82.30 83.82 1.52 2.030
incl. 48.77 50.29 1.52 3.540 94.49 103.63 9.14 0.398
67.06 86.87 19.81 0.792 109.73 111.25 1.52 0.421
incl. 70.10 71.63 1.52 3.270 114.30 115.82 1.52 0.404
incl. 82.30 85.34 3.05 1.813 144.78 152.40 7.62 0.823
106.68 109.73 3.05 0.308 incl. 144.78 146.30 1.52 3.160
120.40 121.92 1.52 0.749
GMRC-028 -45
0.00 7.62 7.62 0.928
GMRC-014 -90
51.82 54.86 3.05 0.631 incl. 0.00 1.52 1.52 2.140
incl. 53.34 54.86 1.52 1.090 48.77 53.34 4.57 0.512
59.44 60.96 1.52 0.524 incl. 51.82 53.34 1.52 1.110
152.40 153.92 1.52 0.622 82.30 111.25 28.96 0.427
GMRC-015 -45 103.63 109.73 6.10 0.726 incl. 82.30 83.82 1.52 1.050
incl. 106.68 108.20 1.52 1.125 incl. 108.20 109.73 1.52 1.565
GMRC-019 -45
42.67 44.20 1.52 0.397 121.92 124.97 3.05 0.340
60.96 70.10 9.14 1.427 134.11 141.73 7.62 1.087
incl. 60.96 64.01 3.05 3.575 incl. 134.11 137.16 3.05 2.175
80.77 82.30 1.52 0.408 150.88 152.40 1.52 0.580

2021 INITIAL ASSESSMENT TECHNICAL REPORT SUMMARY FOR THE GOLDEN MILE PROPERTY, NEVADA
90
96.01 97.54 1.52 0.970
GMRC-029 -45
1.52 7.62 6.10 0.762
170.69 172.21 1.52 0.385 incl. 6.10 7.62 1.52 2.670
GMRC-020 -45
44.20 50.29 6.10 0.519 33.53 89.92 56.39 0.803
incl. 44.20 45.72 1.52 1.310 incl. 33.53 35.05 1.52 2.430
68.58 70.10 1.52 0.468 incl. 53.34 62.48 9.14 1.942
94.49 102.11 7.62 0.566 incl. 71.63 74.68 3.05 2.228
incl. 97.54 99.06 1.52 2.130 99.06 100.58 1.52 0.548
108.20 114.30 6.10 0.325 105.16 108.20 3.05 0.327
121.92 132.59 10.67 0.303 129.54 140.21 10.67 1.516
GMRC-021 -90 68.58 70.10 1.52 1.615 incl. 131.06 132.59 1.52 7.920
GMRC-022 -45 71.63 73.15 1.52 0.379
GMRC-030 -45
62.48 64.01 1.52 0.352
GMRC-023 -45
4.57 27.43 22.86 1.634 80.77 83.82 3.05 0.321
incl. 4.57 7.62 3.05 6.985 89.92 91.44 1.52 0.546
incl. 15.24 16.76 1.52 5.990
GMRC-031 -45
36.58 39.62 3.05 0.675
30.48 32.00 1.52 2.190 51.82 62.48 10.67 0.904
41.15 44.20 3.05 0.469 incl. 51.82 56.39 4.57 1.199
47.24 56.39 9.14 1.944 73.15 91.44 18.29 0.514
incl. 47.24 50.29 3.05 5.125 incl. 82.30 83.82 1.52 1.185
71.63 73.15 1.52 0.451 GMRC-033 -45
77.72 79.25 1.52 0.818
76.20 79.25 3.05 0.353 88.39 94.49 6.10 0.372
83.82 91.44 7.62 0.340 GMRC-034 -45 50.29 54.86 4.57 0.348
102.11 118.87 16.76 0.514
GMRC-035 -45
0.00 12.19 12.19 0.535
incl. 111.25 112.78 1.52 2.150 59.44 64.01 4.57 0.314
129.54 135.64 6.10 0.484 73.15 77.72 4.57 0.314
GMRC-024 -45
0.00 3.05 3.05 0.950 88.39 92.96 4.57 0.474
incl. 0.00 1.52 1.52 1.220
GMRC-037 -45
27.43 32.00 4.57 0.578
16.76 21.34 4.57 2.939 incl. 27.43 28.96 1.52 1.120
incl. 16.76 18.29 1.52 7.470 38.10 39.62 1.52 0.397
62.48 67.06 4.57 0.756 74.68 76.20 1.52 0.389
incl. 65.53 67.06 1.52 1.590 91.44 92.96 1.52 0.518
89.92 91.44 1.52 0.456 GMRC-038 -45
28.96 30.48 1.52 0.459
53.34 54.86 1.52 0.415
GMRC-039 -45 62.48 64.01 1.52 1.465
77.72 80.77 3.05 0.318
GMRC-043 -45
0.00 3.05 3.05 0.333
44.20 47.24 3.05 0.496
60.96 73.15 12.19 0.445
incl. 68.58 70.10 1.52 1.250
80.77 85.34 4.57 0.639
incl. 83.82 85.34 1.52 1.095
7.5 Interpretation
The drill data were incorporated into the property database to complete a S-K 1300 compliant Mineral
Resource estimate for this Initial Assessment. This included an industry standard QA/QC program, down-
hole surveys were conducted on all holes. Care was also taken during drilling and the removal of core from
the core barrel in order to maximize sample recoveries, and further specific gravity determinations were
obtained from samples of the drill core.
The 2020-2021 GRCN drill information allowed for the refinement in the modeling of the high-grade
portions of the Golden Mile Main Zone deposit, as well as the oxidized/unoxidized boundary, and the

2021 INITIAL ASSESSMENT TECHNICAL REPORT SUMMARY FOR THE GOLDEN MILE PROPERTY, NEVADA
91
contact between Mesozoic sedimentary, Tertiary volcanic and granitic rocks. These refinements are
critical to the confidence in the resource estimation at Golden Mile Main Zone. Down-hole surveys
conducted on the 2020-2021 holes indicated only minor deviations, which alleviated concerns related to
the lack of down-hole survey data in previous holes. The confirmatory drilling ultimately led to the
definition of Mineral Resources within the Golden Mile Main Zone deposit. The deposit’s mineralization
remains open on strike and at depth.

2021 INITIAL ASSESSMENT TECHNICAL REPORT SUMMARY FOR THE GOLDEN MILE PROPERTY, NEVADA
92
8 SAMPLE PREPARATION, ANALYSES, AND SECURITY
8.1 Historic Procedures
Sample preparation, analyses and security procedures for historic exploration programs at Golden Mile
were poorly documented. Only reports by Ristorcelli (2006) and Roscan (2011) provided any descriptions
of procedures implemented. Kinross did not provide any documentation of procedures to the underlying
owners during the time of their lease.
8.1.1 Cordex 2006
The 28 holes completed by Cordex in 2006 were drilled by an RC rig with injection of water as required by
MSHA. Drill cuttings were circulated through a cyclone sampler. Equipment used is standard equipment
employed by the exploration drilling business.
All chip material was recovered and collected. A 1.8 kg to 3.6 kg (4 to 8 lb) sample was split from the total
sample using a rotating sample splitter, necessary for wet drilling. The reject sample was stored in the
field. The assay sample interval is 1.52 m (5 ft) in drill holes cutting pre-Tertiary rocks. A 1.52 m (5 ft) assay
sample of drill chips was collected every 6.1 to 9.2m (20 ft. to 30 f) in the unmineralized volcanic cover
rock.
Drill assay samples collected for the Cordex RC holes in 2006 were transported to American Assay
Laboratories Inc. (AAL) in Sparks, Nevada. AAL is a well-established and reputable laboratory participates
in the following accreditations:
• Certificate of ISO/IEC 17025
• Certificate of Laboratory Proficiency PTP-MAL, accredited by the Standards Council of Canada
• Geostats of Australia certificate
• Society of Mineral Analysis-Round Robin Testing
Assay samples as received were dried and crushed to 70% minus 10 mesh (0.90 mm). A split of about 400
g was taken and finely pulverized to 70% minus 150 mesh (0.07mm). A 30-g split of the pulverized material
was assayed for gold using a fire assay with an atomic adsorption finish. Each sample interval was also
analyzed for 30 elements by ICP using an aqua regia digestion of a 0.5-g split of the sample. American
Assay inserted blanks and standards, and randomly re-assayed about 10% of the samples. Cordex did not
insert standard samples or blanks into the sample stream before submitting samples to the assay lab. In
addition, no repeat assays were done using a second assay laboratory.
Cordex selected groups of samples, usually those with initial assays greater than 300 ppb, for re-assay.
For drill holes Ml-1 through Ml-15 (first phase of drilling} some re-assays were done on the original pulp
sample. Some of the new assays were done on new samples processed from the rejects stored in the field,

2021 INITIAL ASSESSMENT TECHNICAL REPORT SUMMARY FOR THE GOLDEN MILE PROPERTY, NEVADA
93
and essentially all repeat assays designated by Cordex from the second phase of drilling (Ml-16 through
Ml-28) were new samples prepared from reject cuttings stored in the field. Cordex reported both the
original and repeat assays in their data file, and also calculated and posted an average of the two assays.
Cordex engaged Mine Development Associates (MDA), a consulting group, to carry out a statistical
analysis of the analytical database and provide recommendations on the sampling protocol (Ristorcelli,
2006). MDA noted that for all samples greater than 300 ppb Au, the relative difference in assay values is
94%, with most differences occurring in values above 1 g/t (0.029 opst) Au. MDA suggested that the high
error most likely may be caused by the presence of relatively coarse gold or gold occurring in clots or
irregularly distributed in the mineralized rock. Other possible sources of error are introduced by the
nature of RC drilling which is noted for introducing downhole contamination and using wet sampling that
can introduce bias by losing fine material from the sample.
8.1.2 Roscan 2011
Roscan (2011) completed a core drilling program designed to determine which structures host the gold at
Golden Mile. Core was logged, sample intervals marked, core boxes taped closed and palletized for pick
up by AAL. After the core was transported, it was cut with a diamond bladed saw by AAL personnel. The
core was then dried, crushed to -10 mesh, split to 250 g and the split was pulverized to -150 mesh. A 30-
g charge was analyzed by fire assay with an IC (1 ppb detection limit). Samples containing >3 g/t (0.088
opst) Au were re-analyzed by fire assay with a gravimetric finish. Multi-element ICP analysis for major and
trace elements was completed on all samples submitted to AAL.
8.2 GRCN Procedures
8.2.1 Security Measures
Sample security procedures for GRCN sample materials were established according to industry standards
and included (from generation of sample at the site) secured sample transport to a local locked storage
facility for holding and/or directly shipped via secured transport to the laboratory for analysis. Diamond
drill samples were loaded into sacks, ziptied and shipped to lab via GRCN personnel. RC samples were
shipped by cargo truck in lots loaded into bins with top closures, enclosed trailer, or stacked and covered
and secured to the bed of a transport truck (in the case of whole DDH drill hole boxes). Chain of custody
forms accompanied the shipments to the reception at the assigned laboratory. No breaches of the security
were reported.

2021 INITIAL ASSESSMENT TECHNICAL REPORT SUMMARY FOR THE GOLDEN MILE PROPERTY, NEVADA
94
8.2.2 Sample Preparation and Analysis
For the GRCN 2020-2021 core drilling and 2021 RC drilling programs, continuous sampling was assigned
to on 1.52 m (5 ft) intervals, contingent on drilling recovery conditions and geologic factors. Core assay
samples were mainly processed at ALS in Reno, with additional work carried out at ALS in Vancouver, BC,
Canada, Elko NV, Tuscon AZ, Sonora Mexico, Chihuahua Mexico and Lima Peru. ALS is an accredited
ISO/IEC 17025 facility. Bureau Veritas Mineral Laboratories (Bureau Veritas), also an accredited ISO/IEC
17025 facility, assayed samples for the four GRCN metallurgical core holes and was also the umpire
laboratory used for check assaying of samples sent to ALS. For the GRCN 2021 RC drilling program, all
assay samples were processed at ALS.
All assay samples were analyzed using a 30 g FA with an AAS finish for gold (ALS code AU-AA23; Bureau
Veritas code FA430)). This technique has a lower detection limit of 0.005 ppm and an upper detection
limit of 10.00 ppm. Samples with greater than 10.00 ppm Au were re-analyzed using a 30 g FA with a
gravimetric finish (ALS code Au-GRA21; Bureau Veritas code FA530). All assay samples were also analyzed
using a 0.5 g sample with aqua regia for silver (ALS code Ag-AA45; Bureau Veritas code AQ-400). This
technique has a lower detection limit of 0.1 ppm for Ag and an upper detection limit of 200 ppm for Ag.
GRCN has no business relationship with either ALS or Bureau Veritas, beyond being a customer for
analytical services.
8.2.3 Quality Assurance/Quality Control Procedures
The 2020-2021 GRCN drilling programs consisted of 14 core and 43 RC drill holes. All Standard Reference
Materials (SRM) used for the QA/QC program were obtained from Shea Clark Smith / MEG, Inc., Reno,
Nevada (Table 8.1). Blank material was sourced as “Lava Rock” (pumice) from Oxborrow Landscaping,
Sparks, Nevada.
Table 8.1 GRCN 2020-2021 Standard Reference Material (SRM)
Standard Au ppm SD
MEG-AU.17.08 0.41 0.014
MEG-Au.19.05 0.663 0.046
MEG-Au.17.21 1.1 0.062
The variation from the SRM mean value defines the QA/QC variance and is used to determine acceptability
of the standard sample assay. Approximately 60 g of sample material was submitted per QA/QC sample.
For the 2020-2021 drilling programs, the criteria for failure were as follows.
1. Assay result outside three times the SRM standard deviation: Warning
2. Assay result outside five times the SRM standard deviation: Failure
3. Blank value greater than 5 times the lower detection limit: Failure

2021 INITIAL ASSESSMENT TECHNICAL REPORT SUMMARY FOR THE GOLDEN MILE PROPERTY, NEVADA
95
For the core drill holes, 69 SRM standards and 68 blanks were inserted with the 1,428 samples collected
(Tables 8.2 & 8.3). For the RC drilling program, a total of 184 SRM standards and 190 blanks were inserted
with the 3,234 samples collected.
Table 8.2 GRCN 2020-2021 QA/QC SRM Results for DDH Drill Holes
Sample No. Drill Hole No. SRM Standard Au ppm SRM ppm 95% Cl
855720 GMDD-002 MEG-Au.17.08 0.429 0.41 0.381 – 0.439
854640 GMDD-002 MEG-Au.17.08 0.425 0.41 0.381 – 0.439
854620 GMDD-002 MEG-Au.17.08 0.423 0.41 0.381 – 0.439
854560 GMDD-003 MEG-Au.17.08 0.415 0.41 0.381 – 0.439
854580 GMDD-003 MEG-Au.17.08 0.413 0.41 0.381 – 0.439
854600 GMDD-003 MEG-Au.17.08 0.41 0.41 0.381 – 0.439
854780 GMDD-004 MEG-Au.17.08 0.428 0.41 0.381 – 0.439
854840 GMDD-004 MEG-Au.17.08 0.425 0.41 0.381 – 0.439
854800 GMDD-004 MEG-Au.17.08 0.422 0.41 0.381 – 0.439
855320 GMDD-005 MEG-Au.17.08 0.409 0.41 0.381 – 0.439
854900 GMDD-006 MEG-Au.17.08 0.409 0.41 0.381 – 0.439
854960 GMDD-006 MEG-Au.17.08 0.422 0.41 0.381 – 0.439
854940 GMDD-006 MEG-Au.17.08 0.424 0.41 0.381 – 0.439 854380 GMDD-007 MEG-Au.17.08 0.386 0.41 0.381 – 0.439
854440 GMDD-007 MEG-Au.17.08 0.408 0.41 0.381 – 0.439
854460 GMDD-007 MEG-Au.17.08 0.36 0.41 0.381 – 0.439
855500 GMDD-009 MEG-Au.17.08 0.432 0.41 0.381 – 0.439
855480 GMDD-009 MEG-Au.17.08 0.416 0.41 0.381 – 0.439
3080300 GMDD-010 MEG-Au.17.08 0.369 0.41 0.381 – 0.439 3107660 GMDD-010 MEG-Au.17.08 0.402 0.41 0.381 – 0.439
3080260 GMDD-011 MEG-Au.17.08 0.378 0.41 0.381 – 0.439
3080280 GMDD-011 MEG-Au.17.08 0.385 0.41 0.381 – 0.439
3080420 GMDD-013 MEG-Au.17.08 0.344 0.41 0.381 – 0.439
3080480 GMDD-013 MEG-Au.17.08 0.387 0.41 0.381 – 0.439
855780 GMDD-014 MEG-Au.17.08 0.4 0.41 0.381 – 0.439 855760 GMDD-014 MEG-Au.17.08 0.395 0.41 0.381 – 0.439
855700 GMDD-014 MEG-Au.17.08 0.418 0.41 0.381 – 0.439
854700 GMDD-002 MEG-Au.17.21 1.13 1.1 0.983 – 1.231
854680 GMDD-002 MEG-Au.17.21 1.08 1.1 0.983 – 1.231
854660 GMDD-002 MEG-Au.17.21 1.13 1.1 0.983 – 1.231
854500 GMDD-003 MEG-Au.17.21 1.03 1.1 0.983 – 1.231 854540 GMDD-003 MEG-Au.17.21 1.145 1.1 0.983 – 1.231
854520 GMDD-003 MEG-Au.17.21 1.07 1.1 0.983 – 1.231
855740 GMDD-004 MEG-Au.17.21 1.135 1.1 0.983 – 1.231
854860 GMDD-004 MEG-Au.17.21 1.15 1.1 0.983 – 1.231
854760 GMDD-004 MEG-Au.17.21 1.09 1.1 0.983 – 1.231
855340 GMDD-005 MEG-Au.17.21 1.13 1.1 0.983 – 1.231 855280 GMDD-005 MEG-Au.17.21 1.115 1.1 0.983 – 1.231
855260 GMDD-005 MEG-Au.17.21 1.06 1.1 0.983 – 1.231
855000 GMDD-005 MEG-Au.17.21 1.16 1.1 0.983 – 1.231
854920 GMDD-006 MEG-Au.17.21 1.15 1.1 0.983 – 1.231
854880 GMDD-006 MEG-Au.17.21 1.03 1.1 0.983 – 1.231
854480 GMDD-007 MEG-Au.17.21 1.03 1.1 0.983 – 1.231

2021 INITIAL ASSESSMENT TECHNICAL REPORT SUMMARY FOR THE GOLDEN MILE PROPERTY, NEVADA
96
854420 GMDD-007 MEG-Au.17.21 1.13 1.1 0.983 – 1.231
855420 GMDD-008 MEG-Au.17.21 1.17 1.1 0.983 – 1.231 855520 GMDD-009 MEG-Au.17.21 1.15 1.1 0.983 – 1.231
3080340 GMDD-010 MEG-Au.17.21 1.144 1.1 0.983 – 1.231
3080320 GMDD-010 MEG-Au.17.21 1.059 1.1 0.983 – 1.231
3107640 GMDD-010 MEG-Au.17.21 1.031 1.1 0.983 – 1.231
3107600 GMDD-011 MEG-Au.17.21 1.155 1.1 0.983 – 1.231
3107620 GMDD-011 MEG-Au.17.21 1.165 1.1 0.983 – 1.231 3080360 GMDD-012 MEG-Au.17.21 1.104 1.1 0.983 – 1.231
3080380 GMDD-012 MEG-Au.17.21 1.125 1.1 0.983 – 1.231
3107580 GMDD-012 MEG-Au.17.21 1.068 1.1 0.983 – 1.231
3107560 GMDD-012 MEG-Au.17.21 1 1.1 0.983 – 1.231
3080400 GMDD-013 MEG-Au.17.21 0.977 1.1 0.983 – 1.231
3080460 GMDD-013 MEG-Au.17.21 1.005 1.1 0.983 – 1.231 855620 GMDD-014 MEG-Au.17.21 1.055 1.1 0.983 – 1.231
855660 GMDD-014 MEG-Au.17.21 1.03 1.1 0.983 – 1.231
854360 GMDD-001 MEG-Au.19.05 0.677 0.663 0.570 – 0.756
854820 GMDD-004 MEG-Au.19.05 0.706 0.663 0.570 – 0.756
855300 GMDD-005 MEG-Au.19.05 0.737 0.663 0.570 – 0.756
854400 GMDD-007 MEG-Au.19.05 0.717 0.663 0.570 – 0.756 855400 GMDD-008 MEG-Au.19.05 0.632 0.663 0.570 – 0.756
855380 GMDD-008 MEG-Au.19.05 0.664 0.663 0.570 – 0.756
855460 GMDD-009 MEG-Au.19.05 0.708 0.663 0.570 – 0.756
855540 GMDD-009 MEG-Au.19.05 0.703 0.663 0.570 – 0.756
3080440 GMDD-013 MEG-Au.19.05 0.628 0.663 0.570 – 0.756
855640 GMDD-014 MEG-Au.19.05 0.652 0.663 0.570 – 0.756
Table 8.3 GRCN 2020-2021 QA/QC Blanks Results for DDH Drill Holes
Sample No. Drill Hole No. BRM Au ppm Blank ppm Failure ppm
854361 GMDD-001 Lava Blank 0.0025 0.003 0.015
854681 GMDD-002 Lava Blank 0.119 0.003 0.015 854661 GMDD-002 Lava Blank 0.008 0.003 0.015
855701 GMDD-002 Lava Blank 0.007 0.003 0.015
855721 GMDD-002 Lava Blank 0.0025 0.003 0.015
854641 GMDD-002 Lava Blank 0.0025 0.003 0.015
854621 GMDD-002 Lava Blank 0.008 0.003 0.015
854541 GMDD-003 Lava Blank 0.005 0.003 0.015
854601 GMDD-003 Lava Blank 0.0025 0.003 0.015
854561 GMDD-003 Lava Blank 0.0025 0.003 0.015
854521 GMDD-003 Lava Blank 0.0025 0.003 0.015
854501 GMDD-003 Lava Blank 0.0025 0.003 0.015
854581 GMDD-003 Lava Blank 0.0025 0.003 0.015 854821 GMDD-004 Lava Blank 0.0025 0.003 0.015
854761 GMDD-004 Lava Blank 0.009 0.003 0.015
854841 GMDD-004 Lava Blank 0.0025 0.003 0.015
854861 GMDD-004 Lava Blank 0.005 0.003 0.015
855741 GMDD-004 Lava Blank 0.013 0.003 0.015
854781 GMDD-004 Lava Blank 0.0025 0.003 0.015

2021 INITIAL ASSESSMENT TECHNICAL REPORT SUMMARY FOR THE GOLDEN MILE PROPERTY, NEVADA
97
854801 GMDD-004 Lava Blank 0.0025 0.003 0.015
855321 GMDD-005 Lava Blank 0.0025 0.003 0.015 855281 GMDD-005 Lava Blank 0.0025 0.003 0.015
855261 GMDD-005 Lava Blank 0.0025 0.003 0.015
855341 GMDD-005 Lava Blank 0.0025 0.003 0.015
854881 GMDD-006 Lava Blank 0.0025 0.003 0.015
854961 GMDD-006 Lava Blank 0.0025 0.003 0.015
854941 GMDD-006 Lava Blank 0.0025 0.003 0.015 854901 GMDD-006 Lava Blank 0.015 0.003 0.015
854921 GMDD-006 Lava Blank 0.0025 0.003 0.015
854381 GMDD-007 Lava Blank 0.0025 0.003 0.015
854401 GMDD-007 Lava Blank 0.0025 0.003 0.015
854441 GMDD-007 Lava Blank 0.0025 0.003 0.015
854481 GMDD-007 Lava Blank 0.006 0.003 0.015 854461 GMDD-007 Lava Blank 0.0025 0.003 0.015
854421 GMDD-007 Lava Blank 0.0025 0.003 0.015
855361 GMDD-008 Lava Blank 0.0025 0.003 0.015
855421 GMDD-008 Lava Blank 0.0025 0.003 0.015
855381 GMDD-008 Lava Blank 0.0025 0.003 0.015
855541 GMDD-009 Lava Blank 0.0025 0.003 0.015 855521 GMDD-009 Lava Blank 0.005 0.003 0.015
855501 GMDD-009 Lava Blank 0.0025 0.003 0.015
855481 GMDD-009 Lava Blank 0.0025 0.003 0.015
855461 GMDD-009 Lava Blank 0.0025 0.003 0.015
855601 GMDD-009 Lava Blank 0.0025 0.003 0.015
3107641 GMDD-010 Lava Blank 0.009 0.003 0.015 3080341 GMDD-010 Lava Blank 0.0025 0.003 0.015
3080321 GMDD-010 Lava Blank 0.005 0.003 0.015
3080301 GMDD-010 Lava Blank 0.0025 0.003 0.015
3107661 GMDD-010 Lava Blank 0.008 0.003 0.015
3080281 GMDD-011 Lava Blank 0.0025 0.003 0.015
3080261 GMDD-011 Lava Blank 0.03 0.003 0.015 3107621 GMDD-011 Lava Blank 0.012 0.003 0.015
3107601 GMDD-011 Lava Blank 0.012 0.003 0.015
3107581 GMDD-012 Lava Blank 0.006 0.003 0.015
3080361 GMDD-012 Lava Blank 0.0025 0.003 0.015
3080381 GMDD-012 Lava Blank 0.01 0.003 0.015 3107561 GMDD-012 Lava Blank 0.014 0.003 0.015
3080461 GMDD-013 Lava Blank 0.021 0.003 0.015
3080441 GMDD-013 Lava Blank 0.0025 0.003 0.015
3080421 GMDD-013 Lava Blank 0.0025 0.003 0.015
3080401 GMDD-013 Lava Blank 0.011 0.003 0.015
3080481 GMDD-013 Lava Blank 0.01 0.003 0.015 855621 GMDD-014 Lava Blank 0.008 0.003 0.015
855781 GMDD-014 Lava Blank 0.0025 0.003 0.015
855641 GMDD-014 Lava Blank 0.034 0.003 0.015
855761 GMDD-014 Lava Blank 0.0025 0.003 0.015
855681 GMDD-014 Lava Blank 0.0025 0.003 0.015
855661 GMDD-014 Lava Blank 0.007 0.003 0.015

2021 INITIAL ASSESSMENT TECHNICAL REPORT SUMMARY FOR THE GOLDEN MILE PROPERTY, NEVADA
98
For the 69 core SRM samples submitted, a total of two warnings were returned and two failures (Table
8.4). Performance of the remaining assays was acceptable (Fig. 8.1). It was noted that three out of the
four SRM warnings or failures were submitted to Inspectorate labs. For the 184 RC SRM standards
submitted a total of eight failures were reported, the majority of which appear to be the result of
recording the incorrect SRM (Fig. 8.2).
Table 8.4 2020-2021 SRM Failures
Sample No. Drill Hole No. SRM Au ppm Criteria
3080300 GMDD-010 MEG-Au.17.08 0.369 Warning
3080260 GMDD-011 MEG-Au.17.08 0.378 Warning
854460 GMDD-007 MEG-Au.17.08 0.360 Failure
3080420 GMDD-013 MEG-Au.17.08 0.344 Failure
835020 GMRC-035 MEG-Au.17.08 0.454 Failure 311740 GMRC-004 MEG-Au.17.08 0.457 Failure
835200 GMRC-038 MEG-Au.17.08 0.561 Failure
314300 GMRC-025 MEG-Au.17.08 1.16 Failure
312700 GMRC-026 MEG-Au.17.21 0.416 Failure
835100 GMRC-037 MEG-Au.17.21 0.019 Failure
312440 GMRC-018 MEG-Au.19.05 0.515 Failure 314140 GMRC-021 MEG-Au.19.05 0.443 Failure
Figure 8.1 2020-2021 SRM Performance for DDH
312825221 91 61 31 0741
1 .2
1 .1
1 .0
Observation
Ind
ivid
ual
Valu
e
_X=1.1
25221 91 61 31 0741
0.45
0.40
0.35
Observation
Ind
ivid
ual
Valu
e
_X=0.41
1 0987654321
0.8
0.7
0.6
Observation
Ind
ivid
ual
Valu
e
_X=0.66
1
1
MEG-Au.1 7.21
MEG-AU.1 7.08
MEG-Au.1 9.05

2021 INITIAL ASSESSMENT TECHNICAL REPORT SUMMARY FOR THE GOLDEN MILE PROPERTY, NEVADA
99
Figure 8.2 2020-2021 SRM Performance for RC
For the blank material, a total of four failures each were reported for DDH and RC drill holes (Table 8.5;
Fig. 8.3).
Table 8.5 2020-2021 Blank Material Failures
Sample No. Drill Hole No. BRM Au ppm Criteria
854681 GMDD-002 Lava Blank 0.119 > 0.015 855641 GMDD-014 Lava Blank 0.034 > 0.015
3080261 GMDD-011 Lava Blank 0.03 > 0.015
3080461 GMDD-013 Lava Blank 0.021 > 0.015 835301 GMRC-039 Lava Blank 0.086 > 0.015
313321 GMRC-006 Lava Blank 0.045 > 0.015
312541 GMRC-020 Lava Blank 0.031 > 0.015
314541 GMRC-029 Lava Blank 0.016 > 0.015
514641363126211 61 161
1 .0
0.5
0.0
Observation
Ind
ivid
ual
Valu
e _X=1.1
615549433731251 91 371
1 .00
0.75
0.50
Observation
Ind
ivid
ual
Valu
e
_X=0.41
645750433629221 581
0.8
0.6
0.4
Observation
Ind
ivid
ual
Valu
e
_X=0.663
1
1
11
1
1
1
1
MEG-Au.1 7.21
MEG-AU.1 7.08
MEG-Au.1 9.05

2021 INITIAL ASSESSMENT TECHNICAL REPORT SUMMARY FOR THE GOLDEN MILE PROPERTY, NEVADA
100
Figure 8.3 2020-2021 Blank Material Performance
8.2.4 Check Assays
For the 2020-2021 core drilling campaign, a total of 241 field duplicates were taken and submitted for
assay at the same laboratory as the primary sample. There is a strong correlation between the primary
and secondary assays, with several outliers noted, possibly representing either a high nugget effect or
gold occurring in clots or irregularly distributed in the mineralized rock (Figs. 8.4 & 8.5).

2021 INITIAL ASSESSMENT TECHNICAL REPORT SUMMARY FOR THE GOLDEN MILE PROPERTY, NEVADA
101
Figure 8.4 Au Field Duplicate Control Plot
Figure 8.5 Au Min Max Field Duplicate Control Plot
8.3 Opinion on Adequacy
GRCN considers that the 2020-2021 core and RC drilling programs meets industry standards and have
been reviewed and confirmed in sufficient detail to permit inclusion of the information in the Golden Mile
property database.
0
1
2
3
4
5
6
7
0 1 2 3 4 5 6 7
Du
plic
ate
Au
g/t
Sample Au g/t
Duplicate Samples
0
1
2
3
4
5
6
7
0 1 2 3 4 5 6 7
Ma
xim
um
Au
g/t
Minimum Au g/t
Min Max Duplicate Plot

2021 INITIAL ASSESSMENT TECHNICAL REPORT SUMMARY FOR THE GOLDEN MILE PROPERTY, NEVADA
102
9 DATA VERIFICATION
9.1 Historic Property Evaluation and Data Verification
Upon acquisition of the Golden Mile property, GRCN conducted a thorough review of all available data.
GRCN found that numerous errors existed in the database. These errors included hole locations, including
the elimination of certain holes from the database, and entering of assays into the database. Other assay
issues included switching back and forth from g/t (ppm) to opst in drill logs. Additionally, assays were
compiled and averaged using duplicate assays. In some cases, the duplicate assays were neither entered
nor compiled. In these cases, assay values changed significantly. Ray (2016) also noted that the locations
of many historical drill holes were not well known and many drill hole collars had not been surveyed.
GRCN has made a diligent effort to identify and correct any errors in the Golden Mile database.
Available information on historic property evaluations and data verifications are summarized below.
9.1.1 Teck
Surface rock chip samples, and grab samples from drill chips collected from the property during and after
the Teck program, were analyzed by multi-element ICP techniques (O’Donnell, 2016). Analytical results
suggested that the gold mineralizing system is accompanied by a trace element assemblage of elevated
arsenic, antimony, bismuth and possibly manganese. In the Main Zone, elevated copper and silver values
accompany the gold, but in other parts of the property (such as the stockwork zones) they do not. This is
consistent with the presence of more than one style of skarn mineralization, but an alternative
interpretation that more than one kind of gold mineralizing system is also possible. Teck also noted that
aqua-regia digestion, such as has been used for the ICP analyses, provides only a partial leach for certain
key pathfinder elements in gold skarn systems, including bismuth and tellurium.
Teck determined that elevated geochemical values form three northeasterly- trending clusters:
1. west of the Main Zone
2. over the Main Zone and northeast extension
3. east of the Main Zone, on the ridge with silicified horizons
9.1.2 Cordex
In 2006, Cordex collected 12 samples during their evaluation of the Golden Mile property (O'Donnell,
2006). These samples were intended to confirm the presence of metal in the system and to characterize
styles of mineralization. Most samples were collected from areas that had been reported to be
mineralized. Additional samples tested monzonite west of the Main Zone, and the ridge with silicified

2021 INITIAL ASSESSMENT TECHNICAL REPORT SUMMARY FOR THE GOLDEN MILE PROPERTY, NEVADA
103
breccia east of the Main Zone. Eight of the 12 samples collected returned results exceeding 500 ppb Au
(Table 9.1). Assays ranged from 10 ppb Au to a maximum of 17,450 ppb Au (Sample# 415519). Samples
were submitted to ALS Chemex (ALS) in Sparks, Nevada. ALS is certified under ISO 9002, and employs a
comprehensive quality control program covering both sample preparation and analysis. Samples were
analyzed for gold by FA/AA techniques on a 30 g aliquot, with a 5-ppb detection limit. Samples returning
in excess of 10 g/t (0.292 opst) Au were re-assayed using fire assay techniques with a gravimetric finish
(FA/GRAV). Samples were analyzed for other elements by 34-element ICP-AES (using aqua-regia partial
digestion) and for mercury using cold vapor/AA techniques. Samples exceeding 10,000 ppm in copper,
lead or zinc were re-analyzed for those elements using aqua regia/AA techniques. No standards were
submitted by Cordex to the laboratory.
The results of surface rock sampling performed by Cordex correlated well with the results from previous
work on the property and confirmed the presence of gold and copper mineralization of a tenor similar to
that reported by previous workers in surface sampling on the property (O'Donnell, 2006).
Table 9.1 Cordex Significant Rock Chip Samples (>500 ppb Au)
Sample Au
(ppb)
Ag
(ppm)
As
(ppm)
Bi
(ppm) Cu
(ppm)
Sb
(ppm)
Zn
(ppm) Description
415519 17,450 41.7 1,370 54 101,000 198 1,285 mt skarn and fault on west wall main pit
415515 13,550 2.9 127 46 579 16 117 px-mt skarn, small pit
415541 3,410 3.6 2,700 30 8,590 102 92 mt skarn in main pit, sil network
415517 2,660 11.8 9,780 42 18,200 128 120 retrograde skarn(ep)
malachite
415518 2,440 7.9 819 19 13,000 57 261 ss/sh, malachite seams
415516 2,350 7.1 186 43 3,860 11 426 mt-px skarn, adit dump
415520 2,030 8.7 4,080 68 8,500 66 71 Mt-skarn in main pit, sil-network
415521 667 1.3 671 16 1,595 22 100 silicified bx, feox boxworks
9.1.3 Portage
In a 2009 NI 43-101 Technical Report, Portage reported that 3 verification samples were taken from old
surface workings at the Golden Mile property (Suda, 2009). These samples were analyzed by ALS in Sparks,
NV and assays ranged from 1.12 ppm to 9.99 ppm Au (Table 9.2).
Portage also checked pre-2006 data including drill chips mounted on canvas strip logs in the offices of
Cordex in Reno. The chip logs were examined using a binocular microscope and checked against written
log sheets. Cordex assay database was also checked against the official assay sheets prepared by American

2021 INITIAL ASSESSMENT TECHNICAL REPORT SUMMARY FOR THE GOLDEN MILE PROPERTY, NEVADA
104
Assay Lab. Only very rarely were errors detected. Data transferred to the database were at least 99.8%
accurately transcribed. The available material and assay data appear to be consistent with descriptions
presented in the logs as well as with the geology and styles of mineralization reported on the property.
Geological mapping checked during a field examination showed the map had been accurately and
correctly prepared (Suda, 2009). Most drill hole locations were also visited and examined in the field and
found to be reclaimed and marked by a permanent survey marker.
Table 9.2 Portage Rock Chip Samples (>500 ppb Au)
Sample No. Easting
m
Northing
m
Au ppm
Ag ppm
Cu ppm
Zn ppm Description
GMN-01 433 168 4 262 384 1.97 7.6 5,290 85 15' chip-channel sample, dozer cut
just VV of Ml-3 Mt- garnet skarn, clay-
carb-chlorite alt w/limonites
GMN-02 433 183 4 262 380 9.99 8.6 1.70% 191 1O' chip channel sample, W wall of pit
gothite-stained retrograde skarn, ser-
clay laced with limonite veinlets;
intersection of NW and NE structures
GMN-03 433 211 4 262 469 1.12 0.2 35 43 8' chip channel sample, dozer cut 20'
S of hole M1-12 Granular clay-rich
rock with limonites, retrograde skarn
9.2 GRCN Data Verification
In early 2020, GRCN collected 11 rock chip samples from old surface workings as part of its due diligence
prior to acquisition of the Golden Mile property.
9.2.1 GRCN Check Samples
Check samples were analyzed by Bureau Veritas, Sparks, NV and gold assays ranged from 0.211 ppm to
12.20 ppm Au (Table 9.3). The location of GRCN check samples are shown on Figure 9.1. The results of
surface rock sampling confirmed results from previous work on the property and the presence of gold,
silver and copper mineralization. Elevated levels of lead, zinc, arsenic and antimony were also returned
for the check samples. In addition, iron content was quite high with four of the samples returning more
than 40% iron indicating an association of gold mineralization with magnetite skarn, at least locally. Six of
the GRCN check samples were also re-submitted to Bureau Veritas for cyanide bottle roll tests to

2021 INITIAL ASSESSMENT TECHNICAL REPORT SUMMARY FOR THE GOLDEN MILE PROPERTY, NEVADA
105
determine the amenability to cyanide leach gold recovery. The results of the bottle roll tests are described
in Section 10.
Table 9.3 GRCN Rock Chip Check Samples
Sample Au Ag Cu Pb Zn As Sb Fe
Number ppm ppm ppm ppm ppm ppm ppm %
3082801 1.613 5.9 3,239.8 29.8 885 345.4 53.4 >40.00
3082802 3.629 3.7 5,793.3 90.5 5,211 4,124.7 291.8 >40.00
3082803 6.366 20.7 >10,000.0 63.0 628 1,139.9 215.0 9.80
3082804 2.824 8.8 3,632.3 63.1 161 1,159.1 146.1 11.90
3082805 3.150 11.1 7,851.6 116.8 132 6,110.6 156.9 >40.00
3082806 1.091 8.3 >10,000.0 37.9 121 1,935.7 63.3 20.56
3082807 8.457 9.3 8,352.1 34.8 142 3,309.0 283.3 >40.00
3082808 2.766 7.4 3,838.6 99.4 387 186.7 17.2 4.15
3082809 0.268 1.1 454.6 66.1 176 93.3 15.0 1.59
3082810 0.211 1.1 99.1 7.2 236 910.9 277.9 3.42
3082811 12.200 35.2 600.4 2,543.5 2,966 >10,000.0 257.9 19.98
Figure 9.1 Location Map of GRCN Rock Chip Check Samples Collected from the Golden Mile Property

2021 INITIAL ASSESSMENT TECHNICAL REPORT SUMMARY FOR THE GOLDEN MILE PROPERTY, NEVADA
106
9.2.2 Drilling Database
In 2020-2021, GRCN determined that multiple operators had historically worked on the Golden Mile
property. The historic drilling data available incorporated 142 drill holes as follows:
✓ Battle Mt Exploration: 29 drillholes
✓ Cordex: 28 drillholes
✓ Elmwood JV: 18 drillholes
✓ Kinross: 36 drillholes
✓ Roscan: 5 drillholes
✓ Standard Slag: 7 drillholes
✓ Teck: 4 drillholes
✓ USMX: 15 drillholes
Of these, the Kinross RC holes had both collar and downhole surveys. The remaining drill holes were
limited to collar surveys only. Thirty-one drill holes had no associated assay data and one drill hole has no
associated collar coordinates, leaving 112 drill holes available for resource modeling on the property. Up
until acquisition of the property by GRCN, the five Roscan drill holes were the only known diamond drill
holes completed on the property.
9.3 Opinion on Data Adequacy
Investigations of all aspects of current and historical data quality indicates that the quality of the
information is suitable for an Initial Assessment of Mineral Resources.

2021 INITIAL ASSESSMENT TECHNICAL REPORT SUMMARY FOR THE GOLDEN MILE PROPERTY, NEVADA
107
10 MINERAL PROCESSING AND METALLURGICAL TESTING
10.1 Historic Metallurgical Testing
Cyanide bottle roll tests are the industry standard initial stage in assessing the gold recovery possible by
cyanide leaching. During a bottle roll test, prepared ore is gently agitated in a cyanide leaching solution.
Oxygen levels, alkalinity, acid consumption and other parameters are monitored and strictly controlled
throughout the test.
In 1982, 24-hour agitated cyanide bottle roll tests on four bulk samples were completed by Kappes Cassidy
& Associates (KCA) on mineralized material collected from the Golden Mile property (Kappes, Cassiday &
Associates, 1982). The samples were composited and submitted to KCA by Grayhill Exploration Company
(Grayhill) as part of the Elmwood JV.
Pulverized portions were prepared from each of the samples used for the bottle roll tests. Description of
the bulk samples are as follows:
• Sample 2903A (labeled “AS-1”) weighing approximately 100 lbs and described by KCA as “mostly
coarse rock 2 to 6 in maximum dimension with few fines. The sample appeared to consist of
porous, well-leached volcanic fragments cemented with red and black iron oxides along ¼-inch
wide fractures”.
• Sample 2903B (labeled “AS-2”) having the same sample weight and size distribution as 2903A and
described by KCA as "nearly 100% of porous, soft yellow brown iron oxides (limonite?) with a
considerable amount of apparently secondary botryoidal limonite lining vugs. Some minor jarosite
or scorodite was present as coatings”.
• Sample 2903C, an approximately 120-pound composite from drill holes CMA-1, CMA-3 and CMA-
4 described in the KCA report as "hard, very heavy black porous magnetite, with some green
copper staining and some yellow-brown porous iron oxides".
• Sample 2903D, an approximate 100-pound composite from drill holes CMA-2 and CMA-5,
described by KCA as consisting of "mostly yellow-brown, low-density, earthy, highly porous, iron-
oxide-stained rich fragments (well-leached volcanics?)”.
Each sample was treated individually and identically by KCA as follows:
1. The entire sample was crushed through a jaw crusher set at 1.5 in
2. The sample was split in half and one-half was stored.
3. The remaining half was crushed through a jaw crusher set at 5/8th-in.
4. A 2-kg portion was split out from the 5/8th-inch material and the remainder was stored.
5. The 2-kg portion was crushed to 100% passing 6-mesh and split in half. Half was pulverized.
6. Two pulps were split out from the pulverized material, one for reference, and one for a bottle roll
test on a 500-g portion.

2021 INITIAL ASSESSMENT TECHNICAL REPORT SUMMARY FOR THE GOLDEN MILE PROPERTY, NEVADA
108
The procedure used for the agitated cyanide bottle roll tests performed by KCA were as follows:
1. Place 500-g of pulverized material into a 2-liter poly-bottle and add 750 ml of distilled water.
2. Adjust pH to 10.0, if necessary, with lime.
3. Add 3.75 g NaCN (equivalent to 5-g NaCN per liter) and place on rolls.
4. Check solution at 2, 4, 8, and 24 hours for pH, Au, Ag and Cu.
5. Check NaCN in solution at 2 and 8 hours.
6. Filter, wash, and dry tailings. Submit for fire assay.
The recovery of contained gold in the tests was 86% and 87% from the two “AS” samples and 81% and
84% from the two “CMA” samples. Results of bottle roll tests are in Table 10.1.
Table 10.1 Cyanide Bottle Roll Tests on Pulverized Material (KCA, 1982)
There appears to be no reason to doubt the accuracy or veracity of this work. These tests provide a
preliminary metallurgical insight into the material sampled. However, at the time of the sampling, a
resource had not been established and it is uncertain whether the samples collected were representative
of the primary zone of mineralization.
To the authors’ knowledge, there has been no additional metallurgical testing conducted for Golden Mile
mineralization since the KCA (1982) study was completed.

2021 INITIAL ASSESSMENT TECHNICAL REPORT SUMMARY FOR THE GOLDEN MILE PROPERTY, NEVADA
109
10.2 GRCN Metallurgical Testing
10.2.1 GRCN Initial Cyanide Bottle Roll Leach Testing
In 2020, GRCN had cyanide bottle roll leach tests conducted on six representative rock chip samples
collected during the initial property visit (Table 10.2). The selected samples were submitted to Bureau
Veritas in Sparks, NV. Each sample was pulverized, targeting 85% passing 200 mesh (Tyler). Head grades
were determined by Bureau Veritas using fire assay preparation with an AAS finish. Cyanide bottle roll
tests were then conducted for 96 hours on 1,000 g of pulverized sample material mixed with 2,000 mm
of leach solution.
Positive bottle roll leach recoveries for gold and silver were indicated by these early-stage metallurgical
tests. Gold recoveries ranged from 53% to 100% averaging 82%. Silver recoveries ranged from 48% to 73%
averaging 64%. Leach kinetics were relatively fast achieving plus 65% of the total gold recovery in 2 hours
as shown for Sample 3082802 in Figure 10.1.
These test results are similar to the historic cyanide bottle roll leach tests run on Golden Mile samples in
1982. Both GRCN’s and earlier tests suggest that the Golden Mile gold-deposit should be amenable to
either cyanide heap leach or agitated cyanide leach processing methods.
Table 10.2 GRCN Initial Cyanide Bottle Roll Tests on Pulverized Material
Sample Target p85
Size Assayed
Head Bottle Roll Extracted
Au Extracted
Assayed Head
Bottle Roll Extracted
Ag Extracted
Leach Time
Number Mesh Tyler Au ppm Au ppm % Ag ppm Ag ppm % hours
3082801 Pulv. 1.613 1.610 100% 5.9 3.9 66% 96
3082802 Pulv. 3.629 2.750 76% 3.7 2.7 73% 96
3082804 Pulv. 2.824 2.010 71% 8.8 5.8 66% 96
3082806 Pulv. 1.091 0.960 88% 8.3 4.0 48% 96
3082807 Pulv. 8.457 4.520 53% 9.3 5.8 62% 96 3082809 Pulv. 0.268 0.280 104% 1.1 0.8 73% 96
AVERAGE 2.980 2.022 82% 6.2 3.8 64%

2021 INITIAL ASSESSMENT TECHNICAL REPORT SUMMARY FOR THE GOLDEN MILE PROPERTY, NEVADA
110
Figure 10.1 Example of Cyanide Bottle Roll Test Results for GRCN Check Sample #3082802. Extraction
%Au (Top), Extraction %Ag (Bottom); Bottle Roll Tests completed by Bureau Veritas, Sparks, NV
10.2.2 Metallic Screen Assays
During the 2020-2021 core drilling program, GRCN geologists observed visible gold in the drill core. To
address a potential nugget effect, selected samples were submitted to ALS for a metallic screening assay
procedure to evaluate the possibility of uneven distribution of gold. Metallic screen fire assaying (ALS
Code Au_SCR21) was completed on 1 kg of sample pulp screened to 100 microns. Gravimetric analysis
was completed on the entire oversize (plus) fraction and duplicate 30 g assays were also run on the screen
undersize fraction. The size fraction weights, coarse and fine fraction gold content and total gold content
were reported (Table 10.3).
0.0
0.5
1.0
1.5
2.0
2.5
3.0
0%
10%
20%
30%
40%
50%
60%
70%
80%
90%
100%
0 10 20 30 40 50 60 70 80 90 100
Extr
acti
on,
ppm
Au
Extr
acti
on,
%A
u
Leach, hours
%Au ppm Au
0.0
0.5
1.0
1.5
2.0
2.5
3.0
0%
20%
40%
60%
80%
100%
0 10 20 30 40 50 60 70 80 90 100
Extr
acti
on,
pp
m A
g
Extr
acti
on,
%A
g
Leach, hours%Ag ppm Ag

2021 INITIAL ASSESSMENT TECHNICAL REPORT SUMMARY FOR THE GOLDEN MILE PROPERTY, NEVADA
111
The primary goal of the metallic screen assay procedure was to give a better idea of the true assay of the
sample and also say something about the content of coarse gold in the sample. The metallic screens run
on these samples confirmed that the weighted average assays of the combined oversize and undersize
fractions (Au Total (+)(-) Combined) were generally close to the “Original Fire Assay Result”. The difference
between the assays averaged <2%. The metallic screen assay procedure also showed that the duplicate
30 g assays on the undersize fraction were repeatable with the difference between assays typically <5%.
In this sample set, the metallic screen analyses do not show a significantly different gold grade than the
original fire assays. The met screens also do not show a significant amount of coarse gold. These two items
suggest metallic screen analyses are not going to increase knowledge regarding grade over a typical fire
assay (or multiple head assays when averaged).
Table 10.3 Metallic Screen Assays on Pulverized Material
HoleID Sample Number
Original Metallic Screen Assays (Au-SCR21)
Check Assays (inc. dup)
Fire Assay Result Au-AA25 Au-AA25D
Au Au Total (+)(-)
Combined Au (+) Fraction Au (-) Fraction Au (+) mg
WT. + Frac Entire
WT. - Frac Entire
Au Au
g/t g/t g/t g/t mg g g g/t g/t
GMDD-002 854625 17.45 24.50 192 12.4 12.668 65.9 915.1 12.1 12.65
GMDD-002 854626 0.08 0.10 <0.05 0.11 0.001 70.28 854.6 0.1 0.12
GMDD-002 854627 0.17 0.09 <0.05 0.1 <0.001 69.69 914.9 0.11 0.09
GMDD-002 854628 15.50 6.48 30.8 4.2 2.600 84.3 899.1 3.95 4.44
GMDD-002 854629 10.50 11.75 47.7 8.68 3.664 76.89 898.3 8.96 8.39 GMDD-002 854648 12.45 12.25 37.3 9.65 3.579 95.9 921.7 9.68 9.62
GMDD-002 854649 0.06 0.07 <0.05 0.08 0.002 77.19 891.5 0.08 0.07
GMDD-002 854650 6.27 5.53 18.35 4.34 1.504 82.03 878.7 4.46 4.21
GMDD-002 854651 4.68 3.97 3.27 4.05 0.311 95.02 876.2 4.13 3.97 GMDD-003 854494 1.62 1.25 1.77 1.19 0.192 108.25 863.8 1.09 1.28
GMDD-003 854495 1.61 3.30 3.6 3.27 0.399 110.7 838.3 3.08 3.45
GMDD-003 854496 0.49 1.91 1.45 1.95 0.119 82.33 893.2 1.83 2.07 GMDD-004 855744 0.13 0.13 <0.05 0.14 0.002 78.91 922.1 0.13 0.14
GMDD-004 855745 0.48 0.54 0.22 0.57 0.017 78.13 905.3 0.54 0.59
GMDD-004 855746 0.95 0.92 0.76 0.93 0.042 55.18 930.8 0.91 0.95
GMDD-004 855747 0.05 0.06 <0.05 0.06 <0.001 48.8 902.6 0.06 0.06
GMDD-004 855748 0.73 1.05 3.89 0.76 0.352 90.49 873.7 0.78 0.73 GMDD-004 854786 0.24 0.34 0.45 0.33 0.048 105.9 910.8 0.4 0.25
GMDD-004 854787 0.38 0.61 2.33 0.46 0.184 79.03 886.4 0.5 0.42
GMDD-004 854788 8.66 9.49 37.1 7.1 2.919 78.74 907.4 6.66 7.54 GMDD-004 854813 0.55 0.45 0.77 0.44 0.037 48.23 934.6 0.45 0.42
GMDD-004 854814 1.18 0.73 7.99 0.15 0.623 78 958.9 0.2 0.09
GMDD-004 854815 0.04 0.05 0.08 0.05 0.006 79.76 934.9 0.06 0.04
GMDD-004 854816 4.89 3.21 7.59 2.79 0.663 87.34 893 2.65 2.92
GMDD-004 854817 0.15 <0.05 <0.05 <0.05 <0.001 77.73 930.1 0.03 0.02
GMDD-004 854818 1.03 1.69 2.21 1.66 0.114 51.59 1003.5 1.85 1.47 GMDD-003 854592 0.96 1.34 2.49 1.3 0.094 37.73 892.7 1.12 1.47
GMDD-003 854593 3.96 5.42 69.7 3.44 1.819 26.09 846.8 3.22 3.65
GMDD-003 854594 1.97 1.92 2.86 1.88 0.112 39.2 875.6 1.91 1.85
GMDD-003 854595 2.51 1.21 8.92 1 0.212 23.77 857.5 0.98 1.01
GMDD-003 854596 0.54 0.71 2.87 0.63 0.099 34.52 849.8 0.67 0.58 GMDD-007 854390 0.84 0.77 0.62 0.78 0.016 25.97 837 0.74 0.81
GMDD-007 854391 2.15 2.27 2.26 2.28 0.081 35.92 926.3 2.3 2.25
GMDD-007 854392 0.34 0.32 0.4 0.32 0.014 35.28 836 0.3 0.33
GMDD-007 854393 1.94 1.89 1.71 1.9 0.060 35.01 831.1 1.88 1.92
GMDD-007 854394 5.59 3.96 9.16 3.73 0.330 36.04 811.4 3.73 3.72
GMDD-007 854395 0.42 0.35 0.36 0.35 0.012 33.78 825.3 0.35 0.35
10.2.3 2021 Metallurgical Testing (KCA)

2021 INITIAL ASSESSMENT TECHNICAL REPORT SUMMARY FOR THE GOLDEN MILE PROPERTY, NEVADA
112
In early 2021, GRCN completed four PQ-size core holes in the Main Zone at Golden Mile for metallurgical
testing. The location of metallurgical holes drilled at Golden Mile by GRCN are shown in Figure 7.3.
The purpose of this testwork was to evaluate process requirements to recover gold using conventional
heap leaching technology. Heap leaching relies on a leaching agent moving through a bed of heaped ore
to extract the metallic components, like gold and silver. The crushed ore is stacked on a leaching pad and
irrigated with the leaching agent, typically cyanide. The leaching agent chemically reacts with the metal
in the ore to dissolve the gold (& silver) into the solution as it percolates through the heap. The
impregnated solution can then be collected at the bottom of the heap so that the gold and silver can be
recovered.
Mineralized core intervals selected for metallurgical testing were sent to the KCA facility in Reno, Nevada.
A total of 65 boxes of half-split PQ-size drill core representing 553 kg of material was delivered to KCA.
Samples were separated into four composites based on mineralization type as described in Table 10.4.
The test work completed on these composites consisted of head screen analysis (including, whole rock
and QXRD), screen analysis by size fraction, comminution, bottle roll, agglomeration and column leach
testing.
Table 10.4 Golden Mile Composite Core Samples Selected for Metallurgical Testing
KCA Sample No.
Description Sample Weight Est. Grade Est. Grade
Kg g/t Au opst
91201 MET A - Jd Upper Composite 202 1.790 0.052
91202 MET B - Jd Lower Composite 223 0.783 0.023
91203 MET C - Tqp, Jd+mag, Jqd Composite 69 2.641 0.077
91204 MET D - MSK Composite 59 2.115 0.062
Total 553
10.2.3.1 Head Analyses
Portions of the composite material (MET A through D) were utilized for head analyses, which included
head assays, head screen analyses with assays by size fraction, multi-element analyses, whole rock
analyses, and cyanide soluble test work.
A summary of the head assays for gold and silver are presented in Tables 10.5 and 10.6.

2021 INITIAL ASSESSMENT TECHNICAL REPORT SUMMARY FOR THE GOLDEN MILE PROPERTY, NEVADA
113
Table 10.5 Gold Head Analyses for Golden Mile Sample Composites
Table 10.6 Silver Head Analyses for Golden Mile Sample Composites
Head analyses for mercury were conducted utilizing cold vapor/atomic absorption methods. Total copper
analyses were conducted utilizing inductively coupled argon plasma – optical emission
spectrophotometer (ICAP-OES) as well as by FAAS methods.
The results of the mercury and copper analyses are presented in Table 10.7.
Table 10.7 Mercury and Copper Head Analyses for Golden Mile Sample Composites (KCA 2021)

2021 INITIAL ASSESSMENT TECHNICAL REPORT SUMMARY FOR THE GOLDEN MILE PROPERTY, NEVADA
114
Head analyses for carbon and sulfur were conducted utilizing a LECO CS 400 unit. In addition to total
carbon and sulfur analyses, speciation for organic and inorganic carbon and speciation for sulfide and
sulfate sulfur were conducted.
The results of the carbon and sulfur analyses are presented in Table 10.8.
Table 10.8 Carbon and Sulfur Head Analyses for Golden Mile Sample Composites (KCA, 2021)
Semi-quantitative analyses were conducted by means of an ICAP-OES for a series of individual elements
and whole rock constituents (lithium metaborate fusion/ICAP).
The results of the multi-element analyses and whole rock analyses are presented in Tables 10.9 and 10.10.

2021 INITIAL ASSESSMENT TECHNICAL REPORT SUMMARY FOR THE GOLDEN MILE PROPERTY, NEVADA
115
Table 10.9 Head Analyses – Multi-Element (KCA, 2021)
Description Unit
MET A - Jd Upper Composite
MET B - Jd Lower Composite
MET C - Tqp, Jd+mag, Jqd Composite
MET D – MSK Composite
KCA Sample No. 91501 B
KCA Sample No. 91502 B
KCA Sample No. 91503 A
KCA Sample No. 91504 A
Al % 5.91 5.77 5.44 1.67
As ppm 110 218 122 7408
Ba ppm 610 301 445 249
Bi ppm 26 <2 <2 9
C(total) % 0.98 0.86 1.10 3.73
C(organic) % 0.03 0.09 0.10 0.28
C(inorganic) % 0.95 0.77 1.00 3.45
Ca % 4.75 6.49 12.31 11.32
Cd ppm <1 <1 <1 6 Co ppm 6 9 8 39
Cr ppm 59 60 85 21
Cu(total) ppm 235 438 366 9866
Cu(cyanide soluble) ppm 94 167 116 4111
Fe % 1.25 1.75 3.93 12.54
Hg ppm 1.01 1.11 0.96 2.46 K % 3.11 2.19 1.44 0.26
Mg % 3.25 4.04 2.64 10.09
Mn ppm 245 267 549 812
Mo ppm 4 28 21 <1
Na % 0.70 1.05 0.97 0.16 Ni ppm 9 10 7 13
Pb ppm 15 13 20 27
S(total) % 0.02 0.09 0.14 0.04
S(sulfide) % <0.01 0.02 0.05 <0.01
S(sulfate) % 0.02 0.07 0.09 0.04
Sb ppm 15 11 6 147 Se ppm <5 <5 <5 <5
Sr ppm 240 320 316 660
Te ppm 12 8 7 33
Ti % 0.18 0.22 0.21 0.08
V ppm 63 80 109 56
W ppm <10 <10 <10 14 Zn ppm 49 19 28 274

2021 INITIAL ASSESSMENT TECHNICAL REPORT SUMMARY FOR THE GOLDEN MILE PROPERTY, NEVADA
116
Table 10.10 Head Analyses - Whole Rock (KCA, 2021)
Description Unit
MET A - Jd Upper Composite
MET B - Jd Lower Composite
MET C - Tqp, Jd+mag, Jqd Composite
MET D – MSK Composite
KCA Sample No. 91501 B
KCA Sample No. 091502 B
KCA Sample No. 91503 A
KCA Sample No. 91504 A
SiO2 % 60.09 56.47 49.65 20.83
Si % 28.09 26.40 23.21 9.74
Al2O3 % 12.34 12.52 11.46 3.69
Al % 6.53 6.63 6.07 1.95
Fe2O3 % 1.80 2.68 5.79 17.91
Fe % 1.26 1.87 4.05 12.52
CaO % 6.93 9.60 18.57 16.38
Ca % 4.95 6.86 13.27 11.71
MgO % 5.56 7.30 4.67 18.33
Mg % 3.35 4.40 2.82 11.06
Na2O % 0.87 1.38 1.19 0.04
Na % 0.65 1.02 0.88 0.03
K2O % 3.93 2.75 1.79 0.31
K % 3.26 2.28 1.49 0.26
TiO2 % 0.34 0.43 0.44 0.14
Ti % 0.20 0.26 0.26 0.08
MnO % 0.04 0.04 0.07 0.11
Mn % 0.03 0.03 0.05 0.09
SrO % 0.03 0.03 0.03 0.07
Sr % 0.03 0.03 0.03 0.06
BaO % 0.07 0.04 0.05 0.02
Ba % 0.06 0.04 0.04 0.02
Cr2O3 % 0.01 0.01 0.02 <0.01
Cr % 0.01 0.01 0.01 <0.01
P2O5 % 0.11 0.14 0.14 <0.01
P % 0.05 0.06 0.06 <0.01
LOI1090°C % 6.93 5.78 5.57 18.78
SUM % 99.05 99.17 99.44 96.61 NOTE: The SUM is the total of the oxide constituents and the Loss-on-Ignition
Cyanide shake tests were conducted utilizing portions of the pulverized head composite material. These
tests provided preliminary indications of cyanide soluble metal extractions from pulverized material.
The results of individual cyanide shake tests are presented in Table 10.11.

2021 INITIAL ASSESSMENT TECHNICAL REPORT SUMMARY FOR THE GOLDEN MILE PROPERTY, NEVADA
117
Table 10.11 Head Analyses – Cyanide Shake Tests (KCA, 2021)
10.2.3.2 Head Screen Analyses with Assays by Size Fraction
Head screen analysis was carried out on portions of each of the four Golden Mile sample composites received.
The objective of the head screen analysis was to determine assay values from select crush size fractions.
Head screen analyses were conducted utilizing portions of material crushed to 100% passing 37.5 mm
(1.476 in) and 100% passing 9.5 mm (0.374 in). The minus 37.5 mm crushed material apportioned for the
head screen was dry screened at 37.5, 25, 19, 12.5, 9.5, 6.3, 4.75, 2.36, 1.70 and 0.212 mm. The minus 9.5
mm crushed material apportioned for the head screen was dry screened at 9.5, 6.3, 4.75, 2.36, 1.70 and
0.212 mm.
Each separate size fraction was weighed, and the weights reported. Each size fraction was then crushed
to 100% passing 1.70 mm (0.067 in), as needed. From each size fraction two (2) portions were split out
and individually pulverized to a target size of 80% passing 0.075 mm (0.003 in). The portions were assayed
using standard fire assaying methods for gold with FAAS finish and four-acid digestion with FAAS finish for
silver.
A summary of the head screen analyses is presented in Table 10.12. The head screen analyses are
presented graphically in Figure 10.2.
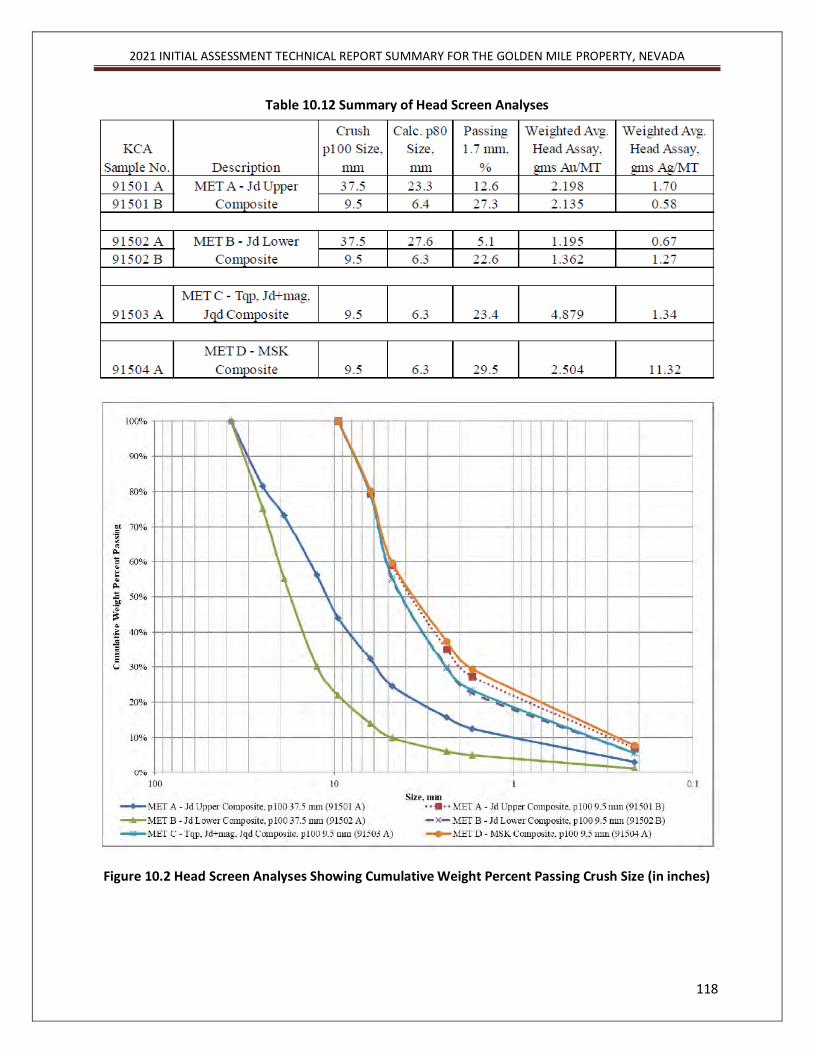
2021 INITIAL ASSESSMENT TECHNICAL REPORT SUMMARY FOR THE GOLDEN MILE PROPERTY, NEVADA
118
Table 10.12 Summary of Head Screen Analyses
Figure 10.2 Head Screen Analyses Showing Cumulative Weight Percent Passing Crush Size (in inches)

2021 INITIAL ASSESSMENT TECHNICAL REPORT SUMMARY FOR THE GOLDEN MILE PROPERTY, NEVADA
119
10.2.3.3 Comminution Test Work
Portions of the head material for the MET A and MET B composites (KCA Sample Nos. 91501 and 91502)
were submitted to Hazen Research, Inc. in Golden, Colorado for comminution testing. Comminution tests
aim to measure the action of reducing a material and is used in designing and sizing the grinding circuit
and to study the variation within an ore body. Test work was completed to provide Bond impact work
indices (CWi) and Bond abrasion indices (Ai) for the samples.
The results are summarized in Table 10.13.
Table 10.13 Summary of Comminution Test Work (KCA, 2021)
10.2.3.4 Characterization Test Work
Portions of the head material for each separate composite were submitted to FLSmidth, Inc. in Midvale,
Utah for quantitative x-ray diffraction (QXRD) and quantitative swelling clay via Cation Exchange Capacity
(CEC) analyses. The purpose of the characterization test work was to utilize the QXRD and CEC results to
quantify the bulk mineralogy of the samples.
The results of the mineralogical analyses are presented in Table 10.14.
Table 10.14 Summary of QXRD Analyses (KCA, 2021)

2021 INITIAL ASSESSMENT TECHNICAL REPORT SUMMARY FOR THE GOLDEN MILE PROPERTY, NEVADA
120
10.2.3.5 Agglomeration Test Work
Ores with a high presence of fines and/or clayey particles result in poor heap permeability as the fines
clog spaces between larger particles, creating pockets where leaching is inhibited or altogether prevented.
The agglomeration of ore fines and clay, however, proves to greatly improve heap permeability when
carried out properly by reducing these fines and transforming them into uniform pellets, which allow for
uninhibited permeability. In the case of heap leaching, agglomeration relies on a binder (typically cement)
and tumbling motion to cause coalescence, or the building of fines into larger particles.
Preliminary agglomeration test work was conducted on portions of the composite material (KCA Sample
Nos. 91501 A/B, 91502 A/B, 91503 A and 91504 A). The purpose of the percolation tests was to examine
the permeability of the material under various cement agglomeration levels (0, 2, 4 and 8 kg (0, 4.41, 8.82
and 17.64 lb) per metric tonne of Portland Type II cement). In the preliminary agglomeration testing, the
agglomerated material was placed in a column (75 mm (3 in) inside diameter) with no compressive load
and then tested for permeability.
This type of agglomeration test work is preliminary but does serve to provide an indication of whether or
not agglomeration will be required for the processing of the material at the tested crushed sizes. These
specific tests should be indicative of cement requirements for a single lift heap having an overall height
of not more than 8 m (26 ft). If a multiple lift heap leach operation is being developed then additional
agglomeration test work will be required and this test work should include examinations of the material
under a static load (this test work is described as compacted permeability test work). For agglomeration
test work conducted by KCA, the parameters that are typically examined are slump, maximum flow rate,
agglomerate pellet break down (when material is agglomerated) and discharge solution color and clarity
(or the “visual” turbidity of the solution).
The results of the agglomeration test work (including a pass/fail results) are shown in Table 10.15.

2021 INITIAL ASSESSMENT TECHNICAL REPORT SUMMARY FOR THE GOLDEN MILE PROPERTY, NEVADA
121
Table 10.15 Summary of Agglomeration Test Work (KCA, 2021)
10.2.3.6 Percent Slump and Final Apparent Bulk Density
The height of material in each column was measured before and after leaching. This height was utilized
to calculate the “slump” during leaching as well as to calculate the final apparent bulk density for the
material in the column. The percent slump of a column gives an indication of potential permeability
problems in production heaps. KCA typically classifies slumps larger than 10% as high.
The height, slump and final apparent bulk density from column leach tests are presented in Table 10.16.
Table 10.16 Percent Slump and Final Apparent Bulk Density (KCA, 2021)

2021 INITIAL ASSESSMENT TECHNICAL REPORT SUMMARY FOR THE GOLDEN MILE PROPERTY, NEVADA
122
10.2.3.7 Cyanide Bottle Roll Tests
Coarse and pulverized bottle roll leach tests were completed on portions of the composite material (MET
A through D; KCA Sample Nos. 91501 B, 91502 B, 91503 A and 91504 A). A portion of the head material
for each individual composite sample was stage crushed to 100% passing 1.70 millimeters. Portions of the
stage crushed material were utilized for coarse bottle roll leach test work. Additionally, portions of the
stage crushed material were pulverized by ring and puck to a target size of 80% passing 0.075 millimeters
and utilized for pulverized bottle roll leach test work. The bottle roll tests ran for a total of 72 hours and
utilized a target sodium cyanide concentration of 1.0 g per liter. After completion, the tailings were rinsed
and filtered. Portions of the tails were split out and assayed for gold and silver.
For the coarse crushed bottle roll leach tests, intermittent rolling was utilized to reduce particle attrition.
The procedure for the bottle roll leach test is outlined in the following:
1. A 1,000 g portion of sample material was placed into a 3.5 liter plastic and slurried with 1,500
milliliters of Reno municipal tap water.
2. The slurry was mixed thoroughly and the pH was checked. The pH of the slurry was adjusted, as
required, to 10.5 to 11.0 with hydrated lime.
3. Sodium cyanide was added to the slurry to a target amount of 1.0 g per liter sodium cyanide. The
bottle was then placed onto a set of laboratory rolls. The coarse material was rolled intermittently
(rolling for two (2) minutes every hour), while the pulverized material was rolled continuously
throughout the test.
4. The slurry was checked at 2, 4, 8, 24 and 48, hours for pH, dissolved oxygen (DO), NaCN, Au, Ag
and Cu.
5. Additional hydrated lime and sodium cyanide were added after each sample period, as required,
to adjust the slurry to the target levels.
6. After completion of the leach period, the slurry was filtered, washed, dried, and assayed for
residual gold and silver content.
The extraction results of the KCA 2021 bottle roll tests showed gold recoveries ranging from 38 to 94%
with finer fractions (<0.075 mm) typically between 90 and 94%. Silver recoveries ranged from 33 to 64%
with finer fractions (<0.075 mm) around 61%. The gold and silver extraction results of the bottle roll test
are summarized in Table 10.16. Figure 10.3 shows overall gold extraction percentages and indicates higher
gold recoveries for the fine fraction for Golden Mile sample composites.
Figures 10.4 and 10.5 show graphical results of gold and silver extraction during the leach period for the
fine pulverized MET A Jd upper composite sample, showing typical recovery curves obtained for these
cyanide bottle roll tests. Both fine pulverized Jd upper and lower composites tested showed rapid leach
kinetics achieving plus 65% of the total gold recovery in 2 hours.

2021 INITIAL ASSESSMENT TECHNICAL REPORT SUMMARY FOR THE GOLDEN MILE PROPERTY, NEVADA
123
Table 10.17 Summary Direct Agitated Cyanidation (Bottle Roll) Gold-and Silver Test Results (KCA 2021)

2021 INITIAL ASSESSMENT TECHNICAL REPORT SUMMARY FOR THE GOLDEN MILE PROPERTY, NEVADA
124
Figure 10.3 Overall Gold Extraction for the Golden Mile Bottle Roll Tests (KCA, 2021)
0%
10%
20%
30%
40%
50%
60%
70%
80%
90%
100%
MET A - Jd UpperComposite
MET B - Jd LowerComposite
MET C - Tqp, Jd+mag, JqdComposite
MET D - MSK Composite
Ove
rall
Go
ld E
xtra
ctio
n
Coarse Bottle - p80 1.70mm Fine Bottle - p80 0.075 mm

2021 INITIAL ASSESSMENT TECHNICAL REPORT SUMMARY FOR THE GOLDEN MILE PROPERTY, NEVADA
125
Figure 10.4 Bottle Roll Test Results Showing % Gold Extraction During Leach Period for KCA Test
#91508A Performed on Fine Pulverized (P80 0.075 mm) Sample of MET A JD Upper Composite
Figure 10.5 Bottle Roll Test Results Showing % Silver Extraction During Leach Period for KCA Test
#91508A Performed on Fine Pulverized (P80 0.075 mm) Sample of MET A JD Upper Composite
0.0
0.2
0.4
0.6
0.8
1.0
1.2
1.4
1.6
1.8
2.0
0%
10%
20%
30%
40%
50%
60%
70%
80%
90%
100%
0 10 20 30 40 50 60 70 80
Extr
acti
on,
gm
s A
u/M
T
Extr
acti
on,
%A
u
Leach, hours
%Au gms Au/MT
0.0
0.5
1.0
1.5
2.0
2.5
3.0
3.5
4.0
4.5
5.0
0%
10%
20%
30%
40%
50%
60%
70%
80%
90%
100%
0 10 20 30 40 50 60 70 80
Extr
acti
on,
gm
s A
g/M
T
Extr
acti
on,
%A
g
Leach, hours
%Ag gms Ag/MT

2021 INITIAL ASSESSMENT TECHNICAL REPORT SUMMARY FOR THE GOLDEN MILE PROPERTY, NEVADA
126
10.2.3.8 Column Leach Test Work
Column leach test work was conducted on portions of the composite material (MET A through D; KCA
Sample Nos. 91501 A/B, 91502 A/B, 91503 A and 91504 A). The crushed composite material split out for
column test work was blended with lime and agglomerated with cement and then loaded into a 203 mm
(8 in) or 152 mm (6 in) diameter plastic column (Fig. 10.6). Alkaline cyanide solution was continuously
distributed onto the material through Tygon tubing. The flow rate of solution dripping onto the material
was controlled with a peristaltic pump to 10 to 12 liters per hour per square meter of column surface area.
The material was leached with a 1.0 g per liter sodium cyanide solution for 115 days.
The results of the column leach tests for gold and silver are summarized in Tables 10.17 and 10.18. Gold
extractions from the column leach tests are presented graphically in Figure 10.7.
Figure 10.6 Column Leach Test Apparatus

2021 INITIAL ASSESSMENT TECHNICAL REPORT SUMMARY FOR THE GOLDEN MILE PROPERTY, NEVADA
127
Table 10.18 Summary of Metal Extractions and Chemical Consumptions – Gold (KCA, 2021)
Table 10.19 Summary of Metal Extractions and Chemical Consumptions – Silver (KCA, 2021)
Figure 10.7 Cyanide Leach Test Work. Gold Extraction vs. Days of Leach (KCA, 2021)

2021 INITIAL ASSESSMENT TECHNICAL REPORT SUMMARY FOR THE GOLDEN MILE PROPERTY, NEVADA
128
Column leach test work was conducted on portions of the 2021 composite core samples crushed to a
target size of 80% passing 25 mm (0.98 in) and 80% passing 6.3 mm (0.25 in). Gold extractions for the
coarse (<37.5 mm; 1.48 in) column leach tests were 80% based on calculated heads which ranged from
1.639 g/t (0.048 opst) to 1.806 g/t (0.052 opst) Au. The sodium cyanide consumptions ranged from 1.70
kg (3.75 lb) to 1.92 kg (4.23 lb) per metric tonne. The material utilized in leaching was blended with 1.27
kg (2.80 lb) to 1.52 kg (3.35 lb) per metric tonne hydrated lime.
Gold extractions for the fine (<9.5 mm; 0.37 in) column leach tests ranged from 51% to 86% based on
calculated heads which ranged from 1.328 g/t (0.039 opst) to 4.506 g/t (0.132 opst) Au. The sodium
cyanide consumptions ranged from 1.69 kg (27.98 lb) to 5.06 kg per metric tonne. The material utilized in
leaching was blended with 1.49 (3.28 lb) to 2.78 kg (6.13 lb) per metric tonne hydrated lime and
agglomerated with about 1 kg (2.20 lb) per metric tonne cement. Column test extraction results were
based upon carbon assays vs. the calculated head (carbon assays + tail assays). Silver extractions were
generally good, ranging from 53 to 92% but typically in the mid 70% to mid 80% range.
The column leach test results for both gold and silver exhibited rapid leach kinetics with 80 to 90 percent
of total recovery occurring in the first 10 days of leaching.

2021 INITIAL ASSESSMENT TECHNICAL REPORT SUMMARY FOR THE GOLDEN MILE PROPERTY, NEVADA
129
11 MINERAL RESOURCE ESTIMATES
11.1 Introduction
On October 31, 2018, the SEC announced that it was adopting amendments to modernize the property
disclosure requirements for mining registrants, and related guidance, under the Securities Act of 1933 and
the Securities Exchange Act of 1934 (SEC, 2018a, 2018b). Under the final rules, a registrant with material
mining operations must disclose specified information in Securities Act and Exchange Act filings
concerning its Mineral Resources, in addition to its Mineral Reserves. A registrant is required to begin to
comply with the new rules starting its first fiscal year beginning on or after January 1, 2021.
The modeling and estimation of Mineral Resources presented herein is based on technical data and
information available as of September 30, 2021.
The modeling and Mineral Resource estimation work reported herein was carried out by Fred H. Brown,
P.Geo., a Qualified Person by reason of education, affiliation with a professional association and past
relevant work experience. Mr. Brown is an independent consulting geologist specializing in Mineral
Resource estimation, and is therefore, independent of GRCN. Mr. Brown was previously employed as a
Senior Resource Geologist by GRCN from 2017 through June of 2021.
Modeling and estimation of Mineral Resources were carried out using the commercially available Maptek
Vulcan software program, version 12.
Any statements and opinions expressed in this document are given in good faith and in the belief that
such statements and opinions are not false and misleading as of the effective date of this report.
11.2 Mineral Resource Definitions
The SEC has adopted the Combined Reserves International Reporting Standards Committee (CRIRSCO)
framework for reporting Mineral Resources (Miskelly, 2003). According to CRIRSCO, a Mineral Resource
is a concentration or occurrence of material of intrinsic economic interest in or on the Earth’s crust (a
deposit) in such form, grade or quality, and quantity that there are reasonable prospects for eventual
economic extraction. The location, quantity, grade, geological characteristics and continuity of a Mineral
Resource are known, estimated or interpreted from specific geological evidence and knowledge. Mineral
Resources are sub-divided, in order of increasing geological confidence, into Inferred, Indicated and
Measured categories. Portions of a deposit that do not have reasonable prospects for eventual economic
extraction must not be included in a Mineral Resource.
Mineral Resources are not Mineral Reserves and do not have demonstrated economic viability. There is
no guarantee that all or any part of the Mineral Resource will be converted into Mineral Reserve.

2021 INITIAL ASSESSMENT TECHNICAL REPORT SUMMARY FOR THE GOLDEN MILE PROPERTY, NEVADA
130
11.2.1 Inferred Mineral Resources
An Inferred Mineral Resource is that part of a Mineral Resource for which tonnage, grade and mineral
content can be estimated with a low level of confidence. It is inferred from geological evidence and
assumed but not verified geological and/or grade continuity. It is based on information gathered through
appropriate techniques from locations such as outcrops, trenches, pits, workings and drill holes which is
limited or of uncertain quality and/or reliability. An Inferred Mineral Resource has a lower level of
confidence than that applying to an Indicated Mineral Resource. Confidence in the estimate of Inferred
Mineral Resources is insufficient to allow the meaningful application of technical and economic
parameters.
11.2.2 Indicated Mineral Resources
An Indicated Mineral Resource is that part of a Mineral Resource for which tonnage, densities, shape,
physical characteristics, grade and mineral content can be estimated with a reasonable level of
confidence. It is based on exploration, sampling and testing information gathered through appropriate
techniques from locations such as outcrops, trenches, pits, workings, and drill holes. The locations are too
widely or inappropriately spaced to confirm geological continuity and/or grade continuity but are spaced
closely enough for continuity to be assumed. An Indicated Mineral Resource has a lower level of
confidence than that applying to a Measured Mineral Resource but has a higher level of confidence than
that applying to an Inferred Mineral Resource.
11.2.3 Measured Mineral Resources
A Measured Mineral Resource is that part of a Mineral Resource for which tonnage, densities, shape,
physical characteristics, grade and mineral content can be estimated with a high level of confidence. It is
based on detailed and reliable exploration, sampling and testing information gathered through
appropriate techniques from locations such as outcrops, trenches, pits, workings, and drill holes. The
locations are spaced closely enough to confirm geological and/or grade continuity.
11.3 Database
The modeling and estimation reported herein utilized the drill hole database compiled by GRCN. The
database used Imperial units, expressed as feet, short tons, and ounces per short ton. Bulk densities have
been converted to short tons per cubic feet. The coordinate reference system used is the Nevada State
Plane NAD 83 (ESPG code 6523).
Industry standard validation checks were carried out on the supplied databases, and minor corrections
made where necessary. The database was reviewed for inconsistencies in naming conventions or

2021 INITIAL ASSESSMENT TECHNICAL REPORT SUMMARY FOR THE GOLDEN MILE PROPERTY, NEVADA
131
analytical units, duplicate entries, interval, length or distance values less than or equal to zero, blank or
zero-value assay results, out-of-sequence intervals, intervals or distances greater than the reported drill
hole length, inappropriate collar locations, and missing interval and coordinate fields.
Drill holes with assay samples occurring within mining claims hosting the Golden Mile deposit were
imported into a Maptek Vulcan database. The resulting drill hole database used for Mineral Resource
estimation contains 150 unique collar records (Table 11.1) and 10,962 assay records (Table 11.2), broken
down by drilling type as:
• RC: 131 reverse circulation drill holes for 14,597 m (47,889 ft)
• DDH: 19 diamond drill holes for 2,843 m (9,327 ft)
A 3D view of all holes drilled in the Main Zone area of the Golden Mile property is shown on Figure 11.1.
Topographic surveying of GRCN 2020-2021 drill hole collars was undertaken by Kevin Haskew of Reno,
Nevada, a registered professional surveyor. All plots were delivered as stamped referenced plats along
with corresponding digital data files. Verification of field locations were also validated with registered air
photographs and drone surveys.
Table 11.1 Golden Mile Drill Hole Database Summary
Description DDH RC Total
Number of Drill Holes 19 131 150
Total Length Drilled 2,843 m (9,327 ft) 47,889 57,216
Average Hole Length 149.7 m (491 ft) 111.6 m (366 ft) 116.1 m (381 ft)
Drill Holes with Downhole Surveys 13 42 55
Table 11.2 Golden Mile Assay Database Summary
Assay Summary DDH RC Total
Number of Assays 1,861 9,101 10,962
Total Length Assayed 2,829.5 m (9,283 ft) 13,869.6 m (45,504 ft) 16,699.1 m (54,787 ft)
Average Assay Length 1.52 m (4.99 ft) 1.52 m (5.00 ft) 1.52 m (5.00 ft)
Average Grade Au 0.38 g/t (0.011 opst) 0.24 g/t (0.007 opst) 0.27 g/t (0.008 opst)
Average Grade Ag 0.48 g/t (0.014 opst) 0.38 g/t (0.011 opst) 0.41 g/t (0.012 opst)

2021 INITIAL ASSESSMENT TECHNICAL REPORT SUMMARY FOR THE GOLDEN MILE PROPERTY, NEVADA
132
Figure 11.1 3D Isometric View Looking Northwest with the Golden Mile Drill Holes
Industry standard validation checks of the database were carried out with minor corrections made where
necessary. The database was interrogated for inconsistencies in naming conventions or analytical units,
duplicate entries, interval, length or distance values less than or equal to zero, blank or zero-value assay
results, out-of-sequence intervals, intervals or distances greater than the reported drill hole length,
inappropriate collar locations, and missing interval and coordinate fields. No significant discrepancies with
the data were noted.
11.3.1 Drill Data
Drill hole distance units were supplied by GRCN in feet and grade units were supplied as ounce per short
ton. The collar coordinates were provided in the Nevada State Plane NAD 83 coordinate system. All data
were supplied electronically as csv format files.
The average minimum collar distance within the mine area is 17.4 m (57 ft). Summary assay statistics were
tabulated for the assay data (Table 11.3).

2021 INITIAL ASSESSMENT TECHNICAL REPORT SUMMARY FOR THE GOLDEN MILE PROPERTY, NEVADA
133
Table 11.3 Summary Assay Statistics
Assay Data Length Au opst Ag opst
Mean 1.52 m (5.00 ft) 0.274 g/t 0.008 (opst) 0.41 g/t (0.012 opst)
Median 1.52 m (5.00 ft) 0.034 g/t (0.001 opst) 0.205 g/t (0.006 opst)
Mode 1.52 m (5.00 ft) 0.000 g/t (0.000 opst) 0.137 g/t (0.004 opst)
Standard Deviation 0.11 m (0.36 ft) 2.40 g/t (0.07 opst) 1.610 g/t (0.047 opst)
Minimum 0.3 m (1 ft) 0.00034 g/t (0.00001 opst) 0.00993 g/t (0.00029 opst)
Maximum 8.63 m (28.3 ft) 130.86 g/t (3.821 opst) 75.31 g/t (2.199 opst)
CoV 0.07 8.46 3.93
Count 10,962 10,962 7,070
11.4 Bulk Density
A total of 44 bulk density values were measured by laboratory pycnometry on DDH core drilled in 2020-
2021. Values ranged from 2.54 tonnes per cubic meter (tonnage factor 12.61) to 3.12 tonnes per cubic
meter (tonnage factor 10.27), with a median of 2.79 tonnes per cubic meter (tonnage factor 11.48) and
an average value of 2.75 tonnes per cubic meter (tonnage factor 11.65). For this resource estimate, a bulk
density of 2.79 tonnes per cubic meter (tonnage factor 11.48) was assigned to the model for all units.
Rock Quality Designation (RQD) data were collected by GRCN from DDH core holes drilled in 2020-2021
and suggests the presence of multiple zones of poor recovery, fractures and voids (Figure 11.2). An
additional factor may be required to accommodate the presence of voids and fractured rocks.

2021 INITIAL ASSESSMENT TECHNICAL REPORT SUMMARY FOR THE GOLDEN MILE PROPERTY, NEVADA
134
Figure 11.2 Plot of RQD vs. Elevation
11.5 Mineralization Modeling
11.5.1 Topography
A topographic model covering the Main Zone area of the Golden Mile property was created by GRCN staff
using aerial photogrammetry collected on October 1, 2021. An Unmanned Aerial Vehicle (UAV) collected
658 high resolution aerial photographs over the Main Zone area at a nominal elevation of 119 m (390 ft)
above ground level (AGL) (Fig. 11.3) and a ground sampling distance (GSD) of 3.3 cm (1.3 in) per pixel.
Cloud based processing was used to generate a high resolution orthomosaic, 3D reconstruction, a dense
point cloud, and a digital elevation model (DEM). The point cloud was converted to a 3D topographic
surface for modeling.
6200
6300
6400
6500
6600
6700
6800
6900
7000
0 20 40 60 80 100
Elev
atio
n (f
t)
RQD %
RQD

2021 INITIAL ASSESSMENT TECHNICAL REPORT SUMMARY FOR THE GOLDEN MILE PROPERTY, NEVADA
135
Figure 11.3 Aerial Photometry with Ground Control Points
On board the UAV global navigation satellite system (GNSS) an electronic compass, barometric sensor,
and inertial measurement unit (IMU) were used to estimate photograph geolocation. Surveyed ground
control points (GCP) were used for indirect georeferencing to WGS84. Table 11.4 lists the GCP geolocation
errors.
Table 11.4 GCP Geolocation Errors
GCP X Error (in) Y Error (in) Z Error (in)
3 0.1575 0.0827 -0.3504
16 0.3307 0.2047 0.0866
19 -0.3268 -0.2913 0.5000
40 -0.1614 0.0039 -0.2323
Total (RMSE) 0.2584 0.1828 0.3295

2021 INITIAL ASSESSMENT TECHNICAL REPORT SUMMARY FOR THE GOLDEN MILE PROPERTY, NEVADA
136
11.5.2 Mineralization Envelopes
Due to the complex nature of the observed grade distribution, a mineralization domain for the Main Zone
was generated using the Leapfrogtm software Radial Basis Function (RBF) interpolent, with a primary
orientation trending northwest to southeast. The RBF interpolant generates a smoothed 3D volume based
on all of the input data.
The Main Zone mineralization domain is constrained by a minimum Au assay grade of 0.34 g/t (0.010 opst)
and where appropriate incorporates lower grade assays. The resulting mineralization system crosses the
Dunlap and Luning Formations and extends slightly into the modeled intrusive units near the contact.
Mineralization domains for the Magnetite Skarn (“MSK”) and the Northwest Skarn were also generated
in Leapfrogtm based on lithological logging. (Fig, 11.4). The resulting mineralization domains were used to
back-tag assay and composite intervals and provide reasonable volume constraints to the Mineral
Resource.
Figure 11.4 3D Isometric View Looking Northwest of the Mineralization Domains.
11.6 Compositing
The average length of assay intervals within the defined mineralization domains is 1.52 m (5.00 ft), with a
mode of 1.52 m (5.00 ft) and a median length of 1.52 m (5.00 ft) (Figure 11.5). Assays were therefore
composited to 1.52 m (5.00 ft) within the defined domains. Where appropriate residual end-of-section
composite lengths less than 0.76 m (2.50 ft) were merged with the adjacent interval. A small number of
missing intervals were assigned a nominal value of 0.00034 g/t Au (0.00001 opst) during compositing.
Main Zone
NW Skarn
MKS

2021 INITIAL ASSESSMENT TECHNICAL REPORT SUMMARY FOR THE GOLDEN MILE PROPERTY, NEVADA
137
Figure 11.5 Plot of Constrained Assay Sample Lengths
11.7 Exploratory Data Analysis
Summary statistics were calculated for the composite sample populations (Table 11.5). The highest gold
values occur in the center of the Main Zone. There is insufficient data available to characterize the silver
sample populations outside of the Main Zone.
Table 11.5 Constrained Composite Statistics for Gold Values
Au Main Zone MSK NW Skarn Total
Mean 1.64 g/t (0.048 opst) 1.40 g/t (0.041 opst) 0.65 g/t (0.019 opst) 1.58 g/t (0.046 opst)
St Dev 5.89 g/t (0.172 opst) 1.58 g/t (0.046 opst) 0.51 g/t (0.015 opst) 5.58 g/t (0.163 opst)
Median 0.51 g/t (0.015 opst) 0.82 g/t (0.024 opst) 0.51 g/t (0.015 opst) 0.51 g/t (0.015 opst)
Minimum 0.00034 g/t (0.00001 opst) 0.03 g/t (0.001 opst) 0.00034 g/t (0.00001 opst) 0.00034 g/t (0.00001 opst)
Maximum 118.70 g/t (3.466 opst) 6.82 g/t (0.199 opst) 2.19 g/t (0.064 opst) 118.70 g/t (3.466 opst)
CoV 3.575 1.109 0.798 3.506
Count 1,166 92 57 1,315
Ag Main Zone MSK NW Skarn Total
Mean 0.55 g/t (0.016 opst) 1.68 g/t (0.049 opst) NA 0.62 g/t (0.018 opst)
St Dev 1.23 g/t (0.036 opst) 3.22 g/t (0.094 opst) NA 1.37 g/t (0.040 opst)
Median 0.21 g/t (0.006 opst) 0.00034 g/t (0.00001 opst) NA 0.21 g/t (0.006 opst)
Minimum 0.00034 g/t (0.00001 opst) 0.00034 g/t (0.00001 opst) NA 0.00034 g/t (0.00001 opst)
Maximum 15.58 g/t (0.455 opst) 17.47 g/t (0.510 opst) NA 17.47 g/t (0.510 opst) CoV 2.283 1.923 NA 2.257
Count 1,166 92 NA 1,258
0
2000
4000
6000
8000
10000
12000
1 2 3 4 5 6 7 8 9 10+
Co
un
t
Length (ft)
Constrained Sample Lengths

2021 INITIAL ASSESSMENT TECHNICAL REPORT SUMMARY FOR THE GOLDEN MILE PROPERTY, NEVADA
138
The gold sample distributions for RC and DDH composites in the Main Zone were also examined for
evidence of bias (Figure 11.6). The results suggest that RC drilling has in general slightly undervalued the
higher-grade diamond drilling (DD) results.
Figure 11.6 RC vs. DDH Drilling Results
11.8 Treatment of Extreme Values
The potential influence of extreme values during estimation was evaluated by grade capping analysis on
the tagged and composited grade intervals in order. The presence of high-grade outliers was identified by
disintegration analysis of the upper tails and examination of histograms and log-probability plots (Fig.
11.7). Composite grades were reduced to the selected threshold prior to estimation. For the Golden Mile
Main Zone, an additional range restriction of 18.3 m (60 ft) was placed on composites equal to the capping
threshold.

2021 INITIAL ASSESSMENT TECHNICAL REPORT SUMMARY FOR THE GOLDEN MILE PROPERTY, NEVADA
139
Figure 11.7 Log-Probability Plots of Composite Capping Thresholds

2021 INITIAL ASSESSMENT TECHNICAL REPORT SUMMARY FOR THE GOLDEN MILE PROPERTY, NEVADA
140
Table 11.6 Capping Thresholds
Au Ag
Cap
Number Capped
Capped Mean
Percent Contribution
Cap Number Capped
Capped Mean
Percent Contribution
Main Zone 17.12 g/t (0.500 opst)
12 1.34 g/t (0.039 opst)
37% 13.70 g/t (0.400 opst)
2 0.55 g/t (0.016 opst)
5%
MSK NA 0 NA NA 13.70 g/t (0.400 opst)
7 1.61 g/t (0.047 opst)
51%
NW Skarn NA 0 NA NA NA 0 NA NA
11.9 Continuity Analysis
Continuity analysis was carried out for the Main Zone on normal-score transformed variograms using
composited Au grade intervals (Figure 11.8). The Main Zone variography suggests a dip range of
approximately 36.6 m (120 ft) and a strike range of approximately 34.1 m (112 ft). A distance of 27.4 m
(90 ft), equal to 75% of the observed range, was selected as a basis for Mineral Resource classification.
Figure 11.8 Main Zone Variography

2021 INITIAL ASSESSMENT TECHNICAL REPORT SUMMARY FOR THE GOLDEN MILE PROPERTY, NEVADA
141
11.10 Block Model
An orthogonal block model was established across the area with the block model limits selected to cover
the extent of the Mineral Resources and accommodate a potential pit shell (Table 11.7). A parent block
size of 4.9 m (16 ft) x 4.9 m (16 ft) x 6.1 m (20 ft) was selected as representative of the pit shell
configuration and selective mining unit.
Table 11.7 Block Model Setup
Origin Offset Block Size Sub-Cell
X 2856700.0 3200 4.9 m (16 ft) 0.3 m (1.0 ft)
Y 14491000.0 4000 4.9 m (16 ft) 0.3 m (1.0 ft)
Z 6000.0 1300 6.1 m (20 ft) 0.3 m (1.0 ft)
The block model contains variables for Au and Ag grade estimation, bulk density, classification and drill
hole spacing. A small amount of historical mining has taken place at Golden Mile. It is considered to be
economically insignificant and was not depleted from the Mineral Resources.
11.11 Estimation and Classification
Inverse Distance Cubed (“ID3”) and Nearest Neighbor (“NN”) estimates were carried out using capped
composites. A minimum of four and a maximum of nine composites were used for estimation, with a
maximum of three composites from a single drill hole. The search ellipsoid oriented parallel with each
defined mineralization domain and extending a maximum of 91.4 m (300 ft) The major and semi-major
axes approximate the average strike and dip directions of the mineralization. Both gold and silver were
modeled and estimated, but Ag is not included in the Mineral Resource due to limited information on this
commodity.
In order to provide a whole block estimate suitable for open pit mine planning and future reserve
reporting, the block model was regularized after estimation to a 4.9 m (16 ft) x 4.9 m (16 ft) x 6.1 m (20
ft) whole block estimate by volume percent and diluted at zero grade.
The relevant factors used in the classification process were:
• Drill hole spacing density,
• Level of confidence in the geological interpretation,
• Observed continuity of mineralization, and
• Direct proximity to a drill hole.
Parent blocks were classified algorithmically by drill hole spacing geometry as follows:

2021 INITIAL ASSESSMENT TECHNICAL REPORT SUMMARY FOR THE GOLDEN MILE PROPERTY, NEVADA
142
• A block was classified as an Indicated Mineral Resource if three or more drillholes used for
estimation are within 27.4 m (90 ft).
• All other estimated blocks are classified as Inferred.
The primary source of uncertainty for Indicated Mineral Resources is the modeling of grade continuity.
The current mineralization envelopes are based on geological mapping, structural logging and
variography, which may change moving forward with additional drilling. The influence of higher-grade
assays on grade continuity has also been mitigated by applying a range restriction of 18.3 m (60 ft) to
composite values of 17.12 g/t (0.500 opst) or higher. Additional uncertainty is associated with the
observed RQD results, which suggest extensive fracture filling, and may bias the estimate in terms of
volume and grade distribution.
The primary source of uncertainty for Inferred Mineral Resources is the extrapolation beyond the drilling.
This has been mitigated by reducing the mineralization envelope beyond current drilling.
An example of a typical cross section showing the drill hole data and modeled mineral-domain envelopes
in in the Main Zone of the Golden Mile property is shown in Figure 11.9.
Figure 11.9 Typical Cross-Section of Golden Mile Main Zone Looking NW Showing Gold Grades (opst)
122 m ( )

2021 INITIAL ASSESSMENT TECHNICAL REPORT SUMMARY FOR THE GOLDEN MILE PROPERTY, NEVADA
143
11.12 Mineral Resource Estimate
GRCN models and estimates Mineral Resources prior to establishing Mineral Reserves. Mineral Resources
at Golden Mile are further defined by GRCN as Mineral Resources within a constraining pit shell and above
a defined cutoff value. Mineral Resources reported herein have been constrained within a Lerchs-
Grossman optimized pit shell and are reported at a cutoff grade of 0.34 g/t (0.010 opst).
Economic parameters used for the cutoff calculation were supplied by GRCN and are derived from unit
costs and recoveries from 2020 operational results at GRCN’s Isabella-Pearl Mine, Nevada (Table 11.8).
The gold price of $1,700 selected by GRCN represents a slightly conservative outlook compared to the 24-
month trailing average of $1,745 per ounce as of September 30, 2021.
The constraining Mineral Resource pit shell was developed by GRCN based on the supplied economic
parameters. The results from the optimized pit shell are used solely for the purpose of reporting Mineral
Resources and include both Indicated and Inferred Mineral Resources (Figure 11.10).
Table 11.8 Parameters Used for Mineral Resources Cutoff Calculation
Description Unit Value
Gold Price $/oz 1,700
Charges % 0.075 Royalty % 3.00
Selling Cost $/oz 37.60
Processing Cost + G&A $/t 11.04
Recovery % 60 Cutoff g/t 0.34
Cutoff opst 0.010
Figure 11.10 3D Isometric View of the Optimized Pit Shell for Golden Mile Deposit

2021 INITIAL ASSESSMENT TECHNICAL REPORT SUMMARY FOR THE GOLDEN MILE PROPERTY, NEVADA
144
Indicated Mineral Resources reported at Golden Mile contain 2.16 million tonnes (2.38 million short tons)
of material at an average gold grade of 1.13 g/t (0.033 opst). Inferred Mineral Resources reported are 2.40
million tonnes (2.64 million short tons) of material at an average gold grade of 1.10 g/t (0.032 opst) (Table
11.9).
Table 11.9 Mineral Resource Inventory at Golden Mile, Mineral County, Nevada, USA (as of September 30, 2021)1 2 3 4
Class Tonnes Short Tons Au (g/t) Au (opst) Au (oz)
Indicated 2,160,000 2,380,000 1.13 0.033 78,500
Inferred 2,400,000 2,640,000 1.10 0.032 84,500 5. Reported at a cutoff of 0.34 g/t Au (0.010 opst).
6. Whole block diluted estimates are reported within an optimized pit shell.
7. Mineral Resources do not have demonstrated economic viability.
8. Totals may not sum exactly due to rounding.
11.13 Mineral Resource Estimate Sensitivity
The sensitivity of the Mineral Resource inventory to changes in cutoff grade was also examined by
summarizing tonnes and grade within the pit shell at varying cutoff grades (Table 11.10).
Table 11.10 Cutoff Grade Sensitivity for the Golden Mile Deposit
Class Cutoff Tonnes Short Tons Au (g/t) Au (opst) Au (oz)
Indicated
0.17 g/t (0.005 opst) 2,630,000 2,900,000 0.99 0.029 84,100
0.34 g/t (0.010 opst) 2,160,000 2,380,000 1.13 0.033 78,500
0.68 g/t (0.020 opst) 1,320,000 1,450,000 1.54 0.045 65,300
1.03 g/t (0.030 opst) 770,000 850,000 2.06 0.060 51,000 1.37 g/t (0.040 opst) 490,000 540,000 2.54 0.074 40,000
1.71 g/t (0.050 opst) 330,000 360,000 3.05 0.089 32,000
Inferred
0.17 g/t (0.005 opst) 2,820,000 3,110,000 0.99 0.029 90,200 0.34 g/t (0.010 opst) 2,400,000 2,640,000 1.10 0.032 84,500
0.68 g/t (0.020 opst) 1,540,000 1,700,000 1.44 0.042 71,400
1.03 g/t (0.030 opst) 910,000 1,000,000 1.85 0.054 54,000
1.37 g/t (0.040 opst) 630,000 690,000 2.16 0.063 43,500 1.71 g/t (0.050 opst) 360,000 400,000 2.61 0.076 30,400

2021 INITIAL ASSESSMENT TECHNICAL REPORT SUMMARY FOR THE GOLDEN MILE PROPERTY, NEVADA
145
11.14 Risk Factors
Relevant factors which may affect the estimation of Mineral Resources include changes to the geological,
geotechnical and geometallurgical models, infill drilling to convert material to a higher classification,
drilling to test for extensions to known Mineral Resources, collection of additional bulk density data and
significant changes to commodity prices. It should be noted that these and other factors pose potential
risks and opportunities, of greater or lesser degree, to the estimate as the model is based on currently
available data. Risks associated with key estimation parameters are tabulated in Table 11.11.
Table 11.11 Mineral Resource Estimation Risk Factors
11.15 Opinion on Adequacy
Mr. F Brown, the QP responsible for Section 11, considers that the GRCN 2020 2021 drilling program
results meet industry standards for drilling and QA/QC measures. Mr. Brown also considers that the
relevant historical drilling results have been reviewed in sufficient detail for inclusion in the generation of
Indicated and Inferred Mineral Resource estimates.
Mr. F Brown believes that all issues relating to relevent technical and economic factors likely to
influence the prospect of economic extraction can be resolved with further work.
Category Description Risk Potential for Adverse
Impact
Database Database Integrity Database combines historical and recent drilling Low Database Database Integrity Database errors Low
Drilling Recovery A wide range of RQD values were logged Medium
Drilling Data Density Sufficient drilling coverage at this stage Low
Drilling Survey Good collar coverage Low
Geology Geological Interpretation An up-to-date geology model is available Low
Model Estimation Industry standard estimation used Low
Model Bulk Density Sufficient samples are available to calculate a global bulk density
Low
Model Grade Continuity Grade continuity is based on drilling coverage and may change due to the nature of the mineralization
Medium
Model Metal At Risk A large proportion of the contained metal is derived from a small number of samples
High
Model Mineralization Fracture style mineralization may overestimate metal content at SMU scale
High
Model Economics Based on current operating costs Low
Model Recoveries Conservative compared to recent met studies Low Sampling Predominantly 5 ft. samples Consistent across DD and RC sampling Low
Sampling Quality of assay data Industry standard use of QAQC Low
Sampling Quality of assay data Some issues with standards noted Low

2021 INITIAL ASSESSMENT TECHNICAL REPORT SUMMARY FOR THE GOLDEN MILE PROPERTY, NEVADA
146
12 MINERAL RESERVE ESTIMATES
Mineral Reserve estimates for the Golden Mile property were not prepared according to the amendments
adopted by the SEC to modernize the property disclosure requirements for mining registrants, and related
guidance, which are currently set forth in Item 102 of Regulation S-K under the Securities Act of 1933
(“Securities Act”) and the Securities Exchange Act of 1934 (“Exchange Act”) and in Industry Guide 7 (SEC,
2018 a, b).
The CRIRSCO framework of applying modifying factors to Mineral Resources reported herein for the
Golden Mile property were not undertaken in order to convert them to Mineral Reserves.

2021 INITIAL ASSESSMENT TECHNICAL REPORT SUMMARY FOR THE GOLDEN MILE PROPERTY, NEVADA
147
13 MINING METHODS
No description of proposed mining methods for the Golden Mile property has been prepared for this TRS.

2021 INITIAL ASSESSMENT TECHNICAL REPORT SUMMARY FOR THE GOLDEN MILE PROPERTY, NEVADA
148
14 PROCESSING AND RECOVERY METHODS
No description of proposed mineral processing and recovery methods for the Golden Mile property has
been prepared for this TRS.

2021 INITIAL ASSESSMENT TECHNICAL REPORT SUMMARY FOR THE GOLDEN MILE PROPERTY, NEVADA
149
15 INFRASTRUCTURE
No description of the required infrastructure for the Golden Mile property has been prepared for this TRS.

2021 INITIAL ASSESSMENT TECHNICAL REPORT SUMMARY FOR THE GOLDEN MILE PROPERTY, NEVADA
150
16 MARKET STUDIES
No description of market studies for the products of the Golden Mile property has been prepared for this
TRS.

2021 INITIAL ASSESSMENT TECHNICAL REPORT SUMMARY FOR THE GOLDEN MILE PROPERTY, NEVADA
151
17 ENVIRONMENTAL STUDIES, PERMITTING, AND PLANS,
NEGOTIATIONS, OR AGREEMENTS WITH LOCAL
INDIVIDUALS OR GROUPS
No description of the factors pertaining to environmental compliance, permitting, and local individuals or
groups, which are related to the Golden Mile property, have been prepared for this TRS.

2021 INITIAL ASSESSMENT TECHNICAL REPORT SUMMARY FOR THE GOLDEN MILE PROPERTY, NEVADA
152
18 CAPITAL AND OPERATING COSTS
No estimates of capital and operating costs for the Golden Mile property have been prepared for this TRS.

2021 INITIAL ASSESSMENT TECHNICAL REPORT SUMMARY FOR THE GOLDEN MILE PROPERTY, NEVADA
153
19 ECONOMIC ANALYSIS
No description of the key assumptions, parameters, and methods used to demonstrate economic viability,
nor material assumptions including discount rates, exchange rates, commodity prices, and taxes, royalties,
and other governmental levies or interests applicable to the Golden Mile property have been prepared
for this TRS.

2021 INITIAL ASSESSMENT TECHNICAL REPORT SUMMARY FOR THE GOLDEN MILE PROPERTY, NEVADA
154
20 ADJACENT PROPERTIES
A recent review of the BLM claim records by the QP’s has been completed. This review indicates that
Registrant-properties and adjacent properties held by competitors which surround the Golden Mile
property are under apparently valid mining claims. Relevant information concerning these properties are
described in this TRS.
20.1 Registrant Properties
GRCN controls additional claims adjoining the Golden Mile property including the Mina Gold property.
GRCN also operates and controls several other properties within a 50 km (31 mi) radius. These properties
include GRCN’s currently operating property, the Isabella Pearl mine, and the East Camp Douglas and
County Line exploration properties (Fig. 20.1).
Figure 20.1 Map of the Properties in the Vicinity of the Golden Mile Property (GRCN properties
highlighted in light blue; Other properties highlighted in dark blue)

2021 INITIAL ASSESSMENT TECHNICAL REPORT SUMMARY FOR THE GOLDEN MILE PROPERTY, NEVADA
155
20.1.1 Mina Gold
GRCN purchased the Mina Gold property from Nevada Select in August 2016. The property is located
approximately 13 km (8 mi) northwest of the Golden Mile property and covers an area of approximately
657 hectares (1,624 acres) consisting of 74 unpatented lode mining claims and 5 patented claims. The
Mina Gold property adjoins the Golden Mile property to the northwest. Gold mineralization at Mina Gold
is hosted by epithermal quartz veins occurring along fault zones in volcanic host rock outcropping at the
surface. Mina Gold has been tested by over 313 historic exploration drill holes which encompass more
than 16,246 m (53,300 ft) of drilling. Historic drill intercepts encountered gold at shallow depths (<60 m;
196 ft) including 7.4 g/t (0.22 opst) gold over 12.2 m (40 ft), 11.8 g/t (0.34 opst) gold over 4.6 m (15 ft)
and 5.0 g/t (0.15 opst) gold over 6.1 m (20 ft). Historic metallurgical reports completed by Legend
Metallurgical Laboratory, Inc. Reno, NV, includes column leach tests at minus 15 cm (6 in) rock returned
80% gold recovery in 60 days. Minus 1.3 cm (0.5 in) rock returned 75% gold recovery in 2 days. The best
gold recoveries will likely require particle agglomeration prior to heap leaching. FGC acquired 100% of the
Mina Gold property from Nevada Select for $1,000,000, which included shares of restricted common stock
valued at $850,000 and cash of $150,000 representing a one-time advanced royalty payment. Nevada
Select retained a 3% NSR royalty on the patented claims and 2% NSR royalty on the unpatented claims.
FGC retained the right to buy down 1% of the NSR royalty on the patented claims for $1,000,000 and 0.5%
of the NSR royalty on the unpatented claims for $500,000.
20.2 Adjacent Properties
The Golden Mile property is situated along strong structural controls and alignments within the Walker
Lane mineral belt which hosts numerous significant epithermal gold and silver deposits. The closest (<90
km; 56 mi) and most significant adjacent properties held by other owner/operators include Santa Fe,
Paradise Peak, Denton-Rawhide, Candelaria and Borealis (Fig. 20.1).
2021 INITIAL ASSESSMENT TECHNICAL REPORT SUMMARY FOR THE GOLDEN MILE PROPERTY, NEVADA
156
21 OTHER RELEVANT DATA AND INFORMATION
GRCN continues to evaluate the known mineralized zones among a much larger conceptual project plan
of multiple open pits along a trend at Golden Mile to the northwest and onto the Mina Gold property.
This includes evaluating the potential of at least three pits feeding ore to a strategically located heap leach
and process facility. The conceptualized process plant is being evaluated to take the gold to the carbon
stage and then haul the carbon for processing at GRCN’s absorption/desorption/recovery (ADR) facility at
Isabella Pearl for final doré production.
There is no other additional information or explanation necessary to provide a complete and balanced
presentation of the value of the property to the registrant. This TRS was prepared to be as understandable
as possible and to not be misleading.

2021 INITIAL ASSESSMENT TECHNICAL REPORT SUMMARY FOR THE GOLDEN MILE PROPERTY, NEVADA
157
22 INTERPRETATION AND CONCLUSIONS
Golden Mile is an advanced exploration property with a favorable economic projection based on Mineral
Resources estimated and reported herein.
22.1 Interpretation
The Golden Mile property is underlain by Triassic, dominantly carbonate Luning Formation, and Jurassic,
dominantly siliciclastic Dunlap Formation. The older Luning Formation is interpreted to be thrust on top
of the younger Dunlap Formation, and both units are folded and faulted into steeply dipping to overturned
beds. The Luning Formation in the property area is largely dolomitic and exposures south of the Road
Fault are unmetamorphosed, dark gray, carbonaceous limestone and fossiliferous micrite. In contrast, the
Dunlap Formation is mostly composed of siltstone and sandstone, which are locally calcareous. The Luning
and Dunlap formations are intruded by several phases of granitoid rocks, mainly granodiorite and a quartz-
feldspar porphyry (Golden Mile Stock), which is interpreted to be related to a skarn event (Ray, 2016).
Meinert (2021) believes that on a district scale, the series of coarse-grained, equigranular quartz
monzonite and granodiorite plutons are likely to be Late Cretaceous, whereas a smaller, porphyritic
granodiorite and quartz monzonite porphyry stocks are likely Tertiary in age. In the northern part of the
property, the older sedimentary and intrusive rocks are unconformably overlain by Tertiary volcanic rocks
that post-date the skarn mineralization.
There are two main types of alteration in the Golden Mile district, hornfels and skarn (Meinert, 2021).
Hornfels is the more extensive alteration type and consists of a biotite alteration of clastic rocks of the
Dunlap Formation. As with most gold skarns, the biotite hornfels likely forms an aureole around the ore
deposit. With increasing alteration intensity, the biotite hornfels is veined and overprinted by pyroxene,
followed by vesuvianite, followed by garnet. This alteration sequence thus forms a bullseye relative to
heat and fluid transfer from the source (Meinert, 2021).
On surface, the most impressive Au-Cu (Fe) exoskarn mineralization is seen at the Main Zone of Golden
Mile. It is characterized by large pods and lenses of massive magnetite which are accompanied by gold,
chalcopyrite, pyrite and variable amounts of Cu and Fe oxides as well as Cu-Fe-Mn wad (Ray, 2016). The
surface mineralization is mainly hosted by garnet-bearing exoskarn that is often quartz-silica-rich with
varying quantities of retrograde alteration, including epidote, chlorite, amphibole, and in the more
dolomitic rocks phlogopite, serpentinite and brucite. Trace quantities of wollastonite and possible very
fine-grained clino-pyroxene were also seen. One notable feature of the skarn is the local presence of
abundant fine to coarse-grained phlogopite that in some parts is spatially associated with magnetite.
Phlogopite is particularly common at the north end of the Main Zone.
All mineralization at Golden Mile occurs within the area that has hornfels formed dominantly from
siliciclastic rocks and skarn alteration formed dominantly from carbonate rocks. From the observed

2021 INITIAL ASSESSMENT TECHNICAL REPORT SUMMARY FOR THE GOLDEN MILE PROPERTY, NEVADA
158
mineralogy, most of the skarn protolith in the Golden Mile district was dolomitic, which results in
magnesian skarn minerals (Meinert, 2021). Because of the dominance of magnesium rather than iron in
the skarn minerals, the excess iron typically forms abundant magnetite, as is observed in the Main Zone
pit. The magnetite is particularly important as a reactant for later, lower temperature Au-bearing fluids.
Only limited calcic skarn has been observed on surface and in drill core.
Most of the high-grade gold mineralization, as confirmed by the oriented core study, appears to be
associated with narrow (<2 cm), NW trending veins and fractures (Butner, 2021). The high-grade veins
consist dominantly of quartz-calcite-chlorite-pyrite-iron oxide +/- envelopes of feldspar and clay. The
identification of dominantly northwest-trending high-grade structures helps to explain lack of correlation
in earlier northwest-directed drill holes. Where these veins encountered reactive alteration mineralogy
such as magnetite or magnesium skarn, the gold mineralization is more disseminated, thus explaining the
Main Zone magnetite-pit mineralization (Meinert, 2021).
22.2 Conclusions
Golden Mile is currently a moderate-sized, mineralized gold (silver-copper-iron) system with potential for
developing gold resources and additional exploration targets. Historic surface and underground rock
sampling, together with previous and current drilling, have defined significant, locally high-grade, gold
values locally in association with magnetite skarn with minor silver-copper mineralization.
Three types of mineralization have been identified at Golden Mile and each could host economic gold
deposits (Ray, 2016). These include: (a) bulk tonnage, open-pit mineable gold hosted within the
endoskarn-altered quartz porphyry (Golden Mile Stock), (b) gold ± copper ± magnetite mineralization
hosted by the garnet-quartz exoskarn envelope developed outboard from the Golden Mile Stock, and (c)
massive sulfide-magnetite replacements or mantos formed distal (up to 1 km or more) from the Golden
Mile Stock thermal aureole.
Lower grade disseminated mineralization occurs in intrusive, limestone, and locally in overlying Tertiary
volcanic rocks. Intercepts of +30 m (100 ft) grading + 0.9 g/t Au (0.025 opst) to 81 m (265 ft) grading +0.5
g/t Au (0.015 opst) have been intersected in numerous drill holes. Alteration includes stockwork veining,
argillic alteration and some silicification. A broad halo of low-grade (>0.1 g/t Au; 0.003 opst) disseminated
gold mineralization envelopes the high-grade mineralization. The drill defined resource is open ended in
nearly all directions.
Column leach test work yielded gold extractions of 80% for coarse composite material (<37.5 mm; 1.48
in) based on calculated heads ranging from 1.639 g/t (0.048 opst) to 1.806 g/t (0.053 opst) Au. Gold
extractions for the fine composite material (9.5 mm; 0.37 in) column leach tests ranged from 51% to 86%
based on calculated heads which ranged from 1.328 g/t (0.039 opst) to 4.506 g/t (0.132 opst) Au. Column
leach test results exhibited rapid leach kinetics with 80 to 90 percent of total recovery occurring in the
first 10 days of leaching.

2021 INITIAL ASSESSMENT TECHNICAL REPORT SUMMARY FOR THE GOLDEN MILE PROPERTY, NEVADA
159
KCA (2021) estimates gold extraction for an ore body based upon the assumption that the ore to be mined
will be similar to the samples tested. KCA normally discounts laboratory gold extractions by two to three
percentage points when estimating field extractions. KCA normally discounts laboratory silver extractions
by three to five percentage points when estimating field recoveries. This assumes a well-managed heap
leach operation, and if agglomeration is required, it is assumed that this process is completed correctly.
Based upon KCA’s experience with mostly clean non-reactive ores, cyanide consumption in production
heaps would be only 25 to 33 percent of the laboratory column test consumptions. For ores containing
high amounts of leachable copper, higher factors should be utilized.
Mineral Resources described herein have been delineated by appropriate drilling and/or sampling to
establish continuity and supports an estimate of tonnage and an average grade of the selected metals.
GRCN has evaluated and performed verification of the Golden Mile drill hole database and considers the
assay data to be adequate for the estimation of the Mineral Resources. The resulting drill hole database
contains 150 unique collar records and 10,962 assay records, broken down by drilling type as:
• RC: 131 reverse circulation drill holes for 14,597 m (47,889 ft)
• DDH: 19 diamond drill holes for 2,843 m (9,327 ft)
Mineral Resources at Golden Mile are further defined within a constraining pit shell and above a defined
cutoff value. Mineral resources reported herein has been constrained within a Lerchs-Grossman
optimized pit shell and are reported at a cutoff grade of 0.34 g/t Au (0.010 opst).
Indicated Mineral Resources reported at Golden Mile contain 2.16 million tonnes (2.38 million short tons)
of material at an average gold grade of 1.13 g/t (0.033 opst). Inferred Mineral Resources reported are 2.40
million tonnes (2.64 million short tons) of material at an average gold grade of 1.10 g/t (0.032 opst). The
modeling and estimation of Mineral Resources presented herein is based on technical data and
information available as of September 30, 2021.
Several factors may affect the estimation of Mineral Resources including changes to the geological,
geotechnical and geometallurgical models. In particular, the resource model showed a large proportion
of the contained metal is derived from a small number of samples and fracture style mineralization may
overestimate metal content at the mining (SMU) scale. Infill drilling to convert material to a higher
classification is recommended to mitigate these risks.

2021 INITIAL ASSESSMENT TECHNICAL REPORT SUMMARY FOR THE GOLDEN MILE PROPERTY, NEVADA
160
23 RECOMMENDATIONS
The QP’s preparing this report for GRCN recommend that the Golden Mile property proceed with a
prefeasibility study to move the property forward to a development decision. The conceptualized plan
being evaluated is open pit mining and heap leaching of the gold deposit, taking the gold to the carbon
stage at Golden Mile, and then hauling the carbon for processing at the parent company’s ADR facility at
its nearby Isabella Pearl mine for final doré production.
Metallurgical testing was recently completed by a third-party process metallurgical services company
specializing in column heap leaching and test results are currently being reviewed. Engineering, base line
and background studies are on-going which include process facility layout, open-pit design and
infrastructure evaluations. Some additional studies are also recommended that may improve value and
optimizations including additional drilling to convert Mineral Resources to Mineral Reserves, and
additional geotechnical studies to possibly steepen pit slopes. Mineralization at Golden Mile remains
open along strike and at depth.
23.1 Proposed Exploration Program
For future exploration, particularly in the vicinity of the Main Zone deposit north of the Road Fault, it will
be important to better understand the structure of the northwest-trending gold-bearing quartz-pyrite-
chlorite veins and the stratigraphy and resulting alteration mineralogy of the Dunlap and Luning
Formations. Investigations would include additional surface mapping to define location and geometry of
carbonate host rocks and preparation of stratigraphic cross-sections to help define the subsurface extent
of the carbonate host rocks, particularly near the granodiorite-quartz feldspar porphyry intrusions.
The intersection of structure, stratigraphy, and alteration appears to control the Au distribution at Golden
Mile. A study of the alteration patterns is likely to show zones that were not tested by previous drilling.
Structure-controlled mineralization is also open at depth and 3D review of structure and alteration would
likely help to define drill areas of deeper carbonatehosted gold mineralized targets. Mineralization
appears to extend north and northwest under post-mineral volcanic cover and additional drilling is also
warranted in this direction.
Metal ratio modeling of the Golden Mile gold mineralized system is recommended. The distribution of
metals in ore deposits is commonly zoned due to gradients in temperature or fluid composition but the
absolute concentration of particular elements can also vary in response to other factors such as structure,
stratigraphy, or host rock composition (Meinert, 2021).
No coherent historic soil sampling has been done on the property. Thus, soil sampling at 100-meter
orthogonal spacing’s should be completed over the area south of the Tertiary volcanic cover. Some

2021 INITIAL ASSESSMENT TECHNICAL REPORT SUMMARY FOR THE GOLDEN MILE PROPERTY, NEVADA
161
reconnaissance soil sampling lines should also be run over the volcanic rocks further north in case there
are post-volcanic fracture zones that may reveal the presence of mineralization at depth.
Geophysical techniques, especially magnetic surveys, have been useful in tracing the granodiorite and
quartz feldspar porphyry intrusions beneath volcanic cover. A series of various geophysical surveys were
completed by several of the previous owners over many years, however none of this data has been
coherently integrated or reviewed in context of modern drilling and geologic setting understanding. An
effort to complete this is warranted.
Additional future work shall also include 1) documenting the stratigraphy of the Dunlap and Luning
Formations, particularly the distribution of magnesian and calcic carbonate units in the Luning Formation,
2) identifying the magnesian skarn mineralogy, especially important is to work out skarn zonation and
evaluating vectors to mineralization, 3) and dating some of the igneous rocks, to obtain U-Pb zircon ages
on the main igneous phases, especially the granodiorite–quartz porphyry phases that appear to be most
closely related to alteration and mineralization, and Ar-Ar ages of amphibole and mica in both igneous
and skarn rocks
The proposed exploration program for the Golden Mile property is shown in Table 23.1. The estimated
cost of the recommended exploration program is $2.5 M. The proposed budget includes for 12,192 m
(40,000 ft) of RC drilling for Mineral Resource expansion and exploration outside of the Main Zone deposit
area.
Table 23.1 Budget for Proposed Exploration at Golden Mile Property
Description Total Cost ($)
Salaries and Wages 120,000
Vacation Days 3,000
Health Insurance 3,000
401K Expense 3,600
Payroll Taxes Employer 12,000
Workers Compensation Insurance 6,000
Contractors Drilling (RC) – 12,192 m (40,000 ft) 1,100,000
Contractors Maintenance 60,000
Contractors Services 200,000
Material Used by Contractors 200,000
Topographical Studies 12,000
Environmental Studies 60,000
Laboratory Assays 500,000
Maintenance Vehicles 600
Software & Licenses (non-cap) 3,000
Consulting Services 60,000
Airfare 1,200
Lodging 12,000 Meals 6,000
Other Travel Expenses 6,000
Gasoline 3,000
Field Supplies and Materials 36,000
Allocation of Labor Costs 90,000
Golden Mile Property Exploration Total 2,497,400

2021 INITIAL ASSESSMENT TECHNICAL REPORT SUMMARY FOR THE GOLDEN MILE PROPERTY, NEVADA
162
23.2 Proposed Technical Studies
Proposed technical studies shall include, but are not limited to, a study of geotechnical requirements for
final pit slope angles to ensure that the most optimal pit slopes are utilized and that proper setbacks are
applied to the dump toes near the final pit crest, and a blasting fragmentation study, open pit and waste
dump designs. Further metallurgical test work is recommended on Golden Mile mineralization to confirm
viability of Heap Leach, Carbon Adsorption/Desorption and Electrowinning gold recovery of oxide and
sulfide Mineral Resources in the Golden Mile Main Zone deposit. This shall also include large column test
work on near-surface Run-of-Mine (ROM) material. A geometallurgical model to further characterize the
Mineral Resources in the Golden Mine deposit and Waste Rock Characterization studies are also
recommended. A hydrologic and mine water source review is on-going and water well drilling, including
monitoring wells, is included in the proposed budget.
A more detailed geotechnical study will also serve to further de-risk the Golden Mile property and could
also lead to improvements. Once core drilling and the geotechnical study have been completed, the open
pit and dump designs should be reviewed and modified, if necessary, to reflect the new geotechnical
information.
Waste Rock Characterization studies will investigate the potential for development of Acid Rock Drainage
and Metal Leaching (ARDML) due to oxidation of sulfide minerals that are unstable under atmospheric
conditions. Upon exposure to oxygen and water, sulfide minerals will oxidize, releasing metals, acidity and
sulfate.
It is also recommended that ore control methodologies be reviewed to determine if fire assaying for blast
holes is more suitable than using cyanide-leach assays. Cyanide leach assays returned for resource drill
holes at Golden Mile have shown to be highly variable and are likely unreliable for grade control purposes.
Recommendations for continued engineering, geotechnical, metallurgical, base line and background
studies at Golden Mile are shown in Table 23.2. The estimated cost of the recommendations total $1.0 M.
Table 23.2 Budget for Proposed Technical Studies at Golden Mile Property
Description Total Cost ($) Core Drilling & Geotechnical Study 300,000
Blasting Fragmentation Study 50,000
Metallurgical Test Work 60,000
Geometallurgical Study 40,000
Waste Rock Characterization 30,000
Hydrogeologic Study 20,000 Water Well Drilling 400,000
Monitor Well Drilling 100,000
Total 1,000,000

2021 INITIAL ASSESSMENT TECHNICAL REPORT SUMMARY FOR THE GOLDEN MILE PROPERTY, NEVADA
163
24 REFERENCES
Albino, G. V. and Boyer, C. I., 1992, Lithologic and structural controls of gold deposits of the Santa Fe
district, Mineral County, Nevada: in Craig, S. D., ed., Structure, Tectonics and Mineralization of the Walker
Lane, Geological Society of Nevada Walker Lane Symposium Proceedings Volume, p. 187-211.
Anderson, E., Berger, B.R., and Miggins, D., 2012, Timing, magnitude and style of Miocene deformation,
west-central Walker Lane belt, Nevada, Lithosphere; v. 4; p. 187-208; Geological Society of America data
repository item # 2012085.
Burtner, G., 2021, Golden Mile Downhole Structural Review, unpublished report for Fortitude Gold
Corporation, 31 p.
Carlson, C. W., Pluhar, C. J., Glen, J. M. G., and Farner, M. J., 2013, Kinematics of the west-central Walker
Lane: Spatially and temporally variable rotations evident in the Late Miocene Stanislaus Group,
Geosphere; online 13, December 2013, 10.1130/GES00955.1; Geological Society of America, p. 22.
Colgan, J. P. Dumitru, T. A., McWilliams, M., and Miller, E. L., 2006, Timing of Cenozoic volcanism and Basin
and Range extension in northwestern Nevada: New constraints from the northern Pine Forest Range,
Geological Society of America Bulletin, January/February 2006; v. 118, no. ½; repository item 2006013, p.
126-139.
Cox, D.P. and Singer, D.A., 1986, U.S. Geological Survey Bulletin 1693: U. S. Geological Survey, Open-File
Report 1693, Model 18b, 282. p.
Dix, R.B., 1982, Cyanide bottle roll tests on Grayhill Exploration bulk samples. Unpublished report of tests
by Kappes Cassidy & Associates for Grayhill Exploration Company.
Doebrich, J.L. and Theodore, T. G. (1996}: Geologic history of the Battle Mountain mining district, Nevada,
and regional controls on the distribution of mineral systems; in Geology and Ore Deposits of the American
Cordillera (A.R. Coyner & P.L. Fahey, eds.) Geol. Soc. Nevada, Reno/Sparks 1, 453-483.
Dunne, K., 2017, Petrography Report, 15 Rock Grab Samples and 6 Drill Core Samples, Golden Mile
Property, Bell Mining District, Mineral County, Nevada. Unpublished report for Kinross Gold USA Inc. 161
p.
Einaudi, M.T., Meinert, L.D., Newberry, R.J., 1981, Skarn deposits. In Seventy-fifth Anniversary Volume,
1906-1980, ECONOMIC GEOLOGY, (B.J. Skinner, ed.). Economic Geology Publishing Co. p. 317-391.
Ferguson, H. G, and Muller, S. W., 1949, Structural geology of the Hawthorne and Tonopah Quadrangles
(a Study of pre-Tertiary rocks and Jurassic diastrophism), Nevada, Department of the Interior U.S.
Geological Survey Professional Paper 216, p. 64.

2021 INITIAL ASSESSMENT TECHNICAL REPORT SUMMARY FOR THE GOLDEN MILE PROPERTY, NEVADA
164
Ferranti, L., Oldow, J. S., Geissman, J. W., and Nell, M. M., 2009, Flattening strain during coordinated slip
on a curved fault array, Rhodes Salt Marsh extensional basin, central Walker Lane, west-central Nevada,
Geological Society of America Special Paper 447, p. 189-213.
Gatchell, B., 1989, Summary Report Golden Mile project. Unpublished report for Battle Mountain
Exploration Company.
Hickey, Robert J.,1992, The Buckhorn Mountain (Crown Jewel) gold skarn deposit, Okanogan County,
Washington; Economic Geology; v. 87; no. 1; p. 125-141.
Hudson, D., 1998, Geology of the Golden Mile Project, Mineral County, Nevada. Unpublished report for
Teck Resources Inc.
Hudson, D., 1999, Petrography of Drill Cuttings from Holes GMT-2 and GMT-3, Golden Mile Project,
Mineral County, Nevada. Unpublished report for Teck Resources Inc.
Jaramillo, S.M., 1975, “J” Claims, Mina, Inter-office correspondence between Standard Slag Company and
Colorado Energy.
Kappes, Cassiday & Associates, 1982, Cyanide Bottle Roll Tests on Grayhill Exploration Bulk Samples,
Internal Company Report for Grayhill Exploration Company, 3p.
Kappes, Cassiday & Associates, 2021, Golden Mile Project Report of Metallurgical Test Work September
2021, Internal Company Report for Fortitude Gold Corp., 168p.
Kern, R.R., 1998, Technical Report, CMA Property, Mineral County, Nevada. Unpublished report for Prism
Resources.
Kinross, 2019, Cedar Mountain Complex, Mineral County, Nevada, Unpublished Internal Report by Kinross
Gold USA Inc., 9 p.
Kuzma, G., 1999, 1999 Summary Report Golden Mile Project. Unpublished Report for Teck Resources Inc.
Meinert, L., 2021, Observations on the Golden Mile Project. Unpublished Report for Fortitude Gold
Corporation, 53 p.
Miskelly, N., 2003, Progress on International Standards for Reporting of Mineral Resources and Reserves
by Norman Miskelly, Chairman, Combined Reserves International Reporting Standards Committee
(CRIRSCO) dated September 20, 2003; 22p.
O'Donnell, M., 2006, Report on the Golden Mile Property, Mineral County, Nevada Technical Report
prepared for Columbus Gold Corporation (formerly Purple Vein Resources Ltd., 109p.
Pegg, C.W., 1988, Golden Mile Gold Property, Bell Mining District, Mineral County, Nevada; Elmwood
Resources, Inc Internal Report, Toronto, Ontario, April 3, 1988.

2021 INITIAL ASSESSMENT TECHNICAL REPORT SUMMARY FOR THE GOLDEN MILE PROPERTY, NEVADA
165
Pullman, S.A, 1983, The Petrography and Petrology of a Portion of the Northern Cedar Mountains, Mineral
County, Nevada, unpublished Master of Science Thesis, University of Nevada, Reno, 139 p.
Ray, G.E., 2016, The Geology & Recommendations for Exploration at the Golden Mile Au-Cu (Fe) Skarn
Property, Nevada. Confidential Report Prepared for Kinross Exploration.
Ristorcelli, S., 2006, Summary review of Golden Mile Project, Mineral County, Nevada. Unpublished
Report by Mine Development Associates to Andy Wallace, Cordex Exploration Co., 7p.
Roscan, 2011, Golden Mile Project Summary Drill Report, August 2011, unpublished private company
report, 11 p
Ross, D.C., 1961, Geology and Mineral Deposits of Mineral County, Nevada: Nevada Bureau of Mines and
Geology, Report No. 27.
SEC, 1992, Industry Guide 7: Description of property by issuers engaged or to be engaged in significant
mining operations. Release No. FR-39, July 30, 1992, effective August 13, 1992, 57 Federal Register 36442.
SEC, 2018a, Securities and Exchange Commission (SEC) 17 CFR Parts 229, 230, 239, and 249, RIN 3235-
AL81, Modernization of Property Disclosures for Mining Registrants, Final Rule; 453 pgs.
SEC, 2018b, Securities and Exchange Commission (SEC) Adopts Rules to Modernize Property Disclosures
Required for Mining Registrants, Press Release (Release Nos. 33-10570; 34-84509; File No. S7-10-16)
Dated October 31, 2018; 3 pgs.
Suda, R.U. (2009): Technical report on the Golden Mile Project. For Portage Minerals Inc., November 16th
2009, 47 pages.
Tingley, S. L., 1999, Generalized geologic map of Nevada, Nevada Bureau of Mines and Geology Map 57,
Million-Scale, Education Series 30, small print map E30.
Vanderburg, W.O., 1937, Reconnaissance of Mining Districts in Mineral County. US Bureau of Mines
Information Circular 6941, p. 17 - 22.
Wikipedia website, viewed 01 August 2021, https://en.wikipedia.org
Wright, J.L., 2017, Golden Mile Property Geophysical Compilation VTEM Survey. Unpublished Report for
Kinross Exploration.
Wright, J.L., 2018, Golden Mile Property Gravity & Induced Polarization Surveys GIS Database.
Unpublished Report for Kinross Exploration.

2021 INITIAL ASSESSMENT TECHNICAL REPORT SUMMARY FOR THE GOLDEN MILE PROPERTY, NEVADA
166
25 RELIANCE ON INFORMATION PROVIDED BY THE
REGISTRANT
Preparation of this TRS has relied on information provided by the registrant for matters discussed herein.
This TRS was prepared to be as understandable as possible and to not be misleading.

2021 INITIAL ASSESSMENT TECHNICAL REPORT SUMMARY FOR THE GOLDEN MILE PROPERTY, NEVADA
167
APPENDIX A: GLOSSARY
A.1 Definition of Terms
The following terms used in this report shall have the following meanings:
Adit: Horizontal drive into a hill that is usually driven for the purpose of intersecting or mining an
ore body. An adit may also be driven into a hill to intersect or connect a shaft for the purpose of dewatering. Adits were commonly driven on a slight incline to enable loaded mine trucks to have the advantage of a downhill run out, while the empty (lighter) truck was pushed uphill back into the hill. The incline also allows water to drain out of the adit. An adit only becomes a tunnel if it comes out again on the hill somewhere, like a train tunnel.
Andesite: An extrusive igneous, volcanic rock, of intermediate composition, with aphanitic to porphyritic texture characteristic of subduction zones (eg. western margin of South America).
Doré: Unrefined gold and silver bars usually containing more than 90% precious metal. Epithermal: Used to describe gold deposits found on or just below the surface close to vents or
volcanoes, formed at low temperature and pressure. Gram:
A metric unit of weight and mass, equal to 1/1000th of a kilogram. One gram equals .035 ounces. One ounce equals 31.1035 grams.
Hectare: Another metric unit of measurement, for surface area. One hectare equals 1/200th of a square kilometer, 10,000 square meters, or 2.47 acres. A hectare is approximately the size of a soccer field.
Hornfels:
Fine-grained metamorphic rock formed by the contact between mudstone/shale, or other clay-rich rock, and a hot igneous body at a shallow depth. Typically show little sign of the action of directed pressure and crystals display little orientation.
Kilometer: Another metric unit of measurement, for distance. The prefix “kilo” means 1000, so one
kilometer equals 1,000 meters, one kilometer equals 3,280.84 feet, which equals 1,093.6 yards, which equals 0.6214 miles.
Mineral Resources: Mineral Resources are a concentration or occurrence of material of intrinsic economic interest in or on the Earth’s crust (a deposit) in such form, grade or quality, and quantity that there are reasonable prospects for eventual economic extraction. The location, quantity, grade, geological characteristics and continuity of a Mineral Resource are known, estimated or interpreted from specific geological evidence and knowledge. Mineral Resources are sub-divided, in order of increasing geological confidence, into Inferred, Indicated and Measured categories. Portions of a deposit that do not have reasonable prospects for eventual economic extraction must not be included in a Mineral Resource.
Net Smelter Return Royalty:
A share of the net revenue generated from the sale of metal produced by the mine. Usage-based payments made by one party (the “licensee”) to another (the “licensor”) for the right to ongoing use of an asset, sometimes called an intellectual property. Typically agreed upon as a percentage of gross or net revenues derived from the use of an asset or a fixed price per unit sold.
Ore or Ore Deposit: Rocks that contain economic amounts of minerals in them and that are expected to be profitably mined.
Silicified: Is combined or impregnated with silicon or silica. Skarn Lime-bearing siliceous rock produced by the metamorphic alteration of limestone or
dolomite.

2021 INITIAL ASSESSMENT TECHNICAL REPORT SUMMARY FOR THE GOLDEN MILE PROPERTY, NEVADA
168
Tonne: A metric ton. One tonne equals 1000 kg. It is approximately equal to 2,204.62 pounds.
VulcanTM: Maptek-Vulcan 3D geology and mining modeling software program
Conversion Table
Metric System Imperial System
1 meter (m) 3.2808 feet (ft)
1 kilometer (km) 0.6214 mile (mi)
1 square kilometer (km2) 0.3861 square mile (mi2) 1 square kilometer (km2) 100 hectares (has)
1 hectare (ha) 2.471 acres (ac)
1 gram (g) 0.0322 troy ounce (oz)
1 kilogram (kg) 2.2046 pounds (lbs)
1 tonne (t) 1.1023 short tons (T)
1 gram/tonne (g/t) 0.0292 ounce/ton (oz/t)
Unless stated otherwise, all measurements reported here are metric and currencies are expressed in constant U.S.
dollars.
A.2 Abbreviations
Other common abbreviations encountered in the text of this report are listed below:
˚C degree Centigrade
AA atomic absorption
AAL American Assay Laboratories, Inc.
AAS Atomic Absorption Spectroscopy
ADR Absorption/Desorption/Recovery
Ag Silver
ALS ALS Chemex and/or ALS USA Inc.
Au Gold
BLM Bureau of Land Management
Bureau Veritas Bureau Veritas Mineral Laboratories
Chemex ALS Chemex and./or ALS USA Inc.
cm centimeter
core diamond core-drilling method
Cu copper
DDH Diamond Drill (Core)Hole

2021 INITIAL ASSESSMENT TECHNICAL REPORT SUMMARY FOR THE GOLDEN MILE PROPERTY, NEVADA
169
EA Environmental Assessment
EPA Environmental Protection Agency
FA Fire Assay
FAAS Fire assay with an atomic absorption finish
FGC Fortitude Gold Corporation
ft or (‘) feet = 0.3048 metre
gms Au/MT grams of gold/metric tonne
g/t gram/metric tonne
g/t Au grams of gold per metric tonne
g gram(s) = 0.001 kg
GIS Geographic Information System
gpm gallons per minute
GPS Global Positioning System
GRCN GRC Nevada Inc.
ha hectare(s)
Hazen Hazen Research Inc.
in or (“) inch, 2.54 cm = 25.4 mm
K-Ar Potassium-Argon (referring to age date technique)
KCA Kappes, Cassiday & Associates
kg kilogram, or kg/t (kilogram per tonne)
km kilometer
lb pound
l liter
LOM Life-of-Mine
m meter
M Million U.S. Dollars
Ma million years age
masl meters above sea level
MDA Mine Development Associates
mean arithmetic average of group of samples
μm microns
mi mile
mm millimeter
MSHA Mine Safety and Health Administration
NDWR Nevada Division of Water Resources
NEPA National Environmental Policy Act
NI 43-101 Canadian Securities Administrators’ National Instrument 43-101
NSR Net Smelter Return
Opst Ounces per short ton
Ounce Troy ounce, or 31.1035 g
oz. ounce
P80 3/4” 80% passing a ¾” screen
P100 3/8” 100% passing a 3/8” screen
Pb lead
POO Plan of Operations
ppb parts per billion
ppm parts per million = g/t
RC reverse-circulation drilling method
ROM Run-of-Mine
RQD Rock Quality Designation
QA/QC Quality Assurance/Quality Control

2021 INITIAL ASSESSMENT TECHNICAL REPORT SUMMARY FOR THE GOLDEN MILE PROPERTY, NEVADA
170
QP Qualified Person
SEC Securities Exchange Commission
SRM Standard Reference Material
t, tonne metric tonne = 1.1023 short tons
T, Ton Imperial or short ton
Tpd, or tpd tonnes per day
USDA US Department of Agriculture
USFWS US Fish & Wildlife Service
USGS US Geological Survey
$ US Dollars
wt weight
Zn zinc

2021 INITIAL ASSESSMENT TECHNICAL REPORT SUMMARY FOR THE GOLDEN MILE PROPERTY, NEVADA
171
APPENDIX B: CERTIFICATES OF QUALIFIED PERSONS
FRED H. BROWN, P.GEO. I, Fred H. Brown, do hereby certify that: 1. I have worked as a geologist continuously since my graduation from university in 1987. 2. This certificate applies to the TRS titled “Initial Assessment Technical Report Summary for the Golden Mile Property, Mineral County, Nevada” (the “TRS”), with an effective date of September 30, 2021. 3. I graduated with a Bachelor of Science degree in Geology from New Mexico State University in 1987. I obtained a Graduate Diploma in Engineering (Mining) in 1997 from the University of the Witwatersrand and a Master of Science in Engineering (Civil) from the University of the Witwatersrand in 2005. I am registered with the Association of Professional Engineers and Geoscientists of British Columbia as a Professional Geoscientist (#171602) and the Society for Mining, Metallurgy and Exploration as a Registered Member (#4152172). 4. I am currently self-employed as a Consulting Geologist specializing in Mineral Resource estimates. 5. I certify that by reason of my education, affiliation with a professional organization and past relevant work experience, I fulfill the requirements to be a “qualified person”.
My relevant experience for the purpose of the TRS is: Underground Mine Geologist, Freegold Mine, AAC .................................................................. 1987-1995 Mineral Resource Manager, Vaal Reefs Mine, Anglogold.......................................................... 1995-1997 Resident Geologist, Venetia Mine, De Beers ............................................................................. 1997-2000 Chief Geologist, De Beers Consolidated Mines .......................................................................... 2000-2004 Consulting Geologist .................................................................................................................. 2004-2017 Senior Resource Geologist, GRCN …………………………………………………………………………………………. 2017-2021 Consulting Geologist .................................................................................................................. Present 6. I am a co-author of this TRS and specifically responsible for Section 11 and contributed to parts of Sections 8 and 9. Effective Date: September 30, 2021 {SIGNED} [Fred H. Brown] _______________________________ Fred H. Brown, P.Geo
2021 INITIAL ASSESSMENT TECHNICAL REPORT SUMMARY FOR THE GOLDEN MILE PROPERTY, NEVADA
172
BARRY D. DEVLIN, P.GEO. I, Barry D. Devlin, do hereby certify that: 1. I have worked as a geologist continuously since my graduation from university in 1981. 2. This certificate applies to the TRS titled “Initial Assessment Technical Report Summary for the Golden Mile Property, Mineral County, Nevada” (the “TRS”), with an effective date of September 30, 2021. . 3. I graduated with a Bachelor of Science degree with honors in Geology in 1981 and a Masters in Geology, 1987, from the University of British Columbia, Vancouver Canada. I am registered with the Association of Professional Engineers and Geoscientists of British Columbia as a Professional Geoscientist (#109658). 4. I am currently employed as Vice President, Exploration with Gold Resource Corporation, a Colorado corporation. 5. I certify that by reason of my education, affiliation with a professional organization and past relevant work experience, I fulfill the requirements to be a “qualified person”. My relevant experience for the purpose of the TRS is: Project Geologist, U.S. Borax & Chemical Corp...............................................................................1981-1984 Project Geologist, Derry, Michener, Booth & Wahl/Dolly Varden Minerals…………...…………………….1985-1986 Chief Mine Geologist, Total Erickson Resources Ltd................................................................................1987 Senior Project Geologist, Welcome North Mines Ltd.....................................................................1988-1989 Chief Mine Geologist/District Geologist/Exploration Manager, Hecla Mining Company...….1990-April 2007 Vice President, Exploration, Endeavour Silver Corp.…………………………………………May 2007-December 2012 Vice President, Exploration, Gold Resource Corp………………………………………….January 2013-February 2021 Vice President, Exploration, Fortitude Gold Corp………………………………………………………March 2021-Present
6. I am a co-author of this TRS and specifically responsible for Sections 1, 2, 3, 4, 5, 21, 24, 25 and contributed to parts of Sections 6, 7, 20, 22 and 23. Effective Date: September 30, 2021 {SIGNED} [Barry D. Devlin] _______________________________ Barry D. Devlin, P.Geo

2021 INITIAL ASSESSMENT TECHNICAL REPORT SUMMARY FOR THE GOLDEN MILE PROPERTY, NEVADA
173
JOY L. LESTER, SME-RM I, Joy L. Lester, do hereby certify that: 1. I have worked as a geologist continuously since my graduation from university in 1996. 2. This certificate applies to the TRS titled “Initial Assessment Technical Report Summary for the Golden Mile Property, Mineral County, Nevada” (the “TRS”), with an effective date of September 30, 2021. 3. I graduated with a Bachelor of Science degree in Geology from the South Dakota School of Mines and Technology in 1996. I obtained a Master of Science degree in Geology from the South Dakota School of Mines and Technology in 2004. 4. I am registered with the Society for Mining, Metallurgy and Exploration; Registered Member #4119722RM. 5. I am currently employed as Chief Geologist with Fortitude Gold Corporation, a Colorado corporation. 6. I certify that by reason of my education, affiliation with a professional organization, and past relevant work experience, I fulfill the requirements to be a “qualified person”. My relevant experience for the purpose of the TRS is: Exploration Geologist, Gold Reserve Inc. Km 88, Venezuela, Exploration site......................………..1996-1999 Exploration Geologist, Hecla Venezuela, La Camorra Mine…………………………………………………………2002-2004 Exploration Geologist, Patagonia Gold S.A, Lomada Leiva and Cap Oeste Mines...........................2004-2008 Senior Exploration Geologist/Project Manager Landore Resources Ltd., Ontario, Canada………….2008-2012 Consultant Geologist, Exploration, Gold Resource Corp. El Aguila Mine, Oaxaca Mex…………………2013-2014 Chief Geologist, Gold Resource Corp., Nevada and El Aguila Mine Oaxaca Mexico……………………..2014-2020 Chief Geologist, Fortitude Gold Corp., Nevada………………………………………………………………………2021-Present 6. I am a co-author of this TRS and specifically responsible for Sections 6, 7 and contributed to parts of Sections 20, 22 and 23. Effective Date: September 30, 2021 {SIGNED} [Joy L. Lester] _______________________________ Joy Lester, P.Geo
Copyright © 2022 FDOKUMEN