
NAVAL POSTGRADUATE SCHOOL TECHNICAL REPORT
380
NAVAL POSTGRADUATE SCHOOL MONTEREY, CALIFORNIA TECHNICAL REPORT Joint ACCESS: High-Speed Assault Connector (HSAC) for Amphibious Seabasing Operations and Joint Expeditionary Logistics by Student Members LTjg Kivanc Anil, Turkish Navy LT Timothy King, USNR LTjg Mehmet Avcu, Turkish Navy LT Steven Peace, USN LT Jon Brisar, USNR LCDR Francisco Perez-Villalonga, Spanish Navy LTjg Adnen Chaabane, Tunisian Navy LT Derek Peterson, USNR LTjg Sotirios Dimas, Hellenic Navy LT Rolando Reuse, Chilean Navy LT Matt Harding, USN LT Scott Roberts, USN Faculty Members Fotis Papoulias Robert Harney December 2004 Approved for public release, distribution unlimited
-
Upload
khangminh22 -
Category
Documents
-
view
2 -
download
0
Transcript of NAVAL POSTGRADUATE SCHOOL TECHNICAL REPORT

NAVAL
POSTGRADUATE SCHOOL
MONTEREY, CALIFORNIA
TECHNICAL REPORT
Joint ACCESS: High-Speed Assault Connector (HSAC) for Amphibious Seabasing
Operations and Joint Expeditionary Logistics by
Student Members
LTjg Kivanc Anil, Turkish Navy LT Timothy King, USNR LTjg Mehmet Avcu, Turkish Navy LT Steven Peace, USN LT Jon Brisar, USNR LCDR Francisco Perez-Villalonga,
Spanish Navy LTjg Adnen Chaabane, Tunisian Navy LT Derek Peterson, USNR LTjg Sotirios Dimas, Hellenic Navy LT Rolando Reuse, Chilean Navy LT Matt Harding, USN LT Scott Roberts, USN
Faculty Members Fotis Papoulias Robert Harney
December 2004
Approved for public release, distribution unlimited

THIS PAGE INTENTIONALLY LEFT BLANK
i
REPORT DOCUMENTATION PAGE Form Approved OMB No. 0704-0188
Public reporting burden for this collection of information is estimated to average 1 hour per response, including the time for reviewing instruction, searching existing data sources, gathering and maintaining the data needed, and completing and reviewing the collection of information. Send comments regarding this burden estimate or any other aspect of this collection of information, including suggestions for reducing this burden, to Washington headquarters Services, Directorate for Information Operations and Reports, 1215 Jefferson Davis Highway, Suite 1204, Arlington, VA 22202-4302, and to the Office of Management and Budget, Paperwork Reduction Project (0704-0188) Washington DC 20503. 1. AGENCY USE ONLY (Leave blank)
2. REPORT DATE December 2004
3. REPORT TYPE AND DATES COVERED Technical Report
4. TITLE AND SUBTITLE: Joint ACCESS: High Speed Assault Connector (HSAC) for Amphibious Seabasing Operations and Joint Expeditionary Logistics 6. AUTHOR(S) LTjg Kivanc Anil, LTjg Mehment Avcu, LT Jon Brisar, LTjg Adnen Chaabane, LTjg Sotirios Dimas, LT Matt Harding, LT Timothy King, LT Steven Peace, LCDR Francisco Perez-Villalonga, LT Derek Peterson, LT Rolando Reuse, LT Scott Roberts, Dr. Robert Harney, Dr. Fotis Papoulias.
5. FUNDING NUMBERS
7. PERFORMING ORGANIZATION NAME(S) AND ADDRESS(ES) Naval Postgraduate School Monterey, CA 93943-5000
8. PERFORMING ORGANIZATION REPORT NUMBER
9. SPONSORING /MONITORING AGENCY NAME(S) AND ADDRESS(ES) N/A
10. SPONSORING/MONITORING AGENCY REPORT NUMBER
11. SUPPLEMENTARY NOTES The views expressed in this thesis are those of the author and do not reflect the official policy or position of the Department of Defense or the U.S. Government. 12a. DISTRIBUTION / AVAILABILITY STATEMENT Approved for public release, distribution unlimited
12b. DISTRIBUTION CODE
13. ABSTRACT (maximum 200 words) The current notion of seabasing requires that three Battalion Landing Teams (BLT) of a 2025 Joint Expeditionary Brigade (JEB) need to be able to transit from the Sea Base to the objective within a 10 hour period. Of the three BLTs, two of them must be transported by surface craft a distance of no more than 200nm in sea state 4 or less. The two surface bound BLTs need to be loaded onto the transporting craft and delivered to shore, whether it is a port facility or austere beachhead. There is no current or future system of connectors to meet all the time-distance, sea state, and interface flexibility requirements for this aspect of seabasing. To meet these requirements a High Speed Assault Connector (HSAC) is needed which either augments current or replaces existing connector platforms to deliver and support the required forces ashore. The Joint ACCESS is a HSAC that brings the necessary speed, payload capacity, interface capability, and mission flexibility needed to fill the Sea Base to shore transportation gap. With a maximum speed of 43kts and payload capacity of 800LT, 12 Joint ACCESS trimarans can transit 200nm and fully offload in 7 hours. Its beachable design uses a floating bow ramp to reach out to austere beaches, while its combat system suite provides self defense in addition to robust offensive capabilities.
15. NUMBER OF PAGES
14. SUBJECT TERMS Ship Design, Total Ship Systems Engineering, High Speed Assault Connector, HSAC, Seabasing, Sea Base, Battalion Landing Team, BLT, Joint Expeditionary Brigade, JEB
16. PRICE CODE
17. SECURITY CLASSIFICATION OF REPORT
Unclassified
18. SECURITY CLASSIFICATION OF THIS PAGE
Unclassified
19. SECURITY CLASSIFICATION OF ABSTRACT
Unclassified
20. LIMITATION OF ABSTRACT
UL
NSN 7540-01-280-5500 Standard Form 298 (Rev. 2-89) Prescribed by ANSI Std. 239-18

ii
THIS PAGE INTENTIONALLY LEFT BLANK

iii
ABSTRACT The current notion of seabasing requires that three
Battalion Landing Teams (BLT) of a 2025 Joint Expeditionary
Brigade (JEB) need to be able to transit from the Sea Base
to the objective within a 10 hour period. Of the three
BLTs, two of them must be transported by surface craft a
distance of no more than 200nm in sea state 4 or less. The
two surface bound BLTs need to be loaded onto the
transporting craft and delivered to shore, whether it is a
port facility or austere beachhead. There is no current or
future system of connectors to meet all the time-distance,
sea state, and interface flexibility requirements for this
aspect of seabasing. To meet these requirements a High
Speed Assault Connector (HSAC) is needed which either
augments current or replaces existing connector platforms
to deliver and support the required forces ashore. The
Joint ACCESS is a HSAC that brings the necessary speed,
payload capacity, interface capability, and mission
flexibility needed to fill the Sea Base to shore
transportation gap. With a maximum speed of 43kts and
payload capacity of 800LT, 12 Joint ACCESS trimaran can
transit 200nm and fully offload in 7 hours. Its beachable
design uses a floating bow ramp to reach out to austere
beaches, while its combat system suite provides self
defense in addition to robust offensive capabilities.

iv
TABLE OF CONTENTS
I. INTRODUCTION ............................................1 II. JOINT EXPEDITIONARY LOGISTICS OVERVIEW ..................3
A. OPERATIONAL CONCEPT ................................3 1. Objective .....................................3 2. Overview ......................................3 3. Expeditionary Forces ..........................5
B. JOINT EXPEDITIONARY OPERATION PHASES ...............6 1. Pre-crisis ....................................6 2. Closure .......................................7 3. Sustainment ...................................8 4. Phased Based Logistics ........................9
C. JOINT EXPEDITIONARY LOGISTICS EMPLOYMENT ..........10 II. DEFINING THE REQUIREMENTS ..............................13
A. INITIAL REQUIREMENTS ..............................13 B. REQUIREMENT DEVELOPMENT ...........................14
1. Defining the Operating Environment ...........14 2. Detailed Requirement Development .............16
a. Ship Capabilities and Characteristics. ..16 b. Combat System Capabilities. .............17 c. Payload Interfacing. ....................17
3. Final Development ............................18 III. ANALYSIS OF ALTERNATIVES ...............................21
A. GENERATION OF MEASURES OF PERFORMANCE .............21 1. Flexibility ..................................21 2. Survivability ................................22 3. Transport Factor .............................22 4. Overall measure of performance ...............24
B. ANALYSIS OF ALTERNATIVES TOOL .....................24 1. Overview of the MIT Spreadsheets Tool ........25 2. Modification of the MIT Tool .................25
C. ANALYSIS OF ALTERNATIVES PHILOSOPHY ...............26 1. Possible Designs .............................26 2. Design Selection Tests .......................27 3. Design Selection Results .....................29
a. Modified cost model .....................29 b. Final selection .........................31
D. SUMMARY ...........................................33 E. BEACHABLE VS. NON-BEACHABLE FEASIBILITY STUDY .....34 F. REFERENCES ........................................37
IV DESIGN PROCESS .........................................39

v
A. CARGO DESIGN ......................................39 1. Establishing the Cargo Parameters ............39 2. Cargo Load Plan Development ..................39 3. Cargo Deck Design ............................42 4. Vehicle Models ...............................47 5. Stern Gate Design ............................49 6. Bow Ramp .....................................51 7. Bow Doors ....................................56 8. Flight Deck and Flight Elevator Design .......60 9. References ...................................62
B. HULL DESIGN .......................................62 1. Design Process ...............................62 2. Type .........................................64
a. Monohull ................................66 b. Trimaran ................................67 c. Catamaran ...............................69 d. SES .....................................70
3. Selection ....................................70 4. Dimensions ...................................71 5. Length/Beam Ratio (L/B) ......................72 6. Froude Number (Fn) ...........................72 7. Cargo Ratio ..................................73 8. Center Hull Form .............................74
a. Alternative A ...........................74 b. Alternative C ...........................75 C. Alternative B ...........................75
9. Draft ........................................76 10. Side Hull Form ...............................76 11. Resistance ...................................79 12. Deck Layout ..................................81 13. Tankage ......................................82 14. Structure ....................................83
a. First Estimate ..........................83 b. Detailed Calculations ...................84 c. Structural Weight .......................86 d. Longitudinal Strength ...................86
15. Hull Calculations ............................87 C. COMBAT SYSTEM DESIGN ..............................88
1. Mission need statement .......................88 a. Background ..............................89 b. Mission .................................89
2. Operational Requirements .....................89 a. Description of Proposed System ..........89 b. Operational and Support Concept .........90 c. Threat Environment ......................91
vi
d. Expanded Sensor Operations/Ballistic Missile Defense .........................92
3. Statement of Work ............................92 a. Objective ...............................92 b. Tasks ...................................93
4. Ship Self Protection System Overview .........94 a. System Overview .........................94 b. Design Philosophy: ......................95 c. Threat Analysis .........................97
5. EW suite: ...................................100 a. Radar Warning Receiver ................101 b. Radio Frequency Jammer ................102 c. Missile Approach Warning System ........103 d. Directed Infrared Countermeasures
(DIRCM) ................................104 e. Chaff/Flare/Decoy Dispenser ............105
6. Sensors Suite: ..............................107 a. Multi-Function Radar ...................107 b. Cooperative Engagement Capability ......109 c. Navigation radar .......................110 d. EO system: .............................112
7. Shipboard Weapon Systems: ...................113 a. Evolved Sea Sparrow Missile (ESSM) .....113 b. Small caliber Gun System ...............115 c. High Power Microwave Active Denial
System .................................116 d. Twin M240C Mounted Machine Gun .........117
8. Final System Overview .......................118 9. Combat Engagement Flow ......................119
a. Air Defense ............................119 b. Surface Engagements ....................120 c. Subsurface warfare .....................121
10. Reliability .................................122 a. Definition .............................122 b. Reliability Prediction Analysis ........122 c. Reliability Analysis (Methods) .........123
11. Availability and Cost Effectiveness .........124 a. Operational Availability ...............124 b. Achieved Availability ..................124 c. Inherent Availability ..................124 d. System Effectiveness ...................125 e. Cost Effectiveness .....................125
12. Maintainability .............................125 a. Organizational Maintenance .............125 b. Intermediate Maintenance ...............125 c. Depot Maintenance ......................126

vii
d. Modular Design .........................126 13. Risk Management: ............................126
a. Purpose ................................126 b. Definition .............................126 c. Components of risk .....................127 d. Phases .................................127 e. Risk Management Plan for the HSAC ......128
14. Survivability Analysis ......................128 15. RCS Calculations ............................130
a. Empirical Method: ......................131 b. POFACETS Method: .......................131 d. Xpatch results: ........................133
16. References ..................................134 D. PROPULSION .......................................135
1. Propulsion Plant Analysis ...................135 a. Propulsion Plant Trade Off Analysis ....135 b. Conventional Steam Plant ...............136 c. Nuclear Steam Plant ....................136 d. Fuel Cells .............................137 e. Diesels ................................137 f. Gas Turbines ...........................137
2. Gas Turbine Comparisons .....................138 a. ICR WR21 ...............................138 b. MT30 TRENT .............................139 c. LM 2500 ................................139 d. LM 2500+ ...............................140 e. LM 1600 ................................141 f. LM 6000 ................................141
3. Electric Propulsion Motor Trade Off Analysis 148 a. DC Superconducting Homo-Polar Motor ....149 b. HTS AC Synchronous Motor ...............150
4. Propulsor Trade Off Analysis ................152 a. Propeller ..............................152 b. Podded Propulsors ......................152 c. Conventional Water Jets ................153 d. Bird-Johnson AWJ-21 ....................153
E. ELECTRICAL DISTRIBUTION ..........................156 1. Distribution Design Analysis ................156 2. Actual Distribution .........................157 3. References ..................................159
F. DAMAGE CONTROL ...................................159 1. Detectors ...................................160 2. Installed Detector Descriptions. ............163
a. Smoke Detectors ........................163 b. Carbon Monoxide Detectors ..............164 c. Fire/Flame Detectors ...................165

viii
d. Closed Circuit Smoke and Flame Detection System .......................166
e. Heat Detectors .........................167 f. Smart Microsensors .....................170 g. Humidity Detectors .....................171 h. Liquid Level Detectors .................171 i. Conclusions ............................172
3. Installed Firefighting Systems ..............172 a. Installed Firefighting System
Descriptions ...........................174 b. Other Considerations ...................177
4. Chemical, Biological and Radiation (CBR) System ......................................178
5. Personal Locator Device (PLD) ..............179 6. Crew Egression ..............................179 7. Ship Numbering System .......................180 8. Battle Stations .............................180 9. Conditions of Readiness .....................181 10. Damage Control Total Ship Survivability ....181
a. Ship's Priorities ......................181 11. Introduction to Firefighting ................182 12. References ..................................183
G. HABITABILITY .....................................184 1. References ..................................190
H. REDUCED MANNING ANALYSIS .........................190 1. References ..................................197
I. ENVIRONMENTAL CONCERNS ...........................197 1. Oil-Water Separators ........................197 2. CHT System ..................................198
a. Transfer element .........................198 b. Holding Element ..........................198 c. Collecting Element .......................199
1. References ..................................199 J. COST AND WEIGHT ESTIMATION .......................200
V. DESIGN EVALUATION .....................................203 A. PRIMARY MISSION EVALUATION .......................204 B. SECONDARY MISSIONS ...............................205
1. Special Operations Support ..................205 2. Embassy and High Asset Reinforcement ........206 3. Humanitarian Assistance/Disaster Relief .....206 4. Theater Security Cooperation ................207 5. Maritime Interdiction .......................207
C. CONCLUSION .......................................207 APPENDIX I 2004 TSSE PROJECT GUIDANCE ..................209 APPENDIX II MISSION NEEDS STATEMENT .....................215
ix
APPENDIX III REQUIREMENT GENERATION ......................217 A. SHIP CHARACTERISTIC REQUIREMENTS .................217 B. COMBAT SYSTEM REQUIREMENTS .......................218 C. PAYLOAD INTERFACING REQUIREMENTS .................219 D. ANALYTIC HIERARCHY PROCESS (AHP) REQUIREMENT
GENERATION .......................................220 E. FINAL OPERATIONAL AND FUNCTIONAL REQUIREMENTS ....221
APPENDIX IV ANALYSIS OF ALTERNATIVE DATA ................223 A. OVERALL MOP RESULTS FOR ALL COMBINATIONS .........223 B. MOP RESULTS OF THE MEDIUM SIZE SHIPS .............223 C. COST MODEL .......................................224 D. COST CALCULATION .................................225
APPENDIX V CARGO DESIGN DATA ...........................227 A. TWO BATTALION LANDING TEAM COMPOSITION ...........227 B. SIX SHIP CARGO DISTRIBUTION ......................230 C. CARGO VERTICAL CENTER OF GRAVITY CALCULATIONS ....231 D. WEIGHT AND BUOYANCY CALCULATIONS .................235 E. OFFLOAD RATE CALCULATIONS ........................237
APPENDIX VI HULL CALCULATIONS ...........................239 A. HULL DATA ........................................239 B. HYDROSTATICS .....................................241 C. TANK CALIBRATION .................................243 D. CROSS CURVES OF STABILITY ........................268 E. FLOODABLE LENGTH .................................270 F. INTACT STABILITY .................................276
1. Full Load - Departure .......................276 2. Full Load - Arrival .........................280 3. Half Load - Departure .......................284 4. Half Load - Arrival .........................288 5. Empty - Departure ...........................292 6. Empty - Arrival .............................296 7. Condition Summary Report ....................300
G. DAMAGED STABILITY ................................301 APPENDIX VII COMBAT SYSTEM ANALYSIS ......................305
A. RWR TRADE OFF ANALYSIS ...........................305 1. Sensitivity Calculations ....................305
a. Calculation Parameters .................305 b. Formulation ............................306 c. Results ................................306 d. Conclusions ............................306
2. Type Selection ..............................306 a. Available Options ......................307 b. Sensitivity Requirements ...............307 c. Probability of Intercept Requirements ..307

x
d. Evaluation Criteria ....................308 e. Discussion .............................308 f. Evaluation of Options ..................309 g. Decision ...............................309
B. RF JAMMER TARDE OFF ANALYSIS .....................309 1. RF Jammer Calculations ......................309
a. Calculation Parameters .................309 b. Formulation ............................310 c. Conclusion .............................312
C. DIRCM TARDE OFF ANALYSIS .........................312 1. DIRCM Laser Power Calculation ...............312
a. Calculation Parameters .................312 b. Formulation ............................313 c. Results ................................313 c. Conclusions ............................313
2. DIRCM System selection ......................314 a. Available Options ......................314 b. Evaluation Criteria ....................314 c. Discussion .............................314 d. Evaluation of Options ..................316 e. Decision ...............................316
D. EO SYSTEM ANALYSIS ...............................316 1. System Overview .............................316 2. System Description ..........................317 3. Sensor Overview: ............................318
a. FLIR System Parameters: ................319 b. Laser System Parameters: ...............320 c. TV Camera Parameters: ..................321
4. Performance Evaluation: .....................322 5. Conclusion: .................................323
E. MISSILE TRADE-OFF ANALYSIS: ......................323 F. GUN TRADE-OFF ANALYSIS ...........................325 G. OPERATING STATEMENTS OF THE HPMADS ...............326
APPENDIX VIII PROPULSION DATA .............................329 A. TABLE FOR THE KAMEWA WATER JET S-SERIES ..........329 B. FACT SHEET FOR THE AWJ-21TM PROVIDED BY ROLLS-
ROYCE ............................................330 C. ADVANCED WATERJET FOR THE 21ST CENTURY (AWJ-21)...332 D. GAS TURBINE TRADE OFF ............................332
APPENDIX IX DAMAGE CONTROL DATA .........................334 A. SHIP NUMBERING AND COMPARTMENT INDENTIFICATION ...334
1. Ship Numbering System .......................334 a. Compartment Numbering ..................334 b. Deck Number ............................334 c. Frame number ...........................334

xi
d. Position in relation to centerline .....334 e. Compartment Use ........................335
2. Compartment / Fitting Identification ........335 a. Bull's eyes ............................335 b. Compartment designation plates .........335 c. Frame and Bulkhead Label Plates ........335 d. Fitting Numbering ......................336
B. BATTLE STATIONS ..................................336 1. Traffic Flow ................................336 2. Manned and Ready Report .....................336 3. Battle Dress ................................337 4. Distributed Stowage .........................337
C. SALVAGE SHIP OR SCUTTLE SHIP .....................338 1. Abandon Ship and Emergency Destruction ......338
D. CONDITIONS OF READINESS AND OTHER CLASSIFICATIONS 340 1. Material Conditions of Readiness ............340 2. Other Damage Control Classifications ........340 3. Modified Material Conditions of Readiness ...341
E. SHIP SURVIVABLILITY ..............................341 1. Damage Control Total Ship Survivability ....341 2. Considerations (Sources of Confusion) .......341
a. C3 - Command, Control, and Communications 341 b. Intense Heat and Heavy Smoke ...........342 c. Personnel Casualties ...................342 d. System(s) Restoration ..................342 e. Material Stowage .......................343
3. Pre-damage Actions ..........................343 a. Knowledge ..............................343 b. Damage Containment Strategies ..........343
4. General Emergencies .........................343 a. General Emergency Bill .................344
5. Mass Conflagration ..........................344 6. Rescue and Assistance .......................344
F FIRE BASICS ......................................345 1. The Fire ....................................345 2. Fire Triangle components (SMOLDERING OR
SURFACE GLOW) ...............................345 3. Fire Dynamics ...............................346
a. Types of Fires .........................347 b. Extinguishing Methods ..................347
G. DC ORGANIZATION FOR A FIRE .......................347 a. Different Types of Fire parties ........347 b. Functions That Make Up the Fire Party: .348
APPENDIX X COST AND WEIGHT ESTIMATION ..................352 A. WEIGHT ESTIMATION ................................352 B. COST ESTIMATION ..................................353

xii
INITIAL DISTRIBUTION LIST ..................................357

xiii
THIS PAGE INTENTIONALLY LEFT BLANK

xiv
LIST OF FIGURES
Figure 1. Joint Expeditionary Operations. ....................3 Figure 2. Pre-Crisis .........................................6 Figure 3. Closure ............................................7 Figure 4. Sustained Operations ...............................9 Figure 5. HSAC Operating Environment ........................15 Figure 6. TF Operating Envelop ..............................24 Figure 7. Sample Interface of the MIT Spreadsheets ..........25 Figure 8. Excel work to establish the design selection
tests .............................................29 Figure 9. Cost vs. MOP for all possible designs .............32 Figure 10. Four ship vs. MOP broken out by speed ............33 Figure 11. Three ships vs. MOP broken out by speed ..........33 Figure 12. Main and Lower Cargo Decks Fully Loaded ..........44 Figure 13. Main and Lower Cargo Deck Dimensions (meters) ....46 Figure 14. Three Dimensional Model of an MTVR ...............47 Figure 15. Stern Gate Operations at the Sea Base ............50 Figure 16. Stern Gate Operations at the Beach ...............51 Figure 17. Bow Ramp Operation at the Beach ..................52 Figure 18. Bow Ramp Track with Rollers (seven of eight
sections shown) ...................................55 Figure 19. Operations at the Beach ..........................56 Figure 20. C-5 Style Bow Door ...............................59 Figure 21. Hydraulically Actuated Bow Doors .................60 Figure 22. Flight Deck Elevator and Helicopter Hangar .......61 Figure 23. Newport Class LST (www.fas.org) ..................67 Figure 24. Triton Research Vessel (www.globalsecurity.org) ..67 Figure 25. Buque Bus (www.shiptechnolgy.com) ................69 Figure 26. Benchijigua Express ..............................72 Figure 27. Center Hull Form Alternatives ....................74 Figure 28. Typical Midship Section of Alternative B .........76 Figure 29. Parabolic Keel Profile ...........................76 Figure 30. Rendered Hull Form ...............................79 Figure 31. Hull Resistance Calculations .....................80 Figure 32. Resistance Curve .................................81 Figure 33. Deck Layout ......................................82 Figure 34. Depiction of First Estimation ....................83 Figure 35. First Estimate Calculations ......................84 Figure 36. Detailed Calculations ............................85 Figure 37. Structural Weight Calculations ...................86 Figure 38. Longitudinal Strength Plot .......................87 Figure 39. Block diagram of proposed SSPS ...................95 Figure 40. Design Philosophy ................................96

xv
Figure 41. Nulka System ....................................107 Figure 42. SPY-3 weight and size estimation ................109 Figure 43. Navigation Radar ................................111 Figure 44. MK 48 Mod-0 Launcher System .....................115 Figure 45. 57mm Gun System .................................115 Figure 46. Single M240C Machine Gun (Twin mount not shown) .118 Figure 47. Final System Overview ...........................119 Figure 48. Risk Analysis ...................................127 Figure 49. Risk Management Plan for the HSAC ...............128 Figure 50. POFACETS Results ................................132 Figure 51. XPATCH RCS calculations results .................134 Figure 52. ICR WR21 Gas Turbine ............................138 Figure 53. MT 30 Gas Turbine ...............................139 Figure 54. LM2500 Gas Turbine ..............................140 Figure 55. LM2500+ Gas Turbine .............................140 Figure 56. LM 1600 Gas Turbine .............................141 Figure 57. LM6000 Gas Turbine ..............................142 Figure 58. Weight Comparison for Gas Turbines ..............143 Figure 59. Volume Requirements for Gas Turbines ............143 Figure 60. Joint ACCESS Power vs Speed .....................144 Figure 61. LM 2500+ and MT30 Fuel Efficiency Comparison ....145 Figure 62. LM 2500+ and MT30 Fuel Consumption Comparison ...146 Figure 63. LM 2500+ and MT30 Endurance Fuel Comparison .....147 Figure 64. Joint ACCESS Fuel Estimation ....................148 Figure 65. Volume Comparison of HTS vs. Conventional Motor .150 Figure 66. Weight Comparison of HTS vs. Conventional Motor .151 Figure 67. HTS AC Synchronous vs. DC Homopolar Motor
Dimension Comparison .............................151 Figure 68. AWJ-21TM Integrated into Hull ....................153 Figure 69. Cut-Away View of AWJ-21TM ........................154 Figure 70. AWJ-21TM Speed vs. Power .........................155 Figure 71. AWJ-21TM Size vs. Power ..........................155 Figure 72. Joint ACCESS Example Electrical Distribution ....158 Figure 73. Joint ACCESS DC Zonal Zones .....................159 Figure 74. Typical Hydrocarbon Fire Spectrum[1] ............166 Figure 75. Schematic Video Smoke and Flame[1] ..............167 Figure 76. Principle of Fiber Optical Detector[1] ..........169 Figure 77. High Performance Optical Detector[1] ............170 Figure 78. Smart Microsensor[2] ............................171 Figure 79. A Typical Life Raft for HSAC[9] .................180 Figure 80. Typical CO Stateroom Arrangement ................186 Figure 81. Typical Officer (USN) Stateroom Arrangement .....186 Figure 82. Typical CPO Stateroom Arrangement ...............187 Figure 83. Sit-up Berth (Ref [3]) ..........................188 Figure 84. Typical Crew Berthing Arrangement ...............188 Figure 85. Reduced Manning Procedure .......................191

xvi
Figure 86. Joint ACCESS Name and Ship Seal .................203 Figure 87. Example Special Operations Support Loadout ......206 Figure 88. Example Humanitarian and Evacuation Operations
Loadout ..........................................207 Figure 89. 225 Figure 90. TISS II System ..................................319 Figure 91. TISS Performance Evaluation .....................323 Figure 92. Missile trade-off-analysis results ..............324 Figure 93. Gun trade-off-analysis results ..................326

xvii
THIS PAGE INTENTIONALLY LEFT BLANK

xviii
LIST OF TABLES
Table 1. Phase Associated Logistics Concepts ...............10 Table 2. Vehicle Data ......................................40 Table 3. 1 Battalion Landing Team distribution .............42 Table 4. Bow Ramp Specifications ...........................53 Table 5. Ship Main Particulars .............................77 Table 6. Longitudinal Strength Data ........................86 Table 7. Modern High Performance ES Receivers .............101 Table 8. Reliability Calculation ..........................124 Table 9. Comparison of Superconducting Electric Power
Applications to Conventional Technologies ........149 Table 10. Installation of Detectors Onboard ................162 Table 11. Installed DC Systems .............................173 Table 12. Accommodation Arrangement ........................185 Table 13. Habitability Weight Estimation ...................185 Table 14. Recommended Amounts of Potable Water Aboard Ship
(Ref [5]) ........................................189 Table 15. Manning Breakdown ................................193 Table 16. Ship Weight Summary ..............................200 Table 17. Cost Estimate ....................................201 Table 18. Design Requirement Satisfaction ..................204 Table 19. Typical sensitivities of the RWR options .........307 Table 20. POIs of the different RWR options ................308 Table 21. Advantages and Disadvantages of the Three MAWS
Options ..........................................315 Table 22. FLIR System Parameters ...........................319 Table 23. Laser System Parameters ..........................320 Table 24. 321 Table 25. TV Camera Parameters .............................321 Table 26. Missile trade-off-analysis .......................324 Table 27. Gun Trade-Off Analysis ...........................325

xix
THIS PAGE INTENTIONALLY LEFT BLANK

xx
ACKNOWLEDGMENTS The 2004 Total Ship Systems Engineering Team would
like to thank our families and friends for their
understanding and support throughout the Joint ACCESS
project. We also would like to extend our appreciation to
Professor Fotis Papoulias, Professor Robert Harney,
Professor Bill Solitario, Professor Chuck Calvano and
Professor Bob Ashton for their assistance and support
throughout the TSSE curriculum and design project. A
special acknowledgement is due for Professor David Jenn for
his invaluable assistance during the RCS evaluation of our
design. Finally we would like to thank American
Superconductor, Northrop Grumman, Naval Facilities
Engineering Command, NAVSEA, and Rolls-Royce for their time
and supplying us with invaluable technical information.

xxi
THIS PAGE INTENTIONALLY LEFT BLANK

1
I. INTRODUCTION
This report is prepared in order to fulfill the
requirements of the Total Ship Systems Engineering program
at the Naval Postgraduate Scholl and in partial support to
the Wayne Meyer Institute of Systems Engineering. The goal
was to develop a High Speed Assault Connector (HSAC) that
will support the transport, logistics, and operations of a
2025 Joint Expeditionary Brigade (JEB). The seaborne
components of the 2025 JEB comprised of 2 Battalion Landing
Teams (BLT) must be transported from the Sea Base to the
point of entry up to 200nm away within a 10 hour period.
After the deployment of forces ashore, there must be a
continuous and efficient flow of materials and supplies to
maintain the logistics train between the Sea Base and those
forces until it is decided that they need to be withdrawn.
Throughout the force deployment process, there must be
adequate support for the landing forces as they make their
way onto and through the beach as well as their withdrawal
from it.
The need for the design and development for a HSAC is
rooted in the Chief of Naval Operations’ (CNO) assessment
in Sea Power 21 where seabasing is stated to be a future
naval forces capability. In 2002, the Total Ship System
Engineering (TSSE) team focused on the development of a
system of ships that would facilitate the notion of
deploying a Marine Expeditionary Brigade (MEB) from a Sea
Base indefinitely. This work was later followed up by the
2003 TSSE design team which developed the Littoral
Combatant Ship (LCS) to provide the “Sea Shield” defense
layer for the Sea Base. Now it is the 2004 TSSE design

2
team’s task to develop a system of ships that will
transport the seaborne components of a 2025 JEB from the
Sea Base to the shore, provide a reliable logistics train
for the deployed forces, and provide beach operation
support.
The amphibious craft and doctrine in place today can
provide for an amphibious assault on almost any beach in
the world. The issue is that this process is extremely
slow, highly specialized to the United States Marine Corps
and relies heavily on port access close to the area of
assault for continual logistics support. Seabasing removes
the reliance on suitable ports for offloading material and
has evolved to include forces beyond the United States Navy
and Marine Corps. In addition, it is now desired that the
components of a 2025 JEB be deployed from the Sea Base to
the beach within a 10 hour period. No ship or combination
of ships in the U.S. Naval Fleet can meet these
requirements. The HSAC is the vital link that will
ultimately make the Sea Base to shore connection a reality.
The objective of this project is to develop and design
a vessel that will work in conjunction with today’s current
and future vessels to meet the requirements of force
deployment, logistics sustainment, and operational
amphibious support of Sea Base to beachhead operations. A
secondary objective is to design this vessel so that it can
serve a dutiful purpose in the fleet when not conducting
its primary mission, especially during non-wartime periods.
The end product should be a ship that not only brings
seabasing to becoming more a reality, but also brings
greater overall flexibility and capability to the U.S.
Navy.

3
II. JOINT EXPEDITIONARY LOGISTICS OVERVIEW
A. OPERATIONAL CONCEPT
1. Objective
This Operating Concept describes the postulated view
of Joint Expeditionary Operations (JEO) and the associated
Joint Expeditionary Logistics (JELo) in the 2025 time frame
as developed by the Systems Engineering and Analysis cohort
Six (SEA-6). Emphasis is on full integration, where all
aspects of United States-led military power are fused and
synchronized. JEO can be considered in phases: Pre-Crisis,
Closure, and Sustainment. The section is intended to
describe the entire operation from 1) Pre-Crisis to a need
for military power, 2) the application of military power
until objectives are reached, and 3) the withdrawal and
redeployment of that military power. Figure 1 pictures
these three areas of operations that scope the project.
Figure 1. Joint Expeditionary Operations.
2. Overview
The Expeditionary Forces must be capable of seizing
the initiative within 10 days, achieve the expeditionary

4
objectives within 30 days, then reconstitute and redeploy
within the next 30 days (10-30-30). The Expeditionary
Logistics systems must meet the demand of the Combined Task
Force Commander (CTF CDR) without slowing the desired
operations tempo.
These operations may occur in any of the littoral
regions of the world, day or night, all weather,1 up to sea
state 5 (6-8 ft. waves)2 and sustained winds up to 20
knots.3
The Area of Operations (AO) and objectives are in a
geographic location where conventional access (road/rail,
neighbor over flight, and/or permissive port/airfield
facilities) is not available. The objectives may be at
sea, on land, in the air, in space, or in cyberspace.
Power is projected and sustained from a Sea Base in crises
or conflicts where a Sea Base adds combat capability.4
The Area of Operations (AO) may include limited5 land-
based Forward Logistics Sites (FLSs)6 which support the
Expeditionary Forces. These FLSs are as far as 2,0007
straight-line miles from the AO (actual transit distances
1 All weather implies rain, snow, ice, reduced visibility, high and
low temperatures. 2 Sea Basing CONOPS, p. 14. 3 Defense Mapping Agency Hydrographic/Topographic Center, The
American Practical Navigator, 1995 ed., Defense Mapping Agency Hydrographic/Topographic Center, Bethesda, 1995, p. 535.
4 Sea Basing CONOPS, pp. 1-3. 5 The requirement for expeditionary forces is driven in part by an
antiaccess environment. As such, it is reasonable to assume that the number available will not be in the ideal location nor have every desired capability.
6 As described in Professor David Schrady’s Expeditionary Logistics Framework.
7 N42 Draft Sea Base Logistical CONOPS, 04 June 2004.
5
may be longer due to geography).8 Critical straight-line
air routes are not available and plans are based on flight
through international airspace.9 The littoral region of the
AO may include regions that are both favorable and
unfavorable10 to amphibious landings.
The assumed threat includes any adversary ranging from
non-state actors (terrorists, insurgents, etc.) with low
technology to a near-peer competitor with one or more
comparable or superior defense technologies.11 In both
cases, the potential for highly asymmetric threats is
assumed.
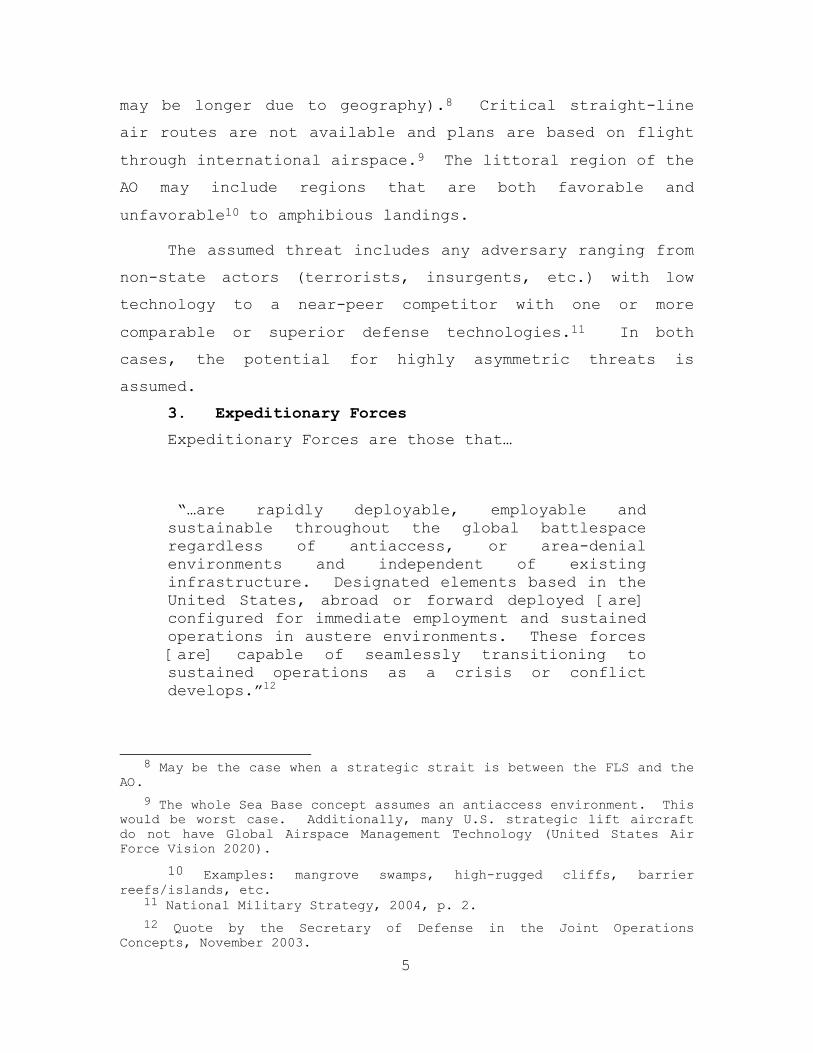
3. Expeditionary Forces
Expeditionary Forces are those that…
“…are rapidly deployable, employable and sustainable throughout the global battlespace regardless of antiaccess, or area-denial environments and independent of existing infrastructure. Designated elements based in the United States, abroad or forward deployed [are] configured for immediate employment and sustained operations in austere environments. These forces [are] capable of seamlessly transitioning to sustained operations as a crisis or conflict develops.”12
8 May be the case when a strategic strait is between the FLS and the
AO. 9 The whole Sea Base concept assumes an antiaccess environment. This
would be worst case. Additionally, many U.S. strategic lift aircraft do not have Global Airspace Management Technology (United States Air Force Vision 2020).
10 Examples: mangrove swamps, high-rugged cliffs, barrier reefs/islands, etc.
11 National Military Strategy, 2004, p. 2. 12 Quote by the Secretary of Defense in the Joint Operations
Concepts, November 2003.

6
The Combined13 Expeditionary Force is a United States-
dominated, Joint Force augmented by one or more allied
partners. This Force uses the Component Commander
construct as used in the Joint Component Commander
organization. These joint forces are fully integrated.14
Specifically, they share common equipment, training,
doctrine and terminology. These forces range in size from
a two-man Special Operations Forces (SOF) unit to an
Expeditionary Brigade-sized force ( ~5,000 ground combat
troops). Some elements of Expeditionary Forces are forward
deployed. Expeditionary Forces and their materiel will be
moved, assembled and sustained using multimode vehicles
called Connectors.
B. JOINT EXPEDITIONARY OPERATION PHASES
1. Pre-crisis
Pre-Crisis describes the configuration and disposition
of the Expeditionary Forces (EXFORCES), shown abstractly in
Figure 2 with no preexisting connections.
Figure 2. Pre-Crisis
13 U.S. Joint Force and another state entity. 14 Modeled after the SOF and Special Operations Command, Commander
forces.

7
2. Closure
Once the nation decides to employ military power, the
Expeditionary Forces (EXFORCES) begin closing on the Area
of Operations (AO), with associations as labeled in Figure
3. A portion of Forces come direct from forward locations,
some Forces direct from home base and some Forces through a
Forward Logistics Site (FLS) on their way. Because of
their location and equipment, key elements of these forces
arrive ahead of the others.
Figure 3. Closure
Within 10 days of the Deploy Order,15 the CTF CDR will
put the Preliminary Elements16 of the ground forces at the
initial objectives. These objective(s) may be within 240
miles17 of the Sea Base. The Sea Base may be within 25-100
miles of the coastline18. The Preliminary Elements shall
15 Quote by Vice Admiral Nathman in the Navy League of the United
States, June 2004. 16 Preliminary Elements will vary by situation and objectives within
that situation. 17 Sea Basing CONOPS, p. 14. 18 Ibid, p. 15.

8
deploy to the initial objective(s) within one period of
darkness (10 hours).19 These elements are able to either
complete the operation or prepare the battlefield for
Follow-on Forces.
Expeditionary Force Protection projects layered
organic and external defensive power to protect Joint and
Combined assets and to dissuade and deter possible
adversaries during Expeditionary Operations. Expeditionary
Force Protection defends against the threats described in
Section II. The Joint Expeditionary Logistics (JELo)
system and Sea Base supports the requirements of
Expeditionary Force Protection.
Forcible Entry Operations are used in a nonpermissive
environment to locate, counter, or penetrate vulnerable
seams in an adversary’s access denial system to enable the
flow of Follow-on Forces. The essence of Forcible Entry
Operations is Ship to Objective Maneuver (STOM) in order to
expedite the speed of action relative to the enemy over
time. This superior tempo uses the rapid buildup of
focused combat power ashore via vertical and surface lift
capabilities, tactical/operational flexibility and maneuver
at and from the sea.20
3. Sustainment
At some point, a majority of the Force has converged
on the Area of Operations (AO) and operation has reached a
steady level of effort. Figure 4 shows the level of
complexity of the logistics lines needed to support this
phase.
19 Expeditionary Maneuver Warfare List, 16 June 2003, p. 21. 20 Ship to Objective Maneuver (STOM), Commandant of the Marine Corp,
LtGen Paul K. Van Riper, 25 July 1997.

9
Figure 4. Sustained Operations
Sustained Expeditionary Operations (Figure 4) are
those expeditionary operations that last for a period of 30
days or longer. Forces that have closed within the AO are
able to plan and execute movement and maneuver from the Sea
Base with the following capabilities:21
1. Maneuver and support a battalion from sea, 110 NM, within 10 hours.
2. Maneuver and support a battalion from the sea, 200 NM, within 24 hours.
3. Maneuver and support smaller forces (e.g. recon, radio relay teams) from the sea, 240 NM, as required to support operations.
4. Phased Based Logistics
Table 1 below lists the critical logistics concepts
needed to enable the each phase of JEO.
21 Ibid.

10
Table 1. Phase Associated Logistics Concepts JEO Phase Associated Logistics Concepts Pre-Crisis • reach around the globe
• scale to conflict level • berth and sustain crew and troops • interface with the Forward Logistics Site(s)• transfer material and personnel (onload/offload) while underway
• survive expected threats • integrate with the Expeditionary Force Protection
• defend themselves commensurate with their role (transport/Sea Base)
• support Unmanned Vehicle (UV) operations • interface among each other and the Sea Base • carry, deploy, and support Preliminary Elements
• maintain mobility against expected combat damage
• enable assembly of personnel and materiel • reconfigure to meet mission requirements • scale in capacity, speed, range, and interoperability
• balance between onload/offload speed and platform stability/maneuvering
• maintain capacity, speed, range, and interoperability so that weather effects don’t adversely impact operational tempo
• maintains sufficient availability to complete mission
Closure • have space and modular facilities to support en route and on-station planning
• support SOF equipment and operations • secure SOF equipment and information • maintain forward progress sufficient to preserve operational tempo
• resupply in transit up to sea state 5 • interface among each other and the Sea Base • operate with transfer mechanisms to move personnel and materiel within the Sea Base and to/from the Sea Base
Sustainment • change configuration to support given mission
• decontaminate themselves
C. JOINT EXPEDITIONARY LOGISTICS EMPLOYMENT
To facilitate the JELo closure phase, the U.S. Navy is
currently relying on FLSs like Diego Garcia and the current

11
inventory of Maritime Pre-positioning Force (MPF) ships to
be able to bring the appropriate gear and supplies to the
objective. Ships under development like the Maritime Pre-
positioning Force (Future) (MPF(F)) and the Rapid Strategic
Lift Ship (RSLS) are the vessels that the Navy is looking
toward to reduce the closure time of massing the required
equipment and supplies for a brigade size force at the Sea
Base. Though these new designs try to address the issue of
transporting large amounts of material rapidly over long
distances to the Sea Base, they fail to address how that
material is going to make its way from the sea base to the
shore.
As stated in the previous JELo description, the
requisite troops, vehicles, and supplies need to be
transported from the Sea Base and taken to shore. Current
connector technologies such as Landing Craft Air Cushion
(LCAC) and Landing Craft Utility (LCU) have an effective
range of 25nm or less and their speed is heavily dependent
on the sea state. To deliver and continually support
forces ashore with these technologies requires bringing a
large number of support ships, such as the MPF(F), to
within 25nm of the coastline, greatly increasing their
susceptibility to hostile fire.
There is a significant gap in the U.S. Navy’s ability
to transport the requisite forces and material from the Sea
Base to the shore over the proposed 200nm distance and
maximum sea state 5. To close or remove this gap, a new
capable high speed connector needs to be developed to
provide the transportation of the initial forces to the
shore within a 10 hour period and then be able to provide
continuous logistic support until the force needs to be

12
removed. Until this HSAC is developed, maneuvering forces
from the Sea Base to the shore in excess of 25nm will
remain a difficult, if not an impossible challenge.

13
II. DEFINING THE REQUIREMENTS
A. INITIAL REQUIREMENTS
SEA-6 requested that the TSSE program develop a
conceptual design for a logistics transport to act as a
connector between the Sea Base and shore to augment or
replace existing connector platforms. This logistics
transport was to be a HSAC to close the gap SEA-6 had
identified in their JElo study of being able to transport
and support a 2025 JEB from the Sea Base to the shore.
From the SEA-6 employment perspective this meant:
• The HSAC system or system of systems must be capable of delivering two BLTs (~8000LT consisting of troops, cargo, and gear) from the Sea Base to the shore.
• The HSAC system or system of systems must deliver the requisite payload a distance of 200nm in sea state 5 or less within a 10 hour period
• The HSAC system or system of systems must interface with the Sea Base, developed ports, and austere beaches in order to transfer cargo to and from the ship.
The TSSE faculty members then augmented these
requirements with the following three additional
requirements that they deemed were necessary for the HSAC
design:
• The HSAC must support amphibious operations ashore in addition to its delivering payload.
• The HSAC must be capable of performing secondary missions.
• The HSAC must be capable of independent operations.
From these initial requirements, the design team then
formulated the functional and operational requirements that
would shape the HSAC design.

14
B. REQUIREMENT DEVELOPMENT
The TSSE design team reviewed the initial requirements
provided by SEA-6 and the TSSE faculty and examined the
guidance set forth in the 2004 TSSE project document
(Appendix I). Three weeks were then spent reviewing
numerous documents related to the Seabasing Concept, Joint
Logistics Over the Shore (JLOTS), transport factor, and
high speed transport in order to fully understand the
design problem. After reviewing this material, the team
was ready to proceed with detailed functional and
operational requirement development.
1. Defining the Operating Environment
Prior to generating any detailed requirements, the
TSSE team defined the operational environment in which the
HSAC would operate. The transit area between the sea base
and the shore received the most attention. This area was
subdivided into a loading zone at the sea base, a transit
zone from the sea base towards the beach, and an unloading
zone at the beach. The threat the ship would expect to
encounter was then defined for each zone based on input
from SEA-6 documentation and the broad operational
experience within the TSSE team. Figure 5 illustrates the
breakdown of the zones and the corresponding threats the
HSAC may encounter.
The Loading Zone was defined as the immediate area
surrounding the sea base. The team assumed that the HSAC
would be protected by the defense systems associated with
the protection of the sea base while the HSAC is loading
and unloading at the seabase.
The Transit Zone spans the distance from the sea base
to within about one mile of the beach. Based on SEA-6

15
documentation, the distance from the sea base to the shore
can be as much as 200 nautical miles. Within this zone,
the HSAC is expected to encounter enemy ships, small boats,
aircraft, and missiles. It was assumed that other assets
assigned to the littoral will provide protection from any
undersea threat.
~1nm200 – 25 nm
Transit ZoneLoading Zone Unloading Zone
1. Missiles
2. Aircraft
3. Small Boats
4. Submarines
• Small Boats
• Aircraft
• Missiles
• Small Arms
Beach1. Hostile
2. Missiles
3. Small Arms
4. Aircraft
~1nm200 – 25 nm
Transit ZoneLoading Zone Unloading Zone
1. Missiles
2. Aircraft
3. Small Boats
4. Submarines
• Small Boats
• Aircraft
• Missiles
• Small Arms
Beach1. Hostile
2. Missiles
3. Small Arms
4. Aircraft
Figure 5. HSAC Operating Environment
Approximately one mile out from the beach to the beach
is the area categorized as the Unloading Zone. At this
point in the design process, it was unclear how the HSAC
would deliver its cargo to the shore, so the Unloading Zone
was pushed offshore one mile to cover the possibility of
offloading the HSAC to another waterborne craft for
delivery to the beach. In this zone, the HSAC is expected
to encounter small boats, aircraft, missiles, and small
arms fire. The team made the assumption that the boat
lanes leading to the beach would be mine free prior to the
HSAC entering the Unloading Zone.
The beach was defined as the fourth zone in the
operating environment. Here the HSAC is expected to
encounter hostile ground forces, missiles, small arms fire,
and aircraft. Although enemy forces may possibly present

16
on the beach during landing operations, it was assumed that
any potential beach landing would be conducted in a reduced
threat environment.
2. Detailed Requirement Development
Having established the operating environment and
having a clear set of initial requirements, the team
developed the mission needs statement listed in Appendix
II. From this mission needs statement, the team developed
the needed operational and functional requirements for the
HSAC. To begin this requirement development process, the
12 person design team was divided into three sub-teams;
ship capabilities and characteristics, combat system
capabilities, and payload interfacing. Each sub-team then
generated a list of specific requirements that the HSAC
must satisfy to effectively meet the initial requirements
set forth by SEA-6 and the TSSE faculty. These
requirements would then be reviewed and combined to form
the HSAC Operational Requirement Document (ORD).
a. Ship Capabilities and Characteristics.
This team was charged with developing notional
requirements that defined the HSAC’s performance, ability
to execute its mission, and maneuver throughout the oceans
of the world, ranging from blue water to the littoral. The
requirements developed under this category are listed in
Appendix III.
It was decided that while the primary mission of
the HSAC is to deliver cargo from the sea base to the
shore, it is necessary for the ship to be capable of trans-
oceanic voyages in order to be a self-sustaining,
deployable ship. The possibility of having another ship
transport the HSAC from a CONUS base to an advanced land

17
base and/or to the sea base was eliminated early in the
process because of the considerable restrictions it placed
the design alternatives of the HSAC.
b. Combat System Capabilities.
This group developed notional requirements to
accomplish the primary mission within the defined threat
environment and to satisfy the Threat Mitigation
Requirements in the Mission Needs Statement. These
requirements are listed in Appendix III.
The key concept produced by the development of
these requirements was that the HSAC would carry a combat
systems suite in order to provide self defense and to
project power ashore at short range, protecting the landing
force both during transit and offload. The self defense
capabilities of the HSAC would be short range systems,
relying heavily on other assets within umbrella of the “Sea
Shield” to protect the HSAC from more formidable blue water
threats.
c. Payload Interfacing.
This team was tasked with developing notional
requirements that define the amount and type of cargo that
the HSAC will be required to carry throughout the
amphibious operation (tons and volume at a minimum). The
requirements for this category were driven by the initial
two BLT composition shown in Appendix V.
While the requirements were being generated, it
was decided that the HSAC will transport the Expeditionary
Fighting Vehicles (EFVs) from the sea base to the shore.
Initially it was discussed that the EFVs may make the
transit from the sea base to the beach on their own power,
but the limited range of the EFV would only allow for this

18
if the sea base was less than 60 nautical miles from the
beach. Since our initial requirements called for the sea
base to be as far as 200 nautical miles from the beach, it
was decided that the design would best be accomplished if
the EFVs are assumed to always be included in the HSAC
load-out. This decision was made early in the design
process because the 98 EFVs that are in two BLTs have a
significant impact on the necessary payload capacity of the
ship due to their large weight and footprint area.
3. Final Development
All of the sub team requirements were thoroughly
analyzed by the entire TSSE team before selecting the final
list of requirements for which the HSAC would be designed
to meet. In some cases the same requirement was developed
by more than one group, and in other cases the team decided
that a requirement was not realistic or necessary. One
week of class time was spent by the TSSE team reviewing and
analyzing each requirement in order to develop the final
list.
To generate a final prioritized list of requirements
each team first weighted their requirements on a scale of 1
to 10 as shown in Appendix III. Then the Analytic
Hierarchy Process (AHP) was used to generate an overall
weight value for each of the sub-teams’ design
requirements. As depicted in Appendix III, the payload
requirements were most influential with an overall weight
of 53.90%. The ship characteristic requirements were next
with a weight of 29.73% followed by combat systems with a
weight of 16.38%. The individual team weighting was
normalized using the AHP derived weights to allowing the
team to rank the derived requirements relative to each

19
other. Finally, all the requirements were prioritized
using their normalized weight, resulting in the final
operational and functional requirement list seen in
Appendix III. With this detailed set of requirements, the
team was prepared to move forward with the design process.

20
THIS PAGE INTENTIONALLY LEFT BLANK

21
III. ANALYSIS OF ALTERNATIVES
A. GENERATION OF MEASURES OF PERFORMANCE
Starting from the payload, speed, and cargo
requirements for the design, the design team developed
three Measures of Performance (MOP) for the HSAC:
flexibility, survivability, and transport factor.
1. Flexibility
This MOP depended on four factors: payload, draft,
number of ships, and speed. The objective preferences for
this MOP were as follows:
Objective Preferences (Flexibility) # of Ships Speed Payload Draft # of Ships 1 1 2 2 Speed 1 1 2 2 Payload 0.5 0.5 1 1 Draft 0.5 0.5 1 1
The above objective preferences led to the following
weightings:
• Number of ships : 14.21%
• Speed : 14.21%
• Draft : 35.79%
• Payload : 35.79 %
After a careful examination of the above weighting
factors, and to make the flexibility MOP more balanced, the
team decided to give more weight to the speed and number of
ships. The final weighting that was used for the rest of
the AOA procedure is as follows:
• Number of ships : 20%
• Speed : 20%
• Draft : 30%

22
• Payload : 30%
The MOP score for flexibility is then scaled between 0
and 20 (with 20 being the best a ship can achieve).
2. Survivability
This MOP depended on three factors: number of ships,
speed, and the ship’s length. The objective preferences for
this MOP were as follows:
Objective Preferences (Survivability) Speed # of Ships Length # of Ships 1 2 2 Length 0.5 1 2 Speed 0.5 0.5 1
The above objective preferences led to the following
weighting factors:
• # of ships : 49.34%
• Length : 31.08%
• Speed : 19.58%
The actual values used during the AOA phase were a
round up of the above values as follows:
• # of ships : 50%
• Length : 30%
• Speed : 20%
The survivability MOP is then scaled between 0 and 20
(0 being the worst case scenario and 20 reflecting a ship
with a perfect survivability).
3. Transport Factor
The last MOP selected for this design project was the
transport factor (TF). The TF is a non dimensional
relationship between the weight, design speed, and

23
installed power of a ship given by:
1 .6 7 85 5 02
1
· ( ) ·
· 2 2 4 0 ·
K W WT F S H P S H PK V V
= =
where, W : Full Load Weight of Ship (WSHIP + WCARGO + WFUEL)
WCARGO : Weight of Cargo WFUEL : Weight of Fuel WSHIP : W - WCARGO - WFUEL VK : Design Speed K1 and K2 : Conversion Constants for hp,lb and LT SHP : Total Installed Power
More on TF can be found in [1].
By examining the TF for existing ships, the team
concluded that the higher the TF, the better the design is.
The team also learned that the highest possible TF with
current technology for the speed range is around 48.
Figure 6 shows the operating envelop for the proposed
designs. From this plot of transport factor vs speed, it is
evident that the operating envelope is below the Carderock
theoretical maximum which is the red line. On the graph
are many other points which correspond to other ships, and
the results are well above most of those. This is expected
due to the fact that the ship’s main objective is to carry
a large quantity of cargo at high speeds, and technological
advances should allow the design to approach closer to the
theoretical maximum. Therefore, the teams used a scale
between zero and 50 for the TF values (none of the designs
exceeded a TF value of 35, though).

24
64
10
13
15
25
3
0
10
20
30
40
50
60
70
25 30 35 40 45 50 55 60
Speed
TF
ActualMax550683
Operating Envelope
64
10
13
15
25
3
0
10
20
30
40
50
60
70
25 30 35 40 45 50 55 60
Speed
TF
ActualMax550683
Operating Envelope
Figure 6. TF Operating Envelop
4. Overall measure of performance
All of the above measures of performance were then
used to derive an overall MOP that will ultimately drive
the design choice.
The weighting of each of the above MOPs in the overall
MOP is as follows:
• Survivability : 42%
• Flexibility : 16%
• TF : 42%
Therefore, the
B. ANALYSIS OF ALTERNATIVES TOOL
As can be seen from the above discussion, the
individual MOPs (and therefore the overall MOP) depended on
parameters like speed, payload, number of ships, length of
each variant, installed power, displacement, and draft. At
this point of the design, a “tool” was needed that provided
Survivability Flexibility TF MOP= .42 .16 .4220 20 50
Normalized + +

25
a good estimate of each of those factors as the design
parameters were varied.
Because the team was familiar with the Massachusetts
Institute of Technology (MIT) spreadsheets tool, the team
decided to use this software as a “first cut” tool for the
evaluation of different hull forms.
1. Overview of the MIT Spreadsheets Tool
This spreadsheet tool, commonly known as MAPC, uses
parametric models and scaling to create high level designs
of various hull types. The inputs are the desired speed,
range, payload, sea state and maximum displacement. Some of
the software’s outputs include the fuel requirements,
draft, displacement, length, beam and installed power. A
sample interface is presented in Figure 7.
Initial InputRanking
1 Desired Speed in Waves 30 knots2 Desired Payload 2,000 long tons3 Desired Range 500 nautical miles
Sea State 1 wave height at top of SS1 = 0.3 feetMaximum Displacement 12,000 long tons
Results Hydrofoil HYSWAS SESSemi-Planing
Monohull Catamaran Trimaran SWATHCalm Water Speed 3,12 knots 30.0 30.0 30.0 30.1 30.0 30.1 30.0 Speed in Waves 1,3,4,9,10,11 knots 30.0 30.0 30.0 30.0 30.0 30.0 30.0 Payload Weight 2,3,4,9 long tons 2,000 2,000 2,000 1,000 2,000 2,000 2,000 Range at Speed in Waves 4,7,9 nautical miles 500 500 500 100 500 500 500 Displacement 3,7 ylong tons 5,391 4,682 5,437 2,115 5,631 5,334 5,824 Installed Power 3,6,7 ylong tons 87,560 49,696 77,450 36,117 68,783 33,885 58,471 Engines 5 ylong tons 6 LM 1600 6 LM 1600 6 LM 1600 6 LM 1600 6 LM 1600 6 LM 1600 6 LM 1600Fuel Carried On Board 3,7,8 ylong tons 246 144 218 21 196 98 169 Length feet 421 313 479 282 419 634 291 Beam feet 107 90 90 56 134 153 129 Hullborne Draft feet 57.9 43.7 19.8 20.9 19.1 15.9 26.7 Foilborne / Cushionborne Draft feet 23.5 23.2 5.5 N/A N/A N/A N/ARough Order of Magnitude Cost 150,000,000$ 133,000,000$ 149,300,000$ 114,900,000$ 148,500,000$ 141,200,000$ 152,600,000$ Lift to Drag Ratio 19.5 25.9 22.3 16.5 23.5 47.1 24.2
Figure 7. Sample Interface of the MIT Spreadsheets
2. Modification of the MIT Tool
In its original format, this tool used geometric and
dynamic similarities along with regression analysis to
generate its outputs. Also, it intended only for relatively
small vessels with speeds up to 40 knots. The TSSE 2003

26
team modified this tool to account for larger and faster
hull forms, though. In this design, these modified MIT
spreadsheets were used to allow the comparison of the seven
proposed hull types (Hydrofoils, HYSWASs, SWATHs, SESs,
Planing monohulls, Catamarans, and Trimarans) for speeds up
to 60 knots. Although the team did not conduct any analysis
to validate the use of this tool for the purpose of the
design, the latest generation of high speed Wave Piercing
Catamarans (WPC) built by the Hobart Company INCAT have
validated the use of this tool for large vessels at higher
speeds.
Although the tool has provided only a first estimation
of the key hull form parameters, it was deemed an adequate
evaluation tool for the purpose of this stage of the AOA.
C. ANALYSIS OF ALTERNATIVES PHILOSOPHY
Starting from the required payload to carry (8000LT)
and an approximate combat system payload of 150LT (derived
from a preliminary study conducted on the combat system
requirement for the ship), the team calculated the payload
for the possible designs as follows: Each ship in a
specific design will carry ([8000LT/(number of ships in the
design)]+150LT). At this point, it was decided that all
ships will have the same combat system payload but will be
designed in a modular way as to allow for flexibility in
the selection of the different combat system elements. As
an example, for a design with 5 ships, each will have to
carry a payload equal to: (8000/5)+150=1750LT.
1. Possible Designs
Because there were many possible designs that fulfill
the requirements of the HSAC, it was necessary to divide
the team into three groups where each group selected a
27
payload range and conducted the needed analyses. The
results of the analyses allowed the team to determine the
characteristics (advantages and drawbacks) of the different
designs.
Ships with payloads less than 2000LT were considered
big ships, ships with a payload between 1000 and 2000LT
were deemed medium size ships, and finally ships with a
payload less than 1000LT were considered small ships.
Group I analyzed the data for the cases of two, three,
and four ships variants (big ships), group II analyzed the
data for five, seven and 10 ships variants (medium ships),
and group III analyzed the data for 15 and 20 ships
variants (small ships).
Each group was tasked to calculate the overall MOP for
each possible payload (varying from 550LT in the case of 20
ships to 4150LT in the case of two big ships) and each
possible hull type (the seven hull types in the MIT
spreadsheets) for speeds varying from 30 knots to 50 knots
(with a 5 knot increment).
The total number of possible runs was equal to 280(7 hull
forms * 5possible speeds * 8 possible ship groupings =280)
All runs were then grouped to show the MOP for each
possible hull type, speed, and payload.
Appendix IV shows the overall results collected from
all three groups.
Appendix IV shows a sample of the MOP calculation
results of the medium size ships.
2. Design Selection Tests
Due to time constraints, it was not possible to
analyze all of the possible 280 designs and a method was

28
neded down that number to a more reasonable figure. Based
on a statistical analysis of the results from all runs, the
following was noted:
1- MOP values varied between 0.2 and 0.5 (most ships
exceeded 0.3, though).
2- For some ship designs MOP values varied
dramatically as speed is changed.
Based on those observations the team decided to run
all deigns through a series of three tests. In case they
pass the last test, they are kept for further processing.
If not, they are dropped out of the AOA process. The three
tests were as follows:
Test1: If the average MOP is less than 0.4, then that
is considered a bad design (spreadsheet reads: Return ZERO
if average< 0.4, otherwise, return the average MOP over all
speeds).
Test2: If the max (MOP)-min (MOP) exceeds 0.05, then
the design is not robust enough and is considered as a bad
design (spreadsheet reads: Return ZERO if max (MOP)-min
(MOP)>0.5, otherwise return the average MOP over all
speeds).
Test3: Any design that has an average>0.45 or passes
the two tests (regardless of the design’s average MOP) is
considered a good design and will be kept (spreadsheet
reads: Return the average MOP if a design passes test 3 and
Zero if it does not pass it).
At this point, it is important to note that the reason
it was decided to keep deigns with an average MOP>0.45
although they might not have passed test two (max (MOP)-min
(MOP) exceeds 0.05) is that 0.45 figure was deemed a high
29
enough MOP (compared to the average over all deigns) that
cutting those deigns would not be fair.
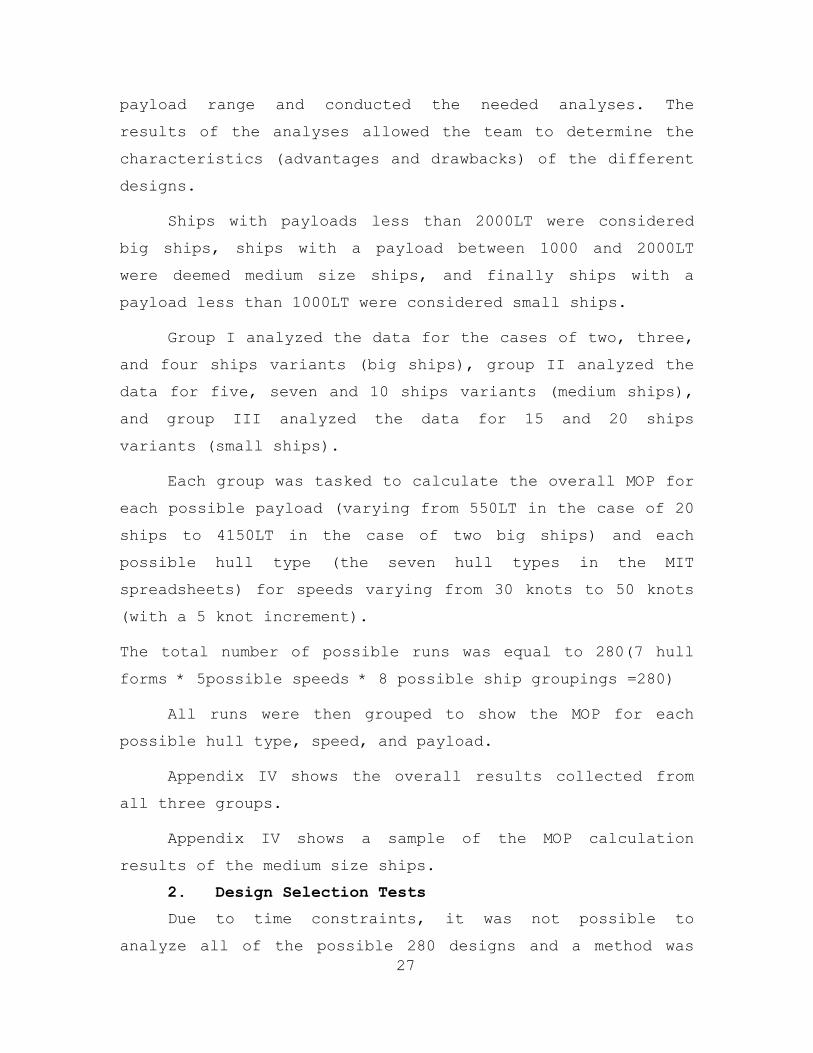
Figure 8 shows a snapshot of the required excel work
to run the three tests for the 15 ships variant. It can be
seen clearly how only two out of the seven possible deigns
made it through the three tests. For the particular case
shown on the figure, only 15 Hydrofoils or 15 Catamarans
would be considered adequate to meet the design
requirements.
15 15 ships
Hydrofoil HYSWAS SES Monohull Catamaran Trimaran SWATH1 2 3 4 5 6 7
30 0.4032911 0.4196021 0.437716 0.3810574 0.4266967 0.4918212 0.41997335 0.407435 0.4054498 0.417811 0.3651894 0.4198396 0.455274 0.39633940 0.409043 0.3938541 0.402963 0.3511751 0.4129364 0.4310445 0.37964545 0.408529 0.3859061 0.391949 0.3478963 0.4058566 0.4203088 0.3705150 0.4073266 0.3781461 0.383412 0.3442935 0.400095 0.409754 0.361815
test1 0.4071249 0 0.40677 0 0.4130849 0.4416405 0test2 0.4071249 0.3965916 0 0.3579223 0.4130849 0 0test3 0.4071249 0 0 0 0.4130849 0 0
Figure 8. Excel work to establish the design selection
tests 3. Design Selection Results
At the conclusion of the three tests, only 23 possible
deigns passed the required tests and were kept for further
processing.
a. Modified cost model
The next step in the AOA was to analyze each of
the 23 designs with respect to cost. Again, the MIT
spreadsheets were used to obtain a rough estimate of the
cost of each of the possible ships. After an initial run,
the team noticed that the MIT spreadsheets assigned almost
the same cost to all possible designs no matter how much
the speed and payload requirements were varied.

30
After a thorough examination of how the MIT
spreadsheets calculated cost, the team realized that the
model used a miscellaneous cost of $300M that is the same
for all ships and is always added to the overall cost of
any particular ship type. Also, the combat systems cost was
not accurate enough and does not reflect what is needed for
the design. At this point, the team deemed necessary to
modify the cost model in order to have a more accurate idea
on how much each of the variants will cost.
In building a modified cost model for the purpose
of the HSAC design, the miscellaneous cost was disregarded;
the combat system cost calculations were tailored to
reflect the ship’s requirements, and only the cost of the
machinery ($225/HP for installed HP) and structural weight
($10/lb) were accounted for. The team believed that the sum
of the machinery cost, the structural weight cost, and the
combat system cost is a more reasonable cost calculation
model to sort the different designs.
Based on the TSSE 2003 design, and because the
Sea Swat had a similar combat system suite to the one
designed for this project, the team estimated the combat
system cost for one ship to be equal to $50M. Starting from
the realization that the cost of the combat system suite
for a specific design should not increase linearly with the
number of ships, the team developed a combat system cost
model to account for designs that have a large number of
ships as is illustrated in Appendix IV. The new combat
system cost model results show that starting from a cost of
$50M when one ship is built, the cost decreases to only
$27M/ship when 20 ships were built; something that was
deemed very reasonable.

31
Also, because building more ships of the same
type involves a learning curve that can minimize the
overall cost of the total number of ships (as compared to
multiplying the cost of the lead ship by the number of
ships), a “0.9” learning factor was used in the cost
calculation to give credit to designs where only few ships
were to be built.
The cost of the nth ships was calculated according
to the following formula:
log( )log(2)
s
uZ Ku =
where u = unit of interest; Z U= resources for
unit u
K = resources for 1st unit; s = learning curve
slope.
Appendix IV illustrates the excel work involved
in calculating the modified (new in the spreadsheet) cost
for six of the possible 23 designs.
b. Final selection
The final step in the AOA is to analyze the 23
possible deigns with respect to cost. For each design, the
overall MOP was plotted against cost. The resultant plot
that reflects the final results is shown in Figure 9.

32
Figure 9. Cost vs. MOP for all possible designs
Because the team was looking for a grouping of
ships with the highest MOP possible and the lowest cost, it
was evident that the trimaran design led to the best design
of all possible ones.
Because the ship’s draft is a big design driver
for the project, and taking into account the fact that the
more ships a design includes, the lower the draft is, the
team decided to select a number of medium size trimarans as
the design of choice rather than to pick an exact number.
The final number would depend on other constraints (cargo,
ramp feasibility study, hull design study, machinery
requirements, beach slope study and draft requirements,
etc.) that will come up during further design analysis.
Figures 10 and 11 show that the three ship and
four ship variants versus MOP broken out by speed. Again,
it can be seen clearly how the trimaran hull form
distinguished itself among all possible hull forms.

33
Four ships vs MOP broken out by speed
0.2
0.25
0.3
0.35
0.4
0.45
0.5
0.55
0.6
0.65
0.7
0 1 2 3 4 5 6 7 8
hull type
MO
P
30kts
35kts
40
45
50
1- Hydrofoil2- hysw as3- SES4- Monohull5- catamaran6- Trimaran7- Sw ath
Figure 10. Four ship vs. MOP broken out by speed
Three ships vs MOP broken out by speed
0.2
0.25
0.3
0.35
0.4
0.45
0.5
0.55
0.6
0.65
0.7
0 1 2 3 4 5 6 7 8
hull type
MO
P
30kts
35kts
40
45
50
1- Hydrofoil2- hysw as3- SES4- Monohull5- catamaran6- Trimaran7- Sw ath
Figure 11. Three ships vs. MOP broken out by speed
D. SUMMARY
Analyzing the outcome of all possible hull designs,
the trimaran displayed the best results to fulfill the
34
requirements of the project. In addition, the trimaran had
the best draft and the largest deck area which are both big
design drivers for the project.
Based on these results, the team decided that the High
Speed Assault Connect (HSAC) will be a design that involves
a number of medium size trimaran.
E. BEACHABLE VS. NON-BEACHABLE FEASIBILITY STUDY
Current amphibious operation’s use two different
methods to transfer troops and equipment to the beach:
First, a beachable craft with a relatively low draft that
is able to reach the beach and use a ramp to off-load
troops and equipment. Second, a non-beachable ship that
anchors or loiters 5-25nm off the beach and uses LCAC´s or
AAV’s to transport troops and equipment to the each. Though
both of these delivery methods are proven technologies,
neither can meet the distance, speed, and sea state
requirements that the current seabasing requirements
stipulate. Thus the HSAC design must replace or augment
these amphibious landing craft technologies.
The design team decided that the HSAC would either be
a beachable ship or a non-beachable ship. The beachable
variant would take the requisite cargo from the Sea Base
directly to shore. The non-beachable variant would “ferry”
loaded landing craft from the Sea Base to a short distance
from the beach and then allow the landing craft take the
cargo ashore. A feasibility study was conducted on each to
determine which alternative to pursue.
After reviewing the Naval Research Advisory
Committee’s (NRAC) concept for a LCAC “ferry,” the team
initially believed that a non-beachable design that would
“ferry” LCACs to and from the Sea Base would be the easiest

35
and more direct design to implement[3]. Since LCACs are
already actively employed, this design would require few
tactical changes. It would extend the effective range of
the LCAC from the Sea Base and would help minimize the
effect the sea state has on LCAC performance by
transporting the LCAC through the worst seas. The design
automatically addressed the beaching issue by using the
LCAC which is a proven high speed connector. Since the
HSAC does not have to beach itself, the draft of the
connector “ferry” would not be as big an issue and it is
kept at a safer distance from the potentially hostile
beach.
However, a LCAC can carry a maximum payload of 60LT
and weighs 200LT when fully loaded. To move the
approximate 8000LT of vehicles, troops, and gear that
comprises two BLTs, at least 114 LCACs would be required,
well above the current U.S Navy inventory. Thus a LCAC
“ferry” design would require a significant payload capacity
and significant number of ships to transport enough loaded
LCACs to make the design worthwhile. Though the HSAC could
be designed to facilitate multiple LCACs trips in an effort
to reduce the number of LCACs required, the LCAC’s 30
minute load and unload time combined with the HSAC transit
time could exceed the 10 hour period allowed. Finally the
mean time between failures of the LCAC and its approaching
end of service life was of concern, greatly affecting the
reliability of the overall system.
To start the beachable design analysis, the team
examined the characteristics and capabilities of the
Newport class LST. Of note from this examination was that
the LST could carry 3000LT of cargo, had a 16ft average
draft, had a stern gate for amphibious vehicle deployment

36
and recovery, and had a deployable bow ramp. The Newport
class LST performed a mission similar to the HSAC and
proved that a large vessel could be made beachable. From
here the team determined that newer technologies in the
area of hull forms, structure, and propulsion could greatly
enhance the design concepts implemented in the LST. The
beachable variant would also provide a single connector
solution that would maximize the 10 hour employment time.
As a single connector solution, the design keeps the
loading and unloading interfaces to a minimum, greatly
increasing the overall reliability.
Making a craft beachable, however, creates structural
issues for bow ramp design and requires additional
structural reinforcement to facilitate beaching. The
additional structure required along with the draft
constraint could limit hull form options when trying to
achieve high speeds with larger payloads. Beachable craft
are more susceptible to shallow water mines than LCACs,
requiring a low mine threat or mine clearance prior to
beaching. Also, the beach characteristics (obstructions,
slope, etc.) affect beachable vessels ability to land more
than air cushion craft.
The technical risks posed by the beachable design
seemed more surmountable than those posed by the LCAC
“ferry,” especially when a similar design had been
implemented in the past. The beachable design provided a
single connector solution that could carry a significantly
larger payload. The payload capacity would be used for the
required cargo and not have to account for the extra weight
imposed by LCACs, reducing the number of ships required to
complete the mission. After examining the pros and cons

37
for each design variant it was determined that a beachable
HSAC would be the most feasible alternative and the team
proceeded to conduct its detailed design of the HSAC.
F. REFERENCES
1. Design Trends in High-Speed Transport Colen Kennell
(Marine Techonology, Vol 35, No.3, July 1998, pp 127-
134)MIT spreadsheets
2. TSSE 2003 Final Report.
3. Mendlow, Larry. Seabasing. Presentation given to
TSSE students at the Naval Postgraduate School regarding
NRAC’s studies and ideas regarding seabasing. Monterey,
CA. 5 August 2004.

38
THIS PAGE INTENTIONALLY LEFT BLANK

39
IV DESIGN PROCESS
A. CARGO DESIGN
1. Establishing the Cargo Parameters
As stated in the initial requirements, the system or
systems of HSACs needed to be capable of transporting two
Battalion Landing Teams (BLT) of a 2025 JEB from the Sea
Base to shore within ten hours. The joint nature of the
force and future time frame made it difficult to define
exactly what vehicles, troops, and equipment would comprise
a 2025 JEB. SEA-6 used the United States Marine Corps
vision of a 2015 MPF(F) MEB as a surrogate [1] to develop
the notional 2025 JEB listed in Appendix V. The 2025 JEB
listed in Appendix V listed the weight, area, and volume
for all the vehicles in the BLT. This provided an accurate
picture of what needed to be transported, how much it
weighed, and how much area it occupied. With this data in
hand, a thorough analysis could begin on interface design
and cargo placement.
2. Cargo Load Plan Development
The analysis of alternatives conducted earlier
determined that a system of 10 medium size trimarans, each
with a payload capacity of 800LT would be capable of
transporting the two BLTs. However, the analysis of
alternatives primarily examined the weight that needed to
be moved and not the footprint area of the vehicles. The
initial hull form design provided for a large cargo deck,
24.4m wide and 76.2m long, that spanned the side hulls of
the trimaran, providing 1859m2 of cargo area. The first
step then was to ensure that the two BLTs would fit across
10 HSACs.

40
Table 2. Vehicle Data
Vehicle 2 BLTs Length Width Area HeightHumvee 204 16.84 7.1 119.564 8.5EFV 98 29.85 12 358.2 10.46M1A2 28 32.25 12 387 9.47LAV 50 27.09 8.73 236.4957 8.825ABV 4 32.25 12 387 9.47AVLB 2 31 12 372 10.46M9ACE 8 22 12 264 10.46M88A2 2 29.38 11.25 330.525 10.25ITV 16 16.67 5.67 94.5189 5.5AVENGER 10 16.25 7.17 116.5125 8.67MTVR 38 22.75 8 182 9.34LW155 12 30.43 9.09 276.6087 7.42M105 16 13.78 6.93 95.4954 8.17MK155 6 15.03 7.98 119.9394 6.17M101 34 12.24 6.14 75.1536 6.93M149 2 13.42 6.86 92.0612 6.37M116 2 12.34 6.25 77.125 2AN/TPQ 2FORKLIFT 8 23.63 8.53 201.5639 10.14CONTACT TRUCK 4 22.75 8 182 9.34
Vehicle Total: 546
First, data was compiled and tabulated in Table 2 on
all of the vehicles to include length, width, height, and
weight. In some cases there were multiple variants of the
same vehicle or piece of equipment. When faced with this
situation, the heaviest weight and largest dimensions of
the multiple variants were used. This allowed the design
to be geared towards the worst case scenario and ensured
that all vehicle variants would fit in the design. Also,
several items in the BLT are vehicles still under
development for which exact data was not readily available.
The design team was forced to use conservative estimates
for these items based on available data or existing
vehicles of similar size. All of the weights used to
describe the vehicles in the BLT include fuel, personnel,
and the gear which the vehicle would carry.
41
Next, the footprint for each vehicle within one BLT
was constructed and then placed across 10 of the initial
cargo decks. To ensure loadout flexibility and
feasibility, a 0.9m buffer separated each vehicle from a
neighboring vehicle or ship structure. Though only one BLT
was being placed on the ships, doubling the resulting
placement would yield the overall weight and area
requirements for two BLTs. After placing one BLTs worth of
vehicles across the 10 cargo decks, 960m2 of cargo area was
occupied leaving only 899m2 for the second BLT. In
addition, this notional cargo deck did not include any
interfaces to provide access to the cargo deck, which would
further reduce the amount of area available cargo area.
Thus, it was determined that initial cargo deck did not
provide enough usable cargo area for two BLTs. It was also
noted that the average loadout for one BLT over 10 HSACs
was 420LT, making the average payload for two BLTs 840LT.
This average payload exceeded the design payload by 40LT.
Due to the average payload weight and area requirement
issues discussed above, it was decided to distribute the
two BLTs across a system of 12 ships. Two BLTs occupied
19,200m2 based on the initial 10 ship analysis. Using 12
HSACs would provide 22,311m2 of cargo area, comfortably
holding the two BLTs, while allowing for cargo deck
interface placement. It would also allow one BLT to be
embarked across six ships, providing mission commanders the
ability to add or remove BLTs easily as the mission needs
dictate.

42
Table 3. 1 Battalion Landing Team distribution
Vehicle SHIP 1 SHIP 2 SHIP 3 SHIP 4 SHIP 5 SHIP 6qty qty qty qty qty qty
Humvee 17 137700 17 137700 17 137700 17 137700 17 137700 17 137700EFV 9 655911 8 583032 8 583032 8 583032 8 583032 8 583032M1A2 2 278160 3 417240 3 417240 2 278160 2 278160 2 278160LAV 5 145000 4 116000 4 116000 4 116000 4 116000 4 116000ABV 0 0 0 0 1 139080 1 139080AVLB 0 0 0 1 93194 0 0M9ACE 0 0 1 37799 1 37799 1 37799 1 37799M88A2 0 1 140000 0 0 0 0ITV 1 7900 1 7900 1 7900 2 15800 1 7900 2 15800AVENGER 1 8300 0 1 8300 1 8300 1 8300 1 8300MTVR 4 164000 3 123000 3 123000 3 123000 3 123000 3 123000LW155 1 9200 1 9200 1 9200 1 9200 1 9200 1 9200M105 2 10720 2 10720 1 5360 1 5360 1 5360 1 5360MK155 0 0 1 6405 1 6405 1 6405 0M101 2 5678 2 5678 4 11356 2 5678 4 11356 3 8517M149 0 0 0 0 0 1 2600M116 0 0 0 0 1 2360 0AN/TPQ 1 43756 0 0 0 0 0FORKLIFT 1 10000 0 1 10000 1 10000 0 1 10000CONTACT TRUCK 0 0 0 2 40000 0 0TOTAL PAYLOAD (LB) 1476325 1550470 1473292 1469628 1465652 1474548TOTAL PAYLOAD (LT) 659 692 658 656 654 658
Using a 12 ship system also reduced the average
loadout weight to 663LT with a worst case loadout of 693LT,
both well below the design payload amount of 800LT. With
the worst case payload over 100LT less than the ship’s
maximum payload, the HSAC will be able to grow and adapt to
new equipment and loadout requirements in the future.
Table 3 illustrates how one BLT was distributed across six
HSACs.
3. Cargo Deck Design
The initial cargo deck layout was established to carry
one sixth of a BLT, approximately 46 vehicles. Also
determined in this initial work was the need for a stern
gate for cargo on load at the Sea Base or Forward Logistics

43
Station (FLS). A bow ramp was also determined to be
necessary for the offload of cargo at the beach. To
continue with the detailed design work for the cargo
spaces, it was necessary to establish the dimensions of the
cargo spaces and to examine specific vehicle storage
locations. The design team determined that it was prudent
to allow for extra room within the cargo spaces to account
for structural members and sufficient space for personnel
to access any of the vehicles. Also of importance to the
design team was to establish a cargo floor plan which would
allow for rapid loading and unloading of vehicles.
The analysis of the cargo spaces to determine how many
ships were necessary to transport both BLTs determined that
two levels of cargo decks would be necessary to accommodate
all of the vehicles. The largest area available within the
hull was located on the first deck spanning the beam of the
ship to include the side hulls, approximately nine meters
above the baseline of the ship. Given a beam of 30 meters,
the main cargo deck was limited to 21.4 meters in order to
allow for structure and additional spaces or passageways
that may be determined to be necessary on the same deck.
In order to retain the main cargo deck within the area of
the ship that extends from the main hull to the side hulls,
the length was determined to be 76 meters, with the space
beginning at the stern of the ship. A minimum of four
meters of deck height was determined in order to allow for
sufficient overhead clearance for any vehicle or container
which the ship would carry.
The additional cargo deck was placed one deck below
the main cargo deck and is restricted by the beam of the
main hull, approximately 5 meters above the baseline. This

44
was determined to be the best location because it would
allow for storage of the heaviest vehicles lower in the
ship, keeping the KG of the cargo as low as possible. In
order to fit the largest vehicles single file, it was
necessary for the compartment to be five meters wide. This
cargo deck was to span the entire length of the ship in
order to permit vehicles to drive in from the stern of the
ship and drive out through the bow. Again, a minimum deck
height of four meters was deemed necessary.
Figure 12. Main and Lower Cargo Decks Fully Loaded
Vehicle flow through the cargo spaces was of great
importance to the design team because this would be a
critical factor in allowing for rapid on and offload of the
vehicles when conducting the primary mission. Several
design features were developed in order to enhance the flow
of cargo through the ship.
With the vehicles loading from the stern of the ship
at the Sea Base or FLS, they would be able to roll on
through the stern gate and would be easily stowed for
transport facing the bow of the ship. When the ship is at

45
the beach, the vehicles are facing forward and just simply
will need to drive forward off the ship. Figure 12
provides a cut-away view of the cargo decks inside the
ship.
A problem the design team faced was how to effectively
move cargo from the lower cargo deck to the main cargo
deck. Both the stern gate and bow ramp were determined to
be located on the lower cargo deck level since that deck
would pass through the entire length of the ship. A system
was necessary to allow the loading vehicles at the stern to
gain access to the main cargo deck, and also for those
vehicles to easily move back down to the lower cargo deck
during offload.
Fixed ramps were determined to be the best design to
address this problem. As the vehicles roll on through the
stern gate, they will need adequate space to either access
the fixed ramp to drive up to the main deck, or pass to the
side of the ramp and travel through the lower cargo deck.
At the forward end of the main cargo deck, a second fixed
ramp would allow the vehicles on that deck to drive down to
the lower cargo deck and then out through the bow. Again,
adequate space would be necessary for the vehicles on the
lower deck to pass by the fixed ramp and continue forward
to the bow. Both ramps have an 18 degree slope.
Limited by the main hull beam of xx meters, the design
team desired to keep the lower cargo deck footprint within
a 10 meter boundary. This permitted the lower cargo deck
to have a width of five meters and for the forward and aft
ramps to also have a width of five meters. In order to
make it all fit within the confines of the main hull, it
was decided to place the lower cargo deck to the left of

46
centerline. The starboard bulkhead of the lower cargo deck
would be on the ship’s centerline with the port edge of the
forward and aft ramps also located on centerline.
Through the ongoing collaboration with the hull and
propulsion designers, space for the intake and exhaust
ducts used by the gas turbine engines was to be allocated
within the cargo area. The necessary space was three
meters wide and twelve meters long. The engines were
placed one deck below the lower cargo deck, and the intake
and exhaust plenums would need to pass through both cargo
decks along the ship’s centerline.
There was adequate space in the main cargo deck, but
the space intruded too much into the lower cargo deck,
leaving only three and one half meters of width along the
twelve meters of the intake and exhaust space. By
extending the lower cargo deck from centerline all the way
to the structure of the port side of the main hull, the
minimum width of five meters was still achievable.
3.00
5.00
12.1913.99
76.20
21.3
4 13.109.13
12.00
4.96
5.00
100.91
11.5
0
Figure 13. Main and Lower Cargo Deck Dimensions
(meters)
Approximately 12 meters ahead of the forward ramp, the
lower cargo deck narrows to a width of five meters for the
remainder of the distance to the bow ramp. Figure 13

47
provides dimensions for each cargo deck and the forward and
aft ramps.
Although the heating and ventilation system has not
been engineered in this iteration of the ship design
process, the design team identified the need for sufficient
ventilation to be installed on both cargo decks. This is
necessary to remove exhaust gasses while the vehicles are
being on and offloaded, or whenever the vehicle engines may
be started while inside the ship.
4. Vehicle Models
Three dimensional AUTOCAD models were obtained from
Northrop Grumman Ship Systems of the vehicles which were to
be carried by the ship. In several instances, the design
team was forced to use similar type vehicles to simulate a
vehicle for which a model was not available. For instance,
a model of the M1A1 tank was used to simulate the M1A2.
Figure 14 shows the three dimensional model of an MTVR
which was used for the design.
Figure 14. Three Dimensional Model of an MTVR
Three dimensional blocks were satisfactory for
modeling the space which each vehicle would occupy, but the
value of the actual vehicle model was excellent as a means
to provide an accurate visual demonstration of how the
vehicles will occupy space inside the cargo decks.

48
To ensure that the vehicles would fit within the cargo
deck spaces, a one ship load-out was developed using the
vehicle models. The design team found that the cargo decks
provided adequate space for all of the required vehicles,
with room for additional vehicles or for the vehicles to be
moved while fully loaded.
The design vehicle load-out places the heaviest
vehicles on the lower cargo deck. This includes the M1A2
tank and the Expeditionary Fighting Vehicle (EFV), which
will be stowed single file along the length of the deck.
This assists with keeping the KG of the cargo as low as
possible. The average cargo weight per ship is 663 LT with
a vertical center of gravity (KG) of 8.6 meters.
Also, since these vehicles are more difficult to
maneuver, they will simply drive straight in and out of the
ship with little or no need to maneuver. Only the vehicles
stored aft of the forward ramp will need to negotiate a
slight turn to centerline. With twelve meters of distance
to move approximately three meters laterally, all of the
vehicles will be able to negotiate this turn. The EFVs can
be loaded in reverse so that they may easily drive back out
through the stern gate while the ship is underway or
beached.
While the main cargo deck is capable of holding any of
the vehicles to be carried by the ship, it is designed to
carry the lighter and more numerous vehicles. The lightest
vehicles will be stored on the extreme port and starboard
sides of the deck to minimize stress on the structure
supporting the side hulls. There is also enough room on
the main cargo deck to maintain a clear path from the aft
ramp to the forward ramp with all of the vehicles onboard.

49
The obstacle caused by the gas turbine intake and exhaust
is approximately 13 meters aft of the forward ramp,
allowing room for all of the vehicles to maneuver around
the obstruction and access the ramp.
5. Stern Gate Design
The key to achieving a rapid cargo on and offload rate
was to design a simple and effective way for the cargo to
be brought onboard and to then be removed at the beach.
Since the ship will need to be able to load cargo at the
Sea Base in addition to at a port, a roll on system was
determined to be the quickest method.
Interfacing with the Sea Base proves to be the most
difficult aspect for cargo on-load because the ship must be
able to move cargo onboard in conditions up through sea
state four. At such a sea state, craning operations can be
slow and dangerous for both personnel and equipment. The
roll-on method allows for a safer operation at the higher
sea state without suffering a large degradation in the on-
load rate.
Another road block in the Sea Base interface is that
the composition of the Sea Base is not yet fully
understood. Referring to existing documentation and
exercises that have been used as test beds for the Sea
Basing concept (REF [2]), the design team decided to
interface the stern gate with a floating platform
comparable to the floating causeway system used in the Navy
Lighterage system. This platform would be provided by the
Sea Base and will not be an organic component of the ship.
The vehicles would be moved from an asset within the Sea
Base on to the floating platform. The method in which the

50
vehicles are moved at the Sea Base to the floating platform
was not considered in this design.
Figure 15. Stern Gate Operations at the Sea Base
A stern gate was chosen as the best method to allow
direct access to the cargo decks for the vehicle on-load.
The gate is 10 meters wide and nine meters high to allow up
to two vehicles to load simultaneously, with one vehicle
entering the lower cargo deck and the other driving up the
aft ramp to the main cargo deck. Since the stern gate
extends 4.5 meters above the lower cargo deck when in the
vertical position, there will be a recession in the stern
of the ship to allow for the gate to close completely and
create a watertight seal around the opening into the lower
cargo deck. The gate will be able to open from the
vertical closed position down through a 120 degree range of
motion. It will be raised and lowered using a hydraulic
piston system capable of holding the gate in the down
position while one vehicle drives on or off the ramp into
the water.

51
Figure 16. Stern Gate Operations at the Beach
Similar stern gates have been used onboard other U.S.
amphibious naval vessels, including the LPD-17 and LSD-36
class ships. Since this is a proven technology that is
currently in use, no further design work was done in this
iteration of the design process to allow the design team to
focus more on other areas of the ship design.
6. Bow Ramp
Keeping with the mindset that a roll-off design would
provide the most rapid means of off-loading the ship, the
design team developed a bow ramp that would allow all of
the vehicles to drive under their own power off the ship
and onto the beach. It was necessary to design a ramp
which would be an organic component of the ship, provide
adequate reach from the grounded ship to the beach, and be
able to deploy and retrieve in a timely manner.
Several options were considered for the bow ramp
design, to include a fixed ramp from the weather deck and
an inflatable ramp. The design that was ultimately chosen
is a floating ramp, comprised of eight five meters long
sections, providing an effective ramp length of 35 meters.

52
Figure 17. Bow Ramp Operation at the Beach
The fixed ramp design would have required the ramp to
be stored high on the ship so that it could be deployed
from the weather deck over the bow. This concept is
similar to that of the ramp design on the LST-1179 Newport
class ship. Since the vehicles were to be stored lower
inside the ship, the problem of getting the vehicles from
the cargo decks to the weather decks was an issue. In
order to deploy and recover the ramp over the bow, an
additional structure would be required on the bow. This
would result in more weight both forward and high on the
ship, and detract from the ship’s optical and radar cross
section.
An inflatable ramp appeared to be an attractive option
and received more analysis. This concept would use high
pressure air from the gas turbine engines to unroll and
deploy the ramp. The deck structure would be slatted to
allow the ramp to be rolled when deflated and stored inside
the ship. The high pressure air would both inflate and
unroll the ramp to the deployed position. This design had
the potential to be much lighter in weight compared to the
fixed ramp and would allow for the vehicles to offload from
the lower cargo deck.

53
The inflatable ramp concept was rejected because of
the many technical issues that were inherent to the design.
A means to rapidly retrieve the ramp was difficult to
develop, and the survivability of the ramp was
questionable. Assuming the ramp would be constructed of a
rubberized material capable of collapsing and rolling, it
would be susceptible to puncture from underwater objects or
hostile fire from the beach. A complicated bladder system
internal to the ramp would be necessary to ensure adequate
pressure throughout the ramp in the event of a puncture.
A floating ramp similar to the existing floating
causeway used in the Naval Lighterage System was chosen to
be the best alternative for the ship’s bow ramp design.
This design allows the ramp to be stored inside the hull of
the ship, can be rapidly deployed and retrieved, and allows
the vehicles to offload from the lower cargo deck. Table 4
compares the specifications of the NL floating causeway to
the bow ramp designed for the ship.
Table 4. Bow Ramp Specifications
NL Floating Causeway HSAC Bow Ramp
Structure Steel Steel and Aluminum
Length 27.4 m 35.0 m (effective)
Beam 6.1 m 5.0 m
Depth 1.7 m 1.7 m
Displacement 62.5 LT 41.9 LT
Capacity 80.4 LT 124.2 LT
A capacity of 124.2 LT permits the bow ramp to hold up to
two M1A2 tanks at one time. Since a typical ship load-out
will typically consist of two or less M1A2 tanks, this

54
constraint will not have a negative impact on the cargo
off-load rate. At full load, the bow ramp will have a
draft of 0.94 meters, leaving 0.76 meters of freeboard.
Bow ramp stability calculations were not conducted for
this iteration of the ship design process. When deployed,
the ramp will be connected to the ship and will also make
contact with the bottom near the beach. Since these two
supporting forces will be acting on the ramp in addition to
the buoyancy force acting over the length of the ramp,
stability in a variety of loading conditions should be
acceptable. As such, the design team left these
calculations to be completed in a later iteration of the
design.
The ideal storage location for the ramp was found to
be just below the lower cargo deck. Since the ship will
likely add ballast astern when beaching, the ramp will need
to drop a short distance from its storage level to the
waterline once deployed. This presents a problem for
recovering the ramp if it needs to be lifted out of the
water while being retrieved.
In order to allow the ramp to move in and out of the
ship and negotiate the change in height, the ramp is split
up into eight five meters long sections. A flexible
coupling system, similar to that found in the NL floating
causeway, permits the ramp sections to bend as necessary to
move in and out of the ship. Future developments with the
Improved Naval Lighterage System (INLS) will further
enhance the coupling system, allowing sections to be
remotely detached by a pneumatic actuating system.
(REF[4]).

55
Figure 18. Bow Ramp Track with Rollers (seven of eight sections shown)
The ramp will be stored on a track just under the
lower cargo deck. The track will have a series of rollers
and each section of the ramp will have a grooved track
embedded within the structure. One end of the ramp section
groove flares open to a wider opening, allowing that
section to make the height transition while being retrieved
and deployed. Figure 18 illustrates how the roller track
inside the ship interfaces with the grooved track on each
ramp section.
The first ramp section, the end which will touch the
beach, is sloped so that the vehicles can negotiate the
transition from the ramp to the beach. More importantly,
it allows easier access for the vehicles to drive from the
beach back on to the ramp when conducting loading
operations at the beach.
An electric motor will be dedicated to the task of
deploying and retrieving the bow ramp. It will drive the
ramp out by pushing on a rigid connection with the last
section of the ramp. The last section, or section number
eight, will not leave the ship when the ramp is fully
deployed. This section will have a mechanical stop to
prevent it from leaving the ramp track, and will provide
the rigid connection for the ramp to the ship and act as

56
part of the transition from the lower cargo deck to the
floating ramp. For retrieval, the rigid connection to the
eighth section will pull the ramp back into the track. The
motor and connection system is estimated to deploy and
retrieve the ramp at a rate of 0.22 meters per second,
resulting in a deployment and retrieval time under three
minutes.
Figure 19. Operations at the Beach
7. Bow Doors
The floating bow ramp design required a method to
allow quick, reliable, and efficient ramp deployment and
recovery, while at the same time providing a clear vehicle
path from the lower cargo deck to the ramp. Deployment and
recovery rates of the vehicles and ramp would be maximized
if both could utilize the same path. This would reduce the
total number of interfaces involved, reduce the number of
points of failure, and provide a straight path from the
ship to the beach. Therefore, it was determined that bow
doors needed to be designed.
Though no current displacement craft in the U.S. Navy
inventory has bow doors, pre-Newport class LSTs and current
operational commercial ferries have implemented bow doors,
proving their feasibility and functionality. The Newport
class LST moved away from bow doors to allow for a fine

57
bow, in order to achieve its design requirement of 20+
knots. The trimaran hull form also has a fine bow, making
the design of bow doors a challenge. However, today’s
structural and material technology makes large bow door
development possible.
Placing doors in the bow, where the ship experiences
extreme forces due to ship speed and the overall sea state,
causes concern for water intrusion into the ship. Current
commercial ferries have addressed this problem in their
design by developing watertight doors that are located
directly aft of the bow doors. This technology will
maintain the watertight integrity of the HSAC while
transiting at high speeds and in high sea states.
Having decided that bow doors were feasible, the next
step was to determine what type of bow opening to
implement. Regardless of the implementation chosen, the
bow opening would need to be large enough for both the
vehicles and ramp to pass through. The first approach
considered was a single piece door that was hinged on one
side of the hull and latched on the other side. The
concept was that the door would swing open to one side as
one unit. However, even if the door itself was
manufactured from composites, it would place an extreme
load on the door hinge. Handling this intense load would
require a massive amount of structure, adding weight to the
bow and reducing the available space for the door opening.
In addition, the single door must travel through a large
range of motion before the ramp and vehicles can exit the
ship. This large range of motion increases the amount of
time between the ship beaching and the first vehicle
hitting the beach, which is undesirable in a hostile

58
environment. These three issues were unacceptable to the
design and therefore the single swing out door was
rejected.
The design team then considered the possibility of
having two bow doors that would swing outward from the
ship. This solution greatly reduced the amount of stress
and weight the hinges would have to encounter. It also
reduced the range of motion required for the doors since
they would open outward from the centerline. However, the
bow of the trimaran hull had extreme curves making hinge
design extremely difficult. Though an elaborate hinge
could be developed to facilitate dual bow doors, its
complexity could make it prone to failure. Due to the
technical risk of hinge development, the dual outward
swinging bow doors were eliminated as a design alternative.
Next the design team looked at developing a bow that
would flip open similar to how the nose of a C-5 Galaxy
transport aircraft opens, as Figure 20 illustrates. This
design was attractive in that the only hinge required would
be along the flat weather deck. The portion of the bow
that would open could be made of composites or aluminum
reducing the amount of weight that needed to be lifted.
Hydraulic rams would then be used to lift the bow up,
allowing the ramp and vehicles to exit the ship. Since the
hinge would be a simple design and hydraulic rams are a
proven technology, this solution would be highly reliable.
In addition, this solution reduced the number of door seals
required. With the bow swinging up there would be only one
seal required horizontally along the lower edge of the door
and two (one on each side) seals going vertically up the
hull where the bow section met the hull. This design was

59
deemed more feasible and more functional than the previous
two design alternatives and therefore considered a possible
alternative.
Figure 20. C-5 Style Bow Door
Though extremely functional from a cargo access and
ramp deployment perspective, the C-5 style bow door option
did not work well with the amphibious support requirements.
With a desire to have main gun mounted on the bow, having
the bow door flip up severely limited the firing arcs of
the main gun when the door was open. The purpose of the
main gun was to provide suppressive and cover fire for the
troops and vehicles as they left the ship and hit the
beach. Since this style door opening prevents the main gun
from performing as required, another bow door alternative
needed to be developed.
The design team then reexamined the dual outward
swinging bow door design. Instead of having the doors
hinged and swinging outward, the doors were mounted on
hydraulic actuators and pushed directly outward. The
hydraulic actuators solved the hinge problem by eliminating
the hinges completely. Thus, the doors could be sized just
large enough to facilitate a 5m wide and 6.2m high opening
for vehicle passage and ramp deployment. By using
hydraulic actuators, the range of motion for the doors was

60
reduced as the rear part of the door had to move outward
less than the forward portion of the door. The doors would
be constructed of composite materials for reduced weight
and higher strength. Figure 21 depicts how the
hydraulically actuated bow doors would function.
Figure 21. Hydraulically Actuated Bow Doors
The hydraulically actuated bow doors proved the most
functional and feasible design solution for the HSAC
design. In addition to implementing this bow door setup,
the design team placed an armored watertight door aft of
the bow doors. The addition of the watertight door not
only added watertight integrity to the ship, but the armor
plating provided crew and cargo protection during bow door
opening and ramp deployment.
8. Flight Deck and Flight Elevator Design
The HSAC needed to be able to facilitate the launch
and recovery of the various rotary winged aircraft of the
2025 JEB. Of particular interest were the CH-53X, MV-22,
and SH-60R due to their logistics role with the Sea Base.
Having an overall length of 30.3m and a maximum width of
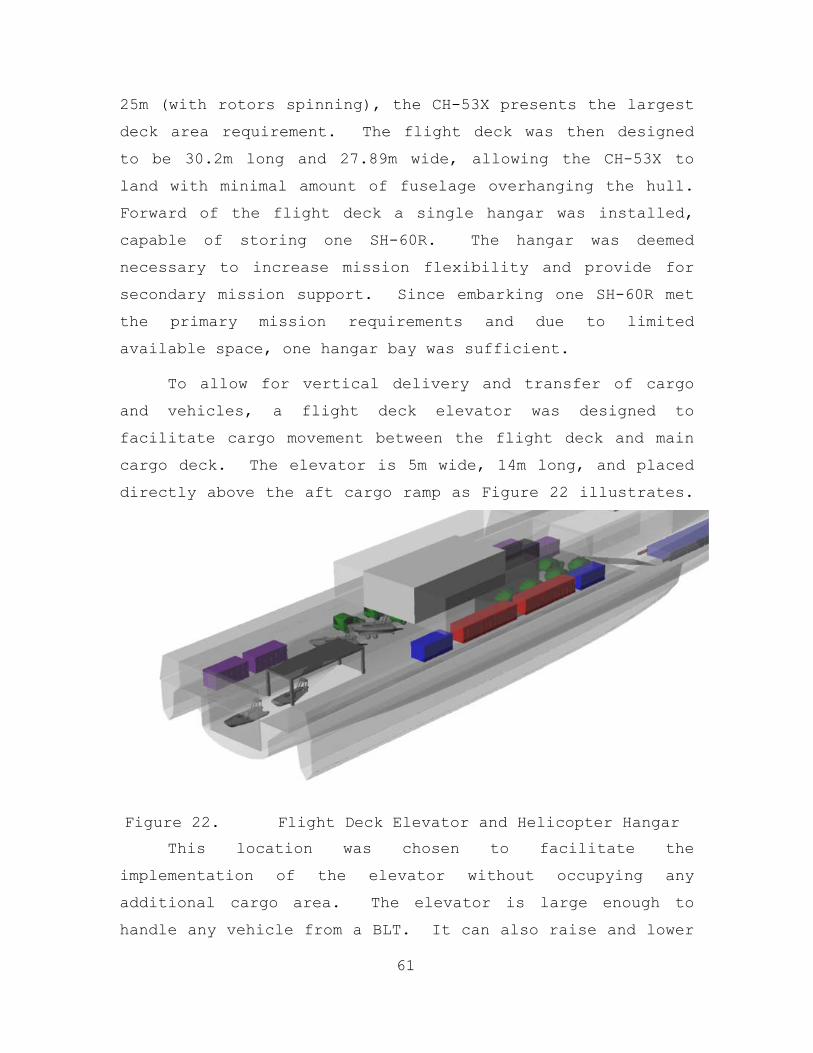
61
25m (with rotors spinning), the CH-53X presents the largest
deck area requirement. The flight deck was then designed
to be 30.2m long and 27.89m wide, allowing the CH-53X to
land with minimal amount of fuselage overhanging the hull.
Forward of the flight deck a single hangar was installed,
capable of storing one SH-60R. The hangar was deemed
necessary to increase mission flexibility and provide for
secondary mission support. Since embarking one SH-60R met
the primary mission requirements and due to limited
available space, one hangar bay was sufficient.
To allow for vertical delivery and transfer of cargo
and vehicles, a flight deck elevator was designed to
facilitate cargo movement between the flight deck and main
cargo deck. The elevator is 5m wide, 14m long, and placed
directly above the aft cargo ramp as Figure 22 illustrates.
Figure 22. Flight Deck Elevator and Helicopter Hangar
This location was chosen to facilitate the
implementation of the elevator without occupying any
additional cargo area. The elevator is large enough to
handle any vehicle from a BLT. It can also raise and lower

62
a folded SH-60R allowing the main cargo deck to be used as
a large hangar for additional SH-60R helicopters when the
BLT is not embarked.
9. References
1. Naval Postgraduate School Technical Report,
"Seabasing and Joint Expeditionary Logistics", By Systems
Engineering and Analysis Cohort 6 (SEA-6). Montery, CA.
December 2004
2. PDF file saved in the following TSSE shared drive
location \\Kiska\TSSE\2004\Background\Reading\HSC-JLOTS
titled LIMITED OBJECTIVE EXPERIMENT 2-04: JOINT LOGISTICS
OVER THE SHORE
3. Phone call with Jeff Green, Mechanical Engineer,
Naval Surface Warfare Center, Carderock Division
4. Phone call with Lawrence Mendlow, Technical
Director, Sealift Support Program Office, Naval Facilities
Engineering Command
B. HULL DESIGN
1. Design Process
In order to design the best ship, from a system of
systems perspective, requires the right balance among a
large number of different systems. Each system is able to
perform efficiently in accordance with a given set of
requirements in the systems.
A major problem during the ship’s design process was
the multiple conflicting interests that changed the ship’s
design in numerous ways. When each sub-team, would change a
specific part of the ship’s system of systems, those
changes would influence the entire ship’s system. This made
a dramatic change in the performance of that system as a
whole. When designing a conventional ship, such as mono-

63
hull merchant ship intended for container transportation,
there is a lot of available information and theoretical
studies. But by changing one aspect of the ships system the
entire ship responds differently.
When designing a ship, intended for new concepts of
system, without previous experience or background, it opens
an environment with plenty of uncertainty in the ship as a
system. This increases the difficulty in starting the
proper design during the early stages of the process
causing new problems, new conflicts and new constraints
will emerge causing delays in the design process which
needs to be reviewed and analyzed for further changes. Many
studies where performed in this design in order to narrow
the number of alternatives and focus the final product for
a well balanced system of systems.
After the Analysis of Alternatives a trimaran hull was
selected as the best platform. There is a growing interest
in trimaran hulls for multiple purposes, a great number of
preliminary designs and studies can be found in the
literature, but very few of them are already in operation.
Because of this, any preliminary calculations, such as hull
and structure weight can’t be done based on previous
designs and the risk of resulting in an unfeasible ship is
higher than normal.
Realizing that refinements would be necessary should
towing tank data be made available and the weight and
position of all equipment is known precisely, a preliminary
hull design was done in order to produce working estimates
and show possible conflicting areas.
The goals of this preliminary design were:

64
• Produce a feasible design that can be reasonably built with short or mid term technology.
• Analyze the space available for cargo.
• Analyze the different ways that cargo can be transferred to shore.
• Conduct a preliminary structure analysis to determine the expected hull weight and possible interferences with cargo movement on board.
• Determine if enough space is available for engines and other machinery.
• Study different types of propulsors.
The ship also must be able to operate in shallow
waters, getting as close as possible to the beach in order
to unload the cargo and at the same time possess enough
speed, range, seakeeping and maneuverability qualities to
operate in open waters.
A recently trimaran built by Austal Shipyards, the
“Benchijigua Express” owned by Fred Olsen Lines and
intended for cargo and passenger traffic, represents one of
the most advanced trimaran already built. Based on her main
particulars a trimaran hull was drawn. This served as the
“parent” hull for our dsign.
2. Type
During the past several years the subject of high
speed sea transportation, for both civil and military
purposes, has experienced important developments. Aviation
based gas turbines, fast diesel engines, water jets and
other emerging technologies applied to ship design can lead
to speeds at sea without precedents.
In order to take advantage of these power plants,
naval architects are exploring new hull configurations

65
other than traditional monohulls. Although a great variety
of hull configurations can be used for fast speed
transportation, some of them are still conceptual designs
and others have been successfully used.
In order to determine the optimal hull configuration,
several hull types were evaluated:
• Hydrofoil
• HYSWAS
• SES
• Semi-Planning
• Monohull
• Catamaran
• Trimaran
• SWATH
The analysis was done using the Maritime Applied
Physics Corporation’s spreadsheet collection (MPAC). This
tool uses primary basis vessels for each type of hull to
provide the block coefficients and ratios L/B and B/T.
The inputs were desired speed, range, payload, sea
state, and maximum displacement. Speed loss due to sea
state was considered for the alternatives. A detailed study
of the different alternatives and MPAC’s result can be find
in Chapter III.
The goal of this Analysis of Alternatives was to
identify the optimal hull configuration and narrow the
number of hull alternatives to a manageable level for the
available time to conduct the present study.
Hull types such as SWATH and Hydrofoils were initially
rejected because of excessive draft for a ship that is
intended for shallow waters. Planning hulls were also

66
rejected due to excessive vertical accelerations when
planning, which were considered too high for heavy weight
transportation and also due to highly demanding structural
reinforcements.
Candidate hull types, which can be built using short
and mid term technology and with a relatively low
technological risk, were monohulls, catamarans, trimarans
and Surface Effect Ships (SES). Each one of them presents
clear advantages and disadvantages. The following sections
present some of the advantages and disadvantages of these
candidate hull types:
a. Monohull
A monohull is the traditional type of hull and
there is large experience designing, building and operating
them. This type of vessel, due to the amount of available
information and experience, is the less risky option. It
requires less development effort and, therefore, is one of
the cheapest alternatives. Research and development
expenses, that will increase the overall cost of the
project, are estimated as low for this kind of hulls.
Having large hull volume, monohulls offer great
flexibility when designing cargo spaces, engine rooms and
accommodation. Due to their large water plane area, and
consequently their relative tolerance to loading changes,
they can be operated with a variable deadweight. Therefore,
they provide the biggest growth margin for future
requirements. Monohulls also provide satisfactory
seakeeping, when sailing in open waters, and adequate
maneuverability when getting close to shore. Most
amphibious ships are monohulls and their operation is
satisfactory for most of the world navies.

67
Figure 23. Newport Class LST (www.fas.org)
At ordinary cruise speeds a monohull becomes a
very attractive option and is worldwide accepted as an
excellent cargo platform. However, when the speed
increases, the power plant becomes excessively large and so
does fuel consumption.
Another important handicap arises when placing
heavy load in upper decks, namely the lack of adequate
stability. The HSSC is intended for different scenarios and
will have a large number of different cargo configurations.
Flexibility is a very important goal to achieve in this
application. Stability is also a major concern when
considering helicopter operations. Several of these aspects
can be improved using a multihull platform.
b. Trimaran
Although few trimarans have been built recently,
there are enough conceptual studies that have been centered
on a trimaran hull configuration.
Figure 24. Triton Research Vessel (www.globalsecurity.org)
68
Some of the relevant characteristics can be
summarized as follows:
• Hull Resistance: A slender center hull with large L/B ratio offers reduced hull resistance compared to an equivalent monohull, especially at high speeds. Although the outrigger hulls increase the overall ship resistance, this is compensated by the savings in center hull resistance. Therefore, a smaller power plant is required and the resulting fuel savings can be important. Less fuel means that more cargo can be transported at faster speeds than a similar and comparable monohull.
• Seakeeping and Stability: A trimaran’s outrigger hulls provide improved transverse stability which means that heavy weights can be transported in the upper decks with minimal stability degradation. Trimarans are able to operate in higher sea states compared to other hulls configurations, especially when compared to catamarans, which can exhibit a “corkscrew” motion. The HSSC is intended to transport troop ready-to-fight and their comfort is an important concern. Secondary missions for HSSC such as medical and humanitarian evacuation also require superior seakeeping.
• Deck Area: Trimarans have about 40% more deck area for a given tonnage than monohulls and this fraction can be increased with increasing side hull separation, although the latter may result in resistance and seakeeping compromise. This extra deck area offers great flexibility for accommodation purposes. Furthermore, it offers more space for helicopter operations and cargo arrangement. Side hulls separation is not a free variable and has some negative effects, requiring more structural weight and may result in increased resistance due to wave interference. The 2003 TSSE project offers a very detailed study of both resistance and seakeeping characteristics of trimaran hulls similar in size to the one considered in this work. Most of the results obtained from the 2003 study have been incorporated in this study as well.

69
c. Catamaran
Catamarans are a popular option for passenger
transportation and many of them have been built and are in
operation during the past several years. Since a catamaran
is a multihull, it exhibits many of the same advantages as
trimarans, namely large deck area and improved stability.
On the other hand, they have reduced waterline area,
limiting the range of cargo conditions that can be used,
and a “corkscrew” motion in certain sea states and sea
directions that can cause seasickness for unaccustomed crew
and passengers.
Figure 25. Buque Bus (www.shiptechnolgy.com)
Crew comfort and embarked personnel combat
readiness is an important issue for the Sea Connector, and
the associated inability of catamarans to operate at high
sea states significantly handicaps this hull type’s
applicability in this problem. Finally, when we conducted a
preliminary study of existing catamarans, we saw that their
cargo capacity is far away of what HSSC is expected to
transport. Although cargo capacity will increase in the
future, there is an associated technical risk that should
be taken into consideration.

70
d. SES
Surface Effect Ships were initially conceived for
naval ship applications early in the 70’s. A SES greatly
minimizes the wetted surface by forcing air down between
the two hulls and resulting in a low resistance. A SES also
offers very low draft, which is an important advantage when
trying to reach degraded beaches. In this aspect such ships
would exhibit the largest usability.
Power requirements in order to move the lifting
fans reduce dramatically their endurance and there are also
limited operational capabilities up to sea state 3. These
two issues became very negative aspects when the ship is
intended to be operated form a distant base (sea base)
located in open waters.
3. Selection
After the Analysis of Alternatives and the application
of the MOP criteria, the trimaran hull configuration
emerged as the preferred one. This result is in agreement
with the preliminary analysis of the different types of
hull discussed previously.
Trimarans are traditionally classified as multi-hulls
in clear opposition to monohulls. However, in many aspects,
their performance is closer to monohulls rather than
catamarans and, some authors prefer the term Stabilized
Slender Monohull.
As discussed above, their advantages and disadvantages
can be summarized as follows:
Advantages:
• Reduced hull resistance at high speed.
• Improved stability.
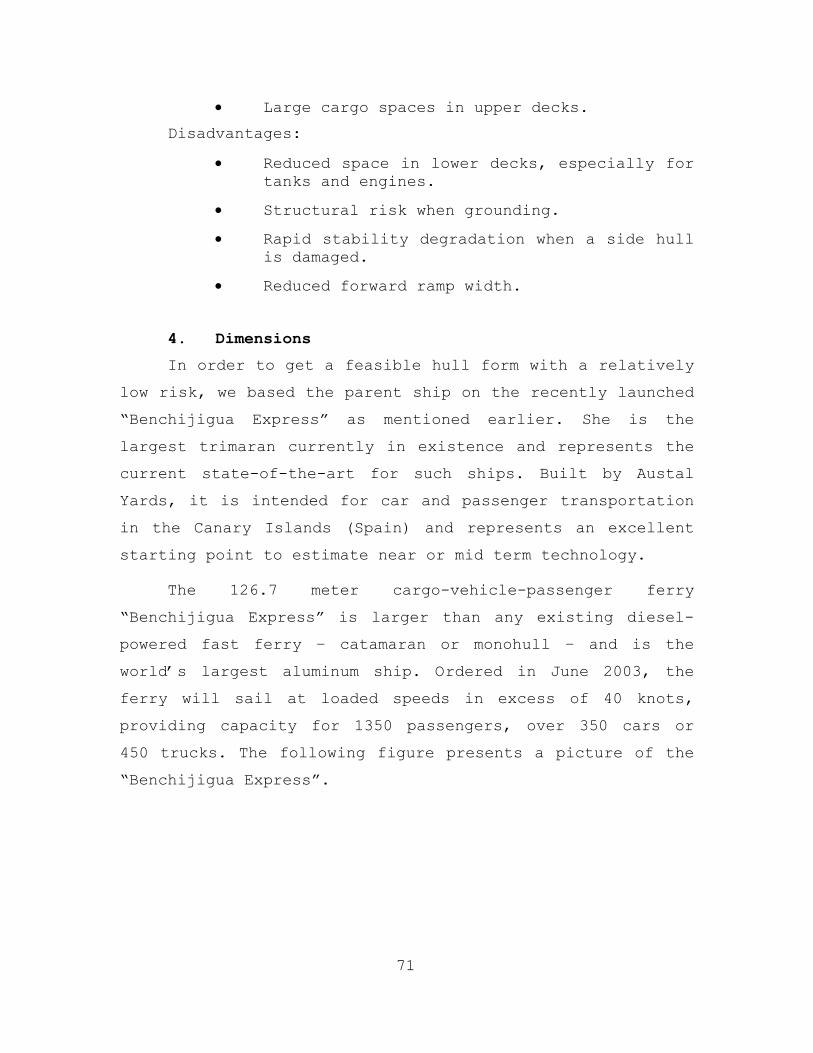
71
• Large cargo spaces in upper decks.
Disadvantages:
• Reduced space in lower decks, especially for tanks and engines.
• Structural risk when grounding.
• Rapid stability degradation when a side hull is damaged.
• Reduced forward ramp width.
4. Dimensions
In order to get a feasible hull form with a relatively
low risk, we based the parent ship on the recently launched
“Benchijigua Express” as mentioned earlier. She is the
largest trimaran currently in existence and represents the
current state-of-the-art for such ships. Built by Austal
Yards, it is intended for car and passenger transportation
in the Canary Islands (Spain) and represents an excellent
starting point to estimate near or mid term technology.
The 126.7 meter cargo-vehicle-passenger ferry
“Benchijigua Express” is larger than any existing diesel-
powered fast ferry – catamaran or monohull – and is the
world’s largest aluminum ship. Ordered in June 2003, the
ferry will sail at loaded speeds in excess of 40 knots,
providing capacity for 1350 passengers, over 350 cars or
450 trucks. The following figure presents a picture of the
“Benchijigua Express”.

72
Figure 26. Benchijigua Express
In order to determine the main dimensions and ratios
of our ship, other existing or conceptual trimarans, in
addition to the one mentioned above, were studied. Our
conclusions are summarized below:
5. Length/Beam Ratio (L/B)
Length/Beam ratios range between 8 and 18. Large L/B
ratios have the clear advantage of reducing the wave
component of the resistance requiring a smaller power plant
to be moved, especially at high speed. But these ships
require a careful study of the structural strength, and
this concern becames more important when the ship is
intended for heavy weights transportation and off-loading
onto a beach.
In order to minimize such risk we selected the
following range:
/ 11 14L B ≈ −
6. Froude Number (Fn)
The terms high and low speed must be used in
conjunction with the length of the ship. A 35kts carrier
can be a slow ship and a 15kts boat a fast ship depending
on the length. The non-dimensional Froude Number is defined
as:

73
VFngL
=
This is the relation between speed and length used to
link both dimensions. When Fn<0.4 the ship is said to be in
a displacement mode. Once Fn increases above 0.4 the ship
reaches a semi-displacement mode and, for higher values, is
said to be a planning hull. Although planning hulls require
less power when the sail above Fn=0.4, extra power is
necessary to initiate this regime.
We concluded that a planning hull was not desired for
the purposes of this design because of the increase of
vertical accelerations that will lead to higher structural
requirements and rugged slashes. This will present
difficulties during loading and off-loading and will
increase the risk for cargo integrity. Therefore, speed and
length were selected in order to keep the ship in a
displacement regime.
0.4 0.5Fn −
7. Cargo Ratio
As previously mentioned, the relative lack of adequate
information for existing trimaran ships was a major
concern. This resulted in some difficulty to estimate the
weights and the amount of cargo that the ship would be able
to transport.
From an analysis of existing ships, we concluded that
about 35% of the total displacement could be used for cargo
and consumables transport. In this way a 4900Ton vessel can
carry 1700Ton of cargo and fuel, fresh water and other
consumables.

74
Naturally these numbers would need to be verified and
will depend on other factors such as double bottom height,
placement of tanks under the deck, and cargo dimensions.
Some light items will require more room than others.
8. Center Hull Form
Having determined a feasible range of main dimensions,
ratios and proportion we analyzed different options to
generate a hull form that matched the requirements for the
ship.
The first step was to determine the midship section
coefficient. Three alternatives were considered as
discussed below:
Figure 27. Center Hull Form Alternatives
a. Alternative A
This results in a deep hull with very low beam
and squared bilges. This alternative provides the largest
L/B ratio but also the largest draft (T). This
configuration offers a very low wave-making resistance, due
to large L/B ratio, but it is highly penalized because of
the large draft. This was considered a negative aspect that
would limit the ability of the ship to reach the beach.
A short beam reduces the available space under
the deck to mount engines and will also present
difficulties with regards to proper arrangement of ramps
that allow cargo movement to upper decks and to shore.

75
b. Alternative C
This results in large values of beam and a
minimum draft. It has a clear advantage when trying to
reach the beach but by reducing the L/B ratio we lose the
advantage of low resistance at high speeds. It is a more
flexible option due to the large beam, which facilitates
engine room arrangement and cargo movement, but it is
highly penalized due to the increase in hull resistance.
C. Alternative B
This alternative is the one with intermediate
values of beam and draft and it also offers the least
wetted surface from all three. Although by increasing the
L/B ratio there will be an important reduction of wave-
making resistance, the reduced wetted surface will result
in less viscous resistance.
For the above reasons, alternative B was
preferred and was the selected one. It is also the
candidate midship section for the car ferry developed by
Nigel Gee and Associates for Norasia. A typical midship
section is shown in the following figure.

76
Figure 28. Typical Midship Section of Alternative B
9. Draft
Low draft is required to be able to reach the beach
easily. By selecting a medium draft hull form we are
penalizing the ability to carry out the ship’s mission.
In order to reduce this problem we used a parabolic
keel profile, reducing the draft forward. In addition,
water ballast tanks are located forward, under the double
bottom deck and, when empty, the ship will trim aft.
Figure 29. Parabolic Keel Profile
10. Side Hull Form
Side hull separation was selected in order to minimize
the overall hull resistance, looking for positive
interference between waves generated by center and side
Water Ballast Tanks

77
hulls. The TSSE 2003 Sea Swath project deeply analyzed this
configuration and their results were used in this study.
Based on their conclusions, the following length and
dimensions were selected:
• Length Side Hull = 40% Length Center Hull
• Volume Side Hull = 5% Volume Center Hull
When the center hull is sailing at a Froude Number
less than 0.4, in a displacement regime, the side hulls,
due to its shortest length, are operating closer to a
planning regime. Because of this peculiarity, the side hull
form corresponds to a typical planning hull with a deep V
shape.
The hull was modeled as NURBS surface using the
Autoship software. The following table and figure show the
ship’s main particulars and rendered shape.
Table 5. Ship Main Particulars
Main Particulars
Displacement ∆ 4923 Ton
Volume ∇ 4803 m3
Draft to Baseline
T 4.500 m
Overall Length LOA 149.000 m
Waterline Length
LWL 145.761 m
Molded Beam B 30.000 m
Waterline Beam BWL 13.158 m
Wetted Surface WSA 2194.761 m2
Max cross sect area
47.45 m2

78
Waterplane area WPA 1711.236 m2
Cp 0.731
Cb 0.586
Cm 0.801
Cwp 0.892
LCB from zero pt 70.225 m
LCF from zero pt 66.905 m
KB 2.763 m
BMt 4.383 m
BMl 503.215 m
GMt 7.146 m
GMl 505.978 m
KMt 7.146 m
KMl 505.978 m
Immersion (TPc) 17.54 tonne/cm
RM at 1deg = GMt.Disp.sin(1)
646.228 tonne.m

79
Figure 30. Rendered Hull Form
11. Resistance
Hull resistance was estimated extrapolating the
information available from the 2003 TSSE Capstone Project
“Sea Swath”, a ship with similar dimensions and ratios,
following standard procedures.

80
SEA CONNECTORHull Resistance
Sea Swath HSSCLoa 124.30 1.200 149.16 m. ν 1E-06Lwl 121.80 1.200 146.16 m. ρad 1.000Lpp 121.80 1.200 146.16 m. ρas 1.025
B 15.270 1.200 18.32 m. λ 1.200Bwl 9.620 1.200 11.54 m. Form Factor k 0.1
T 0.145 1.200 0.17 m. Additive Correction ∆CfTfp 0.135 1.200 0.16 m. CAA 0.000
Tap 0.154 1.200 0.18 m. CA 0.000
D 4.382 1.200 5.26 m.∇ 2780 1.728 4803.8 m3.∆ 2850 1.728 4923.9 Ton.
Cp 0.671 1 0.671
Cb 0.542 1 0.542
Cm 0.807 1 0.807
Lcb 3.456 1.200 4.147 m.Lcb 2.837 1 2.837 %
S 1457 1.440 2098.1 m2.
Lwl 48.72 1.200 58.46 m.S 182.125 1.440 150.0 m2.
Towing Tank Test
Vs Vm Fn RNcm RNsm Rtm Ctm CFcm CFsm CVcm CVsm Caa CrmKt m/s x10^-6 x10^-6 N x10^3 x10^3 x10^3 x10^3 x10^4 x10^3 x10^3
10 5.144 0.149 545.8 218.3 71961 3.732 1.652 1.818 0.000 0.000 1.915
15 7.717 0.223 818.7 327.5 178400 4.112 1.569 1.726 0.000 0.000 2.386
20 10.289 0.298 1091.6 436.6 419625 5.441 1.514 1.666 0.000 0.000 3.776
25 12.861 0.372 1364.5 545.8 529373 4.393 1.473 1.621 0.000 0.000 2.773
30 15.433 0.446 1637.4 654.9 712729 4.107 1.441 1.585 0.000 0.000 2.522
35 18.006 0.521 1910.2 764.1 935636 3.962 1.415 1.556 0.000 0.000 2.405
40 20.578 0.595 2183.1 873.3 1192624 3.866 1.392 1.532 0.000 0.000 2.334
45 23.150 0.670 2456.0 982.4 1458076 3.735 1.373 1.511 0.000 0.000 2.224
50 25.722 0.744 2728.9 1091.6 1719120 3.567 1.356 1.492 0.000 0.000 2.075
55 28.294 0.819 3001.8 1200.7 1975317 3.387 1.341 1.476 0.000 0.000 1.911
Vs Vs Fn RNcs RNcs Ctm CFcs CFss CVcs CVss ∆Cf Ca Caa Crm Rtcb Rtsb RTKt m/s x10^-9 x10^-9 x10^3 x10^3 x10^3 x10^3 x10^3 x10^3 x10^3 x10^3 x10^3 kN kN kN
11.0 5.635 0.149 0.717 0.287 3.670 1.596 1.755 0.000 0.000 0.000 0.000 1.915 125.3 0.0 125.3
16.4 8.453 0.223 1.076 0.430 4.055 1.517 1.668 0.000 0.000 0.000 0.000 2.386 311.5 0.0 311.5
21.9 11.271 0.298 1.435 0.574 5.386 1.464 1.611 0.000 0.000 0.000 0.000 3.776 735.8 0.0 735.8
27.4 14.089 0.372 1.794 0.717 4.341 1.425 1.568 0.000 0.000 0.000 0.000 2.773 926.4 0.0 926.4
32.9 16.906 0.446 2.152 0.861 4.057 1.395 1.534 0.000 0.000 0.000 0.000 2.522 1246.7 0.0 1246.7
38.3 19.724 0.521 2.511 1.004 3.912 1.370 1.507 0.000 0.000 0.000 0.000 2.405 1636.5 0.0 1636.5
43.8 22.542 0.595 2.870 1.148 3.818 1.348 1.483 0.000 0.000 0.000 0.000 2.334 2085.9 0.0 2085.9
49.3 25.360 0.670 3.229 1.291 3.687 1.330 1.463 0.000 0.000 0.000 0.000 2.224 2549.8 0.0 2549.8
54.8 28.177 0.744 3.587 1.435 3.520 1.314 1.445 0.000 0.000 0.000 0.000 2.075 3005.2 0.0 3005.2
60.2 30.995 0.819 3.946 1.578 3.341 1.300 1.430 0.000 0.000 0.000 0.000 1.911 3451.4 0.0 3451.4
Figure 31. Hull Resistance Calculations
The computed resistance curve for the ship shows a
hump, at higher speed than the base ship. Because of this

81
hump, the HSSC will avoid speeds between 22 and 24kts
during transit.
Figure 32. Resistance Curve
12. Deck Layout
The depth of the ship is 14.000m. Three decks were
installed with the following criteria:
Double Bottom is with a depth of 2.000m. Volume under
this deck was calculated in order to estimate the tanks
capacity and to ensure that this capacity is enough to
provide the required endurance.
Lower Cargo Deck with a depth of 5.000m. In order to
accommodate the gas turbine containers, double bottom at
the engine rooms sections was lowered to 1.000m. Clearance
0
100000
200000
300000
400000
500000
600000
700000
800000
900000
1000000
1100000
1200000
1300000
1400000
1500000
1600000
1700000
1800000
1900000
2000000
2100000
2200000
2300000
2400000
2500000
2600000
2700000
2800000
2900000
3000000
10 11 12 13 14 15 16 17 18 19 20 21 22 23 24 25 26 27 28 29 30 31 32 33 34 35 36 37 38 39 40 41 42 43 44 45 46 47 48 49 50Speed
kN
Sea SwathHSSC

82
between decks is enough to allow placement of the electric
propulsion motors.
Upper Deck is with a depth of 9.500m. This is selected
to give enough clearance to the highest vehicle intended to
be transported.
Figure 33. Deck Layout 13. Tankage
Most of the tanks were located below the double bottom
decks, taking advantage of the rounded bottom selected to
reduce resistance.
In addition, provisions were made to mount daily
service tanks high in the engine rooms.
Forward double bottom tanks were dedicated for ballast
in order to increase the aft trim when reaching the beach.
Fresh water tanks, with a full load capacity of
227tons were located between water ballast and fuel tanks,
separated by a cofferdam to avoid contaminations.
Combustible tanks, with a total capacity of 820tons,
located aft of the fresh water tanks provides enough
endurance for 2000nm at 20kts. Aft tanks are dedicated to
aircraft fuel in order to support the embarked helicopter.

83
14. Structure
a. First Estimate
A preliminary structural design was done to
estimate the hull weight and to study the available space
for cargo decks. Section Modulus and Moment of Inertia
Calculations were performed based on the American Bureau of
Shipping GUIDE FOR BUILDING AND CLASSING HIGH-SPEED NAVAL
CRAFT.
The following items were included in the
calculation of the section modulus and moment of inertia
provided they are continuous or effectively developed
within a span 0.4L from midships, have adequate buckling
strength, and are gradually tapered beyond the midship
0.4L.
• Deck plating (strength deck and other effective decks)
• Shell and inner bottom plating
• Deck and bottom girders
• Plating and longitudinal stiffeners of longitudinal bulkheads
• All longitudinals of deck, sides, bottom, and inner bottom
Figure 34. Depiction of First Estimation

84
Midsh
Element Number Thickness Height Long. Area Area Total Area C.G. Moment 2nd MomentITEM Type n t h or r A A AT dn A*dn A*dn2
(cm) (cm) (cm2) (cm2) (cm2) (m) (cm2m) (cm2m2)Strength Deck Plating Rectangular 1 1.40 545 763.00 763.00 9.00 6867.00 61803.00Strength Deck Stringer Plate Rectangular 1 1.60 130 208.00 208.00 9.00 1872.00 16848.00Strength Deck Longitudinals W 160x14; F40x14 10 0.00000084 0.00000084 0.0000084 8.90 0.000075 0.000665Sheer Strake Rectangular 1 1.60 80 128.00 128.00 10.50 1344.00 14112.00Side Plating Rectangular 1 1.40 630 882.00 882.00 6.95 6129.90 42602.812nd Deck Plating Rectangular 1 1.40 675 945.00 945.00 5.00 4725.00 23625.00Bilge (Curved Portion) Circle 1 1.40 190 417.83 417.83 1.09 457.28 500.44Inner Bottom Plating Rectangular 1 1.40 545 763.00 763.00 2.00 1526.00 3052.00Inner Bottom Margin Plate Rectangular 1 1.60 130 208.00 208.00 2.00 416.00 832.00Inner Bottom Longitudinals W 200x10;F66x15 10 0.0000015 0.0000015 0.000015 1.72 0.000026 0.000044Side Girders Rectangular 2 1.20 200 240.00 480.00 1.00 480.00 480.00Center Girder (1/2) Rectangular 1 0.60 200 120.00 120.00 1.00 120.00 120.00Bottom Plating Rectangular 1 1.40 485 679.00 679.00 0.00 0.00 0.00Bottom Longitudinals W 200x10;F66x15 10 0.0000015 0.0000015 0.000015 0.28 0.000004 0.000001Upper Hatch Side Girder 1Lower Hatch Side Girder 1
5593.83 23937.18 163975.25
A= 11187.66Section Modulus Calculation Dg = 4.28
In= 334199.20Io= 129334.86
ctop= 4.72(Section Modulus) Ztop= 27396.86
cbottom= 4.28(Section Modulus) Zbottom= 30224.01
Maximum Stress Calculation (at 64.0 m forward) For hogging Mmax= 10042For Hogging Situation (Max) Tensile Stress in the deck= 35.95
(Max) Compressive Stress in the bottom plating= 32.58
FOR STEELWeight Estimations For Specific Weight = 77000Middle Section (Cross Section Area) A= 1.12
Approximate Weight of Hull Per Length = 8.7843Length of Our Ship = 147.00
Approximate Weight = 1291.2989FOR ALUMINUM ALLOY
Specific Weight = 27000Approximate Weight of Hull Per Length = 3.0802
Approximate Weight = 452.7931 Figure 35. First Estimate Calculations b. Detailed Calculations
After the preliminary estimates for structural
design shown above, a more detail spreadsheet calculation
was performed to determine the hull weight and to study the
available space for cargo decks. In order to get such
detailed structural design data, longitudinal stiffeners
were detailed and selected with sufficient cross section
areas and inertias. Dimensions were selected according to
the distances between decks. Both steel and aluminum were
evaluated for structural weight, and steel was selected for
the design. The following figure presents a sample of the
calculations:

85
SEA CONNECTORMidship Section and Longitudinal Structure Weight Calculation
Element Number Thickness Width Long. Area Area Total Area C.G. Moment 2nd Moment Local 2nd MomentITEM Type n t h or r A A AT dn A*dn A*dn2 Io
(cm) (cm) (cm2) (cm2) (cm2) (m) (cm2m) (cm2m2) (cm2m2)Main Deck Plating Rectangular 1 1.00 1075 1075.00 1075.00 9.00 9675.00 87075.00 0.0092nd Deck Plating Rectangular 1 1.00 675 675.00 675.00 5.00 3375.00 16875.00 0.006Inner Bottom Plating Rectangular 1 1.20 675 810.00 810.00 2.00 1620.00 3240.00 0.010Bottom Plating Rectangular 1 1.70 475 807.50 807.50 0.00 0.00 0.00 0.019Main Side Shell Plate Rectangular 1 1.10 566 622.60 622.60 7.00 4358.20 30507.40 830.133Lower Side Shell Plate Rectangular 1 1.30 300 390.00 390.00 3.50 1365.00 4777.50 292.500Bilge Shell Plate Circle 1 1.40 190 417.83 417.83 1.09 457.28 500.44 105.284Side Girders Rectangular 2 1.20 200 240.00 480.00 1.00 480.00 480.00 160.000Center Girder (1/2) Rectangular 1 0.60 200 120.00 120.00 1.00 120.00 120.00 40.000Main Deck Tripping Brackets ST 8 WF (29 lb/ft) 3 54.97 164.90 8.84 1457.74 12886.44 0.1662nd Tripping Brackets ST 8 WF (29 lb/ft) 3 54.97 164.90 4.84 798.13 3862.95 0.166Main Side Tripping Bracket ST 8 WF (29 lb/ft) 1 54.97 54.97 7.40 406.76 3010.03 0.055Main Side Tripping Bracket ST 8 WF (29 lb/ft) 1 54.97 54.97 6.20 340.80 2112.96 0.055Lower Side Tripping Bracket ST 8 WF (29 lb/ft) 1 54.97 54.97 4.00 219.87 879.48 0.135Lower Side Tripping Bracket ST 8 WF (29 lb/ft) 1 54.97 54.97 3.00 164.90 494.71 0.135Main Deck Longitudinals L 5x3x(3/8) (in) (9.8 lb/ft) 10 18.45 184.52 8.91 1644.04 14648.36 0.1282nd Deck Longitudinals L 5x3x(3/8) (in) (9.8 lb/ft) 6 18.45 110.71 4.91 543.58 2668.99 0.077Inner Bottom Longitudinals L 5x3x(3/8) (in) (9.8 lb/ft) 8 18.45 147.61 1.91 281.94 538.51 0.103Bottom Longitudinals L 5x3x(3/8) (in) (9.8 lb/ft) 5 18.45 92.26 0.08 7.66 0.64 0.064Main Side Longitudinals L 4x3x(3/8) (in) (8.5 lb/ft) 1 16.00 16.00 8.60 137.60 1183.36 0.006Main Side Longitudinals L 4x3x(3/8) (in) (8.5 lb/ft) 1 16.00 16.00 8.20 131.20 1075.84 0.006Main Side Longitudinals L 4x3x(3/8) (in) (8.5 lb/ft) 1 16.00 16.00 7.80 124.80 973.44 0.006Main Side Longitudinals L 4x3x(3/8) (in) (8.5 lb/ft) 1 16.00 16.00 7.00 112.00 784.00 0.006Main Side Longitudinals L 4x3x(3/8) (in) (8.5 lb/ft) 1 16.00 16.00 6.60 105.60 696.96 0.006Main Side Longitudinals L 4x3x(3/8) (in) (8.5 lb/ft) 1 16.00 16.00 5.80 92.80 538.24 0.006Main Side Longitudinals L 4x3x(3/8) (in) (8.5 lb/ft) 1 16.00 16.00 5.40 86.40 466.56 0.006Lower Side Longitudinals L 4x3x(3/8) (in) (8.5 lb/ft) 1 16.00 16.00 4.52 72.32 326.89 0.004Lower Side Longitudinals L 4x3x(3/8) (in) (8.5 lb/ft) 1 16.00 16.00 3.52 56.32 198.25 0.004Lower Side Longitudinals L 4x3x(3/8) (in) (8.5 lb/ft) 1 16.00 16.00 2.52 40.32 101.61 0.004Bilge Shell Longitudinals L 4x3x(3/8) (in) (8.5 lb/ft) 1 16.00 16.00 1.67 26.72 44.62 0.004Bilge Shell Longitudinals L 4x3x(3/8) (in) (8.5 lb/ft) 1 16.00 16.00 1.34 21.44 28.73 0.004Bilge Shell Longitudinals L 4x3x(3/8) (in) (8.5 lb/ft) 1 16.00 16.00 1.01 16.16 16.32 0.004Bilge Shell Longitudinals L 4x3x(3/8) (in) (8.5 lb/ft) 1 16.00 16.00 0.68 10.88 7.40 0.004Bilge Shell Longitudinals L 4x3x(3/8) (in) (8.5 lb/ft) 1 16.00 16.00 0.35 5.60 1.96 0.004
6722.70 28356.05 191122.55 1429.117
A= 13445.41 cm2
Section Modulus Calculation Dg = 4.22 mIn= 385103.34 cm2m2
Io= 145894.27 cm2m2
ctop= 4.78 m(Section Modulus) Ztop= 30508.75 cm2m
cbottom= 4.22 m(Section Modulus) Zbottom= 34588.87 cm2m
Maximum Stress Calculation (at 64.0 m forward) For hogging Mmax= 10042.00 MT-mFor Hogging Situation (Max) Tensile Stress in the deck= 32.28 MPA
(Max) Compressive Stress in the bottom plating= 28.47 MPA
FOR STEELWeight Estimations For Specific Weight = 77000 N/m3
Longitudinal Structure (Cross Section Area) A= 1.34 m2
Weight of Hull (Longitudinal) Per Length = 10.5571 MT/mLength of Our Ship = 147.00 m
Approximate Weight = 1551.89 MTFOR ALUMINUM ALLOY
Specific Weight = 27000 N/m3
Weight of Hull (Longitudinal) Per Length = 3.7018 MT/mApproximate Weight = 544.17 MT
Figure 36. Detailed Calculations

86
c. Structural Weight
Both steel and aluminum were compared to get the
structural weight. Steel was finally selected for the final
design. Total structural weight of the trimaran including
longitudinal and transverse framing was calculated by using
an Excel spreadsheet. The main results are shown below:
SEA CONNECTORStructure Weight Calculation
Transverse Web Frame Spacing for ST 8 WF (TEE SECTION) = 3 m Transverse Web Frame Spacing for ST 6 WF (TEE SECTION) = 0.6 m
Transverse Column Spacing for HOLLOW SECTION = 15 mLENGTH OF THE SHIP = 147 m
Number of Web for ST 8 WF (TEE SECTION) = 48Number of Web for ST 6 WF (TEE SECTION) = 244
Number of Web for HOLLOW SECTION = 30Cross Section Area of ST 8 WF (TEE SECTION) = 54.97 cm2
Cross Section Area of ST 6 WF (TEE SECTION) = 34.19 cm2
Cross Section Area of HOLLOW SECTION = 113.10 cm2
FOR STEELWeight Estimations For Specific Weight = 77000 N/m3
Transverse Structure Total Length for Cross Section = 51.35 mApproximate Weight = 464.09 MT
FOR ALUMINUM ALLOYSpecific Weight = 27000 N/m3
Total Length for Cross Section = 51.35 mApproximate Weight = 159.00 MT
FOR STEELTOTAL STRUCTURE WEIGHT = 2015.99 MT
TOTAL STRUCTUREWEIGHT FOR ALUMINUM ALLOY
TOTAL STRUCTURE WEIGHT = 703.17 MT Figure 37. Structural Weight Calculations
d. Longitudinal Strength
The midship section modulus was used along with
an estimate of the maximum bending moment in order to
determine the strength of the main deck and keel.
In order to provide enough longitudinal
resistance, steel was selected for the hull.
Table 6. Longitudinal Strength Data Max. Shear 263.12 MT At 21.000f
Max. Bending Moment 10042 MT-m at 64.000f (Hogging)

87
Longitudinal Strength
<---Aft (Meters) Fwd--->
0.0a 50.0f 100.0f 150.0f
-100.0
-50.0
0.0
50.0
100.0
Weight x 1.0
Buoy. x 1.0
Shear x 3.5
B.M. x 130.0
Figure 38. Longitudinal Strength Plot
15. Hull Calculations
The software package Autohydro was used for the Naval
Architecture calculations. Sample calculations are shown in
Appendix VI and they include the following:
• Hydrostatics.
• Cross Curves of Stability
• Tanks Calibration
• Floodable Length
• Longitudinal Strength
• Intact Stability
• Damaged Stability.

88
Intact stability calculations were based on the High
Speed Craft 2000 Multihull criteria in order to determine
the stability adequacy of the vessel. This set of rules is
suggested by American Bureau of Shipping and is described
in “Guide for Building and Classing High Speed Naval
Craft”.
In addition, damaged stability was analyzed and
several contingency cases were studied. Trimarans are
highly dependant of side hull integrity to achieve adequate
stability. Side hull damage was a major concern and several
cases were evaluated. This ship is able to withstand the
loss of half a side hull and the simultaneous damage of
three forward watertight compartments. Under these extreme
conditions, however, the main deck is immersed and flooded.
Therefore, at this iteration of the design, main cargo deck
will require watertight doors.
C. COMBAT SYSTEM DESIGN
1. Mission need statement
As the roles, missions, and capabilities of today’s
Navy evolve into the 21st century, so does the role of the
combat system on board naval vessels. Dominance of the
battlefield and the electromagnetic spectrum based on the
ability to use and deny its use by the enemy at will is
dependent on robust weapons systems and electronic warfare
suites that can sustain the unique threats of the 21st
century.
As threats become more complex and asymmetric, the
need to develop sensors, weapons systems and EW systems
that can respond to changing environments is critical to
superior battlefield surveillance, dominance and
survivability.

89
The ability to detect, identify and take appropriate
actions as necessary to counter a threat is central to the
meaning of naval superiority and that is precisely what the
proposed Ship Self Protection System (SSPS) is calling for.
a. Background
Weapons systems are the ensemble of elements that
are used to destroy or perhaps simply disable a threat and
as a result, also to threaten and defend.
Electronic warfare, on the other hand, can be
defined as the control and manipulation of the electro-
magnetic and electro-optical spectrum (i.e. radar, radio,
and infrared) during military operations. Electronic
warfare has always played a key role in deceiving the enemy
and protecting the ship, its cargo, and its sailors.
b. Mission
Generally, Combat System suites protect the ship
through a series of actions that vary from deception,
jamming, and suppression, to attack and destruction. The
HSAC SSPS is designed to be effective against a wide range
of threats without affecting the ship’s dynamics or
maneuverability capabilities. The mission is accomplished
when any threat can be encountered.
2. Operational Requirements
a. Description of Proposed System
The SSPS is envisioned as a self-protection
suite, which includes all the necessary sensors, EW
elements and the shipboard weapons systems elements that
are necessary to mitigate all threats discussed in the
threat analysis part of this chapter.
Dealing with a threat environment of continuously
growing complexity requires a smart marriage of hardware

90
and software. The SSPS should be designed to cope with
extremely dense environments, long-range smart weapons and
all kinds of radars. In addition to the ever-present need
for short reaction times, this also requires a combination
of high sensitivity, high selectivity, and high probability
of intercept from the different SSPS subsystems.
b. Operational and Support Concept
The Ship Self Protection System (SSPS) will be
distributed and installed on all units of the HSAC design.
The ship’s multiple roles require capability for the
following missions:
Air Warfare Capabilities
• Detect, track, and destroy up to 8 simultaneous “leaker” missiles that escape defenses supplied by other fleet units
• Detect, track, and identify UAV, low slow flyers, attack aircraft
• Defend against and engage hostile UAVs and low slow flyers (less than 200kts)
Surface Warfare Capabilities
• Detect, track, and identify surface threats to the horizon
• Defend against and destroy small (less than 200ft long), high speed (in excess of 40kts) surface craft
• Deconflict potentially hostile craft from friendly and neutral shipping
Undersea Warfare Capabilities
• Avoid underwater mines
• Conduct evasive torpedo maneuvers
Amphibious Warfare Capabilities
• Sustain hostile small caliber fire

91
• Provide suppressive fire for amphibious forces
• Provide Naval Surface Fire Support (NSFS) for amphibious forces
• Fuel and support rotary wing aircraft supporting amphibious operations both day and night
• Provide for surface defense of Area of Assault
Command & Control Capabilities
• Conduct Electronic Protection Operations
• Communicate with U.S. and coalition forces via both secure and unsecured channels
• Maintain a CIC capable of collecting, processing, displaying, evaluating and disseminating tactical information
• Provide a data link capability
• The multi-role missions and the need to operate from the sea base (up to 200 nm from the target area) define the operational requirements and functionality of the SSPS.
The SSPS should be able to Detect and Counter
typical threads of current and future aggressors (people,
institutions and platforms). These include Air to Surface,
Ground to Surface, Surface to Surface, Subsurface to
Surface, Mines, and terrorist attacks.
c. Threat Environment
As said, mission and multiple roles of the HSAC
define multiple threats to counter. The basic threats that
need to be considered are:
• Radar guided weapons
• IR guided weapons
• Laser guided weapons
• Small boat attacks

92
• Mines
• Terrorist attacks
• Basic enemy fire from shore locations or localized direct threats
d. Expanded Sensor Operations/Ballistic Missile Defense
The vessel will be equipped with a Multi
Functioning Radar (MFR) and Cooperative Engagement
Capability (CEC). This will enable a battle group to use
the HSAC as a picket ship to extend the sensor range of the
surface combatants comprising the sea force. This ability
will be especially important for two main reasons. First,
it will have great impacts in littoral environments where
shallow water will deter larger vessels from entering the
area, and secondly, as a replacement for the
decommissioning frigates which previously held this role.
The HSAC can also be used as a sensor
platform for Ballistic missile defense. The SPY-3 radar on
this vessel can be used as a mobile missile detection
platform enabling other surface combatants to be freed up
to engage the targets or for other operations. With more
combatants in a position to engage ballistic missiles vice
being paired up as the sensor and the shooter, more area
can be covered and a greater probability of kill can be
expected.
3. Statement of Work
a. Objective
This project involves the complete design and
integration of a Ship Self Protection System for the HSAC.
The result will be a modular system deign that has to be
fully integrated into the ship’s architecture.

93
b. Tasks
(1) Develop Top Level Structure
A system level block diagram and overall
layout is required. Basic information along with key design
specifications relating to the systems requirements should
be included. Power consumption, electromagnetic
compatibility, and different sensors and systems placement
on board the ship need to be considered from the beginning
of development. Weight and volume limitations need to be
incorporated at first hand.
(2) Choice of System Components
The functional components need to follow the
threats as described in the Operational Concept. In
summary, all of following available components should be
analyzed as suitable options for the SSPS, and then a
decision on the preeminent sub-systems to use should be
made.
Sensor Suite:
• Multifunctional Radar • Electro-Optical System • IR search and track System • Volume Search Radar • Navigation Radar • Basic Mine Detection System EW suite:
• Radar warning Receiver • Laser Warning receiver • Missile Approach Warning System • Directed Infrared Countermeasures • Active/Passive Decoy System • IFF System Shipboard Weapons:
• High rate of fire medium range gun • Medium range missile • Free Electron Laser System

94
• High Power Microwave Systems • Crew served weapons, small arms and non
lethal weapons • Other short range weapon systems The components considered necessary for SSPS
must be integrated following the top-level structure. An
updateable threat library needs to be the base of the
decision making process for most of the EW system
components. The design must be modular in nature so that
the HSAC can change missions and meet new threat
requirements as deemed necessary.
4. Ship Self Protection System Overview
In this part, the Technical Specifications of the Ship
Self Protection System for the HSAC are presented. In
accordance with the Operational Requirements Document, the
SSPS is designed to provide protection against a variety of
threats.
Throughout the discussion below we assume that the
ship has adequate weight, space, cooling and electrical
power provisions to accommodate the SSPS system
requirements.
a. System Overview
Figure 39 below depicts the proposed operational
block diagram of the SSPS for the Joint ACCESS. It includes
all the sensor elements that will feed a system controller
with specific target information. The system controller
will, then, assign appropriate countermeasures to mitigate
each of the threats based on their type and priority.

95
EW Suite Sensors Suite
System Controller
Displays & Controls
Countermeasures
Ship Bus
Figure 39. Block diagram of proposed SSPS
b. Design Philosophy:
The HSAC will utilize a layered defense concept
for protecting the ship, its embarked troops and cargo, and
the landing forces ashore. It will leverage on technology
that is being currently developed for the U.S. Navy, while
certain systems that will be specific to HSAC mission need
statement and operational requirement document are also
being proposed.

96
Inner Layer Defense
Middle Layer Defense
5mi
25 mi
100 mi
Outer Layer Defense
Figure 40. Design Philosophy
The HSAC will be heavily dependant on the long-
range defenses of the Sea Shield and in particular the
Littoral Combat Ship (LCS). This ship will be different
from the LCS in that it will achieve higher speed and
maneuverability, though. It will also have a larger
complement of troops and cargo and will have a diminished
capability in both self and landing force protection that
is offered by the LCS. The HSAC will be outfitted with
weapon and sensor suites to provide protection from known
threats to primary mission within area of operation up to
25 miles.
It is planned that the combined number of HSAC
vessels will utilize the advantage of distributed multiple
platforms for a combined blanket of protection for

97
increased survivability. The ability to use technology to
share sensor and weapon data between fleet assets will
raise the effectiveness of conducting the primary mission
over a larger area of operations.
c. Threat Analysis
The threat anticipated to naval forces moving
ashore from a sea base in 2025 will be the heavy protection
of territorial waters / shoreline and the disruption of
surface traffic to and from the sea base. These systems
will be employed to interdict transport vessels in order to
slow down high speed operations and to maximize damage
while troops and cargo are still embarked. Threat
objectives will be the coordinated effort of using all
target acquisition and support agencies, of the littoral
force and sea base that are available, for the purpose of
denying enemy combat power over the landing force during
the initial trough final stages of movement ashore. Central
to the threat’s defensive plan is the early identification
and rapid denial and disruption in the littorals. Enemy
systems are found to operate in multiple threat areas to
include space, air, surface, undersea, electronic, and
information warfare.
The High Speed Assault Connector (HSAC) war
fighting capabilities will be designed with an Inner (0 to
5 miles), Middle (5 to 25 miles), and Outer (25 to 100
miles) defense layers. Although this will mitigate threats
in combat systems terms, particular attention will need to
be placed on the known threats to the primary mission. With
the primary mission of the HSAC being the transit to the
landing zone and the off load of cargo, the threat analysis
will center on that transit and landing. To identify the

98
major expected threats it is prudent to breakdown the
mission into known areas of operation. These will be, in
part, moving from sea base to 25 miles from landing zone,
transit inside 25 mile boundary to 1 mile out, and the
final move from 1 mile out to cargo off load on the beach.
It is expected that threats to the HSAC will grow as it
approaches the landing zone. In no way are these areas, as
they are laid out, firm boundaries. They are only being
used as a reference to classify major threats and crossover
between two or more areas. The threats will next be
analyzed and broken down by area.
From the sea base to the 25 mile range, the craft
will be in the same threat status as open ocean combatants.
These will be the threats from enemy fleet assets in the
realm of surface warfare, undersea warfare, and air
warfare. Enemy surface combatants will utilize ship to ship
cruise missile technology with support by large scale deck
mounted guns. Sub Surface assents will include both
submarines that will be able to launch various torpedo
variants and possible sensor networks to identify and aid
in HSAC tracking. Air warfare will be of a hybrid nature or
modified approach to current tactics. Standard air to
surface anti ship missiles fired from combat aircraft will
still remain the primary air threat, but with the enemies
need to lessen the effect of the HSAC air defense, which
may include friendly fighter aircraft, it can be expected
that commercial aircraft of different sizes will be
employed as deceptively hiding air attack platforms.
Within 25 miles of land the above threats will
still be valid. The upgraded threat within the new zone
will be primarily in the realm of surface warfare, but not

99
limited to it. Small surface combatants ranging from small
cutter vessels to patrol craft will be used to deter
transit within close proximity to and in territorial
waters. These vessels will be multiple in numbers and of
increased speed compared to the major enemy fleet assets.
All will be capable of ship to ship cruise missile attack
with the added ability for close in attack with deck
mounted guns and torpedo launchers. Because of decreased
cost and availability of these ships compared to larger
scale surface combatants, the most likely engagement of the
HSAC by the enemy will be by this means. In addition to the
realized surface threat within this area, the potential
surprise attack form deceptively hidden surface platforms
may either start the enemies small craft assault or wait to
prey on damaged HSAC vessels after engagement. These
vessels will range from pleasure craft to small commercial
vessels (fishing) that have been outfitted with a hidden
one launch missile or rocket. Another concern within this
area is the possibility of engagement from land assets.
Coastal defense may include cruise missile facilities with
the ability to reach out into the area. Although this
technology can have farther reaching capability, the enemy
will not utilize these facilities until the HSAC is within
25 miles for 2 reasons. First will be to protect these
facilities from our fleet and air assets which can target
and destroy these sites, and secondly to increase their
probability of kill by launching when the HSAC is within
its most effective weapon range, which will lead to a
decrease in the available reaction time for the HSAC.
The landing zone area ranges from 1 mile out from
land and into the beach area. The HSAC may be susceptible

100
to small boat attack, beach defenses, and from fire from
troops that may occupy the landing area. The small boat
attack will be varied from the paragraph above in that
small RHIB type of craft or surf riders like jet skis may
be employed for attack or for a possible boarding attempt
due to the HSAC need to drastically cut speed prior to the
beach. The offensive capability will range from machine gun
fire and rocket propelled grenades from both the craft and
from the beach, to potential mortar or artillery fire from
troops or armor units. Mining of beach area to deter
landing will also need to be considered. Theses threats
have historically have had exceptional effectiveness due to
unpredictability and to its simple low tech nature.
In the following pages, each of the major
subsystems of the SSPS will be discussed in terms of their
functionality and operational/technical specifications.
5. EW suite:
The EW suite of the HSAC will provide Electronic
Support (ES), Electronic Attack (EA), and Electronic
Protection (EP) capabilities in the radar and infrared
parts of the electromagnetic spectrum. The primary
functions of the EW suite are the detection and
identification of threat emitters as well as automatic
employment of coordinated on-board countermeasures. The
best system that fits the above description is the Navy’s
next generation Advanced Integrated Electronic Warfare
System (AIEWS).
This system is designed for layered and coordinated
countermeasures in the littoral environment and provides
final layer of self-protection against air threat leakers
and ASCMs for individual ships. Because the subsystems of

101
the AIEWS are still classified, we decided to conduct a
thorough analysis of all possible subsystems and concluded
that and the following EW elements are necessary to
accomplish the EW suite mission.
a. Radar Warning Receiver
The purpose of the Radar Warning Receiver (RWR)
is to provide information to the SSPS about Radio Frequency
threats (radars and active RF-guided missiles) that are
searching for, tracking or illuminating the ship. RWRs are
generally the simplest form of ES receiver consisting of
unsophisticated low-sensitivity (on the order of -40dBm)
equipment that is present to cover the bands and
characteristics of expected threats and exploits the range
advantage to indicate a threat before it reaches its firing
range [1].
Because we are considering the year 2015
technology and from RWR trade off analysis performed in
Appendix VII, it was concluded that the HSAC RWR system
should be based on Digital Receiver technology and should
meet the requirements of a modern high-performance ES
receiver as listed in Table 7.
Table 7. Modern High Performance ES Receivers Frequency range 0.5-40GHz Sensitivity Less than –75dBm Dynamic range greater than 70dBm Frequency resolution better than 2MHz Bearing accuracy better than 1 degree rms Pulse Rate 107 pulses/sec Pulse width resolution 25ns TOA resolution 50ns Amplitude accuracy 1dB

102
The data collected by the RWR receiver are
analyzed in terms of angle of arrival, time of arrival,
pulse width, PRF, frequency, scan rate, amplitude in order
to detect the type of threat (radar and platform), based on
the information stored in the threat library. The RWR
controller then sends the available data for each threat to
the SSPS System controller for further correlation with the
data coming from other SSPS sensors and/or the ship’s other
sensors and data links.
b. Radio Frequency Jammer
The purpose of the Radio Frequency (RF) Jammer is
to emit RF jamming signals in order to protect the ship
from being detected, tracked or intercepted by enemy radars
and RF guided missiles.
Usually, naval vessels have Radar Cross Sections
(RCS) that are very large (as contrasted with the airborne
situation) which requires very large Jammer ERP to cover
the target. Also, ships are relatively immobile and it is
difficult to avoid an accurately targeted missile once
launched.
For the HSAC, it was decided to use the basic
SLQ-32V for self-protection jamming using transponder and
repeater jamming techniques with high ERP. The HSAC will
rely on other fleet assets (E-A6B prowler) to provide stand
off and escort jamming when necessary. The calculation in
Appendix VII shows that the use of the SLQ-32 to cover the
HSAC up to 2km from shore illuminating radars is feasible.

103
c. Missile Approach Warning System
The purpose of the Missile Approaching Warning
System (MAWS) is to provide information to the SSPS about
missiles that are approaching the ship. Its role is
especially important in the case of IR guided missiles,
since these cannot be detected by the RWR.
MAWSs may be either active or passive. The former
uses a pulse Doppler radar to detect and track missiles by
means of their skin return, while the latter responds to
either the IR or UV signature of the exhaust plume from the
missile’s rocket engine [2].
The radar provides the advantage of providing
all-weather range and range-rate data that enables
calculation of time-to-impact data. Disadvantages involve
the difficulty of extracting the small missile RCS target
from competing clutter. An additional criticism of active
radar is the possibility of it being used to as a beacon
for an anti-radiation type missile.
Passive MAWSs employ IR sensors to detect a
missile’s plume out to the physical horizon. This is very
crucial to the success of the mission especially those
ASCMs become stealthier and are able to skim even closer to

104
the ocean surface. Even with a low RCS, the heat signature
of the plume is still detectable by the MAWS IR sensors.
These sensors generally provide relatively accurate angular
data, but range must be estimated on the basis of signal
strength.
By the year 2015, we speculate that this
technology will be mature enough so that the two types of
sensors may be combined in a hybrid system, offering the
best combined benefits of each [3].
The data from the IR sensors are fed to the MAWS
receiver for processing. The resulting threat information
(angle of arrival, velocity, signature and/or type, if the
missile’s signature is already stored in the threat
library) is then sent to the SSPS System for correlation
with other sensor data and the employment of the
appropriate countermeasures.
After a threat is detected the sensor will be
able to continuously track the target to provide the
necessary information to the DIRCM, if the SSPS System
decides to employ it to counter the threat.
Because we are considering threats of the year
2015, the use of a hybrid MAWS on board the HSAC was deemed
necessary to alert the crew of the presence of hostile fire
control radar and missile carrying IR/EO passive sensors.
d. Directed Infrared Countermeasures (DIRCM)
The purpose of the DIRCM system is to employ
countermeasures against IR guided and Laser guided
missiles, based on the information and cueing provided by
the SSPS System. This system will be capable of
transmitting laser energy against both IR missiles in the

105
3-5µm region and laser-guided missiles operating in the
1.06µm frequency. Earlier versions of this type of system
use the laser in a deceptive jamming mode to cause the
missile seeker to break lock. The reflected laser energy
coming from the threat missile’s seeker is demodulated to
provide information about the tracking technique the
missile IR sensor is utilizing. This, in turn, allows for
the proper modulation to be applied to the jamming waveform
to achieve deception.
The newer versions use the laser beam to damage
the seeker optics and IR detector, which in effect blinds
the missile. This is the only technique that can be used
against 3rd generation IR seekers, which employ Staring
Array type detectors. Indeed, deception countermeasures
against these types of sensors are largely inefficient [4].
The analysis done in Appendix VII shows that the
laser system is the best available option and that power
requirements of such system are easily achievable with
today’s technology and certainly achievable in the year
2015 time frame.
e. Chaff/Flare/Decoy Dispenser
Chaff is the oldest, and still the most widely
used radar countermeasure. It is generally used to protect
tactical aircraft, strategic aircraft and ships in either a
corridor-laying or self-protection mode. Shipboard Chaff
can be used in one of three modes: deception, saturation
and seduction.
Based on current technology, it was decided that
the most appropriate Decoy Launching System (DLS) to use
onboard the HSAC is the Mk 53 (NULKA). The NULKA is a rapid
response Active Expendable Decoy (AED) System capable of

106
providing highly effective defense for ships of cruiser
size and below against modern radar homing anti-ship
missiles. It is being developed in cooperation with
Australia ("Nulka" means "be quick!" in Aborigine
language). It is intended to counter a wide spectrum of
present and future radar-guided anti-ship missiles (ASMs)
assessed to have passive decoy rejection and active angular
deflection electronic countermeasures rejection
capabilities. It is designed to over-come the inherent
shortfalls of chaff, which are wind dependence, lack of
placement flexibility, relatively slow reaction time, and
susceptibility to Doppler discrimination. Combination of
thrust and flight control enables successful launches to be
made in severe sea state and high wind conditions [5].
The system that weighs approximately 3000 Lbs
when fully loaded allows for automatic or operator
designation of missile threat and, upon designation of a
particular threat, will respond rapidly by launching an
autonomous airborne decoy. Prior to launch, the system
calculates optimum decoy flight trajectory for mission and
programs that trajectory into the decoy’s flight control
unit (FCU). With programmable and controllable flight path,
the rocket hovers and positions itself to provide more
attractive target for the threat missile. The decoy payload
is provided with design that is optimized to provide
effective protection to both large and small surface ships.
An up close view of the decoy is provided in Figure 41.
The system can either be integrated with the
Combat System or used with the stand-alone AED Fire Control
System. The DLS MK 53 Mod 4 is a modified DLS MK 36 Mod 12

107
by the addition of two NULKA launching tubes to each of the
four MK 137 Mod 2 launchers and a Decoy Launch Processor.
The Nulka decoy employs a broad-band radio
frequency repeater mounted atop a hovering rocket platform.
After launch, the Nulka decoy radiates a large, ship-like
radar cross section while flying a trajectory that seduces
and decoys incoming ASMs away from their intended targets.
The decoy is designed to counter a wide variety of present
and future radar Anti-Ship Missile (ASM) guided threats by
radiating a large radar cross section signal while flying a
ship-like trajectory thus enabling one decoy to counter
multiple threats.
Figure 41. Nulka System
6. Sensors Suite:
a. Multi-Function Radar
The Multi-Function radar (MFR) was selected as
the radar of choice for the HSAC. This 3 dimensional system
combines the functions provided by more than five separate
radars currently aboard Navy combatant ships.
It is essentially the SPY-3 radar currently
undergoing development. The size and weight estimation of
the SPY-3 radar are shown in Figure X.

108
This system is an active phased array X-band
radar designed to meet all horizon search and fire control
requirements and provide missile control based on mid-
course guidance and terminal homing. The most significant
feature of the radar is to provide automatic detection,
tracking, and illumination of low-altitude threat missiles
in adverse environmental conditions routinely found in
coastal waters.
According to the analysis done in [6], the system
will have a 76Km detection range against ASCM threats.
Because most ship radars are horizon limited rather than
electronics detection range limited, a careful examination
of the placement of this system onboard the HSAC should be
conducted. As a matter of fact, in a stand alone situation,
the HSAC will only be able to detect ASCMs threat up to the
physical horizon of the MFR.
The horizon detection range of the MFR should
exceed the missile range of the Evolved Sea Sparrow missile
(30km) to allow for ample time for missile tracking. In
addition, this system will be optimized for the littoral
environment and provide superior clutter rejection.

109
Figure 42. SPY-3 weight and size estimation
This solid-state, active array radar system will
not only scan the horizon for high-speed, low-level cruise
missile threats, but also provide fire-control illumination
for HSAC air defense weapons. MFR is designed to detect the
most advanced low-observable anti-ship cruise missile
(ASCM) threats and support fire-control illumination
requirements for the Evolved Sea Sparrow Missile to support
engagement of the most stressing ASCMs. The MFR mast design
supports new ship-design requirements for reduced radar
cross-section, significantly reduced manning requirements
and total ownership cost reduction.
b. Cooperative Engagement Capability
Cooperative Engagement Capability (CEC) is a
system of hardware and software that allows the sharing of
radar data on air targets among ships. Radar data from
individual ships of a Battle Group is transmitted to other
ships in the group via a line-of-sight, data distribution
system (DDS). Each ship uses identical data processing
algorithms resident in its cooperative engagement processor
(CEP), resulting in each ship having essentially the same
display of track information on aircraft and missiles. An

110
individual ship can launch an anti-air missile at a threat
aircraft or anti-ship cruise missile within its engagement
envelope, based on track data relayed to it by another
ship. Program plans include the addition of E-2C aircraft
equipped with CEP and DDS, to bring airborne radar coverage
plus extended relay capability to CEC. CEP-equipped units,
connected via the DDS network, are known as Cooperating
Units (CUs).
As currently implemented, CEC is a major
contributor to the Joint Vision 2010 concept of full-
dimensional protection for the fleet from air threats. In
concert with multi-Service sensor and engagement systems,
it can contribute to a major expansion of the battle space.
The Joint ACCESS will be able to engage threats within its
engagement envelope based on data relayed to it by other
fleet assets.
c. Navigation radar
The navigation radar will allow the HSAC to
switch off the high power (and distinctive) radar suites
and utilize a simple system for navigation. Because the
HSAC has to transit more than 100 miles before it reached
the area of its primary mission (within 25 miles from the
coast), the navigation radar will enhance the deception
capability of the ship by giving signature comparable to
commercial vessels. This is especially important during the
early stages of transit (from sea base to about 25 miles
from shore) during the first hours of the eight hours
period of darkness.

111
Figure 43. Navigation Radar
The navigation radar that will be installed on
board the Joint ACCESS will be an S-band radar that assures
target detection in adverse weather conditions where X-band
radars are heavily affected by sea or rain clutter.
Such equipment is readily available in a variety
of configurations: 30 or 60 kW output, short or long
antenna radiator, with standard electronic plotting
facility and optional Automatic Radar Plotting Aid (ARPA).
These plotting aids are essential in ship borne radars to
reduce the workload of ship personnel, and improve the
standard of collision avoidance.
The display unit shown in Figure 43 will employ a
21" high-resolution multi-color monitor that provides an
effective diameter of 275 mm. Radar echoes will be
presented in a selected color with a day or night
background color for easy observation in all lighting.
Different colors are assigned to marks, symbols and text
for user-friendly operation. The control head has logically
arranged controls in a combination of push keys, rotary
controls and a well-organized menu structure, and can be
separated from the display unit via a flexible cable. The

112
display pedestal contains all major modules and may be
separated from the monitor part.
The operational features of the navigation radar
will also include all functions required by the IMO and
IEC, such as, Head-up/ Course-up/ North-up orientation,
parallel index lines, True Motion, sensor status message
for compass, SDME, GPS and other electronic position-fixing
systems, wind parameters, depth sounder data, etc.
d. EO system:
After an extensive research on the available EO
systems using current day technology, it was decided to use
the Thermal Imaging Sensor System II (TISS II) as the EO
system of choice for the HSAC.
The TISS II was developed from operational
experience to effectively detect, and identify targets in a
passive mode in the Persian Gulf and the Caribbean. The
HSAC operating in the littorals can be faced with threats
such as floating mines and fast small craft, which are
difficult to detect due to low radar reflectivity and small
cross-sectional areas. The problem of detecting potential
threats becomes even more complex due to sea surface
clutter, operating in small patrol areas, and the
requirements to conduct operations at night and with poor
visibility. Electro-optical (EO) sensors such as thermal
imaging sensors, visible imaging sensors, and laser
rangefinders provide additional situational awareness to
complement current shipboard radars in a manner to overcome
the issues of detection and identification of small surface
targets.
The TISS II incorporates the above-mentioned EO
sensors into a single stabilized platform with a suitable

113
size and weight that allows mounting of the sensor onto the
deck or mast of naval ships. With its suite of EO sensors,
auto-tracking capability, and accurate stabilization, the
TISS II has demonstrated the ability to support other roles
such as navigation, suspect ship boarding, and air defense
[5].
A thorough analysis of this system and its
components can be found in Appendix VII.
7. Shipboard Weapon Systems:
a. Evolved Sea Sparrow Missile (ESSM)
According to the Trade-Off Analysis conducted in
Appendix VII, the Evolved Sea Sparrow Missile will be used
as the medium range ship self-defense missile system for
the Joint ACCESS. This missile will provide the HSAC with
the capability to engage a variety of anti-ship cruise
missiles (ASCMs) and aircrafts to support the medium and to
a lower extend the inner self defense zones. This missile
is very capable against low observable highly maneuverable
missiles, and has a range that fits well the middle layer
defense zone.
This missile, which is the successor to RIM-7M
NATO Sea Sparrow is a tail-controlled missile for 50g
maneuverability against anti-ship missiles maneuvering at
up to 4g. The autopilot allows several ESSM to time-share a
single illuminator in much the same way as the SM-2.
The ESSM uses an autopilot for mid-course
guidance which is updateable via data link from the
launching ship, switching to semi-active homing in the
terminal phase of the engagement. It can also make flight
corrections via radar and midcourse uplinks. A dual mode

114
(semi-active and IR) homing head is a possible future
growth option.
Because a Vertical Launching System (VLS) will
not have directional issues when facing a saturation
attack, has the advantage of providing a lower RCS, and
does not have a reduced minimum firing range as compared to
trainable launchers, it was decided that the ESSMs on board
the HSAC will be fired from a vertical launching system.
Loaded in a Mk 48 vertical launching system (using the Mk-
164 launcher), 32 of these missiles, with a quick start
guidance section, offer a significant increase in load-out,
response time, and fire power for the naval combatants of
the future. The Mod 0 version that will be used in this
design project (used in the Canadian “City”-class frigates)
consists of two individual cells with exhaust uptakes
between them and is designed to be installed on the ship’s
side hulls. With dimensions of 190 inches high, 89 inches
long and 52 inches deep, as illustrated by Figure 44, eight
Mod 0 modules can be installed on each of the ship’s side
hulls.
Exhaust uptakes
Two cells
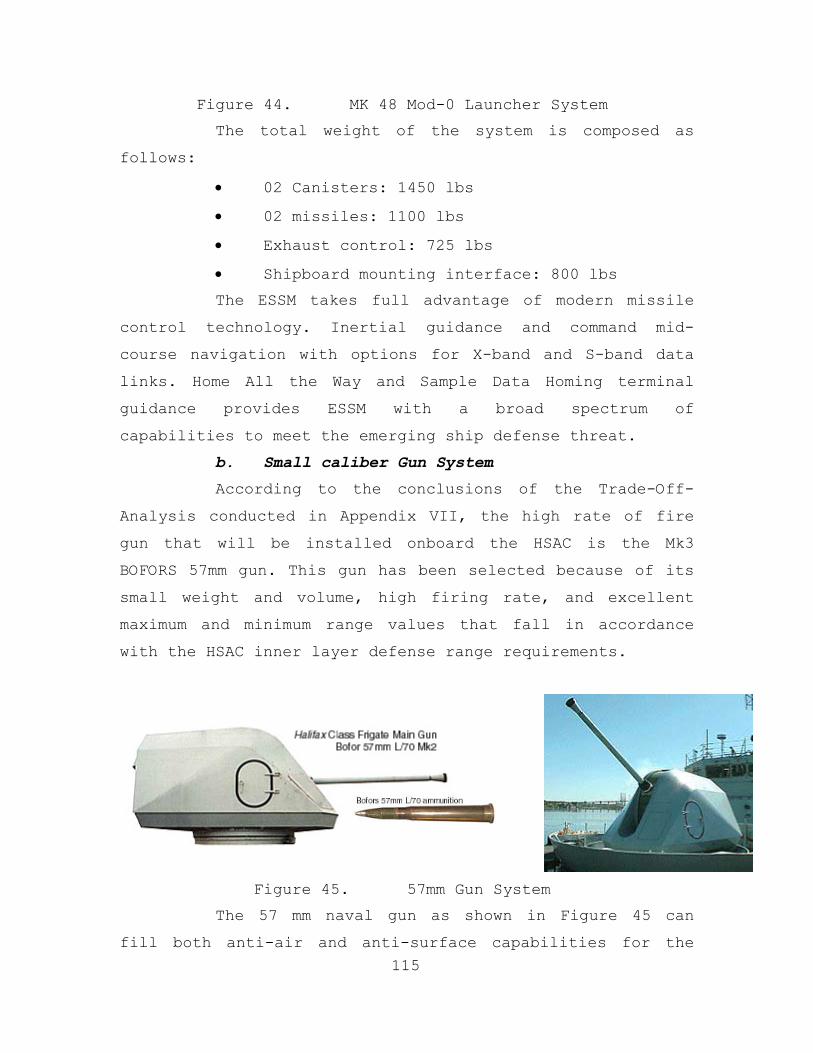
115
Figure 44. MK 48 Mod-0 Launcher System
The total weight of the system is composed as
follows:
• 02 Canisters: 1450 lbs
• 02 missiles: 1100 lbs
• Exhaust control: 725 lbs
• Shipboard mounting interface: 800 lbs
The ESSM takes full advantage of modern missile
control technology. Inertial guidance and command mid-
course navigation with options for X-band and S-band data
links. Home All the Way and Sample Data Homing terminal
guidance provides ESSM with a broad spectrum of
capabilities to meet the emerging ship defense threat.
b. Small caliber Gun System
According to the conclusions of the Trade-Off-
Analysis conducted in Appendix VII, the high rate of fire
gun that will be installed onboard the HSAC is the Mk3
BOFORS 57mm gun. This gun has been selected because of its
small weight and volume, high firing rate, and excellent
maximum and minimum range values that fall in accordance
with the HSAC inner layer defense range requirements.
Figure 45. 57mm Gun System
The 57 mm naval gun as shown in Figure 45 can
fill both anti-air and anti-surface capabilities for the

116
HSAC. With a rate of fire of 220 rounds per minute, a short
firing sequence, a stealth-designed cupola, an effective
maximum range of just over ten miles, and air burst
ammunition, this gun is highly effective against fast
moving surface vessels and small boats.
c. High Power Microwave Active Denial System
(1) Introduction
The high power microwave system that will be
installed onboard the ship is a non-lethal, counter-
personnel directed energy weapon. It uses breakthrough
technologies to provide unprecedented, standoff, non-lethal
capabilities.
This active denial system (ADS) projects a
focused, speed-of-light millimeter-wave energy beam to
induce an intolerable heating sensation on an adversary’s
skin and cause that individual to be repelled without
injury. This non-lethal technology was developed in
response to Department of Defense needs for field
commanders to have options short of the use of deadly
force. This capability is expected to save countless lives
by providing a means to stop individuals without causing
injury, before a deadly confrontation develops.
Non-lethal technologies can be used for
protection of the Joint Access and in other situations in
which the use of lethal force is undesirable. ADS will
provide these capabilities in close in, as well as, at
longer standoff ranges.
Currently, the Air Force has taken the lead
on this technology and has produced prototypes operating
from a Hummvee mount and has personnel portable systems in
the works. Mounting of a ship system should not be of great

117
difficulty due to increased power available on a ship and
less space restrictions compared to a vehicle mount.
(2) HSAC Mission Application
The ADS system will enable the HSAC to
engage threats inside its inner defense layer without
expending ordinance. During the approach to the landing
zone a major threat to the vessel will be from small boats.
As we have learned from the USS Cole incident, these boats
can be modified into mobile bombs. Because the crew of
these vessels is typically exposed in pilot houses or open
decks, they are susceptible to engagement by ADS. Although
countering the system by getting under cover will occur in
some instances, the time expended by the enemy to do so
will aid in time needed to engage the threat by ship
weapons. In addition, the ADS will allow the HSAC to sweep
the beach prior to landing and continue to protect areas to
the outside of the landing zone from an assault by ground
forces on foot. The system is intended to protect military
personnel against small-arms fire, which is generally taken
to mean a range of 1,000 meters. This range suits ship
needs to confront these threats.
More on how HPMADS work and its operating
statements can be found in Appendix VII.
d. Twin M240C Mounted Machine Gun
In addition to the weapon systems described
above, the team decided that the ship needs a very high
rate of fire machine gun to deter hostile fire from the
shore once the ship reaches the landing area. After a
careful examination of the available weapons that can
accomplish this mission, it was decided to use the twin
mount M240C machine gun as shown in Figure 46 (Two M240C
connected side by side).

118
Figure 46. Single M240C Machine Gun (Twin mount not
shown)
This weapon is currently being used on the
Bradley Fighting vehicle and by Seal team operators;
therefore familiarity of this weapon with embarked troops
will be high and that will enable the Joint ACCESS to use
some of its troops aboard to defend itself, its cargo and
its troops when a high rate of fire is desired to cover a
short distance.
Two mounts for the weapon will be positioned on
both the port and starboard side, fore and aft (for a total
of four mounts). Since the weapon is light and moveable,
the vessel will be outfitted with eight guns that can be
used at the discretion of the ship in one or multiple
mounts. In addition to a very high adjustable cyclic rate
between 750 and 950 rpm (2800ft/sec muzzle velocity), this
system offers an excellent maximum range of 3725 meters
which is well outside expected useful need. Guns can be
connected to either a standard 200 round ammunition box or
heavier 600 or 1200 variations.
8. Final System Overview
Figure 47 shows the final system overview after all
the subsystem elements are selected.

119
Directed Infrared Countermeasures
RF Jammer (SLQ-32)
Nulka Decoy System
Radar warning Receiver MAWS
IFF System Other fleet assets
Multifunctional Radar TISS II (EO System)
Navigation Radar Other fleet sensors
Sensors Suite
EW Attack EW Protection
Shipboard Weapons
57 mm Gun ESSM
HPMDS Twin M240C
Small arms Crew served weapons
EW Suite
System Controller
Displays & Controls
Countermeasures
Ship Bus
Figure 47. Final System Overview
All of the system sensors, including the EW elements,
will fuse their target information to the system control,
which based on an updated threat library and other sensor
fusion algorithms, will assign the appropriate
countermeasure that meets the threat’s type and priority.
This procedure can be done either automatically or manually
based on the judgment of the ship’s command.
9. Combat Engagement Flow
In the following section, we will proposed a concept
for employing the sensor suites and combat systems elements
onboard the HSAC when a threat is detected
a. Air Defense
The “contact” is first detected by the existing
sensors onboard the ship and all available fleet assets in
the area (these include radars, EO system as well as EW
elements). The IFF system next classifies the “contact” as
hostile, neutral or friendly. If it is identified by the
IFF system as a threat, fire control information (Range,

120
bearing and velocity) must then be obtained. If this data
is unavailable, more sensors must then be allocated to
track the target. Once the target information is obtained,
the SSPS controller will propose the most appropriate
weapon system to engage the target.
The outer layer defense consisting of the
Littoral Combat Ship and other fleet assets will be
notified of the threat and appropriate action must be taken
by those assets to counter the thereat.
If the target escapes the outer layer defenses
and enters the middle layer of the HSAC defense zone, an
appropriate number of ESSMs will be fired once the threat
is within their firing range. The number to fire depends on
the number of threats and their characteristics.
If the target enters the inner layer defense zone
(less than 5 miles from the ships), the SSPS will decide
the optimum position and firing range to engage the 57mm
gun to counter the threat. In addition, the Nulka system
will be used to deceive the target and divert it from a
collision course with the HSAC. If the target escapes all
defenses, the twin M240C machine gun will then engage it.
This entire sequence can be either automatic or
commanded by the Tactical Officer in charge. During the
entire sequence, the SSPS will provide bearing and speed
directions to optimize the RCS of the ship.
b. Surface Engagements
In a similar way to the air defense sequence,
surface “contacts” are first detected by either the ship’s
sensors or other fleet assets. If a “contact” is identified
as a threat, fire control information must be obtained from

121
the target. Once obtained, the SSPS will allocate the most
appropriate weapon system to engage the threat. Long range
detection (beyond the radar horizon of the MFR) and
engagement (>25 miles) may be possible if the LCS or other
fleet assets are in the vicinity.
If the target enters the lethal range of the
ESSMs, the SSPS will decide if the target has high enough
priority to utilize the ESSM to engage it.
If a target enters the inner defense zone, the
57mm gun will be employed to engage it. The Nulka system
will also be used to deceive the target and redirect it
from its collision course with the HSAC. The SSPS will also
employ the HPMADS system and the M240C machine guns to
deter or repel the personnel of any “unknown” vessel that
closes to less than 3km range from the Joint ACCESS. If a
target escapes all defenses, or that it is not a high
enough priority to be engaged with the ESSM or the 57mm
gun, the twin 40mm machine gun will engage it.
Depending on the target type and the type of
threat it poses, the SSPS will decide on the best course of
action and the weapon system that can best engage the
target.
c. Subsurface warfare
Submarine warfare will be designated to either
the LCS or other fleet assets. The TVs of the TISS II
electro-optical system is capable of imaging floating
mines, and submarine periscopes under clear visibility
conditions but no mine destruction capabilities are
envisioned for the HSAC, though.

122
10. Reliability
The evaluation of the SSPS in terms of reliability is
based on the concept of the reliability / survival
function. The reliability is expressed and provided in
terms of Mean Time Between Failure (MTBF) and the
instantaneous failure rateλ .
a. Definition
Reliability is the probability that a system will
perform in a satisfactory manner for a given period when
used under specified conditions. A system's overall
reliability can be determined by the development of
reliability models. The complexity of these reliability
models is dependent upon various factors such as mission
profiles, function criticality, and redundancy
characteristics. The general approach is to capture the
modeling effort with the use of Reliability Block Diagrams.
b. Reliability Prediction Analysis
The reliability analysis can be used to define
the quantitative parameters for each sub-system or the
complete system, and may be expressed in number of failures
in a given set period of time, set number of cycles or set
number of operations, such as rounds fired from a small
caliber gun, etc.
A common expression used to define an item's
reliability is its Mean-Time-Between-Failure, commonly
known as its MTBF. Once this figure is known it can be used
to determine the reliability of an item in terms of a
probability of success or failure, over a given operating
period.

123
c. Reliability Analysis (Methods)
There are two methods available for determining
the reliability of an item (this could be a piece part to a
complete system) and are:
(1) Reliability Prediction
This is the process used to determine the
MTBF of an item. This is achieved by performing a
prediction analysis.
(2) Similarity
This method is used to determine what the
reliability of a new product will be based upon the "known"
reliability of an existing product with similar attributes.
These attributes can be the type of technology used,
digital circuitry, complexity of components and also
comparable operating environments and scenarios [9].
The reliability of the SSPS is the product
of the individual reliabilities of its different subsystems
such that for a given MTBF, we define 1/MTBFλ = and the
overall reliability of the system using the exponential
distribution is then calculates by
( )ii
tt
iR e e λλ −− ∑= Π =
-3where = failure rate per hour*10 , and t is the number of hoursλ
The reliability calculation of the ship self
protection system is not detailed in this project. The
failure rates provided in Table 8 do not reflect accurate
data but are provided for illustrative purposes only. A
Reliability prediction data summary spreadsheet table below
was provided for use with the most important subsystems,
once MTBF data is acquired.

124
Table 8. Reliability Calculation
Component Part Quantity of parts
(λ/Part) (Qunatity)
RWR 0.2 1 0.2RFJ 0.3 1 0.3MAWS 0.2 1 0.2DICM 0.3 1 0.3MFR 0.2 1 0.2Nav. Radar 0.3 1 0.3EO System 0.2 1 0.2ESSM 0.3 32 9.657mm Gun 0.5 1 0.5HPM System 0.5 2 1Twin M240C 0.5 4 2
Σ= 14.80%
Failure rate (λ)= 14.80% /1000 hoursMTBF= 1000/ 0.148 6757 hours
λ/ Part (%/1000 Hours)
11. Availability and Cost Effectiveness
The metrics of Availability is derived from the
following common definitions:
a. Operational Availability
The probability that a system when used under
stated conditions in an actual operational environment will
operate satisfactorily when call upon.
b. Achieved Availability
Similar definition as Operational Availability,
but includes preventive and scheduled maintenance.
c. Inherent Availability
The probability that a system or equipment, when
used under stated conditions in an ideal support
environment, will operate satisfactorily at any point in
time as required but it excludes preventive or scheduled
maintenance actions, logistics delay time and admin delay
time.

125
d. System Effectiveness
This is defined as the probability that a system
can successfully meet an overall operational demand within
a given time when operated under specific conditions.
e. Cost Effectiveness
Relates to the measure of a system in terms of
mission fulfillment and total life cycle cost, and needs to
be expressed in a suitable way, referencing to the specific
mission of the HSAC. [10]
12. Maintainability
The SSPS Maintenance will be organized in a way that
will facilitate system operation and maintenance from
forward sea bases. All subsystems will incorporate Built-
In-Test capabilities with Automated Fault Detection.
Maintenance will be implemented in the commonly known three
levels which are as described in following paragraphs.
a. Organizational Maintenance
Organizational maintenance is the responsibility
of and performed by the equipment operator; scheduled
preventive maintenance services are performed by trained
personnel. Operational maintenance consists of proper
equipment operation, safety and serviceability inspections,
lubrication, and minor adjustments and services.
b. Intermediate Maintenance
Intermediate maintenance is the responsibility of
and performed by a designated maintenance shop. The extent
of intermediate maintenance encompasses the removal,
replacement, repair, alteration, calibration, modification,
and the rebuilding and overhauling of individual
components, assemblies, and subassemblies.

126
c. Depot Maintenance
Depot maintenance is performed on equipment
requiring major overhaul or comprehensive restoration to
return an item of equipment to a "like-new" condition.
Depot level maintenance uses production line and assembly
line methods whenever practical.
d. Modular Design
Modular design should be incorporated in order to
allow facilitated access and replacement of components.
Functional subsystems will comprise Line Replaceable Units
(LRUs). The SPS-level Built-In-Tests will troubleshoot
malfunctions to the LRU level, allowing remove and replace
maintenance functions to be executed at the O maintenance
level (i.e. flight line), facilitating operations from
forward deployment bases.
13. Risk Management:
a. Purpose
The purpose of the risk management plan is to:
• Provide a disciplined and documented approach to risk management throughout the SSPS life cycle and its upgrades.
• Support management decision making by providing integrated risk assessments (taking into account cost, schedule, performance and safety concerns).
• Communicate to management the significance of assessed risk levels and the decisions made with respect to them.
b. Definition
• RISK: An undesirable situation or circumstance that has a realistic probability of occurring and an unfavorable consequence on the overall mission success.
• Risk Levels

127
• High – Likely to cause significant degradation of the performance, even with special project emphasis
• Medium – Can potentially cause disruption of schedule, increase in cost, and/or degradation of performance. Normal project emphasis will probably be sufficient to overcome issues
• Low – Has little or no potential for disruption of schedule, increase in cost, and/or degradation of performance. Normal project activities will probably be sufficient to overcome issues.
c. Components of risk
Risk is the product of the probability of the
unwanted outcome x loss experienced if the outcome occurs
[8]. Figure 48 clearly outlines this principle.
Figure 48. Risk Analysis
d. Phases
• Risk Assessment – Identify possible risks, and determine root causes
POTENTIAL OF FAILURE
(Pf)
CONSEQUENCES OF FAILURE (Cf)
INCREASING RISK

128
• Risk Analysis – Determine probability of occurrence, and determine most likely consequence of identified risk
• Risk Abatement –Identify potential risk reduction actions, and analyze and prioritize changes to existing plans
e. Risk Management Plan for the HSAC
Figure 49 shows the proposed Risk management Plan
for the SSPS onboard the Joint Access.
Yes
RISK ANALYSIS
IDENTIFY RISK ITEMS
DETERMINE POTENTIAL OF FAILURE Pf
DETERMINE CONSEQUENCES OF
FAILURE Cf
COMPUTE RISK = Pf*Cf
IS RF > 0.7? IS RF > 0.3?
HIGH RISK: 1. Risk Report 2. Risk Abatement Plan 3. Special Review
LOW RISK: 1. Regular Review 2. Monitor Program activity in program status report
MEDIUM RISK: 1. Risk Report 2. Risk Abatement Plan 3. Special Review
No No
Yes
Figure 49. Risk Management Plan for the HSAC 14. Survivability Analysis
In this survivability analysis, it was decided to
start from the outer layer and analyze the probability of
kill down to the inner layer of the self defense zones.

129
Most of the threat in the outer layer will be taken
care of by the LCS and other fleet assets. It was assumed
that half of these threats (aircraft, missile, etc.) will
be destroyed by non HSAC weapons. Therefore, the Pkill of the
HSAC in the outer layer is:
Pkouter=1-0.5*0.5= 0.75
Inside the middle layer, the ESSM is the main
countermeasure to put down any threat. It was assumed that
the missile reliability includes 3 components: the
capability to track the target, the capability to guide the
seeker to the target, and the capability of properly
detonating the fuse at the target.
Data collected from previous reports that assessed the
performance of the RIM-7 missile will be used for the rest
of this analysis. It has been assumed that there will be
sufficient number of missiles to engage each ASCM.
The ESSM missile is assumed to have a reliability of
90% and a warhead lethality (given a hit) of 75%. Therefore
a Single Shot Kill Probability against any ASCM is
PSSK = 0.90 × 0.85= 0.765
Because the probability of a single shot kill is
relatively low, it is probably more practical and safer to
deploy two missiles to ensure a higher probability of kill
against any ASCM threat. Therefore, the PK-ESSM= 1-(1- 0.765)2
=94.5%
A figure of 60% has been assigned to the HPMADS
ability to soft-kill (repel) an enemy once it engages it.
This is the probability that the denial system will render

130
an enemy unable to fight once it is subject to the HPM
projected high energy beam.
Pk-HPM = 60%
The Twin M240C mounted machine gun system has been
assigned a Pk-twin = 20%, once they engage the threat.
The electronic warfare systems have been given a Pk-EW =
60% effectiveness against ASCMs.
Therefore the total effectiveness of the layered
defense (going from the outer to the inner layer) is
defined as:
2401 (1 )(1 )(1 )(1 )(1 )KTOTAL Kouter K ESSM KHPM twinM C K EWP P P P P P− −= − − − − − −
PKtotal=1-(1-0.750)(1-0.945)(1-0.600)(1-0.200)(1-
0.600)=0.998
According to the ORD of the HSAC, each of the HSAC
variants should be able to counter a maximum threat
involving 8 simultaneous ASCMs. Therefore, assuming 96
incoming ASCMs (8 missiles for each of the 12 HSACs
conducting one single mission), the possibility of 1 or
more missiles leaking through all the defenses of the HSAC
is:
PLeakage = 1- 0.9988 = 0.175
Given this value, .175*12= 2 of the total number of 12
HSAC could be hit in this worst case scenario attack.
The remaining squadron of ten ships would remain a
viable fighting force.
15. RCS Calculations
The ship’s RCS was calculates using three methods. The
first is an empirical method, the second is by using the

131
POFACETS software developed at the Naval Post Graduate
School, and the last method is the XPATCH software.
All calculations were conducted in the 300MHz
frequency band.
a. Empirical Method:
By now, there have been sufficient measurements
and trials to allow ranking and scaling of RCS calculations
to take place for naval vessels. There are a lot of
empirical formulas out in the literature but the most
suggested one for low grazing angles is developed by
Skolnik. It calculates the RCS of a ship based on its
displacement (or length if displacement is not known) and
the frequency used.
0.5 1.51644F Dσ =
where D is the ship’s displacement in kilotons
and F is the frequency is GHz.
According to this formula, the mean RCS of the
ship based on its displacement is
0.5 1.51644 0.3 5 1006 07 4SHIP GHz KtonsR B mCS d s= × × = =
This approximation varies with aspect angle and
it is suggested that 13dB is added to provide the broadside
“flash” while 8dB must be subtracted to reach the minima.
Therefore, we estimate the ship’s RCS to vary between
32dBsm (for minima) and 53dBsm for broadside angle.
b. POFACETS Method:
(1) Inputs
POFACETS version 3.0 is RCS calculation
software developed by Professor David C. Jenn (NPS),
Commander Elmo E. Garrido Jr. (Phillipine Navy) and Major
Filippos Chatzigeorgiadis (Hellenic Air Force).

132
(2) Results
The POFACETS Method, led to the following
results:
Figure 50. POFACETS Results (2) Conclusion:
As shown in Figure 50, we can clearly see
that the POFACETS results led to significantly lower

133
numbers than the empirical formula results. The median RCS
was about 20dBsm. The broadside RCS (90 and 270 degrees)
was in the 45dBsm while the minimum was significantly lower
than 32dBsm.
d. Xpatch results:
Because the XPATCH software provides DOD baseline
measurements, it was necessary to run it against our model.
Due to distribution limitations, the program is run by Dr.
David Jenn (ECE Department).
In order to use Xpatch, we first converted our
ship’s rhino file into a “.facet” file. We did this using
the Cifer conversion utility included in the Urbana
software that is available in the ECE microwave lab. The
most important target information after the conversion
process and some of the Urbana options are outlined next:
Target is Perfect Electric Conductor (PEC) Target name: rhino3.facet Length unit is meter Target total facet surface area = 15106.79 Facets: good= 696 bad(thrown out)= 178
absorb= 0 Target geometry: facet 1st bounce: z-buffer(FD) Higher bounce: SBR Edge diffrac: none Ray divergence factor is set to 1 All mono-static rcs are in dBsm & angles in deg
Then, we provided Dr. Jenn with the
“rhino3.facet” file. He run the program and provided us
with the results in an ASCII format.
After plotting the results in Matlab (as shown in
Figure 51, we noticed that the XPATCH results were very
comparable to the POFACETS results. The median RCS was
about 20dBsm, while the broadside angles led to an RCS in
the vicinity of the 45dBsm.

134
Figure 51. XPATCH RCS calculations results 16. References
[1] Schleher, C., “Electronic Warfare in The
Information Age”, Electronic Warfare Support, Norwood, MA:
Artech House, 1999.
[2] Schleher, C., “Electronic Warfare in The
Information Age”, Expandable and Decoy Systems, Norwood,
MA: Artech House, 1999.
[3] Herskovitz, D., “Killing Them Softly”, J.
Electronic Defense, Aug. 1993.
[4] Pollock, D., The Infrared & Electro-optical
Systems Handbook, Vol. 7 Countermeausres Systems,
Bellington, WA: SPIE Optical Engineering
Press, 1993
[5] EC4690 Class notes
[6] TSSE 2003 final project
[7] www.drs.com

135
[8] TS3001 Class notes
[9] MIL-HDBK-217, Military handbook, Reliability and
Failure Rate Data for Electronic Equipment (Washington,
D.C.: Department of Defense)
[10] Blanchard, B.S., and W.J. Fabrycky, Systems
Engineering and Analysis, 3rd ed., prentice hall, Inc. Upper
Saddle River, N.J., 1998
[11] FN Manufacturing, Inc
D. PROPULSION
1. Propulsion Plant Analysis
An in-depth analysis of propulsion plant alternatives
was conducted. The possibilities ranged from purely
mechanical drive to purely electrical drive to a
combination of the two. Ultimately, the benefits of
electric drive far outweighed the other alternatives, and
therefore an integrated propulsion system to the electrical
distribution system was chosen for the HSAC.
a. Propulsion Plant Trade Off Analysis
There are many aspects to consider when selecting
a propulsion plant type. Among those are: size and weight
of the propulsion plant, efficiency, reliability, power,
acceleration, and modularity. Most of the possible marine
propulsion plant types were researched and considered in
light of the Operational Requirements Document (ORD) and
the Mission Needs Statement (MNS). The propulsion plants
considered were: Conventional Steam Plants, Nuclear Steam
Plants, Fuel Cells, Diesel Engines, and Gas Turbine
Engines.

136
b. Conventional Steam Plant
Conventional steam plants are very efficient at
low speeds. High power is also available for high speeds
even though efficiency is low. Another advantage of steam
plants is the ability to use steam for many auxiliary
systems. In addition to these advantages, a steam plant is
easy to start up, but start up time is long and requires a
high volume and weight. Steam plant fuel efficiency is
low, therefore requiring much more volume and weight for
fuel storage. Manning for a conventional steam plant is
high, and maintenance demands are extensive due to long
overhaul periods. Based on design considerations such as
needing a high speed vessel to carry large amounts of
cargo, the conventional steam plant was removed from
further consideration.
c. Nuclear Steam Plant
Nuclear power plants are highly efficient at all
speeds and powers. Large storage volumes for fuel are not
required due to the nuclear reactor having its own fuel.
There are however, many disadvantages to a nuclear powered
steam plant. Nuclear power plants are very heavy due to
shielding and require extensive manning which is not
necessary for other plant types. Radiation and political
issues are also significant concerns. Nuclear power plants
take an extremely long time to start up and require
extensive maintenance practices. All information with
regard to nuclear power is classified, therefore it would
be difficult to obtain information and conduct the required
analyses. Based on the above disadvantages and practical
difficulties, a nuclear steam plant design was removed from
further considerations.

137
d. Fuel Cells
Fuel cells are a clean, efficient source of
power. However, even though there is promising technology
in the field of fuel cells, current capabilities are well
below that required by the Joint ACCESS. Current
technology power levels are significantly below the
required power level of approximately 60 MW at full speed
and load. Based on this technology gap, fuel cells were
removed from further consideration.
e. Diesels
Diesel engines are very cost efficient and have
low specific fuel consumption. In contrast, however,
diesel engines have low power to weight ratios and have
intensive manpower requirements. Diesels also require
large storage volumes for fuel oil. Another disadvantage
of a diesel engine is that in order to meet the power
requirements of the Joint ACCESS, multiple engines per
shaft would be required which leads to space and
arrangement problems. Based on these disadvantages, diesel
engines were removed from further consideration.
f. Gas Turbines
Gas turbines have many features and
characteristics that make it an attractive option for
surface ships. Gas turbines are modular in design, one can
be removed for maintenance and it can either be repaired or
replaced with a new, identical gas turbine. Gas turbines
have high power to weight ratios, and are very efficient at
the high power requirements of the Joint ACCESS. Gas
turbines have very fast startup times and require little
maintenance and manning. Gas turbines have low noise

138
signature compared to diesels and are a very reliable
source for high power applications.
Gas turbines typically do have high infrared
signatures, but this disadvantage pales in comparison to
the advantages of gas turbines. Due to the fact that gas
turbines are a reliable, efficient power source currently
on many naval combatants, gas turbines were chosen as the
power plant for the Joint ACCESS.
2. Gas Turbine Comparisons
a. ICR WR21
The ICR WR21 (Intercooler Recuperator) combines
the most advanced technological advancements in gas turbine
machinery. The Intercooler Recuperator can reduce specific
fuel consumption by as much as 14% over single cycle gas
turbines, as well as greatly reduce the infrared signature
due to the intercooling stage. The main disadvantage of
this gas turbine is the very high weight compared to other
single cycle gas turbines. Other disadvantages are high
volume, cost, and risk associated with the newer design.
Figure 52. ICR WR21 Gas Turbine

139
b. MT30 TRENT
The MT30 Trent is a high efficiency, high power
gas turbine. The power available from the MT30 is 36 MW,
therefore, two of them would be sufficient to overcome the
total power required at full speed and load of the Joint
ACCESS. The MT30 is also efficient at lower power levels,
which is uncommon for gas turbines. The major disadvantage
of the MT30 is its excessive volume compared to other gas
turbines.
Figure 53. MT 30 Gas Turbine c. LM 2500
The LM2500 is a proven reliable gas turbine and
can be found in many naval applications. The LM2500 is
fairly efficient and requires minimal maintenance (40 hours
of maintenance out of every 10,000 hours of operation).
The efficiency of this gas turbine can be greatly increased
by using the exhaust for other applications such as boilers
and other auxiliary systems. The LM2500 has a higher
volume and lower power output than the improved version
(the LM2500+); therefore, it was removed from further
consideration.

140
Figure 54. LM2500 Gas Turbine
d. LM 2500+
As previously stated, the LM2500+ is an upgraded
version of the LM2500. This engine has lower installed
cost per horsepower lower life-cycle cost than its
predecessor. The LM2500+ operates at 3600 RPM to achieve
40,000 brake horsepower (BHP) with a single cycle
efficiency of 39% operating at ISO conditions. The LM2500+
delivers 25% more power than the LM2500 primarily by adding
another compressor stage on the front of the LM2500
compressor and increasing the airflow through the engine by
as much as 23%. The LM2500+ is one of the most desirable
on the market for high power applications primarily due to
its high efficiency and reliability, low SFC, and
modularity.
Figure 55. LM2500+ Gas Turbine

141
e. LM 1600
The LM1600 is another high-efficiency gas turbine
primarily due to the high pressure ratios of the
compressors, high turbine inlet temperatures, and
conservation of cooling air. This gas turbine is fairly
small, and power output is only around 13 MW. Even though
this gas turbine has a high power to weight ratio, the
Joint ACCESS would require at least 5 of them, so the
LM1600 was removed from further consideration.
Figure 56. LM 1600 Gas Turbine f. LM 6000
“The LM6000 is the most fuel-efficient simple-
cycle gas turbine in its size class today, delivering more
than 40 MW with a thermal efficiency over 40%.” (Reference
[internet www.geae.com/engines/marine/lm6000.html]) The
LM6000 is the ultimate in single cycle engines with regard
to efficiency and power to weight ratio. The main
disadvantage of this engine is the requirement for a large,
heavy water cooling system. Also, two LM6000 engines would
be needed for a total of 80 MW which is significantly more
than the required 60 MW of the Joint ACCESS. Due to the

142
high volume and weight requirements for the cooling system,
the LM6000 was removed from further consideration.
Figure 57. LM6000 Gas Turbine
As previously discussed, the LM1600 was removed
from consideration due to the fact that it is too small for
our application. The LM6000 was removed from further
consideration due to the need for a high volume and weight
water cooling system. The LM2500 was removed from further
consideration since the LM2500+ can provide 25% more power
at a significantly lower volume. Based on the following
figure, the ICR WR21 was removed from further consideration
due to its excessive weight over the other gas turbines.

143
0
20000
40000
60000
80000
100000
120000
lb
MT 30 ICRWR21
LM 1600 LM 2500 LM2500+
LM 6000
Weights of Gas Turbines
Figure 58. Weight Comparison for Gas Turbines
Only the LM2500+ and the MT30 Trent remained as
feasible gas turbines for the Joint ACCESS, therefore, the
LM2500+ and the MT30 were chosen for further comparison for
the final selection.
0.000
2000.000
4000.000
6000.000
8000.000
ft^3
MT 30 ICRWR21
LM1600
LM2500
LM2500+
LM6000
Required Enclosed Volumes
Figure 59. Volume Requirements for Gas Turbines
Resistance calculations of the hull form were
used to generate the specific power requirements for
propelling the Joint Access, as shown in the next figure
power versus speed.

144
Power vs Speed requirements
0.00
20000.00
40000.00
60000.00
80000.00
100000.00
120000.00
10.00 15.00 20.00 25.00 30.00 35.00 40.00 45.00 50.00 55.00
Speed [ kt s]
Figure 60. Joint ACCESS Power vs Speed
The ship required 38000 HP for achieving a speed
of 33 knots, including the required electrical load of
about 2 MW. As stated above the two engines that could fit
better in the vessel were the LM2500+ and the MT30. These
two engines were examined for their efficiency, performance
and better utilization as far as vessel’s needs.
Both engines could power the ship up to 33 knots,
but for a desired speed of 40 knots, a second engine must
be installed. The MT30, even though it gives about 5.5MW
more that the LM2500+, could not offer a speed more than 37
knots. Fuel efficiency and consumption charts are presented
as the next figures for the two gas turbines.

145
Sfc vs Speed
0
0.2
0.4
0.6
0.8
1
1.2
0.00 5.00 10.00 15.00 20.00 25.00 30.00 35.00 40.00 45.00 50.00
Sp eed [ kt s]
LM 2500+M T 30
Figure 61. LM 2500+ and MT30 Fuel Efficiency Comparison

146
Fuel Consumption Comparison Chart
0.000
1.000
2.000
3.000
4.000
5.000
6.000
7.000
0.00 5.00 10.00 15.00 20.00 25.00 30.00 35.00Speed [kts]
LT/h
r LM 2500+M T 30
Figure 62. LM 2500+ and MT30 Fuel Consumption Comparison
An analysis of the fuel required for an endurance
of 2600NM was conducted, assuming a cruising speed of 33
knots, which is achievable from both engines, and the
LM2500+ required 3% less fuel.

147
465.0
470.0
475.0
480.0
485.0
490.0
LT
LM2500+ MT 30
Endurance Fuel Required
Figure 63. LM 2500+ and MT30 Endurance Fuel Comparison
The difference between the LM2500+ and MT30 Trent
was not dramatic, therefore the LM2500+ had to be examined
to determine how much fuel would be required to attain the
desirable endurance. According to the next plot, the knee
of the curve occurs at the desirable cruise speed of 33
knots for the Joint ACCESS.

148
Endurance Fuel Estimation for 2600NM
0.0
100.0
200.0
300.0
400.0
500.0
600.0
700.0
800.0
0.00 5.00 10.00 15.00 20.00 25.00 30.00 35.00 40.00 45.00 50.00
Speed [ kt s]
Figure 64. Joint ACCESS Fuel Estimation
The LM2500+ was chosen as the prime mover because
it outperformed the other engines in volume, weight, and
efficiency requirements and because of the power
requirement of about 60 MW; it fits very well within the
design of the Joint ACCESS. The vessel will use one Gas
turbine for cruising up to a speed of 33 knots and a second
one for achieving higher speeds up to a maximum of 43 knots
during operational phases for deploying cargo. A third
relatively small gas turbine will be used as an emergency
power back up and for providing the required power during
harboring. The Allison AG9140 was selected to serve as the
back up generator
3. Electric Propulsion Motor Trade Off Analysis
A propulsion motor trade off analysis was conducted
between conventional motors, DC Homo-polar motors and High
Temperature Superconducting (HTS) AC Synchronous motors.

149
Both the DC Homo-polar and the HTS are superconducting
motors, and a comparison was done between superconducting
motors and conventional. The table below shows a
comparison of superconducting applications to conventional.
Table 9. Comparison of Superconducting Electric Power Applications to Conventional Technologies
Superconducting technology greatly increases the
overall efficiency of the system. Also, superconducting
technologies have longer lifecycles than conventional. The
only downside of superconducting motors is higher cost, but
this is mitigated by having a longer lifecycle. Also,
superconducting motors are much smaller than conventional,
and space consideration is of extreme importance onboard
the Joint ACCESS.
After comparing conventional motors with
superconducting motors, conventional motors were removed
from further consideration.
a. DC Superconducting Homo-Polar Motor
For propulsion R&D purposes, the Navy built a
25,000 HP induction motor that weighs 117 tons and has a

150
volume of 2500 ft3. A DC homo-polar motor that provides 60%
more power weighs less than a third, and occupies a volume
roughly half of the R&D induction motor. The DC homo-polar
motor generates a very low noise signature, so it is quite
stealthy. The downside of this motor is that it requires
two cryo-coolers, each weighing aroung 200 lbs.
b. HTS AC Synchronous Motor
As shown in the figures below, the American
Superconductors HTS AC Synchronous motor is approximately
one fifth the size and one third the weight of a
conventional motor of equivalent power.
Figure 65. Volume Comparison of HTS vs. Conventional
Motor

151
Figure 66. Weight Comparison of HTS vs. Conventional
Motor
The HTS can be driven at several times the rated
output for short periods of time, giving the ship added
operational flexibility when emergency propulsion is
required.
The HTS is also smaller than the DC homo-polar
motor as shown in the figure below.
Motor
Type
Diameter
(m)
Length
(m)
Cyro-cooler
Volume ( 3m )
HTS AC
synchronous
2.65 2.08 1.0
DC
Homopolar
2.65 3.05 1.4
Figure 67. HTS AC Synchronous vs. DC Homopolar Motor Dimension Comparison

152
The design team was informed by a representative
of the manufacturing company that the dimensions of the
desired motor of 15 MW would not be much larger than their
current 5MW motor due to the relative high RPMs that the
propulsors will operate. Therefore, the HTS motor will fit
very well inside the narrow main hull form.
Based primarily on the size and weight advantage
of the HTS over the DC homo-polar motor, the HTS was chosen
as the electric drive motor for the Joint ACCESS
4. Propulsor Trade Off Analysis
The most popular available technologies were taken
into account for the trade off studies of the propulsor
type. These are propellers, electrical pods and water jets.
Since there was a high-speed requirement for the design,
water jets have an overall advantage compared with the
other technologies.
a. Propeller
The disadvantages of conventional propellers are:
increased navigational draft, lower efficiency at higher
speeds, and limitations that could be introduced because of
the narrow beam and shallow draft that was desirable for
the Joint ACCESS. Nevertheless, propellers are the most
popular propulsor solution with the smallest risk.
b. Podded Propulsors
The disadvantages of podded propulsors are the
additional amount of resistance, increased aft draft,
additional drive trains, and the total complexity of the
system. Considering our hull dimension limitations and the
beachable operational concept of our craft, despite their
significant maneuverability, podded propulsors are not a
viable alternative for the JOINT ACCESS.

153
c. Conventional Water Jets
The biggest weakness of water jets is the added
water weight problem. The water that fills the duct for the
jet to operate, and the additional infrastructure required,
greatly increase the ship’s aft weight.
d. Bird-Johnson AWJ-21
This great weakness had been overcame with the
selection of the Rolls Royce Advanced Water Jet propulsor
application (AWJ-21TM) by Bird – Johnson company. The AWJ-
21TM is a podded water jet which is mounted at the aft part
of the hull as shown in the figure below.
Patents Approved & Pending
Figure 68. AWJ-21TM Integrated into Hull
The Joint ACCESS will be propelled by four AWJ-
21TM s, each driven by an HTS motor as stated in the above
section. The AWJ-21TM is based on an advanced mixed-flow
pump design which is highly efficient even at low speeds in
contrast to conventional water jets. Another basic
attribute is the patented underwater discharge
configuration which has been incorporated into its design.
These two basic characteristics offer an improved
cavitation performance, greater tolerance to poor inflow

154
conditions, and reduce the jet-related wake disturbances
and noise level, which gives this water jet a stealth
character, as the manufacturing company asserts.
The AWJ-21TM features an integrated steering and
reversing system with a single hull penetration which
provides superior maneuverability even at low speeds. This
will offer a great potential to the concept of deploying
cargo by “touching” the beach with the bow and maintaining
ship’s position by self power to the jets, in contrast with
old beachable vessels that had to go onto the beach.
Furthermore, the need for reversing drive shaft direction
is eliminated. The next figure presents a cut-away view of
the water jet.
Figure 69. Cut-Away View of AWJ-21TM
Another advantage is that they need not be
considered during “Mediterranean” mooring maneuvers of the
vessel, because they are not exposed since they are not
placed at or near the transom. Another great benefit is
that they typically will not have an impact on the
navigational draft. Rolls Royce provided the team with data
that they used for estimating the operational RPM and size.
Despite the fact that the team did not have specific
dimensions and characteristics for the 15 MW jets that were
chosen for the design, size and RPM vs. power were plotted
P a te n ts A p p r o v e d & P e n d in g

155
in order to make a rough estimation of the jet’s features.
From Figure 70 it can be seen that the AWJ-21TM of the JOINT
ACCESS will operate at a maximum power around 450 rpm and
from Figure 71 that the approximate diameter for the
desirable jet of 15 MW will be around 1.70 m.
Rpm vs Power
0
250
500
750
1000
1250
1500
1750
2000
0 5 10 15 20 25 30 35 40Power [MW]
Rpm
Figure 70. AWJ-21TM Speed vs. Power
Size vs Power
0
0.5
1
1.5
2
2.5
3
0 5 10 15 20 25 30 35 40Power [MW]
Size [m]
Figure 71. AWJ-21TM Size vs. Power

156
Due to the fact that the aft hull of the vessel
sweeps up 3 m from the mid section until the transom, it
leaves plenty of clearance for placing the water jet with
no impact on the ship’s draft. A comparison was conducted
with a conventional propeller, using a propeller
optimization program, resulting in a propeller diameter of
4.5 m which would result in a 2 m or more increase of the
aft draft.
The technology this water jet employs allows it
to operate at 2 – 3 times the rpm of a conventional
propeller and requires less torque for driving it,
therefore results in electric drive motors with a smaller
size and weight. This improvement makes the AWJ-21TM ideal
for electric driven systems.
Also, by examining the data of the Kamewa water
jet SII series that is presented in Appendix VIII, the team
concluded that the water that is inside the system weighs
approximately 60-65% of the total corresponding structural
weight. Eliminating this water column is extremely
beneficial to reducing the total weight of the propulsion
system.
For all the reasons above the AWJ-21TM is more
than adequate to fulfill the operational concept of the
Joint ACCESS and is selected as the ship’s propulsor.
E. ELECTRICAL DISTRIBUTION
1. Distribution Design Analysis
To provide a robust, flexible, and reliable electrical
distribution system for the Joint ACCESS, we decide to
pursue a DC zonal distribution system. The DC Zonal
distribution allows for simpler and faster fault detection
by isolating faults to their corresponding zones. Since

157
the generator frequency is decoupled from the actual
distribution equipment, the prime movers can be run at
their optimum speed. Finally, the zonal distribution
itself allows for greater survivability in the event of
battle damage.
The DC zonal distribution works well in the Joint
ACCESS design for several reasons. First with a
significantly reduced crew size, the DC zonal distribution
system allows control systems to isolate the general and
possibly the exact location of the fault. This greatly
reduces the number of men and man hours required to isolate
and repair the problem. Secondly, the Joint ACCESS’
offensive and defensive capabilities are limited due to its
primary mission, relying on the protection of “Sea Shield”
for overall defense from enemy attacks. The DC zonal
distribution helps increase the survivability of the Joint
ACCESS in the event of a casualty and helps ensure that it
can continue on and complete its mission. Finally from the
propulsion analysis, it was determined that an electric
drive would propel the ship. The DC zonal distribution
will tap directly off the propulsion bus without causing
any other design changes.
2. Actual Distribution
The distribution system that was implemented was
derived from the Office of Naval Research (ONR) Challenge
Problem. This reference system was chosen due to its
emphasis on creating a reliable, dependable, and survivable
system that not only met the current needs of the ship but
also allowed for the expansion of future high power
weapons. Figure 72 depicts overall electrical distribution
with an example of one DC zone.

158
Prime Mover
SM
AC to AC Converter
HTS HTS
Waterjet Waterjet
Prime Mover
SM
AC to AC Converter
HTSHTS
WaterjetWaterjet
PSPS
DC Zone #1
Allison AG9140
SSCM
SSCM
Motor Controller for Bow Ramp
Prime Mover
SM
AC to AC Converter
HTS HTS
Waterjet Waterjet
Prime Mover
SMSM
AC to AC Converter
HTSHTS HTSHTS
Waterjet Waterjet
Prime Mover
SM
AC to AC Converter
HTSHTS
WaterjetWaterjet
Prime Mover
SMSM
AC to AC Converter
HTSHTSHTSHTS
WaterjetWaterjet
PSPS
DC Zone #1
Allison AG9140
SSCM
SSCM
Motor Controller for Bow Ramp
Figure 72. Joint ACCESS Example Electrical Distribution
To provide the total 58MW required for propulsion and
the 2MW for combat systems and hotel loads while underway,
two LM2500+ gas turbines producing 30.5MW each (61MW total)
were used as the prime movers. The LM2500+ gas turbines
each power a 13.8kV AC bus, one on the port side and the
other on the starboard side. Each AC bus goes through an AC
to AC converter and powers two HTS AC synchronous motors
which drive two waterjets. The AC busses are cross
connected so that either LM2500+ can provide power to all
four HTS AC synchronous motors in the event of a LM2500+
casualty.
For powering the ship in port, an Allison AG9140
producing 3.2MW is connected to both port and starboard AC
busses. In the event of one or two LM2500+ casualties, the

159
AG9140 can supply combat system and hotel load power, along
with limited propulsion power.
The combat systems equipment and hotel loads all draw
their power off of port and starboard 1100V DC busses.
Each buss is connected to the port and starboard AC busses
via a power supply. The ship is then divided up into six
zones as Figure 73 illustrates. Each of the six zones then
pulls its power off of both the port and starboard DC
busses.
Zone 1:Bow Ramp
Zone 2:CSER #1
Zone 3:ER #1
Zone 4:ER #2
Zone 5: Aft ER
Zone 6:Superstructure
Zone 1:Bow Ramp
Zone 2:CSER #1
Zone 3:ER #1
Zone 4:ER #2
Zone 5: Aft ER
Zone 6:Superstructure
Figure 73. Joint ACCESS DC Zonal Zones
3. References
Office of Naval Research (ONR), “ONR Control Challenge
Problem.” 19 January, 2002.
http://www.usna.edu/EPNES/ONR_Control_Challenge.pdf
F. DAMAGE CONTROL
Use of an Automated Damage Control System (ADCS) will
assist in the HSAC achieving the requirement for reduced
manning. Use of this system in conjunction with concepts
like DC Flex will enable a significant reduction in

160
personnel needed to combat a casualty compared to the large
number of personnel are assigned to damage control
organizations onboard ships currently. The damage control
system, including the chemical, biological and radiation
warfare system is described below.
1. Detectors
The following proposed fire detection systems, smoke
detectors, carbon monoxide detectors, fire and flame
detectors, CCTV system, heat detectors, smart micro
sensors, humidity detectors, and liquid level detectors
will be utilized onboard the for HSAC.
A ship-wide array of sensors will allow continuous
monitoring compartment by compartment. The system will
indicate the exact location of the damage. Progressive
damage or changes in damage will be updated or reported in
real time. Controlling actions can then be directed to the
exact area where required. The speed of the response will
be increased by eliminating the need for investigators to
search for the damage within zones able to bet detected.
Multi-sensor fire detectors will monitor each compartment.
Fiber optical or electrostatic smoke detectors, triple
wavelength infrared flame, carbon monoxide, closed circuit
television, and high performance optical, or fiber optical
heat sensors will detect smoke and fires. Monitoring of a
fire's progression from the first sign of smoke through the
initiation of a fire will occur until the physical limits
of the detectors are reached. Various alarm thresholds can
depict different conditions from the same sensor. Safety of
Life at Sea (SOLAS) guidelines were used in determining the
type of fire and smoke detectors required in each space.

161
Compartments located below the damage control deck
will also be monitored for flooding by liquid level
detectors. Flooding detectors will consist of multiple
sensors located from the bilge level to the overhead which
will aid in the calculation of stability information. The
detectors will be located to indicate the presence of
liquid at 2 and 6 inches, and at heights to monitor
flooding at 10%, 25%, 50%, 75%, and 100% of the
Compartment.
All the remote operated valves and compartment
accesses will also be monitored for their exact material
condition. Paint lockers and pump rooms will be monitored
for atmospheric content. Sewage spaces will be monitored
for hydrogen sulfide gas. Air conditioning and
refrigeration rooms will be monitored for refrigerants and
low oxygen levels. Other appropriate monitoring will be
conducted in spaces subjected to hazards that are present.
Immediate notification to control stations will prevent
unaware watch standers from entering the compartments. The
type of detectors installed in each type of compartment is
shown below in Table 10.

162
Table 10. Installation of Detectors Onboard
Compartment 3I CCTV HPO FO Smart Humidit Liquid
Machinery X X X X X
Engine X X X
Magazine X X X X
Elect Equip X X X X
Hanger X X X
Flight Deck X
CIC X X X
Bridge X X
Cargo Deck X X X
Berthing X X
Galley X X
Passageways X
Paint X
Pump rooms X X X
AC / X X X
All sensors will be connected to a data network
allowing the various processing centers to access the
information. The processing centers in turn pass the
information to the control centers for display and
decision-making. Multiple interconnected data networks will
be strategically routed throughout the ship with redundant
networks in place to increase survivability of the system.
Processing centers will send information to the control
centers which will be able to evaluate the information or
be set up to initiate automatic response to an alarm.
Control stations will be located in main watch stations to
including the Bridge, CIC, Damage Control Lockers, and
Engineering Control Center. All control stations will have
full control and display capabilities but not the ability

163
to process the data. Therefore loss of a single control
station will not adversely affect the system. Watch
standers will be able to monitor the alarms and visually
watch actions of the damage control organizations as they
occur. Actions performed by damage control personnel will
be added manually to the display by a control station
operator.
On scene personnel would have wireless hand held
input/output into the ADCS for direction and information
update as needed.
2. Installed Detector Descriptions.
The following is the description of the installed
Damage Control detectors installed on the HSAC.
a. Smoke Detectors
Photoelectric smoke sensors operate by projecting
a beam of light across a sensing chamber. A photosensitive
receiver detects changes in the projected light pattern
caused by smoke particles within the chamber. These
detectors provide good response to smoke with larger
particles. However, they are subject to false alarms from
other airborne particulates.[1] Optical detectors
(including fiber optics) are based upon the photoelectric
principle, except the beam is not confined to a sensing
chamber and may be projected across open areas. These
detectors can monitor areas up to 25 meters across, and
areas subjected to high airflow rates. An ionization
detector uses an extremely small quantity of radioactive
material to make the air in the detector chamber conduct
electricity. Smoke from a fire interferes with the
electrical current and triggers the alarm. Smaller
particles are detectable, as compared to the photoelectric

164
sensor, providing higher sensitivity in critical
compartments. These detectors can also be prone to false
alarms from airborne particulate matter. Electrostatic
detectors operate by detecting naturally charged particles
across a set of electrodes. The principle of operation is
the same as the ionization detectors without the need for a
radiation source, as with an ionization detector. These
detectors are not as sensitive as ionization detectors and
do not alarms with "nuisance" smoke, such as burnt toast.
These detectors generally require smoke from a developed
fire to trigger an alarm.
b. Carbon Monoxide Detectors
Irrespective of how intelligent a smoke detector
is it still needs the smoke to be introduced to the
detector before it can be sensed and an alarm decision
made. It is difficult if the protected area is large and
open or the seat of the fire is in a hidden area such as a
linen locker or adjacent unprotected room. [1] In a slow
smoldering fire situation, typical of those started by
discarded cigarette ends in soft furnishings or smoldering
sawdust and other organic materials, smoke may not be given
off for many minutes, even several hours in certain
situations, after ignition. During this time the insidious
carbon monoxide gas can build up to a level sufficiently
high so that, on awakening, sleeping persons are too
disoriented to evacuate the area. When smoke is given off
and has reached the detector it can frequently be too late
to stop the rapid spread of the fire. It is also well known
that smoke escaping into corridors can cool and fall to the
floor thus making them impassable by the time the smoke
reaches the detectors at the ceiling and generates an alarm
condition. Smoke can also be prevented from reaching the

165
detectors by barriers of hot air building towards the
ceiling. CO fire detectors react well to smoldering
pyrolysis fire (wood), and glowing smoldering fire
(cotton), but open plastic fires (polyurethane), and liquid
fires (n-heptane) do not produce sufficient CO gas to
trigger an alarm. CO fire detectors are particularly well
suited to accommodation areas where there is a risk of slow
smoldering fires causing death through the build up of CO,
limiting occupants’ ability to evacuate.
c. Fire/Flame Detectors
Infrared and ultraviolet detectors operate on the
ability to distinguish respective radiation wavelengths
that are only given off during a fire. These optical
sensors are capable of monitoring large open areas by a
single sensor. Infrared sensors can be subject to false
alarms by such things as electrical arcs, whereas
ultraviolet sensors are subject to false alarms by such
things as arc-welding, electrical arcs, x-rays and
lighting. Certain infrared sensors can also be used to
monitor temperatures by annualizing the returned radiation
spectrum. UV flame detectors are very sensitive to arc-
welding, electrical arcs, x-rays and lighting. Although it
is possible to eliminate false alarms from lighting and
electrical arcs by the inclusion of time delay processing
the elimination of false alarms from arc welding and x-rays
is much more difficult to achieve. The detectors’
sensitivity to these false alarm sources can be a
significant problem. There are external influences, whose
presence can have a detrimental effect on the ability of
the detector to see flame radiation. The main inhibitors of
UV propagation are oil mists or films, heavy smoke or
hydrocarbon vapor and water films. These phenomenon are

166
present in machinery spaces and on offshore platforms and
can significantly reduce the intensity of the UV signal if
present in the flame detection path. The shortcoming of UV
detectors for offshore and machinery space applications has
resulted in operators preferring the Triple Wavelength
Infra Red Flame Detectors.
Figure 74. Typical Hydrocarbon Fire Spectrum[1]
The use of Triple Wavelength Infra-Red Detection
principles has overcome the main shortcoming of Infra Red
Flame Detectors, namely response to solar radiation and
black body radiation.
d. Closed Circuit Smoke and Flame Detection System
The system uses standard CCTV Cameras. The system
functions by comparing one frame with the next, so that any
change can be evaluated. Compound Obscuration evaluates the
total attenuation of light from the camera to the furthest
point in the field of view. The algorithm is able to de-
couple smoke quantity from smoke density i.e. large clouds
of thin smoke can be identified as well as small areas of
dense smoke.

167
Figure 75. Schematic Video Smoke and Flame[1]
The system can also be used to detect visible oil
mist, high-pressure oil leakage from pipes, and steam leaks
the moment they occur.
e. Heat Detectors
Heat detectors come in different types including
spot detectors and line detectors. Spot detectors sense
temperature at a specific location. Line detectors consist
of a cable run where temperatures can be detected at a
point along the cable, within a certain distance, typically
1.5 meters. Heat detectors work on five basic principles as
follows in the paragraphs below. Fixed temperature sensors
alarm when temperature reaches a fixed point. Fixed
temperature heat detectors are suited to alarm in the
presence of slowly rising temperatures. Fixed temperature
heat detectors are suited for installation where high heat
output fires are expected or in areas where ambient
conditions will not allow use of other detection methods,
Rate-of-rise sensors alarm when rate of temperature
increase exceeds a predetermined value. It is common
practice to have fixed rate sensors in combination with
rate-of-rise sensors, providing good all round heat

168
protection. Thermoelectric effect sensors detect a change
in electric resistance in response to an increase in
temperature. These sensors are typically "hot wire"
anemometers used for sensing temperature changes in fluid
flows, including ventilation ducts.
Fiber optical heat detection is possible by use
of monitoring the scattering of light down the fiber optic,
which is proportional to the temperature sensed along the
cable. The signals are immune to electromagnetic
interference thereby ensuring integrity of readings from
electrically noisy areas, for example around power cables
and transformers. The system can continue to operate in the
event of a fiber break by exploiting the signal processing
techniques. The system can reconstitute the temperature
profile of the entire fiber length regardless of the
position of the break. Depending on the nature of the break
a few measurement points in the immediate vicinity of the
break may be lost. In the case of multiple breaks, the
length accessible to the system will continue to be
measured. The optical fiber temperature sensing system has
wide ranging applications especially where small changes in
temperature need to be detected, like pipe leakages,
overheating of sensitive equipment, and magazine areas.

169
Figure 76. Principle of Fiber Optical Detector[1]
The High Performance Optical Detector has
sensitivity to both hot, fast, "Clean" burning fires
(domain of the ion-chamber detector) and cold, slow
smoldering fires (domain of the optical detector). [1] The
High Performance Optical Detector senses the flaming fires
that generate a significant rise in air temperature
together with a small increase in visible smoke. To sense
this temperature rise, two thermistors are arranged in a
similar fashion to that found in a standard rate-of-rise
heat detector. One thermistor is mounted so as to be
exposed to the air while the second is shielded inside the
detector's body. If the temperature rises slowly then the
thermistor temperature will be approximately equal and no
adjustment to optical sensitivity occurs. If however the
air temperature changes very rapidly, the exposed
thermistor will heat more quickly than the reference
thermistor (heat shielded by the detector body) and a
temperature difference will be established. The electrical
circuit senses that the exposed thermistor is hotter than

170
the reference thermistor and reduces the alarm threshold of
the optical sensor accordingly. If there is smoke present
at a level above the reduced threshold then an alarm will
be raised. Otherwise the detector will remain in its
enhanced sensitivity state, without giving an alarm until
the temperature stabilizes. The High Performance Optical
offers a significant performance improvement over standard
optical detectors, with a much more uniform performance,
across open cellulose fires (wood), and liquid fires
(heptanes).
Figure 77. High Performance Optical Detector[1]
The use of this detector that contains no radio-
active material, together with its systems design
flexibility, now offers the ship operator a cost effective,
stable, false-alarm-free alternative to the ion- chamber
detector.
f. Smart Microsensors
A smart microsensor is a miniature voltammetric /
electro catalytic (V/EC) microsensor made of ceramic-
metallic (cermet) materials that identify many different
gases by their electrical signatures. [2]

171
Figure 78. Smart Microsensor[2]
The micro sensor’s intelligent pattern
recognition system can be trained to recognize a wide
variety of gases and gas mixtures. The microsensor is
inexpensive to produce (< 25 cents per microsensor), and is
proving rugged enough to survive in hostile, high-
temperature environments. The microsensor can be remotely
cleaned and does not require electrolyte replenishment or
replacement. Compared with conventional sensors, power
requirements are low (milliwatts). The neural network
signature processing is scalable and can be implemented on
equipment from a microcontroller up to a larger PC.
g. Humidity Detectors
Humidity sensor contains a capacitive element
that changes value in response to the relative humidity in
the air. An integrated circuit timer translates this
capacitance into a digital frequency.
h. Liquid Level Detectors
Typical flooding detectors are open/closed 'dry'
contact type switches operating by a float mechanism. A
number of these sensors can be mounted at various heights
within a tank or compartment to determine the liquid level.
These switches are either on or off, and the level of
desired accuracy dictates the number of sensors. "Wet" type
contact switches use the fluid level to complete an

172
electrical circuit and provide the alarm. These sensors are
not as desirable as the dry contact switches. Continuous
reading tank level sensors are available and operate by a
detecting a resistance float sensor along a shaft,
providing readings accurate to within one-half inch. These
sensors typically monitor normal tank levels. These
continuous level sensors can also monitor for excessive
liquid loss indicating a damage situation, or provide
unmanned filling operations. The open/closed contact
switches can also be utilized for detecting actuator and
access status. Fiber optical sensors have also been
developed to provide this detection.
i. Conclusions
Other than fire detection, compartments will also
be monitored for humidity and temperature, to calculate
heat stress. Paint lockers and pump rooms will be monitored
for explosive gases and lack of oxygen. Sewage spaces will
be monitored for hydrogen sulfide gas. Air conditioning and
refrigeration rooms will be monitored for refrigerants and
low oxygen levels. Other appropriate monitoring will be
conducted in spaces subjected to localized hazards.
Monitoring confined areas subject to toxic gas or oxygen
deficiency will prevent unwanted exposures of the crew to
these hazards. Immediate notification to control stations
will prevent unaware watch standers from entering the
compartments
3. Installed Firefighting Systems
The proposed fire suppression systems, FM-200, carbon
dioxide, AFFF, and water mist will be implemented on the
HSAC. Active damage control measures will be required to
keep the damage contained and from progressing through out
the ship. Fire extinguishing methods include the use of a

173
ship-wide water mist sprinkler system, AFFF flooding, FM
200 system and carbon dioxide flooding. Independent
extinguishing agents, such as carbon dioxide flooding for
the paint locker and FM 200 for the electronics equipment
compartments will protect specialized spaces. Water mist
sprinklers will protect machinery spaces. Combinations of
the water mist sprinklers and AFFF sprinklers will be used
to combat fuel fires in the machinery spaces, hangar bay,
and cargo deck. The type of fire suppression systems
installed in each type of compartment is shown below in
Table 11.
Table 11. Installed DC Systems
Compartment FM200 CO2 Water AFFF
Machinery Spaces X X
Engine enclosures X
Magazine Areas
Elect Equip Rooms X
Hanger X X
Flight Deck X
CIC X
Bridge X
Cargo Deck X X
Berthing X
Galley X X
Passageways X
Paint Lockers X
Pump rooms X
AC / Refrigeration X

174
a. Installed Firefighting System Descriptions
The following is a description of the systems
that will be installed in the spaces referenced in the
previous section.
(1) FM-200 Fire Suppression Systems
FM-200, heptafluoropropane, is one of the
new Halon alternative agents now in use to protect
essential applications traditionally protected by Halon
1301. This agent has many similar characteristics to Halon
1301 and is safe in normally occupied areas. FM-200 systems
are available in spheres or cylinders. [3]
(2) Carbon Dioxide Fire Suppression Systems
Clean agent carbon dioxide systems, have
been an industry standard for many decades and are still
the preferred agent in many applications. There are several
common local application systems, which are utilized to
extinguish fires in dip tanks, quench tanks and industrial
operations where spilled fuel is a possibility. Local
application systems are also popular in the marine market,
especially in engine compartments.
(3) Water Mist System
Water mist systems extinguish fires
primarily by removing heat from the materials involved in
the combustion process. Water is applied to the fire in
very fine droplets, which appear to the observer as a dense
fog. The ratio of droplet surface area to water volume is
large and conversion to steam occurs very efficiently. The
latent heat of vaporization, which is a physical phenomenon
associated with the change of state of water to a gas
(steam), removes heat from the fire and the steam produced
also helps to smother the fire by displacing oxygen in the
vicinity of the fire. [5]

175
Water mist systems are also safer for people
and the environment. These systems only use potable or
natural seawater, with no adverse side effects. Lower flow
rates equate to less cleanup than traditional water
sprinkler systems. Tests have shown that properly designed
water mist systems can effectively extinguish a wide
variety of exposed and shielded Class B hydrocarbon pool,
spray, and cascading pool fires. A general reluctance to
provide water extinguishing for class "C" fires exists
because of fears of conductivity.
The Navy sponsored a program at the Applied
Physics Laboratory/Johns Hopkins University (APL/JHU) to
evaluate the effects of water mist on energized electrical
equipment. Equipment selected for testing consisted of 3
phase-450 VAC motors, motor controllers and switchboards
that were representative of equipment to be installed in
the machinery spaces of LPD-17. The objective was to
determine potential for equipment damage and to identify
personnel electric shock hazards resulting from the
discharge of mist onto energized equipment. Results showed
that the conductivity of salt free potable water is very
low. Shock hazards could only exist after a sustained mist
flow of sufficient duration to cause plating out or pooling
of water on equipment surfaces. There was essentially no
current leakage for motors or motor controllers. Shock
hazard with switchboards is negligible within the first 15
minutes if the boards are clean and properly grounded. The
summary conclusion relative to LPD-17 is the probability of
creating a shock hazard is low and that watch standers in
the space would not have to evacuate prior to mist
activation even if all equipment is energized. Water mist
systems have been successfully tested on telecommunications

176
switchgear equipment, consisting primarily of vertically
mounted circuit boards. The results of a multi-year water
mist research and development program by the Naval Research
Laboratory, Chesapeake Beach Detachment says that large
fires are easier to extinguish than small fires, due mainly
to the displacement of oxygen by the expansion of the water
mist to steam, obstructed fires become more difficult to
extinguish with increased water droplet horizontal travel
distance, well-ventilated fires are difficult, but not
impossible, for water mist and water mist performs superior
to gases in well ventilated scenarios. Deep-seated Class A
fires are difficult to totally extinguish, though surface
flaming is suppressed, and mist enhances room tenability by
cooling and smoke scrubbing. The system effectively
extinguishes flammable liquid pool fires as well as spray
fires, which could ignite from a ruptured hose or pipe in a
process using flammable liquids. Water mist applications
include, but are not limited to, engine and generator set
enclosures, machinery spaces with incidental storage of
flammable liquids, oil pumps, gear boxes, and drive shafts.
(4) Aqueous Film Forming Foam (AFFF)
Systems
Aqueous Film Forming Foams (AFFF) is based
on combinations of fluoro-chemical surfactants, hydrocarbon
surfactants, and solvents. These agents require a very low
energy input to produce high quality foam. AFFF agents
suppress fire by separating the fuel from the air (oxygen).
Depending on the type of foam system, this is done in
several ways: Foam blankets the fuel surface smothering the
fire, the fuel is cooled by the water content of the foam,
or the foam blanket suppresses the release of flammable
vapors that can mix with the air. They can be applied
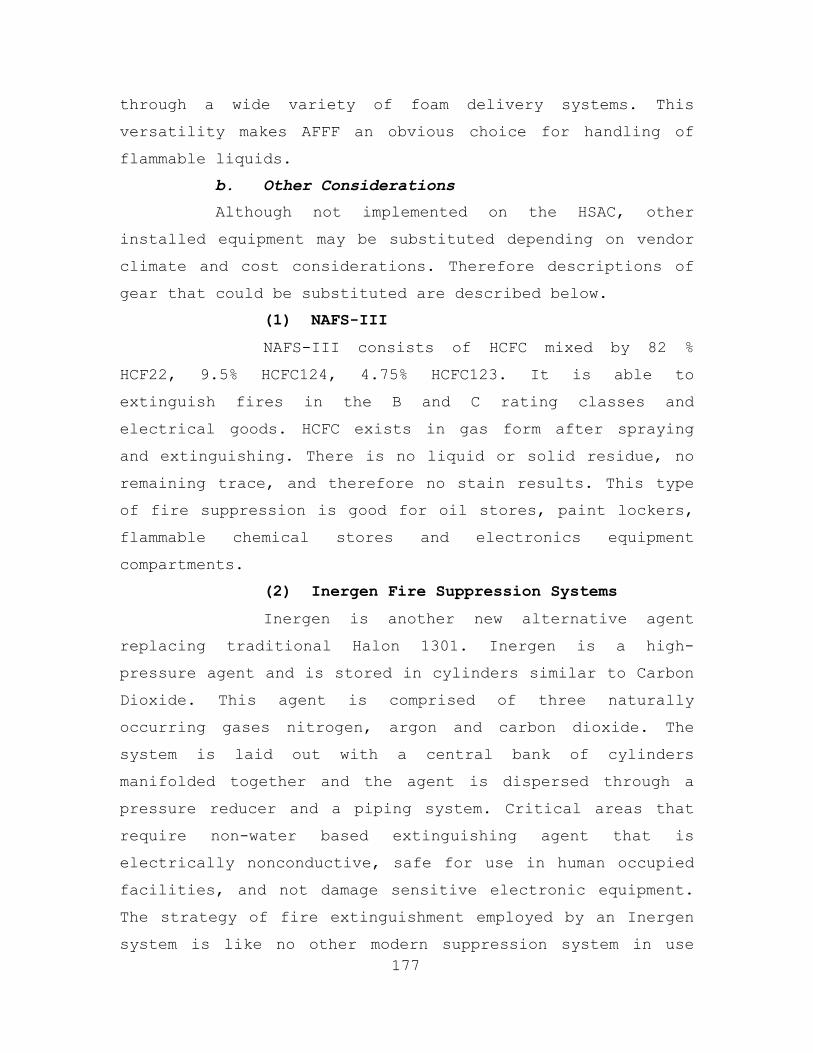
177
through a wide variety of foam delivery systems. This
versatility makes AFFF an obvious choice for handling of
flammable liquids.
b. Other Considerations
Although not implemented on the HSAC, other
installed equipment may be substituted depending on vendor
climate and cost considerations. Therefore descriptions of
gear that could be substituted are described below.
(1) NAFS-III
NAFS-III consists of HCFC mixed by 82 %
HCF22, 9.5% HCFC124, 4.75% HCFC123. It is able to
extinguish fires in the B and C rating classes and
electrical goods. HCFC exists in gas form after spraying
and extinguishing. There is no liquid or solid residue, no
remaining trace, and therefore no stain results. This type
of fire suppression is good for oil stores, paint lockers,
flammable chemical stores and electronics equipment
compartments.
(2) Inergen Fire Suppression Systems
Inergen is another new alternative agent
replacing traditional Halon 1301. Inergen is a high-
pressure agent and is stored in cylinders similar to Carbon
Dioxide. This agent is comprised of three naturally
occurring gases nitrogen, argon and carbon dioxide. The
system is laid out with a central bank of cylinders
manifolded together and the agent is dispersed through a
pressure reducer and a piping system. Critical areas that
require non-water based extinguishing agent that is
electrically nonconductive, safe for use in human occupied
facilities, and not damage sensitive electronic equipment.
The strategy of fire extinguishment employed by an Inergen
system is like no other modern suppression system in use

178
today. An Inergen system lowers the oxygen content of the
protected area to a point sufficient to sustain human life,
but insufficient to support combustion.
(3) FE-13 Fire Suppression Systems
FE-13, trifluromethane, is the safest of the
three most commonly used clean agents (FE-13, FM-200 and
Inergen). Systems are typically designed at 16-21%
concentrations but FE-13 has no exposure restrictions until
concentrations reach 30% or higher. The ability to design
at higher than required concentrations, makes FE-13 an
ideal agent for occupied areas, where very rapid
extinguishments is desired. [4] Two other characteristics
make this a unique agent that should be seriously
considered for our clean agent requirements. First, nozzles
can be located at heights of up to 25 feet as compared to
only 12 feet for FM-200 systems. Second, due to its low
boiling point, FE-13 can be used in temperatures as low as
40° F. As with other clean agents, FE-13 can be used in any
area with high valued electronics such as computer
facilities, battery rooms and telecommunications
facilities. It also has many industrial applications
including unheated storage areas.
4. Chemical, Biological and Radiation (CBR) System
HSAC will be capable of performing launching and
recovering of the aircraft for all types of CBR
contaminated environments. Long-range detection systems for
chemical, biological and radioactive agents will be
installed on HSAC. Also, portable chemical and biological
mass spectrometers, joint chemical agent detectors, radiac
equipment, and CBR protective clothes will be available at
each damage control locker, and hangar bay. A collective
protection system will protect the manned areas against CBR

179
warfare in HSAC. All aircraft will be decontaminated in the
elevators, which are a part of the collective protection
system, after recovery. In case of emergency, one elevator
will be adequate to operate and decontaminate the
contaminated aircraft, although for redundancy purposes two
of the elevators will have the capability.
5. Personal Locator Device (PLD)
The ship’s crew will be issued a PLD. The PLD is a
kind of electronic bracelet, transmitting the identity of
the crew. Receivers around the ship will detect the signals
from the PLDs, and a data network will be connected to the
damage control data network. There will be three modes of
operation of PLD: (1) personal location, (2) personal
paging, and (3) emergency notification. From the damage
control displays, the location of each person will be
monitored. Emergency notification mode will be used by the
crewmember him/herself, if he/she is in an emergency
situation, to notify the watch stander.[8]
6. Crew Egression
Five on each side of the ship, a total of ten, throw
over board life rafts with twenty-five personnel capacity,
will be installed. The total capacity of the life rafts is
250, being ten percent more than the crew size. They will
be evenly distributed and will be inside a shield to reduce
their contribution to radar cross section.

180
Figure 79. A Typical Life Raft for HSAC[9] 7. Ship Numbering System
All crew members must be able to operate key Damage
Control (DC) equipment and fittings in order to effectively
control/stop damage. Therefore, it is essential that
drills incorporating the use of all fittings be conducted
to train and keep personnel proficient in their operation.
In order to locate and operate DC fittings, everyone must
have a clear understanding of shipboard compartmental and
DC fitting numbering.
All compartments and fittings on the HSAC will be
numbered according to appropriate Navy standards. A full
description of the numbering to be used can be found in
Appendix IX.
8. Battle Stations
For a ship to survive under battle conditions, it must
be able to rapidly man battle stations and set material
condition zebra and also to be able to operate under these
conditions for an extended period. Also, there are
evolutions that assume that the ship is at General Quarters
before it can be accomplished. The HSAC must train
personnel in manning battle stations and making initial

181
preparations for action. Use the appropriate damage
control exercise, "Manning Battle Stations", to evaluate
personnel performance. In depth view of battle stations,
Salvage ship, and Abandon ship information can be found in
Appendix IX.
9. Conditions of Readiness
The setting of material condition is the process
of securing the appropriate damage control fittings at
designated times. After damage, there exists a strong
possibility of the spreading of fire, smoke, and flooding.
The proper setting of material condition will enhance the
Damage Control organization's ability to contain and
control damage. Material Conditions of readiness
descriptions can be found in Appendix IX.
10. Damage Control Total Ship Survivability
The concept of Total Ship Survivability has been
formalized from recent events and conclusions drawn from
the Falkland Islands and Desert Storm Conflicts. The HSAC
as a whole must be able to combat casualties either
inflicted by weapon payloads or by internal forces and
maintain mission integrity.
The casualty response will be prioritized to restore
vital systems and\or combat fires and flooding. Vital
systems include electrical power (60 Hz and 400 Hz),
firemain, chilled water, dry air (and others).
a. Ship's Priorities
(1) Peacetime
i.. Return to port ii. Safety of the crew

182
(2) Wartime (Battle conditions) - in
descending order
i. Fight: Maintain/Restore Combat Systems to prevent further damage by being able to detect the next threat and being able to neutralize that threat. If the ship loses its ability to detect and engage, then it becomes a useless floating target.
ii. Move: If the ship does lose its detect and engage ability, then it must make all efforts to regain the ability to maneuver. If the ship maintains the ability to maneuver, then it may be able to evade further damage and also deceive the enemy by mimicking a fighting warship in order to land and off load cargo.
iii. Float: If the ship is unable to maintain the ability to maneuver, then the crew’s only hope is to maintain the ship floating until rescue can be affected.
Considerations for Damage Control Ship Survivability
can be found in Appendix IX.
11. Introduction to Firefighting
The HSAC design has to embrace a wide range of
sometimes conflicting requirements. Were it possible to
design a fire proof ship, it would be prohibitively
expensive. A major requirement is to contain systems and
equipment in the minimum of space. This in itself can
create problems in the event of a fire. Cost and weight
restraints also play a part in reaching a compromise. As a
result, warships contain a number of high risk compartments
such as magazines, machinery spaces, fuel tanks, control
and operations spaces, where a hit could seriously affect
the ship’s capability to move or fight. In the event of a
fire on board ship there is no where to go and no fire
department to handle the situation. The fire must be
controlled and extinguished. Shipboard personnel must be
trained to do this. As the saying goes "YOU CAN RUN, BUT

183
YOU CAN'T HIDE". In the event of a shipboard fire there
isn't even anywhere to run. The objectives of a Damage
Control Organization will be to: Take preliminary actions
taken to prevent damage, minimize and localize damage, and
Restore space or equipment to use.
Firefighting perspective that needs to be understood
is that preliminary actions are most important. The best
situation is not to have a fire, and prevention. Prevention
for eliminating the risk of a fire would be but not limited
to:
• Good Housekeeping
• Proper stowage of flammables/explosives
• Fire Marshall program
• General maintenance
• Watchststander training
• DC Organization training
• All hands training
• Embarked troop training
Terms and organization for Shipboard Firefighting can
be found in Appendix IX.
12. References
[1] Fire Detection Systems for the Millennium, Mr. Brian S.
Rodricks, Btech (Hons),
MBA, Institute of Marine Engineers, London
[2] Smart Microsensor Technologies,
http://www.es.anl.gov/htmls/sensor.html

184
[3] FM 200 Fire Suppression Systems,
http://www.reliablefire.com
[4] FE 13 Fire Suppression Systems, http://www.fireline.com
[5] The Development of Water Mist Fire Protection Systems
for U.S. Navy Ships, Robert L. Darwin, Dr. Frederick W.
Williams, Naval Engineers Journal, Vol.112 No.6
[6] http://www.juruconsultant.com/workstation/articles/firesuppression
[7] An Investigation into Impacts of Adding an Automated
Damage Control System to a Coast Guard 270’ WMEC Cutter,
Jon G. Gage, Thesis, Naval Postgraduate School, Monterey,
California
[8] Automating Damage Control to reduce Manning for Future
Ship Designs, Lance Lantier, Individual Project, Naval
Postgraduate School, Monterey, California
[9] TSSE Project Report 2001
G. HABITABILITY
The habitability analysis was conducted based on the
definitions and instructions given in the Shipboard
Habitability Design Criteria Manual [1&2]. The HSAC has at
least one berth per permanently assigned crewmember and
surge troops. Berths are permanently installed. Officers,
CPOs and crew are accommodated in separate berthing
compartments. Embarked Marine Officers, SNCOs/Troop are
accommodated in separate berthing compartments as well. The
berthing space configuration of the HSAC allows female
crewmember berthing accommodations to be separate.
Individual staterooms with private heads are provided for
the Commanding Officer and Executive Officer. Officers and
CPO are accommodated in double tier bunks. Crew/Troop/SNCOs
are accommodated in three tier bunks. The number of berths

185
per tier does not exceed three. The berthing space
allocation for officers includes additional space for
unobstructed walking and working areas. The initial
estimate of berthing space allocation and habitability
weights are tabulated in Table 12 and Table 13.
Table 12. Accommodation Arrangement Number Area/Person (ft2) Area (ft2)
Commanding Officer 1 180 180Executive Officer 1 100 100Officers (Ship's company) 5 88 440Officers (Surge) 26 33 858CPO (Ship's company) 10 33 330Crew (Ship's company) 49 24 1176SNCO/Troop (Surge) 234 24 5616Officer Wardroom N/A N/A 215CPO/Enlisted Mess N/A N/A 500Galley N/A N/A 370Stores, Offices, Workshops N/A N/A 600Medical Facility N/A N/A 600
Total Area Required 10985 Table 13. Habitability Weight Estimation
Approximate Quantitiy Approximate Weight (lbs) Total (lbs)People 66 180 11,880Berth (CO/XO) 2 200 400Two-tier Berth (Officer / CPO) 50 300 15,000Sit-up Berth (Crew / Troop / SNCO) 279 450 125,550Stowage 100 180 18,000Table 35 80 2,800Chair 140 30 4,200Dishwasher 10 150 1,500Washing Machine 10 150 1,500Dryer 10 150 1,500Refregirator/Freezer 10 360 3,600Television, big screen 2 210 420Television, table model 2 60 120Toilet 40 35 1,400Washbasin 40 35 1,400Stores 32,200Water 920,920Galley Equipment 15,000Miscellaneous 10,000
TOTAL : 1,167,390 The officer berthing arrangement is as follows.
USN Berthing:
• (1) CO cabin
• (1) XO stateroom
• (4) 2 person staterooms

186
• Private and shared heads
USMC Berthing:
• (5) 6 person bunkrooms
• Shared heads
Figure 80. Typical CO Stateroom Arrangement
Figure 81. Typical Officer (USN) Stateroom Arrangement
The CPO/SNCO berthing arrangement is as follows.
CPO Berthing
• (2) 6 person bunkrooms
• Semi-private heads
•
• USMC SNCO Berthing

187
• Assigned one of four USMC berthing compartments
Figure 82. Typical CPO Stateroom Arrangement
The U.S. Navy’s Sit-Up berth has been selected for
installation aboard the HSAC for Crew/Troop/SNCO berthing.
The sit-up berth improves quality of life at sea by
allowing the occupant to sit upright in the bank when not
sleeping, with ample space to read, write or relax, as
shown in Figure 83. Features include forty percent more
stowage space than a classical berth, a pneumatic lift
assist for opening and closing the rack, a stowage area for
boots and Marine battle helmets, towel bars, and stirrup
steps to aid ingress and egress. Each occupant also enjoys
the benefit of a writing/reading surface, electrical
outlet, mirror, individual fan unit, and a small shelf for
personal items. The height and width dimensions are the
same as for the traditional module, however the sit-up
berth is about two feet longer.

188
Figure 83. Sit-up Berth (Ref [3])
Ship’s Crew Berthing:
• (1) 36 person compartment
• (1) 24 person compartment
• (1) 12 person compartment (Women-at-Sea determined compartment size)
• Three tiers per berth (Sit-up Berth)
• (4) Shared heads (one assigned to females)
• Embarked Marine (Troop/SNCO) Berthing:
• (3) 69 person compartments
• Three tiers per berth (Sit-up Berth)
• (3) Shared heads
Figure 84. Typical Crew Berthing Arrangement
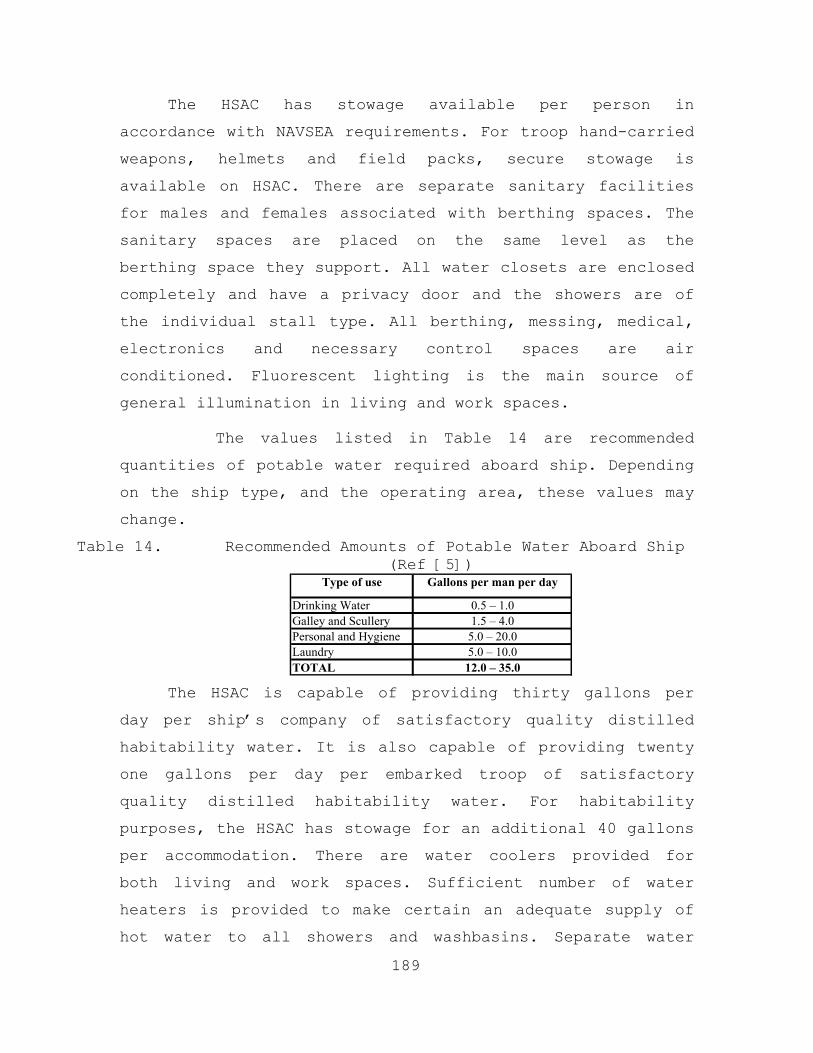
189
The HSAC has stowage available per person in
accordance with NAVSEA requirements. For troop hand-carried
weapons, helmets and field packs, secure stowage is
available on HSAC. There are separate sanitary facilities
for males and females associated with berthing spaces. The
sanitary spaces are placed on the same level as the
berthing space they support. All water closets are enclosed
completely and have a privacy door and the showers are of
the individual stall type. All berthing, messing, medical,
electronics and necessary control spaces are air
conditioned. Fluorescent lighting is the main source of
general illumination in living and work spaces.
The values listed in Table 14 are recommended
quantities of potable water required aboard ship. Depending
on the ship type, and the operating area, these values may
change.
Table 14. Recommended Amounts of Potable Water Aboard Ship (Ref [5])
Type of use Gallons per man per day
Drinking Water 0.5 – 1.0Galley and Scullery 1.5 – 4.0Personal and Hygiene 5.0 – 20.0Laundry 5.0 – 10.0TOTAL 12.0 – 35.0
The HSAC is capable of providing thirty gallons per
day per ship’s company of satisfactory quality distilled
habitability water. It is also capable of providing twenty
one gallons per day per embarked troop of satisfactory
quality distilled habitability water. For habitability
purposes, the HSAC has stowage for an additional 40 gallons
per accommodation. There are water coolers provided for
both living and work spaces. Sufficient number of water
heaters is provided to make certain an adequate supply of
hot water to all showers and washbasins. Separate water

190
heaters that run at a higher temperature are provided for
workspaces (galley, laundry, etc). There is also automatic
potable water disinfection equipment installed on the HSAC.
1. References
[1] OPNAVINST 9640.1A: Shipboard Habitability Program, 3 September 1996
[2] Shipboard Habitability Design Criteria Manual (T9640-AB-DDT-010/HAB), 1 December 1995.
[3] LPD 17 San Antonio Class, Quality of Life on the LPD 17 Class, NAVSEA (PMS 317) DET NEW ORLEANS, OFFICIAL U.S. NAVY WEB SITE; 12 November 2003, URL: http://www.pms317.navy.mil/tech/qol.asp. Accessed Oct 28, 2004.
[4] Sit-Up Berth, MARINETALK; URL: http://www.marinetalk.com/articles_HTML /xxx00030222TU.html. Accessed Oct 31, 2004
[5] Water Supply Afloat, Manual of Naval Preventive Medicine, Chapter 6, Bureau of Medicine and Surgery NAVMED P-5010-6 (Rev 1990) Washington, D.C.
[6] TSSE Project Report 2001 [7] TSSE Project Report 2002
H. REDUCED MANNING ANALYSIS
Whenever new ships are designed, analysis of reduced
manning becomes more important than ever in the design of
the ship. It is important because it provides potential
benefits in operating cost reduction and increasing quality
of crew’s ship life. Besides that, automation technology
starts to be more dependable and stable than ever also. In
manning determination every person is justified by the work
they are required to perform. The work is established by
the system/equipment/function on board which is the product
of a design. As the automation increase, fewer personnel
are required to operate and maintain the ship and its
systems. The crew size required for given ship design is
the sum of all personnel needed to function simultaneously
to meet the most demanding ship's condition of readiness
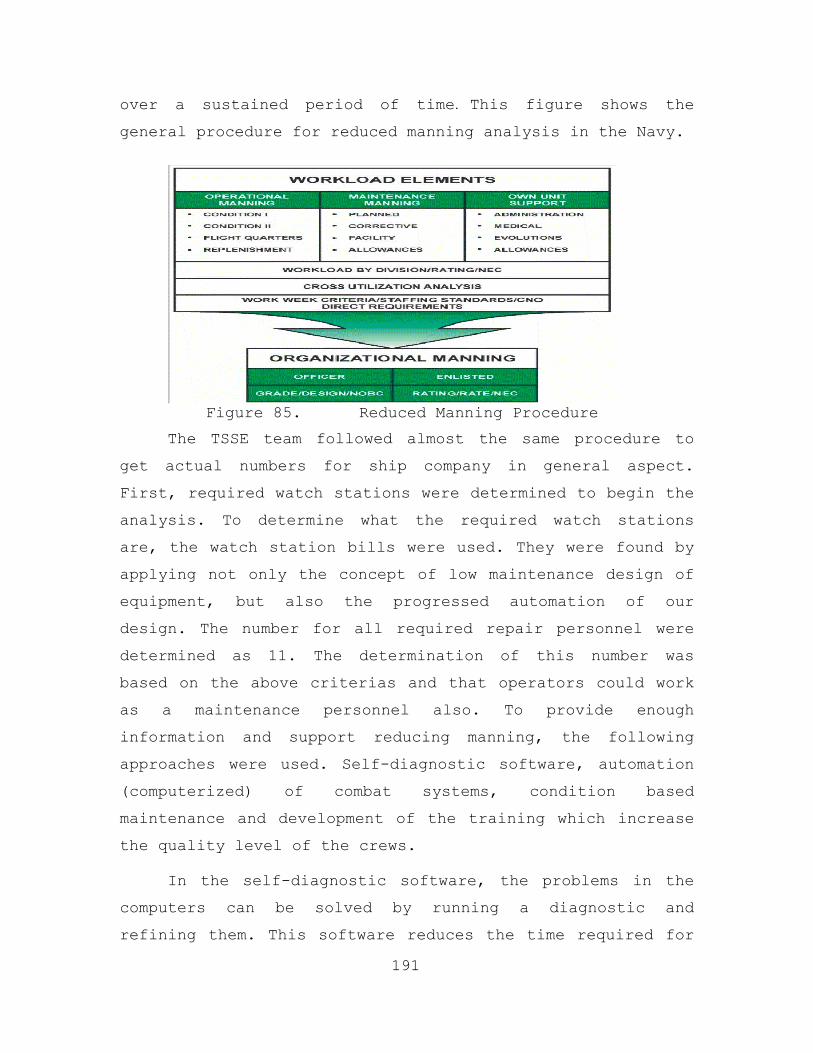
191
over a sustained period of time. This figure shows the
general procedure for reduced manning analysis in the Navy.
Figure 85. Reduced Manning Procedure
The TSSE team followed almost the same procedure to
get actual numbers for ship company in general aspect.
First, required watch stations were determined to begin the
analysis. To determine what the required watch stations
are, the watch station bills were used. They were found by
applying not only the concept of low maintenance design of
equipment, but also the progressed automation of our
design. The number for all required repair personnel were
determined as 11. The determination of this number was
based on the above criterias and that operators could work
as a maintenance personnel also. To provide enough
information and support reducing manning, the following
approaches were used. Self-diagnostic software, automation
(computerized) of combat systems, condition based
maintenance and development of the training which increase
the quality level of the crews.
In the self-diagnostic software, the problems in the
computers can be solved by running a diagnostic and
refining them. This software reduces the time required for

192
repairment and the number of personnel who will maintain
the system. The idea of automation leads to increasing
level of use of the computers and softwares. This idea is
also valid in the automation of combat systems and
engineering. Condition based maintenance is an idea that
decreases the redundant maintenance requred for the system.
This type of maintenance accomplishes this duty by
controlling the systems and measuring the values extracted
from them. If a measurement of the system comes to the
limit, maintenance will be performed at the first step.
This will prevent the time consumption which is required to
wait for the regular maintenance time. Finally, the last
maintenance will be done by ship maintenance. However, less
people will be required because the maintenace is
conditional.
Furthertmore, wide area network system will be used to
reduce the manning. This system provides enough information
to other system computers and determines where the problem
is. Therefore the network will reduce the reaction time for
the problem and also repair work. It is very convinient for
our analysis of reduced manning. Finally, the subject of
the training of the crews will be performed for them to
increase the ability of skills and reaction times when they
run into more important problems (damages, maintenance
problems etc.). The training program will make the crew be
ready in every bad situation of the ship and so will help
reduce manning. Engineering training team will be not
necessary to give this program and will be eliminated.
After the above aspects are applied, the TSSE team
reached the final numbers for ship company. The following

193
shows the tabulation of the rank, section watch, GQ and the
personnel numbers in detailed and total numbers.
Table 15. Manning Breakdown
STATION DESCRIPTION Rank3 Section
Watch GQ Only OtherPosition
TotalShip Total Notes
COMMANDCO O 1 1 1XO/OPS O 1 1 1
SHIP CONTROLPILOT HOUSEOFFICER OF THE DECK (OOD) O/CPO 3 3 3 AOPS/OSC/AUXOPETTY OFFICER OF THE DECK (POOD) E 3 3 3 QM
COMMAND AND CONTROLTACTICAL ACTION OFFICER O 3 3 3 CHENG/CSO/OPSCIC WATCH OFFICER CPO/E 3 3 3 EWC/OSC/OS1TACTICAL INFORMATION COORDINATOR E 3 3 3 Maint during non-GQSURFACE WARFARE COORDINATOR O 1 1 0 Non GQ OODAIR DEFENSE COORDINATOR O 1 1 0 Non GQ OOD
RADIO CENTRALCOMMS WATCH CPO/E 3 3 3 Off w atch conduct maint / 1 ITC
COMBAT SYSTEMS EQUIPMENT ROOMCOMBAT SYS MAINTENANCE CENTRALCSOOW CPO/E 3 3 3 GMC/ETC/FC1ELECTRONIC REPAIRMAN E 3 3 3 Off w atch conduct maint

194
STATION DESCRIPTION Rank3 Section
Watch GQ Only OtherPosition
TotalShip Total Notes
WEAPONS CONTROLBOFORS LOADER DRUM ROOMMOUNT CAPTAIN/LOCAL OPERATOR E 1 1 1 Act as maint tech non-Cond I
VERTICAL LAUNCHING SYSVLS MONITOR/TECH E 1 1 1 Act as maint tech non-Cond I
ENGINEERING CONTROLCENTRAL CONTROL STATIONEOOW CPO/E 3 3 3 EMC/GSMC/GSM1PROP PLANT CTL CONSOLE OPER E 3 3 3 MM Off w atch conduct maintELEC PLANT CTL CONSOLE OPER E 3 3 3 EM Off w atch conduct maintROVING WATCH/TECHNICIAN E 3 3 3 Off w atch conduct maint
DAMAGE CONTROL DAMAGE CONTROL CENTRALDAMAGE CONTROL ASSISTANT (DCA O 1 1 0 CHENG
REPAIR 2REPAIR LOCKER OFFICER CPO 1 1 0 Non-GQ EOOWON-SCENE LEADER E 1 1 1 DC#1 NOZZLEMAN E 1 1 0 Non-GQ CCS Tech#1 HOSEMAN E 1 1 0 Non-GQ Comms#1 HOSEMAN E 1 1 1 BM#1 PLUGMAN E 1 1 1 BMELECTRICIAN E 1 1 0 Non-GQ EPCC#1 UTILITY MAN E 1 1 0 MS#2 UTILITY MAN E 1 1 0 MS#3 UTILITY MAN E 1 1 1 GM/FC#4 UTILITY MAN E 1 1 0 SK
REPAIR 5REPAIR LOCKER OFFICER CPO 1 1 0 Non-GQ EOOWON-SCENE LEADER E 1 1 1 DC#1 NOZZLEMAN E 1 1 0 Non-GQ CCS Tech#1 HOSEMAN E 1 1 0 Non-GQ Comms#1 HOSEMAN E 1 1 0 MM#1 PLUGMAN E 1 1 0 MMELECTRICIAN E 1 1 0 Non-GQ EPCC#1 UTILITY MAN E 1 1 0 MS#2 UTILITY MAN E 1 1 0 MS#3 UTILITY MAN E 1 1 1 GM/FC#4 UTILITY MAN E 1 1 0 SK

195
STATION DESCRIPTION Rank3 Section
Watch GQ Only OtherPosition
TotalShip Total Notes
HELO CONTROLFLIGHT CONTROLHCO O 1 1 0 Off Watch OODLSE O 1 1 0 Air DetCHOCK AND CHAIN #1 E 1 1 0 PNCHOCK AND CHAIN #2 E 1 1 0 YN
HELO FIRE FIGHTING TEAMON SCENE LEADER (OSL) CPO 1 1 1 DCCHOT SUITMAN #1 E 1 1 0 REP 2/5HOT SUITMAN #2 E 1 1 0 REP 2/5NOZZLE E 1 1 0 REP 2/5HOSE E 1 1 1 BMHOSE E 1 1 1 BMPLUGMAN E 1 1 0 REP 2/5NOZZLE E 1 1 0 REP 2/5HOSE E 1 1 1 BMHOSE E 1 1 1 BMPLUGMAN E 1 1 0 REP 2/5
MEDICALCORPSMAN [IDC] CPO 1 1 1 HMCCORPSMAN E 1 1 1 HM
MESSINGSENIOR MESS SPECIALIST E 1 1 1 MS1MESS SPECIALIST E 6 6 6 MS
SUPPLY SUPPORTSTOCK CONTROL SUPERVISOR E 1 1 1 SK1LOCATE/ISSUE CLERK E 3 3 3 SK
ADMINSHIPS OFFICE E 2 2 2 PN/YN
Total 95 49
DEPARTMENTS O CPO E TOTALCOMMAND 2 0 0 2COMBAT SYSTEMS 1 2 9 12ENGINEERING 2 3 12 17OPERATIONS 2 4 16 22MEDICAL 0 1 1 2SUPPLY/ADMIN 0 0 11 11
7 10 49 66

196
OFFICER BILLETSCO 1 CDRXO/OPS 1 LCDRLANDING (Marine Officer/Embarks w ith Marines) MAJOPS 1 LCDRCSO/WEPS 1 LT(DH)CHENG/DCA 1 LT(DH)AUX/ELEC 1 LT(DIVO)NAV/AOPS 1 LT(DIVO)
7
CPO BILLETSGMC 1DCC 1EWC 1GSMC 1OSC 2EMC 1ITC 1HMC 1BMC 1
10
ENLISTED BILLETSPN 1 ADYN 1 ADSK 3 ADMS 6 ADGM 2 CSFC 2 CSBM 6 OPDC 2 ENEM 3 ENGSM 3 ENOS 4 OPET 3 CSIT 3 OPEW 2 CSQM 3 OPMM 3 ENHM 1 MDHT 1 EN
49

197
1. References
[1] Is The Navy Serious About Reduced Manning on Its Ships, J. Robert Bost, James G. Mellis, Philip A. Dent; URL: http://www.manningaffordability.com/ s&tweb/ PUBS/ Bost _Mellis_Dent/Bost _Mellis_ Dent.htm. Accessed December 6, 2004
[2] TSSE Project Report 2001 [3] TSSE Project Report 2003
I. ENVIRONMENTAL CONCERNS
Our ship design can be operated with no disturbing the
ambiance. For this purpose, following two systems will be
used.
1. Oil-Water Separators
There will always exist water of bilge in the ships.
There are several reasons for bilge water. Main and
auxiliary engines of the ship will cause this situation.
Furthermore the air condition systems will drain water to
the bilge. Therefore the ships need oil water separators to
minimize this discharge. NAVSEA identified a membrane
ultra-filtration as the most progressing technology for
shipboard applications. This system has following
capabilities.
A. It is compatible with the Navy’s existing Oil-Water Separator system.
B. It is adaptable to space and ship integration constraints.
C. It can make the existing discharge requirement of fifteen-ppm oil meet consistently.
D. It has capability to meet the future discharge constraints.
Bilge water flows to the waste holding tank (oily).
Then it flows to the Oil-Water Separator. The separator
creates two discharges which will flow to the membrane and
will be held in the waste oil tank. One of them is effluent

198
which flows to the membrane. The other is concentrated
waste oil which is held in the waste oil tank. The ultra-
filtration process allows water and dissolved particles
from the Oil-Water Separator effluent to pass through a
semi-permeable ceramic membrane. The filtration membrane
system (ultra-filtration) makes the influent concentrate
from the Oil-Water Separator. This membrane system is very
affordable for the maintenance purposes, and because it is
an automated system, it requires low manning.
2. CHT System
Urinals, waste drains from showers, laundries and soil
drains from water will be accepted by this system. This
system consists of different functional elements. The
followings are these functional elements which will be used
in this system.
a. Transfer element
There are two marine sewage pumps connected in
parallel for each tank. The discharges of these pumps
depend on the position of the discharge valve. The
discharge locations are tender, barge or shore facility.
The direct discharge location is the overboard.
b. Holding Element
Tanks must be durable for the time period 12
hours. This depends on the ship design process. Each CHT
tank will have inside surfaces without stiffeners.
According to the Naval Ship’s Technical Manual chapter,
each surface of CHT tank must be covered or coated. Each
tank will have ventilation to the air and an orifice for
overflow to the sea. Besides that, tanks have manholes for
maintenance and control in any situation. The ventilation
system will not allow the gases which are coming from CHT
tanks to the other machine parts like compressors.

199
c. Collecting Element
This element has diverter valves. The way of the
soil and waste depends on the position of these valves.
Overboard and CHT tank will be these ways for discharge.
Wastes will be separate from soil drains until they reach
their overboard diverter valves. Then they will be
combined. The gravity is the forcing factor for the drains
above the waterline. The drains below the waterline will be
ejected by CHT system. There must exist also garbage drains
which are connected to the waste drains. They have the
slope 3 in/ft. While the garbage grinder performs the
seawater for flushing, the waste downstream of this will be
of copper-nickel alloy.
Smaller CHT system will be used for our ship
design which will have relatively small tank capacity. CHT
system can be used in any of the three different operation
modes. These modes will be determined according to the
following situations.
A. While the ship is at port, CHT system will collect, hold and transfer all discharge which will be consisting of soil and waste drains to the shore facility.
B. While the ship is at the sea, if the areas are free from the restricted ones, CHT system will divert discharges from soil and waste drains overboard.
C. There are restricted zones for transiting. For this situation, CHT system will just collect and hold the discharges from soil drains.
1. References
[1] TSSE Project Report 2001 [2] TSSE Project Report 2003

200
J. COST AND WEIGHT ESTIMATION
Using parametric weight design estimation equations, a
first order light ship weight, total deadweight, and total
ship weight was calculated and shown in the summary Table
16 below. The light ship weight calculations estimate the
weight of the ship’s structural components, machinery,
outfit and hull engineering weight, and a weight margin.
The total deadweight of the ship estimates the ship’s cargo
weight, fuel oil weight, lube oil weight, freshwater
weight, the weight of the crew and their effects, and the
weight of the provisions. The detail of the calculations is
in Appendix X.
Table 16. Ship Weight Summary
Based on the ship’s first order weight estimation, the
acquisition cost of the Joint ACCESS could be determined
using a weight scaled model similar to that employed in the
2003 SEA SWATH, 2002 TSSE SEA FORCE and 2001 TSSE SEA
4966 Total
820 Payload
235 6% Margin
1022 Liquids &
164Armament 700
159Outfit and 600
302Auxiliary Systems 500
112Command and 400
118Electric Plant 300
91Propulsion Plant 200
1943Hull Structure 100
Weight Name Group

201
ARCHER studies. This model used CER’s from the S-CVX study
conducted in 1998.
The Joint ACCESS model incorporates non-traditional
weight fractions, high cost for specialized equipment
required to meet the ship’s missions, and one time costs
for Government Furnished Equipment (GFE) that is presently
under development. Cost estimates for Joint ACCESS are
summarized in the table below. Appendix X shows the total
cost of the twelfth ship of production assuming a learning
curve exponent of 0.95.
Table 17. Cost Estimate
10Cargo Interfaces
476Total (For 1 Ship)
80Combat System
230Propulsion and Electric Distribution
156Ship Construction
Cost (Mill $) Concept

202
THIS PAGE INTENTIONALLY LEFT BLANK

203
V. DESIGN EVALUATION
The design met the requirements set by SEA-6 and the
TSSE Faculty. In addition, it produced a robust multi-
mission capable self-sustaining vessel that:
• Can augment the MPF(F) by accommodating the embarked troops and cargo from the FLS and/or CONUS to the Sea Base.
• Transit 2640nm @34kts fully loaded with 15% fuel remaining.
• Furthermore, it has defensive and offensive combat capabilities.
The extensive capabilities of this HSAC lead the team
to name it the “Joint ACCESS” for it allows joint forces to
quickly and forcefully access areas of the world from a
distant Sea Base, which no current vessel can do.
Specifically, the Joint ACCESS delivers a joint force’s
amphibious combat cargo while providing expeditionary
support. These capabilities are built into the ship’s name
as Figure 86 demonstrates.
Figure 86. Joint ACCESS Name and Ship Seal

204
A. PRIMARY MISSION EVALUATION
The Joint ACCESS satisfies the high speed assault
connector requirements as shown in Table 18.
Table 18. Design Requirement Satisfaction
Top Level Requirements Joint ACCESS Capability
Carry two BLTs (~8000LT of
Cargo).
A system of twelve ships can
transport 9600LT of cargo.
Transport the two BLTs 200nm
in one 10 hour period
Each ship can make the 200nm
trip at 43kts fully loaded in
less than 8 hours and can
offload in 2 hours.
Interface with the Sea Base
and the beach.
RO-RO capable stern gate and
a flight deck with elevator
allow for cargo exchange at
the Sea Base. 35m floating
bow ramp allows for cargo
loading/unloading at the
beach.
Support amphibious operations
ashore in addition to payload
delivery.
Flexible combat systems suite
provides defensive and
offensive capabilities.
Conduct independent
operations.
Self-sustaining for up to 10
days and can transit 3380nm
@20kts
Conduct secondary missions. Flight deck, flight deck
elevator, helicopter hangar
and large flexible cargo
areas allow multi-mission
capabilities.
205
In addition to satisfying the above requirements, the
Jint ACCESS can effectively augment the MPF(F) ships during
seabasing operations. The Joint ACCESS has the facilities
to embark 260 troops and their gear and transport them from
the forward logistics site or CONUS to the Sea Base. Thus
the system of 12 Joint ACCESS vessels can arrive at the Sea
Base ready to deploy the two BLTs ashore. This ability not
only reduces the number of cargo transfers required at the
Sea Base, but also greatly decreases the time needed for
employment.
B. SECONDARY MISSIONS
In addition to the capabilities inherent in the Joint
ACCESS, the ship integrates well with supporting forces.
Multiple support missions can be conducted. These include
but are not limited to:
1. Special Operations Support
The Joint ACCESS will provide mobility for the support
and sustainment of SOF in support of the Global War on
Terrorism and other traditional SOF missions. While
operating in low-threat environments, the Joint ACCESS will
embark SOF elements, along with mobility assets and
unmanned vehicles to interdict terrorists, weapons of mass
destruction, and other high-value targets.

206
Figure 87. Example Special Operations Support Loadout
2. Embassy and High Asset Reinforcement
As a potential crisis develops, the Joint ACCESS will
rapidly deploy a security force, with embarked rotary-wing
assets, to reinforce a threatened embassy or high asset
without reliance on host nation basing or over flight
rights.
3. Humanitarian Assistance/Disaster Relief
The Joint ACCESS’ high-speed, its capability to
operate in austere, degraded and minor port environments,
its interface with the beach, as well as its ability to
carry multi-mission Conex boxes, make it ideally suited for
supporting HA/DR missions. Because infrastructure at the
crisis site is often destroyed or severely degraded, the
capability of the Joint ACCESS to deliver supplies to the
shore absent port services, tugs, or other infrastructure,
allows the JFC to deliver initial forces and relief
supplies.

207
Figure 88. Example Humanitarian and Evacuation
Operations Loadout 4. Theater Security Cooperation
With the growing importance of theater engagement
activities as a critical element of the Global War on
Terrorism, the Joint ACCESS will provide a platform well
suited for executing these engagement missions. As naval
forces shift to a surge response posture, forward based
Joint ACCESS’ will fill the void left by the decrease in
the availability of other platforms to conduct engagement
activities throughout the world. The access provided by the
Joint ACCESS is especially important in the conduct of port
visits and combined training in less developed countries
that lack developed infrastructure.
5. Maritime Interdiction
The modularity of the Joint ACCESS’ and their ability
to operate independently in the littoral environment will
enable them to be rapidly configured to conduct these
supporting operations.
C. CONCLUSION
The 2004 TSSE design team acknowledges that it was
unable to perform a thorough analysis on all the technical

208
issues that exist with every ship design. However, the
team believes that to achieve the HSAC mission,
displacement craft such as the Joint ACCESS need to be
researched and implemented.
The following renderings depict the ship and its
conceptual employment.

209
APPENDIX I 2004 TSSE PROJECT GUIDANCE
June, 2004 TS4002
2004 Capstone Design Project
Sea Connector in Support of Joint Expeditionary Warfare
1. TASK. Your TSSE capstone design project is to examine the concepts associated with the use of “sea connectors” in support of expeditionary warfare. From this examination you will produce a design for a ship to enable effective deployment of forces from the sea base to the theater of operations. The purpose of your design is to produce a Sea Connector that is able to fight in a littoral environment.
2. OBJECTIVES. The objectives for this project include:
A. Applying to this project all you have learned in all your previous education.
B. Performing the analysis necessary to define the concept of employment needed to meet a broadly-defined need.
C. Learning first-hand the ship-impact of requirements, cost and performance tradeoffs within technical and acquisition constraints.
D. Increasing your familiarity with the process of evaluating a military need and determining how best to meet it.
E. Obtaining experience in the process of translating broad military requirements to mission-based ship requirements and to specific design tasks resulting from those requirements.
F. Practicing technical teamwork in an interdisciplinary design effort where the quality of the product is greatly affected by team dynamics.

210
G. Internalizing the systems approach to a Naval ship as a single engineering system satisfying mission requirements.
H. Exploring innovative ideas which may prove useful to those working on similar projects, both inside and outside NPS.
3. TEAM. After an initial kickoff period in which the faculty will exert some leadership, you will function as a team in all aspects of this project. As is the case in all team efforts of this nature, you will need to have a leader and you will have to assign the lead on various subtasks to individual team members. However, to be successful (both as a design team and in the academic sense) it will be necessary for you to coordinate your efforts closely. The faculty will expect all team members to be familiar with the major design decisions made by the team, and the reasons therefore. We will expect each team member to be cognizant of the results and major features of subtasks performed by other team members as well, of course, as being fully familiar with the subtasks he had the lead on. You may expect to be quizzed on such matters.
4. BACKGROUND. All background information and documents are located in the \\kiska\tsse\2004\Background\Reading folder. Your first task is to familiarize yourselves with those documents.
5. APPROACH. A. Phase I-a (July). You are the "analysis team". Your
first task is to understand the concepts associated with seabasing and expeditionary warfare. Review and understand the logistics requirements from the SEA team. The goal is to determine a set of requirements for the Sea Connector ship. This will require you to consider such things as: threat analysis; existing combat systems capabilities of the Sea Base; and required combat systems capabilities. Furthermore, your ship must be flexible so

211
that it can assist in all aspects of expeditionary warfare including littoral combat and logistic support. Pay particular emphasis on the use of unmanned systems. As you develop your concept of operations, consider the role of the ship in non-expeditionary warfare scenarios. You must also establish desired interfaces with transfer assets (e.g. helos, boats, LCACs, etc.); survivability levels needed; etc.
B. Phase I-b (August). By the end of July you should have developed an initial concept of operations and have acquired desired payload requirements from the SEA team. You should also have a general idea of the desired combat system capabilities based on your threat analysis. You will then start exploring concepts for meeting the basic requirements. By the end of this phase you will have reconciled in more detail the requirements for the basic ship and for its possible variants. Ensure that your overall measure of effectiveness is computable and the SEA team agrees with your choice. Perform an analysis of alternatives to evaluate the optimum basic characteristics (including payload, speed, rough size) of your ship. The faculty members will verify (or change) your intended approach to the basic design and its variants.
C. Phase I-c (September). Refine the operational concept and conclude your analysis of alternatives. Identify a basic hull type and its rough dimensions and geometry.
D. Phase III (September/October/November). During phase III you will perform a more complete design of the basic concept and variants resulting from Phase II. You will prepare a design report suitable for publication as part of an NPS technical report and you will make a formal presentation of your design to members of the NPS community and invited visitors. At or before the beginning of Phase III you will receive from the faculty a list of required "deliverables" which must be included in your report or presentation or both. Past TSSE reports will provide you of a glimpse of what is expected;

212
however, this list is always subject to change in light of the unique requirements and expectations of each design effort. Your design report will become part of the overall SEI report of the integrated campus project. Do not underestimate the time needed for final report write-up and formatting and preparation of the presentation; this will occupy you most of the month of December. Project presentation usually occurs around December 7th.
6. FACULTY ROLE. This is to be YOUR design. Do not feel that you are competing with previous teams or designs. Normally, the faculty will avoid having undue influence. The design will NOT give preference to faculty ideas at the expense of the team’s ideas merely because of their faculty source. On the other hand, the faculty will participate in discussions and try to assist you in reaching conclusions, consensus and feasible solutions. In general, we will act like “coaches”, though to some degree we will also be team members. We will, of course, act to avoid letting you call for the impossible or unreasonable. After Phase I, the faculty will play two roles – members and coaches of the design team, as discussed above, but we will also, when the occasion calls for it, become the “seniors” of the design team, acting as the decision makers to consider changes to requirements if the design team should propose them. Of course, our main objective is to maximize the utility of the project as a learning experience and we will always retain the right to change the rules as we think it necessary to achieve that objective. The faculty will contribute to the process and will author some sections of the final report. If we deem your report to be of sufficient quality, we will publish it as an NPS technical report, showing all of us as the authors.
7. ADMINISTRATIVE. Some administrative items:
A. The six scheduled hours each week are considered mandatory class hours and you will be expected to be present for all of them. We will occasionally use

213
the scheduled time for lectures or presentations by visitors or the faculty. We do not consider the scheduled six hours per week to be sufficient for you to accomplish the necessary tasks to produce a quality design. As in any other course, you are expected to devote between 1 and 2 additional hours for every scheduled hour on the project. You should largely try to use the scheduled hours for coordination and group work and do much of your individual effort outside scheduled times.
B. We will use both the assigned classroom and the Bullard workspace. The latter will be shared by other students, so please be courteous.
C. You will be expected to do library and other research; to make phone calls and contacts and request information from individuals outside NPS. Doing this is always a part of this kind of project in the “real world”. The faculty can be of assistance in finding individuals and organizations who can help. (While others will generally be glad to send information, answer questions, etc., don’t expect your request to go immediately to the top of their priority list – so timeliness in such efforts is extremely important.)
8. GRADES. As is the case with other courses, the faculty must assign you a grade for this project. Frankly, we are strongly of the opinion that it is the team output that is most important and are inclined to give the project a grade and assign the same grade to all the team members. We fully recognize that individuals contribute to different degrees; that some work harder than others; that some facilitate progress while others may actually hinder it. But, as is true in life, the result is what counts and if the result is good, all associated with it bask in the glow – and vice versa. (And learning to cope with the differing contribution levels of team members is one of the “real life” experiences we expect you to reap from this project.)

214
We are inclined to continue to give a single grade for the project to all participants. However, we wish to be able to have greater insight into the individual contributions you are making and may, from time to time, request that you provide a summary of your personal, recent activities.
9. AND, FINALLY. As in any real design effort, this project is open-ended. There is no pre-existing “right” answer. Numerous designs could “work”. We could spend a significant fraction of a career on this project, carrying it to increasing levels of completeness and sophistication. However, this is an academic exercise and we are limited by outside time constraints. Our expectation is that you will work hard, strive for creativity and innovation, work cooperatively, honor commitments to team members and produce work which you are honestly proud of. If you do that, we’ll take care of the rest.

215
APPENDIX II MISSION NEEDS STATEMENT
HSAC Mission Needs Statement
Primary Operational/Threat Environment 1. Sea Base
a. Loading/Unloading point for troops, cargo, etc. b. Defenses handled by Sea Base support ships
2. Transit Zone a. Area of water possibly outside Sea Base’s defensive umbrella b. 100-200nm in distance c. Threats:
i. Missiles ii. Aircraft
1. Low slow flyers 2. Fighter aircraft
iii. Small Boats iv. Submarines
3. Unloading Zone a. Area of water between Transit Zone and Beach b. Approximately 1nm in distance c. Boat lane cleared prior to landing d. Threats:
i. Small Boats ii. Mines iii. Aircraft iv. Missiles v. Small Arms Fire
4. Beach a. Area to place troops, cargo, etc. ashore b. Prepped for assault prior to landing c. Threats:
i. Hostile Beach ii. Missiles iii. Small Arms Fire iv. Aircraft
Requirements
1. Mission a. Primary Mission
i. Deliver required cargo from the sea base to shore within a specified period of time (8-10 hours)
ii. Support operations on/to the beach b. Secondary Mission(s)

216
i. Intel gathering ii. Humanitarian/NCO iii. Unmanned vehicle ‘command ship’ iv. Limited MIW v. MIO
2. Threat Mitigation a. Missiles
i. Detection ii. Self defense
b. Aircraft i. Detection ii. Self defense iii. Both airframe and ordinance
c. Small Boats i. Self defense ii. Attack
d. Small Arms Fire i. Self defense ii. Project firepower ashore at short range
e. Hostile Beach i. Project firepower ashore at short range
f. Mines i. Detection ii. Clearing? iii. Hardening against
g. Submarines i. Evasion ii. Countermeasures
3. Interface with Sea Base
a. Sea Base is located up to 200nm from shore. 4. Able to facilitate loading and unloading of cargo with facilities ranging from
a developed port to an undeveloped beach. 5. Implement technologies that facilitate reduced manning. 6. Meet U.S. Navy Combatant Ship Standards. 7. Able to deliver the primary elements of a Joint MEB sized force. 8. Able to operate with existing and future military forces. 9. Meet mission requirements in up to sea state 5.

217
APPENDIX III REQUIREMENT GENERATION
A. SHIP CHARACTERISTIC REQUIREMENTS
29.73% Rank
Ship Characteristics Prioritized Requirements Weighting
1Endurance for minimum one round trip from sea base to beach at full load and full speed 10
2.972583 1
2Able to interface with developed and undeveloped ports, harbors and beaches to transfer cargo 9
2.675325 2
3 Able to interface with sea base and current Naval assets to transfer cargo 9
2.675325 2
4 Must meet mission requirements at Sea State 5 9 2.675325 2
5Able to transit 2000nm in less than 8 days in sea state 5 (wave height 8-12 ft) without replenishment 7
2.080808 5
6 Able to operate in shallow water without degradation in performance 7
2.080808 5
7 Able to Replenish-at-Sea (RAS)6
1.78355 7
8 Full accommodations required for embarked crew 6
1.78355 7
9Fuel and support rotary wing aircraft supporting amphibious operations both day and night 6
1.78355 7
Ship Characteristics
weight:

218
B. COMBAT SYSTEM REQUIREMENTS
16.38% Rank
Combat Systems Prioritized Requirements Weighting
1Defend against and destroy small (less than 200ft long), high speed (in excess of 40kts) surface craft 10
1.637807 1
2
Detect, track, and destroy up to 8 simultaneous “leaker” missiles that escape defenses supplied by other fleet units 10
1.637807 1
3 Sustain hostile small caliber fire 9 1.474026 3
4 Provide suppressive fire for amphibious forces 9 1.474026 3
5 Communicate with U.S. and coalition forces via both secure and unsecure 8 1.310245 5
6 Provide a data link capability 8 1.310245 5
7Maintain a CIC capable of collecting, processing, displaying, evaluating and disseminating tactical information 8
1.310245 5
8 Conduct evasive torpedo maneuvers 7 1.146465 8
9 Employ ASW countermeasures 7 1.146465 8
10 Detect, track, and identify UAV, low slow flyers, attack aircraft 7 1.146465 8
11 Provide Naval Surface Fire Support (NSFS) for amphibious forces 7 1.146465 8
12 Detect, track, and identify surface threats to the horizon 6 0.982684 12
13 Provide for surface defense of Area of Assault (AOA) 6 0.982684 12
14Defend against and engage hostile UAVs and low slow flyers (less than 200kts) 5
0.818903 14
15 Conduct Electronic Protection Operations 4 0.655123 15
16 Deconflict potentially hostile craft from friendly and neutral shipping 3 0.491342 16
17 Detect underwater mines 3 0.491342 16
18 Avoid underwater mines 2 0.327561 18
19Fuel and support rotary wing aircraft supporting amphibious operations both day and night 1
0.163781 19
Combat Systems weight:

219
C. PAYLOAD INTERFACING REQUIREMENTS
Pay Load Prioritized Requirements53.90%
Weighting Rank
1The HSAC System of Systems must provide minimum lift capacity of 7,963 tons (including EFV transport). 10
5.38961 1
2The HSAC System of Systems must provide minimum deck area of 98,163 square feet (including EFV transport). 10
5.38961 1
3 The HSAC must be capable of offloading cargo to beach and/or unimproved pier. 10 5.38961 1
4The HSAC must be capable of interfacing with LPD, LHA, LHD, LSD, and MPF(F) class ships. 9
4.850649 4
5The HSAC cargo area must be dimensioned to a minimum height requirement to handle and store a standard 20ton TEU (8'6") 8
4.311688 5
6THE HSAC must be capable of providing interfaces and services to payload (i.e. electrical power, data-link, fueling) 1
0.538961 6
Pay Load Weight

220
D. ANALYTIC HIERARCHY PROCESS (AHP) REQUIREMENT GENERATION
CS Payload ShipCS 1 0.333333 0.5Payload 3 1 2Ship 2 0.5 1Sum 6 1.833333 3.5
CS Payload Ship Avg PercentCS 0.166667 0.181818 0.142857 0.163781 16.38%Payload 0.5 0.545455 0.571429 0.538961 53.90%Ship 0.333333 0.272727 0.285714 0.297258 29.73%
Objective Preferences
Weights on Objectives

221
E. FINAL OPERATIONAL AND FUNCTIONAL REQUIREMENTS
Requirement TeamValue RanTeam
1 The HSAC System of Systems must provide minimum lift capacity of 7,963 tons (including EFV transport). 10
5.39 1Payload
2 The HSAC System of Systems must provide minimum deck area of 98,163 square feet (including EFV transport). 10
5.39 1Payload
4 The HSAC must be capable of offloading cargo to beach and/or unimproved pier. 10
5.39 1Payload
3 The HSAC must be capable of interfacing with LPD, LHA, LHD, LSD, and MPF(F) class ships. 9
4.85 4Payload
6
gheight requirement to handle and store a standard 20ton TEU (8'6") 8
4.31 5Payload
1 Endurance for minimum one round trip from sea base to beach at full load and full speed 10
2.97 1Ship
2 Able to interface with developed and undeveloped ports, harbors and beaches to transfer cargo 9
2.68 2Ship
3 Able to interface with sea base and current Naval assets to transfer cargo 9
2.68 2Ship
4 Must meet mission requirements at Sea State 59
2.68 2Ship
5 Able to transit 2000nm in less than 8 days in sea state 5 (wave height 8-12 ft) without replenishment 7
2.08 5Ship
6 Able to operate in shallow water without degradation in performance 7
2.08 5Ship
7 Able to Replenish-at-Sea (RAS)6
1.78 7Ship
8 Full accommodations required for embarked crew6
1.78 7Ship
9 Fuel and support rotary wing aircraft supporting amphibious operations both day and night 6
1.78 7Ship
1 Defend against and destroy small (less than 200ft long), high speed (in excess of 40kts) surface craft 10
1.64 1CS
2 Detect, track, and destroy up to 8 simultaneous “leaker” missiles that escape defenses supplied by other fleet units 10
1.64 1CS
5 Sustain hostile small caliber fire9
1.47 3CS
6 Provide suppressive fire for amphibious forces9
1.47 3CS
7 Communicate with U.S. and coalition forces via both secure and unsecure channels 8
1.31 5CS
8 Provide a data link capability8
1.31 5CS
9 Maintain a CIC capable of collecting, processing, displaying, evaluating and disseminating tactical information 8
1.31 5CS

222
10 Minimal manning4
1.19 10Ship
3 Conduct evasive torpedo maneuvers7
1.15 8CS
4 Employ ASW countermeasures 7
1.15 8CS
10 Detect, track, and identify UAV, low slow flyers, attack aircraft7
1.15 8CS
11 Provide Naval Surface Fire Support (NSFS) for amphibious forces 7
1.15 8CS
12 Detect, track, and identify surface threats to the horizon6
0.98 12CS
13 Provide for surface defense of Area of Assault (AOA)6
0.98 12CS
14 Defend against and engage hostile UAVs and low slow flyers (less than 200kts) 5
0.82 14CS
15 Conduct Electronic Protection Operations4
0.66 15CS
11 Able to transit 2000nm in less than 10 days in up to sea state 8 (wave height 25-40ft) without replenishment 2
0.59 11Ship
5 THE HSAC must be capable of providing interfaces and services to payload (i.e. electrical power, data-link, fueling) 1
0.54 6Payload
16 Deconflict potentially hostile craft from friendly and neutral shipping 3
0.49 16CS
17 Detect underwater mines3
0.49 16CS
18 Avoid underwater mines2
0.33 18CS
19 Fuel and support rotary wing aircraft supporting amphibious operations both day and night 1 0.16 19 CS

223
APPENDIX IV ANALYSIS OF ALTERNATIVE DATA
A. OVERALL MOP RESULTS FOR ALL COMBINATIONS
2 ships 3 ships 4 ships
Hydrofoil HYSWAS SES Monohull Catamaran Trimaran SWATH Hydrofoil HYSWAS SES Monohull Catamaran Trimaran SWATH Hydrofoil HYSWAS SES Monohull Catamaran Trimaran SWATH
30 0.342191 0.449848 0.387279 0.38479 0.426827 0.442271 0.485414 0.343801 0.42984 0.387121 0.376368 0.415776 0.627776 0.452178 0.348871 0.421113 0.391037 0.373974 0.412369 0.589141 0.43641435 0.377021 0.449548 0.386855 0.404311 0.447522 0.347952 0.453666 0.377128 0.431442 0.387181 0.392421 0.435057 0.57083 0.428763 0.381164 0.424002 0.391462 0.387636 0.430813 0.541209 0.41800840 0.408567 0.452919 0.392445 0.416887 0.465315 0.281379 0.438972 0.407249 0.436518 0.393129 0.402279 0.452047 0.53883 0.419628 0.41032 0.430218 0.397681 0.395964 0.447377 0.515975 0.41224145 0.437378 0.459179 0.112771 0.424876 0.481608 0.233838 0.434471 0.434763 0.444303 0.403015 0.408956 0.468001 0.523089 0.419104 0.436972 0.439018 0.407772 0.402265 0.463206 0.505157 0.41413650 0.463961 0.467752 0.125301 0.430924 0.497275 0.198932 0.436559 0.460205 0.454243 0.415671 0.415135 0.483659 0.517947 0.424179 0.461672 0.449867 0.420588 0.409044 0.478948 0.503643 0.421036
5 ships 7 ships 10 shipsHydrofoil HYSWAS SES Monohull Catamaran Trimaran SWATH Hydrofoil HYSWAS SES Monohull Catamaran Trimaran SWATH Hydrofoil HYSWAS SES Monohull Catamaran Trimaran SWATH
1 2 3 4 5 6 730 0.275451 0.312919 0.314196 0.28576 0.317034 0.436347 0.324023 0.291113 0.319738 0.328084 0.294926 0.322713 0.419594 0.323275 0.319575 0.339899 0.354667 0.316175 0.339637 0.417491 0.33535635 0.304634 0.323033 0.321749 0.30163 0.344973 0.421384 0.327652 0.319518 0.342495 0.33768 0.319592 0.361843 0.435067 0.346576 0.347201 0.351833 0.362894 0.329356 0.374694 0.422133 0.35303740 0.331662 0.335356 0.333362 0.314533 0.363817 0.413479 0.331671 0.345838 0.343886 0.347766 0.321663 0.372004 0.410319 0.339481 0.37283 0.365758 0.374999 0.34176 0.393257 0.422391 0.36117745 0.356997 0.349386 0.347695 0.326737 0.382313 0.414992 0.340801 0.370559 0.358624 0.362261 0.334267 0.390515 0.414914 0.350181 0.396964 0.381201 0.389703 0.35523 0.411875 0.429703 0.37329750 0.381033 0.364765 0.363947 0.339745 0.400873 0.422562 0.353284 0.394081 0.374634 0.378638 0.348239 0.409226 0.424739 0.363854 0.420007 0.397835 0.406238 0.370463 0.430812 0.441516 0.388051
15 ships 20 shipsHydrofoil HYSWAS SES Monohull Catamaran Trimaran SWATH Hydrofoil HYSWAS SES Monohull Catamaran Trimaran SWATH
1 2 3 4 5 6 730 0.403291 0.419602 0.437716 0.381057 0.426697 0.491821 0.419973 0.469671 0.493421 0.505792 0.45618 0.499312 0.57552 0.49432535 0.407435 0.40545 0.417811 0.365189 0.41984 0.455274 0.396339 0.474546 0.478343 0.4853 0.44015 0.492529 0.534782 0.46853540 0.409043 0.393854 0.402963 0.351175 0.412936 0.431045 0.379645 0.476765 0.465946 0.47002 0.424849 0.485446 0.507713 0.45034845 0.408529 0.385906 0.391949 0.347896 0.405857 0.420309 0.37051 0.476631 0.457087 0.458488 0.419003 0.47821 0.494835 0.44002650 0.407327 0.378146 0.383412 0.344294 0.400095 0.409754 0.361815 0.475784 0.448682 0.449683 0.415616 0.472034 0.482762 0.430454
B. MOP RESULTS OF THE MEDIUM SIZE SHIPS
5 7 10 5 7 10 5 7 10 5 7 10 5 7 10
Payload Weight 2,3 long tons 1750 1293 950 1750 1293 950 1750 1293 950 1750 1293 950 1750 1293 95030 KNOTS Hydrofoil Hydrofoil Hydrofoil HYSWAS HYSWAS HYSWAS SES SES SES Monohull Monohull Monohull CatamaranCatamaranCatamaran
Survivability 6.26275 6.990406 8.237655 5.518328 6.314631 7.626102 6.678555 7.367351 8.578601 5.849811 6.616026 7.90071231 6.271048 7.006234 8.261482Felexibility 5.038719 5.470441 6.160724 6.008667 6.350925 6.95746 7.715597 7.901518 8.363655 7.218355 7.449274 7.95197086 6.761027 6.538736 6.392819TF 12.33618 11.97033 11.58314 17.73388 16.22895 14.77279 13.3597 13.11404 12.81033 12.51988 11.47568 10.3148463 15.62549 14.67526 13.69084MOP 0.275451 0.291113 0.319575 0.312919 0.319738 0.339899 0.314196 0.328084 0.354667 0.28576 0.294926 0.31617543 0.317034 0.322713 0.339637
35 KNOTSSurvivability 7.063234 7.791234 9.038817 6.324161 7.120577 8.432166 7.497973 8.185565 9.395649 6.657655 7.425483 8.71225123 7.08671 7.822445 9.078281Felexibility 5.838053 6.269304 6.959127 6.800505 7.142606 7.748976 8.507569 8.693988 9.156607 8.012527 8.242249 8.74339909 8.553903 8.731362 9.185178TF 13.04779 12.58896 12.10865 16.16928 16.16928 13.42454 11.45606 11.45606 10.99197 11.6332 11.6332 9.10134847 15.20482 15.20482 13.16297MOP 0.304634 0.319518 0.347201 0.323033 0.342495 0.351833 0.321749 0.33768 0.362894 0.30163 0.319592 0.3293558 0.344973 0.361843 0.374694
40 KNOTSSurvivability 7.865135 8.593408 9.841255 7.130514 7.927053 9.238776 8.31975 9.005974 10.21475 7.469541 8.239523 9.52900853 7.905224 8.641542 9.898008Felexibility 6.63544 7.066314 7.755775 7.591617 7.933544 8.539727 9.298565 9.485549 9.948709 8.803698 9.031819 9.53095081 9.345482 9.522675 9.976204TF 13.50132 12.95789 12.39497 14.8669 13.56537 12.31265 10.03078 9.851912 9.630955 10.38611 9.092667 7.78605887 14.64803 13.6131 12.57013MOP 0.331662 0.345838 0.37283 0.335356 0.343886 0.365758 0.333362 0.347766 0.374999 0.314533 0.321663 0.34175968 0.363817 0.372004 0.393257
45 KNOTSSurvivability 8.668116 9.396618 10.64468 7.9374 8.734078 10.04594 9.144074 9.828784 11.03608 8.28607 9.058785 10.3516414 8.726562 9.463519 10.72067Felexibility 7.43134 7.8619 8.551069 8.381982 8.723715 9.329697 10.08851 10.27612 10.73989 9.591419 9.81751 10.3141378 10.13578 10.31268 10.7659TF 13.75192 13.13516 12.50202 13.76728 12.54987 11.3808 8.923929 8.767607 8.574524 9.04743 7.796755 6.58719462 14.04395 13.00954 11.97777MOP 0.356997 0.370559 0.396964 0.349386 0.358624 0.381201 0.347695 0.362261 0.389703 0.326737 0.334267 0.35523001 0.382313 0.390515 0.411875
50 KNOTSSurvivability 9.471978 10.20068 11.44892 8.744838 9.541666 10.8537 9.971165 10.65421 11.85984 9.107862 9.883913 11.1807928 9.550769 10.28845 11.54636Felexibility 8.226031 8.656316 9.345231 9.171575 9.513098 10.11885 10.87731 11.06561 11.53007 10.37523 10.59884 11.0924825 10.92476 11.10134 11.55421TF 13.84684 13.16859 12.47834 12.82753 11.685 10.59007 8.039773 7.901715 7.731111 7.795064 6.653131 5.58654092 13.44146 12.42356 11.41724MOP 0.381033 0.394081 0.420007 0.364765 0.374634 0.397835 0.363947 0.378638 0.406238 0.339745 0.348239 0.37046345 0.400873 0.409226 0.430812

224
C. COST MODEL
# ships Combat System Cost Cost/ship
1 50 50 2 98 49 3 141 47 4 180 45 5 215 43 7 280 40
10 350 35 15 450 30 20 540 27
Line
Polynomia

225
D. COST CALCULATION
Figure 89.
Excel work to calculate the cost according to the new
cost
Learning curve=0.9
HYSWAS-2 Monohull-2 Catamaran-2 HYSWAS-3 Catamaran-3 Trimaran-3 1 2 3 4 5 6
30 0.44984773 0.38478972 0.426826788 0.429840363 0.415775549 0.6277764135 0.44954772 0.40431136 0.447521768 0.431442471 0.435056994 0.570829540 0.45291902 0.41688715 0.465314781 0.436517769 0.452046917 0.5388295145 0.45917945 0.42487634 0.481607985 0.444303049 0.468000619 0.523088650 0.46775168 0.43092426 0.497275097 0.454242516 0.483658605 0.51794713
test1 0.45584912 0.41235777 0.463709284 0.439269234 0.450907737 0.55569423test2 0.45584912 0.41235777 0 0.439269234 0 0
test3= Average MOP 0.45584912 0.41235777 0.463709284 0.439269234 0.450907737 0.55569423Old MIT Cost 510400000 508100000 538900000 489600000 510300000 506000000
Machinery and Structural Weight
cost 152533994 147933994 209533994.1 166400991.2 228500991.2 215600991
Combat System adjusted cost 250533994 245933994 350533994.1 307400991.2 369500991.2 356600991
Learning curve Adjusted Cost 238007294 233637294 333007294.4 281395480.7 338241944.6 326433259
Cost of nth ship 125266997 122966997 175266997.1 102466997.1 123166997.1 118866997 2 112740297 110670297 157740297.3 92220297.35 110850297.3 106980297 3 106001683 104055409 148311982.1 86708186.3 104224650.2 100585964 4 101466268 99603267.6 141966267.6 82998267.61 99765267.61 96282267.6 5 98082395.4 96281525.9 137231731.4 80230298.1 96438123.24 93071280.3 6 95401514.5 93649868.1 133480783.9 78037367.67 93802185.2 90527368 7 93192111.1 91481031.1 130389502.8 76230100.51 91629820.67 88430845 8 91319640.8 89642940.8 127769640.8 74698440.85 89788740.85 86654040.8 9 89699258.5 88052310 125502487.1 73372986.31 88195522.94 85116445.3 10 88274155.8 86653373.3 123508558.3 72207268.29 86794310.92 83764152.3 11 87004508.3 85407037.5 121732134.2 71168710.85 85545947.98 82559372.2 12 85861363.1 84284881.3 120132705.5 70233630.91 84421966.68 81474631.2 13 84823039.6 83265622.2 118679937.9 69384293.95 83401049.84 80489356.6 14 83872900 82332928 117350552.5 68607090.46 82466838.61 79587760.5 15 82997910.1 81474003.6 116126312.7 67891358.54 81606517.19 78757474.6 16 82187676.8 80678646.8 114992676.8 67228596.76 80809866.76 77988636.8 17 81433785.6 79938597.6 113937871.8 66611922.23 80068613.95 77273262.5 18 80729332.7 79247079 112952238.4 66035687.68 79375970.64 76604800.8 19 80068586.8 78598465 112027757.5 65495204.97 78726301.64 75977813 20 79446740.2 77988036 111157702.5 64986541.46 78114879.82 75387737.1

226
Cost vs MOP
$200,000,000
$300,000,000
$400,000,000
$500,000,000
$600,000,000
$700,000,000
$800,000,000
0.4 0.42 0.44 0.46 0.48 0.5 0.52 0.54 0.56 0.58
MOP
Cos
t
3 Trimarans
2 monohull
4 Trimarans2 catamaran

227
APPENDIX V CARGO DESIGN DATA
A. TWO BATTALION LANDING TEAM COMPOSITION
Landing Priority
Unit # Pax Equipment Type
Equipment Quantity
Indiv Weight
(lbs)
Total Weight (lbs)
Indiv Area (ft2)
Total Area (ft2)
1Rifle Co 1 (Rein) 233 EFV-P 12 72,879 874,548 360.0 4320.0 AA Plt
2 Tank Plt 1 8 M1A1 2 133,815 267,630 387.0 774.08 M1A1 w/TWMP 2 141,075 282,150 506.8 1013.6
3Rifle Co 2 (Rein) 233 EFV-P 12 72,879 874,548 360.0 4320.0 AA Plt
4 Tank Plt 2 8 M1A1 2 133,815 267,630 387.0 774.08 M1A1 w/TWMP 2 141,075 282,150 506.8 1013.6
5 A Command 143 EFV-P 10 71,344 713,440 360.0 3600.0 AA Plt 8 EFV-C 1 66,351 66,351 360.0 360.0CEB Plt81mm Mortars
6Rifle Co 3 (Rein) 233 EFV-P 12 72,879 874,548 360.0 4320.0 AA Plt
7 Tank Plt 3 16 M1A1 4 133,815 535,260 387.0 1548.0
8 Tank Co Hq 8 ABV 2 1,350 2,700 468.0 936.0Det, CEB Co 4 AVLB 1 93,194 93,194 468.0 468.0Det, Engr Spt Plt 8 M1A1 2 133,815 267,630 387.0 774.0 (ABV&ACE) 5 M88A2 1 141,173 141,173 340.5 340.5Det, AT Plt, Tank Bn 4 M9 ACE 4 37,799 151,197 215.3 861.0
8M998 HMMWV w/M101Trlr 2 12,118 24,236 185.3 370.7
3M998 HMMWV w/M116 Trlr 1 12,778 12,778 196.1 196.1
3MRC JTRS HMMWV 2 8,720 17,440 64.8 129.7
4M1043 HMMWV 1 10,158 10,158 109.8 109.8
18M1045 HMMWV 6 9,918 59,508 109.2 655.2
9 M998 HMMWV 3 8,918 26,754 109.3 327.99 CAAT Plt 24 ITV 8
Scout Snipers 40
M1043 HMMWV 10 10,158 101,580 109.8 1097.9
TACP 32M1045 HMMWV 8 10,218 81,744 109.2 873.6
9 M998 HMMWV 3 8,918 26,754 109.3 327.9
SUMMARY OF PERSONNEL AND EQUIPMENT BY LANDING SEQUENCE PRIORITYMPF(F) MEB SEA BASED MANEUVER ELEMENT (SURFACE)
NOTE: UNITS LISTED ARE PER BATTALION TASK FORCE. FOR SURFACE, WEIGHTS AND AREAS ARE DOUBLED (IN RED TEXT/HIGHLIGHT)

228
2
MRC JTRS HMMWV w/M101 Trlr 1 11,770 11,770 140.9 140.9
10 B Command 18 EFV-P 1 72,454 72,454 360.0 360.0Det, AA Plt 12 EFV-C 1 67,551 67,551 360.0 360.0Arty Bn LNO Tm 4
M998 HMMWV w/M101 Trlr 1 12,118 12,118 185.3 185.3
NGLO Team 9MRC JTRS HMMWV 3 9,170 27,510 64.8 194.5
11 LAR Co B 84 LAV 25 14 28,685 401,590 173.3 2425.54 LAV AT 4 30,624 122,496 171.5 686.06 LAV C2 1 29,121 29,121 174.6 174.62 LAV L 3 29,429 88,287 173.5 520.63 LAV M 2 30,047 60,094 172.2 344.46 LAV R 1 31,103 31,103 200.0 200.0
12A Command Veh/Pers 8
M1043 HMMWV 2 10,158 20,316 109.8 219.6
12 M998 HMMWV 3 9,218 27,654 109.3 327.9
12MRC JTRS HMMWV 4 10,670 42,680 64.8 259.4
4
MRC JTRS HMMWVw/M101 Trlr 1 10,870 10,870 140.9 140.9
13
Det, Arty Btry C (3 Guns) 3
M1043 HMMWV 1 9,858 9,858 109.8 109.8
12M998 HMMWV w/M101 Trlr 3 12,118 36,354 185.3 556.0
24 MTVR w/LW155 3 46,208 138,624 214.4 643.1
9MTVR w/M105 Trlr 3 53,068 159,204 310.6 931.9
6MRC JTRS HMMWV 2 9,170 18,340 64.8 129.7
14Avenger Section 10 Avenger 5 13,613 68,065 116.5 582.3
3MRC JTRS HMMWV 1 9,170 9,170 64.8 64.8
15Arty Btry C (-) (3 Guns) 4
M1043 HMMWV 1 10,158 10,158 109.8 109.8
Det, CBR Plt, HQ Btry 4
M998 HMMWV w/M101 Trlr 1 12,118 12,118 185.3 185.3
3MRC JTRS HMMWV 1 9,170 9,170 64.8 64.8
4 MTVR 1 45,008 45,008 214.4 214.4
24 MTVR w/LW155 3 46,208 138,624 214.4 643.1
15MTVR w/M105 Trlr 5 53,068 265,340 310.6 1553.1
3MTVR w/M149 WB 1 50,308 50,308 307.8 307.8
2 4K Forklift 2 12,004 24,008 106.2 212.3
4M1035 HMMWV 1 8,890 8,890 106.3 106.3
12
AN/TPQ (4 HMMWV& 4 Trlr) 1 53,476 53,476 108.5 108.5
16
Det, CEB Co B (Veh/Pers) 6
MTVR Dumptruck w/MK155 3 52,541 157,623 339.0 1017.1
3 M998 HMMWV 1 8,918 8,918 109.3 109.3

229
17B Command (Veh/Pers) 18 M998 HMMWV 6 8,918 53,508 109.3 655.7
9M998 HMMWV w/M101 Trlr 3 11,818 35,454 185.3 556.0
6MRC JTRS HMMWV 2 9,170 18,340 64.8 129.7
18
Inf Bn Combat Trains 6
M1035 HMMWV 2 8,590 17,181 106.3 212.5
8 M997 HMMWV 2 11,550 23,101 122.4 244.921 M998 HMMWV 7 8,918 62,426 109.3 765.0
3M998 HMMWV w/M101 Trlr 1 11,818 11,818 185.3 185.3
19Inf Bn DS CSS Co B 2 4K Forklift 2 12,004 24,008 106.2 212.3
10 M1043 2 10,458 20,916 109.8 219.610 M997 HMMWV 2 11,850 23,701 122.4 244.924 M998 HMMWV 6 9,218 55,308 109.3 655.78 Contact Truck 2 22,200 44,400 214.4 428.8
16M998 HMMWV w/M101 Trlr 4 12,118 48,472 185.3 741.4
3MRC JTRS HMMWV 2 8,720 17,440 64.8 129.7
Totals per Bn Task
Force
Unit # Pax Equipment Type
Equipment Quantity
Indiv Weight
(lbs)
Total Weight (lbs)
Indiv Area (ft2)
Total Area (ft2)
1558 237 2,604,574.4 8,760,044.2 14,594.7 49,081.7
Sub-Totals
for Surface A42SBM
E
Unit # Pax Equipment Type
Equipment Quantity
Indiv Weight
(lbs)
Total Weight (lbs)
Indiv Area (ft2)
Total Area (ft2)
3116 474 5,209,148.8 17,520,088.4 29,189.3 98,163.3
PRIORITIES ABOVE FOR INITIAL STOM. PRIORITIES

230
B. SIX SHIP CARGO DISTRIBUTION
Distribution of one battalion landing team on six HSAC
ships:
Vehicle SHIP 1 SHIP 2 SHIP 3 SHIP 4 SHIP 5 SHIP 6
qty qty qty qty qty qtyHumvee 17 137700 17 137700 17 137700 17 137700 17 137700 17 137700EFV 9 655911 8 583032 8 583032 8 583032 8 583032 8 583032M1A2 2 278160 3 417240 3 417240 2 278160 2 278160 2 278160LAV 5 145000 4 116000 4 116000 4 116000 4 116000 4 116000ABV 0 0 0 0 1 139080 1 139080AVLB 0 0 0 1 93194 0 0M9ACE 0 0 1 37799 1 37799 1 37799 1 37799M88A2 0 1 140000 0 0 0 0ITV 1 7900 1 7900 1 7900 2 15800 1 7900 2 15800AVENGER 1 8300 0 1 8300 1 8300 1 8300 1 8300MTVR 4 164000 3 123000 3 123000 3 123000 3 123000 3 123000LW155 1 9200 1 9200 1 9200 1 9200 1 9200 1 9200M105 2 10720 2 10720 1 5360 1 5360 1 5360 1 5360MK155 0 0 1 6405 1 6405 1 6405 0M101 2 5678 2 5678 4 11356 2 5678 4 11356 3 8517M149 0 0 0 0 0 1 2600M116 0 0 0 0 1 2360 0AN/TPQ 1 43756 0 0 0 0 0FORKLIFT 1 10000 0 1 10000 1 10000 0 1 10000CONTACT TRUCK 0 0 0 2 40000 0 0TOTAL PAYLOAD (LB) 1476325 1550470 1473292 1469628 1465652 1474548TOTAL PAYLOAD (LT) 659 692 658 656 654 658

231
C. CARGO VERTICAL CENTER OF GRAVITY CALCULATIONS
VERTICAL CENTER OF GRAVITY CALCULATIONS FOR ONE
BATTALION LANDING TEAM OF CARGO DISTRIBUTED OVER SIX HSAC
SHIPS
SHIP 1Vehicle weight # of Total Height Vehicle weight*vcg
(lbs) vehicles weight (lb) (m) VCG (m) (lb*m)Humvee 8100 17 137700 2.5908 10.7954 1486527EFV 72879 9 655911 3.188208 7.094104 4653101M1A2 139080 2 278160 2.886456 6.943228 1931328LAV 29000 5 145000 2.68986 10.84493 1572515ABV 139080 0 2.886456 10.94323 0AVLB 93194 0 2.886456 10.94323 0M9ACE 37799 0 2.886456 10.94323 0M88A2 140000 0 3.1242 11.0621 0ITV 7900 1 7900 1.6764 10.3382 81671.78AVENGER 8300 1 8300 2.642616 10.82131 89816.86MTVR 41000 4 164000 2.846832 10.92342 1791440LW155 9200 1 9200 2.261616 10.63081 97803.43M105 5360 2 10720 2.490216 10.74511 115187.6MK155 6405 0 1.880616 10.44031 0M101 2839 2 5678 2.112264 10.55613 59937.72M149 2600 0 1.941576 10.47079 0M116 2360 0 0.6096 9.8048 0AN/TPQ 43756 1 43756 2.5908 10.7954 472363.5FORKLIFT 10000 1 10000 3.090672 11.04534 110453.4CONTACT TRUCK 20000 0 2.846832 10.92342 0TOTAL PAYLOAD WEIGHT(LB) 1476325 12462145TOTAL PAYLOAD WEIGHT(LT) 659.0737
VCG of CARGO= 8.441329

232
SHIP 2Vehicle weight # of Total Height Vehicle weight*vcg
(lbs) vehicles weight (lb) (m) VCG (m) (lb*m)Humvee 8100 17 137700 2.5908 10.7954 1486527EFV 72879 8 583032 3.188208 7.094104 4136090M1A2 139080 3 417240 2.886456 6.943228 2896992LAV 29000 4 116000 2.68986 10.84493 1258012ABV 139080 0 0 2.886456 10.94323 0AVLB 93194 0 0 2.886456 10.94323 0M9ACE 37799 0 0 2.886456 10.94323 0M88A2 140000 1 140000 3.1242 11.0621 1548694ITV 7900 1 7900 1.6764 10.3382 81671.78AVENGER 8300 0 0 2.642616 10.82131 0MTVR 41000 3 123000 2.846832 10.92342 1343580LW155 9200 1 9200 2.261616 10.63081 97803.43M105 5360 2 10720 2.490216 10.74511 115187.6MK155 6405 0 0 1.880616 10.44031 0M101 2839 2 5678 2.112264 10.55613 59937.72M149 2600 0 0 1.941576 10.47079 0M116 2360 0 0 0.6096 9.8048 0AN/TPQ 43756 0 0 2.5908 10.7954 0FORKLIFT 10000 0 0 3.090672 11.04534 0CONTACT TRUCK 20000 0 0 2.846832 10.92342 0TOTAL PAYLOAD WEIGHT(LB) 1550470 13024495TOTAL PAYLOAD WEIGHT(LT) 692.1741
VCG of CARGO= 8.400353 SHIP 3
Vehicle weight # of Total Height Vehicle weight*vcg(lbs) vehicles weight (lb) (m) VCG (m) (lb*m)
Humvee 8100 17 137700 2.5908 10.7954 1486527EFV 72879 8 583032 3.188208 7.094104 4136090M1A2 139080 3 417240 2.886456 6.943228 2896992LAV 29000 4 116000 2.68986 10.84493 1258012ABV 139080 0 2.886456 10.94323 0AVLB 93194 0 2.886456 10.94323 0M9ACE 37799 1 37799 2.886456 10.94323 413643.1M88A2 140000 0 3.1242 11.0621 0ITV 7900 1 7900 1.6764 10.3382 81671.78AVENGER 8300 1 8300 2.642616 10.82131 89816.86MTVR 41000 3 123000 2.846832 10.92342 1343580LW155 9200 1 9200 2.261616 10.63081 97803.43M105 5360 1 5360 2.490216 10.74511 57593.78MK155 6405 1 6405 1.880616 10.44031 66870.17M101 2839 4 11356 2.112264 10.55613 119875.4M149 2600 0 1.941576 10.47079 0M116 2360 0 0.6096 9.8048 0AN/TPQ 43756 0 2.5908 10.7954 0FORKLIFT 10000 1 10000 3.090672 11.04534 110453.4CONTACT TRUCK 20000 0 2.846832 10.92342 0TOTAL PAYLOAD WEIGHT(LB) 1473292 12158929TOTAL PAYLOAD WEIGHT(LT) 657.7196
VCG of CARGO= 8.252898

233
SHIP 4Vehicle weight # of Total Height Vehicle weight*vcg
(lbs) vehicles weight (lb) (m) VCG (m) (lb*m)Humvee 8100 17 137700 2.5908 10.7954 1486527EFV 72879 8 583032 3.188208 7.094104 4136090M1A2 139080 2 278160 2.886456 6.943228 1931328LAV 29000 4 116000 2.68986 10.84493 1258012ABV 139080 0 2.886456 10.94323 0AVLB 93194 1 93194 2.886456 10.94323 1019843M9ACE 37799 1 37799 2.886456 10.94323 413643.1M88A2 140000 0 3.1242 11.0621 0ITV 7900 2 15800 1.6764 10.3382 163343.6AVENGER 8300 1 8300 2.642616 10.82131 89816.86MTVR 41000 3 123000 2.846832 10.92342 1343580LW155 9200 1 9200 2.261616 10.63081 97803.43M105 5360 1 5360 2.490216 10.74511 57593.78MK155 6405 1 6405 1.880616 10.44031 66870.17M101 2839 2 5678 2.112264 10.55613 59937.72M149 2600 0 1.941576 10.47079 0M116 2360 0 0.6096 9.8048 0AN/TPQ 43756 0 2.5908 10.7954 0FORKLIFT 10000 1 10000 3.090672 11.04534 110453.4CONTACT TRUCK 20000 2 40000 2.846832 10.92342 436936.6TOTAL PAYLOAD WEIGHT(LB) 1469628 12671778TOTAL PAYLOAD WEIGHT(LT) 656.0839
VCG of CARGO= 8.622439 SHIP 5
Vehicle weight # of Total Height Vehicle weight*vcg(lbs) vehicles weight (lb) (m) VCG (m) (lb*m)
Humvee 8100 17 137700 2.5908 10.7954 1486527EFV 72879 8 583032 3.188208 7.094104 4136090M1A2 139080 2 278160 2.886456 6.943228 1931328LAV 29000 4 116000 2.68986 10.84493 1258012ABV 139080 1 139080 2.886456 10.94323 1521984AVLB 93194 0 2.886456 10.94323 0M9ACE 37799 1 37799 2.886456 10.94323 413643.1M88A2 140000 0 3.1242 11.0621 0ITV 7900 1 7900 1.6764 10.3382 81671.78AVENGER 8300 1 8300 2.642616 10.82131 89816.86MTVR 41000 3 123000 2.846832 10.92342 1343580LW155 9200 1 9200 2.261616 10.63081 97803.43M105 5360 1 5360 2.490216 10.74511 57593.78MK155 6405 1 6405 1.880616 10.44031 66870.17M101 2839 4 11356 2.112264 10.55613 119875.4M149 2600 0 1.941576 10.47079 0M116 2360 1 2360 0.6096 9.8048 23139.33AN/TPQ 43756 0 2.5908 10.7954 0FORKLIFT 10000 0 3.090672 11.04534 0CONTACT TRUCK 20000 0 2.846832 10.92342 0TOTAL PAYLOAD WEIGHT(LB) 1465652 12627935TOTAL PAYLOAD WEIGHT(LT) 654.3089
VCG of CARGO= 8.615916

234
SHIP 6Vehicle weight # of Total Height Vehicle weight*vcg
(lbs) vehicles weight (lb) (m) VCG (m) (lb*m)Humvee 8100 17 137700 2.5908 10.7954 1486527EFV 72879 8 583032 3.188208 7.094104 4136090M1A2 139080 2 278160 2.886456 6.943228 1931328LAV 29000 4 116000 2.68986 10.84493 1258012ABV 139080 1 139080 2.886456 10.94323 1521984AVLB 93194 0 2.886456 10.94323 0M9ACE 37799 1 37799 2.886456 10.94323 413643.1M88A2 140000 0 3.1242 11.0621 0ITV 7900 2 15800 1.6764 10.3382 163343.6AVENGER 8300 1 8300 2.642616 10.82131 89816.86MTVR 41000 3 123000 2.846832 10.92342 1343580LW155 9200 1 9200 2.261616 10.63081 97803.43M105 5360 1 5360 2.490216 10.74511 57593.78MK155 6405 0 1.880616 10.44031 0M101 2839 3 8517 2.112264 10.55613 89906.58M149 2600 1 2600 1.941576 10.47079 27224.05M116 2360 0 0.6096 9.8048 0AN/TPQ 43756 0 2.5908 10.7954 0FORKLIFT 10000 1 10000 3.090672 11.04534 110453.4CONTACT TRUCK 20000 0 2.846832 10.92342 0TOTAL PAYLOAD WEIGHT(LB) 1474548 12727305TOTAL PAYLOAD WEIGHT(LT) 658.2804
VCG of CARGO= 8.631327

235
D. WEIGHT AND BUOYANCY CALCULATIONS
BOW RAMP WEIGHT AND BOUYANCY CALCULATIONS
Bow Ramp Section Specifications:
L = 5 meters W = 5 meters D = 1.7 meters
Ramp is comprised of eight sections as described
above, seven of which will experience buoyancy forces when
the ramp is fully deployed.
Density of Aluminum: 32700 alkgmρ =
Density of Steel: 37850steelkgmρ =
Aluminum to Steel Density Ratio: 0.34al
steel
ρρ
=
Existing NL causeway Structure Density (steel):
33
140000 14.149900
lb lbftft
ρ = =
HSAC Bow Ramp Structure Density (estimate half
steel/half aluminum construction):
3 30.34 14.14 9.5 estimatedlb lbft ftρ = =
Bow Ramp Weight: ( )( )( ) 3 3Total Volume (8 sections)= 40 5 1.6 320 11300.7m ft= =
( )( )( ) 3 3Total Volume (7 floating sections)= 35 5 1.6 280 9888.1m ft= =
( )33Weight of 40 meter ramp (8 sections) = 11300.7 9.5 107357 47.93lbft lb LTft
= =
( )33Weight of 35 meter ramp (7 floating sections) = 9888.1 9.5 93937 41.94lbft lb LTft
= =
Bow Ramp Draft Unloaded:
( ) 39888.1 9.5 93937 41.94lbft lb LTft ∆ = = =

236
( )3
3 341.94 35 1467.8 41.56ftLT ft mLT ∇ = = =
( )( )( )
341.560.235 35
mT mm m= =
Maximum desired draft = 1.0m
Desired cargo capacity = two M1A2 tanks, at 62.1LT
each
Bow Ramp Calculated Draft with 124.2LT load:
124.2 41.94 166.1load structure LT LT LT+∆ = + =
( )3
3 3166.1 35 5813.5 164.6ftLT ft mLT ∇ = = =
( )( )3
max164.6 0.945 35load
mT mm m= =

237
E. OFFLOAD RATE CALCULATIONS
It was assumed that a vehicle starting all the way at
the stern of the HSAC could traverse the full length of the
ship and fully deployed bow ramp at 5mph or 2.24m/s.
Length of ship = 149m
Length of deployed ramp = 35m
Total travel distance = 184m
Time to traverse total distance = 184 82.142.24 m
s
m s=
The above calculated offload time is the absolute
worst case time for a vehicle leaving the ship. Vehicles
closer to the bow have to travel a shorter distance than
those closer to the stern. In addition, the EFVs and LAVs
can exit out the stern instead of using the bow ramp. Thus
using this worst case time for all the loaded vehicles
should produce a reasonable estimate for the offload time.
It is also important to note that the initial vehicles to
disembark will be unsecured from sea while the ramp is
being deployed. Then as the initial vehicles leave the
remaining vehicles are unsecured in preparation for their
departure.
Vehicles loaded = 47
Worst-case offload time = 47*82.14 3860.50 1.072s s hours= =
Buffer added for extenuating events = 1 hour
Total Estimated Offload Time = ~2 hours

238
THIS PAGE INTENTIONALLY LEFT BLANK

239
APPENDIX VI HULL CALCULATIONS
A. HULL DATA
Floating Status
Draft FP 4.500 m Heel zero GM(Solid) 9.823 m Draft MS 4.500 m Equil Yes F/S Corr. 0.000 m Draft AP 4.500 m Wind 0.0 kn GM(Fluid) 9.823 m
Trim 0.00 deg. Wave No KMT 14.843 m LCG 69.697f m VCG 5.020 m TPcm 18.65
Fluid Legend
Fluid Name Legend Weight (MT)
Load%
DIESEL OIL
819.94 100.00%
FRESH WATER
227.10 100.00%
WATER BALLAST
110.43 100.00%
Fixed Weight Status
Item Weight
(MT) LCG (m)
TCG (m)
VCG (m)
LIGHT SHIP 3,810.00 68.300f 0.000 6.000u Total Fixed: 3,810.00 68.300f 0.000 6.000u

240
Tank Status
DIESEL OIL (SpGr 0.850) Tank Name
Load (%)
Weight (MT)
LCG (m)
TCG (m)
VCG (m)
Perm
DS1.P 100.00% 69.43 48.023f 5.464p 3.813 0.950 DS1.S 100.00% 69.43 48.023f 5.464s 3.813 0.950 DS2.P 100.00% 69.72 66.000f 5.467p 3.810 0.950 DS2.S 100.00% 69.72 66.000f 5.467s 3.810 0.950 JP1.P 100.00% 66.84 32.033f 1.958p 1.419 0.985 JP1.S 100.00% 66.84 32.033f 1.958s 1.419 0.985 JP2.P 100.00% 40.81 48.417f 1.609p 0.618 0.985 JP2.S 100.00% 40.81 48.417f 1.609s 0.618 0.985 JP3.P 100.00% 43.96 66.000f 1.640p 0.598 0.985 JP3.S 100.00% 43.96 66.000f 1.640s 0.598 0.985 JP4.P 100.00% 119.22 83.995f 2.191p 1.182 0.985 JP4.S 100.00% 119.22 83.995f 2.191s 1.182 0.985
Subtotals: 100.00% 819.94 60.901f 0.000 1.994
FRESH WATER (SpGr 1.000) Tank Name
Load (%)
Weight (MT)
LCG (m)
TCG (m)
VCG (m)
Perm
FW1.P 100.00% 113.55 101.504f 2.046p 1.235 0.985 FW1.S 100.00% 113.55 101.504f 2.046s 1.235 0.985
Subtotals: 100.00% 227.10 101.504f 0.000 1.235
WATER BALLAST (SpGr 1.025) Tank Name
Load (%)
Weight (MT)
LCG (m)
TCG (m)
VCG (m)
Perm
WB1.P 100.00% 55.21 117.785f 1.438p 1.455 0.985 WB1.S 100.00% 55.21 117.785f 1.438s 1.455 0.985
Subtotals: 100.00% 110.43 117.785f 0.000 1.455
All Tanks Load
(%) Weight (MT)
LCG (m)
TCG (m)
VCG (m)
Perm
Totals: 1,157.46 74.294f 0.000 1.794
Displacer Status
Item Status Spgr Displ (MT)
LCB (m)
TCB (m)
VCB (m)
Eff /Perm
HULL Intact 1.025 4,967.53 69.697f 0.000 2.791 0.950 SubTotals: 4,967.53 69.697f 0.000 2.791

241
B. HYDROSTATICS
Draft is from Baseline. Trim: 0.00 deg., No heel, VCG = 6.000
Draft at
74.500f (m)
Displ (MT)
LCB (m)
VCB (m)
LCF (m)
TPcm (MT/cm)
MTcm (MT-m /deg)
KML (m)
KMT (m)
0.000 0.000 0.100 7.931 71.742f 0.066 71.879f 1.448 594.657 4,301.723 11.345 0.200 26.676 71.930f 0.128 72.115f 2.298 1236.824 2,662.185 10.214 0.300 53.994 72.064f 0.191 72.266f 3.148 1991.351 2,118.908 11.013 0.400 88.723 72.179f 0.254 72.407f 3.790 2764.115 1,790.833 10.221 0.500 129.726 72.282f 0.316 72.541f 4.410 3571.172 1,583.115 9.960 0.600 176.907 72.370f 0.379 72.675f 5.024 4418.229 1,436.810 9.990 0.700 230.252 72.448f 0.442 72.697f 5.632 5340.515 1,334.797 10.075 0.800 289.045 72.518f 0.505 72.853f 6.122 6198.808 1,234.630 9.749 0.900 352.723 72.583f 0.567 72.922f 6.604 7099.704 1,159.147 9.524 1.000 421.163 72.640f 0.630 72.971f 7.074 8001.117 1,094.377 9.388 1.100 494.273 72.689f 0.692 73.012f 7.538 8913.863 1,039.184 9.323 1.200 572.004 72.732f 0.754 73.039f 7.996 9832.132 990.753 9.314 1.300 654.215 72.768f 0.817 73.009f 8.426 10787.380 950.656 9.228 1.400 740.324 72.800f 0.879 73.023f 8.799 11680.080 909.863 9.053 1.500 830.113 72.826f 0.941 73.033f 9.160 12561.960 872.959 8.905 1.600 923.496 72.846f 1.002 73.046f 9.508 13418.780 838.447 8.788 1.700 1020.400 72.861f 1.064 72.961f 9.867 14350.160 811.684 8.702 1.800 1120.783 72.869f 1.125 72.900f 10.215 15251.660 785.604 8.641 1.900 1224.653 72.870f 1.187 72.818f 10.563 16167.050 762.304 8.603 2.000 1331.987 72.862f 1.248 72.725f 10.896 17087.560 740.952 8.553 2.100 1442.453 72.847f 1.310 72.621f 11.190 18001.750 720.976 8.436 2.200 1555.860 72.824f 1.371 72.483f 11.480 18934.830 703.219 8.328 2.300 1672.158 72.793f 1.432 72.318f 11.767 19890.510 687.471 8.233 2.400 1791.323 72.753f 1.493 72.129f 12.054 20868.730 673.422 8.153 2.500 1913.357 72.705f 1.554 71.913f 12.341 21874.400 660.966 8.088 2.600 2038.269 72.648f 1.615 71.674f 12.631 22912.690 650.011 8.035 2.700 2166.087 72.582f 1.676 71.409f 12.923 23987.520 640.436 7.995 2.800 2296.835 72.506f 1.738 71.117f 13.220 25109.100 632.296 7.966 2.900 2430.443 72.421f 1.799 70.786f 13.494 26287.780 625.651 7.899 3.000 2566.675 72.325f 1.860 70.438f 13.755 27486.140 619.510 7.824 3.100 2705.507 72.219f 1.921 70.068f 14.016 28726.340 614.289 7.755 3.200 2846.944 72.104f 1.982 69.689f 14.274 29991.040 609.519 7.694 3.300 2991.049 71.977f 2.043 69.228f 14.547 31391.950 607.275 7.642 3.400 3137.848 71.838f 2.104 68.784f 14.815 32789.630 604.664 7.598 3.500 3287.456 71.686f 2.166 68.214f 15.116 34404.420 605.560 7.634 3.600 3440.279 71.521f 2.227 67.695f 15.453 35827.530 602.625 8.075 3.700 3596.557 71.344f 2.289 67.229f 15.803 37098.040 596.939 8.703 3.800 3756.353 71.160f 2.351 66.782f 16.151 38316.600 590.385 9.414 3.900 3919.581 70.968f 2.414 66.334f 16.494 39505.680 583.429 10.178 4.000 4086.282 70.770f 2.476 65.874f 16.847 40708.030 576.729 10.987 4.100 4256.575 70.565f 2.539 65.399f 17.211 41945.430 570.551 11.823 4.200 4430.531 70.352f 2.602 64.921f 17.578 43179.730 564.345 12.661 4.300 4608.139 70.134f 2.666 64.482f 17.943 44373.480 557.666 13.446 4.400 4789.379 69.913f 2.730 64.074f 18.304 45520.370 550.509 14.180 4.500 4974.211 69.689f 2.794 63.697f 18.661 46620.790 542.950 14.867
Water Specific Gravity = 1.025.

242
Hydrostatic Properties at Trim = 0.00, Heel = 0.00
Long. Location in m
Draft
@ 74.500f
65.0f 70.0f
0.0
1.0
2.0
3.0
4.0LCB m
LCF m
VCB m
Displ.MT
MT/cm Imm.
Mom/Deg Trim
KML
KMT
VCB m x 1 0.0 1.0 2.0 3.0Displ.MT x 1000 -1.0 0.0 1.0 2.0 3.0 4.0 5.0 6.0
MT/cm Imm. x 10 0.0 1.0 2.0Mom/Deg Trim x 10000 0.0 1.0 2.0 3.0 4.0 5.0
KML x 1000 0.0 1.0 2.0 3.0 4.0 5.0KMT x 10 1.0 1.5

243
C. TANK CALIBRATION
Fluid Legend Fluid Name Legend Weight
(MT) Load%
COMBUSTIBLE
819.94 100.00%
FRESH WATER
227.10 100.00%
WATER BALLAST
110.43 100.00%
Tank Status COMBUSTIBLE (SpGr 0.850) Tank Name
Load (%)
Weight (MT)
LCG (m)
TCG (m)
VCG (m)
Perm
DS1.P 100.00% 69.43 48.023f 5.464p 3.813 0.950DS1.S 100.00% 69.43 48.023f 5.464s 3.813 0.950DS2.P 100.00% 69.72 66.000f 5.467p 3.810 0.950DS2.S 100.00% 69.72 66.000f 5.467s 3.810 0.950JP1.P 100.00% 66.84 32.033f 1.958p 1.419 0.985JP1.S 100.00% 66.84 32.033f 1.958s 1.419 0.985JP2.P 100.00% 40.81 48.417f 1.609p 0.618 0.985JP2.S 100.00% 40.81 48.417f 1.609s 0.618 0.985JP3.P 100.00% 43.96 66.000f 1.640p 0.598 0.985JP3.S 100.00% 43.96 66.000f 1.640s 0.598 0.985JP4.P 100.00% 119.22 83.995f 2.191p 1.182 0.985JP4.S 100.00% 119.22 83.995f 2.191s 1.182 0.985Subtotals: 100.00% 819.94 60.901f 0.000 1.994 FRESH WATER (SpGr 1.000) Tank Name
Load (%)
Weight (MT)
LCG (m)
TCG (m)
VCG (m)
Perm
FW1.P 100.00% 113.55 101.504f 2.046p 1.235 0.985FW1.S 100.00% 113.55 101.504f 2.046s 1.235 0.985Subtotals: 100.00% 227.10 101.504f 0.000 1.235 WATER BALLAST (SpGr 1.025) Tank Name
Load (%)
Weight (MT)
LCG (m)
TCG (m)
VCG (m)
Perm
WB1.P 100.00% 55.21 117.785f 1.438p 1.455 0.985WB1.S 100.00% 55.21 117.785f 1.438s 1.455 0.985Subtotals: 100.00% 110.43 117.785f 0.000 1.455 All Tanks Load
(%) Weight (MT)
LCG (m)
TCG (m)
VCG (m)
Perm
Totals: 1,157.46 74.294f 0.000 1.794

244
Tank Capacities for JP1.P containing DIESEL OIL (0.850)
Trim: 0.00 deg., No Heel Ref Ht (m)
Load (%)
Volume (m3)
Weight (MT)
Lcg (m)
Tcg (m)
Vcg (m)
Fsm (m-MT)
0.82 10.00% 7.86 6.68 35.409f 1.163p 0.635 19.52 1.04 20.00% 15.73 13.37 34.551f 1.359p 0.787 37.77 1.21 30.00% 23.59 20.05 33.975f 1.488p 0.902 54.28 1.36 40.00% 31.45 26.74 33.533f 1.586p 0.998 70.72 1.49 50.00% 39.32 33.42 33.173f 1.667p 1.083 87.31 1.60 60.00% 47.18 40.10 32.864f 1.736p 1.160 102.38 1.71 70.00% 55.04 46.79 32.599f 1.798p 1.231 115.07 1.81 80.00% 62.91 53.47 32.377f 1.855p 1.297 127.09 1.91 90.00% 70.77 60.15 32.191f 1.908p 1.359 138.97 1.98 98.00% 77.06 65.50 32.063f 1.948p 1.407 148.43
100.00% 78.63 66.84 32.033f 1.958p 1.419
Reference Point
Part Long.(m) Trans.(m) Vert.(m) JP1.P 0.000 0.000 0.000
Tank CharacteristicsVolume m^3
Ref Ht
10.0 20.0 30.0 40.0 50.0 60.0 70.0 80.0
0.5
1.0Volume m^3Weight MTFSM m-MTVCG mRef. Ht.m
Weight MT x 10 0.0 1.0 2.0 3.0 4.0 5.0 6.0 7.0FSM m-MT x 100 0.0 1.0
VCG m x 1 0.0 1.0 2.0Ref. Ht.m x 1 1.0 2.0

245
Tank Capacities for JP2.P containing DIESEL OIL (0.850)
Trim: 0.00 deg., No Heel
Ref Ht (m)
Load (%)
Volume (m3)
Weight (MT)
Lcg (m)
Tcg (m)
Vcg (m)
Fsm (m-MT)
0.26 10.00% 4.80 4.08 49.951f 0.797p 0.169 11.44 0.37 20.00% 9.60 8.16 49.279f 0.984p 0.243 21.65 0.47 30.00% 14.40 12.24 48.966f 1.112p 0.303 30.65 0.56 40.00% 19.21 16.33 48.792f 1.213p 0.357 40.11 0.65 50.00% 24.01 20.41 48.683f 1.299p 0.407 50.36 0.72 60.00% 28.81 24.49 48.606f 1.377p 0.453 60.12 0.80 70.00% 33.61 28.57 48.542f 1.445p 0.497 68.21 0.87 80.00% 38.41 32.65 48.491f 1.505p 0.539 75.88 0.93 90.00% 43.21 36.73 48.450f 1.559p 0.579 83.55 0.99 98.00% 47.05 40.00 48.422f 1.599p 0.610 89.86
100.00% 48.01 40.81 48.417f 1.609p 0.618
Reference Point
Part Long.(m) Trans.(m) Vert.(m) JP2.P 0.000 0.000 0.000
Tank CharacteristicsVolume m^3
Ref Ht
0.0 10.0 20.0 30.0 40.0 50.0
0.5
1.0Volume m^3Weight MTFSM m-MTVCG mRef. Ht.m
Weight MT x 10 0.0 1.0 2.0 3.0 4.0FSM m-MT x 100 0.0 0.5 1.0
VCG m x 1 -0.5 0.0 0.5 1.0Ref. Ht.m x 1 0.0 1.0

246
Tank Capacities for JP3.P containing DIESEL OIL (0.850)
Trim: 0.00 deg., No Heel
Ref Ht (m)
Load (%)
Volume (m3)
Weight (MT)
Lcg (m)
Tcg (m)
Vcg (m)
Fsm (m-MT)
0.22 10.00% 5.17 4.40 65.997f 0.783p 0.135 11.29 0.34 20.00% 10.34 8.79 65.998f 0.993p 0.209 22.84 0.45 30.00% 15.51 13.19 65.999f 1.127p 0.270 32.14 0.54 40.00% 20.68 17.58 65.999f 1.232p 0.326 42.43 0.63 50.00% 25.86 21.98 65.999f 1.322p 0.378 53.64 0.71 60.00% 31.03 26.37 65.999f 1.403p 0.426 64.09 0.79 70.00% 36.20 30.77 65.999f 1.473p 0.472 71.87 0.86 80.00% 41.37 35.16 65.999f 1.534p 0.515 79.95 0.93 90.00% 46.54 39.56 65.999f 1.589p 0.558 88.31 0.99 98.00% 50.68 43.08 65.999f 1.630p 0.590 95.19
100.00% 51.71 43.96 66.000f 1.640p 0.598
Reference Point
Part Long.(m) Trans.(m) Vert.(m) JP3.P 0.000 0.000 0.000
Tank CharacteristicsVolume m^3
Ref Ht
10.0 20.0 30.0 40.0 50.0
0.5
1.0Volume m^3Weight MTFSM m-MTVCG mRef. Ht.m
Weight MT x 10 0.0 1.0 2.0 3.0 4.0 5.0FSM m-MT x 100 0.0 0.5 1.0
VCG m x 1 0.0 1.0Ref. Ht.m x 1 0.0 1.0

247
Tank Capacities for JP4.P containing DIESEL OIL (0.850)
Trim: 0.00 deg., No Heel
Ref Ht (m)
Load (%)
Volume (m3)
Weight (MT)
Lcg (m)
Tcg (m)
Vcg (m)
Fsm (m-MT)
0.42 10.00% 14.03 11.92 83.978f 1.092p 0.254 29.34 0.66 20.00% 28.05 23.84 83.985f 1.357p 0.399 58.64 0.87 30.00% 42.08 35.77 83.989f 1.541p 0.522 81.03 1.06 40.00% 56.10 47.69 83.990f 1.680p 0.633 104.42 1.23 50.00% 70.13 59.61 83.992f 1.797p 0.736 129.70 1.40 60.00% 84.16 71.53 83.992f 1.897p 0.832 147.46 1.56 70.00% 98.18 83.46 83.993f 1.983p 0.924 165.16 1.71 80.00% 112.21 95.38 83.994f 2.058p 1.013 183.53 1.86 90.00% 126.23 107.30 83.994f 2.127p 1.099 202.52 1.97 98.00% 137.45 116.84 83.994f 2.179p 1.165 217.99
100.00% 140.26 119.22 83.995f 2.191p 1.182
Reference Point
Part Long.(m) Trans.(m) Vert.(m) JP4.P 0.000 0.000 0.000
Tank CharacteristicsVolume m^3
Ref Ht
0.0 50.0 100.0 150.0
0.5
1.0Volume m^3Weight MTFSM m-MTVCG mRef. Ht.m
Weight MT x 100 0.0 0.5 1.0FSM m-MT x 100 0.0 1.0 2.0
VCG m x 1 0.0 1.0 2.0Ref. Ht.m x 1 0.0 1.0 2.0

248
Tank Capacities for FW1.P containing FRESH WATER (1.000)
Trim: 0.00 deg., No Heel
Ref Ht (m)
Load (%)
Volume (m3)
Weight (MT)
Lcg (m)
Tcg (m)
Vcg (m)
Fsm (m-MT)
0.52 10.00% 11.35 11.35 100.189f 1.048p 0.353 27.59 0.75 20.00% 22.71 22.71 100.788f 1.279p 0.495 52.54 0.95 30.00% 34.06 34.06 101.041f 1.444p 0.613 73.38 1.12 40.00% 45.42 45.42 101.187f 1.571p 0.718 93.83 1.29 50.00% 56.77 56.77 101.278f 1.678p 0.815 115.56 1.44 60.00% 68.13 68.13 101.346f 1.771p 0.907 133.58 1.59 70.00% 79.48 79.48 101.400f 1.851p 0.993 149.68 1.73 80.00% 90.84 90.84 101.442f 1.922p 1.077 165.87 1.87 90.00% 102.19 102.19 101.476f 1.987p 1.157 182.61 1.98 98.00% 111.28 111.28 101.498f 2.035p 1.219 196.38
100.00% 113.55 113.55 101.504f 2.046p 1.235
Reference Point
Part Long.(m) Trans.(m) Vert.(m) FW1.P 0.000 0.000 0.000
Tank CharacteristicsVolume m^3
Ref Ht
0.0 50.0 100.0
0.5
1.0Volume m^3Weight MTFSM m-MTVCG mRef. Ht.m
Weight MT x 100 0.0 0.5 1.0FSM m-MT x 100 0.0 1.0 2.0
VCG m x 1 0.0 1.0 2.0Ref. Ht.m x 1 0.0 1.0 2.0

249
Tank Capacities for WB1.P containing WATER BALLAST (1.025)
Trim: 0.00 deg., No Heel
Ref Ht (m)
Load (%)
Volume (m3)
Weight (MT)
Lcg (m)
Tcg (m)
Vcg (m)
Fsm (m-MT)
0.91 10.00% 5.39 5.52 114.566f 0.879p 0.744 10.89 1.11 20.00% 10.77 11.04 115.493f 1.009p 0.880 21.20 1.26 30.00% 16.16 16.56 116.113f 1.094p 0.983 30.28 1.39 40.00% 21.55 22.09 116.576f 1.159p 1.069 38.22 1.51 50.00% 26.93 27.61 116.914f 1.215p 1.146 45.75 1.62 60.00% 32.32 33.13 117.170f 1.267p 1.216 53.28 1.72 70.00% 37.71 38.65 117.370f 1.315p 1.280 60.14 1.82 80.00% 43.09 44.17 117.533f 1.359p 1.342 66.53 1.91 90.00% 48.48 49.69 117.669f 1.400p 1.400 72.70 1.98 98.00% 52.79 54.11 117.762f 1.431p 1.444 77.58
100.00% 53.87 55.21 117.785f 1.438p 1.455
Reference Point
Part Long.(m) Trans.(m) Vert.(m) WB1.P 0.000 0.000 0.000
Tank CharacteristicsVolume m^3
Ref Ht
10.0 20.0 30.0 40.0 50.0
0.5
1.0Volume m^3Weight MTFSM m-MTVCG mRef. Ht.m
Weight MT x 10 0.0 1.0 2.0 3.0 4.0 5.0 6.0FSM m-MT x 100 0.0 0.5
VCG m x 1 0.0 1.0 2.0Ref. Ht.m x 1 1.0 2.0

250
Tank Capacities for DS1.P containing DIESEL OIL (0.850)
Trim: 0.00 deg., No Heel
Ref Ht (m)
Load (%)
Volume (m3)
Weight (MT)
Lcg (m)
Tcg (m)
Vcg (m)
Fsm (m-MT)
2.81 10.00% 8.17 6.94 48.086f 5.275p 2.658 5.52 3.09 20.00% 16.34 13.89 48.065f 5.317p 2.804 6.74 3.35 30.00% 24.50 20.83 48.054f 5.348p 2.942 7.87 3.60 40.00% 32.67 27.77 48.048f 5.375p 3.076 9.06 3.84 50.00% 40.84 34.71 48.042f 5.399p 3.204 9.98 4.08 60.00% 49.01 41.66 48.036f 5.419p 3.330 10.22 4.31 70.00% 57.18 48.60 48.031f 5.433p 3.453 10.47 4.54 80.00% 65.34 55.54 48.028f 5.445p 3.574 10.71 4.77 90.00% 73.51 62.49 48.025f 5.456p 3.694 10.88 4.95 98.00% 80.05 68.04 48.023f 5.463p 3.790 10.88
100.00% 81.68 69.43 48.023f 5.464p 3.813
Reference Point
Part Long.(m) Trans.(m) Vert.(m) DS1.P 0.000 0.000 0.000
Tank CharacteristicsVolume m^3
Ref Ht
10.0 20.0 30.0 40.0 50.0 60.0 70.0 80.0
0.5
1.0Volume m^3Weight MTFSM m-MTVCG mRef. Ht.m
Weight MT x 10 0.0 1.0 2.0 3.0 4.0 5.0 6.0 7.0 8.0FSM m-MT x 10 0.0 0.5 1.0
VCG m x 1 2.0 3.0 4.0Ref. Ht.m x 1 2.0 3.0 4.0 5.0 6.0

251
Tank Capacities for DS2.P containing DIESEL OIL (0.850)
Trim: 0.00 deg., No Heel
Ref Ht (m)
Load (%)
Volume (m3)
Weight (MT)
Lcg (m)
Tcg (m)
Vcg (m)
Fsm (m-MT)
2.81 10.00% 8.20 6.97 65.999f 5.286p 2.656 5.73 3.08 20.00% 16.40 13.94 65.999f 5.326p 2.801 6.84 3.35 30.00% 24.61 20.91 65.999f 5.355p 2.939 7.98 3.60 40.00% 32.81 27.89 66.000f 5.382p 3.072 9.17 3.84 50.00% 41.01 34.86 66.000f 5.405p 3.201 10.00 4.07 60.00% 49.21 41.83 66.000f 5.424p 3.326 10.25 4.31 70.00% 57.41 48.80 66.000f 5.438p 3.449 10.49 4.54 80.00% 65.61 55.77 66.000f 5.449p 3.571 10.73 4.77 90.00% 73.82 62.74 66.000f 5.459p 3.691 10.88 4.95 98.00% 80.38 68.32 66.000f 5.466p 3.787 10.88
100.00% 82.02 69.72 66.000f 5.467p 3.810
Reference Point
Part Long.(m) Trans.(m) Vert.(m) DS2.P 0.000 0.000 0.000
Tank CharacteristicsVolume m^3
Ref Ht
10.0 20.0 30.0 40.0 50.0 60.0 70.0 80.0
0.5
1.0Volume m^3Weight MTFSM m-MTVCG mRef. Ht.m
Weight MT x 10 0.0 1.0 2.0 3.0 4.0 5.0 6.0 7.0 8.0FSM m-MT x 10 0.0 0.5 1.0
VCG m x 1 2.0 3.0 4.0Ref. Ht.m x 1 2.0 3.0 4.0 5.0 6.0

252
Tank Capacities for JP1.S containing DIESEL OIL (0.850)
Trim: 0.00 deg., No Heel
Ref Ht (m)
Load (%)
Volume (m3)
Weight (MT)
Lcg (m)
Tcg (m)
Vcg (m)
Fsm (m-MT)
0.82 10.00% 7.86 6.68 35.409f 1.163s 0.635 19.52 1.04 20.00% 15.73 13.37 34.551f 1.359s 0.787 37.77 1.21 30.00% 23.59 20.05 33.975f 1.488s 0.902 54.28 1.36 40.00% 31.45 26.74 33.533f 1.586s 0.998 70.72 1.49 50.00% 39.32 33.42 33.173f 1.667s 1.083 87.31 1.60 60.00% 47.18 40.10 32.864f 1.736s 1.160 102.38 1.71 70.00% 55.04 46.79 32.599f 1.798s 1.231 115.07 1.81 80.00% 62.91 53.47 32.377f 1.855s 1.297 127.09 1.91 90.00% 70.77 60.15 32.191f 1.908s 1.359 138.97 1.98 98.00% 77.06 65.50 32.063f 1.948s 1.407 148.43
100.00% 78.63 66.84 32.033f 1.958s 1.419
Reference Point
Part Long.(m) Trans.(m) Vert.(m) JP1.S 0.000 0.000 0.000
Tank CharacteristicsVolume m^3
Ref Ht
10.0 20.0 30.0 40.0 50.0 60.0 70.0 80.0
0.5
1.0Volume m^3Weight MTFSM m-MTVCG mRef. Ht.m
Weight MT x 10 0.0 1.0 2.0 3.0 4.0 5.0 6.0 7.0FSM m-MT x 100 0.0 1.0
VCG m x 1 0.0 1.0 2.0Ref. Ht.m x 1 1.0 2.0
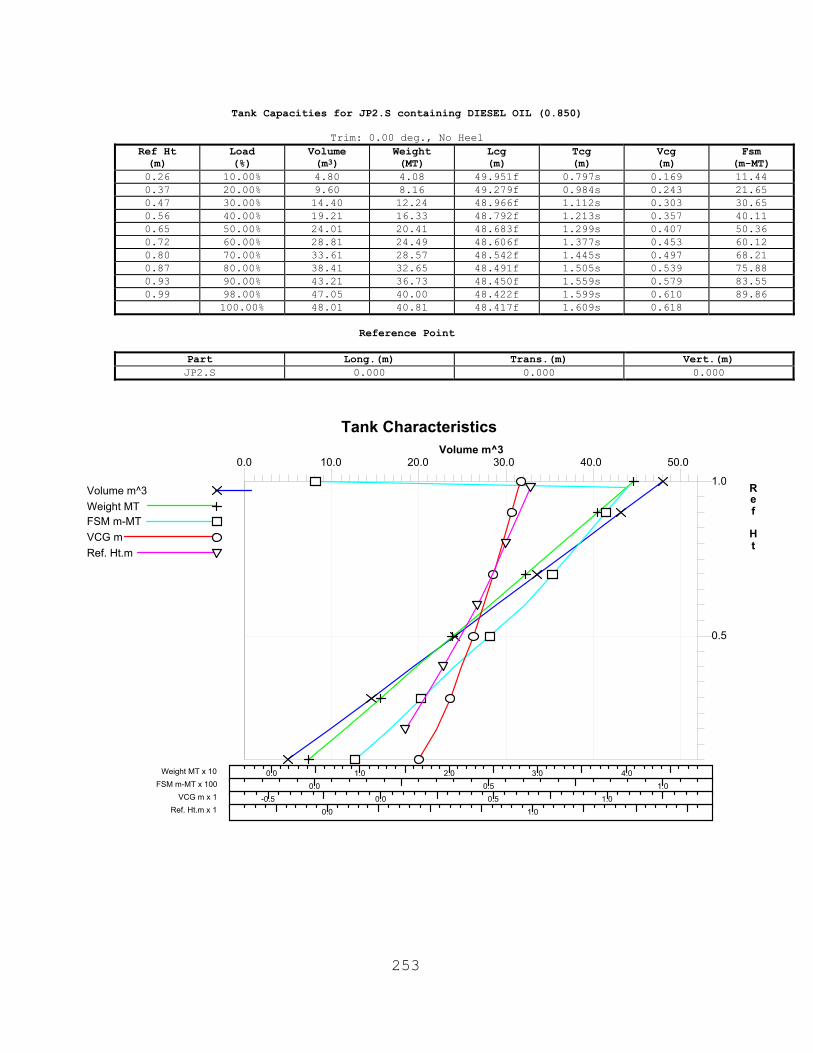
253
Tank Capacities for JP2.S containing DIESEL OIL (0.850)
Trim: 0.00 deg., No Heel
Ref Ht (m)
Load (%)
Volume (m3)
Weight (MT)
Lcg (m)
Tcg (m)
Vcg (m)
Fsm (m-MT)
0.26 10.00% 4.80 4.08 49.951f 0.797s 0.169 11.44 0.37 20.00% 9.60 8.16 49.279f 0.984s 0.243 21.65 0.47 30.00% 14.40 12.24 48.966f 1.112s 0.303 30.65 0.56 40.00% 19.21 16.33 48.792f 1.213s 0.357 40.11 0.65 50.00% 24.01 20.41 48.683f 1.299s 0.407 50.36 0.72 60.00% 28.81 24.49 48.606f 1.377s 0.453 60.12 0.80 70.00% 33.61 28.57 48.542f 1.445s 0.497 68.21 0.87 80.00% 38.41 32.65 48.491f 1.505s 0.539 75.88 0.93 90.00% 43.21 36.73 48.450f 1.559s 0.579 83.55 0.99 98.00% 47.05 40.00 48.422f 1.599s 0.610 89.86
100.00% 48.01 40.81 48.417f 1.609s 0.618
Reference Point
Part Long.(m) Trans.(m) Vert.(m) JP2.S 0.000 0.000 0.000
Tank CharacteristicsVolume m^3
Ref Ht
0.0 10.0 20.0 30.0 40.0 50.0
0.5
1.0Volume m^3Weight MTFSM m-MTVCG mRef. Ht.m
Weight MT x 10 0.0 1.0 2.0 3.0 4.0FSM m-MT x 100 0.0 0.5 1.0
VCG m x 1 -0.5 0.0 0.5 1.0Ref. Ht.m x 1 0.0 1.0

254
Tank Capacities for JP3.S containing DIESEL OIL (0.850)
Trim: 0.00 deg., No Heel
Ref Ht (m)
Load (%)
Volume (m3)
Weight (MT)
Lcg (m)
Tcg (m)
Vcg (m)
Fsm (m-MT)
0.22 10.00% 5.17 4.40 65.997f 0.783s 0.135 11.29 0.34 20.00% 10.34 8.79 65.998f 0.993s 0.209 22.84 0.45 30.00% 15.51 13.19 65.999f 1.127s 0.270 32.14 0.54 40.00% 20.68 17.58 65.999f 1.232s 0.326 42.43 0.63 50.00% 25.86 21.98 65.999f 1.322s 0.378 53.64 0.71 60.00% 31.03 26.37 65.999f 1.403s 0.426 64.09 0.79 70.00% 36.20 30.77 65.999f 1.473s 0.472 71.87 0.86 80.00% 41.37 35.16 65.999f 1.534s 0.515 79.95 0.93 90.00% 46.54 39.56 65.999f 1.589s 0.558 88.31 0.99 98.00% 50.68 43.08 65.999f 1.630s 0.590 95.19
100.00% 51.71 43.96 66.000f 1.640s 0.598
Reference Point
Part Long.(m) Trans.(m) Vert.(m) JP3.S 0.000 0.000 0.000
Tank CharacteristicsVolume m^3
Ref Ht
10.0 20.0 30.0 40.0 50.0
0.5
1.0Volume m^3Weight MTFSM m-MTVCG mRef. Ht.m
Weight MT x 10 0.0 1.0 2.0 3.0 4.0 5.0FSM m-MT x 100 0.0 0.5 1.0
VCG m x 1 0.0 1.0Ref. Ht.m x 1 0.0 1.0

255
Tank Capacities for JP4.S containing DIESEL OIL (0.850)
Trim: 0.00 deg., No Heel
Ref Ht (m)
Load (%)
Volume (m3)
Weight (MT)
Lcg (m)
Tcg (m)
Vcg (m)
Fsm (m-MT)
0.42 10.00% 14.03 11.92 83.978f 1.092s 0.254 29.34 0.66 20.00% 28.05 23.84 83.985f 1.357s 0.399 58.64 0.87 30.00% 42.08 35.77 83.989f 1.541s 0.522 81.03 1.06 40.00% 56.10 47.69 83.990f 1.680s 0.633 104.42 1.23 50.00% 70.13 59.61 83.992f 1.797s 0.736 129.70 1.40 60.00% 84.16 71.53 83.992f 1.897s 0.832 147.46 1.56 70.00% 98.18 83.46 83.993f 1.983s 0.924 165.16 1.71 80.00% 112.21 95.38 83.994f 2.058s 1.013 183.53 1.86 90.00% 126.23 107.30 83.994f 2.127s 1.099 202.52 1.97 98.00% 137.45 116.84 83.994f 2.179s 1.165 217.99
100.00% 140.26 119.22 83.995f 2.191s 1.182
Reference Point
Part Long.(m) Trans.(m) Vert.(m) JP4.S 0.000 0.000 0.000
Tank CharacteristicsVolume m^3
Ref Ht
0.0 50.0 100.0 150.0
0.5
1.0Volume m^3Weight MTFSM m-MTVCG mRef. Ht.m
Weight MT x 100 0.0 0.5 1.0FSM m-MT x 100 0.0 1.0 2.0
VCG m x 1 0.0 1.0 2.0Ref. Ht.m x 1 0.0 1.0 2.0

256
Tank Capacities for FW1.S containing FRESH WATER (1.000)
Trim: 0.00 deg., No Heel
Ref Ht (m)
Load (%)
Volume (m3)
Weight (MT)
Lcg (m)
Tcg (m)
Vcg (m)
Fsm (m-MT)
0.52 10.00% 11.35 11.35 100.189f 1.048s 0.353 27.59 0.75 20.00% 22.71 22.71 100.788f 1.279s 0.495 52.54 0.95 30.00% 34.06 34.06 101.041f 1.444s 0.613 73.38 1.12 40.00% 45.42 45.42 101.187f 1.571s 0.718 93.83 1.29 50.00% 56.77 56.77 101.278f 1.678s 0.815 115.56 1.44 60.00% 68.13 68.13 101.346f 1.771s 0.907 133.58 1.59 70.00% 79.48 79.48 101.400f 1.851s 0.993 149.68 1.73 80.00% 90.84 90.84 101.442f 1.922s 1.077 165.87 1.87 90.00% 102.19 102.19 101.476f 1.987s 1.157 182.61 1.98 98.00% 111.28 111.28 101.498f 2.035s 1.219 196.38
100.00% 113.55 113.55 101.504f 2.046s 1.235
Reference Point
Part Long.(m) Trans.(m) Vert.(m) FW1.S 0.000 0.000 0.000
Tank CharacteristicsVolume m^3
Ref Ht
0.0 50.0 100.0
0.5
1.0Volume m^3Weight MTFSM m-MTVCG mRef. Ht.m
Weight MT x 100 0.0 0.5 1.0FSM m-MT x 100 0.0 1.0 2.0
VCG m x 1 0.0 1.0 2.0Ref. Ht.m x 1 0.0 1.0 2.0

257
Tank Capacities for DS1.S containing DIESEL OIL (0.850)
Trim: 0.00 deg., No Heel
Ref Ht (m)
Load (%)
Volume (m3)
Weight (MT)
Lcg (m)
Tcg (m)
Vcg (m)
Fsm (m-MT)
2.81 10.00% 8.17 6.94 48.086f 5.275s 2.658 5.52 3.09 20.00% 16.34 13.89 48.065f 5.317s 2.804 6.74 3.35 30.00% 24.50 20.83 48.054f 5.348s 2.942 7.87 3.60 40.00% 32.67 27.77 48.048f 5.375s 3.076 9.06 3.84 50.00% 40.84 34.71 48.042f 5.399s 3.204 9.98 4.08 60.00% 49.01 41.66 48.036f 5.419s 3.330 10.22 4.31 70.00% 57.18 48.60 48.031f 5.433s 3.453 10.47 4.54 80.00% 65.34 55.54 48.028f 5.445s 3.574 10.71 4.77 90.00% 73.51 62.49 48.025f 5.456s 3.694 10.88 4.95 98.00% 80.05 68.04 48.023f 5.463s 3.790 10.88
100.00% 81.68 69.43 48.023f 5.464s 3.813
Reference Point
Part Long.(m) Trans.(m) Vert.(m) DS1.S 0.000 0.000 0.000
Tank CharacteristicsVolume m^3
Ref Ht
10.0 20.0 30.0 40.0 50.0 60.0 70.0 80.0
0.5
1.0Volume m^3Weight MTFSM m-MTVCG mRef. Ht.m
Weight MT x 10 0.0 1.0 2.0 3.0 4.0 5.0 6.0 7.0 8.0FSM m-MT x 10 0.0 0.5 1.0
VCG m x 1 2.0 3.0 4.0Ref. Ht.m x 1 2.0 3.0 4.0 5.0 6.0
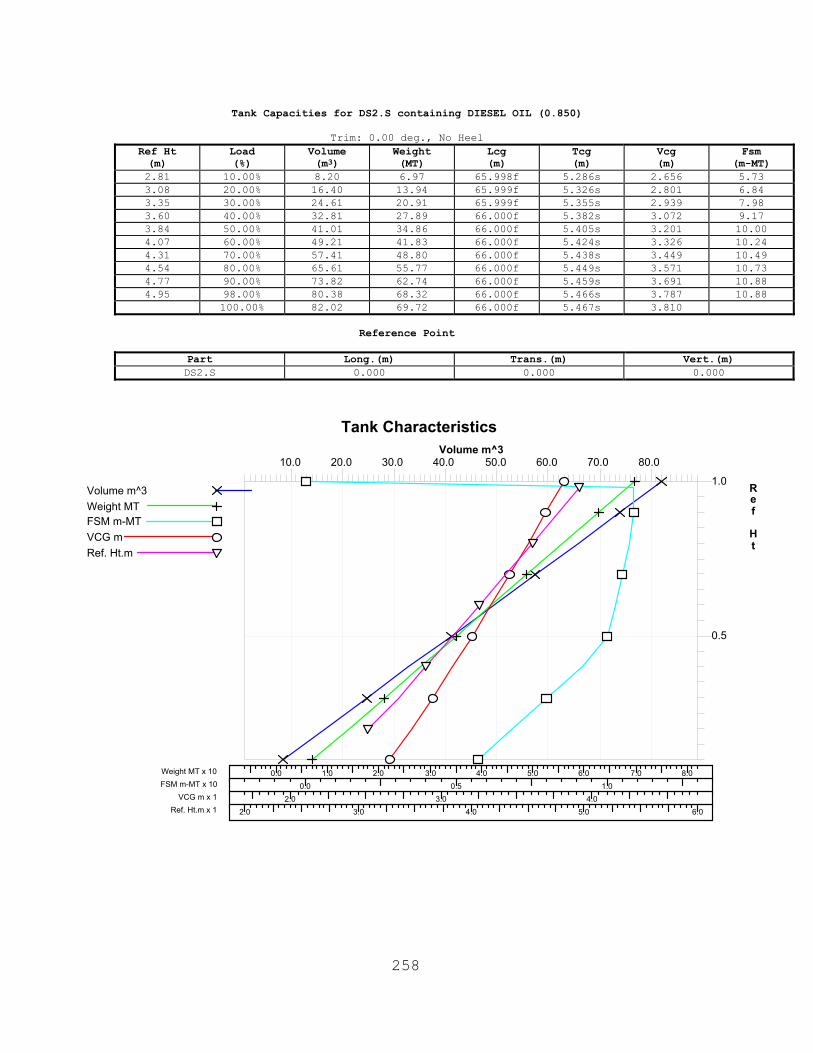
258
Tank Capacities for DS2.S containing DIESEL OIL (0.850)
Trim: 0.00 deg., No Heel
Ref Ht (m)
Load (%)
Volume (m3)
Weight (MT)
Lcg (m)
Tcg (m)
Vcg (m)
Fsm (m-MT)
2.81 10.00% 8.20 6.97 65.998f 5.286s 2.656 5.73 3.08 20.00% 16.40 13.94 65.999f 5.326s 2.801 6.84 3.35 30.00% 24.61 20.91 65.999f 5.355s 2.939 7.98 3.60 40.00% 32.81 27.89 66.000f 5.382s 3.072 9.17 3.84 50.00% 41.01 34.86 66.000f 5.405s 3.201 10.00 4.07 60.00% 49.21 41.83 66.000f 5.424s 3.326 10.24 4.31 70.00% 57.41 48.80 66.000f 5.438s 3.449 10.49 4.54 80.00% 65.61 55.77 66.000f 5.449s 3.571 10.73 4.77 90.00% 73.82 62.74 66.000f 5.459s 3.691 10.88 4.95 98.00% 80.38 68.32 66.000f 5.466s 3.787 10.88
100.00% 82.02 69.72 66.000f 5.467s 3.810
Reference Point
Part Long.(m) Trans.(m) Vert.(m) DS2.S 0.000 0.000 0.000
Tank CharacteristicsVolume m^3
Ref Ht
10.0 20.0 30.0 40.0 50.0 60.0 70.0 80.0
0.5
1.0Volume m^3Weight MTFSM m-MTVCG mRef. Ht.m
Weight MT x 10 0.0 1.0 2.0 3.0 4.0 5.0 6.0 7.0 8.0FSM m-MT x 10 0.0 0.5 1.0
VCG m x 1 2.0 3.0 4.0Ref. Ht.m x 1 2.0 3.0 4.0 5.0 6.0
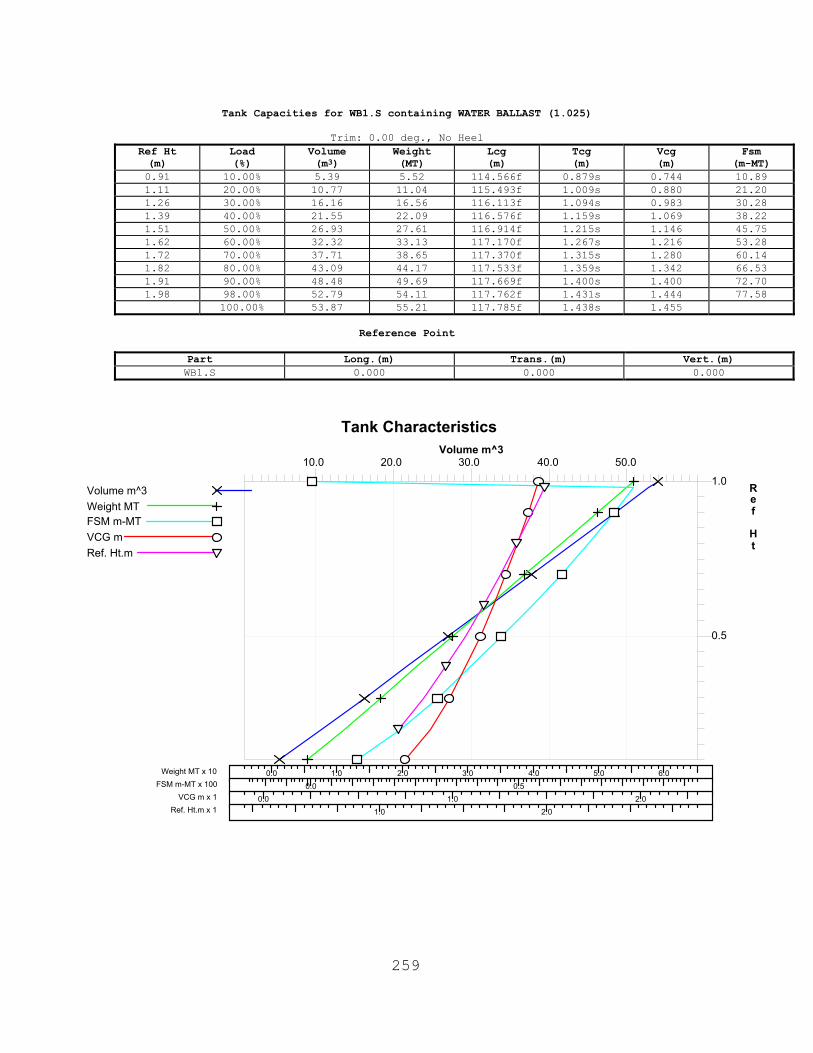
259
Tank Capacities for WB1.S containing WATER BALLAST (1.025)
Trim: 0.00 deg., No Heel
Ref Ht (m)
Load (%)
Volume (m3)
Weight (MT)
Lcg (m)
Tcg (m)
Vcg (m)
Fsm (m-MT)
0.91 10.00% 5.39 5.52 114.566f 0.879s 0.744 10.89 1.11 20.00% 10.77 11.04 115.493f 1.009s 0.880 21.20 1.26 30.00% 16.16 16.56 116.113f 1.094s 0.983 30.28 1.39 40.00% 21.55 22.09 116.576f 1.159s 1.069 38.22 1.51 50.00% 26.93 27.61 116.914f 1.215s 1.146 45.75 1.62 60.00% 32.32 33.13 117.170f 1.267s 1.216 53.28 1.72 70.00% 37.71 38.65 117.370f 1.315s 1.280 60.14 1.82 80.00% 43.09 44.17 117.533f 1.359s 1.342 66.53 1.91 90.00% 48.48 49.69 117.669f 1.400s 1.400 72.70 1.98 98.00% 52.79 54.11 117.762f 1.431s 1.444 77.58
100.00% 53.87 55.21 117.785f 1.438s 1.455
Reference Point
Part Long.(m) Trans.(m) Vert.(m) WB1.S 0.000 0.000 0.000
Tank CharacteristicsVolume m^3
Ref Ht
10.0 20.0 30.0 40.0 50.0
0.5
1.0Volume m^3Weight MTFSM m-MTVCG mRef. Ht.m
Weight MT x 10 0.0 1.0 2.0 3.0 4.0 5.0 6.0FSM m-MT x 100 0.0 0.5
VCG m x 1 0.0 1.0 2.0Ref. Ht.m x 1 1.0 2.0

260
Tank Capacities for WT1.C containing CE (0.950)
Trim: 0.00 deg., No Heel
Ref Ht (m)
Load (%)
Volume (m3)
Weight (MT)
Lcg (m)
Tcg (m)
Vcg (m)
Fsm (m-MT)
2.92 10.00% 45.81 43.52 17.464f 0.000 2.553 510.07 3.32 20.00% 91.63 87.05 16.051f 0.000 2.846 982.15 3.60 30.00% 137.44 130.57 14.913f 0.000 3.054 1,431.73 3.84 40.00% 183.26 174.10 14.088f 0.000 3.222 1,848.83 4.05 50.00% 229.07 217.62 13.518f 0.000 3.367 2,214.23 4.26 60.00% 274.89 261.15 13.102f 0.000 3.498 2,526.59 4.45 70.00% 320.70 304.67 12.784f 0.000 3.620 2,797.96 4.64 80.00% 366.52 348.19 12.533f 0.000 3.736 3,023.28 4.82 90.00% 412.33 391.72 12.330f 0.000 3.846 3,208.13 4.96 98.00% 448.98 426.54 12.192f 0.000 3.931 3,323.89
100.00% 458.15 435.24 12.161f 0.000 3.952
Reference Point
Part Long.(m) Trans.(m) Vert.(m) WT1.C 0.000 0.000 0.000
Tank CharacteristicsVolume m^3
Ref Ht
0.0 100.0 200.0 300.0 400.0 500.0
0.5
1.0Volume m^3Weight MTFSM m-MTVCG mRef. Ht.m
Weight MT x 100 0.0 1.0 2.0 3.0 4.0 5.0FSM m-MT x 1000 0.0 1.0 2.0 3.0 4.0
VCG m x 1 2.0 3.0 4.0Ref. Ht.m x 1 3.0 4.0 5.0 6.0

261
Tank Capacities for WT2.C containing CE (0.950)
Trim: 0.00 deg., No Heel
Ref Ht (m)
Load (%)
Volume (m3)
Weight (MT)
Lcg (m)
Tcg (m)
Vcg (m)
Fsm (m-MT)
1.50 10.00% 77.52 73.64 33.136f 0.000 1.092 699.78 2.02 20.00% 155.04 147.29 32.001f 0.000 1.431 1,280.86 2.46 30.00% 232.55 220.93 31.478f 0.000 1.702 1,770.35 2.86 40.00% 310.07 294.57 31.173f 0.000 1.942 2,164.57 3.24 50.00% 387.59 368.21 30.973f 0.000 2.164 2,485.08 3.60 60.00% 465.11 441.86 30.829f 0.000 2.374 2,719.30 3.96 70.00% 542.63 515.50 30.721f 0.000 2.575 2,904.02 4.31 80.00% 620.14 589.14 30.635f 0.000 2.770 3,004.84 4.66 90.00% 697.66 662.78 30.566f 0.000 2.960 3,051.63 4.93 98.00% 759.68 721.70 30.521f 0.000 3.110 3,075.58
100.00% 775.18 736.43 30.510f 0.000 3.147
Reference Point
Part Long.(m) Trans.(m) Vert.(m) WT2.C 0.000 0.000 0.000
Tank CharacteristicsVolume m^3
Ref Ht
100.0 200.0 300.0 400.0 500.0 600.0 700.0 800.0
0.5
1.0Volume m^3Weight MTFSM m-MTVCG mRef. Ht.m
Weight MT x 100 0.0 1.0 2.0 3.0 4.0 5.0 6.0 7.0 8.0FSM m-MT x 1000 0.0 1.0 2.0 3.0
VCG m x 1 1.0 2.0 3.0Ref. Ht.m x 1 2.0 3.0 4.0 5.0

262
Tank Capacities for WT3.C containing CE (0.950)
Trim: 0.00 deg., No Heel
Ref Ht (m)
Load (%)
Volume (m3)
Weight (MT)
Lcg (m)
Tcg (m)
Vcg (m)
Fsm (m-MT)
0.99 10.00% 90.80 86.26 48.422f 0.000 0.610 773.94 1.56 20.00% 181.60 172.52 48.252f 0.000 0.946 1,387.53 2.06 30.00% 272.40 258.79 48.184f 0.000 1.235 1,913.28 2.52 40.00% 363.21 345.05 48.144f 0.000 1.499 2,276.50 2.95 50.00% 454.01 431.31 48.119f 0.000 1.746 2,609.98 3.37 60.00% 544.81 517.57 48.101f 0.000 1.982 2,805.03 3.79 70.00% 635.61 603.83 48.088f 0.000 2.210 2,994.00 4.19 80.00% 726.41 690.10 48.077f 0.000 2.433 3,035.25 4.60 90.00% 817.21 776.36 48.069f 0.000 2.651 3,074.17 4.92 98.00% 889.86 845.37 48.063f 0.000 2.823 3,083.69
100.00% 908.02 862.62 48.062f 0.000 2.865
Reference Point
Part Long.(m) Trans.(m) Vert.(m) WT3.C 0.000 0.000 0.000
Tank CharacteristicsVolume m^3
Ref Ht
100.0 200.0 300.0 400.0 500.0 600.0 700.0 800.0 900.0
0.5
1.0Volume m^3Weight MTFSM m-MTVCG mRef. Ht.m
Weight MT x 1000 0.0 0.5 1.0FSM m-MT x 1000 0.0 1.0 2.0 3.0
VCG m x 1 1.0 2.0 3.0Ref. Ht.m x 1 1.0 2.0 3.0 4.0 5.0

263
Tank Capacities for WT4.C containing CE (0.950)
Trim: 0.00 deg., No Heel
Ref Ht (m)
Load (%)
Volume (m3)
Weight (MT)
Lcg (m)
Tcg (m)
Vcg (m)
Fsm (m-MT)
0.95 10.00% 91.83 87.24 65.999f 0.000 0.566 776.61 1.52 20.00% 183.66 174.48 66.000f 0.000 0.905 1,392.13 2.03 30.00% 275.50 261.72 66.000f 0.000 1.196 1,920.47 2.49 40.00% 367.33 348.97 66.000f 0.000 1.462 2,283.05 2.93 50.00% 459.16 436.21 66.000f 0.000 1.711 2,614.21 3.36 60.00% 551.00 523.45 66.000f 0.000 1.950 2,810.21 3.77 70.00% 642.83 610.69 66.000f 0.000 2.181 2,997.68 4.18 80.00% 734.66 697.93 66.000f 0.000 2.405 3,036.60 4.59 90.00% 826.49 785.17 66.000f 0.000 2.625 3,075.70 4.92 98.00% 899.96 854.97 66.000f 0.000 2.799 3,083.69
100.00% 918.33 872.42 66.000f 0.000 2.842
Reference Point
Part Long.(m) Trans.(m) Vert.(m) WT4.C 0.000 0.000 0.000
Tank CharacteristicsVolume m^3
Ref Ht
100.0 200.0 300.0 400.0 500.0 600.0 700.0 800.0 900.0 1000.0
0.5
1.0Volume m^3Weight MTFSM m-MTVCG mRef. Ht.m
Weight MT x 1000 0.0 1.0FSM m-MT x 1000 0.0 1.0 2.0 3.0
VCG m x 1 1.0 2.0 3.0Ref. Ht.m x 1 1.0 2.0 3.0 4.0 5.0

264
Tank Capacities for WT5.C containing CE (0.950)
Trim: 0.00 deg., No Heel
Ref Ht (m)
Load (%)
Volume (m3)
Weight (MT)
Lcg (m)
Tcg (m)
Vcg (m)
Fsm (m-MT)
0.95 10.00% 91.80 87.21 83.990f 0.000 0.567 776.03 1.52 20.00% 183.60 174.42 83.993f 0.000 0.905 1,391.14 2.03 30.00% 275.41 261.64 83.994f 0.000 1.196 1,919.18 2.49 40.00% 367.21 348.85 83.995f 0.000 1.462 2,281.62 2.93 50.00% 459.01 436.06 83.996f 0.000 1.712 2,612.71 3.36 60.00% 550.81 523.28 83.996f 0.000 1.951 2,808.67 3.77 70.00% 642.62 610.49 83.996f 0.000 2.181 2,996.22 4.18 80.00% 734.42 697.70 83.997f 0.000 2.406 3,035.28 4.59 90.00% 826.22 784.91 83.997f 0.000 2.626 3,074.51 4.92 98.00% 899.66 854.68 83.997f 0.000 2.800 3,082.63
100.00% 918.02 872.13 83.997f 0.000 2.843
Reference Point
Part Long.(m) Trans.(m) Vert.(m) WT5.C 0.000 0.000 0.000
Tank CharacteristicsVolume m^3
Ref Ht
100.0 200.0 300.0 400.0 500.0 600.0 700.0 800.0 900.0 1000.0
0.5
1.0Volume m^3Weight MTFSM m-MTVCG mRef. Ht.m
Weight MT x 1000 0.0 1.0FSM m-MT x 1000 0.0 1.0 2.0 3.0
VCG m x 1 1.0 2.0 3.0Ref. Ht.m x 1 1.0 2.0 3.0 4.0 5.0
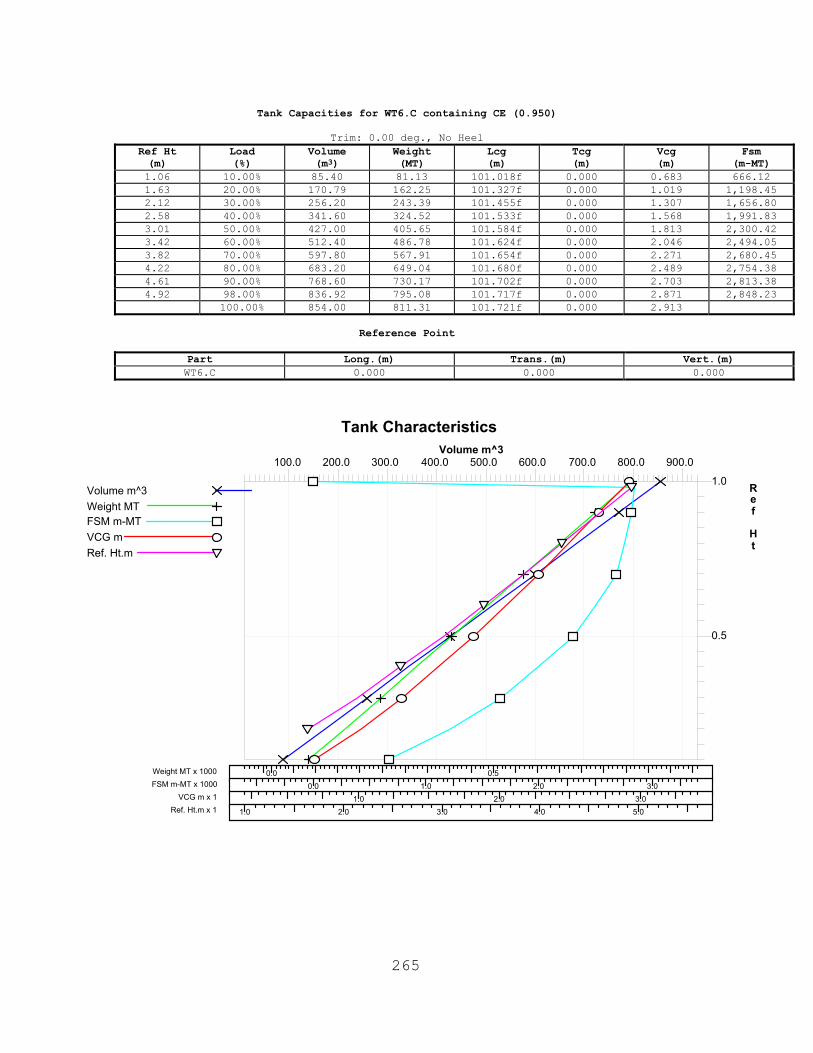
265
Tank Capacities for WT6.C containing CE (0.950)
Trim: 0.00 deg., No Heel
Ref Ht (m)
Load (%)
Volume (m3)
Weight (MT)
Lcg (m)
Tcg (m)
Vcg (m)
Fsm (m-MT)
1.06 10.00% 85.40 81.13 101.018f 0.000 0.683 666.12 1.63 20.00% 170.79 162.25 101.327f 0.000 1.019 1,198.45 2.12 30.00% 256.20 243.39 101.455f 0.000 1.307 1,656.80 2.58 40.00% 341.60 324.52 101.533f 0.000 1.568 1,991.83 3.01 50.00% 427.00 405.65 101.584f 0.000 1.813 2,300.42 3.42 60.00% 512.40 486.78 101.624f 0.000 2.046 2,494.05 3.82 70.00% 597.80 567.91 101.654f 0.000 2.271 2,680.45 4.22 80.00% 683.20 649.04 101.680f 0.000 2.489 2,754.38 4.61 90.00% 768.60 730.17 101.702f 0.000 2.703 2,813.38 4.92 98.00% 836.92 795.08 101.717f 0.000 2.871 2,848.23
100.00% 854.00 811.31 101.721f 0.000 2.913
Reference Point
Part Long.(m) Trans.(m) Vert.(m) WT6.C 0.000 0.000 0.000
Tank CharacteristicsVolume m^3
Ref Ht
100.0 200.0 300.0 400.0 500.0 600.0 700.0 800.0 900.0
0.5
1.0Volume m^3Weight MTFSM m-MTVCG mRef. Ht.m
Weight MT x 1000 0.0 0.5FSM m-MT x 1000 0.0 1.0 2.0 3.0
VCG m x 1 1.0 2.0 3.0Ref. Ht.m x 1 1.0 2.0 3.0 4.0 5.0

266
Tank Capacities for WT7.C containing CE (0.950)
Trim: 0.00 deg., No Heel
Ref Ht (m)
Load (%)
Volume (m3)
Weight (MT)
Lcg (m)
Tcg (m)
Vcg (m)
Fsm (m-MT)
1.58 10.00% 58.52 55.59 117.084f 0.000 1.191 307.58 2.11 20.00% 117.03 111.18 117.907f 0.000 1.523 559.60 2.56 30.00% 175.55 166.77 118.275f 0.000 1.794 791.56 2.96 40.00% 234.06 222.36 118.497f 0.000 2.036 993.02 3.34 50.00% 292.58 277.95 118.650f 0.000 2.258 1,182.10 3.69 60.00% 351.09 333.54 118.765f 0.000 2.468 1,339.93 4.03 70.00% 409.61 389.13 118.857f 0.000 2.667 1,488.46 4.36 80.00% 468.12 444.72 118.932f 0.000 2.858 1,613.89 4.69 90.00% 526.64 500.31 118.997f 0.000 3.044 1,718.14 4.94 98.00% 573.45 544.78 119.043f 0.000 3.188 1,795.57
100.00% 585.15 555.90 119.054f 0.000 3.223
Reference Point
Part Long.(m) Trans.(m) Vert.(m) WT7.C 0.000 0.000 0.000
Tank CharacteristicsVolume m^3
Ref Ht
100.0 200.0 300.0 400.0 500.0 600.0
0.5
1.0Volume m^3Weight MTFSM m-MTVCG mRef. Ht.m
Weight MT x 100 0.0 1.0 2.0 3.0 4.0 5.0 6.0FSM m-MT x 1000 0.0 1.0 2.0
VCG m x 1 1.0 2.0 3.0Ref. Ht.m x 1 2.0 3.0 4.0 5.0

267
Tank Capacities for WT8.C containing CE (0.950)
Trim: 0.00 deg., No Heel
Ref Ht (m)
Load (%)
Volume (m3)
Weight (MT)
Lcg (m)
Tcg (m)
Vcg (m)
Fsm (m-MT)
2.54 10.00% 16.92 16.07 132.002f 0.000 2.158 35.48 3.01 20.00% 33.84 32.15 132.622f 0.000 2.472 71.58 3.36 30.00% 50.76 48.22 133.012f 0.000 2.711 108.16 3.67 40.00% 67.68 64.29 133.300f 0.000 2.913 143.95 3.93 50.00% 84.60 80.37 133.532f 0.000 3.090 179.65 4.18 60.00% 101.52 96.44 133.725f 0.000 3.251 215.69 4.40 70.00% 118.44 112.52 133.893f 0.000 3.400 250.57 4.61 80.00% 135.36 128.59 134.040f 0.000 3.539 284.91 4.81 90.00% 152.27 144.66 134.172f 0.000 3.669 319.27 4.97 98.00% 165.81 157.52 134.268f 0.000 3.769 346.85
100.00% 169.19 160.74 134.291f 0.000 3.793
Reference Point
Part Long.(m) Trans.(m) Vert.(m) WT8.C 0.000 0.000 0.000
Tank CharacteristicsVolume m^3
Ref Ht
0.0 50.0 100.0 150.0
0.5
1.0Volume m^3Weight MTFSM m-MTVCG mRef. Ht.m
Weight MT x 100 0.0 0.5 1.0 1.5FSM m-MT x 100 0.0 1.0 2.0 3.0 4.0
VCG m x 1 2.0 3.0 4.0Ref. Ht.m x 1 2.0 3.0 4.0 5.0 6.0

268
D. CROSS CURVES OF STABILITY
Righting Arms(heel) for VCG = 0.00 Trim zero at heel = 0 (RA Trim = 0)
Displ (MT) 5.000s 10.000s 15.000s 20.000s 25.000s 30.000s 35.000s 1000.000 0.761s 1.588s 3.309s 5.309s 7.068s 8.459s 9.466s 1250.000 0.742s 1.654s 3.360s 5.181s 6.793s 8.128s 9.164s 1500.000 0.726s 1.731s 3.394s 5.078s 6.580s 7.864s 8.916s 1750.000 0.714s 1.810s 3.417s 4.992s 6.409s 7.648s 8.714s 2000.000 0.712s 1.885s 3.432s 4.919s 6.268s 7.469s 8.546s 2250.000 0.726s 1.954s 3.439s 4.855s 6.150s 7.320s 8.406s 2500.000 0.754s 2.015s 3.443s 4.799s 6.050s 7.193s 8.290s 2750.000 0.792s 2.067s 3.444s 4.750s 5.964s 7.087s 8.192s 3000.000 0.836s 2.112s 3.443s 4.706s 5.890s 6.997s 8.110s 3250.000 0.883s 2.152s 3.441s 4.668s 5.825s 6.922s 8.041s 3500.000 0.933s 2.186s 3.438s 4.634s 5.768s 6.858s 7.983s 3750.000 0.984s 2.216s 3.435s 4.604s 5.718s 6.803s 7.933s 4000.000 1.033s 2.242s 3.431s 4.576s 5.672s 6.757s 7.891s 4250.000 1.080s 2.265s 3.427s 4.551s 5.631s 6.716s 7.856s 4500.000 1.124s 2.284s 3.424s 4.528s 5.596s 6.682s 7.828s 4750.000 1.164s 2.302s 3.420s 4.507s 5.564s 6.652s 7.807s 5000.000 1.202s 2.318s 3.417s 4.488s 5.536s 6.627s 7.793s
Displ (MT) 40.000s 45.000s 50.000s 55.000s 60.000s Arm Angle 1000.000 10.197s 10.915s 11.635s 12.299s 12.830s 1250.000 10.001s 10.790s 11.536s 12.227s 12.742s 1500.000 9.843s 10.697s 11.475s 12.170s 12.660s 1750.000 9.707s 10.622s 11.444s 12.133s 12.583s 2000.000 9.588s 10.555s 11.422s 12.104s 12.519s 2250.000 9.485s 10.496s 11.404s 12.079s 12.466s 2500.000 9.392s 10.448s 11.385s 12.055s 12.420s 2750.000 9.311s 10.403s 11.361s 12.029s 12.382s 3000.000 9.239s 10.360s 11.330s 11.998s 12.346s 3250.000 9.181s 10.317s 11.292s 11.961s 12.311s 3500.000 9.137s 10.277s 11.248s 11.917s 12.274s 3750.000 9.101s 10.239s 11.199s 11.867s 12.232s 4000.000 9.070s 10.203s 11.148s 11.809s 12.181s 4250.000 9.043s 10.169s 11.094s 11.746s 12.122s 4500.000 9.018s 10.135s 11.040s 11.678s 12.055s 4750.000 8.997s 10.102s 10.985s 11.608s 11.981s 5000.000 8.979s 10.068s 10.930s 11.535s 11.901s
Water Specific Gravity = 1.025.

269
Cross Curves
Displacement in Metric Tons
Arms in
m
1000.0 1500.0 2000.0 2500.0 3000.0
0.0
5.0
10.0
5
10
15
20
25
30
35
40
45
50
55
60
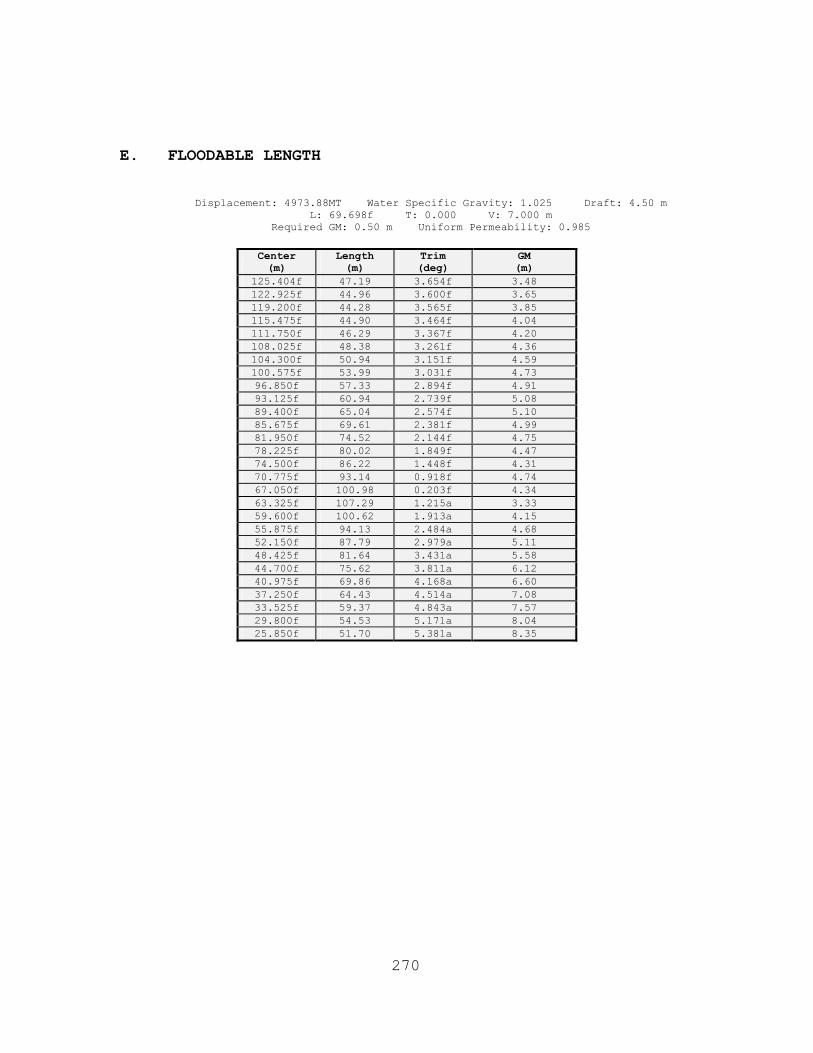
270
E. FLOODABLE LENGTH
Displacement: 4973.88MT Water Specific Gravity: 1.025 Draft: 4.50 m L: 69.698f T: 0.000 V: 7.000 m
Required GM: 0.50 m Uniform Permeability: 0.985
Center (m)
Length (m)
Trim (deg)
GM (m)
125.404f 47.19 3.654f 3.48 122.925f 44.96 3.600f 3.65 119.200f 44.28 3.565f 3.85 115.475f 44.90 3.464f 4.04 111.750f 46.29 3.367f 4.20 108.025f 48.38 3.261f 4.36 104.300f 50.94 3.151f 4.59 100.575f 53.99 3.031f 4.73 96.850f 57.33 2.894f 4.91 93.125f 60.94 2.739f 5.08 89.400f 65.04 2.574f 5.10 85.675f 69.61 2.381f 4.99 81.950f 74.52 2.144f 4.75 78.225f 80.02 1.849f 4.47 74.500f 86.22 1.448f 4.31 70.775f 93.14 0.918f 4.74 67.050f 100.98 0.203f 4.34 63.325f 107.29 1.215a 3.33 59.600f 100.62 1.913a 4.15 55.875f 94.13 2.484a 4.68 52.150f 87.79 2.979a 5.11 48.425f 81.64 3.431a 5.58 44.700f 75.62 3.811a 6.12 40.975f 69.86 4.168a 6.60 37.250f 64.43 4.514a 7.08 33.525f 59.37 4.843a 7.57 29.800f 54.53 5.171a 8.04 25.850f 51.70 5.381a 8.35

271
Floodable LengthsLocation
Length
m
0.0a 50.0f 100.0f 150.0f
0.0
50.0
100.0
Flood Length

272
Longitudinal Strength
Location (m)
Weight (MT)
Buoyancy (MT/m)
Shear (MT)
Bending (MT-m)
145.491f 0.000 0.000 0.00 0 145.000f 0.000 0.084 0.02 0 144.000f 0.000 0.523 0.32 0 143.000f 0.000 1.187 1.18 -1 142.000f 0.000 2.009 2.78 -3 141.000f 0.000 2.959 5.26 -7 140.000f 0.000 4.019 8.75 -14 139.000f 0.000 5.178 13.35 -25 138.000f 0.000 6.408 19.14 -41 137.500f 0.000 7.050 22.51 -51 137.500f 30.000 137.000f 30.000 7.691 11.20 -59 136.000f 30.000 9.015 -10.45 -60 136.000f 30.020 135.000f 30.091 10.365 -30.82 -39 134.000f 30.212 11.736 -49.91 2 133.000f 30.381 13.116 -67.79 60 132.000f 30.592 14.499 -84.47 137 131.000f 30.843 15.880 -100.00 229 130.000f 31.128 17.259 -114.41 336 129.000f 31.442 18.630 -127.75 458 128.000f 31.780 19.978 -140.06 591 127.000f 32.138 21.307 -151.37 737 126.000f 32.516 22.626 -161.73 894 125.000f 32.910 23.930 -171.17 1061 124.000f 33.311 25.193 -179.72 1236 123.000f 33.725 26.442 -187.42 1420 122.000f 34.151 27.677 -194.30 1611 121.000f 34.572 28.861 -200.39 1808 120.000f 35.001 30.035 -205.73 2011 119.000f 35.433 31.185 -210.34 2219 118.000f 35.860 32.292 -214.24 2432 117.000f 36.292 33.388 -217.48 2648 116.000f 36.716 34.438 -220.07 2866 115.000f 37.137 35.458 -222.05 3087 114.000f 37.557 36.457 -223.44 3310 113.000f 37.959 37.396 -224.27 3534 112.000f 38.362 38.321 -224.57 3759 111.000f 38.750 39.196 -224.37 3983 110.000f 39.126 40.035 -223.69 4207 109.000f 39.495 40.848 -222.56 4430 108.000f 39.841 41.600 -221.01 4652 107.000f 40.182 42.336 -219.05 4872 106.000f 40.499 43.013 -216.72 5090 105.000f 40.805 43.660 -214.03 5306 104.000f 41.095 44.269 -211.02 5518 103.000f 41.363 44.828 -207.70 5728 102.000f 41.623 45.367 -204.09 5933 101.000f 41.850 45.835 -200.23 6136 100.000f 42.069 46.285 -196.13 6334 99.000f 42.263 46.682 -191.81 6528 98.000f 42.440 47.043 -187.30 6717 97.000f 42.601 47.369 -182.61 6902 96.000f 42.734 47.641 -177.78 7083 95.000f 42.860 47.895 -172.80 7258 94.000f 42.949 48.078 -167.72 7428 93.000f 43.033 48.249 -162.55 7593 92.000f 43.087 48.360 -157.30 7753 91.000f 43.126 48.443 -152.01 7908 90.000f 43.144 48.483 -146.68 8057 89.000f 43.151 48.502 -141.34 8201

273
88.000f 43.151 48.508 -135.98 8340 87.000f 43.151 48.513 -130.62 8473 86.000f 43.151 48.518 -125.26 8601 85.000f 43.151 48.523 -119.89 8724 84.000f 43.151 48.529 -114.51 8841 83.000f 43.151 48.534 -109.13 8953 82.000f 43.151 48.539 -103.74 9059 81.000f 43.151 48.545 -98.35 9160 80.000f 43.151 48.550 -92.96 9256 79.000f 43.151 48.555 -87.55 9346 78.000f 43.151 48.560 -82.15 9431 77.000f 43.151 48.566 -76.74 9511 76.000f 43.151 48.571 -71.32 9585 75.000f 43.151 48.576 -65.89 9653 74.000f 43.151 48.582 -60.46 9716 73.000f 43.151 48.587 -55.03 9774 72.520f 43.151 48.590 -52.42 9800 72.000f 43.151 48.597 -49.59 9827 71.000f 43.151 48.637 -44.13 9873 70.000f 43.151 48.707 -38.60 9915 69.000f 43.151 48.801 -33.00 9951 68.000f 43.151 48.914 -27.29 9981 67.000f 43.151 49.042 -21.46 10005 66.000f 43.151 49.181 -15.50 10024 65.000f 43.151 49.324 -9.40 10036 64.000f 43.151 49.470 -3.16 10042 63.000f 43.151 49.615 3.24 10042 62.000f 43.151 49.756 9.77 10036 61.000f 43.151 49.890 16.45 10023 60.000f 43.151 50.014 23.25 10003 59.000f 43.151 50.128 30.17 9976 58.000f 43.151 50.229 37.19 9943 57.000f 43.151 50.317 44.32 9902 56.000f 43.151 50.392 51.52 9854 55.000f 43.151 50.460 58.80 9799 54.000f 43.149 50.524 66.14 9736 53.000f 43.147 50.583 73.54 9667 52.000f 43.128 50.616 81.01 9589 51.000f 43.099 50.630 88.51 9505 50.000f 43.064 50.631 96.06 9412 49.000f 42.998 50.586 103.64 9312 48.000f 42.933 50.537 111.24 9205 47.000f 42.837 50.440 118.84 9090 46.000f 42.732 50.326 126.44 8967 45.000f 42.607 50.179 134.02 8837 44.000f 42.461 49.997 141.58 8699 43.000f 42.304 49.793 149.09 8554 42.000f 42.114 49.538 156.54 8401 41.000f 41.917 49.267 163.93 8241 40.000f 41.682 48.935 171.23 8073 39.000f 41.440 48.589 178.43 7899 38.000f 41.153 48.172 185.52 7717 37.000f 40.863 47.742 192.47 7528 36.000f 40.523 47.234 199.26 7332 35.000f 40.172 46.702 205.88 7129 34.000f 39.778 46.101 212.31 6920 33.000f 39.359 45.455 218.52 6705 32.000f 38.906 44.748 224.49 6483 31.000f 38.413 43.968 230.18 6256 30.000f 37.902 43.146 235.58 6023 29.000f 37.324 42.210 240.65 5785 28.000f 36.723 41.218 245.34 5542 27.000f 36.085 40.147 249.62 5294 26.000f 35.383 38.950 253.43 5043 25.000f 34.646 37.665 256.72 4787

274
24.000f 33.878 36.276 259.43 4529 23.000f 33.065 34.738 261.47 4269 22.000f 32.239 33.081 262.73 4007 21.000f 31.500 31.445 263.12 3744 20.000f 30.868 29.860 262.59 3481 19.000f 30.370 28.328 261.06 3219 18.000f 30.043 26.851 258.45 2959 18.000f 30.000 17.000f 30.000 25.441 254.59 2702 16.000f 30.000 24.078 249.35 2450 15.000f 30.000 22.763 242.77 2204 14.000f 30.000 21.494 234.90 1965 13.000f 30.000 20.281 225.79 1735 12.000f 30.000 19.116 215.48 1514 11.000f 30.000 17.990 204.04 1304 10.000f 30.000 16.908 191.48 1106 9.000f 30.000 15.882 177.88 922 8.000f 30.000 14.897 163.27 751 7.000f 30.000 13.949 147.69 595 6.000f 30.000 13.044 131.19 456 5.000f 30.000 12.184 113.80 333 4.000f 30.000 11.359 95.57 229 3.000f 30.000 10.568 76.54 142 2.000f 30.000 9.828 56.74 76 1.000f 30.000 9.121 36.21 29 0.000 30.000 4.221 14.99 4 0.500a 30.000 0.000 0.00 0 0.500a 0.000
Max. Shear 263.12 MT At 21.000f Max. Bending Moment 10042 MT-m at 64.000f (Hogging)

275
Longitudinal Strength
<---Aft (Meters) Fwd--->
0.0a 50.0f 100.0f 150.0f
-100.0
-50.0
0.0
50.0
100.0
Weight x 1.0
Buoy. x 1.0
Shear x 3.5
B.M. x 130.0

276
F. INTACT STABILITY
HSV – Multihull Stability Criteria
1. Full Load - Departure
Floating Status
Draft FP 4.512 m Heel zero GM(Solid) 7.213 m Draft MS 4.503 m Equil Yes F/S Corr. 0.000 m Draft AP 4.494 m Wind 0.0 kn GM(Fluid) 7.213 m
Trim 0.02/145.00 Wave No KMT 14.841 m LCG 69.758f m VCG 7.628 m TPcm 18.66
Loading Summary
Item Weight
(MT) LCG (m)
TCG (m)
VCG (m)
Light Ship 2,888.60 74.500f 0.000 10.088 Deadweight 2,090.72 63.207f 0.000 4.229
Displacement 4,979.31 69.758f 0.000 7.628
Fluid Legend
Fluid Name Legend Weight
(MT) Load%
DIESEL OIL
819.94 100.00%
FRESH WATER
227.10 100.00%
WATER BALLAST
110.43 100.00%

277
Fixed Weight Status
Item Weight (MT)
LCG (m)
TCG (m)
VCG (m)
LIGHT SHIP 2,888.60 74.500f 0.000 10.088u LOWER DECK CARGO 600.00 45.000f 0.000 6.500u MISSION RELATED
EXPANDABLES 76.68 90.000f 0.000 5.000u
SHIP FORCES 17.36 74.500f 0.000 5.000u STORES 39.21 50.000f 0.000 5.000u
UPPER DECK CARGO 200.00 45.000f 0.000 11.000u Total Fixed: 3,821.85 68.385f 0.000 9.395u
Tank Status
DIESEL OIL (SpGr 0.850)
Tank Name
Load (%)
Weight (MT)
LCG (m)
TCG (m)
VCG (m)
Perm FSM (MT-m)
DS1.P 100.00% 69.43 48.023f 5.464p 3.813 0.950 0.00 DS1.S 100.00% 69.43 48.023f 5.464s 3.813 0.950 0.00 DS2.P 100.00% 69.72 66.000f 5.467p 3.810 0.950 0.00 DS2.S 100.00% 69.72 66.000f 5.467s 3.810 0.950 0.00 JP1.P 100.00% 66.84 32.033f 1.958p 1.419 0.985 0.00 JP1.S 100.00% 66.84 32.033f 1.958s 1.419 0.985 0.00 JP2.P 100.00% 40.81 48.417f 1.609p 0.618 0.985 0.00 JP2.S 100.00% 40.81 48.417f 1.609s 0.618 0.985 0.00 JP3.P 100.00% 43.96 66.000f 1.640p 0.598 0.985 0.00 JP3.S 100.00% 43.96 66.000f 1.640s 0.598 0.985 0.00 JP4.P 100.00% 119.22 83.995f 2.191p 1.182 0.985 0.00 JP4.S 100.00% 119.22 83.995f 2.191s 1.182 0.985 0.00
Subtotals: 100.00% 819.94 60.901f 0.000 1.994 0.00
FRESH WATER (SpGr 1.000) Tank Name
Load (%)
Weight (MT)
LCG (m)
TCG (m)
VCG (m)
Perm FSM (MT-m)
FW1.P 100.00% 113.55 101.504f 2.046p 1.235 0.985 0.00 FW1.S 100.00% 113.55 101.504f 2.046s 1.235 0.985 0.00
Subtotals: 100.00% 227.10 101.504f 0.000 1.235 0.00
WATER BALLAST (SpGr 1.025) Tank Name
Load (%)
Weight (MT)
LCG (m)
TCG (m)
VCG (m)
Perm FSM (MT-m)
WB1.P 100.00% 55.21 117.785f 1.438p 1.455 0.985 0.00 WB1.S 100.00% 55.21 117.785f 1.438s 1.455 0.985 0.00
Subtotals: 100.00% 110.43 117.785f 0.000 1.455 0.00
All Tanks Load
(%) Weight (MT)
LCG (m)
TCG (m)
VCG (m)
Perm FSM (MT-m)
Totals: 1,157.46 74.294f 0.000 1.794 0.00
Displacer Status
Item Status Spgr Displ (MT)
LCB (m)
TCB (m)
VCB (m)
Eff /Perm
HULL Intact 1.025 4,978.06 69.759f 0.000 2.795 0.950 SubTotals: 4,978.06 69.759f 0.000 2.795

278
Righting Arms vs Heel Angle
Heel Angle (deg)
Trim Angle (deg)
Origin Depth (m)
Righting Arm (m)
Area (m-Rad)
Flood Pt Height (m)
Notes
0.00 0.01f 4.495 0.000 0.000 9.997 (1) Equil 5.00s 0.10f 4.289 0.532 0.023 7.872 (1) 10.00s 0.25f 3.925 0.989 0.090 5.750 (1) 15.00s 0.42f 3.476 1.439 0.196 3.615 (1) 20.00s 0.61f 2.935 1.875 0.341 1.490 (1) 23.56s 0.76f 2.493 2.180 0.467 -0.005 (1) FldPt 25.00s 0.82f 2.301 2.307 0.523 -0.602 (1) 30.00s 1.03f 1.578 2.808 0.746 -2.622 (1) 35.00s 1.22f 0.778 3.413 1.017 -4.533 (1) 40.00s 1.38f -0.116 4.071 1.343 -6.316 (1) 45.00s 1.58f -1.126 4.670 1.725 -7.976 (1) 50.00s 1.80f -2.218 5.083 2.152 -9.528 (1) 55.00s 2.04f -3.355 5.286 2.606 -10.975 (1) 57.77s 2.18f -3.996 5.313 2.863 -11.731 (1) MaxRa 60.00s 2.29f -4.516 5.296 3.069 -12.309 (1) 65.00s 2.54f -5.700 5.135 3.525 -13.513 (1) 70.00s 2.79f -6.912 4.824 3.961 -14.571 (1) 75.00s 3.05f -8.139 4.384 4.363 -15.472 (1) 80.00s 3.30f -9.358 3.839 4.723 -16.216 (1) 85.00s 3.52f -10.546 3.212 5.031 -16.800 (1) 90.00s 3.72f -11.666 2.519 5.282 -17.235 (1)
Weight and C.G. used above include tank loads. The tank load centers were not allowed to shift with heel and trim changes.
Unprotected Flood Points
Name L,T,V (m) Height (m) (1) Floading Point (Er) 61.000f, 25.000s, 14.500 9.997
"HSV-MULTIHULL CRITERIA"
Limit Min/Max Actual Margin Pass
(18) Area from 0.00 deg to Flood or MaxRA >0.0290 m-R 0.467 0.438 Yes (19) Absolute Angle at MaxRA >10.00 deg 57.77 47.77 Yes

279
Righting Arms vs. HeelHeel angle (Degrees)
Arms in
m
0.0s 50.0s
0.0
1.0
2.0
3.0
4.0
5.0
Righting ArmR. AreaEquilibriumFlood Pt

280
2. Full Load - Arrival
Floating Status
Draft FP 3.870 m Heel zero GM(Solid) 3.584 m Draft MS 4.047 m Equil Yes F/S Corr. 0.013 m Draft AP 4.224 m Wind 0.0 kn GM(Fluid) 3.570 m
Trim aft 0.35/145.00 Wave No KMT 12.388 m LCG 69.257f m VCG 8.804 m TPcm 17.28
Loading Summary
Item Weight
(MT) LCG (m)
TCG (m)
VCG (m)
Light Ship 2,888.60 74.500f 0.000 10.088 Deadweight 1,309.39 57.690f 0.000 5.972
Displacement 4,197.99 69.257f 0.000 8.804
Fluid Legend
Fluid Name Legend Weight
(MT) Load%
DIESEL OIL
278.29 33.94%
FRESH WATER
22.71 10.00%
WATER BALLAST
110.43 100.00%
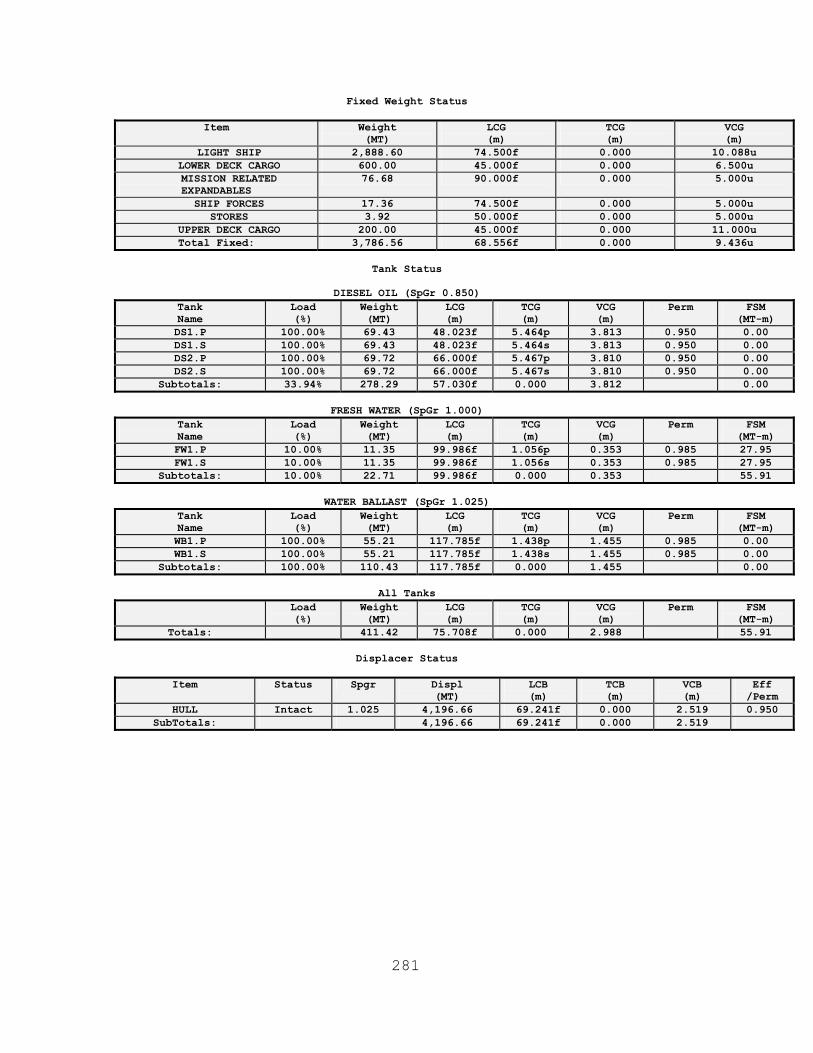
281
Fixed Weight Status
Item Weight (MT)
LCG (m)
TCG (m)
VCG (m)
LIGHT SHIP 2,888.60 74.500f 0.000 10.088u LOWER DECK CARGO 600.00 45.000f 0.000 6.500u MISSION RELATED
EXPANDABLES 76.68 90.000f 0.000 5.000u
SHIP FORCES 17.36 74.500f 0.000 5.000u STORES 3.92 50.000f 0.000 5.000u
UPPER DECK CARGO 200.00 45.000f 0.000 11.000u Total Fixed: 3,786.56 68.556f 0.000 9.436u
Tank Status
DIESEL OIL (SpGr 0.850)
Tank Name
Load (%)
Weight (MT)
LCG (m)
TCG (m)
VCG (m)
Perm FSM (MT-m)
DS1.P 100.00% 69.43 48.023f 5.464p 3.813 0.950 0.00 DS1.S 100.00% 69.43 48.023f 5.464s 3.813 0.950 0.00 DS2.P 100.00% 69.72 66.000f 5.467p 3.810 0.950 0.00 DS2.S 100.00% 69.72 66.000f 5.467s 3.810 0.950 0.00
Subtotals: 33.94% 278.29 57.030f 0.000 3.812 0.00
FRESH WATER (SpGr 1.000) Tank Name
Load (%)
Weight (MT)
LCG (m)
TCG (m)
VCG (m)
Perm FSM (MT-m)
FW1.P 10.00% 11.35 99.986f 1.056p 0.353 0.985 27.95 FW1.S 10.00% 11.35 99.986f 1.056s 0.353 0.985 27.95
Subtotals: 10.00% 22.71 99.986f 0.000 0.353 55.91
WATER BALLAST (SpGr 1.025) Tank Name
Load (%)
Weight (MT)
LCG (m)
TCG (m)
VCG (m)
Perm FSM (MT-m)
WB1.P 100.00% 55.21 117.785f 1.438p 1.455 0.985 0.00 WB1.S 100.00% 55.21 117.785f 1.438s 1.455 0.985 0.00
Subtotals: 100.00% 110.43 117.785f 0.000 1.455 0.00
All Tanks Load
(%) Weight (MT)
LCG (m)
TCG (m)
VCG (m)
Perm FSM (MT-m)
Totals: 411.42 75.708f 0.000 2.988 55.91
Displacer Status
Item Status Spgr Displ (MT)
LCB (m)
TCB (m)
VCB (m)
Eff /Perm
HULL Intact 1.025 4,196.66 69.241f 0.000 2.519 0.950 SubTotals: 4,196.66 69.241f 0.000 2.519

282
Righting Arms vs Heel Angle
Free Surface Adjustment 0.013 Adjusted VCG 8.817
Heel Angle (deg)
Trim Angle (deg)
Origin Depth (m)
Righting Arm (m)
Area (m-Rad)
Flood Pt Height (m)
Notes
0.00 0.14a 4.225 0.000 0.000 10.424 (1) Equil 5.00s 0.04a 4.018 0.341 0.015 8.296 (1) 10.00s 0.11f 3.640 0.776 0.063 6.176 (1) 15.00s 0.30f 3.170 1.199 0.149 4.046 (1) 20.00s 0.51f 2.604 1.599 0.271 1.926 (1) 24.62s 0.73f 1.994 1.948 0.415 -0.002 (1) FldPt 25.00s 0.75f 1.939 1.977 0.428 -0.160 (1) 30.00s 1.00f 1.177 2.377 0.617 -2.183 (1) 35.00s 1.24f 0.325 2.863 0.846 -4.106 (1) 40.00s 1.45f -0.611 3.432 1.120 -5.898 (1) 45.00s 1.68f -1.657 4.002 1.444 -7.548 (1) 50.00s 1.93f -2.812 4.420 1.812 -9.070 (1) 55.00s 2.21f -4.041 4.613 2.208 -10.470 (1) 56.79s 2.32f -4.497 4.627 2.353 -10.941 (1) MaxRa 60.00s 2.52f -5.331 4.583 2.611 -11.737 (1) 65.00s 2.84f -6.671 4.349 3.002 -12.859 (1) 70.00s 3.16f -8.029 3.949 3.366 -13.833 (1) 75.00s 3.46f -9.378 3.421 3.688 -14.658 (1) 80.00s 3.72f -10.676 2.796 3.960 -15.340 (1) 85.00s 3.94f -11.887 2.099 4.174 -15.889 (1) 90.00s 4.09f -12.970 1.353 4.325 -16.314 (1)
Weight and C.G. used above include tank loads. The tank load centers were not allowed to shift with heel and trim changes.
A Free Surface Moment of 55.9 MT-m was used to adjust the VCG.
Unprotected Flood Points
Name L,T,V (m) Height (m) (1) Floading Point (Er) 61.000f, 25.000s, 14.500 10.424
"HSV-MULTIHULL CRITERIA"
Limit Min/Max Actual Margin Pass
(18) Area from 0.00 deg to Flood or MaxRA >0.0290 m-R 0.415 0.386 Yes (19) Absolute Angle at MaxRA >10.00 deg 56.79 46.79 Yes

283
Righting Arms vs. HeelHeel angle (Degrees)
Arms in
m
0.0s 50.0s
0.0
1.0
2.0
3.0
4.0
Righting ArmR. AreaEquilibriumFlood Pt

284
3. Half Load - Departure
Floating Status
Draft FP 4.522 m Heel zero GM(Solid) 6.164 m Draft MS 4.407 m Equil Yes F/S Corr. 0.000 m Draft AP 4.292 m Wind 0.0 kn GM(Fluid) 6.164 m
Trim fwd 0.23/145.00 Wave No KMT 13.651 m LCG 70.794f m VCG 7.487 m TPcm 18.16
Loading Summary
Item Weight
(MT) LCG (m)
TCG (m)
VCG (m)
Light Ship 2,888.60 74.500f 0.000 10.088 Deadweight 1,890.71 65.133f 0.000 3.513
Displacement 4,779.31 70.794f 0.000 7.487
Fluid Legend
Fluid Name Legend Weight
(MT) Load%
DIESEL OIL
819.94 100.00%
FRESH WATER
227.10 100.00%
WATER BALLAST
110.43 100.00%

285
Fixed Weight Status
Item Weight (MT)
LCG (m)
TCG (m)
VCG (m)
LIGHT SHIP 2,888.60 74.500f 0.000 10.088u LOWER DECK CARGO 600.00 45.000f 0.000 6.500u MISSION RELATED
EXPANDABLES 76.68 90.000f 0.000 5.000u
SHIP FORCES 17.36 74.500f 0.000 5.000u STORES 39.21 50.000f 0.000 5.000u
UPPER DECK CARGO 0.00 0.000 0.000 0.000 Total Fixed: 3,621.85 69.676f 0.000 9.306u
Tank Status
DIESEL OIL (SpGr 0.850)
Tank Name
Load (%)
Weight (MT)
LCG (m)
TCG (m)
VCG (m)
Perm FSM (MT-m)
DS1.P 100.00% 69.43 48.023f 5.464p 3.813 0.950 0.00 DS1.S 100.00% 69.43 48.023f 5.464s 3.813 0.950 0.00 DS2.P 100.00% 69.72 66.000f 5.467p 3.810 0.950 0.00 DS2.S 100.00% 69.72 66.000f 5.467s 3.810 0.950 0.00 JP1.P 100.00% 66.84 32.033f 1.958p 1.419 0.985 0.00 JP1.S 100.00% 66.84 32.033f 1.958s 1.419 0.985 0.00 JP2.P 100.00% 40.81 48.417f 1.609p 0.618 0.985 0.00 JP2.S 100.00% 40.81 48.417f 1.609s 0.618 0.985 0.00 JP3.P 100.00% 43.96 66.000f 1.640p 0.598 0.985 0.00 JP3.S 100.00% 43.96 66.000f 1.640s 0.598 0.985 0.00 JP4.P 100.00% 119.22 83.995f 2.191p 1.182 0.985 0.00 JP4.S 100.00% 119.22 83.995f 2.191s 1.182 0.985 0.00
Subtotals: 100.00% 819.94 60.901f 0.000 1.994 0.00
FRESH WATER (SpGr 1.000) Tank Name
Load (%)
Weight (MT)
LCG (m)
TCG (m)
VCG (m)
Perm FSM (MT-m)
FW1.P 100.00% 113.55 101.504f 2.046p 1.235 0.985 0.00 FW1.S 100.00% 113.55 101.504f 2.046s 1.235 0.985 0.00
Subtotals: 100.00% 227.10 101.504f 0.000 1.235 0.00
WATER BALLAST (SpGr 1.025) Tank Name
Load (%)
Weight (MT)
LCG (m)
TCG (m)
VCG (m)
Perm FSM (MT-m)
WB1.P 100.00% 55.21 117.785f 1.438p 1.455 0.985 0.00 WB1.S 100.00% 55.21 117.785f 1.438s 1.455 0.985 0.00
Subtotals: 100.00% 110.43 117.785f 0.000 1.455 0.00
All Tanks Load
(%) Weight (MT)
LCG (m)
TCG (m)
VCG (m)
Perm FSM (MT-m)
Totals: 1,157.46 74.294f 0.000 1.794 0.00
Displacer Status
Item Status Spgr Displ (MT)
LCB (m)
TCB (m)
VCB (m)
Eff /Perm
HULL Intact 1.025 4,778.19 70.803f 0.000 2.727 0.950 SubTotals: 4,778.19 70.803f 0.000 2.727

286
Righting Arms vs Heel Angle
Heel Angle (deg)
Trim Angle (deg)
Origin Depth (m)
Righting Arm (m)
Area (m-Rad)
Flood Pt Height (m)
Notes
0.00 0.09f 4.293 0.000 0.000 10.110 (1) Equil 5.00s 0.18f 4.083 0.492 0.021 7.986 (1) 10.00s 0.34f 3.712 0.975 0.086 5.867 (1) 15.00s 0.51f 3.253 1.448 0.191 3.735 (1) 20.00s 0.71f 2.701 1.905 0.338 1.614 (1) 23.87s 0.88f 2.210 2.249 0.478 -0.005 (1) FldPt 25.00s 0.93f 2.054 2.353 0.524 -0.474 (1) 30.00s 1.16f 1.318 2.864 0.751 -2.491 (1) 35.00s 1.35f 0.504 3.478 1.027 -4.399 (1) 40.00s 1.52f -0.402 4.147 1.359 -6.180 (1) 45.00s 1.73f -1.427 4.761 1.748 -7.834 (1) 50.00s 1.97f -2.544 5.196 2.184 -9.373 (1) 55.00s 2.22f -3.718 5.418 2.649 -10.802 (1) 58.05s 2.39f -4.455 5.453 2.939 -11.617 (1) MaxRa 60.00s 2.50f -4.932 5.438 3.124 -12.111 (1) 65.00s 2.78f -6.180 5.278 3.593 -13.284 (1) 70.00s 3.06f -7.455 4.959 4.040 -14.309 (1) 75.00s 3.34f -8.732 4.510 4.455 -15.183 (1) 80.00s 3.60f -9.992 3.959 4.825 -15.901 (1) 85.00s 3.84f -11.197 3.325 5.143 -16.472 (1) 90.00s 4.03f -12.326 2.627 5.403 -16.896 (1)
Weight and C.G. used above include tank loads. The tank load centers were not allowed to shift with heel and trim changes.
Unprotected Flood Points
Name L,T,V (m) Height (m) (1) Floading Point (Er) 61.000f, 25.000s, 14.500 10.110
"HSV-MULTIHULL CRITERIA"
Limit Min/Max Actual Margin Pass
(18) Area from 0.00 deg to Flood or MaxRA >0.0290 m-R 0.478 0.449 Yes (19) Absolute Angle at MaxRA >10.00 deg 58.05 48.05 Yes
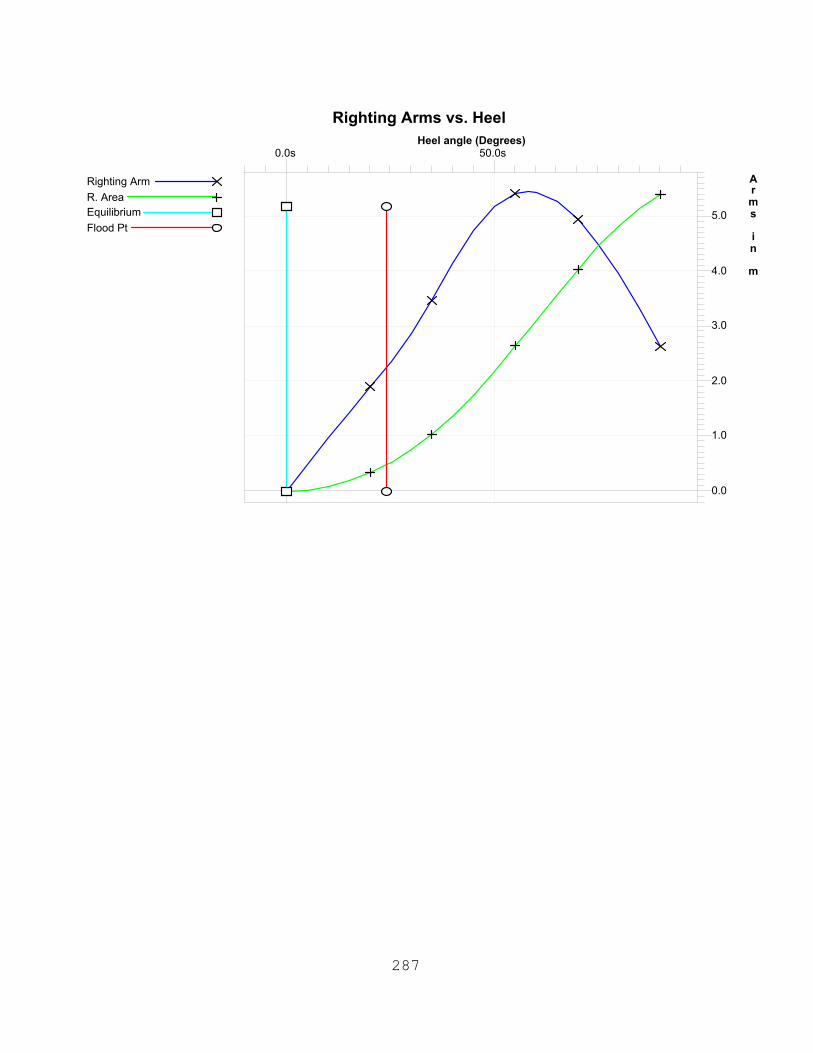
287
Righting Arms vs. HeelHeel angle (Degrees)
Arms in
m
0.0s 50.0s
0.0
1.0
2.0
3.0
4.0
5.0
Righting ArmR. AreaEquilibriumFlood Pt

288
4. Half Load - Arrival
Floating Status
Draft FP 3.890 m Heel zero GM(Solid) 2.080 m Draft MS 3.942 m Equil Yes F/S Corr. 0.014 m Draft AP 3.995 m Wind 0.0 kn GM(Fluid) 2.066 m
Trim 0.11/145.00 Wave No KMT 10.775 m LCG 70.471f m VCG 8.694 m TPcm 16.71
Loading Summary
Item Weight
(MT) LCG (m)
TCG (m)
VCG (m)
Light Ship 2,888.60 74.500f 0.000 10.088 Deadweight 1,109.39 59.981f 0.000 5.065
Displacement 3,997.99 70.471f 0.000 8.694
Fluid Legend
Fluid Name Legend Weight (MT)
Load%
DIESEL OIL
278.29 33.94%
FRESH WATER
22.71 10.00%
WATER BALLAST
110.43 100.00%

289
Fixed Weight Status
Item Weight (MT)
LCG (m)
TCG (m)
VCG (m)
LIGHT SHIP 2,888.60 74.500f 0.000 10.088u LOWER DECK CARGO 600.00 45.000f 0.000 6.500u MISSION RELATED
EXPANDABLES 76.68 90.000f 0.000 5.000u
SHIP FORCES 17.36 74.500f 0.000 5.000u STORES 3.92 50.000f 0.000 5.000u
UPPER DECK CARGO 0.00 0.000 0.000 0.000 Total Fixed: 3,586.56 69.870f 0.000 9.349u
Tank Status
DIESEL OIL (SpGr 0.850)
Tank Name
Load (%)
Weight (MT)
LCG (m)
TCG (m)
VCG (m)
Perm FSM (MT-m)
DS1.P 100.00% 69.43 48.023f 5.464p 3.813 0.950 0.00 DS1.S 100.00% 69.43 48.023f 5.464s 3.813 0.950 0.00 DS2.P 100.00% 69.72 66.000f 5.467p 3.810 0.950 0.00 DS2.S 100.00% 69.72 66.000f 5.467s 3.810 0.950 0.00
Subtotals: 33.94% 278.29 57.030f 0.000 3.812 0.00
FRESH WATER (SpGr 1.000) Tank Name
Load (%)
Weight (MT)
LCG (m)
TCG (m)
VCG (m)
Perm FSM (MT-m)
FW1.P 10.00% 11.35 100.130f 1.050p 0.353 0.985 27.69 FW1.S 10.00% 11.35 100.130f 1.050s 0.353 0.985 27.69
Subtotals: 10.00% 22.71 100.130f 0.000 0.353 55.39
WATER BALLAST (SpGr 1.025) Tank Name
Load (%)
Weight (MT)
LCG (m)
TCG (m)
VCG (m)
Perm FSM (MT-m)
WB1.P 100.00% 55.21 117.785f 1.438p 1.455 0.985 0.00 WB1.S 100.00% 55.21 117.785f 1.438s 1.455 0.985 0.00
Subtotals: 100.00% 110.43 117.785f 0.000 1.455 0.00
All Tanks Load
(%) Weight (MT)
LCG (m)
TCG (m)
VCG (m)
Perm FSM (MT-m)
Totals: 411.42 75.716f 0.000 2.988 55.39
Displacer Status
Item Status Spgr Displ (MT)
LCB (m)
TCB (m)
VCB (m)
Eff /Perm
HULL Intact 1.025 3,997.43 70.466f 0.000 2.443 0.950 SubTotals: 3,997.43 70.466f 0.000 2.443

290
Righting Arms vs Heel Angle
Free Surface Adjustment 0.014 Adjusted VCG 8.708
Heel Angle (deg)
Trim Angle (deg)
Origin Depth (m)
Righting Arm (m)
Area (m-Rad)
Flood Pt Height (m)
Notes
0.00 0.04a 3.996 0.000 0.000 10.548 (1) Equil 5.00s 0.05f 3.801 0.285 0.012 8.415 (1) 10.00s 0.21f 3.416 0.743 0.056 6.297 (1) 15.00s 0.41f 2.932 1.192 0.141 4.172 (1) 20.00s 0.63f 2.351 1.613 0.263 2.058 (1) 24.95s 0.87f 1.676 2.004 0.420 0.000 (1) FldPt 25.00s 0.87f 1.669 2.008 0.421 -0.022 (1) 30.00s 1.14f 0.884 2.417 0.614 -2.037 (1) 35.00s 1.39f 0.007 2.910 0.846 -3.953 (1) 40.00s 1.62f -0.952 3.485 1.125 -5.738 (1) 45.00s 1.86f -2.019 4.060 1.454 -7.380 (1) 50.00s 2.13f -3.201 4.494 1.828 -8.888 (1) 55.00s 2.43f -4.473 4.695 2.231 -10.266 (1) 56.77s 2.55f -4.943 4.710 2.376 -10.722 (1) MaxRa 60.00s 2.76f -5.821 4.663 2.641 -11.504 (1) 65.00s 3.11f -7.217 4.422 3.039 -12.594 (1) 70.00s 3.44f -8.622 4.018 3.408 -13.539 (1) 75.00s 3.74f -9.985 3.489 3.737 -14.349 (1) 80.00s 4.00f -11.268 2.868 4.015 -15.033 (1) 85.00s 4.19f -12.441 2.181 4.235 -15.592 (1) 90.00s 4.30f -13.471 1.448 4.394 -16.037 (1)
Weight and C.G. used above include tank loads. The tank load centers were not allowed to shift with heel and trim changes.
A Free Surface Moment of 55.4 MT-m was used to adjust the VCG.
Unprotected Flood Points
Name L,T,V (m) Height (m) (1) Floading Point (Er) 61.000f, 25.000s, 14.500 10.548
"HSV-MULTIHULL CRITERIA"
Limit Min/Max Actual Margin Pass
(18) Area from 0.00 deg to Flood or MaxRA >0.0290 m-R 0.420 0.391 Yes (19) Absolute Angle at MaxRA >10.00 deg 56.77 46.77 Yes

291
Righting Arms vs. HeelHeel angle (Degrees)
Arms in
m
0.0s 50.0s
0.0
1.0
2.0
3.0
4.0
5.0Righting ArmR. AreaEquilibriumFlood Pt
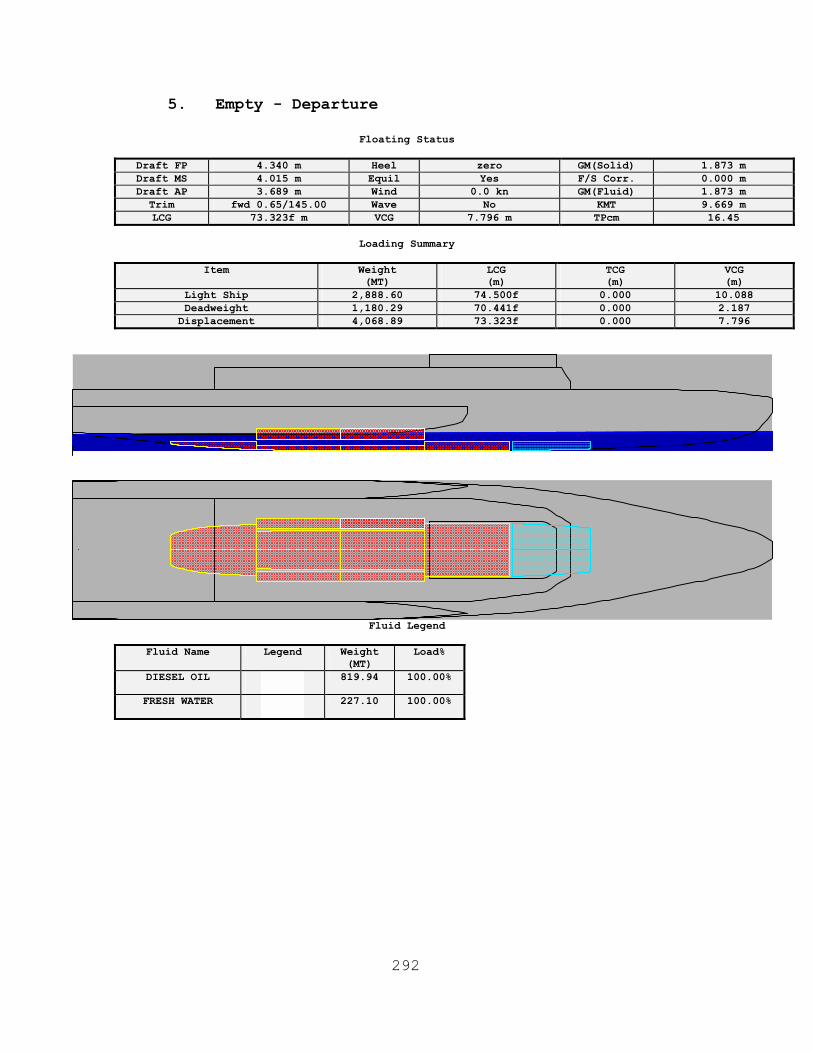
292
5. Empty - Departure
Floating Status
Draft FP 4.340 m Heel zero GM(Solid) 1.873 m Draft MS 4.015 m Equil Yes F/S Corr. 0.000 m Draft AP 3.689 m Wind 0.0 kn GM(Fluid) 1.873 m
Trim fwd 0.65/145.00 Wave No KMT 9.669 m LCG 73.323f m VCG 7.796 m TPcm 16.45
Loading Summary
Item Weight
(MT) LCG (m)
TCG (m)
VCG (m)
Light Ship 2,888.60 74.500f 0.000 10.088 Deadweight 1,180.29 70.441f 0.000 2.187
Displacement 4,068.89 73.323f 0.000 7.796
Fluid Legend
Fluid Name Legend Weight
(MT) Load%
DIESEL OIL
819.94 100.00%
FRESH WATER
227.10 100.00%

293
Fixed Weight Status
Item Weight (MT)
LCG (m)
TCG (m)
VCG (m)
LIGHT SHIP 2,888.60 74.500f 0.000 10.088u LOWER DECK CARGO 0.00 0.000 0.000 0.000 MISSION RELATED
EXPANDABLES 76.68 90.000f 0.000 5.000u
SHIP FORCES 17.36 74.500f 0.000 5.000u STORES 39.21 50.000f 0.000 5.000u
UPPER DECK CARGO 0.00 0.000 0.000 0.000 Total Fixed: 3,021.85 74.575f 0.000 9.864u
Tank Status
DIESEL OIL (SpGr 0.850)
Tank Name
Load (%)
Weight (MT)
LCG (m)
TCG (m)
VCG (m)
Perm FSM (MT-m)
DS1.P 100.00% 69.43 48.023f 5.464p 3.813 0.950 0.00 DS1.S 100.00% 69.43 48.023f 5.464s 3.813 0.950 0.00 DS2.P 100.00% 69.72 66.000f 5.467p 3.810 0.950 0.00 DS2.S 100.00% 69.72 66.000f 5.467s 3.810 0.950 0.00 JP1.P 100.00% 66.84 32.033f 1.958p 1.419 0.985 0.00 JP1.S 100.00% 66.84 32.033f 1.958s 1.419 0.985 0.00 JP2.P 100.00% 40.81 48.417f 1.609p 0.618 0.985 0.00 JP2.S 100.00% 40.81 48.417f 1.609s 0.618 0.985 0.00 JP3.P 100.00% 43.96 66.000f 1.640p 0.598 0.985 0.00 JP3.S 100.00% 43.96 66.000f 1.640s 0.598 0.985 0.00 JP4.P 100.00% 119.22 83.995f 2.191p 1.182 0.985 0.00 JP4.S 100.00% 119.22 83.995f 2.191s 1.182 0.985 0.00
Subtotals: 100.00% 819.94 60.901f 0.000 1.994 0.00
FRESH WATER (SpGr 1.000) Tank Name
Load (%)
Weight (MT)
LCG (m)
TCG (m)
VCG (m)
Perm FSM (MT-m)
FW1.P 100.00% 113.55 101.504f 2.046p 1.235 0.985 0.00 FW1.S 100.00% 113.55 101.504f 2.046s 1.235 0.985 0.00
Subtotals: 100.00% 227.10 101.504f 0.000 1.235 0.00
All Tanks Load
(%) Weight (MT)
LCG (m)
TCG (m)
VCG (m)
Perm FSM (MT-m)
Totals: 1,047.04 69.707f 0.000 1.830 0.00
Displacer Status
Item Status Spgr Displ (MT)
LCB (m)
TCB (m)
VCB (m)
Eff /Perm
HULL Intact 1.025 4,068.11 73.347f 0.000 2.475 0.950 SubTotals: 4,068.11 73.347f 0.000 2.475

294
Righting Arms vs Heel Angle
Heel Angle (deg)
Trim Angle (deg)
Origin Depth (m)
Righting Arm (m)
Area (m-Rad)
Flood Pt Height (m)
Notes
0.00 0.26f 3.690 0.000 0.000 10.536 (1) Equil 5.00s 0.34f 3.511 0.295 0.013 8.398 (1) 10.00s 0.50f 3.119 0.801 0.059 6.283 (1) 15.00s 0.70f 2.621 1.304 0.151 4.164 (1) 20.00s 0.93f 2.024 1.780 0.286 2.058 (1) 24.97s 1.18f 1.333 2.226 0.460 0.000 (1) FldPt 25.00s 1.18f 1.328 2.229 0.461 -0.013 (1) 30.00s 1.45f 0.531 2.710 0.676 -2.016 (1) 35.00s 1.70f -0.353 3.283 0.937 -3.916 (1) 40.00s 1.92f -1.318 3.934 1.251 -5.683 (1) 45.00s 2.16f -2.398 4.548 1.622 -7.316 (1) 50.00s 2.43f -3.596 5.008 2.040 -8.814 (1) 55.00s 2.75f -4.889 5.236 2.488 -10.181 (1) 57.47s 2.91f -5.558 5.263 2.715 -10.805 (1) MaxRa 60.00s 3.09f -6.259 5.235 2.947 -11.407 (1) 65.00s 3.44f -7.668 5.035 3.397 -12.491 (1) 70.00s 3.77f -9.071 4.677 3.821 -13.437 (1) 75.00s 4.07f -10.415 4.198 4.210 -14.259 (1) 80.00s 4.32f -11.678 3.630 4.552 -14.952 (1) 85.00s 4.49f -12.817 2.994 4.841 -15.532 (1) 90.00s 4.61f -13.821 2.307 5.073 -15.996 (1)
Weight and C.G. used above include tank loads. The tank load centers were not allowed to shift with heel and trim changes.
Unprotected Flood Points
Name L,T,V (m) Height (m) (1) Floading Point (Er) 61.000f, 25.000s, 14.500 10.536
"HSV-MULTIHULL CRITERIA"
Limit Min/Max Actual Margin Pass
(18) Area from 0.00 deg to Flood or MaxRA >0.0290 m-R 0.460 0.431 Yes (19) Absolute Angle at MaxRA >10.00 deg 57.47 47.47 Yes

295
Righting Arms vs. HeelHeel angle (Degrees)
Arms in
m
0.0s 50.0s
0.0
1.0
2.0
3.0
4.0
5.0
Righting ArmR. AreaEquilibriumFlood Pt

296
6. Empty - Arrival
Floating Status
Draft FP 3.757 m Heel stbd 4.49 deg. GM(Solid) 2.956 m Draft MS 3.478 m Equil Yes F/S Corr. 0.019 m Draft AP 3.199 m Wind 0.0 kn GM(Fluid) 2.937 m
Trim fwd 0.56/145.00 Wave No KMT 12.285 m LCG 73.533f m VCG 9.338 m TPcm 15.69
Loading Summary
Item Weight
(MT) LCG (m)
TCG (m)
VCG (m)
Light Ship 2,888.60 74.500f 0.000 10.088 Deadweight 398.96 66.532f 0.011s 3.907
Displacement 3,287.56 73.533f 0.001s 9.338
Fluid Legend
Fluid Name Legend Weight
(MT) Load%
DIESEL OIL
278.29 33.94%
FRESH WATER
22.71 10.00%
Fixed Weight Status
Item Weight
(MT) LCG (m)
TCG (m)
VCG (m)
LIGHT SHIP 2,888.60 74.500f 0.000 10.088u LOWER DECK CARGO 0.00 0.000 0.000 0.000 MISSION RELATED
EXPANDABLES 76.68 90.000f 0.000 5.000u
SHIP FORCES 17.36 74.500f 0.000 5.000u STORES 3.92 50.000f 0.000 5.000u
UPPER DECK CARGO 0.00 0.000 0.000 0.000 Total Fixed: 2,986.56 74.866f 0.000 9.921u

297
Tank Status
DIESEL OIL (SpGr 0.850) Tank Name
Load (%)
Weight (MT)
LCG (m)
TCG (m)
VCG (m)
Perm FSM (MT-m)
DS1.P 100.00% 69.43 48.023f 5.464p 3.813 0.950 0.00 DS1.S 100.00% 69.43 48.023f 5.464s 3.813 0.950 0.00 DS2.P 100.00% 69.72 66.000f 5.467p 3.810 0.950 0.00 DS2.S 100.00% 69.72 66.000f 5.467s 3.810 0.950 0.00
Subtotals: 33.94% 278.29 57.030f 0.000 3.812 0.00
FRESH WATER (SpGr 1.000) Tank Name
Load (%)
Weight (MT)
LCG (m)
TCG (m)
VCG (m)
Perm FSM (MT-m)
FW1.P 10.00% 11.36 100.711f 0.878p 0.360 0.985 19.54 FW1.S 10.00% 11.35 100.258f 1.267s 0.362 0.985 41.39
Subtotals: 10.00% 22.71 100.484f 0.194s 0.361 60.93
All Tanks Load
(%) Weight (MT)
LCG (m)
TCG (m)
VCG (m)
Perm FSM (MT-m)
Totals: 301.00 60.309f 0.015s 3.552 60.93
Displacer Status
Item Status Spgr Displ (MT)
LCB (m)
TCB (m)
VCB (m)
Eff /Perm
HULL Intact 1.025 3,287.67 73.561f 0.565s 2.193 0.950 SubTotals: 3,287.67 73.561f 0.565s 2.193

298
Righting Arms vs Heel Angle
Free Surface Adjustment 0.019 Adjusted VCG 9.356
Heel Angle (deg)
Trim Angle (deg)
Origin Depth (m)
Righting Arm (m)
Area (m-Rad)
Flood Pt Height (m)
Notes
0.00 0.18f 3.282 -0.001 0.000 11.025 (1) 5.00s 0.23f 3.162 0.027 0.001 8.858 (1) 10.00s 0.41f 2.765 0.454 0.019 6.740 (1) 15.00s 0.63f 2.228 0.927 0.079 4.633 (1) 20.00s 0.89f 1.585 1.357 0.179 2.541 (1) 25.00s 1.18f 0.837 1.743 0.315 0.487 (1) 26.22s 1.25f 0.637 1.831 0.353 -0.007 (1) FldPt 30.00s 1.49f -0.022 2.105 0.483 -1.504 (1) 35.00s 1.80f -0.985 2.538 0.685 -3.395 (1) 40.00s 2.10f -2.040 3.045 0.928 -5.157 (1) 45.00s 2.39f -3.194 3.574 1.217 -6.767 (1) 50.00s 2.71f -4.487 3.980 1.547 -8.220 (1) 55.00s 3.08f -5.895 4.141 1.903 -9.523 (1) 55.68s 3.13f -6.092 4.144 1.952 -9.689 (1) MaxRa 60.00s 3.45f -7.362 4.059 2.263 -10.687 (1) 65.00s 3.81f -8.818 3.784 2.606 -11.725 (1) 70.00s 4.11f -10.211 3.366 2.919 -12.650 (1) 75.00s 4.36f -11.508 2.841 3.191 -13.466 (1) 80.00s 4.54f -12.694 2.234 3.413 -14.171 (1) 85.00s 4.66f -13.756 1.562 3.579 -14.761 (1) 90.00s 4.71f -14.696 0.838 3.684 -15.227 (1)
Weight and C.G. used above include tank loads. The tank load centers were not allowed to shift with heel and trim changes.
A Free Surface Moment of 60.9 MT-m was used to adjust the VCG.
Unprotected Flood Points
Name L,T,V (m) Height (m) (1) Floading Point (Er) 61.000f, 25.000s, 14.500 11.025
"HSV-MULTIHULL CRITERIA"
Limit Min/Max Actual Margin Pass
(18) Area from 0.00 deg to Flood or MaxRA >0.0290 m-R 0.353 0.324 Yes (19) Absolute Angle at MaxRA >10.00 deg 55.68 45.68 Yes

299
Righting Arms vs. HeelHeel angle (Degrees)
Arms in
m
0.0s 50.0s
0.0
1.0
2.0
3.0
4.0
Righting ArmR. AreaFlood Pt

300
7. Condition Summary Report
Name DISP (MT)
Tpr (m)
T (m)
Tpp (m)
FB (m)
KG (m)
XG (m)
KMT (m)
Full Load - Departure 4979 4.512 4.503 4.494 6.700 7.628 -69.758 14.841 Full Load - Arrival 4197 3.870 4.047 4.224 7.352 8.804 -69.257 12.388
Half Load - Departure 4779 4.522 4.407 4.292 6.684 7.487 -70.794 13.651 Half Load - Arrival 3997 3.890 3.942 3.995 7.325 8.694 -70.471 10.775 Empty - Departure 4068 4.340 4.015 3.689 6.854 7.796 -73.323 9.669 Empty - Arrival 3287 3.757 3.478 3.199 7.286 9.338 -73.533 12.285

301
G. DAMAGED STABILITY
Floating Status
Draft FP 7.506 m Heel stbd 3.00 deg. GM(Solid) 3.629 m Draft MS 5.596 m Equil Yes F/S Corr. 0.000 m Draft AP 3.686 m Wind 0.0 kn GM(Fluid) 3.629 m
Trim fwd 3.81/145.00 Wave No KMT 11.711 m LCG 67.063f m VCG 8.088 m TPcm 17.96
Loading Summary
Item Weight
(MT) LCG (m)
TCG (m)
VCG (m)
Light Ship 2,888.60 74.500f 0.000 10.088 Deadweight 1,753.19 54.809f 0.000 4.792
Displacement 4,641.79 67.063f 0.000 8.088
Fluid Legend
Fluid Name Legend Weight
(MT) Load%
DIESEL OIL
819.94 100.00%
Fixed Weight Status
Item Weight
(MT) LCG (m)
TCG (m)
VCG (m)
LIGHT SHIP 2,888.60 74.500f 0.000 10.088u LOWER DECK CARGO 600.00 45.000f 0.000 6.500u MISSION RELATED
EXPANDABLES 76.68 90.000f 0.000 5.000u
SHIP FORCES 17.36 74.500f 0.000 5.000u STORES 39.21 50.000f 0.000 5.000u
UPPER DECK CARGO 200.00 45.000f 0.000 11.000u Total Fixed: 3,821.85 68.385f 0.000 9.395u
Tank Status
DIESEL OIL (SpGr 0.850)

302
Tank Name
Load (%)
Weight (MT)
LCG (m)
TCG (m)
VCG (m)
Perm FSM (MT-m)
DS1.P 100.00% 69.43 48.023f 5.464p 3.813 0.950 0.00 DS1.S 100.00% 69.43 48.023f 5.464s 3.813 0.950 0.00 DS2.P 100.00% 69.72 66.000f 5.467p 3.810 0.950 0.00 DS2.S 100.00% 69.72 66.000f 5.467s 3.810 0.950 0.00 JP1.P 100.00% 66.84 32.033f 1.958p 1.419 0.985 0.00 JP1.S 100.00% 66.84 32.033f 1.958s 1.419 0.985 0.00 JP2.P 100.00% 40.81 48.417f 1.609p 0.618 0.985 0.00 JP2.S 100.00% 40.81 48.417f 1.609s 0.618 0.985 0.00 JP3.P 100.00% 43.96 66.000f 1.640p 0.598 0.985 0.00 JP3.S 100.00% 43.96 66.000f 1.640s 0.598 0.985 0.00 JP4.P 100.00% 119.22 83.995f 2.191p 1.182 0.985 0.00 JP4.S 100.00% 119.22 83.995f 2.191s 1.182 0.985 0.00
Subtotals: 100.00% 819.94 60.901f 0.000 1.994 0.00
All Tanks Load
(%) Weight (MT)
LCG (m)
TCG (m)
VCG (m)
Perm FSM (MT-m)
Totals: 819.94 60.901f 0.000 1.994 0.00
Displacer Status
Item Status Spgr Displ (MT)
LCB (m)
TCB (m)
VCB (m)
Eff /Perm
HULL Intact 1.025 6,813.58 79.413f 0.514s 3.543 0.950 FW1.P Flooded 1.025 -116.39 101.504f 2.046p 1.235 0.985 WB1.P Flooded 1.025 -55.21 117.785f 1.438p 1.455 0.985 FW1.S Flooded 1.025 -116.39 101.504f 2.046s 1.235 0.985 WB1.S Flooded 1.025 -55.21 117.785f 1.438s 1.455 0.985 WT6.C Flooded 1.025 -875.36 101.721f 0.000 2.913 0.950 WT7.C Flooded 1.025 -599.79 119.054f 0.000 3.223 0.950 WT8.C Flooded 1.025 -173.43 134.291f 0.000 3.793 0.950 SWT4.S Flooded 1.025 -8.73 21.228f 13.731s 4.549 0.950 SWT5.S Flooded 1.025 -12.87 27.161f 13.725s 4.608 0.950 SWT6.S Flooded 1.025 -16.72 33.104f 13.712s 4.663 0.950 SWT7.S Flooded 1.025 -19.87 39.070f 13.703s 4.733 0.950 SWT8.S Flooded 1.025 -22.32 45.047f 13.698s 4.821 0.950 SWT9.S Flooded 1.025 -24.09 51.030f 13.693s 4.928 0.950 SWT10.S Flooded 1.025 -25.07 57.005f 13.690s 5.056 0.950 SWT11.S Flooded 1.025 -23.40 62.920f 13.689s 5.226 0.950 SWT12.S Flooded 1.025 -17.67 68.785f 13.689s 5.467 0.950 SWT13.S Flooded 1.025 -8.99 74.485f 13.690s 5.794 0.950
SubTotals: 4,642.09 67.174f 0.225s 3.803
Error: (H32722) Unable to evaluate (a)
Righting Arms vs Heel Angle with Damage
Heel Angle (deg)
Trim Angle (deg)
Origin Depth (m)
Righting Arm (m)
Area (m-Rad)
Flood Pt Height (m)
Notes
0.00 1.52f 3.639 -0.231 0.000 9.234 (1) 5.00s 1.52f 3.648 0.108 -0.005 6.997 (1) 10.00s 1.58f 3.465 0.301 0.014 4.790 (1) 15.00s 1.63f 3.221 0.508 0.049 2.572 (1) 20.00s 1.65f 2.922 0.837 0.107 0.389 (1) 20.95s 1.65f 2.854 0.946 0.121 -0.011 (1) FldPt 25.00s 1.64f 2.497 1.568 0.209 -1.668 (1) 30.00s 1.65f 1.899 2.504 0.384 -3.603 (1) 35.00s 1.69f 1.174 3.449 0.644 -5.437 (1) 40.00s 1.74f 0.350 4.293 0.983 -7.166 (1) 45.00s 1.81f -0.537 4.912 1.386 -8.805 (1) 50.00s 1.86f -1.449 5.284 1.833 -10.358 (1) 55.00s 1.90f -2.354 5.430 2.302 -11.820 (1)

303
56.45s 1.90f -2.614 5.436 2.439 -12.226 (1) MaxRa 60.00s 1.92f -3.255 5.398 2.775 -13.180 (1) 65.00s 1.93f -4.153 5.224 3.240 -14.426 (1) 70.00s 1.95f -5.053 4.936 3.684 -15.545 (1) 75.00s 1.98f -5.961 4.550 4.099 -16.526 (1) 80.00s 2.02f -6.884 4.077 4.476 -17.355 (1) 85.00s 2.08f -7.827 3.523 4.808 -18.017 (1) 90.00s 2.16f -8.782 2.897 5.089 -18.505 (1)
Weight and C.G. used above include tank loads. The tank load centers were not allowed to shift with heel and trim changes.
Unprotected Flood Points
Name L,T,V (m) Height (m) (1) Floading Point (Er) 61.000f, 25.000s, 14.500 9.234
"HSV-MULTIHULL CRITERIA"
Limit Min/Max Actual Margin Pass
(18) Area from 0.00 deg to Flood or MaxRA >0.0290 m-R 0.121 0.092 Yes (19) Absolute Angle at MaxRA >10.00 deg 56.45 46.45 Yes
Righting Arms vs. HeelHeel angle (Degrees)
Arms in
m
0.0s 50.0s
0.0
1.0
2.0
3.0
4.0
5.0
Righting ArmR. AreaFlood Pt

304
THIS PAGE INTENTIONALLY LEFT BLANK

305
APPENDIX VII COMBAT SYSTEM ANALYSIS
A. RWR TRADE OFF ANALYSIS
1. Sensitivity Calculations
The goal here is to determine the required RWR
sensitivity, taking into consideration existing and
potential future threats. The result of these calculations
will be used to select the type of the RWR receiver.
a. Calculation Parameters
The RWR system must provide warning of threat
radars both in search and track mode. For our purposes, the
track mode will be examined, since it is the mode that
poses the primary threat against the ship.
We will assume that the tracking radar is used to
illuminate the ship, in order to guide an RF guided Air-to-
Surface or a Surface-to-Surface missile. Because we are
looking at both surface and air threats, we will consider
the worst case scenario (the air threat) and use the AGM-84
Harpoon (that has a range of about 100km) as the anti-ship
missile threat.
Hence, the range at which the desired RWR should
detect the threat is 100km.
Two threat situations will be examined:
1. Conventional radar with peak power of 1KW and 30dB antenna gain, operating at 10GHz. According to the frequency selected, this is a fire control radar)
2. LPI radar with 0.1W of peak power and 30dB antenna gain, operating at 10GHz. (This is probably not the main fire control radar of the enemy aircraft, but rather a navigation LPI radar).

306
b. Formulation
A simplified formula for the received power at
the RWR receiver is:
2
2(4 )t t r
rPGGP
Rλ
π= , where
Pt is the radar’s peak power Gt is the radar’s antenna gain Gr is the RWR’s antenna gain λ the wavelength (3cm in our case) R is the range of 100km between the tracking radar
and the RWR c. Results
For the conventional radar case:
2 2
2 2 2
(1000)(1000)(1000)(0.03) 5.69 7 62.4 32(4 ) (4 ) (100000)t t r
rPGGP E Watt dBw dBm
Rλ
π π= = = − = − = −
For the LPI radar case:
2 2
2 2 2
(0.1)(1000)(1000)(0.03) 5.69 11 102.4 72(4 ) (4 ) (100000)t t r
rPGGP E Watt dBw dBm
Rλ
π π= = = − = − = −
d. Conclusions
It is evident that conventional radars can be
detected at the desirable distances (100km) by a RWR with
very low sensitivity (-32dBm). However, this is not the
case for the LPI radars, where the required sensitivity is
much lower (-72dBm).
Because the use of LPI radar systems will become
more widespread in the 2015 time frame, the RWR receiver
that is selected for the HSAC will be capable of achieving
a minimum sensitivity level of –72dBm.
2. Type Selection
The goal of this trade study is to determine which
Radar Warning Receiver (RWR) type will be used.
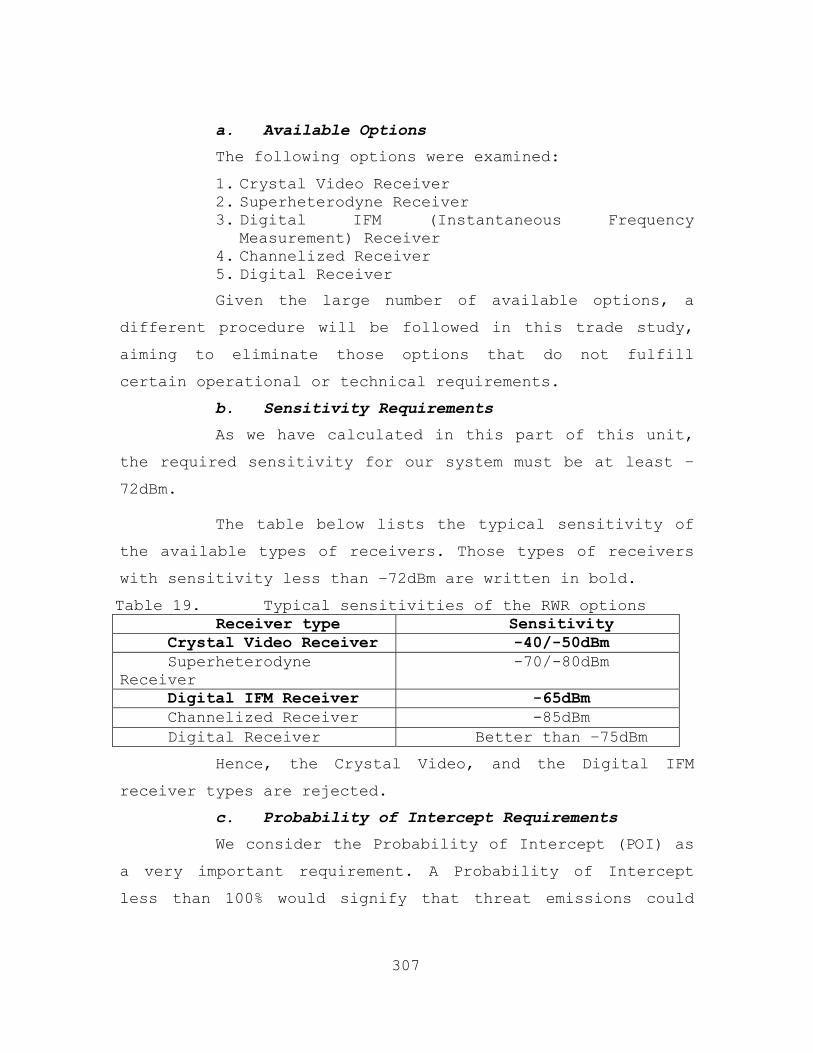
307
a. Available Options
The following options were examined:
1. Crystal Video Receiver 2. Superheterodyne Receiver 3. Digital IFM (Instantaneous Frequency
Measurement) Receiver 4. Channelized Receiver 5. Digital Receiver Given the large number of available options, a
different procedure will be followed in this trade study,
aiming to eliminate those options that do not fulfill
certain operational or technical requirements.
b. Sensitivity Requirements
As we have calculated in this part of this unit,
the required sensitivity for our system must be at least –
72dBm.
The table below lists the typical sensitivity of
the available types of receivers. Those types of receivers
with sensitivity less than –72dBm are written in bold.
Table 19. Typical sensitivities of the RWR options Receiver type Sensitivity
Crystal Video Receiver -40/-50dBm Superheterodyne
Receiver -70/-80dBm
Digital IFM Receiver -65dBm Channelized Receiver -85dBm Digital Receiver Better than –75dBm
Hence, the Crystal Video, and the Digital IFM
receiver types are rejected.
c. Probability of Intercept Requirements
We consider the Probability of Intercept (POI) as
a very important requirement. A Probability of Intercept
less than 100% would signify that threat emissions could

308
potentially remain undetected. Hence the remaining options
are assessed in regards with their POI.
The table in the next page lists the POI of the
remaining types of receivers. Those types of receivers with
POI < 100% are written in bold.
Table 20. POIs of the different RWR options Receiver type Sensitivity
Superheterodyne Receiver
<100%
Channelized Receiver 100% Digital Receiver ~100%
Hence, the superheterodyne receiver types is
rejected.
d. Evaluation Criteria
The following criteria were taken into
consideration in the evaluation of the remaining options:
1. Dynamic Range 2. Frequency accuracy 3. Technological potential 4. Cost e. Discussion
Next we examined the advantages and disadvantages
of the two options.
Channelized receiver:
Advantages:
• 70dB dynamic range • Frequency accuracy of 1MHz or less
Disadvantages:
• Based on Analog technology • High cost
Digital receiver:
Advantages:

309
• More than 60dB dynamic range • Frequency accuracy up to few Hertz in Pulse
Doppler sequence of pulses • Based on Digital technology • Very high cost (expected to decrease over time)
f. Evaluation of Options
Given that both the Channelized and the Digital
Receiver types have similar performance characteristics the
driving factor for the selection of one and not the other
was the technology upon which they are based.
The advantages that the digital technology offers
(i.e. stability, reproducibility and programmability) are
certainly very important factors. Of equal importance is
the fact that one can safely predict significant advances
in digital technology over the foreseeable future. In other
words, it is expected that a digital system will be easier
and cheaper to program, maintain and upgrade, while its
cost is expected to be significantly reduced.
g. Decision
The Radar Warning Receiver of the SSPS will use a
Digital Receiver type.
B. RF JAMMER TARDE OFF ANALYSIS
1. RF Jammer Calculations
The goal here is to determine the jammer peak
power that is required in order to protect our fighter from
a ground threat, consisting of a radar-guided Surface to
Air Missile (SAM).
a. Calculation Parameters
We assume that the SAM threat has a minimum
firing range of 2km from the shore (threat countered right
before the HSAC hits the beach). If the HSAC remains
undetected up to this range, it is considered safe.

310
The threat radar parameters are:
Pt=200KW (Peak Power)
Gt=37dB (Antenna Gain)
λ=0.1m (wavelength), i.e. Frequency 3GHz.
We will assume that the SLQ-32 is operating in
repeater mode. This means that it aims to present to the
threat radar an alternate (false) target, whose RCS is
bigger than the ship’s RCS.
The following parameters are assumed for the
jammer:
Gj=10dB (antenna gain on transmit and receive) Pj is what we want to calculate Ge is the repeater electronic gain Grep is the repeater overall gain
(Gj*Ge*Gj:receive antenna, electronic gain, transmit antenna).
We also assume a polarization mismatch of 45
degrees between the radar and the jammer, which corresponds
to a power loss factor Lp =2.
b. Formulation
If σ=10m2 is the fighter’s RCS, then the power
received from the fighter at the radar receiver is:
2 2
3 4(4 )t tPGS
Rσλ
π= ,
with R being the range between the radar and the
fighter (i.e. R=1km).
The radar power at the receive side of the
repeater jammer is:
2
2(4 )t t J
Rp
PG GPR Lλ
π=

311
This is amplified by the electronic gain of the
repeater, resulting in PJ=PR.Ge and is transmitted towards
the radar.
The power received at the radar is:
2 2 4 2
2 4 2(4 ) (4 )J t t t J e
R ep p
G G PG G GJ P GR L R L
λ λπ π
= =
The Jam to Signal ratio at the radar is:
2 2
2/(4 )
J e
p
G Ga J SL
λπ σ
= = .
We will assume that the radar is jammed when α=5.
Solving for Ge yields:
2
2 2
(4 ) pe
J
a LG
Gπ σ
λ=
Now the Jammer Power can be computed as:
2
2 2 2 2(4 ) 4t t pt t J e
J R ep J
PG a LPG G GP P GR L R G
σλπ β π β
= = =
where β is the repeater’s chopping factor
(typical value β=0.5).
Results
Now we have all the parameters needed to solve
for PJ.
3.7
2 2 2 2
(200 3)(10 )(5)(10)(2) 7974 4 (2000) (0.5) (10)t t p
JJ
PG a L EP WattR G
σπ β π
= = =

312
c. Conclusion
We can see that the repeater jammer will be able
to jam the threat SAM radar, providing protection of the
fighter up to the 2km range, if its peak power is 797Watt.
This is certainly feasible by today’s technology standards,
since most repeaters can produce about 1KW pulses.
C. DIRCM TARDE OFF ANALYSIS
1. DIRCM Laser Power Calculation
In what follows, the required peak power from a laser
transmitter in order to successfully jam the seeker of an
Infra-Red guided missile is calculated.
a. Calculation Parameters
The goal of the laser jammer is not to confuse
the missile’s seeker by providing false target information
(a task that would require less power and is not very
efficient with year 2015 missile systems), but to inflict
damage on the material itself of the detector. We will
assume that the laser transmitter has a pulse width of
0.1µsec and that the laser frequency is within the band of
the IR missile detector. The laser damage threshold for a
pulse of this duration varies inversely with the pulse
duration. Hence, the damage threshold is Eo=10-7W/cm2.
The IR seeker has a circular optical aperture of
10cm in diameter while the transmittance of the optics is
assumed το=0.7. The IR detector area is assumed to be Ad=10-
4cm2. The distance at which the damage is to be inflicted is
R=1km (fair distance especially in the littoral), while the
atmospheric transmittance is τa =0.9.
The beamwidth of the laser beam is 5X10-
4rad=0.5mrad which corresponds to an angular sub tense of
the laser beam Ωl=(5E-4)2=2.5X10⁻⁷Sr.

313
b. Formulation
The power collected by the detector when the
laser threshold is met is:
e o dP E A=
This power must pass through the optics aperture.
Hence:
2
. . ..
l o oe
l
P APR
ατ τ=
Ω
where Ao is the area of the optical aperture and
Pl the power of the laser jammer.
Equating these two formulas, we get:
2
2
. . . .. . .
l o o o d lo d l
l o o
P A E A RE A PR A
α
α
τ ττ τ
Ω= ⇒ =
Ω
c. Results
In our case 2 210( ) 78.53
2oA cm cmπ= =
Hence, converting everything to cm:
7 4 2(10 )(10 )(2.5 7)(100000) 50.53(0.9)(0.7)(78.53)l
EP KWatt− −
= =
c. Conclusions
The peak power required can be considered
moderate and certainly achievable by the existing
technology. It certainly demands a significant amount of
complexity and sophistication in the laser pointing
mechanism, given the fact that it will be placed in the
unsteady platform of the HSAC, though.

314
It must be kept in mind that in order for this
level of power to be effective, the pulse width was set to
100nsec and the beamwidth to 0.5mrad.
2. DIRCM System selection
The goal of this trade study is to determine
which type of Directed Infra-Red Counter Measures system
will be used.
a. Available Options
The following options were examined:
1. “Hot Brick” IR Jammers (electrically heated rods)
2. Vapor Lamps 3. Laser systems b. Evaluation Criteria
The following criteria were taken into
consideration in the evaluation of the options:
1. Jamming techniques that can be implemented 2. Effectiveness against various IR seekers 3. Weight 4. Availability c. Discussion
The following table contains the advantages and
disadvantages of the three options.

315
Table 21. Advantages and Disadvantages of the Three MAWS Options
Hot Brick Jammers
Vapor Lamps Laser
Advantages
• No pointing
mechanism needed
• Available technology
• Modulation or barrage jamming
• Good power efficiency
• Available technology
• Modulation jamming. Physical destruction of the detector (in band) or the missile’s optical aperture (out of band)
• Effective against all types of IR missiles
• Greater power efficiency (less weight)
• Information can be obtained regarding the type of reticle and rotation freq. used
• Laser technology available
Disadvantages
• Space modulation (pinwheel pattern with adjustable frequency and sweep rates)
• Effective only against older generations of missile seekers without Counter-Counter Measures capabilities
• Poor power efficiency
• Has no way of obtaining information about the type of IR seeker
• Pointing mechanism is needed when narrow beam is used
• Poor effectiveness against latest generation of IR missiles (staring arrays)
• Has no way of obtaining information about the type of IR seeker
• Pointing accuracy represents a challenge
• Very precise pointing mechanism is needed

316
d. Evaluation of Options
Because we are looking at the year 2015 threat
environment, it is critical that th MWAS is able to detect
ALL types of IR guided missiles, including the latest
generation, which uses staring type sensors (Focal Plane
Arrays). These missiles are basically immune to
conventional countermeasures (i.e. flares and IR chaff).
As we can see from the table above, only the
Laser systems can be considered as a serious counter
measure against these missiles, while at the same time, the
Laser systems perform equally well – if not better than the
other two options- against older types of IR missiles.
e. Decision
The Laser countermeasures DIRCM system will be
used for the DIRCM system of the SPS of our aircraft.
D. EO SYSTEM ANALYSIS
1. System Overview
The Thermal Imaging Sensor System (TISS) AN/SAY-1 is a
stabilized imaging system that will provide surface ships
with a day and night, high-resolution, infrared, visual
imaging, and laser range-finder capability to augment
existing optical, electronic, and radar sensors. This fully
integrated multi-sensor system will support surveillance,
detection, identification, and tracking of low-observable
surface and air targets, including floating mines,
periscopes, close-in surface boats, low-flying aircraft,
and cruise missiles. TISS will also provide combat and
operational support functions such as low-visibility
navigation, night low-visibility ship-handling, search and
rescue, and in-port security/sneak-swimmer defense.

317
2. System Description
The system that will be installed on the HSAC will be
the Next Generation Thermal Imaging Sensor System, known as
TISS II as it is the most advanced and up to date system in
the U.S. Navy. It is a stabilized, multi-sensor
Surveillance and Targeting System (S&TS). It features an
advanced stabilization technology that results in
exceptional stability, even when exposed to dynamic
environments. This enables the use of high performance
sensors with superior long-range capabilities onboard
ships.
This system can be used in navigation and search-and-
seizure operations, as well as in threat location and
identification. It can provide high-quality video for
surveillance and 3-D targeting data for use with existing
weapon control systems.
In addition, it can use coordinates supplied by the
Global Positioning System (GPS) satellites to pinpoint
targets. Upon locating and identifying the target, TISS is
able to hand off information to a variety of weapons
systems, providing precise direction and control for guns
or missiles. All of the system sensors are bore sighted
with an internal tool that allows in-mission precision
alignment. A high performance tracker rounds out the
system. The result is a state of the art detection,
identification, tracking and engagement in daylight, at
night, and even in adverse weather conditions.
The system includes many automatic target tracking
capabilities that can handle multiple targets. The tracker
handles small targets, cluttered backgrounds, momentary
obscurities (ship superstructure, clouds, etc.) and target

318
crossings. Its high resolution infrared (IR) and television
(TV) systems offer the ability to detect, identify, and
track objects in all climates and areas. Together with
shipboard radar and other sensors, TISS provides a robust
situation awareness capability and provides three
dimensional track capabilities that can be used to provide
target pointing.
TISS II is envisioned to replace the Navy Mast-Mounted
Sight (NMMS) as it is more advanced, smaller, and less
expensive.
3. Sensor Overview:
For the purpose of this report, we will focus only on
the optical sight that houses all the sensors.
The Optical Sight houses the TISS sensors, the Thermal
Control Unit (TCU), and an the Optical Bore sight Tool
(OBT). Sight coverage encompasses 270± ° in the azimuth and
30− ° to 85+ ° elevation, with slew rates of 60 / s° in azimuth
and elevation. The slew acceleration in azimuth as well as
in elevation is of 260 / s . The total weight of the turret is
about 130Lbs with a diameter of 18 inches. The line of
sight (LOS) stability is less than 15 microradians.
TISS is a lightweight, state-of-the- art sensor suite
consisting of the following subsystems:
• a high-resolution Thermal Imaging Sensor (TIS),
• two Charged Coupled Devices (CCDs) daylight imaging Television Sensors (TVS),
• an Eye-Safe Laser Range Finder (ESLRF).
• it also incorporates an Automatic Video Tracker (AVT) that is capable of tracking up to two targets within the TISS field of view.

319
Figure 90. TISS II System a. FLIR System Parameters:
Table 21 illustrates the different FLIR system
parameters.
Table 22. FLIR System Parameters
In the Midwave option mode of operation1, the IR
camera, also referred to as a thermal imager or Forward
Looking Infrared (FLIR), weighs less than 30 lbs. and
FLIR: provides IR video
NTV: provides video
ESLRF: provides laser ranging
WTV: provides video

320
consists of a HgCdTe staring focal plane array (FPA), an
integrated dewar and linear Sterling Cooler, and a dual
field of view (FOV) optical train. The high resolution FPA
operating in the 3-5µm of the electromagnetic spectrum
consists of a total of 640 x 480 pixels. The cooler
provides a cool down time of less than 7 minutes for the
FPA at an operating temperature of about 95K. The optics
provides a narrow FOV of 2.2° x1.65° and a wide FOV of
6.6°x4.95°. For the other modes of operation, the FLIR
specifications are outlined in Table 21. The IR camera
provides all weather and night time imaging capability.
The FLIR provides thermal imagery with either
white-hot or black-hot polarity, selectable by the
operator. The FLIR has an automatic gain and level control
(AGLC) system which optimize the display of targets; manual
override is provided. The FLIR also contains a closed cycle
cryogenics system which cools and maintains the FLIR
detectors at their operating temperature. The FLIR also
sends video signals to the AVT for target track processing.
b. Laser System Parameters:
For determining range of targets, TISS uses an
eye-safe laser rangefinder (ESLRF), which provides a 5m±
range accuracy to targets from 100m to 20,000m from the
turret. The ESLRF provides high selectivity and prevents
false returns from atmospheric aerosols, rain, and snow.
Table 23. Laser System Parameters

321
c. TV Camera Parameters:
The different TV camera parameters are listed
below:
Table 24.
Table 25. TV Camera Parameters
Two fixed FOV Charge Coupled Device (CCD) cameras
provide low light and daytime imaging capability with a
spectral response of 600 to 950 mm for haze penetration and
twilight or dawn operations. The operating sensitivity of
the narrow diagonal FOV (2.2°) is from 0.5 lux to 100,000
lux to account for direct sunlight viewing. The operating
sensitivity of the wide diagonal FOV (8°) is 0.5 lux for
low light imaging. The low light capability is advantageous

322
for viewing of shipboard running lights and lights along
the shore during nighttime operations.
The TVS is capable of imaging floating mines,
ships, boats, air targets, and submarine periscopes under
clear visibility conditions (20 km). The TVS has an
automatic gain and level control (AG/LC) which optimize the
display of targets and minimize operator actions necessary
to control the adjustments. Manual adjustments can also be
made. The Automatic Video Tracker (AVT) processes the
digital FLIR and/or TVS video data. The sensors with TISS
provide a complete visible situational awareness to CIC in
day, night, or harsh weather conditions.
4. Performance Evaluation:
For EO systems, the basic measure of determining if
the system meets mission requirements is to determine the
range performance of the target. Generally, this can be
done in two ways.
The first method is based on theoretical calculations
based on the specifications of the different sensors such
as the FOV, effective focal length of the optics and the
number of pixel dimensions in the FPA. Computer models such
as the FLIR 92 and NAVTherm have been developed by the army
to test the performance of IR systems. The final output in
this case is the graph of the minimum resolvable
temperature difference (MRTD) curve. A similar curve called
the minimum resolvable contrast (MRC) is used to measure
the performance of visible cameras where the contrast
between the target and its background is plotted against
the spatial frequency.
The other method of obtaining the MRTD and MRC curves
is to perform laboratory testing of the EO sensors using a

323
collimator that incorporates 4-bar charts, which can
represent targets at various spatial frequencies.
The sensor performance of the TISS has been
successfully evaluated to meet the operational requirements
of the system using both methods of testing. Figure 91
shows an unclassified pictorial representation of the
typical range performance of the TISS for various targets.
Figure 91. TISS Performance Evaluation 5. Conclusion:
TISS II is a very well tested, proven and now fielded
EO sensor for the USN. It is functional and useful in
various environments and conditions and provides early
warning detection of threats that are essential to the
success of the HSAC mission such as floating mines and
small fast attack crafts. In addition, it can be used as a
Navigation aid and a complimentary target identification
system
E. MISSILE TRADE-OFF ANALYSIS:
Working in conjunction with future package designs and
because we were looking for a missile that can handle both
surface and air threats at ranges up to the middle defense
layer, the following choices were analyzed for the choice
Ra

324
of the medium range missile: Evolved Sea Sparrow Missile,
Rolling Airframe Missile, and Standard Missile SM-2 Block
III version for medium range.
Table 26. Missile trade-off-analysis
0
2
4
6
8
10
ESSM RAM SM-2
Missile Trade-off Analysis
Joint vision conceptManeuverabilityCostquantitySizeRange MinRange Max
Figure 92. Missile trade-off-analysis results
ESSM contributes to the Joint Vision 2010 concept of
full-dimensional protection by enhancing ship self-
protection against air and surface threats that have
"leaked" past outer air defenses. Given that some of the
ships that will use ESSM are also platforms from which
strike operations are executed, ESSM indirectly contributes
to the concept of precision engagement. The ESSM will be
the medium range of choice for the HSAC.

325
F. GUN TRADE-OFF ANALYSIS
The selection of the high rate of fire gun was based
on the following criteria: firing rate, range and weight.
The trade off analysis and the corresponding weightings of
the different criteria are best described in Table 26 and
Figure 93 below.
Table 27. Gun Trade-Off Analysis
GUN TRADE OFF ANALYSIS
Gun Firing Rate Weight Range5in 3 10 657mm 10 6 476mm 6 2 10
Weighting 40% 30% 30%
5in 1.2 3 1.857mm 4 1.8 1.276mm 2.4 0.6 3
The selection of the high rate of fire gun was based
on the following criteria: firing rate, range and weight.
The trade off analysis and the corresponding weightings of
the different criteria are best described in Table 26 and
Figure 93.
0
1
2
3
4
5
6
7
5in 57mm 76mm
Gun Trade Off Analysis
Firing RateWeightRange

326
Figure 93. Gun trade-off-analysis results
From the trade-off analysis conducted above, the team
decided to use the Mk 3 BOFORS 57 mm gun as the gun of
choice for the HSAC. It was selected because of its high
firing rate, small weight and volume, and good range for
the purpose of defeating small boats and ASCMs.
G. OPERATING STATEMENTS OF THE HPMADS
The below operating statements are being used to give
ball park figures on the ADS technology. Due to the nature
and classification of the research, exact numbers and
capabilities can not be given at this time. For more
information on ADS, direct inquiries to the Air Force
Research Laboratory, Kirtland AFB.
Active Denial Technology uses a transmitter producing
energy at a frequency of 95Ghz and an antenna to direct a
narrow focused beam of invisible beam towards a designated
subject. Traveling at the speed of light, the energy
reaches the subject and penetrates the skin to a depth of
less than 1/64 of an inch. Almost instantaneously it
produces a heating sensation that within seconds becomes
intolerable and forces the subject to flee. The sensation
immediately ceases when the individual moves out of the
beam or when the system operator turns it off. Unofficial
reports state that a 2-second burst from the system can
heat the skin to a temperature of 130° F. At 50 °C, the
pain reflex makes people pull away automatically in less
than a second. Someone would have to stay in the beam for
250 seconds before it burnt the skin,
Despite this sensation, the beam does not cause injury
because of the shallow penetration depth of energy at this
wavelength and the low energy levels used. It exploits the

327
body’s natural defense mechanism that induces pain as a
warning to help protect it from injury. The heat-induced
sensation caused by this technology, is nearly identical to
the sensation experienced by briefly touching an ordinary
light bulb that has been left on for a while. Unlike a
light bulb, however, active denial technology will not
cause rapid burning. The transmitter needs only to be on
for a few seconds to cause the sensation.

328
THIS PAGE INTENTIONALLY LEFT BLANK
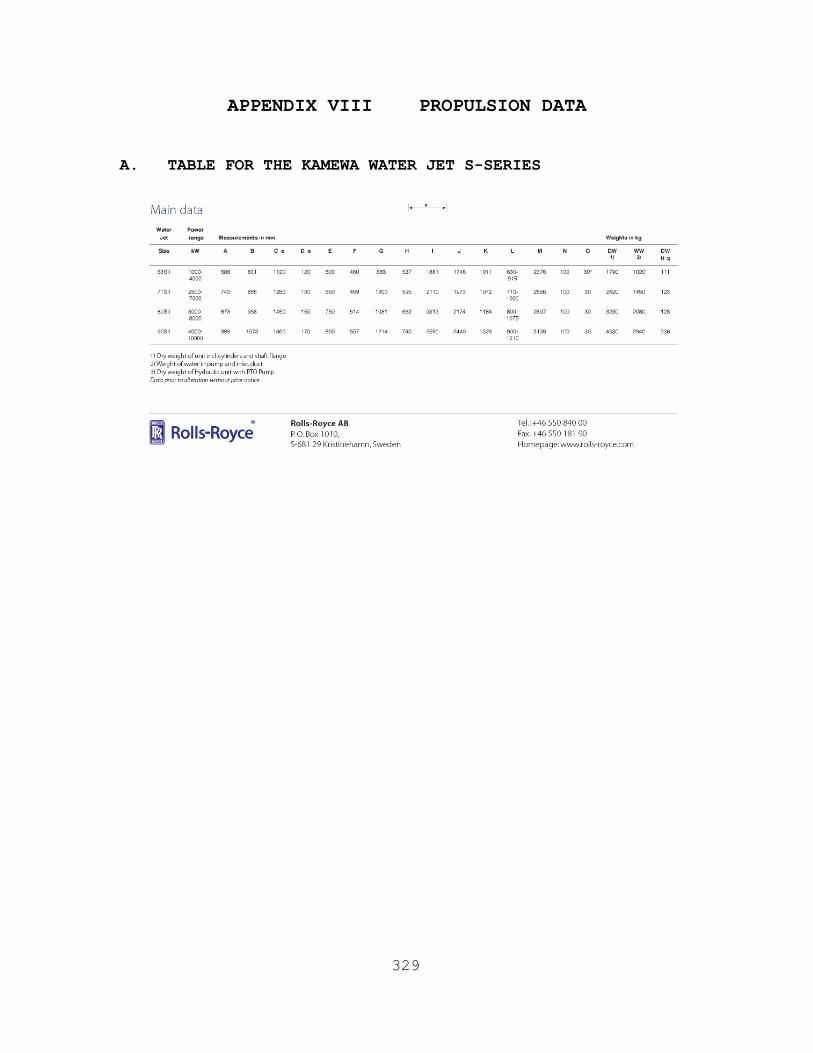
329
APPENDIX VIII PROPULSION DATA
A. TABLE FOR THE KAMEWA WATER JET S-SERIES

330
B. FACT SHEET FOR THE AWJ-21TM PROVIDED BY ROLLS-ROYCE

331
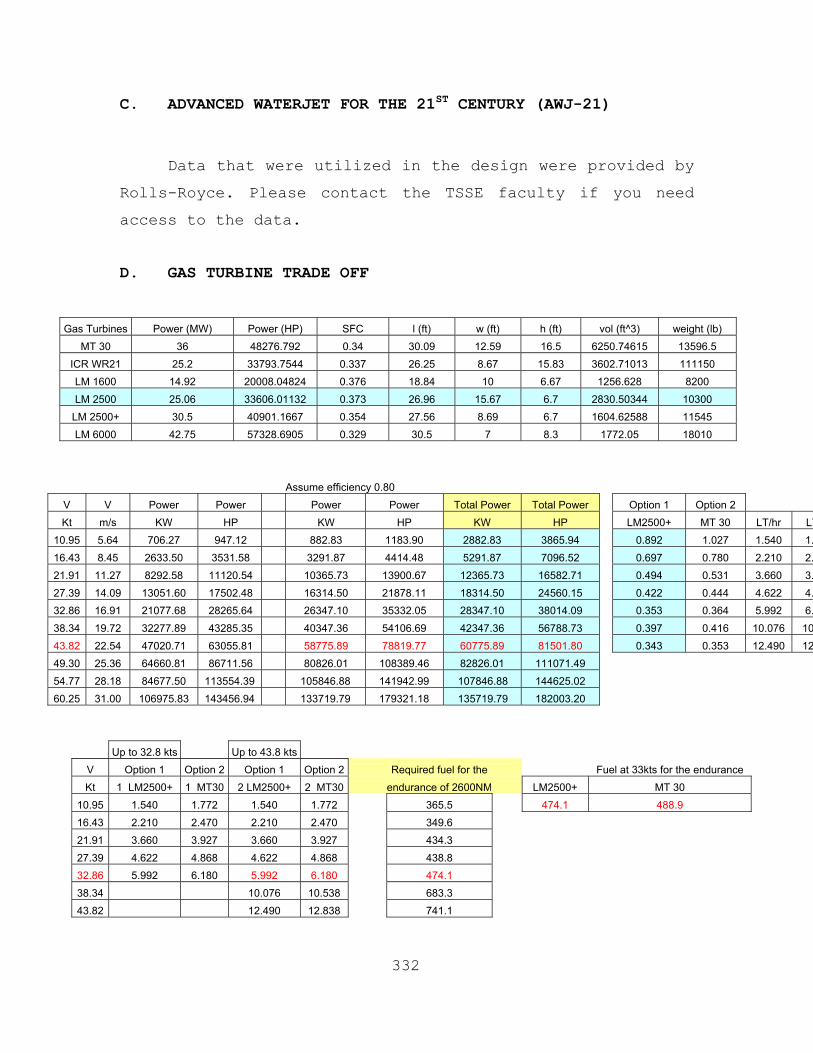
332
C. ADVANCED WATERJET FOR THE 21ST CENTURY (AWJ-21)
Data that were utilized in the design were provided by
Rolls-Royce. Please contact the TSSE faculty if you need
access to the data.
D. GAS TURBINE TRADE OFF
Gas Turbines Power (MW) Power (HP) SFC l (ft) w (ft) h (ft) vol (ft^3) weight (lb) MT 30 36 48276.792 0.34 30.09 12.59 16.5 6250.74615 13596.5
ICR WR21 25.2 33793.7544 0.337 26.25 8.67 15.83 3602.71013 111150 LM 1600 14.92 20008.04824 0.376 18.84 10 6.67 1256.628 8200 LM 2500 25.06 33606.01132 0.373 26.96 15.67 6.7 2830.50344 10300
LM 2500+ 30.5 40901.1667 0.354 27.56 8.69 6.7 1604.62588 11545 LM 6000 42.75 57328.6905 0.329 30.5 7 8.3 1772.05 18010
Assume efficiency 0.80 V V Power Power Power Power Total Power Total Power Option 1 Option 2 Kt m/s KW HP KW HP KW HP LM2500+ MT 30 LT/hr LT
10.95 5.64 706.27 947.12 882.83 1183.90 2882.83 3865.94 0.892 1.027 1.540 1.16.43 8.45 2633.50 3531.58 3291.87 4414.48 5291.87 7096.52 0.697 0.780 2.210 2.21.91 11.27 8292.58 11120.54 10365.73 13900.67 12365.73 16582.71 0.494 0.531 3.660 3.27.39 14.09 13051.60 17502.48 16314.50 21878.11 18314.50 24560.15 0.422 0.444 4.622 4.32.86 16.91 21077.68 28265.64 26347.10 35332.05 28347.10 38014.09 0.353 0.364 5.992 6.38.34 19.72 32277.89 43285.35 40347.36 54106.69 42347.36 56788.73 0.397 0.416 10.076 1043.82 22.54 47020.71 63055.81 58775.89 78819.77 60775.89 81501.80 0.343 0.353 12.490 1249.30 25.36 64660.81 86711.56 80826.01 108389.46 82826.01 111071.49 54.77 28.18 84677.50 113554.39 105846.88 141942.99 107846.88 144625.02 60.25 31.00 106975.83 143456.94 133719.79 179321.18 135719.79 182003.20
Up to 32.8 kts Up to 43.8 kts V Option 1 Option 2 Option 1 Option 2 Required fuel for the Fuel at 33kts for the endurance Kt 1 LM2500+ 1 MT30 2 LM2500+ 2 MT30 endurance of 2600NM LM2500+ MT 30
10.95 1.540 1.772 1.540 1.772 365.5 474.1 488.9 16.43 2.210 2.470 2.210 2.470 349.6 21.91 3.660 3.927 3.660 3.927 434.3 27.39 4.622 4.868 4.622 4.868 438.8 32.86 5.992 6.180 5.992 6.180 474.1 38.34 10.076 10.538 683.3 43.82 12.490 12.838 741.1

333
V (Kts) LM2500+ MT 30 LM2500+ MT 30 Power
10 0.759 0.821 0.800 0.900 5731.791
15 0.641 0.684 0.675 0.750 7756.822
20 0.475 0.492 0.500 0.540 14092.649
25 0.422 0.438 0.445 0.480 18785.774
30 0.380 0.383 0.400 0.420 27037.672
35 0.358 0.351 0.377 0.385 38597.591
MT30 VS LM2500 + LM2500+
weight factor 0.300 0.150 0.350 0.200 sfc 0.215 kg/KW*hr
volume weight sfc power/weight total weight 20 tn
MT30 0.500 0.700 0.600 0.700 volume 67 m3
LM2500+ 0.800 0.750 0.800 0.900
weighted volume weight sfc power/weight total AWJ-21 4 tn
MT30 0.150 0.105 0.210 0.140 0.605
LM2500+ 0.240 0.113 0.280 0.180 0.813
HSC motor 25 tn
Sfc vs Power
y = 43.525x-0.4536
y = 25.44x-0.4056
0.000
0.100
0.200
0.300
0.400
0.500
0.600
0.700
0.800
0.900
1.000
0.000 5000.000 10000.000
15000.000
20000.000
25000.000
30000.000
35000.000
40000.000
45000.000
Power [HP]
Sfc
[lb/h
p-hr
]
LM2500+
MT30
Power(MT30)Power(LM2500+)
334
APPENDIX IX DAMAGE CONTROL DATA
A. SHIP NUMBERING AND COMPARTMENT INDENTIFICATION
1. Ship Numbering System
a. Compartment Numbering
Compartments are numbered for identification to facilitate location. The identification number assigned locates each compartment specifically, and generally indicates the function and use of the compartment. Compartment numbers consist of four parts, separated by hyphens, in the following sequence: Deck Number, Frame Number, Position in relation to centerline of ship, and Compartment use.
b. Deck Number
The main deck is the basis for this numbering scheme and is numbered 1. The first deck below the main deck is numbered 2, and so on. The first horizontal division above the main deck is numbered 01, and the numbers continue consecutively for subsequent upper divisions boundaries. Compartments are numbered by the lowest deck within the space.
c. Frame number
The forward perpendicular is the basis for this numbering scheme and is numbered "0." "Frames" are consecutively numbered, based on frame spacing, until the aft perpendicular is reached. Forward of the forward perpendicular, frames are "lettered" starting from the perpendicular to the bullnose (A, B, C, etc.) while frames aft of the after perpendicular are "double lettered" to the transom (AA, BB, CC, etc.). Compartments are numbered by the frame number of the foremost bulkhead of the compartment. If this bulkhead is located between "frames," the number of the foremost "frame" within the compartment is used. Fractional numbers are not used except where frame spacing exceeds four feet.
d. Position in relation to centerline
The ship's centerline is the basis for this numbering scheme. Compartments located so that the centerline of the ship passes through them are assigned the number 0. Compartments located completely to starboard of the centerline are given odd numbers, and those to port of centerline are given even numbers. The first compartment outboard of the centerline to starboard is 1, the second is

335
3 and so forth. Similarly, the first compartment outboard the centerline to port is 2, the second is 4 and so forth. There may be cases in which the centerline of the ship would pass through more than one compartment, all of which may have the same forward bulkhead number. Whenever this occurs, that compartment having the portion of the forward bulkhead through which the centerline of the ship passes is assigned the number 0 and the other carry numbers 01, 02, 03 etc.
e. Compartment Use
A capital letter is used to identify the assigned primary use of the compartment. Only one capital letter is assigned, except that on dry and liquid cargo ships, a double letter identification is used to designate compartments assigned to carry cargo. Examples of compartment use are storage areas, various tanks, and living quarters.
2. Compartment / Fitting Identification
a. Bull's eyes
Bull's eyes shall be painted on a bulkhead of each compartment. Each bull's eye shall contain the compartment number, the foremost and aftermost frame of the compartment, and the division responsible for the compartment. They should be positioned so that they are readily visible upon entry into the compartment. Do not allow bull's eyes to be hidden behind file cabinets or doors. The letters shall be black, two inches in height, painted on a 12 inches high by 15 inches wide yellow or photo luminescent background. Remember, photo luminescent markings are prohibited where they may be visible from the weather.
b. Compartment designation plates
Compartment designation plates are located on the bulkhead above the access. Where space is insufficient, the label plates shall be located on the bulkhead adjacent to the access on the side away from the hinges. Compartment designation plates shall list the numbers of the access fitting, the compartments on both sides of the access as well as the name of the compartment accessed.
c. Frame and Bulkhead Label Plates
One frame label plate shall be installed in compartments over 24 feet in fore-and-aft length and every 24 feet of length of weather decks and hangar deck. A transverse bulkhead label plate shall be installed in compartments having a tightness requirement only if the
336
bulkhead cannot be identified by other means, such as an access label plate.
d. Fitting Numbering
Fittings are numbered in a similar fashion as compartments with the omission of the fourth number (compartment use). More than one fitting may have the same three number designator (e.g. 3-150-0); so, to further identify each fitting, the type of fitting or the system the fitting belongs to must be included in the numbering.
For Example: A valve in the firemain system: FM COV 3-150-0
If a new fitting is installed in a system, it is issued a number using the above guidance. If a valve currently has that number it is renumbered accordingly.
B. BATTLE STATIONS
1. Traffic Flow
To rapidly man battle stations, all personnel must be
able to transit the ship's passageways simultaneously
without interference. To accomplish this, a generic
traffic flow scheme has been defined which is:
UP AND FORWARD TO STARBOARD, DOWN AND AFT TO PORT
It is understood that this may not be feasible for all
areas of the ship (i.e. narrow passageways or only one on
the Damage Control Deck). In these conditions, the DCA will
determine local traffic control schemes. Also,
consideration may be made on setting material condition
(i.e. not shutting watertight doors on the Damage Control
Deck until a certain time after GQ is called).
2. Manned and Ready Report
The senior person in charge of the Damage Control
Repair Station (DCRS) is responsible for giving the manned
and ready report. A battle station may report manned and
ready when the station has enough personnel to do the job.
Although open to interpretation in some instances, this

337
definition allows personnel to be more readily available in
less time.
3. Battle Dress
Battle dress has been proven to minimize the personnel
injuries from minor effects from weapon hits. It also
serves as the basis for fire-fighting clothing. Battle
dress is not the same for all battle watch stations, but
basic battle dress includes:
• Long-sleeved shirt with sleeves rolled down and all buttons buttoned
• Trousers with pant legs tucked into socks
• Leather safety footwear
• Anti-flash Gear, gas mask, life vest
4. Distributed Stowage
To rapidly allow the damage control teams to prepare
for action, their damage control equipment has been moved
into the passageways under the scheme of Distributed
Stowage. This scheme also divides these teams up so that
not all of a given team and equipment are destroyed by a
single weapon hit. During non-GQ incidents, distributed
stowage will reduce the time for team response as well as
reducing the confusion around the repair station itself.
By disbursing equipment throughout a repair station's area
of responsibility, you achieve redundancy, improved
reaction time, and survivability. Elements of the new
stowage philosophy are:
• Organize equipment by its function
• Relocate appropriate equipment to the passageways
• Relocate large equipment to the passageways and group, by function, near power and exhaust sources.

338
• Distribute teams and equipment by setting up port and starboard teams, fore and aft teams, and above and below deck teams.
• Provide adjusting shelves for repair stations.
• Utilize ship's shell by shelving and brackets.
• Plan for improvements to equipment.
C. SALVAGE SHIP OR SCUTTLE SHIP
If the ship has sustained damage so extensively that
her survival is in question, the C.O. may decide either to
continue efforts to save her or to scuttle the ship to
prevent its use by hostile forces. Before the C.O. can make
this decision, he needs as much information as possible
from the Tactical Action Officer (TAO), Chief Engineer
(CHENG), and DCA. If the decision is to save the ship, all
efforts to control damage must be prioritized and attacked
aggressively. If the decision is to scuttle the ship,
several evolutions must occur simultaneously.
1. Abandon Ship and Emergency Destruction
All personnel not involved with the emergency
destruction of equipment or classified information report
to their abandon ship stations. Personnel involved with
emergency destruction will carry out procedures outlined in
the Emergency Destruction Bill. Scuttle ship procedures
must be carried out only after emergency destruction has
been completed. Personnel involved with emergency
destruction will now report to their abandon ship station
and abandon ship will commence. Once abandon ship has
commenced, the C.O. will order the ship scuttled. As soon
as this order is heard, it must be done quickly, safely,

339
and completely as possible to prevent the ship from falling
into enemy hands or to meet a tactical situation
The Engineer Officer, under the supervision of the
Executive Officer, is responsible for maintaining the
Scuttle Ship Bill. The Engineer Officer is responsible for
the main engineering spaces during Salvage and Demolition.
The DCA is responsible for all spaces outside of main
engineering
a Scuttle Ship Bill (topics that will be addressed
(1) Purpose
(2) Responsibilities
i) Engineer Officer
ii) Damage Control Assistant
iii) Operations Officer
iv) Weapons Officer
v) First Lieutenant
(3) Information
i) Equipment used
ii) Communications used
iii) Personnel involved
(4) Procedures
i) Word passed
ii) Demolition of equipment
iii) Securing the detail
iv) Abandoning ship
Certain other pieces of equipment should also be
completely destroyed to prevent salvage by enemy forces.
Among the more important pieces are the following:
(1) All unclassified electronics equipment, weapons launchers and hoists.
(2) Generators, switchboards, and gyro compasses. (3) Main engine bearings, reduction gears and turbine
blades.
340
D. CONDITIONS OF READINESS AND OTHER CLASSIFICATIONS
1. Material Conditions of Readiness
X-RAY - Set when the ship is in almost no danger of attack or natural hazard, as when it is in a well protected harbor or secured at home base, in fair weather, during normal working hours. All closures and fittings classified X-RAY should be closed at all times. They are labeled with a black letter X.
YOKE - Set and maintained at sea, when entering or leaving port during peacetime, in port outside of normal working hours during peacetime, and in port during wartime. When material condition YOKE is set, both X-RAY and YOKE closures and fitting are secured. YOKE closures and fittings are labeled with a black Y.
ZEBRA - Set during General Quarters. It is also set when the ship is leaving or entering port during a time of war, or at any time the ship is in a damaging situation such as fire or flooding. When material condition ZEBRA is set all X-RAY, YOKE and ZEBRA closures and fittings are secured. ZEBRA closures and fittings are labeled with a red Z.
2. Other Damage Control Classifications
Circle X-Ray and Circle Yoke Assigned to fittings and closures that may be opened without special permission by personnel proceeding to or from battle stations, or as required for routine inspection, or access to vital spaces. They must be immediately closed and secured after passing through.
Circle Zebra In situations where the ship has material condition Zebra set for extended periods of time, the Commanding Officer can authorize the use of Circle Zebra closures and fittings to facilitate the feeding of the crew and to allow the use of selected sanitary spaces. They may be used in the same way as Circle X-Ray and Yoke fitting and closures.
Dog Zebra Closures and fittings that are required to be secured when condition Zebra is set or during periods of darken ship. These fittings and closures are located in decks and bulkheads exposed to the weather. Therefore, they must be closed during darken ship to prevent light from showing outside the ship.
William Closures and fittings that are open during all material conditions. William closures and fittings are

341
only secured to control damage or casualties and to effect repairs.
Circle William Fittings that access ventilation that may be open and operating regardless of material condition of readiness. These fittings are required to be secured only to prevent the spread of the effects of damage or for CBR defense.
3. Modified Material Conditions of Readiness
Modified Yoke Same classification as condition Yoke except only X-Ray and Yoke fittings and closures below the waterline are closed. X-Ray and Yoke fittings and closures above the waterline may be open to improve accessibility and habitability. Commanding Officer's permission is required.
Modified Zebra Same classification as condition Zebra except only X-Ray, Yoke and Zebra fittings and closures below the waterline are closed. X-Ray, Yoke and Zebra fittings and closures above the waterline may be open to improve accessibility and habitability. Commanding Officer's permission is required.
E. SHIP SURVIVABLILITY
1. Damage Control Total Ship Survivability
When a total ship repsonse is needed, all personnel must understand what needs to be done. This will require prior training and coordination between command stations.
2. Considerations (Sources of Confusion)
a. C3 - Command, Control, and Communications
Command must make its priorities known to all and continuously update those priorities during action. A rigid chain of command must be maintained to ensure no duplication of effort while ensuring all action is taken. Controlling stations must be able to communicate and work together to ensure actions are coordinated. These stations include Combat Information Center (OIC: CICWO), Main Control (OIC: EOOW), and Damage Control Central (OIC: DCA). Also, to ensure that these stations easily work together, they must be looking at the same plan(s). Most ships have a Combat Systems Operational Sequencing System (CSOSS), Engineering Operational Sequencing System (EOSS), and Damage Control Book and Diagrams. A valve in a system (like Chilled Water) will have a Damage Control number and a CSOSS number and an EOSS number. Before a casualty can be effectively combated, these three numbers must be reduced

342
to a single identifier. It is suggested that the DC number is used since it can be used to locate the valve. Communications must be clear at all times. This may require alternate means, especially if a controlling station must be evacuated due to damage or smoke.
b. Intense Heat and Heavy Smoke
The intense heat produced by burning fuel from a weapon will prevent fire fighting teams from approaching close enough for extinguishment. Also, damage inflicted by the weapon may render installed fire fighting systems inoperative. Until those teams are able to contain this fire; heat and smoke will continue to be produced and unless these products are controlled, the ship as a whole may become untenable. The proper use of containment strategies and smoke control will be the only way for the ship to continue in its operation. The above actions may require non-damage control personnel to take action (like OS's) thus they must also be trained in the how and why of smoke control and fire containment. The possibility of using installed ventilation systems to purge ship of smoke should be considered. Portable blowers found aboard ship do not have the capability to move vast quantities of smoke.
c. Personnel Casualties
The shock from weapon impact and detonation and then the fire ball that follows may injure a large number of personnel. The injuries will range from localized minor burns to an array of internal injuries. The number and extent of these casualties may quickly overcome the medical department. With a large number of minor personnel casualties, the damage control teams will be needed to assist the medical department. Their knowledge of basic first aid will be of great importance.
d. System(s) Restoration
Electrical power is probably the overall first priority since it supplies fire fighting water (electric driven fire pumps), lighting, basic communication systems, and electronic gear. Even though most power is 440 VAC, three phase, 60 Hz, 400 Hz power must NOT be forgotten. Even if electronics have supply (60 Hz) power, they will not work if they do not have gyro input (a 400 Hz load) or synchro power which is mainly 400 Hz. The best possible pre-damage electrical system line-up must be determined (split plant vs. parallel operation). Combat System support systems (chilled water, dry air, electronic cooling systems, and possibly firemain) must be restored rapidly and in a prioritized order. Controlling stations must know

343
this order and act accordingly. Again, pre-damage system alignment should be determined.
e. Material Stowage
Prior to going into battle, it is advised that a ship performs Strip Ship. This evolution will remove materials unnecessary for combat. The removal of these materials will reduce the amount of secondary fires produced as well as the smoke. Other actions to ensure all stowed material is securely held in place shall also be taken. Special concern should be directed towards removal of hazardous materials (HAZMAT). Paint lockers and other flammable liquid storerooms should be emptied as much as possible. Engineering plant chemicals should be protected as much as possible. Damage control equipment must be distributed throughout the ship to reduce the loses from a single weapon hit. Thoughtful decisions on where this equipment should be placed will reduce the response time of damage control parties. Distributing of personnel should also be considered. Equipment should also be stowed topside to outfit personnel trying to regain access into the ship after being driven out by heat and smoke.
3. Pre-damage Actions
a. Knowledge
The crew’s goal is to know as much as possible of your ship and its systems. Another goal should be to teach as many people as possible this knowledge (i.e. Embarked solders/marines). Ensure all hands have basic first aid training, also basic damage control training, more than the bare minimum qualification. Look at "superstructure" personnel as assets for damage control efforts. Vertical fire spread can be stopped by quick and proper action by these personnel.
b. Damage Containment Strategies
A preplan will be established to confine damage to a localized area. With this already thought out, it will be mentally easier to deal with the damage. The staging of DC equipment at strategic locations will allow these strategies to be rapidly put into place. The establishment of pre-damage system alignment will give personnel information needed to base casualty response to restore the systems to battle readiness.
4. General Emergencies
The ship may experience emergencies that are not best handled by the crew going to General Quarters. These
344
situations may be best covered by a general set of guidelines in the form of a General Emergency Bill.
a. General Emergency Bill
The SORM will delineate the information and use of a General Emergency Bill. It is designed for major emergencies and is generic in response. The CHENG is responsible for ensuring the bill is current and ready for execution. The DCA should also ensure that it includes the latest of damage control directives, especially fire party organization and procedures. The bill cover actions taken by the entire crew when it is aboard as well as actions taken by a partial crew while in port. Everyone is required to know their actions during these situations. Also, if the person required to take action is not available or otherwise not able to take action, someone will have to take charge and ensure those actions are carried out. This bill is generic because not all possible situations can be planned out. It is up to the personnel in charge to determine which actions are required and ensure that they are carried out. This bill could also be made to cover casualties not requiring the attention and participation of the entire crew.
5. Mass Conflagration
A mass conflagration is damage of a magnitude that cannot be readily handled by the conventional damage control organization; therefore, all-hands participation is required to save the ship. It is not required to be fire, but also may be flooding, natural disaster, or mass casualties. The general emergency bill should be utilized to combat this casualty. Information to support the actions required to be taken may come from other bills (e.g. Main Space Fire Doctrine, Rescue of Survivors Bill, Civil Disaster Bill, Heavy Weather Bill, Toxic Gas Bill, etc.) All personnel must be trained to react instinctively to combat the possible disastrous effects of a major conflagration scenario. On scene leadership must quickly evaluate the situation, organize available personnel and damage control assets to contain and limit the casualties. The DCA must ensure to include the major conflagration exercise in training drills. This will help prepare a ship's total crew in their efforts to counter a mass conflagration situation. Consult FXP-4 for further information on the Major Conflagration Exercise.
6. Rescue and Assistance
Emergencies may arise on other ships or shore stations which require actions to be taken by personnel from your

345
ship (i.e. the Rescue and Assistance Detail). It is not implied here that the HSAC will be required to supply assistance under all situations. Security of your own ship is paramount. The Rescue and Assistance detail is an organization of qualified personnel to render assistance to persons or activities outside the unit. The Rescue and Assistance Detail may be called away underway or inport. The following will apply to rescue and assistance:
a. Personnel assigned to the R&A detail will be known.
b. Equipment required by the R&A detail will be separate from ship Dc equipment needs:
c. In port, the R&A equipment chest be kept on the pier IAW local SOPA regulations.
d. During an actual casualty, only the needed equip-ment will be sent. Decision for equipment brought should be made by the Officer in Charge. Communications with the ship shall be maintained at all times.
e. The Rescue and Assistance Detail will be employed for the following situations (not all inclusive):
Plane crashes in the vicinity of the unit Distress on another ship or ashore Rescue of a large number of survivors
f. Because it is impossible to plan and drill for every possible R&A scenario, the personnel involved must be able to be flexible enough to respond and take the appropriate actions. Consult FXP-4 drill, Rescue and Assistance, for evaluating the R&A party in handling emergencies away from the ship.
F FIRE BASICS
1. The Fire
Terms associated with fires.
Flash Point: The lowest temperature at which a substance gives off sufficient vapor to form an ignitable mixture, usually not enough to sustain combustion. Storage requirements for flammable liquids aboard ship are based on the flash point.
Fire Point: A temperature slightly above flash point that allows for sustained combustion.
2. Fire Triangle components (SMOLDERING OR SURFACE GLOW)

346
• fuel
• oxygen
• heat
NOTE: These are the three requirements for a fire to start, removal of any one of these will prevent or extinguish most fires, however when open flame is present a fourth element comes into play.
Fire Tetrahedron components (OPEN FLAME) • Fuel
• Oxygen
• Heat
• Uninhibited chain reaction of combustion, this accounts for the fire extinguishing properties of PKP and Halon.
Self Sustaining Reaction • Burning vapor produces heat
• Heat releases and ignites more vapor
• Burning vapor produces more heat
• Heat control is as important as Flame control, particularly if the fire is getting out of hand.
3. Fire Dynamics
Growth Stage: Average space temperature is low and the fire is localized in the vicinity of its origin.
Flashover Stage: Normally occurs when the upper smoke layer temperature reaches approx. 1100 deg F. Characterized by the sudden propagation of flame through the unburnt gases and vapors in the hot upper layer.
Fully Developed Fire Stage: All combustibles in the space have reached their ignition temperature and are burning. Burning rate is limited by the amount of oxygen available. Unburnt fuel in the smoke may burn as it meets fresh air. A fully developed fire will normally be inaccessible by hose teams and require extinguishment by indirect attack. This stage can develop quickly in a main machinery space flammable liquid fire.
Decay Stage: Eventually, the fire consumes all available fuel and/or oxygen at which time combustion slows down and the fire goes out.

347
a. Types of Fires
• Class "A" examples: Paper, Mattresses,
Rags, etc.
• Class "B" examples: Fuel Oil, Paint,
Alcohol, etc.
• Class "C" examples: Controllers,
Motors, etc.
• Class "D" examples: Special hazards,
burning metals.
b. Extinguishing Methods
• Cooling Remove/Lower heat
• Smothering Remove/Displace
oxygen
• Interrupt Combustion Break up Fire
Tetrahedron
• Starving Remove fuel
G. DC ORGANIZATION FOR A FIRE
a. Different Types of Fire parties
(1) Repair Party (FIRE PARTY) • Manned up during G.Q. • Represents greatest level of readiness • Rispatched from Locker to the scene of
reported fires by RPL (2) At-Sea (FIRE PARTY) • Responds immediately to fire alarms
when repair parties are not manned. • Extinguish small fires without
disrupting operations. • Control fires until critical evolutions
can be terminated and G.Q. can be set. (3) In port Emergency Team • Designed to handle any emergency in
port during and after normal working hours.
• Required for each duty section

348
b. Functions That Make Up the Fire Party:
(1) Repair Party Leader • normally only assigned during GQ • responsible for organization and
training of the personnel assigned to the DCRS must be PQS qualified
(2) Fire Marshal • Required in port/at-sea during non-
condition 1 • Proceeds directly to the scene of the
fire to direct efforts of the RRT • If fire is beyond "RRT" capabilities,
F/M will turn over to On-Scene Leader, and assume other duties as directed. These duties may include: - Repair Party leader - Supervise communications - Post boundary men - Direct logistic support
• The F/M must assume a big-picture role and pay particular attention to potential for vertical fire spread.
• Recommend G.Q. if required (3) On Scene Leader • In charge at the scene • Reports to scene of the fire equipped
to assume control of the fire party • Shall wear SCBA • Directs all firefighting operations • Establish comms with DCC or RPL with
best means available • designates equipment to be used (4) Team Leader • SCBA • In charge of attack team • Uses NFTI if required • Directs firefighting effort • Reports to the Scene Leader (5) Nozzleman • SCBA • primary firefighter • reports to / receives orders from Team
Leader

349
• can function as Team Leader if NFTI is not required
(6) "Backup" Nozzleman • SCBA • Provides second hose (if required) • utilized at Team Leader's /Scene
Leader's discretion (7) Hosemen • SCBA • tend hoses under direction of nozzle
men • relay orders and information between
OSL and Team Leader (8) Plug men
• one per hose • should have SCBA available • charges hoses when directed by OSL • operates marine strainer • rig and operate P-100 • rigs jumper hoses as required • provides C02 / PKP as required • rig and operate portable inline foam
eductor (9) Investigators • investigates area to which assigned • follows principles of investigation
- rapid, but cautious
- thorough
- report findings
- repeat investigation • continuously reports to repair party
leader/scene leader using best means available
• wears SCBA • works in pairs • patrols fire boundaries • if fire/damage is found one
investigator reports, other provides initial action.
(10) Boundarymen • sets and maintains fire boundaries

350
• removes/relocates flammables from boundary
• cools bulkhead/overhead/deck as required
• SCBA recommended but not required unless within Smoke Boundary
• may be required to man installed Fire Fighting systems (i.e. AFFF, HALON, MAG SPRINKS)
• minimum of four assigned to fire party. More may be required
• depending on magnitude of fire. • other resources for boundarymen (11) Messenger • relays orders and information • familiar with standard damage control
symbology • thoroughly familiar with routes and
accesses through the ship (12) Phone Talker • damage control central and each
repair/unit locker • operate the designated DC comms circuit • rig emergency phone circuits when
required • use standard damage control symbology (13) Electrician • secures electrical power as directed. • must be knowledgeable of vital
circuitry • overhauls class Charlie fires • energizes electrical equipment • assesses electrical damage and performs
emergency repairs. (14) Accessman • SCBA required • gains access to the fire affected space
when directed by the scene leader. • must be familiar with all forcible
entry equipment • does not have to be a "dedicated body". (15) Reflash watch • SCBA required
351
• is posted after fire is reported out • have appropriate extinguishing agent(s) • be positioned where best able to
respond to reflash (16) Overhaulman • SCBA required • work together with reflash watch to
thoroughly extinguish fire • secures potential reignition sources (17) Smoke Controlman • secure/manipulate ventilation systems • install smoke curtains/blankets • rig and employ desmoking equipment as
directed by the scene leader. (18) Dewaterman • rig and employ appropriate dewatering
equipment or systems • when directed by the scene leader. (19) First Aid • all personnel shall be qualified to
perform basic first aid (20) Rapid Response Team • proceeds directly to the scene • no SCBA or protective clothing required • attempts to extinguish/contain under
direction of fire marshall • (4) personnel to be assigned; may have
other functions on fireparty; i.e. boundaryman, electrician
• reports to locker when relieved or carries out duties as directed
• not required for G.Q. repair party organization
• do not normally respond to emergencies in "steaming"
• engineering spaces

352
APPENDIX X COST AND WEIGHT ESTIMATION
A. WEIGHT ESTIMATION SWBS Description Weight
110 SHELL + SUPPORTS 294.9120 HULL STRUCTURAL BULKHEADS 390.5130 HULL DECKS 402.9140 HULL PLATFORMS 54.0150 DECK HOUSE STRUCTURE 141.2160 SPECIAL STRUCTURES 494.3170 MAST + KINGPOST + SERV PLATFORM 19.9180 FOUNDATIONS 70.6190 SPECIAL PURPOSE SYSTEMS 74.8
Group Total: 1943.2230 PROPULSION UNITS 49.8240 TRANSMISSION + PROPULSOR SYSTEMS 9.7250 SUPPORT SYSTEMS 25.3260 PROPULSION SUPPORT - FUEL, LUBE, OIL 3.7290 SPECIAL PURPOSE SYSTEMS 2.7
Group Total: 91.3310 ELECTRICAL POWER GENERATION 20.8320 POWER DISTRIBUTION 68.2330 LIGHTING SYSTEMS 17.5340 POWER GENERATION SUPPORT SYSTEMS 8.9390 SPECIAL PURPOSE SYSTEMS 2.9
Group Total: 118.3410 COMMAND + CONTROL SYSTEMS 23.9420 NAVIGATION SYSTEMS 2.5430 INTERIOR COMMUNICATIONS 7.3440 EXTERIOR COMMUNICATIONS 6.0450 SURF SURV SYSTEMS (RADAR) 10.4460 UNDERWATER SURV SYS 0.5470 COUNTERMEASURES 3.3480 FIRE CONTROL SYSTEMS 1.7490 SPECIAL PURPOSE SYSTEMS 55.7
Group Total: 111.3510 CLIMATE CONTROL 45.8520 SEA WATER SYSTEMS 27.0530 FRESH WATER SYSTEMS 7.5540 FUEL/LUBRICANTS, HANDELING+STORAGE 60.4550 AIR, GAS + MISC FLUID SYSTEMS 9.3560 SHIP CNTL SYSTEMS 0.0570 UNDERWAY REPLENISHMENT SYSTEMS 45.9580 MECHANICAL HANDELING SYSTEMS 84.1590 SPECIAL PURPOSE SYSTEMS 21.9
Group Total: 301.9610 SHIP FITTINGS 0.4620 HULL COMPARTMENTATION 24.9630 PRESERVATIVES+COVERING 46.9640 LIVING SPACES 20.8650 SERVICE SPACES 8.3660 WORKING SPACES 20.8670 STOWAGE SPACES 35.3680 SPECIAL PURPOSE SYSTEMS 1.1
Group Total: 158.6

353
710 GUNS + AMMUNITION 36.2720 MISSILES+ROCKETS 47.4730 SMALL ARMS+PYROTECHNICS 4.3740 MINES 0.0750 DEPTH CHARGES 0.0760 TORPEDOES 0.0770 AIRCRAFT RELATED WEAPONS 0.8780 SPECIAL PURPOSE SYSTEMS 7.8790 SPECIAL PURPOSE SYSTEMS 67.7
Group Total: 164.2F10 SHIPS FORCE 17.3637F20 MISSION RELATED EXPENDABLES 76.6828F30 STORES 39.2138F40 LIQUIDS, PETROLEUM BASED 851.5700F50 LIQUIDS, NON-PETROLEUM BASED 37.8429
Total Payload w eight: 1271.9133Group Total: 1022.7
Full Load (LT): 3911.4Growth Margin: 6.0%
Full Load Displacement (LT): 4146.1Light Ship (LT): 3123.5
Dead Weight (LT):Payload Fraction (with fuel):
Payload Fraction (without fuel): B. COST ESTIMATION
Lightship We Total Dead Weigh Total Shipw eight Ref Tot. 3127 1027 4154
ACCESS ACCESS ACCESS ACCESSWT Wt/Tot MAT MATERIAL Labor Labor
Description (LT) Other CER COSTS CER HoursSHELL + SUPPORTS 294.934 0.09432 1181 $348,317 316 93199HULL STRUCTURAL BULKHEADS 390.476 0.12487 1181 $461,152 316 123390HULL DECKS 402.938 0.12886 1181 $475,870 316 127328HULL PLATFORMS/FLATS 54.002 0.01727 1181 $63,776 316 17065DECK HOUSE STRUCTURE 141.236 0.04517 1028 $145,191 692 97735SPECIAL STRUCTURES 494.326 0.15808 1632 $806,740 251 124076MASTS+KINGPOSTS+SERV PLATFORM 19.89766 0.00636 6183 $123,027 164 3263FOUNDATIONS 70.618 0.02258 1028 $72,595 359 25352SPECIAL PURPOSE SYSTEMS 74.772 0.02391 5000000 4758 $5,355,765 404 30208
Structure Sum 1943.2 0.62143 $7,852,434 641617
PROPULSION UNITS 49.848 0.01594 144 $7,178 209 10418TRANSMISSION+PROPULSIOR SYSTEMS 9.67882 0.00310 63 $610 162 1568SUPPORT SYSTEMS 25.3394 0.00810 288 $7,298 412 10440PROPUL SUP SYS -FUEL,LUBE OIL 3.7386 0.00120 36916 $138,014 1412 5279SPECIAL PURPOSE SYSTEMS 2.65856 0.00085 288 $766 0 0
Propulsion Sum 91.3 0.02919 $153,865 27705
ELECTRIC POWER GENERATION 20.77 0.00664 650 $13,501 4 83POWER DIST. SYSTEM 68.16714 0.02180 98329 $6,702,807 1294 88208LIGHTING SYSTEM 17.52988 0.00561 5450 $95,538 1329 23297POWER GEN SUPPT. SYSTEM 8.9311 0.00286 14545 $129,903 1882 16808SPECIAL PURPOSE SYSTEMS 2.94934 0.00094 788 $2,324 471 1389
Electrical Sum 118.3 0.03785 $6,944,072 129786
COMMAND+CONTROL SYS 23.9463 0.00766 150000 $3,591,945 235 5627NAVIGATION SYS 2.4924 0.00080 150000 $373,860 235 586INTERIOR COMMS 7.2695 0.00232 150000 $1,090,425 235 1708EXTERIOR COMMS 5.98176 0.00191 150000 $897,264 235 1406SURF SURV SYS (RADAR) 10.385 0.00332 150000 $1,557,750 235 2440COUNTERMEASURES 0.527558 0.00017 150000 $79,134 235 124FIRE CONTROL SYS 3.3232 0.00106 150000 $498,480 235 781SPECIAL PURPOSE SYS 1.74468 0.00056 150000 $261,702 235 410
Command/Cont Sum 55.7 0.01780 $8,350,560 13083
TSSE Joint ACCESS Cost Estimate

354
CLIMATE CONTROL 45.77708 0.01464 32868 $1,504,601 494 22614SEA WATER SYSTEMS 27.001 0.00863 50705 $1,369,086 679 18334FRESH WATER SYSTEMS 7.5 0.00240 34033 $255,248 529 3968FUELS/LUBRICANTS, HANDLING+STORAGE 60.4407 0.01933 42125 $2,546,064 271 16379AIR, GAS+MISC FLUID SYSTEM 9.26342 0.00296 70265 $650,894 647 5993SHIP CONTL SYS 0 0.00000 14025 $0 353 0UNDERWAY REPLENISHMENT SYSTMES 45.9017 0.01468 8035 $368,820 176 8079MECHANICAL HANDLING SYSTEMS 84.07696 0.02689 16853 $1,416,949 259 21776SPECIAL PURPOSE SYSTEMS 21.93312 0.00701 1888 $41,410 282 6185
Auxiliary Sum 301.9 0.09654 $8,153,072 103328
SHIP FITTINGS 0.4154 0.00013 55033 $22,861 882 366HULL COMPARTMENTATION 24.924 0.00797 11160 $278,152 741 18469PRESERVATIVES+COVERINGS 46.9402 0.01501 10789 $506,438 494 23188LIVING SPACES 20.77 0.00664 29677 $616,391 1235 25651SERVICE SPACES 8.308 0.00266 26174 $217,454 135 1122WORKING SPACES 20.77 0.00664 27376 $568,600 292 6065STOWAGE SPACES 35.309 0.01129 86901 $3,068,387 12 424SPECIAL PURPOSE SYSTEMS 1.12158 0.00036 35511 $39,828 694 778
Hab Sum 158.6 0.05071 $5,318,111 76063
GUNS + AMMUNITION 36.2 0.01158 100000 $3,620,000 235 8507MISSILES+ROCKETS 47.3556 0.01514 100000 $4,735,560 235 11129SMALL ARMS+PYROTECHNICS 4.3 0.00138 100000 $430,000 235 1011MINES 0 0.00000 100000 $0 235 0DEPTH CHARGES 0 0.00000 100000 $0 235 0TORPEDOES 0 0.00000 100000 $0 235 0AIRCRAFT RELATED WEAPONS 0.78926 0.00025 100000 $78,926 235 185SPECIAL PURPOSE SYSTEMS 7.80952 0.00250 100000 $780,952 235 1835
Armament Sum 67.7 0.02165 $6,025,438 14160
MATERIAL / LABOR SUMMATIONS 2736.6 0.87517 1991 Material Cost $42,797,551 1005741
(3% inf lation rate) Total 2004 Material Cost $62,849,647

355
(3% inf lation rate) Total 2004 Material Cost $62,849,647SHIPS FORCE 17.36372 0.00555MISSION RELATED EXPENDABLES 76.68284 0.02452STORES 39.21376 0.01254LIQUIDS, PETROLEUM BASED 851.57 0.27233LIQUIDS, NON-PETROLEUM BASED 37.84294 0.01210FUTURE GROWTH MARGIN 249.24 0.07971 Payload CostTotal Payload w eight: 1271.91326 0.40675 $635,957
Check Sums 4008.6 1.0
Ship assembly and support labor = .478*Labor 480744.042Integration and Engineering Labor = .186*Labor 187067.7653Program Management Labor = .194*Labor 195113.6907 (12th ship) Labor costCombined Labor Total Hours @ rate 30 1868666 $56,059,985
Hours Labor Cost1 Total 1997 1st Ship Labor 2070544.23 1st Ship $62,116,3272 Total 1997 2nd Ship Labor 1967017.02 2nd Ship $59,010,5113 Total 1997 3rd Ship Labor 1908874 3rd Ship $57,266,2204 Total 1997 4th Ship Labor 1868666.17 4th Ship $56,059,9855 Total 1997 5th Ship Labor 1838062.72 5th Ship $55,141,8826 Total 1997 6th Ship Labor 1813430.3 6th Ship $54,402,9097 Total 1997 7th Ship Labor 1792861.61 7th Ship $53,785,8488 Total 1997 8th Ship Labor 1775232.86 8th Ship $53,256,9869 Total 1997 9th Ship Labor 1759827.15 9th Ship $52,794,814
10 Total 1997 10th Ship Labor 1746159.58 10th Ship $52,384,78711 Total 1997 11th Ship Labor 1733887.23 11th Ship $52,016,61712 Total 1997 12th Ship Labor 1722758.79 12th Ship $51,682,764
Joint ACCESS Specialized Equipment used for ship cost estimate
One Tim e Installs Costs in 2004 Costs in 1991Engines/AWJ21 $120,000,000 $84,165,586Electric Plant $70,000,000 $49,096,592 $230,000,000Composite Bow Door Sy $10,000,000 $7,013,799 $80,000,000EW Suite $10,000,000 $7,013,799Multi Function Radar $25,000,000 $17,534,497Other Weps/Sensor Sys $20,000,000 $14,027,598ESSM $25,000,000 $17,534,497Automated DC systs. $40,000,000 $28,055,195
SUMS $320,000,000 $224,441,562
0.26 CS0.03 hull0.53 prop
Costs are ref lected back to 1991 at 3% inf lation rate to align w ith CER's in given model.Later, total is ref lected to 2004 w ith same inf lation rate.

356
Shipyard Overhead TabulationShipyard Gen. & Admin O.H. 0.065Shipyard Insurance 0.01Shipyard Contingency 0.1Shipyard Prof it 0.04Total Shipyard O.H. Rate 0.215
Engineering Burdened Rate $50.00Non-Recurring Engineering Hours 1300000 $65,000,000Navy Program Cost Factor = 1% $650,000Total Non-recurring Eng. Cost $65,650,000
Learning Curve Exponent 0.95
Multi-Hull Adj unit cost w ith basic With Multi-Hull.30*Labor Shipyard Overhead Labor Overhead 1st Ship w ith Eng Burden$18,634,898 $151,833,658 $170,468,556 $236,118,556$17,703,153 $148,060,092 $165,763,245$17,179,866 $145,940,778 $163,120,644$16,817,996 $144,475,203 $161,293,199$16,542,564 $143,359,707 $159,902,272$16,320,873 $142,461,855 $158,782,728$16,135,754 $141,712,127 $157,847,881$15,977,096 $141,069,559 $157,046,655$15,838,444 $140,508,020 $156,346,465$15,715,436 $140,009,838 $155,725,274$15,604,985 $139,562,511 $155,167,496$15,504,829 $139,156,879 $154,661,708 <------Acquis ition Cost
Tw elveth Ship
Estimated System Cost (w/o Manning):Ship $154,661,708One Tim e Installs $320,000,000Payload $635,957
$475,297,664Total System Cost
357
INITIAL DISTRIBUTION LIST
1. Defense Technical Information Center Ft. Belvoir, Virginia
2. Dudley Knox Library Naval Postgraduate School Monterey, California
3. Fotis Papoulias Naval Postgraduate School Monterey, California
4. Robert Harney Naval Postgraduate School Monterey, California