China Naval Modernization: Implications for U.S. Navy ... - DTIC
Upload
khangminh22Category
view
0download
0
NAVAL POSTGRADUATE
SCHOOL
MONTEREY, CALIFORNIA
THESIS
MODELING A UAV-BASED MESH NETWORK TO ANALYZE LATENCY AND THROUGHPUT
by
Abdulkarim Rashed T. Aljaber
September 2019
Thesis Advisor: Alex Bordetsky Co-Advisor: Glenn R. Cook Second Reader: Albert Barreto III
Approved for public release. Distribution is unlimited.

THIS PAGE INTENTIONALLY LEFT BLANK

REPORT DOCUMENTATION PAGE Form Approved OMB No. 0704-0188
Public reporting burden for this collection of information is estimated to average 1 hour per response, including the time for reviewing instruction, searching existing data sources, gathering and maintaining the data needed, and completing and reviewing the collection of information. Send comments regarding this burden estimate or any other aspect of this collection of information, including suggestions for reducing this burden, to Washington headquarters Services, Directorate for Information Operations and Reports, 1215 Jefferson Davis Highway, Suite 1204, Arlington, VA 22202-4302, and to the Office of Management and Budget, Paperwork Reduction Project (0704-0188) Washington, DC 20503. 1. AGENCY USE ONLY (Leave blank) 2. REPORT DATE
September 2019 3. REPORT TYPE AND DATES COVERED Master’s thesis
4. TITLE AND SUBTITLE MODELING A UAV-BASED MESH NETWORK TO ANALYZE LATENCY AND THROUGHPUT
5. FUNDING NUMBERS
6. AUTHOR(S) Abdulkarim Rashed T. Aljaber
7. PERFORMING ORGANIZATION NAME(S) AND ADDRESS(ES) Naval Postgraduate School Monterey, CA 93943-5000
8. PERFORMING ORGANIZATION REPORT NUMBER
9. SPONSORING / MONITORING AGENCY NAME(S) AND ADDRESS(ES) N/A
10. SPONSORING / MONITORING AGENCY REPORT NUMBER
11. SUPPLEMENTARY NOTES The views expressed in this thesis are those of the author and do not reflect the official policy or position of the Department of Defense or the U.S. Government. 12a. DISTRIBUTION / AVAILABILITY STATEMENT Approved for public release. Distribution is unlimited. 12b. DISTRIBUTION CODE
A 13. ABSTRACT (maximum 200 words) As the military has moved toward network-centric operations, unmanned aerial vehicles (UAVs) have become increasingly valuable for capturing real-time information for joint operations on the ground. These UAVs contribute to the mission by conveying the scene accurately to the decision maker. However, because of constraints in free space, using MANET with UAV nodes in free space that has no pre-existing infrastructure poses a network latency problem. Latency reduces network efficiency when transmitting real-time information to a ground station. One goal of analyzing latency is understanding the logic of the UAV network architecture and protocols. Specifically, the thesis investigates the following question: What are the effects of UAV altitude on MANET latency? To investigate this question, this research simulates a two-node UAV mesh network at 2,000 and 3,000 feet altitude using Riverbed Modeler Academic Edition software. The research finds that there is no significant difference in latency at these altitudes. Therefore, all else being equal, 3,000 feet is the preferred altitude for UAVs, as it allows observation of wider areas and reduces UAV vulnerability to enemy weapons without affecting latency.
14. SUBJECT TERMS mesh network, MANET, latency, throughput, UAV, network architecture, DSR, free space, network management, network performance, Riverbed software
15. NUMBER OF PAGES 87 16. PRICE CODE
17. SECURITY CLASSIFICATION OF REPORT Unclassified
18. SECURITY CLASSIFICATION OF THIS PAGE Unclassified
19. SECURITY CLASSIFICATION OF ABSTRACT Unclassified
20. LIMITATION OF ABSTRACT UU
NSN 7540-01-280-5500 Standard Form 298 (Rev. 2-89) Prescribed by ANSI Std. 239-18
i

THIS PAGE INTENTIONALLY LEFT BLANK
ii

Approved for public release. Distribution is unlimited.
MODELING A UAV-BASED MESH NETWORK TO ANALYZE LATENCY AND THROUGHPUT
Abdulkarim Rashed T. Aljaber Captain, Bahrain Defence Force
BS, AMA International University, Kingdom of Bahrain, 2010
Submitted in partial fulfillment of the requirements for the degree of
MASTER OF SCIENCE IN INFORMATION TECHNOLOGY MANAGEMENT
from the
NAVAL POSTGRADUATE SCHOOL September 2019
Approved by: Alex Bordetsky Advisor
Glenn R. Cook Co-Advisor
Albert Barreto III Second Reader
Dan C. Boger Chair, Department of Information Sciences
iii

THIS PAGE INTENTIONALLY LEFT BLANK
iv

ABSTRACT
As the military has moved toward network-centric operations, unmanned aerial
vehicles (UAVs) have become increasingly valuable for capturing real-time information
for joint operations on the ground. These UAVs contribute to the mission by conveying
the scene accurately to the decision maker. However, because of constraints in free space,
using MANET with UAV nodes in free space that has no pre-existing infrastructure
poses a network latency problem. Latency reduces network efficiency when transmitting
real-time information to a ground station. One goal of analyzing latency is understanding
the logic of the UAV network architecture and protocols. Specifically, the thesis
investigates the following question: What are the effects of UAV altitude on MANET
latency? To investigate this question, this research simulates a two-node UAV mesh
network at 2,000 and 3,000 feet altitude using Riverbed Modeler Academic Edition
software. The research finds that there is no significant difference in latency at these
altitudes. Therefore, all else being equal, 3,000 feet is the preferred altitude for UAVs, as
it allows observation of wider areas and reduces UAV vulnerability to enemy weapons
without affecting latency.
v

THIS PAGE INTENTIONALLY LEFT BLANK
vi
vii
TABLE OF CONTENTS
I. INTRODUCTION ................................................................................................. 1 A. RESEARCH QUESTIONS ...................................................................... 3 B. METHODOLOGY ................................................................................... 3 C. HYPOTHESIS ........................................................................................... 3 D. SCOPE AND LIMITATIONS ................................................................. 3 E. THESIS OUTLINE ................................................................................... 4
II. LITERATURE REVIEW .................................................................................... 5 A. RELATED LITERATURE ...................................................................... 5 B. NETWORK TOPOLOGIES .................................................................... 6
1. Fixed (Infrastructure) Network ................................................... 6 2. Ad-Hoc Mobile Network .............................................................. 7
C. NETWORK LAYER OVERVIEW ......................................................... 7 D. LAYER 1 IN UAV NETWORKING: WIRELESS SIGNAL
PROPAGATION ....................................................................................... 9 1. Propagation Environment ............................................................ 9 2. Antenna Efficiency ...................................................................... 12 3. Omnidirectional Antenna ........................................................... 13
E. LAYER 2 IN UAV NETWORKING: PROTOCOLS (802.11) .......... 14 F. LAYER 3 IN UAV NETWORKING: NETWORK ROUTING ......... 15
1. Static Routing .............................................................................. 15 2. Dynamic Routing ........................................................................ 15 3. Network Architecture ................................................................. 19
G. LAYER 4 IN UAV NETWORKING: TRANSPORT LAYER........... 21 H. LAYER 7 IN UAV NETWORKING: APPLICATION ...................... 22
1. Performance Metrics .................................................................. 23 2. Performance Statistics ................................................................ 23 3. Network Management ................................................................ 24
III. RESEARCH METHODOLOGY ...................................................................... 27 A. UAV SYSTEM CAPABILITIES ........................................................... 27
1. Maneuvering Capabilities .......................................................... 27 2. Radio Capabilities ....................................................................... 28
B. RIVERBED SIMULATION SOFTWARE .......................................... 30 C. SCENARIO 1: MANET PLUS 3000 ..................................................... 30
1. UAV Configuration ..................................................................... 31 2. IP Forwarding Setup .................................................................. 33

viii
3. UAV Radio Protocols Setup ....................................................... 34 4. UAV Ad-Hoc Parameters Setup ................................................ 35 5. UAV Geographic Location ......................................................... 36 6. UAV Position Setup .................................................................... 37 7. UAV’s Altitude Setup ................................................................. 38 8. UAV Trajectory Setup ................................................................ 39 9. UAV Data Table .......................................................................... 40 10. UAV Traffic Flow Setup ............................................................. 41 11. MANET Traffic Generation Setup ............................................ 44 12. Descriptive Statistics ................................................................... 45 13. Run Simulation ............................................................................ 46
D. SCENARIO 2: MANET PLUS 2000 ..................................................... 47 1. UAV Altitude Setup .................................................................... 48 2. UAV Trajectory Setup ................................................................ 49 3. UAV Data Table .......................................................................... 49
E. SUMMARY OF MANET MODELING AT ALTITUDES OF 3000 FEET AND 2000 FEET ................................................................. 50
IV. SIMULATION RESULTS ................................................................................. 53 A. SCENARIO 1: DSR MANET DELAY REPORT (PLUS 3000)
RESULTS AND DISCUSSION ............................................................. 53 B. SCENARIO 2: DSR MANET DELAY REPORT (PLUS 2000)
RESULTS AND DISCUSSION ............................................................. 54 C. RESULTS COMPARISON.................................................................... 56
V. CONCLUSIONS AND RECOMMENDATIONS FOR FUTURE RESEARCH ........................................................................................................ 57 A. METHODOLOGY: LESSONS LEARNED......................................... 57 B. SUMMARY AND CONCLUSION ....................................................... 57 C. FUTURE RESEARCH ........................................................................... 58
APPENDIX. MANET SIMULATION TEMPLATE .................................................. 61
LIST OF REFERENCES ............................................................................................... 65
INITIAL DISTRIBUTION LIST .................................................................................. 69

ix
LIST OF FIGURES
Figure 1. The 7 Network Layers. Adapted from Beal (2018). ................................... 8
Figure 2. Multipoint Relay (MPR). Source: Alshabtat and Dong (2011). ............... 17
Figure 3. Centralized UAV Network Architecture. Source: Li, Zhou, and Lamont (2013). ......................................................................................... 19
Figure 4. Decentralized UAV Network Architecture. Source: Li, Zhou, and Lamont (2013). ......................................................................................... 21
Figure 5. UAV IP Setup in Riverbed. ...................................................................... 32
Figure 6. RIP Setup in Riverbed. ............................................................................. 33
Figure 7. Enable IP Forwarding Table in Riverbed. ................................................ 34
Figure 8. UAV Protocol Setup in Riverbed. ............................................................ 35
Figure 9. Ad-Hoc Routing Parameters Setup in Riverbed. ...................................... 36
Figure 10. UAV Maneuver Geographic Location (Camp Roberts, CA). ................... 37
Figure 11. ScanEagle1 and ScanEagle2 Positions in Riverbed. ................................. 38
Figure 12. UAV Altitude Setup in Riverbed. ............................................................. 39
Figure 13. UAV Trajectory Setup in Riverbed. ......................................................... 40
Figure 14. UAV Trajectory Data Table in Riverbed. ................................................. 41
Figure 15. IP Unicast Traffic Flow Setup in Riverbed. .............................................. 42
Figure 16. VOIP Traffic Flow Setup in Riverbed. ..................................................... 43
Figure 17. Traffic Center Report Generated by Riverbed. ......................................... 44
Figure 18. MANET Traffic Generation Parameters in Riverbed. .............................. 45
Figure 19. MANET Descriptive Statistics Report Selection in Riverbed. ................. 46
Figure 20. Simulation Report Window in Riverbed. .................................................. 47
Figure 21. UAV Altitude Setup in Riverbed. ............................................................. 48
Figure 22. UAV Trajectory Setup in Riverbed. ......................................................... 49

x
Figure 23. UAV Data Table in Riverbed. .................................................................. 50
Figure 24. MANET Plus 3000 Results in Riverbed. .................................................. 54
Figure 25. MANET Plus 2000 Results in Riverbed. .................................................. 55

xi
LIST OF TABLES
Table 1. Degree of Gain between Antennas of Various Polarizations. Source: De Vita (2012). ......................................................................................... 13
Table 2. UAV General Characteristics. Adapted from U.S. Air Force (2007). ...... 28
Table 3. UAV Radio Capabilities. .......................................................................... 30
Table 4. UAV Nodes’ Internet Protocol Addresses. ............................................... 31
Table 5. Distrbution of MANET Traffic Destinations. ........................................... 44
Table 6. Summary of Developed MANET Model. ................................................. 51

xii
THIS PAGE INTENTIONALLY LEFT BLANK

xiii
LIST OF ACRONYMS AND ABBREVIATIONS
AODV Ad-Hoc On Demand Distance Vector C2 Command and Control DSR Dynamic Source Routing GCS Ground Control Station IFF Identification Friend or Foe IGP Interior Gateway Protocols IP Internet Protocol LAN Local Area Network MANET Mobile Ad-Hoc Network MIMO Multiple Input Multiple Output MPR Multipoint Relay OFDM Orthogonal Frequency Division Multiplexing OLSR Optimized Link State Routing RIP Routing Information Protocol TCP Transmission Control Protocol UAV Unmanned Aerial Vehicle WLAN Wireless Local Area Network WSN Wireless Sensor Network

xiv
THIS PAGE INTENTIONALLY LEFT BLANK

xv
ACKNOWLEDGMENTS
I offer my deepest thanks and gratitude to His Majesty King Hamad bin Isa Al-
Khalifa Kingdom of Bahrain, the Supreme Commander, Bahrain Defense Force; and
Commander-in-Chief Field Marshal Shaikh Khalifa bin Ahmed Al-Khalifa. I also want to
recognize the other leaders who allowed me to attend the Naval Postgraduate School to
complete a master’s degree and represent the Kingdom of Bahrain in the United States of
America.
I also want to thank Dr. Bordetsky for his support and guidance in writing this
thesis. Additionally, I want to acknowledge my co-advisor, Glenn Cook, for his support. I
am gratefully indebted to him for his valuable comments and guidance on this thesis. It
would be remiss of me if I did not thank Lab Director Robert Broadston for helping me
with the technical aspect of the research. Furthermore, I am also grateful to NPS Graduate
Writing Center coaches Matt Norton and Alison Scharmota for their support helping with
the structure of this thesis.
Finally, I must express my very profound gratitude to my family, particularly my
wife and daughter, for providing me with unfailing support and continuous encouragement
throughout my time researching and writing at NPS. This accomplishment would not have
been possible without them. Thank you.

xvi
THIS PAGE INTENTIONALLY LEFT BLANK

1
I. INTRODUCTION
Several attributes inherent in electronic systems architecture contribute to issues in
using these systems today. Enhancing the capabilities of electronic systems, in particular,
requires reinforcing the command and control cycle and supporting the frontline mission.
A friendly fire incident in northern Iraq on 7 April 1991 displayed several problems that
arise with electronic systems architecture in this regard: F-15 fighters shot down a U.S.
Blackhawk in a no-fly zone area due to the failure of the IFF (Identification Friend or Foe)
system, among other failures. As Scott A. Snook (2011) noted in describing the complexity
that contributed to the mishap, “each with its own helicopters and fixed-wing aircraft, the
challenge became one of putting them all back together again, on the same battlefield,
sharing the same air space” (p. 155). Managing complex flight capabilities systems requires
building efficient systems architecture. This efficient systems architecture requires a
comprehensive and integrated effort, to reduce human error caused by electronic systems
today in various military operation services. This challenge of integration necessitates
standardization of electronic systems to run all systems efficiently as one, which in turn
requires researchers and engineers to agree on electronic specification and standardized
military aviation capabilities.
While aviation has changed since the friendly fire incident, the issue of how to
design an aviation electronics system architecture that integrates with other aviation
systems in battle still remains. In particular, as the military moves toward network-centric
operations, unmanned aerial vehicles (UAV) will be valuable for capturing real-time
information for joint operations on the ground; these UAVs facilitate the mission by
conveying the scene accurately to the decision maker. In light of the technological progress
of the armed forces, UAVs have become active weapons that support the front lines in
battle by tracking the movement of the enemy on the battlefield. Since more battles occur
in constrained areas, where it is difficult to transmit information over fixed networks, using
UAVs’ ad-hoc networking communication architecture in these areas is a challenge. There
are several ways to integrate communication architecture to connect multiple UAVs in a
mesh network, but network latency affects the quality of battlefield information transfer

2
via the UAV. The same is true for situational awareness views at the operations centers:
network latency has a negative impact on decision makers in the theatre of operations. In
constrained areas, operators use UAVs to support mission achievement through
reconnaissance to detect the position of the enemy in battle. Therefore, a delay in signal
communication between UAVs and the ground station will impact ground forces’
movement; commanders will not have enough information about the situation on the
ground to guide or inform ground forces to attack or defend, which can cause loss of
position and loss of land, as well as increase the possibility of causalities.
Therefore, defending communication devices and ensuring communication among
forces requires having alternative plans. The military needs an adaptive flexible network
architecture to reduce vulnerability arising from latency. According to Harris Corporation
(n.d.), “The future is about ensuring spectrum-wide superiority at all times, in all domains.”
This indicates that future wars will require ensuring performance of packets in the network
and providing a real-time picture to avoid lack of communication in battlefield
environments. Therefore, network topology, network architecture, wireless propagation,
network routing, network performance, and network applications are all needed to face this
phenomenon. These technologies facilitate the exchange of information among nodes and
also defend network capabilities in the operational theater for continued transmission.
Although some research has been conducted in the area of reinforcing signal
strength between UAVs to ensure that wave propagation—in other words, network
performance—endures, the question remains of what type of network architecture
maximizes signal performance in the face of constraints. This requires a network
technology capable of facilitating electronic integration among various systems to establish
efficient coordination. Given these requirements, network technology through effective
systems architecture can ensure communication between a ground station and multiple
UAVs’ nodes to reinforce network and telecommunication technology in mesh networks.
This research focuses on the effect of the UAV nodes’ altitude from a ground station
on wireless performance within mesh network. Decentralized mesh networking topology
indirectly supports UAV communication through an intermediate UAV. Altitude creates
unstable network performance because of UAV speed and movement in free space that

3
affect the antenna orientation, which in turn affects performance in this network. In order
to reinforce the strength of ground forces, and support front line missions, it is necessary
to maintain the connectivity of UAVs and the continuous transmission of information
between UAVs and the ground station; it is therefore critical to understand what UAV
altitude enhances network performance and minimizes mobile ad hoc network (MANET)
latency.
A. RESEARCH QUESTIONS
To determine which altitude in a MANET application better supports throughput
and reduces latency, this thesis investigates the following questions:
What are the effects of UAV altitude on MANET latency?
Which of the preferred altitudes is better to use for minimizing UAV MANET latency?
B. METHODOLOGY
To investigate these questions, this research simulates a two-node UAV mesh
network using Riverbed Modeler Academic Edition software. This software allows the
researcher to establish UAV nodes configuration and set different parameters such as
distance (kilometres, Km), altitude (feet), UAV maximum speed, and radio protocols.
These attributes enable the researcher to measure the performance between the ground
station and UAV nodes maintaining signal strength within the mesh networks.
C. HYPOTHESIS
The initial hypothesis of this research is that as altitude increases latency between
the ground station and the UAV nodes will increase due to several factors that affect the
signal power strength, particularly the energy efficiency. The greater the altitude of the
UAV, the more power is required for flight maneuver, which leaves less power available
to maintain signal strength and creates higher latency.
D. SCOPE AND LIMITATIONS
The following limitations apply to this research:

4
• Security is important to secure packet transmission in MANET, but it is
not a subject of this research, which focuses on network architecture.
• Classified UAV (such as the Boeing ScanEagle used in this research)
flight and radio capabilities information prevent the researcher from
identifying the exact capabilities of the UAV’s nodes; thus, some
assumptions have to be made about the properties of the UAV nodes.
• Although several routing algorithm protocols can be used in mesh
networks, this thesis focuses on Dynamic Source Routing (DSR) because
it selects the route that must be used in transmitting data to its destination.
• A UAV icon was not available in the simulation, but the researcher
utilized his laptop so as to represent the UAV.
• Omnidirectional antenna parameters were not available for MANET
station (Mobile nodes) attributes, in particular; therefore, this model
assumes an omnidirectional antenna.
E. THESIS OUTLINE
The remainder of this thesis is organized as follows: Chapter II provides the
literature review, while Chapter III discusses the methodology used in the simulation, and
Chapter IV interprets the results of the simulation. Chapter V offers the lessons learned,
recommendations, conclusions, and suggestions for future work. The appendix contains a
template for further simulation.

5
II. LITERATURE REVIEW
Determining what altitude from the ground station minimizes network latency
within MANET and reinforces a UAV’s signal strength in free space intersects with many
network-related issues. This section begins with a related literature review and a discussion
of network topology types and how topology maintains a network. The chapter then
discusses network layer relevant to latency, including free space propagation, radio
protocols, routing algorithm, network architecture, Transmission Control Protocol (TCP),
and performance metrics. Finally, it examines the role of the network manager in
investigating the health of network.
A. RELATED LITERATURE
In previous studies, researchers investigate the capabilities of network performance
and examine the coordination and communication among the network operator and nodes.
These researchers focus on how to manage Command and Control (C2) in various missions
in maritime and front-line forces such as Special Forces by utilizing a MANET topology
capable of directing a signal among nodes or a military operation center. As Matthew S.
Maupin (2016) noted in his research, the complexity of C2 in littoral environments creates
an unstable operating environment. Maupin’s thesis identified the complexity of littoral
environment and its real impact on C2 performance and MANET management of littoral
operations, by focusing on human factors as the main resource to control several nodes.
While coordination and other human factors responsibilities are critical to network
management, effective coordination is only possible through reliable network performance.
And, reliable network performance is only possible through good network architecture.
Building on Maupin’s thesis, the aim of the present thesis is to guide decision makers to a
clear picture to distinguish the cause and effect of packet latency in networks, using
network architecture software. As Maupin noted, “the open architecture design of new
network management systems like Code Mettle provide significant flexibility and
adaptability to evolve with improvement in technologies and capabilities” (p. 85). Thus,
improving C2 capabilities and communication among nodes in a network requires

6
predicting and modeling the architecture of the network through simulation to determine
the efficiency of signals between ground stations and UAV nodes in a mesh network in
preparation for facing constraint in free space.
B. NETWORK TOPOLOGIES
The physical arrangement of the network architecture components is called the
topology. There are a number of network topology types relevant to this research, including
fixed and ad-hoc network architectures, which are described in the following paragraphs.
1. Fixed (Infrastructure) Network
A fixed network is a physical network built in a local area and consists of fixed network
elements such as routers, switches, and servers to support nodes within this network. Use of a
fixed network speeds data transmission between nodes, because fixed infrastructure like the
operating center, communication towers, microwave dish, and other telecommunication
stations and network elements support data transmission among these nodes.
Network managers are able to manage fixed networks with a command prompt
application. Utilizing the command-line interpreter features in Windows or MAC operating
systems, network managers can solve node failures and other issues that reduce network
performance. This command-line interpreter assists network managers to track a network
issue, failure of nodes, data transmission speed, traffic, and other bottlenecks occurring in
a local area network (LAN) or wireless area network, which saves time and effort in
investigating that status of network nodes such as computers, laptops, routers, and switches
and fixing the issue through the command prompt application.
The command line interpreter is a useful tool to monitor network element status;
however, human intervention might be needed to fix media failures related to cabling,
network interface cards, connectors, and other issues. Indeed, the benefit of a fixed network
is that network administrators are able to configure network elements more simply than in
other networks that require software tools to fix technical flaws. As fixed networks consist
of network elements on the ground, the maintenance of these devices is much simpler.

7
2. Ad-Hoc Mobile Network
Whereas fixed networks use physical infrastructure to maintain communication
among devices, ad-hoc wireless network topology uses peer-to-peer connections to
maintain node-to-node telecommunication in free space. According to Bradley Mitchell
(2018) in an online article, “A Wi-Fi network in ad-hoc mode (also called computer-to-
computer or peer mode) lets two or more devices communicate with each other directly
instead of through a central wireless router or access point (which is what infrastructure
mode is).” This arrangement is significant in that ad-hoc network topology does not rely
on a single backbone to provide the signal to sustain link state in the network. Rather, ad-
hoc networks are built to support nodes without using any additional physical infrastructure
to sustain link state. According Mitchell, “an ad-hoc network is useful if there isn’t a
wireless structure built.” This feature of ad-hoc networks keeps a network effective and
also provides integration among the nodes without any network infrastructure such as
communication towers, microwave receivers, or any backbone that supports signal and link
state in the network.
Using an ad-hoc network has several other benefits. First, ad-hoc networks reinforce
telecommunication between nodes. According to James T. Wood (n.d.), “running an ad hoc
network can be more affordable than a traditional network—you don’t have the added cost of
a router.” In other words, using an ad hoc network saves enterprises money. Also, avoiding the
use of a router means no router will need maintenance. Second, ad-hoc networks enable
telecommunication in various situations and circumstances where a fixed network does not
exist. According to Wood, “Ad hoc networks can be created on the fly in nearly any situation
where there are multiple wireless devices.” Significantly, this property means that ad-hoc
networks can assist in maintaining communication signal strength and sustaining network
stabilization without the aid of network infrastructure other than the nodes themselves.
C. NETWORK LAYER OVERVIEW
The network modeled in this research is an ad-hoc UAV network. As in all
networks, UAV networks are made up of seven layers to establish the telecommunication
capability, as shown in Figure 1. This research focuses on Layer 1, Layer 2, Layer 3, Layer

8
4, and Layer 7, as these are the layers in which latency occurs. In Layer 1 (Physical Layer),
the bits of data transfer through fields, such as the electrical and electromagnetic fields, to
access various channels within the network. Next is Layer 2 (Data Link), which controls
the information and ensures that this information reaches its destination, either in the WAN
or among nodes in the LAN. Specifically, this thesis utilizes the MANET topology among
UAVs to exchange information. The purpose of Layer 3 (Network) is to guarantee the
packet flow through network devices, to enhance the network performance, and to maintain
network capabilities in regulated data frames, without any changes in data frame size.
Layer 4 (Transport) allows for the verification that packets reach their destination, and the
resending of packets in case of transmission failure. The software that the network manager
utilizes to check the health of the network resides in Layer 7 (Application).
This research uitlizes these layers to investigate telecommunication among nodes
depending on a UAV’s altitude to establish a baseline comparsion of latency. Investigation of
these layers supports network managers analyzing telecommunication among UAVs’ nodes
and a groundstation, which requires the configuration of various nodes in a mesh network to
establish the traffic flow among nodes. The network manager investigates the latency within
this network relying on simulation software that is used to represent network performance.
Figure 1. The 7 Network Layers. Adapted from Beal (2018).

9
The following sections describe the relevant network layers.
D. LAYER 1 IN UAV NETWORKING: WIRELESS SIGNAL PROPAGATION
Wireless propagation is an important factor to support signal strength and maintain
link states to minimize latency in free space propagation. Wireless propagation supports
nodes through the electromagnetic spectrum to reinforce signal communication. According
to Mani Subramanian (2011), “there are several physical mechanisms to consider in dealing
with wireless propagation, which we do not have with propagation through wired
networks” (p. 558). One of those considerations is antenna orientation and efficiency. Also,
as was discussed previously, a fixed network is stable, whereas ad-hoc networks face
constraints that limit their efficiency. When operating within an ad-hoc network, nodes will
receive a less stable signal than in a fixed network because there are several factors that
limit wireless propagation, such as weather, buildings, and trees, and other constraints that
create transmission obstacles in a network, reducing the performance of signal transmission
and causing packet delay. By contrast, the omnidirectional antenna offers a solution to
receive the signal from different antennas.
The following sections discuss the wireless propagation environment and relevant
antenna properties.
1. Propagation Environment
There are various types of wireless propagation environments. The two most
relevant to this research are free-space propagation and urban wireless propagation,
discussed in the sections that follow.
a. Free-Space Propagation
Free-space propagation propagates in multiple areas without physical infrastructure
to maintain signal strength. One important property of free-space propagation is that it
becomes weaker as the distance among nodes increases. Free-space wireless propagation
depends on neighboring nodes’ signal to reinforce the efficiency of wireless propagation
between UAV nodes. UAV nodes can act as both transmitter and receiver, and free-space

10
propagation among UAV nodes is affected by the dynamic, constantly changing distance
and height of the UAVs, as well as other constraints that limit signal strength. These
constraints differ according to the UAV mission that requires different UAV behaviors in
free space.
Because these dynamic changes occur in free-space wireless propagation, it is
necessary to rely on a laser communication system to reinforce the capabilities of ad-hoc
network performance. As Hassaun A. Jones-Bey (2007) noted, the usefulness of a “wireless
laser-communications system [is its ability] to obtain a reliable, high-capacity optical link
through the cloud” (para. 4). The purpose of the laser communication in free space is thus
to ensure propagation spread out among the UAV nodes at different distances and altitudes,
and under different constraints.
b. Urban Propagation
Several issues limit wave propagation in urban areas, such as reflection, refraction,
and diffraction, which cause packet delay and reduce UAV nodes’ signal performance in
these environments.
(1) Reflection
In determining the performance of wave propagation, it is important to focus on
factors that degrade communication to reduce incidents occurring among different
antennas—in the case of this research, between UAV nodes. One important factor that
affects urban propagation is reflection, loss of energy because of weather or natural factors.
According to David R. Frieden (1988), “often energy is lost from the
incident wave because of the presence of natural obstacles such as dust, snow, or water
vapor” (p. 18). Such obstacles reduce signal distribution, allowing only part of the
transmission to reach its destination. How much of the signal passes through obstacles
depends on the resistance coefficient of the materials involved, such as water, glass,
cement, wood, metals, and other materials that limit propagation in urban environment.

11
There are two methods for addressing the reflection in urban environments,
Orthogonal Frequency Division Multiplexing (OFDM) and Multiple Input Multiple Output
(MIMO), which reduce reflection of signal and provide solutions to assist signal strength.
Orthogonal Frequency Division Multiplexing
OFDM spreads signal information to multiple frequencies, which enables a
transmission to reach various nodes within the network and smooths the transmission.
OFDM is a multicarrier modulation that utilizes various frequencies to ensure that the
information reaches its destination despite obstacles. OFDM is therefore able to carry
frequency and facilitate transmission of information such as data and voice to the nodes.
This multicarrier modulation also mitigates interference between multiple signals because
of modulation’s ability to add a sampling window and guard interval. This maintains signal
strength among various information sub-carriers in a system and provides a solution to ease
the impact of natural reflection. Control of the sampling window and guard interval
increases the system’s ability to send the signal to the destination and reduce the effect of
reflections by allowing the guard interval to maintain the signal strength of losing the
pattern of waves.
Multiple Input Multiple Output
There are many theories to describe the MIMO method, but this section describes
specific diversity techniques utilized in MIMO. MIMO is a method to direct signal flow
by identifying multiple channels to reduce interruption and mitigate the effect of reflection
on the signal. Use of the diversity techniques enables protecting the network from
propagation fading that occurs from reflection obstacles. Methods such as spatial diversity
provide more than one physical path to stabilize communication while frequency diversity
allows for transmission on more than one frequency to reduce channel interference.
Coherence time is used to maintain the electromagnetic wave for a long time and balance
the response time in various channels that control the signal wave. These techniques of
diversity effectively treat traffic jams that occur in telecommunication among nodes,
particularly among UAVs that fly in urban areas.
12
(2) Refraction
Refraction occurs when an electromagnetic wave transmits in free space. During
refraction, the wave changes direction as it moves through different media or the medium
itself changes. This phenomenon also depends on density of air: according to Frieden
(1988), “an electromagnetic wave encounters several variations in air density” (p. 20), and
density of the air changes the direction of propagation of the wave. Refraction creates
constraints to wave propagation that impact signal pattern shape, which can create latency.
(3) Diffraction
Diffraction occurs when an electromagnetic wave changes direction because of the
edge on obstacles. According to The Physics Classroom website (n.d.), “diffraction
involves a change in direction of waves as they pass through an opening or around a barrier
in their path.” Such changes affect the performance of a signal: while they do not limit the
transmission overall, they do diminish the efficiency of a wave by bending the wave. Also,
when amplitude increases bending of wave increases depending on the medium’s density,
which scatters the wave and causes transmission latency.
2. Antenna Efficiency
Latency among UAV nodes in free space is impacted by antenna efficiency. Path
loss formulas are used to determine various capabilities of radio communication systems
such as transmitter power, received power, gain, locations, and height. This determination
identifies signal strength among various antennas and assists network managers to observe
sensitivity of electromagnetic waves during signal transmission. These formulas also
indicate the power requirement to enhance signal strength and allow network managers to
position antennas, including UAVs, in appropriate locations to ensure signal quality.
Because the focus of this research is on antenna efficiency performance to
determine UAVs’ network architecture to minimize MANET latency, it measures loss of
path in terms of dB. The formula for determining path loss (Lpath) is given in Equation 1:

13
This formula shows that path loss between transmitter and receiver increases as
distance and frequency increase.
Another important mesasure of antenna efficiency is polarization: “polrization of a
plane wave is the figure the…electric field traces out with time” (Stutzman & Thiele, 1998,
p.48). It is necessary to have identically polarized antennas to reduce the disruption and
loss of signal between transmitter and reciever. Table 1 shows how polarization efficiency
depends on antenna type. If the antenna polarization is the same then signal will be received
at maximum power, but if the antenna polarizations are different there will be some amount
of power loss depending on the antenna orientation. This factor allows the network
manager to understand how various polarizations might increase latency and reduce overall
network performance in a military mission.
Table 1. Degree of Gain between Antennas of Various Polarizations. Source: De Vita (2012).
3. Omnidirectional Antenna
This research assumes that UAV nodes are equipped with an omnidirectional
antenna. Whereas directional antennas must be oriented toward each other to receive signal,
omnidirectional antennas radiate signal from any direction without relying on specific
antenna orientation. This radiation of signal allows ground stations to receive a UAV’s

14
omnidirectional antenna electromagnetic wave as the UAV’s speed and position change in
maneuver. This antenna, therefore, is essential for the UAV’s command and control.
E. LAYER 2 IN UAV NETWORKING: PROTOCOLS (802.11)
While Layer 1 focuses on physical properties of the wave, Layer 2 enhances the
physical layer capabilities by providing radio protocols (8021.11). The 802.11 protocol
ensures communication in the physical layer through half–duplex signaling to reinforce the
efficiency of bit rate performance within the wireless mesh network.
Furthermore, there are different standards of 802.11 that maintain
telecommunication. In particular, using 802.11n supports the network manager to obtain a
realistic gain and high-speed bit rate per second that limits the loss of data frames. As Jill
West, Tamara Dean, and Jean Andrews (2016) note, “802.11n boasts maximum throughput
of 600 Mbps, making it a realistic platform for telephone and video signals” (p. 292). Given
that efficiency enhances the performance quality of the network through a high max
throughput between transmitter and receiver, this efficiency might reduce the packet delay
among various nodes depending on distance and other obstacles that limit efficiency of bit
rate throughput.
Furthermore, 802.11n operates in various frequencies such as 2.4 GHz and 5.0
GHz. In 2.4 GHz, the 802.11n standard enables high cover frequency range, which is
applicable for use in a limited military operations mission in an urban environment. On
other hand, using 5.0 GHz frequency reduces the range of frequency coverage, but it
maintains high-speed bit rate. As NETGEAR Support (2019) notes, “The range is lower in
the 5 GHz band because higher frequencies cannot penetrate solid objects, such as walls
and floors. However, higher frequencies allow data to be transmitted faster than lower
frequencies, so the 5 GHz band allows you to upload and download files faster.” Since 5
GHz is adversely affected by obstacles, 2.4 GHz remains a solution to indoor and outdoor
wireless signal propagation that enables reinforcement of the efficiency of the network
during an urban operation. Thus, this research uses 802.11n at 2.4 GHz.

15
F. LAYER 3 IN UAV NETWORKING: NETWORK ROUTING
Network routing algorithms sustain communication among nodes by directing
signal path in the physical layer. The two foundational types of network routing are static
and dynamic.
1. Static Routing
Static routing is fixed routing that links nodes directly without relying on alternative
algorithms to determine shortest path to identify neighboring nodes as dynamic routing
does. Static routing is used in fixed networks as the routing protocol to identify routers.
InetDaemon (2018) noted that “static routing is simply the process of manually entering
routes into a device’s routing table via a configuration file that is loaded when the routing
device starts up.” This fact is significant in that all data about routing protocols in static
routing is configured manually by the network administrator based on the expected
parameters for how a router will identify a neighbor router and transmit packets. Moreover,
according to the IBM Knowledge Center (2010), “static routing usually takes advantage of
default routes: when the destination is not explicitly coded, [packets are sent] to the default
router and let that router figure out how to get the packet to its destination.” This indicates
that static routers choose the shortest path to the destination; when a static router does not
know the destination, it chooses the default router, prompting other routers to investigate
the next destination since the exact destination is unknown, to discover the appropriate
route and deliver the transmitted packet. Additionally, according to Cisco (2018), “static
routes use less bandwidth than dynamic routes, as packets transmit along a fixed path rather
than many variable paths, which provide adequate space to other routing code during the
information transfer process.
2. Dynamic Routing
Dynamic routing is an algorithm used to identify the shortest path from node to
node to mitigate signal constraint among nodes in a network. Dynamic routing makes use
of alternative plans to identify the shortest path to reach neighbor routers to maintain
network communication. According to Sudip Misra and Sumit Goswami (2017), “dynamic
routing allows routing tables in the routers to change so as to enable the best alternative

16
route available at any instance of time to be chosen as the possible routes change” (p. 67).
That is, dynamic routing schemes allow routers to predict various methods to enhance the
direction of routes in case of router failure and thus maintain telecommunications
connectivity. This is unlike what occurs in static routing, where, if a router is down, the
process of exchanging information breaks, halting transmission of data through network
elements.
Additionally, dynamic routing depends on gateway protocols that facilitate
reaching nodes or other network elements. These protocols are the basic engine of data
transmission and include Interior Gateway and Exterior Gateway protocols. The Interior
Gateway protocols (IGP) focus on an individual domain to analyze and determine the
shortest path among network elements in this domain to smooth data transmission
throughout this domain. According to Misra and Goswami (2017), “Each individual
network also uses an IGP for shortest path determination within its own routing domains”
(p. 68). IGP thus focuses on shortest-path determination in the inner domain to protect the
internal communication from barriers that limit communication. The Exterior Gateway
protocols (EGP) depend on discovering the nodes or network elements based on distance.
According to Misra and Goswami, “EGPs propagate ‘reachability indications’ in terms of
many different attributes to measure routes and not the true metrics” (p. 68). This means
that EGPs focus on distance to find the shortest path rather than focusing on routers’
availability in a domain. This reduces time and enables information exchange among
routers.
a. Routing Algorithms Protocols
The protocols’ purpose is to enhance network routing and stabilize signal
transmission. Various protocols such as Optimized Link State Routing Protocols (OLSR)
and Ad-hoc On-demand Distance Vector (AODV), and DSR (Dynamic Source Routing),
facilitate information exchange and mitigate delays occurring in ad-hoc networks.
(1) Optimized Link State Routing Protocols
There are several protocols used in networks to maintain connectivity among UAV
nodes. One of the most important protocols used to sustain network communication

17
between nodes is OLSR. This protocol enhances the packet transmission among nodes and
reduces the time to transmit packets in an ad-hoc network. According to Abdel Ilah
Alshabtat and Liang Dong (2011), OLSR “reduces the size and the number of the control
packets” (p. 991). This means that OLSR is built to control packets among the nodes to
maintain network performance in ad-hoc networks and to enable packet transmission.
One type of OLSR protocol, multipoint relay (MPR), plays an important role in
transmitting and receiving packets in OLSR. According to Alshabtat and Dong (2011),
“MPR is a node chosen by another node that is willing to transmit its data” (p. 991). This
means that MPR creates integrated information exchange among nodes. This property
reduces delay times in packet transmission because nodes receive a packet and retransmit
the packet to the source.
Figure 2 shows how UAVs communicate with each other using MPR. It shows that
MPR’s role is to sustain the connectivity among UAV nodes to enhance packet
transmission. Also, it shows that the source (upper left) can reach the destination and
exchange information through MPR, which allows transmitting and retransmitting the
packet among nodes in an ad-hoc network. Also, this topology retains flexibility in packet
movement and reduces packet loss.
Figure 2. Multipoint Relay (MPR). Source: Alshabtat and Dong (2011).
(2) Ad-hoc On-demand Distance Vector
The role of the AODV routing protocol is to audit routing table information and
avoid routing loops. According to Prashant K. Maurya, Gaurav Sharma, Vaishali Sahu,

18
Ashish Roberts, and Mahendra Srivastava (2012), “it uses traditional tables, one entry per
destination, and sequence number to determine whether routing information is up to date
to prevent routing loops” (p. 728). This means that AODV is responsible for reducing
routing loops between sources and destinations to maintain and sustain network routing.
Also, this protocol, by using sequence number, notifies neighboring nodes about any
information that is not up to date in case they receive old information. This notification
will result in the nodes’ not accepting expired information to avoid additional loops and
prevent packet latency among nodes.
There are, however, several drawbacks to using AODV, such as expiration of active
routes and difficulties receiving and maintaining routing information. According to Maurya
et al. (2012), “Determining of [sic] a reasonable expiry time is difficult” (p. 728). This
means that circumstances and constraints affect the AODV protocol’s effectiveness at
managing and controlling complex changes in routing algorithms in case an active route
expires suddenly or an event occurs to those nodes during the routing process. Moreover,
AODV presents some shortcomings to maintaining routing information. According to
Maurya et al., “AODV can gather only a very limited amount of routing information” (p.
731). Therefore, the data flow capacity of AODV protocols is low, which diminishes the
efficiency of routing information maintenance that supports neighboring nodes in obtaining
and identifying updated routing information to initiate communication.
(3) Dynamic Source Routing
Utilizing DSR as the ad-hoc routing protocol for UAV nodes maintains the nodes’
configuration and route path. According to David B. Johnson, Yih-Chun Hu, and David B.
Maltz (2007), “DSR allows the network to be completely self-organizing and self-
configuring, without the need for any existing network infrastructure or administration.”
This indicates that DSR is capable to maintain network and transmission data in different
circumstances, without the intervention of a network manager. This capability of DSR that
relies on multi -hop wireless communication allows nodes to observe neighboring nodes
and maintain the nodes’ configuration easily within a mesh network, which enables the
sender (UAV nodes) to control the path of packets. This dynamic routing reduces latency

19
and facilitates information flow in a mesh network, which reinforces dynamic algorithm
routing within MANET and supports ad-hoc network capabilities in large-scale networks.
This thesis uses DSR in network simulation.
3. Network Architecture
The previous section focused on the condition when two nodes are communicating.
This section discusses communication among multiple nodes. Network managers rely on
the previous parameters to measure various constraints on network operation during
communication. Based on these measurements the network manager decides which
network architecture to use. Network architecture is the schema to identify which topology
is suitable given various complex changes in the network. There are two major types of
UAV network architecture: centralized UAV network, decentralized UAV network.
a. Centralized UAV Network
Centralized UAV network architecture is one of many toplogies to support and
maintain a link between the ground station and UAVs in the sky. The responsibility of the
ground station is to transmit real-time pictures provided by the UAVs to a military operation
center. This toplogy connects UAV nodes directly to the ground station, as shown in Figure 3.
Figure 3. Centralized UAV Network Architecture. Source: Li, Zhou, and Lamont (2013).

20
Within this topology, if the ground station fails to support nodes, connectivity will
disappear, which will destabilize the transmission lines and affect C2 strategies, plans, and
decisions. Moreover, “advanced radio transmission devices with a high transmission power
are required in the UAVs, which may not be practical for medium or small UAV’s due to
their size and payload constraints” (Li, Zhou, and Lamont, 2013, p. 1416). Network
managers must ensure that UAVs include high enough transmission power to maintain
their links with the ground station to avoid power loss.
b. Decentralized UAV Network
Decentralized UAV network architecture is a topology that supports UAVs through
multiple sources to ensure connectivity and enhance overall communication among UAVs
in free space. This topology relies on dynamic routing, which can manage rapid changes
occurring in the network and limit failure events that delay packet transmission and affect
performance of transmission. In this topology, a backbone UAV behaves as a mobile
ground station, and it is used to maintain signal in free space. A network operator in the
ground station can utilize the backbone UAV to keep signal strength at high efficiency to
enable UAVs to continue transmitting signal in areas without infrastructure. Moreover, the
backbone UAV becomes a solution for processing and strengthening the signal if
bandwidth decreases because a bottleneck occurs in the network. Figure 4 shows how the
backbone UAV supports signal strength.

21
Figure 4. Decentralized UAV Network Architecture. Source: Li, Zhou, and Lamont (2013).
G. LAYER 4 IN UAV NETWORKING: TRANSPORT LAYER
While Layer 3 allows the researcher to set the network routing protocol to maintain
the trajectory of packet flow among the nodes through OFDM and MIMO protocol, Layer
4 allows the researcher to test the connectivity between nodes by verifying, through the use
of the Hyper Text Transfer Protocol (HTTP), the TCP segment sent and the response
between these nodes. As West et al. note (2016), “Before TCP transmits data, it ensures
that a connection or session is established, similar to making sure someone is listening on
the other end of a phone call before you start talking” (p. 108). By providing that service,
TCP enables the user to track the packet delivery from source to destination, to control the
transmission on various nodes of the UAV network in free space. Moreover, Layer 4 relies
on using the Three-Handshakes method that verifies the response between source and
destination by examining the checksum. As West et al. note (2016), “If the two checksums
fail to match, the designation host asks the source to transmit the data” (p. 108). This
indicates that if packet loss occurs, the checksum is reminding the source to transfer data
to verify that the complete data packet has reached its designation. TCP not only provides
checksum to confirm data integrity, but also it provides sequence numbering for each
segment to enable tracking of each segment and when it arrives.
22
H. LAYER 7 IN UAV NETWORKING: APPLICATION
While Layer 4 provides test connectivity among nodes, Layer 7 focuses on
measuring network performance through software applications such as simulation and
other network performance software. The following sections describe the functional model
and performance management, in particular. Evaluating network performance involves
important metrics to determine node-to-node communication, fault configuration, packet
delay, and other constraints in a network that affect its performance. All of these metrics
are essential to assessing which architecture can minimize latency. To perform this
evaluation, this research uses the functional model, which consists of five components:
configuration management, fault management, performance management, security
management, and accounting management (Subramanian, 2011). This research performs
baseline configuration management, but focuses on performance management because it is
the tool used to measure latency, particularly wireless local area network (WLAN) latency,
including throughput and delay.
Performance management is used to analyze the health of a mesh network through
the observation of traffic issues, status of nodes, and strength of signal to control the
stability of the network status. According to Subramanian (2011), “performance
management is really (data) traffic management.” (p. 409). In short, performance
management of a network focuses on traffic flow (b/s) to monitor the flow of information
between various nodes within a mesh network.
Controlling and managing the system by using a network monitoring system will
meet all the needs of a network manager to control network elements and maintain the
connectivity of network. This, in turn, provides the real-time capture of nodes’ status,
traffic, and delay between the ground station and nodes. Therefore, by using network
performance data from a network monitoring system, a network manager can track mesh
network efficiency and maintain the response time in the network, which enables the
network manager to make decisions promptly to sustain network performance and
minimize latency.

23
Performance management encompasses several important factors, including
performance metrics and performance statistics, to monitor the mesh network.
1. Performance Metrics
This parameter measures the important factors related to the performance of
networks: throughput, response time, network availability, and network reliability. While
all these factors are important, this section focuses on network throughput and response
time, in particular, which are used to measure latency.
a. Network Throughput
There are several performance metrics to measure the efficiency of a network. One
of the most important metrics is network throughput. According to Subramanian (2011),
“network throughput are bandwidth or capacity of the transmission media, its utilization,
and error rate of the channel, peak load, and average load of the traffic” (p. 409).
Constraints in free space limit the efficiency of a network, which reduces the flow of
information and creates latency between nodes and the ground station in mesh networks.
b. Response Time
Response time measures how long it will take information to transmit from source
to destination and back again, which gives a benchmark by which to measure latency.
According to Subramanian (2011), “the response time of a network not only depends on
the throughput of the network, but also on the application” (p. 409). In other words,
response time depends on various elements in the network such as equipment temperature,
protocols, radio capabilities, flight capabilities, routing algorithm protocols, and
application configuration. All these factors involved in response time efficiency in a mesh
network might reduce the response time interval, which indicates an increase in latency.
2. Performance Statistics
Network performance statistics observed from network software relies on various
sensors implemented in the nodes. These statistics help the network manager to identify
possible sources of latency. It will be useful to discuss the Wireless Sensor Network (WSN)

24
specifications to explain the sensor capabilities in a mesh network that provide good
performance statistics about nodes.
Relying on WSN features and benefits, the UAVs can exchange data. This benefit
of WSNs integrates the communication between UAV nodes and the ground station, which
allows UAV nodes to exchange data and send it to the ground station. According to Dan
Popescu, Cristian Dragana, Florin Stoican, Loretta Ichim, and Grigore Stamatesc (2018),
“the UAV has to pass near all of the sensor heads in order to retrieve information”; “The
[sensor built in each UAV node] allows to guarantee the feasibility of the trajectory (in the
sense that it respects the dynamics of the UAV) [which] allows various algebraic and
geometric guarantees” (Introduction, para. 5). This indicates that the WSN ensures
collecting information from nodes and passing it to the ground station. Further, the WSN
transmits the UAV position and altitude by utilizing algebraic and geometric capabilities
to monitor nodes’ status and assists the network manager in controlling the nodes remotely
based on sensor alarms.
3. Network Management
While it is important to measure the performance of nodes within networks,
managing the network through applications enhances the command and control of a UAV
mesh network. Applications to manage and control networks provide a convenient solution
to support and track technical issues remotely, which enhances the network manager’s
ability to maintain the health of a network according to the application features available.
According to Douglas E. Comer (2009, p. 540) “a manager needs to interact with a specific
hardware device, the manager runs an application program that acts as a client, and an
application program on the network device acts as server.” Network managers’ authority
to access the server (agent) allows them to control information sharing, control bandwidth,
track the traffic, and change or modify security parameters and other parameters.
Moreover, the network manager can manage packet delay through the use of the
conventional transport protocols. Using conventional protocols means a manager’s packets
will be subject to the same conditions as normal traffic. Therefore, in the case of a delay,
the network manager will control packet traffic remotely using a network application to

25
avoid packets being dropped between various nodes within a mesh network. In this
research, network management occurs via the simulation software discussed in Chapter III.
While this chapter focused on the network layers relevant to latency, the next
chapter, on research methodology, sets the simulation parameters and attributes of nodes
to measure latency between nodes and the ground station, which provides the baseline for
UAV nodes flying in free space and the virtual mesh network.

26
THIS PAGE INTENTIONALLY LEFT BLANK

27
III. RESEARCH METHODOLOGY
This chapter discusses the modeling methodology used in this research to assess
the relative latency at different altitudes of a UAV network. This modeling via computer
simulation describes an architecture consisting of two UAV nodes and having a MANET
topology to establish self-configuration without relying on infrastructure support such as a
ground station.
This chapter begins by discussing the capabilities of the UAV used in the
simulation, specifically, its maneuvering and radio capabilities. Next, the discussion
introduces the Riverbed simulation software. The chapter then describes the first scenario,
the MANET plus 3000, including the steps to configure the simulation, and the second
scenario, the MANET plus 2000. Results of these simulations are discussed in Chapter IV.
A. UAV SYSTEM CAPABILITIES
Identifying UAV system capabilities is critical to modeling the network
realistically. This task assists the network manager to design the UAV network
architecture. The UAV selected for this research is a Boeing ScanEagle, which supports
the MANET topology and has useful capabilities in a military mission. The set of UAV
capabilities described in the following paragraphs include the maneuvering and radio
capabilities.
1. Maneuvering Capabilities
Table 2 includes the UAV maneuvering capabilities that will used in simulation.

28
Table 2. UAV General Characteristics. Adapted from U.S. Air Force (2007).
As Table 2 shows, the ScanEagle’s maneuvering capabilities are determined by
characteristics such as its weight, size, maximum speed, and maximum flight time.
Including these characteristics in the simulation allows the software to determine
simulation duration. Modeling various characteristics, such as flight time set to 20 hours,
enables the software to determine the duration of the simulation as less than 20 hours.
Therefore, using the maximum flight altitude allows the research to adhere to the limit and
obtain realistic results within the values entered into the software. The payload of the
ScanEagle includes a high-resolution camera, which enables the UAV to transmit real-time
pictures of the ground without affecting the ScanEagle’s maneuvering capabilities.
2. Radio Capabilities
Whereas the flight characteristics provide information about the ScanEagle’s flight
ability in free space, radio capabilities are characterized by transmitter power and
transmission speed. These capabilities assist the researcher in determining changes that
occur in the mission such as packet latency and obstacles that reduce the signal strength
within MANET. Several of the relevant radio capabilities of ScanEagle are classified
information. The following math, therefore, is used to determine this research’s
assumptions about the UAV’s radio capabilities, and it relies on telecommunication
formulas.

29
a. Maximum Bit Rate
The max bit rate for video describes the speed of data per second; this calculation
is determined by the ScanEagle’s assumed camera resolution and standard frame rate of 30
fps, based on black and white camera resolution (960*720 p), 24 bits/pixel, and compressed
to MPEG format.
Convert Typical Camera Resolution to bit/sec
Camera Resolution = 960*720p = 691200 pixels / frame * 24 bits / pixel =
16,558,800 bits / frame *30 fps = 497,664,000 bits / sec
Convert bit/sec to MPEG (Compress File)
(497,664,000 b/s) / 40 MPEG = 12,441,600 bits / sec = 12.4 Mbps
b. Transmitter Power
Transmitter power (Pt), which is the power abilities of the transmitter. This
calculation is determined by assumption based on various standard parameters using the Pr
(Power receiver) Formula. The minimum received power for 802.11g at 54 Mbps is -82
dBm. The gain of the ground turnstile antenna (Gt) is 0 db. The gain of the aircraft blade
(Gr) antenna is 6 db. The distance between the ground antenna and the UAV’s is (5 km),
and the speed of light (3*108) m/s.
Pr = Pt + Gt +Gr-Lp (-82dBm) =Pt +0 db+6db-20log (4π * 5000(m) *2.4*109/3*108)
26dBm = Pt For simulation purposes, it is necessary to convert dBm to watts.
Convert (26 dBm to watts)
10 ^ (26 dBm /10) = 400 mW = 0.4 W

30
Table 3 shows the assumptions about ScanEagle radio capabilities.
Table 3. UAV Radio Capabilities.
B. RIVERBED SIMULATION SOFTWARE
Utilizing Riverbed Modeler Academic Edition software enables the researcher to
create a baseline model to analyze MANET latency between UAV nodes and the ground
station. This simulation allows a network manager to configure various nodes, and facilitate
communication by using multiple protocols to establish communication. Riverbed allows
the researcher to configure protocols between UAVs; control distance between nodes; set
up initial waiting time; adjust pitch, yaw, roll (height and movement) of the UAVs; and
test the signal throughput and packet latency. This in turn allows the network manager to
analyze various network scenarios and assists in simulating potential options. Therefore,
this research explores 3,000 feet and 2,000 feet options, which are the lowest possible
altitudes at which the UAVs can avoid enemy weapons. It is also important to model
network performance capabilities that enable transmitting better video quality to ground
stations.
C. SCENARIO 1: MANET PLUS 3000
The purpose of Scenario 1 testing and simulation is to measure direct path and
latency between the sender (the ground control station) and receivers (UAV nodes). In this
scenario, two UAVs operate at 3,000 feet (approximately 1 km) above the ground control
station (GCS), moving at a constant speed of 10 m/s and keeping a constant position
relative to each other at approximately 5 km from the GCS and approximately 7 km from
UAV 1 to UAV2. Therefore, the initial pitch is set as autocomputed to track the UAVs’
position and altitude. Likewise, the initial yaw and roll are set to autocomputed to control

31
the UAVs and ensure that the direction (left or right) is tracked during the flight. Providing
that scenario setup as the baseline for the simulation experiment allows the researcher to
visualize the UAVs’ link status, throughput, and packet delay at specific initial altitude
through reports and statistics. Based on these results the researcher is able to identify
maximum performance in the network design to serve as benchmark as constraints are
included in the next scenarios.
The following section shows the setup for Scenario 1 in Riverbed.
1. UAV Configuration
In this step, conducting the configuration for each UAV’s nodes and the GCS
allows the researcher to identify the status of nodes using the ping command in the event
of network failure. This step is repeated in nodes using the following pattern shown in
Table 4.
Table 4. UAV Nodes’ Internet Protocol Addresses.
Host Name IP Ground Station 192.168.1.1
ScanEagle-1 192.168.1.2 ScanEagle-2 192.168.1.3
These internet protocol (IP) addresses are assigned in Riverbed by editing the
attributes of each node, as shown in Figure 5.

32
Figure 5. UAV IP Setup in Riverbed.
It is also important after setup of the IP address to enable the routing information
protocol (RIP) for all nodes, to establish the hop count between various nodes within
MANET. Figure 6 shows the RIP setup.

33
Figure 6. RIP Setup in Riverbed.
2. IP Forwarding Setup
After assigning each node’s IP address and enabling the RIP, the researcher must
enable the IP forwarding to determine which packet can be sent to neighbor nodes. This
process allows the packet to be transmitted along a different route in an ad-hoc network.
Figure 7 shows the status option of the IP forwarding table.
34
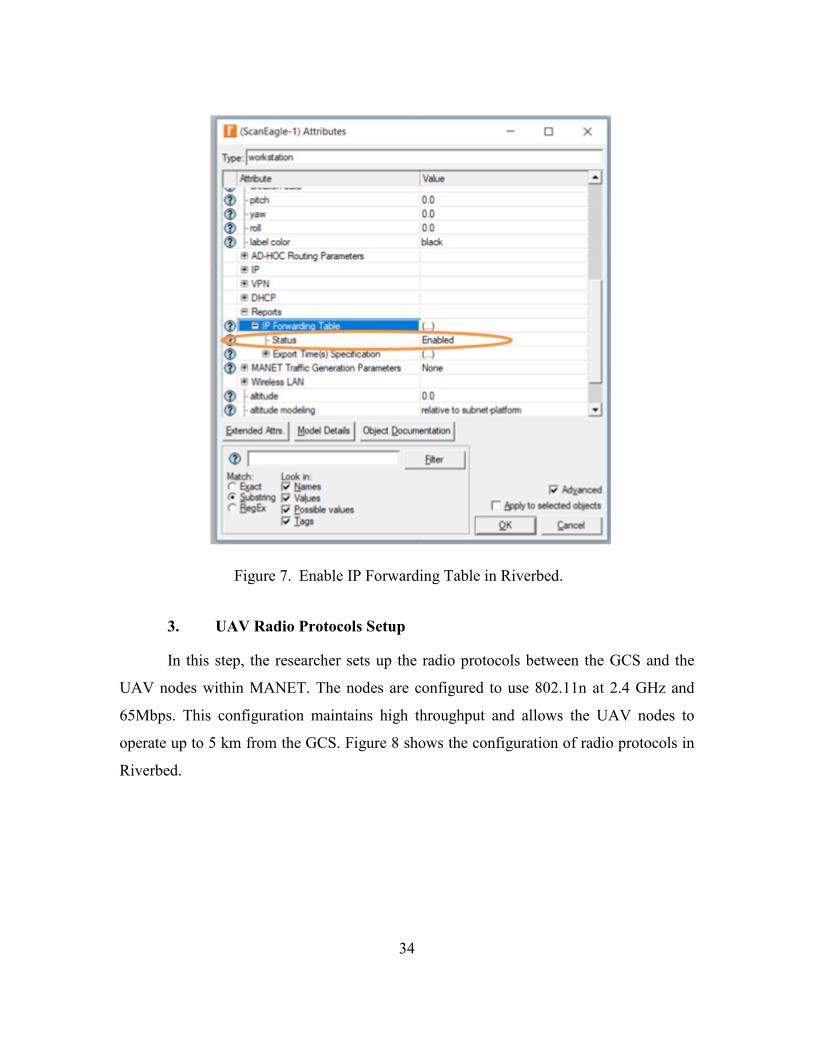
Figure 7. Enable IP Forwarding Table in Riverbed.
3. UAV Radio Protocols Setup
In this step, the researcher sets up the radio protocols between the GCS and the
UAV nodes within MANET. The nodes are configured to use 802.11n at 2.4 GHz and
65Mbps. This configuration maintains high throughput and allows the UAV nodes to
operate up to 5 km from the GCS. Figure 8 shows the configuration of radio protocols in
Riverbed.

35
Figure 8. UAV Protocol Setup in Riverbed.
4. UAV Ad-Hoc Parameters Setup
After setting up the UAVs’ radio protocols, the researcher sets up the ad-hoc
parameters to initiate routing protocols between the GCS and the nodes. In this setup, the
researcher utilizes DSR protocols that allow the nodes to be self-configuring and self-
organizing. Consequently, when a path failure occurs, the DSR will identify another path.
Figure 9 shows the ad-hoc parameters setup. The DSR record route and the DSR record
export should be enabled.

36
Figure 9. Ad-Hoc Routing Parameters Setup in Riverbed.
5. UAV Geographic Location
At this point it is useful to state the assumption of this research that this maneuver
was conducted at Camp Roberts on an area approximately 7 Km. Therefore, the
forthcoming setupdefine trajectory, altitude level, and distancedepend on this area of
operation. Figure 10 shows the geographic location for Camp Roberts Army Base located
in California.
37
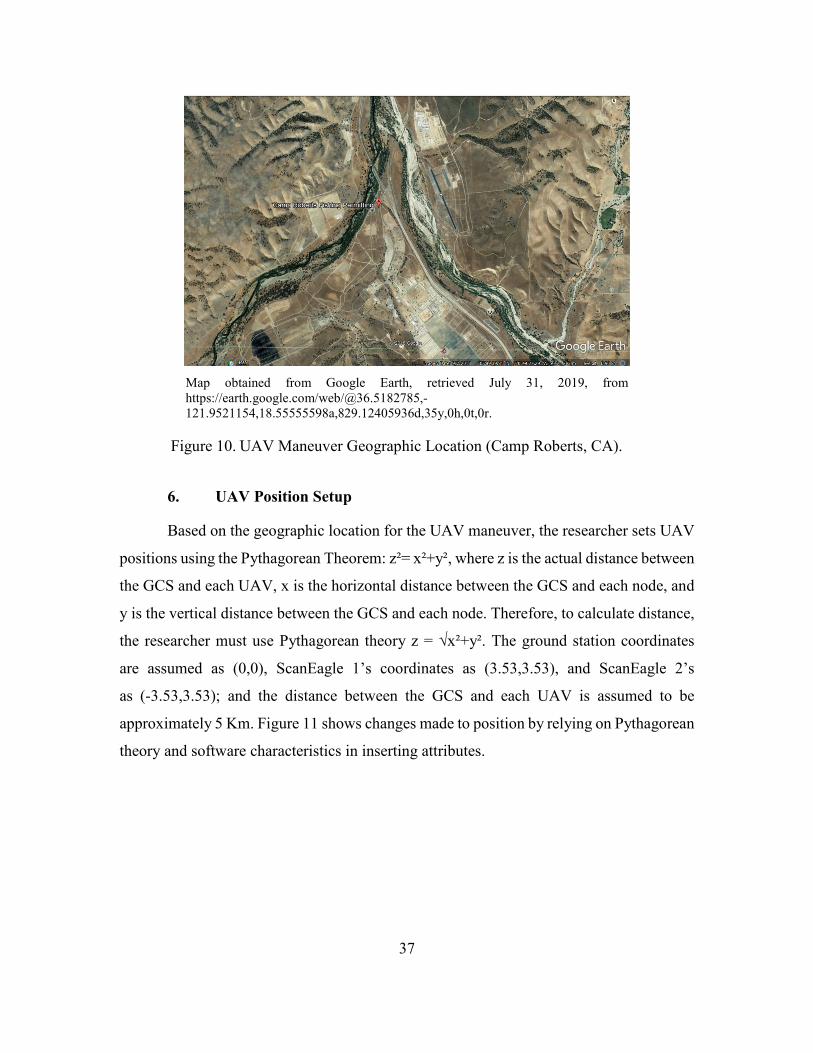
Map obtained from Google Earth, retrieved July 31, 2019, from https://earth.google.com/web/@36.5182785,-121.9521154,18.55555598a,829.12405936d,35y,0h,0t,0r.
Figure 10. UAV Maneuver Geographic Location (Camp Roberts, CA).
6. UAV Position Setup
Based on the geographic location for the UAV maneuver, the researcher sets UAV
positions using the Pythagorean Theorem: z²= x²+y², where z is the actual distance between
the GCS and each UAV, x is the horizontal distance between the GCS and each node, and
y is the vertical distance between the GCS and each node. Therefore, to calculate distance,
the researcher must use Pythagorean theory z = √x²+y². The ground station coordinates
are assumed as (0,0), ScanEagle 1’s coordinates as (3.53,3.53), and ScanEagle 2’s
as (-3.53,3.53); and the distance between the GCS and each UAV is assumed to be
approximately 5 Km. Figure 11 shows changes made to position by relying on Pythagorean
theory and software characteristics in inserting attributes.

38
Figure 11. ScanEagle1 and ScanEagle2 Positions in Riverbed.
7. UAV’s Altitude Setup
The next step is adjusting the altitude for the UAVs’ nodes to obtain accurate
measurement of the UAV altitude level in free space. This modification allows the software
to specify UAV position in free space. In both scenarios, pitch, yaw, and roll are kept to
autocomputed to track UAV position and movement during maneuver and to establish
baseline network performance. Figure 12 shows the parameters for defining trajectory to
adjust altitude and position level for all UAVs during maneuver.

39
Figure 12. UAV Altitude Setup in Riverbed.
8. UAV Trajectory Setup
Once the UAVs’ positions are defined, the researcher defines the trajectory of the
UAV nodes with consideration that the GCS is at 0 level. This trajectory specifies the path
of both UAVs during maneuver. This also indicates that the trajectory of theses nodes
maintains the antenna orientation at the same level. Figure 13 shows the UAVs’ trajectory
setup in Riverbed software.

40
Figure 13. UAV Trajectory Setup in Riverbed.
9. UAV Data Table
After all settings are input into the software, it produces the UAVs’ trajectory table.
This allows the researcher to verify that all input is accurate and the distance between
UAVs is within the range of radio capabilities, and the altitude and speed of both UAVs
are identical. Figure 14 summarizes the setup for implementing the simulation of MANET
baseline latency. This information in the trajectory table shown is based on (10 m/s)
trajectory speed.

41
Figure 14. UAV Trajectory Data Table in Riverbed.
10. UAV Traffic Flow Setup
Once the physical configuration of the nodes is complete, the next step is
establishing traffic flow. This setup assists researchers to identify and examine the total bit
flow per second, which is needed to observe the network health status between UAV nodes
and the GCS. In this task the researcher must set up the TCP, which is operates in Layer 4
(Transport layer) to check the connectivity of devices and examine the response between
multiple sources and their destination. Testing and examining connectivity in the baseline
MANET scenarios between multiple inputs and outputs captures the speed of data flow
from the GCS to all other nodes in the MANET. The first step is to set up the IP unicast
traffic flow to generate the traffic center report, followed by setting up VOIP to simulate
audio and video transmission.
a. Create IP Uincast Traffic Flow
In this setup, the researcher creates IP unicast traffic (full mesh among all nodes)
to verify the throughput among all nodes within the MANET. In this step, the researcher
selects Auto Assigned for the destination IP address, and to support streaming multimedia,
for type of service AF41 is selected. Finally, to obtain good throughput for the purpose of

42
UAV video transmission in capturing ground images, the researcher enters 100000 packet/s
and 63 Mbps. Figure 15 shows the IP unicast traffic flow parameters set up in Riverbed.
Figure 15. IP Unicast Traffic Flow Setup in Riverbed.
b. Create VOIP Traffic Flows
After setting up the IP unicast traffic flow, the researcher sets up the Voice over IP
(VOIP) by using type of service (Streaming Multmedia [AF41]), to ensure that all delivery
of multimedia and communication over IP is implemented between the GCS and other
nodes. Figure 16 shows the setup of VOIP in Riverbed.

43
Figure 16. VOIP Traffic Flow Setup in Riverbed.
c. Analyze the Traffic Center Report
Based on the completed setup, the software produces the traffic center report, which
allows the researcher to visualize the total bits per second to identify the throughput
efficiency from the traffic center. Figure 17 is an example of the traffic center report for
this scenario. Results are discussed in Chapter IV.

44
Figure 17. Traffic Center Report Generated by Riverbed.
11. MANET Traffic Generation Setup
After traffic flow setup, it is important to specify the packet size and destination. In
this research, the destination of one of the UAV nodes is set to other node’s destination.
Packet size should be higher than the Intensity parameters bps field / Packet/sec field,
which increases the traffic sent and received within the MANET. Table 5 shows the
distribution of MANET traffic destinations built in each node to ensure the traffic path and
data transmission to all nodes in the mesh network.
Table 5. Distrbution of MANET Traffic Destinations.
UAV’s IP Destination
192.168.1.1 Nodes: 192.168.1.2 / Nodes: 192.168.1.3
192.168.1.2 Nodes : 192.168.1.1 / Nodes: 192.168.1.3
192.168.1.3 Nodes : 192.168.1.1 / Nodes: 192.168.1.2
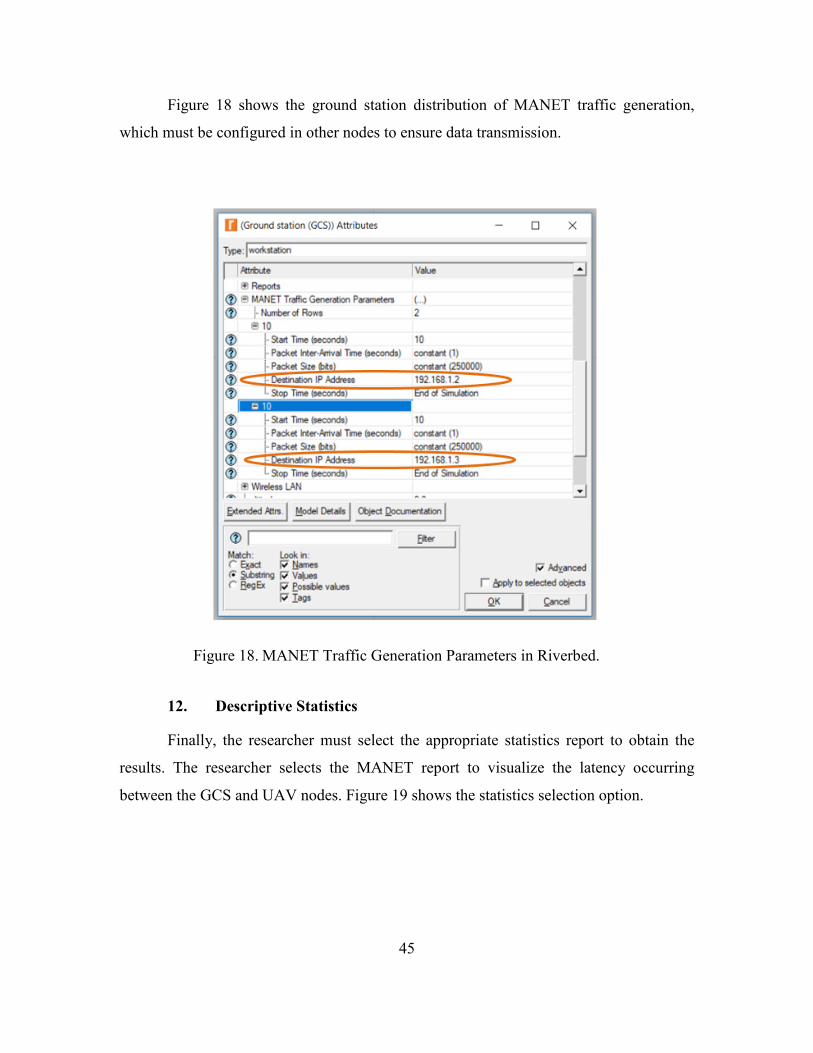
45
Figure 18 shows the ground station distribution of MANET traffic generation,
which must be configured in other nodes to ensure data transmission.
Figure 18. MANET Traffic Generation Parameters in Riverbed.
12. Descriptive Statistics
Finally, the researcher must select the appropriate statistics report to obtain the
results. The researcher selects the MANET report to visualize the latency occurring
between the GCS and UAV nodes. Figure 19 shows the statistics selection option.

46
Figure 19. MANET Descriptive Statistics Report Selection in Riverbed.
13. Run Simulation
After verifying the parameters, in this step the researcher runs the hour-long
simulation and selects the report to view latency in the MANET as shown in Figure 20.
The MANET latency report supports the researcher’s effort to analyze packet latency
during this simulation. The measurement used to determine MANET latency in this
research is the MANET delay report, which captures the link state efficiency between the
GCS and the UAVs in free space, including orientation, altitude, distance, and speed. It is
also important in this step to change the parameters of the Link Usage report to peak usage
for all links to obtain link patterns showing the signal throughput status.

47
Figure 20. Simulation Report Window in Riverbed.
D. SCENARIO 2: MANET PLUS 2000
In this scenario, the researcher adjusts UAV position altitude to 2,000 feet to
observe any difference in MANET latency. The nodes are approximately 0.609 km above
the ground station as compared to Scenario 1 in which they were 1 km above the GCS.
This change in parameters of altitude is intended to enhance energy replenishment and
achieve the objective of maintaining the energy level among UAVs in the MANET, which
does not rely on fixed infrastructure. According to Yong Zeng, Rui Zhang, and Teng Joon
Lim (2016), “[The] UAV is scheduled to leave the serving area for energy replenishment,
during which the service gap is temporarily filled by neighboring UAVs via e.g., increasing
the transmission power and/or adjusting the aircraft positions. (p.39). This indicates that
adjusting the altitude between the GCS and UAVs is the solution to reduce energy
consumption during the UAV mission and obtain energy efficiency between UAV nodes.
Changing the distance reinforces UAV telecommunication because every maneuver
requires energy consumption. Therefore, controlling the energy will not only control the
real-time flight interval, but also reduce energy consumption, which will enhance overall

48
energy efficiency (bits/Joule). Enhancing energy efficiency, in turn, leaves more power to
transmit data, which could reduce latency.
In this option, therefore, the two UAVs will operate at 2,000 feet above ground
level. Both UAVs are moving at a constant speed of 10 m/s, and maintain a constant
position relative to each other. The initial pitch is set as autocomputed to keep the UAVs
at the same altitude. Likewise, the initial yaw and roll are set to autocomputed to control
the UAVs and ensure that the direction (left or right) is tracked during the flight. Based on
these settings, the researcher reruns the simulation to identify the difference in latency
between this scenario and Scenario 1 (3000 PLUS MANET). The parameter changes for
Scenario 2 are the UAVs’ altitude setup and the UAVs’ trajectory setup. Unless noted
otherwise, all other simulation parameters are the same as in Scenario 1.
1. UAV Altitude Setup
Based on assumptions of Scenario 1, changing the UAVs’ altitude to set up all UAV
nodes involved in this simulation will maintain UAV altitude. This change of altitude changes
the distance between nodes and the GCS in the MANET, which might produce different results
from those of Scenario 1. Figure 21 shows the changes entered for this option.
Figure 21. UAV Altitude Setup in Riverbed.

49
2. UAV Trajectory Setup
After setting up the altitude between the nodes and GCS, the researcher must
specify the trajectory path and establish a link between the two UAV nodes. Figure 22
shows the UAVs’ trajectory setup.
Figure 22. UAV Trajectory Setup in Riverbed.
3. UAV Data Table
Figure 23 shows the table containing the changed altitude and distance between
UAVs, which is used to verify that the setup is accurate. This parameter is set at 10 m/s for
speed as it was for the MANET Plus 3000 UAV nodes’ speed.

50
Figure 23. UAV Data Table in Riverbed.
The results from these scenarios are discussed in Chapter IV.
E. SUMMARY OF MANET MODELING AT ALTITUDES OF 3000 FEET AND 2000 FEET
Table 6 summarizes all changes made in the MANET model from Scenario 1
(MANET PLUS 3000) to Scenario 2 (MANET PLUS 2000). This table summarizes the
comprehensive approach and methodology the researcher used to run the simulations and
obtain the results, which provides a baseline for creating a MANET architecture that
analyzes latency between the GCS and UAV nodes.

51
Table 6. Summary of Developed MANET Model.

52
THIS PAGE INTENTIONALLY LEFT BLANK

53
IV. SIMULATION RESULTS
Based on the methodology applied in the previous chapter, this chapter presents the
results and findings of the simulation. First, it discusses the results presented in the DSR
MANET Delay Reports from the two scenarios. It then determines the differences between
these scenarios. The simulation results indicate that there is no significant difference in
MANET delay (bits per second) between Scenario 1 (MANET PLUS 3000) and Scenario
2 (MANET PLUS 2000).
A. SCENARIO 1: DSR MANET DELAY REPORT (PLUS 3000) RESULTS AND DISCUSSION
In this section the researcher focuses on MANET delay and throughput (traffic sent
and traffic received) output results based on UAVs positioned at an altitude of 3,000 feet.
The graphs in Figure 24 show the descriptive statistics for MANET delay based on
the DSR routing algorthim, network size of three nodes, and mobility speed of 10 m/s. In
this case, one node is the GCS and two nodes behave as MANET stations (mobile nodes)
within 7 km distance between ScanEagle 1 and ScanEagle 2, operating at 3,000 feet above
the GCS .
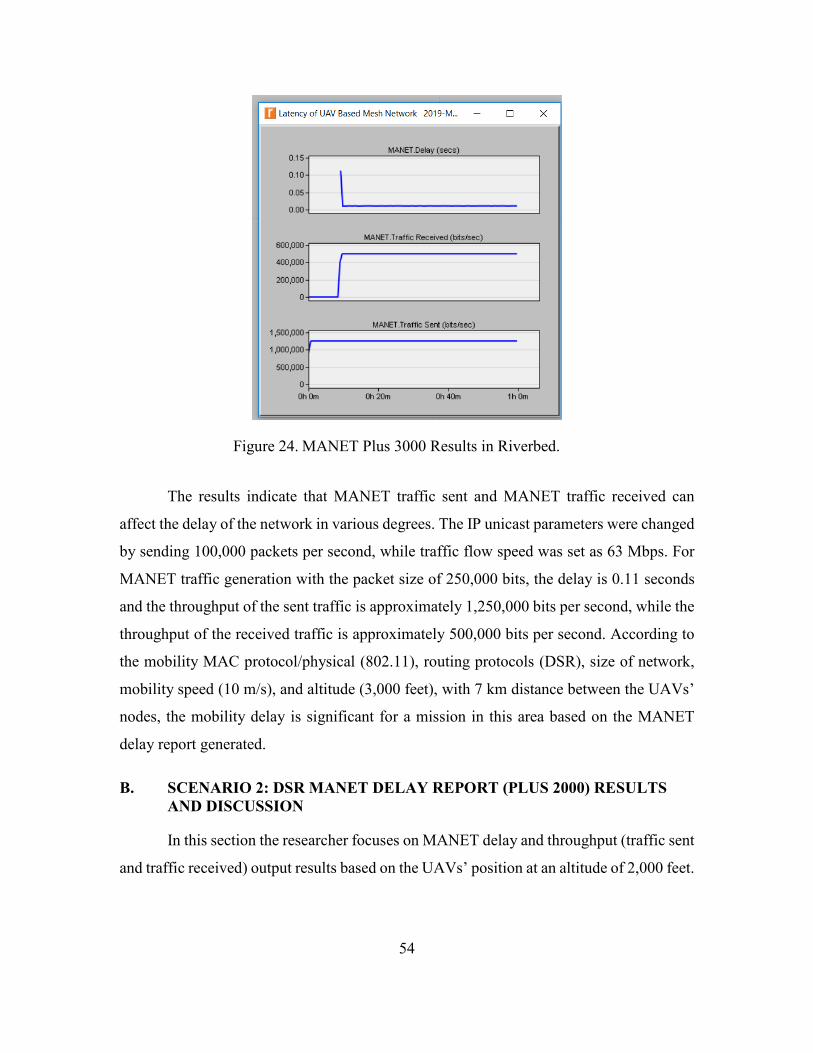
54
Figure 24. MANET Plus 3000 Results in Riverbed.
The results indicate that MANET traffic sent and MANET traffic received can
affect the delay of the network in various degrees. The IP unicast parameters were changed
by sending 100,000 packets per second, while traffic flow speed was set as 63 Mbps. For
MANET traffic generation with the packet size of 250,000 bits, the delay is 0.11 seconds
and the throughput of the sent traffic is approximately 1,250,000 bits per second, while the
throughput of the received traffic is approximately 500,000 bits per second. According to
the mobility MAC protocol/physical (802.11), routing protocols (DSR), size of network,
mobility speed (10 m/s), and altitude (3,000 feet), with 7 km distance between the UAVs’
nodes, the mobility delay is significant for a mission in this area based on the MANET
delay report generated.
B. SCENARIO 2: DSR MANET DELAY REPORT (PLUS 2000) RESULTS AND DISCUSSION
In this section the researcher focuses on MANET delay and throughput (traffic sent
and traffic received) output results based on the UAVs’ position at an altitude of 2,000 feet.

55
The graph in Figure 25 shows the descriptive statistics for MANET delay based on the
DSR routing algorthim, a network size of three nodes, and mobility speed of 10 m/s. In this
case, one node is the GCS and two nodes behave as MANET stations (mobile nodes) within 7
km distance between ScanEagle 1 and ScanEagle 2, operating at 2,000 feet above the GCS .
Figure 25. MANET Plus 2000 Results in Riverbed.
Based on this case, the IP unicast parameters were changed to send 100,000 packets
per second, and traffic flow speed was set as 63 Mbps. For MANET traffic generation with
a packet size of 250,000 bits, the delay is approximately 0.17 seconds and the throughput
of sent traffic is approximately 1,500,000 bits per second, while the throughput of received
traffic is approximately 500,000 bits per second. Given the mobility MAC
protocol/physical (802.11), routing protocols (DSR), size of network, mobility speed of 10
m/s, altitude of 2,000 feet and 7 km distance between UAV nodes, the mobility delay is
significant for a mission in this area based on the MANET delay report generated.

56
C. RESULTS COMPARISON
The results from both scenarios reveal that there is no significant difference in
latency in the MANET between when the UAVs operated at an altitude of 3,000 feet and
2,000 feet, respectively, when the same parameters used in this research were used in the
Riverbed simulation (OPNET). Therefore, in a similar mission, using the altitude of 3,000
feet would be desirable from the standpoint of safety, video surveillance, and network
performance.

57
V. CONCLUSIONS AND RECOMMENDATIONS FOR FUTURE RESEARCH
This thesis has built upon research into human and organizational factors in
networking. By measuring wireless delay through simulation of UAV MANET networks
with constant pitch, yaw, and roll at different altitudes, it aims to enhance C2 and network
management, which can reinforce the information cycle in the military operation
environment. This chapter discusses lessons learned during the simulations, summarizes
the results, and offers conclusions based on the results. This chapter also makes
recommendations for future research.
A. METHODOLOGY: LESSONS LEARNED
During this research, the researcher learned several lessons about configuring the
simulation:
• In MANET traffic generation setup, configuring each node with the other
nodes requires, generating sent and received traffic which results in
finding the delay between those nodes.
• In MANET traffic generation setup, the network manager must first
determine the packet size by measuring intensity (the bps field divided by
packet/sec) to specify the appropriate packet size to radio capabilities bps.
• In traffic flow setup, it necessary to use unicast traffic flow rather than
multicast because unicast relies on the three-handshake method of
telecommunication between nodes to verify traffic between each pair of
nodes.
B. SUMMARY AND CONCLUSION
Based on the UAV simulation results using MANET, Scenario 1 (MANET Plus
3000) displays no more delay than Scenario 2 (MANET Plus 2000). Further, the results
indicate that even an altitude of only 1,000 presents no significant difference in MANET

58
latency results in comparison to Scenario 1 (MANET Plus 3000) and Scenario 2 (MANET
Plus 2000). Higher altitudes, however, are better for practical considerations. As already
noted, UAVs can fly at higher altitudes with no significant difference in latency, and an
altitude of 3,000 feet in particular allows for observation of a wider area and reduces the
UAVs’ vulnerability to enemy weapons.
Although the simulation results provide a baseline latency measurement for the two
scenarios presented, they do not consider air and equipment temperature or other
constraints that might affect MANET latency or change the results obtained in this
research. Therefore, to obtain a more realistic MANET latency result, future researchers
using Riverbed to model the UAV architecture should include such constraints to the
baseline methodology applied in this research. To assist in this process, the appendix
contains a template to help in modeling UAV-based MANET latency and throughput.
C. FUTURE RESEARCH
This thesis examines the throughput of the MANET network using a Riverbed
simulation model to analyze MANET latency. While this approach does offer useful insight
into UAVs and latency in network, other features of the network still require in-depth
analysis to improve C2 and network management.
From the network manager’s standpoint, using particular network parameters,
different protocols, and different numbers of drones; simulating different altitudes; and
changing the distance between UAVs and the GCS will be appropriate to obtain better
results in testing to fine tune the UAV’s architecture and minimize wireless delay. This in-
depth examination of multiple scenarios and methodology will assist the network manager
to track and respond to the changes that occur when using various variables to finalize the
topology and architecture that will be used in real military operations.
From the constraint influence standpoint, in-depth measurements of constraints
such as environmental temperature and UAV nodes’ temperature can give more accurate
results to researcher in measuring the latency in seconds, because of the effect of these
constraints in mesh networks. Such constraints will result in creating latency between
nodes and the GCS. Adding these constraints will refine the results from this research and

59
offer the researcher an approximate visualization of what will occur in realistic free space
and what is better for safe maneuvering of the UAVs.
These more realistic simulations can serve as a preliminary step before conducting
experimentation in the field, and will enhance the network manager’s decision making and
the command and control cycle.

60
THIS PAGE INTENTIONALLY LEFT BLANK

61
APPENDIX. MANET SIMULATION TEMPLATE
File Name: ______________________________________________________
Test No.: ______________________________________________________
Software Used ______________________________________________________
Date ______________________________________________________
MANET Model Parameters
1. Environment Area (m X m) ______________________________________
2. Routing Protocols:
□ DSR □ AODV □ OLSR
If Using DSR Routing Protocols (Enable Both Parameters Below )
DSR Record Route □ Enable □ Disable
DSR Record Export □ Enable □ Disable
3. Data Rate _____________________________________________________
4. Traffic Source
□ HTTP □ FTP □ Others_____________
5. Network Size (No. of Nodes) ______________________________________
6. Mobility Speed _________________________________________________
7. MAC/ Protocol Physical __________________________________________

62
8. Transmission Power ______________________________________________
9. Node Placement _________________________________________________
10. Altitude ________________________________________________________
11. Type of Antenna _________________________________________________
12. Traffic Flow
□ IP Unicast □ IP Multicast
13. VOIP __________________________________________________________
14. MANET Traffic Generation
Packet Size (bits/sec ÷ Packet /sec) __________________________________
Destinations _____________________________________________________
15. IP Forwarding
□ Enable □ Disable
16. RIP
□ Enable □ Disable
17. Link Usage Report
□ Disabled □ Peak Usage for All Links

63
MANET Result
Traffic Sent ____________________________________________________________
Traffic Received ________________________________________________________
Delay _________________________________________________________________

64
THIS PAGE INTENTIONALLY LEFT BLANK
65
LIST OF REFERENCES
Alshabtat, A.I., & Dong, L. (2011). Low latency routing algorithm for unmanned aerial vehicles ad-hoc networks. World Academy of Science, Engineering and Technology International Journal of Electric and Computer Engineering, 5(8), 984–990. Retrieved from https://waset.org/publications/5721/low-latency-routing-algorithm-for-unmanned-aerial-vehicles-ad-hoc-networks
Beal, V. (2018, April 3). The 7 layers of the OSI model. Retrieved from https://www.webopedia.com/quick_ref/OSI_Layers.asp
Cisco. (2018). Cisco Nexus 9000 Series NX-OS Unicast routing configuration guide, release 7.x. Retrieved from https://www.cisco.com/c/en/us/td/docs/switches/datacenter/nexus9000/sw/7-x/unicast/configuration/guide/l3_cli_nxos/l3_route.pdf
Comer, D. E. (2009). Computer networks and internets. Upper Saddle River, N.J: Pearson Prentice Hall.
De Vita, P. (2012). AN4190 application note: Antenna selection guidelines. Geneva, Switzerland: STMicroelectronics. Retrieved from https://www.st.com/content/ccc/resource/technical/document/application_note/82/38/3f/9f/fd/4d/4f/ab/DM00068254.pdf/files/DM00068254.pdf/jcr:content/translations/en.DM00068254.pdf
Frieden. D. (1988). Principles of naval weapons systems. Annapolis, MD: United States Naval Institute.
Harris Corporation. (n.d.). The wave of the future: The evolution of electronic warfare. Retrieved from https://www.harris.com/content/the-wave-of-the-future-the-evolution-of-electronic-warfare
IBM Knowledge Center. (2010). Static routing information. Retrieved from https://www.ibm.com/support/knowledgecenter/zosbasics/com.ibm.zos.znetwork/znetwork_107.htm
InetDaemon. (2018).Static vs. dynamic routing. Retrieved from https://www.inetdaemon.com/tutorials/internet/ip/routing/dyamic_vs_static.shtml
Johnson, D., Hu, Y., & Maltz, D. (2007). The dynamic Source Routing Protocols (DSR) for Mobile Ad Hoc Networks for IPV4 [Working paper]. Retrieved from https://tools.ietf.org/html/rfc4728

66
Jones, H. A. (2007) Free-space optics: Laser link offers fiber quality through cloud cover. Laser Focus World. Retrieved from https://www.laserfocusworld.com/articles/print/volume-43/issue-1/world-news/free-space-optics-laser-link-offers-fiber-quality-through-cloud-cover.html
Li, J., Y. Zhou, & Lamont, L. (2013). Communication architectures and protocols for networking unmanned aerial vehicles. Paper presented at Globecom 2013 workshop, Atlanta, GA, USA. Retrieved from http://doi.org/10.1109/GLOCOMW.2013.6825193
Manion, T. R., Kim, R. Y., & Patiejunas, K. (2008). U.S. Patent No. US8776188B2. Washington, DC: U.S. Patent and Trademark Office. Retrieved from https://patents.google.com/patent/US8776188B2/en
Maupin, S. M. (2016). Fighting the networks: MANET management in support of littoral operations (Master’s thesis). Retrieved from https://calhoun.nps.edu/handle/10945/48561
Maurya, A., Sharma, G., Sahu, V., Roberts, A., & Srivastava, M. (2012). An overview of AODV routing protocols. International Journal of Modern Engineering Research (IJMER), 2(3), 728–732. Retrieved from https://www.researchgate.net/publication/252068339_An_Overview_of_AODV_Routing_Protocol
Misra, S., & Goswami, S. (2017). Network routing. Fundamentals, applications, and emerging technologies. Retrieved from https://nps.primo.exlibrisgroup.com/discovery/fulldisplay?docid=alma991005430096603791&context=L&vid=01NPS_INST:01NPS&search_scope=MyInst_and_CI&tab=Everything&lang=en
Mitchell, B. (2018). Ad-hoc wireless network setup: Here’s how to build a computer-to-computer, P2P network. Retrieved from https://www.lifewire.com/set-up-an-ad-hoc-peer-wifi-network-818272
NETGEAR. (2019). What is the difference between 2.4 GHz and 5 GHz wireless frequencies? Retrieved from https://kb.netgear.com/29396/What-is-the-difference-between-2-4-GHz-and-5GHz
The Physics Classroom. (n.d.). Reflection, refraction, and diffraction. Retrieved January 4, 2019, from https://www.physicsclassroom.com/class/waves/Lesson-3/Reflection,-Refraction,-and-Diffraction
Popescu, D., Dragana, C., Stoican, F., Ichim, L., & Stamatesc, G. (2018). A collaborative UAV-WSN network for monitoring large areas. Sensors, 18(12). Retrieved from https://www.mdpi.com/1424-8220/18/12/4202/htm

67
Snook, S. A. (2011). Friendly fire: The accidental shootdown of U.S. Black Hawks over Northern Iraq. Princeton: Princeton University Press.
Stutzman, W. L., & Thiele, G. A. (1998). Antenna theory and design. Hoboken, NJ: Wiley.
Subramanian, M. (2011). Network management: Principles and practice. Chennai, India: Pearson.
U.S. Air Force. (2007). About us. Retrieved from https://www.af.mil/About-Us/Fact-Sheets/Display/Article/104532/scan-eagle/
West, J., Dean, T., & Andrews, J. (2016). CompTIA Network+ guide to networks (7th ed.). Boston, MA: Cengage Learning.
Wood, J.T. (n.d.). The advantages of ad hoc networks. Retrieved from https://itstillworks.com/advantages-ad-hoc-networks-6793071.html
Zeng, Y., Zhang, R., & Lim, T. J. (2016). Wireless communications with unmanned aerial vehicles: Opportunities and challenges. IEEE Communications Magazine, 54(5), 36–42. Retrieved from https://doi.org/10.1109/MCOM.2016.7470933

68
THIS PAGE INTENTIONALLY LEFT BLANK

69
INITIAL DISTRIBUTION LIST
1. Defense Technical Information Center Ft. Belvoir, Virginia 2. Dudley Knox Library Naval Postgraduate School Monterey, California
Copyright © 2022 FDOKUMEN