Classification of Analog Modulated Communication Signals using Clustering Techniques: A Comparative...
10
F. Ü. Fen ve Mühendislik Bilimleri Dergisi, 17 (2), 247-256, 2005 Classification of Analog Modulated Communication Signals using Clustering Techniques: A Comparative Study Hanifi GULDEMIR Abdulkadir SENGUR [email protected] [email protected] Firat University, Technical Education Faculty, Department of Electronic and Computer Science, 23119, Elazig, TURKEY Abstract In this paper, a comparative study of classification of the analog modulated communication signals using clustering techniques is introduced. Four different clustering algorithms are implemented for classifying the analog signals. These clustering techniques are K-means clustering, fuzzy c-means clustering, mountain clustering and subtractive clustering. Two key features are used for characterizing the analog modulation types. Performance comparison of these clustering algorithms is made using computer simulations. Keywords: Modulation recognition, modulation classification, clustering 1. Introduction In the past, modulation recognition relied mostly on operators scanning the radio frequency spectrum and checking it on the display. The accuracy of this method is depend on the operators. The dependency to the operator has led to the development of automatic modulation recognition systems. Recognition of the modulation type of an unknown signal provides an insight into its structure, origin and properties and is also crucial in order to retrieve the information stored in the signal. Generally, two main approaches are used in modulation classification algorithms. These are the decision theoretic and statistical pattern recognition algorithms [1-5]. In 1990’s, artificial neural networks are introduced for the modulation classification [6-7]. In this paper, clustering algorithms based modulation classification is presented. Clustering techniques group data in clusters to obtain useful information. In each cluster, the data exhibits similarity. Clustering is an unsupervised pattern classification technique which partitions the input space into K regions based on some similarity or dissimilarity metric [8]. Several algorithms for clustering data when the number of clusters is known priori are available in the literature [9, 10]. Communication signals traveling in space with different modulation types and different frequencies. These signals use a variety of modulation techniques in order to send an information. It is required to identify these signals for many applications, both defense and civilian. Civilian applications may include monitoring the non-licensed transmitters, while defense applications may be electronic surveillance systems. In this paper, the conventional clustering techniques are used for the modulation classification. K-means clustering, fuzzy c-means clustering, mountain clustering and subtractive clustering techniques were selected and evaluated on a data set obtained from analog modulated communication signals. These modulations are amplitude modulated signals (AM),
-
Upload
independent -
Category
Documents
-
view
2 -
download
0
Transcript of Classification of Analog Modulated Communication Signals using Clustering Techniques: A Comparative...
F. Ü. Fen ve Mühendislik Bilimleri Dergisi, 17 (2), 247-256, 2005
Classification of Analog Modulated Communication Signals using
Clustering Techniques: A Comparative Study Hanifi GULDEMIR Abdulkadir SENGUR [email protected] [email protected]
Firat University, Technical Education Faculty, Department of Electronic and Computer Science, 23119, Elazig, TURKEY
Abstract
In this paper, a comparative study of classification of the analog modulated communication signals using clustering techniques is introduced. Four different clustering algorithms are implemented for classifying the analog signals. These clustering techniques are K-means clustering, fuzzy c-means clustering, mountain clustering and subtractive clustering. Two key features are used for characterizing the analog modulation types. Performance comparison of these clustering algorithms is made using computer simulations.
Keywords: Modulation recognition, modulation classification, clustering
1. Introduction
In the past, modulation recognition relied mostly on operators scanning the radio frequency spectrum and checking it on the display. The accuracy of this method is depend on the operators. The dependency to the operator has led to the development of automatic modulation recognition systems. Recognition of the modulation type of an unknown signal provides an insight into its structure, origin and properties and is also crucial in order to retrieve the information stored in the signal. Generally, two main approaches are used in modulation classification algorithms. These are the decision theoretic and statistical pattern recognition algorithms [1-5]. In 1990’s, artificial neural networks are introduced for the modulation classification [6-7]. In this paper, clustering algorithms based modulation classification is presented.
Clustering techniques group data in clusters to obtain useful information. In each cluster, the data exhibits similarity. Clustering is an unsupervised pattern classification technique which partitions the input space into K regions based on some similarity or dissimilarity metric [8]. Several algorithms for clustering data when the number of clusters is known priori are available in the literature [9, 10].
Communication signals traveling in space with different modulation types and different frequencies. These signals use a variety of modulation techniques in order to send an information. It is required to identify these signals for many applications, both defense and civilian. Civilian applications may include monitoring the non-licensed transmitters, while defense applications may be electronic surveillance systems.
In this paper, the conventional clustering techniques are used for the modulation classification. K-means clustering, fuzzy c-means clustering, mountain clustering and subtractive clustering techniques were selected and evaluated on a data set obtained from analog modulated communication signals. These modulations are amplitude modulated signals (AM),
H. Guldemir and A. Sengur
248
double side band modulated signals (DSB), upper side band signals (USB), lower side band signals (LSB) and frequency modulated signals (FM). Two key features, the maximum value of the normalized centered instantaneous amplitude of the intercepted signal and the signal spectrum symmetry around the carrier, are employed for forming the data points. A comparative study is achieved based on the computer simulations. There has not been discussed such a comparative study which incorporates characteristics of modulation types. The performance analysis of the examined clustering techniques is performed and simulation results are presented.
2. Clustering
The goal of clustering is to identify structure in an unlabeled data set by objectively organizing data into homogeneous groups where the within-group similarity is minimized and the between-group dissimilarity is maximized. Clustering is necessary when no labeled data are available regardless of whether the data are binary, categorical, numerical, interval, ordinal, relational, textual, spatial temporal, spatio-temporal, image, multimedia, or mixtures of the above data types. Data are called static if all their feature values do not change with time, or change negligibly. The bulk of clustering analyses has been performed on static data. Most, if not all, clustering programs developed as an independent program or as part of a large suite of data analysis or data mining software to date work only with static data [11].
In this study we examine four of the most representative clustering techniques which are frequently used in radial basis function networks and fuzzy modeling [12]. These are K-means clustering, fuzzy C-means clustering, mountain clustering method and subtractive clustering. More detailed discussions of clustering techniques are presented in [13].
2.1. K-means Clustering
The k-means was first developed more than three decades ago. The main idea behind it is the minimization of an objective function, which is normally chosen to be the total distance between all patterns from their respective cluster centers. Its solution relies on an iterative scheme, which starts with arbitrarily chosen initial cluster memberships or centers. The distribution of objects among clusters and the updating of cluster centers are the two main steps of the c-means algorithm. The algorithm alternates between these two steps until the value of the objective function cannot be reduced anymore. Given n patterns {xk|k = 1 . . . n}, c-means determine c cluster centers {vi |i=1 . . . c}, by minimizing the objective function given as;
∑∑= =
−=c
i
n
kikik vxuVUJMin
1 1
2||||),( (1)
||.||,},1,0{ andkiuik ∀∈ in the above equation is normally the Euclidean distance measure [11].
Classification of Analog Modulated Communication Signals using Clustering Techniques: A …
249
2.2. Fuzzy C-Means Clustering
The c-means algorithm allows for fuzzy partition, rather than hard partition, by using the objective function given in Eq. (2) below:
2
1 1
22 )(),( ik
c
i
n
kki vxVUJMin −=∑∑
= =
µ (2)
kiU µ= denotes the matrix of a fuzzy c-partition. The fuzzy c-partition constraints are
(1) µik ∈ [0, 1]∀ i, k, (2)Σi=1,c µik=1, ∀ k, and (3) 0<Σk=1,n µik <n, ∀ i. Each xk could belong to more than one cluster with each belongingness taking a fractional value between 0 and 1.
Fuzzy C-means clustering is a data clustering algorithm in which each data point belongs to a cluster to a degree specified by a membership grade. This algorithm is proposed as an improvement to K-means clustering technique [14]. FCM partitions a collection of n vector
niX i ,...,2,1, = into c fuzzy groups, and finds a cluster center in each group such that a cost function of dissimilarity measure is minimized. The steps of FCM algorithm are therefore first described in brief.
∑=
−
⎟⎟⎠
⎞⎜⎜⎝
⎛
=c
j
m
jk
ik
ik
dd
1
12
1µ (3)
where |||| kjjk xvd −= is the Euclidean distance between ith cluster center and kth data point, and
m is the fuzziness index.
The new c fuzzy cluster centers civi ,...,2,1, = using the following equation;
∑
∑
=
==n
j
mij
n
jj
mij
i
X
v
1
1
µ
µ
(4)
2.3. Mountain Clustering
The mountain clustering method is a relatively simple and effective approach to approximate estimation of cluster centers on the basis of a density measure called mountain function [15]. The following is a brief description of the mountain clustering algorithm.
H. Guldemir and A. Sengur
250
Step 1: Initialize the cluster centers forming a grid on the data space, where the intersection of the grid lines constitute the candidates for cluster centers, denoted as a set C. A finer gridding increases the number of potential cluster centers, but it also increases the computation required.
Step 2: Construct a mountain function that represents a density measure of a data set. The height of the mountain function at a point Cc∈ can compute as;
∑=
−−=
N
i
ixccm
12
2
)2
||||exp()(
σ (5)
where xi is the ith data point and σ is a design constant.
Step 3: Select the cluster centers by sequentially destructing the mountain function. First find the point in the candidate centers C that has the greatest value for the mountain function; this becomes the first cluster center c1. Obtaining next cluster center requires eliminating the effect of the just-identified center, which is typically surrounded by a number of grid points that also have high density scores. This is realized by revising the mountain function as follows;
)2
||||exp()()()(
2
21
1βcc
cmcmcmnew−
−−= (6)
after subtraction the second cluster center is again selected as the point in C that has the largest value for the new mountain function. This process of revising the mountain function and finding the next cluster centers continues until a sufficient number of cluster centers are attained.
2.4. Subtractive Clustering
The mountain clustering method is simple and effective. However its computation grows exponentially with the dimension of the problem. An alternative approach is subtractive clustering proposed by Chiu [16] in which data points are considered as the candidates for center of clusters. The algorithm continues as follow;
Step 1: Consider a collection of n data points },...,,,{ 321 nXXXX in an M-dimensional space. Since each data point is a candidate for cluster center, a density measure at data point Xi is defined as;
Classification of Analog Modulated Communication Signals using Clustering Techniques: A …
251
∑=
−−=
n
j a
jii
r
XXD
12
2
))2/(
||||exp( (7)
where ra is a positive constant. Hence, a data point will have a high density value if it has many neighboring data point. The radius ra defines a neighborhood; data points outside this radius contribute only slightly to the density measure.
Step 2: After the density measure of each data point has been calculated, the data point with the highest density measure is selected as the first cluster center. Let Xc1 be the point selected and Dc1 its density measure. Next, the density measure for each data point Xi is revised as follows;
))2/(
||||exp(
2
2
1b
jicii
r
XXDDD
−−−= (8)
Where rb is a positive constant.
Step 3: After the density calculation for each data point is revised, the next cluster center Xc2 is selected and all of the density calculations for data points are revised again. This process is repeated until a sufficient number of cluster centers are generated.
3. Feature Clustering and Classification
The first step in any classification system is to identify the features that will be used to classify the data. Feature extraction is a form of data reduction, and the choice of feature set can affect the performance of the classification system. Each piece of data, called a case, corresponds to an observation of a modulated signal and the features extracted from that observation are called parameters. Clustering algorithms work by examining a large number of cases and finding groups of cases with similar parameters. These groups are called clusters, and are considered to belong to the same category in the classification.
Two key features are used in this study for generating the data set. The first feature is the maximum value of the normalized centered instantaneous amplitude of the intercepted signal and it is calculated as follow [7];
)/2|)(max(|max Nafft=γ (9)
where ‘a’ is the normalized centered instantaneous amplitude of the intercepted signal and N is the number of the sample in the range. The second key feature is the signal spectrum symmetry around the carrier which is given by;
H. Guldemir and A. Sengur
252
LU
UL
PPPP
P+−
= (10)
where
∑=
=cnf
icL iXP
1
2|)(| (11)
∑=
++=cnf
icncU fiXP
1
2|)1(| (12)
where, Xc(i) is the Fourier transform of the intercepted signal Xc(i), (fc+1) is the sample number corresponding to the carrier frequency, fc and fcn is defined as;
1−=s
sccn f
Nff (13)
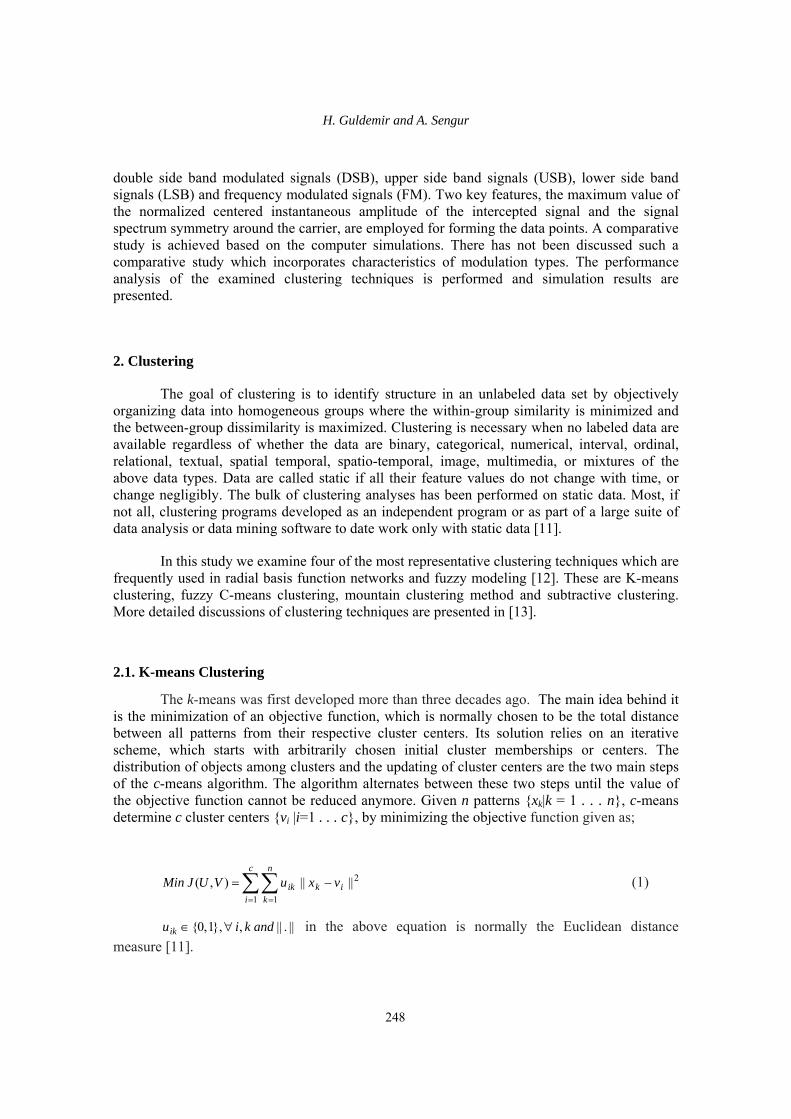
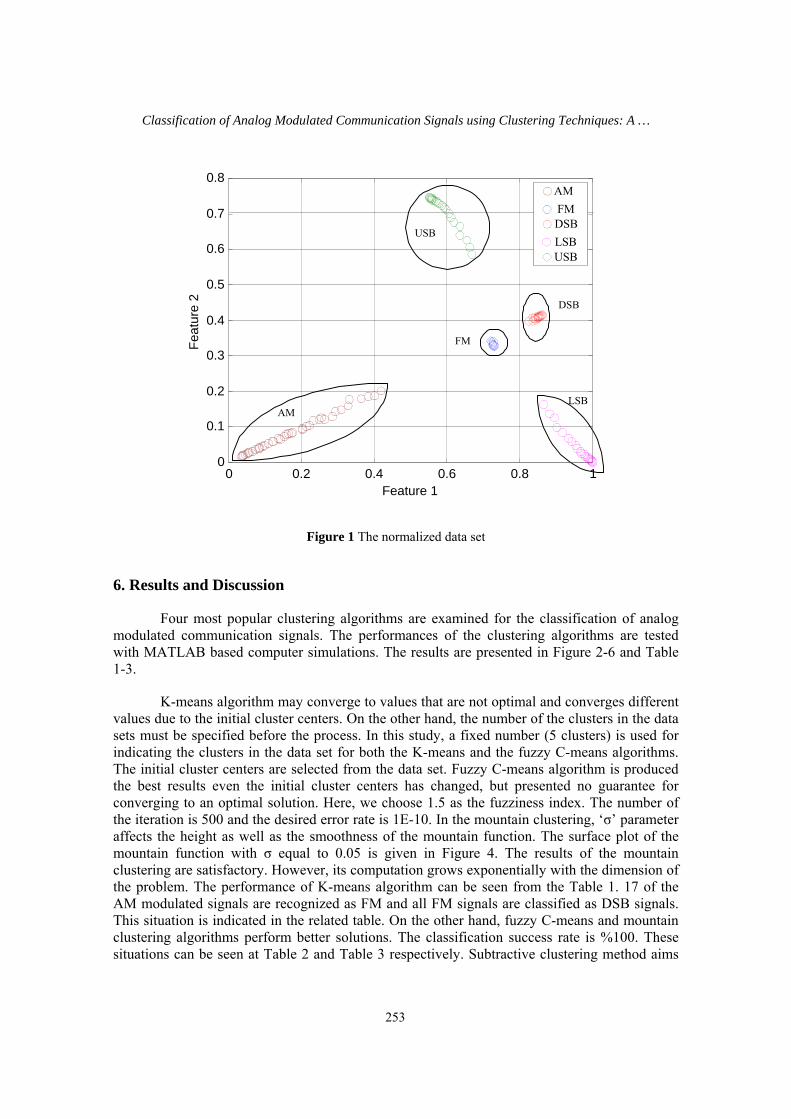
here it is assumed that the carrier frequency is known. The normalized data set is shown in fig. 1.
5. Implementation
A first order autoregressive speech signal is used as a source signal. The results comparing the examined clustering algorithms are provided for data set which is generated from the five analog modulated signals AM, FM, DSB, USB and LSB. This is a non-overlapping two dimensional data set where the number of cluster is five. The data set is generated as follows: The source signal is modulated using the analog modulation schemas. An additive white Gaussian noise is added to the modulated signal and the features are extracted from these signals. The normalized data set is shown in fig. 1.
Classification of Analog Modulated Communication Signals using Clustering Techniques: A …
253
0 0.2 0.4 0.6 0.8 10
0.1
0.2
0.3
0.4
0.5
0.6
0.7
0.8
Feature 1
Feat
ure
2AMFMDSBLSBUSB
AM
USB
LSB
FM
DSB
Figure 1 The normalized data set
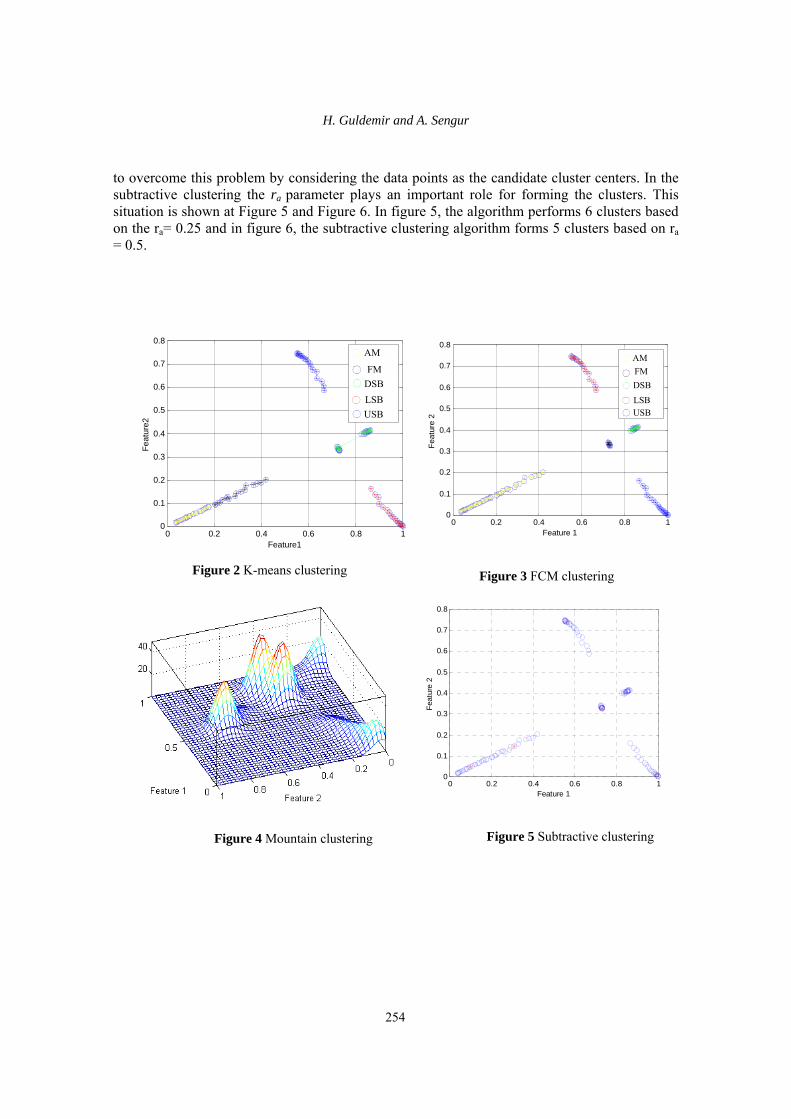
6. Results and Discussion
Four most popular clustering algorithms are examined for the classification of analog modulated communication signals. The performances of the clustering algorithms are tested with MATLAB based computer simulations. The results are presented in Figure 2-6 and Table 1-3.
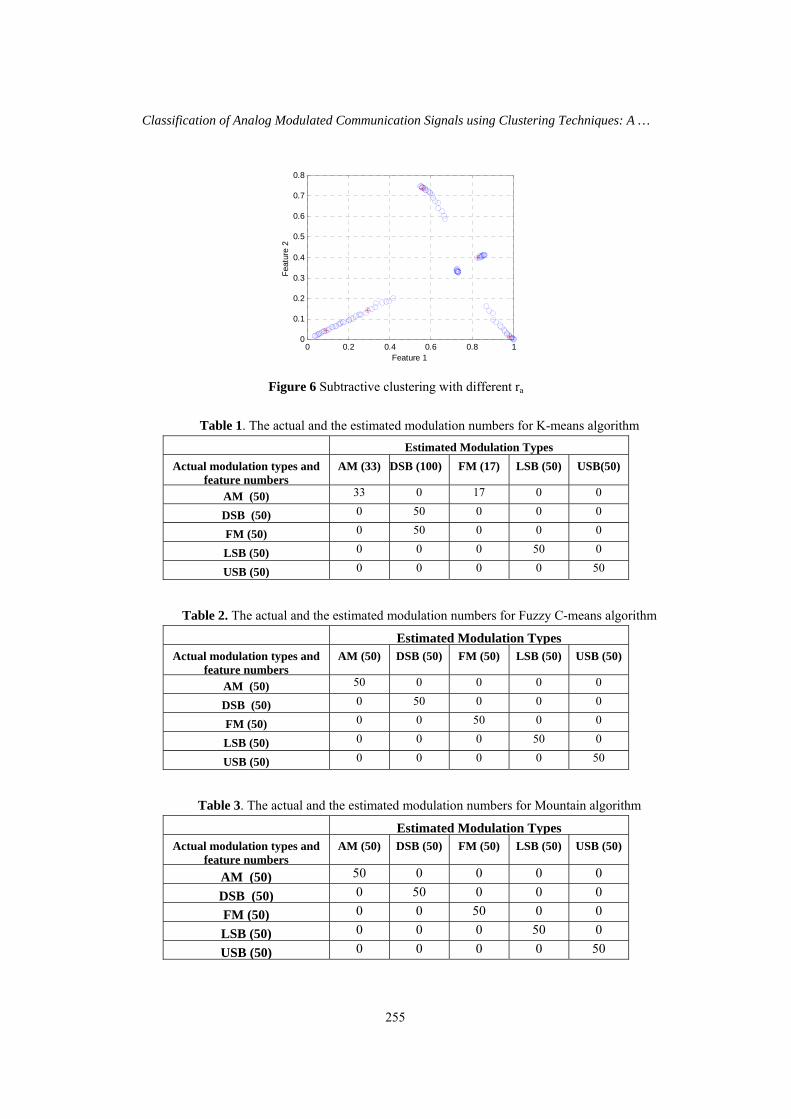
K-means algorithm may converge to values that are not optimal and converges different values due to the initial cluster centers. On the other hand, the number of the clusters in the data sets must be specified before the process. In this study, a fixed number (5 clusters) is used for indicating the clusters in the data set for both the K-means and the fuzzy C-means algorithms. The initial cluster centers are selected from the data set. Fuzzy C-means algorithm is produced the best results even the initial cluster centers has changed, but presented no guarantee for converging to an optimal solution. Here, we choose 1.5 as the fuzziness index. The number of the iteration is 500 and the desired error rate is 1E-10. In the mountain clustering, ‘σ’ parameter affects the height as well as the smoothness of the mountain function. The surface plot of the mountain function with σ equal to 0.05 is given in Figure 4. The results of the mountain clustering are satisfactory. However, its computation grows exponentially with the dimension of the problem. The performance of K-means algorithm can be seen from the Table 1. 17 of the AM modulated signals are recognized as FM and all FM signals are classified as DSB signals. This situation is indicated in the related table. On the other hand, fuzzy C-means and mountain clustering algorithms perform better solutions. The classification success rate is %100. These situations can be seen at Table 2 and Table 3 respectively. Subtractive clustering method aims
H. Guldemir and A. Sengur
254
to overcome this problem by considering the data points as the candidate cluster centers. In the subtractive clustering the ra parameter plays an important role for forming the clusters. This situation is shown at Figure 5 and Figure 6. In figure 5, the algorithm performs 6 clusters based on the ra= 0.25 and in figure 6, the subtractive clustering algorithm forms 5 clusters based on ra = 0.5.
0 0.2 0.4 0.6 0.8 1
0
0.1
0.2
0.3
0.4
0.5
0.6
0.7
0.8
Feature1
Feat
ure2
AM
FMDSBLSBUSB
Figure 2 K-means clustering
0 0.2 0.4 0.6 0.8 10
0.1
0.2
0.3
0.4
0.5
0.6
0.7
0.8
Feature 1
Feat
ure
2
AMFMDSBLSBUSB
Figure 3 FCM clustering
Figure 4 Mountain clustering
0 0.2 0.4 0.6 0.8 10
0.1
0.2
0.3
0.4
0.5
0.6
0.7
0.8
Feature 1
Feat
ure
2
Figure 5 Subtractive clustering
Classification of Analog Modulated Communication Signals using Clustering Techniques: A …
255
0 0.2 0.4 0.6 0.8 10
0.1
0.2
0.3
0.4
0.5
0.6
0.7
0.8
Feature 1
Feat
ure
2
Figure 6 Subtractive clustering with different ra
Table 1. The actual and the estimated modulation numbers for K-means algorithm Estimated Modulation Types
Actual modulation types and feature numbers
AM (33) DSB (100) FM (17) LSB (50) USB(50)
AM (50) 33 0 17 0 0
DSB (50) 0 50 0 0 0
FM (50) 0 50 0 0 0
LSB (50) 0 0 0 50 0
USB (50) 0 0 0 0 50
Table 2. The actual and the estimated modulation numbers for Fuzzy C-means algorithm
Estimated Modulation Types Actual modulation types and
feature numbers AM (50) DSB (50) FM (50) LSB (50) USB (50)
AM (50) 50 0 0 0 0
DSB (50) 0 50 0 0 0
FM (50) 0 0 50 0 0
LSB (50) 0 0 0 50 0
USB (50) 0 0 0 0 50
Table 3. The actual and the estimated modulation numbers for Mountain algorithm
Estimated Modulation Types Actual modulation types and
feature numbers AM (50) DSB (50) FM (50) LSB (50) USB (50)
AM (50) 50 0 0 0 0
DSB (50) 0 50 0 0 0
FM (50) 0 0 50 0 0
LSB (50) 0 0 0 50 0
USB (50) 0 0 0 0 50
H. Guldemir and A. Sengur
256
5. Conclusion
In this study, modulation classification using clustering techniques is presented. A comparative study is given for four different clustering algorithms. The introduction is followed by a brief description of the most representative clustering algorithms used in this study. The presented classification is not limited to any specific class of modulations. A first order autoregressive voice signal is modulated using the analog modulation schemes. An additive white Gaussian noise is added to the modulated signal in order to test the performance of the classification in the presence of noise. The simulation results are given.
Nowadays, in modern communication systems, digital modulation techniques rather than analog modulated schemas are used. So the new trend is the digital modulation recognizers. The aforementioned clustering algorithms are also successfully applied to the digital modulation schemas.
References 1. F. Jondral, Automatic classification of high frequency signals, Signal Processing, 9, 177-190, 1985. 2. J. Aisbett, Automatic modulation recognition using time-domain parameters, Signal Processing, 13,
323-329, 1987. 3. L. Dominiguez, J. Borallo, J. Garcia, A general approach to automatic classification of
radiocommunication signals, Signal Processing, 22, 239-250, 1991. 4. A. Polydoros, K. Kim, On the detection and classification of quadrature digital modulations in broad-
band noise, IEEE Transactions on Communications, 38, 1199-1211, 1990. 5. S.S. Soliman, S. Hsue, Signal classification using statistical moments. IEEE Transactions on
Communications, 40, 908-915, 1992. 6. N. Ghani, R. Lamontagne, Neural networks applied to the classification of spectral features for
automatic modulation recognition, Military Communication Conference (MILCOM’93), 111-115, 1993.
7. E.E. Azzouz, A.K. Nandi, Automatic Modulation Recognition of Communication Signals, Kluwer Academic Publishers, 1996.
8. A.K. Jain, R.C. Dubes, Algorithms for Clustering Data, Prentice-Hall, Englewood Cliffs, NJ, 1988. 9. U. Maulik, S. Bandyopadhyay, Genetic Algorithm based clustering technique. Pattern Recognition
33, 1455-1465, 2000. 10. R. Kothari, D. Pitts, On finding the number of clusters, Pattern Recognition Letters, 20, 405-416,
1999. 11. T.W.Liao. Clustering of time series data—a survey, Pattern Recognition, In Press. 12. J. S.R. Jang, C.T. Sun, E. Mizutani, Neuro-fuzzy and soft computing, Prentice Hall, 1997. 13. R.O. Duda, P.E. Hart, Pattern Recognition and scene analysis, John Willey and Sons, 1973. 14. J.C. Bezdek, Fuzzy mathematics in pattern classification, PhD thesis, Applied Math. Center, Cornell
University Ithaca, 1973. 15. R.R. Yager, D.P. Filev, Generation of fuzzy rules by mountain clustering, IEEE Transactions on
System, Man and Cybernetics, 2, 209-219, 1994. 16. S. L. Chiu, Fuzzy model identification based on cluster estimation, Journal of Intelligent and Fuzzy
Systems, 2, 1994.