
Claim of solar influence is on thin ice: Are 11-year cycle solar minima associated with severe...
8
Claim of solar influence is on thin ice: are 11-year cycle solar minima associated with severe winters in Europe? This content has been downloaded from IOPscience. Please scroll down to see the full text. Download details: IP Address: 60.190.93.70 This content was downloaded on 28/09/2013 at 09:11 Please note that terms and conditions apply. 2013 Environ. Res. Lett. 8 024014 (http://iopscience.iop.org/1748-9326/8/2/024014) View the table of contents for this issue, or go to the journal homepage for more Home Search Collections Journals About Contact us My IOPscience
-
Upload
independent -
Category
Documents
-
view
1 -
download
0
Transcript of Claim of solar influence is on thin ice: Are 11-year cycle solar minima associated with severe...

Claim of solar influence is on thin ice: are 11-year cycle solar minima associated with severe
winters in Europe?
This content has been downloaded from IOPscience. Please scroll down to see the full text.
Download details:
IP Address: 60.190.93.70
This content was downloaded on 28/09/2013 at 09:11
Please note that terms and conditions apply.
2013 Environ. Res. Lett. 8 024014
(http://iopscience.iop.org/1748-9326/8/2/024014)
View the table of contents for this issue, or go to the journal homepage for more
Home Search Collections Journals About Contact us My IOPscience

IOP PUBLISHING ENVIRONMENTAL RESEARCH LETTERS
Environ. Res. Lett. 8 (2013) 024014 (7pp) doi:10.1088/1748-9326/8/2/024014
Claim of solar influence is on thin ice: are11-year cycle solar minima associatedwith severe winters in Europe?
G J van Oldenborgh1, A T J de Laat1, J Luterbacher2, W J Ingram3,4 andT J Osborn5
1 KNMI, De Bilt, The Netherlands2 Department of Geography, Justus Liebig University Giessen, Germany3 Met Office Hadley Centre, Exeter, UK4 Department of Physics, University of Oxford, UK5 Climatic Research Unit, School of Environmental Sciences, University of East Anglia, UK
E-mail: [email protected]
Received 8 December 2012Accepted for publication 5 April 2013Published 25 April 2013Online at stacks.iop.org/ERL/8/024014
AbstractA recent paper in Geophysical Research Letters, ‘Solar influence on winter severity in centralEurope’, by Sirocko et al (2012 Geophys. Res. Lett. 39 L16704) claims that ‘weak solar activity isempirically related to extremely cold winter conditions in Europe’ based on analyses of documentaryevidence of freezing of the River Rhine in Germany and of the Reanalysis of the Twentieth Century(20C). However, our attempt to reproduce these findings failed. The documentary data appear to beselected subjectively and agree neither with instrumental observations nor with two otherreconstructions based on documentary data. None of these datasets show significant connectionbetween solar activity and winter severity in Europe beyond a common trend. The analysis of Sirockoet al of the 20C circulation and temperature is inconsistent with their time series analysis. Aphysically-motivated consistent methodology again fails to support the reported conclusions. Weconclude that multiple lines of evidence contradict the findings of Sirocko et al.
Keywords: solar variability, sunspot numbers, 11-year cycle solar minimum, severe European winter,North Atlantic Oscillation
1. Introduction
In the 19th and first half of the 20th century the beliefwas widespread that the weather was influenced stronglyby the 11-year sunspot cycle (e.g., Berlage 1957). However,the discovery of deterministic chaos (Lorenz 1963) causedby baroclinic instability of the midlatitude westerly flow(Charney and Stern 1962) restricted the potential role ofexternal forcings, as most of the variability of European winterweather results from this chaos. Thirty years ago, review
Content from this work may be used under the terms ofthe Creative Commons Attribution 3.0 licence. Any further
distribution of this work must maintain attribution to the author(s) and thetitle of the work, journal citation and DOI.
articles (Pittock 1978, 1983) concluded that no evidence couldbe found for strong influences of the sunspot cycles on theweather beyond the daily scale in the more than hundredpapers available at the time. They also found the literatureto be full of common errors, such as ‘poor data quality, dataselection, data smoothing and autocorrelations, and post hocelaboration of hypotheses to explain discrepancies’. Furtherresearch in this field has not always acknowledged existingknowledge and lessons learned from the past (Pittock 2009,Lockwood 2012).
Recently there has been renewed interest in the influenceof the solar cycle on European winter weather. Lockwoodet al (2010) claimed a weak but statistically significant effectwhen using the open solar flux rather than sunspot numbers
11748-9326/13/024014+07$33.00 c© 2013 IOP Publishing Ltd Printed in the UK
Environ. Res. Lett. 8 (2013) 024014 G J van Oldenborgh et al
to search for effects of solar activity in the Central EnglandTemperature (CET) series (Manley 1974, Parker et al 1992)over 1675–2011. Note that there are differences betweenthe open solar flux and the sunspot cycle. Although bothshow an 11-year cycle, the sunspot number does not havea secular trend in its minima (Lockwood and Owens 2011).A problem discussed in the Lockwood et al (2010) paperis the detrending procedure, as the trend is not linear andthe observed temperature rise in the CET is faster than theNorthern Hemisphere average (van Oldenborgh et al 2009).Woollings et al (2010) looked for possible mechanisms forthis connection in upper air reanalysis data and found astronger connection in the last four cycles. However, theconnection between the North Atlantic Oscillation (NAO)and solar activity is known not to exist in longer recordsof equivalent surface observations, such as instrumental oranalysis-based sea-level pressure series (see section 4, alreadynoted in Rodwell (2003)) and independent observations suchas the CET and Dutch temperature reconstructions (beyondcommon upward trends). This leaves the two possibilities thatthe connection in recent decades was a chance fluctuation orthe result of a change in the physical behaviour of some aspectof the climate system that switched on a coupling or allowedit to become apparent. The difference cannot be determinedby statistical analyses alone: proper physical understandingis needed. Ineson et al (2011) showed model evidence fora solar-induced signal in the lower stratosphere and uppertroposphere caused by UV radiation variations during thelatest solar cycle changing the ozone concentration and hencetemperature in the upper stratosphere (see also Keckhut et al(2005), Haigh et al (2005)). The solar signal is visible in longupper air reconstructions (Bronnimann et al 2007). However,on long timescales this signal is much weaker at ground leveland not a major factor in determining severe winters. In factwe find it undetectable against the weather noise in longdetrended time series (e.g., figure 4(b)).
In August 2012, a paper appeared in GeophysicalResearch Letters entitled ‘Solar influence on winter severityin central Europe’ (Sirocko et al 2012, hereafter SBP) thatclaims that ‘weak solar activity is empirically related toextremely cold winter conditions in Europe’. SBP’s ‘severewinters’ refers to documentary evidence of the freezingof parts of the River Rhine in Germany. Over the lastapproximately 230 years, 14 such events were identified, 10of which are close to a minimum of sunspot numbers—acoincidence that is statistically significant at the 99% level.
The finding of such a strong connection between sunspotminima and severe winters in Europe is at variance with theliterature discussed above, so we re-assess the study of SBP,considering their data in section 2, their methods in section 3and the proposed mechanisms in section 4.
2. Data
First, the selection of ‘severe winters’ in SBP is taken to bethe ‘freezing of a large river in Germany, which representsa robust and easily detectable climate signal’. However, thesupplementary information in SBP shows that the data recordof Rhine freezing is constructed merely on searching the
internet for miscellaneous documents containing informationabout Rhine river freezing, including an oil painting. Inaddition, no evidence is given that the record of local Rhinefreezing assembled by SBP is a valid proxy for severe winters.
This is not the state of the art in the field. Pfister (1984)reported a calibrated reconstruction of winter severity basedon quantitative measures of the amount of ice cover on Swisslakes. Van Engelen et al (2000) similarly estimated Dutchwinter temperatures using, among other sources, the numberof days that one canal in the Netherlands was frozen. Abenchmark paper on historical trends in Northern Hemispherelake and river ice (Magnuson et al 2000) uses the length of theriver freezing period as an integrated measure of temperatureand thus winter severity. A global database of lake and riverice phenology exists (Benson and Magnuson 2000, updated2012). However, that database does not cover the river Rhine,or any other central European river and mainly covers thetwentieth century.
These studies show that river and lake ice can be used asa proxy for winter severity, but also that the observations haveto be homogeneous and the interpretation as winter severitydemonstrated by comparison with a long temperature record(e.g., Frankfurt am Main for the Rhine) and/or by physicalmodelling of the ice growth. Such quantification is lacking inSBP, as are references to the whole literature on river and lakefreezing (e.g., Pfister 1984, Fouquet 1999, Van Engelen et al2000, Magnuson et al 2000, Benson et al 2012). In addition,the use of different locations and kinds of records to define‘freezing of a long river’ further complicates the databaseconstruction as it introduces unquantifiable inconsistencies.General practice is to construct records of river freezing basedon single locations along the river and only combine datawhen data series overlap.
To exemplify the problems with basing the definitionof cold winters on river ice information, a simple Googlesearch uncovered a report from the History Society of Altrip,a German town on the Rhine, approximately 100 km south ofMainz, near the centre of the stretch considered by SBP. Thisreport mentions freezing of the River Rhine in the years listedbelow. For comparison, SBP’s ‘winters when the Rhine froze’are denoted in bold. SBP’s list also includes 1823, which isabsent from this series.
‘Almost every year between 1803–1815, 1820,1826, 1829, 1830, 1838, 1839, 1841, 1845, 1854,1856, 1861, 1864, 1870, 1879, 1880, 1891, 1893,1894, 1895’. (Source: www.hgv-altrip.de/index.php/downloads/category/5-leben-am-strom.html?download=80,our translation.)
Only 9 out of these 32 freezing winters (28%) satisfySBP’s definition, 4 years surrounding a sunspot minimum,which covers 4 out of each 11-year sunspot cycle (36%). Thisseries therefore shows no evidence that weak solar activityis associated with Rhine freezing events (p ≈ 0.5 using abinomial distribution), but rather an insignificant tendency theother way.
Googling ‘Rhein erfroren’ (actually incorrect German for‘Rhine frozen’) retrieved indications of many other freezing
2

Environ. Res. Lett. 8 (2013) 024014 G J van Oldenborgh et al
Figure 1. Postcard from 1929. Translation of the back: ‘Souvenirof the crossing of the frozen Rhine in the year 1929. The Rhine iceformed near Mainz on 15 February 1929. Since the year 1895, for34 years, the Rhine had not been frozen any more. I crossed thefrozen Rhine on . . . 1929’.
years; some texts indicate that at some places the Rhine froze50% of years, whereas SBP found only 7% (though theyrestricted their selection to only those when it was frozenat multiple places or to a sufficient thickness that peoplecould walk on it). Conversely, instrumental records of dailytemperature at the nearby town Frankfurt am Main (KleinTank et al 2002) show that in some of SBP’s ‘severe winter’months the daily mean temperature dipped below zero on only
a handful of days (e.g., February 1880, December 1941) or thewinter mean temperature was mild (1914).
Finally, the photograph of people skating on the Rhine inSBP was taken in 1929, not in 1963 as their caption claims.The reverse side of this postcard (figure 1)—available from awebsite that offered this postcard for sale—says ‘Andenken anden Uebergang uber den zugefrorenen Rhein im Jahre 1929’(souvenir of the crossing of the frozen Rhine in the year 1929).It also mentions that this is the first time that the Rhine wasfrozen since 1895, which is not in SBP’s list and contradictstheir 1914 date.
Of course we do not imagine that the information wefound is more reliable, but it highlights that a simple Googlesearch can lead to very different results and conflictingevidence, and so is not adequate for the construction of ahistorical Rhine river freezing record.
In contrast, we considered the well-calibrated Pfister(1984) reconstruction of Swiss winter temperatures and theDutch winter temperatures by Van Engelen et al (2000),which are both based on freezing of waterways amongother sources. These areas bracket SBP’s Rhine area andthe reconstructions are well-correlated (r2
= 0.5). Comparingthese reconstructions with SBP, figure 2(a) shows that over1750–1870 five severe winters agree, but five others were notincluded by SBP (most at high sunspot numbers). Over theinstrumental period 1871–1989 (figure 2(b)) some much lesssevere winters are included by SBP, such as 1914 and 1954(both at a sunspot minimum).
With more severe winters at high sunspot numbers andfewer ones at low numbers than in SBP’s list, neither ofthese two well-calibrated reconstructions shows a significantcorrelation with sunspot numbers (international sunspotnumber from Solar Influences Data Analysis Center, SIDC1749–2012) after detrending: r2 < 0.01, p > 0.2 using atwo-sided t-test.
Figure 2. Winter (December–February) temperatures in the Netherlands (Van Engelen et al 2000) and Switzerland (Pfister 1984) comparedwith each other and the SBP series over the pre-instrumental period (a) and also the instrumental observations (b) at Frankfurt am Main(Klein Tank et al 2002).
3
Environ. Res. Lett. 8 (2013) 024014 G J van Oldenborgh et al
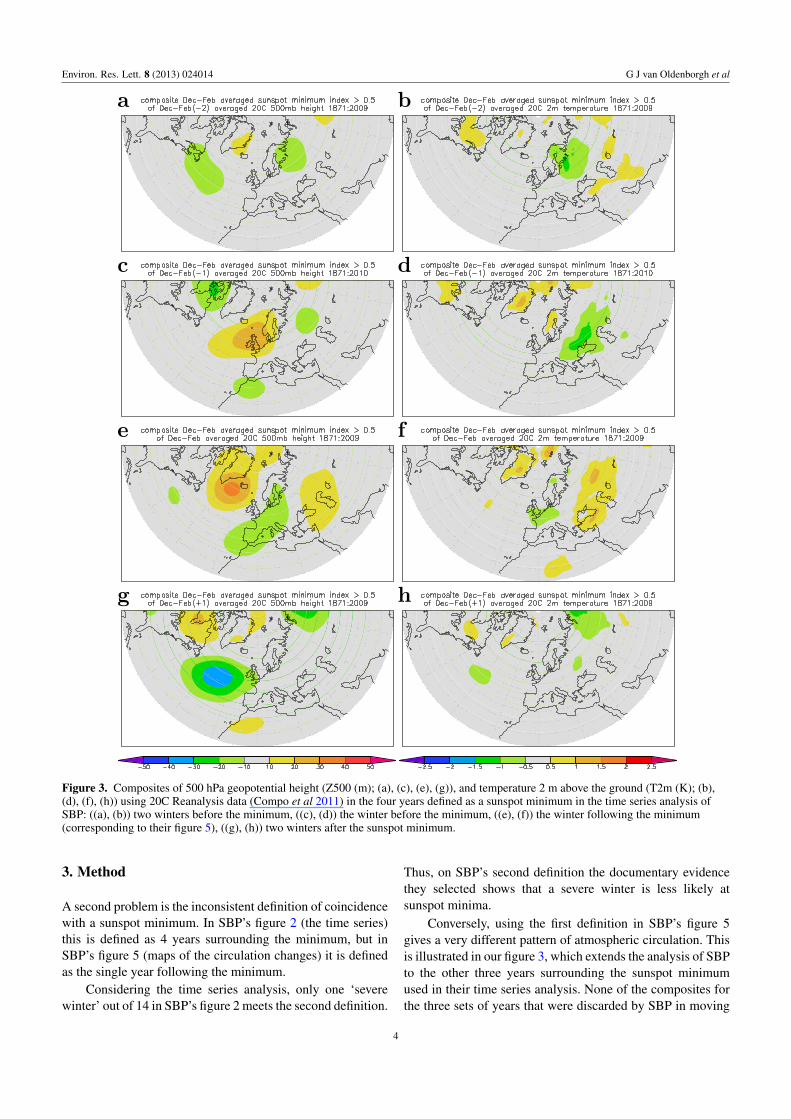
Figure 3. Composites of 500 hPa geopotential height (Z500 (m); (a), (c), (e), (g)), and temperature 2 m above the ground (T2m (K); (b),(d), (f), (h)) using 20C Reanalysis data (Compo et al 2011) in the four years defined as a sunspot minimum in the time series analysis ofSBP: ((a), (b)) two winters before the minimum, ((c), (d)) the winter before the minimum, ((e), (f)) the winter following the minimum(corresponding to their figure 5), ((g), (h)) two winters after the sunspot minimum.
3. Method
A second problem is the inconsistent definition of coincidencewith a sunspot minimum. In SBP’s figure 2 (the time series)this is defined as 4 years surrounding the minimum, but inSBP’s figure 5 (maps of the circulation changes) it is definedas the single year following the minimum.
Considering the time series analysis, only one ‘severewinter’ out of 14 in SBP’s figure 2 meets the second definition.
Thus, on SBP’s second definition the documentary evidencethey selected shows that a severe winter is less likely atsunspot minima.
Conversely, using the first definition in SBP’s figure 5gives a very different pattern of atmospheric circulation. Thisis illustrated in our figure 3, which extends the analysis of SBPto the other three years surrounding the sunspot minimumused in their time series analysis. None of the composites forthe three sets of years that were discarded by SBP in moving
4
Environ. Res. Lett. 8 (2013) 024014 G J van Oldenborgh et al
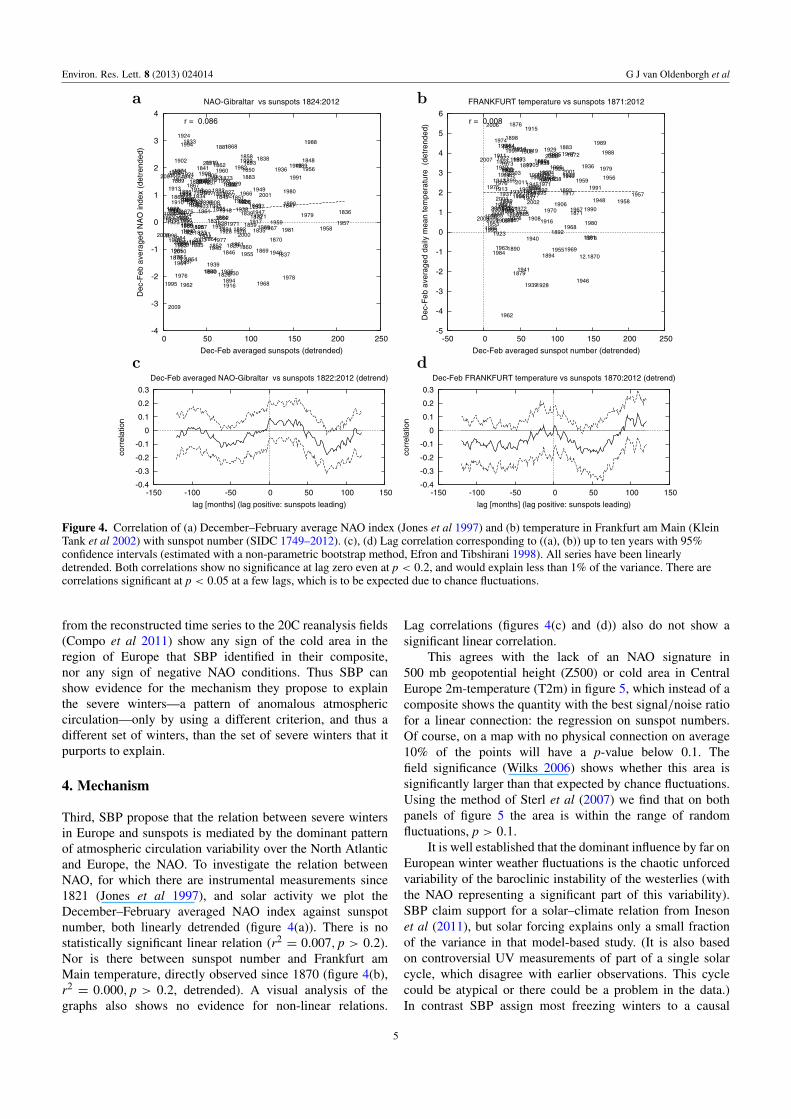
Figure 4. Correlation of (a) December–February average NAO index (Jones et al 1997) and (b) temperature in Frankfurt am Main (KleinTank et al 2002) with sunspot number (SIDC 1749–2012). (c), (d) Lag correlation corresponding to ((a), (b)) up to ten years with 95%confidence intervals (estimated with a non-parametric bootstrap method, Efron and Tibshirani 1998). All series have been linearlydetrended. Both correlations show no significance at lag zero even at p < 0.2, and would explain less than 1% of the variance. There arecorrelations significant at p < 0.05 at a few lags, which is to be expected due to chance fluctuations.
from the reconstructed time series to the 20C reanalysis fields(Compo et al 2011) show any sign of the cold area in theregion of Europe that SBP identified in their composite,nor any sign of negative NAO conditions. Thus SBP canshow evidence for the mechanism they propose to explainthe severe winters—a pattern of anomalous atmosphericcirculation—only by using a different criterion, and thus adifferent set of winters, than the set of severe winters that itpurports to explain.
4. Mechanism
Third, SBP propose that the relation between severe wintersin Europe and sunspots is mediated by the dominant patternof atmospheric circulation variability over the North Atlanticand Europe, the NAO. To investigate the relation betweenNAO, for which there are instrumental measurements since1821 (Jones et al 1997), and solar activity we plot theDecember–February averaged NAO index against sunspotnumber, both linearly detrended (figure 4(a)). There is nostatistically significant linear relation (r2
= 0.007, p > 0.2).Nor is there between sunspot number and Frankfurt amMain temperature, directly observed since 1870 (figure 4(b),r2= 0.000, p > 0.2, detrended). A visual analysis of the
graphs also shows no evidence for non-linear relations.
Lag correlations (figures 4(c) and (d)) also do not show asignificant linear correlation.
This agrees with the lack of an NAO signature in500 mb geopotential height (Z500) or cold area in CentralEurope 2m-temperature (T2m) in figure 5, which instead of acomposite shows the quantity with the best signal/noise ratiofor a linear connection: the regression on sunspot numbers.Of course, on a map with no physical connection on average10% of the points will have a p-value below 0.1. Thefield significance (Wilks 2006) shows whether this area issignificantly larger than that expected by chance fluctuations.Using the method of Sterl et al (2007) we find that on bothpanels of figure 5 the area is within the range of randomfluctuations, p > 0.1.
It is well established that the dominant influence by far onEuropean winter weather fluctuations is the chaotic unforcedvariability of the baroclinic instability of the westerlies (withthe NAO representing a significant part of this variability).SBP claim support for a solar–climate relation from Inesonet al (2011), but solar forcing explains only a small fractionof the variance in that model-based study. (It is also basedon controversial UV measurements of part of a single solarcycle, which disagree with earlier observations. This cyclecould be atypical or there could be a problem in the data.)In contrast SBP assign most freezing winters to a causal
5

Environ. Res. Lett. 8 (2013) 024014 G J van Oldenborgh et al
a b
Figure 5. Regression of Z500 (a) and T2m (b) (Compo et al 2011) on the international sunspot number (SIDC) over the period 1871–2009.Areas not significant at p < 0.1 are shaded light. Neither map shows more significant areas than expected, the field significance p > 0.1(estimated using the method of Sterl et al 2007).
agent, often the sunspot cycle, implying a dominant role forexternal forcing in determining winter weather in Europe.Despite many attempts, no such strong signal of the sunspotcycle has been found in the Earth’s surface climate (see e.g.,Pittock (2009), and references therein) and even the relativelywell-established effect of large tropical volcanic eruptionsis much weaker than the unforced internally-generatedvariability (Weber 2005, Zanchettin et al 2013).
5. Conclusions
We conclude that a critical look at the record of severe wintersdeveloped by Sirocko et al (2012) shows that the selectionis inhomogeneous and thus the data are unreliable. Thecombination of inhomogeneous data, a subjective definitionof a ‘severe winter’, inconsistent definitions of weak solaractivity and disagreement with analysis of instrumental data,implies that the conclusion that Rhine freezing events areconnected to low sunspot numbers is not supported bythe data as a whole. We show that there is no significantconnection beyond common trends between sunspot numbersand instrumental series of the North Atlantic Oscillation andFrankfurt am Main temperature, nor with reconstructions ofwinter weather in the Netherlands and Switzerland. Minimumstandards in this field were laid out more than 30 years ago(Pittock 1978). Progress in robustly identifying a controversialbut probably minor influence on surface climate is morelikely to be attained using the daily instrumental observationsthat exist for both temperature and air pressure over thepast 150 years and well-calibrated reconstructions of monthlyclimate for the longer period (e.g., Luterbacher et al 2004),rather than the subjectively-defined and incomplete recordsused by SBP.
Acknowledgments
We thank Roger Pielke Sr and Stefan Rahmstorf fortheir support in this project. WJI was supported by theJoint DECC/Defra Met Office Hadley Centre ClimateProgramme (GA01101) and also by NERC via the
HYDRA project (NE/I00680X/1); TJO was supported byNERC NE/G018863/1. JL acknowledges support fromthe DFG Project PRIME 2 within the Priority ProgramINTERDYNAMIK and from the EU FP7 project ACQWA(NO212250). All data and analyses are available at the KNMIClimate Explorer, http://climexp.knmi.nl.
c© Crown copyright 2013. Reproduced with the permissionof Her Majesty’s Stationery Office and Met Office HadleyCentre. Published under exclusive licence by IOP PublishingLtd.
References
Benson B J and Magnuson J J 2000 Global Lake and River IcePhenology Database (Boulder, CO: National Snow and IceData Center) (http://nsidc.org/data/docs/noaa/g01377 lakeriver ice/)
Benson B J, Magnuson J J, Jensen O P, Card V M, Hodgkins G,Korhonen J, Livingstone D M, Stewart K M,Weyhenmeyer G A and Granin N G 2012 Extreme events,trends, and variability in Northern Hemisphere lake-icephenology (1855–2005) Clim. Change 112 299–323
Berlage H P 1957 Fluctuations of the General AtmosphericCirculation of More than One Year, their Nature andPrognostic Value (Mededelingen en verhandelingen vol 69)(De Bilt: KNMI)
Bronnimann S, Ewen T, Griesser T and Jenne R 2007 Multidecadalsignal of solar variability in the upper troposphere during the20th century Space Sci. Rev. 125 305–15
Charney J G and Stern M E 1962 On the stability of internalbaroclinic jets in a rotating atmosphere J. Atmos. Sci.19 159–72
Compo G P et al 2011 The twentieth century reanalysis projectQ. J. R. Meteorol. Soc. 137 1–28
Efron B and Tibshirani R J 1998 An Introduction to the Bootstrap(New York: Chapman and Hall)
Fouquet G 1999 Bauen fur die Stadt. Finanzen, Organisation undArbeit in kommunalen Baubetrieben des Spatmittelalters. Einevergleichende Studie vornehmlich zwischen den Stadten Baselund Marburg Stadteforschung vol 48, ed P Johanek(Koln-Weimar-Wien: Bohlau Verlag) p 594
6

Environ. Res. Lett. 8 (2013) 024014 G J van Oldenborgh et al
Haigh J D, Blackburn M and Day R 2005 The response oftropospheric circulation to perturbations in lower-stratospherictemperature J. Clim. 18 3672–85
Ineson S, Scaife A A, Knight J R, Manners J C, Dunstone N J,Gray L J and Haigh J D 2011 Solar forcing of winter climatevariability in the Northern Hemisphere Nature Geosci. 4 753–7
Jones P D, Jonsson T and Wheeler D 1997 Extension to the NorthAtlantic Oscillation using early instrumental pressureobservations from Gibraltar and South-West Iceland Int. J.Climatol. 17 1433–50
Keckhut P, Cagnazzo C, Chanin M L, Claud C and Hauchecorne A2005 The 11-year solar-cycle effects on the temperature in theupper-stratosphere and mesosphere: part I—assessment ofobservations J. Atmos. Sol.-Terr. Phys. 67 940–7
Klein Tank A et al 2002 Daily dataset of 20th-century surface airtemperature and precipitation series for the European climateassessment Int. J. Climatol. 22 1441–53
Lockwood M 2012 Solar influence on global and regional climateSurv. Geophys. 27 503–34
Lockwood M, Harrison R G, Woollings T and Solanki S K 2010Are cold winters in Europe associated with low solar activity?Environ. Res. Lett. 5 024001
Lockwood M and Owens M J 2011 Centennial changes in theheliospheric magnetic field and open solar flux: the consensusview from geomagnetic data and cosmogenic isotopes and itsimplications J. Geophys. Res. 116 A04109
Lorenz E N 1963 Deterministic nonperiodic flow J. Atmos. Sci.20 130–41
Luterbacher J, Dietrich D, Xoplaki E, Grosjean M andWanner H 2004 European seasonal and annual temperaturevariability, trends, and extremes since 1500 Science303 1499–503
Magnuson J J et al 2000 Historical trends in lake and river ice coverin the Northern Hemisphere Science 289 1743–6
Manley G 1974 Central England temperatures: monthly means 1659to 1973 Q. J. R. Meteorol. Soc. 100 389–405
Parker D E, Legg T P and Folland C K 1992 A new daily centralEngland temperature series, 1772–1991 Int. J. Climatol.12 317–42
Pfister C 1984 Klimageschichte der Schweiz 1525–1860, Das Klimader Schweiz von 1525–1860 und seine Bedeutung in derGeschichte der Bevolkerung und Landwirtschaft (AcademicaHelvetica 6, Bd. 1) (Bern: P Haupt)
Pittock A B 1978 A critical look at long-term sun–weatherrelationships Rev. Geophys. 16 400–20
Pittock A B 1983 Solar variability, weather and climate: an updateQ. J. R. Meteorol. Soc. 109 23–55
Pittock A B 2009 Can solar variations explain variations in theEarth’s climate? Clim. Change 96 483–7
Rodwell M J 2003 On the predictability of North Atlantic climateThe North Atlantic Oscillation ed J W Hurrell, Y Kushnir,G Ottersen and M Visbeck (Washington, DC: AmericanGeophysical Union) pp 173–92
SIDC 1749–2012 The International Sunspot Number (Brussels:Royal Observatory of Belgium) (www.sidc.be/sunspot-data/)
Sirocko F, Brunck H and Pfahl S 2012 Solar influence on winterseverity in central Europe Geophys. Res. Lett. 39 L16704
Sterl A, van Oldenborgh G J, Hazeleger W and Burgers G 2007 Onthe robustness of ENSO teleconnections Clim. Dyn. 29 469–85
Van Engelen A F V, Buisman J and IJnsen F 2000 A millennium ofweather, winds and water in the Low Countries History andClimate: Memories of the Future ed P D Jones et al(New York: Kluwer Academic) pp 101–24
van Oldenborgh G J, Drijfhout S S, van Ulden A P, Haarsma R,Sterl A, Severijns C, Hazeleger W and Dijkstra H A 2009Western Europe is warming much faster than expected Clim.Past 5 1–12
Weber S L 2005 A timescale analysis of the Northern Hemispheretemperature response to volcanic and solar forcing Clim. Past1 9–17
Wilks D S 2006 On ‘field significance’ and the false discovery rateJ. Appl. Meteorol. 45 1181–9
Woollings T, Lockwood M, Masato G, Bell C and Gray L 2010Enhanced signature of solar variability in Eurasian winterclimate Geophys. Res. Lett. 37 L20805
Zanchettin D, Timmreck C, Bothe O, Lorenz S J, Hegerl G,Graf H F, Luterbacher J and Jungclaus J H 2013 Delayedwinter warming: a robust decadal response to strong tropicalvolcanic eruptions? Geophys. Res. Lett. 40 204–9
7


![Knobbelzwanen in de stad Groningen in strenge winters [in Dutch] (Mute Swans Cygnus olor in the city of Groningen, The Netherlands, during severe winters)](https://static.fdokumen.com/doc/165x107/631707a8c5ccb9e1fb03f5dc/knobbelzwanen-in-de-stad-groningen-in-strenge-winters-in-dutch-mute-swans-cygnus.jpg)