Applying Solar Energy in the Combination of Solar Dryer with ...
29
Citation: Zare, F.; Najafi, G.; Ghiasi, P.; Fayyazi, E.; Yusaf, T.; Mazlan, M. Applying Solar Energy in the Combination of Solar Dryer with Olive Harvesting Machine to Reduce Energy Losses. Sustainability 2022, 14, 1091. https://doi.org/10.3390/ su14031091 Academic Editors: Tomonobu Senjyu and Alessandro Franco Received: 30 November 2021 Accepted: 4 January 2022 Published: 18 January 2022 Publisher’s Note: MDPI stays neutral with regard to jurisdictional claims in published maps and institutional affil- iations. Copyright: © 2022 by the authors. Licensee MDPI, Basel, Switzerland. This article is an open access article distributed under the terms and conditions of the Creative Commons Attribution (CC BY) license (https:// creativecommons.org/licenses/by/ 4.0/). sustainability Article Applying Solar Energy in the Combination of Solar Dryer with Olive Harvesting Machine to Reduce Energy Losses Fatemeh Zare 1 , Gholamhassan Najafi 1 , Pedram Ghiasi 1 , Ebrahim Fayyazi 1 , Talal Yusaf 2, * and Mohamed Mazlan 3, * 1 Department of Biosystems Engineering, Tarbiat Modares University (TMU), Tehran 14115-111, Iran; [email protected] (F.Z.); g.najafi@modares.ac.ir (G.N.); [email protected] (P.G.); [email protected] (E.F.) 2 School of Engineering and Technology, Central Queensland University, Brisbane 4009, Australia 3 Faculty of Bioengineering and Technology, Advanced Material Research Cluster, Universiti Malaysia Kelantan, Jeli 17600, Malaysia * Correspondence: [email protected] (T.Y.); [email protected] (M.M.) Abstract: In recent years, leveraging the amount of energy loss occurring in different fields of human activity has captured the attention of researchers. Harvesting and drying processes can be integrated in order to reduce energy losses. The present research work seeks to pinpoint the association between the harvesting and drying processes as well as to make optimal use of both processes so as to decrease the level of energy loss and apply the renewable energies to the food supply chain. The olive harvesting machine was designed and evaluated, and the olives harvested in the solar dryer were placed in the solar dryer as the input materials. To obtain the evaluation of the experimental tests’ purpose, Mari cultivar was used. Following this trend was the evaluation of the olive harvesting machine and its comparison with the manual harvesting method. Having separated the olives from the tree through use of the harvesting machine designed and made, a solar dryer was used to accommodate the olives in order to make the final examination concerning any damage to olives. Findings of the study indicated up to 92% separation of the olive fruits by the olive harvester. It was also found that there is a 29.47 harvest efficiency for the olive harvester. In addition, evaluation of the solar dryer emphasized that an increase in the temperature and velocity of the inlet air results in a rapid decrease in the olive moisture. Keywords: continuous processes; renewable energy in agriculture; olive fruit storage 1. Introduction In the field of energy, agriculture is believed to be among the high-consuming indus- tries. The determinants of energy consumption are the population involved in agriculture, the number of arable areas, and the level of mechanization. Furthermore, when there is a bulky chain of production concerning the final product, lower levels of energy consumption can be expected. Renewable energies are regarded as alternative sources of energy to fossil fuel [1], which include solar energy, wind energy, biomass energy, geothermal energy, etc. [2]. Solar energy is deemed to be a common energy source, and it can be found in various countries [3]. Solar collectors can collect solar energy and produce applicable heat. The outcome of collecting the heat through the solar collectors is the generation of power, desalination, and drying [4]. Drying is classified by its high level of energy consumption when the crop-producing processes category is addressed [5]. When referring to the drying process of horticultural crops, it is observable that direct sunlight and high temperatures can damage the active ingredients existing in the plant. Accordingly, the main horticulture crops, namely olive fruits, can be obtained in canned, dried fruit, and oil extraction forms [6]. There are three features, including the harvesting, drying, and the time interval, that render the olive plant for consumption [7]. In the case of fully mechanized harvesting, it is feasible Sustainability 2022, 14, 1091. https://doi.org/10.3390/su14031091 https://www.mdpi.com/journal/sustainability
-
Upload
khangminh22 -
Category
Documents
-
view
1 -
download
0
Transcript of Applying Solar Energy in the Combination of Solar Dryer with ...
�����������������
Citation: Zare, F.; Najafi, G.; Ghiasi,
P.; Fayyazi, E.; Yusaf, T.; Mazlan, M.
Applying Solar Energy in the
Combination of Solar Dryer with
Olive Harvesting Machine to Reduce
Energy Losses. Sustainability 2022, 14,
1091. https://doi.org/10.3390/
su14031091
Academic Editors: Tomonobu Senjyu
and Alessandro Franco
Received: 30 November 2021
Accepted: 4 January 2022
Published: 18 January 2022
Publisher’s Note: MDPI stays neutral
with regard to jurisdictional claims in
published maps and institutional affil-
iations.
Copyright: © 2022 by the authors.
Licensee MDPI, Basel, Switzerland.
This article is an open access article
distributed under the terms and
conditions of the Creative Commons
Attribution (CC BY) license (https://
creativecommons.org/licenses/by/
4.0/).
sustainability
Article
Applying Solar Energy in the Combination of Solar Dryer withOlive Harvesting Machine to Reduce Energy LossesFatemeh Zare 1, Gholamhassan Najafi 1, Pedram Ghiasi 1, Ebrahim Fayyazi 1, Talal Yusaf 2,*and Mohamed Mazlan 3,*
1 Department of Biosystems Engineering, Tarbiat Modares University (TMU), Tehran 14115-111, Iran;[email protected] (F.Z.); [email protected] (G.N.); [email protected] (P.G.);[email protected] (E.F.)
2 School of Engineering and Technology, Central Queensland University, Brisbane 4009, Australia3 Faculty of Bioengineering and Technology, Advanced Material Research Cluster,
Universiti Malaysia Kelantan, Jeli 17600, Malaysia* Correspondence: [email protected] (T.Y.); [email protected] (M.M.)
Abstract: In recent years, leveraging the amount of energy loss occurring in different fields of humanactivity has captured the attention of researchers. Harvesting and drying processes can be integratedin order to reduce energy losses. The present research work seeks to pinpoint the association betweenthe harvesting and drying processes as well as to make optimal use of both processes so as todecrease the level of energy loss and apply the renewable energies to the food supply chain. The oliveharvesting machine was designed and evaluated, and the olives harvested in the solar dryer wereplaced in the solar dryer as the input materials. To obtain the evaluation of the experimental tests’purpose, Mari cultivar was used. Following this trend was the evaluation of the olive harvestingmachine and its comparison with the manual harvesting method. Having separated the olivesfrom the tree through use of the harvesting machine designed and made, a solar dryer was used toaccommodate the olives in order to make the final examination concerning any damage to olives.Findings of the study indicated up to 92% separation of the olive fruits by the olive harvester. It wasalso found that there is a 29.47 harvest efficiency for the olive harvester. In addition, evaluation of thesolar dryer emphasized that an increase in the temperature and velocity of the inlet air results in arapid decrease in the olive moisture.
Keywords: continuous processes; renewable energy in agriculture; olive fruit storage
1. Introduction
In the field of energy, agriculture is believed to be among the high-consuming indus-tries. The determinants of energy consumption are the population involved in agriculture,the number of arable areas, and the level of mechanization. Furthermore, when there is abulky chain of production concerning the final product, lower levels of energy consumptioncan be expected. Renewable energies are regarded as alternative sources of energy to fossilfuel [1], which include solar energy, wind energy, biomass energy, geothermal energy,etc. [2]. Solar energy is deemed to be a common energy source, and it can be found invarious countries [3]. Solar collectors can collect solar energy and produce applicable heat.The outcome of collecting the heat through the solar collectors is the generation of power,desalination, and drying [4]. Drying is classified by its high level of energy consumptionwhen the crop-producing processes category is addressed [5]. When referring to the dryingprocess of horticultural crops, it is observable that direct sunlight and high temperaturescan damage the active ingredients existing in the plant. Accordingly, the main horticulturecrops, namely olive fruits, can be obtained in canned, dried fruit, and oil extraction forms [6].There are three features, including the harvesting, drying, and the time interval, that renderthe olive plant for consumption [7]. In the case of fully mechanized harvesting, it is feasible
Sustainability 2022, 14, 1091. https://doi.org/10.3390/su14031091 https://www.mdpi.com/journal/sustainability
Sustainability 2022, 14, 1091 2 of 29
to have the economic success of super-intensive olive plantations [8]. Olive harvesting isnot a cost-effective process, and a number of problems accompany it, such as damagesto fruit and to the olive tree, mitigation of quality, injuries to individuals, consumptionof time, and expenses present in adhering to the conventional methods [9]. The dryingprocess is attended through the incorporation of an electrical device, which means it fallsinto the high-energy process category. When compared to other crop-producing processes,it makes use of the maximum energy level [10]. The subcategories of renewable energy(which are solar energy, wind energy, biomass energy, geothermal energy, etc.) can betaken into consideration when it comes to resolving the problems of energy consumptioninvolved in the aforementioned process [7]. The harvesting method has been meticulouslygiven attention in terms of the shaker design, harvesting efficiency estimation, tree damage,and energy consumption. Practically, the extent to which the shaking force and shakingamplitude could affect mechanized olive harvesting was put forth in a study, which showedthat as the olive tree diameter increased, the shaking force and shaking amplitude wereincreased and decreased, respectively. It was suggested in this study that there shouldbe higher levels of power used in case of large olive trees with large trunk diameters [11].Another study tackled different manners in which olive harvesting could be performed,and it was concluded that stem shaking is the best method to remove the olive fruit froma tree with a low level of energy consumption [12]. As regards the different categories ofolive harvesting, one study illustrated that the flat-type olive harvester enjoys the highestvibration value index [10]. Productivity and energy consumption can be specified on thebasis of the time, which is a significant element in the harvesting process. In this regard, an-other study was shaped to investigate the effect of olive tree harvesting tools, namely, trunkshaker and mechanical harvest aid, with respect to time [13]. The study was performedthrough the lenses of the mechanical canopy and trunk shaking related to the harvestingmechanization of table olive orchards. From the trunk shaker accumulation and shakercombs perspective, the outcomes of the study represented an increase in the bruise indexof olive fruits. Therefore, it is possible to argue that the lowest bruise index of olive fruits is0.5%, the value of the manual-type harvester [14].
The performance of a dish concentrator with cavity receivers has been addressedby various researchers [15,16]. As an example, Pavolic et al. [17] sought to pinpoint theoptical and thermal performance of a dish concentrator featuring two shapes of cavityreceiver, conical and spiral, and it was suggested that the use of the dish concentratorwith the conical cavity receiver leads to a higher thermal performance. In another attempt,Loni et al. [18] drew their attention toward the performance of a dish concentrator withdifferent shapes of cavity receiver and various solar working fluids. In particular, threecategories of cavities, including hemispherical, cylindrical, and cubical, accompaniedby water and thermal oil as different heat transfer fluids were studied. It was foundthat when high temperature exists, the highest exergy efficiency can be attributed tothe thermal oil. Focusing on energy and exergy, Venkatachalam and Cheralathan [19]investigated a dish concentrator with a conical cavity receiver, and the aspect ratio withdifferent amounts was studied. As the outcomes represented, the aspect ratio is of immensesignificance when one addresses solar dish performance. The overall objective of the studyled by Yan et al. [20] was to optimize the solar heat flux distribution on cavity walls ofa dish contractor as far as the highest performance was concerned. For the purpose ofoptimization, the researchers used a genetic algorithm and reported an increase in opticalefficiency and uniformity of solar flux distribution on the cavity receiver. Furthermore,Yan et al. [21] intended to find a new design of a dish concentrator with a cavity receiver.Accordingly, Loni et al. [22] endeavored to evaluate and optimize the optical and thermalperformance of a dish concentrator with a rectangular cavity receiver as a heat source of anORC system for power generation. What the authors suggested to attain the maximumperformance was the consideration of optimum structural and operational parameters.Focusing on a numerical study, Karimi et al. [23] conducted a study to investigate a dishconcentrator with a cylindrical cavity receiver. The performance of the solar dish system
Sustainability 2022, 14, 1091 3 of 29
was in question regarding the influence of different operational and structural parameters.Similar researchers such as [24], who contemplated smooth and corrugated types of cavitytubes, have looked into the exegetical performance of a dish concentrator with a spiralreceiver and decided that a better performance can be attributed to the solar systemincluding the spiral cavity receiver with a corrugated tube.
Nanofluids, defined as suspension fluids of nanoparticles in a base fluid such as water,oil, or propylene glycol, share important features concerning solar system performanceand can be used in this field [25]. Several researchers have attended to the investigation ofnanofluids as the solar working fluid of solar collectors [26–28]. Some other researcherssuch as Loni et al. [29,30] surveyed the use of various nanofluids, including Al2O3/oil andSiO2/oil nanofluids, so as to obtain the performance of a dish concentrator with cylindricaland hemispherical cavity receivers. Performance of dish was accompanied by severalexperimental relationships. Ultimately, the use of nanofluid, compared to pure oil as thesolar working fluid, was proved to improve the performance of the solar system.
Researchers who deal with energy and agriculture review energy consumption reduc-tion and agricultural processes centralization as two key entities. An integration of thevarious agricultural processes to mitigate energy and material losses was put into practiceconcerning the soil and planting crops preparation process. There is a new approach towardolive production, i.e., merging the harvesting and drying operations continuously withoutinterruption. One of the primary intentions of the current research work was to integratethe harvesting and drying processes as well as to incorporate renewable energy as far as thefinal product preparation process is concerned. Nevertheless, the absence of a proper oliveharvesting machine inspired the idea to design and construct a new pneumatic machine forthe purpose of olive harvesting, and this was pursued by studying the olives’ processing ina solar dryer. For the sake of this matter, to design the olive harvesting machine, initially aproper and safe frequency in line with the vibration of the jaw of the machine was attendedby simulation in Ansys software, and then a pneumatic design was completed in orderto yield this frequency. Outcomes of olive harvesting machine assessment, including theharvesting efficiency, harvesting productivity, and damage to the olive tree, were inspectedindividually through the manual harvesting.
The role played by a dish concentrator with a cavity receiver in heating a dryer wasstudied. To fulfill the dish absorber role, a cylindrical cavity receiver was used. Purethermal oil and Al2O3/oil nanofluid, taken as working fluids, were examined as the solarheat transfer fluid. Last but not least, the drying process of a solar dryer was scrutinized inthe current study.
The novelty of the present study is highlighted clearly in the following elements:(1) performing the numerical simulation to determine the minimum frequency for thedamage in order to reduce the consumed energy of the harvesting process; (2) designingand developing a new model of olive harvesting machine; (3) mixing the harvesting anddrying processes as continuous.
2. Materials and Methods2.1. Physical and Mechanical Properties of Olives
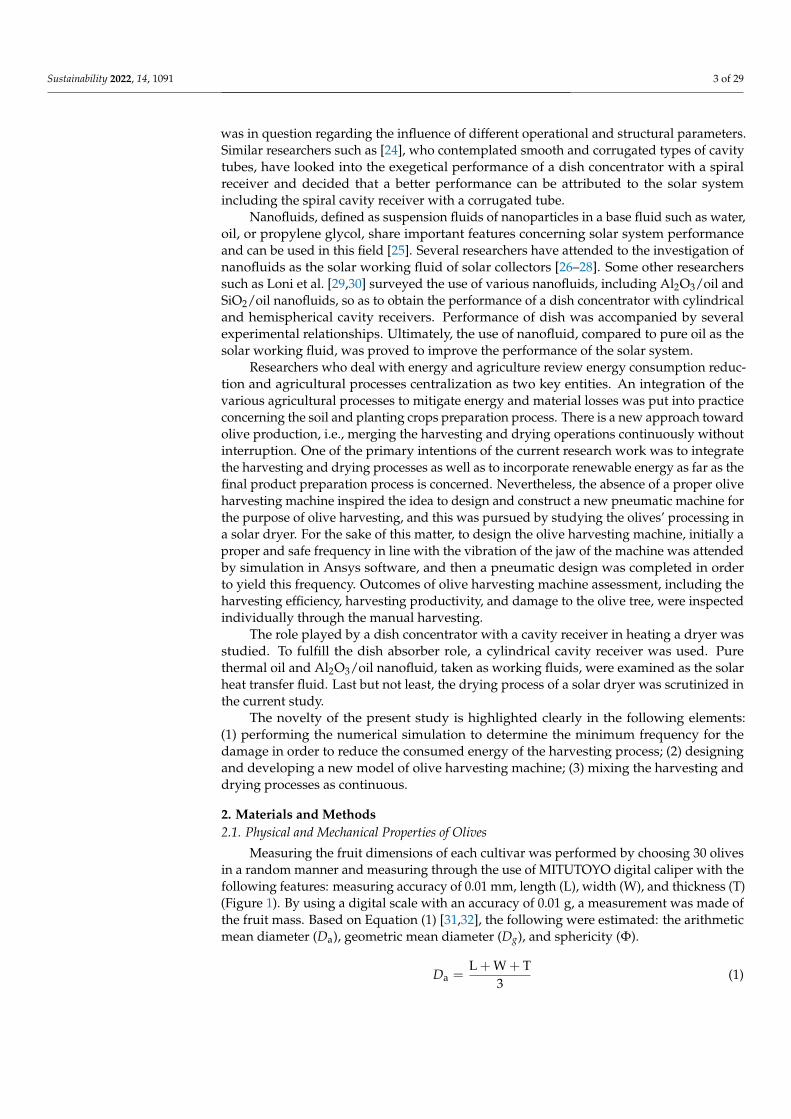
Measuring the fruit dimensions of each cultivar was performed by choosing 30 olivesin a random manner and measuring through the use of MITUTOYO digital caliper with thefollowing features: measuring accuracy of 0.01 mm, length (L), width (W), and thickness (T)(Figure 1). By using a digital scale with an accuracy of 0.01 g, a measurement was made ofthe fruit mass. Based on Equation (1) [31,32], the following were estimated: the arithmeticmean diameter (Da), geometric mean diameter (Dg), and sphericity (Φ).
Da =L + W + T
3(1)
Sustainability 2022, 14, 1091 4 of 29
where: L = the olive length (mm), W = the olive width (mm), T = the olive thickness (mm),Da = the arithmetic mean diameter (mm).
Dg = (LWT)13 (2)
where: Dg = the geometric mean diameter (mm).
Φ =(LWT)1/3
L(3)
Sustainability 2021, 13, x FOR PEER REVIEW 4 of 29
was made of the fruit mass. Based on Equation (1) [31,32], the following were estimated: the arithmetic mean diameter (Da), geometric mean diameter (Dg), and sphericity (ϕ).
Figure 1. Dimensions of olive.
𝐷 = L +W+ T3 (1)
where: L = the olive length (mm), W = the olive width (mm), T = the olive thickness (mm), Da = the arithmetic mean diameter (mm). 𝐷 = (LWT) (2)
where: Dg = the geometric mean diameter (mm).
LLWT 3/1)(=Φ (3)
Dividing the mass of the fruit by the total volume gives the physical specific density Pb. The physical specific density was measured through the olive fruit filling into an empty cylinder with a specified volume. In addition, dividing the mass of the samples by the volume of the container yields the physical specific density. The true density was obtained from Equation (4), and the sample volume was estimated by Equation (5) using liquid (water) displacement volume method. 𝑃 = mPm (4)
where: Pt = true density ( ), m = olive mass (gr), water density, mw = displaced water mass (gr). 𝑉 = 𝑚P (5)
where: mw = discalced water mass (gr), v = olive volume (mm3). The static friction coefficient (μ) was calculated by measuring the angles at which
the threshold product moves on the surfaces of various materials such as wood, steel sheet, and galvanized sheet. To measure this variable, the fruits were placed in a card-board box that had no contact with the surface, and then the surface began to rotate around a hinged axis at a uniform speed. The tangent of the angle at which the product is at the threshold of moving equals to the coefficient of static friction [31]. To determine the mechanical behavior of olives, Santam SMT-20 and 100 kgf Loadecell material test device with an accuracy of 0.03 μm was used. The device consists of three main parts, namely a fixed plate, a moving plate by which force is applied to the fruit, and a screen that displays the results (Figure 2). The olives were placed on a fixed plate, pressed by a moving plate until the olive peel was broken, and the force-deformation diagram was recorded. Five replications were performed for each sample. Fracture force and energy were displayed on the computer; the fracture energy was equal to the area below the force-deformation diagram, and the toughness was obtained through dividing the frac-ture energy by the volume of each sample [33].
Figure 1. Dimensions of olive.
Dividing the mass of the fruit by the total volume gives the physical specific densityPb. The physical specific density was measured through the olive fruit filling into an emptycylinder with a specified volume. In addition, dividing the mass of the samples by thevolume of the container yields the physical specific density. The true density was obtainedfrom Equation (4), and the sample volume was estimated by Equation (5) using liquid(water) displacement volume method.
Pt =mPw
mw(4)
where: Pt = true density ( kgm3 ), m = olive mass (gr), water density, mw = displaced water
mass (gr).
V =mw
Pw(5)
where: mw = discalced water mass (gr), V = olive volume (mm3).The static friction coefficient (µ) was calculated by measuring the angles at which the
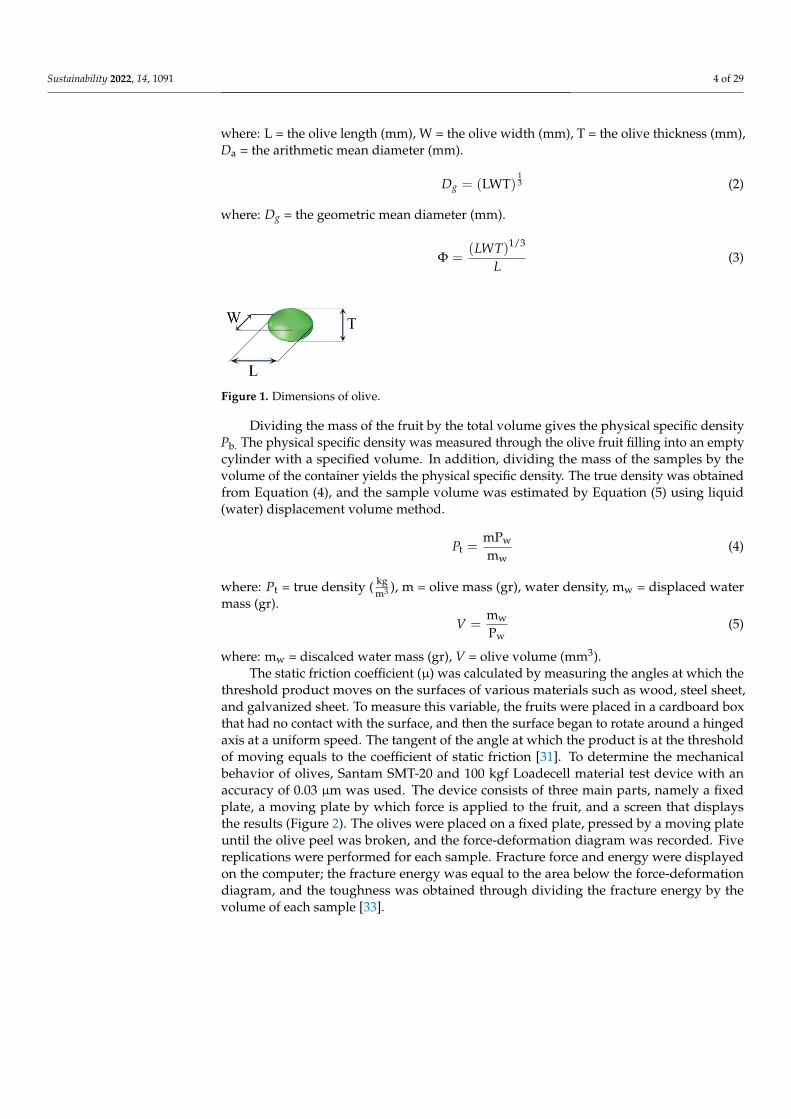
threshold product moves on the surfaces of various materials such as wood, steel sheet,and galvanized sheet. To measure this variable, the fruits were placed in a cardboard boxthat had no contact with the surface, and then the surface began to rotate around a hingedaxis at a uniform speed. The tangent of the angle at which the product is at the thresholdof moving equals to the coefficient of static friction [31]. To determine the mechanicalbehavior of olives, Santam SMT-20 and 100 kgf Loadecell material test device with anaccuracy of 0.03 µm was used. The device consists of three main parts, namely a fixedplate, a moving plate by which force is applied to the fruit, and a screen that displaysthe results (Figure 2). The olives were placed on a fixed plate, pressed by a moving plateuntil the olive peel was broken, and the force-deformation diagram was recorded. Fivereplications were performed for each sample. Fracture force and energy were displayedon the computer; the fracture energy was equal to the area below the force-deformationdiagram, and the toughness was obtained through dividing the fracture energy by thevolume of each sample [33].
Sustainability 2022, 14, 1091 5 of 29Sustainability 2021, 13, x FOR PEER REVIEW 5 of 29
Figure 2. Mechanical behavior test process.
In order to measure the force required to separate the olive fruit from the branch, 10 olives per day were randomly selected from different parts of the canopy of each plot, and the force required to separate them was measured by a mechanical force dynamom-eter. The force was measured in such a way that a cotton thread of fixed length was at-tached to the dynamometer and the other end to the joint of the fruit to the peduncle. Then, by pulling the dynamometer ring and separating the fruit from the peduncle, the force indicated by the dynamometer was read. The dynamometer used by the Precision Process Measurement Calibration Laboratory, with certification number 681 from the Iranian Institute of Standards, was calibrated.
2.2. Simulation To perform the simulation, initially the model was developed in SolidWorks soft-
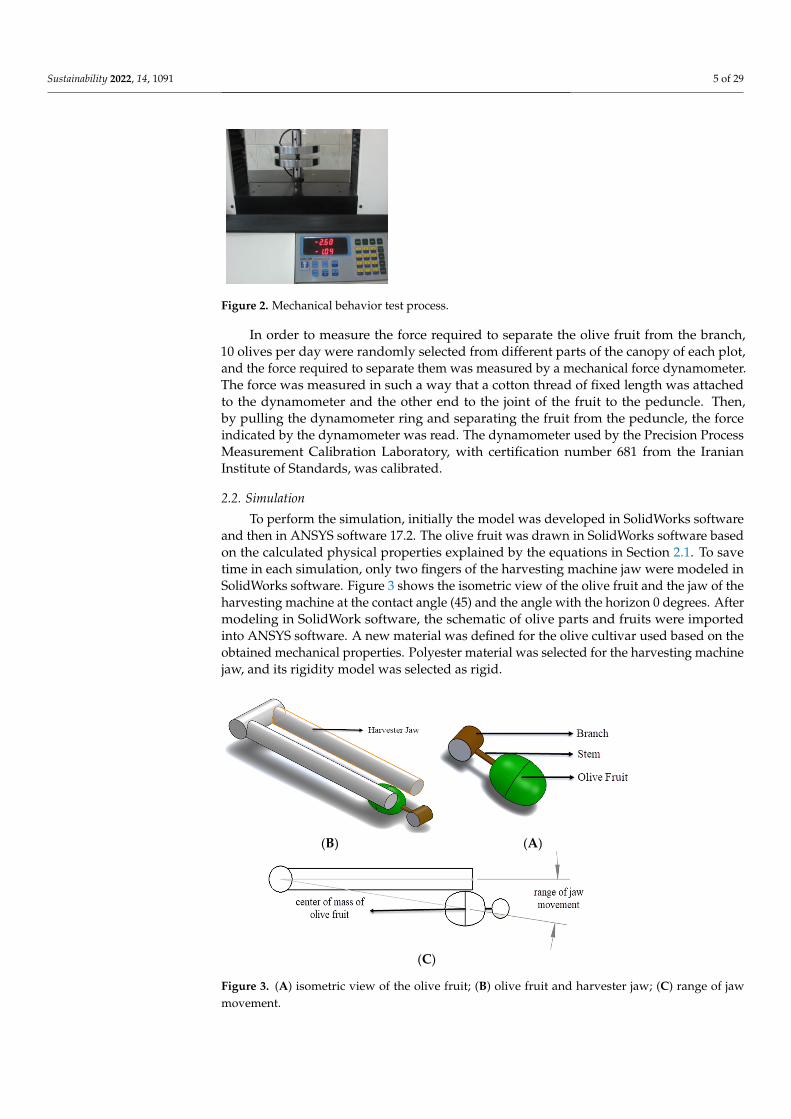
ware and then in ANSYS software 17.2. The olive fruit was drawn in SolidWorks soft-ware based on the calculated physical properties explained by the equations in Section 2.1. To save time in each simulation, only two fingers of the harvesting machine jaw were modeled in SolidWorks software. Figure 3 shows the isometric view of the olive fruit and the jaw of the harvesting machine at the contact angle (45) and the angle with the horizon 0 degrees. After modeling in SolidWork software, the schematic of olive parts and fruits were imported into ANSYS software. A new material was defined for the olive cultivar used based on the obtained mechanical properties. Polyester material was selected for the harvesting machine jaw, and its rigidity model was selected as rigid.
(B) (A)
(C)
Figure 3. (A) isometric view of the olive fruit; (B) olive fruit and harvester jaw; (C) range of jaw movement.
Figure 2. Mechanical behavior test process.
In order to measure the force required to separate the olive fruit from the branch,10 olives per day were randomly selected from different parts of the canopy of each plot,and the force required to separate them was measured by a mechanical force dynamometer.The force was measured in such a way that a cotton thread of fixed length was attachedto the dynamometer and the other end to the joint of the fruit to the peduncle. Then,by pulling the dynamometer ring and separating the fruit from the peduncle, the forceindicated by the dynamometer was read. The dynamometer used by the Precision ProcessMeasurement Calibration Laboratory, with certification number 681 from the IranianInstitute of Standards, was calibrated.
2.2. Simulation
To perform the simulation, initially the model was developed in SolidWorks softwareand then in ANSYS software 17.2. The olive fruit was drawn in SolidWorks software basedon the calculated physical properties explained by the equations in Section 2.1. To savetime in each simulation, only two fingers of the harvesting machine jaw were modeled inSolidWorks software. Figure 3 shows the isometric view of the olive fruit and the jaw of theharvesting machine at the contact angle (45) and the angle with the horizon 0 degrees. Aftermodeling in SolidWork software, the schematic of olive parts and fruits were importedinto ANSYS software. A new material was defined for the olive cultivar used based on theobtained mechanical properties. Polyester material was selected for the harvesting machinejaw, and its rigidity model was selected as rigid.
Sustainability 2021, 13, x FOR PEER REVIEW 5 of 29
Figure 2. Mechanical behavior test process.
In order to measure the force required to separate the olive fruit from the branch, 10 olives per day were randomly selected from different parts of the canopy of each plot, and the force required to separate them was measured by a mechanical force dynamom-eter. The force was measured in such a way that a cotton thread of fixed length was at-tached to the dynamometer and the other end to the joint of the fruit to the peduncle. Then, by pulling the dynamometer ring and separating the fruit from the peduncle, the force indicated by the dynamometer was read. The dynamometer used by the Precision Process Measurement Calibration Laboratory, with certification number 681 from the Iranian Institute of Standards, was calibrated.
2.2. Simulation To perform the simulation, initially the model was developed in SolidWorks soft-
ware and then in ANSYS software 17.2. The olive fruit was drawn in SolidWorks soft-ware based on the calculated physical properties explained by the equations in Section 2.1. To save time in each simulation, only two fingers of the harvesting machine jaw were modeled in SolidWorks software. Figure 3 shows the isometric view of the olive fruit and the jaw of the harvesting machine at the contact angle (45) and the angle with the horizon 0 degrees. After modeling in SolidWork software, the schematic of olive parts and fruits were imported into ANSYS software. A new material was defined for the olive cultivar used based on the obtained mechanical properties. Polyester material was selected for the harvesting machine jaw, and its rigidity model was selected as rigid.
(B) (A)
(C)
Figure 3. (A) isometric view of the olive fruit; (B) olive fruit and harvester jaw; (C) range of jaw movement.
Figure 3. (A) isometric view of the olive fruit; (B) olive fruit and harvester jaw; (C) range of jawmovement.
Sustainability 2022, 14, 1091 6 of 29
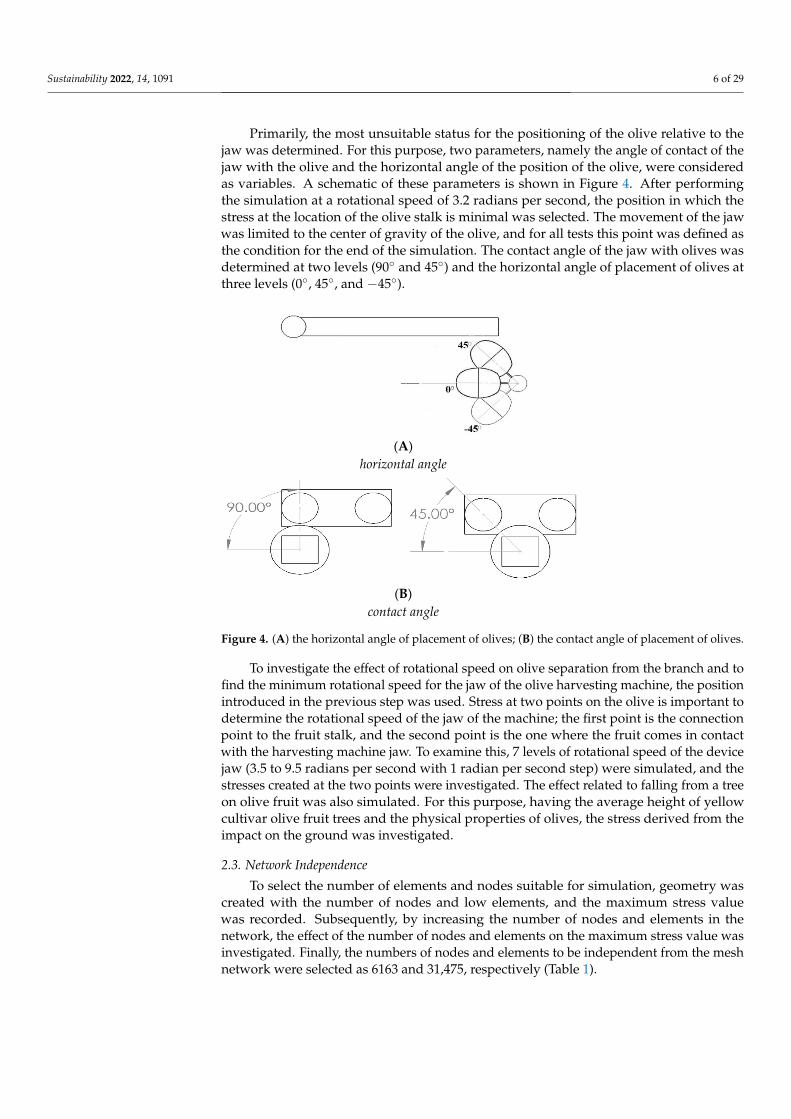
Primarily, the most unsuitable status for the positioning of the olive relative to thejaw was determined. For this purpose, two parameters, namely the angle of contact of thejaw with the olive and the horizontal angle of the position of the olive, were consideredas variables. A schematic of these parameters is shown in Figure 4. After performingthe simulation at a rotational speed of 3.2 radians per second, the position in which thestress at the location of the olive stalk is minimal was selected. The movement of the jawwas limited to the center of gravity of the olive, and for all tests this point was defined asthe condition for the end of the simulation. The contact angle of the jaw with olives wasdetermined at two levels (90◦ and 45◦) and the horizontal angle of placement of olives atthree levels (0◦, 45◦, and −45◦).
Sustainability 2021, 13, x FOR PEER REVIEW 6 of 29
Primarily, the most unsuitable status for the positioning of the olive relative to the jaw was determined. For this purpose, two parameters, namely the angle of contact of the jaw with the olive and the horizontal angle of the position of the olive, were consid-ered as variables. A schematic of these parameters is shown in Figure 4. After performing the simulation at a rotational speed of 3.2 radians per second, the position in which the stress at the location of the olive stalk is minimal was selected. The movement of the jaw was limited to the center of gravity of the olive, and for all tests this point was defined as the condition for the end of the simulation. The contact angle of the jaw with olives was determined at two levels (90° and 45°) and the horizontal angle of placement of olives at three levels (0°, 45°, and −45°).
(A)
horizontal angle
(B)
contact angle
Figure 4. (A) the horizontal angle of placement of olives; (B) the contact angle of placement of olives.
To investigate the effect of rotational speed on olive separation from the branch and to find the minimum rotational speed for the jaw of the olive harvesting machine, the position introduced in the previous step was used. Stress at two points on the olive is important to determine the rotational speed of the jaw of the machine; the first point is the connection point to the fruit stalk, and the second point is the one where the fruit comes in contact with the harvesting machine jaw. To examine this, 7 levels of rotational speed of the device jaw (3.5 to 9.5 radians per second with 1 radian per second step) were simulated, and the stresses created at the two points were investigated. The effect related to falling from a tree on olive fruit was also simulated. For this purpose, having the av-erage height of yellow cultivar olive fruit trees and the physical properties of olives, the stress derived from the impact on the ground was investigated.
2.3. Network Independence To select the number of elements and nodes suitable for simulation, geometry was
created with the number of nodes and low elements, and the maximum stress value was recorded. Subsequently, by increasing the number of nodes and elements in the network, the effect of the number of nodes and elements on the maximum stress value was inves-tigated. Finally, the numbers of nodes and elements to be independent from the mesh network were selected as 6163 and 31,475, respectively (Table 1).
Figure 4. (A) the horizontal angle of placement of olives; (B) the contact angle of placement of olives.
To investigate the effect of rotational speed on olive separation from the branch and tofind the minimum rotational speed for the jaw of the olive harvesting machine, the positionintroduced in the previous step was used. Stress at two points on the olive is important todetermine the rotational speed of the jaw of the machine; the first point is the connectionpoint to the fruit stalk, and the second point is the one where the fruit comes in contactwith the harvesting machine jaw. To examine this, 7 levels of rotational speed of the devicejaw (3.5 to 9.5 radians per second with 1 radian per second step) were simulated, and thestresses created at the two points were investigated. The effect related to falling from a treeon olive fruit was also simulated. For this purpose, having the average height of yellowcultivar olive fruit trees and the physical properties of olives, the stress derived from theimpact on the ground was investigated.
2.3. Network Independence
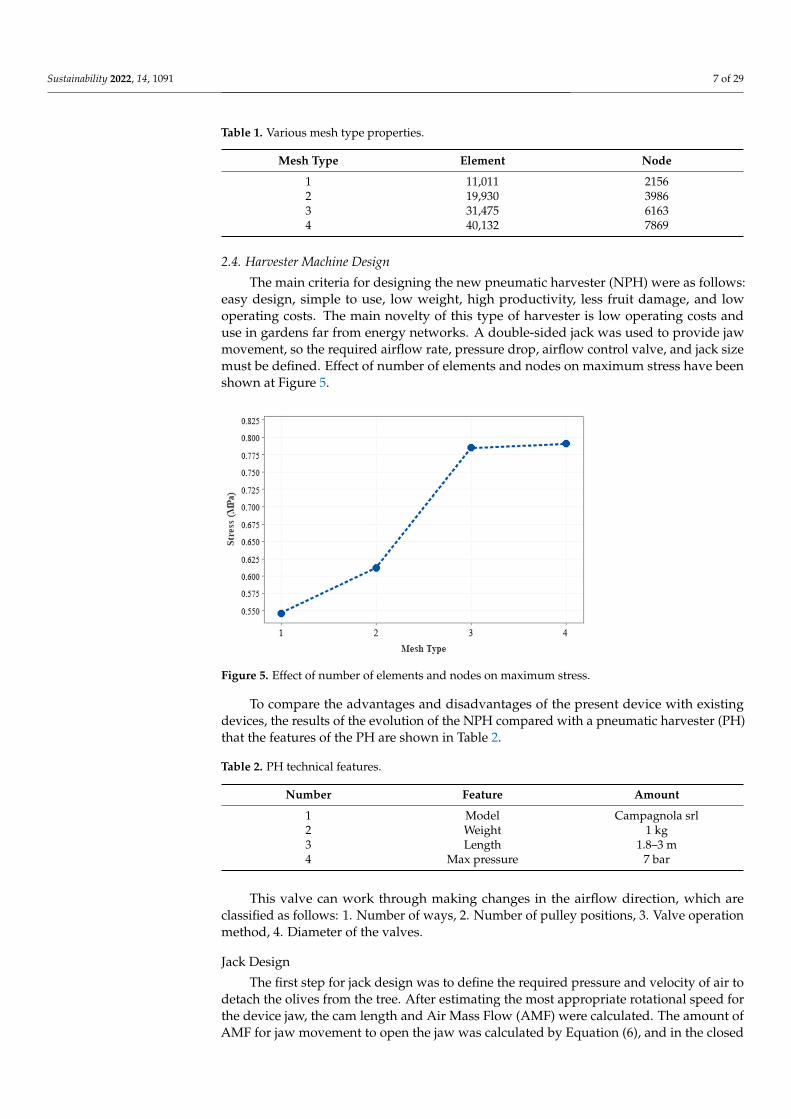
To select the number of elements and nodes suitable for simulation, geometry wascreated with the number of nodes and low elements, and the maximum stress valuewas recorded. Subsequently, by increasing the number of nodes and elements in thenetwork, the effect of the number of nodes and elements on the maximum stress value wasinvestigated. Finally, the numbers of nodes and elements to be independent from the meshnetwork were selected as 6163 and 31,475, respectively (Table 1).
Sustainability 2022, 14, 1091 7 of 29
Table 1. Various mesh type properties.
Mesh Type Element Node
1 11,011 21562 19,930 39863 31,475 61634 40,132 7869
2.4. Harvester Machine Design
The main criteria for designing the new pneumatic harvester (NPH) were as follows:easy design, simple to use, low weight, high productivity, less fruit damage, and lowoperating costs. The main novelty of this type of harvester is low operating costs anduse in gardens far from energy networks. A double-sided jack was used to provide jawmovement, so the required airflow rate, pressure drop, airflow control valve, and jack sizemust be defined. Effect of number of elements and nodes on maximum stress have beenshown at Figure 5.
Sustainability 2021, 13, x FOR PEER REVIEW 7 of 29
Table 1. Various mesh type properties.
Mesh Type Element Node 1 11011 2156 2 19930 3986 3 31475 6163 4 40132 7869
2.4. Harvester Machine Design The main criteria for designing the new pneumatic harvester (NPH) were as follows:
easy design, simple to use, low weight, high productivity, less fruit damage, and low operating costs. The main novelty of this type of harvester is low operating costs and use in gardens far from energy networks. A double-sided jack was used to provide jaw move-ment, so the required airflow rate, pressure drop, airflow control valve, and jack size must be defined. Effect of number of elements and nodes on maximum stress have been shown at Figure 5.
Figure 5. Effect of number of elements and nodes on maximum stress.
To compare the advantages and disadvantages of the present device with existing devices, the results of the evolution of the NPH compared with a pneumatic harvester (PH) that the features of the PH are shown in Table 2.
Table 2. PH technical features.
Number Feature Amount 1 Model Campagnola srl 2 Weight 1 kg 3 Length 1.8–3 m 4 Max pressure 7 bar
This valve can work through making changes in the airflow direction, which are classified as follows: 1. Number of ways, 2. Number of pulley positions, 3. Valve opera-tion method, 4. Diameter of the valves.
Jack Design The first step for jack design was to define the required pressure and velocity of air
to detach the olives from the tree. After estimating the most appropriate rotational speed for the device jaw, the cam length and Air Mass Flow (AMF) were calculated. The
Figure 5. Effect of number of elements and nodes on maximum stress.
To compare the advantages and disadvantages of the present device with existingdevices, the results of the evolution of the NPH compared with a pneumatic harvester (PH)that the features of the PH are shown in Table 2.
Table 2. PH technical features.
Number Feature Amount
1 Model Campagnola srl2 Weight 1 kg3 Length 1.8–3 m4 Max pressure 7 bar
This valve can work through making changes in the airflow direction, which areclassified as follows: 1. Number of ways, 2. Number of pulley positions, 3. Valve operationmethod, 4. Diameter of the valves.
Jack Design
The first step for jack design was to define the required pressure and velocity of air todetach the olives from the tree. After estimating the most appropriate rotational speed forthe device jaw, the cam length and Air Mass Flow (AMF) were calculated. The amount ofAMF for jaw movement to open the jaw was calculated by Equation (6), and in the closed
Sustainability 2022, 14, 1091 8 of 29
cycle, Equation (7) was used for the AMF. Finally, the total AMF to open and close the jawswas calculated by Equation (8).
Qext = π ×(
D2
4
)× x × n ×
(P1 − P0
P0
)(6)
Qext = π ×(
D2 − d2
4
)× x × n ×
(P1 − P0
P0
)(7)
Qtot = π ×(
2D2 − d2
4
)× x × n ×
(P1 − P0
P0
)(8)
Assuming that the total pneumatic energy was converted to kinematic energy, thetotal energy required was calculated by Equation (9):
E =12 P.πD2.(0.5)2
6g(9)
The determinations show that the detachment force of olive fruit from the tree and thepressure required for the pneumatic jack were 10 N and 7 bar, respectively. The machinehad one handle, and it was gripped by one operator’s hand and a telescoping rod up to amaximum length of 3 m. The harvesting mechanism had two jaws, and each jaw contained7 fingers that allowed for easy and deep access to all types of foliage without getting caughtin the branches. The angle between two jaws was selected as 90 degrees based on theprevious research. The jaws had 18 cm length, and the distance between them must beequal to the olive fruit width, so 1 cm distance was considered. We assume that in everyimpact of jaws, 23 olive fruits were detached from tree branches. The amount of forceof each jaw for the olive fruit detached from the tree was 325.3 N. After determining thepiston diameters, the length of the cam was calculated, and the standard jack with thesecharacters was selected.
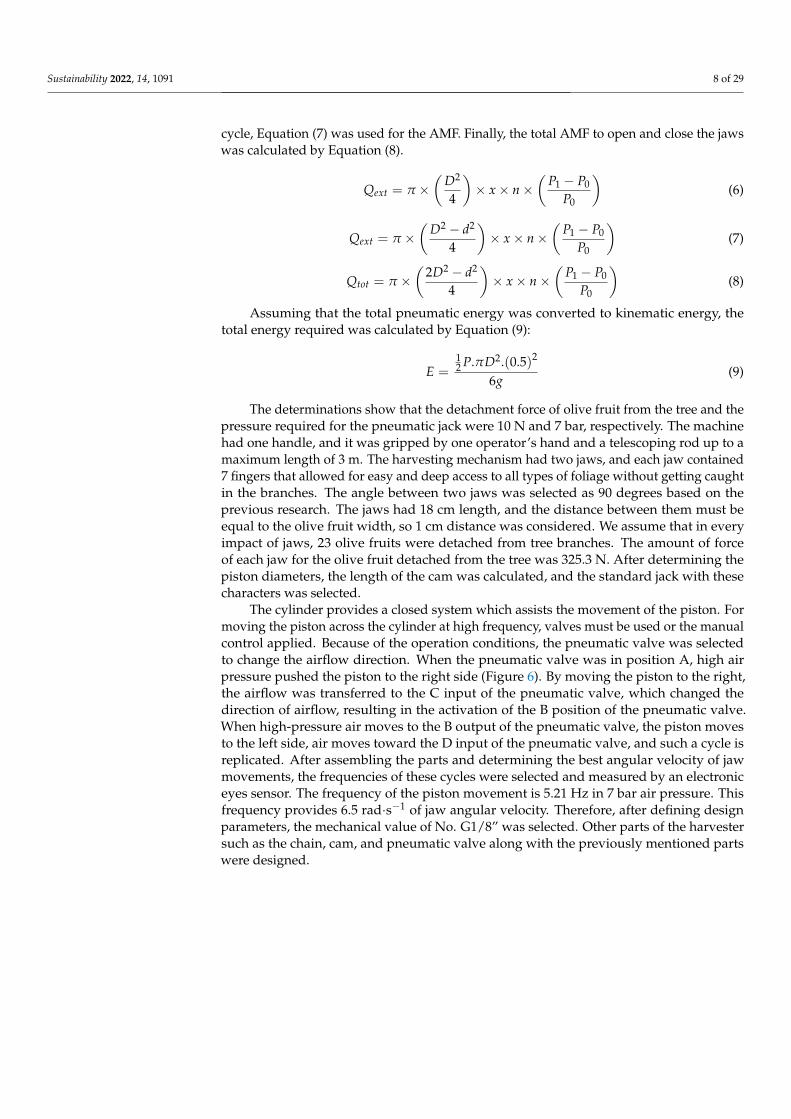
The cylinder provides a closed system which assists the movement of the piston. Formoving the piston across the cylinder at high frequency, valves must be used or the manualcontrol applied. Because of the operation conditions, the pneumatic valve was selectedto change the airflow direction. When the pneumatic valve was in position A, high airpressure pushed the piston to the right side (Figure 6). By moving the piston to the right,the airflow was transferred to the C input of the pneumatic valve, which changed thedirection of airflow, resulting in the activation of the B position of the pneumatic valve.When high-pressure air moves to the B output of the pneumatic valve, the piston movesto the left side, air moves toward the D input of the pneumatic valve, and such a cycle isreplicated. After assembling the parts and determining the best angular velocity of jawmovements, the frequencies of these cycles were selected and measured by an electroniceyes sensor. The frequency of the piston movement is 5.21 Hz in 7 bar air pressure. Thisfrequency provides 6.5 rad·s−1 of jaw angular velocity. Therefore, after defining designparameters, the mechanical value of No. G1/8” was selected. Other parts of the harvestersuch as the chain, cam, and pneumatic valve along with the previously mentioned partswere designed.
Sustainability 2022, 14, 1091 9 of 29Sustainability 2021, 13, x FOR PEER REVIEW 9 of 29
Figure 6. Schematic of the piston, cylinder, valve, and connector pipes.
Figure 7 shows the details of NPH, including harvester jaws, cylinder and pneu-matic valve, power transmission, and telescoping rod.
Figure 7. The parts of the NPH. (A): Harvester Jaws. (B): Cylinder and Pneumatic Valve. (C): Power Transmission Part. (D): Telescoping Rod. (E): Olive Tree.
The common properties of the collector system for olive fruit are shown in Table 3. By applying this system, the olive fruits falling from the tree were collected into a box. The driving power of the collector system is provided by labor. As suggested in Figure 8, the collector system is ready to collect the fruits in the box. The collector system in-cludes the wheels, steering wheel, bendable bars, wire for hold cover, polyester cover, trunk holder, position for boxes, and outlet, all of which are assembled on chassis. Col-lector system properties have been described at Table 3.
Table 3. Collector system properties.
Parameters Value Chasses length 140 cm Chasses width 95 cm
Trunk holder height 60 cm Trunk diameter Up to 40 cm Cover diameter 300 cm
Figure 6. Schematic of the piston, cylinder, valve, and connector pipes.
Figure 7 shows the details of NPH, including harvester jaws, cylinder and pneumaticvalve, power transmission, and telescoping rod.
Sustainability 2021, 13, x FOR PEER REVIEW 9 of 29
Figure 6. Schematic of the piston, cylinder, valve, and connector pipes.
Figure 7 shows the details of NPH, including harvester jaws, cylinder and pneu-matic valve, power transmission, and telescoping rod.
Figure 7. The parts of the NPH. (A): Harvester Jaws. (B): Cylinder and Pneumatic Valve. (C): Power Transmission Part. (D): Telescoping Rod. (E): Olive Tree.
The common properties of the collector system for olive fruit are shown in Table 3. By applying this system, the olive fruits falling from the tree were collected into a box. The driving power of the collector system is provided by labor. As suggested in Figure 8, the collector system is ready to collect the fruits in the box. The collector system in-cludes the wheels, steering wheel, bendable bars, wire for hold cover, polyester cover, trunk holder, position for boxes, and outlet, all of which are assembled on chassis. Col-lector system properties have been described at Table 3.
Table 3. Collector system properties.
Parameters Value Chasses length 140 cm Chasses width 95 cm
Trunk holder height 60 cm Trunk diameter Up to 40 cm Cover diameter 300 cm
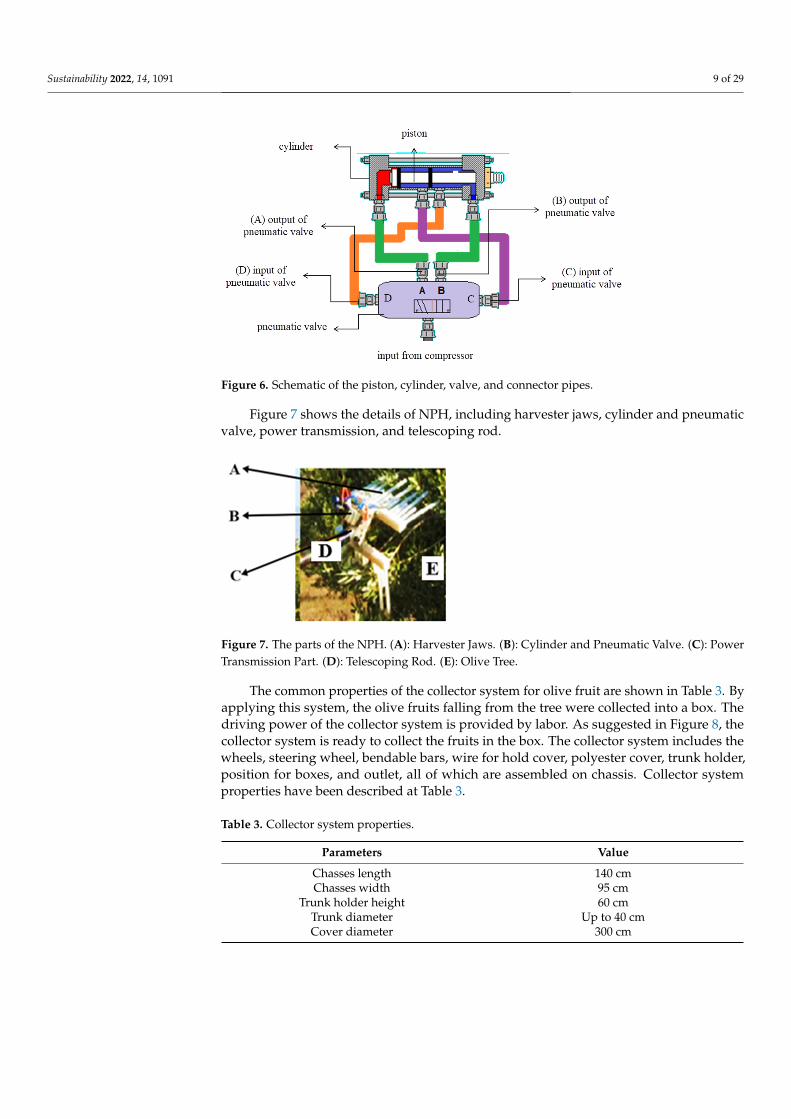
Figure 7. The parts of the NPH. (A): Harvester Jaws. (B): Cylinder and Pneumatic Valve. (C): PowerTransmission Part. (D): Telescoping Rod. (E): Olive Tree.
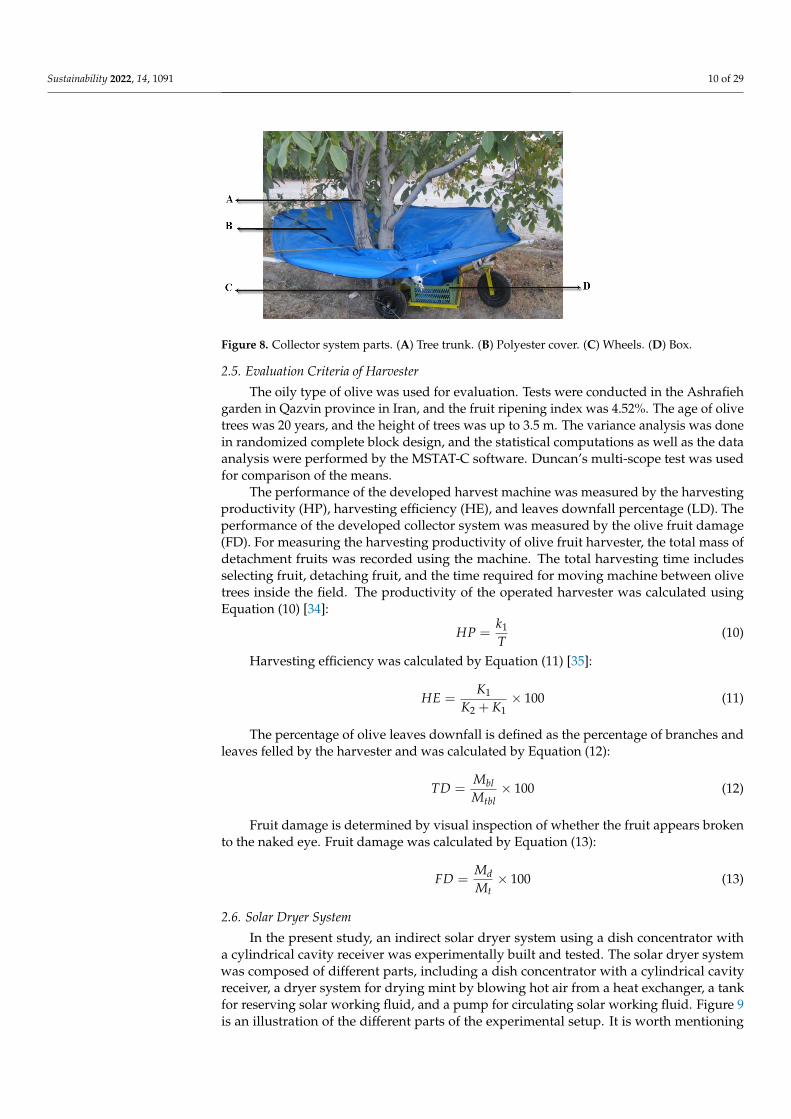
The common properties of the collector system for olive fruit are shown in Table 3. Byapplying this system, the olive fruits falling from the tree were collected into a box. Thedriving power of the collector system is provided by labor. As suggested in Figure 8, thecollector system is ready to collect the fruits in the box. The collector system includes thewheels, steering wheel, bendable bars, wire for hold cover, polyester cover, trunk holder,position for boxes, and outlet, all of which are assembled on chassis. Collector systemproperties have been described at Table 3.
Table 3. Collector system properties.
Parameters Value
Chasses length 140 cmChasses width 95 cm
Trunk holder height 60 cmTrunk diameter Up to 40 cmCover diameter 300 cm
Sustainability 2022, 14, 1091 10 of 29Sustainability 2021, 13, x FOR PEER REVIEW 10 of 29
Figure 8. Collector system parts. (A) Tree trunk. (B) Polyester cover. (C) Wheels. (D) Box.
2.5. Evaluation Criteria of Harvester The oily type of olive was used for evaluation. Tests were conducted in the Ash-
rafieh garden in Qazvin province in Iran, and the fruit ripening index was 4.52%. The age of olive trees was 20 years, and the height of trees was up to 3.5 m. The variance analysis was done in randomized complete block design, and the statistical computations as well as the data analysis were performed by the MSTAT-C software. Duncan’s multi-scope test was used for comparison of the means.
The performance of the developed harvest machine was measured by the harvesting productivity (HP), harvesting efficiency (HE), and leaves downfall percentage (LD). The performance of the developed collector system was measured by the olive fruit damage (FD). For measuring the harvesting productivity of olive fruit harvester, the total mass of detachment fruits was recorded using the machine. The total harvesting time includes selecting fruit, detaching fruit, and the time required for moving machine between olive trees inside the field. The productivity of the operated harvester was calculated using Equation (10) [34]: 𝐻𝑃 = 𝑘𝑇 (10)
Harvesting efficiency was calculated by Equation (11) [35]: 𝐻𝐸 = 𝐾𝐾 + 𝐾 × 100 (11)
The percentage of olive leaves downfall is defined as the percentage of branches and leaves felled by the harvester and was calculated by Equation (12): 𝑇𝐷 = 𝑀𝑀 × 100 (12)
Fruit damage is determined by visual inspection of whether the fruit appears broken to the naked eye. Fruit damage was calculated by Equation (13): 𝐹𝐷 = 𝑀𝑀 × 100 (13)
2.6. Solar Dryer System In the present study, an indirect solar dryer system using a dish concentrator with
a cylindrical cavity receiver was experimentally built and tested. The solar dryer system was composed of different parts, including a dish concentrator with a cylindrical cavity receiver, a dryer system for drying mint by blowing hot air from a heat exchanger, a tank for reserving solar working fluid, and a pump for circulating solar working fluid. Figure 9 is an illustration of the different parts of the experimental setup. It is worth mentioning that that pure thermal oil and Al2O3/thermal oil nanofluid were used as the solar working
Figure 8. Collector system parts. (A) Tree trunk. (B) Polyester cover. (C) Wheels. (D) Box.
2.5. Evaluation Criteria of Harvester
The oily type of olive was used for evaluation. Tests were conducted in the Ashrafiehgarden in Qazvin province in Iran, and the fruit ripening index was 4.52%. The age of olivetrees was 20 years, and the height of trees was up to 3.5 m. The variance analysis was donein randomized complete block design, and the statistical computations as well as the dataanalysis were performed by the MSTAT-C software. Duncan’s multi-scope test was usedfor comparison of the means.
The performance of the developed harvest machine was measured by the harvestingproductivity (HP), harvesting efficiency (HE), and leaves downfall percentage (LD). Theperformance of the developed collector system was measured by the olive fruit damage(FD). For measuring the harvesting productivity of olive fruit harvester, the total mass ofdetachment fruits was recorded using the machine. The total harvesting time includesselecting fruit, detaching fruit, and the time required for moving machine between olivetrees inside the field. The productivity of the operated harvester was calculated usingEquation (10) [34]:
HP =k1
T(10)
Harvesting efficiency was calculated by Equation (11) [35]:
HE =K1
K2 + K1× 100 (11)
The percentage of olive leaves downfall is defined as the percentage of branches andleaves felled by the harvester and was calculated by Equation (12):
TD =MblMtbl
× 100 (12)
Fruit damage is determined by visual inspection of whether the fruit appears brokento the naked eye. Fruit damage was calculated by Equation (13):
FD =MdMt
× 100 (13)
2.6. Solar Dryer System
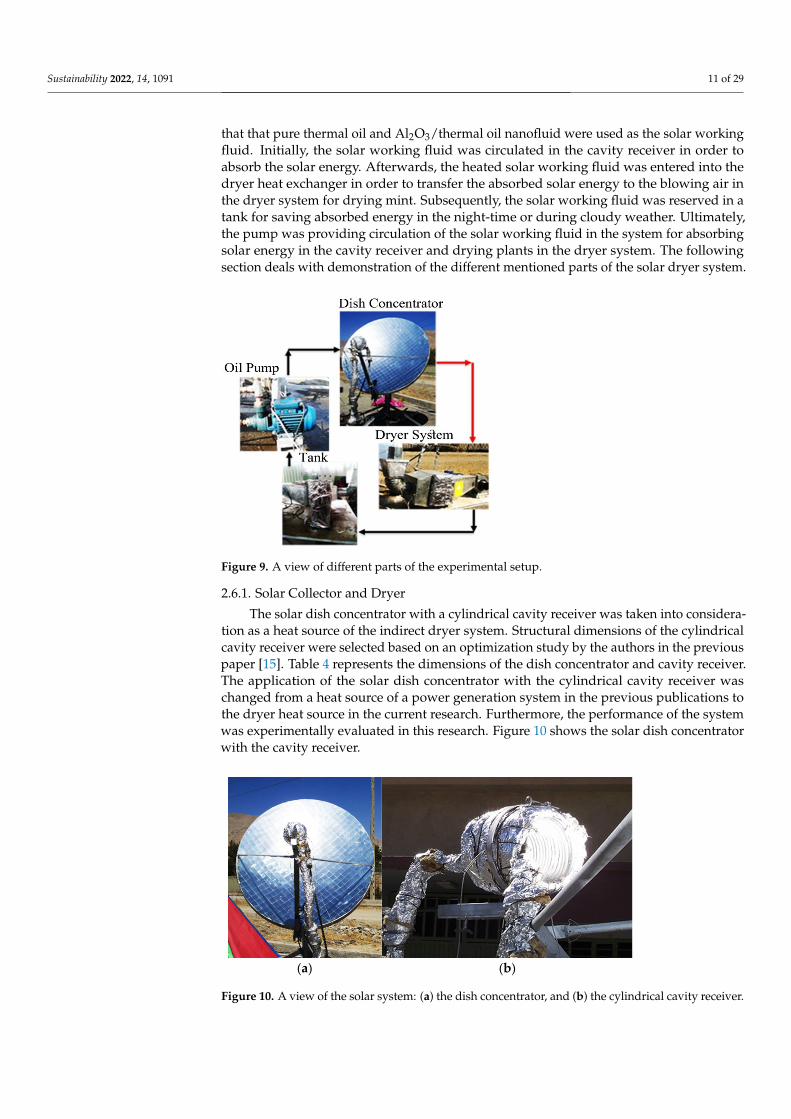
In the present study, an indirect solar dryer system using a dish concentrator witha cylindrical cavity receiver was experimentally built and tested. The solar dryer systemwas composed of different parts, including a dish concentrator with a cylindrical cavityreceiver, a dryer system for drying mint by blowing hot air from a heat exchanger, a tankfor reserving solar working fluid, and a pump for circulating solar working fluid. Figure 9is an illustration of the different parts of the experimental setup. It is worth mentioning
Sustainability 2022, 14, 1091 11 of 29
that that pure thermal oil and Al2O3/thermal oil nanofluid were used as the solar workingfluid. Initially, the solar working fluid was circulated in the cavity receiver in order toabsorb the solar energy. Afterwards, the heated solar working fluid was entered into thedryer heat exchanger in order to transfer the absorbed solar energy to the blowing air inthe dryer system for drying mint. Subsequently, the solar working fluid was reserved in atank for saving absorbed energy in the night-time or during cloudy weather. Ultimately,the pump was providing circulation of the solar working fluid in the system for absorbingsolar energy in the cavity receiver and drying plants in the dryer system. The followingsection deals with demonstration of the different mentioned parts of the solar dryer system.
Sustainability 2021, 13, x FOR PEER REVIEW 11 of 29
fluid. Initially, the solar working fluid was circulated in the cavity receiver in order to absorb the solar energy. Afterwards, the heated solar working fluid was entered into the dryer heat exchanger in order to transfer the absorbed solar energy to the blowing air in the dryer system for drying mint. Subsequently, the solar working fluid was reserved in a tank for saving absorbed energy in the night-time or during cloudy weather. Ulti-mately, the pump was providing circulation of the solar working fluid in the system for absorbing solar energy in the cavity receiver and drying plants in the dryer system. The following section deals with demonstration of the different mentioned parts of the solar dryer system.
Figure 9. A view of different parts of the experimental setup.
2.6.1. Solar Collector and Dryer The solar dish concentrator with a cylindrical cavity receiver was taken into consid-
eration as a heat source of the indirect dryer system. Structural dimensions of the cylin-drical cavity receiver were selected based on an optimization study by the authors in the previous paper [15]. Table 4 represents the dimensions of the dish concentrator and cav-ity receiver. The application of the solar dish concentrator with the cylindrical cavity re-ceiver was changed from a heat source of a power generation system in the previous publications to the dryer heat source in the current research. Furthermore, the perfor-mance of the system was experimentally evaluated in this research. Figure 10 shows the solar dish concentrator with the cavity receiver.
Table 4. The specification of the dish concentrator and cylindrical cavity receiver.
Structural Dimensions Values Dish Concentrator
Aperture diameter 2 m Focal length 0.693 m Reflectance 0.84 Tracking error 1° Rim angle 45° Concentration ratio 165 Focal length 0.693 m
Cylindrical Cavity Receiver Outer diameter 16 cm Inner diameter 14 cm Height 14 cm
Figure 9. A view of different parts of the experimental setup.
2.6.1. Solar Collector and Dryer
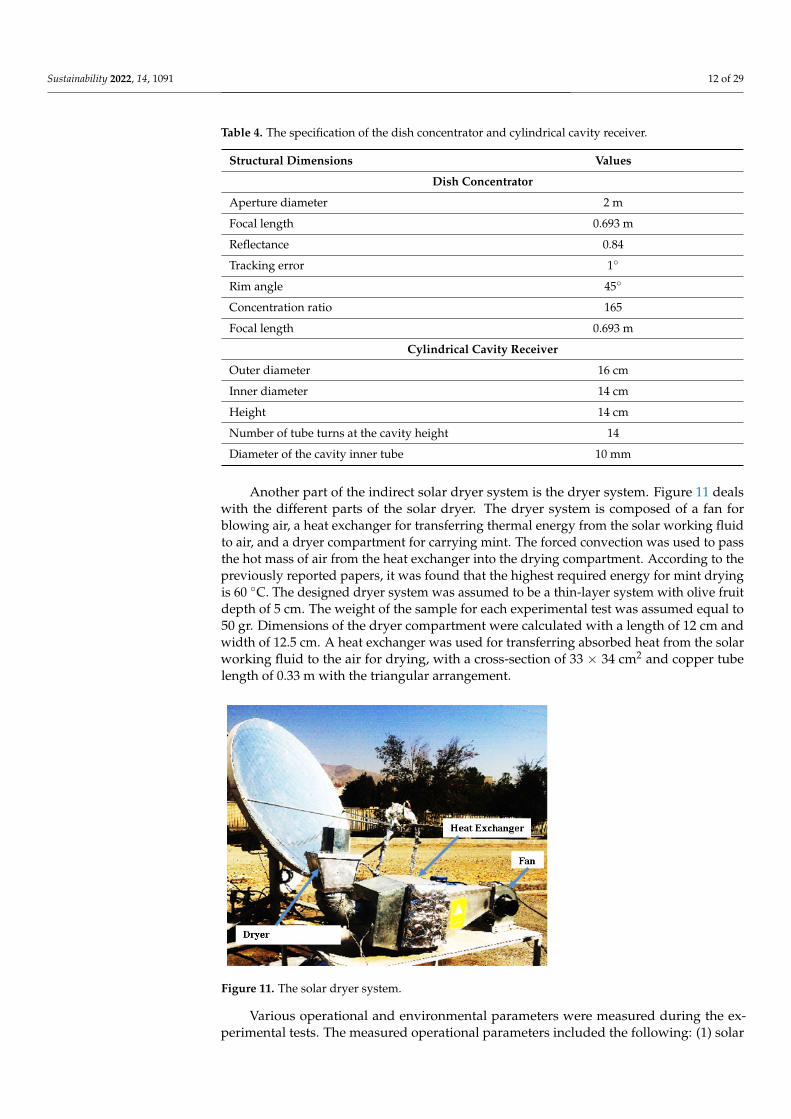
The solar dish concentrator with a cylindrical cavity receiver was taken into considera-tion as a heat source of the indirect dryer system. Structural dimensions of the cylindricalcavity receiver were selected based on an optimization study by the authors in the previouspaper [15]. Table 4 represents the dimensions of the dish concentrator and cavity receiver.The application of the solar dish concentrator with the cylindrical cavity receiver waschanged from a heat source of a power generation system in the previous publications tothe dryer heat source in the current research. Furthermore, the performance of the systemwas experimentally evaluated in this research. Figure 10 shows the solar dish concentratorwith the cavity receiver.
Sustainability 2021, 13, x FOR PEER REVIEW 12 of 29
Number of tube turns at the cavity height 14 Diameter of the cavity inner tube 10 mm
(a) (b)
Figure 10. A view of the solar system: (a) the dish concentrator, and (b) the cylindrical cavity re-ceiver.
Another part of the indirect solar dryer system is the dryer system. Figure 11 deals with the different parts of the solar dryer. The dryer system is composed of a fan for blowing air, a heat exchanger for transferring thermal energy from the solar working fluid to air, and a dryer compartment for carrying mint. The forced convection was used to pass the hot mass of air from the heat exchanger into the drying compartment. Ac-cording to the previously reported papers, it was found that the highest required energy for mint drying is 60 °C. The designed dryer system was assumed to be a thin-layer sys-tem with olive fruit depth of 5 cm. The weight of the sample for each experimental test was assumed equal to 50 gr. Dimensions of the dryer compartment were calculated with a length of 12 cm and width of 12.5 cm. A heat exchanger was used for transferring ab-sorbed heat from the solar working fluid to the air for drying, with a cross-section of 33 × 34 cm2 and copper tube length of 0.33 m with the triangular arrangement.
Figure 11. The solar dryer system.
Various operational and environmental parameters were measured during the ex-perimental tests. The measured operational parameters included the following: (1) solar radiation, (2) wind speed, and (3) ambient temperature. The solar radiation was meas-ured using Hukseflux Pyranometer, model SR12. The ambient temperature and wind
Figure 10. A view of the solar system: (a) the dish concentrator, and (b) the cylindrical cavity receiver.
Sustainability 2022, 14, 1091 12 of 29
Table 4. The specification of the dish concentrator and cylindrical cavity receiver.
Structural Dimensions Values
Dish Concentrator
Aperture diameter 2 m
Focal length 0.693 m
Reflectance 0.84
Tracking error 1◦
Rim angle 45◦
Concentration ratio 165
Focal length 0.693 m
Cylindrical Cavity Receiver
Outer diameter 16 cm
Inner diameter 14 cm
Height 14 cm
Number of tube turns at the cavity height 14
Diameter of the cavity inner tube 10 mm
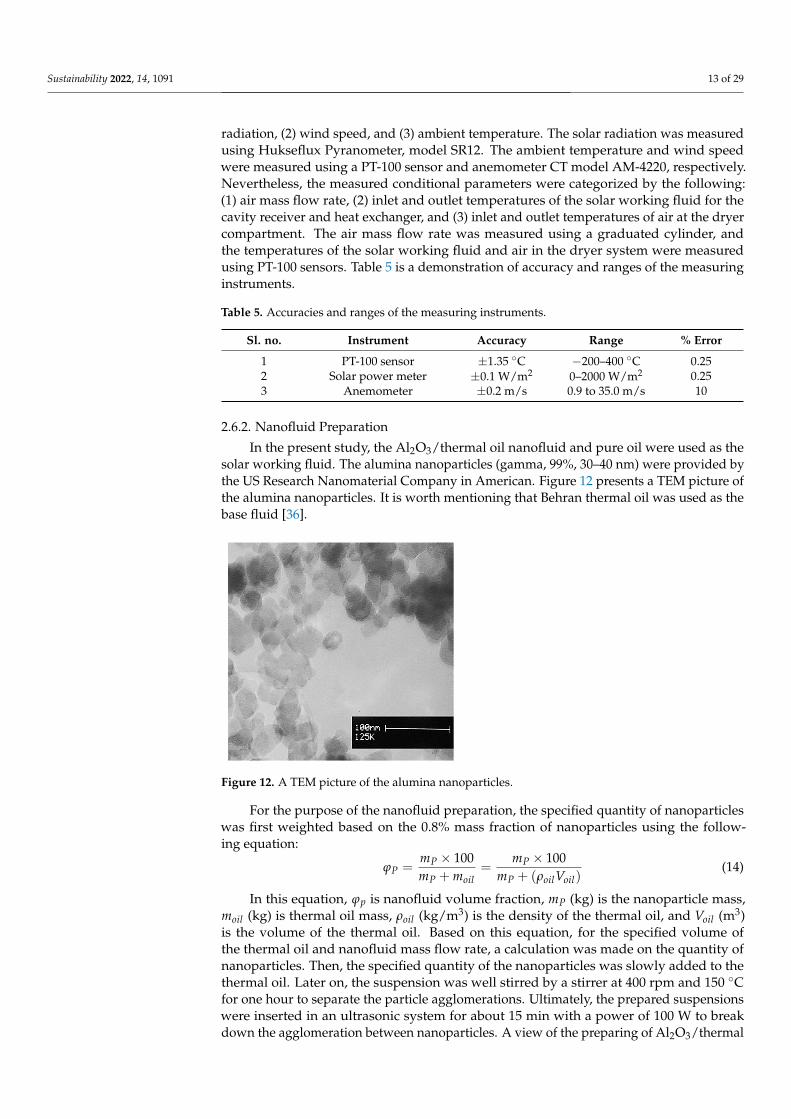
Another part of the indirect solar dryer system is the dryer system. Figure 11 dealswith the different parts of the solar dryer. The dryer system is composed of a fan forblowing air, a heat exchanger for transferring thermal energy from the solar working fluidto air, and a dryer compartment for carrying mint. The forced convection was used to passthe hot mass of air from the heat exchanger into the drying compartment. According to thepreviously reported papers, it was found that the highest required energy for mint dryingis 60 ◦C. The designed dryer system was assumed to be a thin-layer system with olive fruitdepth of 5 cm. The weight of the sample for each experimental test was assumed equal to50 gr. Dimensions of the dryer compartment were calculated with a length of 12 cm andwidth of 12.5 cm. A heat exchanger was used for transferring absorbed heat from the solarworking fluid to the air for drying, with a cross-section of 33 × 34 cm2 and copper tubelength of 0.33 m with the triangular arrangement.
Sustainability 2021, 13, x FOR PEER REVIEW 12 of 29
Number of tube turns at the cavity height 14 Diameter of the cavity inner tube 10 mm
(a) (b)
Figure 10. A view of the solar system: (a) the dish concentrator, and (b) the cylindrical cavity re-ceiver.
Another part of the indirect solar dryer system is the dryer system. Figure 11 deals with the different parts of the solar dryer. The dryer system is composed of a fan for blowing air, a heat exchanger for transferring thermal energy from the solar working fluid to air, and a dryer compartment for carrying mint. The forced convection was used to pass the hot mass of air from the heat exchanger into the drying compartment. Ac-cording to the previously reported papers, it was found that the highest required energy for mint drying is 60 °C. The designed dryer system was assumed to be a thin-layer sys-tem with olive fruit depth of 5 cm. The weight of the sample for each experimental test was assumed equal to 50 gr. Dimensions of the dryer compartment were calculated with a length of 12 cm and width of 12.5 cm. A heat exchanger was used for transferring ab-sorbed heat from the solar working fluid to the air for drying, with a cross-section of 33 × 34 cm2 and copper tube length of 0.33 m with the triangular arrangement.
Figure 11. The solar dryer system.
Various operational and environmental parameters were measured during the ex-perimental tests. The measured operational parameters included the following: (1) solar radiation, (2) wind speed, and (3) ambient temperature. The solar radiation was meas-ured using Hukseflux Pyranometer, model SR12. The ambient temperature and wind
Figure 11. The solar dryer system.
Various operational and environmental parameters were measured during the ex-perimental tests. The measured operational parameters included the following: (1) solar
Sustainability 2022, 14, 1091 13 of 29
radiation, (2) wind speed, and (3) ambient temperature. The solar radiation was measuredusing Hukseflux Pyranometer, model SR12. The ambient temperature and wind speedwere measured using a PT-100 sensor and anemometer CT model AM-4220, respectively.Nevertheless, the measured conditional parameters were categorized by the following:(1) air mass flow rate, (2) inlet and outlet temperatures of the solar working fluid for thecavity receiver and heat exchanger, and (3) inlet and outlet temperatures of air at the dryercompartment. The air mass flow rate was measured using a graduated cylinder, andthe temperatures of the solar working fluid and air in the dryer system were measuredusing PT-100 sensors. Table 5 is a demonstration of accuracy and ranges of the measuringinstruments.
Table 5. Accuracies and ranges of the measuring instruments.
Sl. no. Instrument Accuracy Range % Error
1 PT-100 sensor ±1.35 ◦C −200–400 ◦C 0.252 Solar power meter ±0.1 W/m2 0–2000 W/m2 0.253 Anemometer ±0.2 m/s 0.9 to 35.0 m/s 10
2.6.2. Nanofluid Preparation
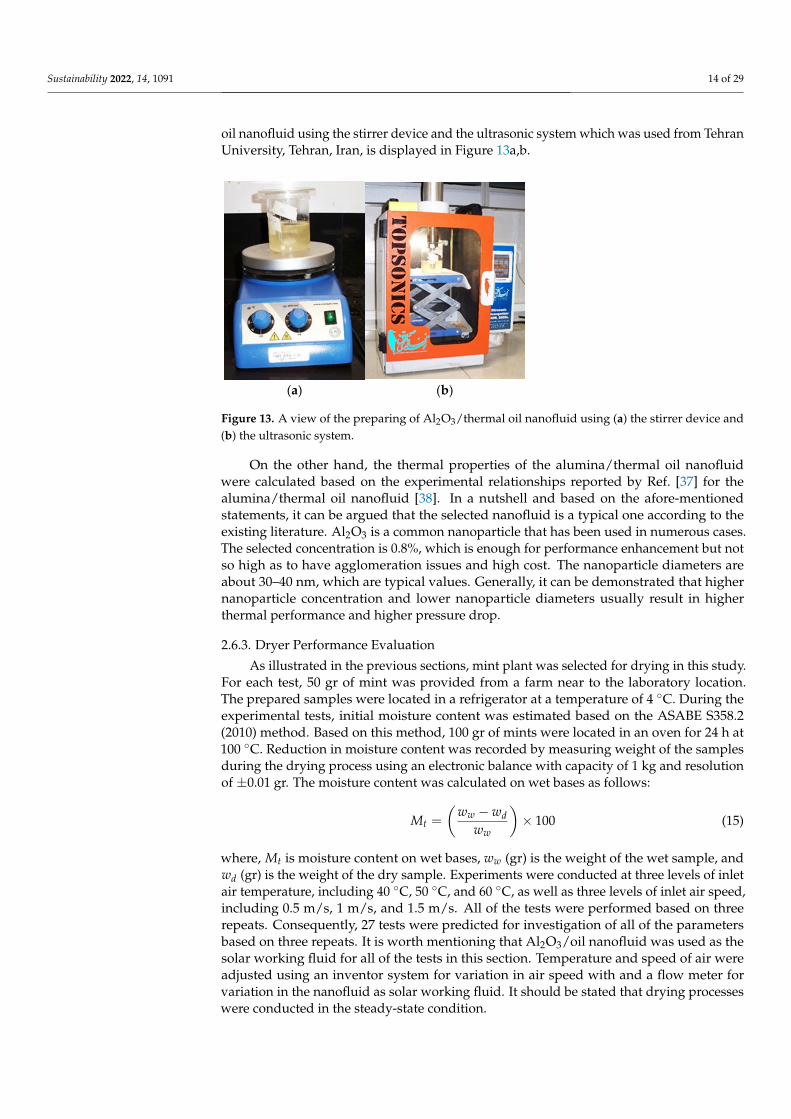
In the present study, the Al2O3/thermal oil nanofluid and pure oil were used as thesolar working fluid. The alumina nanoparticles (gamma, 99%, 30–40 nm) were provided bythe US Research Nanomaterial Company in American. Figure 12 presents a TEM picture ofthe alumina nanoparticles. It is worth mentioning that Behran thermal oil was used as thebase fluid [36].
Sustainability 2021, 13, x FOR PEER REVIEW 13 of 29
speed were measured using a PT-100 sensor and anemometer CT model AM-4220, re-spectively. Nevertheless, the measured conditional parameters were categorized by the following: (1) air mass flow rate, (2) inlet and outlet temperatures of the solar working fluid for the cavity receiver and heat exchanger, and (3) inlet and outlet temperatures of air at the dryer compartment. The air mass flow rate was measured using a graduated cylinder, and the temperatures of the solar working fluid and air in the dryer system were measured using PT-100 sensors. Table 5 is a demonstration of accuracy and ranges of the measuring instruments.
Table 5. Accuracies and ranges of the measuring instruments.
Sl. no. Instrument Accuracy Range % Error 1 PT-100 sensor ±1.35 °C −200–400 °C 0.25
2 Solar power me-ter
±0.1 W/m2 0–2000 W/m2 0.25
3 Anemometer ±0.2 m/s 0.9 to 35.0 m/s 10
2.6.2. Nanofluid Preparation In the present study, the Al2O3/thermal oil nanofluid and pure oil were used as the
solar working fluid. The alumina nanoparticles (gamma, 99%, 30–40 nm) were provided by the US Research Nanomaterial Company in American. Figure 12 presents a TEM pic-ture of the alumina nanoparticles. It is worth mentioning that Behran thermal oil was used as the base fluid [36].
Figure 12. A TEM picture of the alumina nanoparticles.
For the purpose of the nanofluid preparation, the specified quantity of nanoparticles was first weighted based on the 0.8% mass fraction of nanoparticles using the following equation: 𝜑 = 𝑚 × 100𝑚 +𝑚 = 𝑚 × 100𝑚 + (𝜌 𝑉 ) (14)
In this equation, 𝜑 is nanofluid volume fraction, 𝑚 (kg) is the nanoparticle mass, 𝑚 (kg) is thermal oil mass, 𝜌 (kg/m3) is the density of the thermal oil, and 𝑉 (m3) is the volume of the thermal oil. Based on this equation, for the specified volume of the thermal oil and nanofluid mass flow rate, a calculation was made on the quantity of na-noparticles. Then, the specified quantity of the nanoparticles was slowly added to the thermal oil. Later on, the suspension was well stirred by a stirrer at 400 rpm and 150 °C for one hour to separate the particle agglomerations. Ultimately, the prepared suspen-sions were inserted in an ultrasonic system for about 15 min with a power of 100 W to break down the agglomeration between nanoparticles. A view of the preparing of
Figure 12. A TEM picture of the alumina nanoparticles.
For the purpose of the nanofluid preparation, the specified quantity of nanoparticleswas first weighted based on the 0.8% mass fraction of nanoparticles using the follow-ing equation:
ϕP =mP × 100mP + moil
=mP × 100
mP + (ρoilVoil)(14)
In this equation, ϕp is nanofluid volume fraction, mP (kg) is the nanoparticle mass,moil (kg) is thermal oil mass, ρoil (kg/m3) is the density of the thermal oil, and Voil (m3)is the volume of the thermal oil. Based on this equation, for the specified volume ofthe thermal oil and nanofluid mass flow rate, a calculation was made on the quantity ofnanoparticles. Then, the specified quantity of the nanoparticles was slowly added to thethermal oil. Later on, the suspension was well stirred by a stirrer at 400 rpm and 150 ◦Cfor one hour to separate the particle agglomerations. Ultimately, the prepared suspensionswere inserted in an ultrasonic system for about 15 min with a power of 100 W to breakdown the agglomeration between nanoparticles. A view of the preparing of Al2O3/thermal
Sustainability 2022, 14, 1091 14 of 29
oil nanofluid using the stirrer device and the ultrasonic system which was used from TehranUniversity, Tehran, Iran, is displayed in Figure 13a,b.
Sustainability 2021, 13, x FOR PEER REVIEW 14 of 29
Al2O3/thermal oil nanofluid using the stirrer device and the ultrasonic system which was used from Tehran University, Tehran, Iran, is displayed in Figure 13a,b.
On the other hand, the thermal properties of the alumina/thermal oil nanofluid were calculated based on the experimental relationships reported by Ref. [37] for the alu-mina/thermal oil nanofluid [38]. In a nutshell and based on the afore-mentioned state-ments, it can be argued that the selected nanofluid is a typical one according to the exist-ing literature. Al2O3 is a common nanoparticle that has been used in numerous cases. The selected concentration is 0.8%, which is enough for performance enhancement but not so high as to have agglomeration issues and high cost. The nanoparticle diameters are about 30–40 nm, which are typical values. Generally, it can be demonstrated that higher nano-particle concentration and lower nanoparticle diameters usually result in higher thermal performance and higher pressure drop.
(a) (b)
Figure 13. A view of the preparing of Al2O3/thermal oil nanofluid using (a) the stirrer device and (b) the ultrasonic system.
2.6.3. Dryer Performance Evaluation As illustrated in the previous sections, mint plant was selected for drying in this
study. For each test, 50 gr of mint was provided from a farm near to the laboratory loca-tion. The prepared samples were located in a refrigerator at a temperature of 4 °C. During the experimental tests, initial moisture content was estimated based on the ASABE S358.2 (2010) method. Based on this method, 100 gr of mints were located in an oven for 24 h at 100 °C. Reduction in moisture content was recorded by measuring weight of the samples during the drying process using an electronic balance with capacity of 1 kg and resolu-tion of ±0.01 gr. The moisture content was calculated on wet bases as follows: 𝑀 = (𝑤 − 𝑤𝑤 ) × 100 (15)
where, 𝑀 is moisture content on wet bases, 𝑤 (gr) is the weight of the wet sample, and 𝑤 (gr) is the weight of the dry sample. Experiments were conducted at three levels of inlet air temperature, including 40 °C, 50 °C, and 60 °C, as well as three levels of inlet air speed, including 0.5 m/s, 1 m/s, and 1.5 m/s. All of the tests were performed based on three repeats. Consequently, 27 tests were predicted for investigation of all of the param-eters based on three repeats. It is worth mentioning that Al2O3/oil nanofluid was used as the solar working fluid for all of the tests in this section. Temperature and speed of air were adjusted using an inventor system for variation in air speed with and a flow meter for variation in the nanofluid as solar working fluid. It should be stated that drying pro-cesses were conducted in the steady-state condition.
Figure 13. A view of the preparing of Al2O3/thermal oil nanofluid using (a) the stirrer device and(b) the ultrasonic system.
On the other hand, the thermal properties of the alumina/thermal oil nanofluidwere calculated based on the experimental relationships reported by Ref. [37] for thealumina/thermal oil nanofluid [38]. In a nutshell and based on the afore-mentionedstatements, it can be argued that the selected nanofluid is a typical one according to theexisting literature. Al2O3 is a common nanoparticle that has been used in numerous cases.The selected concentration is 0.8%, which is enough for performance enhancement but notso high as to have agglomeration issues and high cost. The nanoparticle diameters areabout 30–40 nm, which are typical values. Generally, it can be demonstrated that highernanoparticle concentration and lower nanoparticle diameters usually result in higherthermal performance and higher pressure drop.
2.6.3. Dryer Performance Evaluation
As illustrated in the previous sections, mint plant was selected for drying in this study.For each test, 50 gr of mint was provided from a farm near to the laboratory location.The prepared samples were located in a refrigerator at a temperature of 4 ◦C. During theexperimental tests, initial moisture content was estimated based on the ASABE S358.2(2010) method. Based on this method, 100 gr of mints were located in an oven for 24 h at100 ◦C. Reduction in moisture content was recorded by measuring weight of the samplesduring the drying process using an electronic balance with capacity of 1 kg and resolutionof ±0.01 gr. The moisture content was calculated on wet bases as follows:
Mt =
(ww − wd
ww
)× 100 (15)
where, Mt is moisture content on wet bases, ww (gr) is the weight of the wet sample, andwd (gr) is the weight of the dry sample. Experiments were conducted at three levels of inletair temperature, including 40 ◦C, 50 ◦C, and 60 ◦C, as well as three levels of inlet air speed,including 0.5 m/s, 1 m/s, and 1.5 m/s. All of the tests were performed based on threerepeats. Consequently, 27 tests were predicted for investigation of all of the parametersbased on three repeats. It is worth mentioning that Al2O3/oil nanofluid was used as thesolar working fluid for all of the tests in this section. Temperature and speed of air wereadjusted using an inventor system for variation in air speed with and a flow meter forvariation in the nanofluid as solar working fluid. It should be stated that drying processeswere conducted in the steady-state condition.
Sustainability 2022, 14, 1091 15 of 29
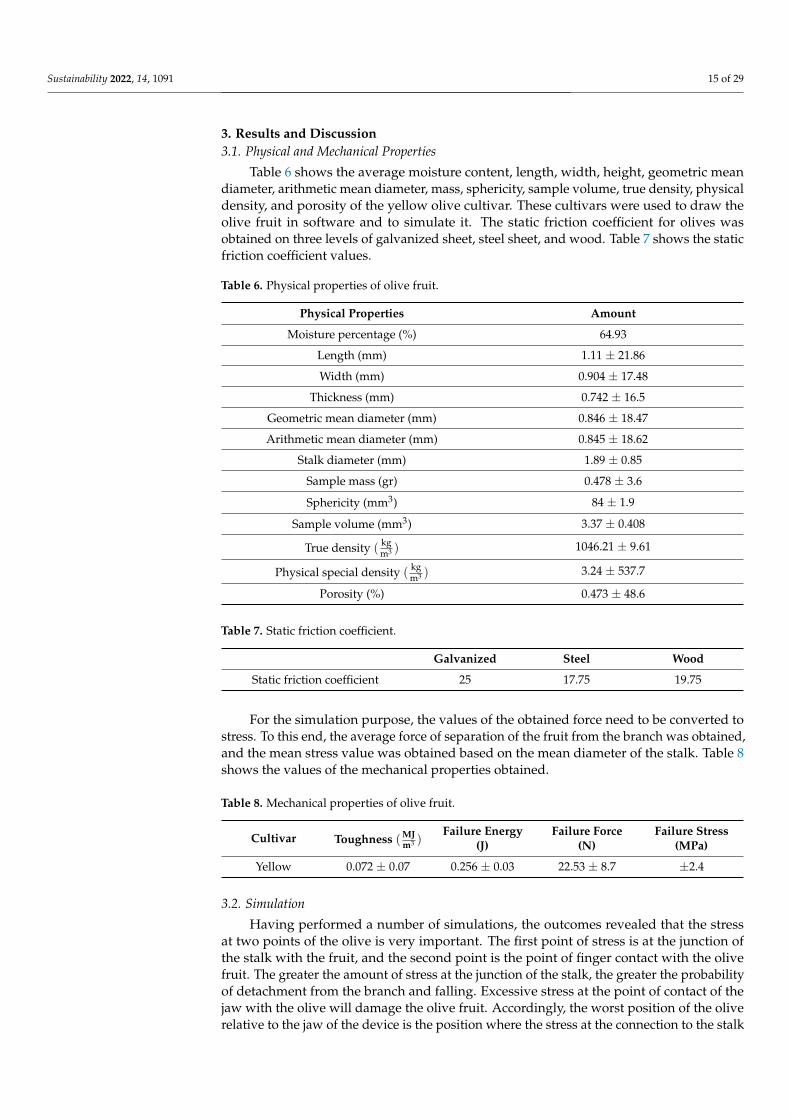
3. Results and Discussion3.1. Physical and Mechanical Properties
Table 6 shows the average moisture content, length, width, height, geometric meandiameter, arithmetic mean diameter, mass, sphericity, sample volume, true density, physicaldensity, and porosity of the yellow olive cultivar. These cultivars were used to draw theolive fruit in software and to simulate it. The static friction coefficient for olives wasobtained on three levels of galvanized sheet, steel sheet, and wood. Table 7 shows the staticfriction coefficient values.
Table 6. Physical properties of olive fruit.
Physical Properties Amount
Moisture percentage (%) 64.93
Length (mm) 1.11 ± 21.86
Width (mm) 0.904 ± 17.48
Thickness (mm) 0.742 ± 16.5
Geometric mean diameter (mm) 0.846 ± 18.47
Arithmetic mean diameter (mm) 0.845 ± 18.62
Stalk diameter (mm) 1.89 ± 0.85
Sample mass (gr) 0.478 ± 3.6
Sphericity (mm3) 84 ± 1.9
Sample volume (mm3) 3.37 ± 0.408
True density (kgm3 ) 1046.21 ± 9.61
Physical special density (kgm3 ) 3.24 ± 537.7
Porosity (%) 0.473 ± 48.6
Table 7. Static friction coefficient.
Galvanized Steel Wood
Static friction coefficient 25 17.75 19.75
For the simulation purpose, the values of the obtained force need to be converted tostress. To this end, the average force of separation of the fruit from the branch was obtained,and the mean stress value was obtained based on the mean diameter of the stalk. Table 8shows the values of the mechanical properties obtained.
Table 8. Mechanical properties of olive fruit.
Cultivar Toughness (MJm3 )
Failure Energy(J)
Failure Force(N)
Failure Stress(MPa)
Yellow 0.072 ± 0.07 0.256 ± 0.03 22.53 ± 8.7 ±2.4
3.2. Simulation
Having performed a number of simulations, the outcomes revealed that the stressat two points of the olive is very important. The first point of stress is at the junction ofthe stalk with the fruit, and the second point is the point of finger contact with the olivefruit. The greater the amount of stress at the junction of the stalk, the greater the probabilityof detachment from the branch and falling. Excessive stress at the point of contact of thejaw with the olive will damage the olive fruit. Accordingly, the worst position of the oliverelative to the jaw of the device is the position where the stress at the connection to the stalk
Sustainability 2022, 14, 1091 16 of 29
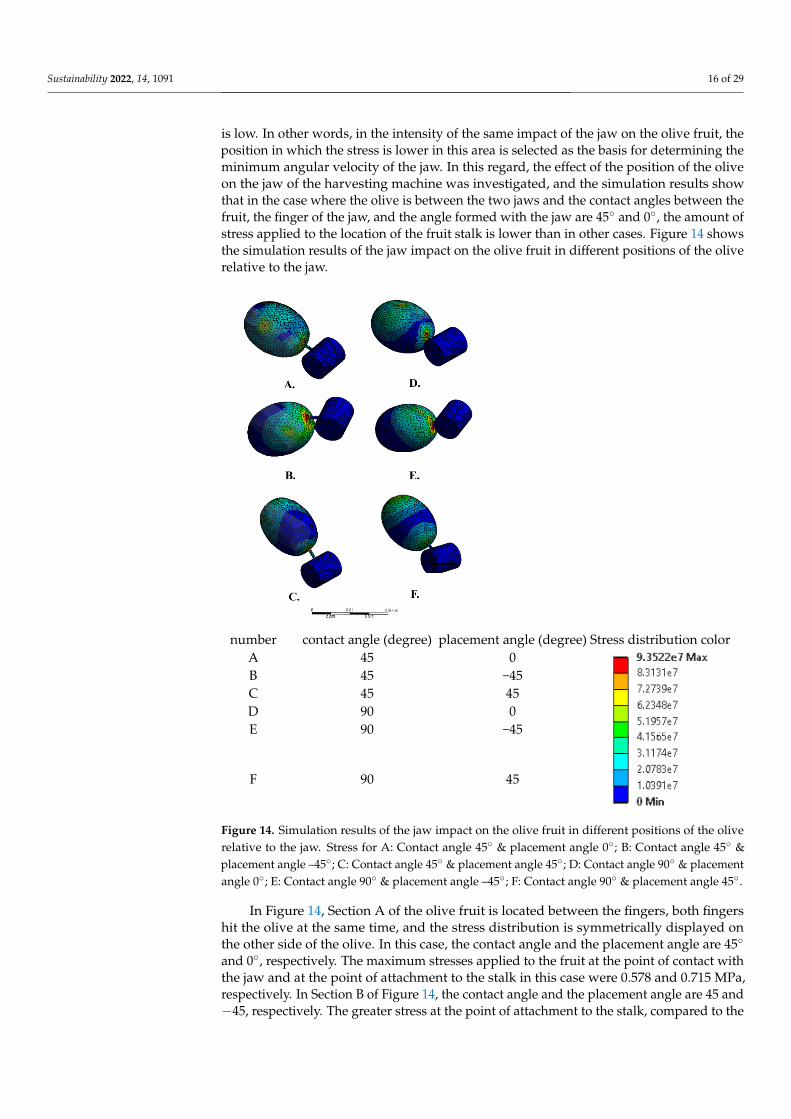
is low. In other words, in the intensity of the same impact of the jaw on the olive fruit, theposition in which the stress is lower in this area is selected as the basis for determining theminimum angular velocity of the jaw. In this regard, the effect of the position of the oliveon the jaw of the harvesting machine was investigated, and the simulation results showthat in the case where the olive is between the two jaws and the contact angles between thefruit, the finger of the jaw, and the angle formed with the jaw are 45◦ and 0◦, the amount ofstress applied to the location of the fruit stalk is lower than in other cases. Figure 14 showsthe simulation results of the jaw impact on the olive fruit in different positions of the oliverelative to the jaw.
Sustainability 2021, 13, x FOR PEER REVIEW 16 of 29
determining the minimum angular velocity of the jaw. In this regard, the effect of the position of the olive on the jaw of the harvesting machine was investigated, and the sim-ulation results show that in the case where the olive is between the two jaws and the contact angles between the fruit, the finger of the jaw, and the angle formed with the jaw are 45° and 0°, the amount of stress applied to the location of the fruit stalk is lower than in other cases. Figure 14 shows the simulation results of the jaw impact on the olive fruit in different positions of the olive relative to the jaw.
In figure 14, Section A of the olive fruit is located between the fingers, both fingers hit the olive at the same time, and the stress distribution is symmetrically displayed on the other side of the olive. In this case, the contact angle and the placement angle are 45° and 0°, respectively. The maximum stresses applied to the fruit at the point of contact with the jaw and at the point of attachment to the stalk in this case were 0.578 and 0.715 MPa, respectively. In Section B of Figure 14, the contact angle and the placement angle are 45 and −45, respectively. The greater stress at the point of attachment to the stalk, compared to the stress at the point of finger contact with the fruit, is quite evident, and these stresses are equal to 1.06 MPa and 0.707 MPa, respectively.
number contact angle (degree) placement angle (degree) Stress distribution color
A 45 0
B 45 −45 C 45 45 D 90 0 E 90 −45
F 90 45
Figure 14. Simulation results of the jaw impact on the olive fruit in different positions of the olive relative to the jaw. Stress for A: Contact angle 45° & placement angle 0°; B: Contact angle 45° & placement angle –45°; C: Contact angle 45° & placement angle 45°; D: Contact angle 90° & placement angle 0°; E: Contact angle 90° & placement angle –45°; F: Contact angle 90° & placement angle 45°.
Figure 14. Simulation results of the jaw impact on the olive fruit in different positions of the oliverelative to the jaw. Stress for A: Contact angle 45◦ & placement angle 0◦; B: Contact angle 45◦ &placement angle –45◦; C: Contact angle 45◦ & placement angle 45◦; D: Contact angle 90◦ & placementangle 0◦; E: Contact angle 90◦ & placement angle –45◦; F: Contact angle 90◦ & placement angle 45◦.
In Figure 14, Section A of the olive fruit is located between the fingers, both fingershit the olive at the same time, and the stress distribution is symmetrically displayed onthe other side of the olive. In this case, the contact angle and the placement angle are 45◦
and 0◦, respectively. The maximum stresses applied to the fruit at the point of contact withthe jaw and at the point of attachment to the stalk in this case were 0.578 and 0.715 MPa,respectively. In Section B of Figure 14, the contact angle and the placement angle are 45 and−45, respectively. The greater stress at the point of attachment to the stalk, compared to the
Sustainability 2022, 14, 1091 17 of 29
stress at the point of finger contact with the fruit, is quite evident, and these stresses areequal to 1.06 MPa and 0.707 MPa, respectively.
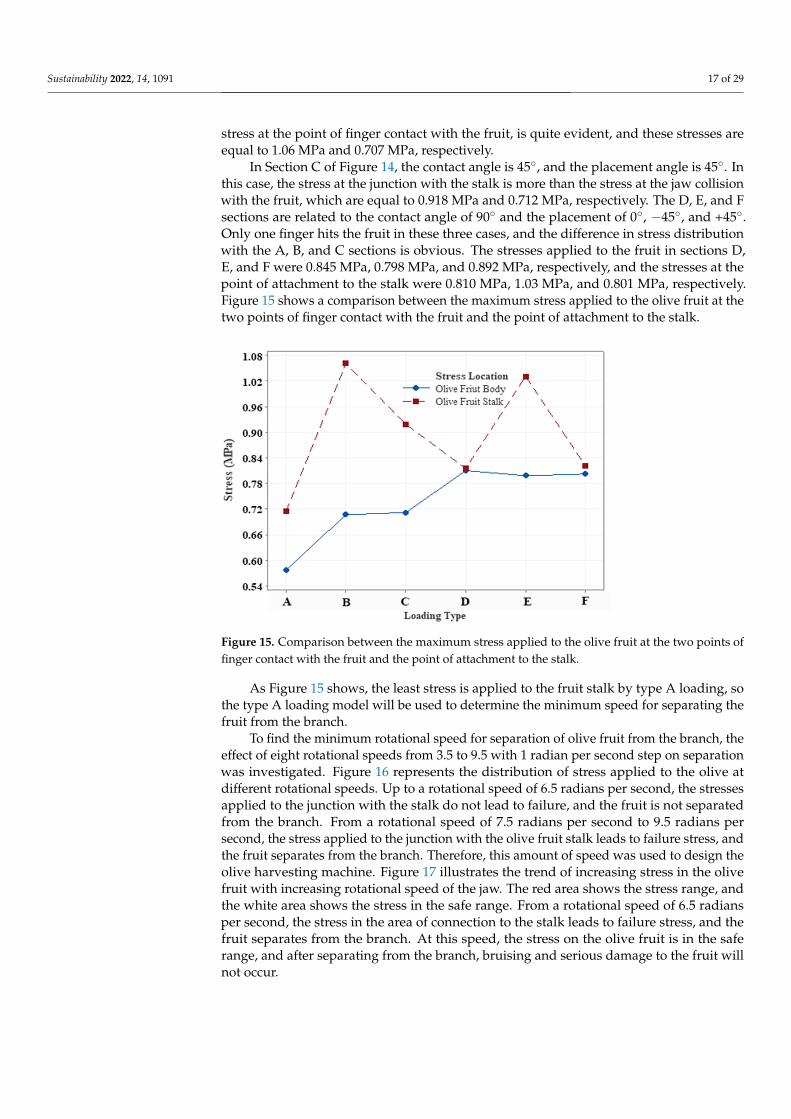
In Section C of Figure 14, the contact angle is 45◦, and the placement angle is 45◦. Inthis case, the stress at the junction with the stalk is more than the stress at the jaw collisionwith the fruit, which are equal to 0.918 MPa and 0.712 MPa, respectively. The D, E, and Fsections are related to the contact angle of 90◦ and the placement of 0◦, −45◦, and +45◦.Only one finger hits the fruit in these three cases, and the difference in stress distributionwith the A, B, and C sections is obvious. The stresses applied to the fruit in sections D,E, and F were 0.845 MPa, 0.798 MPa, and 0.892 MPa, respectively, and the stresses at thepoint of attachment to the stalk were 0.810 MPa, 1.03 MPa, and 0.801 MPa, respectively.Figure 15 shows a comparison between the maximum stress applied to the olive fruit at thetwo points of finger contact with the fruit and the point of attachment to the stalk.
Sustainability 2021, 13, x FOR PEER REVIEW 17 of 29
In Section C of Figure 14, the contact angle is 45 °, and the placement angle is 45 °. In this case, the stress at the junction with the stalk is more than the stress at the jaw collision with the fruit, which are equal to 0.918 MPa and 0.712 MPa, respectively. The D, E, and F sections are related to the contact angle of 90° and the placement of 0°, −45°, and +45°. Only one finger hits the fruit in these three cases, and the difference in stress distribution with the A, B, and C sections is obvious. The stresses applied to the fruit in sections D, E, and F were 0.845 MPa, 0.798 MPa, and 0.892 MPa, respectively, and the stresses at the point of attachment to the stalk were 0.810 MPa, 1.03 MPa, and 0.801 MPa, respectively. Figure 15 shows a comparison between the maximum stress applied to the olive fruit at the two points of finger contact with the fruit and the point of attachment to the stalk.
Figure 15. Comparison between the maximum stress applied to the olive fruit at the two points of finger contact with the fruit and the point of attachment to the stalk.
As Figure 15 shows, the least stress is applied to the fruit stalk by type A loading, so the type A loading model will be used to determine the minimum speed for separating the fruit from the branch.
To find the minimum rotational speed for separation of olive fruit from the branch, the effect of eight rotational speeds from 3.5 to 9.5 with 1 radian per second step on sep-aration was investigated. Figure 16 represents the distribution of stress applied to the olive at different rotational speeds. Up to a rotational speed of 6.5 radians per second, the stresses applied to the junction with the stalk do not lead to failure, and the fruit is not separated from the branch. From a rotational speed of 7.5 radians per second to 9.5 radians per second, the stress applied to the junction with the olive fruit stalk leads to failure stress, and the fruit separates from the branch. Therefore, this amount of speed was used to design the olive harvesting machine. Figure 17 illustrates the trend of in-creasing stress in the olive fruit with increasing rotational speed of the jaw. The red area shows the stress range, and the white area shows the stress in the safe range. From a rotational speed of 6.5 radians per second, the stress in the area of connection to the stalk leads to failure stress, and the fruit separates from the branch. At this speed, the stress on the olive fruit is in the safe range, and after separating from the branch, bruising and serious damage to the fruit will not occur.
Figure 15. Comparison between the maximum stress applied to the olive fruit at the two points offinger contact with the fruit and the point of attachment to the stalk.
As Figure 15 shows, the least stress is applied to the fruit stalk by type A loading, sothe type A loading model will be used to determine the minimum speed for separating thefruit from the branch.
To find the minimum rotational speed for separation of olive fruit from the branch, theeffect of eight rotational speeds from 3.5 to 9.5 with 1 radian per second step on separationwas investigated. Figure 16 represents the distribution of stress applied to the olive atdifferent rotational speeds. Up to a rotational speed of 6.5 radians per second, the stressesapplied to the junction with the stalk do not lead to failure, and the fruit is not separatedfrom the branch. From a rotational speed of 7.5 radians per second to 9.5 radians persecond, the stress applied to the junction with the olive fruit stalk leads to failure stress, andthe fruit separates from the branch. Therefore, this amount of speed was used to design theolive harvesting machine. Figure 17 illustrates the trend of increasing stress in the olivefruit with increasing rotational speed of the jaw. The red area shows the stress range, andthe white area shows the stress in the safe range. From a rotational speed of 6.5 radiansper second, the stress in the area of connection to the stalk leads to failure stress, and thefruit separates from the branch. At this speed, the stress on the olive fruit is in the saferange, and after separating from the branch, bruising and serious damage to the fruit willnot occur.
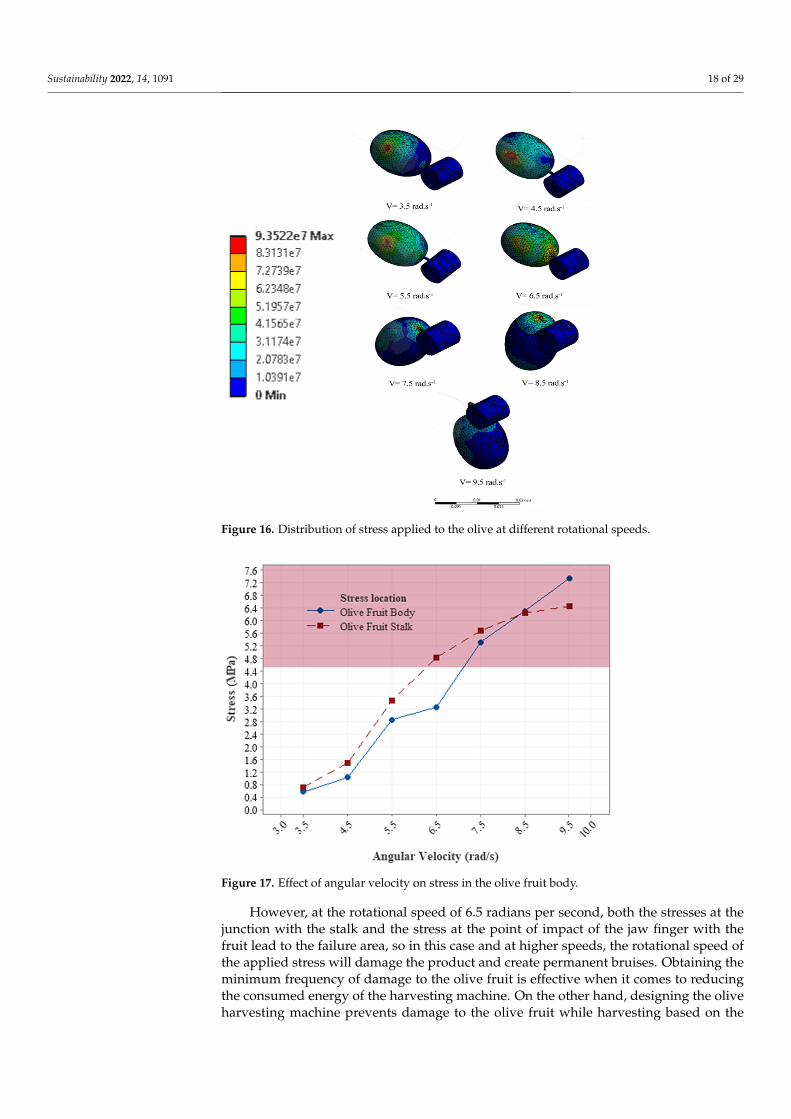
Sustainability 2022, 14, 1091 18 of 29Sustainability 2021, 13, x FOR PEER REVIEW 18 of 29
Figure 16. Distribution of stress applied to the olive at different rotational speeds.
However, at the rotational speed of 6.5 radians per second, both the stresses at the junction with the stalk and the stress at the point of impact of the jaw finger with the fruit lead to the failure area, so in this case and at higher speeds, the rotational speed of the applied stress will damage the product and create permanent bruises. Obtaining the min-imum frequency of damage to the olive fruit is effective when it comes to reducing the consumed energy of the harvesting machine. On the other hand, designing the olive har-vesting machine prevents damage to the olive fruit while harvesting based on the mini-mum frequency of jaws. Therefore, simulation in these two contexts affected the design-ing.
Figure 17. Effect of angular velocity on stress in the olive fruit body.
Figure 16. Distribution of stress applied to the olive at different rotational speeds.
Sustainability 2021, 13, x FOR PEER REVIEW 18 of 29
Figure 16. Distribution of stress applied to the olive at different rotational speeds.
However, at the rotational speed of 6.5 radians per second, both the stresses at the junction with the stalk and the stress at the point of impact of the jaw finger with the fruit lead to the failure area, so in this case and at higher speeds, the rotational speed of the applied stress will damage the product and create permanent bruises. Obtaining the min-imum frequency of damage to the olive fruit is effective when it comes to reducing the consumed energy of the harvesting machine. On the other hand, designing the olive har-vesting machine prevents damage to the olive fruit while harvesting based on the mini-mum frequency of jaws. Therefore, simulation in these two contexts affected the design-ing.
Figure 17. Effect of angular velocity on stress in the olive fruit body. Figure 17. Effect of angular velocity on stress in the olive fruit body.
However, at the rotational speed of 6.5 radians per second, both the stresses at thejunction with the stalk and the stress at the point of impact of the jaw finger with thefruit lead to the failure area, so in this case and at higher speeds, the rotational speed ofthe applied stress will damage the product and create permanent bruises. Obtaining theminimum frequency of damage to the olive fruit is effective when it comes to reducingthe consumed energy of the harvesting machine. On the other hand, designing the oliveharvesting machine prevents damage to the olive fruit while harvesting based on the
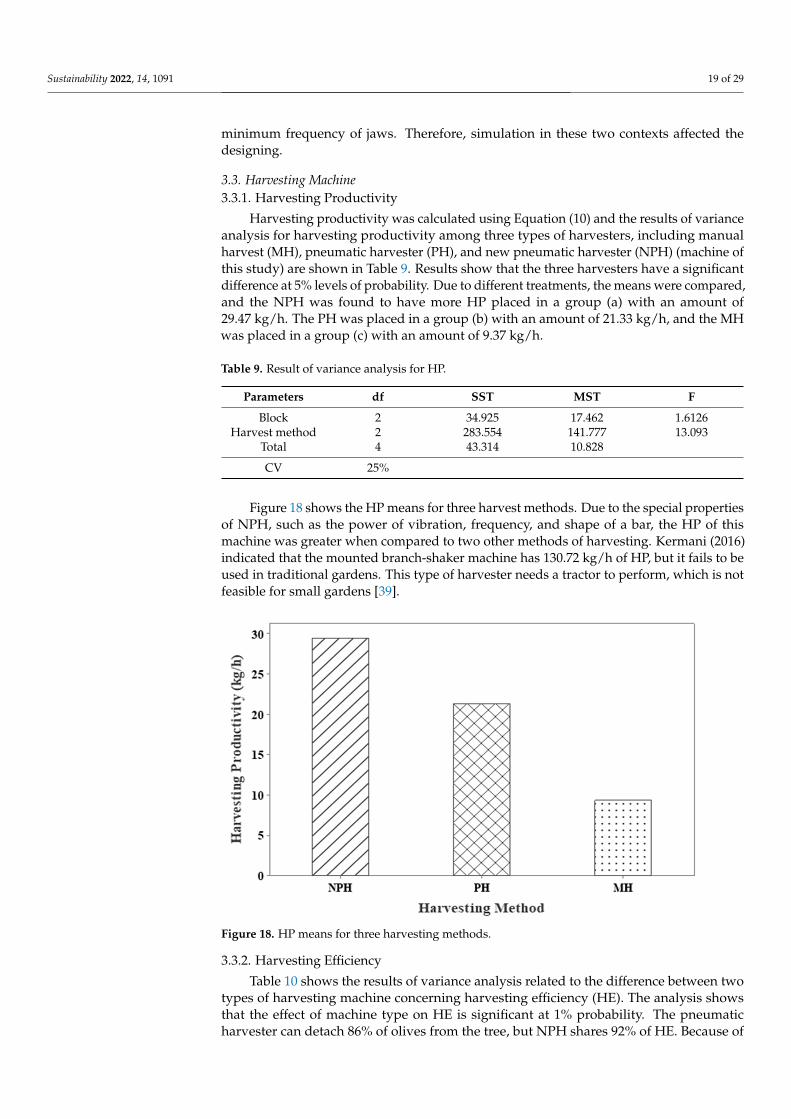
Sustainability 2022, 14, 1091 19 of 29
minimum frequency of jaws. Therefore, simulation in these two contexts affected thedesigning.
3.3. Harvesting Machine3.3.1. Harvesting Productivity
Harvesting productivity was calculated using Equation (10) and the results of varianceanalysis for harvesting productivity among three types of harvesters, including manualharvest (MH), pneumatic harvester (PH), and new pneumatic harvester (NPH) (machine ofthis study) are shown in Table 9. Results show that the three harvesters have a significantdifference at 5% levels of probability. Due to different treatments, the means were compared,and the NPH was found to have more HP placed in a group (a) with an amount of29.47 kg/h. The PH was placed in a group (b) with an amount of 21.33 kg/h, and the MHwas placed in a group (c) with an amount of 9.37 kg/h.
Table 9. Result of variance analysis for HP.
Parameters df SST MST F
Block 2 34.925 17.462 1.6126Harvest method 2 283.554 141.777 13.093
Total 4 43.314 10.828
CV 25%
Figure 18 shows the HP means for three harvest methods. Due to the special propertiesof NPH, such as the power of vibration, frequency, and shape of a bar, the HP of thismachine was greater when compared to two other methods of harvesting. Kermani (2016)indicated that the mounted branch-shaker machine has 130.72 kg/h of HP, but it fails to beused in traditional gardens. This type of harvester needs a tractor to perform, which is notfeasible for small gardens [39].
Sustainability 2021, 13, x FOR PEER REVIEW 19 of 29
3.3. Harvesting Machine 3.3.1. Harvesting Productivity
Harvesting productivity was calculated using Equation (10) and the results of vari-ance analysis for harvesting productivity among three types of harvesters, including manual harvest (MH), pneumatic harvester (PH), and new pneumatic harvester (NPH) (machine of this study) are shown in Table 9. Results show that the three harvesters have a significant difference at 5% levels of probability. Due to different treatments, the means were compared, and the NPH was found to have more HP placed in a group (a) with an amount of 29.47 kg/h. The PH was placed in a group (b) with an amount of 21.33 kg/h, and the MH was placed in a group (c) with an amount of 9.37 kg/h.
Table 9. Result of variance analysis for HP.
Parameters df SST MST F Block 2 34.925 17.462 1.6126
Harvest method 2 283.554 141.777 13.093 Total 4 43.314 10.828 CV 25%
Figure 18 shows the HP means for three harvest methods. Due to the special prop-erties of NPH, such as the power of vibration, frequency, and shape of a bar, the HP of this machine was greater when compared to two other methods of harvesting. Kermani (2016) indicated that the mounted branch-shaker machine has 130.72 kg/h of HP, but it fails to be used in traditional gardens. This type of harvester needs a tractor to perform, which is not feasible for small gardens [39].
Figure 18. HP means for three harvesting methods.
3.3.2. Harvesting Efficiency Table 10 shows the results of variance analysis related to the difference between two
types of harvesting machine concerning harvesting efficiency (HE). The analysis shows that the effect of machine type on HE is significant at 1% probability. The pneumatic harvester can detach 86% of olives from the tree, but NPH shares 92% of HE. Because of the availability of all olives on the tree, the HE of this method is considered as 100% for labor in the case of manual harvest (Figure 19). It is very important to understand how
Figure 18. HP means for three harvesting methods.
3.3.2. Harvesting Efficiency
Table 10 shows the results of variance analysis related to the difference between twotypes of harvesting machine concerning harvesting efficiency (HE). The analysis showsthat the effect of machine type on HE is significant at 1% probability. The pneumaticharvester can detach 86% of olives from the tree, but NPH shares 92% of HE. Because of
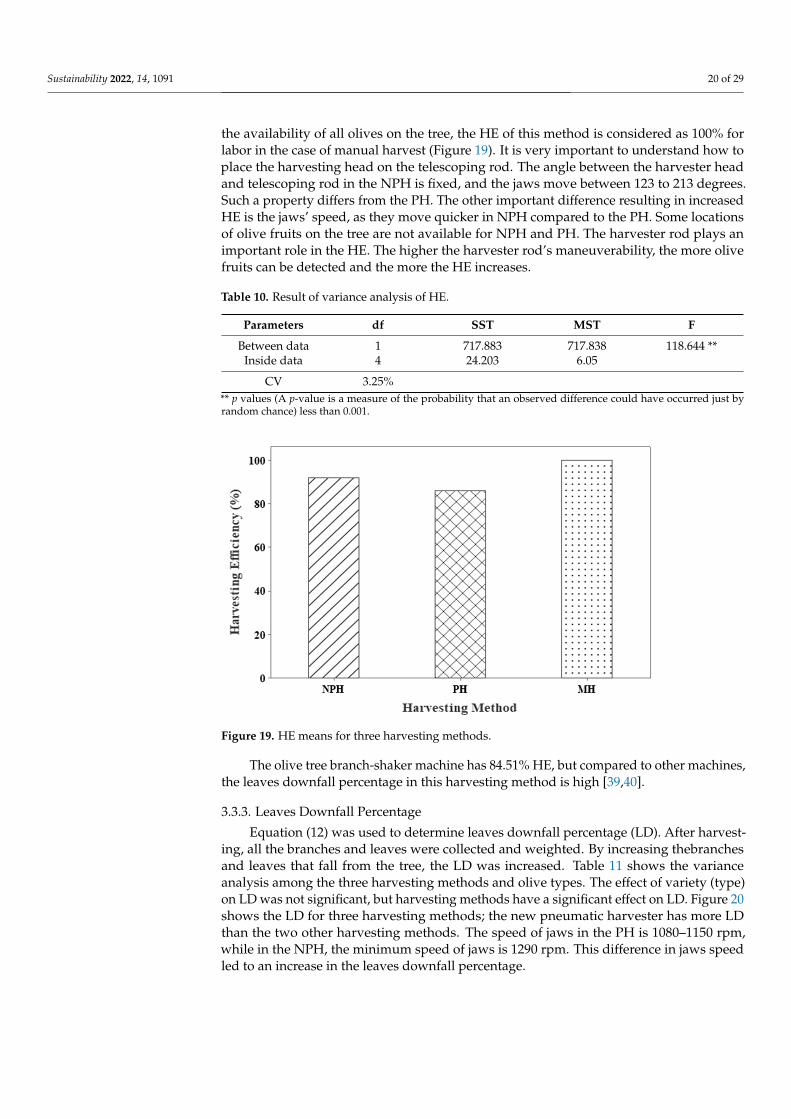
Sustainability 2022, 14, 1091 20 of 29
the availability of all olives on the tree, the HE of this method is considered as 100% forlabor in the case of manual harvest (Figure 19). It is very important to understand how toplace the harvesting head on the telescoping rod. The angle between the harvester headand telescoping rod in the NPH is fixed, and the jaws move between 123 to 213 degrees.Such a property differs from the PH. The other important difference resulting in increasedHE is the jaws’ speed, as they move quicker in NPH compared to the PH. Some locationsof olive fruits on the tree are not available for NPH and PH. The harvester rod plays animportant role in the HE. The higher the harvester rod’s maneuverability, the more olivefruits can be detected and the more the HE increases.
Table 10. Result of variance analysis of HE.
Parameters df SST MST F
Between data 1 717.883 717.838 118.644 **Inside data 4 24.203 6.05
CV 3.25%** p values (A p-value is a measure of the probability that an observed difference could have occurred just byrandom chance) less than 0.001.
Sustainability 2021, 13, x FOR PEER REVIEW 20 of 29
to place the harvesting head on the telescoping rod. The angle between the harvester head and telescoping rod in the NPH is fixed, and the jaws move between 123 to 213 degrees. Such a property differs from the PH. The other important difference resulting in increased HE is the jaws’ speed, as they move quicker in NPH compared to the PH. Some locations of olive fruits on the tree are not available for NPH and PH. The harvester rod plays an important role in the HE. The higher the harvester rod’s maneuverability, the more olive fruits can be detected and the more the HE increases.
Table 10. Result of variance analysis of HE.
Parameters df SST MST F Between data 1 717.883 717.838 118.644 **
Inside data 4 24.203 6.05 CV 3.25%
** p values ( A p-value is a measure of the probability that an observed difference could have occurred just by random chance) less than 0.001.
Figure 19. HE means for three harvesting methods.
The olive tree branch-shaker machine has 84.51% HE, but compared to other ma-chines, the leaves downfall percentage in this harvesting method is high [39,40].
3.3.3. Leaves Downfall Percentage Equation (12) was used to determine leaves downfall percentage (LD). After har-
vesting, all the branches and leaves were collected and weighted. By increasing the-branches and leaves that fall from the tree, the LD was increased. Table 11 shows the variance analysis among the three harvesting methods and olive types. The effect of va-riety (type) on LD was not significant, but harvesting methods have a significant effect on LD. Figure 20 shows the LD for three harvesting methods; the new pneumatic har-vester has more LD than the two other harvesting methods. The speed of jaws in the PH is 1080–1150 rpm, while in the NPH, the minimum speed of jaws is 1290 rpm. This dif-ference in jaws speed led to an increase in the leaves downfall percentage.
Figure 19. HE means for three harvesting methods.
The olive tree branch-shaker machine has 84.51% HE, but compared to other machines,the leaves downfall percentage in this harvesting method is high [39,40].
3.3.3. Leaves Downfall Percentage
Equation (12) was used to determine leaves downfall percentage (LD). After harvest-ing, all the branches and leaves were collected and weighted. By increasing thebranchesand leaves that fall from the tree, the LD was increased. Table 11 shows the varianceanalysis among the three harvesting methods and olive types. The effect of variety (type)on LD was not significant, but harvesting methods have a significant effect on LD. Figure 20shows the LD for three harvesting methods; the new pneumatic harvester has more LDthan the two other harvesting methods. The speed of jaws in the PH is 1080–1150 rpm,while in the NPH, the minimum speed of jaws is 1290 rpm. This difference in jaws speedled to an increase in the leaves downfall percentage.
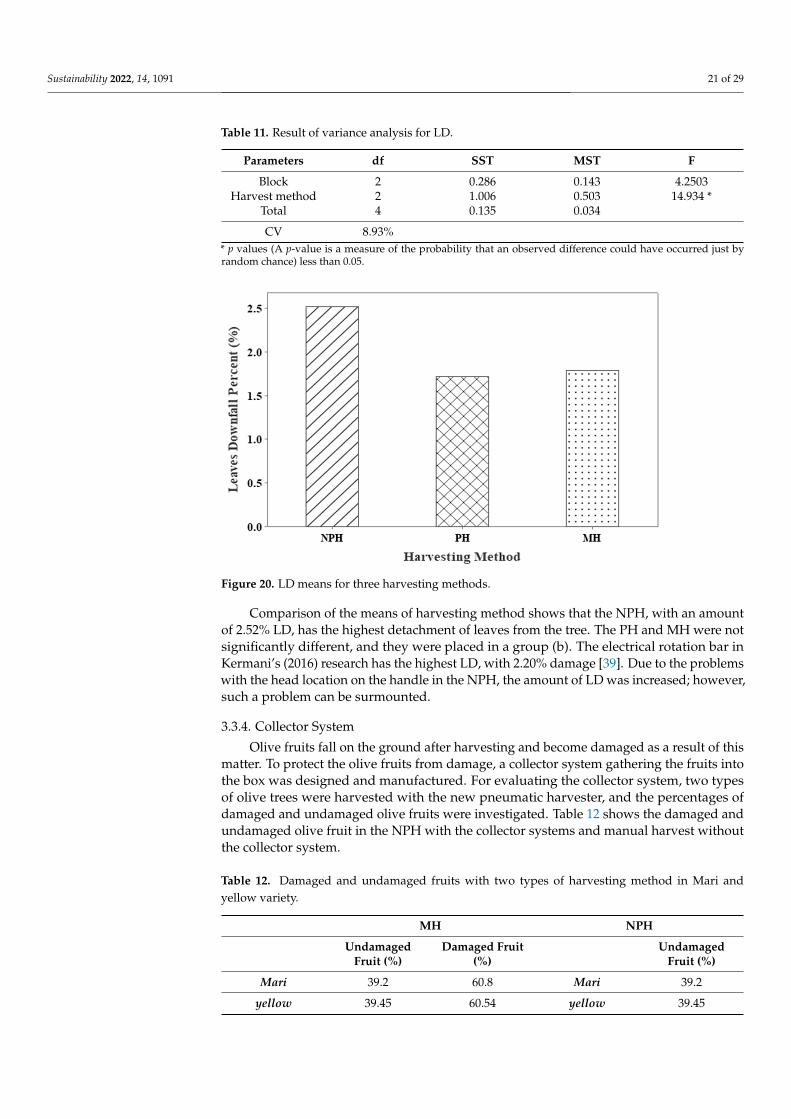
Sustainability 2022, 14, 1091 21 of 29
Table 11. Result of variance analysis for LD.
Parameters df SST MST F
Block 2 0.286 0.143 4.2503Harvest method 2 1.006 0.503 14.934 *
Total 4 0.135 0.034
CV 8.93%* p values (A p-value is a measure of the probability that an observed difference could have occurred just byrandom chance) less than 0.05.
Sustainability 2021, 13, x FOR PEER REVIEW 21 of 29
Table 11. Result of variance analysis for LD.
Parameters df SST MST F Block 2 0.286 0.143 4.2503
Harvest method 2 1.006 0.503 14.934 * Total 4 0.135 0.034 CV 8.93%
* p values ( A p-value is a measure of the probability that an observed difference could have oc-curred just by random chance) less than 0.05.
Figure 20. LD means for three harvesting methods.
Comparison of the means of harvesting method shows that the NPH, with an amount of 2.52% LD, has the highest detachment of leaves from the tree. The PH and MH were not significantly different, and they were placed in a group (b). The electrical rotation bar in Kermani’s (2016) research has the highest LD, with 2.20% damage [39]. Due to the problems with the head location on the handle in the NPH, the amount of LD was increased; however, such a problem can be surmounted.
3.3.4. Collector System Olive fruits fall on the ground after harvesting and become damaged as a result of
this matter. To protect the olive fruits from damage, a collector system gathering the fruits into the box was designed and manufactured. For evaluating the collector system, two types of olive trees were harvested with the new pneumatic harvester, and the per-centages of damaged and undamaged olive fruits were investigated. Table 12 shows the damaged and undamaged olive fruit in the NPH with the collector systems and manual harvest without the collector system.
Table 12. Damaged and undamaged fruits with two types of harvesting method in Mari and yel-low variety.
MH NPH
Undamaged Fruit (%)
Damaged Fruit (%)
Undamaged Fruit (%)
Mari 39.2 60.8 Mari 39.2 yellow 39.45 60.54 yellow 39.45
Figure 20. LD means for three harvesting methods.
Comparison of the means of harvesting method shows that the NPH, with an amountof 2.52% LD, has the highest detachment of leaves from the tree. The PH and MH were notsignificantly different, and they were placed in a group (b). The electrical rotation bar inKermani’s (2016) research has the highest LD, with 2.20% damage [39]. Due to the problemswith the head location on the handle in the NPH, the amount of LD was increased; however,such a problem can be surmounted.
3.3.4. Collector System
Olive fruits fall on the ground after harvesting and become damaged as a result of thismatter. To protect the olive fruits from damage, a collector system gathering the fruits intothe box was designed and manufactured. For evaluating the collector system, two typesof olive trees were harvested with the new pneumatic harvester, and the percentages ofdamaged and undamaged olive fruits were investigated. Table 12 shows the damaged andundamaged olive fruit in the NPH with the collector systems and manual harvest withoutthe collector system.
Table 12. Damaged and undamaged fruits with two types of harvesting method in Mari andyellow variety.
MH NPH
UndamagedFruit (%)
Damaged Fruit(%)
UndamagedFruit (%)
Mari 39.2 60.8 Mari 39.2
yellow 39.45 60.54 yellow 39.45
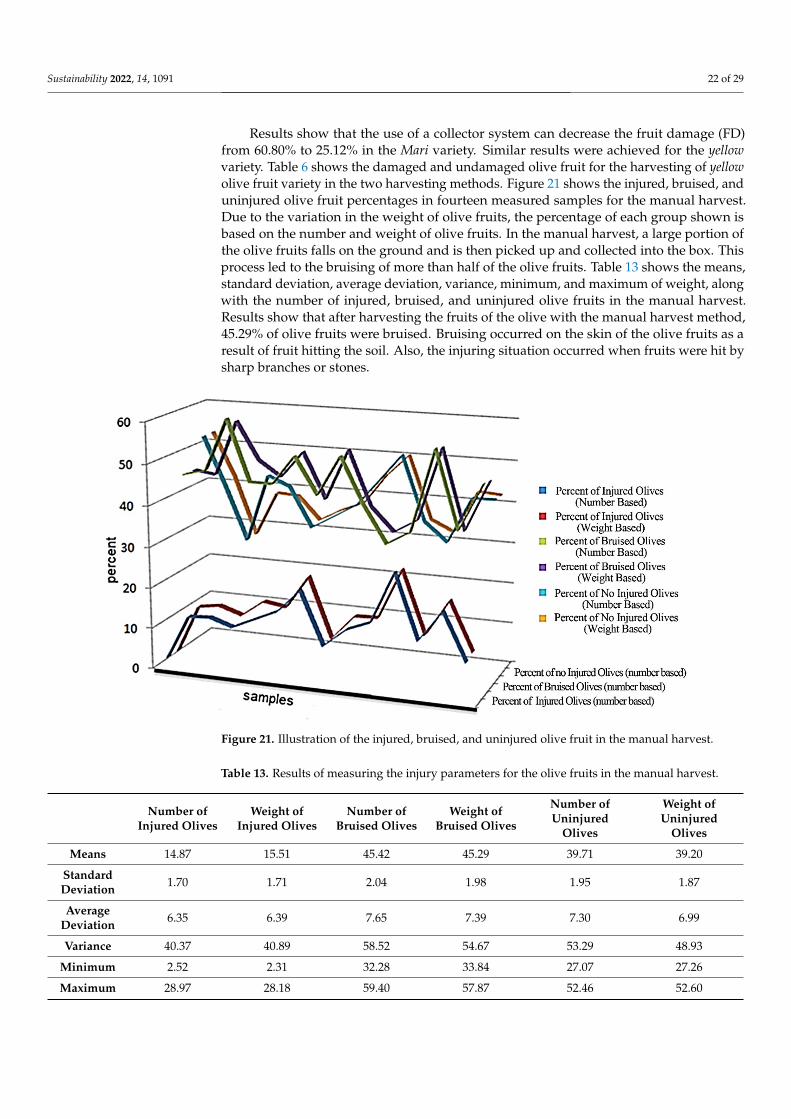
Sustainability 2022, 14, 1091 22 of 29
Results show that the use of a collector system can decrease the fruit damage (FD)from 60.80% to 25.12% in the Mari variety. Similar results were achieved for the yellowvariety. Table 6 shows the damaged and undamaged olive fruit for the harvesting of yellowolive fruit variety in the two harvesting methods. Figure 21 shows the injured, bruised, anduninjured olive fruit percentages in fourteen measured samples for the manual harvest.Due to the variation in the weight of olive fruits, the percentage of each group shown isbased on the number and weight of olive fruits. In the manual harvest, a large portion ofthe olive fruits falls on the ground and is then picked up and collected into the box. Thisprocess led to the bruising of more than half of the olive fruits. Table 13 shows the means,standard deviation, average deviation, variance, minimum, and maximum of weight, alongwith the number of injured, bruised, and uninjured olive fruits in the manual harvest.Results show that after harvesting the fruits of the olive with the manual harvest method,45.29% of olive fruits were bruised. Bruising occurred on the skin of the olive fruits as aresult of fruit hitting the soil. Also, the injuring situation occurred when fruits were hit bysharp branches or stones.
Sustainability 2021, 13, x FOR PEER REVIEW 22 of 29
Results show that the use of a collector system can decrease the fruit damage (FD) from 60.80% to 25.12% in the Mari variety. Similar results were achieved for the yellow variety. Table 6 shows the damaged and undamaged olive fruit for the harvesting of yellow olive fruit variety in the two harvesting methods. Figure 21 shows the injured, bruised, and uninjured olive fruit percentages in fourteen measured samples for the manual harvest. Due to the variation in the weight of olive fruits, the percentage of each group shown is based on the number and weight of olive fruits. In the manual harvest, a large portion of the olive fruits falls on the ground and is then picked up and collected into the box. This process led to the bruising of more than half of the olive fruits. Table 13 shows the means, standard deviation, average deviation, variance, minimum, and maximum of weight, along with the number of injured, bruised, and uninjured olive fruits in the manual harvest. Results show that after harvesting the fruits of the olive with the manual harvest method, 45.29% of olive fruits were bruised. Bruising occurred on the skin of the olive fruits as a result of fruit hitting the soil. Also, the injuring situation occurred when fruits were hit by sharp branches or stones.
Figure 21. Illustration of the injured, bruised, and uninjured olive fruit in the manual harvest.
Table 13. Results of measuring the injury parameters for the olive fruits in the manual harvest.
Number of
Injured Olives Weight of
Injured Olives Number of
Bruised Olives Weight of
Bruised Olives Number of
Uninjured Olives
Weight of Uninjured
Olives Means 14.87 15.51 45.42 45.29 39.71 39.20
Standard Deviation
1.70 1.71 2.04 1.98 1.95 1.87
Average Deviation
6.35 6.39 7.65 7.39 7.30 6.99
Variance 40.37 40.89 58.52 54.67 53.29 48.93 Minimum 2.52 2.31 32.28 33.84 27.07 27.26 Maximum 28.97 28.18 59.40 57.87 52.46 52.60
The percentages of injured, bruised, and uninjured olive fruits for NPH based on number and weight are shown in Figure 22. The results improved significantly. Most
Figure 21. Illustration of the injured, bruised, and uninjured olive fruit in the manual harvest.
Table 13. Results of measuring the injury parameters for the olive fruits in the manual harvest.
Number ofInjured Olives
Weight ofInjured Olives
Number ofBruised Olives
Weight ofBruised Olives
Number ofUninjured
Olives
Weight ofUninjured
Olives
Means 14.87 15.51 45.42 45.29 39.71 39.20
StandardDeviation 1.70 1.71 2.04 1.98 1.95 1.87
AverageDeviation 6.35 6.39 7.65 7.39 7.30 6.99
Variance 40.37 40.89 58.52 54.67 53.29 48.93
Minimum 2.52 2.31 32.28 33.84 27.07 27.26
Maximum 28.97 28.18 59.40 57.87 52.46 52.60
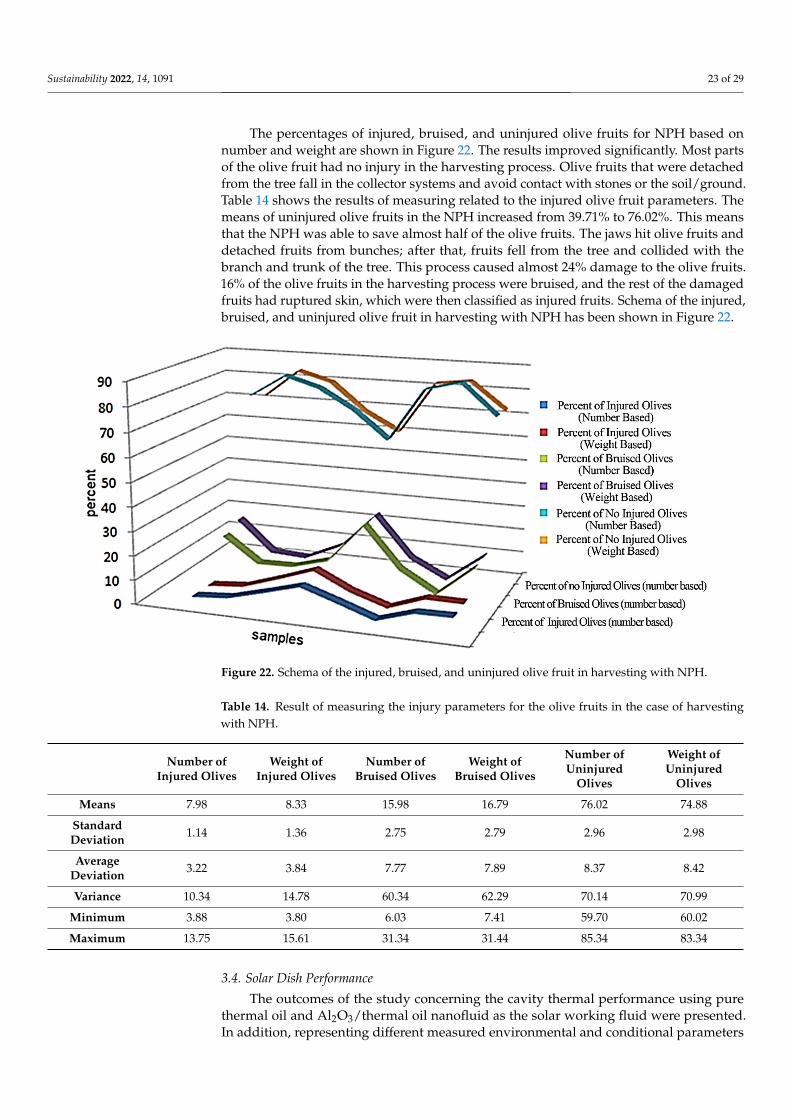
Sustainability 2022, 14, 1091 23 of 29
The percentages of injured, bruised, and uninjured olive fruits for NPH based onnumber and weight are shown in Figure 22. The results improved significantly. Most partsof the olive fruit had no injury in the harvesting process. Olive fruits that were detachedfrom the tree fall in the collector systems and avoid contact with stones or the soil/ground.Table 14 shows the results of measuring related to the injured olive fruit parameters. Themeans of uninjured olive fruits in the NPH increased from 39.71% to 76.02%. This meansthat the NPH was able to save almost half of the olive fruits. The jaws hit olive fruits anddetached fruits from bunches; after that, fruits fell from the tree and collided with thebranch and trunk of the tree. This process caused almost 24% damage to the olive fruits.16% of the olive fruits in the harvesting process were bruised, and the rest of the damagedfruits had ruptured skin, which were then classified as injured fruits. Schema of the injured,bruised, and uninjured olive fruit in harvesting with NPH has been shown in Figure 22.
Sustainability 2021, 13, x FOR PEER REVIEW 23 of 29
parts of the olive fruit had no injury in the harvesting process. Olive fruits that were de-tached from the tree fall in the collector systems and avoid contact with stones or the soil/ground. Table 14 shows the results of measuring related to the injured olive fruit parameters. The means of uninjured olive fruits in the NPH increased from 39.71% to 76.02%. This means that the NPH was able to save almost half of the olive fruits. The jaws hit olive fruits and detached fruits from bunches; after that, fruits fell from the tree and collided with the branch and trunk of the tree. This process caused almost 24% damage to the olive fruits. 16% of the olive fruits in the harvesting process were bruised, and the rest of the damaged fruits had ruptured skin, which were then classified as injured fruits. Schema of the injured, bruised, and uninjured olive fruit in harvesting with NPH has been shown in Figure 22.
Figure 22. Schema of the injured, bruised, and uninjured olive fruit in harvesting with NPH.
Table 14. Result of measuring the injury parameters for the olive fruits in the case of harvesting with NPH.
Number of Injured Olives
Weight of Injured Olives
Number of Bruised Olives
Weight of Bruised Olives
Number of Uninjured Olives
Weight of Uninjured
Olives Means 7.98 8.33 15.98 16.79 76.02 74.88
Standard Deviation 1.14 1.36 2.75 2.79 2.96 2.98
Average Deviation 3.22 3.84 7.77 7.89 8.37 8.42
Variance 10.34 14.78 60.34 62.29 70.14 70.99 Minimum 3.88 3.80 6.03 7.41 59.70 60.02 Maximum 13.75 15.61 31.34 31.44 85.34 83.34
3.4. Solar Dish Performance The outcomes of the study concerning the cavity thermal performance using pure
thermal oil and Al2O3/thermal oil nanofluid as the solar working fluid were presented. In addition, representing different measured environmental and conditional parameters was attempted when considering the experimental tests. Experiments were led during the following times: 9:00 to 14:00 on 29 and 30 September 2020. It was observed through-out the experimental tests that the volume flow rate pertaining to the solar working fluids
Figure 22. Schema of the injured, bruised, and uninjured olive fruit in harvesting with NPH.
Table 14. Result of measuring the injury parameters for the olive fruits in the case of harvestingwith NPH.
Number ofInjured Olives
Weight ofInjured Olives
Number ofBruised Olives
Weight ofBruised Olives
Number ofUninjured
Olives
Weight ofUninjured
Olives
Means 7.98 8.33 15.98 16.79 76.02 74.88
StandardDeviation 1.14 1.36 2.75 2.79 2.96 2.98
AverageDeviation 3.22 3.84 7.77 7.89 8.37 8.42
Variance 10.34 14.78 60.34 62.29 70.14 70.99
Minimum 3.88 3.80 6.03 7.41 59.70 60.02
Maximum 13.75 15.61 31.34 31.44 85.34 83.34
3.4. Solar Dish Performance
The outcomes of the study concerning the cavity thermal performance using purethermal oil and Al2O3/thermal oil nanofluid as the solar working fluid were presented.In addition, representing different measured environmental and conditional parameters
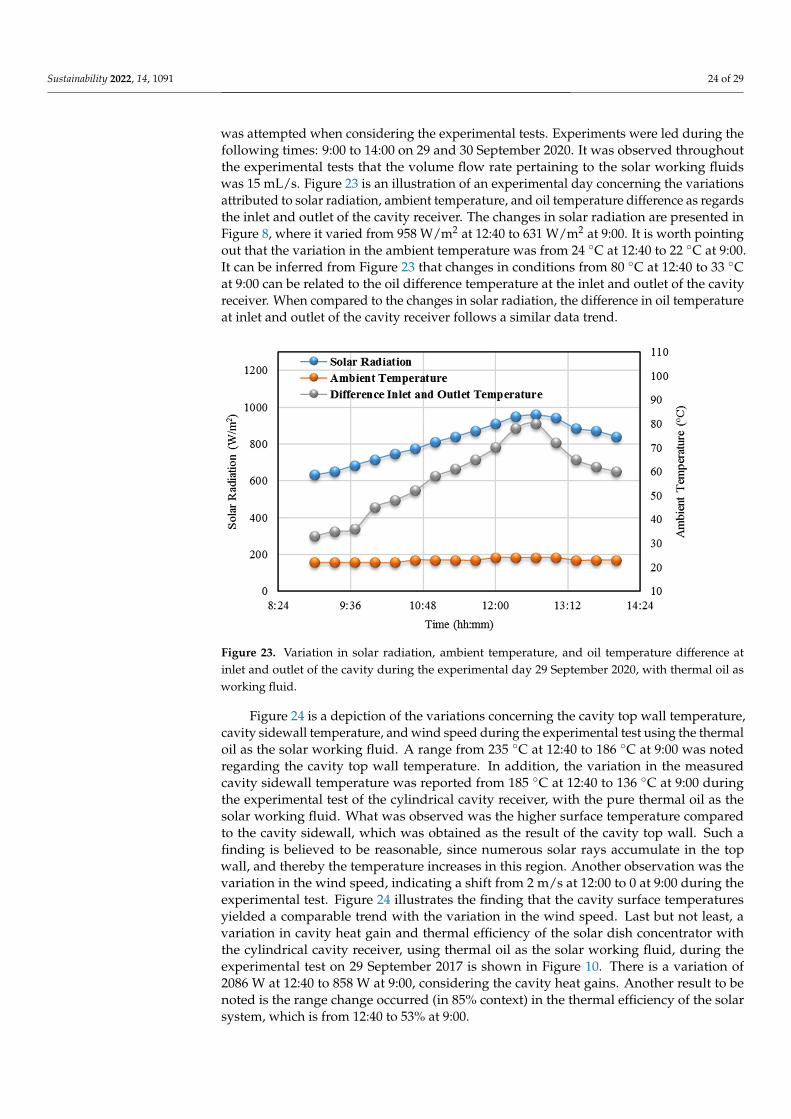
Sustainability 2022, 14, 1091 24 of 29
was attempted when considering the experimental tests. Experiments were led during thefollowing times: 9:00 to 14:00 on 29 and 30 September 2020. It was observed throughoutthe experimental tests that the volume flow rate pertaining to the solar working fluidswas 15 mL/s. Figure 23 is an illustration of an experimental day concerning the variationsattributed to solar radiation, ambient temperature, and oil temperature difference as regardsthe inlet and outlet of the cavity receiver. The changes in solar radiation are presented inFigure 8, where it varied from 958 W/m2 at 12:40 to 631 W/m2 at 9:00. It is worth pointingout that the variation in the ambient temperature was from 24 ◦C at 12:40 to 22 ◦C at 9:00.It can be inferred from Figure 23 that changes in conditions from 80 ◦C at 12:40 to 33 ◦Cat 9:00 can be related to the oil difference temperature at the inlet and outlet of the cavityreceiver. When compared to the changes in solar radiation, the difference in oil temperatureat inlet and outlet of the cavity receiver follows a similar data trend.
Sustainability 2021, 13, x FOR PEER REVIEW 24 of 29
was 15 mL/s. Figure 23 is an illustration of an experimental day concerning the variations attributed to solar radiation, ambient temperature, and oil temperature difference as re-gards the inlet and outlet of the cavity receiver. The changes in solar radiation are pre-sented in Figure 8, where it varied from 958 W/m2 at 12:40 to 631 W/m2 at 9:00. It is worth pointing out that the variation in the ambient temperature was from 24 °C at 12:40 to 22 °C at 9:00. It can be inferred from Figure 23 that changes in conditions from 80 °C at 12:40 to 33 °C at 9:00 can be related to the oil difference temperature at the inlet and outlet of the cavity receiver. When compared to the changes in solar radiation, the difference in oil temperature at inlet and outlet of the cavity receiver follows a similar data trend.
Figure 23. Variation in solar radiation, ambient temperature, and oil temperature difference at inlet and outlet of the cavity during the experimental day 29 September 2020, with thermal oil as work-ing fluid.
Figure 24 is a depiction of the variations concerning the cavity top wall temperature, cavity sidewall temperature, and wind speed during the experimental test using the ther-mal oil as the solar working fluid. A range from 235 °C at 12:40 to 186 °C at 9:00 was noted regarding the cavity top wall temperature. In addition, the variation in the meas-ured cavity sidewall temperature was reported from 185 °C at 12:40 to 136 °C at 9:00 during the experimental test of the cylindrical cavity receiver, with the pure thermal oil as the solar working fluid. What was observed was the higher surface temperature com-pared to the cavity sidewall, which was obtained as the result of the cavity top wall. Such a finding is believed to be reasonable, since numerous solar rays accumulate in the top wall, and thereby the temperature increases in this region. Another observation was the variation in the wind speed, indicating a shift from 2 m/s at 12:00 to 0 at 9:00 during the experimental test. Figure 24 illustrates the finding that the cavity surface temperatures yielded a comparable trend with the variation in the wind speed. Last but not least, a variation in cavity heat gain and thermal efficiency of the solar dish concentrator with the cylindrical cavity receiver, using thermal oil as the solar working fluid, during the experimental test on 29 September 2017 is shown in Figure 10. There is a variation of 2086 W at 12:40 to 858 W at 9:00, considering the cavity heat gains. Another result to be noted is the range change occurred (in 85% context) in the thermal efficiency of the solar system, which is from 12:40 to 53% at 9:00.
Figure 23. Variation in solar radiation, ambient temperature, and oil temperature difference atinlet and outlet of the cavity during the experimental day 29 September 2020, with thermal oil asworking fluid.
Figure 24 is a depiction of the variations concerning the cavity top wall temperature,cavity sidewall temperature, and wind speed during the experimental test using the thermaloil as the solar working fluid. A range from 235 ◦C at 12:40 to 186 ◦C at 9:00 was notedregarding the cavity top wall temperature. In addition, the variation in the measuredcavity sidewall temperature was reported from 185 ◦C at 12:40 to 136 ◦C at 9:00 duringthe experimental test of the cylindrical cavity receiver, with the pure thermal oil as thesolar working fluid. What was observed was the higher surface temperature comparedto the cavity sidewall, which was obtained as the result of the cavity top wall. Such afinding is believed to be reasonable, since numerous solar rays accumulate in the topwall, and thereby the temperature increases in this region. Another observation was thevariation in the wind speed, indicating a shift from 2 m/s at 12:00 to 0 at 9:00 during theexperimental test. Figure 24 illustrates the finding that the cavity surface temperaturesyielded a comparable trend with the variation in the wind speed. Last but not least, avariation in cavity heat gain and thermal efficiency of the solar dish concentrator withthe cylindrical cavity receiver, using thermal oil as the solar working fluid, during theexperimental test on 29 September 2017 is shown in Figure 10. There is a variation of2086 W at 12:40 to 858 W at 9:00, considering the cavity heat gains. Another result to benoted is the range change occurred (in 85% context) in the thermal efficiency of the solarsystem, which is from 12:40 to 53% at 9:00.
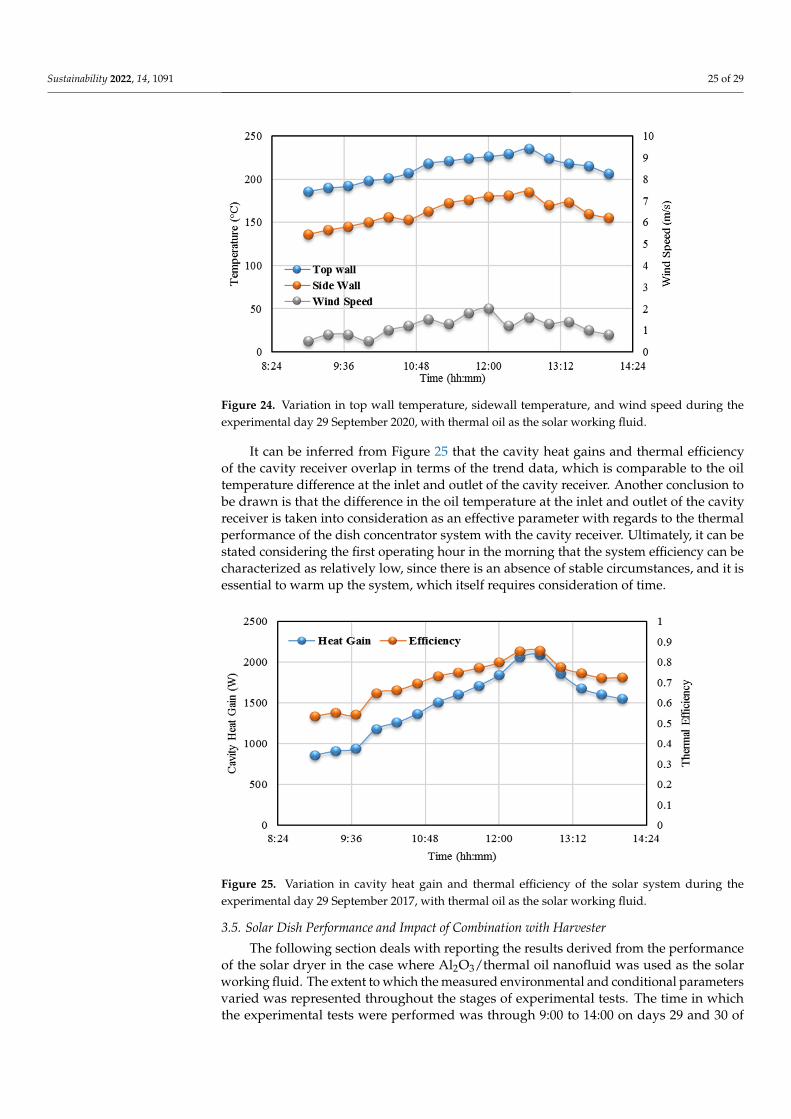
Sustainability 2022, 14, 1091 25 of 29Sustainability 2021, 13, x FOR PEER REVIEW 25 of 29
Figure 24. Variation in top wall temperature, sidewall temperature, and wind speed during the experimental day 29 September 2020, with thermal oil as the solar working fluid.
It can be inferred from Figure 25 that the cavity heat gains and thermal efficiency of the cavity receiver overlap in terms of the trend data, which is comparable to the oil tem-perature difference at the inlet and outlet of the cavity receiver. Another conclusion to be drawn is that the difference in the oil temperature at the inlet and outlet of the cavity receiver is taken into consideration as an effective parameter with regards to the thermal performance of the dish concentrator system with the cavity receiver. Ultimately, it can be stated considering the first operating hour in the morning that the system efficiency can be characterized as relatively low, since there is an absence of stable circumstances, and it is essential to warm up the system, which itself requires consideration of time.
Figure 25. Variation in cavity heat gain and thermal efficiency of the solar system during the ex-perimental day 29 September 2017, with thermal oil as the solar working fluid.
3.5. Solar Dish Performance and Impact of Combination with Harvester The following section deals with reporting the results derived from the performance
of the solar dryer in the case where Al2O3/thermal oil nanofluid was used as the solar working fluid. The extent to which the measured environmental and conditional param-eters varied was represented throughout the stages of experimental tests. The time in which the experimental tests were performed was through 9:00 to 14:00 on days 29 and 30 of September, 2020, and the solar working fluids were categorized by 15 mL/s volume flow rate.
Figure 24. Variation in top wall temperature, sidewall temperature, and wind speed during theexperimental day 29 September 2020, with thermal oil as the solar working fluid.
It can be inferred from Figure 25 that the cavity heat gains and thermal efficiencyof the cavity receiver overlap in terms of the trend data, which is comparable to the oiltemperature difference at the inlet and outlet of the cavity receiver. Another conclusion tobe drawn is that the difference in the oil temperature at the inlet and outlet of the cavityreceiver is taken into consideration as an effective parameter with regards to the thermalperformance of the dish concentrator system with the cavity receiver. Ultimately, it can bestated considering the first operating hour in the morning that the system efficiency can becharacterized as relatively low, since there is an absence of stable circumstances, and it isessential to warm up the system, which itself requires consideration of time.
Sustainability 2021, 13, x FOR PEER REVIEW 25 of 29
Figure 24. Variation in top wall temperature, sidewall temperature, and wind speed during the experimental day 29 September 2020, with thermal oil as the solar working fluid.
It can be inferred from Figure 25 that the cavity heat gains and thermal efficiency of the cavity receiver overlap in terms of the trend data, which is comparable to the oil tem-perature difference at the inlet and outlet of the cavity receiver. Another conclusion to be drawn is that the difference in the oil temperature at the inlet and outlet of the cavity receiver is taken into consideration as an effective parameter with regards to the thermal performance of the dish concentrator system with the cavity receiver. Ultimately, it can be stated considering the first operating hour in the morning that the system efficiency can be characterized as relatively low, since there is an absence of stable circumstances, and it is essential to warm up the system, which itself requires consideration of time.
Figure 25. Variation in cavity heat gain and thermal efficiency of the solar system during the ex-perimental day 29 September 2017, with thermal oil as the solar working fluid.
3.5. Solar Dish Performance and Impact of Combination with Harvester The following section deals with reporting the results derived from the performance
of the solar dryer in the case where Al2O3/thermal oil nanofluid was used as the solar working fluid. The extent to which the measured environmental and conditional param-eters varied was represented throughout the stages of experimental tests. The time in which the experimental tests were performed was through 9:00 to 14:00 on days 29 and 30 of September, 2020, and the solar working fluids were categorized by 15 mL/s volume flow rate.
Figure 25. Variation in cavity heat gain and thermal efficiency of the solar system during theexperimental day 29 September 2017, with thermal oil as the solar working fluid.
3.5. Solar Dish Performance and Impact of Combination with Harvester
The following section deals with reporting the results derived from the performanceof the solar dryer in the case where Al2O3/thermal oil nanofluid was used as the solarworking fluid. The extent to which the measured environmental and conditional parametersvaried was represented throughout the stages of experimental tests. The time in whichthe experimental tests were performed was through 9:00 to 14:00 on days 29 and 30 of
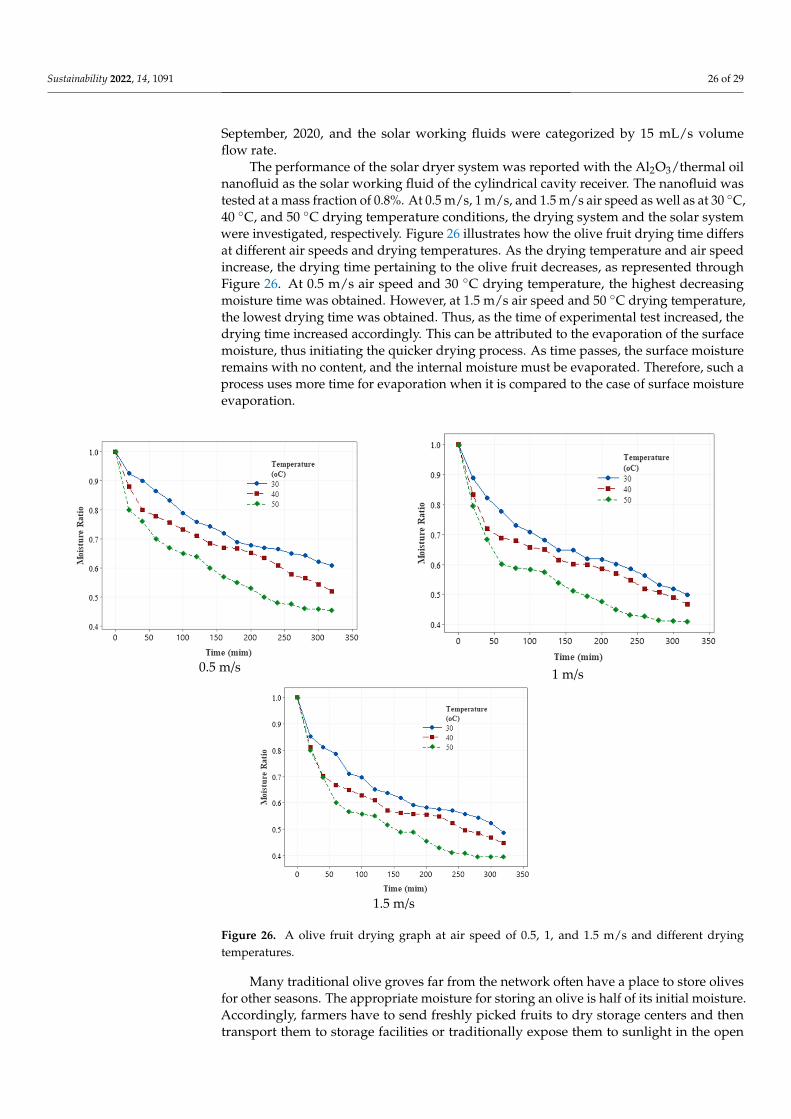
Sustainability 2022, 14, 1091 26 of 29
September, 2020, and the solar working fluids were categorized by 15 mL/s volumeflow rate.
The performance of the solar dryer system was reported with the Al2O3/thermal oilnanofluid as the solar working fluid of the cylindrical cavity receiver. The nanofluid wastested at a mass fraction of 0.8%. At 0.5 m/s, 1 m/s, and 1.5 m/s air speed as well as at 30 ◦C,40 ◦C, and 50 ◦C drying temperature conditions, the drying system and the solar systemwere investigated, respectively. Figure 26 illustrates how the olive fruit drying time differsat different air speeds and drying temperatures. As the drying temperature and air speedincrease, the drying time pertaining to the olive fruit decreases, as represented throughFigure 26. At 0.5 m/s air speed and 30 ◦C drying temperature, the highest decreasingmoisture time was obtained. However, at 1.5 m/s air speed and 50 ◦C drying temperature,the lowest drying time was obtained. Thus, as the time of experimental test increased, thedrying time increased accordingly. This can be attributed to the evaporation of the surfacemoisture, thus initiating the quicker drying process. As time passes, the surface moistureremains with no content, and the internal moisture must be evaporated. Therefore, such aprocess uses more time for evaporation when it is compared to the case of surface moistureevaporation.
Sustainability 2021, 13, x FOR PEER REVIEW 26 of 29
The performance of the solar dryer system was reported with the Al2O3/thermal oil nanofluid as the solar working fluid of the cylindrical cavity receiver. The nanofluid was tested at a mass fraction of 0.8%. At 0.5 m/s, 1 m/s, and 1.5 m/s air speed as well as at 30 °C, 40 °C, and 50 °C drying temperature conditions, the drying system and the solar sys-tem were investigated, respectively. Figure 26 illustrates how the olive fruit drying time differs at different air speeds and drying temperatures. As the drying temperature and air speed increase, the drying time pertaining to the olive fruit decreases, as represented through Figure 26. At 0.5 m/s air speed and 30 °C drying temperature, the highest de-creasing moisture time was obtained. However, at 1.5 m/s air speed and 50 °C drying temperature, the lowest drying time was obtained. Thus, as the time of experimental test increased, the drying time increased accordingly. This can be attributed to the evapora-tion of the surface moisture, thus initiating the quicker drying process. As time passes, the surface moisture remains with no content, and the internal moisture must be evapo-rated. Therefore, such a process uses more time for evaporation when it is compared to the case of surface moisture evaporation.
0.5 m/s
1 m/s
1.5 m/s
Figure 26. A olive fruit drying graph at air speed of 0.5, 1, and 1.5 m/s and different drying tem-peratures.
Many traditional olive groves far from the network often have a place to store olives for other seasons. The appropriate moisture for storing an olive is half of its initial mois-ture. Accordingly, farmers have to send freshly picked fruits to dry storage centers and then transport them to storage facilities or traditionally expose them to sunlight in the open air to reduce moisture. The traditional method of reducing the moisture of olives is often time-consuming, and transferring the fruits to the drying centers and returning the
Figure 26. A olive fruit drying graph at air speed of 0.5, 1, and 1.5 m/s and different dryingtemperatures.
Many traditional olive groves far from the network often have a place to store olivesfor other seasons. The appropriate moisture for storing an olive is half of its initial moisture.Accordingly, farmers have to send freshly picked fruits to dry storage centers and thentransport them to storage facilities or traditionally expose them to sunlight in the open
Sustainability 2022, 14, 1091 27 of 29
air to reduce moisture. The traditional method of reducing the moisture of olives is oftentime-consuming, and transferring the fruits to the drying centers and returning the fruitsto the warehouse bring about wastage of money, energy and hard work. The combinationof two harvesting and drying operations in the garden reduces the energy consumption tozero as a result of the transfer. On the other hand, renewable energy is used for drying.
4. Conclusions
It is taken for granted that harvesting takes the first priority when the goal is to farmolives, and quality of harvesting is dependent on the device used in this regard. In thepresent research work, initially, the effect of harvester jaw on olive fruit was simulated, andthe jaw was analyzed in terms of the best angular velocity. In order to show how the newpneumatic harvester could outperform when compared to its counterparts in the market, ananalysis in this field was attempted. Concerning the 4.52% fruit ripening index, it is feasibleto claim that only 8% of olive fruits remained on the trees. It was found that the HP was29.47 kg/h, indicating that 92% of the tree olives can be detached by NPH in a short time.Thanks to its usability and suitable working conditions, such a machine is traditionallypractical. The major part of the energy is used in olive moisture reduction process forthe traditional orchards with distant energy network, manual harvesting process, transferto the desiccators’ location, and return to farmer. An integration of on-site energy andtime-consuming processes can reduce the consumed energy for harvesting and moisturereduction. In this case, more time is saved, and the collector system impedes furtherdamage to the olive fruit, which makes it easier to use in various harvesting methods.Another note to be taken is addressing the issue of how the solar drying system worksusing the Al2O3/oil nanofluid. The increase in drying temperature and air speed resultedin decreased olive fruit moisture drying time. The reason lies in the fact that there arehigher heat transfer rates under these operating conditions. Under 0.5 m/s air speed and30 ◦C drying temperature conditions, the highest drying time (320 min) was achieved.However, under 1.5 m/s air speed and 50 ◦C drying temperature conditions, the lowestdrying time was obtained.
Author Contributions: F.Z.; writing—original draft preparationdata curation G.N.; supervision,project administration, funding acquisition, investigation, resources P.G.; software, validation, formalanalysis E.F.; Conceptualization, methodology T.Y.; writing—review and editing; visualization M.M.;writing—review and editing. All authors have read and agreed to the published version of themanuscript.
Funding: This research received no funding.
Institutional Review Board Statement: Not applicable.
Informed Consent Statement: Not applicable.
Data Availability Statement: Not applicable.
Acknowledgments: This research was supported by Iran National Science Foundation (INSF) with92032254 number. We thank our colleagues from INSF who provided insight and expertise thatgreatly assisted the research and appreciation to Universiti Malaysia Kelantan Rising Star ResearchGrant (R/STA/A1300/00929A/005/2021/00926).
Conflicts of Interest: The funders had no role in the design of the study; in the collection, analyses,or interpretation of data; in the writing of the manuscript; or in the decision to publish the results.
References1. Ghobadian, B.; Najafi, G.; Rahimi, H.; Yusaf, T. Future of renewable energies in Iran. Renew. Sustain. Energy Rev. 2009, 13, 689–695.
[CrossRef]2. Assali, A.; Khatib, T.; Najjar, A. Renewable energy awareness among future generation of Palestine. Renew. Energy 2019, 136,
254–263. [CrossRef]3. Kartite, J.; Cherkaoui, M. Study of the different structures of hybrid systems in renewable energies: A review. Energy Procedia
2019, 157, 323–330. [CrossRef]
Sustainability 2022, 14, 1091 28 of 29
4. Phillips, L. Solar energy. In Managing Global Warming: An Interface of Technology and Human Issues; Letcher, T.M., Ed.; Elsevier:Amsterdam, The Netherlands, 2018; pp. 317–332.
5. Kalogirou, S.A. Solar thermal collectors and applications. Prog. Energy Combust. Sci. 2004, 30, 231–295. [CrossRef]6. Barbera, A.C.; Maucieri, C.; Cavallaro, V.; Ioppolo, A.; Spagna, G. Effects of spreading olive mill wastewater on soil properties
and crops, a review. Agric. Water Manag. 2013, 119, 43–53. [CrossRef]7. Fiorino, P.; Marone, E.; Ottanelli, A. Mechanical Harvesting, Productivity and Superintensive Planting Systems in Olive Groves.
Adv. Hortic. Sci. 2010, 24, 91–94.8. Lupi, F.R.; Gabriele, D.; Facciolo, D.; Baldino, N.; Seta, L.; de Cindio, B. Effect of organogelator and fat source on rheological
properties of olive oil-based organogels. Food Res. Int. 2012, 46, 177–184. [CrossRef]9. Ottanelli, A.; Marone, E.; Fiorino, P. A new device to improve the mechanical winter pruning in olive trees hedgerows. Adv.
Hortic. Sci. 2019, 33, 113–122.10. Zipori, I.; Dag, A.; Tugendhaft, Y.; Birger, R. Mechanical harvesting of table olives: Harvest efficiency and fruit quality. HortScience
2014, 49, 55–58. [CrossRef]11. Ahmad, R.L. Efficiency of mechanical tools for olive harvest and effect on fruit quality. Acta Hortic. 2018, 1199, 315–319. [CrossRef]12. Mansour, H.A.; Elmesiry, T.A.; Abdelhady, A.A. The Effect of Operating Speed and Olive Varieties Harvested by Hand-Held
Machine on Productivity and Damage Percentage. World Wide J. Multidiscip. Res. Dev. 2018, 4, 355–360.13. Plasquy, E.; Sola-Guiraldo, R.R.; Florido, C.; García, J.M.; Blanco-Roldán, G. Evaluation of a manual olive fruit harvester for small
producers. Res. Agric. Eng. 2019, 65, 105–111. [CrossRef]14. Sola-Guirado, R.R.; Castillo-Ruiz, F.J.; Blanco-Roldan, G.L. Mechanical canopy and trunk shaking for the harvesting mechanization
of table olive orchards. Revista Facultad Ciencias Agrarias UNCuyo 2020, 52, 124–139.15. Loni, R.; Kasaeian, A.; Shahverdi, K.; Asli-Ardeh, E.A.; Ghobadian, B.; Ahmadi, M.H. ANN model to predict the performance of
parabolic dish collector with tubular cavity receiver. Mech. Ind. 2017, 18, 408. [CrossRef]16. Loni, R.; Kasaeian, A.; Mahian, O.; Sahin, A. Thermodynamic analysis of an organic rankine cycle using a tubular solar cavity
receiver. Energy Convers. Manag. 2016, 127, 494–503. [CrossRef]17. Pavlovic, S.; Loni, R.; Bellos, E.; Vasiljevic, D.; Najafi, G.; Kasaeian, A. Comparative study of spiral and conical cavity receivers for
a solar dish collector. Energy Convers. Manag. 2018, 178, 111–122. [CrossRef]18. Loni, R.; Asli-Ardeh, E.A.; Ghobadian, B.; Bellos, E.; Le Roux, W.G. Numerical comparison of a solar dish concentrator with
different cavity receivers and working fluids. J. Clean. Prod. 2018, 198, 1013–1030. [CrossRef]19. Venkatachalam, T.; Cheralathan, M. Effect of aspect ratio on thermal performance of cavity receiver for solar parabolic dish
concentrator: An experimental study. Renew. Energy 2019, 139, 573–581. [CrossRef]20. Yan, J.; Peng, Y.-d.; Cheng, Z.-r. Optimization of a discrete dish concentrator for uniform flux distribution on the cavity receiver of
solar concentrator system. Renew. Energy 2018, 129, 431–445. [CrossRef]21. Yang, S.; Wang, J.; Lund, P.D.; Jiang, C.; Huang, B. Design and performance evaluation of a high-temperature cavity receiver for a
2-stage dish concentrator. Sol. Energy 2018, 174, 1126–1132. [CrossRef]22. Loni, R.; Kasaeian, A.; Asli-Ardeh, E.A.; Ghobadian, B.; Le Roux, W. Performance study of a solar-assisted organic Rankine cycle
using a dish-mounted rectangular-cavity tubular solar receiver. Appl. Therm. Eng. 2016, 108, 1298–1309. [CrossRef]23. Karimi, R.; Gheinani, T.T.; Avargani, V.M. A detailed mathematical model for thermal performance analysis of a cylindrical cavity
receiver in a solar parabolic dish collector system. Renew. Energy 2018, 125, 768–782. [CrossRef]24. Pavlovic, S.; Bellos, E.; Loni, R. Exergetic investigation of a solar dish collector with smooth and corrugated spiral absorber
operating with various nanofluids. J. Clean. Prod. 2018, 174, 1147–1160. [CrossRef]25. Elsheikh, A.; Sharshir, S.; Mostafa, M.E.; Essa, F.; Ali, M.K.A. Applications of nanofluids in solar energy: A review of recent
advances. Renew. Sustain. Energy Rev. 2017, 82, 3483–3502. [CrossRef]26. Xuan, Y.; Li, Q. Heat transfer enhancement of nanofluids. Int. J. Heat Fluid Flow 2000, 21, 58–64. [CrossRef]27. Verma, S.K.; Tiwari, A.K. Progress of nanofluid application in solar collectors: A review. Energy Convers. Manag. 2015, 100,
324–346. [CrossRef]28. Mahbubul, I.; Khan, M.M.A.; Ibrahim, N.I.; Ali, H.M.; Al-Sulaiman, F.A.; Saidur, R. Carbon nanotube nanofluid in enhancing the
efficiency of evacuated tube solar collector. Renew. Energy 2018, 121, 36–44. [CrossRef]29. Loni, R.; Asli-Ardeh, E.A.; Ghobadian, B.; Najafi, G.; Bellos, E. Effects of size and volume fraction of alumina nanoparticles on the
performance of a solar organic Rankine cycle. Energy Convers. Manag. 2019, 182, 398–411. [CrossRef]30. Loni, R.; Asli-Ardeh, E.A.; Ghobadian, B.; Kasaeian, A.; Bellos, E. Thermal performance comparison between Al2O3/oil and
SiO2/oil nanofluids in cylindrical cavity receiver based on experimental Study. Renew. Energy 2018, 129, 652–665. [CrossRef]31. Loni, R.; Asli-Ardeh, E.A.; Ghobadian, B.; Kasaeian, A.; Bellos, E. Energy and exergy investigation of alumina/oil and silica/oil
nanofluids in hemispherical cavity receiver: Experimental Study. Energy 2018, 164, 275–287. [CrossRef]32. Mohsenin, N.N. Physical Properties of Plant and Animal Materials; Taylor and Francis: New York, NY, USA, 1986.33. Ghaffari, H.; Hassanpor, H.; Marghoub, N.; Mohammadi, K. Evaluation of some mechanical properties of two varieties persimmon
in order to improve post-harvest systems at different ripening stages. J. Food Res. 2020, 30, 183–194.34. Polat, R.; Gezer, I.; Guner, M.; Dursun, E.; Erdogan, D.; Bilim, H.C. Mechanical harvesting of pistachio nuts. J. Food Eng. 2007, 79,
1131–1135. [CrossRef]

Sustainability 2022, 14, 1091 29 of 29
35. Srivastava, A.K.; Goering, C.E.; Rohrbach, R.P.; Buckmaster, D.R. Engineering Principles of Agricultural Machines, 2nd ed.; AmericanSociety of Agricultural and Biological Engineers: St. Joseph, MI, USA, 2006.
36. Baghernejad, A.; Yaghoubi, M. Thermoeconomic methodology for analysis and optimization of a hybrid solar thermal powerplant. Int. J. Green Energy 2013, 10, 588–609. [CrossRef]
37. Ilyas, S.U.; Pendyala, R.; Narahari, M.; Susin, L. Stability, rheology and thermal analysis of functionalized alumina-thermaloil-based nanofluids for advanced cooling systems. Energy Convers. Manag. 2017, 142, 215–229. [CrossRef]
38. Yazid, M.N.A.W.M.; Sidik, N.A.C.; Mamat, R.; Najafi, G.J.I.C.i.H.; Transfer, M. A review of the impact of preparation on stabilityof carbon nanotube nanofluids. Int. Commun. Heat Mass Transf. 2016, 78, 253–263. [CrossRef]
39. Kermani, A. Comparison of Four Harvesting Machines for Harvesting of Oil Olive. J. Eng. Res. Agric. Mech. Syst. 2016, 16, 1–18.40. Ettefaghi, E.; Ghobadian, B.; Rashidi, A.; Najafi, G.; Rashtchi, M.; Sadeghian, S. A novel bio-nano emulsion fuel based on
biodegradable nanoparticles to improve diesel engines performance and reduce exhaust emissions. Renew. Energy 2018, 125,64–72. [CrossRef]