Development of a cyclone rice dryer - CORE
312
DEVELOPMENT OF A CYCLONE RICE DRYER by Pracha Bunyawanichakul B.Eng, Kasetsart University; M.Eng, AIT Thailand School of Engineering Submitted in fulfillment of the requirement for the degree of Doctor of Philosophy UTAS University of Tasmania Faculty of Science, Engineering and Technology September 2006
-
Upload
khangminh22 -
Category
Documents
-
view
0 -
download
0
Transcript of Development of a cyclone rice dryer - CORE

DEVELOPMENT OF A CYCLONE RICE DRYER
by
Pracha Bunyawanichakul
B.Eng, Kasetsart University; M.Eng, AIT Thailand
School of Engineering
Submitted in fulfillment of the requirement for the degree of
Doctor of Philosophy
UTAS University of Tasmania
Faculty of Science, Engineering and Technology
September 2006

Signed Statements
This work contains no material which has been accepted for the award of any other
degree or diploma in any University or other institution and, to the best of my
knowledge and belief, contains no material previously published or written by another
person, excepted where due reference has been made in the text.
Signed
Date c9 ct/ 0 E
Pracha Bunyawanichakul v i 'sect Pvo lio
This thesis may be made available for loan and limited copying in accordance with
the Copyright Act 1968
Signed P."7
Date aT
Pracha Bunyawanichakul taw jed /9/0//o 7-

ABSTRACT
This thesis evaluates the suitability of a cyclone dryer for the drying of paddy (rice grain).
The design aim is to reduce the moisture content of paddy from a fresh harvest level of
33% dry-basis to a more manageable level of 22% of dry basis, and to replace all
classical methods of drying. The cyclone dryer consists of a cylindrical tower containing
a series of inverted conical baffles with central orifices that divide the tower into
chambers. The moist particulate matter is fed into a stream of hot, dry air which enters
tangentially at the base of the tower, creating a rotating flow within the dryer. The central
vortex and through-flow jet transport the particles upwards from chamber to chamber
until discharged tangentially at the top. Recirculation of flow within the chambers
lengthens the particle residence time
Single-phase numerical calculations with the commercial RANS-based Computational
Fluid Dynamics (CFD) code CFX 5.7 are used for flow field and pressure drop
predictions. Experimental observations in a small scale laboratory model are used for
validation. Useful descriptions of the axial and tangential velocity distributions are
obtained, and the pressure drop across the cyclone dryer chamber is predicted to about
20% accuracy.
Particle residence time in the laboratory model cyclone dryer is measured by the pulse
tracer stimulus response technique. Observations using paddy grain and spherical silica
gel particles show the mean residence time to vary quadratically with particle
concentration. The residence time distribution (RTD) is explained well by a tank-in-series
model. Numerical predictions of particle residence time obtained from one-way coupled
particle transport modelling without particle dispersion using a Lagrangian/Eulerian
approach produce RTDs differing significantly from the experimental observations.
However, the trends of mean residence time variations in response to changes in inlet air
velocity and number of cyclone chambers are correctly predicted.

Single-pass drying tests with paddy grain demonstrate maximum moisture reductions of
2.6-6.5% dry-basis obtained at inlet air temperatures of 82-89 °C and paddy grain feed
rate of 0.03 kg/s. The specific energy consumption (SPEC) varies between 7.5-20.5
MJ/kg of water evaporated, depending on the initial moisture content of paddy grain.
Compared with fluidised bed and spouted bed paddy dryers employing 50-70% exhaust
air recycling, the cyclone dryer gives a lower moisture reduction and a higher SPEC. This
indicates that practical application of the model-scale cyclone dryer would require multi-
pass operation with exhaust air recycling to be sufficiently economic.
Multi-pass laboratory tests show three-pass drying in a four-chamber cyclone dryer with
inlet air temperature of about 80°C and 0.03 kg/s paddy grain feed rate to reduce the
moisture content of paddy grain by about 11% dry-basis, with an SPEC of 13 MJ/kg of
water evaporated. Recycling about 90% of the air would give a 70-75% reduction in
SPEC compared to non-recycled air operation, and 3.5-4 MJ/kg water evaporated. This is
comparable to fluidised bed paddy dryer operation for similar initial moisture content of
the paddy grain.
Numerical simulations of silica gel particle drying based on two-way coupled particle
transport modelling with a Lagrangian/Eulerian approach are also reported. The
simulations consistently overpredict the moisture and heat transfer observed
experimentally using silica gel particle 3.25 mm in average diameter. As the mean
particle residence time was underpredicted , it is concluded that the water evaporation
model used here gives a much higher moisture transfer rate than that observed
experimentally.
Computational studies of the increase in residence time with geometric scale-up of the
dryer indicate that a commercial scale unit small enough to be field portable could
achieve the desired moisture reduction of paddy grain with single pass operation.

Acknowledgements
The author wishes to express his sincere appreciation and gratitude to his supervisor, Dr.
Greg Walker, for his guidance, encouragement and advice throughout the duration of his
study and research. Grateful thanks are also due to his co-supervisors, Dr. Michael
Kirkpatrick and Dr. Jane Sargison for their valuable suggestions, advice and great support.
Thanks for kind help and suggestions on CFX techniques from Dr. Alan Henderson.
Sincere thanks are extended to the initial-supervisor, Associate Professor Dr. Peter Doe
for his suggestions and advice on the pneumatic drying studies. Special thank for Dr.
Neville Mendham, for his advice on the paddy supply source. The author wishes to
acknowledge and thank his scholarship provider, Srinakharinwirot University, for all the
support which enabled him to complete the Ph.D at University of Tasmania (UTAS). The
support of ANSYS Inc. for the CFX academic software licence is gratefully
acknowledged.
He is most grateful to technical staff of the School of Engineering, UTAS for assistance in
making available facilities needed in conducting experiments. Thanks also to Mr. Ron
Burton, Production Manager, Sunrice Leeton Mill, for kindly supplying paddy for the
experiments. His deep gratitude is extended to Ms. Diane Smith, Senior International
Student Advisor, UTAS for her kind assistance during the time spent in Tasmania.
The author would like to express deep appreciation to Mr. Sena Sadsananan, his
colleague, for all special help, support and advice. Sincere appreciation is extended to all
of his colleagues from Srinakharinwirot University: Dr. Tossapol Kietchareanpol, Mr.
Chainarong Klaimanee, Mr. Siradej Chartniyom, Miss Pilada Wangpanich and Mr.
Chanchai Thaijiem. Many thanks to fellow post graduate student Tzuu Bin Ng for his help
and discussion.
Above all, the author extends his deep love to his lovely family for their help and support
throughout this study. Finally, the author wishes to dedicate this work to his beloved mom
who passed away in 2001, one year before he started study at UTAS.
iv

Supporting Publications
Bunyawanichakul, P., Kirkpatrick, M.P., Sargison, J.E. and Walker, G.J., 2006,
Numerical and experimental studies of the flow field in a cyclone dryer. ASME Journal of
Fluids Engineering, Vol. 28(6), pp.1240-1250.
Bunyawanichakul, P., Sargison, J.E. and Walker, G.J., 2007, Modelling and simulation of
paddy (rice) drying in a simple pneumatic dryer. Biosystems Engineering, Vol. 96(3), pp.
335-344.
Bunyawanichakul, P., Kirkpatrick, M.P., Sargison, J.E. and Walker, G.J. A three-
dimensional simulation of a cyclone dryer. CFD 2006 the 5 th International Conference on
Computational Fluid Dynamics in Industrial Processes, Melbourne, Australia, 13-15
December 2006, CD ROM, 10 pp.

Table of Contents
Signed Statements i Abstract ii Acknowledgements iv Supporting Publications v Table of Contents vi List of Figures xii List of Tables xix List of Symbols xx
Chapter 1 INTRODUCTION 1
1.1 NEED 1 1.2 PROCESS 1 1.3 CURRENT METHODS 2 1.4 PROBLEMS WITH CURRENT METHODS 3 1.5 TARGET USERS 3 1.6 THESIS OUTLINE 4
Chapter 2 OVERVIEW OF PADDY DRYING IN THAILAND 6
2.1 INTRODUCTION AND DEFINITION 6 2.1.1 Fixed Bed Dryers 7 2.1.2 Moving Bed Dryers 7 2.1.3 Boiling Bed Dryers 7 2.1.4 Suspension Bed Dryers 7
2.2 BACKGROUND AND DEVELOPMENT 8 2.2.1 Batch Type Paddy Dryers 9 2.2.2 Solar Paddy Dryer 9 2.2.3 Rotary Paddy Dryer 15 2.2.4 Mixed Flow Paddy Dryer 17 2.2.5 Fluidised Bed Paddy Dryer 18 2.2.6 Spouted Bed Paddy Dryer 23
2.3 COMMERCIAL PADDY DRYERS 24 2.4 EFFECT OF OPERATING PARAMETERS ON RICE QUALITY 28
vi

2.5 POTENTIAL TECHNOLOGY FOR PADDY DRYING 37
Chapter 3 MATHEMATICAL MODEL FOR PADDY DRYING IN A
SIMPLE PNEUMATIC DRYER 40
3.1 INTRODUCTION 40 3.2 PNEUMATIC DRYER 41
3.3 THEORETICAL MODEL DEVELOPMENT 43
3.4 SOLUTION TECHNIQUE 48 3.5 SIMULATION RESULTS 50
3.5.1 Introduction 50
3.5.2 Effect of Dryer Diameter on Moisture and Temperature of Air and Paddy 51
3.5.3 Effect of Paddy Feed Rate on Moisture and Temperature of Air and Paddy 52
3.5.4 Effect of Inlet Air on Moisture and Temperature of Air and Paddy 56
3.6 DISCUSSION AND EVALUATION OF THE PNEUMATIC DRYER FOR
PADDY DRYING 57
3.7 CONCLUSIONS 59
Chapter 4 CYCLONE TECHNOLOGY FOR GRAIN DRYING 62
4.1 INTRODUCTION 62
4.2 CYCLONE SEPARATOR 63 4.2.1 Flow Behaviour 63
4.2.2 Particle Terminal Velocity 66
4.2.3 Particle Deposition Velocity 67
4.3 THE WORKING PRINCIPLE OF A CYCLONE DRYER 68
4.4 CYCLONE DRYER APPARATUS DESIGN AND DEVELOPMENT 69
4.4.1 Outline and Basic Assumptions 69
4.4.2 Drying Chamber 71 4.4.3 Blower Selection 73
4.4.4 Rated Capacity of Heater 73
4.4.5 Separation Chamber 74
4.5 PRELIMINARY-STUDY OF CYCLONE DRYER 75
4.5.1 Introduction 75 4.4.1 Effect of Velocity on Cyclone Dryer Pressure Drop 75
4.4.2 Flow Characteristics of Grain Inside Cyclone Dryer and Minimum Working
Velocity 76
4.6 CONCLUDING REMARKS 78
vii

Chapter 5 CYCLONE DRYER FLOW FIELD: EXPERIMENTAL AND
NUMERICAL STUDIES 76
5.1 INTRODUCTION 79
5.2 EXPERIMENTAL INVESTIGATIONS 82
5.2.1 Flow Geometry and Physical Model 82 5.2.2 Measurement Techniques 83 5.2.3 Experimental Results 86
5.3 NUMERICAL SIMULATION AND VALIDATION 88
53.1Basic Governing Equations 88
5.3.1.1 Two-equation turbulence model 89
5.3.1.1 Reynolds stress turbulence model 90
5.3.2 Numerical Set-up and Solution Technique 92
5.3.3 Simulation Results and Validation 93
5.3.3.1 Advection (differencing) scheme 95
5.3.3.2 Grid sensitivity 98
5.3.3.3 Turbulence model 103
5.3.3.4 Optimised numerical model 108
5.4 NUMERICAL PREDICTIONS 108
5.4.1 Effect of Inlet Air Velocity 108
5.4.2 Effect of Number of Chambers 113
5.5 CONCLUSIONS 117
Chapter 6 SOLID-GAS FLOW BEHAVIOUR AND PARTICLE
RESIDENCE TIME DISTRIBUTION OF A CYCLONE DRYER. 119
6.1 INTRODUCTION 119
6.2 RESIDENCE TIME DISTRIBUTION (RTD) OF PARTICLES IN A CYCLONE
DRYER 122
6.2.1 RTD Theory 123
6.2.2 Experimental Evaluation of RTD 125
6.2.3 RTD Modelling for Non-Ideal Flow 126
6.2.3.1 Dispersion model 126
6.2.3.2 Tank-in-Series model 127
6.3 EXPERIMENTAL INVESTIGATION 127
6.3.1 Experimental Set-up 129
6.3.1.1 Intake system 129
6.3.1.2 Particle feeder 129
viii

6.3.1.3 Cyclone dryer chamber 130 6.3.1.4 Separation chamber 131
6.3.2 Experimental Procedure 132 6.3.3 Experimental Results 132
6.3.3.1 Effect of inlet air velocity 135 6.3.3.2 Effect of particle feed rate 135 6.3.3.3 Effect of number of cyclone chambers 138 6.3.3.4 Effect of particle density 138 6.3.3.5 Comparison with ideal flow models 140
6.4 NUMERICAL SIMULATION 143 6.4.1 Mathematical Modelling 143 6.4.2 Numerical Procedure 144 6.4.3 Numerical Results 145
6.4.3.1 Effect of turbulent dispersion model 145 6.4.3.2 Comparison of numerical residence time predictions with experimental
results 147 6.5 CONCLUSIONS 151
Chapter 7 EXPERIMENTAL AND NUMERICAL STUDIES OF CYCLONE
DRYER PERFORMANCE 155
7.1 INTRODUCTION 155 7.2 EXPERIMENTAL STUDIES 158
7.2.1 Experimental Apparatus and Instrumentation 158 7.2.2 Experimental Procedure 159 7.2.3 Experimental Heat and Mass Transfer 160 7.2.4 Results and Discussion 162
7.2.4.1 Moisture reduction 162 7.2.4.2 Heat transfer 163 7.2.4.3 Mass transfer 171 7.2.4.4 Specific energy consumption 175 7.2.4.5 Summary of experimental results for single pass drying and comparison
with other paddy dryers 180 7.2.5 Strategy for Paddy Drying with the Model Cyclone Dryer 183
7.2.5.1 Characteristics of multi-pass drying in the model dryer 183 7.2.5.2 Predicted effect of air recycling 185 7.2.5.3 Summary of paddy drying strategy in the model scale cyclone dryer 187
ix

7.3 NUMERICAL STUDIES 189 7.3.1 Mathematical Model 190
73.1.1 Governing conservation equations for the continuous phase 190
7.3.1.2 Governing equations for the dispersed phase 191 7.3.1.3 Heat and mass transfer 191
7.3.2 Modelling Set-up 192 7.3.3 Simulation Results 193
7.3.3.1 Particle trajectories 194
7.3.3.2 Velocity distribution 195
7.3.3.3 Temperature and humidity distributions 195
7.3.4 Numerical Validations 196
7.4 PROJECTED COMMERCIAL SCALE PROTOTYPE PERFORMANCE 202 7.4.1 Scale Up Considerations 203
7.4.2 Numerical Results and Discussion 204
7.43 Cyclone Dryer Scale Up Strategy 206 7.5 CONCLUSIONS 206
Chapter 8 SUMMARY AND RECOMMENDATIONS 210
8.1 INTRODUCTION 210
8.2 SUMMARY 211
8.2.1Apparatus Design and Preliminary Investigation 211
8.2.2 RTD of Solid Particles in the Model Cyclone Dryer 212
8.23 Performance of the Model Cyclone Dryer during Continuous Operation 212
8.2.4 Applicability of CFD for Cyclone Dryer Design 213
8.3 RECOMMENDATIONS 215
References 216
Appendices (in separate volume)
Appendix A. MATLAB Source Program for Pneumatic Dryer Simulation— 226
Appendix B. Drawing of Cyclone Myer, Rotary Feeder, Heater and Settling
Chamber 235

Appendix C. Calculation of the Required Air Flow and Total Pressure Drop 264
Across the Drying System C.1 Air flow rate 265 C.2 System pressure drop 265
Appendix D. Three Hole Probe Calibration 271 D.1 Probe Construction 272 D.2 Detail of Probe Calibration 272
D.3 Calibration Results and Data Fitting 273
D.4 Error of Fitted Surface 277
Appendix E. Experimental Results of Paddy Grain and Silica Gel Particle
Drying and Initial Conditions for Cyclone Myer Simulations.... 280
xi

List of Figures
2.1 Paddy dryer developed by AED (Singhagajen, 1981) 10
2.2 AIT Solar Paddy dryer (Exell et al., 1979) 12
2.3 Solar rice dryer with forced air circulation (Tongprasert, 1978) 13
2.4 Integrated paddy-drying/storage solar hut (Soponronnarit, 1985) 14
2.5 Natural convective rotary dryer (Puechkamutr, 1985) 16
2.6 Drying Chamber of the Louisiana State University Dryer 17
2.7 Diagram of fluidised bed paddy dryer (Soponronnarit et al., 1996a) 19
2.8 Fluidised bed paddy dryer (Soponronnarit et al., 1996b) 20
2.9 Mobile fluidised bed paddy dryer (Soponronnarit et al., 1998) 21
2.10 Diagram of vibro-fluidised bed paddy dryer (Soponronnarit et al., 2001) , 22
2.11 Industrial-scale prototype spouted bed dryer (Madhiyanon et al., 2001) 24
2.12 Paddy drying system in Supanthaanya rice mill (Rordprapat et al., 1999) 26
2.13 Paddy drying System in Poonsinthai rice mill (Rordprapat et al., 1999) 27
2.14 Paddy drying System in Taweerungruang rice mill (Rordprapat et al., 1999) 28
2.15 Head rice yield as a function of final moisture content of paddy (agitation speed, 14 rpm;
feed rate 30 kg/min) (Jindal et al., 1986) 30
2.16 Head rice yield as a function of final moisture content of paddy (agitation speed, 30 rpm;
feed rate 30 kg/min) (Tindal et al., 1986) 30
2.17 Head rice yield as a function of final moisture content of paddy (agitation speed, 40 rpm;
feed rate 30 kg/min) (Jindal et al., 1986) 31
2.18 Relationship between relative head rice yield and final moisture content in fluidised bed
drying at different temperatures (Initial moisture content 45.3% dry- basis)
(Soponronnarit et al., 1994) 31
2.19 Relationship between Relative whiteness and final moisture content in fluidised bed
drying at different temperature (Initial moisture content 45.3% dry- basis)
(Soponronnarit et al., 1994) 32
2.20 Relative head rice yield at different initial moisture contents Inlet air temperature 150 °C
(Wetchacama et al., 1999) 33
2.21 Relative head rice yield at different inlet air temperatures Initial moisture content 31.1 %
db. (Wetchacama et al., 1999) 34
2.22 Relative rice whiteness at different initial moisture contents (Wetchacama et al., 1999).... 35
2.23 Relative rice whiteness at different inlet air temperatures (Wetchacama et al., 1999) 35
2.24 Sun drying of paddy on a concrete floor 38
3.1 Diagram of a simple pneumatic dryer 43
3.2 Elemental layer of a concurrent flowing pneumatic dryer 44
xi i
3.3 Flow diagram of the pneumatic dryer simulation 49
3.4 Development of dimensionless quantities over the dryer length 51
3.5 Variation of slip velocity over dryer length with paddy feed rate of 0.75 kg/s and inlet air
velocity of 23 m/s for three dryer diameters 52
3.6 Development of : (a) paddy and air temperatures; and (b) paddy moisture content and air
Humidity, over the dryer length with paddy feed rate of 0.75 kg/s and inlet air velocity of
23 m/s for three dryer diameters 53
3.7 Variation of slip velocity over dryer length with dryer diameter of 0.203 m and inlet air
velocity of 23 m/s for three paddy feed rates 54
3.8 Development of : (a) paddy and air temperatures; and (b) paddy moisture content and air
humidity over, the dryer length with dryer diameter of 0.203 m and inlet air velocity of
23 m/s for three paddy feed rates 55
3.9 Variation of slip velocity over dryer length with dryer diameter diameter of 0.203 m and
inlet air velocity of 23 m/s for three inlet air velocity values 56
3.10 Development of : (a) paddy and air temperatures; and (b) paddy moisture content and air
humidity over, the dryer length with, dryer diameter of 0.203 m and inlet paddy feed rate
of 0.5 kg/s for three inlet air velocities 58
3.11 Variation of equilibrium temperature with: (a) dryer diameter; and (b) paddy feed rate,
for three inlet air velocities 60
3.12 Required dryer length to achieve different final moisture contents. (T f, = 30 °C, M, = 0.33
kg water/ kg dry material, D = 0.203 m, F = 0.25 kg/s, v f = 23 m/s) 61
4.1 Flow pattern inside tangential inlet cyclone (Hoffmann et al., 2002) 63
4.2 Control surface (CS) of cyclone (Hoffmann et al., 2002) 64
4.3 Multi-chamber cyclone dryer (Korn, 2001) 69
4.4 Schematic diagram for model cyclone dryer used in this study 70
4.5 Geometry of cyclone dryer chamber used in the present investigation 72
4.6 Drawing of model cyclone dryer system 74
4.7 Variation of cyclone dryer total pressure drop coefficient with Reynolds number 76
4.8 Paddy grain behaviour at 0.09 m 3/s air flow rate (Estimated jet velocity 11.5 m/s) 77
4.9 Paddy grain behaviour at 0.11 m 3/s air flow rate (Estimated jet velocity 14 m/s) 78
5.1 Model cyclone dryer geometry in x-z and x-y planes. The configuration geometric ratios
and measuring positions are also shown 83
5.2 Three-hole modified wedge probe. (support diameter 6.35 mm) 85
5.3 Radial profiles of velocity components at elevations z = 0.055m and 0.255 m: (a) axial
velocity; (b) tangential velocity 87
5.4 Series of meshes of different fineness used for grid sensitivity studies: (a) 864,185 nodes;
(b) 419,928 nodes; (c) 190,057 nodes; (d) 86,555 nodes 94

5.5 Influence of differencing scheme on predicted velocity distributions at z = 0.055 m: (a)
axial velocity; (b) tangential velocity 96
5.6 Influence of differencing scheme on predicted velocity distributions at z = 0.255 m: (a)
axial velocity; (b) tangential velocity 97
5.7 Influence of mesh resolution on predicted velocity distributions at z = 0.055 m for RNG
k-E turbulence model: (a) axial velocity; (b) tangential velocity 99
5.8 Influence of mesh resolution on predicted velocity distributions at z = 0.255 m for RNG
k-E turbulence model: (a) axial velocity; (b) tangential velocity 101
5.9 Predicted near-wall tangential velocity distributions for different mesh resolutions using
the RNG k-E turbulence model: (a) inlet pipe side; (b) outlet pipe side. Values plotted at
computational nodes 102
5.10 Influence of mesh resolution on predicted velocity distributions at z = 0.055 m for SSG
Reynolds stress turbulence model: (a) axial velocity; (b) tangential velocity 104
5.11 Influence of mesh resolution on predicted velocity distributions at z = 0.255 m for SSG
Reynolds stress turbulence model: (a) axial velocity; (b) tangential velocity 105
5.12 Predicted near-wall tangential velocity distributions for different mesh resolutions using
the SSG Reynolds stress turbulence model: (a) inlet pipe side; (b) outlet pipe side. Values
plotted at computational nodes 107
5.13 Influence of different turbulence models on predicted velocity distributions at z = 0.055
m: (a) axial velocity; (b) tangential velocity 109
5.14 Influence of different turbulence models on predicted velocity distributions at z = 0.255
M: (a) axial velocity; (b) tangential velocity 110
5.15 Pressure drop characteristics from simulation and experiment Ill
5.16 Comparison of axial and tangential velocity profiles predicted by RNG k-E turbulence
model at different inlet velocities (8, 10 and 13 m/s): (a) axial velocity; (b) tangential
velocity 112
5.17 Velocity vector plot and pressure contour of three-chamber cyclone dryer: (a) velocity
vector plot of x-z cut plane at y=0; (b) pressure contour plot of x-z cut plane at y=0; (c),
(d) and (e) velocity vector and pressure contour plots of x-y plane at z = 0.055 m, 0.255
M and 0.455m 114
5.18 Velocity vector plot and pressure contours of four-chamber cyclone dryer: (a) velocity
vector plot of x-z cut plane at y=0; (b) pressure contour plot of x-z cut plane at y=0; (c),
(d), (e) and (f) velocity vector and pressure contour plots of x-y cut plane at z = 0.055 m,
0.255 m, 0.455 m and 0.655 m 115
6.1 The two ideal types of reactor: (a) plug flow; (b) mixed flow 122
6.2 Cumulative age distribution, or F(t) curve 123
6.3 The exit age distribution curve, E(t) for particle flow through the dryer, also called the
xiv

residence time distribution or RTD (Levenspiel 1972) 124
6.4 Effect of model parameters on the RID curve, indicating various degrees of mixing :
(a) Dispersion model: influence of dispersion number, D/uL;
(b) Tank-in-series model: influence of number of tanks, n (Levenspiel, 1972) 128
6.5 Paddy flow rates versus motor frequency at different sliding plate openings 130
6.6 Silica gel flow rates versus motor frequency at different sliding plate openings 131
6.7 Cumulative age distribution, F(t), of silica gel particles 134
6.8 Cumulative age distribution, F(t), of paddy grain 134
6.9 Influence of inlet air velocity on cumulative age distribution of silica gel particles 136
6.10 Influence of inlet air velocity on cumulative age distribution of paddy grain 136
6.11 Influence of particle feed rate on cumulative age distribution of silica gel particles 137
6.12 Influence of particle feed rate on cumulative age distribution of paddy grain 137
6.13 Influence of mass concentration on mean residence time of paddy grain for three- and
four-chamber cyclone dryers 139
6.14 Influence of mass concentration on mean residence time of silica gel particles for three-
and four-chamber cyclone dryers 139
6.15 Comparison of best fit tank-in-series and dispersion models with experimental RTD for
paddy grain. Test case 1 141
6.16 Comparison of best fit tank-in-series and dispersion models with experimental RID for
silica gel. Test case 11 141
6.17 Comparison of experimental and numerical cumulative age distributions of silica gel
particles in a three-chamber cyclone dryer (Silica gel feed rate = 0.0778 kg/s) 148
6.18 Comparison of experimental and numerical cumulative age distributions of silica gel
particles in a four-chamber cyclone dryer (Silica gel feed rate = 0.0778 kg/s) 148
6.19 Comparison of experimental and numerical cumulative age distributions of paddy grain
in a three-chamber cyclone dryer (Silica gel feed rate = 0.0778 kg/s) 149
6.20 Comparison of experimental and numerical cumulative age distributions of paddy grain
in a four-chamber cyclone dryer (Silica gel feed rate = 0.0778 kg/s) 149
6.21 Comparison of numerical and experimental age distributions, E(t), for silica gel particles
in three-chamber cyclone dryer, showing influence of inlet air velocity 152
6.22 Comparison of numerical and experimental age distributions, E(t), for silica gel particles
in four-chamber cyclone dryer, showing influence of inlet air velocity 152
6.23 Comparison of numerical and experimental age distributions, E(t), for paddy grain in thre ,
-chamber cyclone dryer, showing influence of inlet air velocity 153
6.24 Comparison of numerical and experimental age distributions, E(t), for paddy grain in •
four-chamber cyclone dryer, showing influence of inlet air velocity 153
XV
7.1 Variation of percentage of moisture reduction (MR) with inlet air temperature (I f,) at
different paddy feed rates: (a) three-chamber cyclone dryer; (b) four-chamber cyclone
dryer 164
7.2 Variation of percentage of moisture reduction (MR) with inlet air temperature (T f, i)
at different silica gel feed rates: (a) three-chamber cyclone dryer; (b) four-chamber
cyclone dryer 165
7.3 Comparison of moisture reduction (MR) for three- and four-chamber cyclone dryers
at different feed rates: (a) low feed rate; (b) medium feed rate; (c) high feed rate 167
7.4 Variation of dimensionless heat transfer coefficient (Nu) with inlet air temperature
for different paddy feed rates; (a) three-chamber cyclone dryer; (b) four-chamber cyclone
dryer 168
7.5 Variation of dimensionless heat transfer coefficient (Nu) with inlet air temperature for
different silica gel feed rates: (a) three-chamber cyclone dryer; (b) four-chamber cyclone
dryer 169
7.6 Comparison of dimensionless heat transfer coefficient (Nu) variation with inlet air
Temperature for three- and four-chamber cyclone dryer operation at different feed
rates: (a) low feed rate; (b) medium feed rate; (c) high feed rate 171
7.7
Variation of dimensionless mass transfer coefficient (Sh) with inlet air temperature
for different paddy feed rates: (a) three-chamber cyclone dryer;
(b) four-chamber cyclone dryer 172
7.8
Variation of dimensionless mass transfer coefficient (Sh) with inlet air temperature
for different silica gel feed rates: (a) three-chamber cyclone dryer;
(b) four-chamber cyclone dryer 173
7.9 Comparison of dimensionless mass transfer coefficients (Sh) for paddy grain and
silica gel particle drying: (a) low feed rate; (b) medium feed rate; (c) high feed rate 175
7.10 Variation of specific energy consumption (SPEC) with inlet air temperature at
different paddy feed rates: (a) three-chamber cyclone dryer; (b) four-chamber cyclone
dryer 176
7.11 Variation of specific energy consumption (SPEC) with inlet air temperature at
different silica gel feed rates: (a) three-chamber cyclone dryer; (b) four-chamber cyclone
dryer 177
7.12 Comparison of specific energy consumption (SPEC) for paddy grain and silica gel
particle drying: (a) low feed rate; (b) medium feed rate; (c) high feed rate 179
7.13 Influence of initial moisture content of particles on the SPEC 180
7.14 Schematic diagram of cyclone dryer with system of air recycling system 186
7.15 Influence of mixing moisture content on fraction of air recycled and SPEC 188
7.16 Variation of SPEC with fraction of air recycled 188
xvi

7.17 Typical particle trajectories: (a) three-chamber cyclone dryer; (b) four-chamber cyclone
Dryer. Colour contours indicate residence time in seconds 194
7.18 Influence of silica gel feed rate on predicted tangential velocity profiles for three-
chamber cyclone dryer at: (a) 0.055 m elevation ;(b) 0.255 m elevation (Inlet air
temperature 57.43 °C; initial moisture content of silica gel 21 % db.) 198
7.19 Influence of inlet air temperature on predicted tangential velocity profiles for three-
chamber cyclone dryer: (a) 0.055 m elevation; (b) 0.255 m elevation (Silica gel feed rate
0.0256 kg/s; initial moisture content of silica gel 21 % db.) 198
7.20 Influence of initial moisture content of silica gel on predicted tangential velocity profiles
for three-chamber cyclone dryer: (a) 0.055 m elevation; (b) 0.255 m elevation (Inlet air
temperature 57.43 °C; silica gel feed rate 0.0256 kg's) 199
7.21 Influence of silica gel feed rate on predicted temperature profiles for three-chamber
cyclone dryer: (a) 0.055 m elevation; (b) 0.255 m elevation (Inlet air temperature
57.43 °C; initial moisture content of silica gel 21 % db.) 199
7.22 Influence of inlet air temperature on predicted temperature profiles for three-
chamber cyclone dryer: (a) 0.055 m elevation; (b) 0.255 m elevation; (Silica gel feed
rate 0.0256 kg/s; initial moisture content of silica gel 21 % db.) 200
7.23 Influence of initial moisture content of silica gel on predicted temperature profiles
for three-chamber cyclone dryer: (a) 0.055 m elevation; (b) 0.255 m elevation (Inlet air
temperature 57.43 °C; silica gel feed rate 0.0256 kg/s) 200
7.24 Influence of silica gel feed rate on predicted humidity profiles for three-chamber cyclone
dryer: (a) 0.055 m elevation; (b) 0.255 m elevation (Inlet air temperature 57.43 °C;
initial moisture content of silica gel 21 % db.) 201
7.25 Influence of inlet air temperature on predicted humidity profiles for three-chamber
cyclone dryer: (a) 0.055 m elevation; (b) 0.255 m elevation (Silica gel feed rate 0.0256
kg/s; initial moisture content of silica gel 21 % db.) 201
7.26 Influence of initial moisture content of silica gel on predicted humidity profiles for
three-chamber cyclone dryer: (a) 0.055 m elevation; (b) 0.255 m elevation (Inlet air
temperature 57.43 °C; silica gel feed rate 0.0256 kg's) 202
7.27 Influence of geometric scale factor on RTDs of silica gel particles 205
7.28 Predicted variation of mean residence time with geometric scale factor 205
C-1 Operating point at various speeds of the selected blower 269
C-2 Characteristic curve of selected blower at 2880 rpm 270
D-1 flplotted against probe angle at different Re 274
D-2 f2plotted against probe angle at different Re 274
D-3 f3plotted against probe angle at different Re 275
D-4 Error of fl 278
xvii

D-5 Error of f2 278
D-6 Error of f3 278
D-7 Error of Calibration Angle 279
D-8 Error of Air Velocity 279
xviii

List of Tables
4.1 Characteristic of cyclone dryer pilot plant (Korn, 2001) 71 5.1 Pressure scanner channel set-up during flow field measurement of Cyclone dryer 85 5.2 Effect of differencing scheme on predicted total pressure drop coefficient using mesh of
86,555 nodes and RNG k-c turbulence model 98 5.3 Comparison of predicted total pressure drop coefficient and RMS residual value for
different mesh resolutions using RNG k-c turbulence model with second-order
differencing scheme 103
5.4 Comparison of predicted total pressure drop coefficient and RMS residual value for
different mesh resolutions using SSG Reynolds stress turbulence model with second-
order differencing scheme 106 5.5 Predicted influence of number of chambers on total pressure drop coefficient for model
cyclone dryer 117 6.1 Influence of cyclone geometry and operating conditions on residence time distributions
for silica gel particles and paddy grain 133 6.2 Best fit to experimental residence time distribution for tank-in-series and dispersion
models for cases specified in Table 6.1 142 6.3 Stokes number of paddy grain and silica gel particles at different inlet air velocity 147 6.4 Comparison of experimental and numerical by simulated mean particle residence times 150 7.1 Comparison of working performance between the model cyclone dryer and other
commercial paddy dryers 182 7.2 Results of multi-pass drying of paddy grain in a three-chamber cyclone dryer 184 7.3 Results of multi-pass drying of paddy grain in a four-chamber cyclone dryer 184 7.4 Overall average values for multi-pass paddy drying tests 184 7.5 Comparison of numerical and experimental results for overall air temperature and
humidity changes in silica gel drying 197 7.6 Influence of geometric scale-up factor mean residence time 206 D-1 Coefficient of fl(a,Re) 276
D-2 Coefficient of 12 (a, Re) 276
D-3 Coefficient of f3 (a, Re) 276
E.1 Experimental results of paddy drying in three-chamber cyclone dryer 281 E.2 Experimental results of paddy drying in four-chamber cyclone dryer 282 E.3 Experimental results of silica gel drying in three-chamber cyclone dryer 283 E.4 Experimental results of silica gel drying in four-chamber cyclone dryer 284 E.5 Summary of simulation cases for silica gel drying in three-chamber cyclone dryer 285 E.6 Summary of simulation cases for silica gel drying in four-chamber cyclone dryer 386
xix

List of Symbols
A Projected area of body normal to relative flow direction m2
a Anisotropic tensor m s
a Specific surface area m2 m-3
b, b0, b 1 Constants
b2 , b3, 134 Constants
Concentration kg kg -1
CD Drag coefficient
Ce Equilibrium concentration kg kg -1
C1, C2 Constants for k-c turbulence model
Cr2, Cr3 Constants for Reynolds stress turbulence model
Cr4, Cr5 Constants for Reynolds stress turbulence model
Cs, C51, C52 Constants for Reynolds stress turbulence model
Cc1 ,C,2 Constants for Reynolds stress turbulence model
CeIRNG Constant for RNG k-e turbulence model
Ce2RNG Constant for RNG k-e turbulence model
C, Constant for k-c turbulence model
Com Constant for RNG k-e turbulence model
C pp Total pressure drop coefficient
c l , c2 Constants
Cf Heat capacity of air kJ kg -1 IC-1
ci Measured tracer concentration kg kg-1
Heat capacity of particles kJ kg-1 K-1
Co Heat capacity of particles at initial state kJ kg-1 K-1
Heat capacity of saturated water kJ kg -1 K-1
cv Heat capacity of water vapour kJ kg -1 IC-1
Dryer diameter
Deff Coefficient of diffusion m2 S -1
D, Equivalent diameter
Do Outlet diameter
Dp Axial dispersion coefficient
Dv-a Diffusivity of water in air m2 S -I
dp Particle diameter
E(t) Exit age distribution, or residence time distribution
E(0) Dimensionless exit age distribution
XX
Em, Mean deviation
Feed rate of particles kg s-I
F(t) Cumulative age distribution s I
F(0) Dimensionless cumulative age distribution
F Average particle feed rate kg s-I
Friction factor
Constant
f' Modified friction factor
Gravitational acceleration m S-2
Heat transfer coefficient W Tr1-2
hCS Height of control surface
Latent heat of vaporisation kJ kg'
Kronecker delta
Kro Mass transfer coefficient kg
Turbulence kinetic energy m2 5-2
Length
Diffuser length
Moisture content of particles (dry basis) kg kg'
MCr Critical moisture content kg kg'
Meq Equilibrium moisture content kg kg'
M, Initial moisture content kg kg'
M. Moisture content at outlet kg kg'
MR Moisture reduction % db.
Inf Mass flow rate of air kg s-1
Mass flux of air kg 111-2S -I
mp Mass flow rate of particles kg s-I
tin Mass flux of particles kg M-2S-I
Mw Mass of water in particles kg
NP, Number of particles having left calculation domain at time t,
Nit Nusselt number
Number of tank for tanks-in-series RTD model
no Number of particles initially injected into calculation domain
Pressure Pa
Pk Shear production for k-c turbulence model kg m s -3
Ps Shear production for Reynolds stress turbulence model kg m S -3
Pw Partial pressure of vapour in air Pa
xxi

Saturated vapour pressure Pa
Pr Prandtl number
Volumetric flow rate 1113 S -1
Heat transfer rate kJ
0m Mass transfer rate kg
Radius
Vector directed from the axis of rotation
Rc Radius of vortex finder 111
Rcyclone Radius of cyclone dryer
Rx Radius of vortex core
Re Reynolds number
Rep Particle Reynolds number
RE Surface roughness
Re' Modified particle Reynolds number
RH Relative humidity
Radial coordinate
rc Continuous phase volume fraction
rf Fraction of mass in continuous phase
Fraction of mass in particulate phase
Strain rate m S -1
SE Energy source kg m-I s-I
S m Momentum source kg M-2 S -1
SMS Mass source kg M-3 s-I
Sh Sherwood number -
SPair Specific air flow rate m3 kg 1
Sty Stokes number - T Temperature
T„ Equilibrium temperature
Tf Air temperature
Tr, Air temperature at inlet
Tfp Air temperature at outlet
Tp Particle temperature
Tp1 Particle temperature at inlet
Tpo Particle temperature at outlet
To, Ambient temperature
Time

te Air temperature °C
Mean residence time in one tank t
Mean residence time in n tanks
-1 u Velocity vector In S
-I U ' Fluctuating velocity component in turbulence flow ms
V Volume 1113
v Velocity 111 5-I
-1 Va,d Average downward axial velocity in S
Vd Bed voidage % -1 va ,„ Average upward inlet velocity 111 S
-1 VP Velocity of particle 111 S -I
Vpo Initial velocity of particle In s
Vf Velocity of air, fluid 111 S-1
-I vr Radial velocity 111 S
-I V rcs Radial velocity at control surface 111 S
-1 v, Terminal velocity of particle 111 S
- Vo Tangential velocity In SI
-I Vm Minimum superficial pipe velocity 111 S
W Humidity of air kg kg - '
Wd Weight of bone-dry material kg
W, Humidity at inlet kg kg- '
Wm Weight of moist material kg
Wo Humidity at outlet kg kg-I
Wsat Saturated humidity % db.
WP Wetted perimeter 111
xo Initial displacement of particle 111
Xn Displacement of particle at nth stage In
z Height of dryer 111
a Transition angle degree
13 Constant for k-E turbulence model
RNG Constant for RNG k-E turbulence model O
X Constant
5 Constant
& Dissipation rate 1112 S-3
4). The solution of relevant quantity
7 Constant

x ii
Peff
PT
li w
II.
11
Thermal conductivity
Molecular viscosity
Effective viscosity
Turbulent viscosity
Air viscosity at surface temperature
Air viscosity at bulk temperature
Constant for RNG k-E turbulence model
W m-2 K-I
kg m-1 s -1
kg ni-I s -I
kg rn-I -I
kg rri-I s -I
kg rn-I s -1
0 Dimensionless time
PP Density of particles kg m -3
Pf Density of air, fluid kg In-3
a Standard deviation of residence time distribution s-2
Uk,ae Constant for k-E turbulence model
a E RNG Constant for RNG k-E turbulence model
T Mean residence time s
Tv Momentum response time s
TT Characteristic convective time for the flow field s
to Vorticity Red s -I
4 Fitting pressure loss coefficient
Ft Eddy diffusivity kg m-I s -I
AP Total pressure loss Pa
il Pressure strain term for Reynolds stress turbulence model kg m S -3
9i Gas constant Nm kg' IC I
D Dispersion number
uL
xxiv

Chapter 1 Introduction 1
Chapter 1
INTRODUCTION
1.1 NEED
The rice yield of farming systems in Thailand is increasing due to many factors, such
as high-yielding non-photoperiodic varieties, irrigated farms, high fertiliser inputs and
the development of agricultural machinery, etc., which result in double or triple
cropping systems.
At least one paddy (rice) crop is harvested during the rainy season, and there are many
difficulties associated with this wet crop production. Because of the large crop
production, some of the products cannot be harvested on time. This has resulted in
losses of product stability, which can lead to biochemical deterioration of grain. This
deterioration takes the form of general discolouration, yellowing, germination and
damage to milling quality. Immediate threshing and drying of the wet harvest is the
only practical method to arrest deterioration.
1.2 PROCESS
During 2000-01, 25.608 Mt of paddy was produced in Thailand. This comprised
19.552 Mt from the main year crop and 6.055 Mt from the second crop (Agricultural

Chapter 1 Introduction 2
statistics crop year 2000-01, Office of Agricultural Economies, Thailand, 2002). The
main year crop is harvested in the dry season, while the second crop is harvested in
the rainy season. The combine harvester does most of the harvesting work. The plant
is cut and threshed in the combine harvester. Then, the paddy is sold to the rice
millers or transported to the barn. Most farmers sell the paddy to rice millers
immediately, because they have no storage facilities or need to obtain the cash.
Furthermore, the grain deteriorates more quickly in the rainy season.
During the harvesting season of the second crop, a high moisture content is usually
found in the air. Rice harvested from the field contains about 24-28% moisture
content wet-basis (De Padua et al., 1985), while a general moisture content of 14 %
wet-basis gives the paddy a longer storage life and higher milling quality (Kunze et al.
1980). An 18 % moisture content wet-basis of threshed rice is generally preferable to
the rice miller, and the price decreases when the moisture content increases. The
drying process plays an important role to maintain the quality and increase the price
of paddy.
1.3 CURRENT DRYING METHODS
Solar drying is usually practised. In this method, a thin layer of grain is spread on an
apron in the ambient air. This method is still the most commonly used in Thailand. In
the dry season, paddy grain can be dried within a few days by solar drying. However,
it is problematic in the rainy season, which is why the products are then distributed
out to the rice millers as fast as possible. The rice millers have better facilities, such as
high-speed mechanical dryers or sun drying on a concrete apron, to dry paddy.
Heated air-drying has been developed in Thailand within the last few decades. The
dryers which have been developed were mostly batch types and use solar energy, fuel
oil or agricultural waste as energy supplies. However, solar drying is the most popular
method to eliminate the moisture content in paddy, because it is cheapest.

Chapter 1 Introduction 3
1.4 PROBLEMS WITH CURRENT METHODS
Traditional solar drying of spread-out paddy grain is an effective means of reducing
moisture in the dry season. Wet season crops require forced-air drying with heated or
ambient temperature air. In both wet and dry seasons, paddy grain may be treated by
variety of methods, all of which require great care. Drying is a complex process
requiring considerable skill and effort on the part of the farmer; the success with
which the grain is preserved over shorter or longer periods depends on the care and
attention given to the drying and subsequent storage.
Over-heating, under-heating and too-rapid drying can occur during the sun drying
process. The temperature of the sun drying floor surface and the paddy may increase
to as high as 60 to 70 °C. This high, uncontrolled temperature induces severe
temperature and moisture gradients within the paddy kernels resulting in a rapid
drying rate and, consequently, stress checks and cracks. The resulting "sun checking"
of the paddy is a common and, unfortunately, too often accepted form of loss of rice
quality. On the other hand, slow drying results in deterioration due to fungi and
bacteria, and also leads to losses of paddy grain. Solar drying is undoubtedly a low-
cost method, but there are problems associated with sun drying which often result in a
poor quality product: no control over the drying process, possible contamination of
the product, and its labour intensiveness.
1.5 TARGET USERS
As mentioned in the previous section, the drying process plays an important role to
maintain the quality and increase the price of paddy. For the farmers, a better
purchasing price will be obtained at 18 % moisture content wet-basis. For rice millers,
the length of storage life depends on the moisture content in paddy grain, and 14 %
moisture content wet-basis is the best. Therefore, the development of rice dryers is
needed not only for farmers but also for rice millers. The development of rice dryers
requires the following steps:

Chapter 1 Introduction 4
1. First determine the quantity and nature of the product to be dried and the
particular consumer requirements. By determining what the initial and final
moisture content are and the maximum drying time, quantity to be dried per
batch, dryer bed size, amount of moisture to be removed, and heat required to
remove moisture, a required air flow rate can be established.
2. A prototype dryer should be built and initial tests carried out, and a consumer-
acceptance analysis should be conducted.
3. Feedback data from consumers should be used in prototype modification until
the prototype is suitable for the drying of a high-quality product acceptable to
the consumer.
1.6 THESIS OUTLINE
The thesis outlines the development of a forced air rice dryer based on the previously
discussed requirements. The remaining chapters are structured as follows.
Chapter 2 reviews rice (paddy) dryers used in Thailand and their commercialisation.
The effect of their operating parameters on rice quality is also reviewed. The most
promising dryer for paddy grain is identified.
Chapter 3 develops mathematical modeling of heat and mass balance between air and
rice (paddy) and tests the applicability of a simple pneumatic dryer for rice (paddy)
drying. Simulation results for different operating parameters are discussed.
Chapter 4 introduces the design and development of a proposed cyclone dryer.
Preliminary studies of rice grain flow inside a model cyclone dryer chamber are
reported.
Chapter 5 details a series of single-phase flow field simulations inside the cyclone
dryer chamber with the commercial RANS-based computational fluid dynamics

Chapter 1 Introduction 5
(CFD) package CFX 5.7. The Numerical results are validated using experimental
results obtained from the laboratory scale model cyclone dryer.
Studies of solid-gas flow in the model cyclone dryer using paddy grain and silica gel
particles are reported in Chapter 6. Experimental results with different operating
parameters are discussed. Numerical simulations for paddy grain and silica gel
particles are presented and compared with experimental results.
Experimental and numerical results for heat and mass transfer in the laboratory scale
cyclone dryer are reported in Chapter 7. A strategy for scaling up the model cyclone
dryer to a commercial sized unit is identified.
Chapter 8 gives the conclusions and recommendations for the study.
All references are located at the back of the thesis.
The appendics are placed in a separate volume.

Chapter 2 Overview of Paddy Drying in Thailand 6
Chapter 2
OVERVIEW OF PADDY DRYING
IN THAILAND
2.1 INTRODUCTION AND DEFINITIONS
"Drying" is the word commonly used to describe any process in which water is
removed from a substance. Drying may be defined as the removal of volatile
substances by heat from a mixture to yield a solid product. Commonly, the principal
volatile substance is water. Many agricultural products, especially cereal grains, must
be dried to preserve their quality.
There are various ways to classify a grain dryer. An important technological
characteristic of convective grain dryers is the state of the grain layer during drying,
which, to a great extent, governs the heat and mass transfer parameters of the drying
process. Based on this, all convective grain driers may be classified into four types:
1) Dryers with grain in a stationary or fixed bed;
2) Dryers with grain in a moving bed;
3) Dryers with grain in a "boiling" or fluidised bed layer;
4) Dryers with grain in suspension.

Chapter 2 Overview of Paddy Drying in Thailand 7
2.1.1 Fixed Bed Dryers
Grain drying in a stationary layer is characterised by the fact that the velocity of grain
(vp) is zero and the velocity of the drying agent (vf) is less than the terminal velocity
of grain (vt). Dryers in which drying is conducted in a fixed bed are operated
intermittently and are simple in construction. They are suitable for small farm usage
because they do not need large capital investment and they provide long service.
Moreover, they may also be used as storage bins after drying. This type of grain dryer
may be further classified into tray dryers, through dryers, chamber dryers, belt dryers
and forced circulation dryers.
2.1.2 Moving Bed Dryers
In moving bed dryers, the velocity of the grain is greater than zero (vp > 0) and the
velocity of the drying agent is less than the terminal velocity (vf < v t). Examples of
this dryer type are the drum (rotary) dryer, vibrating grain dryer, shaft dryer and
louvred dryer.
2.1.3 Boiling Bed Dryers
In boiling bed dryers, the velocity of the grain is varied from zero to the terminal
velocity (0 < vp <vt) and the velocity of the drying agent is greater than the terminal
velocity (vf > vt). The force exerted by the drying agent moves grains in the dryer.
The grain layer swells and its height and volume increase to some extent. When the
weight of individual grains is balanced by the drag force, the grain velocity is zero.
Grain drying in a boiling bed may be achieved in a spouted bed dryer or a fluidised
bed dryer.
2.1.4 Suspension Dryers
Suspension dryers have the velocity of grain (v p) equal to the velocity of the drying
agent (vf), which is much greater than the terminal velocity (vf >> v t). Grains are

Chapter 2 Overview of Paddy Drying in Thailand 8
moving along with the drying agent in the dryer. This type of dryer is called a
pneumatic dryer or stream dryer.
As mentioned in Chapter 1, various types of paddy dryer have been developed and
tested in Thailand over the last few decades. Most of them used heated air as the
drying agent. The primary design criterion was simplicity in construction and
operation. The earlier machines were fixed bed dryers that used solar energy or
agricultural waste as a heat source. They were implemented in rural areas of Thailand
but none was attractive for the Thai farmer. Later developments included moving bed
and boiling bed paddy dryers. Commercial rice millers adopted some of them, but
there is still no acceptance of these types by farmers.
The purpose of this chapter is to review the present state of the art in the development
of paddy dryers in Thailand. Their design, operation and performance in terms of
capacity, energy consumption and product quality will be analysed; the constraints
and problems with each type of dryer will be reported. Their capacity is expressed in
terms of 'hold-up', which means the amount of drying material remaining in the
drying chamber during steady state operation. The product quality is measured by
percent of head rice yield, which is defined as the ratio of the mass of rice kernels
having a length at least 8/10 of an intact rice kernel to the total mass of rice. It is
usually measured by random sampling from the processed rice.
2.2 BACKGROUND AND DEVELOPMENT
In 1976, the Agricultural Engineering Division (AED), Department of Agriculture of
the Government of Thailand, began work on post harvest technology with the support
of the International Development Research Centre (IDRC). The survey on post
harvest practices of farms conducted in that year indicated that the introduction of a
farm grain dryer was essential because of the government support for second cropping
in various part of country. The second crop was harvested during the wet season; this
caused quality losses because of mould infection and changes in colour, giving a low
milling yield.

Chapter 2 Overview of Paddy Drying in Thailand 9
2.2.1 Batch Type Paddy Dryers
A batch type fixed, flatbed paddy dryer with capacity 1-2 t was developed and tested
by AED in 1977. The design basic for this dryer was simplicity of operation and
construction, and an ability to be constructed using local materials and labour. Figure
2.1 shows the design and construction of the AED batch type dryer.
Grain was dried by hot air at a temperature of 43-38 °C. Heat was supplied by
burning diesel oil or rice hull. When a 1 t/batch of paddy was dried with an air flow
rate 107 m3/h, it took 3-6 hours to reduce the moisture content of paddy from 20-26 %
to 14 %. The rate of drying was about 2 % of moisture content per hour. Fuel
consumption was estimated to be 0.7-1.07 f / t of paddy / 1 % (wet basis) of moisture
reduction, for a 6 kW diesel engine and burner (Singhagajen, 1981).
A study made by the Philippines National Post Harvest Institute for Research and
Extension (NAPHIRE) with the assistance of the IDRC documented the constraints
perceived by both users and non-users of this dryer in the private sector. There were
frequent complaints against heated-air dryers as follows (De Padua, 1985):
1) Dryer capacity is too great or too small: a 2-ton batch dryer was observed to be
too large for farmers' requirements, but too small for rice millers;
2) High fixed cost required and/or limited capital available;
3) High operating cost for the fuel burner;
4) Claims of poorer quality milled rice than with sun drying, higher percentages of
broken grains in milled rice, darker colour, and non-uniform drying;
5) Dryers said to be inconvenient. (Heat and dust are mentioned.)
2.2.2 Solar Paddy Dryer
Exell et al. (1979) have developed a simple solar dryer designed to provide the rice
farmer in Thailand with a cheap and simple but efficient method for drying in the wet
season. Their dryer and components are shown in Figure 2.2.

Rice-hull bin Rice-hull furnace Grain-holding bin Grain
Cool air
•ii-v Hot air Cyclone
Air chamber
Canvas duct Per forated
floor
Chapter 2 Overview of Paddy Drying in Thailand 10
Diagram of the farm grain dryer.
Components of the paddy dryer: (I) grain bin (244 )( 244 x 122 cm). (2) thermometer, (3) screen (no. 8'h), (4) canvas air duct, (5) engine (6 kW), (6) rice-hull furnace, (7) air duct, and (8) cyclo fan.
Figure 2.1 Paddy dryer developed by AED (Singhagajen, 1981)

Chapter 2 Overview of Paddy Drying in Thailand 11
The three main components are the solar collector, paddy box and chimney. The solar
collector consists of a matte-black substance spread on the ground and provided with
transparent top and side covers. The dryer was initially designed with a bed of burnt
rice husk as an absorber and clear UV-stabilised polyethylene plastic sheet as the
transparent cover. However, these could be substituted with locally-available
materials such as charcoal, black plastic or black-painted metal sheets, dark coloured
pebbles, etc.
The paddy box, located at waist level, is made of perforated material which allows air
to pass through easily but is able to contain the grain. A door is provided to load and
unload paddy at the back. The roof and sides of the box are covered with clear
material, such as polyethylene plastic sheet. The box can be made of straw, but should
be strong enough to hold paddy up to a depth of about 100 mm.
The chimney consists of a light, strong frame covered with a matte-black material. A
top cover above the chimney keeps out the rain. The black material could be black
plastic or black-painted metal sheet.
The principle of operation of this dryer is very simple. Sunlight passes through the
clear plastic sheet and is absorbed by the black absorber bed, which in turn heats up
the air inside the solar collector. The warm air then rises and passes up through the
paddy box. The chimney gives a tall column of warm air to increase the airflow
through the paddy by natural convection. The airflow is increased further if the air
inlet to the bottom of dryer faces the direction of the prevailing wind. The paddy in
the box is also heated up by direct absorption. Drying is thus by both direct and
indirect heating modes. Experiments conducted during the wet season
(Boonthumjinda, 1983) showed that:
- drying was faster in the top and bottom layers because of the subsequent
increase in humidity of the air during its passage through the paddy bed and
the direct heating effect of the top layer;
- stirring of the paddy bed reduced drying times by half;
- optimum bed depth during the wet season was 100 mm
- the use of a chimney reduced drying time by about 10%.

ALL DIMENSIONS IN PAM
Chapter 2 Overview of Paddy Drying in Thailand 12
Boonthumjinda et al. (1983) reported that the main problems encountered during field
tests of this solar dryer conducted in Thailand were:
damage of plastic sheets caused by vandals, dogs, strong wind and heavy
rain;
- short life span of the polyethylene sheets used and hence frequent
replacement costs,
- loading and unloading was found to be slow and tedious.
The general experiences and opinions of farmers who participated in the field tests
could be summarised as follows:
- construction materials should be changed in order to lengthen the life of the
dryer and reduce general maintenance requirements;
- the dryer should be made transportable to simplify bringing the dryer to the
paddy field;
- capacity should be increased to 2-5 tonnes to cope with the harvest.
Figure 2.2 AIT solar paddy dryer (Exell et al., 1979)
CLEAR PLASTIC COVER
GALVANIZED SHEET
INSULATION PADDY GRAINS
HOT CHAMBER
FAN
• AMBIENT AIR
Chapter 2 Overview of Paddy Drying in Thailand 13
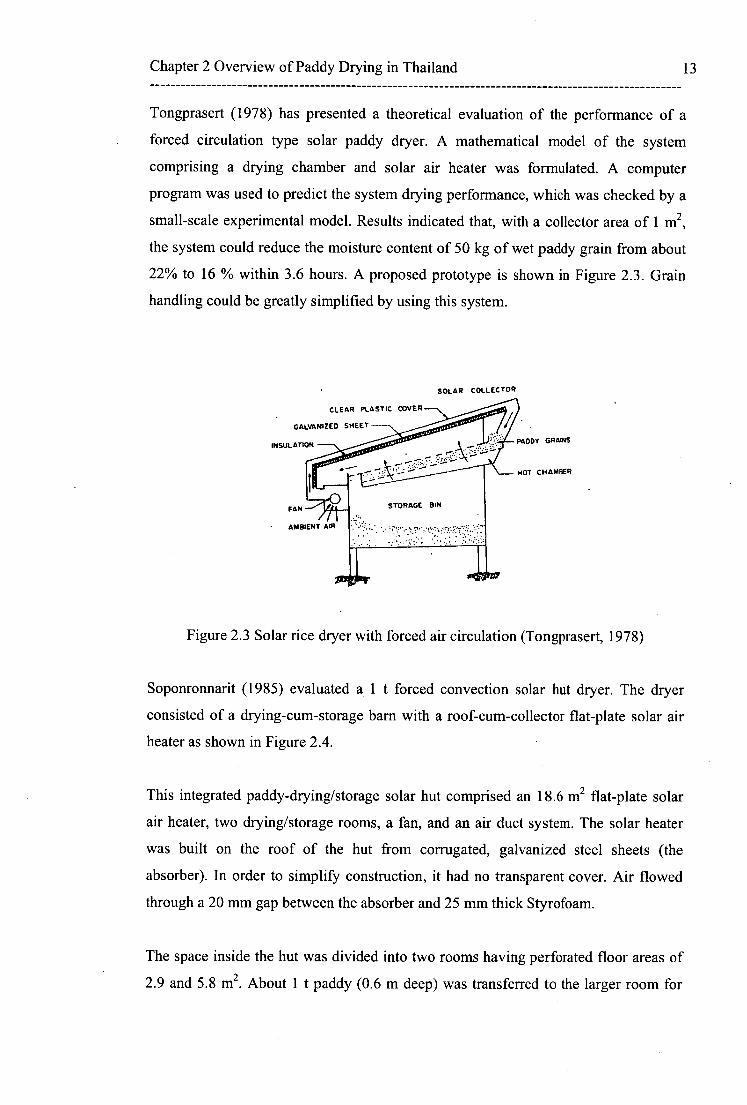
Tongprasert (1978) has presented a theoretical evaluation of the performance of a
forced circulation type solar paddy dryer. A mathematical model of the system
comprising a drying chamber and solar air heater was formulated. A computer
program was used to predict the system drying performance, which was checked by a
small-scale experimental model. Results indicated that, with a collector area of 1 m 2 ,
the system could reduce the moisture content of 50 kg of wet paddy grain from about
22% to 16 % within 3.6 hours. A proposed prototype is shown in Figure 2.3. Grain
handling could be greatly simplified by using this system.
SOLAR COLLECTOR
Figure 2.3 Solar rice dryer with forced air circulation (Tongprasert, 1978)
Soponronnarit (1985) evaluated a 1 t forced convection solar hut dryer. The dryer
consisted of a drying-cum-storage barn with a roof-cum-collector flat-plate solar air
heater as shown in Figure 2.4.
This integrated paddy-drying/storage solar hut comprised an 18.6 m 2 flat-plate solar
air heater, two drying/storage rooms, a fan, and an air duct system. The solar heater
was built on the roof of the hut from corrugated, galvanized steel sheets (the
absorber). In order to simplify construction, it had no transparent cover. Air flowed
through a 20 mm gap between the absorber and 25 mm thick Styrofoam.
The space inside the hut was divided into two rooms having perforated floor areas of
2.9 and 5.8 m2 . About 1 t paddy (0.6 m deep) was transferred to the larger room for

I Pertootted non Sheet 0 Ormn thick DAMN 0081
2 GYPourn board Finon thick 3 With StrOpOrt 4 Shding pale for unloading paddy 5 Remoymble partition 8 Sliding gale
I Flat plate solar celled*, 2 Contrilugal Ian 3 Air duct 0 0.3m 4 Rectangular air duct 0,I5rn it 0.4m 5 Steling valve 0 Gypaum board Ilmm thick
Wall suppotl 8 ROM flow 9 Shallop GM tor unloading paddy
Direction of an Um
Chapter 2 Overview of Paddy Drying in Thailand 14
storage. However, both could be used for drying and/or storage. The maximum
storage capacity was about 10 t at a depth of 2 m.
A 0.3 m centrifugal fan with forward-curved blades, driven by a 3.7 kW diesel engine,
was used to draw heated air from the solar air heater and pass it through the paddy in
which drying took place. The fan could be driven by a power tiller engine or an
electric motor. Normally, it was operated during the daytime at 1500-1900 rpm,
corresponding to an engine speed of 1200-1500 rpm and a power requirement of 2.2-
2.9 kW.
Figure 2.4 Integrated paddy-drying/storage solar hut (Soponronnarit, 1985)
The efficiency of the solar collector varied from 7-29% at airflow rates of 0.027-0.041
kg/s/m2 of collector, with high variability due to changing of the wind velocity. Heat
obtained from the solar air heater varied from 20 to 81 MJ/day when the global solar
radiation was 15 MJ/m2/day.

Chapter 2 Overview of Paddy Drying in Thailand 15
Three runs of drying experiments were conducted during the wet season and 10
during the dry season. The resulting performance estimates indicated drying rates of
0.64 and 0.3 % wet-basis/t of dry paddy/h, and fuel consumption of the diesel engine
driving the fan of 1.13 and 2.08 t / t of dry paddy / 1 % wet-basis moisture reduction,
for drying paddy during the dry and wet season, respectively.
The head rice yield after milling varied from 45-50 % and germination was greater
than 92 %. About 7 t of paddy was stored in the solar hut for 5 months (January-
May). It was found that the quality of the stored product remained high. There was no
evidence of losses due to birds or rats.
The farmers who participated in this project were interested in drying wet paddy
harvested during the wet season in order to prevent it from spoilage due to rain. They
were also interested in storing paddy and selling it when the price was reasonably
high. Their interest arose from the ease of operation of the hut and because it did not
conflict with their traditional post harvest practices. However, they would not accept
solar hut drying during the dry season because paddy could then be dried easily in the
field within 2 or 3 days.
The integrated paddy drying and storage solar hut is seem to be an ideal dryer for the
farmer who harvests about 10 t of paddy per season and grows two crops per year.
However, energy consumption for drying is still high. This is due to the use of a
centrifugal fan, which is needed to overcome the significant pressure loss in the
system from the bed of paddy grain.
2.2.3 Rotary Paddy Dryer
Puechkamutr (1985) designed and constructed a natural convection rotary dryer for
paddy. Components and details of this dryer are shown in Figure 2.5. The basic
design concept was to dry free-flowing material such as grain by means of both
conduction and convection heating from the pipe heat exchanger and the rotary
cylinder itself during movement of the material. Air was heated by combustion of rice
husks inside the furnace, and was passed through the pipe heat exchanger to avoid

1 Rice husk feed hopper
2. Feeding troy
3. Electra magnet
4. Furnace
5. Inclined grate
6. Ash tray
T ash trap
8. Cover plate
9. Five heat exchanger
Faddy feed hopper
Slide gate opening
12_ Circular fin
13. Triangle steel sheet
14. Fertorated cylinder
15. Annular ring
16. Spiral . fin
IT Straight baffle
18. Guioe ring
16. SProcket
2Q Choir.
21. Ball bearing
22. Frame
23 Adjustable bait
24. Variable speed motor
25. Outlet tray
28. Rectangular box
27 Butterfly valve
25.. Chimney
29. Flo:v.001 insulator
Chapter 2 O
verview of Paddy D
rying in Thailand
cr■

Chapter 2 Overview of Paddy Drying in Thailand 17
2.2.4 Mixed Flow Paddy Dryer
In 1993, the government of Thailand set up two main projects for the use of
mechanical dryers. The objective of the first project (duration of 2 years) was to
extend loans with low interest rate to rice millers in order to purchase the Louisiana
State University (LSU) type dryer, which had a capacity of 120 t/day. The objective
of the second project (duration of 4 years) was to extend loans for 20 units of 100
t/day LSU-type dryers to government cooperative millers and 80 units of 20 t/day
small-scale dryers, designed and developed by the AED for groups of farmers at the
village level (Chamsingl et al., 2000).
The LSU dryer is a continuous flow, moving bed, heated-air, columnar, mixing type
dryer. The drying chamber is shown in Figure 2.6. The flow of rice is diverted from a
straight downward path by rows of baffles through which the heated air is introduced
or exhausted. The pattern of airflow and path of rice flow for this dryer is illustrated
in Figure 2.6.
Figure 2.6 Drying chamber of the Louisiana State University dryer

Chapter 2 Overview of Paddy Drying in Thailand 19
_
Figure 2.7 Diagram of fluidised bed paddy dryer (Soponronnarit et al., 1996a)
Throughout the wet season of 1994 the prototype fluidised bed dryer was used for
drying high moisture content paddy. No repair was required. The owner of the rice
mill assessed the unit as having:
- ease of use;
- very fast drying rate, especially at high moisture level;
less energy consumption in terms of electricity and diesel fuel oil and more
uniform product moisture compared to existing dryers.
Due to the success of the prototype, the owner of the rice mill where the prototype
was tested ordered a larger fluidised bed dryer unit with an adjustable capacity of 2.5-
5 t/h. Commercial fluidised bed paddy dryers with capacities of 5 t/h and 10 t/h were
produced at the beginning of 1995 (Soponronnarit et al., 1996b). Figure 2.8 shows the
components of the letter fluidised bed paddy dryer.
In order to make the fluidised bed paddy dryer more convenient to use, especially in
harvesting areas remote from rice mills where electricity is not available, a project on
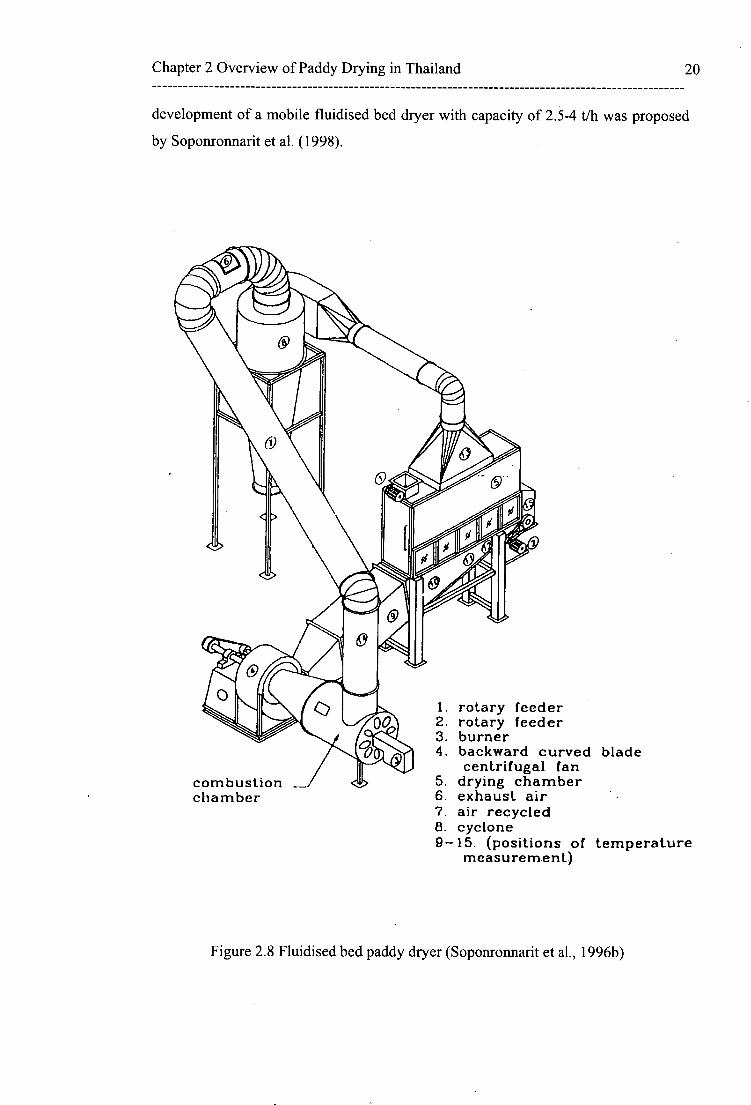
Chapter 2 Overview of Paddy Drying in Thailand 20
development of a mobile fluidised bed dryer with capacity of 2.5-4 t/h was proposed
by Soponronnarit et al. (1998).
combustion chamber
I. rotary feeder 2. rotary feeder 3. burner 4. backward curved blade
centrifugal fan 5. drying chamber 6. exhaust air 7. air recycled 8. cyclone 9-15. (positions of temperature
measurement)
Figure 2.8 Fluidised bed paddy dryer (Soponronnarit et al., 1996b)

Chapter 2 Overview of Paddy Drying in Thailand 21
The mobile fluidised bed dryer was designed and constructed by the research group
on drying technology at King Mongkut's Institute of Technology Thonburi. The
capacity was 2.5-4 t/h. The dryer was installed on a 2x4 m trailer. It comprised a
diesel burner, 0.6x2.1x0.8 m drying chamber and paddy hopper, backward-curved
blade centrifugal fan driven by an 11.2 kW motor, 2 bucket elevators, cyclone and
cyclo-fan as shown in Figure 2.9.
After construction, the unit was installed and tested at a private rice mill. Suitable
drying conditions were recommended as follows:
- drying capacity 3.8 t/h;
- bed velocity 2.8 m/s;
average drying air temperature 144°C;
bed height 13.5 cm;
- fraction of air recycled 0.8;
residence time of paddy approximately 1.3 minutes.
Test results showed that the moisture content of paddy was reduced from 32.6% to
25.8% dry basis. Consumption of electrical power and diesel fuel were 12.9 kW and
21.71 f, / h, respectively. Specific energy consumption was 4.2 MJ/kg water
evaporated.
front view rear view
Figure 2.9 Mobile fluidised bed paddy dryer (Soponronnarit et al., 1998)

Chapter 2 Overview of Paddy Drying in Thailand 22
Due to the success of the fluidised bed paddy dryer development and the requirement
to reduce electrical power of the blower motor, Soponronnarit et al. (2001) conducted
research aimed at designing, constructing and testing a vibro-fluidised bed paddy
dryer with capacity 2.5-5 t/h, and developed a mathematical model to determine
optimum operating parameters.
A vibro-fluidised bed paddy dryer was fabricated and tested at a private rice mill. The
unit comprised a diesel burner and combustion chamber, a backward-curved blade
centrifugal fan driven by a 7.5 kW motor, 0.6x2.1x1.2 m drying chamber and 0.6x2.1
m perforated steel sheets with 0.5 mm thickness and 1.1 mm hole diameter. The
vibration system comprised cams, coil springs, watch springs, a 1.5 kW vibration
motor with vibration frequency of 7.3 Hz and vertical amplitude of 5 mm, hopper,
rotary feeder, rotary discharger, recycle air duct and cyclone. A diagram of the vibro-
fluidised bed paddy dryer is shown in Figure 2.10.
Figure 2.10 Diagram of vibro-fluidised bed paddy dryer
(Soponronnarit et al., 2001)

Chapter 2 Overview of Paddy Drying in Thailand 23
Experimental drying conditions were: airflow rate 1.7 m 3/s; bed velocity 1.4 m/s;
average drying air temperature 125-140°C; residence time of paddy approximately 1
minute; bed height 11.5 cm; fraction of air recycled 0.85; and vibration frequency 7.3
Hz and amplitude 5 mm. With a paddy feed rate of 4821 kg/h, moisture content was
reduced from 28 to 23 % dry-basis. Specific energy consumption was 6.15 MJ/kg
water evaporated. The total electrical power of the blower motor and vibration motor
was 55% of the blower motor power used in fluidised bed drying without vibration.
2.2.6 Spouted Bed Paddy Dryer
Wetchacama et al. (1999) conducted experiments of paddy drying in a two-
dimensional spouted bed dryer. Experimental results showed that a linear equation
was suitable for describing the drying rate of paddy, which depends on the hold-up
and drying temperature. The combination of two distinct hydrodynamic features, viz,
the pneumatic transport of particles in the spouted bed (which allows intensive
heating and moisture evaporation) and a falling bed in the downcomer (where
tempering of particles takes place) are the main features of the spouted bed.
Madhiyanon et al. (2001) have studied drying of paddy in an industrial-scale
prototype spouted bed dryer with capacity 3.5 t/h as shown in Figure 2.11.The dryer
consisted of a vertical rectangular chamber 0.6 m in width, 1.45 m in height, and 2.1
m in length. The front wall and both of the sidewalls just above the slanting base of
the drying chamber were fitted with glass windows to permit visualisation of the grain
flow pattern. The slanting base was inclined at 60 ° to horizontal. The air entrance and
spout widths were 0.04 and 0.06 m, respectively. The draft plates were centrally
installed. The entrance height was varied to match the feed rate of paddy.
Heat derived from burning diesel fuel was supplied to heat the air before it entered the
blower. The heated air was forced through the ductwork connected to the drying
chamber. Hot and humid air leaving the drying chamber was discharged into a
cyclone with some portion of it exhausted to atmosphere. The rest (approximately 60-
70% of total circulated air) was recirculated and mixed with ambient air at the
combustion chamber.

Chapter 2 Overview of Paddy Drying in Thailand 24
The paddy travelled upward through the draft channel before raining back onto the
downcomers and moving vertically downward. The paddy movement alternated
between spout and downcomer until paddy came out of the bottom of the drying
chamber.
Experimental results showed that the prototype performed well in reducing the
moisture content of the paddy and yielded high product milling quality. High
temperatures up to 130-160 °C were applied to dry paddy from various initial
moisture contents to the range of 14-25% dry-basis without significant change in
quality. Specific energy consumption was 3.1-3.8 MJ/ kg water evaporated.
Figure 2.11 Industrial-scale prototype spouted bed dryer (Madhiyanon et al., 2001)
2.3 COMMERCIAL PADDY DRYERS
As stated in Section 2.3.2.1, many researchers and research groups in Thai
universities and government institutes have evaluated dryer prototypes of varying

Chapter 2 Overview of Paddy Drying in Thailand 25
designs and capacity. These prototypes were tested for appropriateness at the farm
level, and at cooperatives and commercial millers.
The greatest resistance to artificial drying is understandably at the farm level of
operation. Government programs have generally encouraged the use of small flat bed
dryers compatible with the volume of production in each farm, whose size typically
ranges between 0.25 and 3 hectares. Despite the need for dryers at this critical level of
operation, the acceptance of farm dryers was low. The major causes of this situation
are (Fredericks et al., 1985):
- high acquisition costs beyond the reach of small-scale farmers due to low
production volume;
- unsatisfactory performance of some drying systems introduced;
- lack of technical know-how in dryer operations, resulting in inefficiency and
poor milling results;
- capacity of dryers incompatible with farm production and other processing
equipment; and
the price structure of paddy, which does not seem to reflect adequately the cost
of drying.
A suitable farm dryer is one that is mobile, uses high temperature heat with very short
exposure and residence time of the grain, and provides mixing of the grain. It can be
made cost-effective when operated on a custom basis, as in the case of the mobile
paddy thresher (Tumambing, 1987).
Commercial rice dryers seem to have been successfully developed at the cooperatives
and commercial millers. The continuous moving bed dryer type called the LSU dryer
was developed by Louisiana State University in the mid-1950s. This design was
developed specially for rice, to ensure gentle treatment, good grain mixing, and good
air-to-grain contact. The LSU dryer has become the most widely accepted mechanical
paddy dryer for cooperatives and commercial millers in Thailand. Further
development of the continuous dryer has resulted in the fluidised-bed dryer.
Commercial designs for fluidised-bed paddy dryers are now available. The principle
of operation is to provide sufficient air pressure of fluidise a thin bed of grain, giving

7
2 4
Outlet Moisture 14.2% (wb)
4
Inlet Moisture 19.7% (wb)
Chapter 2 Overview of Paddy Drying in Thailand 26
excellent air/grain contact. Above a certain pressure, related to the weight per unit
area of the paddy bed, the pressure drop across the bed becomes constant with volume
flow rate, so that fast drying can be achieved. By combining high air temperatures and
suitable grain tempering, the fluidised bed offers better economy, gentler grain
handling, and reduced drying times over the LSU dryer.
A combination drying system, in which a single-pass fast-drying stage is followed by
a multi-pass second stage, had been used in large rice mills of Thailand. The high
moisture grain is dried rapidly to about 18% wet-basis using a fluidised-bed dryer in
the first stage. The second-stage is done gently in an LSU type dryer (Rordprapat et
al., 1999). The combination and arrangement of the fluidised-bed paddy dryer and
LSU type dryer differs from rice mill to rice mill. Rordprapat et al. (1999) show the
arrangements of paddy drying systems for three different rice mills (Figures 2.12-
2.14).
1. Pre-cleaner 2. Fluidized bed dryer 3 Cooler 4. LSU dryer 5. Discharge paddy bin 6. Combustion chamber
Figure 2.12 Paddy drying system in Supanthaanya rice mill (Rordprapat et al., 1999)
The first system arranges a fluidised-bed dryer, cooler and two LSU-type dryers in
series. Paddy with bed depth 15 cm is exposed to 130 °C air in the fluidised-bed
dryer; moisture content at the exit is 19.4 % wet-basis. It is then passed through the
cooler for 10 minutes to reduce the temperature. The first and second LSU-type

LJ
Outlet Moisture 14.9% (wb)
Inlet Moisture 22.0% (wb)
I. Pre-cleaner 2. Fluidized bed dryer 3 Cooler 4. LSU dryer 5. Discharge paddy bin 6. Combustion chamber
Chapter 2 Overview of Paddy Drying in Thailand 27
dryers, each with a capacity of 6 t, provide second and third stages of drying at 100 °C and 90 °C air temperature, respectively. Moisture contents at exit from the first and
second LSU dryers are 14.9 and 14.2 % wet-basis, respectively.
Another arrangement is shown in Figure 2.13. A fluidised-bed paddy dryer is
connected to four parallel LSU-type dryers. Paddy with a bed depth of 15 cm is
exposed to 110 °C air in the fluidised-bed dryer; moisture content at the exit is 18 %
wet-basis. It is then passed through a cooler for 10 minutes to reduce the temperature.
The following stage of drying is done in an LSU dryer with a capacity of 7 t. Paddy:is
passed through the LSU dryer four times at 75 °C air temperature; each pass takes 1
hour during which the paddy is tempered for 21 minutes. The final moisture content
of paddy at exit is 14.9% wet-basis.
Figure 2.13 Paddy drying system in Poonsinthai rice mill (Rordprapat et al., 1999)
The third arrangement shown in Figure 2.14 incorporates a tempering bin. A
fluidised-bed paddy dryer and LSU-type dryer are arranged in series. They are
followed by a tempering bin and cooler arranged in series. Paddy with a bed depth 15
cm is exposed to 110 °C air in the fluidised-bed dryer; moisture content at the exit is
17 % wet-basis. It then passes through the cooler to reduce the temperature and is kept
in the tempering bin for 3.6 hours. The LSU-type dryer does the following stage of
drying with 80 °C of air temperature; moisture content at exit is 15.6 % wet-basis.

Outlet Moisture 15.1% (wb)
Inlet Moisture 22.0% (wb)
Chapter 2 Overview of Paddy Drying in Thailand 28
Finally, paddy is kept in the tempering bin for 4.6 hours and cooled in the cooler,
giving a final moisture content of 15.1% wet-basis.
1. Pre-cleaner 2. Fluidized bed dryer 3 Cooler 4. LSU dryer 5. Discharge paddy bin 6. Combustion chamber 7. Tempering bin
Figure 2.14 Paddy drying system in Taweerungruang rice mill
(Rordprapat et al., 1999)
The performance of the above three paddy drying systems with the same type of
components but different arrangements was investigated by Rordprapat et al. (1999).
The paddy quality and energy consumption of each dryer component in each system
were studied. These studies found that the arrangement of dryers and temperature
during each drying stage affected the overall performance of the drying system.
2.4 EFFECT OF OPERATING PARAMETERS ON
RICE QUALITY
The drying operation is not merely considered as the removal of moisture content, as
there are many factors that can be adversely affected by incorrect selection of drying
conditions and equipment. The objective of the rice drying process is to maximise the
drying capacity of a rice dryer with a minimum loss in head rice yield and a minimum
consumption of energy, without affecting the colour and cooking characteristics of the
rice.

Chapter 2 Overview of Paddy Drying in Thailand 29
The head rice yield is defined as the proportion of rice having a length at least 8/10 of
the intact rice kernel. Percentage of head rice provides an estimate of the quality of
head rice and total milled rice produced from a unit of paddy. Colour of rice is
defined as kernel whiteness, which is measured by a colour difference meter. Low
readings indicate the kernel is browning and will be graded as a low quality.
Acceptable values of whiteness for commercial rice millers are not less than 37.
The head rice yield varies with final moisture content and exposure time during
drying. Studies of the effect of drying on rice quality were conducted by Jindal et al.
(1986) and Reyes et al. (1988). Their studies used a rotary conduction unit with
various levels of moisture content and exposure time, and produced similar results. As
indicated in Figures 2.15 to 2.17, heat-treated paddy samples showed an initial
increase in head rice yield depending on the exposure time, heating surface
temperature and initial moisture content. A marked improvement of head rice yield
was observed in rice samples having an initial moisture content of 30% wet-basis. The
increase in head rice yield was attributed to the gelatinisation of starch granules and
cementing of fissures present in the kernel, which prevents excessive breakage during
the milling operation. These results indicate that, in general, continuous rapid drying
of high moisture paddy can be safely carried out to a final moisture content of about
16 % wet-basis.
The factors affecting rice quality during fluidised bed drying were investigated by
Soponronnarit et al. (1994). Head rice yield was compared to a reference sample of
paddy dried in ambient air. Figure 2.18 shows the relationship between relative head
rice yield and final moisture content for an initial moisture content of 43.5% dry-
basis. Head rice yield dropped rapidly when moisture content reached about 23-26%
dry- basis. Due to the relatively fast drying rate, grain surfaces rapidly became hard,
resulting in cracking of grain kernels with further drying. For a drying temperature of
150 °C, relative head rice yield increased when moisture content decreased. This was
due to the gelatinisation effect observed by Jindal et al. (1986) and Reyes et al.
(1988), in high temperature heat treatment of paddy by a rotary conduction dryer.

Chapter 2 Overview of Paddy Drying in Thailand 30
80
70
60 -
50
40
30 -
20 -
10 -
0
12 16 20 24 28 32
Find adsture Cautrint. %
Figure 2.15 Head rice yield as a function of final moisture content of paddy
(agitation speed 14 rpm; feed rate 30 kg/min) (Jindal et al., 1986)
RN) Alobtoso Contort % nt)
Figure 2.16 Head rice yield as a function of final moisture content of paddy
(agitation speed 30 rpm; feed rate 30 kg/min) (Jindal et al., 1986)

Chapter 2 Overview of Paddy Drying in Thailand 31
Final Moisture Cod. % wD
Figure 2.17 Head rice yield as a function of final moisture content of paddy
(agitation speed 40 rpm; feed rate 30 kg/min) (Jindal et al., 1986)
13 16 19 22 25 28 31 34 37 • 40
Final moisture content (%db)
Figure 2.18 Relationship between relative head rice yield and final moisture content
in fluidised bed drying at different temperatures (Initial moisture content 45.3% dry-
basis) (Soponronnarit et al., 1994)

Relat
ive w
hiten
ess(
%)
Chapter 2 Overview of Paddy Drying in Thailand 32
Figure 2.19 shows the relationship between relative whiteness and final moisture
content for an initial moisture content of 45.3% dry-basis. The relative whiteness of
rice kernels was still acceptable (relative whiteness more than 80%) for all final
moisture content values when paddy was dried at 100 °C of heated air. For higher air temperatures (130, 150 °C), relative whiteness decreased rapidly with decreasing final
moisture content. Drying temperature therefore needs to be limited to maintain
whiteness of the rice kernel. Over-heating during drying causes rice kernels to turn
yellow.
60 1 1 1 1 I i 12 1 4 16 18 20 22 24 26 -28 30 32 34 36 38 40
Final moisture content (% db)
Figure 2.19 Relationship between relative whiteness and final moisture content in
fluidised bed drying at different temperatures (Initial moisture content 45.3% dry-
basis) (Soponronnarit et.al ., 1994)
It was concluded from these results that air temperature during drying by the fluidised
bed technique should not be higher than 115 °C to maintain whiteness of the rice
kernel; the final moisture content should not be lower than 23% dry-basis to maintain
the quality of head rice yield.

160
de: 140 - .0
8 120 - v
100 -
so - Ne 41.1 % head rice yield = 41.2 lb Ml =31.8% d.b.. Ref. bead rice yield 2 46.7% Mi =15.6% d.b., Ref. bead rice yield = 44.8%
Chapter 2 Overview of Paddy Drying in Thailand 33
60 r I
15 20 25 30 35 • ao 45 Final moisture content (%. d.b.)
Figure 2.20 Relative head rice yield at different initial moisture contents.
Inlet air temperature 150 (Wetchacama et al., 1999)
Wetchakama et al. (1999) conducted experiments to investigate the quality of high
moisture content paddy drying using the two-dimensional spouted bed technique.
Figure 2.20 shows the relationships between the relative head rice yield and the final
moisture content of paddy at an inlet air temperature of 150 °C, a hold-up of 30 kg,
and initial moisture contents of 31.1, 37.8 and 45.6% dry-basis. The relative head rice
yield compared to the reference sample was higher for initial moisture contents of
37.8 and 45.6 % dry-basis, with values over 100 % indicated. The relative head rice
yield reduced continuously with decreasing final moisture content for the case of an
initial moisture content of 31.1% dry-basis. Such higher percentages of head rice yield
can be explained by the gelatinistion effect in which molecules of the starch granules
are vibrated and the chemical bonds are deformed, resulting in water molecules being
transported to them and forming hydrogen bonds. Eventually, when both moisture and
temperature levels are appropriate, gelatinisation occurs. For temperatures of 130 and
140 °C, and initial moisture contents of 37.8 and 45.6 % dry-basis, the results showed
a similar trend to Figure 2.21, giving an increase of relative head rice yield.

120
110
75
8 •c 90 2 .c 80
rx 70
- Dsying air temp. 130 °C
—11—' Drying' air temp. 140 °C
- Drying air temp. ISO °C
Chapter 2 Overview of Paddy Drying in Thailand 34
20 25 30
35 Final moist= content (96 cl:b.)
60 15
Figure 2.21 Relative head rice yield at different inlet air temperatures
Initial moisture content 31.1 % db. (Wetchacama et al., 1999)
The relative head rice yield for an initial moisture content of 31.1 % dry-basis reduced
progressively with decrease of final moisture content, as shown in Figure 2.21. In this
case, the inlet air temperature seriously affected relative head rice yield; significantly
lower yields were obtained by using higher drying temperatures with the same final
moisture level. This behaviour differs from that in Fig 2.20, particularly at moisture
contents higher than 37.8 % dry-basis, where there is a remarkable increase of head
rice yield during the reduction of moisture content. The reduction of head rice yield
for paddy possessing lower moisture contents is due to large gradients of moisture
inside the grain kernel leading to the formation of stress cracks.
Fig 2.22 shows the relationship between the relative rice whiteness and final moisture
content. At initial moisture contents of 31.1-45.6 % dry-basis, a hold up of 30 kg and
an inlet air temperature of 150 °C, the results indicated that the relative rice whiteness
continuously decreased during periods of reducing moisture content. The relative rice
whiteness curve for the initial moisture content of 45.6 % dry-basis showed a steep
drop in colour values from 100 % at the start to 62 % at a moisture content of 25 %
dry-basis, whereas the rice whiteness values for an initial moisture content of 31.1 %
dry-basis changed insignificantly with the final moisture content. The reason for this
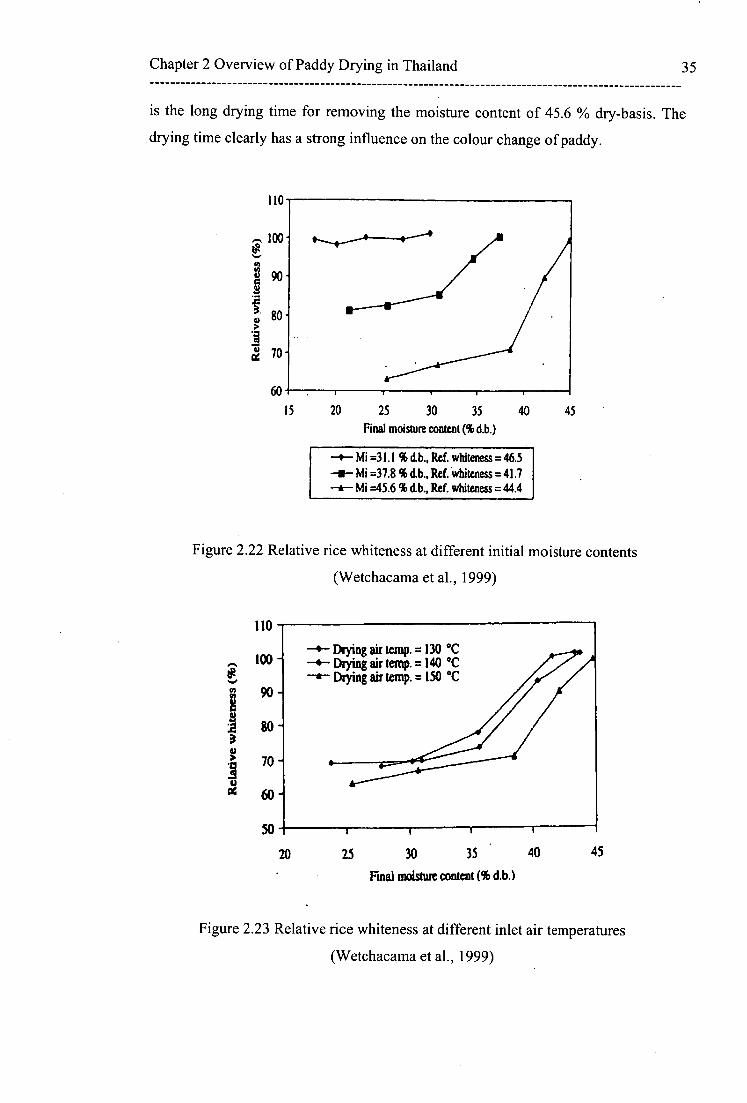
Chapter 2 Overview of Paddy Drying in Thailand 35
is the long drying time for removing the moisture content of 45.6 % dry-basis. The
drying time clearly has a strong influence on the colour change of paddy.
110
-I00
80 -
60 . 15 20 25 30 35 40 45
Final moisture content (% d.b.)
Mi =31.1 % d.b., Ref. whiteness = 46.5 —a— Mi =37.8% d.b., Ref. whiteness = 41.7 - Mi =45.6 % (Lb., Ref. whiteness = 44.4
Figure 2.22 Relative rice whiteness at different initial moisture contents
(Wetchacama et al., 1999)
110
Drying air temp. = 130 °C - Drying air temp. =140 °C - Drying air temp. = ISO °C
100 -
50
20 25 30 35 40 45
Final moisture content (% d.b.)
Figure 2.23 Relative rice whiteness at different inlet air temperatures
(Wetchacama et al., 1999)

Chapter 2 Overview of Paddy Drying in Thailand 36
The influence of drying air temperature on rice whiteness is shown in Fig 2.23. It is
clearly evident that for the same final moisture content the use of higher drying air
temperatures produces lower values of relative rice whiteness, despite the shorter
drying time. In all cases, the colour rapidly decreases during the initial period of
drying and then slowly declines during the remainder of the drying period.
As stated by Kelnin et al. (1986), paddy is a cereal crop in which carbohydrates
predominate. The structure and chemical composition of the seeds of cereal crops
permit as much as 60 % moisture removal during one pass through a dryer. If a lower
moisture content is required, further passes through the dryer can be needed. To avoid
stress cracking of rice kernels, continuous flow dryers are used in association with
tempering bins. After each drying pass of the grain, it is held in a tempering bin where
the moisture within the kernel equalises as moisture diffuses from the interior to the
surface.
The effects of tempering time on head rice yield and rice whiteness was studied by
Taweerattanapanich (1999). A batch-type fluidised bed dryer was used in these
experiments. Paddy was dried from moisture contents of 23-31 % wet-basis to 13-29
% wet-basis at air temperatures of 140-150 °C. Then the paddy was further dried in a
tray dryer with ambient air to 14 % wet basis with and without tempering. The effect
of tempering time on head rice yield and whiteness was investigated
Head rice yield was significantly increased when the paddy was tempered for 0-12
hours. The higher head rice yield of tempered paddy resulted from moisture
redistribution during the tempering period which reduced the stress cracking during
the subsequent tray drying. For 2-8 hour tempered paddy, whiteness was slightly
decreased but it was still in the acceptable range for the rice trade. For tempering
times longer than 8 hour, the whiteness of rice was further decreased and would have
made the products less acceptable for sale.

Chapter 2 Overview of Paddy Drying in Thailand 37
2.5 POTENTIAL TECHNOLOGY FOR PADDY
DRYING
As shown earlier in this chapter, a wide choice of technologies is available for drying
paddy. For high moisture content paddy harvested in unfavourable weather
conditions, especially during the wet season, it has been suggested that drying the
grain in two stages can achieve acceptable results (Tumambing, 1987).
Two-stage drying can be done in various ways, depending upon the drying technology
available, final grain quality desired, weather conditions in the area, and level of
operation. The idea of two-stage drying is to rapidly dry the high moisture content
down to a more manageable level (around 18% wet-basis) using high-speed dryers
(e.g. batch dryer, continuous-flow dryer), or by sun drying if the weather -is
favourable. At this level, paddy may be held for up to three weeks in tropical climates
before excessive deterioration occurs (Driscoll et al., 1986). The second stage - of
drying reduces moisture to the optimum moisture content of 14% wet-basis. The final
drying to 14 %wb. is done in-plant using continuous-flow driers or by gentle drying in
storage. Where solar drying is done properly, mechanical drying in combination with
solar drying is an alternative two-stage drying system.
Sun drying is still the most widely used method of drying high moisture grain
whenever the sun shines. In this method, paddy is spread into thin a layer over
concrete floor and stirred periodically by a grader blade as shown in Figure 2.24.
Due to the unreliability of sun shine in the wet season, mechanical drying is the more
sunshine effective method. The earliest form of mechanical dryer was the batch (fixed
bed) dryer. It was developed for individual farmer operation, but found unattractive
by farmers. Farmers who lacked understanding of the technical aspects of mechanical
drying blamed the dryer for yielding poor quality processed grain, whereas the poor
results were really due to improper adjustment of temperature, airflow and other
drying conditions.

Chapter 2 Overview of Paddy Drying in Thailand 38
Figure 2.24 Sun drying of paddy on a concrete floor
Continuous-flow dryers that move the grain continuously through the dryer exist in
many forms. They must be used with a multi-pass drying procedure to obtain higher
drying capacity and good quality grain. They also require a system incorporating
tempering bins and conveying equipment. Therefore, the potential users of
continuous-flow dryers are commercial millers or farmer cooperatives. Large millers
have also invested in these types of grain dryer, but the performance has been less
than satisfactory, due to a lack of technical know-how in their operation. They are
often installed without tempering bins and operated at higher drying temperatures for
one-pass drying. This inevitably leads to a high percentage of broken grains.
Commercial designs for fluidised-bed paddy dryers now exist. By combining high air
temperature and suitable grain tempering, the fluidised-bed offers better economy,
gentler grain handling, and reduced drying time compared with continuous-flow
dryers. Similar results occur during drying in a spouted-bed dryer. The whole bed of
grain is continually being heated and dried, so the process is very energy-efficient and
uniform, and the grain is automatically stirred in a spouted-bed dryer. The spouted-
bed dryers process large volumes of wet grain quickly. They are used with conveying
equipment, and are usually associated with bulk handling and storage systems and
large potential users of continuous-flow dryers.
Chapter 2 Overview of Paddy Drying in Thailand 39
In spite of the many drying technologies resulting from past decades of research and
development there is still work to be done, especially in designing drying systems
compatible with specific drying requirements at the individual farmer level. This is
especially true for the second crop when paddy is normally harvested at high moisture
content (24-28 %wb). Drying of paddy from 24-28 %wb to 18 %wb is the only
known method to prolong the storage life of grain and increase the selling price. A
suitable dryer for this type of operation is one that is mobile, uses high temperature
heat, and has very short exposure and residence time of the grain. It must be attractive
for individual farmers, if it operated on a custom basis as for the mobile paddy
thresher and combine harvester.
The type of dryer with the most potential for individual farmers' operation is the
pneumatic dryer, in which solids are conveyed concurrently with the air stream. In the
pneumatic dryer, the solid is dried while being transported. The basic and most
commonly used form is the flash dryer. Drying takes place in a vertical tube up
which warm air flows with velocity greater than the free-falling speed (terminal
velocity) of the largest particles in the wet feed. The wet feed is introduced at the
bottom of the tube by means of a suitable feeder.
At the top of the tube, dried product is collected by means of a cyclone or another
collection device. The very short residence time of solids makes the flash dryer well
suited to remove easily accessible surface moisture in the first drying stage, called the
"constant rate period".
A mathematical model of paddy drying in a simple pneumatic dryer will be developed
in the next chapter to investigate the drying behaviour of this kind of machine.

Chapter 3 Mathematical Model for Paddy Drying in Simple Pneumatic Dryer 40
Chapter 3
MATHEMATICAL MODEL FOR
PADDY DRYING IN A SIMPLE
PNEUMATIC DRYER
3.1 INTRODUCTION
This chapter describes paddy grain (rice) drying in a pneumatic conveyor where gas-
particle heat and mass transfer occur simultaneously with transporting and drying
operations. A one-dimensional macroscopic drying model of the overall bed
incorporating mass and energy balances, and drying kinetics of moisture diffusion
inside the paddy grain is developed. The set of coupled non-linear ordinary
differential equations is solved numerically to illustrate the evolution of moisture and
temperature of the paddy grain and air stream throughout the dryer length. The effect
of specific air flow rate, which depends on dryer diameter, paddy feed rate and inlet-
air velocity on the final moisture content and temperature of the paddy grain and air
stream is studied. The feasibility of paddy drying in a pneumatic conveyor for the first
stage of a two-stage drying process is evaluated using the developed model, and found
to be impractical because of the unduly large conveyor length requires.

Chapter 3 Mathematical Model for Paddy Drying in Simple Pneumatic Dryer 41
As discussed in detail in Chapter 2, paddy grain is normally harvested from the field
with a moisture content of about 24-28 % wet basis (wb), which results in high yields
and prevents field loss due to dropping and shattering. However, this moisture content
is too high for safe storage and the grain must be dried to a moisture content of 14 %
wet basis to ensure long storage life and high milling quality. Owing to the high
moisture content of the harvested paddy and unfavourable weather conditions,
especially during the wet season, paddy drying is usually carried out in two stages. In
the first stage, the high moisture content is rapidly reduced to a more manageable
level (around 18-19 % wb) using fast rate drying. This is an appropriate final moisture
content for fast rate drying because the percentage of head rice yield decreases
significantly when the final moisture content is lower than 18-19 % wb. Excessive
moisture removal during fast rate drying could induce stress cracking and lower the
head rice yield.
At 18-19 % wb moisture content the paddy can keep for up to three weeks without
excessive deterioration in quality. During that period, the moisture content of paddy
can be reduced to 14 % wb using a second-stage slow rate dryer. For the individual
farmer, immediate threshing and drying of wet harvested paddy to 18-19 % wb
moisture content is a practical method to arrest deterioration and increase selling
price. A suitable dryer for this purpose is a compact mobile unit that uses high
temperature heating and has a very short grain exposure and grain residence time. It
must be attractive for the individual farmer, if operated on a custom basis as for the
mobile paddy thresher and combine harvester.
3.2 PNEUMATIC DRYERS
The pneumatic conveyor has been used extensively to convey various kinds of grain,
for instance in post elevators transferring to/from ships. In industrial processes, wet
particles can be dried by introducing inlet-heated air to the pneumatic conveyor. In
principle, this dryer offers a number of advantages: very the short contact time and
gas/solid concurrent flow make it possible to dry heat-sensitive materials; and low
maintenance cost due to the small number of moving parts (Strumillo et al., 1986).
Chapter 3 Mathematical Model for Paddy Drying in Simple Pneumatic Dryer 42
Figure 3.1 shows a schematic diagram of a simple pneumatic dryer. It consists of a
heater, material feeder, dryer duct and material separator. Material is introduced into
the gas stream by the material feeder, goes upward through the dryer duct and is
separated at the material separator. The pneumatic dryer considered in the present
study was designed to be part of a mobile threshing-drying-conveying machine using
the thresher exhaust air as the heat source for the drying process.
Steady-state one-dimensional flow and uniform non-shrinking grain models have
been developed to simulate the pneumatic drying process (Thorpe et al., 1973). The
most simple moisture transfer model based on the rate of loss of moisture per unit
mass of solid was used. The mass transfer between particle and air was assumed to be
governed only by external convection. This model was later modified to take account
of particle shrinkage in the pneumatic dryer (Pelegrina et al., 2001). In their model,
the drying of a single particle was assumed to be controlled mainly by convection in
the boundary layer at the particle-air interface. The drying rate depends on the
material properties and the particle size, and the model application is restricted to
sufficiently high water contents. This model can be used to predict the final particle
conditions and provide a design tool; but more complex drying models must be used
when the internal resistance for mass transfer is important. As mentioned by Stmmillo
et al. (1986), the rate of drying of hygroscopic material such as cereal grains is mainly
governed by diffusion of moisture through the particle crust. The mathematical model
of a pneumatic dryer for paddy grain to be developed here will take this effect into
account.
Saastamoinen (1992) developed a one-dimensional steady state and uniform non-
shrinking simulation for flash drying using a more complex model in which the
drying rate was partially controlled by moisture migration to the surface. This model
takes into account the internal resistance for both heat and mass transfer. Later, the
model was applied to the drying process in a large-scale pneumatic dryer by taking
into account shrinking effects on the particle diameter (Levy et al., 1999).
Experimental investigations of the mechanisms of heat and mass transfer in
pneumatic dryers indicate that the heat and mass transfer coefficients are at a
maximum in the acceleration region (Debrand, 1974). The latter study indicated three

(e)
(a) Fan
(b) Heater
(c) Material Feeder
(d) Dryer duct
(e) Material Separator (d)
(a)
Chapter 3 Mathematical Model for Paddy Drying in Simple Pneumatic Dryer 43
locations where a high heat flux was observed between the gas and the particles: (a)
the feeding point; (b) the elbow; and (c) the cyclone. The high flux at these locations
was explained by high values of the slip velocity and a high intensity of turbulence.
The slip velocity between particle and air stream is defined as the difference between
the local air and particle velocities.
Figure 3.1 Diagram of a simple pneumatic dryer
Although extensive research has already been done on the pneumatic dryer, past
efforts have been focussed on industrial drying. No work has been done on drying of
paddy grain (rice). The objective of this Chapter is therefore to develop a model of
paddy drying in a simple pneumatic dryer, and study the feasibility of using this
device for first-stage drying
3.3 THEORETICAL MODEL DEVELOPMENT
To develop the present model, the volume of the pneumatic dryer was split
longitudinally into elemental layers dz as shown in Figure 3.2, where z is the dryer
length in m. The set of differential equations describing heat and mass conservation
for different grain arrangements such as cross-flow, counter-flow and concurrent flow

Chapter 3 Mathematical Model for Paddy Drying in Simple Pneumatic Dryer 44
proposed by Brooker et al.(1992) were applied. In this case, the differential equation
for concurrent flow was used to describe the characteristics of the pneumatic dryer.
The model is based on the following simplifying assumptions:
(1) The paddy kernels are uniform in size and internally homogeneous, and can be
approximated as isotropic spheres of 3.5 mm diameter;
(2) The temperature gradients within the individual kernels are negligible, though
not constant with time;
(3) The volume shrinkage of paddy grain is negligible during the drying process.
This model would be better applicable to dried grain;
(4) Moisture diffusion dominates the drying process inside the grains. This means
that the external convective resistance to mass transfer can be neglected, and the
grain surface moisture assumed to attain instantaneous equilibrium with the
drying air. Surface evaporation of moisture is inherent in this approach;
(5) The effect of heat conduction and moisture transfer between grains, and heat
losses through the dryer walls are considered negligible compared with the air-
grain transfer rate;
(6) The accumulation of thermal energy and water vapour of the air in the dryer
duct is negligible;
(7) The airflow and grain flow are plug-type, and the grain flow can be described
by the Basset-Boussinesq-Oseen (BBO) equation (Crowe et al., 1997) in the
simple form for one-dimensional flow with no rotation of individual grain
particles.
Tp0 Mo '40 Wo Grain out Air out
dz
1 Grain In Air In
Tpi 1\41 Tfi AV;
Figure 3.2 Elemental layer of a concurrent flowing pneumatic dryer

Chapter 3 Mathematical Model for Paddy Drying in Simple Pneumatic Dryer 45
The mass conservation law can be written as
• dM . dW m — = m f (3.1) P dz dz
where m and rh f are the mass fluxes in kg/m2/s for the paddy and moist air,
respectively; M is moisture content of paddy (dry basis) in kg water/ kg dry material;
W is air humidity in kg water/ kg dry air.
From energy balances of grain and air, the air and grain temperature gradients with
respect to dryer height are given by
dT ha p (Tf T p hfg + c v (Tf —Tp )dM P _ dz thc + th Mcc + Mc dz P P P w
(3.3) dz rh f c f + rii f Wc v
where T and Tf are temperatures in K for the paddy and moist air, respectively; h is
the convective heat transfer coefficient in J/m2/K; a p is surface area of paddy per unit
of bed volume in m2/m3 ; c p , c w , c v and c f are specific heats in J/kg/K for paddy,
water, vapour and moist air, respectively; h fg is the latent heat of vaporisation in
J/kg/K.
A differential equation in spherical coordinates based on Ficks' law is used to
describe the moisture diffusion in paddy grain with appropriate initial and boundary
conditions. These are written as (Steffe et al., 1982):
am_ D [a 2 M 42) am] at ett ar 2 r ar (3.4)
=0 , r = 0 and t 0 (3.5) at M=M eg , r=d p and tO (3.6)
M=M 0 , 0 and t=0 (3.7)
where t is time in s; D eff is diffusion coefficient in m 2/s; r is radial distance from the
centre of a spherical particle in m; M eg and M o are moisture contents of paddy (dry
(3.2)
dTf - ha p trf Tp
am

Chapter 3 Mathematical Model for Paddy Drying in Simple Pneumatic Dryer 46
basis) in kg water / kg dry material at equilibrium and initial states; d p is equivalent
diameter of paddy grain in m. The effective diffusion coefficient as a function of grain
temperature is (Poomsaad et al., 2000): -3445.6y1p
De = = 5.68088 x 10 -6 e (3.8)
The motion of paddy grain in the air stream can be calculated from the simplified
BBO equation:
TcdP 3 dv rcp.,d 2p C p lv f — v i (v f — Vp) 1 7-cd 3 (p
P p..)g (3.9)
6PP dtP 8 6 P
where p p and p f are densities in kg/m3 for paddy and moist air, respectively; vf and v p
are velocities in m/s for paddy and moist air, respectively; CD is particle drag
coefficient. The right hand side terms of the simplified BBO equation account for all
the forces acting on each particle: particle drag, buoyancy and gravitation. The usual
mode of flow in a pneumatic dryer is a dilute phase flow. Note that in the present
study, a vertical dilute phase flow in a pneumatic dryer was investigated. As a
consequence, the friction force between particle and wall, which is often encountered
in two-phase flow, can be neglected in the present case.
The drag coefficient of spherical particles (assumption 1) at low Reynolds number
(Re) can be computed analytically using Stoke's law:
24 a,
CD — (3.10) Re
where Re is the Reynolds number based on the particle diameter and slip velocity. For
particle Reynolds numbers sufficiently large for inertial effects to dominate viscous
effects, the drag coefficient becomes independent of Reynolds number and
C D = 0.44, 1000 Re 2x10 5 (3.11)
In the transition region between the viscous and inertial regimes, the drag coefficient
for a sphere can be determined from the Schiller-Naumann drag model for dilute solid
particle flow
CD= —24 (1+ 0.15Re °.687 ) (3.12) Re
The heat transfer in forced convection over a single sphere can be expressed as
(Whitaker, 1972)

Chapter 3 Mathematical Model for Paddy Drying in Simple Pneumatic Dryer 47
Nu = 2 + ( 0.4 Re m + 0.06 Re) rp 0.4 ( ico /1.1w ) (3.13)
where Nu is Nusselt number, hD/k. Re is the particle Reynolds number; Pr is Prandtl
number; ko ; and la w are air viscosities in kg/m/s evaluated at the bulk temperature
and surface grain temperature, respectively. The surface area of particles available for
heat transfer within each elemental layer is given by
— 6(1
d- vd )
a (3.14) P p
V Vd = 1
v f +v
where a p is surface area of paddy per unit of bed volume in m2 /m3 ; vd is bed
voidage. Complementary equations required in order to solve the physical and
thermodynamic properties of paddy grain are summarised (Brooker et al., 1992;
Laithong, 1987) as :
h fg = ( 2502 — 2.386Tp )(1+ 2.496e -21.733m )x10 3
464 1 ln(1— RH) 1 A2
(3.16)
(3.17 )
(3.18)
(3.19)
M eq 100 —3.146 x10 -6 Tp [
= 1.11x10 -3 4.48 c + + M
p p = 1460.695-1.738M
where RH is relative humidity in percent. Thermophysical and transport properties of
wet air are calculated from the following complementary equations (Mujumdar, 1995;
Palowski et al., 1991; Wilhelm, 1976):
P(1 +1.6078M)
0.02399897Tf —1.1654551 x10 -5 Tf2
x10 -8 Tf? + 2.0998405 x 10 -11 T; —12.1507991n(Tf )
(3.20)
(3.21)
(3.22)
(3.23)
Pf 91x Tf
RH =P w
Pws
-7511.52 ln(P) — 89.63121+ ws + Tf
—1.2810336
P x M P — w 0.62198+M
(3.15)

Chapter 3 Mathematical Model for Paddy Drying in Simple Pneumatic Dryer 48
(3.24)
c r 1.00926x10 -3 —4.043x10 -2 t r +6.1759x1ON —4.097x10⁻⁷ q-
X = 2.425x10⁻² +7.889x10⁻⁵ t r —1.79x10⁻⁸ q —8.57x10⁻¹² q (3.25)
= 1.691x10⁻⁵ +4.984x10 -8 t r —3.187x10⁻¹I q —1.319x10⁻¹⁴ q (3.26)
= 1.883x10³ —1.6737x10 -1 Tf +8.4386x10⁻⁴ T/ —2.6966x10⁻⁷ Tr3 (3.27)
= 2.8223x 10 3 +11.828Tr —3.5043x10 2 Tr2 —3.601x10⁻⁵ 11 (3.28)
where X, is thermal conductivity in W/m/K; j. is air viscosity in kg/m/s; t r is air
temperature in °C.
3.4 SOLUTION TECHNIQUE
For integrating the drying equations, the dryer is represented as a series of elemental
layers. Grain moves through the various layers with a constant volumetric flow rate.
The conditions of grain leaving a previous layer are used as input conditions for grain
entering the subsequent layer. The solution of the governing equations involves the
following steps:
(1) The time step required to transit a given elemental layer thickness is calculated
from the mean velocity given by Equation (3.9) using one-step forward Euler
integration. The initial velocity of a particle is assumed zero at the inlet of the
pneumatic dryer.
(2) The radial distribution of moisture inside the grain kernels and the change in
average moisture content for a given time step are calculated from Equations
(3.4) to (3.7). Equation (3.4) is solved numerically using the Crank-Nicholson
implicit method. The average grain moisture content for each height step is
calculated by Simpson integration over the entire radius of the paddy grain.
(3) Knowing the inlet air humidity and the mass fluxes of grain and air, the outlet
air humidity is determined from Equation (3.1).
(4) The temperatures of grain and air at the exit of an elemental layer are calculated
by solving Equations (3.2) and (3.3) using 4 th order Runge-Kutta integration.
(5) The entire procedure is repeated for subsequent layers until reaching the dryer
exit.

Chapter 3 Mathematical Model for Paddy Drying in Simple Pneumatic Dryer 49
A flow chart of the simulation procedure is shown in Figure 3.3. The MATLAB
program in M-file format used for this simulation is presented in Appendix A.
Start
Input Data Air ;Temperature(deg. C) :Tf , Humidity (kg/kg) :W, Volume Flow rate (m3/s) :Q Paddy; Temperature(deg. C):Tp , Moisture Content (kg/kg, dry basis):M
Feed rate (kg/s):F Dryer; Diameter(m):Dthyp, Height of dryer(m) :H, Height increment(m),dz
Calculate : (time in elementary thin layer) M2 (Paddy Moisture content at the end of thin layer) W2 (Air Humidity at the end of thin layer) T of air at the end of thin layer) To( Temperature of grain at the end of thin layer)
Set initial conditions for subsequent elementary layer Tp1 =Tp2 W 1 =W2' T11 =Tf2' M=M , Vr1 =V(2' t 1 =t2
Figure 3.3 Flow diagram of the pneumatic dryer simulation
V
Set initial conditions for first elementary layer Tp1 =Tp, W 1 =W 111 =TP M 1 =M
Vf=Q/A,Vri =0,ti =0 Nostep = H/dz
Chapter 3 Mathematical Model for Paddy Drying in Simple Pneumatic Dryer 50
3.5 SIMULATION RESULTS
3.5.1 Introduction
To evaluate the potential of a pneumatic dryer for paddy drying, a series of
simulations were performed. A dryer of 300 m length was divided into elemental
layers of 0.005 m. The elemental layer thickness was decreased until the solutions for
temperature and humidity distributions along the dryer converged. The calculations
assumed paddy inlet temperature and moisture content values of 30 °C and . 0.333 kg
water / kg dry material, respectively. The inlet air temperature and humidity were
fixed at 110 °C and 0.0215 kg water / kg dry air, respectively. To maintain stable
operating conditions of the pneumatic dryer, the inlet air velocity must be higher than
the minimum spouted bed velocity of paddy of 15 m/s (Wetchacama et al., 1999).
Dryer diameters of 0.2032, 0.1524 and 0.1016 m, inlet air velocities of 15, 19 and 23
m/s, and paddy feed rates of 0.1, 0.75 and 0.5 kg/s were examined. The drying rate of
paddy at various levels of specific air flow rate was evaluated by changing the dryer
diameter and paddy feed rate at constant inlet air velocity. The variations of moistdre
content and temperature of air and grain at various levels through the pneumatic dryer
were calculated. Figure 3.4 shows the resulting simulated distributions of velocity,
temperature and moisture content along the dryer length expressed in terms of the
dimensionless variables vf/vf„ (T-T0)/(Tfl-T0), W/W; and M/M,.
After the entrance region, in which grain particles are accelerated, the grain velocity
curve runs almost parallel to the air velocity curve. In the initial stage, corresponding
to the acceleration zone, the drying rate reaches a maximum. Air temperature
decreases sharply as in all concurrent flow systems, while paddy temperature rises
rapidly from its initial value up to the equilibrium temperature. The paddy moisture
content decreases markedly and air humidity concurrently increases. After reaching
the equilibrium stage, the product temperature tends to decrease keeping equilibrium
with the air. The paddy moisture content then becomes essentially constant, while the
air humidity also tends to plateau.
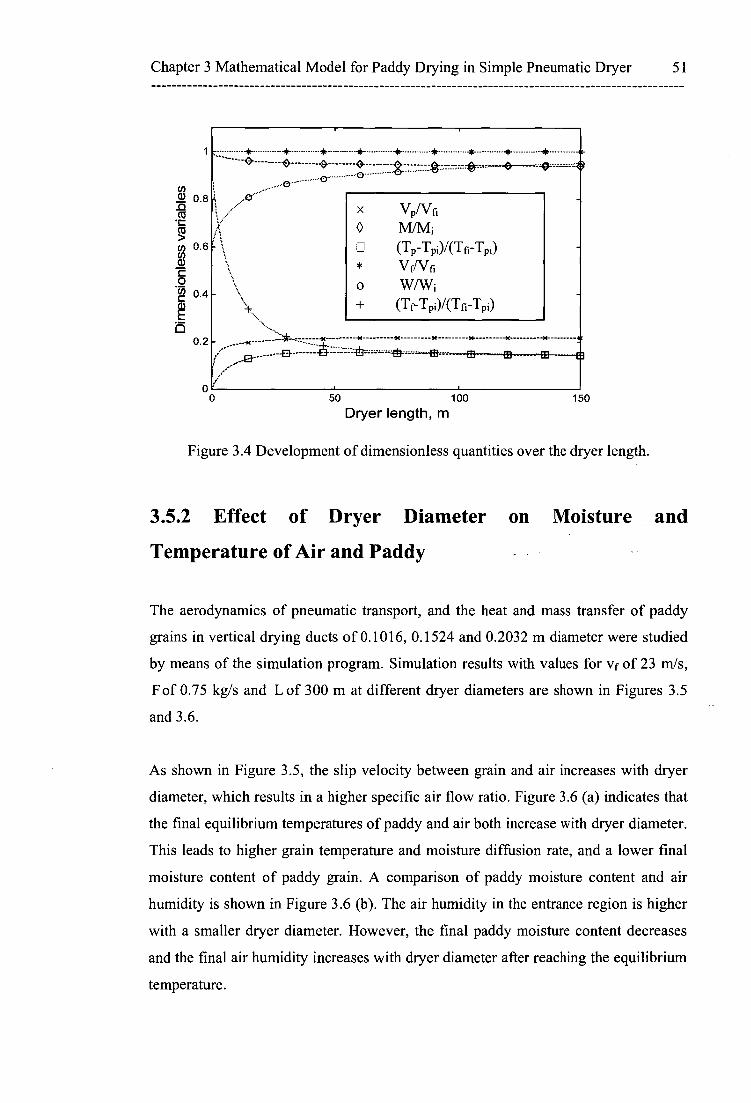
Dim
ens i
onle
ss v
aria
bles
0.8
0.6
0.4
Chapter 3 Mathematical Model for Paddy Drying in Simple Pneumatic Dryer 51
_ -*- * * * * * * * * ---- --- - - <> - -- g
.,0
VpNfi 0 M/Mi
(Tp-Tpi)/(Tfi-To) * V AT f fj
o WAVj (Tr-Tpi)/(Tr, —
-- se -X
• - 0 -- El ; -al- —431
50 100
150
Dryer length, m
Figure 3.4 Development of dimensionless quantities over the dryer length.
3.5.2 Effect of Dryer Diameter on Moisture and
Temperature of Air and Paddy
The aerodynamics of pneumatic transport, and the heat and mass transfer of paddy
grains in vertical drying ducts of 0.1016, 0.1524 and 0.2032 m diameter were studied
by means of the simulation program. Simulation results with values for vf of 23 m/s,
F of 0.75 kg/s and L of 300 m at different dryer diameters are shown in Figures 3.5
and 3.6.
As shown in Figure 3.5, the slip velocity between grain and air increases with dryer
diameter, which results in a higher specific air flow ratio. Figure 3.6 (a) indicates that
the final equilibrium temperatures of paddy and air both increase with dryer diameter.
This leads to higher grain temperature and moisture diffusion rate, and a lower final
moisture content of paddy grain. A comparison of paddy moisture content and air
humidity is shown in Figure 3.6 (b). The air humidity in the entrance region is higher
with a smaller dryer diameter. However, the final paddy moisture content decreases
and the final air humidity increases with dryer diameter after reaching the equilibrium
temperature.
0.2-
•
Oc;

100 50 100 150 200 250 300
Dryer length, m
18
1
i i i I i
f
I I
Dryer diameter 0.2032m
o 0.1524m 0.1016m
I.
17
0.
Chapter 3 Mathematical Model for Paddy Drying in Simple Pneumatic Dryer 52
Figure 3.5 Variation of slip velocity over dryer length with paddy feed rate of 0.75
kg/s and inlet air velocity of 23 m/s for three dryer diameters
Thus, at constant inlet air velocity and paddy feed rate, the drying capacity is
predicted to decrease with dryer diameter. The final moisture content of paddy
decreases with dryer diameter, but the final air absolute humidity and equilibrium
temperature Teg both increase with increasing dryer diameter.
3.5.3 Effect of Paddy Feed Rate on Moisture and
Temperature of Air and Paddy
Figures 3.7 and 3.8 show the effect of paddy feed rate on the variation of slip velocity
and the distributions of temperature and moisture content of air and grain over the
dryer length. The pneumatic drying model was solved for a vertical dryer ( D = 0.2032
m, L = 300 m, vf =23 m/s) at different paddy feed rates ( F = 1.0, 0.75 and 0.5 kg/s.).
Figure 3.7 indicates that the slip velocity increases when the paddy feed rate
decreases. The higher slip velocity leads to an increased specific air flow ratio at the
same dryer diameter and inlet air velocity, which results in a higher equilibrium
temperature Teg

i
E3-
- -4
0 ry•r diameter 0.2032 m 0.1524 m 0.1018 m
-r-
. L L' I 1
7 Dryer diem star ▪ 0.2032 m
0.1524 m 0.1018 m
Dryer diem etcr 0.2032 m 0.1524 m 0.1016 m
I - -
42
Padd
y te
mp
erat
ure
: deg
. C
• 0
38
38
34
32
30
28 0
Padd
y m
ois
ture
con
ten
t•kg
wat
er/k
g dr
y m
ater
ial
*
C 0 C. D
Dryer diam eter • 0.2032 m • 0.1524 m -1- 0.1016m
Chapter 3 Mathematical Model for Paddy Drying in Simple Pneumatic Dryer 53
20 0 50 100 150 200 250 300
50 100 150
200
250
300
Dryer length or
(a)
50
100
150
200
250
300
0.045
0.04
0.035
0.03
0.025
0.02 0 50 100 150 200 250 300
D ryer length : m
(b)
Figure 3.6 Development of: (a) paddy and air temperatures; and (b) paddy moisture
content and air humidity, over the dryer length with paddy feed rate of 0.75 kg/s and
inlet air velocity of 23 rn/s for three dryer diameters.
120
100
80
60
40
0.34
O 335
0.33
0.325
0.32
O 315 0

18
1 I i ;- I I ; 1
i 1 1
I I ; I ; i I I-
I i
1
50 100 150 200
250
300
Dryer length, m
Paddy feed rate 1 kg/s
o 0.75 kg/s 0.5 kg/s
17
16
15
14
13
M 12
11
100
Chapter 3 Mathematical Model for Paddy Drying in Simple Pneumatic Dryer 54
Figure 3.7 Variation of slip velocity over dryer length with dryer diameter of 0.203 m
and inlet air velocity of 23 m/s for three paddy feed rates
As shown in Figure 3.8 (a), the final air and paddy grain temperatures increase when
the paddy feed rate decreases. This results in a higher moisture diffusion at lower
paddy feed rates. As a result of higher moisture diffusion, the final moisture content
of paddy grain decreases sharply with the decrease of paddy feed rate (as clearly seen
in Figure 3.8 (b)).
Due to the increasing moisture transfer, the air humidity (in kg water / kg dry air)
would be expected to increase as the paddy feed rate decreases. This equates to an
improvement in drying performance demonstrated by a lower paddy moisture content.
The temperature charts in Figure 3.8 (a) demonstrate that the system has reached
equilibrium by a dryer length of 200 m for highest feed rate, but has not reached
equilibrium by 300 m for the other feed rates.
This is also indicated in Figure 3.8 (b) by the continuing variation in humidity and
moisture content with dryer length for the 0.75 and 0.5 kg/s solid feed rates. The air
humidity for 0.75 and 0.5 kg/s has not reached a steady level by 300 m; and the slope
of these lines indicates that the equilibrium level will be highest for the lowest paddy
feed rate, even though the simulation was not extended to a dryer length beyond 300
m.

40
Mr
tem
per
atur
e : d
eg.0
110
100
90
80
70
60
50
4-
- 0— 0 0 - (D- 0 C 0 4._ _7,
Paddy Feed rate 1 kg/s 0.75 kg/s 0.5 kg/s
L - sr
Paddy Feed rate 1 kg/s 0.75 kg/s 0.5 kg/s
Paddy Feed rate 1 kg/s 0.75 kg/s 0.5 kg/s
Chapter 3 Mathematical Model for Paddy Drying in Simple Pneumatic Dryer 55
Paddy Feed rate kg/s
0.75 kg/s 0.5 kg/s
50 100 150 200 250 300
Pa
ddy
tem
per
atu
re :
deg.
C
50
45
40
35
30
25 50 100 150
200
250 300 Dryer length : m
(a)
50
100
150
200
250
300 Pa
ddy
moisture
con
tent kg
2
0.335
0.33
0.325
0.32
0.315
0.31
0.305
0.04
0 035
0 03
0.025
0.02 50 100 15 0
200
250 300
D rye r leng th : m
(b)
Figure 3.8 Development of: (a) paddy and air temperatures; and (b) paddy moisture
content and air humidity over, the dryer length with dryer diameter of 0.203 m and
inlet air velocity of 23 m/s for three paddy feed rates.
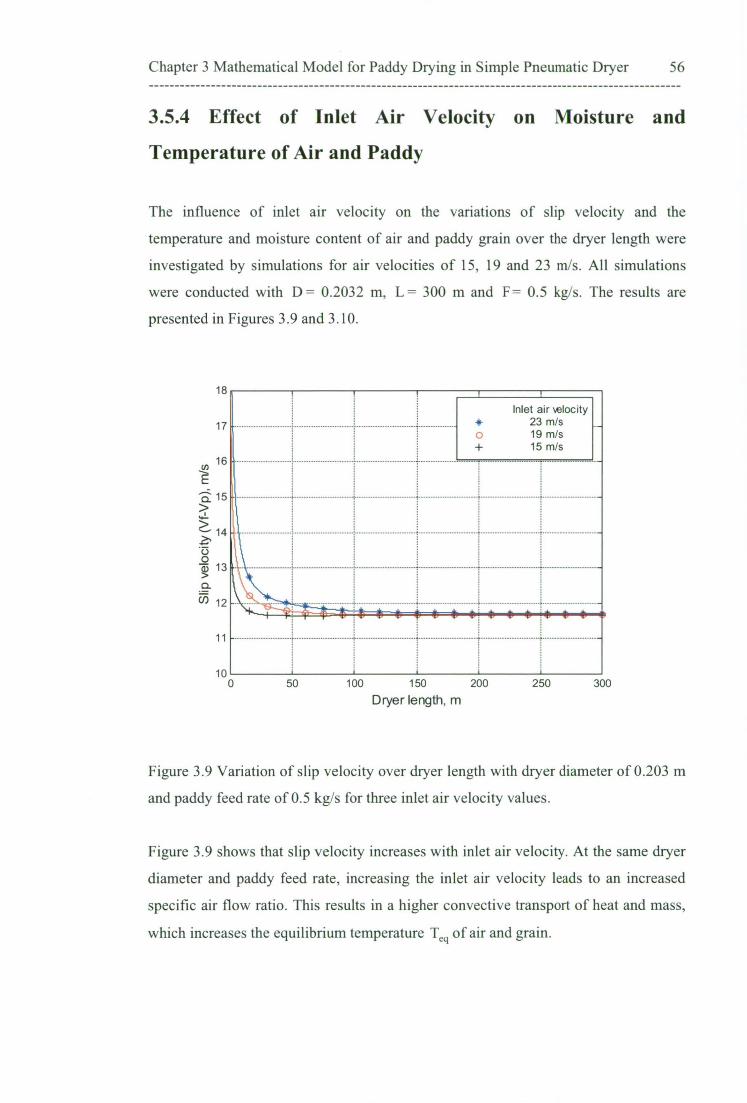
Chapter 3 Mathematical Model for Paddy Drying in Simple Pneumatic Dryer 56
3.5.4 Effect of Inlet Air Velocity on Moisture and
Temperature of Air and Paddy
The influence of inlet air velocity on the variations of slip velocity and the
temperature and moisture content of air and paddy grain over the dryer length were
investigated by simulations for air velocities of 15, 19 and 23 m/s. All simulations
were conducted with D= 0.2032 m, L= 300 m and F= 0.5 kg/s. The results are
presented in Figures 3.9 and 3.10.
Inlet air velocity -111- 23 m/s o 19 m/s
15 m/s
1
18
17
16
15
14
0 a) 13
CI) 12
11
10o
50 100 150 200 250 300
Dryer length, m
Figure 3.9 Variation of slip velocity over dryer length with dryer diameter of 0.203 m
and paddy feed rate of 0.5 kg/s for three inlet air velocity values.
Figure 3.9 shows that slip velocity increases with inlet air velocity. At the same dryer
diameter and paddy feed rate, increasing the inlet air velocity leads to an increased
specific air flow ratio. This results in a higher convective transport of heat and mass,
which increases the equilibrium temperature Teg of air and grain.

Chapter 3 Mathematical Model for Paddy Drying in Simple Pneumatic Dryer 57
As shown in Figure 3.10 (a), the air and grain reach their equilibrium temperatures
within 100 m with an air inlet velocity of 15 m/s. The temperature distribution should
display similar trends at higher inlet air velocity, but did not reach equilibrium
temperature within 300 m. A higher moisture diffusion results when the inlet air
velocity is increased.
The paddy grain temperature rises faster from its initial value and reaches equilibrium
within 300 m at the lower inlet air velocity, but is unable to achieve the equilibrium
temperature within this length at higher inlet air velocities. Figure 3.10 (b) shows that
the paddy moisture content at 15 m/s inlet air velocity reduces rapidly in the
acceleration zone and more gradually after reaching thermal equilibrium. The paddy
moisture content at higher inlet air velocity reduces faster along the dryer length and
does not reach equilibrium. Therefore, the final paddy moisture content at 300 m
dryer length decreases for increasing in air inlet velocity.
At 15 m/s air inlet velocity the air humidity increases rapidly in the initial stage and
then reaches equilibrium. It rises more slowly as the air inlet velocity increases and
does not reach equilibrium within the dryer length. The air humidity increases with air
velocity at end of the dryer.
3.6 DISCUSSION AND EVALUATION OF THE
PNEUMATIC DRYER FOR PADDY DRYING
The final grain temperature must be limited to maintain the quality of paddy after
drying in terms of head rice yield and rice whiteness. Head rice yield and rice
whiteness depend on the grain temperature, moisture gradients, and exposure time.
Gradients produce a dry periphery and wetter centre. The dry periphery tends to
constrict, and develop stress inside the kernel. For high grain temperature and longer
exposure time the starch granules are partially gelatinised, resulting in accelerated
ageing that affects the grain qualities in a way similar to parboiling of rice (Tindal et
al., 1986).

20 0
120
Air T
emp
erat
ure
: deg
.0
100
80
80
40
100 50 150 200 250 300
--I- —1" Inlet Am Velocity
— 23 m /s
it- 19 -i-- 15 m is
42
Padd
y Te
mpe
ratu
re :
d eg
.0
40
38
313
34
32
30
Li
Padd
y m
istu
re c
onte
nt:k
g w
ater
/kg
dry
ma
Air h
um
idity
:kg w
ate
r/kg
dry
ma
teria
l
Chapter 3 Mathematical Model for Paddy Drying in Simple Pneumatic Dryer 58
In let A Ir V io c ty 23 m /s 19 or /a 15 to Is
–•"–
50 100
D
150
rye r length
200 250 300
(a)
0.34 Inlet A ir V sio City
23 m /s 0.335 4 19 m /5
15 m re
0.33
0.325
• . 'HT C. 0.32 r-*
0.315 200 250 0 50 100 150 300
0.04
0.035 .911,
0 03 r-
Inlet A in V sloe ity 0.025 23 m /s
19 m /s 15 m /s
0.02 0 50 100 150 200 250 300
D ryer leng t h
(b)
Figure 3.10 Development of: (a) paddy and air temperatures; and (b) paddy moisture
content and air humidity over, the dryer length, with dryer diameter of 0.203 m and
paddy feed rate of 0.5 kg/s for three inlet air velocities.
28 0

Chapter 3 Mathematical Model for Paddy Drying in Simple Pneumatic Dryer 59
Whiteness of milled rice decreases with increasing grain temperature, drying
temperature and exposure time. Chemical and physical transformations induced by
heating (Maillard reaction) and translocation of colour from rice husk and bran to
endosperm cause discolouration. Longer drying time and higher moisture content
during heating also accelerate the Maillard reaction, but do not affect the rate of water
removal. For first stage drying, the recommended grain temperature is 64-67 °C
(Inprasit et al., 2001). The maximum equilibrium temperature of the pneumatic dryer
was limited to this range in the current simulation.
For a given paddy feed rate the equilibrium temperature increases with inlet air
velocity as shown in Figure 3.11(a). Decreases in equilibrium temperature with
increases in paddy feed rate for a fixed dryer diameter are shown in Figure 3.11 (b).
The initial drying rate increases due to the water activity, the thermal driving force
from the temperature difference between air and grain, and the higher slip velocity.
However, after reaching the equilibrium temperature, the driving force tends to zero
and the drying rate decreases markedly, thus necessitating a longer residence time for
moisture evaporation. As a result, the dryer length required to reach a practical final
moisture content of 22 % db is greatly increased.
Figure 3.12 shows the required dryer length to obtained final moisture contents of 32,
31, and 30% db with values for Tfi = 110 °C, W1= 0.0215 kg water/kg dry air, T p, °C, M, = 0.33 kg water / kg dry material, D = 0.2032 m, F = 0.25 kg/s and vf = 23
m/s. These conditions gave the highest equilibrium temperature Tut = 46.6 ° C. It was
found that the required dryer length was inversely proportional to the value of final
moisture content. Thus, a longer dryer length and lower paddy feed rate would be
necessary to achieve the desired final moisture content of the grain.
3.7 CONCLUSIONS
A one-dimensional mathematical model of a pneumatic dryer, incorporating mass and
energy balances and drying kinetics, has been developed to model paddy drying in
this device. The model was evaluated for different dryer diameters, paddy feed rates,

Chapter 3 Mathematical Model for Paddy Drying in Simple Pneumatic Dryer 60
and inlet air velocities. The simulation results showed the specific air ratio to increase
with dryer diameter and inlet air velocity. In contrast, specific air ratio increased when
paddy feed rate decreased. Increasing specific air ratio also increased the equilibrium
air temperature ( TO and yielded a higher moisture diffusion rate inside the paddy
grain. Hence, the drying rate increased when the dryer diameter and inlet air velocity
increased, while paddy feed rate decreased.
41 47
46 40
45
39 44
38 43
37 42
41 36
40
35 Inlet Air Velocity Inlet Air Velocity 23 m/s 39 23 m/s 19 m/s 19 m/s
34 / 15 m/s 15 m/s 38
Paddy Feed Rate 0.5 kg/s Dryer biameter 02032
33 37
Eq
u ilib
riu
m T
emp
era
ture
:deg
. 0
01
0.15 0.2
0.25
04 0.6 0.8
Dryer Diameter : m
Paddy Feed Rate : kg/s
(a) (b)
Figure 3.11 Variation of equilibrium temperature with: (a) dryer diameter; and (b)
paddy feed rate for, three inlet air velocities.
Due to the huge dryer length and very low paddy feed rate required to achieve a
sufficiently low moisture content, it is concluded that the simple pneumatic dryer is
not practical to use for first-stage paddy drying. It is more feasible to use the
pneumatic dryer as a flash dryer to remove the moisture on free surfaces, as this only
requires a short residence time. In order to make a pneumatic dryer useful for
hygroscopic materials such as paddy grain, the dryer design would have to be
improved to increase the solid residence time and reduce the length of the dryer.

Chapter 3 Mathematical Model for Paddy Drying in Simple Pneumatic Dryer 61
1000
900
800
700
600
500
400
300
200
100
Dry
er L
eng
th: m
0
29.5 30 30.5 31 31.5 32
32.5
Final Grain Moisture Content: kg/kg (dry basis)
Figure 3.12 Required dryer length to achieve different final moisture contents.
(Tfi = 30 °C, Mi = 0.33 kg water / kg dry material,
D = 0.203 m, F = 0.25 kg/s, vf = 23 m/s)

Chapter 4 Cyclone Dryer Technology For Grain Drying 62
Chapter 4
CYCLONE TECHNOLOGY FOR
GRAIN DRYING
4.1 INTRODUCTION
As stated in the previous chapter, the preliminary idea to use a simple pneumatic
conveyor as a dryer is not practical due to the fact that a long residence time is
required. Simulation results in the previous chapter indicate that a long length of
pneumatic transport pipe is required for drying hygroscopic material such as paddy.
In the past, various efforts were made to increase the residence time of a pneumatic
dryer such as recirculating the solid materials in the dryer and designing a multistage
dryer with a delay chamber. However, these efforts were not successful because they
increase the complexity of construction and capital cost due to the need for additional
parts and the conveying system.
Another approach to the design problem is the cyclonic dryer. This is based on swirl
flow or vortex flow which occurs in different types of industrial processing equipment
such as the cyclone separator, hydro-cyclone, spray dryer and vortex burner. The
advantages of this system are that it increases process intensity and residence time of
the solid material. The outcome of this approach was the design of the cyclone dryer.
This recently developed pneumatic dryer with one or more delay chambers gives a

Axial velocity,
Tangential velocity, v,
Inlet Vortex finder
eparation space
Chapter 4 Cyclone Dryer Technology For Grain Drying 63
longer particle residence time than a simple pneumatic dryer or cyclone separator. It is
a medium residence time dryer with solid retained for 5 to 30 minutes. This type of
dryer has been used for drying S-PVC and other polymers (Nebra, 2000; Korn, 2001;
Heinze, 1984; Ulrich, 2002). A brief description of its design and working principles
is given in Section 4.2.
In order to develop the cyclone dryer, it is necessary to review its working principles.
The modelling of the flow pattern inside a cyclone separator, particle terminal
velocity and particle deposition velocity are all topics relevant to the design of a
cyclone dryer. The next section contains short discussions of these topics.
4.2 CYCLONE SEPARATORS
4.2.1 Flow Behaviour
The gas flow pattern in a cyclone separator is fairly well known from experimental
evidence collected over a decade. More recently, Computational Fluid Dynamics
(CFD) calculations have also shown a fair prediction of the flow field inside a cyclone
separator.
Figure 4.1 Flow pattern inside a tangential inlet cyclone separator
(Hoffmann et al., 2002).
Figure 4.1 shows a sketch of a standard reverse-flow cylinder-on-cone gas cyclone
separator with a tangential inlet. The flow pattern is indicated. A swirling motion is
created using the tangential gas injection. The gas flow is downward in the outer part

Chapter 4 Cyclone Dryer Technology For Grain Drying 64
of the swirl and upward in the centre. The downward flow in the outer part of the
cyclone is critically important, as it is the dominant mechanism for transporting the
solids out at the cyclone bottom. Gravity will assist in vertically oriented cyclones,
but its influence is important only for cyclones operating at high solids concentration.
The radial profiles of axial and tangential gas velocity components are sketched on
the right of Figure 4.1. The former shows an outer region of downward-directed axial
flow and an inner one of upward direction flow. As mentioned, the downward
velocity at the wall is the primary mechanism for particle transport through the dust
outlet. The axial velocity often shows a dip around the centre line. Sometimes this is
so severe that the flow is downward directed. The tangential velocity profile
resembles a Rankine vortex: a near loss-free swirl surrounding a core of near solid-
body rotation. Various mathematical models have been developed to predict the
cyclone velocity distribution and pressure drop across the device.
Dx -0- 41-
I hCS
I Figure 4.2 Control surface (CS) of cyclone (Hoffmann et al. 2002)
The radial velocity component is computed in a very straight-forward manner. Near
the wall the radial velocity is neglected. On the control surface CS shown in Figure
4.2 it is assumed uniform, giving the average radial velocity
Iv r (R x 1 V rCS = Q (4.1) 7cR x h cs
where Q is the volumetric flow rate through the cyclone, D x is the diameter of the
vortex finder, which is also the diameter of surface CS, and h cs is the height of the
surface CS.

Chapter 4 Cyclone Dryer Technology For Grain Drying 65
In reality, the velocity on CS is not uniform. There occurs a radial, inwardly directed
"lip flow" or "lip leakage" just below the vortex tube. Thus some portion of the gas
tends to short circuit the imaginary cylinder of height ti cs and diameter D x near the
top of the cylinder.
The tangential velocity distribution in real swirl flow is intermediate between two
types of ideal swirl flows: the first type is a forced vortex flow, which is a swirl flow
with the same tangential velocity distribution as a rotating solid body; the second is a
free vortex flow, which is the way a frictionless fluid would swirl. The tangential
velocity distribution inside a cyclone is given by
v=cr for 0<r < D
° 2
v o — — for — <r <— C 2
r 2 2 (4.2)
where D. is the diameter of the forced vortex core, D is the outer diameter of the
cyclone, and c i and c2 are constants.
For the axial velocity, the surface CS is assumed to separate the outer region of
downward flow from the inner region of upward flow. Axial velocities in each region
are assumed to be uniform over the cross section. The upward axial velocity for the
inner region of radius R, is
4Q Va,u 2 (4.3)
nR x
Mass conservation for incompressible flow gives the average downward axial velocity
va,d for the outer annular region between radii Rx and R = D/2 from
Q irR x2 va,u rc(R _ R 2 )va,d (4.4)
The pressure drop ( AP ) over a cyclone is approximately proportional to the square of
the volumetric flow rate. To obtain a characteristic measurement for pressure drop in
a given cyclone, the pressure drop is often reported as the dimensionless pressure drop
coefficient

Chapter 4 Cyclone Dryer Technology For Grain Drying 66
C =- AP 2
—2
pf in
where v in is the mean velocity at inlet of the cyclone. Equation (4.5) is very useful for
estimating the pressure loss through the system at conditions other than design.
4.2.2 Particle Terminal Velocity
A particle falling from the rest in a fluid will initially experience a high acceleration.
As the particle accelerates the drag force increases, causing a reduction of the
acceleration. Eventually a force balance is achieved where the acceleration is zero and
a maximum or terminal relative velocity is reached. This is known as the single
particle terminal velocity, vt . For a spherical particle of diameter d p the terminal
velocity is related to the drag coefficient by (Cheremisinoff et al., 1984)
4 C gd (( — Pf )\
P PP (4.6) D = 3 v 2t pf
Thus in the Stokes law region, with CD = 24/Rep , the single particle terminal velocity is given by
v d i2)(Pp — Pf)g (4.7) 18p,
In the Stokes law region the terminal velocity is proportional to the square of particle
diameter. In the Newton drag law region, with C D = 0.44, the terminal velocity is
given by (Cheremisinoff et al., 1984)
AP (4.5)
v, =5.46 i d p (p p —p f )gp
P f (4.8)
In this region the terminal velocity is independent of the fluid viscosity and
proportional to the square root of the particle diameter. In the intermediate region,
with, CD = 18.5/Rep", the particle terminal velocity is given by (Cheremisinoff et al.,
1984) 0.43 I
U P f p —P)0.715
v t = 0.78 P 0.285 043 Pf
(4.9)

Chapter 4 Cyclone Dryer Technology For Grain Drying 67
Generally, when calculating the terminal velocity for a given particle or the particle
diameter for given velocity, it is not known which region of operation is relevant. One
way around this problem is to formulate the dimensionless group C D Re p2 . To
calculate v, for a given particle size dp, calculate the group
C D Re 2 = 4 dP3Pf (PP2 P f P 3 (4.10)
which is independent of v, for the given particle and fluid properties. C D Re 2p is a
constant and will therefore produce a straight line of slope —2 on a logarithmic plot of
CD and Rep . The intersection of this line with the drag curve gives the value of
Re and hence v t '
4.2.3 Particle Deposition Velocity
In the operation of a cyclone or a pneumatic conveyor, it is generally desirable to
avoid particles settling out in the horizontal piping or ducting feeding or exiting the
cyclones. Thus, it is necessary to know the minimum gas velocity required to prevent
solid particles from settling and accumulating on the bottom of piping. Wicks (1971)
examines the forces (lift, drag, buoyancy and gravity) acting on a particle (diameter d)
resting at the bottom of a horizontal pipe (diameter D) and gives a very useful
correlation for computing the minimum superficial pipe velocity v m which is
required to prevent a particle from stagnating on the bottom of the pipe. This
correlation is
1= yv. + 5v 2.5 (4.11)
1011. y = and 5 = where (p p —p f )gd p D
13 V
100(p p pf )gpt"D"
Equation 4.11 is solved using an iterative method to get the minimum superficial pipe
velocity, v.. To avoid iterative calculation, the following explicit equation
v y m 6 6 1.4 (4.12)

Chapter 4 Cyclone Dryer Technology For Grain Drying 68
may be used to provide an approximate answer. In many applications of industrial
interest, the I/ term is small compared with the y term. This permits an even 81.4 5
greater simplification of Equation 4.12 into
1 V m = c04
0 (4.13)
Where the piping or ducting is not circular, the equivalent or hydraulic mean diameter
D eg is used instead of D. This is given by
A D eg = 4 WP
(4.14)
where A is the cross-sectional area of the duct, and WP is the wetted perimeter.
4.3 THE WORKING PRINCIPLE OF A CYCLONE DRYER
A cyclone dryer is a cylindrical tower, divided by conical orifices into several
chambers as shown in Figure 4.3. Hot gas and wet solids are introduced tangentially
into the lowest chamber. The conveying air imparts a strong rotational spin to the
entry chamber. Subsequently, a ring of recirculating drying material is rotated at high
velocity, first at the lowest chamber and later in the upper chambers. The rotational
movement continues towards the top of the dryer, slowing as it passes from chamber
to chamber. There is a great difference in the velocities of gas and solids inside the
cyclone chamber, resulting in high heat and mass transfer coefficients.
The rotational movement in each chamber enables drying material to be successfully
separated. It is then re-entrained into the gas jet at the centre of the cyclone after
falling down the conical surface to the orifice lip. The residence time of the drying
material in the chambers will vary depending on the weight and moisture content of
individual particles. Small, light particles move in the direction of the gas direction
along the vertical axis, and a short residence time is expected. Large heavy particles,
which are more readily are separated and redispersed, will have a longer residence
time.

Chapter 4 Cyclone Dryer Technology For Grain Drying 69
Figure 4.3 Multi-chamber cyclone dryer (Korn, 2001).
4.4 CYCLONE DRYER APPARATUS DESIGN AND
DEVELOPMENT
4.4.1 Outline and Basic Assumptions
Figure 4.4 presents a schematic diagram of the laboratory model cyclone dryer used in
the present investigation. It consists of five parts: blower, heater, rotary feeder, drying
chamber and separation chamber.
The drying chamber is separated into body and orifice parts, for convenient design
and set-up. The blower is selected to provide sufficient airflow to develop the
necessary total pressure in the air stream to maintain pneumatic conveying and
overcome the flow resistance of the system. The heater is sized to deliver sufficient
heat to the air to raise its temperature to desirable values. The objective of this chapter
is to design all necessary apparatus used in the experimental set-up of the cyclone
dryer.

Chapter 4 Cyclone Dryer Technology For Grain Drying 70
(3)
(1) Blower, (2) Heater, (3) Rotary Feeder, (4) Drying Chamber, (5) Separation Chamber
Figure 4.4 Schematic diagram for model cyclone dryer used in this study
The following basic assumptions were made in the cyclone dryer design:
1. Since the angle of repose of paddy grain is 36 0 , the conical surfaces between the
separation chambers slope at 40° to horizontal to ensure that the paddy grain can
move down to the orifice lip;
2. At steady state working conditions, the cyclone dryer acts as a pneumatic
conveyor which is operated in dilute mode and 5% volume fraction is occupied
by paddy;
3. The minimum spouted bed velocity of paddy is 13 m/s (Wetchacama, 1999). To
ensure proper working of the cyclone dryer, the axial velocity in the jet through
an orifice of the cyclone dryer should exceed the minimum spouted bed velocity;
4. The minimum deposition velocity of paddy is calculated using Equations 4.11 to
4.14. The average velocity at inlet and outlet of the cyclone dryer should be
higher than deposition velocity to ensure that paddy can be conveyed through
the dryer;
5. Ambient air of 30 °C, 80 % RH will be heated to 110 °C and used as the heat
source for the cyclone dryer.

Chapter 4 Cyclone Dryer Technology For Grain Drying 71
4.4.2 Drying Chamber
The cyclone dryer is a device whose; the design and performance has been little
reported in the open literature. There is therefore little information available about this
device for drying of agricultural materials. Korn (2001) presented the relevant
geometry and nominal operating data for drying chemical substances in a cyclone
dryer. Its sizing was largely dependent on the results of pilot scale tests. The sizing
procedure was reported in the same paper. The dimensions of this pilot plant (Korn,
2001) are shown in Table 4.1
Table 4.1 Characteristics of cyclone dryer pilot plant (Korn, 2001).
Quantity Value
Height of cyclone dryer
Diameter of cyclone dryer
Number of chambers
Drying air throughput
Maximum temperature of inlet gas
1.4 m
500 mm
7
1200 m3/h
150 °C
The geometry of the model cyclone dryer chamber used in the present investigation is
shown in Figure 4.5. The outer diameter of cyclone dryer is 0.5 m. Other dimensions
can be calculated from the specified values of various length ratios. The orifice angle
is 40 ° to ensure the paddy grain can slide down the conical surface to the air jet at the
orifice lip.
The acceptability of this configuration is checked by evaluating the minimum spouted
bed velocity and deposition velocity to ensure that the paddy grain can be conveyed
from chamber to chamber with no deposition at the inlet and outlet of cyclone. The
minimum spouted bed velocity is used to calculate the velocity in the contracted jet
through each orifice. From the continuity equation, the average velocity at inlet and
outlet can be calculated and checked against the deposition velocity given by
Equations 4.11 to 4.14.

Chapter 4 Cyclone Dryer Technology For Grain Drying 72
a/D = b/D = e/D = 0.2
f/D = h/D = 0.4
d/D = 0.3
Z =40 °
Figure 4.5 Geometry of cyclone dryer chamber used in the present investigation.
Assuming a contraction coefficient of 0.66 for each orifice and a velocity of 13 rn/s in
the contracted jet, the average velocity values at inlet and outlet are 13.0 and 6.5 m/s,
respectively. From Equations 4.11 to 4.14, the deposition velocity for paddy grain at
inlet and outlet are 0.25 and 0.27 m/s, respectively. The average velocities at inlet and
outlet are higher than the deposition velocity, and thus these configuration ratios are
acceptable.
The most important parameter for cyclone dryer design is the total pressure drop. This
is not known initially, and must be estimated from experimental data or numerical
simulation. The experimental results presented in Section 4.5.2 indicate values of total
pressure drop coefficient C Ap increasing from 16.0 to 17.5 over the range of cyclone
Reynolds number from 2.4 x 10 5 to 3.9 x 10 5 for a three-chamber dryer. The single-
phase numerical flow simulation reported in Chapter 5 indicates an increase in
C ap from 13.1 to 14.4 (or about 10%) as the number of chambers is increased from
three to six. Experimental studies by Yuu et al. (1978) in a conventional single
chamber cyclone separator indicated that the total pressure drop coefficient was
reduced by an increase in solid loading. Taking all these factors into account, a design
value of C ap = 20 would appear to be conservative for grain drying applications.

Chapter 4 Cyclone Dryer Technology For Grain Drying 73
In order to conveniently observe the particle behaviour, the cyclone dryer parts were
fabricated from transparent acrylic. They consist of the cyclone body, orifice, bottom,
inlet body, outlet body and top lid. Drawings and dimension details are shown in
Appendix B.
4.4.3 Blower Selection
The blower is the component in the system that provides energy in the form of total
pressure to the air stream to overcome the system resistance. An appropriate blower
must develop the necessary pressure to meet the system requirements for the desired
airflow. The method of calculation of the required air flow and total pressure drop
across the drying system is shown in Appendix C.
4.4.4 Rated Capacity of Heater
The amount of heat required to elevate the air temperature from 30 °C to 110 °C is
given by
Heat = p f Qc p , — Tco
where Tr, = 110°C, Tc,, = 30°C
c p, = specific heat of air at (Tr, + )/2 = 1.009 kJ/kg K
p r Q = 0.922*0.16 =0.147 kg/s (calculated at maximum air flow rate)
Hence the required heating rate is
Heat = 0.1474 *1.009*(110 —30) =11.9 kW
By assuming a heat loss equal to 20% of the heat input, the capacity of heater should
be at least
Heat real 11.9/0.8 =14.875 15 kW

A Heater Set B Feeder Set C: Cyclone Dryer D Separation Chamber
Chapter 4 Cyclone Dryer Technology For Grain Drying 74
4.4.5 Separation Chamber
The separation chamber was designed without a top cover. This lets the air out of the
dryer and into the atmosphere. In the separation chamber, the grain is separated out by
its own weight and falls to the bottom of the chamber. The design and dimension
details are given in Appendix B.
Figure 4.6 shows the assembled model cyclone dryer system. The complete drawings
with all details, materials of construction and dryer layout are given in Appendix B.
Figure 4.6 Drawing of model cyclone dryer system.
Chapter 4 Cyclone Dryer Technology For Grain Drying 75
4.5 PRELIMINARY STUDY OF A CYCLONE DRYER
4.5.1 Introduction
Preliminary tests of the model cyclone dryer system were conducted to examine the
minimum working air velocity and characteristics of grain flow inside the drying
chambers and the pressure drop characteristics of the system. These tests were
conducted without any air heating.
4.5.2 Effect of Velocity on Cyclone Dryer Pressure Drop
These measurements were conducted first, to establish the adequacy of the fan and
provide data for later validation of numerical simulations. The cyclone dryer was
fitted with a centrifugal blower, powered by an AC motor with a variable frequency
speed control unit. Four different fan speeds (2925, 2350, 1770 and 1180 rpm) were
used to investigate the variation of pressure drop across the cyclone dryer chamber
with air flow-rate.
A bellmouth fitted at the fan inlet was used to measure the airflow rate. Pressure
tappings were provided at the throat of the bellmouth and other key points through the
system. The pressure differentials between individual tapping points and atmosphere
were measured with a Furness Controls Model FC012 electronic manometer giving an
analog voltage output linear with pressure differential. The selection of pressure
sources was performed by a Furness Controls pressure scanner Model FCS421. The
fan speed, pressure scanning and data acquisition were controlled by a personal
computer.
The total pressure drop across the dryer was calculated by summing the differentials
of static and dynamic pressure between inlet and outlet. The results for a 3-chamber
configuration are presented in dimensionless form in Figure 4.7, as the total pressure
drop coefficient C ap (defined by Equation 4.5) against Reynolds number based on

3.6 15
2 4 2.6 2.8 3 3.2 3.4 Reynolds Number : Re
3.8 4
x 105
18
17.5
17
16.5
16
15.5
1
1
Chapter 4 Cyclone Dryer Technology For Grain Drying 76
the cyclone diameter and inlet velocity. There is a slow increase in CAP with
Reynolds number, with C AI, values between 16.0 to 17.5 over the range tested.
Figure 4.7 Variation of cyclone dryer total pressure drop coefficient with Reynolds
number.
4.5.3 Flow Characteristics of Grain Inside the Cyclone Dryer
and Minimum Working Velocity
As stated previously, the minimum spouted bed velocity is the key factor to make the
cyclone dryer work properly. The cyclone dryer chamber design was based on a value
of 13 m/s for paddy grain. Due to the lack of published data, it was considered
desirable to check the applicability of this criterion for the multi-chamber cyclone
dryer model.
Initial testing was conducted by loading a batch of paddy grain in the base of the
model dryer tower. The mode of pneumatic transport of grain inside the chamber was
then observed while the airflow rate was gradually increased by adjusting the fan
speed until a steady state working condition with satisfactory operation was achieved.
At low inlet air velocity, the air simply passed over the solid bed without carrying any
paddy grain. Only some of the straw and contaminant material were separated and
transported by the air to the exit of the cyclone. Figure 4.8 shows the paddy grain

Chapter 4 Cyclone Dryer Technology For Grain Drying 77
behaviour at 0.09 m3/s air flow rate, corresponding to an estimated axial jet velocity
of 11.5 tn/s through the chamber orifices.
Figure 4.8 Paddy grain behaviour at 0.09 m 3/s air flow rate.
(Estimated jet velocity 11.5 m/s)
As the air velocity was increased, the bed of grain gradually commenced to rotate
inside the lowest chamber and be drawn up into the rotating air stream in the centre of
the dryer. A pile of paddy grain grew in the centre of the dryer as air flow was
increased. At the critical air flow rate, where the pressure of the air was sufficient to
overcome gravity and frictional restraints, the grain was drawn up into the air stream
and conveyed from chamber to chamber until reaching the exit. The air stream formed
the grain into a rotating fountain through the central orifices, and vigorous
recirculation of grain was observed in the central dryer chamber.
Grain was sucked up at the centre of the lowest chamber, while some grain moved in
the form of a rotating ring at the wall of lowest chamber. In the next higher chamber,
grains separating from the central vortical flow column fell to the conical floor and
travelled towards the orifice in the form of a spiral dune flow. This circulation process
occurred in every chamber, and slowed down from chamber to chamber until grains
were conveyed out of the exit. The pattern of grain movement inside the central
cyclone dryer chamber at an air flow rate slightly above the critical value required for

Chapter 4 Cyclone Dryer Technology For Grain Drying 78
grain transport is shown in Figure 4.9. This flow rate corresponds to an estimated jet
velocity of 14 m/s, which is consistent with the minimum spouted bed velocity of 13
m/s for paddy grain proposed by Wetchacama (1999).
Figure 4.9 Paddy grain behaviour at 0.11 m 3/s air flow rate.
(Estimated jet velocity 14 m/s)
4.6 CONCLUDING REMARKS
This chapter has reviewed some basic principles of conventional cyclone separator
operation and outlined the design of a multi-chamber cyclone suitable for grain
drying. The significant feature of this device is the dispersion and recirculation of
grain within the individual chambers that increases the residence time of the grain.
The feasibility of pneumatically transporting paddy grain through this device has been
demonstrated, and the critical air velocity has been found consistent with the
minimum spouted bed velocity reported by other workers.
The next chapter will describe detailed measurements of single-phase (clean air) flow
through the model dryer and a comparison of these results with numerical
simulations.

Chapter 5 Cyclone Dryer Flow Field: Experimental and Numerical Studies 79
Chapter 5
CYCLONE DRYER FLOW FIELD:
EXPERIMENTAL AND NUMERICAL
STUDIES
5.1 INTRODUCTION
As reviewed in Chapter 2, rice grain as harvested in the wet season usually has a high
moisture content (24-33 % wb.) which, if not reduced, allows microbial growth causing
biochemical deterioration of the grain. Drying of paddy grain (rice) from its fresh harvest
moisture content to a more manageable level (18 % wb.) is currently the only practical
method to lower the rate of deterioration of grain (Driscoll et al., 1985). Satisfactory
drying of newly harvested grains typically requires a residence time of several minutes.
Simulation results in Chapter 3 indicate that an excessively long length of pneumatic
transport pipe would be required for drying hygroscopic material such as paddy. The
recently developed pneumatic dryer with delay chambers called a "cyclone dryer", gives
a longer residence time of particles than a simple pneumatic dryer. Solid retention times

Chapter 5 Cyclone Dryer Flow Field: Experimental and Numerical Studies 80
of 5-30 minutes can be obtained with this dryer (Korn, 2001) making it suitable for large
amounts of moisture removal. However, the cyclone dryer reported by Korn (2001) was
developed by pilot plant scale testing rather than theoretical predictions.
Computational Fluid Dynamics (CFD) is now widely used to evaluate the working
possibility of new process reactors during the conceptual and preliminary design stages.
With recent advances in CFD and computer capability it is now possible to simulate the
flow field and heat and mass transfer processes in a short enough period of time to have a
significant impact on the design cycle. There is, however, still a significant amount of
uncertainty about the accuracy of CFD for prediction of the absolute physical
characteristics of a newly designed reactor. Due to this lack of confidence, the current
practice is to use CFD as a tool for screening a large number of potential designs.
To make further improvements to cyclone dryer designs, a good understanding of the
fluid dynamics is required. Analytical techniques do not allow changes in geometry to be
readily assessed. Reynolds-Average Navier-Stokes (RANS) based CFD models provide
an economical means of understanding the complex fluid dynamics and how it is
influenced by changes in design and operating conditions. Validation of the
computational results is required to establish confidence in the predictions.
A review of archival literature revealed no research involving simulation of cyclone
dryers, but significant advances have been made in simulating cyclone separators.
Boysan et al. (1982) who were the early users of the CFD technology, applied the
algebraic stress model (ASM) to simulations of a cyclone separator. Later Zhou et al.
(1990), Modigell et al. (2000) and Hoekstra et al. (1999) applied CFD to this problem
with varying success. But their works dealt only with two-dimensional prediction of
single-phase flow in the cyclones, and treated the flow field as axisymmetric and steady.
To get more details of the complicated flow field in cyclone devices it is necessary to
perform numerical simulations in three-dimensions. Several researchers have conducted
three-dimensional numerical simulations of cyclone separators (Griffiths et al., 1996;

Chapter 5 Cyclone Dryer Flow Field: Experimental and Numerical Studies 81
Zhao et al., 2000; Yoshida et al., 1990 & 2001; Montavon et al., 2000; Schimdt et al.,
2003; Wang et al., 2003; Derksen et al., 2000; Derksen, 2003; Witt et al., 1999). These
authors have tested a number of turbulence models, ranging from the algebraic stress
model (Zhao et al., 2000), standard k-E (Yoshida et al., 1991 & 2001; Witt et al., 1999;
Montavon et al., 2000), RNG k-E (Schimdt et al., 2003), and a Reynolds stress model
(Wang et al., 2003; Witt et al., 1999). Their studies have demonstrated that CFD still
cannot produce very accurate descriptions of the flow field in cyclones because of
difficulties in modelling the phenomena occurring in swirling flow. Calculated results for
pressure drop agreed only moderately well with the experimental data. The experimental
pressure drop was larger than the calculated pressure drop by 60 %, 15 %, and 16 % for
the standard k-E model (Yoshida et al., 2001), RNG k-E (Griffiths et al., 1996), and
Reynolds stress model (Wang et al., 2003), respectively.
Recently, large eddy simulation (LES) was used to predict the unsteady characteristics
and spiral shape of the vortex core in a cyclone separator (Schmidt et al., 2003; Derksen
et al., 2000&2003). Good agreement with experimental data was obtained, both in terms
of the average velocity and velocity fluctuations, when high spatial and temporal
resolution was used. The superiority of the LES approach as compared with the
Reynolds-average approach was clearly illustrated, but at greatly increased computational
cost.
This chapter presents predictions of the gas-phase flow field and pressure drop inside a
laboratory scale cyclone dryer using RANS based CFD. The commercial code CFX 5.7 is
run for steady, three-dimensional, single-phase flow conditions. Simulation parameters
such as the advection scheme, turbulence model and level of mesh resolution are tested to
find the best combination for flows of this type. The computed flow behaviour is
compared with experimental results to establish the level of confidence in the numerical
predictions. Mean flow field and pressure drop predictions are then presented using the
optimised simulation parameters. Finally, the effect of the number of delay chambers on
the pressure drop is investigated. This is the first stage in the development of a
computational method for cyclone dryer design.

Chapter 5 Cyclone Dryer Flow Field: Experimental and Numerical Studies 82
5.2 EXPERIMENTAL INVESTIGATION
5.2.1 Flow Geometry and Physical Model
The geometry of the cyclone dryer used for the initial numerical investigation is shown in
Figure 5.1. It is characterised by the principal diameter, D, and the geometric ratios
detailed in Figure 5.1. The diameter of the laboratory scale model cyclone dryer tested is
500 mm, similar to the design of Korn (2001). The orifice angle of 40° is greater than the
angle of repose of the granular material to ensure that the grains can slide along the
surface to the air jet at the orifice. This achieves the necessary recirculation of grain
within the dryer chamber for the ultimate drying application. The cylindrical coordinate
directions are defined in Figure 5.1. The origin of the coordinate system is located at the
level of the interface between the conical bottom and the cylindrical body.
In order to judge the quality of numerical simulations, experimental data were required.
These were obtained from the laboratory scale cyclone dryer, which was constructed
from 10 mm thick acrylic. Air was drawn from the atmosphere through a horizontal duct
to a centrifugal blower with a flow straightening honeycomb at exit. It then fed
tangentially to the lower cyclone chamber and finally discharged freely to atmosphere
from the upper chamber. The centrifugal blower was powered by an AC motor with
variable frequency speed control. A bellmouth nozzle was fitted at the fan inlet in order
to measure the air flow-rate across the system. Static pressure tappings were provided at
the nozzle throat and the cyclone inlet.
As shown in Figure 5.1 (a), axial and tangential velocity profiles were measured at two
elevations (at z = 0.055 and 0.255 m) by means of a 3-hole probe. At each axial location,
the measurement probe was traversed from either wall along a diameter orientated 11 °
from the normal to the inlet duct. The traverse locations in the x-y plane are shown in
Figure 5.1 (b). The measuring devices and data acquisition systems will be described in
the following sub-section.

Chapter 5 Cyclone Dryer Flow Field: Experimental and Numerical Studies 83
c1/0 = lo/D = e/O = 02 ; d/0 = 02 F/D 0.36 ; 6/0. OA ; Angle = 40 degree
(a) Elevation View
(b) Cross Section Through plane A-A
(c) Cross Section Through plane B-B
Figure 5.1 Model cyclone dryer geometry in x-z and x-y planes. The configuration
geometric ratios and measuring positions are also shown.
5.2.2 Measurement Techniques
For all the velocity traverses presented graphically in this chapter, the fan motor was
operated at 30 Hz frequency, giving an inlet velocity of about 9 m/s. Two pressure taps
were used to measure the static pressure at the bellmouth and cyclone dryer inlet. The air
flow rate was calculated from the static pressure differential across bellmouth inlet. The
total pressure drop across the cyclone dryer was calculated from summation of the static
and dynamic pressure diffrentials between the inlet and outlet. The dynamic pressures
were based on the mean velocities determined from the measured flow rate.

Chapter 5 Cyclone Dryer Flow Field: Experimental and Numerical Studies 84
A three-hole modified wedge probe was used to measure the radial profiles of axial and
tangential velocity. Figure 5.2 shows the detail of the probe head and hole numbering. In
the cyclone dryer chamber, where the direction and the magnitude of velocity are not
known, this device indicates the flow direction in one plane only. The axial and tangential
velocity components are determined from the direction and magnitude of velocity. The
three-hole probe was calibrated in uniform flow in a wind tunnel. Details of the
calibration procedure are given in Appendix D. The calibration results showed that the
uncertainties of the local angle and velocity measurement in two-dimensional flow were
both less than 1% over the range of calibration. A MATLAB program (Ucpct.m) was
written to reduce the probe pressure measurements into angle and magnitude of velocity
at the probe head. These values were then used to calculate the local axial and tangential
velocity components.
Five pressures were measured: Po at the bellmouth; P at the cyclone inlet; and P1, P2
and P3 at the front, top and bottom sides of three-hole probe head. A pressure scanner
(Furness FCS421) was used to select different pairs of pressure sources as shown in
Table 5.1. The pressure scanner was linked to a 0-100 mm H 20 range micromanometer
(Furness FC012), which gave an analog voltage output proportional to the observed
pressure differential. A LabVIEW program was used to control the automatic data
acquisition. This program operated the channel selection and recording of measured
voltages at the desired sampling rate. The estimated uncertainties in these measurements
were ±6% for total pressure and ±2% for velocity. The radial velocity component was not
measured.
While the non-zero pitch angle produced by radial velocity components within the model
dryer would have caused deviations from the 2-D probe calibration, these effects are
thought to have been acceptably small in the outer vortex region 1r/R1 > 0.4. Here the
CFD predictions indicated the pitch angles to be generally less than 2 °, the likely
measurement errors from this source are less than 1 ° in angle and 2% in flow speed.
Larger errors would have occurred for velocity measurements in the inner core region

Chapter 5 Cyclone Dryer Flow Field: Experimental and Numerical Studies 85
Ir/RI < 0.4 at z = 0.055 m, where pitch angles of up to 100 were predicted. The inner core
measurements at z = 0.255 m must be considered unreliable due to predicted pitch angles
averaging 20°, with higher peaks. Additional measurement error is likely in regions of
high shear at the edge of the vortex core due to flow non-uniformity over the probe head.
Hole 2 Top
Hole 1 ront
Hole 3 Bottom
Figure 5.2 Three-hole modified wedge probe.
(support diameter 6.35 mm)
Axial and tangential velocities inside the cyclone chamber were normalised with the
mean inlet air velocity. The pressure drop was expressed in terms of a pressure
coefficient, using a dynamic pressure based on the mean inlet velocities. These values
were used to validate the quality of the flow field simulated by the flow solver CFX 5.7.
The validation procedure and development of an optimised CFD model will be discussed
in section 5.3.3.
Table 5.1 Pressure scanner channel set-up during flow field measurement of the cyclone
dryer
Channel 1 2 3 4 + side Po Pin PI P2 - side Patm Patm P3 P3

Chapter 5 Cyclone Dryer Flow Field: Experimental and Numerical Studies 86
5.2.3 Experimental Results
Figure 5.3 presents typical measurements of radial profiles of tangential and axial
velocity components at elevations, z = 0.055 m and 0.255 m, as indicated in Figure 5.1.
The tangential velocity profiles in Figure 5.4 (b) show the expected Rankine (or
combined) type vortex, consisting of an outer potential vortex with a region of near solid
rotation at the core. This flow pattern has been reported in flow field measurements of
cyclone separators by several researchers (e.g. Stirmand, 1952; Ter linden, 1949;
Shepherd et al., 1939). The maximum tangential velocity rises to 2.5 and 1.5 times the
inlet air velocity at the first and second measurement stations, respectively.
For measurements taken at z = 0.055 m, the tangential velocity maxima occur at
Racyclone = ±0.2, indicating symmetrical swirl flow in the lowest chamber of the cyclone
dryer. At z = 0.255 m, the tangential velocity maxima are not symmetric about the
orifice centre, indicating an eccentric swirl flow pattern in the higher chamber. However,
the flow pattern still represents a Rankine type vortex.
The axial velocity profiles in Figure 5.4 (a), show maxima in similar locations to this of
the tangential velocity profiles for both measurement stations. In the outer core, the
magnitude of axial velocity is nearly constant except in the near wall region, which
shows a variation depending on the direction of the local air-flow. The magnitudes of the
tangential and axial velocity maxima decrease from chamber to chamber due to turbulent
diffusion inside the cyclone dryer. Energy losses cause a general decay in the level of
tangential velocity from the first to the second chamber of the dryer.

1.2
0.8
0.6
0.4
0.2
-0.2
-0.8 -0.6 -0.4 -0.2 0
r/R
(a)
-0.4
-0.6
-0.8 -1 0.2 0.4 0.6 0.8
0 Z = 0.055 m
+ Z = 0.255 m
Chapter 5 Cyclone Dryer Flow Field: Experimental and Numerical Studies 87
r/R (b)
Figure 5.3 Radial profiles of velocity components at elevations z = 0.055 m and 0.255 m:
(a) axial velocity; (b) tangential velocity.

Chapter 5 Cyclone Dryer Flow Field: Experimental and Numerical Studies 88
The velocity distribution was found to retain a high degree of similarity over a range of
inlet velocities. Another measurement at 11tn/s inlet velocity showed a slight reduction in
the dimensionless value of peak tangential velocity, but no change in its position; there
appeared to be nearly perfect similarity in the distributions. Thus, the results for 9 m/s
inlet velocity were used to validate the numerical simulations in the following section.
5.3 NUMERICAL SIMULATION AND VALIDATION
5.3.1 Basic Governing Equations
Turbulent flow can be described by the Reynolds-averaged Navier-Stokes equations. The
Reynolds averaged equation for conservation of mass is written:
V • (p f u). 0 (5.1)
while the Reynolds averaged equation for conservation of momentum is written:
V • (p f u u)= –VP -1- 'V • (t at. (Vu + (VOT )- p f u' u') (5.2)
where t1 is the turbulent eddy viscosity obtained from:
k 2 !IT CpPf — E
Here u is the Reynolds averaged flow velocity while u' is the turbulent fluctuation. An
effective viscosity can be defined by [I eff = [I + [I T . p is molecular viscosity and pi is
turbulence eddy viscosity. The over-bar represents the Reynolds-averaging operator.
Solution of the above equations by analytical techniques is only possible for very simple
cases. Numerical solution methods have been developed, but are complicated by the
(5.3)

Chapter 5 Cyclone Dryer Flow Field: Experimental and Numerical Studies 89
additional Reynolds stress terms (- p f le 0 ) on the right hand side of Equation (5.2). To
obtain values for the Reynolds stress terms a suitable turbulence model must be used. The
models used in this study are the RNG k-E and SSG Reynolds stress turbulence models.
5.3.1.1 Two-equation turbulence model
A widely used turbulence model is the k - E model, which is based on the eddy viscosity
hypothesis. In the k — E turbulence model the Reynolds stress terms are approximated by:
p f u' 0u' = —;p f kl— —32 p T V • uI + (Vu + (Vu) T ) (5.4)
The equations below are solved to obtain k and c, which are the turbulence kinetic
energy and dissipation rate, respectively.
V•(p f uk)—V •
V • (p f uE) — V •
Shear production is defined
Pk = VI T VII • (Vt1
11 \ [ p+---IL GI(
Vk = Pk - p fe
E2
VE r, n —
k
2 / )- —
3V • upp T V • u +p f k)
(5.5)
(5.6)
(5.7)
G E
as:
v (V11)
r
For the standard k —E turbulence model, the constants are cr k =1, cr E =1.3, C 1 =1.44,
C 2 =1.92. The RNG k —E turbulence model is based on renormalisation group analysis

(5.10)
II Pk 11 =
Pf C RRNG E (5.11)
= 4.38, fn (1 + PRNG 11 3 )
Chapter 5 Cyclone Dryer Flow Field: Experimental and Numerical Studies 90
of the Navier-Stokes equations. The transport equations for turbulence generation and
dissipation are the same as those for the standard k — E turbulence model, but the model
constants differ and the constant C I is replaced by the function C EIRNG . The transport
equation for turbulence dissipation becomes:
. 2 V • (p f uE) — V • + T
• — ̀ —'61RNG E Pk C e2RNGPf GERNG
(5.8)
where
C ciRNG = 1.42 — (5.9)
The values of constants for the RNG k-E model are: C e2RNG = 1.68, a cRNG = 0.7179, P RNG = 0.012 and C pRNG = 0.085.
5.3.1.2 Reynolds stress turbulence model
Another choice of turbulence model is the Reynolds stress turbulence model (RSM).
Transport equations have been developed for each component of Reynolds stresses as
shown below. These differential equations can be solved to obtain each stress component.

k 3
S = —12 (Vu + (VOT )
a= , 2 1
ci
Chapter 5 Cyclone Dryer Flow Field: Experimental and Numerical Studies 91
V•(p f u® V • (([1+ —2 C sp f 2jVt1 11) = Ps --
2p f c1
3 3
2 V • (p f tic)—N7•[(.t + •d= C c, Pk —Capf —c
Gk
(5.12)
(5.13)
The shear production term, P s is defined as:
Ps = —p f (u' u'(Vu) T + (Vu)u' 0 u i) (5.14)
The pressure strain term, ri is given by the following equations:
=1-1 1 +II 2 (5.15)
= —p f c(C si a+C s2 (aa — —1a •a1))
3
112 = —C,,Pa + C r2 pkS —C r3 p fkSji
( +C m p f k aS T + Sa T —2 a • SI +C r5 p f k(ato T +ma l ) 3
where
to = --1 (Vu + (Vu)T ) 2
(5.16)
(5.17)
(5.18)
(5.19)
(5.20)
is the Kronecker delta, a the anisotropy tensor, S the strain rate and tu the vorticity.
Constants for the SSG Reynolds stress model are C s =0.22, C E =0.18, C1 =1.45,
C e2 —1 '95 CSI 1.7, C s2 =4.05, C ri =0.9, C r2 =0•8, Co =0.65, C r4 =0.625 and C5 =O.2.
Chapter 5 Cyclone Dryer Flow Field: Experimental and Numerical Studies 92
5.3.2 Numerical Set-up and Solution Technique
The commercial CFD software package CFX uses a finite volume method to find a
steady-state solution of the above set of partial differential equations. For each iteration,
the full set of equations is solved using an algebraic multigrid method (AMG). The
hydrodynamic equations are solved simultaneously as a single system. This solution
approach uses a fully implicit discretisation of the equations at any given iteration.
Transport equations for the turbulence properties are then solved. The solution procedure
is repeated until the specified convergence criteria are met.
A series of definition files was created to obtain simulation results from CFX5.7. The
simulation assumes isothermal (25 °C) flow of a generic ideal gas with a reference
pressure of 1 atm. Fluid enters the domain with uniform velocity of 10 m/s normal to the
inlet surface. The outlet boundary was specified with an average static pressure of 0 Pa.
This is compatible with the experimental set-up, in which air was discharged freely to the
atmosphere. Scalable wall functions were applied to describe the velocity distribution
near the wall.
Boundary conditions for k and c at the inlet were determined by assuming a turbulence
intensity of 5%. A high turbulence intensity was expected due to the combined effects of
the fan discharge and honeycomb mesh. A simulation using a turbulence intensity of 1%
at the inlet was also run. This change was found to have only a small effect on the results.
The values of k and E at inlet were calculated using k = yi2v2 and = k 2 2 In 0.3D •
All simulations were started from the automatic initial condition. Hexahedral meshes of
various fineness were used in this study. Mesh concentration was applied in the near wall
regions to capture flow gradients in boundary layer. Figures 5.4 (a), (b), (c) and (d) show
the series of meshes having 864,185, 419,928, 190,057 and 86,555 nodes, that were used
for mesh sensitivity studies. These are required for quality assurance purpose, as

Chapter 5 Cyclone Dryer Flow Field: Experimental and Numerical Studies 93
specified for example in the statement on the control of numerical accuracy by the ASME
Journal of Fluids Engineering. (http://journaltools.asme.org/Templates/JFENumAccuracy pcif).
The predicted distributions of normalised axial and tangential velocity components v z
and ye, as well as the total pressure drop coefficient C AP/ 34pv,2n , were compared
with the experimental results to validate the numerical solutions.
5.3.3 Simulation Results and Validation
To investigate the effect of different modelling parameters and approaches, the following
tests were performed:
1) Advection scheme test: Calculations were made with a series of differencing schemes
of first order accuracy (upwind), high resolution, and second order accuracy (specific
blend factor = 1) using the low resolution mesh of 86,555 nodes and the RNG k-c
turbulence model. The advection scheme that gave closest agreement with experimental
results was used for further modelling tests.
2) Grid sensitivity test: Based on the optimum advection scheme identified, a series of
calculations for mesh resolutions of 864,185 nodes, 419,928 nodes, 190,057 nodes, and
86,555 nodes were made. The predicted axial and tangential velocity distributions, as
well as the total pressure drop coefficient, were compared to identify an adequate mesh
resolution.

(a)
MEM 11..11 imfflo!
(c)
(b)
(d)
insomul um•oael 1121414
Chapter 5 Cyclone Dryer Flow Field: Experimental and Numerical Studies 94
Figure 5.4 Series of meshes of different fineness used for grid sensitivity studies: (a)
864,185 nodes; (b) 419,928 nodes; (c) 190,057 nodes; (d) 86,555 nodes.

Chapter 5 Cyclone Dryer Flow Field: Experimental and Numerical Studies 95
3) Turbulence model test: the RNG k-E and SSG Reynolds stress turbulence models were
tested using the optimum advection scheme and level of mesh resolution identified as
described above. The predicted axial and tangential velocity distributions, as well as the
total pressure drop coefficient, were compared with experimental data to choose the best
performing turbulence model for the cyclone dryer problem.
The optimised numerical model based on the optimum advection scheme, mesh
resolution and turbulence model was then used to predict the effect of inlet air velocity
variation and number of dryer chambers on the velocity distributions and overall pressure
drop coefficient for the cyclone dryer.
5.3.3.1 Advection (differencing) scheme
Simulations were run using first order (upwind), high resolution and second order
differencing schemes, on a hexahedral mesh of 86,555 nodes with the RNG k-E
turbulence model. For all differencing schemes, a tight convergence of RMS level 10 -6 was achieved. Figures 5.5 and 5.6 compare the predicted non-dimensional velocity
distributions at the two elevations indicated in Figure 5.1 (a). The results are presented at
a circumferential location 11 0 from the point where the inlet duct is attached.
With the upwind differencing scheme the tangential velocity was seriously under-
predicted compared to the experimental data at both locations z = 0.055 m and z = 0.255
m. The adverse gradient of axial velocity in the core region was not captured due to the
smearing effect of this differencing scheme. The high resolution and second-order
differencing schemes produced significant improvements in predictions of the non-
dimensional tangential and axial velocity distributions. They give good agreement for
locations of the axial and tangential velocity maxima.

1.2
—L 4 i 1 ; .
..• ; .
0.6 -1- . . +. ; I ; I ;
0.47 .4--
0.8
I ; 4 4 0.2
• •
Second order High resolution Upwind Experiment
: ; i
i ; I .• . .
: . 4 I i
. .
i . I i- ;
. ;
0.2
-0.4
-0.6
1
3
-0.5
5
0100 1000.100"
Second order High resolution Upwind
—I— Experiment
'
2.5
2
5
Chapter 5 Cyclone Dryer Flow Field: Experimental and Numerical Studies 96
-0.8 -0.6 -0.4 -0.2 0 0.2 0.4 0.6 0.8
r/R
(a)
-0.8 -0.6 -0.4 -0.2 0 0.2 04 0.6 0.8
r/R (b)
Figure 5.5 Influence of differencing scheme on predicted velocity distributions at
z = 0.055 m: (a) axial velocity; (b) tangential velocity.

1.2
1
0.8
0.6
0.4
0.2
0 INW
•
Second order High resolution -
— Upwind —I— Experiment ._
-0.6
-0.2
-0.4
2.5
Second order High resolution Upwind
—I— Experiment
t-
1.5
0.5
-0.5
Chapter 5 Cyclone Dryer Flow Field: Experimental and Numerical Studies 97
-1 -0.8 -0.6 -0.4 -0.2 0
r/R (a)
0.2 0.4 0.6 0.8
-1 -0.8 -0.6 -0.4 -0.2 0 0.2 0.4 0.6 0.8
r/R (b)
Figure 5.6 Influence of differencing scheme on predicted velocity distributions at
z = 0.255 m: (a) axial velocity; (b) tangential velocity.

Chapter 5 Cyclone Dryer Flow Field: Experimental and Numerical Studies 98
The optimum differencing scheme was determined by comparing the calculated total
pressure drop coefficients with the experimental results as shown in Table 5.2. Based on
these results, the second-order differencing scheme was chosen as the most appropriate
scheme for modelling of the cyclone dryer flow.
Table 5.2 Effect of differencing scheme on predicted total pressure drop coefficient using
mesh of 86,555 nodes and RNG k-c turbulence model.
Source of value Total pressure drop coefficient Experimental result 16-17
Simulation • - First order (Upwind)
- High resolution
- Second order
4.9
11.4
12.0
5.3.3.2 Grid sensitivity
The hexahedral Mesh used to model the flow field inside the cyclone dryer was generated
at four levels of resolution as shown in Figure 5.4. Mesh concentration was applied at all
solid surface to assist in capturing the boundary layer flows. The mesh of 86,555 nodes
was used in the previous testing. Similar refined meshes of 190,057, 419,928 and 864,185
nodes were created to test the sensitivity of the results to domain discretisation. As the
CFX solver modelling manual states that RMS residual levels of 10 -6 are the most
appropriate for design investigations, the RMS levels of convergence were evaluated to
ensure that sufficiently accurate results were obtained at each level of mesh resolution.
The RNG k-c turbulence model with a second order differencing scheme was used
throughout the grid sensitivity testing. The predicted tangential and axial velocity
distributions for different mesh resolutions are plotted and compared with experimental
data in Figures 5.7 and 5.8.

1.2
1
864,185 nodes 419,928 nodes 190,057 nodes 86,555 nodes Experiment
-0.2
-0.4
-0.6
Chapter 5 Cyclone Dryer Flow Field: Experimental and Numerical Studies 99
-0.8 -0.6 -0.4 -0.2
0.2
0.4
0.6 0.8 1
r/R
(a)
3
2.5
2
1.5
1
0.5
0
-0.5
864,185 nodes 419,928 nodes 190,057 nodes 86,555 nodes
—I— Experiment
-0.8 -0.6 -0.4 -0.2 0
0.2
0.4
0.6
0.8
r/R
(b)
Figure 5.7 Influence of mesh resolution on velocity distributions at z = 0.055 m for RNG
k-g turbulence model: (a) axial velocity; (b) tangential velocity.

Chapter 5 Cyclone Dryer Flow Field: Experimental and Numerical Studies 100
As the mesh was refined, the velocity distributions changed only slightly for the last three
resolutions (190,057, 419,928 and 864,185 nodes). It was thus not clear from the velocity
distribution alone which is the best resolution. Additional information is provided by the
total pressure drop predictions for different mesh resolutions shown in Table 5.3. The
predicted pressure drop coefficient for a mesh of 190,067 nodes is significantly more
accurate than that for the coarsest mesh. There is little difference for the mesh of 419,928
nodes. For the finest mesh of 864,185 nodes the accuracy of the predicted pressure drop
noticeably deteriorates.
An excellent convergence level of 10 -6 RMS was obtained for mesh resolutions of
86,555, 190,057 and 419,928 nodes. For the finest mesh of 864,185 nodes the RMS
residual fluctuated, and the best convergence that could be obtained was 5x10 -5 as shown
in Table 5.3. The reasons for this deterioration in convergence are not clear, but poorer
mesh quality may possibly have been a factor.
Figures 5.9 shows the predicted distributions of tangential velocity at computational
nodes within 10 % of the cyclone dryer radius from the cyclone wall for different mesh
resolutions at an elevation of z = 0.255 m (in the intermediate chamber). The velocity
was sampled along a line normal to the inlet duct on the inlet and outlet sides of the
dryer. The results for meshes of 419,928 and 864,185 nodes are closely similar. The
predicted velocity distributions show increasing deviation as the mesh is coarsened to
190,057 and 86,555 nodes.
Taking all the above mentioned considerations into account, the mesh of 419,928 nodes
was chosen as the most appropriate for all further work. It gave the best agreement with
the measured velocity distributions and a good level of convergence with the RNG k-c
turbulence model. The predicted total pressure drop coefficient for this mesh differs only
slightly from the best approximation obtained with the mesh of 190,057 nodes; but the
predicted velocity distributions for that mesh were noticeably worse.

02 04 -1 -0 8 -0.6 -0.4 -0.2 0
r/R (a)
0.6 0.8
1.2
0.8
! I !
1 !
! i
i
! ! ! :
I ....1..............±..............+___.....±, .
—
864,185 nodes 419,928 nodes 190,057 nodes 86,555 nodes Expenment
,
—1— 1 !
; ; 0.6
0.4
0.2.
6 ..---,.• Ao. -t-
: : POIrf'
• • i
.
,
4 I 1 --i- e 1---
4-- .4-- t :
i 1
I ■ i ■ ,, ■ 1 1 i I i ■ . I i 1 I
- i. , i- •--1-
i . :
. 1 ■ .
i
4 i ..t.• ; . ,
-0.2 ; i-- i. i . ,--
-0.4 ;
-0.6
-4- • • • • • • • • • • • •
864,185 nodes 419,928 nodes
190,057 nodes
86,555 nodes
—1— Ex penment
2.5
0.5 -
-0.5
Chapter 5 Cyclone Dryer Flow Field: Experimental and Numerical Studies 101
-0.8 -0.6 -0.4 -0.2 0
r/R (b)
02 0.4 0.6 0.8
Figure 5.8 Influence of mesh resolution on velocity distributions at z = 0.255 m for RNG
k-E turbulence model: (a) axial velocity; (b) tangential velocity.

2
12
10 -
7
—e— 86,555 nodes — G— 190,057 nodes —as— 419,928 nodes - 864,185 nodes
2
0 0.22 0.225 0.23 0.235 0.24 0.245 0.25 0.255
(a)
8
8 3 6 -
To
& 4
Chapter 5 Cyclone Dryer Flow Field: Experimental and Numerical Studies 102
10
9 -
8
7 -
6
'5 5 - —0— 86,555 nodes —G— 190,057 nodes
419,928 nodes 864,185 nodes
0 0.22 0.225 0.23 0.235 0.24 0.245
0.25 0.255
Cyclone dryer radius (m)
Cyclone dryer radius (m)
(b)
Figure 5.9 Predicted near-wall tangential velocity distributions for different mesh
resolutions using the RNG k-E turbulence model: (a) inlet pipe side; (b) outlet pipe side.
Values plotted at computational nodes.

Chapter 5 Cyclone Dryer Flow Field: Experimental and Numerical Studies 103
Table 5.3 Comparison of predicted total pressure drop coefficient and RMS residual
value for different mesh resolutions using RNG k-E turbulence model with second-order
differencing scheme.
Mesh resolution Predicted total pressure drop coefficient RMS residual
Value Difference from experiment (%)
864,185 nodes 12.65 - 23.3 5 x 10⁻⁵ 419,928 nodes 13.08 - 20.7 1 x 10 -6 190,057 nodes 13.20 - 20.0 1 x 10 -6 86,555 nodes 11.99 -27.3 1 x 10 -6
With the 419,928 nodes mesh the value of dimensionless distance y + at nodes nearest the
solid boundaries was generally less than 20 except for small isolated regions in the centre
of the roof and floor of the cyclone and the corners of the inlet and outlet ducts. As seen
from Figure 5.9, there were generally about 10 computational nodes in the boundary
layer regions. This complies with recommendations of the CFX 5 user guide, and should
have adequately captured the boundary layer flow.
5.3.3.3 Turbulence model
This section discusses computations of the model cyclone dryer flow using the SSG
Reynolds stress turbulence model and compares the results obtained with these for the
RNG k-E model. Reynolds stress models are physically more realistic, and generally give
more accurate predictions than k-E model for complex flows. Simulations were conducted
for the four different mesh resolutions shown in Figure 5.4 using a second-order
differencing scheme. Simulation results for the velocity distributions and the pressure
drop coefficient were compared with the experimental data. The levels of convergence
achieved for with different mesh resolutions were also examined.

864,185 nodes 419,928 nodes 190,057 nodes
86,555 nodes —I— Experiment
1.4
1.2 -
4 4
0.8 -I- -- 1
0.6 -4- 0.4—
0.2 ••••
-0.8 -0.6 -0.4 -02 0 0.2 0.4 0.6 0.8
r/R
2.5
1.5
> • 5
0.2
r/R -0.8 0.2 0.4 0.6 0.8 -0.6 -0.4
(a)
-0.5
864,185 nodes 419,928 nodes 190,057 nodes
86,555 nodes —I— Experiment
-0.2
-0.4
-0.6
Chapter 5 Cyclone Dryer Flow Field: Experimental and Numerical Studies 104
(b)
Figure 5.10 Influence of mesh resolution on predicted velocity distributions at elevation z
= 0.055 m for SSG Reynolds stress turbulence model: (a) axial velocity; (b) tangential
velocity.

•••••
1,
----------- , i ..„., vit
864,185 nodes 419,928 nodes 190,057 nodes 86,555 nodes Experiment
1 -0.6 -0.4 -0.2
r/R -0.8 0.2 0.4 0.6 0.8
(a)
864,185 nodes 419,928 nodes
— 190,057 nodes 86,555 nodes
—I— Experiment
2.5 -
4
Chapter 5 Cyclone Dryer Flow Field: Experimental and Numerical Studies 105
1.5
1
0.5
-0.5
-0.8 -0.6 -0.4 -0.2 0 0.2 0.4
r/R 0.6 0.8 1
(b) Figure 5.11 Influence of mesh resolution on predicted velocity distributions at z = 0.255
m for SSG Reynolds stress turbulence model: (a) axial velocity; (b) tangential velocity.

Chapter 5 Cyclone Dryer Flow Field: Experimental and Numerical Studies 106
The tangential and axial velocity distributions obtained with the SSG Reynolds stress
turbulence model for four different mesh resolutions are plotted and compared with the
experimental data in Figures 5.10 and 5.11. The general trend of the velocity distributions
is correctly predicted at the mesh resolutions of 864,185, 190,057 and 86,555 nodes, but a
significantly discrepancy is observed for the mesh resolution of 419,928 nodes. The
convergence level of RMS residual achieved with the SSG Reynolds stress model was
generally poor. As seen from Table 5.4, the RMS residual values were all of order 10-3 .
Table 5.4 Comparison of predicted total pressure drop coefficient and RMS residual
value for different mesh resolutions using SSG Reynolds stress turbulence model with
second-order differencing scheme.
Mesh resolution Predicted total pressure drop coefficient RATS residual
Value Difference from
experiment (%)
864,185 nodes 13.3 - 19.2 7.5 x 10⁻⁴ 419,928 nodes 9.2 -44.0 1.5 x 10⁻³
190,057 nodes 12.4 - 24.7 8.8 x 10⁻⁴ 86,555 nodes 10.5 - 36.2 3.5 x 10⁻³
The values of total pressure drop coefficient predicted by the SSG Reynolds stress model
are presented in Table 5.4. They generally differ more from experiment than the
predictions of the RNG k-E model. There is a very rough (but not entirely consistent)
correlation between the accuracy of the pressure drop prediction and the trend of near-
wall convergence achieved. Similar trends can be seen in the near-wall distributions of
tangential velocity presented in Figure 5.12. These distributions do not exhibit
convergence with increasing mesh resolution, as was observed with the RNG k-E model
results presented in Figure 5.9.
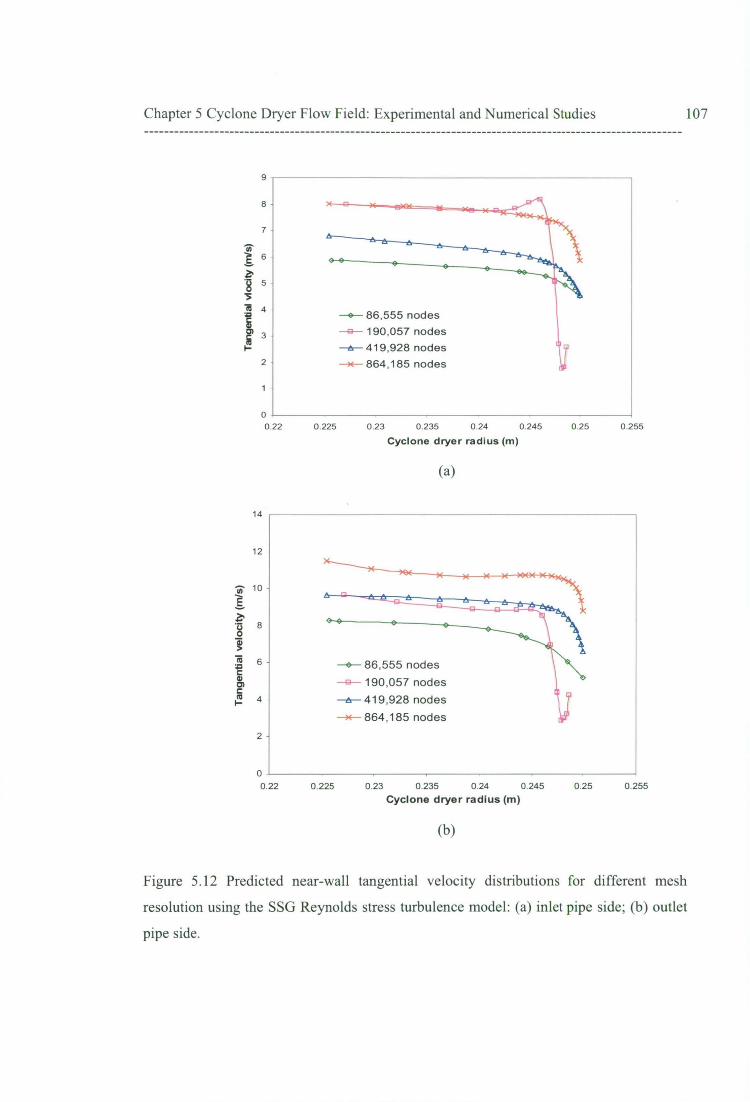
0.25 0.255 0 0.22 0.225 0.23 0.235 0.24 0.245
Cyclone dryer radius (m)
(a)
14
12 -
10 -
6 - —e— 86,555 nodes - G- 190,057 nodes —n-419,928 nodes - 864,185 nodes
4
0.25 0.255 0 0.22 0.225 0.23 0.235 0.24 0.245
Cyclone dryer radius (m)
9
8
7
—0— 86,555 nodes - 0- 190,057 nodes —8-419,928 nodes —94— 864,185 nodes
2
(b)
• 6
.g 5
4
3
2
Chapter 5 Cyclone Dryer Flow Field: Experimental and Numerical Studies 107
Figure 5.12 Predicted near-wall tangential velocity distributions for different mesh
resolution using the SSG Reynolds stress turbulence model: (a) inlet pipe side; (b) outlet
pipe side.

Chapter 5 Cyclone Dryer Flow Field: Experimental and Numerical Studies 108
Figures 5.13 and 5.14 compare the distributions of tangential and axial velocity predicted
by the RNG k-E and SSG Reynolds stress turbulence models at elevations z = 0.055 m
and 0.255 m. The curves presented are those for the best converged solutions obtained
with each turbulence model. The SSG Reynolds stress turbulence model does not
perform significantly better overall than the RNG k-E turbulence model.
It was decided on the basis of these results to use the RNG k-E turbulence model for all
further work. The SSG Reynolds stress model results were considered unreliable due to
the inability of this model to produce acceptable levels of solution convergence.
5.3.3.4 Optimised numerical model
On the basis of the foregoing results, the RNG k-E turbulence model using a second-
order differencing scheme with a mesh resolution of 419,928 nodes was selected for all
further cyclone dryer investigations. This procedure produced good solution convergence
with an RMS residual level of le. The SSG Reynolds stress turbulence model was
considered unreliable, due to its inability to produce adequate levels of solution
convergence. The selected computation procedure gave values of predicted total pressure
drop coefficient about 20 % lower than experiment; this is comparable with the accuracy
of computational pressure drop predictions for simple cyclone separators reported in the
literature.
5.4 NUMERICAL PREDICTIONS
5.4.1 Effect of Inlet Air Velocity
The optimised numerical model described in Section 5.3.3.4 was subsequently applied to
predict the influence of inlet air velocity variation on the velocity field and pressure drop

k-e RSM Experiment
--t i i 1 1 i
i I- 1 f -..-. i
r/R (a)
2.5
k e RSM Experiment
1.5
05
-0 5
i • .• .• . i +....- 4
i . 1 ! i
, I 1 , I 1
1—
Chapter 5 Cyclone Dryer Flow Field: Experimental and Numerical Studies 109
characteristics of the cyclone dryer. The uniform inlet velocity was varied from 8 to 13
m/s.
-08 -0.6 -0.4 -0.2 0 0.2 0.4 0.6 0.8 1
-0.8 -0.6 -0.4 -0.2 0 0.2 0.4 0.6 0.8
r/R
(b)
1.5
0.5
0.5
Figure 5.13 Influence of different turbulence models on the predicted velocity
distributions at elevation z = 0.055 m: (a) axial velocity; (b) tangential velocity.

k-e RSM --4— Experiment
2.5
1.5
05
0-
0.5
Chapter 5 Cyclone Dryer Flow Field: Experimental and Numerical Studies 110
1 2
•t-•
• f
k-e RSM Expenment
08
06
4f.
1
's... ,
' . .
i . i . . I i
„ t 't I 1 t .
f
1 , ! i
; i : ! i
I I i 4 t
. i t 1 4 f
-0.6 -0.4 -0.2 0 0.4
r/R
(a)
-0.8 -0.6 -0.4 -0.2 o r/R
(b)
0.2 0.4 0.6
i t i i I ■ ■ i ■ I !
! . ; . ■
■ i i ■ ! ! !
i ■ 1 ! i i i i
I i i I . -I-
I i 1 i 1 111 1 1 I i
Figure 5.14 Influence of different turbulence models on the predicted velocity
distributions at z = 0.255 m: (a) axial velocity; (b) tangential velocity.
-0.4
-0.6
- -0.8 0.2 0.6
0.8

18
17
12
11 24 2.6 2.8 3 3.2 3.4 3.6 3.8
Reynolds Number : Re 4 4.2 44
X 105
Chapter 5 Cyclone Dryer Flow Field: Experimental and Numerical Studies 111
Figure 5.15 shows the predicted total pressure drop coefficient plotted against the cyclone
dryer Reynolds number. The results are compared to the experimental data presented
earlier in Section 4.5.2. The predicted variation of pressure drop coefficient with
Reynolds number is closely similar to that observed experimentally. However, as
indicated in Table 5.3, the predicted values of total pressure drop coefficient are about 20
% below the experimental values.
Figure 5.15 Pressure drop characteristics from simulation and experiment.
The predicted radial profiles of dimensionless axial and tangential velocity at 8, 10 and
13 m/s inlet velocity are closely similar, as shown in Figure 5.16. This indicates that a
similar flow pattern is obtained in the cyclone dryer over its practical operating range for
grain drying.

V = 13 m/s V = 10 m/s V = 8 m/s Experiment (V = 9 m/s)
-
—1—
3
0.5
V = 13 m/s V = 10 m/s V = 8 m/s Expenment (V = 9 m/s) -0 5
2.5
2
1.5
Chapter 5 Cyclone Dryer Flow Field: Experimental and Numerical Studies 112
1.2
0.8
0.6
0.4
0.2
-0.2
-0.4
-0.6
-1 -0.8 -0.6 -0.4 -0.2 0
02
0,4
0.6 0.8 1
r/R (a)
-0.8 -0.6 -0.4 -0 2 0.2 0.4 0.6 0.8
r/R
(b)
Figure 5.16 Comparison of axial and tangential velocity profiles predicted by RNG k — c
turbulence model at different inlet velocities (8, 10 and 13 m/s): (a) axial velocity; (b)
tangential velocity.

Chapter 5 Cyclone Dryer Flow Field: Experimental and Numerical Studies 113
5.4.2 Effect of Number of Chambers
The number of internal separation chambers in a cyclone dryer may need to be altered to
change the residence time of the material being dried. The effect of additional chambers
on the velocity distribution and pressure drop across the model cyclone dryer was also
investigated by means of the optimised numerical simulation. Calculations for the 3-
chamber dryer were repeated for dryers with 4, 5 and 6 chambers by adding further
internal chambers. The meshing scheme for the additional chambers was identical to that
used for the central chamber in the 3-chamber dryer flow computation. A uniform inlet
velocity of 10 m/s was used in all cases.
Figure 5.17 shows velocity vector plots together with pressure contours on an x-z plane
and x-y planes at various elevations in a 3-chamber dryer. Velocity vector plots and
pressure contours in a 4-chamber cyclone dryer are shown in Figure 5.18. The velocity
and pressure distributions for the 5- and 6-chamber cyclone dryer calculations are not
shown here, but the predicted total pressure drop coefficients are presented in Table 5.5.
For the 3-chamber cyclone dryer, the simulation results in Figure 5.17 (a) indicate the
complicated structure of the axial velocity field inside the cyclone dryer chambers. In the
lowest chamber, air-flow separates at the wall into upward and downward streams at a
point close to the middle of the inlet pipe. Upward flow is present along the wall surface
above the middle of inlet pipe, and it causes a downward flow along the surface of the
orifice plate and a short circuit through to the higher chamber at the orifice. Below the
middle of inlet pipe, there is a downward flow along the conical bottom surface leading
to an upward flow at the axis of the cyclone dryer.
The upward velocity components near the axis of the cyclone dryer are small and widely
distributed in the lowest chamber, but larger and more concentrated at the higher
chambers. This air core has an asymmetric pattern in the second chamber, but becomes
more symmetrical with a higher number of chambers, as seen from the velocity vector
plot for the 4-chamber dryer in Figure 5.18 (a).

VVerdde
16.214
— 12.442
1.120
tI. .^ -1]
4 894 WINOU
g: 1
L.
VVer,•-•
- r
Chapter 5 Cyclone Dryer Flow Field: Experimental and Numerical Studies 114
■11,
PVer (PConlour)
I 978.758
157.025
• —715.291
1413.558
491.824
248.357
370.091
126.624
4.890
i .116 .144
L , IP41
(a) (b)
'
(c)
(d) (e)
Figure 5.17 Velocity vector plot and pressure contours for three-chamber cyclone dryer:
(a) velocity vector plot in x-z plane at y = 0 m; (b) pressure contour plot in x-z plane at y
= 0 m; (c), (d) and (e) velocity vector and pressure contour plots in x-y plane at z = 0.055
m, 0.255 m and 0.455 m.
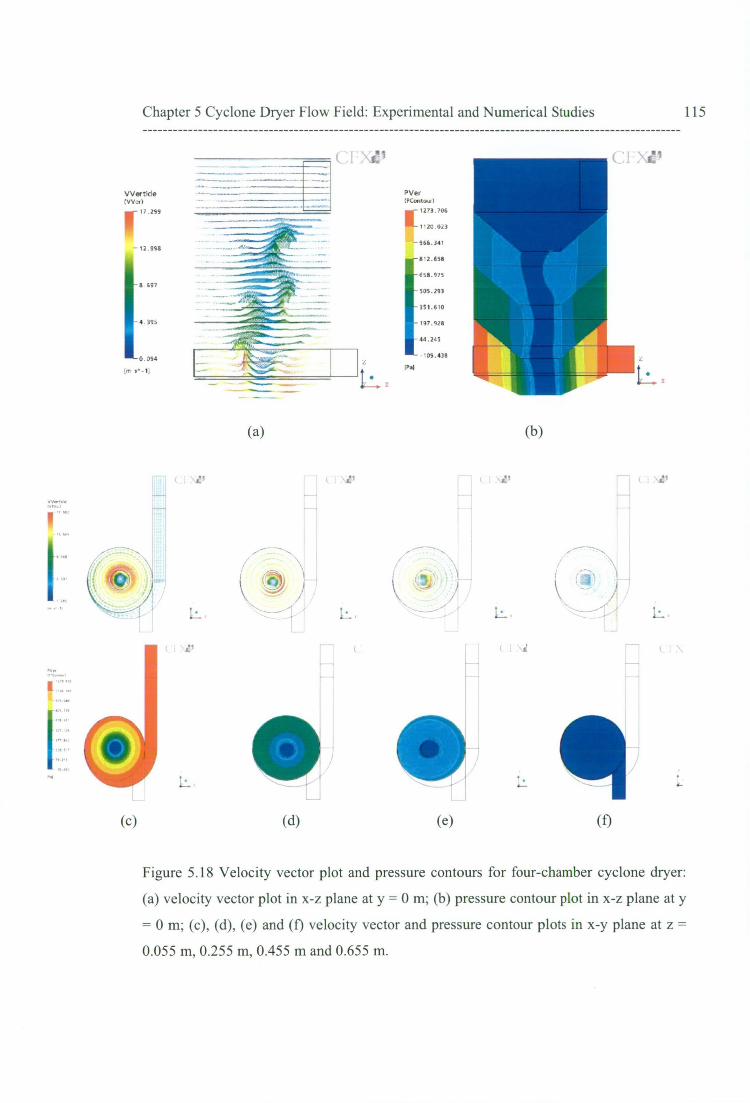
Watch' (VVcr)
17.211 7momomommemaw
— 11.191
P1ier (PContow
I1273.706
r 1120 023
• - 966.341
I812.658
658.975
505.293
351.610
197.928
44.245
01+4
-109.438 1' 697
(m 1.-1]
4.395
0.094
-
Chapter 5 Cyclone Dryer Flow Field: Experimental and Numerical Studies 115
(a) (b)
a! ' '
a-
(c) (d) (e) (f)
Figure 5.18 Velocity vector plot and pressure contours for four-chamber cyclone dryer:
(a) velocity vector plot in x-z plane at y = 0 m; (b) pressure contour plot in x-z plane at y
= 0 m; (c), (d), (e) and (f) velocity vector and pressure contour plots in x-y plane at z =
0.055 m, 0.255 m, 0.455 m and 0.655 m.

Chapter 5 Cyclone Dryer Flow Field: Experimental and Numerical Studies 116
The swirl velocity becomes weaker as it passes through successive chambers, while the
axial velocity becomes stronger for additional chambers of cyclone dryer. This is seen in
the comparison of vector plots for 3- and 4-chamber dryers shown in Figures 5.17 (a) and
5.18 (a). These flow patterns indicate that the drying material should first move
downward along the surface of the conical bottom and then upward from chamber to
chamber due to the high upward velocity component in the orifice flow near the axis of
the cyclone dryer.
In the highest or exit chamber, the flow pattern is different from that in the internal
chambers as the upward core air flow vanishes. The vortex core is deflected from the
cyclone axis and changes its direction to the exit pipe. This causes a large scale
recirculation inside the highest chamber which continues into the exit pipe in the y
direction. This flow pattern is clearly seen in the velocity vector plots for x-y planes at z
= 0.455 m, z = 0.655 m and z = 0.855 m for the 3- and 4-chamber cyclone dryers, which
exhibited similar behaviour (Figures 5.17(e) and 5.18(0).
The static pressure decreases radially from the wall to the centre of cyclone dryer
chamber, and a negative pressure zone appears in the forced vortex region in the centre of
the vortex core. This is indicated by the dark blue colour on the pressure contour plot.
The pressure gradient is largest in the radial direction of the lowest dryer chamber, where
the swirl velocity is highest. Another significant pressure gradient occurs along the exit
pipe, as a flow deflection exists at this part of the cyclone dryer. Negative static pressure
can be seen in the pressure contour plots for x-y planes at z = 0.455 m, and z = 0.655 m
for the 3- and 4-chamber cyclone dryers (Figures 5.17(e) and 5.18(f)).
The predicted influence of the number of chambers on the overall total pressure drop
coefficient for the model cyclone dryer is show in Table 5.5. The computed pressure drop
coefficient increases only slowly with number of chambers. There is certainly no direct
proportionality between these two quantities.

Chapter 5 Cyclone Dryer Flow Field: Experimental and Numerical Studies 117
Table 5.5 Predicted influence of number of chambers on total pressure drop coefficient
for model cyclone dryer.
Number of chambers 3 4 5 6
Total pressure drop coefficient 13.1 13.4 14.0 14.4
5.5 CONCLUSIONS
This chapter has reviewed the development of an optimised numerical model, based on
the commercial CFD software package CFX 5.7, for prediction of the single-phase flow
field in the model cyclone dryer. Experimental data for internal velocity distributions and
overall pressure drop were used to validate the computations and assist in choosing the
optimal procedure.
Grid independence was demonstrated with a hexahedral mesh of about 420,000 nodes for
the 3-chamber dryer case. The best results were obtained using second-order differencing
with the RNG k-e turbulence model, which gave good solution convergence to an RMS
residual level of 10 -6 . The SSG Reynolds stress turbulence model, which is physically
more accurate, was not adopted because it did not produce acceptable solution
convergence.
The optimised numerical model gave predictions of the internal velocity distributions that
agreed fairly well with experiment. The predicted variation of the overall total pressure
drop coefficient with Reynolds number agreed well with experiment, but the predicted
pressure drop levels were about 20% lower. This is comparable with the accuracy of

Chapter 5 Cyclone Dryer Flow Field: Experimental and Numerical Studies 118
computational pressure drop predictions for simple cyclone separators reported in the
literature.
The optimised model predicted closely similar internal flow patterns over the range of
inlet velocities practical for grain drying. The additional of more internal chambers,
which might be required to obtained longer residence time for solid particles in the dryer,
was predicted to produce only a slight increase in the overall pressure drop coefficient.
The next chapter will discuss two-phase isothermal solid-gas flow in the model cyclone
dryer. The residence time characteristics of both paddy grain and spherical silica gel
particles will be examined experimentally and compared with numerical predictions.

Chapter 6 Solid-Gas Behaviour and Particle Residence time Distribution of A Cyclone Dryer 119
Chapter 6
SOLID-GAS FLOW BEHAVIOUR
AND
PARTICLE RESIDENCE TIME
DISTRIBUTION
OF
A CYCLONE DRYER
6.1 INTRODUCTION
Drying of paddy grain in a pneumatic dryer was studied in Chapter 3. The simulation
results showed that this type of dryer could not achieve the large residence time required
to reduce the moisture content of paddy to a safe storage level. Particle residence time is

Chapter 6 Solid-Gas Behaviour and Particle Residence time Distribution of A Cyclone Dryer 120
an extremely important variable in paddy grain drying. Cyclone dryer technology offers
the prospect of more suitable residence times for paddy grain drying. However, the
development of this technology in the chemical industry appears to have been largely
empirical, and no detailed studies of particle residence time and drying behaviour have
been reported in the open literature.
The dynamic behaviour of traditional gas-cleaning cyclone separators has been
extensively studied. Most of these investigations were related to separation efficiency and
pressure drop. Several recent studies have examined possible cyclone applications for
heat transfer equipment (Szekely et al., 1966; Yen et al., 1990) and heat and mass transfer
equipment (Silva et al., 1991; Benta et al., 1997) because of the good contact between gas
and solid phase. Particle residence time was not examined by these workers, but is
obviously an important variable as the results they obtained were strongly process
dependent.
The application of CFD for the numerical calculation of particle-gas flow in a cyclone
has become popular in recent decades. Two different modelling approaches can be
employed: the Eulerian-Lagrangian and the Eulerian-Eulerian multiphase models. In the
Eulerian-Lagrangian multiphase model, the flow of gas is treated as a continuum carrying
numerous discrete particles. The trajectory of each particle within the air flow is
predicted by solving the Lagrangian equations of mass and momentum. In the Eulerian-
Eulerian multiphase model, the air flow and particle phases are both treated as
interpenetrating interactive continuums. The governing equations for each phase are
similar to the Navier-Stokes equations, with extra source terms in the momentum
equation to account for the turbulent dispersion of particles.
One of the first CFD simulations of the cyclone separator was done by Boysen et al.
(1982). They used an Eulerian-Lagrangian multiphase model with an algebraic
turbulence model to provide the details of gas flow and particle motion occurring in this
device. Grade-efficiency was obtained by means of a stochastic particle tracking
technique. Several researchers have undertaken numerical simulations, attempting to

Chapter 6 Solid-Gas Behaviour and Particle Residence time Distribution of A Cyclone Dryer 121
predict the pressure drop and grade-efficiency of cyclone separators by Lagrangian-
Eulerian multiphase models (Griffths et al., 1996; Yoshida et al., 1991 and 2001; Derksen
2003 and Wang et al., 2003). Silva and Nebra et al. (1991, 1994, and 1997) used an
Eulerian-Eulerian multiphase model to model particle-gas flow in cyclone separators.
These studies determined design specifications and performance characteristics for
various types of cyclone separator, but the particle residence time was not studied or
reported.
Kemp et al. (1998) have studied particle residence time and drying in a cyclone separator.
They concluded that particle residence time increased with cyclone diameter, particle
diameter, and particle density but decreased when solid-gas loading increased. They also
observed that drying in a cyclone increased with cyclone diameter, gas temperature, and
gas flow rate, but it decreased with solid-gas loading. Other authors have observed this
influence in cyclone separators. Correa et al.(2001) and Dibb et al. (1997) used software
developed by Silva et al. (1991), in which the particle-gas flow was described by an
Eulerian-Eulerian multiphase model to examine the influence of cyclone geometry. It was
concluded that the cyclone diameter had the most significant influence on particle
residence time. A Lagrangian-Eulerian multiphase model provided by the commercial
CFD code CFX4.4 was used by Correa et al. (2004a and 2004b) to study the influence of
cyclone dimensions on particle residence time. Experimental and theoretical results
showed the solid volumetric concentration to have the greatest influence on particle
residence time, but the qualitative agreement between simulated and experimental
residence times was poor.
This chapter describes studies of the residence time of spherical silica gel particles and
paddy grain in various builds of the model cyclone dryer designed previously in Chapter
4. Experimental studies of the influence of the number of chambers and operating
conditions of the cyclone dryer on particle residence time were performed.
Computational fluid dynamics studies were undertaken using the commercial code CFX
5.7. A Lagrangian-Eulerian multiphase model was used to simulate particle transport
with one-way coupling. Due to the irregular shape of paddy grain, additional experiments

Chapter 6 Solid-Gas Behaviour and Particle Residence time Distribution of A Cyclone Dryer 122
were conducted with spherical shaped material (silica gel). This provides a more valid
comparison between numerical and experimental results, as the particle drag model in
CFX assumes particles of spherical shape.
6.2 RESIDENCE TIME DISTRIBUTION (RTD) OF
PARTICLES IN A CYCLONE DRYER
This chapter deals in large part with the residence time distribution (or RTD) approach to
particle transport through a cyclone dryer. There are two idealised flow models: plug and
mixed flows (Levinspiel, 1972). The first of the two ideal steady-state flow models is
plug flow, which occurs in a plug flow reactor (PFR). It is characterised by orderly flow
of fluid through the reactor with no element of fluid overtaking or mixing with any other
element ahead or behind. There may actually be lateral mixing of fluid in a plug flow
reactor; however, there must be no mixing or diffusion along the flow path. The
necessary and sufficient condition for plug flow is for the residence time in the reactor to
be the same for all elements of fluid. The other ideal flow model is called mixed flow,
and occurs in a constant flow stirred tank reactor (CFSTR). It is a flow in which the
contents are well stirred and uniform through out. Thus the exit stream has the same
composition as the fluid within the reactor. Figure 6.1 shows diagrams of these two ideal
types of reactor.
Feed
Product
Product
Feed
(a)
(b)
Figure 6.1 The two ideal types of reactor: (a) plug flow; (b) mixed flow.

2 0.6
0.5
5 0.4
3 0.3
0.2
Chapter 6 Solid-Gas Behaviour and Particle Residence time Distribution of A Cyclone Dryer 123
In order to characterise the dynamic behaviour of a real dryer, the particle residence time
must be determined. The particle flow patterns and residence time distributions used for
characterisation of the real (non-ideal) device will be discussed in the following section.
6.2.1 RTD Theory
It is evident that particles in a dryer taking different routes will require different lengths
of time to pass through the dryer (Levinspiel, 1972). Some particles might leave the dryer
after a shorter time than the mean residence time. These would still be wet, while other
particles might remain in the dryer much longer than mean residence time and leave the
dryer over-dried. Figure 6.2 shows the cumulative age distribution of tracer particles
recorded in the exit stream from the dryer. This is called the F(t) curve, and it represents
the proportion of tracer having left the dryer at time t relative to the initial amount of
tracer. It always rises from 0 to 1.
Time (s)
Figure 6.2 Cumulative age distribution, or F(t) curve.

z
Exit age distribution curve, E (t)
Fraction of exit particles older than
Total area =1
Chapter 6 Solid-Gas Behaviour and Particle Residence time Distribution of A Cyclone Dryer 124
The RTD depends on the flow pattern: in particular, whether it tends towards well-mixed
or ideal plug flow. The distribution of residence times of each particle is called the exit
age distribution, E, or the residence time distribution (RTD) of particles. It is the
differential of the cumulative age distribution (F curve) with time as shown in Equation
6.1:
dF(t) = E(t) dt
The RTD can be represented in such a way that the area under the curve is unity, i.e.
fE(t)dt = 1
This procedure is called distribution normalisation and is shown in Figure 6.3. The
fraction of particles exiting between t + dt and t is E(t)dt. The fraction of particles with t,
residence time less than t is fE(t)dt . The fraction of exit particles staying in the dryer
longer than t i , shown as the shaded area in Figure 6.3, is
t, t, SE(t)dt = 1— SE(t)dt (6.3)
Time, t
Figure 6.3 The exit age distribution curve, E (t) for particle flow through a dryer, also
called the residence time distribution or RTD (Levenspiel, 1972).
(6.1)
(6.2)
Exit
age
dist
ribut
ion,
E (t
)

Chapter 6 Solid-Gas Behaviour and Particle Residence time Distribution of A Cyclone Dryer 125
6.2.2 Experimental Evaluation of RTD
The following methods of experimentation have been widely used to characterise the exit
age distribution function or residence time distribution. They might be classified as
stimulus-response techniques, in which the system is disturbed and subsequently
observed to examine the system response. In the present experiments, the stimulus was a
tracer input into the inlet of the dryer; the response was a time record of the tracer
particles leaving the dryer. When injecting tracers into the dryer, the tracer pulse was
made as short as possible. The residence time distribution (RTD) function was
determined experimentally from the following relation (Seker, 2005; Levenspiel, 1972):
E (t) c i /(Ec i At) (6.4) i=o
where ci = the tracer concentration at time t = mass of tracer in sample at time t / mass of
sample at time t. The accumulated quantity of tracer at the exit, represented by the F(t)
curve, is given by the following equation:
F (t) _- _:(Ec i At)/(Ec i At) (6.5) i=o i=o
The mean residence time (t), or centroid of the RTD, is co oo co
T a ftE(t)dt '-'' (Et i c i At)/(Ec i At) (6.6) o i=o i=o
The variance (a2), which measures the spread of the residence time distribution, is given
by
.5 2 ((Eqc i At)/(Ec i At))— T 2 i=o i=o
(6.7)
The dimensionless parameter 0 used for comparison of residence time distribution curves
is defined by:
0 = t (6.8)
The dimensionless RTD and cumulative age distribution curves are E(0) and F(0),
respectively.

Chapter 6 Solid-Gas Behaviour and Particle Residence time Distribution of A Cyclone Dryer 126
6.2.3 RTD Modelling for Non-Ideal Flow
As stated earlier in this section, the flow in a real reactor does not conform to the ideal
situations of a plug flow reactor (PFR) or constant flow stirred tank reactor (CFSTR).
These differences result from a certain degree of back mixing, which may be due to
channelling, axial mixing caused by vortices and turbulence, and bypass or short-
circuiting.
In order to consider deviations from these ideal flow behaviours, more complex models
are needed. Two well-known models were applied in this work to describe the behaviour
of particles in the cyclone dryer. These models are now briefly described.
6.2.3.1 Dispersion model
The dispersion model is often used to characterise the behaviour of tubular reactors. It
considers mass transport in the axial direction (z) as a diffusion-like process in terms of
an axial dispersion coefficient, Dp, which is superimposed on the plug flow. For steady-
state flow through the dryer (but unsteady with respect to the tracer concentration C)
(Tang et al., 2004). The differential mass balance is given in a dimensionless form by
Levinspiel (1972) as
ac = D p a 2c ac ao uL az 2 az
where u is the velocity and L is the characteristic length of the reactor. According to this
model, the reactor performance changes from that of a PFR for D p/uL = 0 to that CSFTR
for Dp/uL = 00. The dimensionless group D p/uL is called the dispersion number. The
effect of dispersion number on the RTD curve, which corresponds to degree of mixing, is
shown in Figure 6.4 (a). The solution of Equation (6.9) for large dispersion in an open
vessel is given by
(6.9)

Chapter 6 Solid-Gas Behaviour and Particle Residence time Distribution of A Cyclone Dryer 127
(1_0)2 E(0)= , 1 1 xp 2.V7rOp
[p /uL) 40(D p /uL)]
The variance of this distribution is found to be
2 DD = = 2 P 8 P ) 2 `J O 72 uL uL
(6.10)
(6.11)
6.2.3.2 Tank-in-series model
The tank-in-series model is an alternative to the dispersion model for dealing with
deviations from plug flow. In this model, it is assumed that the actual reactor can be
"replaced" by n identical stirred tank reactors, whose total volume is the same as that of
the actual reactor. The only parameter of this model is the number of tanks (n). The E (t)
curve of this model is obtained in the form n-I
f 1 E(t) = (n —1)
, !
e -t/i . (6.12) t i
Here i ; = mean residence time of each tank, I = nt 1 = mean residence time in the
N tank system. The effect of number of tanks (n) on the RTD curve, which corresponds
to degree of mixing, is shown in Figure 6.4 (b).
6.3 EXPERIMENTAL INVESTIGATION
A series of experiments was conducted to observe the dynamic behaviour of the model
cyclone dryer. Spherical silica gel particles with 3.25 mm mean diameter (33 % moisture
content) and paddy grain with 3.5 mm mean diameter (14% moisture content) were used
as test particles. The average particle diameter was measured using grading sieves. The
moisture content of these particles was measured by the oven-dry method. In this method,
an 11 g sample of silica gel was dried at 200 °C for 24 hours (Ashworth et al., 1980),
while a 3 g sample of whole paddy grain was dried at 105 °C for 72 hours (Chen, 2003).
The influence of inlet air velocity, particle feed rate and number of chambers on the RTD

Chapter 6 Solid-Gas Behaviour and Particle Residence time Distribution of A Cyclone Dryer 128
was observed. The applicability of the dispersion and tank-in-series model for describing
particle flow in the cyclone dryer was examined.
Dp/uL = 0.0002 Plug Flow, D p/uL = 0
Mixed Flow, Dp/uL = co 130/uL = 0.002
Dp/uL = 0.025
--...
Dp/uL=
_
0.2
- - _ Aii.
0
0.2
0.4
0.6
0.8
1.2
1.4
1.6
1.8
2
0 = t /
(a)
1.5
1
E(0)
0.5
E(0)
0 = t /
(b)
Figure 6.4 Effect of model parameters on the RTD curve, indicating various degrees of
mixing: (a) Dispersion model: influence of dispersion number, D/uL; (b) Tank-in-series
model: influence of number of tanks, n. (Levenspiel, 1972)

Chapter 6 Solid-Gas Behaviour and Particle Residence time Distribution of A Cyclone Dryer 129
6.3.1 Experimental Set-up
The test rig used to determine the RTD of the cyclone dryer is shown in the schematic
diagram of Figure 4.5. Details of the configuration and the measuring devices used are
briefly given below.
6.3.1.1 Intake system
This part consists of a bellmouth nozzle, heater and blower. Ambient air was drawn into
the system by a centrifugal blower (1). The air flow rate was measured using the throat
pressure tapping at the bellmouth nozzle intake. Readings were corrected for variations of
atmospheric conditions (temperature and pressure).
For the residence time experiments, it was not necessary to use hot air. Therefore the
heater (2) was not operated at this stage. Inlet air velocity was about 17-21 m/s and 19-23
m/s for the paddy and silica gel tests, respectively.
6.3.1.2 Particle feeder
A rectangular conical hopper with an adjustable sliding plate at exit was used as a particle
feeder. The particle feed rate was controlled by adjusting the position of sliding plate to
calibrated positions. A rotary feeder was used to prevent the air blowing back through the
open sliding plate. The mean relative deviation ( Erm ) of particle feed rate was calculated
by the following equation (Narimatsu et al., 2001):
Erm = F, —FI) (6.13)
n
where F measured particle feed rate (kg/s); F = average particle feed rate (kg/s).
Figures 6.5 and 6.6 show typical calibration curves for the solid flow rate of paddy and

Chapter 6 Solid-Gas Behaviour and Particle Residence time Distribution of A Cyclone Dryer 130
silica gel at different levels of fan motor frequency (Hz) and sliding plate opening. The
particle flow rate provided by the feeder did not change with the fan speed over the range
tested, but it varied significantly with the sliding plate opening.
Ern, was less than 0.5% for both paddy grain and silica gel. The experiments showed
good reproducibility. Particle feed rates used were 0.0339-0.0697 kg/s and 0.0340-0.0778
kg/s for paddy and silica gel, respectively.
6.3.1.3 Cyclone dryer chamber
Design details and dimensions of the cyclone dryer used for these experiments are given
in Appendix B. The outer diameter of cyclone dryer chamber was 500 mm. Experiments
were conducted using three- and four-chamber configurations of the dryer. The static
pressure drop across the dryer was measured between a pressure tap at the dryer inlet and
atmosphere at outlet.
Feed Rate 0.0697 kg/s Ern,= 0.4 %
Feed rate 0.0468 kg/s Ern, = 0.5% •
Feed rate = 0.0339 kg/s Ern, = 0.4%
• Le\el 1 • Level 2 • Level 3
0 10 20 30 40 50
Fan motor frequency (Hz)
Figure 6.5 Paddy flow rates versus motor fan frequency at different sliding plate
openings.
0.08
0.07
0.06
0.05
0.04
0.03
0.02
0.01

Chapter 6 Solid-Gas Behaviour and Particle Residence time Distribution of A Cyclone Dryer 131
0.09
0.08
Feed Rate 0.0778 kg/s = 0.4%
0.07
7 :It 0.06
0.05
Feed rate 0.0576 kg/s Ern, = 0.5%
Feed rate = 0.034 kg/s Err„ = 0.4%
0.02 -
• Lew! 1 e Level 2 • Level 3
0 10 20 30 40 50 ' s
Fan motor frequency (Hz)
Figure 6.6 Silica gel flow rates versus fan motor frequency at different sliding plate
openings.
6.3.1.4 Separation chamber
Test particles were collected at the cyclone exit by means of gravitational separation,
while the air was being exhausted to atmosphere. The separation chamber design and
dimensions are shown in Appendix B. By using the pulsing technique (Levenspiel, 1972)
the extent of non-ideal flow can be characterised.
The exhausted particles were collected in a succession of cups at the outlet of the
separation chamber and the tracer particles were counted. The RTD curves for tracer
particles for different operating conditions and number of chambers were established
from the tracer concentrations in successive collecting cups.
0.01
0
Chapter 6 Solid-Gas Behaviour and Particle Residence time Distribution of A Cyclone Dryer 132
6.3.2 Experimental Procedure
The test particles were loaded into the hopper, located at cyclone inlet. The sliding plate
was adjusted to the desired position to control particle feed rate. The centrifugal fan and
rotary feeder were then operated and the test particles were continuously blown through
the cyclone dryer chamber. This operation was continued until a steady flow of particles
was attained, and the pressure differentials across the cyclone and the bellmouth intake
was recorded. The dyed tracer particles were then injected to obtain the residence time
distribution (RTD).
A total mass of 100-200 g of tracer particles was injected into the cyclone dryer chamber
via a specially designed injector located at the cyclone inlet. The test particles were
collected from the outlet of separation chamber every 10 seconds until 450 seconds had
elapsed to ensure no tracers remained in the dryer chamber. The exhausted particles
collected in each time interval were analysed by separating the dyed particles and
weighing them using an electronic balance with an accuracy of 0.001 g. This procedure
was then repeated for three different particle feed rates and three different inlet velocities,
for both three- and four-chamber dryer configurations. The RTD curves for different
operating conditions were determined following the method in Section 6.2.2.
The first experiments were with 3.25 mm average diameter silica gel particles at feed
rates of 0.0340, 0.0576, and 0.0778 kg/s, and inlet velocities of 23, 21, and 19 m/s for
three- and four-chamber configurations of the cyclone dryer. Experiments with paddy
grain at feed rates of 0.0339, 0.0468, and 0.0697 kg/s, and inlet velocities of 17, 19, and
21 m/s for three- and four-chamber cyclone dryers were subsequently conducted.
6.3.3 Experimental Results
The experimental results at twenty operating conditions using silica gel and paddy as
testing materials are shown in Table 6.1. The first and second moments of residence time

Chapter 6 Solid-Gas Behaviour and Particle Residence time Distribution of A Cyclone Dryer 133
were first calculated from the measured distributions. The mean and variance were then
computed following Equations (6.6) and (6.7). The measured cumulative age
distributions, F(t), for the complete of tests on silica gel particles and paddy grain are
shown in Figures 6.7 and 6.8, respectively.
The measured effects of particle feed rate and inlet air velocity on the mean and variance
of residence time are first discussed. The experimental observations are then compared
with the two ideal reactor models outlined in Section 6.2.3. This matching was performed
by using the functions available in Microsoft Excel. The sum of squares of the residuals
was minimised with respect to the mean residence time and the relevant model
parameter: D/uL for the dispersion model; and n for the tank-in-series model.
Table 6.1 Influence of cyclone geometry and operating conditions on experimental
residence time distributions for silica gel particles and paddy grain.
Case Test particle Number of Chambers
Inlet Air Velocity (m/s)
Particle Feed Rate (kg/s)
Mean Residence
Time, T (s)
Standard Deviation
a (s) (sit
1 Paddy 3 21 0.0339 154 108 0.700 2 Paddy 3 21 0.0468 138 102 0.740 3 Paddy 3 21 0.0697 115 95 0.825 4 Paddy 3 19 0.0697 122 90 0.740 5 Paddy 3 17 0.0697 130 , 140 1.080 6 Paddy 4 21 0.0339 191 119 0.622 7 Paddy 4 21 0.0468 152 104 0.687 8 Paddy 4 21 0.0697 106 81 0.761 9 Paddy 4 19 0.0697 111 83 0.752 10 Paddy 4 17 0.0697 124 94 0.755 11 Silica gel 3 19 0.0778 134 102 0.761 12 Silica gel 3 21 0.0778 132 96 0.727 13 Silica gel 3 23 0.0778 148 116 0.784 14 Silica gel 3 21 0.0576 135 103 0.763 15 Silica gel 3 21 0.0340 184 119 0.645 16 Silica gel 4 19 0.0778 136 102 0.750 17 Silica gel 4 21 0.0778 138 101 0.735
18 Silica gel 4 23 0.0778 132 100 0.758 19 Silica gel 4 21 0.0576 161 190 0.678
20 Silica gel 4 21 0.0340 194 122 0.629
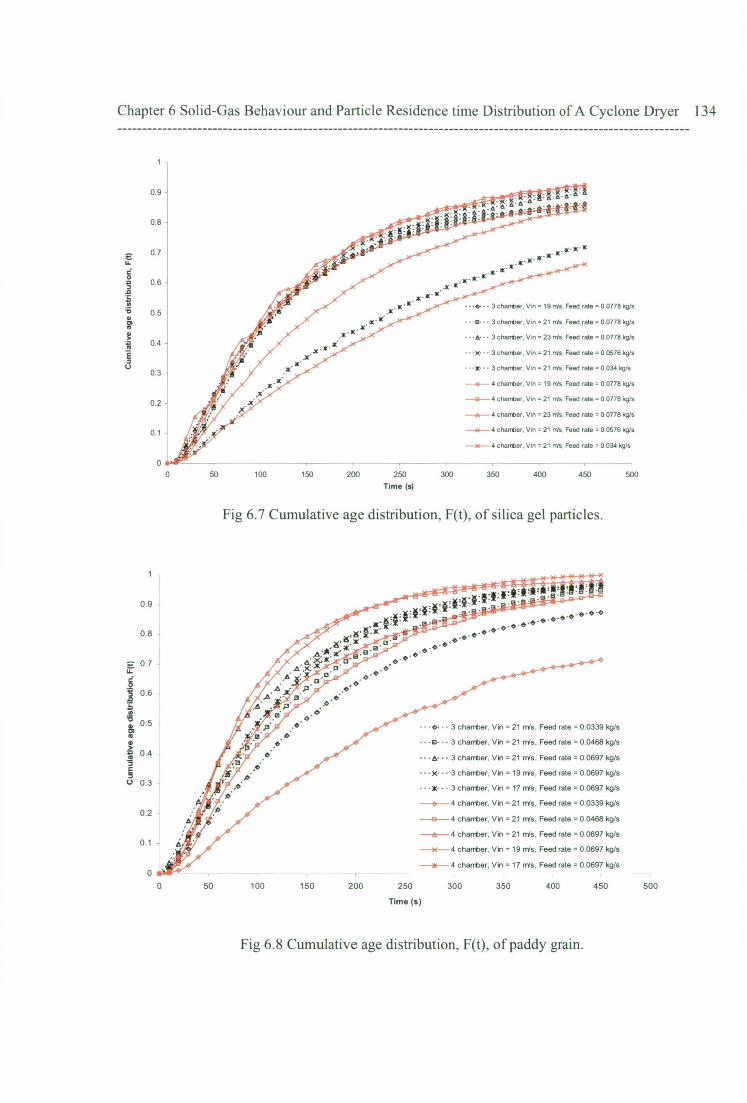
Cu
mia
tive
ag
e d
istr
ibu
tion
, F(
t)
0.9
0.8
0.7
0.6
0.5
0.4
0.3
0.2
0.1
Chapter 6 Solid-Gas Behaviour and Particle Residence time Distribution of A Cyclone Dryer 134
• - -e- • • 3 chamber, Vin = 19 rot, Feed rate = 0.0778 kg/s
• • -a- • - 3 chanter, Vin = 21 mg, Feed rate = 0.0778 kg/s
- • -A- • • 3 chanter, Vin = 23 inks, Feed rate = 0.0778 kg/s
• • • )6 • • 3 chamber, Vin = 21 nVs, Feed rate = 0.0576 kg/s
- 3 chanter, Vin = 21 mg, Feed rate = 0.034 kg/s
- e- 4 chanter, Vin = 19 mg, Feed rate = 0.0778 kg/s
- a- 4 chanter, Vin = 21 rnis. Feed rate = 0.0778 kg/s
-6- 4 chanter, Vin = 23 irks, Feed rate = 0.0778 kg/s
-6-- 4 chamber, Vin = 21 rrtes, Feed rate = 0.0576 kg/s
- 4 chanter, Vin = 21 irks, Feed rate = 0.034 kg/s
50
100
150
200
250
300
350
400
450 500
Time (s)
Fig 6.7 Cumulative age distribution, F(t), of silica gel particles.
A:
.41.11
kAt..411:1:"'
A,*
.0' o'
- - -0- - - 3 chanter, Vin = 21 m's, Feed rate = 0.0339 kg/s
• - -a- -- 3 chanter, Vin = 21 Ms, Feed rate = 0.0468 kg/s
- - A- - 3 chanter, Vin = 21 nYs, Feed rate = 0.0697 kg/s
• • -x• - - 3 chanter, Vin = 19 Ms, Feed rate = 0.0697 kg/s
-- -a- - - 3 chanter, Vii, = 17 Ms, Feed rate = 0.0697 kg/s
- 4 chanter, Vin = 21 Ms, Feed rate = 0.0339 itg/s
-9-- 4 chanter, Vin = 21 m's, Feed rate = 0.0468 kg/s
-0- 4 chanter, Vin = 21 rds, Feed rate = 0.0697 kg/s
- 4 chanter, Vin = 19 Ms, Feed rate = 0.0697 kg/s
- *---- 4 chanter, Vin = 17 nYs, Feed rate = 0.0697 kg/s
0
50 100 150 200 250 300 350 400 450 500
Time (s)
Fig 6.8 Cumulative age distribution, F(t), of paddy grain.
Cu
mu
lati
ve a
ge d
istr
ibu
tio
n, F
(t)
1
0.9 -
0.8
0.7
0.6
0.5
0.4
0.3
0.2 -
0.1 -

Chapter 6 Solid-Gas Behaviour and Particle Residence time Distribution of A Cyclone Dryer 135
6.3.3.1 Effect of inlet air velocity
The cumulative age distributions, F(t), at different inlet air velocities with the same feed
rate of silica gel particles and paddy grain in the three- and four-chamber cyclone dryers
are shown in Figures 6.9 and 6.10. The shape of the distributions does not change greatly
with the number of chambers. Figures 6.9 and 6.10 also show that the inlet velocity had a
slight effect on the cumulative age distribution.
For paddy grain, a higher inlet air velocity consistently gives a lower residence time, as
might be expected from kinematic similarity. (See cases 3, 4 and 5 for the three- chamber
dryer, and cases 8, 9 and 10 for the four-chamber dryer, as shown in Table 6.1.) For silica
gel particles, however, the trend of mean residence time with inlet air velocity is
inconsistent. (See cases 11, 12 and 13 for three-chamber dryer, and cases 16, 17 and 18
for the four-chamber dryer.)
6.3.3.2 Effect of particle feed rate
Figures 6.11 and 6.12 for silica gel particles and paddy grain, respectively, show how the
cumulative age distribution curves varied with particle feed rate for a given inlet air
velocity for both three- and four-chamber cyclone dryers.
For paddy grain, the mean residence time increased significantly when the particle feed
rate decreased. (See cases 1, 2 and 3 for the three-chamber dryer and cases 6, 7 and 8 for
the four-chamber dryer.) For silica gel particles this trend was less consistent. (See cases
12, 14 and 15 for the three-chamber dryer and cases 17, 19 and 20 for the four-chamber
dryer.)
The relative deviation of the residence time distributions, ah, tended to increase with the
particle feed rate. But again this trend was less consistent for the silica gel particles tests.

Cu
mu
lati
ve a
ge
dis
trib
uti
on
, F(
t)
1
0.9
0.8
0.7
0.6
0.5
0.4
0.3
0.2
0.1
Chapter 6 Solid-Gas Behaviour and Particle Residence time Distribution of A Cyclone Dryer 136
- - -0- -. 3 chamber,
- - -0- - - 3 chanter,
-- - a--- 3 chanter,
-0- 4 chanter,
-G- 4 chanter,
-6- 4 chanter,
Vin = 19 m's, Feed rate = 0.0778 kg/s
Vin = 21 m's, Feed rate = 0.0778 kg/s
Vin = 23 rn,s, Feed rate = 0.0778 kg/s
Vin = 19 rrVs, Feed rate = 0.0778 kg/s
Vin = 21 mis, Feed rate = 0.0778 kg/s
Vin = 23 rnis, Feed rate = 0.0778 kg/s
50
100
150
200
250 300
350
400
450 500
Time (s)
Figure 6.9 Influence of inlet air velocity on cumulative age distribution of silica gel
particles.
a:VK ,e)c.
•
- - -e- - - 3 chanter, Vin = 21 rrVs, Feed rate = 0.0697 kg/s
- - - 3 chanter, Vin = 19 TVs, Feed rate = 0.0697 kg/s
- - -x- - - 3 chanter, Vin = 17 rills, Feed rate = 0.0697 kg/s
-6- 4 chanter, Vin = 21 mis, Feed rate = 0.0697 kg/s
-x- 4 chanter, Vin = 19 n-Vs, Feed rate = 0.0697 kg/s
4 chanter, Vin = 17 m's, Feed rate = 0.0697 kg/s
0 50 100 150 200 250 300
350
400
450 500 Time (s)
0.9
0.8
0.7
0.6
0.5
g 0.4
I 0.3
0.2
0.1
Figure 6.10 Influence of inlet air velocity on cumulative age distribution of paddy grain.

Chapter 6 Solid-Gas Behaviour and Particle Residence time Distribution of A Cyclone Dryer 137
0.9 -
0.8 -
0.7 -
0.6 -
0.5 -
0.4 -
-El- - 3 chanter, Vin = 21 rrbfs, Feed rate = 0.0778 kg/s
- -8- — 3 chanter, Vin = 21 rtYs, Feed rate = 0.0576 kg/s
- - - 3 chanter, Vin = 21 rrYs, Feed rate = 0.034 kg/s
—a— 4 chanter, Vin = 21 m's, Feed rate = 0.0778 kg/s
—0— 4 chanter, Vin = 21 m/s, Feed rate = 0.0576 kg/s
—e— 4 chanter, Vin = 21 nYs, Feed rate = 0.034 kg/s
0
50
100
150
200 250 300 350 400 450 500 Time (s)
Figure 6.11 Influence of particle feed rate on cumulative age distribution of silica gel
particles.
1
5 ;
. . : . . .
-0 -0 -0 -
.0' .0
,0
0 4' P
• ei
tit 0 5 -
0.4 - ---0--- 3 chamber, Vin = 21 mis, Feed rate = 0.0339 kg/s
- - -B- - - 3 chanter, Vin = 21 mis, Feed rate =0.0468 kg/s
- - -0- -. 3 chanter, Vin = 21 m's, Feed rate =0.0697 kg/s
—0-- 4 chanter, Vin = 21 m's, Feed rate =0.0339 kg/s
—a— 4 chanter, Vin = 21 m's, Feed rate =0.0468 kg/s
—0— 4 chamber, Vin = 21 rris, Feed rate =0.0697 kg/s
50
100 150
200
250 300
350 400 450 500 Time (s)
Cum
ula
tive a
ge
dis
trib
ution,
F(t
)
0.3
0.2
0 9 -
0 8
• 0.7
2 0.6
-A 'a
.A.A
.0
A .8..a* .o•e'e
.e .e• 111 A•
A
0.3
0.2 -
0.1 -
Figure 6.12 Influence of particle feed rate on cumulative age distribution of paddy grain.

Chapter 6 Solid-Gas Behaviour and Particle Residence time Distribution of A Cyclone Dryer 138
6.3.3.3 Effect of number of chambers
In previous work on sugar cane bagasse drying in a cyclone separator, Correa et al.
(2004a) tried to obtain a general correlation for the average particle residence time
(APRT) as a function of variables like volumetric concentration, inlet gas velocity,
particle diameter, particle density and dimensions such as cyclone height and diameter. It
was concluded that none of the variables always had the same influence, except for
volumetric concentration, which always had an inverse influence on APRT. This was also
true in the present work, where the number of chamber had a variable influence on the
mean residence time. The relative deviation of the residence time distribution, alt, was
more consistently influenced by the number of chambers. As seen from Table 6.1, ah
mostly decreases when the number of chamber is increased from three to four.
The inlet air velocity and solid feed rate jointly determine the mass concentration. The
effect of mass concentration on mean residence time for three- and four-chamber cyclone
dryers is plotted in Figures 6.13 and 6.14 for paddy and silica gel, respectively. The mean
residence time varies quadratically with mass concentration. The fitted quadratic curves
shown in the figures describe the mean residence times with standard deviations of 8 and
10 % for paddy grain and silica gel particles, respectively.
6.3.3.4 Effect of particle density
The effect of particle type on average residence time is summarised in Table 6.1. The
data show that a higher particle residence time is obtained for silica gel with closely
similar feed rates at the same inlet air velocity. (See cases 3&4 vs 11&12; cases 8&9 vs
16&17.)
As mentioned in Chapter 4, heavier particles (larger diameter and higher density) will
spend more time in the swirl flow field of a cyclone dryer because of the action of

o Mean residence time, 3-Chanter
o
0 Mean residence time, 4-Ctianter
Correlation for 3-chamber cyclone dryer y =2170x 2 - 1150x +272
R2 =0.958
Correlation for 4-chamber cyclone dryer y = 3800x2 - 2130x + 409
R2 = 0.985
250
200
Mea
n re
sid
en
ce t
ime (
s)
150
100
50
0
Chapter 6 Solid-Gas Behaviour and Particle Residence time Distribution of A Cyclone Dryer 139
entrainment and re-dispersion. Therefore silica gel, which has nearly the same diameter
but higher density than paddy grain, exhibits the higher residence time in this experiment.
01 0.15 0.2 0.25 0.3 0.35
Mass concentration (kg/kg)
Figure 6.13 Influence of mass concentration on mean residence time of paddy grain for
three-and four-chamber cyclone dryers.
250 -
0 Mean residence time, 3-chamber
200
E .g 150
i i 1 100
I 50
0 01
Correlation for 3-chamber cyclone dryer y = 2040x2 - 1110x + 286
W = 0.843
Correlation for 4-chamber cyclone dryer y = 1320,0 - 894x + 283
R2 = 0.96
0.15 0.2 0.25 0.3 0.35
Mass concentration (kg/kg)
Figure 6.14 Influence of mass concentration on mean residence time of silica gel particles
for three-and four-chamber cyclone dryers.

Chapter 6 Solid-Gas Behaviour and Particle Residence time Distribution of A Cyclone Dryer 140
6.3.3.5 Comparison with non -ideal flow models
The comparison of experimental data with ideal theoretical models is a useful means of
defining the behaviour and performance characteristics of the model cyclone dryer. The
best fit of the ideal dispersion model given by Equation 6.10 was first studied, using the
experimental RTD data from test cases 1 to 10 (for paddy grain) and 11 to 20 (for silica
gel particles). The square of the correlation coefficient (R2) was minimised with respect
to the value of dispersion number. The tank-in-series model given by Equation 6.13 was
subsequently fitted to this experimental data, and the model parameter, n (number of
tanks in series) for best fit was obtained.
The best fit dispersion and tank-in-series models are compared with the experimental data
from test cases 1 and 11 in Figures 6.15 and 6.16 for paddy grain and silica gel particles,
respectively. The agreement is fairly good for the tank-in-series model, but a large
deviation is observed for dispersion model. The tank-in-series model is, therefore, more
acceptable for describing the RTD of a cyclone dryer.
The model parameters and R 2 values for all operating conditions shown tabulated in
Table 6.2. The tank-in-series model clearly gives much lower deviations from the
experimental RTD curves than the dispersion model. This indicates that the cyclone dryer
produces a well-mixed flow behaviour. The number of tanks, n, for best fit of the
experimental data in this study varies between 2 and 3, and is generally less than the
number of chambers in the dryer. This is consistent with the smaller amount of solid
recirculation in the exit chamber seen in both visual and numerical particle tracking
results. Typical numerically predicted particle tracks are show in Figure 7.17.
For the tests with paddy grain (cases 1-10) the average value n for best fit to the tank-in-
series model is lower for the three-chamber cases than for the four-chamber cases. This
tendency is not evident for the tests with silica gel particles (cases 11-20), where most of
the cases are best fitted by n =3.

0 50 100 150 200 250 300 350 400 450 500
Parameter Value —0— Experiment
—e-- Tank-in-series model n 2
—A— Dispersion model D/ul 0.375
0 50 100 150 200 250 300 350 400 450 500
—0-- Experiment Parameter Value
—e— Tank-in-series model n 2
—6— Dispersion model D/uL 0.517
.z.- a 0.005
2 0.004
fe 9
k 0.003
Chapter 6 Solid-Gas Behaviour and Particle Residence time Distribution of A Cyclone Dryer 141
time (s)
Figure 6.15 Comparison of best fit tank-in-series and dispersion models with
experimental RTD for paddy grain. Test case 1.
time (a)
Figure 6.16 Comparison of best fit tank-in-series and dispersion models with
experimental RTD for silica gel. Test case 11.

Chapter 6 Solid-Gas Behaviour and Particle Residence time Distribution of A Cyclone Dryer 142
Table 6.2 Best fit to experimental residence time distribution for tank-in-series and
dispersion models for cases specified in Table 6.1.
Case Number Of
Chambers
Tank-in-series Model Dispersion Model Number of
tanks, n R2 Dispersion
number, D/uL R2
1 3 2* 0.968 0.375 0.456 3 0.807
2 3 2 0.86 0.481 0.32 3* 0.926
3 3 2 0.814 0.499 0.253 3* 0.996
4 3 2* 0.916 0.463 0.302 3 0.876
5 3 2 0.827 0.48 0.283 3* 0.962
6 4 2 0.819 0.257 0.779 3* 0.998
7 4 2 0.808 0.354 0.406 3* 0.968
8 4 2 0.768 0.524 0.223 3* 0.936
9 4 2 0.758 0.491 0.232 3* 0.932
10 4 2 0.782 0.472 0.235 3* 0.989
11 3 2 0.836 0.517 0.29 3* 0.951
12 3 2 0.751 0.433 0.277 3* 0.946
13 3 2 0.742 0.585 0.336 3* 0.943
14 3 2 0.803 0.521 0.286 3* 0.987
15 3 2* 0.794 0.289 0.951 3 0.636
16 4 2 0.733 0.491 0.276 3* 0.952
17 4 2 0.776 0.456 0.265 3* 0.982
18 4 2 0.886 0.51 0.301 3* 0.896
19 4 2 0.869 0.336 0.511 3* 0.902
20 4 2* 0.654 0.226 0.671 3 0.535
* Indicates the number of tanks giving the best fit to the experimental data for the tank-in-
series model

Chapter 6 Solid-Gas Behaviour and Particle Residence time Distribution of A Cyclone Dryer 143
6.4 NUMERICAL SIMULATION
This section describes the numerical simulations used to study the gas-solid flow in the
model cyclone dryer. The simulations were performed using a Lagrangian-Eulerian
multiphase model with an RNG k-E turbulence model.
6.4.1 Mathematical Modelling
Chapter 5 described the three-dimensional Navier-Stokes and mass conservation
equations and presented numerical solutions for the gas phase. Details of the numerical
set-up for turbulence modelling, mesh type, advection scheme, mesh resolution, and
convergence criteria were also discussed in the previous chapter. The numerical results
for the gas phase are now used as initial conditions for particle transport modelling in the
model cyclone dryer.
In the particle transport model the gas phase is treated as a continuum, while the
particulate phase is treated as discrete elements. This approach is called a Lagrangian-
Eulerian multiphase model. The flow of the particulate phase is modelled by tracking a
small number of representative particles as they move through the fluid continuum.
Particle-particle interactions and the influence of the particle phase on the gas phase are
not taken into account. Only the gravity force and the gas drag force on the particles are
calculated. The interactions when particles hit the cyclone wall are described in terms of
parallel and perpendicular restitution coefficients.
The BBO equation presented in Chapter 3 is used to describe particle transport in the
Lagrangian-Eulerian multiphase model. The virtual mass force (or Basset force), Magnus
force, and Saffman force are not considered. The implemented model has a large number
of parameters that can be used to improve the RTD data fit. As mentioned by Crowe et al.
(1997), the response time of particles to changes in flow velocity or temperature are

Chapter 6 Solid-Gas Behaviour and Particle Residence time Distribution of A Cyclone Dryer 144
important in establishing non-dimensional parameters to characterise the flow. The
momentum response time (Ty) relates to the time required for a particle to respond to
turbulent velocity fluctuations. It is related to the fluid and the particle properties by
Tv = p p d p2 /18u a (6.14)
A quantitative estimate of the effect of turbulence on particle response time is given in
term of the Stokes number (Sty), which is defined by the ratio of the momentum response
time to a characteristic time for the flow field (TT):
Sty = Tv / TT (6.15)
If Sty << 1, the particle will have ample time to respond to velocity fluctuations. On the
other hand, if Sty >> 1, then the particle velocity will be little affected during passage
through the flow field.
The CFX simulations for the model cyclone dryer were run with and without turbulence
dispersion for the particle phase. The predicted cumulative age distributions of the solid
particles with and without turbulence dispersion effects were then compared with the
experimental results.
6.4.2 Numerical Procedure
The grid used for the multiphase flow was the hexahedral element grid of 419,928 nodes
shown in Figure 5.4. The gas phase was assumed to enter the domain with a uniform inlet
velocity through the tangential inlet to the bottom chamber. One thousand particles were
injected into the calculation domain through the solid feeder inlet at different positions
equally spaced over the inlet. Restitution coefficients of unity were assigned for the
simulations, i.e., it was assumed that the particles were perfectly elastic.
In order to compare the predicted results with experimental results described in the
previous section, the following data were used. Equivalent diameters of 3.25 mm and 3.5
mm were used for the silica gel particles and paddy grain, respectively. The moisture
content and density of the particulate phase were taken from the experimental results. The
Chapter 6 Solid-Gas Behaviour and Particle Residence time Distribution of A Cyclone Dryer 145
densities of the paddy grain at 14 % dry-basis and silica gel particles at 33% dry-basis
were 1132 and 1523 kg/m 3 , respectively.
A series of simulations was performed in which important design parameters were varied.
Simulations using silica gel particles were run with feed rates of 0.0340, 0.0576 and
0.0778 kg/s and inlet velocities of 23, 21 and 19 m/s for three- and four-chamber cyclone
dryer configurations. These feed rates and inlet air velocities are the same as those used
experimentally. Simulations of paddy grain behaviour at feed rates of 0.0379, 0.0468, and
0.0697 kgis and inlet velocities of 17, 19 and 21 m/s for three - and four-chamber dryer
configurations were subsequently conducted. The particle residence time distributions
were calculated by the following method. The particle mass fraction was defined by a
new probability parameter c , which is given by
c, = NP,/ (6.16)
Here NP, is the number of particles left in the chamber at time t, , and n o is the number
of particles initially injected into the computational domain. This particle mass fraction
was then used to calculate the cumulative age distribution of particles F(t) following the
method described in Section 6.2.2.
6.4.3 Numerical Results
6.4.3.1 Effect of turbulent dispersion model
Figures 6.17 and 6.18 show the cumulative age distributions of silica gel particles at
different inlet air velocities calculated with and without turbulence dispersion for three-
and four-chamber cyclone dryers. The predicted cumulative age distributions of paddy
grain at different air velocities for three- and four-chamber cyclone dryers are shown in
Figures 6.19 and 6.20. The corresponding experimental results are also presented in these
figures.

Chapter 6 Solid-Gas Behaviour and Particle Residence time Distribution of A Cyclone Dryer 146
The cumulative age distributions calculated with turbulence dispersion exhibit an abrupt
early break, after which the particles exit very slowly and there is an almost constant
accumulation of solids in the dryer. These curves differ greatly in shape from the
experimental results. For particle tracking without turbulence dispersion, the predicted
cumulative age distributions are similar in form to the experimental curves, but indicate a
more rapid exit of particles from the dryer than is actually observed. The predicted
variations in the cumulative age distributions with changes in air velocity are, however,
quite similar to those observed experimentally.
The above observations indicate that particle trajectories were little affected by turbulent
velocity fluctuations in the real flow situation. The influence of turbulent velocity
fluctuations was further examined by evaluating typical Stokes numbers for silica gel
particles and paddy grain in the cyclone dryer flow. The characteristic time of the cyclone
dryer adopted was a convective time scale obtained by dividing the cyclone dryer
diameter by the velocity of air at the orifice assuming uniform flow conditions.
As shown in Table 6.3, the Stokes numbers for both silica gel particles and paddy grain
range from 500 to 800 when the cyclone diameter is used as the characteristic length
scale. However, the length scale of turbulent eddies in the cyclone orifice flow that are
primarily responsible for the dispersion and re-entrainment of solid particles would be at
least an order of magnitude smaller than the cyclone diameter. Hence the relevant Stokes
number for the paddy grain and silica gel particles should be of order 10 4 . This provides a
possible explanation for the apparent lack of turbulent dispersion effects. Further
justification is provided by the experimental results of Modigell et al. (2000) who
observed that particles larger than 50% cut off diameter (equal to 4 [im) were unaffected
by turbulent dispersion in a cyclone separator flow.
Following the above observations, all further numerical computations were conducted
without turbulent dispersion effects applied by the CFX solver.

Chapter 6 Solid-Gas Behaviour and Particle Residence time Distribution of A Cyclone Dryer 147
Table 6.3 Stokes number of paddy grain and silica gel particles at different inlet air
velocity
Inlet air velocity
(m/s)
Stokes number (Sty)
Paddy grain Silica gel particles
17 506 -
19 565 656
21 625 725
23 - 794
6.4.3.2 Comparison of numerical residence time predictions with
experimental results
Table 6.4 compares the experimental mean particle residence times with the numerical
predictions obtained by neglecting turbulent dispersion. The case numbers in Table 6.4
correspond to those in Table 6.1.
The mean residence time predicted by the simulations was roughly doubled by increasing
the number of cyclone dryer chambers from 3 to 4; but changing this parameter had
relatively little effect on the experimental results. An inconsistent trend of mean
residence time variations for both experimental and numerical results was obtained when
the inlet air velocity was changed. The simulation results for different particle feed rates
have the same particle trajectories and mean residence time.
The predicted mean residence times are generally more accurate for four-chamber dryer
cases than for three-chamber cases (as indicated by the higher ratio of numerical to
experimental values shown in Table 6.4). The predicted mean residence times for paddy
grain are more accurate than those for silica gel particles.

100
..icer 2= 4 ,tlF tG rtc.e-
90 _ A • 6 . ,e'
.•0 80 4/
I A
70 -
60
ft f it: lit I:8 :I= It
I
-6. -0- -.3-0"
70
60
Chapter 6 Solid-Gas Behaviour and Particle Residence time Distribution of A Cyclone Dryer 148
C. •.71 .0;11
30 ot;..af
20
10
0 if •
- - -e- - Experiment, 3 Chamber, V=19 m/s
A Experiment, 3 Chamber, V= 21 m/s
- - -x- - - Experiment. 3 Chamber, V= 23 m/s
- Numerical, 3 Chamber, V=19 m/s
A Numerical, 3 Chamber. V= 21 m/s
- Numerical, 3 Chamber, V= 23 m/s
Numerical, 3 Chamber, V=19 m/s (Tur. Disp.)
Numerical, 3 Chamber, V= 21 m/s (Tur Disp.)
Numerical, 3 Chamber, V= 23 m/s (Tur. Oisp.)
50 -
40
50
100
150
200
250
300
350
400
450 500
Time (s)
Figure 6.17 Comparison of experimental and numerical cumulative age distributions of
silica gel particles in a three-chamber cyclone dryer. (Silica gel feed rate = 0.0778 kg/s)
100 -
)!F 41P 281. 1* ir OF AP OF OF IF 4"1"/F
, .)g -lc •ik
'IF e
N'A e -0 ", ,25"
.6 ••,• . 0
-A A
• Zt 4. 1*
50
90
6'
•?1-21- or—
Of dr 80 -
3 40
xa
30
20 .2C
10 - ?i X
0
- - -. Experiment, 4 Chamber, V=19 m/s
- - - a- - Experiment, 4 Chamber, V= 21 m/s
- - -x- - - Experiment, 4 Chamber, V= 23 m/s
—e— Numerical, 4 Chamber, V=19 m/s
—a— Numerical, 4 Chamber, V= 23 m/s
xc Numerical, 4 Chamber, V= 23 m/s
— - - Numerical, 4 Chamber, V=19 m/s (Tur. Disp.)
— - - Numerical, 4 Chamber, V= 21 m/s (Tur Disp.)
— - x— - Numerical, 4 Chamber, V= 23 m/s (Tur. Disp.)
0
50
100
150
200
250
300 350 400 450 500
Time (s)
Figure 6.18 Comparison of experimental and numerical cumulative age distributions of
silica gel particles in a four-chamber cyclone dryer. (Silica gel feed rate = 0.0778 kg/s)

1
50
40 -
1 30 -
20
10 -
Chapter 6 Solid-Gas Behaviour and Particle Residence time Distribution of A Cyclone Dryer 149
svotg fpg/F4F4F4F41Fic4iviFIFIFIFiF 4F 4 ***
. x-44 0
..outvirctlEti.:11:111:111511011,*.u. .x-Iff4e •°-
X I..
A . ...
. ,
i c I
100
90
80
70 -
6 60 -
.a. ••• . A,
' A
- - •e- - - Experiment, 3 Chamber, Vin = 17 m/s
•• •a- - Experiment, 3 Chamber, Vin = 19 m/s
-x- - Everiment, 3 Chamber, Vin = 21 m/s
Numerical, 3 Chamber, \An = 17 m/s
—a— Numerical, 3 Chamber, Vin = 19 m/s
—x— Numerical, 3 Chamber, \An = 21 m/s
- - Numerical, 3 Chamber, \An = 17 m/s (Tur Disp.)
- - - Numerical, 3 Chamber, \An = 19 m/s (Tur Disp.)
- - - Numerical, 3 Chamber, \An = 21 m/s (Tur Disp.)
0 50 100 150 200 250 Time (a)
300 350 400 450 500
Figure 6.19 Comparison of experimental and numerical cumulative age distributions of
paddy grain in a three-chamber cyclone dryer. (Paddy feed rate = 0.0697 kg/s)
11 -1 * - X6 :11
ar•
tr # 0- 0- 4, 4g 4,1
• -x' • r
.0' 4' .
ft
0".
•,‘ 41" g
, 4;
fertirlirAM AM - --------------- - ---------------- --- -- Experiment, 4 Chamber, \An = 17 m/s
- - -A- - - Exieriment, 4 Chamber, \An = 19 m/s
- - -x- -' Experiment, 4 Chamber, \An = 21 m/s
—a— Numerical, 4 Chamber, NAn = 17 m/s
— a-- Numerical, 4 Chamber, \An = 19 m/s
- Numerical, 4 Chamber, \An = 21 m/s
- - Numerical, 4 Chamber, \An = 17 m/s (Tur Disp.)
- - Numerical, 4 Chamber, \An = 19 m/s (Tur Disp.)
- - - Numerical, 4 Chamber, \An = 21 m/s (Tur Disp.)
0
0 50 100 150 200 250 Time (a)
300 350 400 450 500
80
70
60
50
40
3 30
20
10
100
90 -1
Figure 6.20 Comparison of experimental and numerical cumulative age distributions of
paddy grain in a four-chamber cyclone dryer. (Paddy feed rate = 0.0697 kg/s)
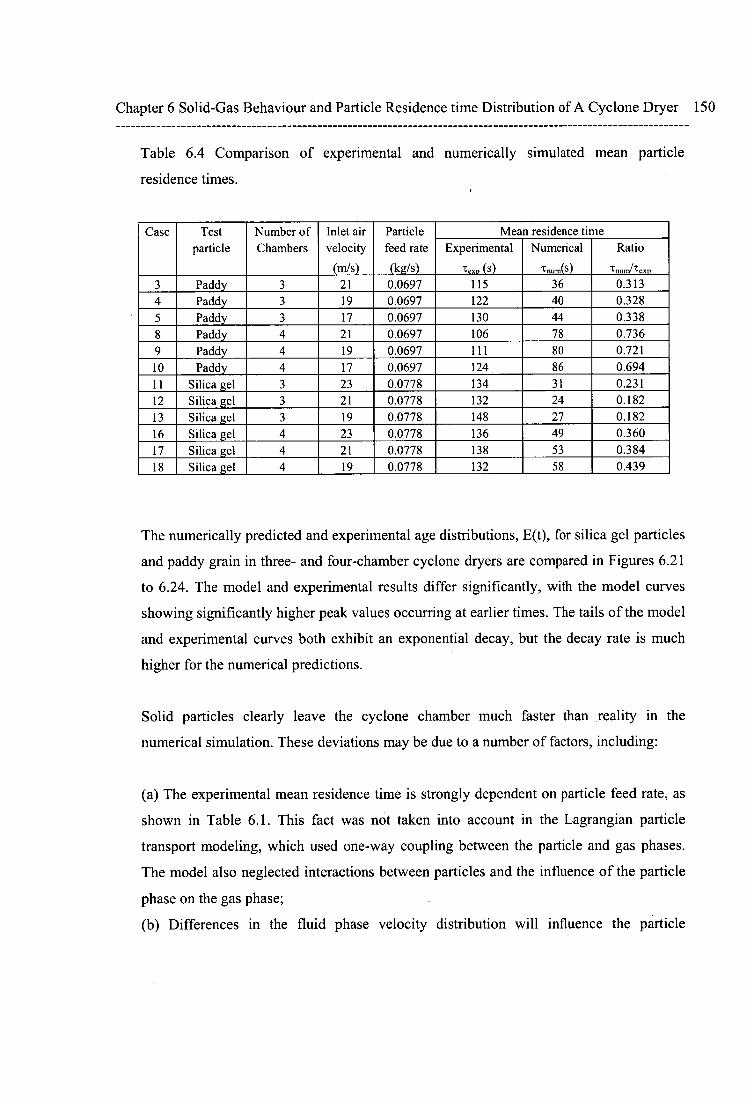
Chapter 6 Solid-Gas Behaviour and Particle Residence time Distribution of A Cyclone Dryer 150
Table 6.4 Comparison of experimental and numerically simulated mean particle
residence times.
Case Test particle
Number of Chambers
Inlet air velocity
(m/s)
Particle feed rate (kg/s)
Mean residence time Experimental
texp (s)
Numerical
Tnum(S)
Ratio
Tnumitexp
3 Paddy 3 21 0.0697 115 36 0.313 4 Paddy 3 19 0.0697 122 40 0.328 5 Paddy 3 17 0.0697 130 44 0.338
Paddy 4 21 0.0697 106 78 0.736 9 Paddy 4 19 0.0697 111 80 0.721 10 Paddy 4 17 0.0697 124 86 0.694 11 Silica gel 3 23 0.0778 134 31 0.231 12 Silica gel 3 21 0.0778 132 24 0.182 13 Silica gel 3 19 0.0778 148 27 0.182 16 Silica gel 4 23 0.0778 136 49 0.360 17 Silica gel 4 21 0.0778 138 53 0.384 18 Silica gel 4 19 0.0778 132 58 0.439
The numerically predicted and experimental age distributions, E(t), for silica gel particles
and paddy grain in three- and four-chamber cyclone dryers are compared in Figures 6.21
to 6.24. The model and experimental results differ significantly, with the model curves
showing significantly higher peak values occurring at earlier times. The tails of the model
and experimental curves both exhibit an exponential decay, but the decay rate is much
higher for the numerical predictions.
Solid particles clearly leave the cyclone chamber much faster than reality in the
numerical simulation. These deviations may be due to a number of factors, including:
(a) The experimental mean residence time is strongly dependent on particle feed rate, as
shown in Table 6.1. This fact was not taken into account in the Lagrangian particle
transport modeling, which used one-way coupling between the particle and gas phases.
The model also neglected interactions between particles and the influence of the particle
phase on the gas phase;
(b) Differences in the fluid phase velocity distribution will influence the particle

Chapter 6 Solid-Gas Behaviour and Particle Residence time Distribution of A Cyclone Dryer 151
residence time. As discussed in Chapter 5, although the simulated velocity distributions
represent the experimental results fairly well there are some significant deviations in the
outer region due to the diffusive nature of RNG k —8 turbulence model;
(c) Deviations from perfect elastic behaviour in particle-particle and particle-wall
collisions will affect particle trajectories and speed.
In summary, the simulated residence time distributions deviate significantly from the
experimental data. The predicted mean residence times are consistently too low.
However, the quantitative results are of the same order of magnitude and there is
qualitative agreement for the trends in residence time associated with changes in some
operating conditions.
6.5 CONCLUSIONS
The influence of cyclone dryer operating parameters and geometry on the particle
residence time of paddy grain and silica gel particles were investigated by means of
experimental and numerical simulation studies. In numerical simulation studies, it was
found that the mean residence time of paddy grain and silica gel particles increased with
the number of chambers. The experimental results indicated a variable influence of the
number of chambers on the mean residence time, but there was a noticeable tendency for
the relative deviation of the RTD, alt, to be reduced with a higher number of chambers.
In experimental studies, the parameter most influencing the mean residence time was the
particle feed rate; in numerical studies, the inlet air velocity was found to have the most
influence.
Numerical simulations without a turbulence dispersion model gave better predictions of
the cumulative age distribution for both paddy grain and silica gel particles. The apparent
lack of turbulent dispersion effect was explained by the relatively high value of Stokes
number for the solid particles in the model dryer.

0
0.04
0.035
Ag
e d
istr
ibu
tion
, E(t
), (
1/s)
0.03
0.025
0.02
0.05
0.045
—8— 4 chamber, Vin=19rrYs, Experiment
—0— 4 chanter, Vin=21rrYs, Experiment
—6— 4 chanter, Vin=23r4s, Experiment
- - 4 chanter, Vin=19rn,s, Numerical
- - - - 4 chanter, Vin=21rnis, Numerical
4 chamber, V in=23nYs, Numerical
0.015
0.01
-- 0.005
200
Chapter 6 Solid-Gas Behaviour and Particle Residence time Distribution of A Cyclone Dryer 152
0.06
0.03
o 3 charrber, Vin=19rnls, Experiment
—41— 3 chamber, Vin=21rWs , Experiment
—8— 3 chamber, Vin=23mfs, Experiment
- - - 3 chamber, Vin=19rnls. Numerical
3 chamber, Vin=21rnls, Numerical
3 chamber, Vin=23rris, Numerical
0.05
0.04
0.02
0.01
50
100 150 200
250
time (s)
Figure 6.21 Comparison of numerical and experimental age distributions, E(t), for silica
gel particles in a three-chamber cyclone dryer, showing influence of inlet air velocity.
time (s)
Figure 6.22 Comparison of numerical and experimental age distributions, E(t), for silica
gel particles in a four-chamber cyclone dryer, showing influence of inlet air velocity.

Chapter 6 Solid-Gas Behaviour and Particle Residence time Distribution of A Cyclone Dryer 153
0.05
C! 0.045 - ;
0.04 -
0.035 -
0.03
1 0.025 -
• 0.02 -
0.015 -I
3 chanter, Vin=21 Ms, Experiment
—0— 3 chanter, V in=19 Ms. Experiment
- 3 chanter, Vin=17 Ms, Experiment
3 chanter, Vin=21 rnfs, Numerical
- - -0- - 3 chanter, Vin=19 m/s, Numerical
- - -a. - - 3 chanter, Vin=17 Ms, Numerical
0
50
100
150
200
250
time (s)
Figure 6.23 Comparison of numerical and experimental age distributions, E(t), for paddy
grain in a three-chamber cyclone dryer, showing influence of inlet air velocity.
0.045
—G-4 chanter, Vin=21 Ms, Experiment 0.04
ca. 4 Vin=19 Ms, Experiment —O— chanter,
0.035
4 Vin=17 Ms, Experiment —6— chanter,
0.03 7: - ID 4 chanter. Vin=21 Ms, Numerical
0.025 - - -o- - - 4 chanter, Vin=19 Ms. Numerical
0.02 - - - -e- - - 4 chanter, Vin=17 Ms, Numerical
0.015
0.01
0.005 4tv •ap -
0
50 100
150
200
250
time (s)
Figure 6.24 Comparison of numerical and experimental age distributions, E(t), for paddy
grain in a four-chamber cyclone dryer, showing influence of inlet air velocity.

Chapter 6 Solid-Gas Behaviour and Particle Residence time Distribution of A Cyclone Dryer 154
The numerical simulations without turbulence dispersion gave reasonable qualitative
predictions of the observed behaviour but large quantitative discrepancies in the
residence time distributions and mean particle residence times. The Lagrangian-Eulerian
multiphase model used did not take into account the effect of interactions between
particles and the influence of the particle phase on the gas phase. This is believed to be
the main reason why the numerical simulation results were so different from the
experimental data. Further work is needed to examine and improve the usefulness of CFD
predictions for the cyclone dryer.
A more advanced numerical model using two-way particle-fluid coupling will be used in
the next chapter to investigate heat and mass transfer during the drying process inside the
model cyclone dryer.

Chapter 7 Experimental and Numerical Studies of Cyclone Dryer Performance 155
Chapter 7
EXPERIMENTAL AND NUMERICAL
STUDIES OF CYCLONE DRYER
PERFORMANCE
7.1 INTRODUCTION
In Thailand, most of the paddy harvested during the second season usually has a moisture
content higher than 25% of dry basis. It needs to be dried to an acceptable moisture level
for safe storage. The drying process needs good mixing and effective gas-solid contact to
provide efficient heat utilisation due to the irregular shape and large size of paddy grain.
Drying of large varieties of particulate materials in cyclone separators has been reported
during the last decade (Silva, 1992; Kemp., 1998; Benta, 1997; Correa, 2004a). Those
studies indicated that a cyclone is a very efficient heat exchanger between gas and solid
particles, and also plays an important role in pneumatic drying. A swirling flow is

Chapter 7 Experimental and Numerical Studies of Cyclone Dryer Performance 156
induced in this device, within which the particles experience centrifugal forces. High
relative velocities between particles and air are obtained, resulting in high heat and mass
transfer intensity. However, most drying tasks for hygroscopic materials require a long
residence time. Therefore, due to the short residence time of the particles, a cyclone
separator is only used as a dryer for heat sensitive materials or pre-drying (Benta, 1997).
Drying of solids in a swirling flow field was studied by Jinscue (1992) who reported
experimental results showing that helicoidal motion of the solid particles varied with their
weight and diameter. The heavier particles stayed at a lower level of the chamber while
drying advanced, until the particle weight reduced and they moved on to higher levels of
the chamber until evacuated by pneumatic transport. These effects were responsible for
the excellent results obtained with the swirling flow dryer, as the particle residence time
increased with particle weight. Consequently, the second stage of drying (falling rate
period) was obtained in this kind of dryer. Furthermore, a relatively uniform moisture
content of the final product was expected for drying material with different initial
moisture contents. This characteristic demonstrated the potential for obtaining diffusion
controlled drying of hygroscopic material such as paddy grain.
Since the 1980s, a type of swirling flow dryer known commercially as the "Cyclone
Dryer" has been industrially applied in drying powder (Hienze, 1984). Korn (2001) has
reported the drying of chemical substances with this device. A cyclone dryer consists of a
cylindrical tower containing a series of inverted conical baffles with central orifices,
which divide the tower into chambers. The moist particulate matter is fed into a stream of
hot, dry air, which enters the dryer tangentially at the base of the tower, creating a
rotating flow within the dryer. This rotating flow is considerably more complex than that
seen in cyclonic separators. A precessing central vortex forms within the open region at
the centre of the tower, while recirculation zones form within each of the chambers. The
central vortex and through flow jet transports the particles upwards from chamber to
chamber. Most of the drying occurs within the chambers where the particles spend time
trapped in the recirculating air flow. This system ensures adequate residence time and
excellent mixing between the hot dry gas and the moist particles, which enables rapid

Chapter 7 Experimental and Numerical Studies of Cyclone Dryer Performance 157
transfer of moisture from the particles to the gas. Very little performance data for this
device has been published in the open literature and the design of cyclone dryers has to
date relied predominantly on pilot plant testing. No previous reports of agricultural
material being dried drying by this technique have been located by the present study.
The major purpose of the present work is to investigate the working performance of a
cyclone dryer in paddy drying. Another purpose is to test the ability of a currently
available commercial CFD code to predict the performance of this kind of dryer. The
performance of the laboratory model dryer described in Chapter 4 was investigated
experimentally using paddy grain and silica gel particles as drying materials. While
paddy grain was the target material of this research it was difficult to get direct
comparisons of experimental and numerical results due to the irregularities in shape of
the paddy grain particles. The boundary conditions for wall impacts are particularly
complex for paddy grain. Therefore, additional experiments with spherical silica gel
particles were undertaken to provide closer agreement between the experimental and
numerical models, because the silica gel particles approximate the spherical shape
assumed in the CFX modeling. Details of the experimental conditions and the methods
for performance investigation will first be described. The influences of key drying
parameters such as inlet air temperature, particle feed rate, number of cyclone chambers,
and material tested will then be reported.
The performance of a cyclone dryer is directly related to the changes of temperature and
moisture content of air and solid particles during drying. These changes depend on both
the air-flow pattern and the particle trajectories inside the drying chambers. Using the
commercial CFD code CFX 5.7, the air-flow pattern as well as particle trajectories were
calculated. This commercial code was first used to predict the single-phase air-flow
pattern inside the cyclone dryer chambers as discussed in Chapter 5. The optimal single-
phase model was then used to predict the particle trajectories from a one-way coupling
procedure as detailed in Chapter 6. In the present chapter, the model will be further
applied to predict the changes in temperature and humidity of both air and solid particles
during drying by including the exchanges of mass, energy, and momentum in a two-way

Chapter 7 Experimental and Numerical Studies of Cyclone Dryer Performance 158
coupling model. The mathematical details of this approach are given in Section 7.3.1.
The mathematical model is used to investigate the effects of changes in various operating
parameters such as the inlet air conditions, the particle feed rate and the number of
chambers in the dryer. Finally, the results of numerical simulation are compared with
experimental results.
In conclusion, the numerical and experimental results will be applied to estimate the
performance of commercial scale cyclone dryers and make comparisons with the
performance of other types of commercial paddy drying equipment.
7.2 EXPERIMENTAL STUDIES
7.2.1 Experimental Apparatus and Instrumentation
A schematic diagram of the cyclone dryer is shown in Figure 4.5. As described
previously, it consisted of a centrifugal blower, an electrical heater, solid material hopper,
rotary feeder, drying chambers, and separation chamber. The configuration was changed
from three to four chambers by adding extra chamber. The hopper was used to hold solid
material for the rotary feeder supply. The feed rates of material were controlled by a
sliding plate installed between hopper and rotary feeder. The centrifugal blower was used
to supply ambient air to an electrical heater. The heated air from electrical heater was
used to both convey and dry the solid material.
The temperatures of drying air and paddy were measured by k-type thermocouples with
an accuracy of ±1 °C. Thermocouples were positioned at the heater outlet and inlet, and
outlet of the drying chamber to measure changes of air temperature during drying. One
additional thermocouple was embedded at the cyclone outlet to measure the temperature
of dried material in the separation chamber. Inlet and outlet air humidity were monitored
by humidity probes (Testo 635 at inlet with an accuracy of ±2% RH, and Electronik
EE29 at outlet with an accuracy of ±1% RI-I). These were calibrated periodically with

Chapter 7 Experimental and Numerical Studies of Cyclone Dryer Performance 159
wet/dry bulb thermometers in a wind tunnel. Air-flow rate was measured by observing
the pressure drop across the inlet nozzle with a Furness FC012-micromanometer
accurate to ±1%.
All measuring sensors were connected to a National Instruments data acquisition board
(NI-4351) to record the data via LabView program on a personal computer. The data
were recorded in text file format for further processing. The electrical power
consumption of the heater was measured by a clamp-on current meter (Lutron DM 1000)
with an accuracy of ± 1.2 %. Drying material moisture content was determined by oven
drying, and weighing of samples in an electronic balance with an accuracy of 0.0001 g.
(as previously discussed in Chapter 6).
7.2.2 Experimental Procedure
The gas flow was set at a steady state value, usually by setting up fan motor converter
frequencies of 42.5, 44.5 and 46.5 Hz. The current to the heater was then adjusted. The
testing materials were then introduced into the gas stream by opening the sliding plate
under the rotary feeder to predetermined levels from the calibration given in Chapter 6.
Once a steady state had been established, the air-flow rate was measured with a pressure
tap at the bellmouth nozzle. The signals from all sensors connected to the NI 4351 data
acquisition board were recorded at one-minute intervals for five minutes. The testing
material at the inlet hopper and separation chamber outlet were sampled at the same time
and subsequently dried in a hot air oven for moisture content determination. The
experimental results at three levels of particle feed rate, fan motor converter frequency,
and inlet air temperature for paddy and silica gel were then collected.
The data obtained enabled the calculation of heat and mass transfer rates as shown in
subsequent sections. However, for calculation of heat and mass transfer coefficients, an
average residence time of particles in the cyclone dryer was also required. Due to the
difficulties of obtaining the residence time distributions during drying tests, the particle

Chapter 7 Experimental and Numerical Studies of Cyclone Dryer Performance 160
residence time was estimated using correlations obtained from experiments described in
Chapter 6. The residence times are principally a function of mass concentration.
7.2.3 Experimental Heat and Mass Transfer
The macroscopic heat transfer was calculated by measuring •the gas and solid
temperatures at both inlet and outlet of the cyclone dryer using method outlined by Silva
et al. (1991). For solid particles of diameter d p and density p p with total contact area as
between gas and solid particles in the cyclone dryer, the integral energy balance is
expressed as
= m f (c f + c,,W,) • AT f = ha p (AT)m (7.1)
where 0 is the heat transfer rate; m f and m are the mass flow rates of air and particles;
ATf is the air temperature differential between inlet and outlet of the cyclone dryer given
by (Tr, — ; c f and c y are the specific heats of air and water vapour given by Eqs.
(3.50) and (3.53); and h is the heat transfer coefficient between gas and solid particles.
(AT)m is the log-mean temperature differential, given by
, (Tr — T )— (Tf — T ) (AT),n pi 0 p.
Tfi —
In Tf. Tpo
where Tfi and Tfi, are the air temperatures at inlet and outlet; T p, and Tpo are the particle
temperatures at inlet and outlet. Assuming that the particles are spherical in shape, the
contact area a can be expressed as (Silva et al., 1991)
TT1 T• 6m • T 7Ed 2 = P a =
7E 3 pd p —6 pPdP
(7.3)
(7.2)

Chapter 7 Experimental and Numerical Studies of Cyclone Dryer Performance 161
where T is the average residence time of particles in the dryer. By substitution of Eq. (7.3)
into Eq. (7.1), the heat transfer coefficient is formulated as
h = —1 p d (c f +c v W,) ,ATf\mf (7.4) 6 P P TOT)m M p
The moisture mass transfer rate between gas and solid can be expressed as
Qm = mf (Wo — ) = mp (MI Mo )= Kmap (AW)m (7.5)
where M, and M. are the moisture contents of particles at inlet and outlet, W, and
W. are the air humidities at inlet and outlet of the cyclone dryer, and K m is the mean
mass transfer coefficient. The log-mean humidity differential between the saturated
particle surface and air, (AW)m , is defined by
(AW). = (Wsat Wi )— (Wsat Wo )
in Wsa' W ' Wsat Wo
where Ws., is the humidity of air in the saturated state. By substituting Eq. (7.3) into Eq.
(7.5), the mass transfer coefficient can be expressed as
1 M, — M o = —p p d p (7.7)
6 T(AW).
The dimensionless forms of heat and mass transfer coefficients are defined as
hd Nu =
xP Nusselt number (7.8)
K d and Sh = m P Sherwood number (7.9)
Pf Dv-a
where is the thermal conductivity of air given by Eq. (3.51) and D v _ a is the diffusivity
of water in air calculated using the correlation given by Pakowski (1991). The heat and
mass transfer coefficients can be calculated from the foregoing relations if the inlet and
outlet temperatures and moisture contents of gas and solid particles in cyclone dryer are
measured. The moisture reduction in the solid particles ( MR ) is calculated from
MR = M, —M. (7.10)
(7.6)

Chapter 7 Experimental and Numerical Studies of Cyclone Dryer Performance 162
The following section is devoted to detailed discussion of the experimental results. The
moisture reduction will be evaluated and the dimensionless heat and mass transfer for
three- and four-chamber cyclone dryer operation will be discussed.
7.2.4 Results and Discussion
Tables E.1 to E.4 of Appendix E show the experimental results for paddy and silica gel
drying using three- and four-chamber cyclone dryer configurations. The results were
obtained for different particle feed rates and inlet air temperatures. Three different
particle feed rates were employed for each set of tests. The feed rates were 0.0289,
0.0411 and 0.0611 kg of dry paddy grain per second, and 0.0256, 0.0433 and 0.0585 kg
of dry silica gel particles per second. The feed rate was adjusted using the sliding
mechanism described in Chapter 6. The inlet air temperature was varied between 57 to
90°C. The initial moisture content was varied between 20.7 to 42.9 % of dry basis for
paddy grain and 17.3 to 26.4 % of dry basis for silica gel particles. The moisture
reduction, heat and mass transfer, and specific energy consumption figures deduced from
the experimental observations will now be discussed.
7.2.4.1 Moisture reduction
Figures 7.1 (a) and (b) show the variation of moisture reduction (MR) of paddy grain
with inlet air temperature for different feed rates in three- and four-chamber cyclone
dryer configurations, respectively. MR Increases with inlet air temperature increase in all
cases. A lower feed rate of material enables longer mean residence time of particles as
discussed in Chapter 6, and hence more heat and mass exchange between the particles
and air is obtained. Therefore, the MR generally decreases as the particle feed rate is
increased at constant inlet air temperature. However, at medium and high feed rates with
three-chamber operation, the moisture reduction does not differ significantly. Similar
trends are observed for the silica gel particle drying results shown in Figures 7.2 (a) and
(b).

Chapter 7 Experimental and Numerical Studies of Cyclone Dryer Performance 163
A comparison of drying performance for three- and four-chamber operation is shown in
Figures 7.3 (a), (b) and (c). MR increases with inlet air temperature, as discussed
previously, but only a small, variable effect of the number of cyclone chambers on
the MR is indicated. The experimental data are scattered around the same range. In
Chapter 6, the mean particle residence time was found to be variably influenced by
changing from three- to four-chamber operation. The drying results presented here are
consistent with those observations.
For approximately identical feed rates, the moisture reduction for silica gel particles
exceeded that for paddy grain over the whole range of inlet air temperature. As indicated
in Chapter 4, the heavier silica gel particles (larger diameter and higher density) spent
more time in the cyclone dryer due to the dispersion and re-entrainment effects. The
lighter paddy grain particles follow the air stream more closely, resulting in a lower
residence time. The paddy grain and silica gel particles had almost the same mean
particle diameter (3.25 mm for silica gel, 3.5 mm for paddy) but the higher density of
silica gel particles results in longer residence times. This would give greater moisture
reduction in the initial drying stage; but internal diffusivity would become an additional
factor in the second (falling rate) drying stage.
7.2.4.2 Heat transfer
Figures 7.4 (a) and (b) summarise the experimental heat transfer data obtained at three
levels of paddy feed rate for three- and four-chamber cyclone dryer operation,
respectively. The dimensionless heat transfer (Nusselt number, Nu) is plotted against
inlet air temperature (T fi). The results indicate consistent tendencies for Nu to decrease
with increasing inlet air temperature. The same trends are observed for the silica gel
drying results presented in Figures 7.5 (a) and (b). Nu decreases consistently with
increases in particle feed rate for three-chamber operation. However, there is no clear
trend for the influence of feed rate on Nu for four-chamber operation.

Moi
stur
e re
duct
ion,
% d
ry-b
asis
Moi
stur
e re
duct
ion,
% d
ry-b
asis
Chapter 7 Experimental and Numerical Studies of Cyclone Dryer Performance 164
7 0
Paddy feed rate 6
— 00.0298 kg/s
5 — — - A 0.0411 kg/s
- - - - 0.0611 kg/s 0 4
A
3
• • *A A 2 A
1 3-chanters operation
50 55 60 65 70 75 80 85 90 95
Inlet air temperature, T, °C
5
4
Paddy feed rate
(a)
—0 0.0298 kg/s A
--0.0411 kg/s A A
3 - - - - .x 0.0611 kg/s
A A
2 -
A 1 -
4-chambers operation
0 50 55 60 65 70 75 80 85 90 95
Inlet air temperature, Tfi , °C
(b)
Figure 7.1 Variation of percentage of moisture reduction ( MR ) with inlet air temperature
(Tfi) at different paddy feed rates: (a) three-chamber cyclone dryer; (b) four-chamber
cyclone dryer.

3-chambers operation
(a)
0
— 0 0.0256 kg/s
-- A 0.0433 kg/s
- - - 0.0585 kg/s
0
0
0 0 -
▪ """ • _ .•••• x
▪ -"" A 0 s.„
- -
4-chambers operation
Silica gel feed rate
Moi
stur
e re
duc t
ion,
% d
ry
10 -
9
8
7
6
5
4
3
2
1
Chapter 7 Experimental and Numerical Studies of Cyclone Dryer Performance 165
9 Silica gel feed rate
8 - 0 0.0256 kg/s
7 — — - 0.0433 kg/s 0
6 - - - - x 0.0585 kg/s
Moi
stur
e re
duct
ion,
% d
ry-b
asis
5
0 4 -
3
2
1
0
"
x A
50 55 60 65 70 75 80 85 90 95 ' Inlet air temperature, Tfl
50 55 60 65 70 75 80 85 90 95 Inlet air temperature, Tfi , °C
(b)
Figure 7.2 Variation of percentage of moisture reduction ( MR ) with inlet air temperature
(Tfi) at different silica gel feed rates: (a) three-chamber cyclone dryer; (b) four-chamber
cyclone dryer.

Mo
istu
re r
educ
tion,
°A)
dry
-bas
is
10
9
8
7
6
5
4
3
2
1
(a)
- — 0 3-chanter, 0.0411 kg/s, Paddy
- -- A 4-chanter, 0.0411 kg/s, Paddy
— x 3-chanter, 0.0433 kg/s, Silica gel
— o 4-chanter, 0.0433 kg/s, Silica gel
7
a
A X
A ■■
•■■
0
A Medium feed rate
5
4
3
2
1
Mo
istu
re r
educt
ion,
% d
ry-b
asis
Chapter 7 Experimental and Numerical Studies of Cyclone Dryer Performance 166
—— —0 3-chanter, 0.0298 kg/s, Paddy
—--A 4-chanter, 0.0298 kg/s, Paddy
— x 3-chanter, 0.0256 kg/s, Silica gel
— o 4-chanter, 0.0256 kg/s, Silica gel
A
Low feed rate
50 55 60 65 70 75 80 85 90 95 Inlet air temperature, T , °C
50 55 60 65 70 75 80 85 90 95 Inlet air temperature, Tfi , °C
(b)

Moi
stur
e re
duct
ion,
% d
ry-b
asis
6
5
4
3
2
1
0
- --o 3-chamber, 0.0611 kg/s, Paddy
— A 4-chamber, 0.0611 kg/s, Paddy
— X 3-chamber, 0.0585 kg/s, Silica gel
- o 4-chanter, 0.0585 kg/s, Silica gel x
c,
Q— —
0
X
X * A
OA
•••••• A 0111•110 •••■■•
""" ••■•■■•■• ••••■■
A
A
A High feed rate
ci
Chapter 7 Experimental and Numerical Studies of Cyclone Dryer Performance 167
50 55 60 65 70 75 80 85 90 95
Inlet air temperature, Tfi , °C
(c)
Figure 7.3 Comparison of moisture reduction ( MR ) for three- and four-chamber cyclone
dryers at different feed rates: (a) low feed rate; (b) medium feed rate; (c) high feed rate.
The effects of particle feed rate on flow patterns in cyclone separators were studied by
Yuu et al. (1978). The tangential velocity decreased noticeably when the particle feed
rate increased, compared with single-phase air measurements. The turbulence intensity
was lower for higher particle feed rates, thus giving lower gas-particle relative velocity
and degree of mixing. Another reason for decreasing Nu with increasing feed rate is the
greater heat transfer area (a p). As seen from Eq. (7.4) the Nusselt number will decrease
with increasing particle feed rate, provided that the temperature differential remains
constant.
A comparison of heat transfer data for both paddy grain and silica gel particle drying is
shown in Figure 7.6. This figure again shows the consistent trend for Nu to decrease
with increasing inlet air temperature for both three- and four-chamber cyclone dryer
operation. However, at the medium and high feed rates there is almost no effect of the
number of cyclone dryer chambers on the Nusselt number.

Chapter 7 Experimental and Numerical Studies of Cyclone Dryer Performance 168
Nuss
elt
num
ber,
Nu
0.3 -
0.25
0.2
0.15
0.1
0.05
A 11... ......
.... .....
.... a A .....
.... A ....
" • X
Paddy Feed rate
—o 0.0298 kg/s
A 0.0411 kg/s
- - - X 0.0611 kg/s
0
3-chambers operation
50 55 60 65 70 75 80 85 90 95
Inlet air temperature, Tfi
(a)
0.3 - Paddy Feed rate
— 0 0.0298 kg/s
— — A 0.0411 kg/s
'X 0.0611 kg/s
Nuss
elt
num
ber,
Nu
0.25 -
A
0.2 -
XA v. 4., A
0.15 A
01-
0.05 - 4-chanters operation
50 55 60 65 70 75 80 85 90 95
Inlet air temperature, Tfi , °C
(b)
Figure 7.4 Variation of dimensionless heat transfer coefficient (Nu) with inlet air ..
temperature for different paddy feed rates; (a) three-chamber cyclone dryer; (b) four-
chamber cyclone dryer.

0.6 -
0.55 -
Silica gel Feed rate
— 0 0.0256 kg/s
0.5- 0 — — - A 0.0433 kg/s
0.45 - - X 0.0585 kg/s
0.4 -
0.35 - A 0
0.3 - A
0.25 -
0.2 -
0.15 - " 4 - st
• X A 0.1 -
3-chambers operatbn 0.05
0
50 55 60 65 70 75 80 85 90 95
Inlet air temperature, Tr, , °C
(a)
0.4 Silica gel Feed rate
0.35 — o 0.0256 kg/s
— _ A 0.0433 kg/s
0.3 _ x 0.0585 kg/s
0.25 4
0.2 x ' . . A Op . .
i - ", .... A
0.15
X • - - . _X
0.1
0.05 4-chambers operation
0
Nuss
elt
num
ber,
Nu
2 1
Chapter 7 Experimental and Numerical Studies of Cyclone Dryer Performance 169
50 55 60 65 70 75 80 85 90 95
Inlet air terrperature, T, °C
(b)
Figure 7.5 Variation of dimensionless heat transfer coefficient (Nu) with inlet air
temperature for different silica gel feed rates: (a) three-chamber cyclone dryer; (b) four-
chamber cyclone dryer.

Nuss
elt
num
ber,
Nu
0.6 -
0.5 -
0.4 -
0.3 -
0.2 -
0.1 -
Chapter 7 Experimental and Numerical Studies of Cyclone Dryer Performance 170
Nuss
elt
num
ber,
Nu
X
— — — 0 3-chanter, 0.0298 kg/s, Paddy
—— — a 4-chanter, 0.0298 kg/s, Paddy
— X 3-chamber, 0.0256 kg/s, Silica gel
- 4-chanter, 0.0256 kg/s, Silica gel
o 0
■46■!' A — A _ a
A
Low feed rate
0
0.4
0.3
0.2
0.1 -
0
50 55
4,
60
X
0 4.,
65 70 75 80 85 90
Inlet air temperature, Tfi , °C
(a)
— — - 0 3-chanter, 0.0411 kg/s, Paddy
— — - A 4-chanter, 0.0411 kg/s, Paddy
X 3-chanter, 0.0433 kg/s, Silica — gel
95
0 4-chanter, 0.0433 kg/s, Silica gel
A X
""•7:4".. it 13 ■••••
0 ■A.1. )KA r A
Medium feed rate
50 55 60 65 70 75 80 85 90 95
Inlet air temperature, Tfi , °C
(b)

Aro
Chapter 7 Experimental and Numerical Studies of Cyclone Dryer Performance 171
0.3
0 -- o 3-chanter, 0.0611 kg/s, Paddy
ci — — A 4-chanter, 0.0611 kg/s, Paddy
x 3-chanter, 0.0585 kg/s, Silica gel
o 4-chanter, 0.0585 kg/s, Silica gel
A•••■ ,
* .... ..... .... -.... 0 ..... -- ..--..A.._ "Zt- -...
0 "-,0 •-... ....."•-• .... .4,
0 A
High feed rate
50 55 60 65 70 75 80 85 90 95
Inlet air temperature, Tr,, °C
(c)
Figure 7.6 Comparison of dimensionless heat transfer coefficient ( Nu) validation with inlet
air temperature for three- and four-chamber cyclone dryer operation at different feed rates:
(a) low feed rate; (b) medium feed rate; (c) high feed rate.
Nu values are scattered around the same range for these feed rates for both paddy grain
and silica gel particle experiments. This may possibly be due to the suppression of
turbulence at high particle feed rates as discussed above. Figure 7.6 also shows that at
approximately identical feed rates, the values of Nu for silica gel particles were higher
than for paddy grain over the whole temperature range tested.
7.2.4.3 Mass transfer
The variation of dimensionless mass transfer coefficient (Sherwood number, Sh ) for
paddy grain and silica gel particle drying is shown in Figures 7.7 and 7.8, respectively.
These figures show the expected trend for mass transfer to increase with inlet air
temperature at constant particle feed rate.
Nuss
elt nu
mbe
r, N
u 0.2
0.1 A

(a)
00' A .0'
A ••••
.. m.• - '
- - 0 X 0 - 0 A
X 4-chanter operation
o
Paddy feed rate
— 0 0.0298 kg/s
--.
A 0.0411 kg/s
- - - - x 0.0611 kg/s
0 A 0
0••• 0.0
0.012
0.01
.c U)
if; 0.008 -
1 c 0.006 -
-I a) 0.004 - .c (/)
0.002 -
A
4 ••••
0
-
-
Chapter 7 Experimental and Numerical Studies of Cyclone Dryer Performance 172
Paddy feed rate
0 0.0298 kg/s
— — — A 0.0411 kg/s 0
x0.0611 kg/s 0
o °
-... •-■4(4*-'' —.- 0
il
x X X ..A.. - . 0•'-' ..... "-.
X
3-chamber operation
50 55 60 65 70 75 80 85 90 95
Inlet air temperature, T °C
50 55 60 65 70 75 80 85 90 95
Inlet air temperature, Tfi , °C
(b)
Figure 7.7 Variation of dimensionless mass transfer coefficient (Sh) with inlet air
temperature for different paddy feed rates: (a) three-chamber cyclone dryer; (b) four-
chamber cyclone dryer.
0.016
0.014
0.012
0.01
0.008
0.006
0.004
0.002
o

Silica gel feed rate
4-chanter operation
0
A
0
0.016 -
0.014 -
0.012 -
0.01
0.008 -
0.006 -
0.004 -
0.002 -
— 0 0.0256 kg/s
— — - A 0.0433 kg/s
- - - - * 0.0585 kg/s
A
X
Chapter 7 Experimental and Numerical Studies of Cyclone Dryer Performance 173
0.016
Silica gel feed rate 0.014
— G 0.0256 kg/s 0
0.012 — A 0.0433 kg/s
0.01 - - - - 3: 0.0585 kg/s
0 0.008 A A to• .... 3: A
* •■• _ . * ' -
0.006 0 ' ; :
.1.0 . ....:
* * ...X. ■ . "' '42'
.....- A
0.004
0.002
0 50 55 60 65 70 75 80 85 90 95
Inlet air temperature, T, °C
(a)
"
AA *
3-chanter operation
50 55 60 65 70 75 80 85 90 95 Inlet air temperature, T, °C
(b)
Figure 7.8 Variation of dimensionless mass transfer coefficient (Sh) with inlet air
temperature for different silica gel feed rates: (a) three-chamber cyclone dryer; (b) four-
chamber cyclone dryer.

0.012
0.01
She
rwoo
d nu
mbe
r, S
h 0.008
0.006
0.004
0.002 -
Chapter 7 Experimental and Numerical Studies of Cyclone Dryer Performance 174
0.016 --- 0 3-chanter, 0.0298 kg/s, Paddy
— - A 4-chanter, 0.0298 kg/s, Paddy 0.014
— x 3-chanter, 0.0256 kg/s, Silica gel
0.012 — o 4-chanter, 0.0256 kg/s, Silica gel
0.01
0.008 .••••• a...
ow/.
...... A 0
...- *
0.006 • A
A .... — O 0 0 A ..... ..-..- — O A A ..-• -.-.
0.004 ...-- A ■•••• •■■• ..—
A a 0.002
Low feed rate
0 50 55 60 65 70 75 80 85 90 95
Inlet air temperature, -1-, , °C
(a)
- - o 3-chanter, 0.0411 kg/s, Paddy
— — A 4-chanter, 0.0411 kg/s, Paddy A
— X 3-chanter, 0.0433 kg/s, Silica gel
— 0 4-chanter, 0.0433 kg/s, Silica gel
X X 0
o ..***
• 40-•
x x er" A
0
Medium feed rate
0
50 55 60 65 70 75 80 85 90 95
Inlet air terrperature,T, , °C
(b)

Chapter 7 Experimental and Numerical Studies of Cyclone Dryer Performance 175
0.016 — — - 3-chamber, 0.0611 kg/s, Paddy
— — - A 4-chanter, 0.0611 kg/s, Paddy 0.014 -
3-chamber, 0.0585 kg/s, Silica —x gel
0.012 - 4-chamber, 0.0585 kg/s, Silica — o gel
0.01
0
0.008
0
0.006 *X 0 0
0.004 0 .60
A A a
0.002 High feed rate
0
50 55 60 65 70 75 80 85 90 95
Inlet air temperature, Tr, , °C
(c)
Figure 7.9 Comparison of dimensionless mass transfer coefficients ( Sh ) for paddy grain
and silica gel particle drying: (a) low feed rate; (b) medium feed rate; (c) high feed rate.
Increasing the particle feed rate decreases Sh at constant inlet air temperature. As shown
in Figure 7.9, the values of Sh for silica gel particle drying are higher than for paddy
grain over the entire range of particle feed rates. As with the heat transfer coefficient, the
number of cyclone dryer chambers appears to have a rather variable influence on the
mass transfer coefficient.
7.2.4.4 Specific energy consumption
The effects of inlet air temperature and particle feed rate on specific energy consumption
for paddy grain and silica gel particle drying are shown in Figures 7.10 and 7.11,
respectively. The specific energy consumption (SPEC) is defined as the total electrical
energy consumption in the dryer system divided by amount of water evaporated. Values
of SPEC are given in MJ/kg water evaporated.
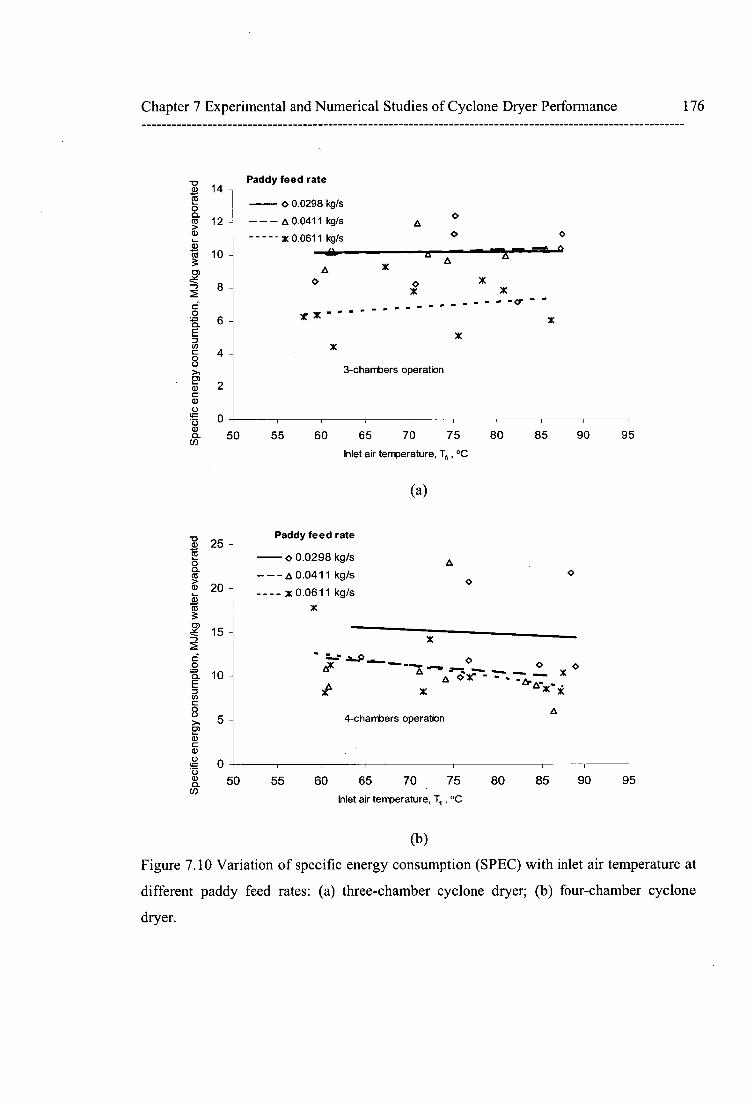
Spec
ific
ene
rgy
cons
um
ptio
n, M
J/kg
wat
er e
vap
ora
ted
Spec
ific
ener
gy c
onsu
mpt
ion,
MJ/
kg w
ater
eva
por
ated
Chapter 7 Experimental and Numerical Studies of Cyclone Dryer Performance 176
14
12
Paddy feed
— 0
rate
0.0298 kg/s
0.0411 kg/s
0.0611 kg/s
A
■A
— — — A
X
10 LI A
A
8
6 * X -
............. ...
4 3-chanters operation
2
0 I
50 55 60 65 70 75 80 85 90 95
Inlet air temperature, Tr,, °C
(a)
Paddy feed rate 25 -
0.0298 kg/s — o A
— — - A 0.0411 kg/s 20 - -- - - *0.0611 kg/s
15 -
10 - - -•••- A0 r
*$1
0
A" * • * A
5 - 4-chanters operation
0 50 55 60 65 70 75 80 85 90 95
Inlet air temperature, Tf, , °C
(b)
Figure 7.10 Variation of specific energy consumption (SPEC) with inlet air temperature at
different paddy feed rates: (a) three-chamber cyclone dryer; (b) four-chamber cyclone
dryer.

Ofts
---- -
- - -x --
3-chambers operation
Chapter 7 Experimental and Numerical Studies of Cyclone Dryer Performance 177
Silica gel feed rate
4 — o 0.0256 kg/s
Lr••••
A
— — - A 0.0433 kg/s
0 A x 0.0585 kg/s
50 55 60 65 70 75 80 85 90 95
Inlet air terrperature, T fi , °C
Spec
ific
ener
gy c
onsu
mpt
ion,
MJ/
kg w
ater
eva
pora
ted
(a)
0
0
ox
-
X Silica gel feed rate
— 0 0.0256 kg/s
— 0.0433 kg/s
*0.0585 kg/s
0 50 55 60 65 70 75 80 85 90 95
Inlet air temperature, Tn , °C
(b)
Figure 7.11 Variation of specific energy consumption (SPEC) with inlet air temperature at
different silica gel feed rates: (a) three-chamber cyclone dryer; (b) four-chamber cyclone
dryer.
Spec
ific
ener
gy c
onsu
mpt
ion,
MJ/
kg w
ater
eva
pora
ted
0
0 4
X
4-chambers operation

Spec
ific
ener
gy c
onsu
mp
tion,
MJ/
kg w
ate
r eva
po
rate
d 25
20
15
10
5
0
Chapter 7 Experimental and Numerical Studies of Cyclone Dryer Performance 178
0 A DO
Do
0
Low feed rate
50 55 60 65 70 75 80 85 90 95 Inlet air temperature, T, °C
— — — o 3-chanter, 0.0298 kg/s, Paddy
— — — 4-chanter, 0.0298 kg/s, Paddy
A
— x 3-chanter, 0.0256 kg/s, Silica gel
- o 4-chanter, 0.0256 kg/s, Silica gel
25 -
20
15
10 -
5 -
- 03-chanter, 0.0411 kg/s, Paddy
— - 4-chanter, 0.0411 kg/s, Paddy
— x 3-chanter, 0.0433 kg/s, Silica gel
— o 4-chanter, 0.0433 kg/s, Silica gel
O 0 0
Medium feed rate
0
Spec
ific
ene
rgy
cons
um
ptio
n, M
J/kg
wa
ter e
vap
ora
ted
50 55 60 65 70 75 80 85 90 95 Inlet air temperature, Tf., , °C
(b)

Chapter 7 Experimental and Numerical Studies of Cyclone Dryer Performance 179
— — — - o 3-chamber, 0.0611 kg/s, Paddy -o 0 20 12 ---- A 4-charrber, 0.0611 kg/s, Paddy o a 18 A 0 X 3-chanter, 0.0585 kg/s, Silica gel > Li) 16 o 4-chanter, 0.0585 kg/s, Silica gel a) co 3 14 A
o) 12 ...... ..... ---.
■ A ...... -... -....
A 0 1 0 A '""'" --.... ....... = 0
t 8 o A 0 A <> 0 D X ... Cf1 Vo...........A....i=64..... ..7L..........1„...6.......1 § 6 0 >, o o x 2) 4 - o a) C a) 2 - High feed rate 0
4= .0 a) 0 a (0 50 55 60 65 70 75 80 85 90 95
Inlet air temperature, Ti., , °C
(c)
Figure 7.12 Comparison of specific energy consumption (SPEC) for paddy grain and silica
gel particle drying: (a) low feed rate; (b) medium feed rate; (c) high feed rate.
Figure 7.10 indicates the SPEC for paddy grain drying to be essentially invariant with air
temperature, but to decrease with increasing particle feed rate. There is a relatively large
scatter in the SPEC results, especially for four-chamber operation. The SPEC for paddy
grain drying is higher than for silica gel particles for all inlet temperatures with
approximately identical particle feed rates, as shown in Figure 7.12.
For silica gel particle drying, the SPEC tends to decrease when inlet air temperature is
increased at all feed rates, as shown in Figure 7.11. This is because the increased drying
rate at higher air temperatures causes the energy consumed per unit of evaporated water
to decrease.
Effects of initial moisture content of the drying material on SPEC are shown in Figure
7.13. This figure confirms the result that there were no conclusive effects of either
particle feed rate or number of cyclone dryer chambers on the SPEC. SPEC tends to
increase when the initial moisture content decreases for both silica gel and paddy drying

Chapter 7 Experimental and Numerical Studies of Cyclone Dryer Performance 180
operations. Figure 7.13 indicates the SPEC for paddy drying to be consistently higher
than for silica gel at a given initial particle moisture content over the whole range tested.
30
15 25 a)
- - - - 0 Paddy Silicagel
• 15
T0■ o 4...,,
a ■ A ° al a. • , N.. dk
75o ob.
■ o 0 It.
° ■
• 5
0.1 0.2 0.3 0.4
0.5
0.6
Initial moisturecontent of material ( kg water /kg dry material)
Figure 7.13 Influence of initial moisture content of particles on the SPEC.
7.2.4.5 Summary of experimental results for single pass drying and
comparison with other paddy dryers
The present experimental results show that the moisture reduction increases with inlet air
temperature at the same particle feed rate; and at the same inlet air temperature, the
moisture reduction decreases when particle feed rate is increased. There is no clear trend
for the influence of the number of cyclone chambers on moisture reduction. Higher
moisture reductions are observed for silica gel particles due to their higher density, which
results in higher particle residence times.
The dimensionless heat transfer coefficient (Nu) decreases when inlet air temperature
and particle feed rate is increased. The presence of solids reduces the heat transfer
between gas and solid due to depression of turbulence intensity and solid mixing inside

Chapter 7 Experimental and Numerical Studies of Cyclone Dryer Performance 181
cyclone dryer. Values of Nu for three- and four-chamber cyclone dryers are almost the
same in all cases.
The specific energy consumption decreases at higher inlet air temperatures for silica gel
particle drying, but is not significantly affected by inlet air temperature for paddy grain
drying. Higher inlet air temperatures give lower specific energy consumption. No
definitive conclusions on specific energy consumption can be drawn concerning the
effect of particle feed rate and the number of cyclone chambers.
Drying of paddy grain in these tests was conducted with three- and four-chamber cyclone
dryer configurations with inlet air temperatures of 60-90 °C and paddy feed rates of
0.0298-0.0611 kg/s. The percentage of moisture reduction increases when the inlet air
temperature is increased or the paddy feed rate is decreased. The maximum moisture
reduction achieved was 2.6-6.5% dry-basis at inlet air temperatures of 82-89 °C and a
paddy feed rate of 0.0298 kg/s. The specific energy consumption did not seem to differ
with inlet air temperature or particle feed rate, but increased with the initial moisture
content of the paddy grain as previously discussed.
Table 7.1 compares the working performance of the model cyclone dryer and other paddy
dryers at approximately the same initial moisture content of paddy. This comparison
shows that the moisture reduction of the model cyclone dryer is less than that of a
commercial fluidised bed dryer. The specific energy consumption of the model cyclone
dryer is also higher than industrial fluidised bed paddy dryers. Similar comparisons are
obtained with commercial spouted bed dryers. The model cyclone dryer has a lower
moisture reduction and higher specific energy consumption at about the same initial
moisture content of paddy. The lower specific energy consumption for commercial
fluidised bed and spouted bed paddy dryers is due to their larger scale, and their use of
50-70% of air recycling and higher inlet air temperatures. The model cyclone dryer has
approximately the same moisture reduction and specific energy consumption as a
commercial cross-flow dryer without air recycling at about the same inlet air temperature.

Chapter 7 Experimental and Numerical Studies of Cyclone Dryer Performance 182
The experimental results indicate that single-pass drying of paddy in the model cyclone
dryer did not achieve the target moisture reduction from 33% of dry-basis to 22% of dry-
basis. This raises the question of how to achieve results of practical use with the multi-
chamber cyclone dryer that are sufficiently energy efficient. The inlet air temperature can
be further raised to increase the moisture reduction of paddy, but the experimental data
indicate that this will have no effect on SPEC. In any case, the allowable inlet air
temperature is severely limited by problems of adversely affecting grain quality.
Increasing the number of cyclone chambers does not significantly increase the particle
residence time, and only slightly increases the moisture reduction on a single pass drying.
Table 7.1 Comparison of working performance of the model cyclone dryer and
commercial paddy dryers
No. Dryer Type Capacity Ton/h
Tai °C
Mi % db.
M. °A db.
SPEC MJ/kg
Air Recycle (/o)
Reference
1 Fluidised bed dryer 1.00 60.0 27.0 23.2 4.24 66 Cyclone dryer 0.20 59.3 26.6 24.5 17.75 0 Table E.2, test 22
2 Fluidised bed dryer 1.00 106.0 45.3 24.2 1.43 66 Cyclone dryer 0.10 8.3 42.2 35.6 7.14 0 Table E.2, test 9
3 Fluidised bed dryer 9.50 120.0 28.7 22.5 2.83 69 Cyclone dryer 0.15 71.2 29.6 27 10.52 0 Table E.2, test 11
4 Fluidised bed dryer 9.50 116.0 26.0 22.5 3.56 69 Cyclone dryer 0.20 76.8 26.0 24.5 9.80 0 Table E.2, test 20
5 Fluidised bed dryer 9.50 115.0 22.0 20.1 8.63 69 Cyclone dryer 0.10 76.7 21.0 19.1 20.64 0 Table E.2, test 8
6 Fluidised bed dryer 9.50 130.0 30.6 23 2.33 69 Cyclone dryer 0.15 60.5 30.5 28.6 10.81 0 Table E.2, test 10
7 Fluidised bed dryer 4.80 150.0 27.0 21 4.05 53 Cyclone dryer 0.10 88.9 26.5 22.8 11.06 0 Table E.2, test 6
8 Spouted bed dryer 3.20 154.0 29.4 25 3.96 60-70 Cyclone dryer 0.15 83.3 32.3 28.9 9.43 0 Table E.2, test 12
9 Spouted bed dryer 3.55 160.0 22.8 19 3.55 60-70 Cyclone dryer 0.10 76.7 21.0 19.1 20.46 0 Table E.2, test 8
10 Spouted bed dryer 2.40 159.0 25.0 19.7 5.70 60-70 Cyclone dryer 0.20 87.1 26.0 24.5 8.20 0 Table E.2, test 21
11 Cross flow dryer 7.00 71.0 21.8 17 22.46 0 Cyclone dryer 0.10 76.7 21.0 19.1 20.46 0 Table E.2, test 8
Thus, the only feasible option to remove large amounts of water in the model scale dryer
is by multi-pass operation. Decrease of SPEC will require a high fraction of exhaust air

Chapter 7 Experimental and Numerical Studies of Cyclone Dryer Performance 183
recycling, as employed in commercial fluidised bed and spouted bed dryers. Suitable
strategies for paddy drying to remove large amounts of water with higher energy
efficiency will be explored in detail in the next section.
7.2.5 Strategy for Paddy Drying with the Model Cyclone Dryer
A possible strategy for achieving a large amount of water removal with high energy
efficiency in the model cyclone dryer is to use multi-pass drying and suitable
arrangements for air recycling. Thus multi-pass drying of paddy grain in three-and four-
chamber cyclone dryers was subsequently investigated in a final series of tests. The effect
of air recycling on SPEC was investigated theoretically assuming adiabatic processes of
drying and air mixing.
7.23.1 Characteristics of multi -pass drying in the model dryer
The multi-pass experiments for paddy grain drying were conducted at 46 Hz motor
converter frequency, a high inlet air temperature of 75-85 °C, 0.0298-0.0411 kg/s feed
rate, and 26-29 % of dry-basis initial moisture content of paddy. The paddy was dried in
three separate passes of the model dryer.
The results in terms of moisture reduction and specific energy consumption for each pass
are shown in Tables 7.2 and 7.3 for three-and four-chamber cyclone dryers, respectively.
Test data for initial and final moisture content, average inlet air temperature, average
moisture content difference between inlet and outlet, and average specific energy
consumption are shown in Table 7.4.
As shown in Tables 7.2 and 7.3, the paddy moisture content difference between inlet and
outlet and specific energy consumption were almost the same for each drying pass for
both three- and four-chamber operation. Moisture content was reduced by approximately
2.9% and 2.3% dry-basis in each drying pass for three-chamber operation with 0.0298
and 0.0411 kg dry paddy per second feed rates, respectively. Higher moisture reductions

Chapter 7 Experimental and Numerical Studies of Cyclone Dryer Performance 184
of 3.9 % and 2.5% dry-basis per pass were obtained in four-chamber cyclone drying with
0.0298 and 0.0411 kg dry paddy per second feed rates.
Table 7.2 Results of multi-pass drying of paddy grain in a three-chamber cyclone dryer.
Test Pass No.
mp kg dry/s
Til
°C M1
% dry-basis M.
% dry-basis MR
% dry-basis SPEC
MJ/kg-water
1 1 0.0298 77.9 28.1 25.1 2.97 15.3 2 0.0298 83.0 25.1 22.0 3.15 15.1 3 0.0298 84.2 22.0 19.2 2.71 19.1
2 1 0.0411 84.5 26.4 24.3 2.10 16.2 2 0.0411 87.0 24.3 22.2 2.15 16.5 3 0.0411 87.4 22.2 19.7 2.53 14.0
Table 7.3 Results of multi-pass drying of paddy grain in a four-chamber cyclone dryer.
Test Pass No.
mp kg dry/s
T li °C
NI, % dry-basis
M. ')/0 dry-basis
MR % dry-basis
SPEC MJ/kg-water
3 1 0.0298 84.5 29.0 25.3 3.67 13.3 2 0.0298 86.8 25.3 20.7 4.67 10.3 3 0.0298 85.2 20.7 17.4 3.28 14.6
4 1 0.0411 80.0 27.9 25.5 2.37 14.4 2 0.0411 84.4 25.5 23.0 2.45 14.3 3 0.0411 84.8 23.0 20.3 2.76 12.7
Table 7.4 Overall average values for multi-pass paddy drying tests.
Test m P
kg dry/s Tr, °C
Minitial
% dry-basis Mfinal
% dry-basis MR
% dry-basis SPEC
MJ/kg-water 1 0.0298 81.7 28.1 19.2 2.94 16.5 2 0.0411 86.3 26.4 19.7 2.26 15.6 3 0.0298 85.5 29.0 17.4 3.87 12.7 4 0.0411 83.0 27.9 20.3 2.52 13.8
Average SPEC decreased when the number of chambers was increased. During the three-
chamber cyclone dryer tests, the average SPEC values were 16.5 and 15.6 MJ/kg of water
evaporated using 0.0298 and 0.0411 kg dry paddy per second feed rates, respectively.

Chapter 7 Experimental and Numerical Studies of Cyclone Dryer Performance 185
Lower SPEC values of 12.8 and 13.8 MJ/kg of water evaporated were obtained for the
four-chamber cyclone dryer using 0.0298 and 0.0411 kg dry paddy per second feed rates.
It is concluded from these tests that the desired moisture reduction of approximately 11%
dry-basis from 33% to 22% dry-basis could be achieved in the model dryer by three
passes of drying in a four-chamber cyclone dryer using approximately 80°C inlet air
temperature and 0.0298 kg dry paddy per second of feed rate (Test condition 3).
7.2.5.2 Predicted effect of air recycling
Although sufficient moisture removal could be achieved by three-pass drying using the
model four-chamber cyclone dryer, the energy efficiency is the most important factor in
practical dryer performance. The single-pass and multi-pass drying tests show the SPEC
of the model cyclone dryer to be higher than that of industrial fluidised bed and spouted
bed dryers with approximately the same initial moisture content of paddy grain. This is
due to the air recycling of 50-70% used in industrial dryers. Hence the effects of exhaust
air recycling on SPEC need to be explored to improve the energy efficiency of the model
cyclone dryer.
To investigate the effects of air recycling on SPEC, the results of first-pass drying in each
multi-pass test are used as case studies. The following assumptions are made:
1. Drying and air mixing processes are assumed to be adiabatic.
2. The temperature and mass flow rates at the cyclone inlet are assumed to be the same,
to maintain the thermal and fluid dynamic similarity of the cyclone dryer operation.
3. The influence of moisture content of air on the flow field inside the cyclone dryer is
neglected.
4. No heat loss to the surroundings.
5. Effects of the blower on the inlet air conditions are neglected.

1. Blower 2. Heater 3. Feeder 4. Cyclone dryer
T ambient
Wambient
Chapter 7 Experimental and Numerical Studies of Cyclone Dryer Performance 186
Air recycle condition, T.ut W.ut
Figure 7.14 Schematic diagram of cyclone dryer with air recycling system.
Figure 7.14 shows a schematic diagram of a cyclone dryer with air recycling. The
moisture content is the same at the inlet of the heater and the cyclone dryer. The amount
of water evaporated is the same as in operation without recycling. The total enthalpy of
solid and gas phases at inlet and outlet of cyclone dryer is the same due to the adiabatic
assumption. The moisture content of air at outlet is the summation of moisture content at
inlet and water evaporated inside the dryer. An initial value of moisture content of air
after mixing is assigned. Then the fraction of air recycled to give the same value of
moisture content at the heater inlet is calculated from the adiabatic air mixing process
between ambient and outlet air from cyclone dryer. The value of moisture content at the
mixing condition is varied corresponding to fractions of recycled air from 10% to 90%.
The amount of energy required to heat up the incoming air is calculated from the
difference between the enthalpies of enthalpy of air at the mixing point and the cyclone
dryer inlet. Finally, the SPEC values are obtained.
Figure 7.15 shows the computed influence of moisture content at the mixing condition on
the variation of SPEC and fraction of air recycling required. The results indicate that
SPEC should increase, while the fraction of recycled air should decrease with increasing
mixing moisture content until they are not significantly changed at 0.045-0.05 kg

Chapter 7 Experimental and Numerical Studies of Cyclone Dryer Performance 187
water/kg dry air of mixing moisture content. This corresponds to a 90% fraction of air
recycled. Further increase in the fraction of air recycled greatly increases the required
mixing moisture content and produces little further reduction of SPEC. Therefore, the
mixing moisture content should be limited at this value, which gives a maximum
effective air recycling fraction of 90%.
Figure 7.16 shows the predicted variation of SPEC with the fraction of air recycled. The
SPEC decreases linearly as the fraction of air recycled is increased. At 90% fraction of air
recycled, the percentage of reduction of SPEC for all cases studies (data from the first-
pass drying of each multi-pass drying test) is between 70-75% of the non-recycled air
drying SPEC. It varies between 3.5-4 MJ/kg water evaporated. This is comparable to the
fluidised bed paddy dryer performance at approximately the same initial moisture content
of paddy grain (as shown in comparison no. 1, 4 and 7 of Table 7.1).
7.2.5.3 Summary of paddy drying strategy in the model scale cyclone
dryer
The strategy for practical paddy drying using the model cyclone dryer has been
examined. The aim was to remove a sufficient large amount of water from paddy grain
(around 11% dry-basis difference) with high energy efficiency. The inlet air temperature
could not be further increased due to adversely effects on paddy grain quality. The only
feasible strategy was to use multi-pass drying to achieve the require amount of water
removal. To maximize energy efficiency exhaust air recirculation is required, as
employed in commercial fluidised bed and spouted bed dryers. The effect of air recycling
on SPEC was investigated theoretically. The most efficient paddy drying strategy in the
model scale cyclone dryer was determined to be follows:
1. Use of three-pass drying in a four-chamber cyclone dryer at inlet air temperatures of
about 80°C with 0.0298 kg/s paddy grain feed rate. This can reduce the moisture
content of paddy grain by approximately 11% dry-basis, with SPEC of 13 MJ/kg
water evaporated with no air recycling.

16
14
12
10
6
4
2
SPEC Test 1 Pass 1 SPEC Test 2 Pass 1
SFEC Test 3 Pass 1 - SPEC Test 4 Pass 1
Chapter 7 Experimental and Numerical Studies of Cyclone Dryer Performance 188
2. Implement 90% air recycling to give 70-75% reduction of SPEC compared to non-
recycled air operation. The SPEC should then vary between 3.5-4 MJ/kg water
evaporated. This range of SPEC is comparable to commercial fluidised bed paddy
dryer operation at approximately the same initial moisture content of paddy grain.
100
90
80
70
60
50
40
30
20
10
Fraction of air recycled Test 1 Pass 1
- - - - Fraction of air recycled Test 2 Pass 1
Fraction of air recycled Test 3 Pass 1
- - - - Fraction of air recycled Test 4 Pass 1
SFEC Test 1 Pass 1
- - - - SFEC Test 2 Pass 1
SPEC Test 3 Pass 1
- - - - SPEC Test 4 Pass 1
------- -----
0
0.01 0.02 0.03 0.04 0.05 0.06 0.07
0.09
Mixing moisture content, kg water/ kg dry air
Figure 7.15 Influence of mixing moisture content on fraction of air recycled and SPEC.
16
12
1
0
10 20 30 40 50 60
70 80 90 100
Fraction of air recycle, %
Figure 7.16 Variation of SPEC with fraction of air recycled.

Chapter 7 Experimental and Numerical Studies of Cyclone Dryer Performance 189
7.3 NUMERICAL STUDIES
The numerical study described in this section aims to evaluate the usefulness of a
commercial CFD code for predicting the drying process inside a cyclone dryer. In
Chapter 5, CFX 5.7 was used to predict the single-phase flow field inside the cyclone
dryer. The RNG k — g turbulence model combined with a second order accurate
differencing scheme gave an acceptable result for the flow field simulation without
particles present. In Chapter 6, the particle phase was added and the model was used to
predict the residence time of the particles. As discussed in Chapter 6, better agreement
between the shapes of residence time distribution obtained from numerical and
experimental results was obtained by using a numerical model without turbulence
dispersion for both silica gel particles and paddy grain. This model provided a reasonable
qualitative prediction of trends, and a quantitative prediction of mean particle residence
time with the correct order of magnitude. However, as seen from Table 6.4, the predicted
mean residence times varied between 18 and 74% of those observed experimentally. The
lack of particle-particle and particle-fluid interactions in this earlier modelling
undoubtedly contributed to the quantitative discrepancies observed.
The following treatment uses a more advanced Lagrangian/Eulerian approach that takes
into account mass, momentum and energy transfer between the particulate and
continuous phases to describe the drying process in the cyclone dryer. The computational
fluid dynamics study was carried out to compare the gas flow, temperature and humidity
patterns, as well as the trajectories of silica gel particles in three- and four-chamber
cyclone dryers. Although the complex transport phenomena occurring in the cyclone
dryer cannot yet be modelled with high accuracy, the CFD results are nevertheless a
useful guide to further improve the design and operation of cyclone dryers.
In the next section, the conservation equations of the particulate and continuous phases
are modified to include the two-way coupling effects. The numerical results obtained
using the commercial code CFX 5.7 for some experimental conditions are presented in

Chapter 7 Experimental and Numerical Studies of Cyclone Dryer Performance 190
the subsequent section. The final section compares the numerical and experimental
results.
7.3.1 Mathematical Model
7.3.1.1 Governing conservation equations for the continuous phase
The flow patterns were calculated by solving the steady state three-dimensional equations
for continuity, momentum and energy. The continuity and momentum equations in
Chapter 5 were rewritten to add a source term for the mass and momentum of the
particulate phase. The resulting equations for continuity, momentum and energy are:
V • (p f u)= S ms
V • (p f u u)-- —VP + v. (Leff (VU (vu)T))+ Skt
V • (p f Ull'tot )= V • (A,VT)+ SE
where S ms is a mass source term, S m is a momentum source and S E is an energy source.
Turbulent flux terms, (- p u' 0 u' ) and (- p f u'h') are added to the right hand side of the
Equations (5.2) and (5.3), respectively. These terms are modelled by using an eddy
viscosity (t 1 ) and eddy diffusivity ( rt ) as follows:
32 1, - p f u' u' = vt t (Vu + (VOT )__32pfki 1v (7.14)
-p f u'h = Ft Vh' (7.15)
where the eddy diffusivity can be defined as function of eddy viscosity
Ft =
Prt (7.16)

Chapter 7 Experimental and Numerical Studies of Cyclone Dryer Performance 191
Here k is the turbulence kinetic energy, I is the Kronecker delta, and Pr, is the turbulent
Prandtl number. The eddy viscosity is obtained using the RNG k — g turbulence model as
described in Chapter 5.
7.3.1.2 Governing equations for the dispersed phase
Based on the solution obtained for the continuous phase, the Lagrangian/Eulerian
approach was used to calculate the particle trajectories. The governing equation for the
dispersed phase is the BBO equation described in Chapter 3. Interactions between
particles were neglected. The BBO equation describes the force balance on a particle by
considering only the dispersed phase inertia, the aerodynamic drag force, and the gravity
force. Details of the BBO equation, inertia force evaluation, aerodynamic force
evaluation, and numerical integration procedure were discussed previously in Chapter 3.
The particle sources in the fluid phase momentum equations were obtained by solving a
transport equation for the sources. From the BBO equation, the equation for the
momentum source is expressed as
dS m 1 d 2 I = TEN p C inv f —v p l(v t- — v p )
dt 8 (7.17)
7.3.1.3 Heat and mass transfer
In general, the moisture transfer between the continuous and particulate phases during the
constant drying rate period is assumed to satisfy the equation (CFX 5.7 manual: Solver
theory)
dtw = rrd p p r DSh(rp — rf ) (7.18) dm

Chapter 7 Experimental and Numerical Studies of Cyclone Dryer Performance 192
where m w is the mass of water in the particle, rp and rf are the fractions of mass in the
particulate and continuous phases, p f D is the diffusivity of the mass fraction in the
continuous phase, and Sh is the Sherwood number given by
Sh = 2 +0.6Re °5 3 Pf p v-a
(7.19)
The rate of temperature change is governed by two physical processes: sensible heat
transfer and latent heat transfer associated with mass transfer of water. The equation of
energy balance is given by
dT dm m
P C P dt P = rcd p XNu(Tr — Tp ) h f
g dt' (7.20)
where Tf is the gas temperature, m p and c p are respectively the mass and heat capacity of•
the particles, X is the thermal conductivity of the gas, and h t is the latent heat of
vaporisation of the liquid water. The Nusselt number ( Nu) is calculated from
Nu = 2 + 0.6Re" (7.21)
X
7.3.2 Modelling Set up
The simulations presented in this chapter were performed using CFX 5.7. The structured
mesh was generated using ICEM 5. As discussed in Chapter 5, reasonable accuracy and
computational time were obtained using the RNG k — s turbulence model with a second
order accurate differencing scheme and a 419,928 node mesh. Parcels of the particulate
phase were tracked using the Lagrangian particle-tracking feature of CFX 5.7. The
evaporation of water in the particles was simulated by employing the evaporation model

Chapter 7 Experimental and Numerical Studies of Cyclone Dryer Performance 193
incorporated within CFX 5.7, which models heat and mass transfer between the discrete
and gas phases as described above. The density of the continuous phase was computed as
a function of temperature according to the ideal gas law, while its viscosity, thermal
conductivity, and specific heat were defined as polynomial functions of temperature.
The mean diameter of a silica gel particle was taken as 3.25 mm. In the simulations
presented in this chapter a restitution coefficient of unity was used to determine the
behaviour of particles impacting at the wall of the cyclone dryer, i.e. the particles were
allowed to rebound elastically from the wall. Particle agglomeration was neglected within
the dryer due to unavailability of this model in CFX.
In each simulation, 1000 particle tracks were used to represent the flow of particles
within the dryer. Limited simulations were conducted by setting up the inlet air and
particle mass flow rates, (and the inlet temperature and moisture content according to
some experimental results, as shown in Tables E.3 and E.4 of Appendix E. Additional
simulations were conducted at different particle feed rates, inlet air temperatures and
initial particle moisture contents to investigate the effects of these parameters on the
humidity, velocity, temperature field, and particle trajectories inside the cyclone dryer.
The inlet conditions of air and particles for the additional simulations are shown in Tables
E.5 and E.6.
7.3.3 Simulation Results
In this section, simulations of silica gel particle drying in three- and four-chamber
cyclone dryers are presented. Four sets of experimental results were selected for each,of
the three-and four-chamber configurations. These sets of data were used for the initial
validation of the numerical model. Another seven simulations were then conducted at
different particle feed rates, inlet air temperatures, and initial particle moisture contents to
evaluate the influence of these parameters on the humidity, velocity and temperature
distributions inside the cyclone dryer.

Particle Traveing Time 1Res PT for MartSicagel)
400.000
300 000
200.000
100.000
0.000
Particle Traveing Time (Ror PT for MoistSica9e4
400 OH
300 000
I 200 000
100 000
0 000
Chapter 7 Experimental and Numerical Studies of Cyclone Dryer Performance 194
7.3.3.1 Particle trajectories
Typical calculated particle trajectories for the three-and four-chamber cyclone dryers are
shown in Figures 7.17 (a) and (b), respectively. The results show 5 of the particle tracks
for simulations corresponding to the experimental results of Test numbers 4 and 10 of
Tables E.3 and E.4. The colour of the trajectory in each plot indicates the length of time
that particles represented by the particle track spend within the dryer.
11.
(a) (b)
Figure 7.17 Typical particle trajectories: (a) three-chamber cyclone dryer; (b) four-
chamber cyclone dryer. Colour contours indicate residence time in seconds.
As shown in Figure 7.17, the particles move upward to the higher chamber and then keep
moving around the wall of the dryer. The particle trajectories show almost circular
motion for a certain period of time in the intermediate chamber. The residence times of
particles become longer in this chamber as indicated by the different track colour. There

Chapter 7 Experimental and Numerical Studies of Cyclone Dryer Performance 195
is no significant change in track colour in the inlet and outlet chambers, where particles
stay for a relatively short time.
7.3.3.2 Velocity distribution
Figures 7.18 to 7.20 show the predicted tangential velocity distributions for different
silica gel particle feed rates, inlet air temperatures, and initial moisture content,
respectively. As shown in Figure 7.18, the tangential velocity decreases when silica gel
feed rate increases. This verifies that the presence of a particulate phase has a great
influence on the gas velocity distribution, and provides a partial explanation for the
influence of solid loading on the experimentally observed particle residence time
distributions. The change in the gas axial velocity is negligible compared with the very
large change in the tangential velocity.
The effect of different inlet air temperatures is shown in Figure 7.19. Changing the inlet
air temperature causes only small changes in the tangential velocity distribution. The
tangential velocity decreases by a negligible amount when the initial moisture content of
silica gel particles increases, as shown in Figure 7.20. Similar results were obtained for
the tangential velocity distribution in the four-chamber cyclone dryer configuration
(results not shown here).
7.3.3.3 Temperature and humidity distributions
Figures 7.21 (a) and (b) show the predicted temperature distributions in the first and
second chambers of the three-chamber cyclone dryer at different silica gel feed rates. The
corresponding humidity distributions are depicted in Figures 7.24 (a) and (b). From
Figures 7.21(a) and 7.24 (a), it can be seen that the first part of the drying takes place in
the fast flowing core of the first chamber, where the air temperature decreases and
humidity increases. The second part of the drying process takes place in an outer core of
the second chamber where the air temperature further decreases and humidity increases
as shown in Figures 7.21(b) and 7.24 (b). These phenomena can be explained from the

Chapter 7 Experimental and Numerical Studies of Cyclone Dryer Performance 196
previous discussion of particle trajectories. It appears that most of the particles are
trapped in the outer region of the intermediate chamber for a long time. Drying takes
place in this region at a high particle concentration, which encourages a high intensity of
particle and gas mixing. This pattern of temperature and humidity distributions was also
predicted for the four-chamber cyclone dryers (results not shown).
The effects of particle feed rate on the distributions of humidity and air temperature are
shown in Figures 7.21 and 7.24. The predicted humidity and air temperature distributions
in the outer region of the second chamber are almost constant, while significantly
different distributions occur in the first chamber and the central core of the second
chamber. This is because of the effect of different particle feed rates on the velocity
distribution in these regions. The tangential velocity distribution plays an important role
in the degree of mixing in these cases, and is considered a major factor in the predicted
differences in humidity and temperature distributions.
The inlet air temperature plays an important role in the humidity and temperature
distributions shown in Figures 7.22 and 7.25. A higher inlet air temperature gives a
higher driving force for water evaporation, and therefore the humidity of the air increases
when inlet air temperature increases. There is little difference in the humidity and
temperature of the air at different initial moisture contents of silica gel, as shown in
Figures 7.23 and 7.26. A similar trend was predicted for the humidity and air temperature
distributions in a four-chamber cyclone dryer (results not shown).
7.3.4 Numerical Validations
Due to the lack of experimental data on velocity, temperature and humidity distributions
of air inside the cyclone dryer with solid loading, only the predicted overall humidity and
temperature differentials of air between inlet and outlet could be used to validate the
numerical model. These values were calculated and compared with the experimental data
for the same operating conditions.

Chapter 7 Experimental and Numerical Studies of Cyclone Dryer Performance 197
Table 7.5 presents a comparison between numerical and experimental results for drying
of silica gel particles in the three- and four-chamber cyclone dryers. Studies of the
particle residence time distributions in Chapter 6 showed that the numerical model
predicted lower mean residence times than were observed experimentally. This would be
expected to reduce the air humidity and temperature differentials predicted in drying
simulations. However, the numerical predictions for air humidity and temperature
differentials are somewhat higher than the experimental results, as seen from the ratios of
numerical and experimental values in Table 7.5. This indicates that the heat and mass
transfer model used in this study gives significant overprediction of the mass and energy
transfer rates. It plays a more important role than residence time prediction in the
accuracy of drying process predictions.
Table 7.5 Comparison of numerical and experimental results for overall air temperature
and humidity changes in silica gel drying.
No. AT =T r,- °C AVV=WO - Wi, kg/kg Remark (Arne,. (AT). (AT)n../(AT)e.0 (AW)e.D OW). (AW)num/(AW)eiv
1 20.39 30.63 1.50 0.0082 0.0145 1.77 Test 27, Table E.3 2 16.26 30.61 1.88 0.0059 0.0112 1.90 Test 26, Table E.3 3 11.42 24.05 2.11 0.0042 0.0076 1.81 Test 25, Table E.3 4 17.26 27.65 1.60 0.0061 0.0095 1.56 Test 4, Table E.3 5 12.21 26.58 2.17 0.0032 0.0109 3.41 Test 22, Table E.4 6 16.71 34.70 2.08 0.005 0.0125 2.50 Test 23, Table E.4 7 32.58 37.16 1.14 0.0072 0.0137 1.90 Test 24, Table E.4 8 15.54 30.68 1.97 0.0048 0.0074 1.52 Test 10, Table E.4
The model employed to simulate heat and mass transfer between the particles and air is
based on the concept of droplet evaporation, which assumes that the vapour at the surface
of the particles is always saturated. This model does not accurately describe the heat and
mass transfer during the falling rate drying period in which the rate of water evaporation
is controlled by moisture diffusion inside the particle. Throughout the numerical
simulations, the ratio between the numerical and experimental air temperature differential
is within the range 1.1-2.2, while a higher deviation ratio of 1.5-3.4 is obtained for the air
humidity differentials. Larger deviations are obtained for a dryer with a higher number of

.0.25 -0.2 -0.15 -0.1 -0.05 0 0.05 r (m)
0.1 0.15 0.2 0.25
50
-40
30
a, 20
- 10
.. cr
▪
,
(a)
I ! I ! I .. . . .
35 *
2 15
10
.10
-0.2 0.15 -0.1 -0.05 0 0.05 0.1 0.15 0.2 0.25 r (m)
(b)
-0.25 -0.2 -0.15 -0.1 0.05 0 0.05 0.1 0.15
0.2 0.25 r (m)
35
30 I ill
- 25
20 4 k : Alla !Fla 2 15
10
+ 57.43 C + 68.94C 0 87.19C
-15
(a)
+ 57.43C + 68.94C 0 87.19C
I .. ....
: . • : : i I
• . • . .
'
Chapter 7 Experimental and Numerical Studies of Cyclone Dryer Performance 198
chambers, as seen by comparing results for the four-chamber configuration (Numbers 5,
6, 7 and 8) with results for the three-chamber configuration (Numbers 1, 2, 3 and 4).
Figure 7.18 Influence of silica gel feed rate on predicted tangential velocity profiles for
three-chamber cyclone dryer at: (a) 0.055 m elevation ;(b) 0.255 m elevation.
(Inlet air temperature 57.43 °C; initial moisture content of silica gel 21% db.)
40
35
30
-25
20
2 15
10
5
=0
c .. . . . . . . .
10
0.15
0.2 0.25
(b)
15 -0.25 -0.2 -0.15 -0.1 -0.05 0 0.05 0.1
r (m)
. . I
Figure 7.19 Influence of inlet air temperature on predicted tangential velocity profiles for
three-chamber cyclone dryer: (a) 0.055 m elevation; (b) 0.255 m elevation.
(Silica gel feed rate 0.0256 kg/s; initial moisture content of silica gel 21% db.)

I 1 1
1 1 1 1 ■ : : , : :
! ! !
1 1 1 1 4 21% db. + 23% db. -
1 i ! ; 1 i 0 40%db._ i I iiiii 1 i
:.: 20 ifiLl iimpri . jilki I I i ,..
' . . . . . ,1 ; ,
:
a> 0 ••
0:1
10
; 1 -15
! ! ! ! i !
0 0 kg/s !
! I • 0.0256 kg/s
I ! I i + 0.0433 kg/s
0 0.0585 kg/s
1 oaoobodooDo
1 ';40
30
1 0
Chapter 7 Experimental and Numerical Studies of Cyclone Dryer Performance 199
35 _
-0.25 -0.2 -0.15 0.1 -0.05 0
0.05 0.1 0.15 0.2 0.25
r(m)
(a)
40 :
. ii + 21% db.
0 4056db. . ..... + 23%.
.. . . . . . ;
..... ! 20
!
I I ! 1
-10 I I .. . . . . .
-0.25 0.2 0.15 -0.1 -0.05 0 0.05 0.1 0.15 0.2 0.25
r(m)
(b)
215
5 ! ! ! ! ! !
. . . .
"
Figure 7.20 Influence of initial moisture content of silica gel on predicted tangential
velocity profiles for three-chamber cyclone dryer: (a) 0.055 m elevation; (b) 0.255 m
elevation. (Inlet air temperature 57.43 °C; silica gel feed rate 0.0256 kg/s.)
o 0 kg/s - 0.0256 kg/s
-70 + 0.0433 kg/s - 1 0.0585 1kg/s Ls
_60
ogoopocloo'pe-et0000doo;oocioo
1 I I
60
50
- co - 30
E20
10
0 -0.15 -0.1 0.05 0 0.05 0.1 0.15 0.2 0.25 -0.25 -0.2 -0.15 -0.1 -0.05 0 0.05 0.1 0.15 0.2 0.25
r(m) r(m)
(a) (b)
- 5 i 1 : I I
Figure 7.21 Influence of silica gel feed rate on predicted temperature profiles for three-
chamber cyclone dryer: (a) 0.055 m elevation; (b) 0.255 m elevation
(Inlet air temperature 57.43 °C; initial moisture content of silica gel 21% db.)
0 -0.25 -0.2

+ 57.43C 1 1 1 + 68.94C
0 87.19C
, 1 . .
1 I 1 I I 1 1 1 1 lllll
.. . . . . . • .. . . . . . . . . . . . .
I
..... 1
0 I -0.25 -0.2 -0.15 -0.1 0.05 0 0.05 0.1 0.15 0.2 0.25
r (m)
BO
"70
1760
"OM
10
1
C, ! ! 1 'I
! .. .. .. .. ..
+ 57.43 C + 68.94C 0, 87.19C
-so 1 1 1 1 1 1 as
";5° : : . . A. - • 40 : . ..„.
.. . . .
•
30 .. .. .. .. .. .. .. .. . . . .
Chapter 7 Experimental and Numerical Studies of Cyclone Dryer Performance 200
E20 144
...... ..
-0.25 0.2 0.15 -0.1 -0.05 0 0.05 0.1 0.15 0.2 0.25
r (m)
(a) (b)
Figure 7.22 Influence of inlet air temperature on predicted temperature profiles for three-
chamber cyclone dryer: (a) 0.055 m elevation; (b) 0.255 m elevation
(Silica gel feed rate 0.0256 kg/s; initial moisture content of silica gel 21% db.)
........
............
1 1 .....
1 1 1
...... 1.1
11
+ 21% db. - 80 + 23% db.
- 0 40% db. 70
-c) -. -70 .. ; : ; . : -
C)
- . 1 1 1 1 1 1 1 1 1
t60 .. : : 1 1 1 1 1 1 =60
5° : . I ;50
+ 21% db. 1 1 1 1 ..... 1„1 t + 23% db. ......... ti : 0 db. . 1 i 1 i 40%;
1 t . . . . . . . . .
1 = .... . I I ! ...... .
! .
I ; ;
E 20 1 1 E20 : a, i 1 I i 1 i i a, i- ...... • • •
10 - 10 .. .........
I 1 I ! i i I i i ■ ii ; I i 0 0
-0.25 -0.2 -0.15 -0.1 -0.05 0 0.05 0.1 0.15 0.2 0.25 -0.25 -0.2 -0.15 -0.1 -0.05 0 0.05 0.1 0.15 0.2 0.25
r (m) r (m)
(a) (b)
Figure 7.23 Influence of initial moisture content of silica gel on predicted temperature
profiles for three-chamber cyclone dryer: (a) 0.055 m elevation; (b) 0.255 m elevation.
(Inlet air temperature 57.43 °C; silica gel feed rate 0.0256 kg/s)

0.03
0,
0.03
3 0.02
fb.015
0,005 -ca
0 = -025 -0.2 -0.15 -0.1 -0.05 0 0.05 0.1 0.15 0.2 0.25
r(m)
(b)
Chapter 7 Experimental and Numerical Studies of Cyclone Dryer Performance 201
003 •-
co
0) - 0.025
•-
•- a)
0 ' 0.0585 , kg/s
: 0.02
i 1
o
...... I : ....
O 0 kg/s • 0.0256 kgls + 0.0433 kg/s
0
+ 0
0 kg/s 0.0256 kg/s 0.0433 kg/s 0.0585 kg/s
i i
I
1 i .......
i i i 1 i
"015 I
'
I : I
:
cow
.. • • - oogooloocioo'pocioo 0 ogoo:poclooOodooi)ocioobocioo
0005 . . ...... --
E I . . . ....
... m = -0.25 -0.2 -0.15 -0.1 -0.05 0 0.05 0.1 0.15 az 0.25 -0.25 -0.2 -0.15 -0.1 -0.05 0 0.05 0.1 0.15 0.2 0.25
r(m) r(m)
(a)
(b)
Figure 7.24 Influence of silica gel feed rate on predicted humidity profiles for three-
chamber cyclone dryer: (a) 0.055 m elevation; (b) 0.255 m elevation.
(Inlet air temperature 57.43 °C; initial moisture content of silica gel 21% db.)
013.015
o 0000pogoo
; 005
0.01
_
0.02
cr0.015
.t 0.01
-
o
;.005
•-
m 0 -0.25 -0.2 -0.15 -0.1 -0.05 0 0.05 0.1 0.15 0.2 0.25
r(m)
(a)
0.03
0.025
• 57.43 C + 68.94C O 87.19 C
Figure 7.25 Influence of inlet air temperature on predicted humidity profiles for three-
chamber cyclone dryer: (a) 0.055 m elevation; (b) 0.255 m elevation.
(Silica gel feed rate 0.0256 kg/s; initial moisture content of silica gel 21% db.)

0- 03 ._ to
CC
0.025
co 002
TO.015
CO 0.01
.- 0.005
.— E
0
CO 0.0
Chapter 7 Experimental and Numerical Studies of Cyclone Dryer Performance 202
+ 21% db. + 23% db. 0 40% db.
i
!
■ ! !
li 1 1 ! ! !
i !
!
1
! ! 1 I
+ 21% db. + 23% db. 0 4010 db. _
1 1 i ! I ! i ■ i i ! !
! !
I ! !
1
! 1 ! 1 ! ! 1 !
I I I I I I 1 1 1 1 1 1 1 1 1 1
-0.25 -02 -0.15 -0.1 -0.05 0
0.05 0.1 0.15 02 0.25 -0.25 -0.2 -0.15 -0.1 -0.05
0
0.05 0.1
0.15 0.2
0.25
r (m)
r (to)
(a) (b)
Figure 7.26 Influence of initial moisture content of silica gel on predicted humidity
profiles for three-chamber cyclone dryer: (a) 0.055 m elevation; (b) 0.255 m elevation.
(Inlet air temperature 57.43 °C; silica gel feed rate 0.0256 kg/s.)
7.4 PROJECTED COMMERCIAL SCALE PROTOTYPE
PERFORMANCE
Both experimental and numerical modelling of the laboratory scale cyclone dryer gave
positive results: faster drying time, and reasonable energy consumption for multi-pass
operation with air recycling compared to commercial paddy dryers. The model cyclone
dryer results can be used to predict performance for a larger commercial scale dryer with
higher capacity and able to evaporate the excessive moisture within a single pass
operation. However, much consideration is required before a suitable cyclone dryer
commercial scale prototype can be constructed. The principal concerns in designing a
cyclone dryer chamber are to ensure sufficient residence time. Hence particle residence
time is the key parameter for successful scaling up of the cyclone dryer.
Theoretical considerations of cyclone dryer scaling effects based on CFD predictions will
now be investigated. The most appropriate strategies for cyclone dryer scale-up will be

Chapter 7 Experimental and Numerical Studies of Cyclone Dryer Performance 203
identified. As discussed previously, CFD simulations of the complex transport
phenomena occurring in a cyclone dryer are subject to considerable uncertainty.
However, the computations can still give a useful indication of trends and help to limit
the number of pilot plant tests needed to achieve effective large-scale dryer operation.
7.4.1 Scale up Considerations
One of the primary factors influencing the cyclone dryer scale-up is the particle residence
time. This parameter directly influences the final moisture content of the drying material.
It is particularly important in the drying of thermally sensitive material such as cereal
grain, where product deterioration or degradation could occur if the particle remains in a
gas stream for too long or too short a time. From the laboratory scale cyclone dryer
studies, it is apparent that the desired production capacity and final moisture content of
paddy grain could not be achieved with a single-pass operation. The objective of scaling
up the dryer size is to achieve this goal. With a sufficiently high residence time some
reduction in air temperature might also be possible, with a beneficial effect on product
quality and specific energy consumption.
Previous experimental studies on cyclone separators (Dibb et et al. 1997; Nebra et al.,
2000) suggest that particle residence time is significantly increased when the diameter
and height of a cyclone separator are increased. Jinscue (1992) also reported an increase
in particle residence time when the height of a swirl flow dryer was increased. The
influence of diameter and height of the present cyclone dryer chambers on particle
residence time will now be studied using numerical modelling. The cyclone dryer
chamber geometries used here are derived from the laboratory scale model previously
studied, which is shown in Figure 4.6. Scale factors of 1.25 and 1.5 are applied to all of
the model cyclone dryer dimensions, i.e. geometric similarity is assumed. These selected
values are only representative and not optimal in any way. The main aim was obtain an
indication of the functional relationship between the predicted mean residence time and
the geometric scale factor. Care should be taken in interpretation, and especially in
extrapolating the results obtained from this study.

Chapter 7 Experimental and Numerical Studies of Cyclone Dryer Performance 204
CFD based Lagrangian-Eulerian multiphase flow modelling was used with one-way
coupling to examine the influence of scale-up factor on the particle residence time.
Boundary conditions for the fluid and particle phases were set up as described in Chapter
6. Note that the inlet air velocity was held constant to keep the grain particles entrained.
According to this assumption, the capacity of the cyclone dryer in terms of the solid feed
rate should increase as the square of the geometric scale factor. One thousand silica gel
particles were tracked through the computational domain to obtain the residence time of
particles for geometric scale factors of 1.25 and 1.5. The numerical simulation results are
discussed in the following section.
7.4.2 Numerical Results and Discussion
To compare the numerical results of different chamber geometries, the inlet air conditions
(velocity and temperature) are set to be the same. Air inlet velocity and temperature are
19 m/s and 25 °C, respectively. The predicted cumulative age distributions of silica gel
particles with different scale-up factors of 1, 1.25 and 1.5 are compared in Figure 7.27.
The geometric scale factor clearly has a significant influence on the cumulative age
distribution.
Table 7.6 shows the predicted effect of the geometric scale up factor on the mean
residence time of silica gel particles. A logarithmic plot of mean residence time against
geometric scale factor is shown in Figure 7.28. This indicates that the variation of mean
residence time with geometric scale factor is highly non-linear. The mean residence time
is predicted to increase at more than the cube of the geometric scale factor over the range
investigated. This behaviour shows that the cyclone geometry could easily be modified to
meet the required residence time for single pass drying of paddy. If the solid particles
moved with the fluid, then kinematic similarity would require a linear increase in
residence time with geometric scale factor if the inlet air velocity were held constant. The
predicted results indicate significant non-linearity due to gravitational effects and
aerodynamic forces arising from relative air-particle motion.

0 50 100 150 200 250 300 350 400
1.2
0.8
06
—0— F (Original)
F (Scale factor 1.25)
F (Scale factor 1.5)
Acc
um
ula
te a
ge
dis
trib
uti
on,
F(t
)
Chapter 7 Experimental and Numerical Studies of Cyclone Dryer Performance 205
Time (s)
Figure 7.27 Influence of geometric scale factor on RTDs of silica gel particles.
3 -
2.5 -
2
1.5
1
0.5
0 0
y = 3.6043x 4- 1.4237 R2 = 0.9979
0.05 0 1 0.15 0.2 Log (Scale Factor)
0.25 0.3
Figure 7.28 Predicted variation of mean residence time with geometric scale factor.

Chapter 7 Experimental and Numerical Studies of Cyclone Dryer Performance 206
Table 7.6 Influence of geometric scale-up factor on mean residence time.
Scale factor Mean residence time (s)
1 (original case) 27
1.25 57
1.5 117
7.4.3 Cyclone Dryer Scale-up Strategy
A heat and mass transfer analysis incorporating moisture diffusion as discussed in
Chapter 3 indicates that a residence time of 180 seconds would be required for drying of
paddy grain in air at 80 °C. Assuming the paddy grain to have similar aerodynamic
properties to silica gel particles the geometric scale factor of 1.7 would be required to
give this mean residence time, as indicated by the correlation in Figure 7.28. The
corresponding cyclone diameter is 0.85 m. This prediction shows that the cyclone
geometry could easily be modified to meet the required residence time for single pass
drying of paddy. The modified dryer should still be small enough to be easily portable in
the field.
Due to the complexity of the processes taking place and the imprecision of residence time
and mass transfer predictions, current CFD practice cannot completely replace pilot-scale
testing and the partly empirical nature of the design process. Traditional techniques will
continue to be used for routine design, but CFD is invaluable for supporting this work
and for investigating the most promising dryer geometry to minimise pilot scale testing.
7.5 CONCLUSIONS
The performance of a laboratory scale multi-chamber cyclone dryer has been evaluated
experimentally. The effect of operating parameters such as particle feed rate and inlet air
temperature on the moisture reduction, heat and mass transfer, and specific energy

Chapter 7 Experimental and Numerical Studies of Cyclone Dryer Performance 207
consumption were investigated. It was found that particle feed rate and inlet air
temperature significantly affected the moisture reduction. When particle feed rate
decreased or inlet air temperature increased, the moisture reduction increased. Nusselt
number ( Nu) decreased when either the particle feed rate or inlet air temperature was
increased. At higher inlet air temperatures, specific energy consumption (SPEC)
decreased. The particle feed rate did not significantly affect the SPEC.
In these experiments, the maximum moisture reduction for paddy grain was obtained at
the highest inlet air temperature and at the lowest paddy feed rate. This was due to the
larger thermal driving force and particle residence time at higher inlet air temperature and
lower particle feed rate, respectively. However, the target moisture reduction of paddy
grain (33% to 22% dry-basis, or about 11% dry-basis reduction) was not achieved within
a single pass of the model dryer. Therefore, an appropriate paddy drying strategy to
remove the required amount of water with high energy efficiency in the model scale dryer
was designed based on multi-pass drying and exhaust air recycling.
A multi-pass drying experiment showed that sufficient moisture reduction in the model
dryer could be achieved by this means. The moisture content of paddy with a feed rate of
0.0298 kg per second was reduced from 29 to 17% dry-basis with three-pass operation of
a four- chamber cyclone dryer. Average moisture difference was 3.87% dry-basis per
pass, and an overall SPEC of 12.76 MJ per kg of water evaporated was achieved.
The use of exhaust air recycling to improve energy efficiency was examined
theoretically. The calculations indicated that 90% air recycling should give a 70-75%
reduction of SPEC compared to non-recycled air operation. This gave an SPEC of 3.5-4
MJ/kg water evaporated, which is comparable to commercial fluidised bed paddy dryer
operation at approximately the same initial moisture content of paddy grain.
The commercial CFD code CFX5.7 was used to model silica gel drying in the cyclone
dryer. The influence of changes in particle feed rate, inlet air temperature, and initial
particle moisture content on the humidity, velocity and temperature distributions were

Chapter 7 Experimental and Numerical Studies of Cyclone Dryer Performance 208
examined. A large decrease in tangential velocity was predicted when the particle feed
rate increased. There was little change in the tangential velocity distribution with either
the initial moisture content of the paddy grain or the inlet air temperature.
The simulation results showed the inlet air temperature to have the greatest influence on
the humidity and temperature distributions. This was due to a higher thermal driving
force between the air and the particle. A higher particle feed rate yielded an increase in
humidity and a decrease in temperature, especially in the bottom chamber and the central
core of higher chambers. This was considered largely due to the effect of the particles on
the tangential velocity distribution in that region, which resulted in changes to the heat
and mass transfer rates. The effect of initial moisture content of the particles on humidity
and temperature distributions was found to be insignificant compared to the effect of inlet
air temperature.
Numerical predictions of the overall humidity and temperature differentials of the air
between inlet and outlet were compared to the experimental results. The CFD predictions
gave ratios of numerical and experimental air temperature and humidity differentials
within the ranges of 1.5-3.4 and 1.1-2.2, respectively. This indicates that the heat and
mass transfer models used did not accurately describe heat and mass transfer during the
falling rate drying period, because they used a droplet evaporation model in which the
vapour at the surface of particle is always saturated; this is incorrect for falling rate
drying. Nevertheless, the model gave a reasonable prediction of trends in the humidity
and temperature changes at the outlet. The CFD model could be improved and used for
further cyclone dryer simulations.
In order to investigate the performance of a commercial scale cyclone dryer, a CFD based
Largrangian-Eulerian particle transport model was used to conduct exploratory studies on
the effect of changes in chamber geometry. From numerical modelling of three
geometrically similar cyclone dryers, the mean residence time of silica gel particles was
predicted to increase non-linearly with dryer size. By suitable increase in geometric scale,
both silica gel particles and paddy grain could be dried to achieve the desired final

Chapter 7 Experimental and Numerical Studies of Cyclone Dryer Performance 209
moisture content in a single pass operation without excessive particle degradation due to
the resulting longer residence time; a lower inlet air temperature could also be applied.
Further investigations of cyclone dryer performance at pilot scale are still necessary
because of the limited accuracy of current CFD models in predicting particle residence
time and the heat and mass transfer between gas and particles. However, the CFD
predictions can still be used as a design guide to suggest the most appropriate strategy for
dryer scale up and to indicate the influence of changes in geometry and operating
parameters.

Chapter 8 Summary and Recommendations 210
Chapter 8
SUMMARY AND
RECOMMENDATIONS
8.1 INTRODUCTION
The primary objectives of this research have been:
1) to design, construct and test a model of a cyclone dryer suitable for use in paddy
drying;
2) to investigate the residence time distribution (RTD) behaviour for paddy grain during
continuous operation of the cyclone dryer and propose a simple model for the RTD;
3) to evaluate the drying characteristics of the cyclone dryer in continuous operation;
4) to investigate an applicability of computational fluid dynamics (CFD) for the design
and performance prediction of this type of dryer.
The following conclusions regarding each objective may be drawn from the experimental
results and CFD calculations. The apparatus design criteria are covered first, followed by

Chapter 8 Summary and Recommendations 211
experimental results for the RTDs and the drying characteristics of the model cyclone
dryer. The applicability of CFD for predicting the pressure, humidity, velocity, and
temperature distributions and particle RTDs in a cyclone dryer are then reviewed. Finally,
some estimates for commercial scale dryer performance are produced and
recommendations for further research are addressed.
8.2 SUMMARY
8.2.1 Apparatus Design and Preliminary Investigation
The principal components of the model cyclone dryer are the drying chamber, duct work,
feeding unit, blower, and heater. The model cyclone dryer design was based on a capacity
of 200 kg/h. The dryer chamber geometry was developed from the design of Korn (2000)
used in the pharmaceutical industry. Due to the complexity of flow phenomena inside the
cyclone chambers, simple one-dimensional flow calculations were unable to determine
the flow-field and pressure drop characteristics. The commercial CFD code ANSYS CFX
5.7 was therefore used to investigate the flow field and pressure drop across the model
cyclone dryer for various cases.
The predicted pressure drop coefficient was used to determine the system resistance
curve for blower selection. The blower flow rate was chosen high enough to keep the
particles moving through the dryer chambers; this depended on both the internal orifice
geometry and the terminal velocity of the solid particles to be conveyed. Finally, a heater
was selected based on the amount of energy required to heat up this volumetric rate of
airflow and generate the required rate of evaporation of moisture from the transported
solids.
Preliminary trials were conducted to test the design. The flow pattern of paddy grain was
observed to be uniform inside cyclone dryer chambers. The paddy was conveyed from
inlet to outlet continuously without any sign of blower overload. There was no serious

Chapter 8 Summary and Recommendations 212
damage of paddy at the outlet of cyclone dryer. The cyclone dryer seemed to have
reasonable potential at this stage..
8.2.2 RTD of Solid Particles in the Model Cyclone Dryer
The residence time distributions for paddy grain and silica gel particles in the model
dryer were measured experimentally by the stimulus-response technique at three levels of
particle feed rate and inlet air velocity, with three-and four-chamber geometries.
The ideal single-parameter Tank-In-Series (TIS) model generally fitted the experimental
data much better than the ideal dispersion model. The overall flow pattern of particles in
dryer was between a plug flow and a perfectly mixed flow. The level of mixing was
relatively high, as indicated by value of the parameter n (number of tanks) in the TIS
model ranging from 2-3.
The mean particle residence times of paddy grain and silica gel particles observed in the
model dryer varied between 105-192 seconds and 132-195 seconds, respectively. Higher
mean residence times were obtained with lower mass concentrations of solid particles.
The mean residence time increased slightly with the number of recirculation chambers
and the specific gravity of particles at low solid concentrations. A quadratic function was
found to describe the relation between the mean residence time of particles and their
concentration with a deviation of less than 10 % of mean residence time.
8.2.3 Performance of the Model Cyclone Dryer During
Continuous Operation
The experimental studies with paddy grain and silica gel particles in the model cyclone
dryer showed that higher percentage moisture reductions were obtained with low particle
feed rates and high inlet air temperatures and a greater number of cyclone chambers. The

Chapter 8 Summary and Recommendations 213
lowest specific energy consumption (SPEC) for silica gel drying was achieved by using
the highest available inlet air temperature. However, the SPEC for paddy grain drying did
not change significantly with inlet air temperature. The SPEC increased when the initial
moisture content of paddy grain was decreased.
No serious damage of paddy grain was observed during the single pass drying
experiments. Maximum moisture reductions of 2.5-6.5 % dry-basis were obtained at inlet
air temperatures of 82-89 °C and a paddy feed rate of 0.0298 kg dry paddy per second.
The corresponding SPEC varied between 7-20.5 MJ/kg water evaporated, depending on
the initial paddy moisture content. These values are high compared to SPECs achieved in
commercial fluidised bed spouted bed dryers employing 50-70% exhaust air recycling.
As the target paddy moisture reduction from 33% to 22% dry-basis was not achieved by
single pass drying in the model cyclone dryer, a multi-pass drying strategy was
subsequently investigated; the use of air recycling to improve energy efficiency was
predicted. Three-pass drying at 75-85°C and 0.0298 kg dry paddy per second showed that
the model four-chamber cyclone dryer could reduce the moisture content of paddy from
29% to 17.4% dry-basis with an SPEC of 13 MJ/kg of water evaporated without air
recycling. This is still high compared to other commercial paddy dryers. However, a
competitive SPEC could be obtained by using 90% recycling of exhaust air. Calculations
showed that an SPEC between 4-3.5 MJ/kg of water evaporated could be achieved. This
lies in the same range of SPEC as a fluidised bed dryer operating with about the same
initial moisture content of paddy grain.
8.2.4 Applicability of CFD for Cyclone Dryer Design
Single-phase simulation of the flow field inside a laboratory scale three-chamber cyclone
dryer was carried out using ANSYS CFX 5.7, a RANS-based commercial computational
fluid dynamics (CFD) code. The RNG k-E turbulence model using a second-order
differencing scheme with a mesh resolution of 419,928 nodes gave satisfactory results. It
produced good solution convergence with an RMS residual level of 10 -6 . The SSG

Chapter 8 Summary and Recommendations 214
Reynolds stress turbulence model was considered unreliable, due to its inability to
produce adequate levels of solution convergence. The optimal numerical model using
RNG k-s turbulence model with a second-order differencing scheme at a mesh resolution
of 419,928 nodes gave useful descriptions of the axial and tangential velocity
distributions were obtained, and the predicted pressure drop across the cyclone dryer was
about 20 % lower than experiment. This is comparable with the accuracy of pressure drop
predictions for cyclone separators reported in the literature.
To estimate the particle residence time inside the laboratory scale cyclone dryer, a
numerical study was conducted using the Lagrangian/Eulerian approach with one-way
solid-fluid coupling in CFX 5.7. The numerical simulations without turbulence dispersion
gave reasonable qualitative predictions of the observed behaviour but large quantitative
discrepancies in the residence time distributions and mean particle residence times. The
apparent lack of turbulent dispersion effect was explained by the relatively high value of
Stokes number for the solid particles in the model dryer. The predicted cumulative age
distribution curve altered with inlet air velocity, but was not influenced significantly by
changes in particle feed rate. The mean particle residence times were not accurately
predicted. Evidently the one-way coupling did not sufficiently account for particle-
particle and particle-fluid interactions. Nevertheless, these numerical calculations gave
useful qualitative predictions of the influence of operating conditions on mean residence
time. The predicted mean residence times are generally more accurate for four-chamber
dryer cases than for three-chamber cases. The predicted mean residence times for paddy
grain are more accurate than those for silica gel particles.
A full simulation of some silica gel drying tests in the laboratory scale cyclone dryer was
conducted using CFX5.7 with a Lagrangian/Eulerian approach and two-way coupling
that accounted for mass, momentum and energy transfer between the solid particles and
gas phase. The simulation results showed the particle feed rate to have the greater
influence on the tangential velocity distribution. The CFD model used over estimated
both mass and energy transfer. The ratio between the numerical and experimental air
temperature was within range 1.1-2.2, while a higher ratio of 1.5-3.4 was obtained for the

Chapter 8 Summary and Recommendations 215
air humidity. Larger deviations were also obtained for dryers with a higher number of
chambers. The results is indicate that the heat and mass transfer model used in this study
played a more important role than the residence time prediction in the accuracy of drying
process prediction. Nevertheless, the model gave a reasonable prediction of trends in the
humidity and temperature changes at the outlet. The CFD model could be improved and
used for further cyclone dryer simulations.
An examination of the influence of cyclone dryer size on the mean particle residence time
conducted numerically. CFD predictions for geometrically similar dryers indicated a
highly non-linear relation between the mean residence time and the geometric scale.
Hence by suitably increasing the chamber dimensions, it should possible to achieve the
desired final moisture content of grain within a single-pass operation in a unit small
enough to be easily field portable.
8.2 RECOMMENDATIONS
1. Experimental studies at commercial pilot plant scale should be undertaken with' a
view to increasing particle residence time and achieving single-pass drying of paddy
at reduced air temperature. The effects of drying parameters (inlet air temperature,
particle feed rate and initial particle moisture content) on the final product qualities of
paddy, such as percentage of head rice yield and whiteness of rice grain after milling
process, should be examined.
2. Improvements of the CFD water evaporation model to incorporate the drying
characteristics of the solid particles during the falling rate drying period need to be
developed.
3. Experimental studies of the effects of exhaust air recycling on SPEC need to be
conducted.

References 216
References
ASHRAE, 1971, (American Society of Heating, Refrigeration and Air Conditioning
Engineers), Duct Design, In Fundamental Handbook, ASHRAE, Atlanta, USA, pp 33.1-
33.43.
ANSYS, 2004, Turbulence and wall function theory and initial condition modelling, In
CFX-5. Solver theory, ANSYS Canada Ltd, Waterloo.
ASME, Statement on the control of numerical accuracy by the ASME Journal of Fluids
Engineering, hap ://j ournaltools.asme.org/Templates/JFENumAccuracv.pdf, ASME
Journal of Fluid Engineering.
Ashworth, J.C. and Carter, J.W., 1980, Experimental study of drying behavior of silica-
gel granules by continuous weighing in an air stream, Drying'80, Vol. 1, Hemisphere
Publishing Coporation, New York, pp. 151-159.
Benta E.S., and Silva, M.A., 1997, Cyclone drying of milled corncob, Proceedings of the
Inter-American Drying Conference (IADC), Itu-SP, Brazil, pp. 288-295.
Boonthumjinda, S., Exell, R.H.B., Rongtawng, S. and Kaewnikom, M., 1983, Field tests
of solar rice drier in Thailand, Proceedings of ISES Solar World Forum, Perth, Australia,
pp.1258-1263.
Boysan, F., Ayers, W. H., Swithenbank, J., 1982, A fundamental mathematical modeling
approach to cyclone design, Trans. IChem E., 16, pp. 222-230.
Brooker, D.B., Bakker-Arkema, F.W., and Hall, C.W., 1992, Drying and storage of
grains and oilseeds, AVI Publication, New York.

References 217
Chamsingl, A. and G. Singh, 2000, Rice mechanization and processing in Thailand,
Agricultural Mechanization in Asia, Africa and Latin America, 31, pp. 21 -30.
Chen, C., 2003, Evaluation of air oven moisture content determination methods for rough
rice, Biosystems Engineering, 86, pp. 447-457.
Cheremisinoff, N.P. and Cheremisinoff, P.N., 1984, Hydrodunamics of gas -solid
fluidisation, Gulf Publication Co., Houston, Texas, USA.
Correa, J. G. L., Chamma, M.O., Godoy, A.L., Silva, M.A., and Nebra, S.A., 2001,
Experimental study of drying and residence time of sugar cane baggasse in cyclonic
devices, Proceedings of rd Inter-American Drying Conference, Boca del Rio, Veracruz,
Maxico, pp. 407-414.
Correa, J. G. L., Graminho, D.R., Silva, M.A. and Nebra, S.A., 2004a, Cyclone as a
sugar cane bagasse dryer, Chinese Journal of Chemical Engineering, 12, pp. 826-830.
Correa, J. G. L., Graminho, D.R., Silva, M.A. and Nebra, S.A., 2004b, The cyclone
dryers - a numerical and experimental analysis of the influence of geometry on average
particle residence time, Brazilian Journal of Chemical Engineering, 21, pp. 103-112.
Crowe, C., Sommerfielld, M, and Tsuji, Y., 1997, Multiphase flows with droplets and
particles, CRC Press, New York.
Debrand, S., 1974, Heat transfer during a flash drying process, I&EC Process Design
Development, 13, pp. 396 -404.
De Padua, D.B., 1985, Requirements for drying high moisture content grain in Southeast
Asia, Preserving Grain Quality by Aeration and In-Store Drying, AICAR Proceeding no.
15, Kuala Lumpur, Malaysia, pp. 45-49.

References 218
Department of Agricultural Economy, 2002, Agricultural statistics crop year 2000 -01,
Ministry of Agriculture and Co-operative, Thailand.
Derksen, J.J., 2003, Separation performance predictions of a Stairmand high -efficiency
cyclone, AIChE Journal, 49, pp. 1359-1371.
Derksen, J.J., Van den Akker, H.E.A. 2000, Simulation of vortex core precession in a
reverse-flow cyclone, AIChE Journal, 46, pp. 1317-1331.
Dibb, A. and Silva, M.A., 1997, Cyclone as dryer - the optimum geometry, Proceedings
of Inter-American Drying Conference (IADC), Itu-SP, Brazil, pp. 396-403.
Driscroll, R.H., and Adanezak., T., 1985, Drying systems for the humid tropics,
Preserving grain quality by aeration and in-store drying, AICAR Proceedings no.15,
Kuala Lumpur, Malaysia, pp. 58-68.
Exell, R.H.B., Kornsakool, S. and Triratrakoolchai, 1979, S., A low cost solar rice drier
for farmers in South-East Asia, Agricultural Mechanization in Asia, Africa and Latin
America, Authum, pp. 75-78.
Fredericks, L.J., and Mercader, J.P., 1985, Cost implication of implementation of grain
quality systems, Preserving Grain Quality by Aeration and In-Store Drying, AICAR
Proceedings no.15, Kuala Lumpur, Malaysia, pp. 152-160.
Griffiths, W.D., and Boysan, F., 1996, Computational Fluid Dynamics (CFD) and
empirical modeling of the performance of a number of cyclone samples, J. Aerosol Sci.,
27, pp. 281-304.
Heinze, C., 1984, New cyclone dryer for solid particles, Ger. Chem. Eng, 7, pp. 274-279.

References 219
Hoekstra, A.J., Derksen, J.J., 1999, Van Der Akker, FI.E.A., An experimental and
numerical study of turbulent swirling flow in gas cyclones, Chemical Engineering
Science, 54, pp.2055-2065.
Hoffmann, A. C., and Stein, L. E., 2002, Gas Cyclones and Swirl Tube, Springer,
Heildenberg, Germany.
Idelchik, I.E.; editor, Steinberg, M.E.; translated by Malyaskaya, G.R.; translation editor,
Martynenko, 0.G., 1994, Handbook of hydraulic resistance, 3 rd edition, CRC Press.
Inprasit, C. and Noomhorm, A., 2001, Effect of drying air temperature and grain
temperature of different types of dryer operation on rice quality, Drying Technology, 19,
pp. 389 -404.
Jindal, V.K. and Obaldo, L.G., 1986, Rice husk-fired drier for infestations and rapid 9t h - drying for paddy, 9 Annual ASEAN grains post-harvest technology seminar
(Singapore), Paper no. 86202, ASEAN crops post-harvest programme, Manila,
Philippines.
Jinescu, G., Vasilescu, P., and Dumitru, V., 1992, Drying of solid in the centrifugal field,
Drying'92, A.S. Mujumdar Editor, Elsevier Science Publishers By., USA, pp. 1624-
1650.
Kemp, I.C., Frankum, D.P., Abrahumson, J., and Saruchera, T., 1998, Solids residence
time and drying in cyclones, Drying'98, Hikidiki, Greece, pp. 581-588.
Klenin, N.I., I.F. Popov and V.A. Sakan, 1986, Agricultural mechanics: theory of
operation, computation of controlling parameters and the conditions of operation,
Russian Translations Series 31, Gidson Printing Works, New Delhi, India.

References 220
Korn, 0., 2001, Cyclone Dryer: A pneumatic dryer with increased solid residence time,
Drying Technology, 19, pp.1925-1937.
Kunze, O.R. and David L. Calderwood, 1980, Systems for drying rice, Drying and
Storage of Agricultural Crops, AVI Pub Co. Ltd., Connecticut, USA.
Laithong, C.,1987, The study of thermo physical properties of rough rice, Master Thesis,
King Monkgut's Institute of Technology Thonburi.
Levy, A. and Borde, J., 1999, Steady state one-dimensional flow for a pneumatic dryer,
Chemical Engineering and Process, 38, pp. 121-130.
Levenspiel, 0., 1972, Chemical reaction engineering, 2nd edition, John Wiley and Sons,
New York.
Madhiyanon, T., Soponronnarit, S. and Tia, W., 2001, Industrial-scale prototype of
continuous spouted bed paddy drier, Drying Technology, 19, pp. 207 -216.
Modigell, M., and Weng, M., 2000, Pressure loss and separation characteristics
calculation of a uniflow cyclone with a CFD method, Chem. Eng. Technol., 23, pp.753 -
758.
Montavon, C.A., Grotjans, H., Hamill, I.S., Phillips, H.W., and Jones, I.P., 2000,
Mathematical modelling and experimental validation of flow in a cyclone, 5th
International Conference on Cyclone Technologies, Warwick, UK, 31 May-2 Jun, 2000;
BHR Group, pp.175-186.
Morita, T and R.P. Singh, 1979, Physical and thermal properties of short grain rough
rice, Transactions of ASAE, 22, pp. 630-636.

References 221
Mujumdar, A. S., 1995, Handbook of Industrial Drying, 2nd Edition, Marcel Dekker Inc.,
New York, USA.
Narimatsu, C.P., and Feeeeira, M.C., 2001, Vertical pneumatic conveying in dilute and
dense phase flow: experimental study of the influence of particle density and diameter on
fluid dynamic behavior, Brazilian Journal of Chemical Engineering, 18.
Nebra, S.A., Silva M.A., Mujumdar. A.S., 2000, Drying in cyclones - A review, Drying
Technology, 18, pp. 791-832.
Pakowski, Z., Bartczak, Z., Strumillo, C., and Stenstrom, S., 1991, Evaluation of
equations approximating thermodynamic and transport properties of water, steam and
air from used in CAD of drying processes, Drying Technology, 9, pp. 753 -773.
Prachayawarakorn, S., 1997, Drying of high moisture paddy by fluidization technique,
Master Thesis, King's Mongkut's Institute of Technology, Bangkok. (In Thai)
Puechkamutr, Y., 1985, Design and development of natural convection rotary dryer for
paddy, Master Thesis, Asian Institute of Technology, Thailand.
Reyes, V.G., Jr. and V.K. Jindal, 1988, Effect of heat treatment on the head rice yields of
high moisture rough rice, Journal of Food Science, 53, pp. 482-487.
Rordprapat, W., Soponronnarit, S. and Wangji, M., 1999, Paddy drying systems in rice
mills, Kasetsart Journal (National Science), 33, pp. 126-133. (In Thai)
Saastanoinen, J., 1992, Model offlash drying, Drying'92, Amsterdum, the Netherlands,
pp. 434-443.

References 222
Schmidt, S., Blackburn, H. M., 2003, Simulation of turbulent flow in a cyclonic
separator, Third International Conference on CFD in the Minerals and Process
Industries, Melbourne, Australia, Dec 10-12 2003; CSIRO, pp. 365-369.
Seker, M., 2005, Residence time distribution of starch with high moisture content in a
single-screw extruder, Journal of Food Science, 67, pp. 317-324.
Singhagajen S., 1981, Farm grain dryer - Thailand, Food Drying, Proceeding of a
workshop, Edmonton, Alberta, pp. 89-93.
Silva, M.A. and Nebra, S.A., 1991, Drying in cyclone - an experimental study, Drying'91
edited by Mujumda, A.S., Elsevier Science Publishers, Amsterdam, pp. 281-291.
Silva, M.A. and Nebra, S.A., 1994, Numerical calculations of gas -solid flow in a cyclone,
Drying'94, Vol. b, Gold Coast, Australia, pp. 1319 - 1326.
Silva, M.A. and Nebra, S.A., 1997, Numerical simulation of drying in a cyclone, Drying
Technology, 15, pp. 1731 - 1741.
Silva, M.A., and Nebra, S.A., 1992, Experimental and theoretical study of drying in a
cyclone, Drying'92, edited by Mujumda, A.S., Elsevier Science Publishers, Amsterdam,
pp. 1651-1663.
Soponronnarit, S., 1985, Paddy drying in Thailand, AICAR Proceedings no.15:
Preserving Grain Quality by Aeration and In-Store Drying, Kuala Lumpur, Malaysia,
pp.192-199.
Soponronnarit, S. and Prachayawarakorn, S., 1994, Optimum strategy for fluidized bed
paddy drying, Drying Technology, 12, 1667-1686.

References 223
Soponronnarit, S., Prachayawarakorn, S. and Sripawatakul, 0., 1996a., Development of
cross-flow fluidized bed paddy drier, Drying Technology, 14, 2397 -2410.
Soponronnarit, S., Rordprapat, W. and Wetchacama, S., 1998, Mobile fluidized bed
paddy drier, Drying Technology, 16, 1501-1513.
Soponronnarit, S., Wetchacama, S., Trutassanawin, S. and Jariyatontivait, W., 2001,
Design, testing and optimization of vibro -fluidized bed paddy drier, Drying Technology,
19, 1891-1908.
Sopomronnarit, S., Prachayawarakorn, S., and Wangji, M., 1996b., Commercial fluidized
bed paddy drying, Drying' 96, Vol a., Krakow, Poland, pp. 638-644.
Stanford, H. W. and Englewood Cliffs, N.J., 1988, Analysis and design of heating,
ventilating, and air-conditioning systems, Prentice-Hall, New York.
Steffe, J.F. and R.P. Singh, 1982, Diffusion coefficients for predicting rice drying
behavior, Journal of Agricultural Engineering Research, 27, pp. 489 -493.
Stirmand, C. J., 1952, The design and performance of modern gas cleaning equipment,
Journal Institution Fuel, 29, pp. 58 -76.
Strumillo, C. and T. Kudra, 1986, Drying: principles, application and design, Gordon
and Breach Science Publishers, New York.
Szekely, J., and Carr, R., 1966, Heat transfer in a cyclone, Chemical Engineering
Science, 21, pp. 1119-1132.
Tang, D, Jess, A., Ren, X., Bluemich, B. and Stapf, S., 2004, Axial dispersion and wall
effect s in narrow fixed bed reactors: A comparative study based on RTD and NMR
measurements, Chemical Engineering Technology, 27, pp 866-873.

References 224
Taweerattanapanish, A., S. Soponronnarit, S. Wetchakama, N. Kongseri and S.
Wongpiyachon, 1999, Effect of drying on head rice yield using fluidized technique,
Drying Technology, 17, pp. 345 -353.
Ter Linden, 1949, Investigations into cyclone dust collectors, Proceeding International
Mechanical Engineering, London, pp. 160.
Thongprasert, M., 1978, Solar rice drier: a forced air drier type, Proceedings of Solar
Drying Workshop, Manila, Philippines.
Thrope, G. R., Wint, A. and Coggan, G.R., 1973, The mathematical modeling of
industrial pneumatic dryers, Transaction of Institute of Chemical Engineering Research,
51, pp. 339-349.
Tumambing, J.A., 1978, Current drying practices and need in ASEAN, Bulk Handling
and Storage of Grain in The Humid Tropics, AICAR Proceedings no.22, Kuala Lumpur,
Malaysia, pp. 48-57.
Ulrich, W., 2002, Cyclone dryer, 13 th International Drying Symposium (IDS 2002),
Beijing, China, Aug. 27-30 2002, Vol. B., pp. 867-873.
Wang, B., Xu, L.X., Xiao, G.X., Chu, K.W.,Yu, A.B., 2003, Numerical study of gas -solid
flow in a cyclone separator, Third International Conference on CFD in the Minerals and
Process Industries, Melbourne, Australia, Dec 10-12 2003; CSIRO, pp. 371-376.
Wetchacama, S., Soponronnarit, S., Swasdisevi, S., Panich-ing-orn, J. and
Suthicharoenpanich, S., 1999, Drying of high moisture paddy by two-dimensional
spouted bed technique, Proceedings of the First Asian-Australian Drying Conference
(ACD'99), Bali, Indonesia, pp. 300-307.

References 225
Wicks, M., 1971, Transport of solids at low concentrations in horizontal pipes.,
Advances in solid-liquid flow in pipes and its application., edited by Zandi, I., Pergamon
Press, New York.
Wilhelm, L.R., 1976, Numerical calculation of psychrometric properties in SI units,
Transaction of the ASAE, pp. 318 -328.
Witt, P.J., and Mittoni, L.J., 1999, Validation of a CFD model for predicting gas flow in
a cyclone, CHEMECA99, Newcastle, Australia.
Wratten, F.T., W.D. Poole, J.L. Chesness, S. Bal and V.Ramarao, 1969, Physical and
thermal properties of rough rice, Transactions of ASAE, 12, pp. 801-803.
Yen, S.C., Lu, W-M., Shung, S.C., 1990, Gas-solid heat transfer in gas cyclone, Journal
of Chinese Institute of Chemical Engineering, 21, pp. 197-206.
Yoshida, H., Saeki, T., Hashimoto, K., and Fujioka, T., 1991, Size classification of sub-
micron powder by air cyclone and three -dimensional analysis, Journal of Chemical
Engineering of Japan, 24, pp. 640-647.
Yoshida, H., Fukui, K., Yoshida, K., and Shinoda, E., 2001, Particle separation by
linoya's type gas cyclone, Powder Technology, 118, pp. 16-23.
Yuu, S., Jotalci, T., Tomita, Y., and Yoshida. K., 1978, The reduction of pressure drop
due to dust loading in a conventional cyclone, Chemical Engineering Science, 33,
pp.1573 - 1580.
Zhou, L.X., and Soo, S. L., 1990, Gas-solid flow and collection of solids in a cyclone
separator, Powder Technology, 63, pp.45-53.

DEVELOPMENT OF A CYCLONE RICE DRYER
by
Pracha Bunyawanichakul
B.Eng, Kasetsart University; M.Eng, AIT Thailand
School of Engineering
Submitted in fulfillment of the requirement for the degree of
Doctor of Philosophy
APPENDICES
University of Tasmania
Faculty of Science, Engineering and Technology
September 2006
Appendices
Appendix A. MATLAB Source Program for Pneumatic Dryer Simulation..... 226
Appendix B. Drawing of Cyclone Dryer, Rotary Feeder, Heater and Settling
Chamber 235
Appendix C. Calculation of the Required Air Flow and Total Pressure Drop 264
Across the Drying System C.1 Air flow rate 265
C.2 System pressure drop 265
Appendix D. Three Hole Probe Calibration 271 D.1 Probe Construction 272
D.2 Detail of Probe Calibration 272
D.3 Calibration Results and Data Fitting 273
D.4 Error of Fitted Surface 277
Appendix E. Experimental Results of Paddy Grain and Silica Gel Particle
Drying and Initial Conditions for Cyclone Dryer Simulations.... 280

Appendix A. 226
Appendix A.
MATLAB Source Program for Pneumatic Dryer Simulation
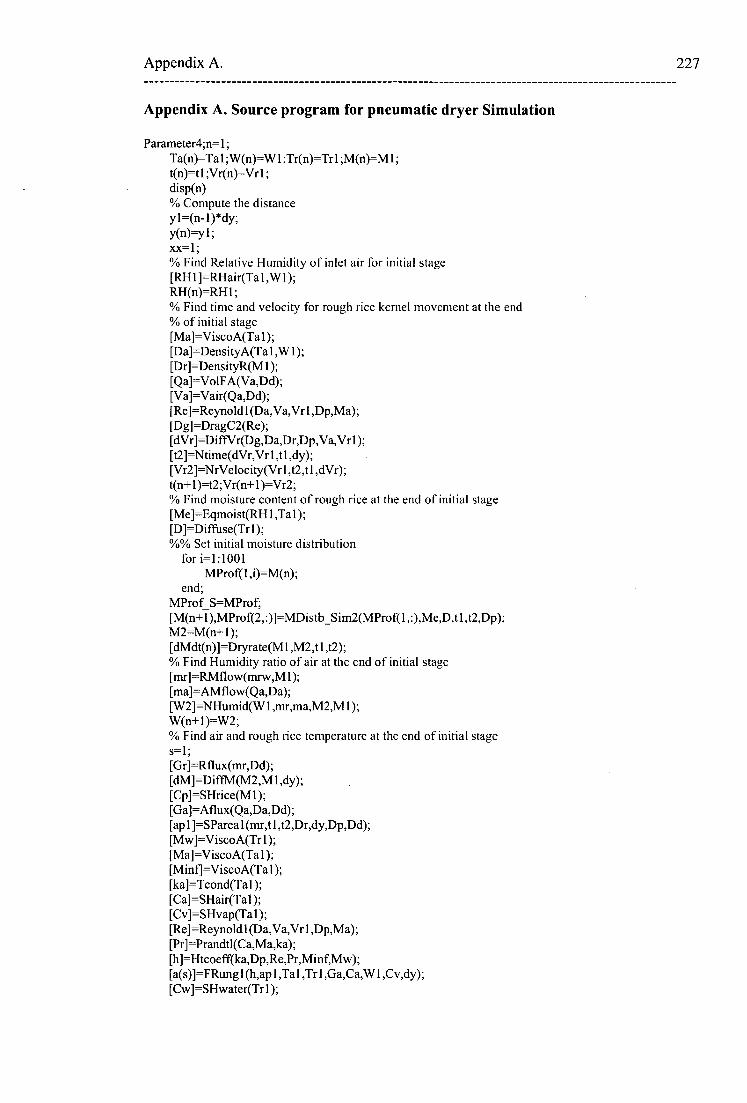
Appendix A. 227
Appendix A. Source program for pneumatic dryer Simulation
Parameter4;n=1; Ta(n)=Tal;W(n)=WI;Tr(n)=TrI;M(n)=M1; t(n)=t 1 ;Vr(n)=Vr 1 ; disp(n) % Compute the distance y 1=(n- 1 )* dy; y(n)y1; xx=1; % Find Relative Humidity of inlet air for initial stage [RH1]=RHair(Ta 1 ,W1); RH(n)=RH1; % Find time and velocity for rough rice kernel movement at the end % of initial stage [Ma]=ViscoA(Tal); [Da]=DensityA(Tal,W1); [Dr]=DensityR(M1); [Qa]=VolFA(Va,Dd); [Va]=Vair(Qa,Dd); [Re]=Reynold I (Da, Va,Vr 1 ,Dp,Ma); [Dg]=DragC2(Re); [dVr]=DiffVr(Dg,Da,Dr,Dp,Va,Vr1); [t2]=Ntime(dVr,Vr1,t1,dy); [Vr2]=NrVe loc ity(Vr 1 ,t2,t 1,dVr); t(n+1)=t2;Vr(n+1)=Vr2; % Find moisture content of rough rice at the end of initial stage [Me]=Eqmoist(RH1,Tal); [D]=Diffuse(Tr1); %% Set initial moisture distribution
for i=1:1001 MProf(1,i)=M(n);
end; MProf S=MProf; [M(n+1),MProf(2,:)]=MDistb_Sim2(MProf(1,:),Me,D,t1,t2,Dp); M2=M(n+1); [dMdt(n)]=Dryrate(M 1 ,M2,t 1 ,t2); % Find Humidity ratio of air at the end of initial stage [mr]=RMflow(mrw,M1); [ma]=AMflow(Qa,Da); [W2]=NHumid(W 1 ,mr,ma,M2,M 1); W(n+ 1 )=W2; % Find air and rough rice temperature at the end of initial stage s=1; [Gr]=Rflux(mr,Dd); [dM]=DiffM(M2,M1,dy); [Cp]=SHrice(M1); [Ga]=-Aflux(Qa,Da,Dd); [ap 1 ]=SPareal(mr,t 1,t2,Dr,dy,Dp,Dd); [Mw]=ViscoA(Tr1); [Ma]=ViscoA(Tal); [Minf]=ViscoA(Tal); [ka]=Tcond(Tal); [Ca]=SHair(Tal); [Cv]=SHvap(Tal); [Re]=Reynold 1 (D a, Va,Vr 1 ,Dp,Ma); [Pr]=Prandtl(Ca,Ma,ka); [h]=Htcoeff(ka,Dp,Re,Pr,Minf,Mw); [a(s)]=FRungl(h,ap 1,Ta 1 ,Tr 1,Ga,Ca,W 1 ,Cv,dy); [Cw]=SHwater(Tr1);

Appendix A. 228
[L]=Lheat(Trl,M1); [b(s)]=FRung2(h,ap1,Ta1,Trl,Gr,Cp,M1,Cw,L,Cv,dM,dy); for s=2:1:4 if s=2&3 Ta1=Ta(n)+(a(s-1)/2); Tr1=Tr(n)+(b(s-1)/2); [Mw]=ViscoA(Tr1); [Ma]=ViscoA(Ta1); [Minf]=ViscoA(Ta1); [ka]=Tcond(Tal); [Ca]=SHair(Tal); [Cv]=SHvap(Ta1); [Da]=DensityA(Ta1,W1); [Re]=Reynold1(Da,Va,Vr1,Dp,Ma); [Pr]=Prandtl(Ca,Ma,ka); [h]=Htcoeff(ka,Dp,Re,Pr,Minf,Mw); [Ga]=Aflux(Qa,Da,Dd); [a(s)]=FRung1(h,apl,Tal,Trl,Ga,Ca,W1,Cv,dy); [Cw]=SHwater(Tr1); [L]=Lheat(Tr1,M1); [b(s)]=FRung2(h,ap1,Ta1,Tr1,Gr,Cp,M1,Cw,L,Cv,dM,dy); else Ta1=Ta(n)+a(s-1); Tr1=Tr(n)+b(s-1); [Mw]=ViscoA(Tr1); [Ma]=ViscoA(Tal); [Mint]=ViscoA(Tal); [ka]=Tcond(Tal); [Ca]=SHair(Ta1); [Cv]=SHvap(Tal); [Da]=DensityA(Ta1,W1); [Re]=Reynold1(Da,Va,Vrl,Dp,Ma); [Pr]=Prandtl(Ca,Ma,ka); [h]=Htcoeff(ka,Dp,Re,Pr,Minf,Mw); [Ga]=Aflux(Qa,Da,Dd); [a(s)]=FRung1(h,apl,Tal,Trl,Ga,Ca,W1,Cv,dy); [Cw]=SHwater(Tr1); [L]=Lheat(Tr1,M1); [b(s)]=FRung2(h,apl,Ta1,Trl,Gr,Cp,M1,Cw,L,Cv,dM,dy); end; end; Ta2=Ta(n)+((a(1)+(2*a(2))+(2*a(3))+a(4))/6); Ta(n+1)=Ta2; Tr2=Tr(n)+((b(1)+(2*b(2))+(2*b(3))+b(4))/6); Tr(n+1)=Tr2; for n=2:3002 Ta1=Ta(n);W1=W(n);Tr1=Tr(n);M1=M(n); t1=t(n);Vr1=Vr(n);MProf(1,:)=MProf(2,:); disp(n) % Compute the distance y1=(n-1)*dy; y(n)=y1; % Find Relative Humidity of inlet air for nth stage [RH1]=RHair(Ta 1 ,W1); RH(n)=RH1; % Find time and velocity for rough rice kernel movement at the end % of nth stage [Ma]=ViscoA(Tal); [Da]=DensityA(Tal,W1); [Dr]=DensityR(M1);

Appendix A. 229
[Va]=Vair(Qa,Dd); [Re]=Reynold1(Da,Va,Vr1,Dp,Ma); [Dg]=DragC2(Re); [dVr]=DiffVr(Dg,Da,Dr,Dp,Va,Vr1); [t2]=Ntime(dVr,Vr1,t1,dy); [Vr2]=NrVeloc ity(Vr 1 ,t2,t 1 ,dVr); t(n+1)=t2;Vr(n+1)=Vr2; % Find moisture content of rough rice at the end of nth stage • [Me]=Eqmoist(RH1,Tal); [D]=Diffuse(Tr1); [M(n+1),MProf(2,:)]=MDistb_Sim2(MProf(1,:),Me,D,t1,t2,Dp); M2=M(n+1); [dMdt(n)]=Dryrate(M1,M2,t1,t2); if mod(n,100)=1
MProf S(xx+1,:)=MProf(2,:); xx=xx+ 1;
end; % Find Humidity ratio of air at the end of nth stage [mr]=RMflow(mrw,M1); [ma]=AMflow(Qa,Da); [W2]=NHumid(W1,mr,ma,M2,M1); W(n+1)=W2; % Find air and rough rice temperature at the end of initial stage s=1; [Gr]=Rflux(mr,Dd); [dM]=DiffM(M2,M1,dy); [Cp]=SHrice(M1); [Ga]=Aflux(Qa,Da,Dd); [ap 1 ]=SParea 1(mr,t 1 ,t2,D r,dy,Dp,Dd); [Mw]=ViscoA(Tr1); [Ma]=ViscoA(Tal); [Minf]=ViscoA(Tal); [ka]=Tcond(Tal); [Ca]=SHair(Tal); [Cv]=SHvap(Tal); [Re]=Reynold 1 (Da,Va,Vr 1 ,Dp,Ma); [Pr]=Prandtl(Ca,Ma,ka); [h]=Htcoeff(ka,Dp,Re,Pr,Minf,Mw); [a(s)]=FRung1(h,ap1,Tal,Tr1,Ga,Ca,W1,Cv,dy); [Cw]=SHwater(Tr1); [L]=Lheat(Tr 1 ,M 1); [b(s)]=FRung2(h,apl,Ta1,Tr1,Gr,Cp,M1,Cw,L,Cv,dM,dy); for s=2:1:4 if s=28L3 Tai =Ta(n)+(a(s- 1)12); Tr I=Tr(n)+(b(s-1)/2); [Mw]=ViscoA(Tr1); [Ma]=ViscoA(Ta 1 ); [Minf]=ViscoA(Tal); [ka]=Tcond(Ta1); [Ca]=SHair(Tal); [Cv]=SHvap(Tal); [Da]=DensityA(Ta I ,W1); [Re]=Reynoldl(Da,Va,Vr 1 ,Dp,Ma); [Pr]=Prandtl(Ca,Ma,ka); [h]=Htcoeff(ka,Dp,Re,Pr,Minf,Mw); [Ga]=Aflux(Qa,Da,Dd); [a(s)]=FRung 1(h,ap 1 ,Ta 1 ,Tr 1 ,Ga,Ca,W 1 ,Cv,dy); [Cw]=SHwater(Tr1); [L]=Lheat(Tr 1 ,M 1 );

Appendix A. 230
[b(s)]=FRung2(h,apl,Tal,TrI,Gr,Cp,MI,Cw,L,Cv,dM,dy); else Tal—Ta(n)+a(s-1); Tr1=Tr(n)+b(s-1); [Mw]=ViscoA(Tr1); [Ma]=ViscoA(Ta1); [Minf]=ViscoA(Tal); [ka]=Tcond(Tal); [Ca]=SHair(Tal); [Cv]=SHvap(Tal); [Da]=DensityA(Tal,W1); [Re]=Reynoldl(Da,Va,Vr I ,Dp,Ma); [Pr]=Prandtl(Ca,Ma,ka); [h]=Htcoeff(ka,Dp,Re,Pr,Minf,Mw); [Ga]=Aflux(Qa,Da,Dd); [a(s)]=FRungl(h,ap1,Tal,TrI,Ga,Ca,W1,Cv,dy); [Cw]=SHwater(Tr1); [L]=Lheat(Tr1,M1); [b(s)]=FRung2(h,ap1,Tal,Tr1,Gr,Cp,MI,Cw,L,Cv,dM,dy); end; end; Ta2=Ta(n)+((a( 1 )+(2*a(2))+(2*a(3))+a(4))/6); Ta(n+1)=Ta2; Tr2=Tr(n)+((b(1)+(2*b(2))+(2*b(3))+b(4))/6); Tr(n+1)=Tr2; end;
function [RH]=RHair(Tal,W1); % Function 'RHair.m' % This function compute Air properties(RH) pw=(101.325*WI)/(.62198+W1); pws=exp((-7511.52/(Tal+273.15))+89.63121+(0.02399897*(Ta1+273.15))...
-(1.1654551*10^-5*((Ta1+273.15)^2))-(1.2810336*10^-8*((Ta1+273.15)^3))... +(2.0998405*10^-11*((Tal+273.15)^4))-(12.150799*log(Tal+273.15)));
RI-1=pw/pws;
function [Ma]=ViscoA(Tal); % Function 'ViscoA.m' % This function compute the viscosity of air at abritariry temperature Ma=(1.69111*10^-5)±(4.98424*10^-8*Ta I )-(3.18702*10A-11*Ta 1 ^2)...
+(1 .31965*10^-14*Ta 1 ^3);
function [Da]=DensityA(Tal,W1); % Function 'DensityA.m' % This function compute the density of air at abitariry air temperature and humidity ratio Da= 101.325/(0.28705*(Tal+273.15)*(1+(1.6078*W1)));
function [Qa]=VolFA(Va,Dd); % Function 'Vair.m' % This function compute Air velocity at abitariry flow rate... % of abitariry dryer diameter Qa=Va*(pi*DdA2)/4;
function [VA]=Vair(Qa,Dd); % Function 'Vair.m' % This function compute Air velocity at abitariry flow rate... % of abitariry dryer diameter VA=(4*Qa)/(pi*DdA2);

Appendix A. 231
function [Re]=Reynold1(Da,Va,Vrl,Dp,Ma); % Function 'Reynold.m' % This function compute Reynold number Re=Da*Dp*(Va-Vr1)/Ma;
function [Dg]=DragC2(Re); % function 'DragC.m' % This function compute drag coefficient of rice kernel if Re<1 Dg=24/Re; elseif Re>=1&Re<1000 Dg=max((24/Re)*(1+(0.15*Re^0.687)),0.44); elseif Re>=1000&Re<=200000 Dg=0.44; end;
function [dVr]=DiffVr(Dg,Da,Dr,Dp,Va,Vr1); % Function 'DiffVr.m' % This function is the change of Rough rice respect to distance dy dVr=((3*Dg*Da*((Va-Vr1)^2))/(4*Dr*Dp))-((Dr-Da)*9.8 1 /Dr);
function [t2]=Ntime(dVr,Vrl,t1,dy); % Function 'Ntime.m' % This function compute moving time of rough rice for distance dy a=dVr; b=Vr1-(2*tl*dVr); c=(t1^2*dVr)-(t1*Vr1)-dy; t2=((-1*b)+(((b^2)-(4*a*c))^0.5))/(2*a);
function [Vr2]=NrVelocity(Vrl,t2,t1,dVr); % Function 'NrVelocity.m' % This function compute velocity of rough rice at distance increment dy Vr2=Vr1+((t2-tI)*dVr);
function [Me]=Eqmoist(RH,Tal); % Function 'Eqmoist.m' % This function compute equilibrium moisture content of Rough Rice... % at abritariry air conditions x=(3.146*10^-6*(273.15+Tal ))^(1/2.464); y=log(1-RH); Me=-(y/x)/100;
function [D]=Diffuse(Tr1) % Function 'Diffuse.m' % This function compute Diffusion coefficient of water inside Rough... % Rice kernel at abitariry Air Temperature D=5.68033*10^-6*exp(-3445.66/(Tr1+273.15));
% This program compute moisture districution inside rice kernel % at constant drying condition and time t function [Mav,Mt]=MDistb_Sirn2(M0,Me,DF,t1,t2,Dp) % Find time step and radius increment during simulation dt=t2-t1; dDp=Dp/(2*1000); %Start Calculation k=1; t=k*dt; % Compute radius increment for i=1:1001
R(i)=(i-1)*dDp;

Appendix A. 232
end; % Set initial moisture distribution
MI=MO; M I=MO;
% Create System of equation for moisture distribution i=1; B(i)=-43/(dDpA2))+(1/(DF*dt))); C(i)=3/(dDpA2); D(i)=(((3/(dDpA2))-(1/(DF*dt)))*M1(i))-(M1(i+1)*3/(dDr2)); for i=2:999
A(i)=(1/(2*dDpA2))*(1-(1/(i-1))); B(i)=-((1/(DF*dt))+(1/(dDpA2))); C(i)=(1/(2*dDpA2))*(1+( 1/(i-1))); D(i)=-((1/(2*dDpA2))*(1-(1/(i-1)))*M1(i-1))-(((1/(DF*dt))-(1/(dDp A2)))*M1(i))...
41/(2*dDpA2))*(1+(1/(i-1)))*M1(i+1)); end; i=1000;
A(i)=(1/(2*dDpA2))*(1-(1/(i-1))); B(i)=-((1/(DF*dt))+(1/(dDpA2))); D(i)=-((1/(2*dDpA2))*(1-(1/(i-1)))*M1(i-1))-(41/(DF*dt))-(1/(dDpA2)))*M1(i))...
-41/(2*dDpA2))*(1+(1/(i-1)))*M1(i+1))-((1/(2*dDr2))*(1+(1/(i-1)))*Me); % Solve System of equation % Forward Substitution for i=2:1000
A(i)=A(i)/B(i-1); B(i)=B(i)-(A(i)*C(i-1)); D(i)=D(i)-(A(i)*D(i-1));
end; %Backward Substitution Mt(1001)=Me; Mt(1000)=D(1000)/B(1000); for i=999:-1:1
Mt(i)=(D(i)-(C(i)*Mt(i+1)))/B(i); end; % Find Average Moisture content by Composite Simpson's rule Mav=0; b=4/(1000*(DpA2)); for i=2:1000
if mod(i,2)=0 sum=4*b*Mt(i)*(R(i)A2); Mav=Mav+sum;
else sum=2*b*Mt(i)*(R(i)A2); Mav=Mav+sum;
end; end; sum=b*Mt(1001)*(R(1001)A2); Mav=Mav+sum; % Create the average moisture profile for i=1:1001
Mf(i)=Mav; end;
function [mr]=RMflow(mrw,M1); % Function IRMflow.m' % This function compute Flow rate of rough rice dry mass mr=mrw-(mrw*(M1/(1+M1)));
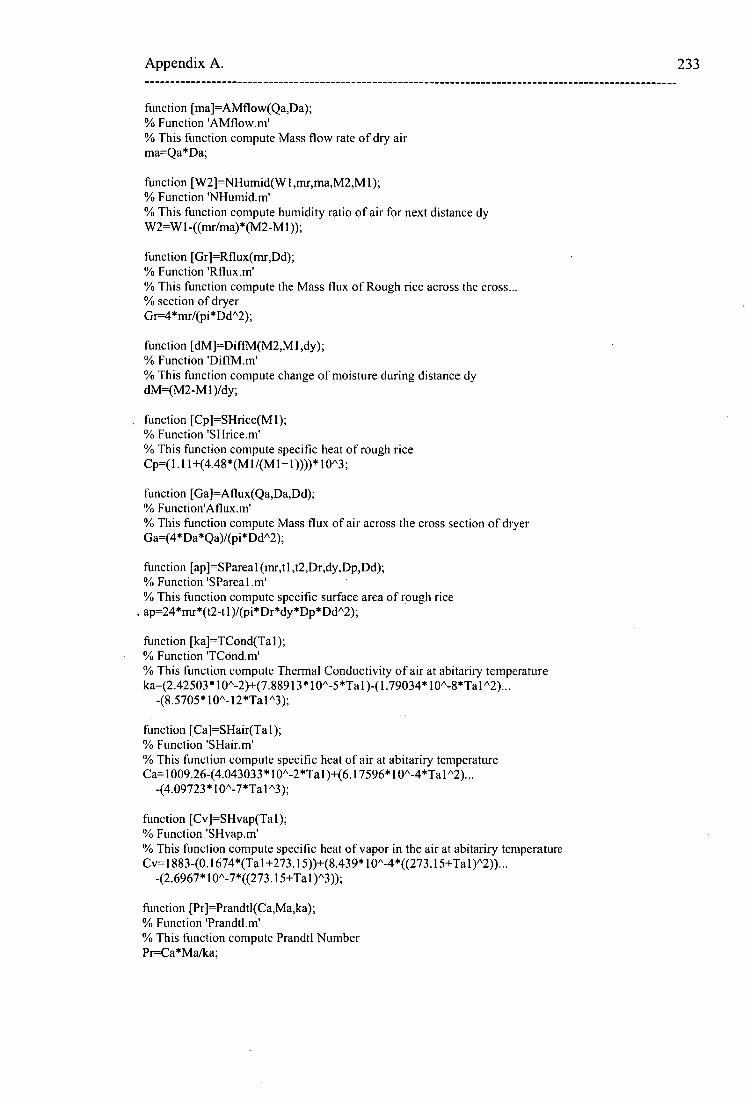
Appendix A. 233
function [ma]=AMflow(Qa,Da); % Function 'AMflow.m' % This function compute Mass flow rate of dry air ma=Qa*Da;
function [W2]=NHumid(W1,mr,ma,M2,M1); % Function 'NHumid.m' % This function compute humidity ratio of air for next distance dy W2=W1-((mr/ma)*(M2-M1));
function [Gr]=Rflux(mr,Dd); % Function 'Rflux.m' % This function compute the Mass flux of Rough rice across the cross... % section of dryer Gr=4*mr/(pi*DdA2);
function [dM]=DiffM(M2,M1,dy); % Function 'DiffM.m' % This function compute change of moisture during distance dy dM=(M2-M1)/dy;
function [Cp]=SHrice(M1); % Function 'SHrice.m' % This function compute specific heat of rough rice Cp=(1.11+(4.48*(M1/(M1+1))))*10^3;
function [Ga]=Aflux(Qa,Da,Dd); % Function'Aflux.m' % This function compute Mass flux of air across the cross section of dryer Ga=(4*Da*Qa)/(pi*DdA2);
function [ap]=SParea1(mr,t1,t2,Dr,dy,Dp,Dd); % Function 'SPareal.m' % This function compute specific surface area of rough rice ap=24*mr*(t2-t1)/(pi*Dr*dy*Dp*DdA2);
function [ka]=TCond(Tal); % Function 'TCond.m' % This function compute Thermal Conductivity of air at abitariry temperature ka=(2.42503*10^-2)+(7.88913*10^-5*Ta1)-(1.79034*10^-8*Ta1^2)...
-(8.5705*10A-12*Ta 1 ^3);
function [Ca]=SHair(Tal); % Function 'SHair.m' % This function compute specific heat of air at abitariry temperature Ca=1009.26-(4.043033*10^-2*Tal)+(6.17596*10^-4*Tal^2)...
(4.09723*10^-7*Ta 1 ^3);
function [Cv]=SHvap(Tal); % Function 'SHvap.m' % This function compute specific heat of vapor in the air at abitariry temperature Cv=1883-(0.1674*(Ta1+273.15))+(8.439*10^-4*((273.15+Ta 1 )A2))...
42.6967*10A-7*((273.15+Ta1)^3));
function [Pr]=Prandtl(Ca,Ma,ka); % Function 'Prandtl.m' % This function compute Prandtl Number Pr=Ca*Ma/ka;

Appendix A. 234
function [h]=Htcoeff(ka,Dp,Re,Pr,Minf,Mw) % Function 'Htcoeff. m' % This function compute Heat transfer coefficient between Rough rice and moving air h=(ka/Dp)*((((Minf/Mw)^0.25)*(Pr^0.4)*((0.4*Re ^0.5)±(0.06*Re^(2/3))))+2);
function [FRI]=FRungl(h,ap,Tal,Trl,Ga,Ca,W1,Cv,dy); % Function 'FRungl.m' % This function is the change of air temperature respect ot distance dy % Solution of this equation solve by Runge-Kutta 4th method FRI=dy*(-1*h*ap*(Tal-Tr1))/(Ga*(Ca+(Wl*Cv)));
function [Cw]=SHwater(Tr1); % Function 'SHwater.m' % This function compute specific heat of water in rough rice Cw=2822.32+(11.8277*(273.15+Tr 1))-(3.5047*10^-2*((273.15+Tr1)^2))...
+(3.601*10^-5*((273.15+Tr1)^3));
function [L]=Lheat(Trl,M1); % Function 'Lheat.m' % This function compute heat of vaporization of water in rough rice L=(2502-(2.386*Tr1))*(1+(2.49*exp(-21.733*M1)))*1000;
function [FR2]=FRung2(h,ap,Ta1,TrI,Gr,Cp,M1,Cw,L,Cv,dM,dy); % Function 'Frung2.m' % This function is the change of rough rice temperature respect to distance dy... % Solution of this equation find by Runge-kutta 4th order method FR2=((h*ap*(Ta1-Tr I )/Gr)+((L+(Cv*(Tal-Tr I )))*dM))*(dy/(Cp+(M I *Cw)));
% Program 'Parameter4.m' % Input parameter of Penumatic rice dryer disp('Please input parameter for penumatic rice drying') disp('Air parameter') Tal=input('fnitial air temperature'); Wl=input('Initial humidity ratio of air'); Va=input('Air Inlet Velocity'); disp('Rough rice parameter') Tr1=input(Initial grain temperature'); Ml=input('Initial moisture content of rough rice'); mrw=input('Feed rate of rough rice'); Vr1=input('Initial velocity of rough rice particle'); tl=input('Time at start'); Dp=0.0035; disp('Dryer parameter') Dd=input('Diameter of dryer'); dy=input('Hight increment during simulation');

Appendix B. 235
Appendix B.
Drawings of Cyclone Dryer, Rotary Feeder,
Heater and Settling Chamber

REV DATE BY REVIVON Met end Unit
PROJECT
Development of Rice Dryer DRAWING DESCRIPTION
Cyclone dryer Total Layout
DRAWN Procho B
CHECKED
DATE MAY 2004
SCALE
'or' of Cyclone Dryer DRAWING NUMBER GAO No.
REVISION
PART NO. DRAWING SET NAME DESCRIPTION
No. 1 HEATER CASE HEATER SET
No. 2 FAN
No. 3 RICE FEEDER RICE FEEDER SD
CYCLONE DRYER SET
SETTLING CHAMBER SET
CYCLONE DRYER
SETTLING CHAMBER
No. 4
No. 5

PART NO. DESCRIPTION DRAWING NO.
No. 1 HEATER INLET 1 OF 4
No. 2 HEATER OUTLET 2 OF 4
No. 3 HEATER BODY 3 OF 4
No. 4 HEATER BEND 4 OF 4
No. 5 HEATET COIL AREA, DRAWING OF COIL HEATER SUPPLED BY COSTOMER
REV DATE REVISION Material Unit
PROJECT Development of Rice Dryer
DRAWING SET NAME
HEATER CASE
DRAWN Pro no 8
CHECKED
DATE 4402 2004 SCALE
Port of Cyclone Dryer
DRAWING NUMBER CAD No
REVISION

NOTES , 1) Flange dimesion and welding as manufacturer specified 2) Holes located to match parts 3 heater body
REV DATE BY REVISION PROTECT DRAWING SET NAME DRAWN CHECKED Material Unit Development of Rice Dryer Pearls 0
DATE MAY 2004
SCALE HEATER CASE Galvanised Steel Sheet
PART NAME DRAWING NUMBER CAD No. 1.6 mm tickness Heater Inlet
1 of 4 REVISION

NOTES , 1) Flange dimesion and welding as manufacturer specified 2) Holes located to catch parts 4 heater bend
L'k.11111.- ■••11-
REV DATE BY REVISION Material Unit
PROJECT
Development of Rice Dryer DRAWiNG SET NAME
HEATER CASE
DRAWN Prarha
CHECKED
Galvanised Steel Sheet
1.6 mm tickness
r11111
DATE MAY 2004
SCALE
PART WE Heater Outlet DRAWING NUMBER
2 of 4
CAD No.
REVISION
ui

NOTES , 1) Flange dimesion and welding as manuf acturer speciFied Coil area Heater
//, Heater 2) Holes located to match parts 1 heater inlet and 4 dimension as another drawing heater bend 3) Heater element suppled by costomer Insulation Material thickness Standard
as manuf a c tur er specified. The Maximum operating temerasture is 120°C
REV DATE BY REVISM PROJECT DRAWING SET NAME DRAWN CHECKED Material Unit Development of Rice Dryer Pro ha It
DATE MAY 2009
SCALE HEATER CASE Galvanised Steel Sheet
PART NAME DRAWING NUMBER CAD No 1.6 ram holiness Heater Body
3 of 4 REVISION
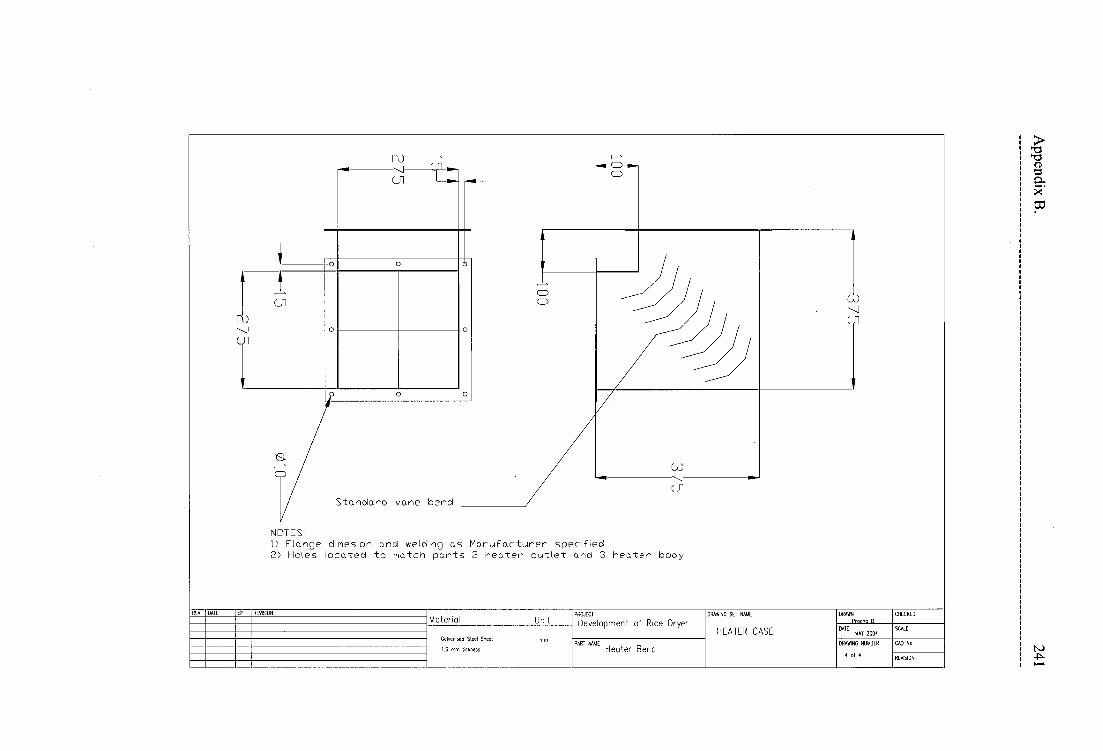
NOTES: 1) Flange dirnesion and welding as Manufacturer specified 2) Holes located to match parts 2 heater outlet and 3 heater body
REV DATE By REvisION PROJECT DRAWING SET NAME DRAWN CHECKED Material Unit Development of Rice Dryer Pf• acnn
DATE MAY 2004
SCALE HEATER CASE Galvanised Steel Sheet Mal
PART NAME DRAWING NUMBER CAD No. 1.6 mm tIcoess Heater Bend
4 Al 4 REVISION
Standard vane bend
C!)

REV RAID BY RBASION Material Unit
PROJECT
Development of Rice Dryer DRAINING SET NAME
RICE FEEDER
DRAWN Procho
CHECKED
DATE MAY 2004
SCALE
Port NI Cyclone Dryer DRAWING NUMBLR CAD No.
REVISION
PART NO. DRAWNF NO. DESCRIPTION
No 1 1 OF 4 RIPE CONNECTOR
20E4 FEEDER CONNECTOR No .2
No.3 3 OF 4 RICE HOPPER
FEEDER AND HOPPER SUPPORT 4 OF 4 No. 4
ROTARY FEEDER, DRAWING SUPPLED BY MANUFACTURER No.5

REV DATE BY REVISION Material Unit
PROJECT
Development of Rice Dryer DRAWING SET NAME
RICE FEEDER
DRAWN Procho B.
CHECKED
Steel Sheet
1 rnm Bane. ,
Mr11
DATE MAY 2004
SCALE
PART NAME Pipe Contraction
DRAWING NUMBER
1 OF 4
CAD No.
REVISION

NOTES: 1) Flange dimesion and welding as manufacturer specified 2) Hole layout on Flanges -±1 mm to match existing parts 3) Drawing 3 of 3 not supplies here those part make by costomer
REV DATE An RansiaN Material Unit
PROJECT
Development of Rice Dryer DRAWING SET NAME
RICE FEEDER
DRAWN Pracho
CHECKED
Galvanised Steel Sheet
1.6 mrn Ih1ckness
DAIE MAY 2004
SCALE
'MT "" Feeder Connector DRAW.NG NUMBER
2 of 4
CAD No,
RENSION

NOTES , D Flange dimesion and welding as ma nu f acturer specif ied 2) Hole layout on Flanges ±1 mm to ma tch commercial f eeder 3) Drawing 3 of 3 not supplies here those part make by cost omer
REV DATE Br REASION Material Unit
PROJECT
Development of Rice Dryer DRAWING SET NAME
RICE FEEDER
DRAWN Procho
CHECKED
Galvanised Steel Sheet
1 6 row thickness
rnrn
DATE MAY 2004
SCA1E
'ART WANE Rice Hopper DRAWING NUMBER
3 of
CAD No.
REVISION

REV REVISION BY DATE Material
—5
reo
Steel Equal Bar
SOAE3
Unit PROJECT
Development of Rice Dryer DRAWING SET NAME
RICE FEEDER
DRAWN Frame 9
CHECKED
DATE MAY 2004
SCAI.E
'ART "" Feeder and Hopper Support
DRAWING NUMBER
4 of 4
CAD No.
REASON

DRAWINF NO.
No. 1 10E7
No.2 2 OF 7
No.3 3 OF 7
No.4 4 OF 7
No.5 50E7
No.6 60E7
PART NO. DESCRIPTION
CYCLONE DRYER SUPPORT
CYCLONE DRYER BODY
CYCLONE DRYER OWLET
CYCLONE DRYERT BOTTOM LID
CYCLONE DRYER INLET
CYCLONE DRYER ORIFICE
7 OFT CYCLONE DRYER TOP LID No.7
REV DATE BY REVISION Material Unit
PROJECT
Development of Rice Dryer DRAWING OCT NAME
CYCLONE DRYER
DRAWN Procho B
CHECKED
DATE MAY 2004
SCALE
PAR of Cyclone Dryer DRAWING NUMBER CAD No.
REVISION

REV REV DATE BY REMSION Material Unit
PROJECT
Development of Rice Dryer DRAWING SET NAME
CYCLONE DRYER
DRAWN Procho B
CHECKED
Equal Angle Steel
50AE3
DATE MAY 2001
SCALE
PART NAME Cyclone Dryer Support
DRAWING NUMBER
1 of 7
CAD No.
REVISION
18,87
_AD
)RD

PROJECT
Development of Rice Dryer DRAWING SET NAME
CYCLONE DRYER
DRAWN Prochoil_
CHECKED
DATE MAY 2004
SCALE
PART NAME Cyclone Dryer Bottom Lid
DRAWING NUMBER
2 of 7
CAD No
REVISION
REV DATE BY REVISION Material Unit
Acrylic C1171,
10 tyro tickness

REV DATE BY REVISION Material Unit
PROJECT
Development of Rice Dryer DRAWING SET NAME
CYCLONE DRYER
DRAWN p Bo R
CHECKED
Acrylic
10 mm tickness
DATE MAY 7004 SCALE
PART NMJ.E Cyclone Dryer Inlet
DRAWING NUMBER
3 ol 7
CAD No.
REVISION

REVISION BY DATE REV DRAWING SET NAME Material
DRAWN Prorho Unit
PROJECT
Development of Rice Dryer CYCLONE DRYER DATE
MAY 2004 rnm Acrylic
On tickness DRAWING NUMBER
4.ol 7
CHECKED
SCALE
CAD No.
REVISION PART NAME Cyclone Dryer Orifice

REV DATE By REVISION PROJECT DRAWING SET NAME DRAWN CHECKED Material Unit Development of Rice Dryer Proc.
DATE MAT 2004
SCALE CYALONE DRYER Acrylic MM
PART NAME DRAWING NUMDLR CAD No. 10 mm tOkness Cyclone Dryer Body
5 of 7 REVISION

ALA 0A1E BY RLMSION Material
Acrylic
10 mm tickness
Unit
HIM
PROJECT
Development of Rice Dryer DRAWING SET NAME
CYCLONE DRYER
DRAWN Nacho R
CHECKED
DATE MAT 2009
SCALE
PART NAME Cyclone Dryer Outlet
DRAWING NUMBER
5 of 7
CAD No.
REVISION

REV DATE BY REVISION PROJECT DRAWNG SET NAME DRAWN CHECKED Material Unit Development of Rice Dryer `Loc.t0 0.
DATE MAY 2004
SCALE CYCLONE DRYER Acrylic MM
PART NAME DRAWING NUMBER CAD No. 10 mm tickness Cyclone Dryer Top Lid
7 Al 7 REVISION

REV DATE REASON Material Unit
PROJECT
Development of Rice Dryer DRAIVNO SET NAME:
SETTLING CHAMBER
DRAWN Pro ha B
CHECKED
DATE MAY 2004
SCALE
Port of Cyclone Dryer DRAWING NUMBER CAD No.
REVISION
PART NO DRAWING NO. DESCRIPTION
No 2 2 OF 8 SETTLING CHAMBER INLET
DISCHARGE BOTTOM 4 OF 8
WEIGHING CHAMBER 5 OF 8
LOAD CELL SUPPORT 6 OF 8
8 OF 8 SETTLING CHAMBER SUPPORT
No. 1 SETTLING CHAMBER BODY 1 OF 8
SETTLING CHAMBER COLLECTION BOTTOM 3 OF 8
7 OF 8 END PLATE
No. 3
No. 4
No. 5
No 6
No. 7
No 8

PP5 P00 PP
-4•11
Unit PROJECT
Development of Rice Dryer DRAWING SET NAME
SETTLING CHAMBER
DRAWN Prarho
CHECKED
Mal
DAIS MAY 2004
SCALE
PART NAME Settl
ing Chamber
Body
DRAWING NUMBER
1 of 8
CAD No.
REVISION
Material
Steel Sheet
2 mm Colmess
REV DATE BY REVISION

REV DATE BR REVISION PROJECT DRAWING SET NAME DRAWN CHECKED Material Unit Development of Rice Dryer POO, OR
DATE MAY 2004
SCALE Settling Chamber Steel Sheet
PART NAME DRAWING NUMBER CAD No. 2 mm tickness Settling Chamber Inlet Pipe
Inlet 2 of B REVISION
400
Pon

REV DATE BY ANSON Material Unit
PROJECT
Development of Rice Dryer DRAWING SET NAME
SETTLING CHAMBER
DRAWN P 000
CHECKED
Steel Sheet
2 mm tic k nes s
DATE MAY 2004
SCA' E
PART NAME Settling Chamber Collection Bottom
DRAWING NUMBER
of 8
CAD No.
REVISION

__3_10_,.... _ 125 "IP
\ /
RO__ REV CHECKED REVIStON BY DATE DRAWING SET NAME
Material DRAWN
Pro h,, R Unit PROJECT
Development of Rice Dryer SCALE SETTLING CHAMBER DATE
MAY 2004 MM CAD No.
Steel Sheet
2 mm tickness DRAWING NUMBER
4 of 13 RUSION
PART NME Discharge Bottom

REV DATE BY REVISION Material Unit
PROJECT
Development of Rice Dryer DRAWING SET NAME
SETTLING CHAMBER
DRAWN PrcKI, B
CHECKED
Steel Sheet
2 mm tlekness
MIT
DATE MAT 2004
SCALE
PART NAME . . Weighing Chamber
DRAWING NUMBER
5 oh B
CAD No
REWSION
110 1P 1P5
1R7

REV DATE BA REVISION Material Unit
PROJECT
Development of Rice Dryer DRAWING SET NAME
SETTLING CHAMBER
DRAWN Brach° B
CHECKED
Aluminium
5 mm lickness
MM
DATE MAY 2004
SCALE
PART NAME Load Cell Support DRAWING NUMBER
6 of 8
CAD No
REVISION
25,4 3
2 Mounting through M6 X LOP

2 Mounting through !note ME x 0.1P
REV DATE BY REVISION Material Unit
PROJECT
Development of Rice Dryer DRAWING SET NAME
Settling Chamber
DRAWN PTAATA 13
CHECKED
Steel Sheet
3 mm tickhess
MM
DATE MEAT 2004 SCALE
PART "" End Plate DRAWING NUMBER
7 of 8
CAD No.
REVISION

REVISION BY DATE REV CHECKED DRAWING SET NAME Material
DRAWN Nebo Unit
PROJECT
Development of Rice Dryer SCALE SETTLING CHAMBER DATE
NAT 2004
CAD No. Steel Equal Bar
SOAE3 DRAVONC NUMBER
1 of 2 REVISION PAM NAME Settling Chamber
Support 1
75
S.
7 /—•

Appendix C. 264
Appendix C.
Calculation of the Required Air Flow and Total Pressure Drop
across the Drying System

Appendix C. 265
Appendix C Calculation of the Required Air Flow and Total Pressure Drop Across
the Drying System
C.1 Air flow rate of cyclone dryer system
The air flow rate through cyclone dryer system must provide an air velocity greater than
the minimum value that will sustain the steady state working of a cyclone dryer.
According to the work of Wetchakama (1999), the minimum spouted bed velocity varies
between 13 -16 m/s. For 15 cm orifice, the desired air flow was determined by the
following relationship, assuming uniform flow in the contracted jet:
Q = vA
where Q = Volume airflow rate, m3/s
v= Inlet air velocity = 13 m/s
A = Tc(R 2„ — R 2 ) when R/R. =0.66 and R x = 0.15 m
Therefore, the desired air flow varies between:
(L in = 13 g (1-0 .662)*0 .15 2 /4 = 0.129 m3/s
Q. = 16 7T (1-0.662)*0.15 2 /4 = 0.16 m3/s
C.2 System pressure drop
Once the air flow rate is specified, the corresponding pressure losses can be estimated.
The system pressure loss is composed of the pressure loss for the individual components,
i.e. cyclone dryer chamber, air duct, duct fitting, heater chamber and separation chamber.
The layout drawing in Appendix B shows the components installed in the model dryer
system. The corresponding pressure loss is being determined by the following procedure:
The calculation of pressure loss is based on the following assumptions:
1. The volume air flow rate: Q= 0.129-0.16 m3/s
2. Density and viscosity of air at 110 °C

Appendix C. 266
pf = Air density = 0.921 kg/m 3
1..1 = Air viscosity = 2.205*10 -5 kg/ms
3. To calculate friction losses in straight ducts, the Darcy-Weisbach equation is
applied:
AP = f(1000L/D eq )13 f v 2 /2 (C-1)
where
AP = friction loss, Pa
f = friction factor
L = duct length, m
D eg = equivalent diameter, equation (3.14), mm
v = velocity, m/s
pf = density, kg/m3
A simplified formula for calculation of the friction factor f is (ASHRAE
1981):
f' = 0.11 ..025
R68 c + _ D eg Re ,
(C-2)
where itc is surface roughness of duct and Re is Reynolds number. If f 0.018:
f = f', otherwise f = 0.85f' + 0.0028 (ASHRAE 1981). Reynolds number Re is
calculated by the relationship:
pvD e Re = q (C-3)
100011
4. To calculate dynamic losses that result from disturbances in the flow caused by a
fitting, Equation (4.18) is applied:
AP = 4(p f v 2 /2) (C-4)
where
AP = fitting loss, Pa
4 = fitting loss coefficient

Appendix C. 267
The following paragraphs expand on the losses of individual components as shown in the
layout drawing in Appendix B. The pressure losses can be determined as follows:
(a) Inlet Bellmouth
According to Table F.1 Entry Fitting, Stanford (1988)
- r/D =0.2: 4a = 0.03
(b) Heater body inlet
See drawing number 1 of 4 heater cases set in Appendix B. Fitting loss coefficient
for this diffuser according to Idelchik (1994) diagrams 5-4 and 5-28 is
- Reynolds number = 6* iø
- Transition angle (a) = 12.2 degree
- Diffuser length (1 d ) = 0.75 m
- Area ratio (n ar , ) = 4.22
- = 0.433
(c) Heater bank
Fitting loss coefficient for this diffuser according to Idelchik (1994) diagram 12-30
is
- 4, = 5.32
(d) Heater body outlet
See drawing number 2 of 4 rice feeder set in Appendix B. Fitting loss coefficient
for this diffuser according to Idelchik (1994) diagrams 5-4 and 5-28 is
- Reynolds number = 4.7*104
- Transition angle ( a ) = 10.2 degree
- Diffuser length ( I d ) = 0.75 m
- Area ratio (n ail ) = 3.1
(e) Honey comb (Flow Straightener)
- 4e= 0.5 (From manufacturer)
(f) Transition duct from fan to cyclone
See drawing number 1 of 4 rice feeder set in Appendix B. Fitting loss coefficient
for this diffuser according to Idelchik (1994) is

Appendix C. 268
- Reynolds number = 4.6* iO4
- Transition angle (a) = 5.45 degree
- Diffuser length (1 d ) = 0.4 m
- Area ratio (n ar1 ) = 1.8
-4f = 0.2
(g) Cyclone chamber
= 20
(h) Separation chamber
-4h= 1 (Free flow to atmosphere)
Due to the small duct lengths in the system, the pressure loss in ducts following Equation
(C-1) is neglected; The total pressure loss of system according to the sum of items (a) to
(f) is shown in equation (C-4),
2 2 2 pv
= Pva PV b PV : 'D a
2 2 • h (C-5)
where v a = Q/A a = 4Q/710.15 2 m/s2
v h =Q/A a = 4Q/n0.15 2 m/s2
v e = Q/A e = Q/0.075625 m/s2
v d = Q/A d = 4Q/7t0.0176 2 m/s2
v e = Q/A e = 4Q/n0.15 2 m/s2
v f =Q/A f = 4Q/7t0.15 2 m/s2
V g =Q/A g =Q/0.01 m/s2
v h =Q/A h =Q/0.02 m/s2
By substitution of v a , v h v h into Equation 4.19, the system pressure loss curve
Equation 4.20 is obtained with varying numbers of chambers.

Appendix C. 269 Pr
essu
re: k
Pa
AP = 207739pQ 2 Pa (C-6 )
Equation (C-6) gives the total pressure drop across cyclone dryers. Figure C-1 shows
typical plots of the system pressure loss and blower characteristic curves for the model
dryer system. The operating flow for a particular case is given by the intersection of the
corresponding system and blower characteristic curves.
4
3.5 Blower pressure at 2500 rpm
3 Blower pressure at 2880 rpm
Blower pressure at 3000 rpm 2.5 System curve of cyclone dryer
2
1.5 -
0.5 -
0 0 0.05 0.1 0.15 0.2 0.25 0.3 0.35 0.4 0.45
Air flow rate: m 3/s
Figure C-1 Operating point at various speeds of the selected blower
The radial bladed centrifugal blower was driven by a 3 kW AC motor equipped with a
variable frequency speed controller. The characteristic curves of the blower at 2880 rpm
are shown in Figure C-2.
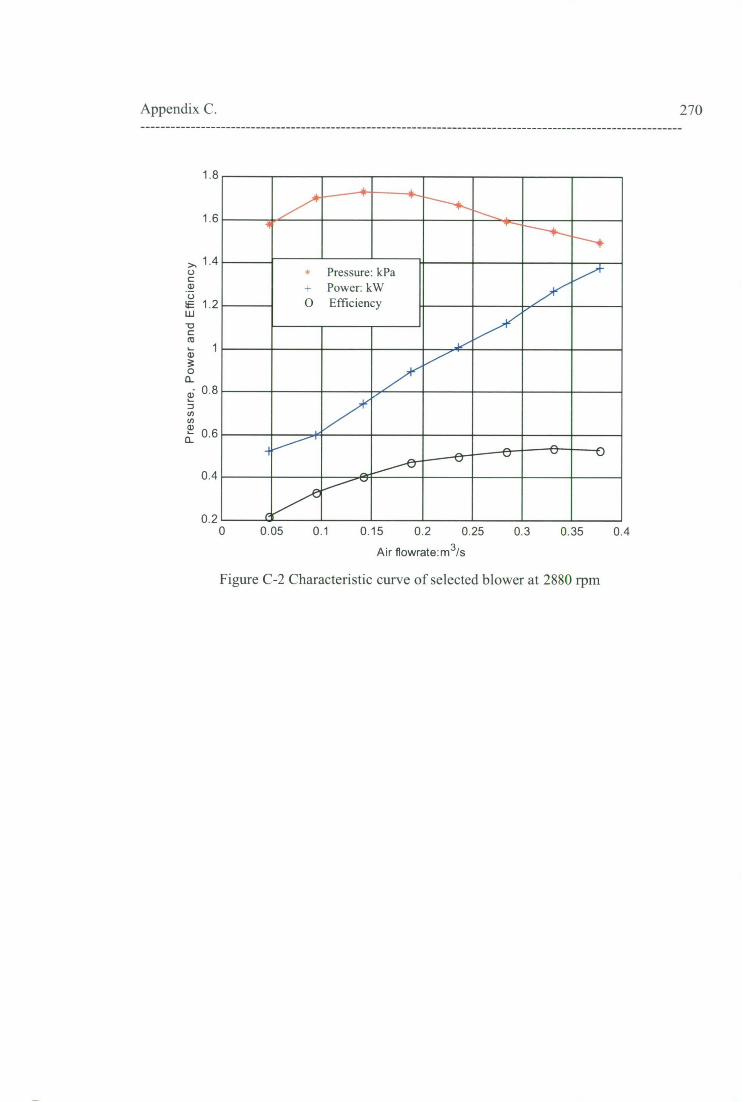
- Pressure kPa Power: kW
0 Efficiency
411
Appendix C. 270
1.8
1.6
1.4
1.2
CL 6 0.8
'a2
0.6 o_ '
0.4
04 0.2
0 0.05 01 0.15 02 0.25
Air flowrate:m 3/s
03
0.35
Figure C -2 Characteristic curve of selected blower at 2880 rpm

Appendix D. 271
Appendix D.
Three Hole Probe Calibration

Appendix D. 272
Appendix D. Three Hole Probe Calibrations
D.1 Probe Construction
The three-hole probe is supported by a steel tube of 6.35 mm O.D. The measuring
head is a wedge shape with a rounded nose as shown in Figure 5.4. There are three
pressure tappings: one is the centre of the nose and one on each side face. Pressures
from these tappings are conducted to the measuring device through 0.75 mm O.D.
tubes inside the probe support.
This probe can measure flow speed and direction, and total and static pressure. The
pressure difference between the top and bottom holes is zero when the probe points
directly into the flow. The probe tappings are numbered 1 through 3: nose tapping 1,
side tappings 2 and 3.
D.2 Detail of probe calibration
By considering the potential flow around a circular cylinder as an ideal case, three
calibration functions fl, f2 and f3 can be written in forms of the flow angle relative to
the probe head (a), the probe geometry, and Reynolds number based on probe
diameter (Re = pUd/pt).
fl (a,Geometry,Re)—(P2-P3)/(PI-P3) (D.1)
f2(a,Geometry,Re)=(P1-P3)/(pU2/2) (D.2)
f3(a,Geometry,Re)=(Ptot-P1)/(pU2/2) (D.3)
where P is the total pressure at the probe and U is the velocity at the probe. For a
particular probe the forms of fl, f2 and £3 can be found at a given Reynolds number
by measuring over the range of flow angle. The calibration was carried out by
rotating the probe in a closed circuit wind tunnel over the range of 1000-10000 of
probe Reynolds number. The three hole probe was mounted in a variable angle
support. A Pitot tube placed in the wind tunnel with its static hole at the same axial
position as the three hole probe was used as a velocity reference. Pressure differences

Appendix D. 273
between the three probe tappings were obtained with a pressure scanner and Furness
FCS421 micromanometer. The scanner channel connections were
Channel 0 Channel 1 Channel2 Channel3 Channel4
0 Ptot P2 (top side) P1 (front side) Ptot
0 Pstat P3(bottom side) P3(bottom side) Pl(front side)
Data from the manometer output signal were acquired by a PC with a National
Instruments data acquisition board. Programs were written in National Instruments
LabVIEW software (created by Jane Sargison). Pressure signals were typically
sampled at 500 Hz for 5-10 seconds, with 2 seconds delay time for steady-state
condition to be achieved after switching pressure sources.
D.3 Calibration Results and Data Fitting
The values of fl, £2 and £3 at different probe Reynolds numbers (Re) are plotted
against probe angle (a) in Figures C-1, C-2, C-3. These results show that functions fl,
f2 and £3 vary significantly with Re. This implies that the three functions fl, £2 and £3
depend on flow velocity.
Least square multiple polynomial regression was used to fit surfaces of fl, £2 and £3
over ranges of Re and probe angle a, which were considered independent variables.
The regression model assumed a fifth order variation with angle a and a third order
variation with Reynolds number. This lead to 24 regression coefficients for each of
the fractions f1 , 2 and f3, as indicated in Equations D-4 to D-6.
fl (a,Re) =A(0,0) + A(Oj)Re + A(0,2)Re2 + A(0,3)Re3
A( 1 ,0)ct + A( l , i )ocRe + A(l,2)ccRe 2 + A( 1 ,3)ccRe3
• A(2,0)a2 + A(2,0 1 a2Re + A(2,2)a2Re2 + A(2, 3)a2Re3
• A(3,0)a3 + A(3,0a3Re + A(3,2)a 3Re2 + A(3 , 3 )a3Re 3
A(4,0)a4 + A(4,0a4Re + A(4,2)a4Re2 + A(4,3)a4Re3
A(5 ,0)a5 + A(5,0a5Re + A(5,2)a 5Re2 + A(5,3)a 5Re 3 (D.4)

fl =
(P2-
P3)/(
P1-P
3)
0.6
0.4
0.2
0 2 0 212.5 215 217.5
-0.2
-0.4
5■•• , '"%° . 225 227.5 230 232.5 2 5
-0.6
-0.8
0 210 212.5 215 217.5 220 222.5 225 227.5 230 232.5 235
Re:1000
—9— Re:2000
Re:3000
—x— Re :4000
Re:5000
- Re:6000
— 1— Re :7000
- Re :8000
Re:9000
Re:10000
2.5
f2 =
(Pl-
P3)/
(01^
2/2)
I 5
0.5
Probe Angle : Degree
Appendix D. 274
—9— Re:1000
—s— Re :2000
Re :3000
—x— Re :4000
—x— Re :5000
—9— Re:6000
- Re:7000
- Re :8000
--- Re :9000
Re: 10000
Probe Angle : Degree
Figure D-1 fl plotted against probe angle at different Re
Figure D-2 12 plotted against probe angle at different Re
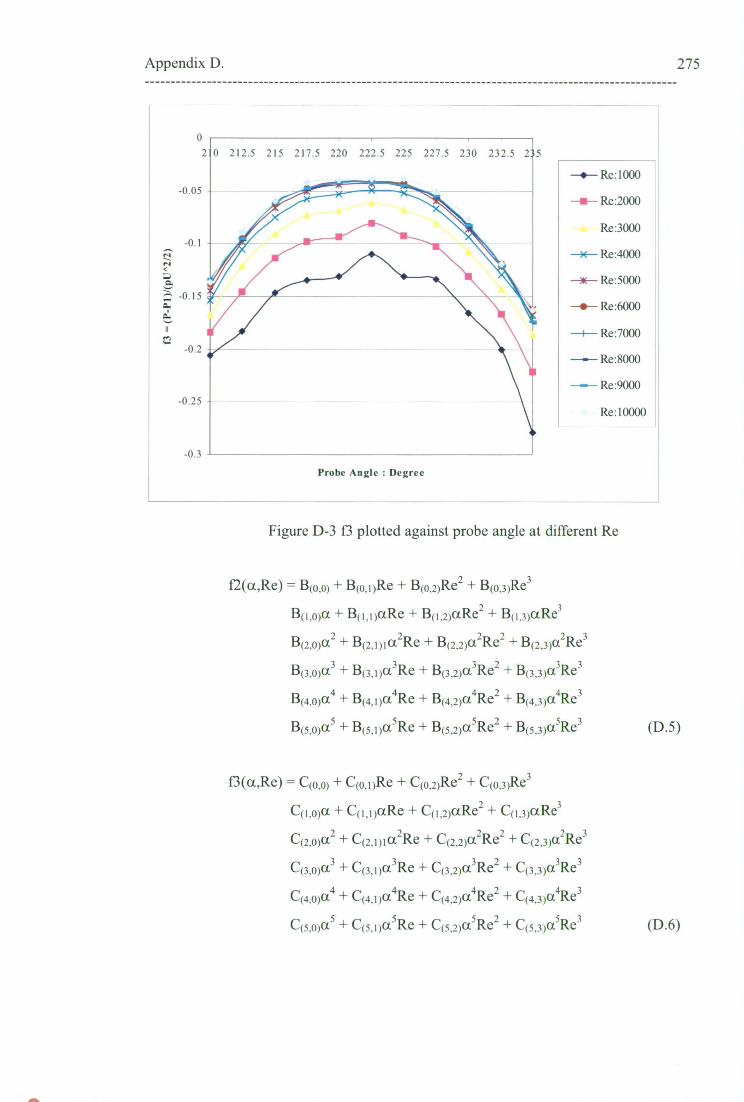
0 212.5 215 217.5 220 222.5 225 227.5 230 232.5 2
-0.05
a. ii 0
-0.2
-0.25
-0.3
Probe Angle : Degree
- e- Re: 1000
- a- Re:2000
Re:3000
- x- Re:4000
- Nir- Re:5000
- 4,- Re:6000
-1- Re:7000
- -- Re:8000
- Re:9000
Re: 10000
Appendix D. 275
Figure D-3 13 plotted against probe angle at different Re
f2(a,Re) = B(0,0) + B(0,DRe + B(0,2)Re 2 + B(0,3)Re 3
Boma + BomaRe + B(1,2)aRe 2 + B(1,3)aRe3
B(2,0)a2 + B(2,01a2Re + B(2,2)a2Re2 + B(2,3)a2Re3
Boma? + B(3,0a3Re + B(3,2)a3Re2 + B(3,3)a3Re3
Boma4Re + B0,2)a4Re2 + B(4,3)a4Re3 Bomot4 +
B(Ss)a5 + Boma5Re + B(5,2)a5Re2 + B(5,3)a5Re3
f3(ot,Re) = C(0,0) + C(0,1)Re + C(0,2)Re2 + C(0,3)Re3
C(1,0)a, + C(1,1 )(lite + Co ,2)aRe2 + C(1,3)aRe3
C(2,0)a2 + C(2,1)1a2Re + C(2,2)a2Re2 + C(2,3)a2Re3
Coma3 + Comot3Re + C(3,2)a3Re2 + C(3,3)a3Re3
C(4s)a4 + C OL Re + _(4,1)__4___ C(4,2)a4Re2 + C(4,3)a4Re3
Coma5 + C(5 , 0a5Re + C(5,2)a5Re2 + C(5,3)a5Re3
(D.5)
(D.6)

Appendix D. 276
The regression coefficient for the functions fl, £2 and £3 are specified in
Tables D-1, D-2 and D-3.
Table D-1 Coefficients of fl(a,Re)
Coefficient i = 0 i =1 i = 2 i = 3 A(0,i) 3.61E+04 -5.87E+01 2.90E-02 -2.11E-06 A(1,i) -6.99E+02 1.24177526-6.41E-04 4.67E-08 A(2,i) 5.26095601 -1.05E-02 5.65E-06 -4.15E-10 A(3,i) -1.90E-02 4.38E-05 -2.49E-08 1.84E-12 A(4,i) 3.24E-05 -9.13E-08 5.48E-11 -4.08E-15 A(5,i) -1.98E-08 7.56E-11 -4.82E-14 3.61E-18
Table D-2 Coefficients of f2(a,Re)
Coefficient i = 0 i =1 i = 2 i = 3 B(0,i) 1.12E+06 -3.67E+02 5.33E-02 -2.56E-06 B(1,i) -2.52E+04 8.15E+00 -1.18E-03 5.66E-08 B(2,i) 2.25E+02 -7.24E-02 1.05E-05 -5.00E-10 B(3,i) -1.00E+00 3.21E-04 -4.64E-08 2.21E-12 B(4,i) 2.24E-03 -7.11E-07 1.03E-10 -4.88E-15 B(5,i) -2.00E-06 6.30E-10 -9.07E-14 4.30E-18
Table D-3 Coefficients of f3(a,Re)
Coefficient i = 0 i=1 i = 2 i = 3 C(0,i) 2.42E+05 -1.96E+02 3.79E-02 -2.15E-06 C(1,i) -5.45E+03 4.42E+00 -8.53E-04 4.84E-08 C(2,i) 4.92E+01 -3.98E-02 7.69E-06-4.36E-10 C(3,i) -2.22E-01 1.79E-04 -3.46E-08 1.96E-12 C(4,i) 5.01E-04 -4.04E-07 7.79E-11 -4.42E-15 C(5,i) -4.52E-07 3.63E-10 -7.01E-14 3.97E-18
From (D.1) and (D.2) when the probe Reynolds number is defined as
we have
and
Re = pUd/1.1
C2 = f2Re2 = 2(pl-p3) pd2/g2
f2= C2/Re 2
(D.7)
(D.8)
(D.9)
Substituting (D.7) into (D.5) gives

Appendix D. 277
C2 = B(o,0) Re 2+ B(0,0Re3 + B(0,2)Re4 + B(0,3)Re 5
BomaRe2 + maRe3 + B(1,2)ctRe4 + B(1 , 3)ctRe5
13(2 ,0)oc2Re2 + B(2,0 1 a2Re3+13(2,2)a2Re4 +
B(2,3)a2Re5 + Boma 3Re2 +13(3,0a 3Re3 +
13(3,2)a3Re4 + B(3,3)a 3Re5 +13(4,0)a4Re2 +
+ 13(4,2)cc4Re4 +13(4,3)oc4Re5 + Bomcc4Re3
B(5,0)a5Re2 +13(5,0a 5Re3 +13(5,2)a5Re4 +
B(5 , 3 )cc5Re5 (D.10)
where B are numbers taken from Table D-2. With the known values of fl and C2,
Equations (D.4) and (D.10) can be now solved for the probe angle and probe
Reynolds number. Velocity is calculated from the probe Reynolds number by using
equation (D.7). The Newton-Raphson Iteration method for the system of non-linear
equations was employed for this solution. An application program (program
UCpct.m) written in was used to desire the flow angle and velocity from the probe
measurements.
D.4 Error of fitted surface
In order to assess the error in the calibration process, the probe Reynolds number and
probe angle were substituted into (D.4), (D.5) and (D.6) to obtain fl, £2 and f3 at
various positions over the calibration range. The difference between the calculated
values and real measured data for fl, £2 and f3 is show in Figures D-4, D-5 and D-6,
respectively.
The fl and £2 values of probe angle and Reynolds number calibration range were
substituted into Equations (D.7) and (D.10) to obtain the calculated probe angle and
air velocity. The errors of probe angle (difference between calculated angle and real
angle at the same fl and f2) and air velocity are shown in Figures D-7 and D-8.

278 Appendix D.
Probe Angle (Degree) -20 Re
As.erage Rms error of 'VI is 0.006035
........
•........ .............
........
0.
0.01-- .......... ...
.
....
-0.01 .................
... ..........
.............
.............
...
. . ....
...... ..
.................. . ................... .. . ........
. .. ...... . .....
.. . . .....
..
..... .............................. •••••••• ..
. ... .... ....
•••••••••••••••
•
.... ............
....... . ................
2000
.......
... .
6000 -10 4000
...... ....
.. .... S
10000 8000
-0.02- ....... ......
-0.03 ......... 20
10
0.03-......
20
.. 1. ...................
....
...............
............... .................................... .........
...........
.................. ..........
...........
... ................................
...................
........... .............. .
...... .....
• -•• ..
............ ........
.. ....
............ .
....... ..................... ....... ••••••••••• .......... .....
..
......... ............... .....
.. 10
...... ....
.............. .................
...... .........
..... ..... ............................. ......................................... .......................... ................ ...... .....................
•...... ..... . ........... ........
.......... - ......
-..1...-.... .............. ..
6000 8000
.........
Figure D-4 Error of fl Average Rms error of f2 is 0.0062111
........
..
10000
10000
-10 2000 4000
Probe Angle (Degree) -20 Re
Figure D-5 Error of £2 Average Rms error of f3 is 0.0017526
..... ..... 1
....... ..... .r
6
....................... 11. ................................... 1-1.111 ... ... ............... .... ..
, . .................
x 10-3
tb s.
0 - • : .. ......... . . 1
A. -4
.. . . . , . . ....... .1.11 .. ..... .. .... ................. it, ................................
......... ii .......
..I ................. i
.. . 1 .
..... .1
_221 ............ .r . 1
................ 1 .................. 1 4
I .......... .!
...................... .1.1 ..... . . . . . .. . . . .. .. .. .. .. . . . . .. ..1 .. .. ........................... 0
20
-6 si.. .........
.. •
... 11. ........
1
..... •••• . ................ .........,<.. .............
... .. ...... • ....... .. .... 10 ... 1 ........................... ..„ ....... .......
...... ........ .. —
2000 Probe Angle (Degree)
-20 Re
Figure D-6 Error of 0

Appendix D. 279
Average Rms error of Angle is 0.13974 °
10000
Robe Angle (Degree) -20 Re
Figure D-7 Error of Calibration Angle
Average Rms error of Air Velocity is 0.02234 ms -1
10000
Probe Angle (Degree) -20 Re
Figure D-8 Error of Air Velocity

Appendix E. 280
Appendix E.
Experimental Results of Paddy Grain and Silica Gel Particle
Drying and
Initial Conditions for Cyclone Dryer Simulations

Table E.1 Experimental results of paddy drying in three-chamber cyclone dryer
TEST F,, T.
C
T.„
° C
Iti;
kg/kg
M„
Kg/kg
T.
° C
T.,
° C
FV,
kg/kg
W„
kg/kg
F.
kg/s
MR
% d h .
Nu Sh SPEC
MJ/ kg Water
1 0.0298 22.00 43.69 0.32822 0.30122 63.39 46.01 0.00758 0.01182 0.2027 2.40 0.22583 0.00566 10.75
2 0.0298 22.40 52.21 0.32192 0.29253 75.27 54.24 0.00757 0.01219 0.1925 2.94 0.21072 0.00597 12.39
3 0.0298 22.60 57.72 0.32299 0.28489 57.44 60.48 0.00773 0.01341 0.1868 3.81 0.18256 0.00772 11.28
4 0.0298 24.00 48.02 0.34006 0.31430 62.57 49.74 0.00670 0.01041 0.2162 2.58 0.21582 0.00551 11.86
5 0.0298 24.40 53.99 0.34028 0.30691 75.10 55.75 0.00684 0.01131 0.2060 3.34 0.21723 0.00601 11.29
6 0.0298 24.60 60.28 0.34110 0.29826 57.26 62.71 0.00693 0.01279 0.1989 4.28 0.18419 0.00774 10.38
7 0.0298 21.00 46.25 0.41572 0.37662 59.64 47.36 0.00743 0.01229 0.2325 3.91 0.25548 0.00722 8.40
8 0.0298 21.60 54.03 0.41781 0.36927 70.78 55.12 0.00768 0.01461 0.2239 4.85 0.23103 0.01009 8.22
9 0.0298 21.70 62.28 0.42197 0.35572 82.32 63.99 0.00777 0.01602 0.2176 6.63 0.17645 0.01186 7.14
10 0.0411 23.70 40.70 0.35700 0.33555 61.13 44.72 0.00969 0.01368 0.2262 2.15 0.18988 0.00467 10.41
11 0.0411 23.00 46.88 0.35692 0.32818 74.40 52.06 0.00919 0.01479 0.2094 2.87 0.14874 0.00612 9.71
12 0.0411 23.40 47.67 0.35828 0.32615 58.55 57.80 0.00945 0.01595 0.2079 3.21 0.11271 0.00706 10.34
13 0.0411 20.60 38.94 0.36111 0.33547 60.42 45.13 0.00547 0.00979 0.2223 2.56 0.14154 0.00502 9.13
14 0.0411 20.70 45.98 0.35289 0.32202 72.17 53.42 0.00548 0.01111 0.2328 3.09 0.12370 0.00678 10.09
15 0.0411 20.00 50.16 0.36082 0.32598 80.95 58.55 0.00594 0.01238 0.2245 3.54 0.11065 0.00756 9.97
16 0.0411 21.00 42.01 0.31494 0.30574 57.34 44.82 0.00632 0.00791 0.2401 0.92 0.18141 0.00194 22.80
17 0.0411 20.80 43.45 0.36007 0.33514 70.99 50.30 0.00629 0.01073 0.2260 2.49 0.14203 0.00523 11.94
18 0.0411 20.80 47.79 0.31518 0.29176 82.46 57.04 0.00630 0.01107 0.2146 2.34 0.11332 0.00534 14.67
19 0.0611 21.50 38.69 ' 0.42576 0.39759 61.41 40.58 0.00735 0.01590 0.2059 2.82 0.12371 0.00433 4.41
20 0.0611 21.50 41.04 0.42859 0.39470 75.53 44.73 0.00728 0.01671 0.2174 3.39 0.11416 0.00547 5.06
21 0.0611 21.60 43.05 0.42369 0.38814 86.07 49.90 0.00727 0.01829 0.1916 3.55 0.06194 0.00455 6.01
22 0.0611 20.20 38.17 0.38578 0.36112 58.01 42.86 0.00918 0.01514 0.2422 2.47 0.11271 0.00495 6.27
23 0.0611 20.20 43.19 0.39075 0.36623 70.48 48.04 0.00936 0.01400 0.2175 2.45 0.08978 0.00502 7.82
24 0.0611 20.40 43.92 0.38835 0.36192 78.32 50.27 0.00978 0.01656 0.2222 2.64 0.08909 0.00463 8.47
25 0.0611 20.20 38.28 0.38683 0.36129 59.58 41.25 0.00623 0.01307 0.2302 2.55 0.13391 0.00509 6.36
26 0.0611 22.60 41.37 0.38361 0.36260 67.31 45.45 0.00907 0.01390 0.2469 2.10 0.13686 0.00356 9.32
27 0.0611 20.40 45.36 0.38344 0.35117 80.74 52.21 0.00557 0.01433 0.2406 3.23 0.09798 0.00691 7.84 00

Table E.2 Experimental results of paddy drying in four-chamber cyclone dryer
TEST F.
lo, Is
T,
° C ° C
M,
1cP/kp
M.
Kp/kp
T.
° C '
T.,
° C
Ir, kP/kP
W.
kp/kP
F,.
kP/s
MR
% db.
Nu Sh SPEC
MR kp Water
1 0.0298 23.60 45.41 0.32870 0.29925 63.30 49.34 0.00516 0.00912 0.2090 2.95 0.14254 0.00440 9.40
2 0.0298 23.40 50.04 0.32259 0.28929 75.67 56.99 0.00510 0.01018 0.2038 3.33 0.10916 0.00556 9.89
3 0.0298 23.40 63.67 0.32817 0.29402 84.67 65.07 0.00514 0.01195 0.2052 4.42 0.14646 0.00749 11.27
4 0.0298 24.10 50.75 0.27194 0.24149 64.54 52.21 0.00726 0.01149 0.2112 3.04 0.16107 0.00461 12.16
5 0.0298 24.40 53.70 0.26471 0.23368 76.73 60.59 0.00730 0.01188 0.2020 3.10 0.09101 0.00486 11.74
6 0.0298 24.60 65.52 0.26524 0.22881 88.99 68.09 0.00755 0.01325 0.1944 3.64 0.11708 0.00593 11.06
7 0.0298 24.80 49.20 0.20908 0.19366 63.50 51.31 0.01038 0.01246 0.2212 1.54 0.15152 0.00227 20.50
8 0.0298 25.00 59.12 0.21043 0.19129 76.67 61.05 0.01033 0.01282 0.2111 1.91 0.13144 0.00264 20.64
9 0.0298 25.50 63..51 0.20729 0.18124 88.49 66.03 0.01059 0.01438 0.2060 2.60 0.13081 0.00396 21.71
10 0.0411 23.00 43.35 0.30565 0.28615 60.50 46.78 0.00868 0.01212 0.2129 1.95 0.13483 0.00322 10.81
11 0.0411 23.20 51.18 0.29547 0.27043 71.15 52.57 0.00853 0.01380 0.2112 2.50 0.16678 0.00490 10.52
12 0.0411 23.40 49.47 0.32307 0.28917 83.25 58.12 0.00808 0.01509 0.2053 3.39 0.09636 0.00646 9.34
13 - - - - - - - - - - - - -
14 0.0411 24.20 53.21 0.31571 0.30402 74.51 54.94 0.01066 0.01301 0.2033 1.17 0.15257 0.00215 3.66
15 0.0411 23.80 55.25 0.38807 0.33095 86.29 59.62 0.01068 0.02135 0.2148 5.71 0.12615 0.01032 6.07
16 0.0411 23.80 44.60 0.35109 0.32526 60.78 45.72 0.01130 0.01573 0.2297 2.58 0.21791 0.00439 8.82
17 0.0411 23.80 51.64 0.35321 0.31919 74.10 53.67 0.01125 0.01784 0.2164 3.40 0.16152 0.00633 9.61
18 0.0411 23.90 57.22 0.35125 0.31406 84.42 60.85 0.01136 0.01936 0.2117 3.72 0.12063 0.00758 8.96
19 0.0611 22.20 39.02 0.26519 0.25064 61.02 41.96 0.00663 0.01096 0.2097 1.46 0.13567 0.00291 11.22
20 0.0611 22.20 44.59 0.26044 0.24492 76.79 49.03 0.00657 0.01174 0.1922 1.55 0.09877 0.00310 9.80
21 0.0611 22.60 50.41 0.26687 0.24455 87.13 58.42 0.00666 0.01343 0.1843 2.23 0.06249 0.00380 8.20
22 0.0611 22.30 39.97 0.26581 0.25741 59.26 43.33 0.00812 0.01025 0.2258 0.84 0.12545 0.00155 17.79
23 0.0611 22.00 46.04 0.26709 0.25472 72.29 49.56 0.00794 0.01213 0.1983 1.24 0.10184 0.00263 14.19
24 0.0611 22.30 50.97 0.26766 0.24682 87.47 55.25 0.00817 0.01554 0.1903 2.08 0.08925 0.00436 10.34
25 0.0611 24.20 38.79 0.37727 0.35856 60.42 41.48 0.01013 0.01496 0.2339 1.87 0.16588 0.00363 8.17
26 0.0611 23.90 42.03 0.38506 0.36244 71.58 45.75 0.00998 0.01472 0.2203 2.26 0.13393 0.00133 8.23
27 0.0611 23.80 47.39 0.37284 0.34805 85.51 52.34 0.00993 0.01677 0.2151 2.48 0.10802 0.00465 8.49 00

Table E.3 Experimental results of silica gel drying in three-chamber cyclone dryer
TEST F.
kg/s
T.,
° C
T..
° C
M,
kPlkg
M.
Ku/kg
T.
° C
T,.
° C
W,
kolkP
W.
kplko
F.
kuls
MR
% db.
Nu Sh SPEC
M.I/ kg Water
1 0.0585 21.50 44.18 0.25688 0.23564 63.78 44.40 0.01132 0.01727 0.2000 2.12 0.21626 0.0039 6.39
2 0.0585 19.40 44.73 0.25203 0.22426 73.25 45.17 0.00838 0.01642 0.1789 2.60 0.15570 0.00457 6.17
3 0.0585 21.10 51.56 0.25530 0.21138 84.60 52.74 0.01122 0.02503 0.1940 4.39 0.13016 0.00837 5.07
4 0.0585 19.70 38.61 0.26565 0.24023 57.80 40.54 0.00659 0.01267 0.2434 2.54 0.18604 0.00577 6.80
5 0.0585 20.00 44.15 0.25836 0.23112 69.83 46.26 0.00648 0.01300 0.2429 2.72 0.17025 0.00605 7.10
6 0.0585 19.20 44.30 0.25927 0.22970 76.11 47.30 0.00622 0.01360 0.2473 2.96 0.16124 0.00699 7.45
7 0.0585 21.40 39.46 0.26133 0.23260 58.62 40.94 0.00707 0.01339 0.2484 2.87 0.21135 0.00552 6.05
8 0.0585 21.00 44.26 0.25885 0.22464 70.47 46.30 0.00684 0.01500 0.2504 3.42 0.18231 0.00738 5.92
9 0.0585 24.00 49.27 0.25251 0.20889 81.63 51.52 0.01088 0.02163 0.2265 4.36 0.15228 0.00707 5.48
10 0.0433 21.80 40.07 0.21731 0.19844 61.24 42.47 0.00604 0.00985 0.2134 1.89 0.20810 0.00374 11.15
11 0.0433 21.20 43.68 0.24070 0.20616 72.02 47.30 0.06632 0.01428 0.2032 3.45 0.16725 0.00782 7.37
12 0.0433 22.00 48.12 0.23265 0.18920 85.67 53.22 0.00604 0.01521 0.1912 4.35 0.13475 0.00806 6.84
13 0.0433 19.80 38.98 0.25341 0.23196 58.19 39.59 0.00600 0.00998 0.2299 2.15 0.33476 0.00475 10.35
14 0.0433 20.20 43.74 0.25493 0.21688 68.28 44.85 0.00622 0.01333 0.2186 3.81 0.25513 0.00796 6.86
15 0.0433 20.60 46.64 0.24946 0.21087 80.13 49.20 0.00628 0.01406 0.2105 3.86 0.19269 0.00821 9.00
16 0.0433 23.40 38.50 0.24129 0.22122 60.10 39.93 0.00779 0.01152 0.2411 2.01 0.30500 0.00364 12.65
17 0.0433 21.20 42.42 0.24598 0.22040 68.95 43.66 0.00706 0.01141 0.2528 2.56 0.29257 0.00505 11.76
18 0.0433 21.20 46.54 0.24834 0.21281 79.40 50.27 0.00704 0.01324 0.2524 3.55 0.19136 0.00720 10.19
19 0.0256 22.00 42.65 0.26918 0.21027 58.38 42.85 0.00715 0.01379 0.2272 5.89 0.49917 0.00935 5.96 20 0.0256 21.40 46.48 0.25633 0.19757 70.23 48.96 0.00693 0.01360 0.2187 5.88 0.24909 0.00652 7.00
21 0.0256 21.80 52.59 0.26067 0.18174 84.13 56.15 0.00722 0.01591 0.2187 7.89 0.20962 0.01211 7.13
22 0.0256 23.80 45.92 0.24848 0.20571 59.96 46.60 0.01056 0.01525 0.2372 4.28 0.33278 0.00599 8.59
23 0.0256 21.60 47.68 0.25016 0.18234 67.89 50.00 0.00728 0.01481 0.2365 6.78 0.23937 0.01108 6.79
24 0.0256 21.50 53.37 00.24860 0..16915 79.90 56.80 0.00714 0.01638 \ 0.2272 7.95 0.19563 0.01335 6.94
25 0.0256 19.70 45.68 0.23087 0.15647 57.43 46.01 0.00773 0.01190 0.2519 4.44 0.39829 0.00713 9.18
26 0.0256 21.60 51.34 0.22934 0.17307 68.94 52.68 0.00854 0.01439 0.2387 5.63 0.24389 0.00857 8.49
27 0.0256 20.80 58.81 0.23234 0.15881 81.19 60.80 0.00783 0.01600 0.2338 7.35 0.19489 0.01248 8.01
CD
("J 00

Table E.4 Experimental results of silica gel drying in four-chamber cyclone dryer
TEST F.
ko3Is
T.;
° C
7'..
° C
M:
li9/1m
M.
Kp/kp
T.
° C
T,.,
° C
W:
Ico/kP
W.
im/kg
F.
ko/s
MR
% db.
Nu Sh SPEC
MN ko Water
1 0.0585 22.00 40.62 0.24865 0.22191 60.02 41.18 0.00683 0.01395 0.2376 2.67 0.26061 0.00543 6.25
2 0.0585 22.00 44.51 0.24926 0.21169 72.24 46.36 0.00671 0.01887 0.1949 3.76 0.13144 0.00692 4.77
3 0.0585 22.20 50.30 0.24963 0.020103 90.79 52.22 0.00675 0.02180 0.1999 4.86 0.12969 0.00899 5.08
4 0.0585 23.60 40.50 0.21481 0.21274 62.08 41.51 0.00825 0.01550 0.2414 2.91 0.24320 0.00533 5.95
5 0.0585 24.00 43.85 0.23868 0.20749 72.98 46.27 0.00801 0.01624 0.2275 3.12 0.16656 0.00546 6.56
6 0.0585 24.10 48.82 0.23292 0.19614 85.74 51.30 0.00802 0.01788 0.2171 3.68 0.14478 0.00700 6.61
7 0.0585 21.80 39.52 0.23753 0.21700 58.56 41.05 0.00742 0.01241 0.2378 2.05 0.19943 0.00403 8.03
8 0.0585 22.40 44.04 0.23782 0.20920 69.28 46.37 0.00770 0.01425 0.2427 2.86 0.17019 0.00545 6.33
9 0.0585 22.60 47.85 0.24702 0.21271 83.86 49.93 0.00792 0.01759 0.2061 3.43 0.13965 0.00597 5.82
10 0.0433 22.00 41.91 0.23330 0.20907 58.73 43.19 0.00816 0.01303 0.2201 2.42 0.23151 0.00486 5.19
11 0.0433 24.80 47.57 0.23932 0.20173 75.41 51.70 0.01142 0.01856 0.2150 3.79 0.15669 0.00586 7.14
12 0.0433 24.80 54.91 0.27058 0.21975 90.58 56.38 0.01144 0.02344 0.1794 5.08 0.17239 0.00818 5.04
13 0.0433 22.90 44.00 0.25505 0.22277 69.78 44.56 0.01086 0.01687 0.2270 3.23 0.28027 0.00583 6.56
14 0.0433 23.50 49.00 0.26012 0.21123 70.27 50.58 0.01108 0.02050 0.2248 4.89 0.20107 0.00874 4.76
15 0.0433 24.00 54.82 0.25632 0.19810 81.03 56.06 0.01163 0.02277 0.2246 5.82 0.20238 0.00999 4.96
16 0.0433 21.60 42.71 0.26402 0.23005 59.32 43.03 0.01037 0.01632 0.2380 3.40 0.34616 0.00650 6.71
17 0.0433 22.20 46.46 0.25926 0.22398 68.97 47.66 0.01074 0.01717 0.2348 3.53 0.24474 0.00669 7.79
18 0.0433 21.60 48.79 0.25923 0.22133 80.44 51.50 0.01064 0.01788 0.2100 3.79 0.17956 0.00717 8.07
19 0.0256 23.70 47.23 0.18825 0.15249 61.26 48.32 0.01035 0.01448 0.2134 3.60 0.25248 0.00490 8.90
20 0.0256 23.80 54.27 0.17632 0.14174 71.08 55.47 0.01019 0.01423 0.2128 3.46 0.21582 0.00473 10.44
21 0.0256 23.60 53.79 0.24624 0.15893 80.31 46.71 0.01020 0.01978 0.2152 8.73 0.20713 0.01174 5.80
22 0.0256 21.90 46.84 0.18147 0.15347 59.82 47.61 0.00699 0.01019 0.2288 2.80 0.27203 0.00441 10.73
23 0.0256 22.00 50.65 0.18649 0.14448 68.86 52.15 0.007111 0.01210 0.2240 4.20 0.23305 0.00677 9.05
24 0.0256 22.20 55.63 0.18682 0.13113 81.50 59.92 0.00656 0.01379 0.2119 5.57 0.15592 0.00975 9.39
25 0.0256 21.60 46.25 0.19768 0.15263 57.79 46.83 0.00817 0.01280 0.2422 4.51 0.29078 0.00676 7.85
26 0.0256 22.00 50.67 0.20081 0.14399 66.41 51.87 0.00835 0.01472 0.2383 5.68 0.24129 0.00899 7.91
27 0.0256 21.60 57.05 0.19531 0.13720 79.59 59.21 0.00821 0.01517 0.2282 6.26 0.19497 0.00982 8.84
'CS
CD
00

Table E.5 Summary of simulation cases for silica gel drying in three chamber cyclone dryer
TEST F..
kPls
T..
" C
M;
1(91kP
F.
kPls
T.:
° C
W;
kPlk9
Remark
4 0.0585 19.70 0.26565 0.2434 57.80 0.00659 From E.3
25 0.0256 19.70 0.23087 0.2519 57.43 0.00773 From E.3
26 0.0256 21.60 0.22934 0.2387 68.94 0.00854 From E.3
27 0.0256 20.80 0.23234 0.2338 81.19 0.00783 From E.3
1 - 0.2519 57.43 0.00773 Compare to Test 25 of E.3
2 0.0433 19.70 0.23087 0.2519 57.43 0.00773 Compare to Test 25 of E.3
3 0.0585 19.70 0.23087 0.2519 57.43 0.00773 Compare to Test 25 of E.3
5 0.0256 19.70 0.23087 0.2519 68.94 0.00773 Compare to Test 25 of E.3
6 0.0256 19.70 0.23087 0.2519 81.19 0.00773 Compare to Test 25 of E.3
8 0.0256 19.70 0.20988 0.2519 57.43 0.00773 Compare to Test 25 of E.3
9 0.0256 19.70 0.40000 0.2519 57.43 0.00773 Compare to Test 25 of E.3

Table E.6 Summary of simulation cases for silica gel drying in three chamber cyclone dryer
TEST F.
kalc
T.,
° C
AL
kalka
F.
kals
T.:
° C
W:
kalka
Remark
10 0.0433 22.00 0.23330 0.2201 58.73 0.00816 From E.4
22 0.0256 21.90 0.18147 0.2288 59.82 0.00699 From E.4
23 0.0256 22.00 0.18649 0.2240 68.86 0.00711 From E.4
24 0.0256 22.20 0.18682 0.2119 81.50 0.00656 From E.4
11 - - - 0.2288 59.82 0.00699 Compare to Test 25 of E.4
12 0.0433 21.90 0.18147 0.2288 59.82 0.00699 Compare to Test 25 of E.4
14 0.0585 21.90 0.18147 0.2288 59.82 0.00699 Compare to Test 25 of E.4
15 0.0256 21.90 0.18147 0.2288 68.86 0.00699 Compare to Test 25 of E.4
16 0.0256 21.90 0.18147 0.2288 81.50 0.00699 Compare to Test 25 of E.4
17 0.0256 21.90 0.23330 0.2288 59.82 0.00699 Compare to Test 25 of E.4
18 0.0256 21.90 0.40000 0.2288 59.82 0.00699 Compare to Test 25 of E.4