
1997 ANNUAL TROPICAL CYCLONE REPORT
263
1997 ANNUAL TROPICAL CYCLONE REPORT JOINT TYPHOON WARNING CENTER
-
Upload
khangminh22 -
Category
Documents
-
view
0 -
download
0
Transcript of 1997 ANNUAL TROPICAL CYCLONE REPORT

1997ANNUAL TROPICALCYCLONE REPORT
JOINT TYPHOON WARNING CENTER

COVER PHOTO: Super Typhoon Oliwa (02C), as seen by 2034Z visible GMS imagery on9 September. The small comma shaped cloud on the inside of the eyewall is a possiblemanifestation of an eyewall mesovortex.
U.S. Naval Pacific Meteorology and Oceanography Center WestJoint Typhoon Warning Center
C. P. DILLONCaptain, United States Navy
Commanding Officer
MARK J. ANDREWSLieutenant Colonel, United States Air Force
Director, Joint Typhoon Warning Center
Work on this report was supported in part bythe Office of Naval Research Grant N00014-96-1-0744

STAFF
JOINT TYPHOON WARNING CENTER
LCOL MARK ANDREWS USAF DIRECTOR * LCDR ERIC J. TREHUBENKO USN TDO, DEPUTY DIRECTOR LCDR KENNETH A. MALMQUIST USN TDO, DEPUTY DIRECTOR MR FRANK H. WELLS CIV TECHNICAL ADVISOR **LCDR STACY R. STEWART USNR TDO LCDR MARGARET A. SMITH USN TDO *LT MICHAEL S. KALAFSKY USN TDO *CAPT CARL A. MCELROY USAF TDO***CAPT CHRISTOPHER T. NICKLAS USAF TDO LT KIM F. BOYER USN TDO CAPT STEPHEN B. COCKS USAF TDO *CAPT GARY B. KUBAT USAF TDO *CAPT WILLIAM J. CARLE USAF TDO, STATISTICS OFFICER LT PAULA E. HILDEBRAND USN TDO CAPT TOM D. LUNSFORD USAF TDO CAPT CHRISTOPHER FINTA USAF TDO MSGT BRENT T. SULLINS USAF TDO AG1 PAUL G. SANCHEZ USN LPO, SAT FORECASTER, TDA A1C JASON R. DOBBINS USAF TDA AG2 KEYIA HALL USN TDA AG2 BRYAN Y. HONG USN TDA AG3 JOHN E. UROGI USN TDA AG3 CAROL A. GILL USN TDA SRA SAMUEL R. PUGH USAF TDA SRA DIONNE M. TIRSCHEL USAF TDA SRA MATHEW A. BOYD USAF TDA SRA RYAN M. EIBLING USAF SAT FORECASTER,PROGRAMMER SRA CHRISTOPHER L. JONES USAF TDA AGAR STEPHEN R. BACON USN TDA
36 OSS/OSJ
MAJ ROGER T. EDSON USAF TECHNIQUE DEVELOPMENT *CAPT RICHARD A. ANSTETT USAF TDO, OIC USPACOM SAT NETWORK MSGT RONALD L. HOOVER USAF SAT FORECASTER, NCOIC *TSGT SHIRLEY A. BROWN USAF CHIEF INFORMATION MANAGEMENT TSGT ROBERT P. MOTZ USAF CHIEF INFORMATION MANAGEMENT *TSGT DENNIS W. MILLER USAF SAT FORECASTER TSGT ROBERT J. PATTERSON USAF SAT FORECASTER *SSGT MERRYRUTH I. DEOCARIZA USAF SAT FORECASTER *SSGT LINDA R. HAM USAF SAT FORECASTER SSGT GARTH A. MCCULLUCH USAF SAT FORECASTER SSGT IRA L. JOHNSON USAF SAT FORECASTER *SSGT BRUCE W. WOFFORD USAF SAT FORECASTER *SSGT MELISSA E. HATFIELD USAF SAT FORECASTER *SSGT CRAIG S. BOUCHILLON USAF DATA DEVELOPMENT *SRA SEAN M. MCDUNN USAF DATA DEVELOPMENT
UNIVERSITY OF GUAM/JTWC RESEARCH LIAISON
DR MARK A. LANDER TROPICAL CYCLONE RESEARCH, TECHNICAL WRITING MR CHARLES P. GUARD TROPICAL CYCLONE RESEARCH, TECHNICAL WRITING
* TRANSFERRED DURING 1997** ACTIVE DUTY TRAINING*** DECEASED

iii
FOREWARD
The Annual Tropical Cyclone Report isprepared by the staff of the JointTyphoon Warning Center (JTWC), acombined Air Force/Navy organization.In 1997, the period covered by thisreport, JTWC operated under thecommand of the Commanding Officer,U.S. Naval Pacific Meteorology andOceanography Center West(NAVPACMETOCCEN WEST)/JointTyphoon Warning Center, Guam. Asthis is being written, however, in Januaryof 1999, JTWC has just completedtransition from Guam to Pearl Harbor,Hawaii, as mandated by the 1995 BaseRealignment And Closing Commission(BRAC). JTWC now operates under thecommand of the Commanding Officer,U.S. Naval Pacific Meteorology andOceanography Center(NAVPACMETOCCEN)/Joint TyphoonWarning Center, Pearl Harbor, Hawaii.This move brings to an end the fortyyear history of JTWC on Guam, whichbegan on 01 May 1959 when the U.S.Commander-in-Chief Pacific(USCINCPAC) forces directed that asingle tropical cyclone warning center beestablished for the western North Pacificregion. However, our customers cananticipate the same dedicated supportthey have come to expect from our newlocations. The operations of JTWC areguided by USCINCPAC Instruction3140.1W. The mission of JTWC is multifacetedand includes:
1. Continuous monitoring of alltropical weather activity in theNorthern and SouthernHemispheres, from 180 eastlongitude westward to the eastcoast of Africa, and the promptissuance of appropriate
advisories and alerts whentropical cyclone developmentis anticipated.
2. Issuance of warnings on allsignificant tropical cyclones inthe above area ofresponsibility.
3. Determination of requirementsfor tropical cyclonereconnaissance and assignmentof appropriate priorities.
4. Post-storm analysis ofsignificant tropical cyclonesoccurring within the westernNorth Pacific and North IndianOceans.
5. Cooperation with the NavalResearch Laboratory,Monterey, California onevaluation of tropical cyclonemodels and forecast aids, andthe development of newtechniques to support forecastrequirements.
Special thanks to: the men andwomen of the Alternate Joint TyphoonWarning Center (AJTWC) for standingin for JTWC as needed (AJTWC willmove to Yokosuka, Japan, as part of theBRAC relocation); Fleet NumericalMeteorology and Oceanography Center(FNMOC) for their operational support;the Naval Research Laboratory for itsdedicated research; the Air ForceWeather Agency (AFWA) and NationalOceanic and AtmosphericAdministration (NOAA) NationalEnvironmental Satellite, Data, andInformation Service (NESDIS) forsatellite support; the 36th
Communications Squadron’s DefenseMeteorological Satellite Program(DMSP) Site 18 at Nimitz Hill, Guam(which will soon move to Andersen Air

iv
Force Base as part of BRAC), and theOperations and Equipment Supportdepartments of bothNAVPACMETOCCEN WEST, Guamand NAVPACMETOCCEN PearlHarbor, Hawaii, for their high qualitysupport; all the men and women of theships and facilities ashore throughout theJTWC area of responsibility (AOR), andespecially on Guam, who took theobservations that became the basis forour analyses, CDR (Ret) Lester E. CarrIII and Dr. Russell L. Elsberry for theircontinuing efforts at the NavalPostgraduate School and their furtherwork on the Systematic and IntegratedApproach to Tropical Cyclone TrackForecasting; Dr. Robert F. Abbey Jr andthe Office of Naval Research for theirsupport to the University of Guam(UOG) for the Research Liaisons toJTWC; the UOG Research Liaisons fortheir contributions to this publication;Dr. Mark A. Lander for his trainingefforts, suggestions and valuableinsights, and Mr. Charles P. Guard for
his support and data collection efforts;Dr. Jeff D. Hawkins, Chris S. Veldon,Samuel Chang and Roger Weldon fortheir continuing efforts to exploit remotesensing technologies in new andinnovative ways; Mr. Charles R. “Buck”Sampson, Sally A. Calvert (who sadlyleft the team in 1998 to pursue otheropportunities-she will be missed),Rosemary Lande, Mike D. Frost, MugurGeorgescu, Daren H. Grant, and Ann J.Schrader for their support and continueddevelopment of the Automated TropicalCyclone Forecasting (ATCF) system;SRA Ryan Eibling of the JTWC staff,who used his advanced knowledge ofsoftware development to solve toughautomation problems; and, LCDRKenneth Malmquist, LCDR MargretSmith, LT Kim Boyer, Frank H. Wells,Mark A. Lander, Charles P. Guard, AG2Keyia Hall, and AG2 Bryan Hong fortheir editing, desktop publishing, webpublishing, and computer graphics,without which this document would nothave been possible.

v
EXECUTIVE SUMMARY
The Joint Typhoon Warning Center(JTWC), Guam worked very hard in 1997 toimprove its data management processes. Ourgoal is to get the raw environmental data in-house, processed, and then displayed, inorder to create finished products - warning,alert, advisory, prognostic reasoning - out(of house) to you, the user, faster, moreefficiently, and with supporting, easilyunderstood graphics. The use of theNPMOCW/JTWC Guam web site hasrevolutionized our ability to generateproducts that can be rapidly accessed. Thegrowth of the JTWC home page has beennothing less than phenomenal -- as SuperTyphoon Paka approached Guam, the website received 107,000 "hits" in a 24-hourperiod. We realize this doesn't replace ourprimary distribution methods, butsignificantly augments our currentcapability.We've been busy this year, but so have thetropical cyclones (TCs). In the WesternNorth Pacific, thirty-three significant TCsoccurred, two above the 37-year average of31. Of these, 11 became super typhoons,which was a record - the 37-year average isfour with seven being the previousmaximum. Therefore, 1997 became the yearof the super typhoon. Two of these supertyphoons - Oliwa and Paka - were"borrowed" from the Central Pacific. InSeptember, Oliwa passed through thenorthern Marianas and recurved over Japan,which was unusual for a Central Pacificcyclone. In December, Paka brushed byKwajalein and Majuro before clobberingGuam.Mean forecast track errors in 1997 continuedto fall to lower values: 93 nm, 164 nm, and247 nm at 24, 48, and 72 hours respectively- a new record. We are proud of thesenumbers, especially in light of continual
manning shortages. However, these valuesare still a long way from the goals stated byCOMNAVFOR JAPAN, Admiral McKay,at the 1984 Annual Tropical CycloneConference of 50, 100, and 150 nm. It issobering to note a few of this year'srecurving track forecasts still had individualforecast errors in excess of 1000 nm. Thebottom line is that there's still a lot whichneeds to be accomplished, particularly in theareas of numerical guidance, remotesensing, basic research and tropical cyclonestructure and structure change.For the North Indian Ocean, four significantTCs occurred - one less than the 21-yearaverage of five. The Southern HemisphereTC-year (1 July 1996 - 30 June 1997) had abumper crop of 38, which exceeds therecord of 35 set in 1985, and is 11 more thanthe 15-year average of 27. Of interest, noneof these TCs in the North Indian Ocean andSouthern Hemisphere reached super typhoonintensity.The total number of JTWC warningsprovides a measure of our workload. During1997 there were 950 in the Western NorthPacific (15-year average 712), 56 in theNorth Indian Ocean (15-year average 58),and 566 Southern Hemisphere (15-yearaverage 263). Adequate JTWC manning,resources, and communications are criticalto surmounting the challenge presented byyears with above average workload.Looking ahead, we're trying to speed up thedelivery of our post-analysis products to youby providing them in electronic form:HTML and PDF. This product will beavailable via the World Wide Web andcompact diskette (CD). For instance, thedocument that follows was assembled inHTML for the Guam web site. It is theTropical Cyclone Summary, which providesbasic statistical data for the TC-year in

vi
review. This document will be expandedwith narratives, images, and climatology asthey are developed, to become in final formChapter 3 of the 1997 Annual TropicalCyclone Report (ATCR). In this way, ATCRchapters can be built and made available onthe Internet as they are finished, without thedelays of having to wait for the finalcomplete manuscript to be printed or"burned" into a CD. Our intent in providinga PDF version of the final document alongwith the HTML format is to allow you tolocally produce a suitable printed version ifdesired. However, we realize that there willbe a few users out there without thecapability to do this, and we will be glad toprint a copy for you on request.I would be remiss if I didn't stop to thank themembers of the JTWC "team", from theresearchers providing us an ever increasingamount of precious weather data and newforecast techniques, to the 32 Air Force andNavy civilian and military personnel whohave tirelessly worked overtime withoutcomplaint, and for the outstandingperformance achieved this past year, eventhough we faced many difficult situations.To the ultimate end user of our products, theoperational units both ashore and afloat, wepledge to keep our eyes and ears open as towhat types of products you want, when youwant it, and how you want it delivered. Werealize without your support we wouldn'thave a reason for existence.In closing, there will be plenty going on andmore changes planned for 1998. However atJTWC we will never lose sight of the factthat, "the forecast is our only product."
LCOL Mark AndrewsDirector, JTWCJan,1998

vii
TABLE OF CONTENTS
FORWARD ................................ ................................ ................................ ............. iiiEXECUTIVE SUMMARY................................ ................................ ........................ v1. OPERATIONAL PROCEDURES................................ ................................ ..........1 1.1 General ................................ ................................ ................................ .........1 1.2 Data Sources................................ ................................ ................................ .1 1.3 Telecommunications ................................ ................................ ..................... 3 1.4 Data Displays ................................ ................................ ............................... 6 1.5 Analyses ................................ ................................ ................................ ........7 1.6 Forecast Procedures................................ ................................ ....................... 8
2. RECONNAISSANCE AND FIXES ................................ ................................ ..... 17 2.1 General ................................ ................................ ................................ ........ 17 2.2 Reconnaissance Availability ................................ ................................ ........ 17 2.3 Satellite Reconnaissance Summary ................................ .............................. 17 2.4 Radar Reconnaissance Summary ................................ ................................ . 23 2.5 Tropical Cyclone Fix Data ................................ ................................ ........... 23
3. SUMMARY OF WESTERN NORTH PACIFIC AND NORTH INDIAN OCEAN TROPICAL CYCLONES................................ .......... 26 3.1 Annual Summary ................................ ................................ ......................... 26
Western North Pacific Tropical Cyclone Narratives
Tropical Cyclone Page01W TS Hannah .................. 4402W STY Isa....................... 4603W TS Jimmy.................... 5004W TS Kelly...................... 5105W TS Levi ....................... 5206W TY Marie .................... 5307W STY Nestor................. 5408W TY Opal ...................... 5709W TY Peter ..................... 5810W STY Rosie................... 6011W TS Scott ...................... 6112W TY Tina ...................... 6213W TY Victor.................... 6314W STY Winnie ................ 6415W TY Yule...................... 7016W TD .............................. 7017W TY Zita ....................... 76
Tropical Cyclone Page18W TY Amber...................7719W STY Bing .................. ..8120W TS Cass..................... ..8602C STY Oliwa ................. ..8721W TY David .................. ..9122W TY Fritz .................... ..9323W TS Ella ...................... ..9424W STY Ginger ............... ..9525W TS Hank.................... ..9926W TD ............................ 10027W STY IVAN................ 10128W STY JOAN................ 10129W STY KEITH .............. 10930W TY LINDA................ 11531W TY MORT ................ 11905C STY PAKA ................ 120

viii
North Indian Ocean Tropical Cyclones
Tropical Cyclone PageTC01B ................................ 128TC02B ................................ 129
Tropical Cyclone PageTC03A................................ 130TC04A................................ 131
4.. SUMMARY OF SOUTH PACIFIC AND SOUTH INDIAN OCEAN TROPICAL CYCLONES................................ ................................ ................................ ............132 4.1 General ................................ ................................ ................................ ...............................132 4.2 South Pacific and South Indian Ocean Tropical Cyclones ................................ ....................132
5. SUMMARY OF FORECAST VERIFICATION................................ ................................ ..........143 5.1 Annual Forecast Verification ................................ ................................ ...............................143 5.2 Comparison of Objective Techniques ................................ ................................ ..................143 5.3 Testing and Results ................................ ................................ ................................ .............148
6. TROPICAL CYCLONE WARNING VERIFICATION STATISTICS ................................ .........163 6.1 General ................................ ................................ ................................ ...............................163 6.2 Warning Verification Statistics ................................ ................................ ............................163
7. TROPICAL CYCLONE (TC) SUPPORT SUMMARY................................ ................................196 7.1 Southern Hemisphere Application Of The Systematic Approach To Tropical Cyclone Track Forecasting ................................ ................................ ................................ ..............196 7.2 Statistical Post-Processing Of NOGAPS Track Forecasts ................................ ....................197 7.3 Automated Tropical Cyclone Forecasting System ................................ ...............................197 7.4 SSM/I Tropical Cyclone Structure ................................ ................................ ......................197 7.5 Tropical Cyclone Scatterometer Studies................................ ................................ ..............199 7.6 Upper Tropospheric Outflow Patterns Over Several Very Intense Tropical Cyclones Of The Western North Pacific As Revealed By Soundings, Doppler Radar, And Water Vapor Winds................................ ................................ ................................ ......................200 7.7 Some Characteristics Of Tropical Cyclone Intensification As Revealed By Hourly Digital Dvorak Analysis ................................ ................................ ................................ .....201 7.8 Evaluation Of A Simple Technique For Predicting The Peak Intensity And The Timing Of Peak Intensity For Tropical Cyclones Of The Western North Pacific ..................201 7.9 A Look At Global Tropical Cyclone Activity: Basin Intercomparisons And Relationships With ENSO, QBO, And Other Large-Scale Climate Features ........................203 7.10 Techniques Incorporating SSM/I Imagery Into Dvorak Tropical Cyclone Intensity Estimates ................................ ................................ ................................ ..........................204
BIBLIOGRAPHY................................ ................................ ................................ ...........................205APPENDIX A – Definitions ................................ ................................ ................................ ............208APPENDIX B – Names for Tropical Cyclones in the Western North Pacific Ocean and South China Sea ................................ ................................ ................................ ...211APPENDIX C – Contractions ................................ ................................ ................................ ..........212APPENDIX D – Past Annual Tropical Cyclone Reports ................................ ................................ ...216

1
1. OPERATIONAL PROCEDURES
1.1 GENERAL
The Joint Typhoon Warning Center(JTWC) provides a variety of routineproducts and services to theorganizations within its area ofresponsibility (AOR) as prescribed byUSCINCPACINST 3140.1W. JTWCissues the following products:
1.1.1 SIGNIFICANT TROPICALWEATHER ADVISORY — Issueddaily, or more frequently as needed, todescribe all tropical disturbances andtheir potential for further developmentduring the advisory period. Separatebulletins are issued for the WesternPacific and the Indian Ocean.
1.1.2 TROPICAL CYCLONEFORMATION ALERT — Defines aspecific area when synoptic, satellite, orother germane data indicate developmentof a significant tropical cyclone (TC) islikely within 24 hours.
1.1.3 TROPICALCYCLONE/TROPICALDEPRESSIONWARNING — Issued periodicallythroughout each day to provide forecastsof position, intensity, and winddistribution for TCs in JTWC’s AOR.The tropical depression warning wasdropped in 1998 as a separate product.Post-1997 tropical depressions in thewestern North Pacific receive regulartropical cyclone warnings.
1.1.4 PROGNOSTIC REASONING
MESSAGE — Issued in conjunctionwith warnings for tropical cyclones, thathave potential to reach tropical storm ortyphoon strength in the western NorthPacific. This discusses the rationale forthe content of the specific JTWCwarning.
1.1.5 PRODUCT CHANGES — Thecontents and availability of the aboveJTWC products are set forth inUSCINCPACINST 3140.1W. Changesto USCINCPACINST 3140.1W as wellas JTWC products and services areproposed and discussed at the annualU.S. Pacific Command (PACOM)Tropical Cyclone Conference.
1.2 DATA SOURCES
1.2.1. COMPUTER PRODUCTSNumerical and statistical guidance areavailable from the USN Fleet NumericalMeteorology and Oceanography Center(FLENUMETOCCEN, or FNMOC) atMonterey, California. FNMOC suppliesJTWC with analyses and prognoses fromthe Navy Operational GlobalAtmospheric Prediction System(NOGAPS) via the NIPRNET packetswitched network (Internet gateway).NOGAPS products that are routinelydisseminated to JTWC include: surfacepressure and winds, upper-air winds,deep-layer-mean winds, geopotentialheight and height change, and sea-surfacetemperature. Also, additional variousatmospheric components at all standardlevels are available. These products arevalid for the 00Z and 12Z synoptic times.

2
Along with selected products from the(U.S.) National Center forEnvironmental Prediction (NCEP), theEuropean Centre for Medium-RangeWeather Forecasts (ECMWF), and theJapanese Meteorological Agency (JMA)are received as electronic files vianetworked computers, and by computermodem connections on government andcommercial telephone lines as a backupmethod for the network.
1.2.2 CONVENTIONAL DATA —These data sets are comprised of landand shipboard surface observations,enroute meteorological observationsfrom commercial and military aircraft(AIREPS) recorded within six hours ofsynoptic times, and cloud-motion windsderived from satellite data. Thisconventional data is computer plotted,and manually analyzed in the tropics forthe surface/gradient and 200-mb levels.These analyses are prepared twice dailyusing 00Z and 12Z synoptic data.
1.2.3 SATELLITERECONNAISSANCE—Meteorological satellite imageryrecorded at USAF/USN ground sites andU.S. Naval vessels supply day and nightcoverage in JTWC’s AOR.Interpretation of these satellite dataprovides TC positions and estimates ofcurrent and forecast intensities (Dvorak1984). The USAF tactical satellite sitesand Air Force Weather Agency (AFWA)currently receive and analyze SpecialSensor Microwave/Imager (SSM/I) datato provide TC locations and estimates of35-kt (18-m/sec) wind radii when thelow-level center is obscured by higherclouds
The Defense Meteorological SatelliteProgram (DMSP), NationalOceanographic and AtmosphericAdministration (NOAA), (Japanese)Geostationary Meteorological Satellite(GMS), and (European Geostationary)Meteorological Satellite (METEOSAT)provide the foundation forreconnaissance. Use of satellitereconnaissance is discussed further in theSection 2.3 Satellite ReconnaissanceSummary.
In addition to imagery, scatterometrydata from the European Remote Sensing(ERS)-2 satellite provide valuable insightas to the distribution of low-level windsaround TCs. When remotely sensed dataof this quality became available, JTWCimmediately began using it to supplementother available data. Evolution ofalgorithms and subsequent display ofscatterometer data has occurred rapidlyover the past few years and JTWC hasbeen fortunate to have access to thisleading edge technology.
JTWC retrieves scatterometry data on aroutine basis from web sites on theNIPRNET/Internet maintained byFNMOC, the Naval OceanographicOffice (NAVOCEANO), and theOceanic Sciences Branch of NOAA. Thescatterometry data available at these siteshelp to define TC position and low-levelstructure. Heavy-rain contaminationnear a TC's center limits the usefulness ofintensity estimation to tropical stormstrength and below. JTWC also usesscatterometry data to refine the twicedaily manual analyses of thesurface/gradient-level wind flow andatmospheric structure.

3
1.2.4 RADAR RECONNAISSANCE
Land-based radar observations are usedto position TCs. Once a well-defined TCmoves within range of land-based radarsites, radar reports are invaluable fordetermination of position, movement,and, in the case of Doppler radar, stormstructure and wind information. JTWC'suse of radar reports during 1997 isdiscussed in Section 2.4 RadarReconnaissance Summary.
1.2.5. AIRCRAFTRECONNAISSANCE — Until thesummer of 1987, dedicated aircraftreconnaissance was used routinely tolocate and determine the wind structureof TCs. Now, aircraft fixes are onlyrarely available from transiting jet aircraftor from weather-reconnaissance aircraftinvolved in research missions. Noaircraft fixes were available in 1997.
1.2.6. DRIFTINGMETEOROLOGICAL BUOYS — In1989, the Commander, NavalMeteorology and OceanographyCommand (COMNAVMETOCCOM)put the Integrated Drifting Buoy Planinto action to meet USCINCPACFLTrequirements that included TC warningsupport. In 1997, 30 drifting buoys weredeployed in the western North Pacific bya NAVOCEANO-contracted C-130aircraft. Of the 30 buoys, 24 wereCompact Meteorological andOceanographic Drifters (CMOD) withtemperature and pressure sensors and sixwere Wind Speed and Direction (WSD)with wind speed and direction,temperature and pressure. The buoyswere evenly split by type over two
deployments — the first in June,followed by the second in September.The purpose of the split deployment wasto overlap the expected three-monthlifespans of the CMOD buoys in order toprovide continuous coverage during thepeak of the western North Pacific TCseason.
1.2.7. AUTOMATEDMETEOROLOGICAL OBSERVINGSTATIONS (AMOS) — Through acooperative effort betweenCOMNAVMETOCCOM, theDepartment of the Interior, andNOAA/NWS to increase data availabilityfor tropical analysis and forecasting, anetwork of 20 AMOS stations is beinginstalled in the Micronesian Islands (seeTables 1-1 and 1-2). Since September of1991, in most of the sites, the capabilityto transmit data via Service ARGOS andNOAA polar-orbiting satellites has beenavailable as a backup to regular datatransmission to the GeostationaryOperational Environmental Satellite(GOES) West and, more recently forsites to the west of Guam, to the GMS.Upgrades to existing sites are beingaccomplished as opportunities arise.JTWC receives data from the AMOSsites via the Automated WeatherNetwork (AWN) under the KWBCbulletin headers SMPW01, SIPW01 andSNPW01 (SXMY10 for Tinian andRota).

4
1.3. TELECOMMUNICATIONS
Telecommunications support for theNaval Pacific Meteorological andOceanography Center West(NAVPACMETOCCEN WEST orNPMOCW)/Joint Typhoon Warning Center is provided by the Naval
Computer And TelecommunicationsStation (NCTS), Guam, and their BaseCommunications Department. The
telecommunications link to NCTS is afiber-optic cable which incorporatesseveral stand-by redundancy features.Connectivity includes “switched” secureand non-secure voice, facsimile, dataservices, and dedicated audio and digitalcircuits to NCTS. Telecommunicationsconnectivity and the basic system
configurations which are available toJTWC follow.
Table 1-1 Automated Meteorological Observing Stations Summary
Site Location Call Sign ID# System Installed Upgrade/Survey
Rota 14.2°N 145.2°E 15D16448 91221 ARC 1987 ---- Enewetak 11.4°N 162.3°E ENIP2 91251 C-MAN/ARGOS 1989 1998 Ujae* 08.9°N 165.7°E UJAP2 91365 C-MAN 1989 1999 Pagan 18.1°N 145.8°E PAGP2 91222 C-MAN/ARGOS 1990 1998 Kosrae 05.4°N 163.0°E KOSP2 91355 C-MAN/ARGOS 1990 1998 Mili 06.1°N 172.1°E MILP2 91377 C-MAN 1990 1999 Oroluk 07.6°N 155.2°E ORKP2 91343 C-MAN 1991 ---- Pingelap 06.2°N 160.7°E PIGP2 91352 C-MAN/ARGOS 1991 1999 Ulul 08.4°N 149.4°E NA 91328 C-MAN/ARGOS 1992 1999 Tinian 15.0°N 145.6°E 15D151D2 91231 ARC 1992 ---- Satawan 06.1°N 153.8°E SATP2 91338 C-MAN/ARGOS 1993 ---- Ulithi 09.9°N 139.7°E NA 91204 C-MAN/ARGOS 1995 1999 Ngulu 08.3°N 137.5°E NA 91411 C-MAN/ARGOS 1995 ---- Ebon 04.6°N 168.7°E NA 91442 C-MAN/ARGOS 1996 ---- Maloelap 08.7°N 171.2°E NA 91374 C-MAN/ARGOS 1996 ----
* Ujae site was destroyed on 18 November 1992 by Super Typhoon Gay; requires survey.
ARC = Automated Remote Collection system (via GOES West) C-MAN = Coastal-Marine Automated Network (via GOES West or GMS) ARGOS = Service ARGOS data collection (via NOAA’s TIROS-N)
Table 1-2 Proposed Automated Meteorological Observing Stations
Site LocationPulusuk 06.5°N 149.5°EFaraulep 08.6°N 144.6°EEauripik 06.7°N 143.0°EUtirik 11.2°N 169.7°ESatawal 07.4°N 147.0°ESorol 08.1°N 140.4°ENukuoro 03.9°N 155.0°E
Alternate Sites LocationSonsorol 05.3°N 132.2°EToangi 14.6°N 169.0°EWotho 10.2°N 166.0°EBikini 11.5°N 165.6°E

5
1.3.1 AUTOMATED DIGITALNETWORK (AUTODIN) —AUTODIN currently supports themessage requirements for JTWC, withthe process of converting to the newDefense Messaging System (DMS) in thenear future. A personal computer (PC)system running the “Gateguard” softwareapplication provides transmit and receivemessage capabilities. Secure connectivityis provided by a dial-up SecureTelephone Unit-III path with NCTS.The Gateguard system is used to accessthe AUTODIN/DMS network fordissemination of warnings, alerts, relatedbulletins, and messages to Department ofDefense (DoD) and U.S. Governmentinstallations. Message recipients canretransmit these messages for furtherdissemination using the Navy FleetBroadcasts, Coast Guard continuouswave (CW) Morse code, and text-to-voice broadcasts. AUTODIN/DMSmessages are also relayed via commercialtelecommunications routes for deliveryto non-DoD users. Inbound messagetraffic for JTWC is received viaAUTODIN/DMS addressed toNAVPACMETOCCEN WEST GU//JTWC//.
1.3.2 AUTOMATED WEATHERNETWORK (AWN) — The AWNprovides weather data over the PacificMeteorological Data System(PACMEDS). JTWC uses two PCsystems which run the Windows basedWINDS/AWNCOM software applicationpackage to interface with a dedicated 1.2kb/sec (kilobits per second) PACMEDScircuit. These PC systems provideJTWC the PACMEDS transmit andreceive capabilities needed to effectivelystore and manipulate large volumes of
alphanumeric meteorological dataavailable from reporting stationsthroughout JTWC's AOR. The AWNalso allows JTWC access to data whichare available on the GlobalTelecommunications System (GTS).JTWC's AWN station identifier isPGTW.
1.3.3 AUTOMATED WEATHERDISTRIBUTION SYSTEM (AWDS)— The AWDS consists of two dual-monitor workstations whichcommunicate with a UNIX basedcommunications/data server via a privateLocal Area Network (LAN). Theserver’s data connectivity is provided bytwo dedicated long-haul data circuits.The AWDS provides JTWC withadditional transmit and receive access toalphanumeric AWN data at Tinker AFBusing a dedicated 9.6 kb/sec circuit.Access to satellite imagery and computergraphics from Air Force Weather Agency(AFWA) is provided by anotherdedicated 9.6 kb/sec circuit.
The current configuration of AWDS wasupgraded in 1996 to include improvedworkstation performance, and integrationinto NPMOCW’s LAN backbone, thishas access to the Defense InformationSystems Network’s (DISN), Non-secureInternet Protocol (IP) Router Network’s(NIPRNET) Wide Area Network(WAN). The LAN and WANconnectivity allow JTWC to send andreceive products among other AWDS.
1.3.4 DEFENSE SWITCHEDNETWORK (DSN) — DSN is aworldwide, general purpose, switchedtelecommunications network for theDoD. The network provides a voice anddata link by which JTWC communicates

6
TC information with DoD installationsand civilian agencies. JTWC utilizesDSN for all switched voice and data. TheDSN and commercial telephone numbersfor JTWC are 349-5240 or 349-4224.The commercial area code is 671 and theDSN Pacific area code is 315.
After January 1, 1999, JTWC will beoperating from Pearl Harbor, Hawaii.The new telephone number will be 474-2320, with a commercial area code of808.
1.3.5. NIPRNET— The TCP/IP basedNIPRNET network has replaced theolder MILNET computercommunications network, providing amuch needed boost in throughput speedfor the transfer of large data and imagefiles. NIPRNET has links or gateways tothe non-DoD Internet, allowing data tobe pulled and pushed from Internet basedWorld Wide Web (WWW) and FileTransfer Protocol (FTP) servers. Thisability has enhanced JTWC’s ability toexchange data with the Internet-basedresearch community.
The JTWC's products are currentlyavailable to users of the DoD Secret IPRouter Network (SIPRNET) usingWWW browser software. The JTWC'sunclassified NIPRNET/Internet web siteaddress is http://www.npmocw.navy.mil.After 1 January 1999, this will change tohttp://www.npmoc.navy.mil.
1.3.6. TELEPHONE FACSIMILE —TELEFAX provides the capability torapidly scan and transmit, or receive,documents over commercial telephonelines or DSN. TELEFAX is used todisseminate TC advisories and warningsto key agencies on Guam and, in special
situations, to DoD, other U.S.Government agencies, and the otherMicronesian Islands.
1.4. DATA DISPLAYS
1.4.1. AUTOMATED TROPICALCYCLONE FORECAST (ATCF)SYSTEM — The ATCF is an advancedsoftware program that assists theTyphoon Duty Officer (TDO) in thepreparation, formatting, anddissemination of JTWC’s products. Itcuts message preparation time andreduces the number of corrections. TheATCF automatically displays theworking and objective best tracks;forecasts of track, intensity, and winddistribution; information from computergenerated forecast aids, and productsfrom other agencies. It also computesthe myriad of statistics calculated byJTWC.
1.4.2. AUTOMATED WEATHERDISTRIBUTION SYSTEM (AWDS)AWDS consists of two dual-monitorworkstations which communicate with aUNIX based server. The server hasconnectivity to the alphanumeric AWNand through a dedicated 9.6 kb/seccircuit to imagery and graphics from theAir Force Weather Agency (AFWA).
1.4.3. NAVAL OCEANOGRAPHICDATA DISTRIBUTION SYSTEM(NODDS) — NODDS is a PC-basedsystem that uses a telephone modem todownload, store and display bothenvironmental and satellite products fromFLENUMETOCCEN.
1.4.4. NAVAL SATELLITEDISPLAY

7
SYSTEM— GEOSTATIONARYNSDS-G is NAVPACMETOCCENWEST's primary geostationary imageryprocessing and display system is theNSDS-G. It can be used to process highresolution geostationary imagery foranalysis of TC positions and intensityestimates for the Western Pacific Ocean.It also acts as a secondary system shouldthe Meteorological Imagery, DataDisplay, and Analysis System (MIDDAS- see Chapter 2) and Mark IVB (seeChapter 2 also) fail.
1.4.5. Meteorology and OceanographyIntegrated Data Display System(MIDDS)MIDDS is a client-server based systemdesigned to ingest, process, display anddisseminate METOC data. This WebInformation Service includes satelliteimagery, digital and analog facsimile,alphanumeric, gridded fields, radar,lightning, and specialized applications.
1.4.6. SATELLITE WEATHERDATA IMAGING SYSTEM (SWDIS)— The SWDIS (also known as the M-1000) is a PC-based system thatinterfaces with the LAN to retrieve,store, and display various products, suchas geostationary-satellite imagery fromother sites at Rota (Spain), Pearl Harbor(Hawaii), or Norfolk (Virginia),scatterometer data from NAVOCEANOand NOAA, and composites of globalgeostationary-satellite imagery from theInternet. The SWDIS has proveninstrumental in providing METEOSATreduced-resolution coverage of TCs overthe western Indian Ocean as well as longtime-series animation of water-vaporimagery.
1.4.7 Joint METOC Viewer (JMV) —JMV is a powerful, fast, and easy-to-usetool that allows JTWC to retrieve,display, annotate and savemeteorological and oceanographic data.The JMV uses World Wide Webbrowsers to access data from variousmeteorological centers worldwide.
1.5. ANALYSES
The JTWC TDO routinely performsmanual streamline analyses of compositesurface/gradient-level (3000 ft (914 m))and upper-tropospheric (centered on the200-mb level) data for 00Z and 12Zdaily. Computer analyses of the surface,925-, 850-, 700-, 500-, 400-, and 200-mb levels, deep-layer-mean winds,frontal boundary depiction, 1000-200mb/400-200 mb/and 700-400-mb windshear, 500-mb and 700-mb 24-hourheight change, as well as a variety ofother meteorological displays come fromthe 00Z and 12Z FLENUMETOCCENdata bases. Additional sectional charts atintermediate synoptic times and auxiliarycharts, such as station-time plotdiagrams, time-height cross-sectioncharts and pressure-change charts, areanalyzed during periods of significant TCactivity.
1.6. FORECAST PROCEDURES
This section first introduces theSystematic and Integrated Approach toTC Track Forecasting by Carr andElsberry (1994), referred to hereafter asthe "Systematic Approach" and thenprovides JTWC’s basic approach totrack, intensity and wind radiiforecasting.

8
1.6.1. THE SYSTEMATICAPPROACH — JTWC began applyingthe Systematic Approach (Figure 1.1) in1994. The basic premise of thisapproach is that forecasters can improveupon dynamical track forecasts[guidance] generated by numericalmodels and other objective guidance ifthe forecasters are equipped with:1) a meteorological knowledge base
(Carr et al., 1997) of conceptualmodels that organizes a wide array of
scenarios into a relatively fewrecurring, dynamically-relatedsituations; and
2) a knowledge base of numerical modeltropical cyclone- forecast traits andobjective-aid traits within thedifferent recurring situations that areorganized around the meteorologicalknowledge base.
Figure 1-1 Systematic Approach Flowchart
1.6.1.1. General Concepts — Track,intensity, and size components of a TCforecast are dynamically interdependent.
1) TC motion affects intensity and howa TC intensifies can affect its motion.
2) TC size affects propagation relativeto environmental steering. A large
TC may significantly modify itsenvironment. Thus, the present sizeof a TC and any subsequent changesin size can affect motion.
3) TC size may affect intensity indirectlythrough changes induced on TCmotion.

9
1.6.1.2. Key Motion Concepts — TCmotion results from a variety of causes.
1) Environmental Steering — To afirst approximation, the TC vortex isadvected by the winds of the large-scale environmental flow (i.e., the TCmoves as a "cork in the stream").
2) TC Propagation — The motion ofTCs usually departs in a minor, butnot insignificant way from the largescale environmental steering vector.
3) TC-Environment Interaction — Incertain situations, the circulation ofthe TC interacts with theenvironment in such a way as tosignificantly alter the structure of theenvironment, and thus modifies thesteering vector that is the first-ordereffect on the motion of the TC.
1.6.1.3. Knowledge BaseFramework
1.6.1.3.1. Environment Structure— Structure is classified in terms of alarge-scale synoptic PATTERN andtwo or more synoptic REGIONSwithin the pattern that tend toproduce characteristic directions andspeeds of steering flow for a TClocated therein. Five patterns withten associated regions are recognizedby the Systematic Approach. JTWCnotes that not all TCs fit "neatly" intothese patterns/regions at all times andthat hybrids and transitions betweenpatterns occur. Thesepatterns/regions are briefly describedbelow.
1.6.1.3.1.1. Patterns — There are fiveprimary patterns:
STANDARD (S) (Figure 1.2)
1) Most frequently occurring pattern inthe WNP; and
2) key feature is roughly zonally-oriented subtropical ridge (STR)anticyclones.
POLEWARD (P) (Figure 1.3)
1) Second highest frequency ofoccurrence in the WNP;
2) key feature is a ridge (anticyclone)that extends from the STR deep intothe tropics and interrupts the tropicaleasterlies;
3) usually has SW-to-NE axisorientation; and,
4) usually produces strong polewardsteering on its west and polewardside.
GYRE (G) (Figure 1.4)
1) Only occurs during June-Novemberperiod;
2) key feature is a particularly large anddeep monsoonal circulation (thus,"monsoon gyre"); and,
3) usually situated between a zonally-oriented STR anticyclone to the NWand a meridionally-orientedanticyclone on its eastern periphery.
MULTIPLE (M) (Figure 1.5)
1) Key feature is more than one TC witha large break in the STR in thevicinity of the two TCs;
2) the TCs are oriented approximatelyeast-west (i.e., zonally-oriented TCs);
3) the TCs must be far enough apart topreclude significant mutualadvection, but close enough topreclude the development of ridging

10
between them (typically greater than10°, but less than about 25°);
4) the average latitude of the two TCsmust be sufficiently close to thelatitude of the STR axis (no morethan about 10° equatorward or 5°poleward) so that regions ofpoleward/equatorward flow areestablished, which affect TC motionand intensification; and,
5) there are three subsets of the "M"pattern which describe varyingdegrees of interaction between thetwo cyclones.
HIGH AMPLITUDE (H) (Figure 1.6)
A newly identified pattern for theSouthern Hemisphere (Carr et al., 1997).The key feature is a mid-latitude troughwhich penetrates very deeply into thetropics, almost to the equator. Acombination of this trough and thesubtropical ridge circulation to its eastcan produce long, southeastwardoriented tracks. The ridge circulation tothe west completes the pattern, bydefining “Ridge Equatorward” and“Ridge Poleward” regions. A small areaof “Equatorward Westerlies” is alsodefined.
1.6.1.3.1.2. Regions — There are tenprimary regions associated with the fourpatterns:
EQUATORIAL WESTERLIES (EW)— The area of equatorial westerliesequatorward of the monsoon troughaxis.
DOMINANT RIDGE (DR) — Thearea of tropical easterlies equatorward ofthe STR axis, except near any break in
the STR.
WEAKENED RIDGE (WR) — Thearea of weaker southeasterly winds in thevicinity of a break in the STR.
MIDLATITUDE WESTERLIES(MW) — The area of eastward andpoleward steering extending east from abreak in the STR.
POLEWARD-ORIENTED (PO) --The area of poleward steering west ofthe ridge feature in the "P" and "G"Patterns
POLEWARD FLOW (PF) — createdin the vicinity of the eastern TC of a "M"Pattern as a result of the gradientbetween the western TC and the STRcirculation to the east.
RIDGE POLEWARD (RP) — Thepoleward flow region of the HA pattern,where steering is provided by the westernside of the anti-cyclone.
RIDGE EQUATORWARD (RE) —The equatorward flow region of the HApattern, where steering is provided by theeastern side of the anti-cyclone.
TROUGH POLEWARD (TP) — Thevery long poleward flow region of theHA pattern, where steering is providedby the deeply penetrating mid-latitudetrough.
EQUATORWARD FLOW (EF) —created in the region of the western TCof a "M” Pattern as a result of thegradient between the eastern TC and theSTR circulation to the west.

11
1.6.1.3.1.3. Nomenclature — JTWCmakes routine use of the aforementionedPatterns and Regions of the SystematicApproach. In order to quickly transcribethis information, a short-hand contractionstandard has developed. By utilizing theone-letter contraction of a pattern andthe two-letter contraction of anassociated region (e.g., S/DR), aneffective method of quickly andaccurately describing SystematicApproach concepts in writing exists.
1.6.1.3.2. TC Structure — TC structureconsists of an INTENSITY that is basedon the maximum wind speed near thecenter of the TC, and a SIZE that isbased on some measure of the extent ofthe cyclonic wind component in thelower atmosphere. TC intensity isrelated to steering level and TC size isrelated to propagation and environmentmodification.
1.6.1.3.3. Transitional Mechanisms —These mechanisms act to change thestructure of the environment(pattern/region) and fall into twocategories:
Figure 1-2 Standard Pattern
Figure 1-3 Poleward Pattern
Figure 1-4 Gyre Pattern
Figure 1-5 Multiple TC Pattern
Figure 1-6 High Amplitude Pattern
1)TC-Environment Transformations.The TC and the environment mayinteract, resulting in a change inenvironmental structure (pattern/region)and thus the direction/speed of theassociated steering flow. In addition,TC-environment transformations mayresult in a change to TC structure. Listedbelow are recognized TC-environmenttransformations (refer to Carr andElsberry (1994) for a more thoroughtreatment):
- Beta Effect Propagation

12
- Vertical Wind Shear- Ridge Modification by TC- Monsoon Gyre-TC Interaction- TC Interaction (Direct (DTI), Semi-
direct (STI), and Indirect (ITI))(Figure 1.7)
2) Environmental Effects. These alsoresult in changes to the structure of theenvironment (pattern/region)surrounding the TC, but do not dependon, are or largely independent of, thepresence of the TC. Recognizedenvironmental effects are listed below(refer to Carr and Elsberry (1994) forthorough treatment):- Advection by Environment- Monsoon Gyre Formation- Monsoon Gyre DissipationSubtropical Ridge Modulation (bymidlatitude troughs)
TC movement, intensification, and sizeevolution are closely linked, therefore, an"ideal TC forecast approach" may bedefined as a fully integrated solution forthe time evolution of the 3-dimensionalthree partial representations of the totalTC circulation. TC track, intensity andsize forecasts are then to be consideredthree partial representations of the totalforecast solution.
1.6.2. BASIC APPROACH TOFORECASTING
1.6.2.1. Initial Positioning — Thewarning position is the best estimate ofthe center of the surface circulation atsynoptic time. It is estimated from ananalysis of all fix information receivedfrom one hour before to one and one-halfhours after that synoptic time. Theanalysis is aided by a computer-generatedobjective best-track scheme that weightsfix information based on its statisticalaccuracy. The TDO includes synopticobservations and other information toadjust the position, testing consistencywith the past direction, speed ofmovement and the influence of thedifferent scales of motions. If the fixdata are not available due toreconnaissance-platform malfunction orcommunication problems, or areconsidered unrepresentative, synopticdata and/or extrapolation from previousfixes are used.
1.6.2.2. Track Forecasting — Inpreparing the JTWC official forecast, theTDO evaluates a wide variety ofinformation and employs SystematicApproach methodology. JTWC uses astandardized, three-phase TC motion-forecasting process to improve forecastaccuracy and forecast-to-forecastconsistency. Figure 1.1 depicts the threephases and inputs to the SystematicApproach outlined below.

13
Figure 1-7 Tropical Cyclone Interaction: (a) Direct TC Interaction (DTI) is composed of three types —(i) one way influence, (ii) mutual interaction, and (iii) merger, (b) Semi-Direct TC Interaction (STI), and(c) Indirect TC Interaction (ITI).

14
1.6.2.2.1 Numerical GuidanceAnalysis Phase — NOGAPS analysesand prognoses at various levels areevaluated for position, development, andrelevant synoptic features such as:
1) STR circulations;2) midlatitude short/long-wave troughs
and associated weaknesses in theSTR monsoon surges;
3) influences of cyclonic cells in thetropical upper-tropospheric trough(TUTT);
4) other TCs;5) the distribution of sea-surface
temperature.
The TDO determines into whichpattern/region the TC falls, and whatenvironmental influences and transitionalmechanisms are indicated in the modelfields. The process outlined abovepermits the TDO to develop an initialimpression of the environmental steeringinfluences to which the TC is, and willbe, subjected to as depicted byNOGAPS. The NOGAPS analyses arethen compared to the manually-plottedand analyzed charts prepared by theTyphoon Duty Assistant (TDA) andTDO, and to the latest satellite imagery,in order to determine how well theNOGAPS-initialization process hasconformed to the available synoptic data,and how well the resultant analysis fieldsagree with the synoptic situation inferredfrom the imagery. Finally, the TDOcompares both the computer- andmanually-analyzed charts to monthlyclimatology in order to make apreliminary determination of to whatdegree the TC is, and will continue to be ,subject to a climatological ornonclimatological synoptic environment.Noting latitudinal and longitudinal
displacements of STR and long-wavemidlatitude features is of particularimportance, and will partially determinethe relative weights given toclimatologically- or dynamically-basedobjective forecast guidance.
1.6.2.2.2 Objective TechniquesAnalysis Phase — By applying thesystematic guidance with the NOGAPSmodel prognoses and real worldconditions, performance characteristicsfor many of the objective techniqueswithin the synoptic patterns/regionsoutlined in Section 1.6.1.3.1.1 have beendetermined. Estimating the likely biasesof each of the objective-techniqueforecasts of TC track, intensity, and sizegiven the current meteorologicalsituation, the TDO eliminates thosewhich are most likely inappropriate. TheTDO also determines the degree towhich the current situation is consideredto be, and will continue to be,climatological by comparing the forecastsof the climatology-based objectivetechniques, dynamically-basedtechniques, and past motion of thepresent storm. Additionally, the spreadof the set of objective forecasts, whenplotted, is used to provide a measure ofthe predictability of subsequent motion,and the advisability of including amoderate-probability alternate forecastscenario in the prognostic reasoningmessage or warning (outside the westernNorth Pacific). The directional spread ofthe plotted objective techniques istypically small well-before or well-afterrecurvature (providing high forecastconfidence), and is typically large nearthe decision point of recurvature or non-recurvature, or during a quasi-stationaryor erratic-movement phase. A large

15
spread increases the likelihood ofalternate forecast scenarios.
1.6.2.2.3 Forecast Development Phase— The TDO then constructs the JTWCofficial forecast giving due considerationto:
1) Interpretation of the TC-environmentscenario depicted by numerical modelguidance;
2) known properties of individualobjective techniques given thepresent synoptic situation orgeographic location;
3) the extent to which the synopticsituation is, and is expected toremain, climatological; and,
4) past statistical performance of thevarious objective techniques on thecurrent storm.
The following guidance for weighting theobjective techniques is applied:
1) Weight persistence strongly in thefirst 12 to 24 hours of the forecastperiod;
2) use conceptual models of recurring,dynamically-related meteorologicalpatterns with the traits of thenumerical and objective-aid guidanceassociated with the specific synopticsituation; and
3) give significant weight to the lastJTWC forecast at all forecast times,unless there is significant evidence towarrant departure (also consider thelatest forecasts from regional warningcenters, as applicable).
1.6.3. INTENSITY FORECASTING— The empirically derived Dvorak(1984) technique is used as a first guessfor the intensity forecast. The TDO then
adjusts the forecast after evaluatingclimatology and the synoptic situation.An interactive conditional-climatologyscheme allows the TDO to define asituation similar to the system beingforecast in terms of location, time ofyear, current intensity, and intensitytrend. Synoptic influences such as thelocation of major troughs and ridges, andthe position and intensity of the TUTT allplay a large part in intensifying orweakening a TC. JTWC incorporates achecklist into the intensity-forecastprocedure. Such criteria as upper-leveloutflow patterns, neutral points, sea-surface temperatures, enhancedmonsoonal or cross-equatorial flow, andvertical wind shear are evaluated for theirtendency to enhance or inhibit normaldevelopment, and are incorporated intothe intensity-forecast process. In additionto climatology and synoptic influences,the first guess is modified for interactionswith land, with other tropical cyclones,and with extratropical features.Climatological and statistical methods arealso used to assess the potential for rapidintensification ( Mundell, 1990).
1.6.4. WIND-RADII FORECASTING- Since the loss of dedicated aircraftreconnaissance in 1987, JTWC hasturned to other data sources fordetermining the radii of winds aroundtropical cyclones. The determination ofwind-radii forecasts is a three-stepprocess:
1) Low-level satellite drift winds,scatterometer and microwave imager35-kt (18 m/s) wind speed analysis(see Chapter 2), and synoptic dataare used to derive the current winddistribution.
16
2) The first guess of the radii is thendetermined from statistically-derivedempirical wind-radii models. TheJTWC currently uses three models:the Tsui model, the Huntley model,and the Martin-Holland model. Thelatter model uses satellite-derivedparameters to determine the size andshape of the wind profile associatedwith a particular tropical cyclone.The Martin-Holland model alsoincorporates latitude and speed ofmotion to produce an asymmetricalwind distribution. These modelsprovide wind-distribution analysesand forecasts that are primarilyinfluenced by the intensity forecasts.The analyses are then adjusted basedon the actual analysis from step 1,and the forecasts are adjustedappropriately.
3) Synoptic considerations, such as theinteraction of the cyclone with mid-latitude high pressure cells, are usedto fine-tune the forecast wind radii.
1.6.5. EXTRATROPICALTRANSITION When a tropical cyclonemoves into the mid-latitudes, it oftenenters an environment that is detrimentalto the maintenance of the tropicalcyclone’s structure and energy-producingmechanisms. The effects of cooler sea-surface temperatures, cooler and dryerenvironmental air, and strong verticalwind shear all act to convert the tropicalcyclone into an extratropical cyclone.JTWC indicates this conversion process
is occurring by stating the tropicalcyclone is “becoming extratropical.”JTWC will indicate the conversion isexpected to be complete by stating thesystem has "become extratropical.”When a tropical cyclone is forecast tobecome extratropical, JTWC coordinatesthe transfer of warning responsibility toNAVPACMETOCCEN WEST.
1.6.6. TRANSFER OF WARNINGRESPONSIBILITY JTWC coordinatesthe transfer of warning responsibility fortropical cyclones entering or exiting itsAOR. For tropical cyclones crossing180E longitude in the North PacificOcean, JTWC coordinates with theCentral Pacific Hurricane Center(CPHC), Honolulu viaNAVPACMETOCCEN, Pearl Harbor,Hawaii. For tropical cyclones crossing180°E longitude in the South PacificOcean, JTWC coordinates withNAVPACMETOCCEN, which hasresponsibility for the eastern SouthPacific. Whenever a tropical cyclonethreatens Guam, files are electronicallytransferred from JTWC to Alternate JointTyphoon Warning Center (AJTWC)collocated with NAVPACMETOCCEN.In the event that JTWC should becomeincapacitated, the AJTWC assumesJTWC’s functions. Assistance indetermining satellite reconnaissancerequirements, and in obtaining theresultant data, is provided by the weatherunit supporting the 15th Air Base Wing,Hickam AFB, Hawaii.
17
2. RECONNAISSANCE AND FIXES
2.1 GENERAL
JTWC depends primarily on tworeconnaissance platforms, satellite andradar, to provide accurate and timelymeteorological information in support ofadvisories, alerts and warnings. Whenavailable, synoptic and aircraftreconnaissance data are also used tosupplement the above. As in past years,optimal use of all availablereconnaissance resources to supportJTWC’s products remains a primaryconcern. Weighing the specificcapabilities and limitations of eachreconnaissance platform and the tropicalcyclone’s threat to life and property bothafloat and ashore continues to be animportant factor in careful productpreparation.
2.2 RECONNAISSANCEAVAILABILITY
2.2.1 SATELLITE Interpretation ofsatellite imagery by analysts at AirForce/Navy tactical sites and on Navyships yields tropical cyclone positions,estimates of the current intensity and 24-hour forecast intensity. Additionalpositioning and surface wind fieldestimation information are available foranalysis from DMSP SSM/I data and theERS-2 scatterometer.
2.2.2 RADAR Interpretation of land-based radar, which remotely senses andmaps precipitation within tropicalcyclones, provides positions in theproximity (usually within 175 nm (325km)) of radar sites in Kwajalein, Guam,Japan, South Korea, China, Taiwan,Philippine Islands, Hong Kong, Thailandand Australia. Where Doppler radars are
located, such as the Weather SurveillanceRadar-1988 Doppler (WSR-88D) onGuam, Okinawa, and Korea,measurements of radial velocity are alsoavailable, and observations of the tropicalcyclone’s horizontal velocity field andvertical wind structure are possible.
2.2.3 AIRCRAFT No weatherreconnaissance aircraft fixes werereceived at JTWC in 1997.
2.2.4 SYNOPTIC JTWC alsodetermines tropical cyclone positionsbased on analysis of conventionalsurface/gradient-level synoptic data.These positions are an importantsupplement to fixes derived from remotesensing platforms, and become mostvaluable in situations where satellite,radar, and aircraft fixes are unavailable orare considered unrepresentative.
2.3 SATELLITERECONNAISSANCE SUMMARY
Per USCINCPACINSTRUCTION 3140.1W , the PacificAir Force (PACAF) has primaryresponsibility for providing tropicalcyclone reconnaissance for the U.S.Pacific Command (USPACOM). TheJTWC tasks all reconnaissancerequirements. Operational control ofradar and satellite readout sites engagedin tropical cyclone reconnaissanceremains in normal command channels.However, the Guam DMSP site isdelegated the authority to manage thePacific DMSP Tropical CycloneReconnaissance Network (hereafterreferred to as Network) in support ofJTWC. The Network control and thepersonnel of Satellite Operations

18
(SATOPS) are members of the 36OSS/OSJ, and are collocated with JTWCat Nimitz Hill, Guam. The network sitesare listed in Table 2-1.TABLE 2-1 USPACOM SATELLITERECONNAISSANCE NETWORK SITES
UNIT ICAO15 OSS/OSW, Hickam AFB, Hawaii PHIK18 OSS/OSW, Kadena AB, Japan RODN36 OSS/OSJ, Nimitz Hill, Guam PGTW607 COS/DOW, Yongsan Garrison RKSY
Republic of KoreaAir Force Weather Agency, KGWC
Offutt AFB, NebraskaNPMOD DGAR, Diego Garcia FJDG
Direct readout Network sitesprovide coverage of the tropical westernNorth Pacific, South China Sea, andsouth central Indian Ocean using DMSPand NOAA TIROS polar orbitingsatellites. PACAF Instruction 15-102requires each network site to perform aminimum of two fixes per tropicalcyclone per day if a tropical cyclone iswithin a site’s coverage. Network directreadout site coverage is augmented byother sources of satellite-basedreconnaissance. Air Force WeatherAgency (AFWA) provides AOR-widecoverage to JTWC using recordedsmooth DMSP and NOAA TIROSimagery. This imagery is recorded andstored on the satellites for later relay to acommand readout site, which in turnpasses the data via a communicationssatellite to AFWA. Civilian contractweather support for the Army atKwajalein Atoll provides additional polarorbiting satellite-based tropical cyclonereconnaissance in the Marshall Islandsand east of 180W as needed. TheNOAA/NESDIS Satellite ApplicationsBranch at Suitland, Maryland (ICAOidentifier KWBC) also performs tropicalcyclone fix and intensity analysis over theJTWC AOR using METEOSAT andGMS geostationary platforms.
The Network provides tropicalcyclone positions and intensity estimatesonce JTWC issues either a TCFA or awarning. An example of the Dvorakcode is shown in Figure 2-1. Eachsatellite-derived tropical cyclone positionis assigned a Position Code Number(PCN) (Arnold and Olsen, 1974), whichis a statistical estimate of fix positionaccuracy. The PCN is determined by: 1)the availablility of visible landmarks inthe image that can be used as referencesfor precise gridding, and 2) the degree oforganization of the tropical cyclone’scloud system (Table 2-2)
Figure 2-1 Dvorak code for communicatingestimates of current and forecast intensityderived from satellite data. In the example,the current “T-number” is 3.5, but thecurrent intensity is 4.5. The cloud systemhas weakened by 1.5 “T-numbers” since theevaluation conducted 24 hours earlier. Theplus (+) symbol indicates an expectedreversal of the weakening of the tropicalcyclone during the next 24-hour period.
TABLE 2-2 POSITION CODE NUMBER (PCN)
PCN CENTER DETERMINATION/GRIDDINGMETHOD
1 EYE/GEOGRAPHY 2 EYE/EPHEMERIS 3 WELL DEFINED CIRCULATION CENTER/GEOGRAPHY 4 WELL DEFINED CIRCULATION CENTER/EPHEMERIS 5 POORLY DEFINED CIRCULATION CENTER/GEOGRAPHY 6 POORLY DEFINED CIRCULATION CENTER/EPHEMERIS
Example: T 3.5/4.5+/W1.5/24 HRS
19
Once a tropical cyclone reachesan intensity of 50 kt (26 m/sec), AFWAand SATOPS analyze the 35-kt (18-m/sec) wind distribution surrounding thetropical cyclone based on microwavesatellite imagery.
SATOPS provides three-hourlypositions and six-hourly intensityestimates for all tropical cyclones inTCFA or warning status. Currentintensity estimates are made using theDvorak technique for both visible andenhanced infrared imagery. The standardrelationship between tropical cyclone “T-number”, maximum sustained surfacewind speed, and minimum sea-levelpressure (Atkinson and Holliday, 1977)for the Pacific is shown in Table 2-3.Subtropical cyclone intensity estimatesare made using the Hebert and Poteat(1975) technique. Intensity estimates oftropical cyclones undergoingextratropical transition are made usingthe Miller and Lander (1997) technique.
Table 2-3 ESTIMATED MAXIMUM SUSTAINEDWIND SPEED (KT) AS A FUNCTION OFDVORAK CURRENT AND FORECAST INTENSITYNUMBER AND MINIMUM SEA-LEVEL PRESSURE(MSLP)
ESTIMATED WIND MSLP(MB)T-NUMBER SPEED-KT(M/SEC) (PACIFIC)
0.0 <25 <(13) --- 0.5 25 (13) --- 1.0 25 (13) --- 1.5 25 (13) --- 2.0 30 (13) 1000 2.5 35 (13) 997 3.0 45 (13) 991 3.5 55 (13) 984 4.0 65 (13) 976 4.5 77 (13) 966 5.0 90 (13) 954 5.5 102 (13) 941 6.0 115 (13) 927 6.5 127 (13) 914 7.0 140 (13) 898
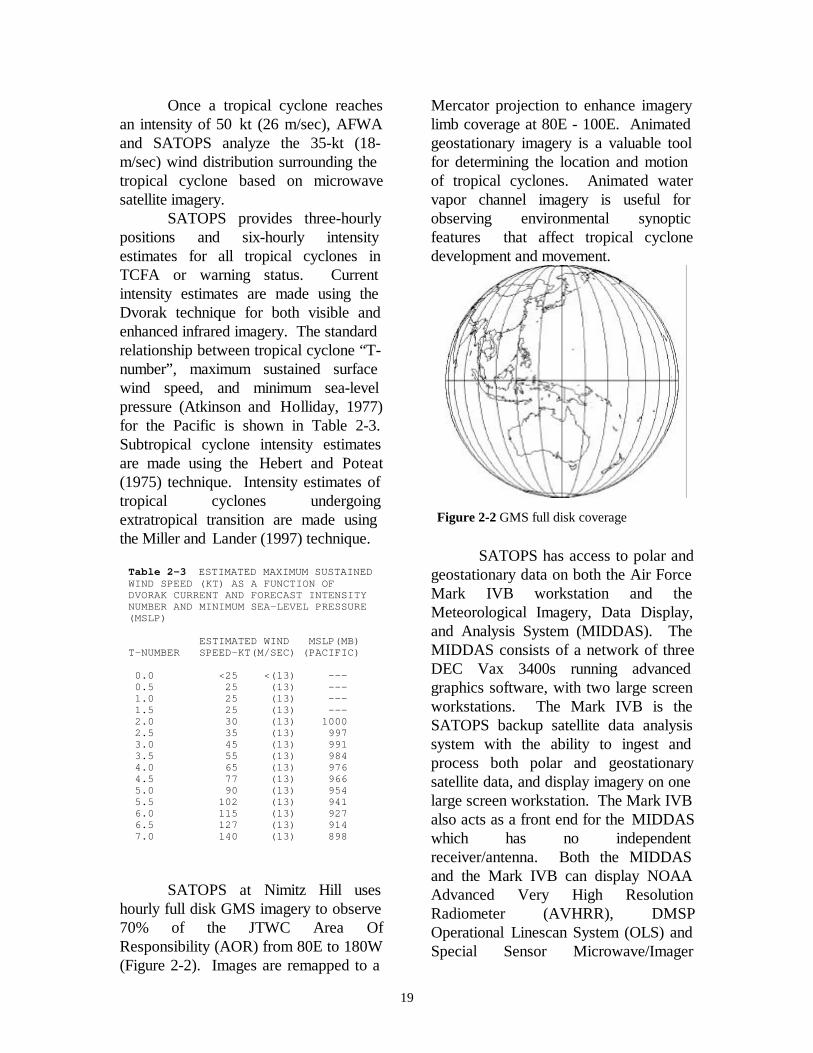
SATOPS at Nimitz Hill useshourly full disk GMS imagery to observe70% of the JTWC Area OfResponsibility (AOR) from 80E to 180W(Figure 2-2). Images are remapped to a
Mercator projection to enhance imagerylimb coverage at 80E - 100E. Animatedgeostationary imagery is a valuable toolfor determining the location and motionof tropical cyclones. Animated watervapor channel imagery is useful forobserving environmental synopticfeatures that affect tropical cyclonedevelopment and movement.
Figure 2-2 GMS full disk coverage
SATOPS has access to polar andgeostationary data on both the Air ForceMark IVB workstation and theMeteorological Imagery, Data Display,and Analysis System (MIDDAS). TheMIDDAS consists of a network of threeDEC Vax 3400s running advancedgraphics software, with two large screenworkstations. The Mark IVB is theSATOPS backup satellite data analysissystem with the ability to ingest andprocess both polar and geostationarysatellite data, and display imagery on onelarge screen workstation. The Mark IVBalso acts as a front end for the MIDDASwhich has no independentreceiver/antenna. Both the MIDDASand the Mark IVB can display NOAAAdvanced Very High ResolutionRadiometer (AVHRR), DMSPOperational Linescan System (OLS) andSpecial Sensor Microwave/Imager

20
(SSM/I), and also geostationary visible,infrared and water vapor channelimagery. The MIDDAS can displayNOAA TIROS Operational VerticalSounder (TOVS) data, and the MarkIVB can display DMSP SSM/T1 andSSM/T2 sounder data.
NOAA TIROS AVHRR imageryprovides five channels of imagery —visible, near and middle IR, and two inthe far IR channels. DMSP OLSprovides imagery in two channels —visible/near IR (commonly referred asbroadband visible), and far IR. TOVSincludes the High Resolution InfraredRadiation Sounder/2 (HIRS/2), theMicrowave Sounding Unit (MSU), andthe Stratospheric Sounding Unit (SSU).
2.3.1 SATELLITE PLATFORMSUMMARY Figure 2-3 shows theoperational status of polar orbitingspacecraft. Imagery was received fromfive DMSP and two NOAA satellitesduring 1997. Both Operational LineScan (OLS) and Special SensorMicrowave Imagery (SSM/I) wasreceived from F13 and F14 (F14 begantransmitting data in early summer). F12produced only OLS imagery and F10 andF11 only SSM/I imagery. Aftertransmitting four years beyond its normallife expectancy, F10 went into anuncontrollable spin in November and wasunrecoverable. NOAA-12 and NOAA-14
Figure 2-3 Polar orbiting spacecraft statusfor 1997.
were operational throughout the year,with fully functional AVHRR imagers.
2.3.2 STATISTICAL SUMMARY During 1997, over 91% of all fixes forinput into JTWC’s warnings weresatellite based tropical cyclone positionsand intensities. The PACOM satellitereconnaissance network and otheragencies provided JTWC with 10,726fixes: 6,114 western North Pacific, 313northern Indian Ocean, 3,419 SouthernHemisphere, and 880 for circulationswhich did not develop into significanttropical cyclones. SATOPS provided7,601, accounting for nearly 71% of allfixes. A comparison of total fixes fromthe network and western North Pacificover the past seven years is shown inFigure 2-4.
Figure 2-4 Comparison of fixes for the AOR(Total) and western North Pacific for the period1991 - 1997.
2.3.3 APPLICATION OF NEWTECHNIQUES ANDTECHNOLOGYSATOPS continues to push advances insatellite meteorology to improve thesupport provided to JTWC. A newgeostationary satellite, Feng Yun 2,owned by China/PRC, becameoperational for a short period during theyear. Unfortunately, this satellite failedand became unusable within a few

21
Table 2-4 POSITION CODE NUMBER (PCN) CRITERIA AND FIX CODES FORTC LOW-LEVEL CCs FROM SATELLITE
PCN PCN Definitions Sensor /technique type and fix codeGrid Grid IR Vis Both SSM/I Vis/IR AnmtnBy by only & (note 4)
Geog Ephem (note 3) SSM/I(note2)
(note2) (note 3)
1 2 Eye(EYE) (EYE) CDO type eye, geometric center 1 2 3 4 S A
(regular/round, any diameter)(note 6)
(EYE) (EYE) Small eye (irregular/ragged, diameter 5 6 7 8 S A> 30 nm on long axis) (note 6)
3 4 Well defined CC(EYE) (EYE) Eye(ragged/irregular, diameter 9 10 11 12 S A
> 30 nm center > 1/2 enclosed bywall cloud) (note 6)
(EYE) (EYE) Tightly curved band/banding type 13 14 15 16 S Aeye (band curves at least 1/2 distancearound center, diameter < 90 nm)
(LLCC) (LLCC) Exposed low-level CC 17 18 19 20 S A(CDO) (CDO) Small CDO (round with well 21 22 23 S A
Defined edges, positioned nearGeometric center, diameter < 80 nm)
(EMB) (EMB) Small embedded center (diameter 24 25 26 S A< 80 nm)
(CDO) (CDO) Large CDO (with clear 27 28 29 S AIndications of shearing, low-levelcloud lines, or overshooting topsthat bias low-level centerPosition away from the geometriccenter, diameter > 80 nm )
(CDO) (CDO) Any CDO or Embedded Center 30 31 32 33 Swith low-level CC clearly visibleon co-registered SSM/I (note 7)
5 6 Poorly DefinedLarge eye (ragged/irregular, 30 34 35 36 37 S Anm diameter on long axis, 1/2Enclosed by wall cloud)Spiral banding systems 38 39 40 41 S A(convective curvature) notClassifiable as banding eye orTightly curved bandLarge CDO 43 44 45 S AEmbedded center positioned with IR 46 APartially exposed low-level 47 48 49 50 S ACenters with the CC less than halfExposedCloud minimum wedge/cold 51 52 53 54 S ACommaCentral cold cover 55 56 57 58 S ACirrus outflow - upper level 59 60 61 62 S AOutflow provides the onlyCirculation parametersPoorly organized low-level centerEvident only in high resolutionAnimation (Vis/IR or both)All othersMonsoon depressions or multiple Any combination of Vis , IR/EIR,cloud clusters, positioned using and SSM/Iany of the following methods:

22
Table 2-4 (Continued)Cirle method 68Conservative feature 69 AAnimation 70Extrapolation 71
Note 1: Use the following steps to determine the PCN and Fix Code:
a. Based on the analysis of the circulation parameters, determine a TC low-level CC position.
b. Go to Table 2-2, then to the definitions column. Choose a PCN based on the cloud pattern, discretemeasurements, as necessary, and/or technique used to determine the position.
c. Move across to the Fix Code columns, and based on the sensor(s) used, select a fix code.
Note 2: Odd PCNs (1, 3, 5) are gridded with geography, the low-level CC being within 10 degrees (600 nm)of the geographic feature used for gridding. Even PCNs (2, 4, 6) are gridded with ephemeris, or the low-level CC is not within 10 degrees (600 nm) of the geographic feature used for gridding.
Note 3: SSM/I only fixes - Use PCN of 5 or 6, and fix code based on Note 1, para a & c.
Note 4: Append "S" to the numerical fix code entry to indicate Special Sensor Microwave Imager (SSM/I)and visible and/or infrared data was used in determining the low-level CC (i.e. 18S). DefenseMeteorological Satellite Program (DMSP) fixes only. For the purposes of this fix code, SSM/I (S) andAnimation (A) are mutually exclusive.
Note 5: Append "A" to the numerical fix code entry to indicate animation was used in determining the low-level CC (i.e. 11A). Geostationary fixes only. For the purposes of this fix code, SSM/I (S) andAnimation (A) are mutually exclusive.
Note 6: For fix code entries 1-9, encode 01-09.
Note 7: In order to use SSM/I data to position low-level CCs, you must be able to correct thenavigation/gridding and interrogate the SSM/I imagery directly for latitude/longitude (DMSP fixes only).
months. However, there wereindications late in 1998 that someoperational capability was beingregained. When operational, this satellitehas the potential of filling in the gapbetween METEOSAT and GMS-5(Figure 2-5).
Meteosat Feng-Yun 2 GMS 5
Figure 2-5 Geostationary spacecraftcoverage of AOR. The PRC satellite Feng-Yun 2 was briefly available in late 1997 andearly 1998 before being rendered useless bythe failure of onboard instrumentation.There has been some success late in 1998 inrestoring it to service.
SATOPS continued to make use of real-time SSM/I data on the Mark IVB to
determine storm structure and betteridentify 35-kt (18 m/s) windssurrounding tropical cyclones. Severalupgrades on the Mission Sensor TacticalImaging Computer (MISTIC) helped usbetter interrogate time-late SSM/I datastored on DMSP spacecrafts andforwarded from FNMOC to provide fullcoverage of JTWC’s AOR. Theacquisition of DMSP F14 data in theearly summer helped increase the areacovered by microwave imagery.
Additionally, to give the TDO abetter statistical value for each satellitederived fix, SATOPS used animatedgeostationary imagery and multispectraldisplay capability to apply Position CodeNumbers (PCN) (Table 2-4) and fixcodes to a particular tropical cyclonepattern based on sensor type (SeeStatistical Summary and Figure 2-6).

23
The XT technique (Miller andLander, 1997) was developed and usedoperationally to better estimate tropicalcyclones undergoing extratropicaltransition.
Several Mark IVB Network sitesreceived the new Build 8 software in late1997. This upgrade made the system
Figure 2-6 Western North Pacific Oceansatellite position errors (nm).
more user-friendly and much easier tointerrogate several tropical cyclones atonce--something previous softwarebuilds lacked.
2.3.4 FUTURE OF SATELLITERECONNAISSANCE SATOPS willcontinue to strive to improve satellitereconnaissance to support JTWC in1998. The 1995 Base Realignment andClosure (BRAC) directed JTWC tomove from Guam to Hawaii by 1999.Preparing for this move, while continuingto provide uninterrupted support, will bea major challenge. Initiatives arecurrently being taken to move the MarkIVB to Andersen AFB,Guam by 1 April1999.
2.4 RADAR RECONNAISSANCESUMMARY
Of the 33 significant tropicalcyclones in the western North Pacificduring 1997, 13 passed within range ofland-based radar with sufficient
precipitation and organization to befixed. A total of 466 land-based radarfixes were logged at JTWC. As definedby the World MeteorologicalOrganization (WMO), the accuracy ofthese fixes falls within three categories:good [within 10 km (5 nm)], fair [within10 - 30 km (5 - 16 nm)], and poor[within 30 - 50 km (16 - 27 nm)]. Of the466 radar fixes encoded in this manner,198 were good, 201 fair, and 182 poor.The radar network provided timely andaccurate fixes which allowed JTWC tobetter track and forecast tropical cyclonemovement. In addition to fixes, theGuam and Okinawa WSR-88D radarssupplied meteorologists with a look intothe vertical and horizontal structure ofprecipitation and winds in tropicalcyclones passing nearby.
In the Southern Hemisphere, 40radar reports were logged for tropicalcyclones. No radar fixes were receivedfor the North Indian Ocean.
2.5 TROPICAL CYCLONE FIXDATA
Table 2-5a delineates the numberof fixes per platform for each individualtropical cyclone for the western NorthPacific. Totals and percentages are alsoindicated. Similar information is providedfor the North Indian Ocean in Table 2-5b, and for the South Pacific and SouthIndian Ocean in Table 2-5c.

24
Table 2-5a WESTERN NORTH PACIFIC OCEAN FIX PLATFORM SUMMARY FOR 1997
TROPICAL CYCLONE SATELLITE SCATTEROMETER RADAR SYNOPTIC AIRCRAFT TOTAL
01W HANNAH 117 1 0 0 0 118 02W ISA 362 7 32 0 0 401 03W JIMMY 114 5 0 0 0 119 04W KELLY 120 10 3 3 0 136 05W LEVI 116 3 9 0 0 128 06W MARIE 155 6 0 0 0 161 07W NESTOR 276 13 0 2 0 291 08W OPAL 173 7 34 11 0 225 09W PETER 156 14 37 23 0 230 10W ROSIE 221 1 45 8 0 275 11W SCOTT 173 3 0 0 0 176 12W TINA 300 4 96 4 0 404 13W VICTOR 75 0 17 0 0 92 14W WINNIE 385 2 71 7 0 465 15W YULE 157 3 0 1 0 161 16W - 49 2 0 0 0 51 17W ZITA 68 1 14 8 0 91 18W AMBER 238 4 18 9 0 269 19W BING 218 4 0 3 0 225 20W CASS 69 0 0 2 0 71 02C OLIWA 369 4 49 8 0 430 21W DAVID 197 5 0 3 0 205 22W FRITZ 95 1 0 3 0 99 23W ELLA 8 1 0 0 0 9 24W GINGER 156 4 0 0 0 160 25W HANK 50 2 0 0 0 52 26W - 82 0 0 0 0 82 27W IVAN 279 3 18 6 0 306 28W JOAN 269 3 23 2 0 297 29W KEITH 336 6 58 15 0 415 30W LINDA 196 3 0 5 0 204 31W MORT 162 3 0 8 0 173 05C PAKA 480 8 57 4 0 549
TOTALS 6221 133 581 135 0 7070
PERCENTAGE OF TOTAL 88% 2% 8% 2% 0% 100%
Table 2-5b NORTH INDIAN OCEAN FIX PLATFORM SUMMARY FOR 1997
TROPICAL CYCLONE SATELLITE SCATTEROMETER RADAR SYNOPTIC AIRCRAFT TOTAL
01B 137 5 0 0 0 142 02B 76 0 0 4 0 80 03A 23 2 0 1 0 26 04A 110 1 0 2 0 113
TOTALS 346 8 0 7 0 361
PERCENTAGE OF TOTAL 96% 2% 0% 2% 0% 100%

25
Table 2-5c SOUTH PACIFIC AND SOUTH INDIAN OCEAN FIX PLATFORM SUMMARY FOR 1997
TROPICAL CYCLONE SATELLITE SCATTEROMETER RADAR SYNOPTIC AIRCRAFT TOTAL 01S LINDSAY 41 1 0 0 0 42 02S - 91 2 0 0 0 93 03S - 78 1 0 0 0 79 04S ANTOINETTE 80 2 0 0 0 82 05S MELANIE/BELLAMI 242 4 0 0 0 246 06P CYRIL 106 2 0 1 0 109 07S CHANTELLE 121 2 0 0 0 123 08S DANIELLA 67 4 0 5 0 76 09S ELVINA 130 0 0 8 0 138 10P NICHOLAS 60 3 0 5 0 68 11S OPHELIA 147 0 0 0 0 147 12P PHIL 247 1 1 1 0 250 13P FERGUS 123 1 0 4 0 128 14S FABRIOLA 42 1 0 7 0 50 15S RACHEL 128 3 16 14 0 161 16P DRENA 130 2 0 7 0 139 17P EVAN 49 2 0 1 0 52 18S - 80 1 0 0 0 81 19S PANCHO-HELINDA 378 4 0 0 0 382 20S GRETELLE 76 3 0 4 0 83 21S ILETTA 76 2 0 0 0 78 22P FREDA 133 1 0 1 0 135 23S JOSIE 93 2 0 1 0 96 24P GILLIAN 47 1 0 1 0 49 25S KARLETTE 135 2 0 0 0 137 26P HAROLD 102 1 0 1 0 104 27S - 107 2 0 0 0 109 28P ITA 13 0 0 0 0 13 29P - 12 0 0 3 0 15 30S LIZETTE 19 2 0 0 0 21 31P GAVIN 151 4 4 1 0 160 32P JUSTIN 343 8 18 3 0 372 33P HINA 72 1 0 0 0 73 34P IAN 53 7 0 3 0 63 35P JUNE 135 10 0 2 0 147 36S RHONDA 178 9 0 0 0 187 37P - 54 0 0 0 0 54 38P KELI 113 4 0 0 0 117
TOTALS 4252 95 39 73 0 4459
PERCENTAGE OF TOTAL 95% 2% 1% 2% 0% 100%

26
3. Summary of Western North Pacific and North Indian Ocean Tropical Cyclones
3.1 Western North Pacific Ocean TropicalCyclones
The year of 1997 was an El Niño year, andby some measures (e.g., the magnitude of thewarming of the Sea Surface Temperature(SST) in the eastern equatorial Pacific), the ElNiño episode of 1997 was one of thestrongest in recorded history (ClimatePrediction Center (CPC) 1997). El Niño had alarge influence on the distribution of westernNorth Pacific (WNP) TCs during 1997. Thesignature characteristics of the distribution,character and behavior of the tropicalcyclones (TCs) of the WNP during 1997(some known to be related to El Niño)include: (1) a very high number of super typhoons; (2) an early start of WNP TC activity witha higher than average number during the earlyseason (01 January to 15 July); (3) a tendency -- especially during the firsthalf of the year -- for the TC tracks to benorth oriented; (4) a substantial eastward displacement ofthe mean genesis location for all TCs and formany of the individual TCs; (5) the formation, east of the internationaldateline, of two TCs which moved into theWNP and became super typhoons -- Oliwa(02C) and Paka (05C) (these are Hawaiiannames given to them by the Central PacificHurricane Center (CPHC)); (6) the landfall of only one TC in thePhilippines; (7) the formation in the monsoon trough ofall but one of the TCs -- (Scott (07W) formedin direct association with a cycloniccirculation (cell) in the tropical uppertropospheric trough (TUTT)); and, (8) the simultaneous existence in thePhilippine Sea of 2 super typhoons -- Ivan(28W) and Joan (29W) -- each possessing anextreme intensity of 160 kt (82 m/sec).
Some of these unusual characteristics of thedistribution and behavior of the TCs in thewestern North Pacific during 1997 are likelyrelated to the large-scale atmospheric andoceanic circulation anomalies associated with1997's strong El Niño/Southern Oscillation(ENSO) event. Of the items in this list, (2),(4) and (7) are typical features of El Niñoyears. The annual number of significant TCs inthe WNP during 1997 (Table 3-1) was almostnormal: 33 versus the climatological averageof 32 (Table 3-2). The year of 1997 included11 super typhoons, 12 lesser typhoons, 8tropical storms and 2 tropical depressions.The calendar-year total of 31 TCs (of at leasttropical storm intensity) was one higher thanthe climatological average (Figure 3-1). Thecalendar-year total of 23 typhoons was fiveabove the long-term average, and is thehighest annual number of typhoons recordedin the WNP basin since 1971 when there were24. The 11 super typhoons is anunprecedented value. Since 1970, as best-track wind and intensities became ever moreconstrained to conform to standardized TCwind-pressure relationships (e.g., Atkinsonand Holiday 1977), the highest annualnumber of super typhoons is 7 . (Figure 3-2).The high number of super typhoons in theWNP was one of the most significanthighlights of 1997. The annual number ofsuper typhoons may be weakly related to ElNiño: the El Niño years of 1972, 76, 82, 87,91, 93 and 94 had 2, 5, 5, 7, 7, 3, and 6 supertyphoons respectively (for an average of 5.0);and, the La Niña years of 1973, 83, 88, 89,95, and 96 had 3, 4, 3, 7, 5 and 6 supertyphoons respectively (for an average of 4.7).A suggested physical mechanism for theincrease in super typhoons during El Niñoyears is the longer over-water, low-latitudetrajectories of the TCs which, because of ElNiño, form well to the east of normal. The
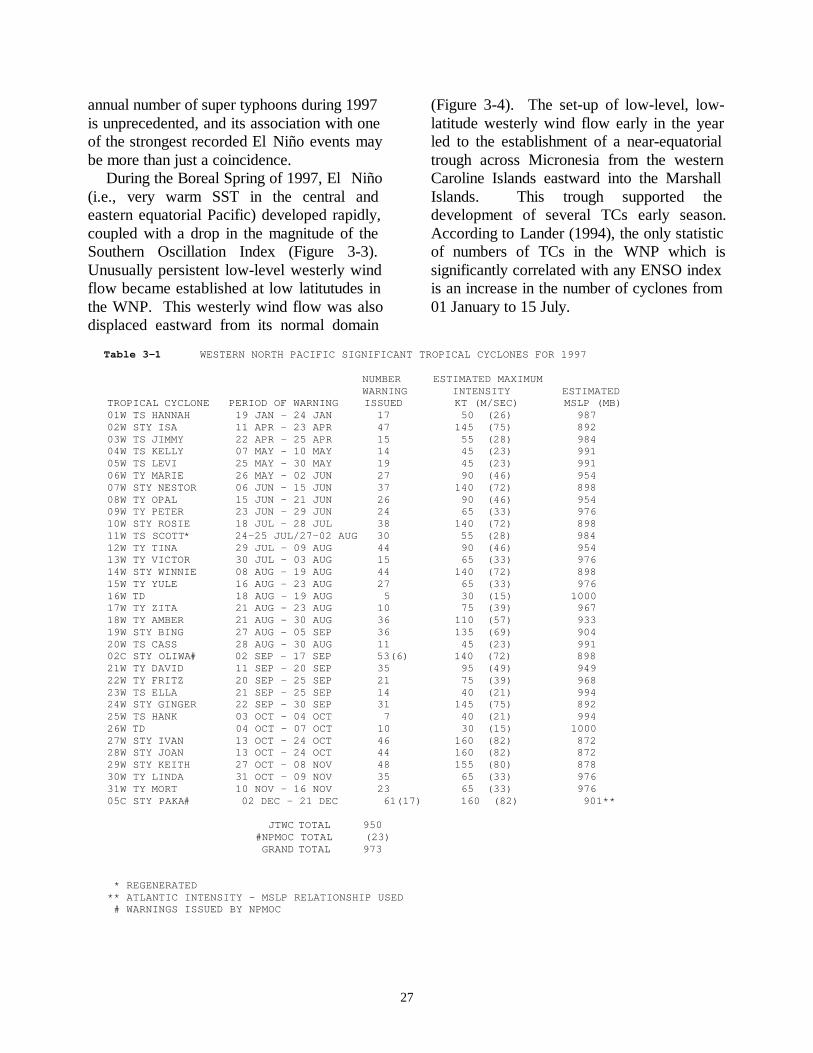
27
annual number of super typhoons during 1997is unprecedented, and its association with oneof the strongest recorded El Niño events maybe more than just a coincidence. During the Boreal Spring of 1997, El Niño(i.e., very warm SST in the central andeastern equatorial Pacific) developed rapidly,coupled with a drop in the magnitude of theSouthern Oscillation Index (Figure 3-3).Unusually persistent low-level westerly windflow became established at low latitutudes inthe WNP. This westerly wind flow was alsodisplaced eastward from its normal domain
(Figure 3-4). The set-up of low-level, low-latitude westerly wind flow early in the yearled to the establishment of a near-equatorialtrough across Micronesia from the westernCaroline Islands eastward into the MarshallIslands. This trough supported thedevelopment of several TCs early season.According to Lander (1994), the only statisticof numbers of TCs in the WNP which issignificantly correlated with any ENSO indexis an increase in the number of cyclones from01 January to 15 July.
Table 3-1 WESTERN NORTH PACIFIC SIGNIFICANT TROPICAL CYCLONES FOR 1997
NUMBER ESTIMATED MAXIMUM WARNING INTENSITY ESTIMATED TROPICAL CYCLONE PERIOD OF WARNING ISSUED KT (M/SEC) MSLP (MB) 01W TS HANNAH 19 JAN - 24 JAN 17 50 (26) 987 02W STY ISA 11 APR - 23 APR 47 145 (75) 892 03W TS JIMMY 22 APR - 25 APR 15 55 (28) 984 04W TS KELLY 07 MAY - 10 MAY 14 45 (23) 991 05W TS LEVI 25 MAY - 30 MAY 19 45 (23) 991 06W TY MARIE 26 MAY - 02 JUN 27 90 (46) 954 07W STY NESTOR 06 JUN - 15 JUN 37 140 (72) 898 08W TY OPAL 15 JUN - 21 JUN 26 90 (46) 954 09W TY PETER 23 JUN - 29 JUN 24 65 (33) 976 10W STY ROSIE 18 JUL - 28 JUL 38 140 (72) 898 11W TS SCOTT* 24-25 JUL/27-02 AUG 30 55 (28) 984 12W TY TINA 29 JUL - 09 AUG 44 90 (46) 954 13W TY VICTOR 30 JUL - 03 AUG 15 65 (33) 976 14W STY WINNIE 08 AUG - 19 AUG 44 140 (72) 898 15W TY YULE 16 AUG - 23 AUG 27 65 (33) 976 16W TD 18 AUG - 19 AUG 5 30 (15) 1000 17W TY ZITA 21 AUG - 23 AUG 10 75 (39) 967 18W TY AMBER 21 AUG - 30 AUG 36 110 (57) 933 19W STY BING 27 AUG - 05 SEP 36 135 (69) 904 20W TS CASS 28 AUG - 30 AUG 11 45 (23) 991 02C STY OLIWA# 02 SEP - 17 SEP 53(6) 140 (72) 898 21W TY DAVID 11 SEP - 20 SEP 35 95 (49) 949 22W TY FRITZ 20 SEP - 25 SEP 21 75 (39) 968 23W TS ELLA 21 SEP - 25 SEP 14 40 (21) 994 24W STY GINGER 22 SEP - 30 SEP 31 145 (75) 892 25W TS HANK 03 OCT - 04 OCT 7 40 (21) 994 26W TD 04 OCT - 07 OCT 10 30 (15) 1000 27W STY IVAN 13 OCT - 24 OCT 46 160 (82) 872 28W STY JOAN 13 OCT - 24 OCT 44 160 (82) 872 29W STY KEITH 27 OCT - 08 NOV 48 155 (80) 878 30W TY LINDA 31 OCT - 09 NOV 35 65 (33) 976 31W TY MORT 10 NOV - 16 NOV 23 65 (33) 976 05C STY PAKA# 02 DEC - 21 DEC 61(17) 160 (82) 901**
JTWC TOTAL 950 #NPMOC TOTAL (23) GRAND TOTAL 973
* REGENERATED ** ATLANTIC INTENSITY - MSLP RELATIONSHIP USED # WARNINGS ISSUED BY NPMOC

28
Table 3-2 DISTRIBUTION OF WESTERN NORTH PACIFIC TROPICAL CYCLONES FOR 1959 - 1997 YEAR JAN FEB MAR APR MAY JUN JUL AUG SEP OCT NOV DEC TOTALS
1959 0 1 1 1 0 1 3 8 9 3 2 2 31 000 010 010 100 000 001 111 512 423 210 200 200 17 7 7 1960 1 0 1 1 1 3 3 9 5 4 1 1 30 001 000 001 100 010 210 210 810 041 400 100 100 19 8 3 1961 1 1 1 1 4 6 5 7 6 7 2 1 42 010 010 100 010 211 114 320 313 510 322 101 100 20 11 11 1962 0 1 0 1 3 0 8 8 7 5 4 2 39 000 010 000 100 201 000 512 701 313 311 301 020 24 6 9 1963 0 0 1 1 0 4 5 4 4 6 0 3 28 000 000 001 100 000 310 311 301 220 510 000 210 19 6 3 1964 0 0 0 0 3 2 8 8 8 7 6 2 44 000 000 000 000 201 200 611 350 521 331 420 101 26 13 5 1965 2 2 1 1 2 4 6 7 9 3 2 1 40 110 020 010 100 101 310 411 322 531 201 110 010 21 13 6 1966 0 0 0 1 2 1 4 9 10 4 5 2 38 000 000 000 100 200 100 310 531 532 112 122 101 20 10 8 1967 1 0 2 1 1 1 8 10 8 4 4 1 41 010 000 110 100 010 100 332 343 530 211 400 010 20 15 6 1968 0 1 0 1 0 4 3 8 4 6 4 0 31 000 001 000 100 000 202 120 341 400 510 400 000 20 7 4 1969 1 0 1 1 0 0 3 3 6 5 2 1 23 100 000 010 100 000 000 210 210 204 410 110 010 13 6 4 1970 0 1 0 0 0 2 3 7 4 6 4 0 27 000 100 000 000 000 110 021 421 220 321 130 000 12 12 3 1971 1 0 1 2 5 2 8 5 7 4 2 0 37 010 000 010 200 230 200 620 311 511 310 110 000 24 11 2 1972 1 0 1 0 0 4 5 5 6 5 2 3 32 100 000 001 000 000 220 410 320 411 410 200 210 22 8 2 1973 0 0 0 0 0 0 7 6 3 4 3 0 23 000 000 000 000 000 000 430 231 201 400 030 000 12 9 2 1974 1 0 1 1 1 4 5 7 5 4 4 2 35 010 000 010 010 100 121 230 232 320 400 220 020 15 17 3 1975 1 0 0 1 0 0 1 6 5 6 3 2 25 100 000 000 001 000 000 010 411 410 321 210 002 14 6 5 1976 1 1 0 2 2 2 4 4 5 0 2 2 25 100 010 000 110 200 200 220 130 410 000 110 020 14 11 0 1977 0 0 1 0 1 1 4 2 5 4 2 1 21 000 000 010 000 001 010 301 020 230 310 200 100 11 8 2 1978 1 0 0 1 0 3 4 8 4 7 4 0 32 010 000 000 100 000 030 310 341 310 412 121 000 15 13 4 1979 1 0 1 1 2 0 5 4 6 3 2 3 28 100 000 100 100 011 000 221 202 330 210 110 111 14 9 5 1980 0 0 1 1 4 1 5 3 7 4 1 1 28 000 000 001 010 220 010 311 201 511 220 100 010 15 9 4 1981 0 0 1 1 1 2 5 8 4 2 3 2 29 000 000 100 010 010 200 230 251 400 110 210 200 16 12 1 1982 0 0 3 0 1 3 4 5 6 4 1 1 28 000 000 210 000 100 120 220 500 321 301 100 100 19 7 2 1983 0 0 0 0 0 1 3 6 3 5 5 2 25 000 000 000 000 000 010 300 231 111 320 320 020 12 11 2 1984 0 0 0 0 0 2 5 7 4 8 3 1 30 000 000 000 000 000 020 410 232 130 521 300 100 16 11 3 1985 2 0 0 0 1 3 1 7 5 5 1 2 27 020 000 000 000 100 201 100 520 320 410 010 110 17 9 1 1986 0 1 0 1 2 2 2 5 2 5 4 3 27 000 100 000 100 110 110 200 410 200 320 220 210 19 8 0 1987 1 0 0 1 0 2 4 4 7 2 3 1 25 100 000 000 010 000 110 400 310 511 200 120 100 18 6 1 1988 1 0 0 0 1 3 2 5 8 4 2 1 27 100 000 000 000 100 111 110 230 260 400 200 010 14 12 1 1989 1 0 0 1 2 2 6 8 4 6 3 2 35 010 000 000 100 200 110 231 332 220 600 300 101 21 10 4 1990 1 0 0 1 2 4 4 5 5 5 4 1 31 100 000 000 010 110 211 220 500 410 230 310 100 21 9 1 1991 0 0 2 1 1 1 4 8 6 3 6 0 32 000 000 110 010 100 100 400 332 420 300 330 000 20 10 2 (TABLE CONTINUED ON TOP OF NEXT PAGE)

29
Table 3-2 (CONTINUED FROM PREVIOUS PAGE) YEAR JAN FEB MAR APR MAY JUN JUL AUG SEP OCT NOV DEC TOTALS 1992 1 1 0 0 0 3 4 8 5 6 5 0 33 100 010 000 000 000 210 220 440 410 510 311 000 21 11 1 1993 0 0 2 2 1 2 5 8 5 6 4 3 38 000 000 011 002 010 101 320 611 410 321 112 300 21 9 8 1994 1 0 1 0 2 2 9 9 8 7 0 2 41 001 000 100 000 101 020 342 630 440 511 000 110 21 15 5 1995 1 0 0 0 1 2 3 7 7 8 2 3 34 001 000 000 000 010 020 210 421 412 512 020 012 15 11 8 1996 0 1 0 2 2 0 7 10 7 5 6 3 43 000 001 000 011 110 000 610 433 610 212 132 111 21 12 10 1997 1 0 0 2 3 3 4 8 4 6 1 1 33 010 000 000 110 120 300 310 611 310 411 100 100 23 8 2
(1959-1996) MEAN 0.6 0.3 0.6 0.8 1.3 2.1 4.6 6.5 5.8 4.8 3.0 1.5 31.9
CASES 22 11 23 29 48 79 175 248 219 182 113 57 1206
The criteria used in TABLE 3-2 are as follows:
1) If a tropical cyclone was first warned onduring the last two days of a particular month andcontinued into the next month for longer than twodays, then that system was attributed to the secondmonth.
2) If a tropical cyclone was warned on prior tothe last two days of a month, it was attributed tothe first month, regardless of how long the systemlasted.
3) If a tropical cyclone began on the lastday of the month and ended on the first day of the
next month, that system was attributed to the firstmonth. However, if a tropical cyclone began on thelast day of the month and continued into the nextmonth for only two days, then it was attributed tothe second month.
Figure 3-1 Tropical cyclones of tropical storm or greaterintensity in the western North Pacific (1960-1997).
Figure 3-2 Number of western North Pacific supertyphoons (1960-1997).
The annual mean genesislocation of TCs which form in theWNP is related to the status of ENSO:it tends to be east of normal duringEl Niño years and west of normalduring those years characterized bylarge-scale climatic anomaliesopposite to those of El Niño, yearsknown as La Niña or ENSO cold phase.Consistent with the TC distributiontypically associated with El Niño (oran ENSO warm phase), the annual meangenesis location for all TCs during1997 was substantially east of normal(Figure 3-5a). This was a pronounced
change from the TC distributionsduring 1995 and 1996 (both weak LaNiña years) when this statistic waswest of normal. A breakdown of thegenesis locations of the individualWNP TCs of 1997 (Figure 3-5b) showsthat most formed east of 140E. Elevenformed east of 160E, while only two -- two below normal -- formed in theSouth China Sea. Through the periodof 1960 to 1991, the five years withthe highest annual average of theSouthern Oscillation Index (SOI)(i.e., 1988, 1975, 1974, 1973,
TABLE 3-2 LEGENDTotal for the month/year
Typhoons
Tropical Storms
Tropical Depressions
3323 8 2
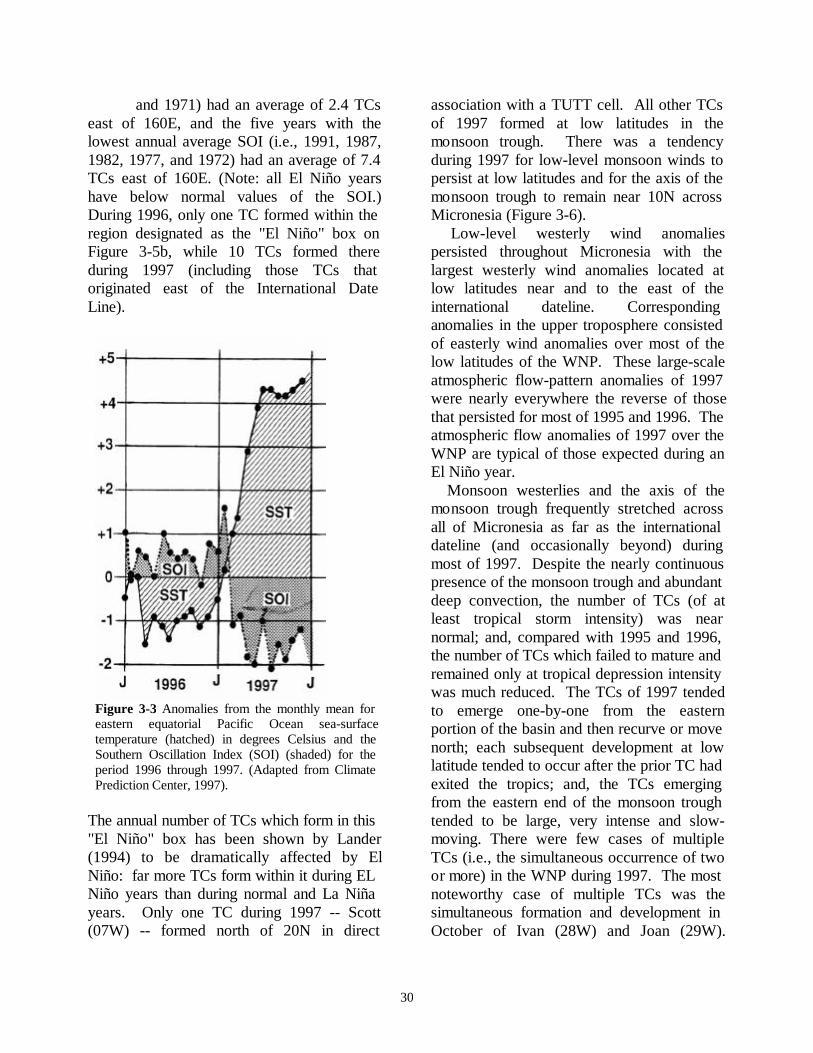
30
and 1971) had an average of 2.4 TCseast of 160E, and the five years with thelowest annual average SOI (i.e., 1991, 1987,1982, 1977, and 1972) had an average of 7.4TCs east of 160E. (Note: all El Niño yearshave below normal values of the SOI.)During 1996, only one TC formed within theregion designated as the "El Niño" box onFigure 3-5b, while 10 TCs formed thereduring 1997 (including those TCs thatoriginated east of the International DateLine).
Figure 3-3 Anomalies from the monthly mean foreastern equatorial Pacific Ocean sea-surfacetemperature (hatched) in degrees Celsius and theSouthern Oscillation Index (SOI) (shaded) for theperiod 1996 through 1997. (Adapted from ClimatePrediction Center, 1997).
The annual number of TCs which form in this"El Niño" box has been shown by Lander(1994) to be dramatically affected by ElNiño: far more TCs form within it during ELNiño years than during normal and La Niñayears. Only one TC during 1997 -- Scott(07W) -- formed north of 20N in direct
association with a TUTT cell. All other TCsof 1997 formed at low latitudes in themonsoon trough. There was a tendencyduring 1997 for low-level monsoon winds topersist at low latitudes and for the axis of themonsoon trough to remain near 10N acrossMicronesia (Figure 3-6). Low-level westerly wind anomaliespersisted throughout Micronesia with thelargest westerly wind anomalies located atlow latitudes near and to the east of theinternational dateline. Correspondinganomalies in the upper troposphere consistedof easterly wind anomalies over most of thelow latitudes of the WNP. These large-scaleatmospheric flow-pattern anomalies of 1997were nearly everywhere the reverse of thosethat persisted for most of 1995 and 1996. Theatmospheric flow anomalies of 1997 over theWNP are typical of those expected during anEl Niño year. Monsoon westerlies and the axis of themonsoon trough frequently stretched acrossall of Micronesia as far as the internationaldateline (and occasionally beyond) duringmost of 1997. Despite the nearly continuouspresence of the monsoon trough and abundantdeep convection, the number of TCs (of atleast tropical storm intensity) was nearnormal; and, compared with 1995 and 1996,the number of TCs which failed to mature andremained only at tropical depression intensitywas much reduced. The TCs of 1997 tendedto emerge one-by-one from the easternportion of the basin and then recurve or movenorth; each subsequent development at lowlatitude tended to occur after the prior TC hadexited the tropics; and, the TCs emergingfrom the eastern end of the monsoon troughtended to be large, very intense and slow-moving. There were few cases of multipleTCs (i.e., the simultaneous occurrence of twoor more) in the WNP during 1997. The mostnoteworthy case of multiple TCs was thesimultaneous formation and development inOctober of Ivan (28W) and Joan (29W).

31
These two TCs formed simultaneously alonga segment of the monsoon trough axis, whichstretched across the Marshall Islands andeastward beyond the international dateline.Moving west-northwestward, these two TCsintensified and, while in the Philippine Sea,they simultaneously attained an extremeintensity of 160 kt (82 m/sec) -- the first timein the JTWC archives that two TCs of suchextreme intensity co-existed in the WNP.The westernmost of these TCs, Ivan (28W),was the first and only TC of 1997 to makelandfall in the Philippine archipelago. Itgrazed the northern tip of Luzon beforerecurving behind Joan (29W). The lownumber of landfalling TCs in the Philippinesand along the coast of Asia (excluding Japan)may be partly related to El Niño (e.g., Dong1988). Despite the low number of TCs tomake landfall in eastern Asia, two that did,Winnie (10W) and Linda (31W), weresignificant natural disasters which causedmuch loss of life and great destruction at theirrespective landfall sites in China andVietnam.Mainland Japan, the Ryukyu Islands, theBonin Islands, and the Mariana Islands wereeach affected by several typhoons. The lastTC of 1997 in the WNP, Paka (05C), affectedthe Marshall Islands and the island of Guamand Rota. The tracks of the TCs, which formed in theWNP during 1997, indicate a below-normalnumber of TCs in the South China Sea, and abelow-normal number of straight-movingtracks. By contrast, there were a largenumber of TCs that moved northward, eitheron north-oriented tracks or conventionalrecurving tracks. Of the 33 significant TCs inthe WNP during 1997, 8 (24%) were straightmoving, 15 (46%) were recurvers, 6 (18%)moved on north-oriented tracks, and 4 (12%)were designated as "other". In summary, a chronology of all the TCactivity in the JTWC AOR during 1997 isprovided in Figure 3-7. Composite besttracks for the WNP TCs are provided for the
periods: 01 January to 02 August (Figure 3-8a), 21 July to 22 September (Figure 3-8b),and 17 September to 22 December (Figure 3-8c). Table 3-3 includes: a climatology oftyphoons, and tropical storms/typhoons forthe WNP for the period 1945-1997.
Figure 3-4 Comparison between climatological(black) and analyzed (shaded) mean monthly windswith a westerly component for the WNP in 1997. ForJune, July, and August the area of coverage is shiftednorthward to include the subtropics. For reference,the star indicates Guam's location. The outline ofAustralia appears in the lower left of each panelexcept for June, July and August where the Koreanpeninsula and Japan appear in the upper left. Theclimatology is adapted from Sadler et al. (1987). The1997 monthly mean winds were adapted from theCPC (1997).
3.1.1 Monthly Activity Summary
JANUARY

32
Beginning during November of 1996,episodes of strong low-level monsoonwesterlies began to occur in the low latitudesof the WNP. Most of the WNP TCs ofNovember and December 1996 wereassociated with these episodes of enhancedlow-level westerly wind flow. Thesimultaneous occurrence of TCs in theSouthern Hemisphere -- some of them twinsto the WNP TCs -- was a signaturecharacteristic of the TC distribution as 1996came to a close. Although the monsoontrough of the southern hemisphere became thedominant site of TC development by Januaryof 1997, there were some episodes ofenhanced westerly wind flow along theequator associated with a concurrentestablishment of a near-equatorial trough inthe WNP. During just such time of enhancedwesterly flow along the equator, the tropicaldisturbance which became Hannah (01W)formed in the near-equatorial trough south ofthe Marshall Islands. Moving on a longwestward track for over two weeks, it reacheda peak intensity of 50 kt (26m/s), and thendissipated in the Philippine Sea. Many ofTCs of 1997 (including Hannah) shared theunusual characteristic of forming well to theeast of normal: a typical behavior of TC'sduring an El Niño year. Although TropicalStorm Hannah was in most aspects relativelyunremarkable, it was, in retrospect, an earlymanifestation of an unusual large-scaletropical circulation pattern which would seemany of the TC's of 1997 form well east ofnormal in the Marshall Islands. We nowknow that the weather events over the lowlatitudes of the western Pacific during the late1996 and early 1997 may be looked upon asthe antecedent (or onset) conditions leading tothe development of strong El Niño conditionsby April of 1997. An eastward displacement
of the mean genesis location of TCs in theWNP is a hallmark signature of El Niño.
FEBRUARY In keeping with February's climatology asthe month of lowest TC frequency in theWNP, there were no significant TCs in theWNP basin during February.
MARCH There were no significant tropical cyclonesin the WNP basin during March.
APRIL During most of April, a monsoon troughstretched across Micronesia and westerlylow-level winds persisted at low latitudes.During the final week of the month, sea-levelpressure fell across the eastern CarolineIslands, abundant deep convection increased,and a monsoon depression developed. Thismonsoon depression moved westward andbecame Super Typhoon Isa (02W) -- thefirst of 11 super typhoons, the most ever in asingle year -- to occur in 1997. Passing to thesouth of Guam on 16 April, Isa produced upto 10 inches (250 mm) of rain and wind guststo near 60 kt (31 m/sec). Moving into thePhilippine Sea late in the month, the typhoonturned to the north, intensified to a supertyphoon, and then recurved over water to thesoutheast of Japan. As Isa was recurving, monsoon westerliespersisted in low levels of Micronesia, andextended to the international dateline.Tropical Storm Jimmy (03W) formed a lowlatitude in a near-equatorial trough whichextended across the southern MarshallIslands. This small TC moved northwest andintensified, reaching a peak of 55 kt (28m/sec) as it made a turn to the northeast. Itthen encountered a shear line and dissipatedover water during the final week of April.
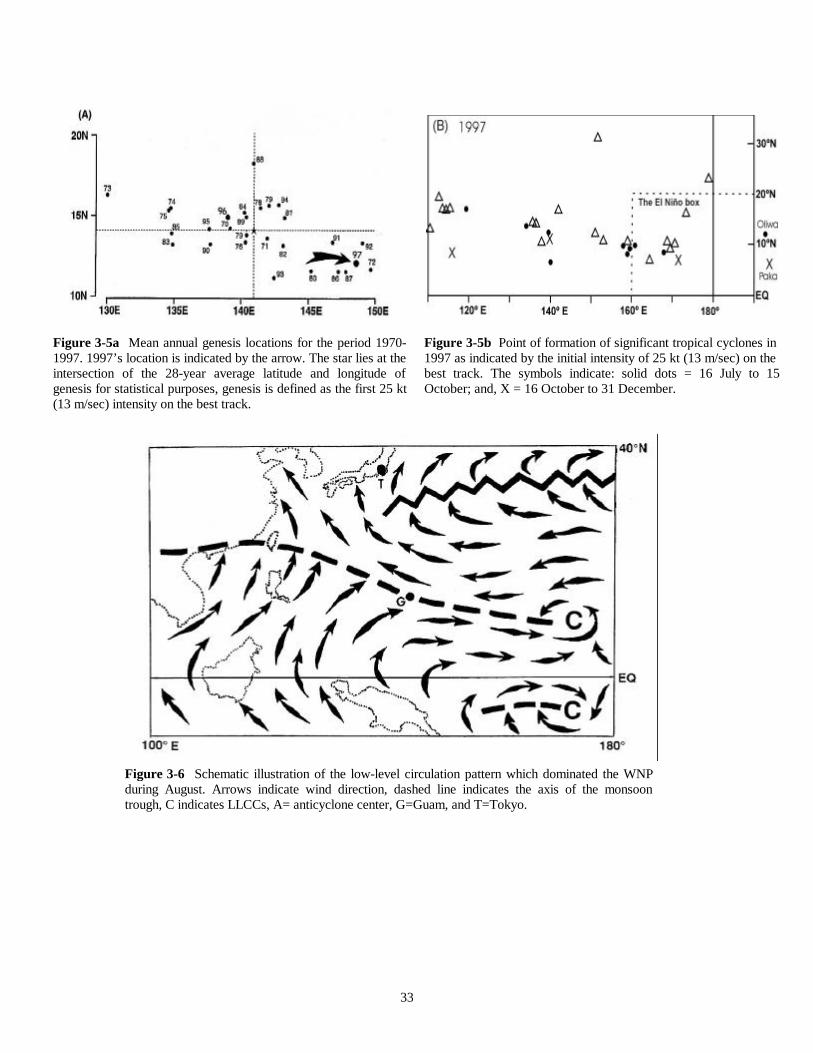
33
Figure 3-5a Mean annual genesis locations for the period 1970-1997. 1997’s location is indicated by the arrow. The star lies at theintersection of the 28-year average latitude and longitude ofgenesis for statistical purposes, genesis is defined as the first 25 kt(13 m/sec) intensity on the best track.
Figure 3-5b Point of formation of significant tropical cyclones in1997 as indicated by the initial intensity of 25 kt (13 m/sec) on thebest track. The symbols indicate: solid dots = 16 July to 15October; and, X = 16 October to 31 December.
Figure 3-6 Schematic illustration of the low-level circulation pattern which dominated the WNPduring August. Arrows indicate wind direction, dashed line indicates the axis of the monsoontrough, C indicates LLCCs, A= anticyclone center, G=Guam, and T=Tokyo.

34
MAY As the month of May began, monsoonwesterlies persisted across the low latitudes ofthe eastern half of Micronesia. TropicalStorm Kelly (04W), like Jimmy (03W) twoweeks earlier, formed at low latitude in thesouthern Marshall Islands. It was a relativelyweak TC, which moved slowly to thenorthwest, then after heeling over to a fasterwestward track, it dissipated over water.During mid-May, the tropics of the WNPbecame inactive. The next episode of TC developmentcommenced during the final week of Maywhen two TCs -- Tropical Storm Levi(05W) and Typhoon Marie (06W) -- formedat opposite ends of the basin: Levi in theSouth China Sea and Marie at low latitudenear 160E. While still a depression, Levimoved eastward across Luzon where itcaused severe flooding in Metro-Manila.Ivan (27W) was the only mature system to hitthe Philippines. After entering the PhilippineSea, it turned to the north, reached itsmaximum intensity of 45 kt (23 m/sec), andeventually recurved on 28 May, merging withthe Mei-Yu front south of Japan. Marieinitially moved westward, then turned to thenorth and maintained a northward track forseveral days. While intensification wasinitially slow, Marie eventually reached amaximum intensity of 90 kt (47 m/sec).Shortly thereafter, Marie recurved andeventually became extratropical.
JUNE Levi and Marie were still active in earlyJune as they accelerated into midlatitudes,became extratropical, and crossed theinternational dateline to become mid- latitudelows northwest of Hawaii. Low-latitudemonsoon westerlies continued to persistacross Micronesia during June, and three TCs-- Nestor (07W), Opal (08W) and Peter(09W) -- formed in the monsoon trough.
Super Typhoon Nestor (07W) began as amonsoon depression in the Marshall Islands.It moved toward the west-northwest andslowly intensified. After becoming a tropicalstorm, it jogged to the north-northwestpassing to the east and over the top of theMariana Island chain. It became the secondsuper typhoon of the season when locatedabout 200 nm (370 km) northeast of Saipan(WMO 91232). Undergoing another synoptic-scale meander, it swung back to anorthwesterly track before undergoingrecurvature to the east of Japan. As Nestor (07W) recurved, anothermonsoon depression -- originating in theeastern Caroline Islands -- consolidated andbecame Typhoon Opal (08W). Opal movedon a north oriented track and began to rapidlyintensify, but ran into westerly shear as itreached its maximum intensity of 90 kt (47m/sec). It then turned to the northeast andbecame the first TC of the season to hit Japan,making landfall in southern Honshu. Opalthen accelerated north of Tokyo, entered thePacific Ocean, and became extratropical. After Opal (08W) recurved, anothermonsoon depression, originating again in theeastern Caroline Islands, consolidated andbecame Typhoon Peter (09W). During thelast week of June, Peter approached Luzon,but then turned north and became a minimaltyphoon of 65 kt (34 m/sec) as it neared theRyukyu Island Chain. After Peter reached30N, it turned to the northeast, made landfallin Kyushu, and traversed nearly the entirelength of Honshu. Exiting Honshu andmoving over water, the TC reintensified tobecome a typhoon once again as it passed tothe south of the Kamchatka peninsula.
JULYDuring the first few days of July, TyphoonPeter (09W) moved eastward at high latitudeand slowly weakened. It crossed theinternational dateline and became a weak

35
extratropical low on 04 July. During the firsthalf of July there was a break in TC activity. There wasn't another named TC in theWNP basin until 19 July when SuperTyphoon Rosie (10W) was upgraded from atropical depression to a tropical storm. Rosieformed as a monsoon depression at lowlatitudes to the south of Guam. It moved on anorth-oriented track and became the year'sthird super typhoon while it was movingtoward the north approximately 600 nm (1110km) east-northeast of Luzon. During the lastweek of July, Rosie made landfall on thesouth coast of Shikoku, and then passedacross Honshu into the Sea of Japan where itstalled and weakened. The remnants of Rosie,drifted southeastward back across Honshuand dissipated over water southwest ofTokyo. While most of the tropical cyclones haddeveloped in the monsoon trough in theeastern and western parts of the basin, thebirth of Tropical Storm Scott (11W)occurred north of 20N in direct associationwith a cyclonic circulation in the TropicalUpper Tropospheric Trough. As TD 11W, thesystem interacted with the outflow of SuperTyphoon Rosie (10W), and was steered to thesoutheast for a few days. It eventually turnedto the northwest for 24 hours, then recurvedand reached its maximum intensity of 55 kt(29 m/sec). Scott spent its entire life overwater. Like so many other 1997 tropicalcyclones, the disturbance that becameTyphoon Tina (12W) developed in the ElNiño-induced monsoon trough in the easternCaroline Islands. Organization was very slowfor over a week as the disturbance moved tothe northwest. On 29 July, the systembecame TD 12W and on 05 August it reachedits 90 kt (47 m/sec) maximum intensity. Tinathen turned to the north, passed betweenTaiwan and Okinawa, made landfall insouthern Korea, and dissipated in the Sea ofJapan on 10 August.
As Tina was developing in the eastern partof the basin, the cloud system that becameTyphoon Victor (13W) was consolidatingtogether west of Luzon in the South ChinaSea. The system moved on a northward trackand intensified slowly against northerlyupper-level shear. It finally reached minimaltyphoon intensity just prior to making landfallnear Waglin Island, Hong Kong on 02August.
AUGUST August was an extremely busy with a totalof ten TCs spending some part of their life inthe month. As Tina (12W) and Victor (13W)were maturing in the western portion of theWNP basin, yet another monsoon depressionwas developing in association with El Nino-induced westerlies in the Marshall Islands.The new monsoon depression soon reachedtropical storm intensity, and then intensifiedinto Super Typhoon Winnie (14W), thefourth of the eleven super typhoons. Winniewas unique in that as it moved towardOkinawa, a large rain band completelyencircled the eye wall cloud, producing anouter eye wall cloud with a diameter of nearly200 nm (370 km), one of the largest everobserved. Doppler radar at Kadena AB(Okinawa) clocked winds of 100 kt (52m/sec) in the outer eye wall cloud. Winnielater made landfall south of Shanghai, Chinaand dissipated rapidly. Torrential rainsassociated with Winnie caused considerabledeath and destruction in China. As Winnie was forming its unusualconcentric eye wall clouds, Typhoon Yule(15W) and Tropical Depression 16 (TD16W) were organizing in the prolificmonsoon trough that extended from east ofthe international dateline westward to theCaroline Islands. The disturbance thatbecame Yule began at the extremely lowlatitude of 03N, while the system that became16W started east of the Date Line. The twosystems engaged in a direct interaction, with

36
Yule moving to the north-northeast andTD16W moving to the west. The twosystems eventually merged with Yulebecoming the dominant circulation. Yulebriefly attained typhoon intensity, and after along north-oriented track, it became anintense tropical-extratropical hybrid systemwith typhoon-force winds. The weakenedsystem finally recurved at almost 50N. Typhoon Zita (17W) was one of the threeTCs to reach typhoon intensity in the SouthChina Sea, and one of four TCs to develop inthe monsoon trough in a 8-day period. Itdeveloped in the monsoon trough about 300nm (560 km) to the west of Luzon and movedin a northward direction. The system rapidlymoved into easterly steering flow and turnedto the west. Despite its proximity to theChina mainland, it intensified significantly,reaching a maximum intensity of 75 kt (39m/sec) over the Luichow Peninsula. Zitamaintained this strength across the Gulf ofTonkin, and made landfall in Vietnam on themorning of 23 August. The pre-Typhoon Amber (18W)disturbance developed southwest of Guamand took a slow westward, thennorthwestward track toward Taiwan. Amberintensified slightly faster than the normalDvorak one T-number per day, and hadreached 100 kt (52 m/sec) on the morning of25 August. At this time, Tropical StormCass (20W) began to form southwest ofAmber in the South China Sea, about 160 nm(296 km) south of Hong Kong. Shear fromthe outflow from Typhoon Amber inhibitedCass' intensification. On 28 August, the twoTCs underwent a binary interaction, whichaccelerated Amber toward Taiwan and causedCass to move slowly to the east. After somevacillation in intensity, Amber reached itspeak of 110 kt (57 m/sec) just prior to hittingTaiwan on 29 August. Amber weakened overthe mountainous island, and later madelandfall on mainland China. Tropical StormCass (20W) was very short-lived, spending
only 2.5 days in warning. Once Amber moveover Taiwan, Cass moved to the north andintensified to its peak of 45 kt (23 m/sec).Cass made landfall in mainland China, 150nm (278 km) west of Taiwan, and laterdissipated over the mountains of southernChina. While Amber (18W) was developingsouthwest of Guam, the disturbance destinedto become Super Typhoon Bing (19W) wasdeveloping near the eastern extent of themonsoon trough in the Marshall Islands. Thesystem was upgraded to TD 19W on 27August and tracked westward at 13-15 kt (24-28 km/hr) toward the Mariana Islands. Onthe afternoon of 29 August, Tropical StormBing passed through the channel thatseparates Guam and Rota with 40-kt (21-m/sec) sustained winds. After passing Guam,Bing began to rapidly intensify, and 54 hourslater, it reached its peak intensity of 135 kt(70 m/sec), becoming the fifth super typhoonof the season. Near 143E, Bing slowed itsforward motion and turned to the north.Shortly thereafter, it accelerated to a speed of11-13 kt (20-24 km/hr), maintainingnorthward motion for three days, until itrecurved to the northeast about 300 nm (555km) south of eastern Japan. Bing's forwardspeed accelerated to 30 kt (56 km/hr) as ittransitioned into a 55-kt (29 m/sec)extratropical cyclone on 05 September.
SEPTEMBER September was also a busy month withfive TCs. At the end of August, a tropicaldisturbance formed to the southwest ofHawaii in the monsoon trough displaced farto the east as a result of the intense El Niñoevent. The disturbance would eventuallybecome Super Typhoon Oliwa (02C) (aHawaiian name -- pronounced "Oh'-lee-vah")after it crossed the international dateline.Oliwa reached tropical storm intensity in theCentral North Pacific and proceeded on awestward track, crossing the dateline on 04
37
September. In the WNP, Oliwa intensifiedslowly to typhoon intensity, then explosivelydeepened, with its winds increasing from 75kt (39 m/sec) to its peak of 140 kt (72 m/sec)in only 24 hours. Super Typhoon Oliwa (02C)continued it's west-northwest motion, slowlyweakening. At mid-month, it recurvednortheast of the Ryukyu Islands and madelandfall in southern Kyushu with an intensityof 70 kt (36 m/sec), causing some deaths andconsiderable destruction. Oliwa dissipated inthe Sea of Japan. The disturbance that became TyphoonDavid (21W), initially developed east of thedateline in the active monsoon trough. TD21W moved to the northwest, intensifying ata normal one T-number/day rate. The systemwas large, and the northward component wasattributed to the "Beta effect" of its large size.David attained its maximum intensity of 95 kt(49 m/sec) on the morning of 15 September.Typhoon David recurved, passed south ofJapan, and became extratropical on 21September en route to the Gulf of Alaska. While David (21W) was recurvingsoutheast of Japan, the disturbance thatbecame Super Typhoon Ginger (24W), wasconsolidating near the international datelineas one of 10 TCs which formed east of 160Eand south of 20N -- within the El Niño box(See Figure 3-3a). Ginger moved on a north-oriented track in the eastern portion of theWNP basin. Ginger underwent a 24-hourperiod of explosive deepening, and as itneared its peak intensity of 145 kt (75 m/sec),the typhoon possessed an extensive system ofprimary and peripheral rain bands. WhenGinger reached 30N, it accelerated within themid-latitude westerlies where it transitionedinto a vigorous extratropical low . Typhoon Fritz (22W) was first seen as anarea of enhanced convection in the SouthChina Sea. As the system moved away fromthe coast of Vietnam, it slowly intensified.After a few days of eastward movement, Fritzturned back to the west toward Vietnam and
continued to intensify. It reached its peakintensity of 75 kt (39 m/sec), which itmaintained until it made landfall in Vietnamon 25 September. The system dissipated overland, but torrential rains triggered landslidesthat took the lives of many gold prospectors. Tropical Storm Ella (23W) developed asa very small circulation east of the dateline.By 21 September, convection had becomewell-organized, abeit small (30 nm (56 km),over the system center. Ella sped to the west-northwest at 18-25 kt (33-46 km/hr), reachedits maximum intensity of 40 kt (21 m/sec) on22 September, recurved and dissipated on 24September near 40N 170E.
OCTOBERTropical Storm Hank (25W) was theshortest-lived tropical cyclone of the season,with warnings issued for only 36 hours. Thedisturbance that became Hank, was firstobserved on 27 September in the South ChinaSea, but the first warning was not issued until03 September. The system moved erratically,and upper-level wind shear prevented it fromintensifying beyond 40 kt (21 m/sec). Hankmade landfall in northern Vietnam on 05September and dissipated soon thereafter. As Hank was developing in the SouthChina Sea, Tropical Depression 26W (TD26W) formed southeast of Guam. Thedisturbance initially moved northward, thenhealed over to the west and passed north ofGuam on 03 October, where it attained itsmaximum intensity of 30 kt (16 m/sec). TD26W maintained this intensity for three moredays, but strong westerly upper level shearnever allowed it to intensify. As an exposedlow level circulation, TD 26W merged with afrontal boundary over the Philippine Sea. Super Typhoon Ivan (27W) and SuperTyphoon Joan (28W) were two of three TCsin the WNP during 1997 to attain an extremeintensity of 160 kt (82 m/sec), and were the8th and 9th of 1997's unprecedented numberof 11 super typhoons. An equatorial westerly

38
wind burst associated with the El Niñopreceeded the formation of Ivan, Joan and aSouthern Hemisphere twin -- TropicalCyclone Lusi (02P). After developing, Ivanmoved to the west-northwest and eventuallypassed 55 nm (102 km) south of Guam. From150600Z to 171800Z, Ivan intensified from65 kt (34 m/sec) to 160 kt (83 m/sec). Thetyphoon continued its westward movement,becoming the first and only named TC in1997 to hit the Philippines. Ivan recurved inthe Luzon Strait, and after weakening,became extratropical south of Japan. Joandeveloped just east of Ivan, and took a similartrack to the west, but passed 155 nm (287 km)north of Guam. Joan explosively deepened,intensifying from 70 kt (36 m/sec) to 160 kt(83 m/sec) in 36 hours -- a deepening rate of2.8 mb per hour. Joan remained at or abovethe super typhoon threshold (130 kt, 68m/sec) for 4.5 days -- a record. Joan and Ivanwere the two most intense TCs ever seen toexist simultaneously. Joan slowly weakened,finally recurved, and while traveling eastwardalong 30N, became an intense extratropicalcyclone. As Ivan and Joan began to recurve, yetanother disturbance was developing in the ElNiño-induced monsoon trough in the easternCaroline and Marshall Islands. Thisdisturbance would become the tenth of eleven1997 super typhoons -- Super TyphoonKeith (29W). After several days of westwardmovement and difficulty in organizing, thesystem finally consolidated and began tointensify at a normal rate of one Dvorak "T-number" per day. Once it reached 105 kt (55m/sec), the typhoon began to rapidlyintensify, peaking at 155 kt (81 m/sec) in just24 hours. The small eye and narrow wallcloud of Keith passed between the islands ofSaipan and Rota in the Mariana Islands, andno island endured the full force of thetyphoon. Keith remained a super typhoon for3.5 days as it moved to the northwest at theend of the month. On 04 November , Super
Typhoon Keith's (29W) forward motionslowed, and the typhoon began to weaken andrecurve. A few days later, a weakened Keithwas speeding at 45 kt (83 km/hr) to the east-northeast and becoming extratropical.
NOVEMBER The disturbance that became TyphoonLinda (30W), developed near the end ofOctober near 10N about 200 nm (370 km)east of the Philippines. The system movedwestward and reached tropical storm intensitywithin 24 hours of moving into the SouthChina Sea. The system continued to intensifyas it approached the Ca Mau province ofVietnam on 02 November, and reachedtyphoon intensity in the Gulf of Thailand.The typhoon weakened while crossing theMalay Peninsula, but reintensified in the Bayof Bengal. Linda was the first TC sinceTyphoon Forrest (30W) in 1992 tosuccessfully make this low latitude trek.After attaining typhoon intensity in the Bayof Bengal on 06 November, Linda ran intoprogressively more severe wind shear, andfour days later, it dissipated over the Bay.Linda caused considerable damage and lossof life in Vietnam. Typhoon Mort (31W) was the last TC ofNovember and the last 1997 TC to form westof the international dateline. Mort began in aweak monsoon trough south of Guam. Thesystem moved to the west and reached itmaximum intensity of 65 kt (34 m/sec) in thePhilippine Sea on 12 November. Mort peakedat 55 kt (29 m/sec), before it again ran intostrong shear, which pushed the convection tothe south at the low-level circulation center.On 16 November, Mort made landfall on theeast coast of Luzon as a tropical depression.
DECEMBER No TCs originated in the WNP duringDecember 1997, and were it not for the entryof Super Typhoon Paka (05C) into the basinfrom the central North Pacific, it is probable

39
that there would have been no TCs in theWNP during December. Trade winds dominated the tropics of theWNP for most of December. Anomalouseasterly wind flow became established at lowlatitudes, except at eastern longitudes near theinternational dateline where El Niño-relatedlow-level westerly wind flow persisted. Themajority of monsoon-related deep convectionhad moved to the east of the internationaldateline, and twin near equatorial troughsextended along 8N and 5S from near 160E tothe south of Hawaii at about 160W. Atropical storm -- Paka (05C) -- which hadformed south of Hawaii during lateNovember, moved steadily westward duringDecember. It crossed the International DateLine on 07 December, and became a typhoonin the Marshall Islands. Continuing on awest-northwestward track, it intensified into asuper typhoon and passed over Guam on 16December, where the 600 million dollar levelof destruction resulted in a Presidentialdeclaration of Guam as a disaster area.Reliable measurements of wind gusts onGuam were as high as 149 kt (77 m/sec) and
storm total rainfall amounts in excess of 15inches (635 mm) occurred. Paka continued tomove west-northwestward into the PhilippineSea where it eventually dissipated over waterafter reaching an extreme estimated intensityof 160 kt (82 m/sec). With the dissipation of Paka, the "year ofthe super typhoon" in the western NorthPacific came to a close. At the end ofDecember, high pressure, persistent easterlywinds, and reduced amounts of deepconvection prevailed in the tropics of thebasin. ENSO-related drought conditionsworsened to record proportions inMicronesia, and TC activity shifted into theSouthern Hemisphere with a classical El Niñoshift to the east. During 1997 for the western North Pacific,JTWC issued 950 warnings. Super TyphoonsPaka (05C) and Oliwa (02C) were the longestlived TCs of the year, requiring 78 and 59warnings respectively, even after movingfrom their genesis regions in the central NorthPacific across the international dateline intothe JTWC area of responsibility.
Table 3-3 WESTERN NORTH PACIFIC TROPICAL CYCLONES
TYPHOONS (1945-1959) JAN FEB MAR APR MAY JUN JUL AUG SEP OCT NOV DEC TOTALS MEAN 0.3 0.1 0.3 0.4 0.7 1 2.9 3.1 3.3 2.4 2 0.9 16.4 CASES 5 1 4 6 10 15 29 46 49 36 30 14 245
TYPHOONS (1960-1997) JAN FEB MAR APR MAY JUN JUL AUG SEP OCT NOV DEC TOTALS MEAN 0.3 0.1 0.2 0.4 0.7 1.1 2.8 3.5 3.4 3.3 1.7 0.7 18 CASES 10 2 8 16 27 41 107 132 129 124 63 26 685
TROPICAL STORMS AND TYPHOONS (1945-1959) JAN FEB MAR APR MAY JUN JUL AUG SEP OCT NOV DEC TOTALS MEAN 0.4 0.1 0.5 0.5 0.8 1.6 2.9 4 4.2 3.3 2.7 1.2 22.2 CASES 6 2 7 8 11 22 44 60 64 49 41 18 332
TROPICAL STORMS AND TYPHOONS (1960-1997) JAN FEB MAR APR MAY JUN JUL AUG SEP OCT NOV DEC TOTALS MEAN 0.5 0.2 0.4 0.7 1.2 1.8 4.3 5.7 5.1 4.3 2.7 1.2 28.1 CASES 20 9 17 25 44 70 163 215 193 164 101 47 1068

40
TABLE 3-4 TROPICAL CYCLONE FORMATION ALERTS FOR THE WESTERN NORTH PACIFIC OCEAN FOR 1976-1997
YEAR INITIAL TCFAS TROPICAL CYCLONESWITH TCFAS
TOTAL TROPICALCYCLONES
PROBABILITY OFTCFA WITHOUT
WARNING*
PROBABILITY OFTCFA BEFORE
WARNING
1976 34 25 25 26% 100%1977 26 20 21 23% 95%1978 32 27 32 16% 84%1979 27 23 28 15% 82%1980 37 28 28 24% 100%1981 29 28 29 3% 96%1982 36 26 28 28% 93%1983 31 25 25 19% 100%1984 37 30 30 19% 100%1985 39 26 27 33% 96%1986 38 27 27 29% 100%1987 31 24 25 23% 96%1988 33 26 27 21% 96%1989 51 32 35 37% 91%1990 33 30 31 9% 97%1991 37 29 31 22% 94%1992 36 32 32 20% 100%1993 50 35 38 30% 92%1994 50 40 40 20% 100%1995 54 33 35 39% 94%1996 41 39 43 ,5% 91%1997 36 30 33 17% 91%(1976-1997)MEAN: 37 29 30 22% 97%TOTALS: 818 635 670
* Percentage of initial TCFA's not followed by warnings.
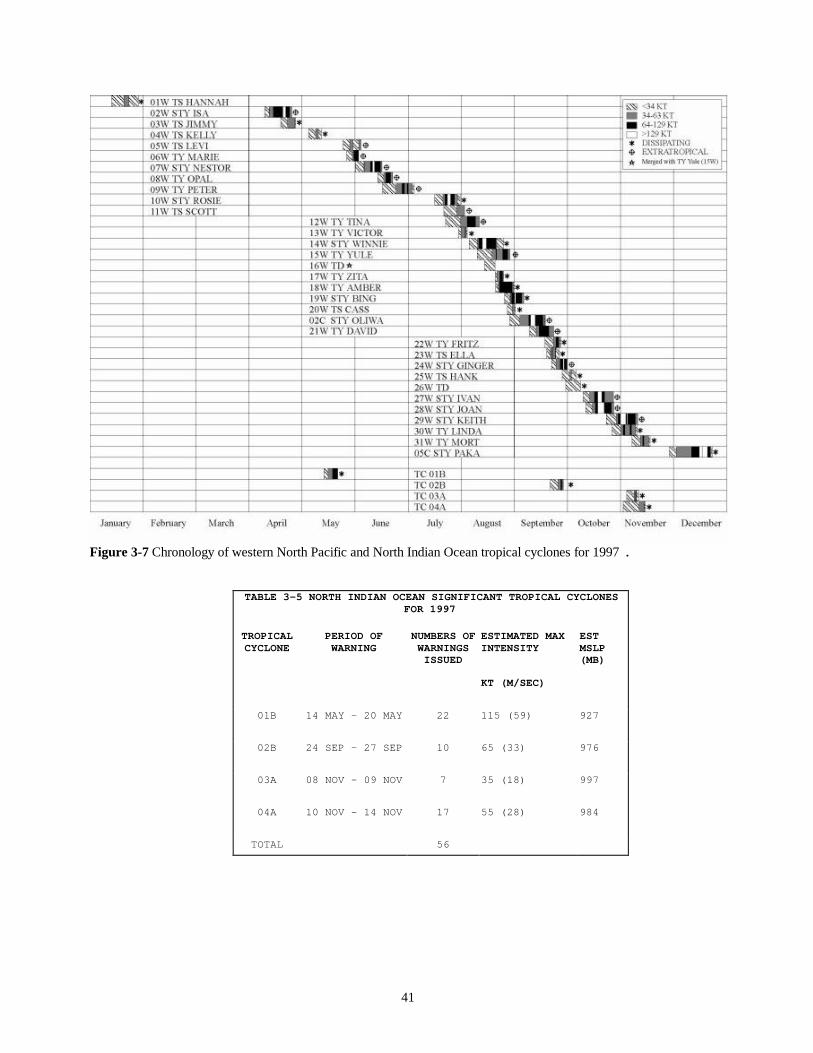
41
Figure 3-7 Chronology of western North Pacific and North Indian Ocean tropical cyclones for 1997 .
TABLE 3-5 NORTH INDIAN OCEAN SIGNIFICANT TROPICAL CYCLONESFOR 1997
TROPICALCYCLONE
PERIOD OFWARNING
NUMBERS OFWARNINGSISSUED
ESTIMATED MAXINTENSITY
ESTMSLP(MB)
KT (M/SEC)
01B 14 MAY - 20 MAY 22 115 (59) 927
02B 24 SEP - 27 SEP 10 65 (33) 976
03A 08 NOV - 09 NOV 7 35 (18) 997
04A 10 NOV - 14 NOV 17 55 (28) 984
TOTAL 56

42
Figure 3-8a Composite best tracks for the western North Pacific Ocean tropical cyclones for the period 01 January to 02 August 1997
Figure 3-8b Composite best tracks for the western North Pacific Ocean tropical cyclones for the period21 July to 22 September 1997
12W TINA 21 JUL – 10 AUG13W VICTOR 28 JUL – 04 AUG14W WINNIE 05 AUG – 23 AUG15W YULE 09 AUG – 27 AUG16W TD 13 AUG – 19 AUG17W ZITA 19 AUG – 23 AUG18W AMBER 19 AUG – 13 AUG19W BING 24 AUG – 06 SEP20W CASS 26 AUG – 31 AUG02C OLIWA 28 AUG – 17 SEP21W DAVID 09 SEP – 22 SEP

43
Figure 3-8c Composite best tracks for the western North Pacific Ocean tropical cyclones for the period 17 September to22 December 1997

44
Figure 3-01-1 The deep convection associated with thepre-Hannah tropical disturbance becomes betterorganized, and JTWC responds by issuing a TropicalCyclone Formation Alert. Note the large extent of low-level westerly winds along the equator and at lowlatitudes in both hemispheres implied by the distributionand pattern of the deep convection (182333Z Januaryinfrared GMS imagery).
TROPICAL STORM HANNAH (01W)
I. HIGHLIGHTS
The first named tropical cyclone of 1997,Hannah, developed from a tropicaldisturbance in a near-equatorial troughsouth of the Marshall Islands. Moving on along westward track for over two weeks, itreached a peak intensity of 50 kt (26m/sec), and then dissipated in thePhilippine Sea. Many of the tropicalcyclones of 1997 (including Hannah)shared the unusual characteristic of formingwell to the east of normal; a typicalbehavior of tropical cyclones during an ElNiño year.
II. TRACK AND INTENSITY
The tropical disturbance which becameHannah was first described on the 11January significant tropical weatheradvisory as an area of persistent deepconvection located at very low latitude(4ºN) and just to the west of theInternational Date Line (IDL). Thedisturbance remained poorly organized forseveral days as it moved steadilywestward along 4ºN. After a westwardjourney covering over 2000 nm (3700 km)in a period of one week, it began to showsigns of development. On 19 January,when the system was south-southwest of Guam, an increase in the amount of deep convectionand the presence of a low-level circulation center were detected by multi-spectral satelliteimagery (Figure 3-01-1) and synoptic data. This prompted JTWC to issue a Tropical CycloneFormation Alert valid at 00Z on 19 January. The first warning on Tropical Depression (TD) 01Wwas issued valid at 0600Z on the nineteenth based on a blend of synoptic data, scatterometerdata, and satellite intensity estimates, which indicated that the winds in the system had increasedto at least 25 kt (13 m/sec). Twelve hours later, at 191800Z, TD 01W was upgraded to TropicalStorm Hannah. This was based, once again, on a blend of synoptic data, scatterometer data, andsatellite intensity estimates which indicated intensification to 35 kt (18 m/sec). Hannah reachedpeak intensity of 50 kt (26m/sec) at 0600Z on 20 January based on conventional satelliteintensity estimates, and special sensor microwave imagery (SSM/I). These sources all indicated

45
that the deep convection and the low-level cloud lines had become organized into well-definedcyclonic bands. After 0600Z the cyclone approached a region of low-level northeasterly flowoverlaid by upper level southeasterly winds. Weakening ensued as vertical wind shear forced thedwindling amounts of deep convection to the northern quadrant. Hannah's motion became erraticon 21 January as the system began to interact with a shear line that trailed into the tropics from alarge and vigorous extratropical low moving eastward off the coast of Japan. Trapped at the endof the shear line, the areal extent of Hannah's deep convection began to rapidly diminish, and thefinal warning was issued valid at 1800Z on the 24th when the intensity had fallen to 25 kt (13m/sec) and further weakening was expected. Post analysis revealed that the remains of Hannahmaintained an intensity of about 25 kt (13m/sec) for the next three days as it moved slowlytoward Mindanao.
III. DISCUSSION
Although Tropical Storm Hannah was in most respects unremarkable, in retrospect it'sdevelopment can be seen as part of the unusual large-scale tropical circulation pattern associatedwith El Niño, which would cause many of the tropical cyclones of 1997 to form well east ofnormal. We now know that the weather events over the Pacific warm pool during late 1996 andearly 1997 may be looked upon as the antecedent (or onset) conditions leading to thedevelopment of strong El Niño conditions by April of 1997. An eastward displacement of themean genesis location of tropical cyclones in the western North Pacific is a signature of El Niño.
IV. IMPACT
No reports of significant damage or injuries were received at JTWC.

Tropical Storm Hannah (01W)11 Jan to 27 Jan 1997
MIN SLP 987 mbMAX INTENSITY 50 kt

46
SUPER TYPHOON ISA (02W)
I. HIGHLIGHTS
The first of eleven super typhoons to occur in the western North Pacific during 1997, Isa formedat a low latitude in the Caroline Islands along the axis of the near equatorial trough. On the nightof 16 April, Isa passed 140 nm (260 km) to the south of Guam. There was no significant damagereported (the peak wind gust on island was 61 kt (31 m/sec)), though peripheral rainbands of thetyphoon produced rainfall of 6 to 10 inches (15 to 25 cm) across the island. Most of the objectivetrack guidance available to JTWC turned Isa to the north well before it happened; a commonmodel bias that is identified and explained in the model-traits knowledge base of the "SystematicApproach".
II. TRACK AND INTENSITY
The tropical disturbance that became Isa developed in a near-equatorial trough that had becomeestablished across Micronesia. On 09 April, a large cloud cluster with the characteristics of amonsoon depression formed in the Caroline Islands, and was subsequently described in the 09April 0600Z Significant Tropical Weather Advisory (ABPW). Synoptic data and animatedsatellite imagery indicated that a large, weak, low-level cyclonic circulation accompanied thiscloud cluster. After several cycles of mesoscale cloud cluster growth, dissipation andregeneration, the system acquired a persistent and well-organized area of deep convection on 11April, prompting JTWC to issue a Tropical Cyclone Formation Alert (TCFA), valid at 0000Z.The first warning on Tropical Depression (TD) 02W was issued valid at 1800Z on 11 April,based on satellite intensity estimates of 30 kt (15 m/sec), cooling cloud tops, and increasedorganization of the outflow aloft.
TD 02W was a large tropical cyclone that intensified slowly. The strong, deep monsoonalwesterlies to its south prevented much movement from 0000Z on 10 April to 0000Z on 12 April.Based on satellite intensity estimates of 35 kt (18 m/sec), 02W was upgraded to Tropical StormIsa (02W) on the warning valid at 0600Z on 12 April. After becoming a tropical storm,intensification occurred more rapidly, and the system began to move toward the west-northwest.Isa was upgraded to a typhoon on the 13 April 1800Z warning. At this point, the motion of thesystem became more westward, and the rate of intensification slowed. During the six-day periodfrom 0000Z on the 14th to 0000Z on the 20th, the intensity of the typhoon steadily increasedfrom 65 kt (33 m/sec) to its peak of 145 kt (75 m/sec) (Figure 3-02-1). This rate of intensification(approximately one-half a T-number per day) is defined by Dvorak (1975, 1984) as slow.Approximately 36 hours prior to reaching peak intensity, Isa turned to the north, a major trackchange indicated by most of the numerical guidance for several days (although the models madethe turn far too early). Moving slowly north along 137E during the 24-hour period from 20 April0000Z to 21 April 0000Z, Isa began to weaken. At 0000Z, on 21 April, the typhoon turned to thenorth-northeast and doubled its forward speed to approximately 12 kt (22 km/hr) whilecontinuing to weaken. At 0000Z on the 22nd, the typhoon, having weakened to 80 kt (41 m/sec),began to accelerate in the midlatitude flow and the speed of translation increased from 12 kt (22

47
km/hr) to 17 kt (32 km/hr) at 0000Z on the 23rd, and to 24 kt (44 km/hr) at 1200Z on the 23rd.The final warning on Isa was issued valid at 0600Z on the 23rd, as the system accelerated to thenortheast and its cloud system became sheared. The remnants of Isa later merged with the cloudband on the northeast side of a vigorous extratropical low that had developed and movedeastward into the Pacific from northern Japan.
Figure 3-02-1 Isa near the time of its peak intensity. (a) Visible imagery within three hours of its besttrack peak (192131Z April visible GMS imagery) and (b) microwave imagery within two hours of the peak(200146Z April 85 GHz horizontally polarized microwave DMSP imagery).
Figure 3-02-2 A peripheral rainband on the northeast side of Isa remained in a fixed position over Guam forover 12 hours resulting in rainfall totals of up to 10 inches. (a) As Isa's eye moved westward away from Guam,heavy showers and thunderstorms embedded in an outer rainband were directed over the island for an extendedperiod (162029Z April NEXRAD base reflectivity). (b) The rainband as it appeared in microwave imagery(170805Z April 85 GHz horizontally polarized microwave DMSP imagery). (c) The narrowness of the ribbonof high amounts of rainfall is apparent on NEXRAD integrations of precipitation (NEXRAD storm-totalprecipitation ending at 172154Z April).

48
III. DISCUSSION
a. A Next-generation Radar (NEXRAD) view of Isa as itpassed Guam
Isa passed closest to Guam during the early morning of 17April. Most of the rainfall and the highest winds associatedwith the typhoon, however, occurred after Isa began movingaway from the island, and was associated with a peripheralrainband (see the NEXRAD display of Figure 3-02-2a and themicrowave imagery of Figure 3-02-2b). Twenty-four hourrainfall measurements on Guam approached 10 inches insome places. The NEXRAD storm-total precipitation product(Figure 3-02-2c) shows the narrow ribbon of very highrainfall produced over Guam (and adjacent ocean) by thenearly stationary typhoon rainband. Although the rainbandwas stationary, the convective elements within the band weremoving rapidly northwestward in deep-layer southeasterlyflow of 45-50 kt (23-26 m/sec).
b. Model biases
Numerical track prediction biases (predominantly those of the NOGAPS model), as described inthe "Systematic and Integrated Approach" to tropical cyclone forecasting (Carr and Elsberry1994), were observed in Typhoon Isa, particularly the NOGAPS tendency to prematurely turn awestward moving tropical cyclone to the north. Although JTWC forecasters were aware of themodel bias and delayed forecasting the turn, the actual delay was longer than anticipated. JTWCforecast Isa's northward turn to occur near its actual closest point of approach to Guam, leadingto over-forecasting of wind on the island. While the "Systematic Approach" deserves credit foralerting the forecaster's to the model's bias, and for correctly identifying that the northward turnwould eventually occur, the turn was delayed for a very long time relative to other examples ofthis type, as illustrated in Carr and Elsberry (1994) and in training materials devised for theJTWC forecasters. Recent work by Carr (personal communication) on the problem of prematurerecurvature in model guidance (e.g., NOGAPS and GFDN) has led to new findings. In the earlyformulations of the "Systematic Approach", there were only two scenarios in which thenumerical guidance tended to turn a westward moving tropical cyclone towards the north tooearly: 1) During cases of Indirect Tropical Cyclone Interaction, and 2) during cases of westwardmotion equatorward of a Dominant Subtropical Ridge when the model analysis of the tropicalcyclone was too large. An additional scenario has recently been identified, and applies to Isa:Premature recurvature forecasts also occur in the transition seasons (spring; and late fall throughearly winter) when the subtropical ridge is meridionally thin, particularly if the tropical cycloneis intense. Presumably the intense tropical cyclone in the model is too large and drives through aweakness in the thin ridge sooner than its real-world counterpart (as was the case with Isa) orindicates a false recurvature in the case of a straight runner (as was the case with 05C, Paka).
Figure 3-02-3 Most of the objectiveguidance available at the JTWC had apersistent and strong northward biasfor much of Isa's track. (NOGAPSforecasts out to 72 hours aresuperimposed over Isa's best track.

49
IV. IMPACT
No reports of significant damage or injuries were received at JTWC. Welcome dry-seasonrainfall of up to 10 inches (25 cm) was recorded on Guam as Isa passed near.

Super Typhoon Isa (02W)09 Apr to 23 Apr 1997
MIN SLP 892 mbMAX INTENSITY 145 kt

50
TROPICAL STORM JIMMY (03W)
The tropical disturbance that was tobecome Tropical Storm Jimmy (03W)formed in mid-April from the samelow-level equatorial westerly windsystem that produced Super TyphoonIsa (02W) and Tropical Cyclone 34P(Ian) a week earlier. First mention ofthe pre-Jimmy disturbance appearedon the 0600Z Significant TropicalWeather Advisory (ABPW) on 18April. After three days of trackingslowly to the west-northwest, the pre-Jimmy disturbance separated from thelow-latitude maximum cloud zone andbegan its intensification. JTWC issueda Tropical Cyclone Formation Alert(TCFA) at 0400Z on 22 April. Thesystem developed very rapidly and thefirst warning, valid at 0600Z on 22April, was for Tropical Storm Jimmy(03W). By this time, Isa had alreadybroken through the subtropical ridge,leaving the ridge weakened to non-existent west of 150E. Water vapor wind data showed southerly and southwesterly winds aloftover the Philippine Sea, preventing movement west of 150E. Jimmy tracked around the westernperiphery of the maritime subtropical ridge reaching 153E before recurving. Jimmy peaked justafter its recurvature at 55 kt (28 m/sec) in the low-shear environment near the subtropical ridgeaxis. After moving north of the subtropical ridge, Jimmy quickly weakened due to increasedsouthwesterly winds aloft. JTWC issued the final warning, valid at 1800Z, on 25 April, as thelow-level circulation center became completely exposed and it was clear that the remnants ofJimmy would soon merge with an approaching frontal boundary.
Figure 3-03-1 Tropical Storm Jimmy intensifies as it followsthe remnants of Isa (02W) through the weakened subtropicalridge (230531Z April visible GMS imagery).

Tropical Storm Jimmy (03W)18 Apr to 26 Apr 1997
MIN SLP 984 mbMAX INTENSITY 55 kt
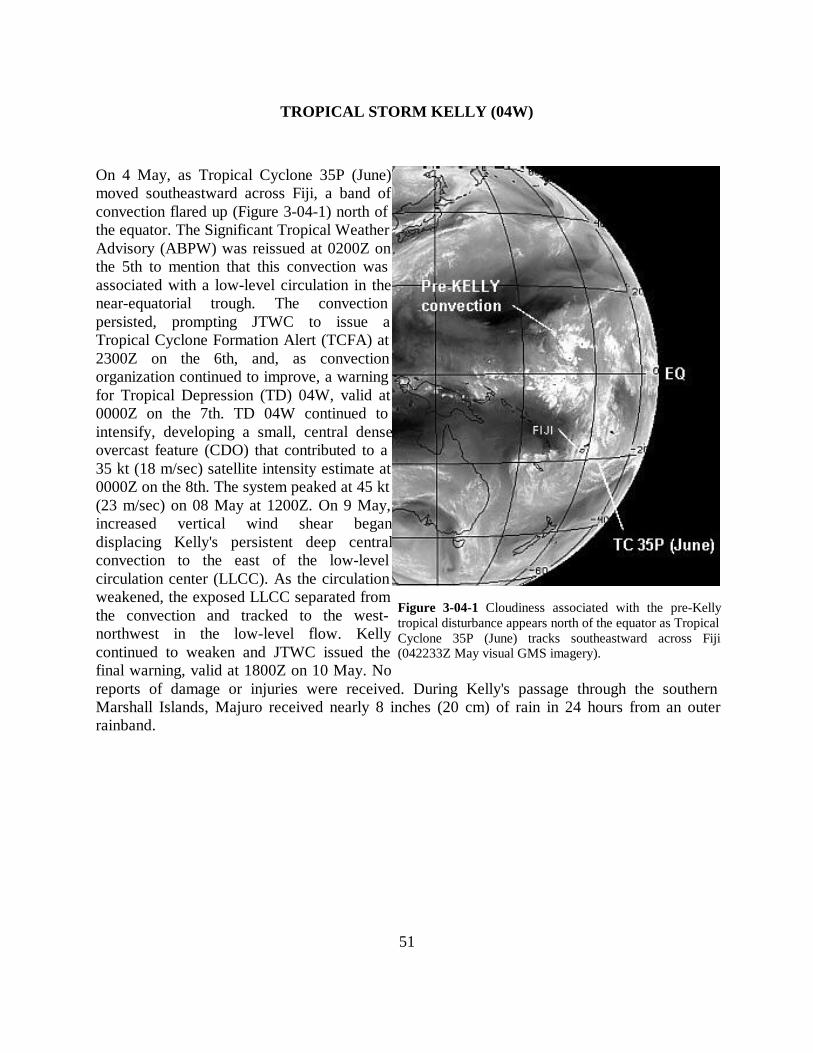
51
TROPICAL STORM KELLY (04W)
On 4 May, as Tropical Cyclone 35P (June)moved southeastward across Fiji, a band ofconvection flared up (Figure 3-04-1) north ofthe equator. The Significant Tropical WeatherAdvisory (ABPW) was reissued at 0200Z onthe 5th to mention that this convection wasassociated with a low-level circulation in thenear-equatorial trough. The convectionpersisted, prompting JTWC to issue aTropical Cyclone Formation Alert (TCFA) at2300Z on the 6th, and, as convectionorganization continued to improve, a warningfor Tropical Depression (TD) 04W, valid at0000Z on the 7th. TD 04W continued tointensify, developing a small, central denseovercast feature (CDO) that contributed to a35 kt (18 m/sec) satellite intensity estimate at0000Z on the 8th. The system peaked at 45 kt(23 m/sec) on 08 May at 1200Z. On 9 May,increased vertical wind shear begandisplacing Kelly's persistent deep centralconvection to the east of the low-levelcirculation center (LLCC). As the circulationweakened, the exposed LLCC separated fromthe convection and tracked to the west-northwest in the low-level flow. Kellycontinued to weaken and JTWC issued thefinal warning, valid at 1800Z on 10 May. Noreports of damage or injuries were received. During Kelly's passage through the southernMarshall Islands, Majuro received nearly 8 inches (20 cm) of rain in 24 hours from an outerrainband.
Figure 3-04-1 Cloudiness associated with the pre-Kellytropical disturbance appears north of the equator as TropicalCyclone 35P (June) tracks southeastward across Fiji(042233Z May visual GMS imagery).

Tropical Storm Kelly (04W)04 May to 11 May 1997
MIN SLP 991 mbMAX INTENSITY 45 kt

52
TROPICAL STORM LEVI (05W)
Tropical Storm Levi (05W), oneof three tropical cyclones todevelop in May, formed in themonsoon trough in the center ofthe South China Sea, betweencentral Vietnam and Luzon. Alow-level circulation center(LLCC) was first analyzed at0000Z on 23 May. It wasmentioned on the SignificantTropical Weather Advisory(ABPW) 6 hours later. Thesystem assumed the form of amonsoon depression, having deepconvection on the eastern andsouthern peripheries, with little consolidation near the center. On 24 May, convection began toorganize near the LLCC, and a Tropical Cyclone Formation Alert (TCFA) was issued at 0600Zon the 25th. Twelve hours later, the first warning was released on Tropical Depression (TD)05W. The depression moved eastward and crossed central Luzon on 26 May, producing copiousamounts of rainfall which caused severe flooding. This forced the closure of government offices,schools, and the Philippine stock market in Manila. The main generator at the Ninoy AquinoInternational Airport in Manila was totally submerged by floodwater, shutting down the airportfor several hours. A total of 33 peole lost their lives in the Philippines, primarily from floodingand mudslides.
After emerging into the Philippine Sea late on 26 May, TD 05W began to move to the northeastand was soon upgraded to Tropical Storm Levi (05W). On 28 May, the tropical storm reached itsmaximum intensity of 45 kt (23 m/sec). At this point, the system began to move on a northwardtrack, steered by the monsoonal mid-tropospheric flow which connected the southwest monsoonwith the Mei-yu front south of the Ryukyu Islands. Levi maintained its 45-kt (23 m/sec) windsduring recurvature until 29 May at 1800Z when upper level westerly shear began to weaken thecyclone. The final warning on Tropical Storm Levi (05W), valid at 0600Z on the 30th, wasissued as the system raced off to the northeast.
Figure 3-05-1. 281233Z May 1997 infrared imagery of Tropical StormLevi (05W) as it moves on a northward track at its 45-kt (23-m/s)maximum intensity.

Tropical Storm Levi (05W)23 May to 04 Jun 1997
MIN SLP 991 mbMAX INTENSITY 45 kt

53
TYPHOON MARIE (06W)
Typhoon Marie (06W) was the only of thethree May tropical cyclones to developinto a typhoon. The disturbance thateventually became Marie developed muchfarther east than normal for a May tropicalcyclone. An active monsoon troughextended to the Marshall Islands inresponse to strong low level equatorialwesterly winds associated with thedeveloping 1997 El Niño. The disturbancewas first mentioned on the 26 MaySignificant Tropical Weather Advisory(ABPW) and was located about 250 nm(463 km) east of Kwajalien Atoll (WMO91366). A Tropical Cyclone FormationAlert (TCFA) was issued at 1630Z on 26May, and the first warning was producedsoon thereafter at 1800Z. For the next twodays, Tropical Depression 06W intensifiedslowly as it moved northward through the subtropical ridge, which had been bisected by thepassage of a short wave trough. The system reached tropical storm strength at 1800Z on the 28thand then intensified for the next 24 hours, while moving to the north-northeast at 5-9 kt (9-17km/hr). At 1200Z on 29 May, Marie achieved typhoon intensity. While moving on a nearlynorthward track, Typhoon Marie continued to intensify, reaching its maximum intensity of 90 kt(46 m/s) at 0000Z on 31 May. Afterwards, the typhoon moved towards the northeast and beganto slowly weaken. By 1800Z on 1 June, Marie's intensity had fallen below typhoon intensity, andthe system was undergoing extratropical transition. The final warning was issued at 0600Z on the2nd as the system accelerated to over 40 kt (74 km/hr), and its transition was nearly complete.Marie spent its entire life over water, and there were no reports of significant impact received byJTWC.
Figure 3-06-1. 302132Z May 97 GMS visible imagery ofTyphoon Marie near its 90 kt (47 m/s) peak intensity. At thistime, Marie was moving northward at 12 kt (22 km/hr).
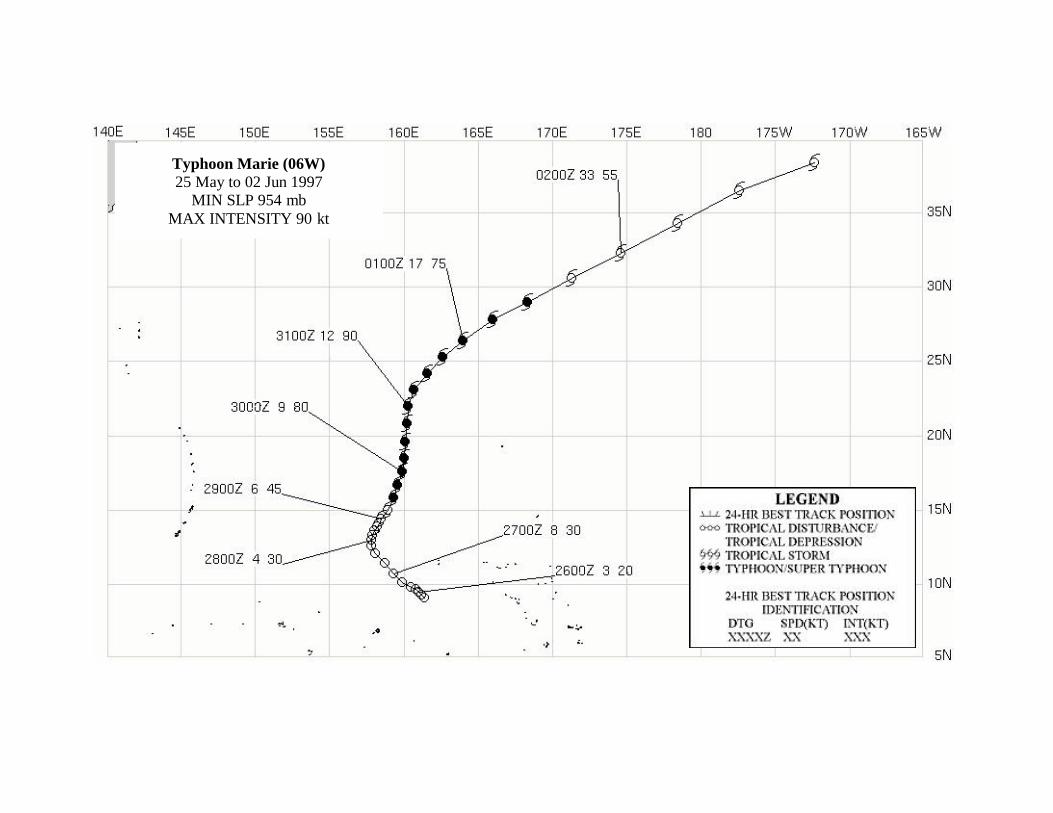
Typhoon Marie (06W)25 May to 02 Jun 1997
MIN SLP 954 mbMAX INTENSITY 90 kt

54
SUPER TYPHOON NESTOR (07W)
I. HIGHLIGHTS
Super Typhoon Nestor (07W) was thestrongest of three typhoons to developin June, and was the second of 11 supertyphoons to occur in 1997. It was aspin-off of strong equatorial westerlywinds associated with the developing1997 El Niño. Nestor's development inthe southern Marshall Islands is thefarthest east a June typhoon hasdeveloped since records have been kept.
II. TRACK AND INTENSITY
In early June, strong equatorial lowlevel westerly winds extended to theInternational Date Line (IDL) inassociation with the development of the1997 El Niño. As Typhoon Marie(06W) was nearing the end of itstropical life, the disturbance that wouldbecome Super Typhoon Nestor (07W)was beginning its 2-week tropicalexistence. It was first identified on theSignificant Tropical Weather Advisory (ABPW) at 0600Z on 1 June as a persistent area ofconvection about 70 nm (130 km) south-southwest of Majuro. For the next two days, thedisturbance moved to the west-southwest at 5-7 kt (9-13 km/hr), with no noticeableintensification. On the evening of 03 June, near 165E, the system turned to the northwest, but itcontinued to have difficulty organizing (Fig. 3-07-1). A Tropical Cyclone Formation Alert(TCFA) was isssued at 0830Z on the 4th. A second TCFA was issued 24 hours later. Beginningat 1800Z on the 5th, the system quickly pulled itself together and reached tropical storm intensityby the time the first warning was issued at 0000Z on the 6th. Nestor assumed a heading towardthe Mariana Islands. Statistical and statistical-dynamic prediction models indicated west-northwestward movement for several days, initially taking the storm south of Guam. However,these models soon started walking the track up over Saipan. On the morning of 08 June, TropicalStorm Nestor (07W) veered away from the Mariana Islands to a north-northwestward track andcontinued intensifying for four days, reaching peak intensity of 140 kt (72 m/s) at 1200Z on the10th, approximately 200 nm (370 km) northeast of Saipan. Figure 3-7-2 compares the Dvorakenhancement image (a) with the microwave image (b) just before Nestor attained its maximumintensity. The system temporarily heeled over to the northwest before turning to the north andrecurving about 20 nm (37 km) east of Iwo Jima (WMO 47981). Iwo Jima recorded wind guststo 102 kt (51 m/s) at 1500Z on the 12th when the typhoon passed about 20 nm (37 km) to the
Figure 3-07-1 040232Z June 1997 GMS visual imagery ofthe tropical disturbance that would eventually become SuperTyphoon Nestor (07W).

55
Figure 3-07-2 (a) 091547Z June 1997 enhanced infrared imagery using the BD enhancement curve and (b)092013Z June 1997 DMSP microwave imagery (SSM/I) of Super Typhoon Nestor (07W) at an estimatedintensity of 125-130 kt (65-68 m/s). The system is approximately 190 nm (352 km) east-northeast of Saipan.
Figure 3-07-3 120332Z June 1997 GMS visual imagery ofthe eye of Nestor just prior to recurvature. The intensity atthis time was estimated to be 115 kt (60 m/s).

56
east. At 0200Z on the 13th, the typhoon passed about 30 nm (56 km) west of Chichijima (WMO47971), which reported wind gusts to 96 kt (50 m/s). Nestor took a parabolic track to thenortheast and east, eventually doubling its forward speed to over 30 kt (56 km/hr). The finalwarning by JTWC was issued at 0000Z on the 15th. Twelve hours later, the system had becomea 50-kt (26-m/s) extratropical cyclone.
III. DISCUSSION
Statistical and statistical-dynamic modelsfrom 04 June to 08 June predicted west-northward motion for Nestor's circulation.These models consistently targeted an area100 nm (185 km) to either side of Guam.When the first dynamic models becameavailable, they predicted a northward turnas early as 06 June. This was first indicatedby an abrupt turn to the north byNOGAPS, followed by northwestwardmotion. The Geophysical Fluid DynamicsNavy model (GFDN) and the BritishMeteorological Office model (EGRR)mimicked the motion of NOGAPS, butwere slower to accelerate the system to thenorthwest. The short term predictionsturned too abruptly (nearly perpendicularto the actual track), but the longer termpredictions of NOGAPS were relativelyaccurate. This occurrence of premature andabrupt track changes has been discussed byCarr and Elsberry (1997), who attribute itto a tendancy towards early pattern/regiontransition from the Standard/DominantRidge to Poleward/Poleward Oriented, especially for early (12 to 24 hrs) forecast points. Theypoint out the characteristic good accuracy of the 72-hour forecasts and recommend using the 72-hour dynamic model prediction guidance and merging it into the shorter term statisticalpredictions to derive an overall forecast. The daily changes in the NOGAPS predictions aresuperimposed upon Nestor's best track to illustrate the premature turning of the short termpredictions.
IV. IMPACTS
Aside from passing through the Volcano Islands and the Bonin Islands of Japan, Nestorremained over water. Nestor did produce some high waves on Saipan. No reports of significantdamage were received at JTWC.
Figure 3-07-4 A history of NOGAPS track forecastsillustrating the models tendency toward premature shortterm turning.

Super Typhoon Nestor (07W)01 Jun to 15 Jun 1997
MIN SLP 898 mbMAX INTENSITY 140 kt

57
TYPHOON OPAL (08W)
The disturbance that was to becomeTyphoon Opal (08W) was firstmentioned on the Significant TropicalWeather Advisory (ABPW) on 12 Juneas an area of persistent convectionabout 150 nm (278 km) southwest ofGuam. The disturbance was slow todevelop as it moved to the west-northwest at 6-8 kt (11-15 km/hr).However, by 14 June at 2030Z, thesystem had organized sufficiently towarrant the issuance of a TropicalCyclone Formation Alert (TCFA). Thefirst warning on Tropical Depression08W was valid at 0000Z on the 15th.One day later, the depression attainedtropical storm strength (35 kt or 18m/sec), and began to track toward thenorth. By 0000Z on 17 June, it hadreached an intensity of 65 kt (34m/sec). Twelve hours later, Typhoon Opal was at its maximum intensity of 90 kt (47 m/sec),which it maintained for 36 hours (Figure 3-08-1). As Opal approached 20N latitude, itaccelerated to speeds ranging from 14-17 kt (26-31 km/hr). By 0000Z on 18 June, westerliesfrom a trough to the northwest began to impinge upon Opal's outflow. This can be seen in Figure3-08-1. As Opal neared 30N latitude, it began to turn to the northeast, subsequently acceleratingand weakening. Opal made landfall near Shionomisaki, Japan (WMO 47778) at 2200Z on 19June with an intensity near 65 kt (33 m/sec). A minimum pressure of 980.3 mb was observedduring the passage. Six hours after making landfall, Tropical Storm Opal (08W) passed about 50nm (93 km) northwest of Tokyo, and at 1500Z on 20 June, Opal exited Honshu on an east-northeast track with 55 kt (29 m/sec) winds. The final warning was issued at 0600Z on the 21stas the system became extratropical near 42N 167E while maintaining 40 kt (21 m/sec) winds.
Opal was one of three typhoons to develop in June. This level of activity has not been seen in thewestern North Pacific in June since 1965. It was the first tropical cyclone of 1997 to strike Japan.
As Opal approached south central Japan, a fisherman drowned while tying his boat to a pier.Opal caused only minor damage in Yokohama and Tokyo. Transportation was disruptedthroughout eastern Japan, and 70 domestic flights were canceled.
Figure 3-08-1. Opal reaches its peak of 90 kt (47 m/s) whilemoving on a north-oriented track (171059Z June low-lightvisible DMSP imagery).

Typhoon Opal (08W)13 Jun to 21 Jun 1997
MIN SLP 954 mbMAX INTENSITY 90 kt

58
TYPHOON PETER (09W)
I. HIGHLIGHTS
One of three typhoons to develop in June,Typhoon Peter (09W) achieved only minimaltyphoon intensity. The cyclone moved on anorthward track nearly 900 nm (1665 km)before recurving. It made landfall nearSasebo, Japan, paralleled the mountainousspine of Honshu, and eventually became oneof the most intense extratropical cyclones ofthe year.
II. MOVEMENT AND INTENSITY
Typhoon Peter (09W) developed from adisturbance that was first detected early onthe morning of 19 June as an area ofpersistent convection at the eastern edge ofthe monsoon trough, about 300 nm (560 km)southeast of Guam. This area, mentioned onthe Significant Tropical Weather Advisory(ABPW) on 20 June, had characteristics of amonsoon depression with most convection onthe south and east peripheries. After two daysof slow development, deep convection beganto consolidate near the center. As a result, the first Tropical Cyclone Formation Alert (TCFA)was issued at 0400Z on 22 June and a second TCFA was issued 24 hours later. However, whenERS-2 and NSCAT scatterometer-derived winds became available a short time later, the firstwarning was issued on Tropical Depression 09W at 0600Z on the 23rd. Scatterometer dataplayed a critical role in ascertaining the cyclone's location and intensity throughout its life (seethe discussion section). The developing cyclone spent its first four days on a west-northwesttrack, except for a temporary stair-step to the northwest on 20 June. Scatterometer wind data wasagain valuable as it indicated that the depression reached tropical storm intensity at 1200Z on the23rd. By 24 June, a mid-tropospheric ridge had built to the southeast of Peter. This ridgeimposed southerly steering, causing the tropical cyclone (TC) to take a sharp northward turn.Peter maintained this track for three days, covering about 900 nm (1665 km). On 25 June,conventional satellite imagery indicated that Peter was moving to the northeast, but microwaveimagery data (SSM/I) revealed that the low level circulation center (LLCC) was maintaining anorthward motion (Fig. 3-09-1). On 260600Z, Peter was upgraded to typhoon. It maintained a 65knot (33 m/s) intensity for 36 hours, but developed no further. While tracking northward, Peteraccelerated from an average speed of 10 kt (19 m/s) to 20 kt (38 m/s). Late on 27 June, TyphoonPeter began to weaken and turn northeastward. At 1800Z,on the 27th, Peter passed over
Figure 3-09-1. 251023Z June 1997 microwave image ofTropical Storm Peter (09W).
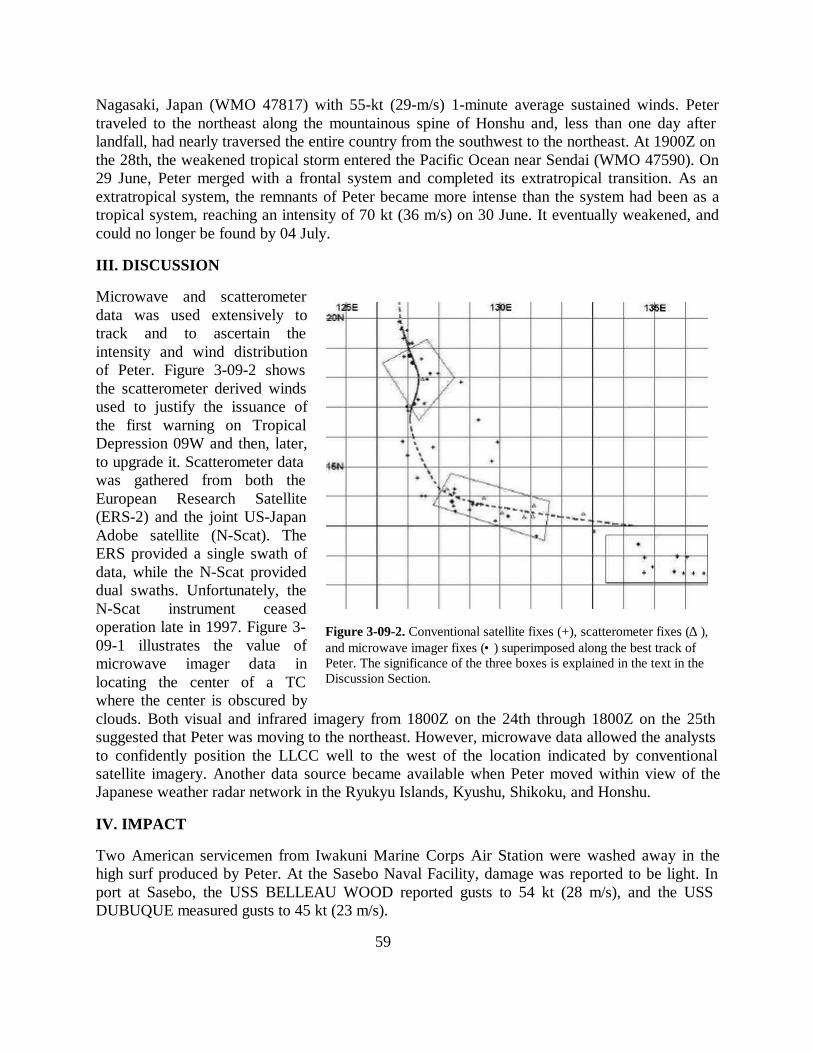
59
Nagasaki, Japan (WMO 47817) with 55-kt (29-m/s) 1-minute average sustained winds. Petertraveled to the northeast along the mountainous spine of Honshu and, less than one day afterlandfall, had nearly traversed the entire country from the southwest to the northeast. At 1900Z onthe 28th, the weakened tropical storm entered the Pacific Ocean near Sendai (WMO 47590). On29 June, Peter merged with a frontal system and completed its extratropical transition. As anextratropical system, the remnants of Peter became more intense than the system had been as atropical system, reaching an intensity of 70 kt (36 m/s) on 30 June. It eventually weakened, andcould no longer be found by 04 July.
III. DISCUSSION
Microwave and scatterometerdata was used extensively totrack and to ascertain theintensity and wind distributionof Peter. Figure 3-09-2 showsthe scatterometer derived windsused to justify the issuance ofthe first warning on TropicalDepression 09W and then, later,to upgrade it. Scatterometer datawas gathered from both theEuropean Research Satellite(ERS-2) and the joint US-JapanAdobe satellite (N-Scat). TheERS provided a single swath ofdata, while the N-Scat provideddual swaths. Unfortunately, theN-Scat instrument ceasedoperation late in 1997. Figure 3-09-1 illustrates the value ofmicrowave imager data inlocating the center of a TCwhere the center is obscured byclouds. Both visual and infrared imagery from 1800Z on the 24th through 1800Z on the 25thsuggested that Peter was moving to the northeast. However, microwave data allowed the analyststo confidently position the LLCC well to the west of the location indicated by conventionalsatellite imagery. Another data source became available when Peter moved within view of theJapanese weather radar network in the Ryukyu Islands, Kyushu, Shikoku, and Honshu.
IV. IMPACT
Two American servicemen from Iwakuni Marine Corps Air Station were washed away in thehigh surf produced by Peter. At the Sasebo Naval Facility, damage was reported to be light. Inport at Sasebo, the USS BELLEAU WOOD reported gusts to 54 kt (28 m/s), and the USSDUBUQUE measured gusts to 45 kt (23 m/s).
Figure 3-09-2. Conventional satellite fixes (+), scatterometer fixes (∆ ),and microwave imager fixes (• ) superimposed along the best track ofPeter. The significance of the three boxes is explained in the text in theDiscussion Section.
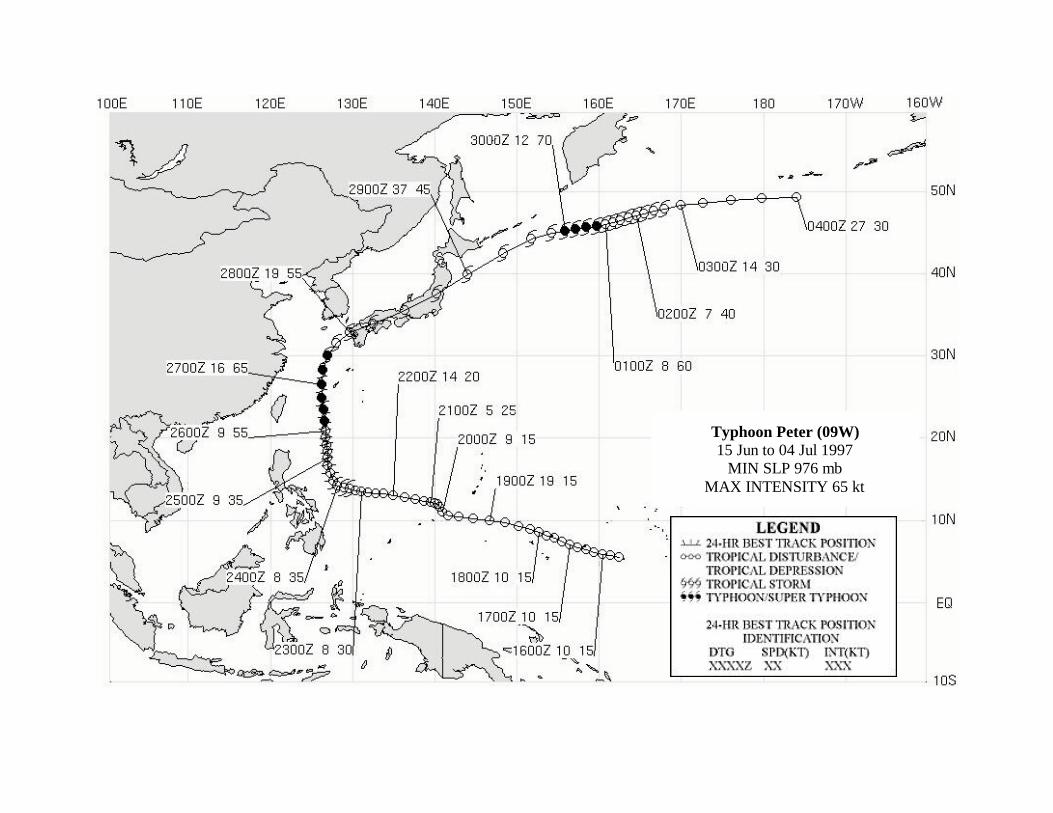
Typhoon Peter (09W)15 Jun to 04 Jul 1997
MIN SLP 976 mbMAX INTENSITY 65 kt

60
SUPER TYPHOON ROSIE (10W)
Super Typhoon (STY) Rosie (10W) originated as a tropical disturbance in the western CarolineIslands along the monsoon trough. The disturbance was first noted on the 15 July SignificantTropical Weather Advisory (ABPW) as an area of persistent convection. The pre-Rosiedisturbance slowly tracked west-northwestward over the next few days; and on 18 July at 1400Z,a Tropical Cyclone Formation Alert (TCFA) was issued by JTWC. The first warning on TropicalDepression (TD) 10W was issued only four hours later. The now northwestward moving TCintensified to a typhoon by 0000Z on 21 July and reached its peak intensity of 140 kt (72 m/s) onthe 22nd at 1200Z. Twelve hours later, Rosie began to weaken and slowly accelerate toward thenorth-northeast. The system made landfall near Okayama on the Japanese island of Shikokuaround 0800Z on 26 July as a minimal typhoon with 65 kt (33 m/s) winds. Crossing over land,Rosie rapidly weakened as the main convection sheared away from the low-level circulation. Itcontinued to weaken in the Sea of Japan as the exposed low-level and its remnants were trackedback over Japan and into the Philippine Sea where it dissipated. Rosie left two dead in Japan; andits passage resulted in power failures, landslides and widespread damage to buildings in thesouthern and central parts of the country.
Figure 3-10-1 Rosie near peak intensity. (a) 222131Z July visible GMS imagery and (b) 222147Z July 85 GHzhorizontally polarized DMSP imagery.

Super Typhoon Rosie (10W)15 Jul to 29 Jul 1997
MIN SLP 898 mbMAX INTENSITY 140 kt

61
TROPICAL STORM SCOTT (11W)
Tropical Storm Scott formed in mid-Julynear 24N 150E from a Tropical UpperTropospheric Trough (TUTT)-induced midlevel disturbance. It was first noted on the20 July Significant Tropical WeatherAdvisory (ABPW) as a closed low-levelcirculation with associated scatteredconvection. Initial development of the pre-Scott disturbance was inhibited by outflowfrom Super Typhoon (STY) Rosie (10W).However by 0000Z on 24 July systemorganization improved significantly,leading to issuance of a Tropical CycloneFormation Alert (TCFA). The first warningon Tropical Depression (TD) 11W wasissued just 6 hours later, at which timeRosie was located approximately 20degrees west of TD 11W and movingnorth-northeastward with a large trailing anti-cyclone. The influence of this anti-cyclone causedTD 11W's northward track to shift to the southeast. TD 11W took a southeastward track insteadof the more usual southwestward track attributed to the Indirect Tropical Cyclone Interaction(ITI) pattern because of the northwest-southeast orientation of the trailing anticyclone. AfterRosie (10W) made landfall in Japan, this anticyclone became less significant as a steeringinfluence on TD 11W. By 26 July, TD 11W appeared to be dissipating and JTWC issued whatwas thought to be the final warning. Soon afterward, development recommenced, resulting in asecond TCFA issued at 1730Z on the 26th. Scott reached tropical storm intensity at 0600Z on the27th and began its second major track change as it turned first toward the northwest for 24 hoursand then finally to the northeast. The system reached its peak intensity of 55 kt (28 m/s), at0600Z on the 29th and held it through 1800Z the same day. Scott began to slowly weaken,continuing northeastward, until it merged with a frontal system on 2 August. JTWC issued afinal warning at 1200Z on this day. Tropical Storm Scott remained over water for its entireexistence and JTWC received no reports of damage.
Figure 3-11-1 Tropical Storm Scott at peak intensity of55 kt (28 m/s) on 29 July at 0633Z

Tropical Storm Scott (11W)20 Jul to 02 Aug 199 MIN SLP 984 mb
MAX INTENSITY 55 kt

62
TYPHOON TINA (12W)
The tropical disturbance that becameTyphoon Tina (12W) initially formed asan area of convection in the easternCaroline Islands and was first noted onthe Significant Tropical WeatherAdvisory (ABPW) at 0600Z on 21 July.The first Tropical Cyclone FormationAlert (TCFA) was issued at 1000Z on 23July. However, upper level wind shearcaused the system to lose much of itsdeep convection and the TCFA wascancelled. As the disturbance continuedto track northwestward, vertical windshear gradually relaxed and the systembegan to reorganize. A second TCFAwas issued at 0830Z on the 29th. Thesystem's organization continued toimprove and the first warning onTropical Depression (TD) 12W wasissued at 1800Z the same day. TD 12W continued to track northwestward under the steeringinfluence of the subtropical ridge, and was upgraded to Tropical Storm Tina (12W) with the 30July 1800Z warning. The system reached typhoon strength by 1200Z on 3 August, withcontinued movement to the northwest. Interaction between the cyclone and the subtropical ridgeresulted in a Poleward/Poleward Oriented pattern/region (see chapter 1), causing a gradual trackchange from northwestward to northward. Typhoon Tina (12W) reached its peak intensity of 90kt (46 m/s), on 5 August at 0600Z. Naha airport in Okinawa reported 50 kt (26 m/s), sustainedwinds on the evening of 6 August as Tina passed west of the island. The system began to weakenas it moved toward the Korean Peninsula and encountered vertical wind shear. Tina madelandfall along the South Korean coast at approximately 2200Z on 8 August. JTWC issued thefinal warning on the system at 1200Z, 9 August. Tina passed close to Pohang, Korea, early onthe 9th, which recorded wind of 25 kt (13 m/s) sustained with gusts to 48 kt (25 m/s), and aminimum pressure of 995.3 mb. The system continued to track northeastward and dissipatedover the Sea of Japan.
Figure 3-12-1 Typhoon Tina (12W) at 0730 on 5 Aug, nearpeak intensity of 90 kt (GMS 5 visible imagery).

Typhoon Tina (12W)21 Jul to 10 Aug 1997
MIN SLP 954 mbMAX INTENSITY 90 kt
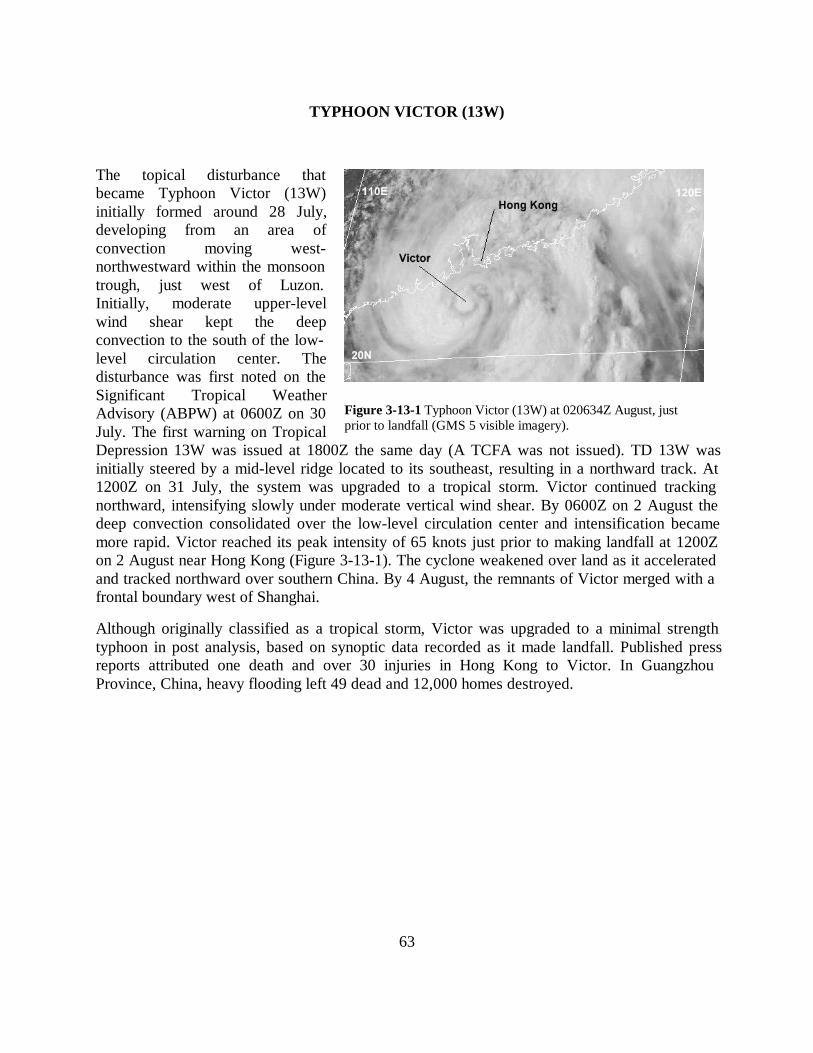
63
TYPHOON VICTOR (13W)
The topical disturbance thatbecame Typhoon Victor (13W)initially formed around 28 July,developing from an area ofconvection moving west-northwestward within the monsoontrough, just west of Luzon.Initially, moderate upper-levelwind shear kept the deepconvection to the south of the low-level circulation center. Thedisturbance was first noted on theSignificant Tropical WeatherAdvisory (ABPW) at 0600Z on 30July. The first warning on TropicalDepression 13W was issued at 1800Z the same day (A TCFA was not issued). TD 13W wasinitially steered by a mid-level ridge located to its southeast, resulting in a northward track. At1200Z on 31 July, the system was upgraded to a tropical storm. Victor continued trackingnorthward, intensifying slowly under moderate vertical wind shear. By 0600Z on 2 August thedeep convection consolidated over the low-level circulation center and intensification becamemore rapid. Victor reached its peak intensity of 65 knots just prior to making landfall at 1200Zon 2 August near Hong Kong (Figure 3-13-1). The cyclone weakened over land as it acceleratedand tracked northward over southern China. By 4 August, the remnants of Victor merged with afrontal boundary west of Shanghai.
Although originally classified as a tropical storm, Victor was upgraded to a minimal strengthtyphoon in post analysis, based on synoptic data recorded as it made landfall. Published pressreports attributed one death and over 30 injuries in Hong Kong to Victor. In GuangzhouProvince, China, heavy flooding left 49 dead and 12,000 homes destroyed.
Figure 3-13-1 Typhoon Victor (13W) at 020634Z August, justprior to landfall (GMS 5 visible imagery).
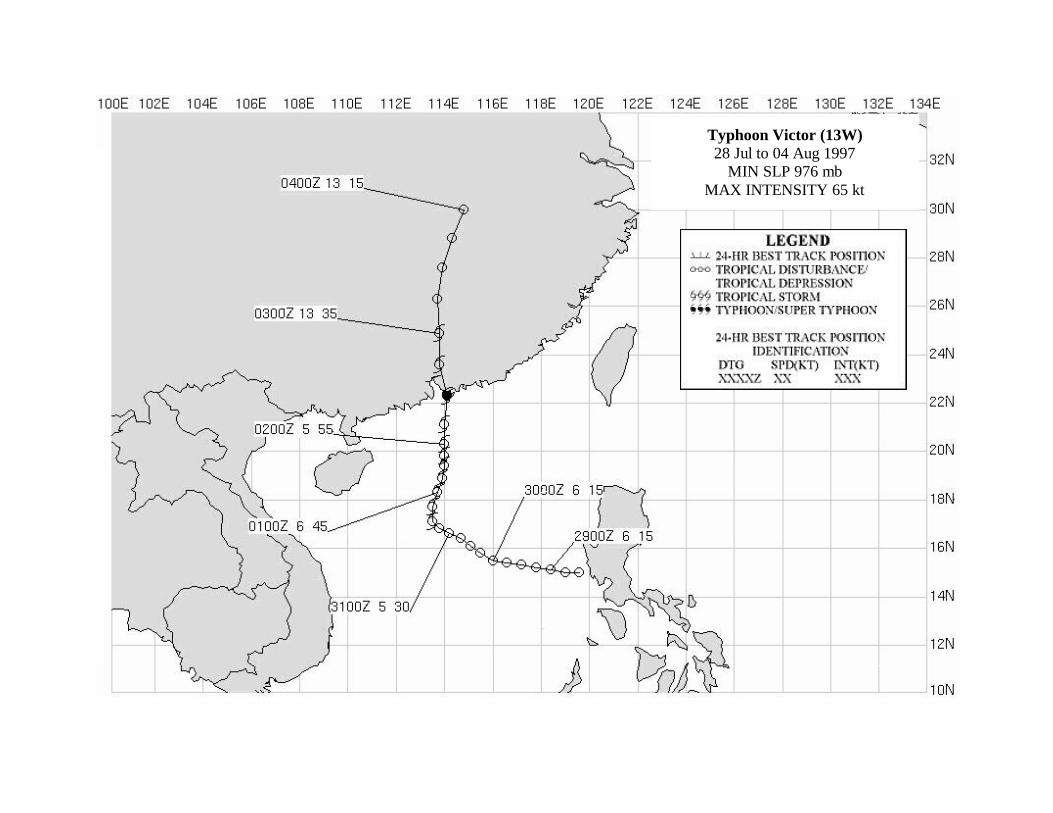
Typhoon Victor (13W)28 Jul to 04 Aug 1997
MIN SLP 976 mbMAX INTENSITY 65 kt

64
SUPER TYPHOON WINNIE (14W)
I. HIGHLIGHTS
Winnie formed at low latitudes in the Marshall Islands and was the fourth of eleven tropicalcyclones (TCs) to attain super typhoon intensity in the western North Pacific during 1997. It wasone of ten TCs that formed east of 160E and south of 20N; the "El Niño" box in Figure 3-3a.Winnie was a straight running TC that passed over Okinawa, and later made landfall on theeastern coast of China, where it was responsible for loss of life and considerable damage. Whenit was near Okinawa, the typhoon formed concentric eyewall clouds. The 200 nm (370 km)diameter of the outer eyewall cloud, observed by satellite and radar, was one of the largest everrecorded.
II. TRACK AND INTENSITY
During the first week of August, twoTCs, Tina (12W), and Victor (13W),moved northward in the westernportion of the West North Pacific(WNP) basin. Concurrent with theevolution of these TCs, an area ofdeep convection associated with theEl Niño related low latitude westerlywind flow east of 160E persistednear the Marshall Islands. Thedisturbance was added to the 5August Significant Tropical WeatherAdvisory (ABPW) after satelliteimagery and synoptic data indicateda low-level cyclonic circulation withsea-level pressure in the regionapproximately 2 mb below normal.
The monsoon depression graduallybecame better organized as it movedsteadily toward the west-northwest.The deep convection became moreconsolidated and cirrus outflowbecame organized in a well-defined anticyclonic pattern, while the sea-level pressure slowly fell.Based on increased organization of the deep convection, sea-level pressures estimated at 1006mb, and divergent outflow aloft (as indicated by animated water-vapor imagery) a TropicalCyclone Formation Alert (TCFA) was issued at 0230Z on the 8th. The first warning on TropicalDepression (TD) 14W soon followed, valid at 0600Z the same day, based on a satellite intensityestimate of 30 kt (15 m/sec). This large TC intensified and was upgraded to Tropical Storm
Figure 3-14-1 Winnie nears its peak intensity of 140 kt (72 m/sec)as it approaches the Northern Mariana Islands (112133Z Augustvisible GMS imagery).

65
Winnie (14W) with the 0600Z warning on 9 August. Winnie intensified quickly and became atyphoon by 0000Z on the 10th, and peaked at an intensity of 140 kt (72 m/sec) at 0000Z on the12th (Figure 3-14-1). While still east of the Mariana Island chain. At 0600Z on the 12th, thesystem passed between the islands of Alamagan and Pagan. Winnie continued on its west-northwestward course and maintained an intensity of 140 kt (72 m/sec) for 24 hours, then beganto slowly weaken as it approached the Ryukyu Islands. By 14 August, Winnie showed signs ofdeveloping concentric wall clouds which became more distinct on 15 and 16 August. As thetyphoon passed through the Ryukyu Islands on 17 August, the inner wall cloud began todissipate as the large-diameter outer wall cloud became well defined (see discussion below).Winnie moved across the East China Sea and made landfall on the eastern coast of Chinaapproximately 140 nm (260 km) south of Shanghai shortly before 1200Z on 18 August. Thesystem passed across Manchuria and quickly dissipated as it moved into the mountainous terrainnorth of Vladivostok. The final warning was issued valid at 0000Z on the 19th. The remnants ofWinnie were eventually observed to have recurved to the northeast.
III. DISCUSSION
a. Winnie's large-diameterouter eye wall cloud.
The well-defined eye of amature TC is probably one ofnature's most remarkable andawe-inspiring phenomena. Inthe Dvorak (1975, 1984)classification scheme, theintensity of a TC is estimatedfrom several characteristics ofsatellite imagery. Theseinclude the distance of the low-level circulation center to thedeep convection; the size ofthe central dense overcast; thecloud-top temperatures, thehorizontal width of the eyewall cloud; and the width andextent of peripheral bandingfeatures. The basic TC patterntypes identified by Dvorak are:(1) the "shear" pattern; (2) the"curved band" pattern; (3) the"central dense overcast" pattern; and, (4) the "eye" pattern. Of these pattern types, the "eye"pattern is probably the best known to the laymen.
The TC eye can be ragged or well-defined. In general, the more sharply defined the eye becomeson satellite imagery, the more intense the TC is likely to be. The average satellite-observed TC
Figure 3-14-2 Winnie's outer wall cloud passes over Okinawa bringingtyphoon-force winds as the small eye and inner wall cloud (within arelatively cloud-free moat) pass to the south. (170133Z August visibleGMS imagery.) The black dot indicates the Kadena NEXRAD location.

66
eye diameter is between 30 and 45 nm (55 - 85 km) (Weatherford 1984). Eyes with diametersless than 30 nm (55 km) are considered to be small, while those with diameters greater than 45nm (85 km) are considered to be large. In the Dvorak scheme, the intensity of a TC with a largewell-defined eye is capped at 115 kt (59 m /sec), and the intensity of a TC with a large raggedeye is capped at 90 kt (46 m/sec), regardless of other characteristics observed on the satelliteimagery. Some extremes of eye sizes include the small, 8-nm (15-km) diameter eye of SuperTyphoon Tip (JTWC 1979 - observed by aircraft), and the radar-observed, large, 200-nm (370-km) diameter eye of Typhoon Carmen (JTWC 1960).
Some TCs, especially the intense ones, develop concentric wall clouds separated by a relativelycloud-free moat. In such cases, the outer wall cloud may contract while the inner one collapses ina process known as eyewall replacement. This has been discussed at length by Willoughby et al.(1982) and Willoughby (1990). These authors also note that TC eyes almost invariably contractduring intensification so that smaller eyes and extreme intensity tend to be correlated. TheDvorak scheme has no special rules for concentric eyewall clouds. This is most likely because acirrus overcast normally obscures the outer wall cloud in satellite imagery.
As Winnie moved toward Okinawa on August 16, a large outer rain band began to encircle thewall cloud that defined the eye. By the time the typhoon passed over Okinawa, the rainband hadbecome a complete, 200 nm (370 km) diameter, concentric outer wall cloud (Figures 3-14-2 and3-14-3).
The largest eye diameter everreported by JTWC was that ofTyphoon Carmen (JTWC 1960) as itpassed over Okinawa. Bycoincidence, Winnie also passed overOkinawa. Carmen's eye diameter, asmeasured by the weather radar atKadena Air Force Base was 200 nm(370 km), approximately the samediameter as Winnie's outer eyewallcloud. The 1960 Annual TyphoonReport commented: "Another featurequite unusual about this typhoon wasthe diameter of its eye.Reconnaissance aircraft frequentlyreported eye diameters of 100 [nm][185 km], using as the basis ofmeasurement, surface winds andpressure gradient. However, withrespect to wall clouds surroundingthe eye, radar photographs takenfrom the CPS-9 at Kadena AB showquite clearly that on 20 August, theeye had a diameter of approximately
Figure 3-14-3 Winnie's outer wall cloud is nicely highlighted bymicrowave imagery. This is sensitive to regions containingprecipitation-sized hydrometeors (especially large ice-phaseparticles). The eye and inner wall cloud are present but less distinct.(161311Z August horizontally polarized 85 GHz microwave DMSPimagery.)

67
200 [nm] [370 km]. The eye diameter of Carmen was probably one of the largest ever reported . .." Winnie, like Carmen, was also viewed by radar at Kadena AB, a NEXRAD WSR 88D (Figure3-14-4a,b).
As the outer wall cloud passed over Okinawa on 16 August, wind gusts of 82 kt (42 m/sec) wererecorded (Figure 3-14-5) and the sea level pressure (SLP) fell to 964 mb (Figure 3-14-6). Thecenter of the eye passed approximately 80 nm (150 km) south of the island. Doppler radarindicated 100-kt (51-m/sec) winds in the large outer eye wall in a layer from 3,000 ft (914 m) to6,000 ft (1829 m). The NEXRAD base velocity product (Figure 3-14-4b) shows inbound windspeeds between 50 kt and 80 kt (26 m/sec and 41 m/sec) at an altitude of 8,000 ft (2438 m) abovesea level on the eastern side of the inner wall cloud.
Although concentric wall clouds are not rare, especially for intense TCs, the extreme diameter ofWinnie's outer eyewall cloud is an infrequent occurance. Such large diameters are restrictedprimarily to the western North Pacific basin. In the Atlantic, TCs with large-diameter outer eyewall clouds have been observed, but not as large as these WNP examples. Such Atlantic stormsinclude Allen (1980), Diana (1984), Gilbert (1988), and Luis (1995). These had outer eyewallclouds with diameters greater than 135 nm (250 km) and very small inner eyewall clouds withdiameters less than 15 nm (28 km).
Sometimes typhoons which form in the monsoon trough of the western North Pacific generatevery large circulations and eyes. The 370 km diameter of Winnie's outer eye wall cloud duringpassage over Okinawa is one of the largest ever observed in a TC. These cases are importantbecause they define the most extreme possibilities of TC dynamics.
Figure 3-14-4 Winnie's outer wall cloud, and smaller inner wall cloud and eye, as depicted by the NEXRAD WSR88D located near Kadena AB on Okinawa. (a) The base reflectivity at 170226Z August, and (b) the 170122ZAugust base velocity product. The NEXRAD is able to compute Doppler velocities within 125 nm (230 km) of theradar. The black dot (with arrow) shows the location of the NEXRAD in both panels.

68
Figure 3-14-5 Wind reports from Kadena ABreceived at JTWC are plotted with respect toWinnie's cloud system (shaded regions). Windsare peak gusts in kt. Note that the peak gusts(indicated by arrows) at Kadena occur on theinward edge of the outer wall cloud in agreementwith Jorgensen's (1984) synthesis of aircraftobservations of the wind distribution in the largeouter wall cloud of Hurricane Allen (1980). Thesmall black dots along the indicated track are at 5-hour intervals from 160100Z to 172200Z August.
Figure 3-14-6 A time series of the sea-levelpressure (SLP) recorded at Kadena AB asWinnie's outer wall cloud (hatched region)passed. Again, note the peak gusts occurring nearthe inner edge of the satellite observed outer wallcloud.
b.Winnie's Digital Dvorak (DD) time series
The magnitude of Winnie's Digital Dvorak(DD) numbers increased more rapidly thanthe warning intensity as the TC intensified on11 and 12 August (a frequent occurance).Winnie's series did not exhibit any obviousdiurnal variations. Some typhoons exhibit astrong diurnal variation, while others (likeWinnie) show little or none. Although notshown below, DD numbers were calculatedfor Winnie on 16 and 17 August when itpossessed a very large diameter outer eyewall cloud by adapting the DD algorithm touse cloud-top temperature of the outer eyewall cloud to arrive at an intensity estimate.These DD numbers were observed tofluctuate between about 4.5 and 5.0. Thecorresponding intensity range of 77-90 kt
Figure 3-14-7 A time series of Winnie's hourly DDnumbers (small black dots) compared with the warningintensity (open circles). As the TC was intensifying on11 and 12 August, the DD numbers increase faster thanthe warning intensity (shaded region) -- a commonbehavior of the DD numbers. Note that the warningintensity is higher than the DD numbers as the TCbegins to weaken, which is consistent with Dvorak'srule to delay the current intensity behind thedecreasing data T-numbers.

69
(40-46 m/sec) fits well with synoptic reports from Okinawa (e.g., the 82 kt (42 m/sec) peak gustat Kadena, and the NEXRAD indications of 100 kt (51 m/sec) winds within the outer eyewalllayer between 3,000 ft (914 m) and 6000 ft (1829 m)).
IV. IMPACT
As Winnie passed through the northern Mariana Islands, the populated islands of Guam, Rota,Tinian, and Saipan (well to the south of Winnie's track, but within its gale area) reported damageto crops and vegetation from winds and sea-salt spray. In Taiwan, 27 people were reported killedwhen an apartment building collapsed. Another 12 people were reported killed from mudslides,flooding and high wind. In mainland China, torrential rains and winds caused at least 25 deaths.Damage from wind and flooding was extensive.

Super Typhoon Winnie (14W)05 Aug to 23 Aug 1997
MIN SLP 898 mbMAX INTENSITY 140 kt

70
TYPHOON YULE (15W) AND TROPICAL DEPRESSION 16W
I. HIGHLIGHTS
Yule and Tropical Depression(TD) 16W were two of tentropical cyclones (TCs) during1997 which formed east of 160Eand south of 20N — within the"El Niño box" in Figure 3-5b.These two TCs existedsimultaneously, and underwent abinary interaction resulting intheir merger. After merger, thesingle resultant TC (retaining thename Yule) moved on a north-oriented track and passed closeto Wake Island. When it reachedthe mid-latitudes, the systembecame a vigorous hybridsystem possessing typhoon-forcewinds.
II. TRACK AND INTENSITY
During the middle of August, asthe large-sized Winnie (14W)approached Okinawa and theeast coast of China, low-levelwesterly winds persisted at lowlatitude from the Philippineseastward across Micronesia asfar as the international date line (IDL). A monsoon cloud band (with some well-defined tropicalupper tropospheric trough (TUTT) cells to its north) stretched from Winnie to the eastern end ofthe monsoon trough. Yule and TD 16W originated from tropical disturbances located at lowlatitude: Yule from a tropical disturbance west of the IDL in the Marshall Islands, and TD 16Wfrom a tropical disturbance east of the IDL at low latitudes to the southwest of Hawaii.
a. Yule (15W)
Yule (the westernmost of the Yule-TD 16W pair) originated from a very poorly organizedtropical disturbance in the monsoon trough which stretched at low latitude across the easternCaroline and Marshall Island groups. It was first mentioned on the 090600Z August SignificantTropical Weather Advisory (ABPW) when satellite imagery indicated that a possible low-levelcirculation center was associated with an area of deep convection at very low latitude (3N) and
Figure 3-15/16-1 Yule becomes a tropical storm when located about 180nm (330 km) northwest of Kwajalein (170533Z August visible GMSimagery). Properties of the centroid-relative motion help to reveal thenature of the interaction (which is not always apparent in the actual earth-relative tracks).
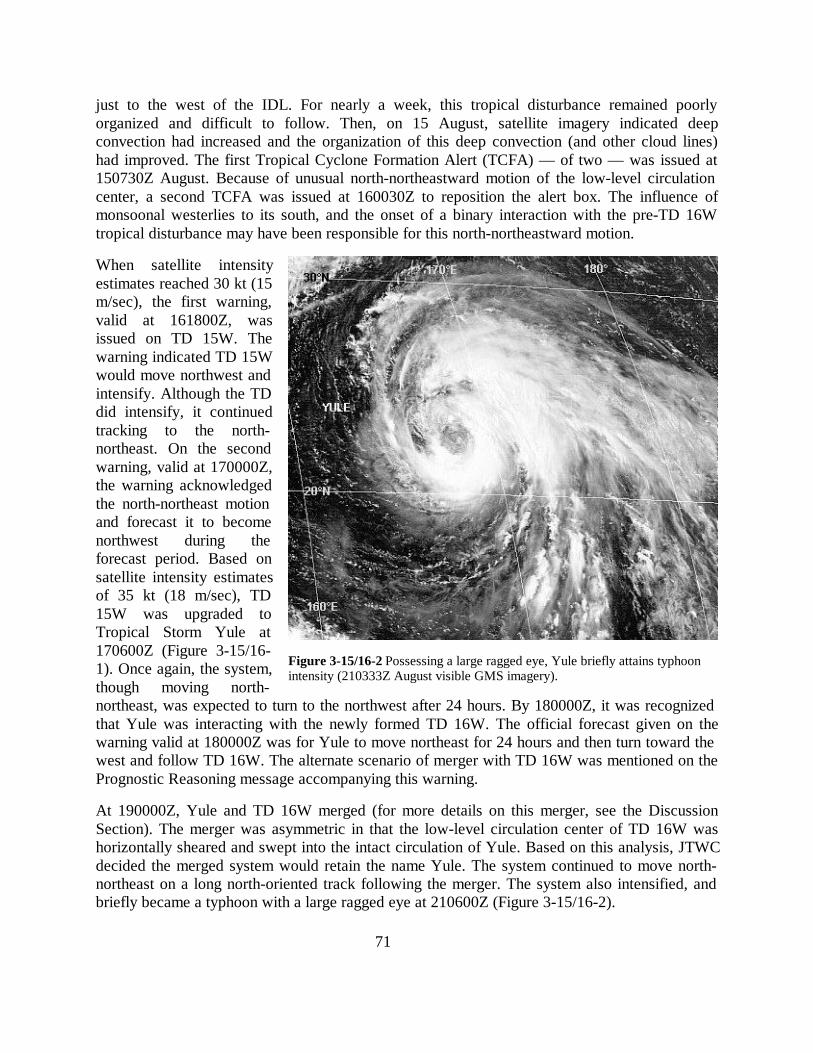
71
just to the west of the IDL. For nearly a week, this tropical disturbance remained poorlyorganized and difficult to follow. Then, on 15 August, satellite imagery indicated deepconvection had increased and the organization of this deep convection (and other cloud lines)had improved. The first Tropical Cyclone Formation Alert (TCFA) — of two — was issued at150730Z August. Because of unusual north-northeastward motion of the low-level circulationcenter, a second TCFA was issued at 160030Z to reposition the alert box. The influence ofmonsoonal westerlies to its south, and the onset of a binary interaction with the pre-TD 16Wtropical disturbance may have been responsible for this north-northeastward motion.
When satellite intensityestimates reached 30 kt (15m/sec), the first warning,valid at 161800Z, wasissued on TD 15W. Thewarning indicated TD 15Wwould move northwest andintensify. Although the TDdid intensify, it continuedtracking to the north-northeast. On the secondwarning, valid at 170000Z,the warning acknowledgedthe north-northeast motionand forecast it to becomenorthwest during theforecast period. Based onsatellite intensity estimatesof 35 kt (18 m/sec), TD15W was upgraded toTropical Storm Yule at170600Z (Figure 3-15/16-1). Once again, the system,though moving north-northeast, was expected to turn to the northwest after 24 hours. By 180000Z, it was recognizedthat Yule was interacting with the newly formed TD 16W. The official forecast given on thewarning valid at 180000Z was for Yule to move northeast for 24 hours and then turn toward thewest and follow TD 16W. The alternate scenario of merger with TD 16W was mentioned on thePrognostic Reasoning message accompanying this warning.
At 190000Z, Yule and TD 16W merged (for more details on this merger, see the DiscussionSection). The merger was asymmetric in that the low-level circulation center of TD 16W washorizontally sheared and swept into the intact circulation of Yule. Based on this analysis, JTWCdecided the merged system would retain the name Yule. The system continued to move north-northeast on a long north-oriented track following the merger. The system also intensified, andbriefly became a typhoon with a large ragged eye at 210600Z (Figure 3-15/16-2).
Figure 3-15/16-2 Possessing a large ragged eye, Yule briefly attains typhoonintensity (210333Z August visible GMS imagery).
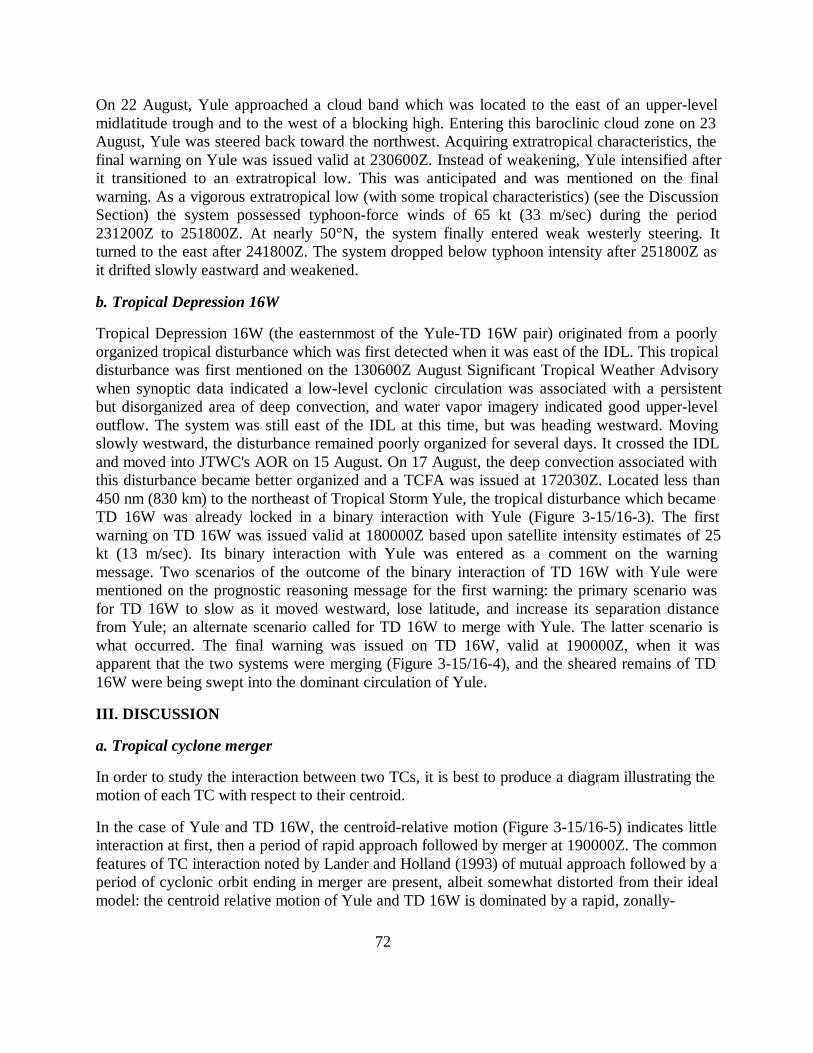
72
On 22 August, Yule approached a cloud band which was located to the east of an upper-levelmidlatitude trough and to the west of a blocking high. Entering this baroclinic cloud zone on 23August, Yule was steered back toward the northwest. Acquiring extratropical characteristics, thefinal warning on Yule was issued valid at 230600Z. Instead of weakening, Yule intensified afterit transitioned to an extratropical low. This was anticipated and was mentioned on the finalwarning. As a vigorous extratropical low (with some tropical characteristics) (see the DiscussionSection) the system possessed typhoon-force winds of 65 kt (33 m/sec) during the period231200Z to 251800Z. At nearly 50°N, the system finally entered weak westerly steering. Itturned to the east after 241800Z. The system dropped below typhoon intensity after 251800Z asit drifted slowly eastward and weakened.
b. Tropical Depression 16W
Tropical Depression 16W (the easternmost of the Yule-TD 16W pair) originated from a poorlyorganized tropical disturbance which was first detected when it was east of the IDL. This tropicaldisturbance was first mentioned on the 130600Z August Significant Tropical Weather Advisorywhen synoptic data indicated a low-level cyclonic circulation was associated with a persistentbut disorganized area of deep convection, and water vapor imagery indicated good upper-leveloutflow. The system was still east of the IDL at this time, but was heading westward. Movingslowly westward, the disturbance remained poorly organized for several days. It crossed the IDLand moved into JTWC's AOR on 15 August. On 17 August, the deep convection associated withthis disturbance became better organized and a TCFA was issued at 172030Z. Located less than450 nm (830 km) to the northeast of Tropical Storm Yule, the tropical disturbance which becameTD 16W was already locked in a binary interaction with Yule (Figure 3-15/16-3). The firstwarning on TD 16W was issued valid at 180000Z based upon satellite intensity estimates of 25kt (13 m/sec). Its binary interaction with Yule was entered as a comment on the warningmessage. Two scenarios of the outcome of the binary interaction of TD 16W with Yule werementioned on the prognostic reasoning message for the first warning: the primary scenario wasfor TD 16W to slow as it moved westward, lose latitude, and increase its separation distancefrom Yule; an alternate scenario called for TD 16W to merge with Yule. The latter scenario iswhat occurred. The final warning was issued on TD 16W, valid at 190000Z, when it wasapparent that the two systems were merging (Figure 3-15/16-4), and the sheared remains of TD16W were being swept into the dominant circulation of Yule.
III. DISCUSSION
a. Tropical cyclone merger
In order to study the interaction between two TCs, it is best to produce a diagram illustrating themotion of each TC with respect to their centroid.
In the case of Yule and TD 16W, the centroid-relative motion (Figure 3-15/16-5) indicates littleinteraction at first, then a period of rapid approach followed by merger at 190000Z. The commonfeatures of TC interaction noted by Lander and Holland (1993) of mutual approach followed by aperiod of cyclonic orbit ending in merger are present, albeit somewhat distorted from their idealmodel: the centroid relative motion of Yule and TD 16W is dominated by a rapid, zonally-
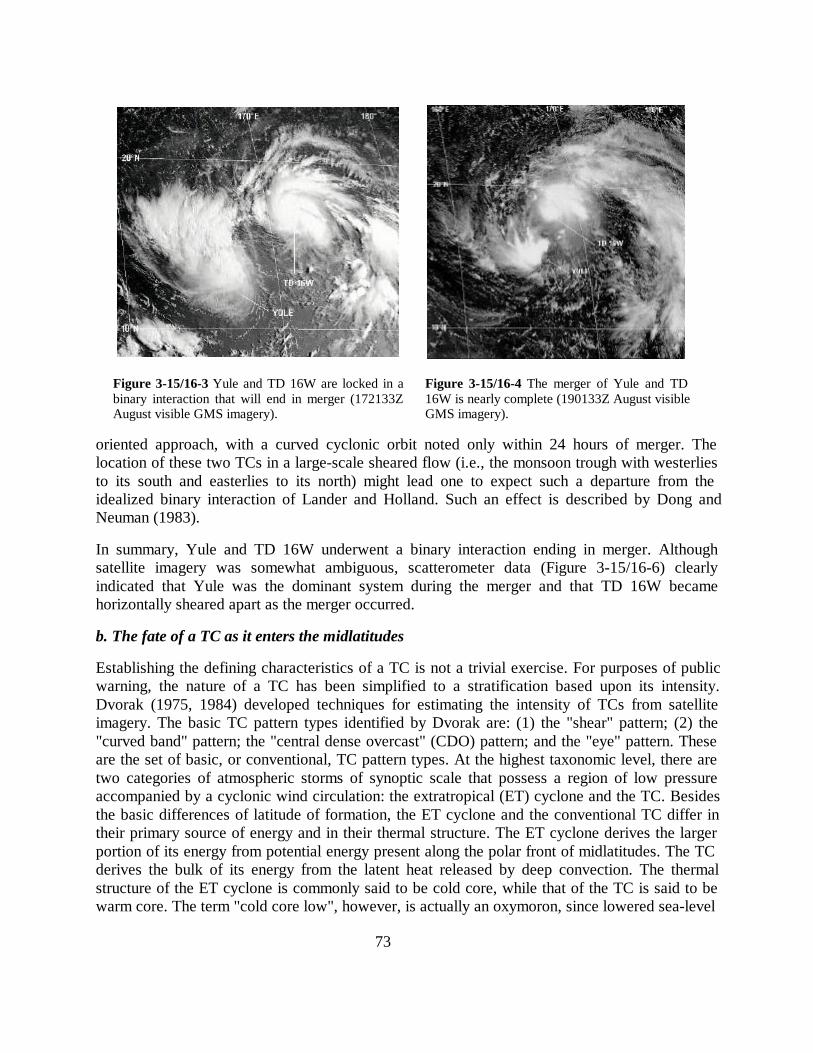
73
Figure 3-15/16-3 Yule and TD 16W are locked in abinary interaction that will end in merger (172133ZAugust visible GMS imagery).
Figure 3-15/16-4 The merger of Yule and TD16W is nearly complete (190133Z August visibleGMS imagery).
oriented approach, with a curved cyclonic orbit noted only within 24 hours of merger. Thelocation of these two TCs in a large-scale sheared flow (i.e., the monsoon trough with westerliesto its south and easterlies to its north) might lead one to expect such a departure from theidealized binary interaction of Lander and Holland. Such an effect is described by Dong andNeuman (1983).
In summary, Yule and TD 16W underwent a binary interaction ending in merger. Althoughsatellite imagery was somewhat ambiguous, scatterometer data (Figure 3-15/16-6) clearlyindicated that Yule was the dominant system during the merger and that TD 16W becamehorizontally sheared apart as the merger occurred.
b. The fate of a TC as it enters the midlatitudes
Establishing the defining characteristics of a TC is not a trivial exercise. For purposes of publicwarning, the nature of a TC has been simplified to a stratification based upon its intensity.Dvorak (1975, 1984) developed techniques for estimating the intensity of TCs from satelliteimagery. The basic TC pattern types identified by Dvorak are: (1) the "shear" pattern; (2) the"curved band" pattern; the "central dense overcast" (CDO) pattern; and the "eye" pattern. Theseare the set of basic, or conventional, TC pattern types. At the highest taxonomic level, there aretwo categories of atmospheric storms of synoptic scale that possess a region of low pressureaccompanied by a cyclonic wind circulation: the extratropical (ET) cyclone and the TC. Besidesthe basic differences of latitude of formation, the ET cyclone and the conventional TC differ intheir primary source of energy and in their thermal structure. The ET cyclone derives the largerportion of its energy from potential energy present along the polar front of midlatitudes. The TCderives the bulk of its energy from the latent heat released by deep convection. The thermalstructure of the ET cyclone is commonly said to be cold core, while that of the TC is said to bewarm core. The term "cold core low", however, is actually an oxymoron, since lowered sea-level

74
Figure 3-15/16-5 The centroid-relative motion of Yule and TD16W. Black dots indicate positions at 12-hour intervals beginningon 130000Z August and ending at the merger location (large blackdot) at 190000Z August. The square provides a length scale (asindicated) and the orientation of the cardinal directions.
Figure 3-15/16-6 Scatterometer-derivedmarine surface wind speed and direction ina swath over both Yule and TD 16W(locations indicated). This scatterometerpass over these two TCs occurredapproximately 12 hours prior to theirmerger. One can clearly see that thecirculation of TD 16W is being shearedinto the circulation of Yule (181131ZAugust ERS-2 scatterometer-derivedmarine surface wind vector).
pressure must, by hydrostatic considerations, be the result of an integrated density deficit in theatmospheric column above the area of lowered sea-level pressure. This density deficit isprimarily the result of a warm anomaly somewhere in the atmospheric column. Therefore boththe ET cyclone and the TC must possess warm cores; the true difference is in the location of thewarm anomaly that results in the lowered sea-level pressure. In the mature ET cyclone, althoughmuch of the troposphere is generally colder than in the surrounding regions (hence its cold coredesignation), the tropopause is greatly lowered, and the stratosphere above the system is muchwarmer than in the surrounding regions. The lowered tropopause accompanied with thestratospheric warmth accounts for the lowered sea-level pressure in the mature ET cyclone. Inthe TC, the column density deficit due to higher core temperature occurs in the troposphere. Inaddition to tropospheric warmth above the TC low-pressure center, the TC differs from thetypical ET cyclone in horizontal structure as well. The maximum winds in a mature TC areusually found very close to the center. The radius of maximum winds of even very intense TCsmay be on the order of 10 km. The winds beyond the radius of maximum wind may fall offquickly. The maximum winds in an ET cyclone are usually displaced farther from the center thanthey are in the TC, and the highest winds are spread out across a larger area.
So far, it seems as if the differences between the ET cyclone and the conventional TC are so

75
great that their differentialdiagnosis should be simple.This, however, is not the case.There exists, in nature, types ofcyclones that possesscharacteristics of both ETcyclones and conventional TCs.For example, the subtropicalcyclone (Hebert and Poteat1975), the arctic hurricane(Businger and Baik 1991), themonsoon depression (Ramage1971, and JTWC 1993), and themonsoon gyre (Lander 1994,Carr and Elsberry 1994). Thesetypes of cyclones have causedconfusion and forecast problemsfor decades. Furthercomplicating things is the factthat transitions among the typesare possible. For example, atwhat point does a TC enteringthe midlatitudes becomeextratropical?
In the case of Yule, ittransformed into a vigorousextratropical low (Figure 3-15/16-7) after it moved into the cloud band associated with the baroclinic zone located between amidlatitude upper-level trough and a blocking high. Yule, as a transforming — or transformed —low, intensified. Maximum wind speeds increased to typhoon intensity as the system movednorthwest from 45°N to 50°N. Few TCs intensify as they become extratropical, nor is theextratropical low into which they transform generally more intense than the transforming system.Some TCs dissipate when they enter the midlatitudes. According to Harr (personalcommunication 1997) the fate of a TC which enters the midlatitudes may be governed primarilyby what type of mid-latitude flow pattern is in place when the TC arrives there. Certainly theextratropical transition of TCs is a topic requiring much study.
IV IMPACT
Prior to becoming a typhoon, and as it moved to the north-northeast, Yule passed to the east ofWake Island. Peak winds on Wake (WMO 91245) reached 45 kt (23m/sec) sustained with a gustto 58 kt (30 m/sec) from the north at 201000Z August. Damage on Wake was light with onepower pole down. A few palm and ironwood trees were also downed. No buildings weredamaged. High surf pushed rocks onto the road going around the east end of the main runway,forcing the road's closure.
Figure 3-15/16-7 After Yule entered a baroclinic cloud band, ittransformed into a vigorous extratropical low. In this enhanced infraredimage, the transformed Yule is moving northwest toward theKamchatka peninsula with maximum winds of typhoon intensity(282333Z August enhanced infrared GMS imagery). Enhancementcurve is "BD" (Basic Dvorak).

Typhoon Yule (15W)09 Aug to 27 Aug 1997
MIN SLP 976 mbMAX INTENSITY 65 kt

Tropical Depression 16W13 Aug to 19 Aug 1997
MIN SLP 1000 mbMAX INTENSITY 30 kt

76
TYPHOON ZITA (17W)
Typhoon Zita (TY) (17W) was the second offour tropical cyclones, TY Victor (13W),TY Zita (17W), TY Fritz (22W), and TYLinda (30W) to develop and reach typhoonintensity in the South China Sea during1997. Although short-lived, the systemreached a peak intensity of 75 kt (39 m/sec)as it entered the Gulf of Tonkin andmaintained that intensity until landfall wasmade over Vietnam.
On 19 August, a tropical disturbance formedin the South China Sea approximately 300nm (560 km) to the west of the Philippineisland of Luzon. This disturbance was firstmentioned on the 20 August SignificantTropical Weather Advisory (ABPW) afteran area of deep convection had persisted for12 hours in association with a weak low-level cyclonic circulation. As the systemmoved into an area of easterly environmental steering flow, convective organization improvedand became more centrally located. This prompted JTWC to issue a Tropical Cyclone FormationAlert (TCFA), valid at 2030Z on 20 August. Shortly thereafter, banding features developed andJTWC issued its first warning on Tropical Storm Zita (17W) valid at 0000Z on the 21st. Zitacontinued tracking towards the west under the influence of easterly steering flow, equatorward ofthe subtropical ridge. Outflow aloft was good in all quadrants with little to no vertical windsheer. Despite the proximity to China's southern coastline, the system reached typhoon intensityat 0000Z on the 22nd, approximately 180 nm (330 km) southwest of Hong Kong. Zita reached itspeak intensity of 75 kt (39 m/sec) at 0600Z the same day over the Luichow Peninsula, just northof Hainan Dao (Figure 3-17-1). Zita maintained this intensity for 18 hours as it tracked westwardthrough the Gulf of Tonkin. The cyclone made landfall over Vietnam on 2100Z on the 22nd anddissipated as it moved into the mountainous terrain. The final JTWC warning was issued at0600Z on the 23rd. No reports of damage or injuries were received.
Figure 3-17-1 Zita develops a ragged eye over the LuichowPeninsula, just north of Hainan Dao At peak intensity,(220427Z August visible GMS imagery).

Typhoon Zita (17W)19 Aug to 23 Aug 1997
MIN SLP 976 mbMAX INTENSITY 75 kt

77
TYPHOON AMBER 18W
I. HIGHLIGHTS
Typhoon Amber (18W) wasthe second of four tropicalcyclones which woulddevelop within the monsoontrough during an eight dayperiod. The system wouldlater interact with TropicalStorm (TS) Cass (20W) thenmove across the island ofTaiwan and the FormosaStrait and into China.
II. TRACK ANDINTENSITY
By the 20th of August, themonsoon trough extendedfrom southeastern Asia intothe South China Sea,eastward through the Luzonstrait, across the southernMariana Islands and east-northeastward to Wake Island(where Typhoon Yule wasapproaching from the south-southwest). The monsoontrough was very active. Fourdifferent tropical cycloneswould form during the nexteight days: Typhoon Zita(17W) and TS Cass (20W),which formed in the SouthChina Sea; Super TyphoonBing (19W) which developedeast of the Mariana Islands;and finally Typhoon Amber(18W) which began in thePhilippine Sea. The pre-Amber (18W) disturbance developed in a region of upper-level divergence overlying the surfacetrough. It was first mentioned on the Significant Tropical Weather Advisory (ABPW) on 20
Figure 3-18-1 Typhoon Amber as seen by visible and infrared satelliteimagery over a 36 hour period beginning 26 August at 0633Z. The valid timesof the images are: far left 260633Z; middle and far right 242224Z. Note thebanding type eye feature in the image at far left has developed into a morecircular eye feature (better defined in the infrared imagery).
Figure 3-18-2 Visible imagery valid at 282227Z.

78
August. A scatterometer pass at 1340Z indicated at least 20 to 25 kt (10 to 13 m/s) of sustainedwind. A Tropical Cyclone Formation Alert (TCFA) was issued at 0300Z on 21 August followedby a warning at 0600Z, prompted by a ship report of 40 kt (20 m/s).
Amber remained in deep monsoonal flow with the subtropical ridge to the north and ridgingassociated with Typhoon Zita (17W) to the west-southwest. This ridging allowed only a slowwest-northwest motion ranging from 3 to 5 kt (6 to 9 km/hr), lower than what is normallyassociated with a tropical cyclone south of the sub-tropical ridge. This motion continued until 26August when Tropical Storm Cass (20W) formed west-southwest of Typhoon Amber, closeenough for direct interaction to occur. By 28 August, the effect of Tropical Storm Cass’circulation was to cause Amber’s forward speed to increase to near 8 to 10 kt (15 - 19 km/hr)with a more northwestward motion. This motion continued as Amber moved across Taiwan andthen China on 29 August.
Typhoon Amber (18W) intensified at a slightly faster than the climatological (one Dvorak 'T'number per day) rate. On 23 August at 0633Z, the intensity was estimated at 70 kt (35 m/s),based on visible satellite imagery which showed the development of a banding type eye. This eyebecame better defined in visible and infrared imagery on 24 August at 2246Z, when the intensitywas 100 kt (50 m/s) (see figure 1). The system subsequently weakened to 85 kt (43 m/s) for ashort time, but re-intensified to 110 kt (55 m/s) by the morning of 28 August as it began toapproach Taiwan. Reports from the island indicated northeast winds of 75 kt (38 m/s) and asurface pressure of 992 mb at 0300Z 28 August; 6 hours later the pressure had dropped to 984mb with north winds of 45 kt (23 m/s). By the morning of 29 August, Typhoon Amber began tomove across Taiwan with an intensity of 95 kt (figure 3-18-2) maintaining typhoon intensity as itcrossed the island’s central mountains, some of which range from 8500 to 13000 feet (2600 to4000 m). Land interaction weakened Typhoon Amber as it crossed into the Formosa Strait withan intensity of 80 kt (40 m/s). The system subsequently made landfall in China with an intensityof 65 kt (33 m/s).
III. DISCUSSION
a) The formation of concentriceyes during intensification
Satellite imagery over a 48-hourperiod beginning from 25 through27 August indicated that TyphoonAmber developed concentric eyes,a feature typically found only inintense tropical cyclones. Theprocess starts when banding beginsto wrap around the establishedcentral convective feature. Anouter eye wall begins to form anddominates the inflow of moistureflowing towards the center, while
Figure 3-18-3 Visible satellite image (valid time, 27 August 0733Z) ofTropical Storm Cass and Typhoon Amber over the South China andPhilippine Seas.

79
the inner eye wall begins to contract and may eventually dissipate. Refer to Figure 3-18-4. Theimage at top left shows a solid area of convection surrounding a cloud filled eye with a bandingfeature stretching from west to south of the center. The image at top right, which was taken abouta day later. shows an area free of convection (known as the "moat" region) developing betweenthe eyewall and the outer banding feature. The banding feature is closer to the eyewall and iswrapping around the center. The image at bottom left is 19 hours later and clearly shows abanding type structure. Microwave imagery 10 hours earlier indicated the presence of an eye;therefore cloud cover is probably obscuring it in this image. The image at bottom right showsfully developed concentric eyes with a moat in between. About 9 hours after the last image,Typhoon Amber reached a peak intensity of 110 kt (55 m/s). The concentric eye feature becameless apparent in subsequent satellite imagery as Amber approached Taiwan.
b) Interaction With TS Cass, andNumerical Model TrackPerformance
While Typhoon Amber wastransiting the Philippine Sea, TSCass formed in the South China Seaapproximately 700 nm (1300 km) tothe west-southwest. The distancebetween these tropical cyclone, asshown in Figure 3-18-3, was closeenough for direct interaction to occur(Carr and Elsberry, 1994). However,due to the smaller size and lesserorganization of TS Cass, TyphoonAmber's track was only slightlymore northwestward and faster thanwould otherwise be expected. Thedirect interaction was primarily oneway as Typhoon Amber significantlyaltered the motion track of TS Cass.Although TS Cass had only a smalleffect on the actual motion ofTyphoon Amber, it did complicatethe forecasting process, because themodels tended to exaggerate theextent of interaction Figures 3-18-5, 3-18-6 and 3-18-7 show the track reconstruction of TyphoonAmber along with the forecasted tracks from the NOGAPS, GFDN and FBAM models. Eachmodel showed a poleward bias (as they normally do) early on, then switched to an equatorwardbias as Typhoon Amber was just northeast of the island of Luzon.
IV. IMPACT
No reports were received by the JTWC on damage, injuries or fatalities due to Typhoon Amber.
Figure 3-18-4 Development of concentric eye walls in TyphoonAmber during a 53 hour period beginning 242226Z August, asseen in visible satellite imagery. Valid times of satellite imagesare: top left, 242226Z; top right, 260334Z; bottom left, 262226Z;bottom right 270334Z. Peak intensity occurred shortly afterconcentric eye wall formation.

80
Figure 3-18-5 The best track and the NGPS forecasttracks for Amber (18W).
Figure 3-18-6 The best track and the GFDN forecasttracks for Amber (18W).
Figure 3-18-7 The best track and the FBAM forecasttracks for Amber (18W).
Figure 3-18-8 Radar image of Typhoon Amber as it isapproaching Taiwan. Valid time is 290001Z

Typhoon Amber (18W)19 Aug to 30 Aug 1997
MIN SLP 933 mbMAX INTENSITY 110 kt

81
SUPER TYPHOON BING (19W)
I. HIGHLIGHTS
Super Typhoon Bing (STY) (19W) was the third of four tropical cyclones that would formwithin the monsoon trough during a period of eight days. It produced heavy rainfall whiletracking near Guam as a tropical storm on 29 August. Rapid intensification began as Bing movedwest of Guam, and two days later it became the fifth super typhoon of the 1997 season.
II. TRACK AND INTENSITY
By 26 August, the monsoon trough extended from the South China Sea to north of the PhilippineIslands, through the central Mariana and Marshall Islands to the dateline. Low level westerlywinds were observed all the way to 177E. During a normal year, the monsoon trough usuallydoes not extend past 160E. The observed eastward extension was most likely an effect of ElNiño.
The disturbance that became STY Bing (19W) started in the eastward extension of the monsoontrough near the Marshall Islands. The disturbance formed to the south-southeast of a large scaleupper level anticyclone. Vigorous convection associated with the disturbance was enhanced bystrongly divergent upper level wind flow. At 2330Z on 25 August, the Significant TropicalWeather Advisory (ABPW) was re-issued to add the disturbance as a suspect area. However, theconvection (see Figure 3-19-1) quickly organized and a Tropical Cyclone Formation Alert(TCFA) was issued only eight hours later. At 0600Z on the 24th, the disturbance was upgradedto a Tropical Depression (TD).
The newly formed TD 19W tracked westward at speeds of 13 to 15 kt (24 to 28 km/hr). This wasdue to strong low to mid-level easterly steering flow south of the subtropical ridge. Thiswestward track continued as it passed near Guam and Rota on 29 August. Fortunately for theislands, only slow intensification took place as it approached. At 1800Z on the 28th, Bing wasupgraded to tropical storm intensity, but had an intensity of only 40 kt (21 m/sec) during itspassage through the Marianas (Figure 3-19-2). Shortly after passing the Marianas, the systemunderwent a period of rapid intensification, beginning about 1200Z on 30 August and ending 54hours later with a peak intensity of 135 kt (69 m/sec). Figure 3-19-3 shows visual satelliteimagery which illustrates how quickly the central cloud structure changed in little more than aday. The satellite image at left shows Bing as a 80 kt (41 m/sec) typhoon with a developing eye,while the image at right, when Bing's intensity was near 130 kt (67 m/sec), shows a smootheyewall with a very well defined eye. This represented a change of approximately two Dvorak"T" numbers. During the intensification process, mid-level ridging began to build to the east-southeast of the tropical cyclone causing the steering flow to gradually shift from an easterly tosouth-southeasterly. At approximately the same time, mid-latitude disturbances moving down theeast side of a large mid-level ridge over eastern Asia were acting to weaken the mid levelsubtropical ridge structure north of the tropical cyclone. Both factors were significant in causingBing’s forward motion to slow as a turn to the north developed on 30 August. On 31 August, the
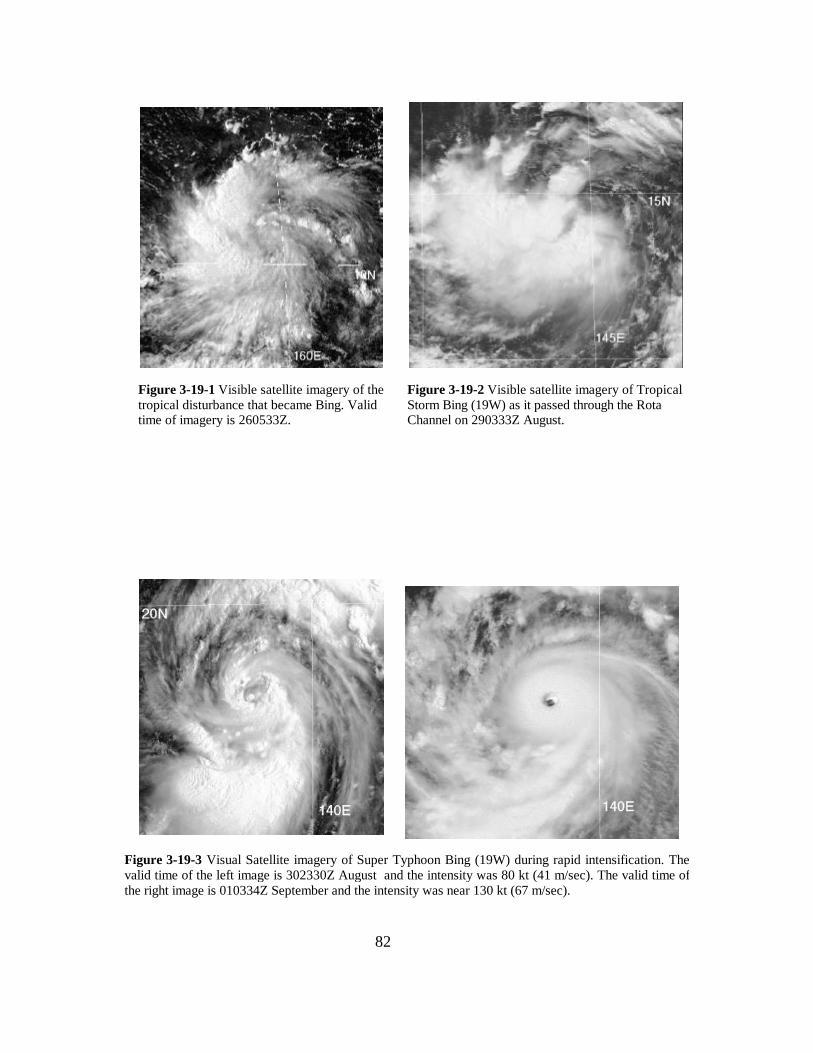
82
Figure 3-19-1 Visible satellite imagery of thetropical disturbance that became Bing. Validtime of imagery is 260533Z.
Figure 3-19-2 Visible satellite imagery of TropicalStorm Bing (19W) as it passed through the RotaChannel on 290333Z August.
Figure 3-19-3 Visual Satellite imagery of Super Typhoon Bing (19W) during rapid intensification. Thevalid time of the left image is 302330Z August and the intensity was 80 kt (41 m/sec). The valid time ofthe right image is 010334Z September and the intensity was near 130 kt (67 m/sec).

83
cyclone began following a northward oriented track with speeds between 11 and 13 kt (20 to 24km/hr), thus completing the transition from a Standard (S) to a Poleward Oriented (PO) synopticpattern as described by the systematic and integrated approach of Carr and Elsberry (1994). Asthe cyclone continued north, it passed west of the islands of Iwo Jima and Chi Chi Jima on 01and 02 September, respectively. During the closest point of approach, each island reportedsustained winds of 30 kt (15 m/sec) with peak gusts ranging from 52 kt (26 m/sec), at Iwo Jima,to 40 kt (21 m/sec), at Chi Chi Jima. By 02 September, STY Bing was located south of theJapanese island of Honshu. Although the system was beginning to weaken, it remained a threatto Honshu. However, a shift in the sub-tropical ridge over Honshu enabled a band of relativelystrong westerly winds to develop across the Japanese islands, causing the steering flow tobecome more westerly. Bing's track shifted to the northeast, and Honshu was spared.
By 03 September, Bing had moved far enoughnorthward that it began to merge with a strongmid- and upper-level westerly wind flow.Accordingly, Bing turned towards the east-northeast and accelerated to speeds above 30 kt(15 m/sec) by 04 September. By 1000Z on the4th, Special Sensor Microwave/Imager (SSM/I)indicated that upper-level westerly winds hadsheared the system’s convection and left thelow-level circulation center exposed. Figure 3-19-4 shows Bing on 05 September. Althoughthere was no longer central convection, itremained a potent extratropical cyclone withmaximum sustained winds estimated to be 55kt (28 m/sec).
III. DISCUSSION
a) Heavy Rainfall over Guam
Although STY Bing (19W) was a minimaltropical storm as it passed through the Rotachannel, just north of Guam, it did bring a lot of rain. The National Weather Service Office atTiyan reported 5.19 inches (13.2 cm) as Bing passed on 29 August. Andersen Air Force Basereported 6.17 inches (15.7 cm) of rain during a 36 hour period beginning at 0900Z on 28 August.The soil on the island was already saturated from repeated rainfall during the month, and theadditional rain resulted in flooding of low-lying areas and around small streams. The excessiverainfall triggered a landslide in the village of Santa Rita on 30 August that caused extensive localdamage. August 1997 turned out to be the wettest month in Guam’s history as the final rainfalltotal reached 39.5 inches (100 cm). This was partially due to the monsoon trough beingpositioned over the southern and central Mariana Islands, allowing numerous tropicaldisturbances to track close to the island.
Figure 3-19-4 Visible satellite imagery of SuperTyphoon Bing (19W) as a potent extratropicalsystem with maximum sustained winds estimated tobe 55 kt (28 m/sec). Valid time of image is 042227ZSeptember.

84
b) The Formation of Concentric Eye Walls
After Bing reached its peak intensity of 135 kt (69 m/sec), satellite and microwave imageryindicated the development of concentric eyewalls. Figure 3-19-5 shows the development over a48 hour period. The image at the left shows Bing at peak intensity with a very small eye andintense convection in the eyewall. The middle image is about 24 hours later, when the cyclonehad an intensity of 110 kt (56 m/sec). The central convection has diminished although a smalleye feature is still discernable. However, convection in the outer bands has started to increaseand wrap around the center. The image at right shows a newly formed, very large outer eyemeasuring approximately 90 nm (167 km) in diameter. The inner eye has almost disappearedwith only a very small area of central convection remaining. At this point, the intensity hasweakened to 85 kt (44 m/sec). This eyewall cycling process was very similar to that whichoccurred in STY Winnie (14W), TY Amber (18W) and STY Paka (05C) during the 1997Western Pacific season.
Figure 3-19-5 The development of concentric eye walls in Super Typhoon Bing (19W) as seen by SSM/I. Fromleft to right, the valid times are 001011Z, 021205Z, and 030946Z September.
c) A comparison between two objective aids in forecasting Super Typhoon Bing’s (19W)motion track
Many objective aids (forecast models) are used by the Typhoon Duty Officer (TDO) indetermining the track forecast of a tropical cyclone. In order to produce the best forecast productpossible, TDOs are thoroughly trained in the weaknesses and strengths of the various objectiveaids under certain synoptic conditions. Some examples of these strengths and weaknesses can beseen in an analysis of Bing’s track. An example is the Colorado State University Model(CSUM), which is a statistical-dynamical model based on the work of Matsumoto (1984). Themodel is further discussed in Chapter 5, section 2.3.2. Because CSUM uses statisticallydeveloped regression equations, it has a problem predicting future changes in the synopticenvironment which could alter the tropical cyclone's motion. This is illustrated in Figure 3-19-6.Although a distinct poleward bias can be seen, CSUM does a reasonable job of predicting thefuture track as long as the system remains south of the subtropical ridge. For example, during a24-hour period beginning at 0000Z on the 28th, CSUM's 72-hour forecast errors averaged about
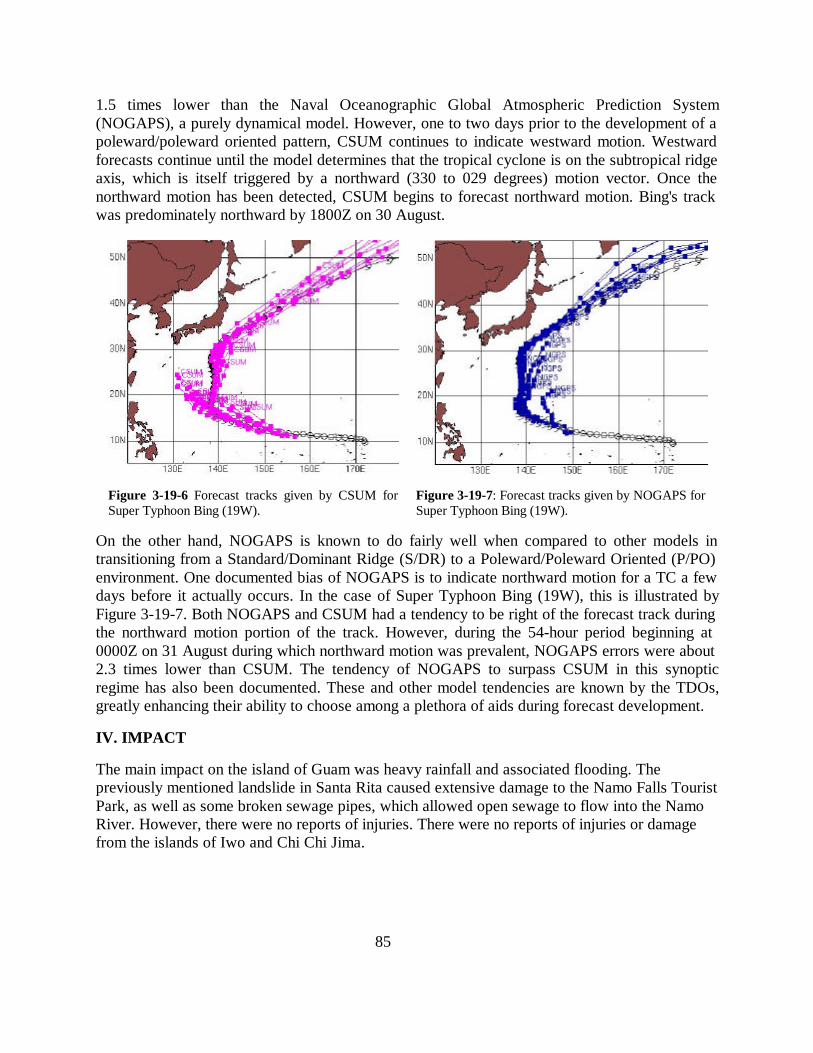
85
1.5 times lower than the Naval Oceanographic Global Atmospheric Prediction System(NOGAPS), a purely dynamical model. However, one to two days prior to the development of apoleward/poleward oriented pattern, CSUM continues to indicate westward motion. Westwardforecasts continue until the model determines that the tropical cyclone is on the subtropical ridgeaxis, which is itself triggered by a northward (330 to 029 degrees) motion vector. Once thenorthward motion has been detected, CSUM begins to forecast northward motion. Bing's trackwas predominately northward by 1800Z on 30 August.
Figure 3-19-6 Forecast tracks given by CSUM forSuper Typhoon Bing (19W).
Figure 3-19-7: Forecast tracks given by NOGAPS forSuper Typhoon Bing (19W).
On the other hand, NOGAPS is known to do fairly well when compared to other models intransitioning from a Standard/Dominant Ridge (S/DR) to a Poleward/Poleward Oriented (P/PO)environment. One documented bias of NOGAPS is to indicate northward motion for a TC a fewdays before it actually occurs. In the case of Super Typhoon Bing (19W), this is illustrated byFigure 3-19-7. Both NOGAPS and CSUM had a tendency to be right of the forecast track duringthe northward motion portion of the track. However, during the 54-hour period beginning at0000Z on 31 August during which northward motion was prevalent, NOGAPS errors were about2.3 times lower than CSUM. The tendency of NOGAPS to surpass CSUM in this synopticregime has also been documented. These and other model tendencies are known by the TDOs,greatly enhancing their ability to choose among a plethora of aids during forecast development.
IV. IMPACT
The main impact on the island of Guam was heavy rainfall and associated flooding. Thepreviously mentioned landslide in Santa Rita caused extensive damage to the Namo Falls TouristPark, as well as some broken sewage pipes, which allowed open sewage to flow into the NamoRiver. However, there were no reports of injuries. There were no reports of injuries or damagefrom the islands of Iwo and Chi Chi Jima.

Super Typhoon Bing (19W)24 Aug to 06 Sep 1997
MIN SLP 904 mbMAX INTENSITY 135 kt
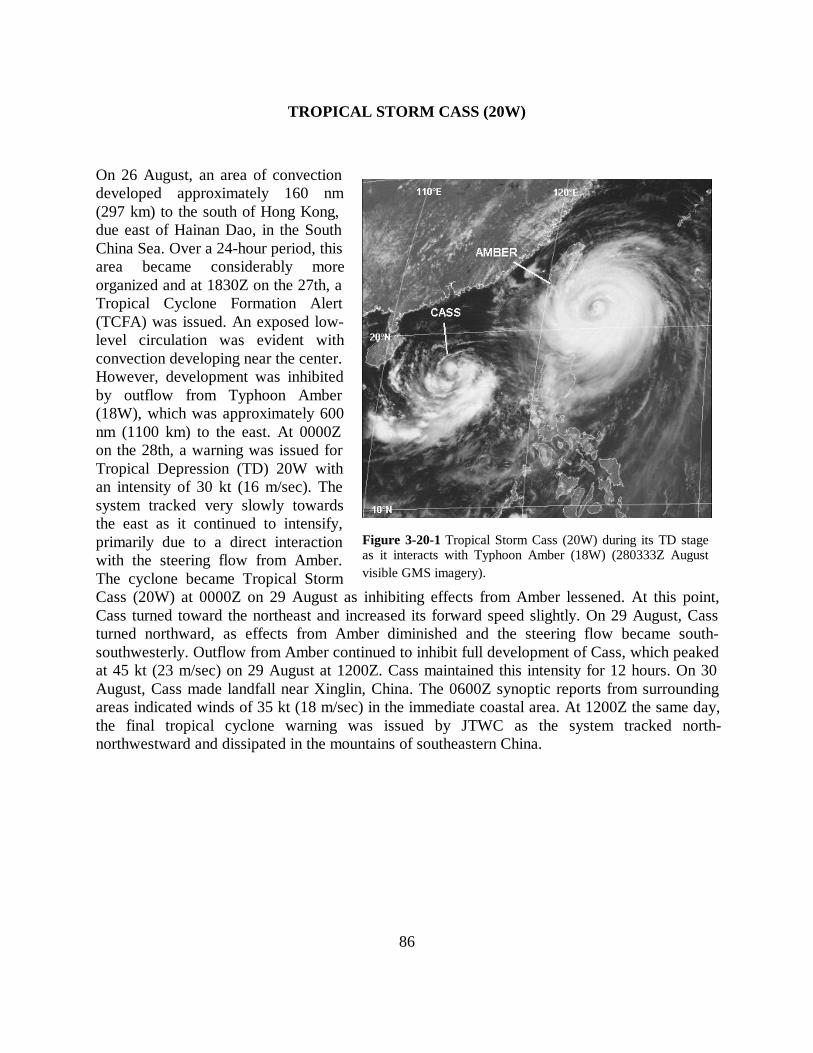
86
TROPICAL STORM CASS (20W)
On 26 August, an area of convectiondeveloped approximately 160 nm(297 km) to the south of Hong Kong,due east of Hainan Dao, in the SouthChina Sea. Over a 24-hour period, thisarea became considerably moreorganized and at 1830Z on the 27th, aTropical Cyclone Formation Alert(TCFA) was issued. An exposed low-level circulation was evident withconvection developing near the center.However, development was inhibitedby outflow from Typhoon Amber(18W), which was approximately 600nm (1100 km) to the east. At 0000Zon the 28th, a warning was issued forTropical Depression (TD) 20W withan intensity of 30 kt (16 m/sec). Thesystem tracked very slowly towardsthe east as it continued to intensify,primarily due to a direct interactionwith the steering flow from Amber.The cyclone became Tropical StormCass (20W) at 0000Z on 29 August as inhibiting effects from Amber lessened. At this point,Cass turned toward the northeast and increased its forward speed slightly. On 29 August, Cassturned northward, as effects from Amber diminished and the steering flow became south-southwesterly. Outflow from Amber continued to inhibit full development of Cass, which peakedat 45 kt (23 m/sec) on 29 August at 1200Z. Cass maintained this intensity for 12 hours. On 30August, Cass made landfall near Xinglin, China. The 0600Z synoptic reports from surroundingareas indicated winds of 35 kt (18 m/sec) in the immediate coastal area. At 1200Z the same day,the final tropical cyclone warning was issued by JTWC as the system tracked north-northwestward and dissipated in the mountains of southeastern China.
Figure 3-20-1 Tropical Storm Cass (20W) during its TD stageas it interacts with Typhoon Amber (18W) (280333Z Augustvisible GMS imagery).

Tropical Storm Cass (20W)26 Aug to 31 Aug 1997
MIN SLP 991 mbMAX INTENSITY 45 kt

87
SUPER TYPHOON OLIWA (02C)
I. HIGHLIGHTS
The sixth of eleven tropical cyclones (TCs) to attain super typhoon intensity in the western NorthPacific (WPN) during 1997, Oliwa formed east of the international dateline (IDL) and to thesouthwest of the Hawaiian Islands. After becoming a tropical storm in the Central PacificHurricane Center (CPHC) area of responsibility (AOR), this TC was named Oliwa. Oliwa movedon a long straight running track which brought it across the IDL into the WPN, and eventually tolandfall in southwestern Japan. As it moved westward from its region of formation in aneastward displaced monsoon trough and into the WNP basin (which was unusually cloud free forthe time of year), the intensity forecasts for Oliwa were nearly all too low. Early in its life, Oliwawas accompanied by a weak, unnamed Southern Hemisphere twin. While near its peak intensity,a possible eye-wall meso vortex was revealed by visible satellite imagery. After its peak, well-defined concentric eye wall clouds were observed, which were especially distinct in microwaveimagery.
II. TRACK AND INTENSITY
During late August, low-levelmonsoon westerlies extended acrossthe IDL and stretched eastward at lowlatitudes to the southwest of Hawaii.At the end of August, a tropicaldisturbance formed southwest ofHawaii at the eastern end of themonsoon trough associated with theseeastward-displaced low-latitudewesterlies. This disturbance movedslowly westward and intensified. On02 September, while it was still east ofthe IDL, the CPHC (located inHonolulu, Hawaii) upgraded it toTropical Depression (TD) 02C. Afterbecoming a tropical storm in CPHC'sAOR at 030000Z September, TD 02Cwas named Oliwa (Hawaiian for"Oliver", the letter "w" in Oliwa ispronounced as a "v" in this case). On04 September, Oliwa crossed the IDLand entered the JTWC AOR. The firstwarning issued by JTWC was valid at040600Z September.
3-02C-1 The low-angle morning sun nicely highlights thefeatures of the cloud tops of Oliwa's eye wall cloud andperipheral rainbands as the typhoon reached its peak of 140 kt(72 m/sec) (092034Z September visible GMS imagery).
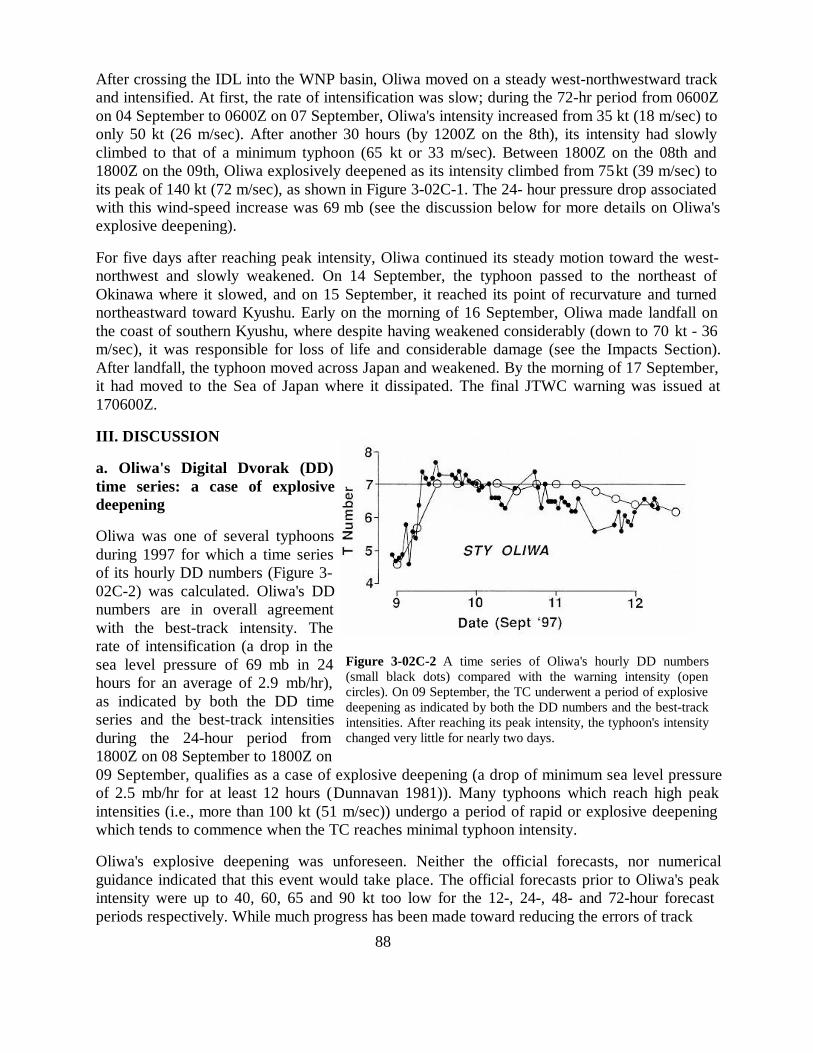
88
After crossing the IDL into the WNP basin, Oliwa moved on a steady west-northwestward trackand intensified. At first, the rate of intensification was slow; during the 72-hr period from 0600Zon 04 September to 0600Z on 07 September, Oliwa's intensity increased from 35 kt (18 m/sec) toonly 50 kt (26 m/sec). After another 30 hours (by 1200Z on the 8th), its intensity had slowlyclimbed to that of a minimum typhoon (65 kt or 33 m/sec). Between 1800Z on the 08th and1800Z on the 09th, Oliwa explosively deepened as its intensity climbed from 75 kt (39 m/sec) toits peak of 140 kt (72 m/sec), as shown in Figure 3-02C-1. The 24- hour pressure drop associatedwith this wind-speed increase was 69 mb (see the discussion below for more details on Oliwa'sexplosive deepening).
For five days after reaching peak intensity, Oliwa continued its steady motion toward the west-northwest and slowly weakened. On 14 September, the typhoon passed to the northeast ofOkinawa where it slowed, and on 15 September, it reached its point of recurvature and turnednortheastward toward Kyushu. Early on the morning of 16 September, Oliwa made landfall onthe coast of southern Kyushu, where despite having weakened considerably (down to 70 kt - 36m/sec), it was responsible for loss of life and considerable damage (see the Impacts Section).After landfall, the typhoon moved across Japan and weakened. By the morning of 17 September,it had moved to the Sea of Japan where it dissipated. The final JTWC warning was issued at170600Z.
III. DISCUSSION
a. Oliwa's Digital Dvorak (DD)time series: a case of explosivedeepening
Oliwa was one of several typhoonsduring 1997 for which a time seriesof its hourly DD numbers (Figure 3-02C-2) was calculated. Oliwa's DDnumbers are in overall agreementwith the best-track intensity. Therate of intensification (a drop in thesea level pressure of 69 mb in 24hours for an average of 2.9 mb/hr),as indicated by both the DD timeseries and the best-track intensitiesduring the 24-hour period from1800Z on 08 September to 1800Z on09 September, qualifies as a case of explosive deepening (a drop of minimum sea level pressureof 2.5 mb/hr for at least 12 hours (Dunnavan 1981)). Many typhoons which reach high peakintensities (i.e., more than 100 kt (51 m/sec)) undergo a period of rapid or explosive deepeningwhich tends to commence when the TC reaches minimal typhoon intensity.
Oliwa's explosive deepening was unforeseen. Neither the official forecasts, nor numericalguidance indicated that this event would take place. The official forecasts prior to Oliwa's peakintensity were up to 40, 60, 65 and 90 kt too low for the 12-, 24-, 48- and 72-hour forecastperiods respectively. While much progress has been made toward reducing the errors of track
Figure 3-02C-2 A time series of Oliwa's hourly DD numbers(small black dots) compared with the warning intensity (opencircles). On 09 September, the TC underwent a period of explosivedeepening as indicated by both the DD numbers and the best-trackintensities. After reaching its peak intensity, the typhoon's intensitychanged very little for nearly two days.

89
forecasts, and real skill as measured against such benchmarks as CLIPER has been achieved,errors of intensity forecasts remain large, and there is much room for improvements.
b. A possible eye wall mesovortex
Eyewall mesocyclonic vortices (EMs) were first detected and documented in airborne Dopplerradar data by Marks and Houze (1984) and also with aircraft inertial navigation equipment asnoted by Black and Marks (1991). Stewart and Lyons (1996) identified EMs with the GuamNEXRAD in association with the passage of Ed (1993) over Guam. Until the implementation ofthe NEXRAD radar network in the United States during the early 1990s, only chance encounterswith EMs have occurred during reconnaissance aircraft penetrations. However, now that Dopplervelocity data are available, strong mesocyclones associated with TC outer convective bands andeyewall convection are frequently detected. Stewart et al. (1997) used NEXRAD data to showthat mesocyclonic vortices in the wall clouds of TC eyes may be a mechanism for TCintensification and for extreme wind bursts in TCs, as noted with Hurricane Andrew damage(Wakimoto and Black 1993). In three cases, a TC underwent a period of rapid intensificationduring which time several vertically deep EMs formed prior to the occurrence of rapidintensification and persisted for several hours while rapid deepening was occurring.
In the case of Oliwa, a possible EM was observed in its eye on visible satellite imagery (Figure3-02C-3) in the early daylight hours of 10 September. Possible EMs were evident on only twoimage frames: at 092030Z and 092130Z September. Unlike the cases investigated by Stewart etal. (1997), the EMs observed in Oliwa's eye wall cloud occurred after the TC had reached itspeak intensity.
Figure 3-02C-3 A small commashaped cloud along the inner edge ofOliwa's eye wall cloud is a possiblemanifestation of an eyewallmesovortex. This image is a zoom ofthe eye and eye wall cloud whichappears in Figure 3-02C-1 (092034ZSeptember visible GMS imagery).
Figure 3-02C-4 Microwave imagery isespecially suited to view concentricwall clouds in a TC. Oliwa developedwell-defined concentric wall clouds as itbegan to weaken (120104Z September85 GHz horizontally polarizedmicrowave DMSP imagery).

90
c. Concentric wall clouds
Oliwa was yet another example of an intense WNP typhoon acquiring concentric eye wall cloudswhich were easily seen on conventional visible and infrared imagery, and especially well-definedon microwave imagery (Figure 3-02C-4). Microwave imagery is particularly well-suited toobserve and document the evolution of concentric eye wall clouds (e.g., Paka's (05C) eye-wallreplacement cycle was exceptionally well documented on microwave imagery) There is atendency for high-end typhoons (i.e., those with peak intensity greater than 100 kt (51 m/sec)) todevelop concentric eye wall clouds.
IV. IMPACT
Oliwa made landfall in southwestern Japan where it was responsible for widespread damage andfor loss of life. On Japan's southern island of Kyushu, seven people were reported killed. Onethousand homes were flooded and dozens of homes were destroyed. Along Korea's southerncoast, twenty-eight ships sank or were wrecked in strong winds and high waves. A crabbing shipwith 10 crewmen aboard was reported missing. Earlier in its life, Oliwa passed close to the islandof Agrihan in the Marianas, which reported winds of about 85 mph (74 kt). No reports of damageor injuries were received at JTWC.

Super Typhoon Oliwa (02C)28 Aug to 17 Sep 1997
MIN SLP 898 mbMAX INTENSITY 140 kt.

91
TYPHOON DAVID (21W)
The disturbance which would become Typhoon David (21W) was first noted in the monsoontrough northeast of Kwajalein on 09 September. Visible satellite imagery on 10 Septembershowed Super Typhoon Oliwa (02C), moving northwestward south of the subtropical ridge axis.Southeast of Oliwa, the monsoon trough extended from 155E to 175W along the 10N latitudeline in conjunction with a weaker near-equatorial trough in the southern hemisphere thatextended from 160E to 173E near 5S to 8S. The twin troughs were indicative of a large area ofwesterly winds straddling the equator between 10N and 8S. The system was initially mentionedon the Significant Tropical Weather Advisory (ABPW) at 0600 on 10 September; six hours latera Tropical Cyclone Formation Alert (TCFA) was issued. By 12 September at 0034Z, visiblesatellite imagery indicated that the developing depression had a very large associated low-levelcirculation, with westerly winds feeding into the vortex from as far west as 150E. On the easternside, flow into the vortex extended well past the dateline. At 1800Z that day, JTWC issued thefirst warning on the system. Post-analysis would later indicate that the system had actuallyreached tropical depression intensity (25 kt(13 m/sec)) two days earlier on 10 September. Thesystem continued to organize as it tracked northwestward at approximately 10 kt (19 km/hr).
David intensified at a climatological rate,becoming a typhoon by 1800Z on 13September. The cyclone tracked steadilyin a northwestward direction equatorwardof the sub-tropical ridge (StandardDominant Ridge pattern/region of theSystematic and Integrated Approach –see Chapter 1). David’s large sizecontributed to the strong northwestwardcomponent of its motion due to the "BetaEffect". This is the mechanism by whichlarge tropical cyclones tend to self-propagate northward due to theirdisturbance of the earth’s vorticity field.
By 1800Z on 14 September, David hadreached its peak of 95 kt (49 m/sec),remaining at this intensity for 36 hours. Itcontinued traveling in a generallynorthwestward direction at speedsranging from 12 - 15 kt (22 - 28 km/hr). By 16 September, strong mid-level ridging (related tothe large Beta Effect) had developed east of the system. This was indicative of the formation of aPoleward/Poleward Oriented pattern/region (Systematic and Integrated Approach, see Chapter1). Transition to the poleward pattern, along with a passing mid-latitude trough, caused David torecurve.
Figure 3-21-1 Typhoon David (21W) at 2230Z on 15September 1997.

92
David passed near the island of Minami Tori Shima (WMO 479910) on the 16th, wheresustained winds of 65 kt (33 m/sec) and a minimum sea level pressure of 968mb were recorded.Deep convection started to decrease near the system center as the cyclone began to weaken.However, the convection around the periphery began to increase and visible satellite imageryindicated a large cloud free area around the tropical cyclone's center.
At 0000Z on the 18th, David made its closest approach to the island of Chi Chi Jima (WMO47971), where sustained wind speeds of 40 kt (21 m/sec) and a minimum sea level pressure of967mb were reported. The intensity had dropped to 65 kt (33 m/sec), but the system remained athreat to the islands of Japan. Fortunately, David continued to turn toward the northeast, makingits closest approach to Honshu on 19 September. Yokosuka reported 30 kt (15 m/sec) sustainedwinds at 0300Z.
JTWC issued its final warning at 0600Z on 20 September as the system transitioned to anextratropical low. The remnants of Typhoon David (21W) continued moving into the Gulf OfAlaska. There were no reports of damage or injuries as a result of David.

Typhoon David (21W)09 Sep to 22 Sep 1997
MIN SLP 949 mbMAX INTENSITY 95 kt

93
TYPHOON FRITZ (22W)
The tropical disturbance that becameTyphoon Fritz (22W) originated in theSouth China Sea (near the Philippinearchipelago) within a long east-west cloudband associated with the monsoon trough.When first mentioned on the 19September Significant Tropical WeatherAdvisory (ABPW), the deep convectionassociated with this disturbance hadformed a distinct cloud cluster embeddedin an otherwise unbroken monsoonalcloud band that stretched eastward along10N from Southeast Asia to 170E. On 20September, JTWC went directly to thefirst warning on Tropical Depression (TD)22W. At 1800Z that day, satellite dataindicated that the winds in the system hadincreased to 25 kt (13 m/sec). The cyclonewas expected to intensify after it movedinto open water away from the coast ofVietnam. As expected, TD 22W turnedsharply to the right and began a slow tracktoward the north-northeast. The system failed to intensify until 22 September when it slowedsoutheast of Hainan Island, and organization of the deep convection began to improve. TD 22Wwas upgraded to Tropical Storm Fritz (22W) on the warning valid at 0000Z on the 23rd, basedon satellite intensity estimates of 45 kt (23 m/sec). After becoming a tropical storm, Fritz turnedtoward the west and began to track toward the coast of Vietnam while continuing to intensify.Fritz reached typhoon intensity at 0000Z on the 24th (Figure 3-22-1). The intensity peaked at 75kt (39 m/sec) at 0600Z on 24 September and held steady until the 25th when Fritz made landfall.Fritz steadily weakened after landfall, and the final warning was issued valid at 1800Z on 25September, when it was expected that the system would dissipate over land within 24 hours. InVietnam, at least 25 people were reported killed and dozens were missing. Most of the victimswere gold prospectors buried in landslides triggered by flash flooding.
Figure 3-22-1 Tightly wrapped coils of deep convectionsurrounding a ragged ragged eye indicate that Fritz hasbecome a typhoon (240133Z September visible GMSimagery).

Typhoon Fritz (22W)17 Sep to 26 Sep 1997
MIN SLP 968 mbMAX INTENSITY 75 kt

94
TROPICAL STORM ELLA (23W)
The disturbance that became TropicalStorm Ella (23W) began as a smallcirculation east of the dateline, withscattered convection emerging from alarger area of convection on 19September. By 21 September, visibleimagery indicated that the convectionhad become well developed over thesystem’s center. Now a tropical storm,Ella moved rapidly to the west-northwest at 18 to 25 kt (33 to 46km/hr) under the influence of easterlysteering flow south of the subtropicalridge. However, by 22 September, thesystem began to slow as it approacheda break in the ridge, and on 23September Tropical Storm Ella (23W)moved through the break and recurvedto the northeast.
Tropical Storm Ella (23W) was anunusually small system. The central convection associated with the low-level circulation on 20September was only about 30 nm (56 km) in diameter. The cyclone’s small size in conjunctionwith moderate vertical wind shear kept Tropical Storm Ella (23W) from intensifying beyond aminimal tropical storm (peak intensity was 40 kt (20m/s) on 22 September). Tropical Storm Ella(23W) dissipated on 24 September near 40N 170E in the vicinity of a frontal zone.
Figure 3-23-1 Tropcial Storm Ella (23W) showing a partiallyexposed low-level circulation (212132Z September visible GMSimagery).

Tropical Storm Ella (23W) 18 SEP TO 25 SEP 1997
MIN SLP 994 MBMAX INTENSITY 40 KT

95
SUPER TYPHOON GINGER (24W)
I. HIGHLIGHTS
The seventh of eleven Tropical Cyclones (TCs) to attain super typhoon intensity in the westernNorth Pacific (WNP) during 1997, Ginger formed at low latitudes in the Marshall Islands. It wasone of ten TCs that formed east of 160E and south of 20N; within the "El Niño" box in Figure 3-3a. Ginger moved on a north-oriented track through the eastern portion of the western NorthPacific basin. As it neared its peak intensity, the typhoon possessed an extensive system ofprimary and peripheral rainbands. When it reached 30N, it accelerated within the mid-latitudewesterlies where it transitioned into a vigorous extratropical low. Ginger was one of the many1997 TCs that formed at the eastern end of the monsoon trough near the international dateline(IDL) and evolved into a large solitary TC's (i.e., much of the WNP basin, with the exception ofthe single typhoon, was unusually free of deep convection).
II. TRACK AND INTENSITY
During the first two weeks of September1997, two TCs, STY Oliwa (02C) andTY David (21W), formed near the IDL,moved across the basin as large solitarytyphoons, and recurved near Japan. On 21September, as David was recurving eastof Japan, the tropical disturbance that wasto become Ginger had consolidated atlow latitude near the IDL. On 22September, this tropical disturbancebecame better organized, as evidenced bya low-level cyclonic circulation that waswell-defined by synoptic data. Deepconvection associated with the low-levelcirculation became organized into curvedbands; and animated water vapor imageryindicated the presence of anticyclonicflow at upper levels over the low-levelcenter. This disturbance was firstmentioned on the Significant TropicalWeather Advisory (ABPW) valid at0000Z on 22 September. A TropicalCyclone Formation Alert (TCFA) wasissued at 0530Z on the 22nd, when satellite data indicated continued improvement in thesystem's organization and the presence of factors deemed favorable for TC formation (e.g., thewater vapor derived winds showed strong upper-level divergence over the system). Based onsatellite derived intensity estimates of 25 kt (13 m/sec), the first warning on Tropical Depression
Figure 3-24-1 Ginger nears its peak intensity of 145 kt (75m/sec). Extensive banding features accompanied this TC(262132Z September visible GMS imagery).

96
(TD) 24W was issued valid at 1800Z on 22 September. For 36 hours, TD 24W moved northwestand slowly intensified. Based on satellite intensity estimates, it was upgraded to Tropical StormGinger (24W) on the warning valid at 0600Z on 24 September. Ginger began to track in a morenortherly direction. Intensifying at a normal climatological rate, it became a typhoon at 1200Z onthe 25th. At this point Ginger began a period of explosive deepening (see Discussion Section)and in the 24-hour period from the 26th at 0000Z to the 27th at 0000Z, the intensity jumped from75 kt (39 m/sec) to 145 kt (75 m/sec).
As it neared its peak intensity, Ginger's structure provided spectacular views via visible satelliteimagery (e.g., Figure 3-24-1). It had a small well-defined eye embedded in a smooth symmetricalCentral Dense Overcast (CDO), which in turn was surrounded by an extensive pattern of primaryand peripheral cloud bands. The unusually cloud free structure of the large-scale environmentserved to highlight Ginger in the imagery (Figure 3-24-2).
After Ginger peaked on 27 September, it moved slowly north-northwestward and arrived at itspoint of recurvature 36 hours later at 1200Z on 28 September with an intensity of 110 kt (57m/sec). Typically, weak typhoons peak at or near their point of recurvature, while more intensetyphoons, like Ginger, experience a delay between reaching peak intensity and arriving at theirpoint of recurvature (JTWC 1994).
After recurving, Ginger began a slow acceleration into the midlatitudes. Finally, the intensity fellbelow typhoon force at 1800Z on the 30th, and the system made a smooth transition into avigorous extratropical low. The final warning was issued, valid at 0600Z on 30 September, whena complete extratropical transition was expected within six hours.
III. DISCUSSION
a. Ginger's Digital Dvorak (DD) time series
Ginger was one of several typhoons during 1997 for which a time series of hourly DD-numbers(Figure 3-24-3) was recorded. Ginger's DD-numbers are in overall agreement with the best-trackintensity; although there are two notable exceptions. First, the drop of the DD-numbers below thevalues of the best track intensities as Ginger was weakening, is an intrinsic feature of Dvorakanalysis for a TC weakening over water. The decrease of the Current Intensity (CI) is delayed, byabout one day behind a falling computed Data T (DT) number. In general this results in the CIremaining one T-number higher than the DT for steadily weakening systems. The seconddiscrepancy is harder to explain, and carries both operational and research implications with it.The best-track intensity values are all lower than their corresponding DD-numbers as Gingerintensified. The rate of intensification during the 24-hr period from 0000Z on 26 September to0000Z on September, as shown by Digital Dvorak (50 mb for an average of 2.1 mb/hr), is quitedifferent from that computed from the best track (74 mb for an average of 3.1 mb/hr). Theformer rate of intensification qualifies as a case of explosive deepening (defined as meeting orexceeding a drop of minimum sea-level pressure of at least 2.5 mb/hr for 12 hours (Dunnavan1981)). The latter rate of deepening is not so extreme, but qualifies as a case of rapid deepening(defined as a drop of minimum sea-level pressure of at least 1.75 mb/hr, or 42 mb/24 hrs(Holliday and Thompson 1979).

97
Figure 3-24-2 Ginger and its extensive pattern ofprimary and peripheral cloud bands are isolated in anotherwise relatively cloud free tropics (270033ZSeptember visible GMS imagery).
Figure 3-24-3 A time series of Ginger's hourly DD-numbers (small black dots) compared with the best-track intensity (open circles). Note that as Gingerwas intensifying the best-track intensity rises fasterthan the value of the DD-numbers (indicated by thethick black line).
The discrepancy between the DD-numbers and best track intensities during intensification is notuncommon. However, in the case of Ginger, one can see that the resulting rate of deepening isquite different depending on whether the best-track or the DD-numbers are used to compute it.The results of research into TC intensification processes may be very different depending uponwhich method is used. DD-numbers are still experimental, and methods for incorporating theminto operational practice are being explored. Reasons for the disagreement between the DD-numbers and the best-track intensities must be determined before any modifications are made tothe current methods of estimating TC intensity utilizing satellite imagery.
b. Large and solitary
Ginger was one of many TCs of the 1997 season that formed at the eastern end of the monsoontrough near the IDL and became large solitary typhoons (Figure 3-24-2 and Figure 3-24-4). Thepersistent reduction of deep convection throughout much of Micronesia and within the lowlatitudes of the WNP basin became more pronounced during the latter half of 1997. The low-level monsoon westerlies and their associated deep convection moved eastward to the IDL (andbeyond) in association with large-scale climatic anomalies related to El Niño. Other large andsolitary typhoons during 1997 included TY David (21W), STY Oliwa (02C), STY Ivan (27W),STY Joan (28W), STY Keith (29W), and STY Paka (05C).
c. Concentric eye wall clouds
Ginger was yet another example of an intense WNP typhoon acquiring concentric eye wallclouds that are easily seen on conventional visible and infrared imagery, and are especially well-defined on microwave imagery (Figure 3-24-5). Microwave imagery is particularly well-suited toobserve concentric eye wall clouds, and to document their evolution. (Paka's eye-wallreplacement cycle was exceptionally well documented on microwave imagery; see the Paka
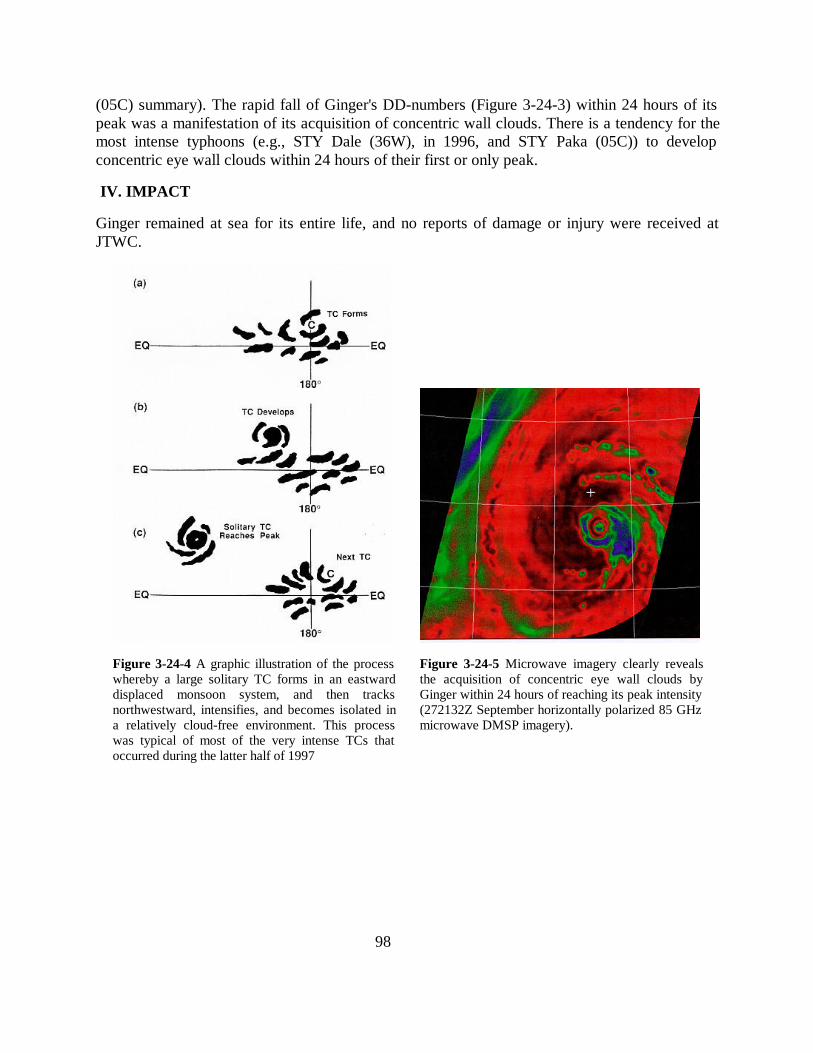
98
(05C) summary). The rapid fall of Ginger's DD-numbers (Figure 3-24-3) within 24 hours of itspeak was a manifestation of its acquisition of concentric wall clouds. There is a tendency for themost intense typhoons (e.g., STY Dale (36W), in 1996, and STY Paka (05C)) to developconcentric eye wall clouds within 24 hours of their first or only peak.
IV. IMPACT
Ginger remained at sea for its entire life, and no reports of damage or injury were received atJTWC.
Figure 3-24-4 A graphic illustration of the processwhereby a large solitary TC forms in an eastwarddisplaced monsoon system, and then tracksnorthwestward, intensifies, and becomes isolated ina relatively cloud-free environment. This processwas typical of most of the very intense TCs thatoccurred during the latter half of 1997
Figure 3-24-5 Microwave imagery clearly revealsthe acquisition of concentric eye wall clouds byGinger within 24 hours of reaching its peak intensity(272132Z September horizontally polarized 85 GHzmicrowave DMSP imagery).

Super Typhoon Ginger (24W)21 Sep to 01 Oct 1997
MIN SLP 892 mbMAX INTENSITY 145 kt

99
TROPICAL STORM HANK (25W)
Tropical Storm (TS) Hank (25W)originated as a surface circulationin the South China Sea on the27th of September. For severaldays, synoptic data suggested thepresence of this circulation, butwith light winds and minimalconvection. It first appeared as asuspect area on the 30 SeptemberSignificant Tropical WeatherAdvisory (ABPW). The system’sconvective signature experiencedfluctuation over the next fewdays. No Tropical CycloneFormation Alert (TCFA) wasissued on this system; JTWCissued a warning at 0000Z on 3October with a 35 kt (70 m/s)intensity based on synoptic dataand cloud signature. Hank peakedat 40 kt (80 m/s) during the next 6to 12 hours, before beingsubjected to strong vertical windshear. During its early existence,the disturbance drifted in theSouth China Sea, eventuallymoving equatorward. At about the time JTWC began issuing warnings, it began trackingnorthward along the Vietnam coast. Although infrared imagery indicated very convincingconvective cloud masses over land as early as 2032Z on October 3, the circulation center wasactually further east and landfall was not made until about 0000Z on the 5th. Landfall occurrednear 18ºN (figure 3-25-1). No reports of damage were received by JTWC.
Figure 3-25-1 Hank makes landfall (042333Z October visible GMSimagery).

Tropical Storm Hank (25W)27 Sep to 05 Oct 1997
MIN SLP 994 mbMAX INTENSITY 40 kt

100
TROPICAL DEPRESSION 26W
Tropical Depression 26W initiallyformed as a disturbance southeast ofthe Marianas on 29 September. Afteran initial slow track to the north, thedisturbance turned briskly westwardat about 14 kts (26 km/hr) as thesubtropical ridge built to its north.The disturbance tracked just north ofGuam bringing the island showers andthunderstorms early on 02 October.The disturbance became TropicalDepression 26W northwest of Guamlate on 02 October. On 03 October at00Z, a 30 kt (60 m/s) sustained shipobservation was reported within 1degree of the system center. Satelliteimagery at this time indicated a low-level circulation with only scatteredconvection near the center. Theconvection became more widespreadduring the next 24 hours as theTropical Depression 26W’s forward motion slowed in the weak steering region associated with abreak in the mid-level subtropical ridge. Tropical Depression 26W did not intensify further.Satellite imagery from 4 October and 5 October showed it to be affected by increasing verticalwind shear. By 5 October, Tropical Depression 26W had increased its westward speed as thesubtropical ridge redeveloped to its north. Tropical Depression 26W continued to experiencevertical wind shear, as evident by 00Z 6 October visible imagery indicating that the main area ofconvection was distinctly separated from its low-level circulation center. The system remained atropical depression as indicated by 30 kt (60m/s) wind ship observations near its center. TropicalDepression 26W dissipated over the Philippine Sea on 7 October as it merged with a frontalboundary.
Figure 3-26-1 Tropical Depression 26W increasing inconvection (032132Z October visible GMS imagery).

Tropical Depression 26W29 Sep to 07 Oct 1997
MIN SLP 1000 mbMAX INTENSITY 30 kt

101
SUPER TYPHOONS IVAN (27W) AND JOAN (28W)
I. HIGHLIGHTS
Super Typhoon Ivan (27W) and SuperTyphoon Joan (28W) were two of threetropical cyclones (TCs) in the westernNorth Pacific (WNP) during 1997 toattain an extreme intensity of 160 kt (82m/sec), and were the 8th and 9th supertyphoons of 1997's unprecedentedannual total of eleven. They reachedtheir peak intensities at nearly the sametime: Ivan at 171800Z October and Joanat 170600Z October. At 171200Z, Ivanwas at 155 kt (80 m/sec) while Joan wasstill at 160 kt (82 m/sec); the firstobservation of two TCs of such extremeintensity existing simultaneously in theWNP. Both Ivan and Joan affected theMariana Islands, and Ivan was the firstand only TC during 1997 of at leasttropical storm intensity to make landfallon Luzon. An equatorial westerly windburst (bounded by twin near-equatorialtroughs) preceded the formation of Ivan,Joan and a Southern Hemisphere twin,TC 02P (Lusi).
II. TRACK AND INTENSITY
During the first week of October, low-latitude, low-level, westerly winds blewalong the equator from approximately 150E eastward, across the international dateline (IDL), tonear 170W. Twin near-equatorial troughs (one in the Northern Hemisphere, the other in theSouthern Hemisphere) bounded these westerly winds and a region of deep convection. As thedeep convection along the equator diminished, three TCs emerged from this synoptic flowpattern. The first -- Lusi -- formed in the Southern Hemisphere on 08 October and movedsouthward between Fiji and Vanuatu. On 13 October, Ivan and Joan formed in the NorthernHemisphere in the eastern half of Micronesia and began to track toward the west-northwest. Asthey were initially poorly organized (Figure 3-27/28-1) and isolated in an environment relativelyfree of deep convection (Figure 3-27/28-2), neither numerical guidance nor human forecasteranticipated the extreme intensity which these two TCs would attain. Also lacking during thelifetimes of the two TCs was any significant monsoon flow to their south and west.
Figure 3-27/28-1 The pre-Ivan and pre-Joan tropicaldisturbances are poorly organized at low latitude in the easternportion of the WNP basin. A Southern Hemisphere twin, Lusi, ispassing southward between Fiji and the islands of Vanuatu(102132Z October visible GMS imagery).
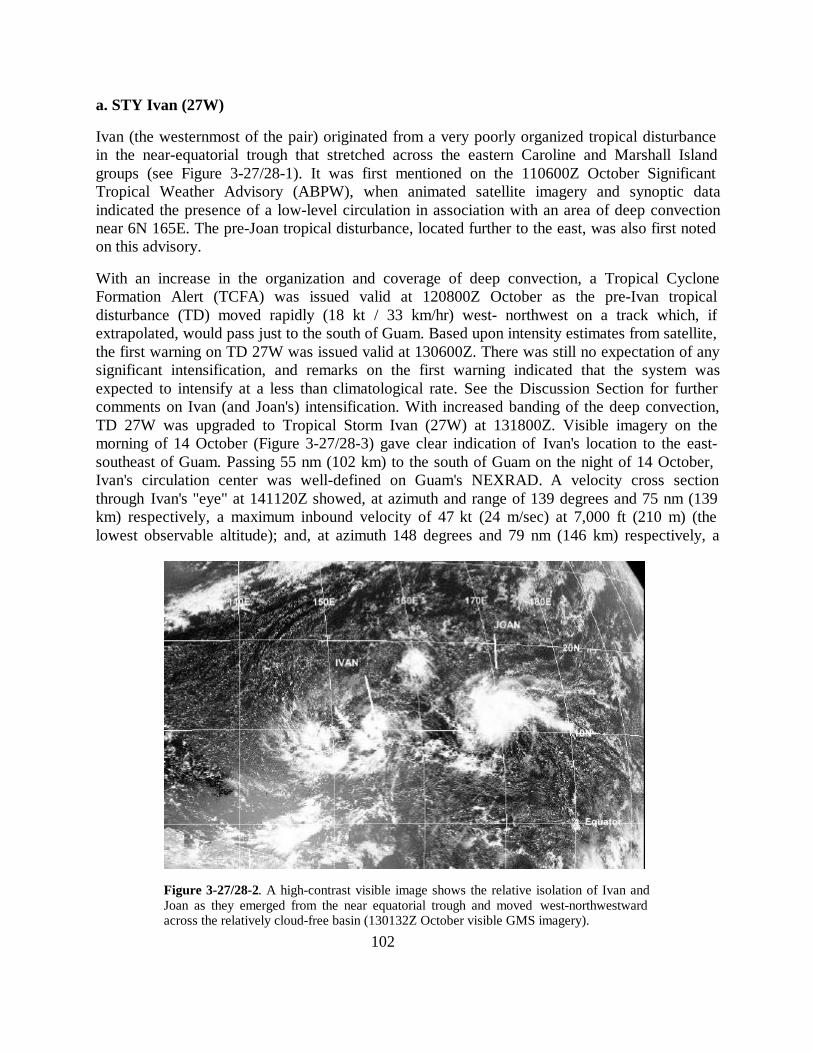
102
a. STY Ivan (27W)
Ivan (the westernmost of the pair) originated from a very poorly organized tropical disturbancein the near-equatorial trough that stretched across the eastern Caroline and Marshall Islandgroups (see Figure 3-27/28-1). It was first mentioned on the 110600Z October SignificantTropical Weather Advisory (ABPW), when animated satellite imagery and synoptic dataindicated the presence of a low-level circulation in association with an area of deep convectionnear 6N 165E. The pre-Joan tropical disturbance, located further to the east, was also first notedon this advisory.
With an increase in the organization and coverage of deep convection, a Tropical CycloneFormation Alert (TCFA) was issued valid at 120800Z October as the pre-Ivan tropicaldisturbance (TD) moved rapidly (18 kt / 33 km/hr) west- northwest on a track which, ifextrapolated, would pass just to the south of Guam. Based upon intensity estimates from satellite,the first warning on TD 27W was issued valid at 130600Z. There was still no expectation of anysignificant intensification, and remarks on the first warning indicated that the system wasexpected to intensify at a less than climatological rate. See the Discussion Section for furthercomments on Ivan (and Joan's) intensification. With increased banding of the deep convection,TD 27W was upgraded to Tropical Storm Ivan (27W) at 131800Z. Visible imagery on themorning of 14 October (Figure 3-27/28-3) gave clear indication of Ivan's location to the east-southeast of Guam. Passing 55 nm (102 km) to the south of Guam on the night of 14 October,Ivan's circulation center was well-defined on Guam's NEXRAD. A velocity cross sectionthrough Ivan's "eye" at 141120Z showed, at azimuth and range of 139 degrees and 75 nm (139km) respectively, a maximum inbound velocity of 47 kt (24 m/sec) at 7,000 ft (210 m) (thelowest observable altitude); and, at azimuth 148 degrees and 79 nm (146 km) respectively, a
Figure 3-27/28-2. A high-contrast visible image shows the relative isolation of Ivan andJoan as they emerged from the near equatorial trough and moved west-northwestwardacross the relatively cloud-free basin (130132Z October visible GMS imagery).

103
maximum outbound velocity of 42 kt (22 m/sec), also at 7,000 ft (210 m). After passing Guam,Ivan became a typhoon at 150600Z, and then began to intensify at a fast rate (1.5 T numbers perday) (Figure 3-27/28-4). During the 48-hour period from 150600Z to 170600Z Ivan intensifiedfrom 65 kt (33 m/sec) to 145 kt (75 m/sec) approximately 3 T-numbers. The peak intensity of160 kt (82 m/sec) was reached at 171800Z. On 16 October, Ivan slowed and began to tracktoward Luzon. Numerical guidance and the synoptic flow pattern suggested that the TC wouldrecurve before reaching the Philippines. The anticipated northward turn did commence on 18October, but it was too late to spare the Philippines. At approximately 191800Z October, the
center of Ivan made landfall on the extreme northeastern tip of Luzon with an intensity of 120 kt(62 m/sec). On 20 October, the typhoon moved into the Luzon Strait and recurved. Afterrecurving, it dropped below typhoon intensity on 21 October, then briefly reintensified totyphoon intensity on 22 October as it moved northeastward south of Okinawa. A steadyweakening trend then set in, and the final warning was issued, valid at 241200Z, as the systembecame extratropical.
b. Joan (28W)
Joan (the easternmost of the Ivan-Joan pair) originated from a very poorly organized tropicaldisturbance in a near-equatorial trough that stretched across the eastern Caroline and MarshallIsland groups (see Figure 3-27/28-1). The system was first mentioned on the 110600Z OctoberABPW. Animated satellite imagery and synoptic data indicated the possible presence of a low-level circulation in association with an area of deep convection at a low latitude near 4N 176E.Synoptic data indicated that equatorial westerlies were present to the south of this disturbance.The pre-Ivan tropical disturbance -- located further to the west -- was also first noted on thisadvisory. The pre-Joan tropical disturbance moved northwestward, and was north of 10N by 13
Figure 3-27/28-3 Ivan approaches Guam after becoming a tropicalstorm (132132Z October visible GMS imagery).

104
October. With an increase in the areal coverage and organization of deep convection, a TCFAwas issued valid at 130400Z October.
The system now made a turn to the left andbegan to track to the west and slowly intensify.The first warning on TD 28W was issued, valid at130600Z, based on satellite intensity estimates of25 kt (13 m/sec). The system was expected tointensify at a climatological rate. Based uponsatellite intensity estimates of 35 kt (18 m/sec),TD 28W was upgraded to Tropical Storm Joan(28W) on the warning valid at 140600Z. Thesystem now tracked just north of due west,approached the Mariana Islands, and intensified.After becoming a typhoon, between 151200Z and151800Z, Joan began to intensify very rapidly,increasing from 70 kt (36 m/sec) at 151800Z to itspeak of 160 kt (82 m/sec) 36 hours later (Figure3-27/28-5a,b). The equivalent pressure fall of 100mb over this 36-hour period, for an average of 2.8mb per hour, qualifies as a case of explosivedeepening (Dunnavan 1981). As it approached theMariana Islands, Joan made turned to thenorthwest. Weakening slightly, it passed betweenthe Islands of Saipan and Anatahan on the morning of 18 October (see the Impact Section fordetails on the effects of Joan on the Marianas). Its well-defined eye was tracked by Guam'sNEXRAD as it passed to the north. However, at a range of 155 nm (287 km) from the site, it wasbeyond Doppler radial velocity range. Joan remained at or above the super typhoon threshold(130 kt, 67 m/sec) for 4.5 days (170000Z to 211200Z) -- a record. Moving slowly, but making asharp recurve during the 48-hour period 200000Z to 220000Z , Joan weakened steadily from 140kt (72 m/sec) to 115 kt (59 m/sec). On 23 October, Joan moved eastward along 30N andcontinued to weaken. On 24 October, the system turned toward the northeast and accelerated.The final warning was issued, valid at 240000Z, when it appeared that Joan was transitioninginto an intense extratropical low. In postanalysis, Joan remained at typhoon intensity until241800Z, and its transition into an extratropical low was completed at 251800Z.
III. DISCUSSION
a. On the extreme intensities reached by Ivan and Joan
Ivan and Joan both emerged from a near equatorial trough in the Marshall Islands. As the twoTCs moved west-northwestward in tandem, they both intensified to an extreme value of 160 kt(82 m/sec) -- two of three WNP TCs to do so during 1997 (the other was STY Paka (05C)). At171200Z, Ivan was at 155 kt (80 m/sec) while Joan was still at 160 kt (82 m/sec); the first timenoted that two TCs of such extreme intensity existed simultaneously in the WNP basin (Figure 3-27/28-6a,b). On the enhanced infrared image of Figure 3-27/28-5b, Joan's cold dark-gray eye
Figure 3-27/28-4 Ivan becomes the year's eighthsuper typhoon (161913Z October enhanced IRDMSP imagery). Enhancement curve is "BD".

105
wall cloud (indicating cloud-top temperatures of -81 degrees C or colder), is off of Dvorak'sscale for subjectively determining TC intensity from infrared imagery (Dvorak 1984). TheDigital Dvorak (DD) algorithm, however, has no intrinsic upper bound (although there may beactual physical upper limits), and the DD numbers for both Ivan and Joan (Figure 3-27/28-7a,b)reached T8.0 (hypothetically equivalent to 170 kt (87 m/sec) intensity). Since 1995, the highestDD number computed for a typhoon by the DD algorithm on the satellite image processingequipment at JTWC was T8.3 for Super Typhoon Angela (29W) (1995), as it approached thePhilippines. No other TC since then has reached a DD number of 8.0 or higher. Why these twoTCs became so intense is unknown. Early in their lives, neither objective guidance nor humanforecaster anticipated the extreme intensities that Ivan and Joan would reach. The initialdisturbances from which they developed were very poorly organized and were isolated in anenvironment that was unusually free of deep convection. The monsoon trough across the WNPwas relatively weak and sea-level pressures were near or above normal. For Ivan, nearly everyintensity forecast leading up to its peak was low by as much as 40 kt (21 m/sec) for the 12-hourforecast, and 45, 50, 45, and 50 kt for the 24-, 36-, 48-, and 72-hour forecasts respectively. ForJoan, the intensity forecasts were even lower: nearly all forecasts for the entire life of the TCwere too low. Leading up to its peak, the intensity forecasts for Joan were low by as much as 30,55, 65, 65, and 65 kt for the 12-, 24-, 36-, 48-, and 72-hour forecasts respectively. Despite thepassage of these two TCs across much of the WNP basin, the monthly average wind for October(Figure 3-3) was more easterly than normal everywhere except in the low-latitudes east of 150E(an El Niño-related anomaly).
Figure 3-27/28-5 Joan reaches its peak intensity of 160 kt (82 m/sec). (a) The low sun-angle of late afternoonhelps highlight features on the tops of Joan's eye wall cloud (170632Z October visible GMS imagery). (b) Thecold dard gray ring surrounding Joan's eye-indicative of temperatures of -81C or colder-puts Joan off the scale ofDvorak's intensity estimation techniques using enhanced IR imagery (170803Z October enhanced IR DMSPimagery). Enhancement curve is "BD"
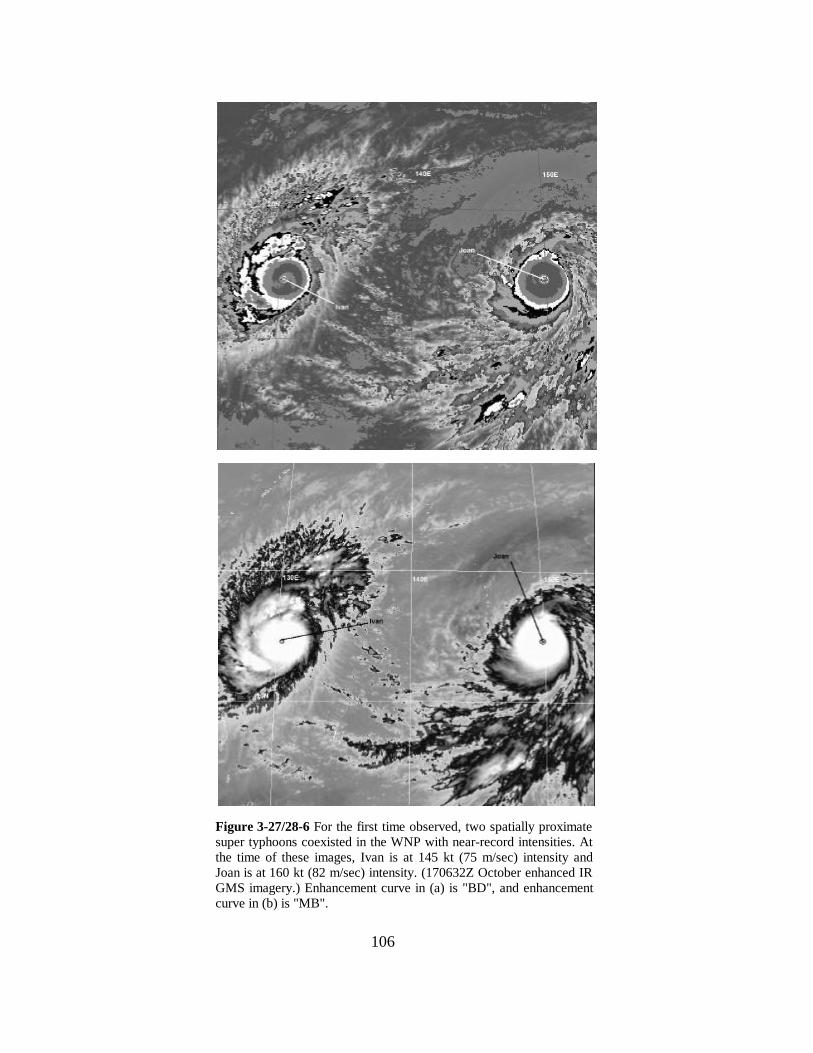
106
Figure 3-27/28-6 For the first time observed, two spatially proximatesuper typhoons coexisted in the WNP with near-record intensities. Atthe time of these images, Ivan is at 145 kt (75 m/sec) intensity andJoan is at 160 kt (82 m/sec) intensity. (170632Z October enhanced IRGMS imagery.) Enhancement curve in (a) is "BD", and enhancementcurve in (b) is "MB".

107
b. TC-TC interactions?
In the Systematic and Integrated Approach to Tropical Cyclone Forecasting (Elsberry 1994)there are three basic modes of interactions between two spatially proximate TCs: 1) direct TCinteraction (whereby each TC is advected by the flow of the other); 2) semi-direct TC interaction(whereby each TC is advected by the altered flow between the other TC and the high pressuresystem on the opposite side); and, 3) indirect TC interaction (whereby the TC to the west inducesa ridge between the two TCs which, in turn, imposes an equatorward component to the steeringflow on the eastern TC). In order to study the interaction between two TCs, it is best to produce adiagram illustrating the motion of each TC with respect to their centroid. Properties of thecentroid-relative motion help to reveal the nature of the interaction (which is not always apparentin the actual earth-relative tracks). In the case of Ivan and Joan, the centroid-relative motion(Figure 3-27/28-8) does not seem to indicate that any form of TC interaction took place.
Figure 3-27/28-7 A time series of (a) Ivan's, and (b)Joan's hourly DD numbers (small black dots) comparedwith the best-track intensity (open circles). Both Joan andIvan reached an extreme DD magnitude of 8.0(equivalent to an intensity of 170 kt (87 m/sec)). There isa slight diurnal cycle apparent in these time series with atendency for higher DD numbers just prior to sunrise(1800Z).
Figure 3-27/28-8 The centroid-relative motion ofIvan and Joan. Black dots indicate positions at0000Z at 24-hour intervals beginning on 11October and ending on 25 October. The inscribedcircle has a diameter of 600 nm (1100 km).
Although initially within the 780-nm (1446 km) threshold noted by Brand (1970) for mutualcyclonic rotation about the centroid to dominate, very little centroid-relative cyclonic orbit isnoted for the period. The common features of TC interaction noted by Lander and Holland(1993) of mutual approach followed by a period of stable cyclonic orbit are also missing. Onlythe rapid increase of separation distance as the two TCs recurved is a typical feature of binaryinteraction noted by Lander and Holland. This so-called "escape" phase indicates that the binaryinteraction has ceased. In summary, Ivan and Joan appear to have undergone no form of TCinteraction. They simply moved along similarly shaped adjacent recurving tracks and, recurving
108
at approximately the same time, the centroid relative motion became one of rapid increase inseparation distance as Joan recurved east of Ivan and accelerated faster into the midlatitudes
IV. IMPACT
Both Ivan and Joan affected the Mariana Islands. On the night of 14 October, Ivan passed 55 nm(100 km) to the south of Guam where a peak wind gust of 41 kt (21 m/sec) was recorded atAndersen Air Force Base; the heaviest 24-hr rainfall of 5.85 inches was also recorded atAndersen. Ivan also affected the Philippines. At least one person was reported drowned andanother missing on the northeastern tip of Luzon. Ivan damaged thousands of houses anddestroyed large amounts of rice and corn in this region. More than $US 500,000 worth of fishstocks in ponds and cages were also destroyed. Joan largely spared the Mariana Islands anysignificant damage when it passed between the Islands of Saipan and Anatahan on 18 October.Peak wind gusts of 85 kt (44 m/sec) were experienced on Saipan when Joan passedapproximately 45 nm (80 km) to the north. A Red Cross initial assessment indicated that Joandestroyed four houses, caused major damage to 15 other tin and wood structures and causedminor damage to 17 homes on Saipan. On Guam, winds gusted to only 33 kt (17 m/sec) at thecommercial port on the west side of the island.

Super Typhoon Ivan (27W)09 Oct to 26 Oct 1997
MIN SLP 872 mbMAX INTENSITY 160 kt

Super Typhoon Joan (28W)11 Oct to 25 Oct 1997
MIN SLP 872 mbMAX INTENSITY 160 kt

109
SUPER TYPHOON KEITH (29W)
I. HIGHLIGHTS
The tenth of eleven tropical cyclones (TCs) to attain super typhoon intensity in the western NorthPacific during 1997, Keith formed at low latitudes in the Marshall Islands. It was one of ten TCswhich formed east of 160E and south of 20N — within the "El Niño" box in Figure 3-3a. Keithwas a recurving TC which passed between the Islands of Rota and Tinian (only 50 nm (93 km)apart) on the west-bound leg of its recurving track. NEXRAD imagery from Guam indicated theeye wall cloud of Keith never touched land as it threaded the narrow channel between these twoislands. As such, the Mariana Islands were spared the full force of Keith (see the ImpactsSection). Keith's compact wind and cloud structure were revealed by Guam's NEXRAD (see theDiscussion Section). Equatorial westerly winds bounded by twin near-equatorial troughspreceded the formation of Keith and a Southern Hemisphere twin, TC 03P 98.
II. TRACK AND INTENSITY
During most of October, low-latitude, low-level, westerly windsblew along the equator fromapproximately 150E and eastwardacross the international datelineto near 170W. Twin near-equatorial troughs (one in theNorthern Hemisphere, another inthe Southern Hemisphere)bounded these westerly winds andmost of the region's deepconvection. During the first weekof October, deep convectionincreased between the twintroughs in association with anequatorial westerly wind burst;and then, during the second weekof October, it decreased as threeTCs emerged from the twin near-equatorial trough synoptic flowpattern: Ivan (27W) and Joan(28W) in the NorthernHemisphere, and a twin, Lusi(02P98), in the SouthernHemisphere.
Figure 3-29-1 A low evening sun angle brings out the relief in Keith'sclouds. From the satellite perspective, it is hard to imagine that the eyewall cloud, and the extreme winds remained over water between therelatively closely spaced islands of the Marianas (020632Z Novembervisible GMS imagery).

110
When Ivan (27W) and Joan (28W) began to recurve, deep convection once again increased in theaforementioned region, and two more TCs emerged from the twin near-equatorial trough flowpattern: Keith developed in the Marshall Islands, and a Southern Hemisphere twin, TC 03P98,moved south between Fiji and the Islands of Vanuatu. An area of deep convection located in theMarshall Islands was, for several days (beginning at 181730Z October), mentioned on theSignificant Tropical Weather Advisory (ABPW). Deep convection (in varying amounts)persisted in the Marshalls, and in postanalysis, the area of deep convection that could beunambiguously linked to the low-level circulation center which became Keith was mentioned onthe 230600Z ABPW. This area of deep convection moved slowly westward and remained poorlyorganized for three days. On 26 October, the organization of the deep convection improved.Water-vapor derived winds showed anticyclonic outflow had become more symmetrical over thesystem, and synoptic data from Kwajalein and Majuro indicated falling sea-level pressure withina persistent low-level circulation. These factors prompted JTWC to issue a Tropical CycloneFormation Alert (TCFA) at 260500Z October. During the valid period of this TCFA, the systemfailed to develop into a significant TC. Since conditions still appeared to be favorable for theformation of a significant TC, a second TCFA was issued at 270500Z. During the night of 27October, the deep convection became better organized, and based on satellite intensity estimatesof 25 kt (13 m/sec), the disturbance was upgraded to Tropical Depression (TD) 29W on thewarning valid at 271800Z. On the morning of 28 October, satellite intensity estimates increasedto 35 kt (18 m/sec) and TD 29W was upgraded to Tropical Storm Keith at 280000Z. At this time,Keith was anticipated to develop at a normal rate of one T-number per day, and move toward thewest-northwest.
For two days, beginning on 280000Z, Keith intensified slowly, increasing by only one T-number(i.e., from 35 kt (18 m/sec) at 280000Z to 55 kt (28 m/sec) at 300000Z). Then, like Ivan (27W)and Joan (28W) before it, Keith underwent a period of rapid intensification which wasunforeseen. By 310000Z, Keith had intensified to 105 kt (54 m/sec). The equivalent pressuredrop of 43 mb in 24 hours (for an average of 1.79 mb/hr) qualifies as a case of rapid deepening(Holliday and Thompson 1979). Keith continued to intensify rapidly until 011200Z Novemberwhen it reached its peak of 155 kt (80 m/sec).
When it reached its peak intensity, Keith was moving west-northwest and was just over a dayaway from passing through the Mariana Island chain. During the 6 hour period 020600Z-021200Z November, Keith passed between the Islands of Rota and Tinian. Though weakenedslightly from its peak, it was still a powerful 140 kt (72 m/sec) super typhoon (Figure 3-29-1) asit made its closest approach to these islands. Fortunately, as Guam's NEXRAD showed, the eyewall cloud of Keith remained over water, and no island experienced the full force of Keith,although some damage was reported (see the Discussion and the Impact Sections).
Keith remained at or above super typhoon intensity for three-and-one-half days (311800ZOctober to 030600Z November), dropped to 125 kt (64 m/sec) for two warning times at 031200Zand 031800Z, and became a super typhoon briefly again for two warning times at 040000Z and040600Z. Then, late on 04 November, Keith slowed, weakened, and began to recurve. For twodays (05-06 November), Keith moved slowly northeastward and continued to weaken. On 07

111
November, Keith turned more eastward, weakened further, and began its acceleration in thewesterly flow to the north of the subtropical ridge. The final warning was issued, valid at0812200Z, as Keith raced east-northeastward with a translation speed of 45 kt (23 m/sec) andbecame extratropical.
III. DISCUSSION
a. Keith's structure as revealed by Guam's NEXRAD
As Keith moved between the islands of Rota and Tinian on 02 November, it passed well withinthe range of Guam's NEXRAD. The most striking aspect of the NEXRAD data was the compactstructure of the TC core. A 5-nm-wide (9-km-wide) eye wall cloud surrounded a 20-nm-wide(37-km-wide) eye at beam altitude of approximately 7,000 ft (2134 m) (Figure 3-29-2a). Thebase velocity product (Figure 3-29-2b) showed that winds in excess of 100 kt were occurring inthe eye wall cloud. Peak NEXRAD-observed winds of 135-140 kt (69-72 m/sec) were found inthe eye wall cloud; and, as a velocity cross section (Figure 3-29-2c) revealed, these highest windspeeds were found at the lowest altitudes of the cross section.
Figure 3-29-2 (a) Keith's eye and eye wall cloud pass between the islands of Rota and Tinian (020553ZNovember NEXRAD Composite Reflectivity product). (b) A dramatic couplet of high inbound wind and highoutbound winds within Keith's eye wall cloud is revealed by the NEXRAD (020837Z November NEXRAD BaseVelocity product). Note the narrow width of the region of inbound and outbound winds of 128 kt (66 m/sec) or

112
greater. (c) Typical of the structure of warm-core vortices, the peak azimuthal flow is at the lowest levels of thevortex and decreases with height (020837Z November NEXRAD velocity cross section in an east-west slicethrough Keith's eye).
Figure 3-29-3 (a) The path of Keith's eye through the Marianas as depicted by Guam's NEXRAD. The typhoonsymbols indicate the position of Keith at 020600Z and 021200Z November. The path of the 5-nm-wide (9-km-wide) eye wall cloud is indicated by the hatched swaths. (b) The wind distribution of Keith as it passed throughthe Marianas based upon the NEXRAD Base Velocity product, and from synoptic data from Guam and Saipan.Winds of 100 kt (51 m/sec) or greater occurred in Keith's eye wall cloud. An asymmetry in the wind field hasbeen introduced by considering Keith's 15-kt (28-km/hr) speed of translation.
The NEXRAD data showed that the eye-wall cloud of Keith did not touch any land as it passedbetween islands only 50 nm (93 km) apart (Figure 3-29-3a). Also, the base velocitymeasurements (coupled with synoptic reports from the islands) indicated that sustained winds inexcess of 100 kt (51 m/sec) most likely did not occur on any of the islands (Figure 3-29-3b), butpassed between them in the same 30-nm-wide (56-km-wide) swath as traversed by the eye wallcloud. The super typhoon pictured in Figure 3-29-1 passed through the Marianas and left theislands relatively untouched. On a clear day, free of salt haze, each of the Mariana Islands can beviewed from the shores of its immediate neighbors. It is hard to imagine, viewing the neighborislands from the shore, that the eye, eye wall cloud, and the destructive winds of a super typhooncan all fit over the waters of the channel and largely spare the islands. In Paka's (05C) summary,this is borne out even more dramatically. As Paka passed over the northern half of the island ofGuam, wind gusts of approximately 150 kt (77 m/sec) and major damage to vegetation andstructures were experienced on the parts of the island where the eye wall cloud passed, while

113
only 10 nm (20 km) to the south, outside of the eye wall cloud, gusts reached only to minimaltyphoon intensity and little damage to structures or vegetation was noted.
b. Keith's Digital Dvorak (DD) time series
Keith was one of several typhoons during 1997 for which a time series of its hourly DD-numbers(Figure 3-29-4) was calculated. Keith's DD-numbers are unusually well-behaved. During thetwo-day period 010000Z-030000Z November, the DD-numbers fluctuated only a few tenthsabove and below T 7.0. The eye was obscured by cirrus on 03 November (possibly as amanifestation of an eyewall replacement cycle), but then reappeared and became well-defined on04 November as Keith neared its point of recurvature. Keith's DD time series shows little or nodiurnal variation, which for some typhoons is quite prominent. Why some typhoons show astrong diurnal signal in the DD-numbers and why others do not is an unsolved mystery.
c. Asymmetries in pressure fluctuations on microbarographic recordings
In the microbarograph trace of the pressure recorded at JTWC as Keith passed to the north of thestation (Figure 3-29-5), an asymmetry is observed in the small fluctuations of pressure which aresuperimposed on the general longer period trends: the fall of pressure as the typhoon approachesis smoother than the rise of pressure after the TC is moving away from the station. This feature ispresented here, because it also occurs in pressure traces from two different locations recorded asSuper Typhoon Paka (05C) passed over Guam. While only a curiosity with perhaps a simpleexplanation, its repeated occurrence in two different typhoons, and at two separate locationsduring the same typhoon, raises the level of interest.
IV. IMPACT
Despite its track between the islands, Keith caused damage on Rota, Tinian, and Saipan in theMarianas. Red Cross officials reported that at least 790 houses were destroyed or damaged onthese islands. About 15 power poles were reported downed on Saipan, and 20 on Tinian. Windgusts of 95 kt (49 m/sec) were reported at Saipan's International Airport. Sea-level pressures fellto 964 mb on Rota and to 977 mb on Saipan. On Guam, little damage occurred, but power wasknocked out to the entire island for nearly a day. Wind gusts reached 67 kt (35 m/sec) and nearly6 inches of rain fell on parts of the island. Very large surf from the east deposited rubble on thecoastal road on the southeast side of the island, forcing officials to close the road.

114
Figure 3-29-4 A time series of Keith's hourly DD numbers (small black dots) compared with the best-track intensity(open circles).
Figure 3-29-5 Microbarograph trace of the station pressure (in millibars) at the JTWC as Keith passed to the northof the island. At the 600-ft (183-m) elevation of the station approximately 18.5 mb must be added to obtain anestimate of the SLP. Note the smooth fall of pressure followed by and increase in small fluctuations as the pressurebegins to rise.

Super Typhoon Keith (29W)22 Oct to 10 Nov 1997
MIN SLP 878 mbMAX INTENSITY 155 kt

115
TYPHOON LINDA (30W)
The tropical disturbance that would become Typhoon Linda (30W) formed within an area ofconvection east of the Philippine Islands near 10N 130E on 26 October. The disturbance wasmentioned in the Significant Tropical Weather Advisory (ABPW) as it tracked westward overthe next several days under the subtropical ridge to the north. Convection began to increase overthe disturbance as it entered the Sulu Sea on 30 October. At 0730Z on the 31st, a TropicalCyclone Formation Alert (TCFA) was issued as deep convection continued to organize about thedisturbance’s center. The first warning on Tropical Depression (TD) 30W was issuedapproximately 12 hours later.
The newly formed tropical cyclonereached tropical storm intensitywithin 24 hours as it tracked overthe South China Sea. At this point,Tropical Storm Linda (30W)accelerated westward toward thesouthern tip of Vietnam. It trackedover the Vietnamese province of CaMau at 0900Z on 02 Novemberwith an intensity of 55 kt (28m/sec).
Linda reached typhoon intensityshortly after entering the Gulf ofThailand. The cyclone turnednorthwestward following steeringfrom the subtropical ridge. Thesystem weakened slightly to 55 kt(28 m/sec) prior to striking theMalay Peninsula at 1600Z on 03November. Crossing the MalayPeninsula, Linda further weakenedas it encountered the region’s 3000ft (914 m) to 5000 ft (1524 m)mountains. However, once over the warm waters of the Andaman Sea, the system began toreconsolidate. This was the first tropical cyclone since Typhoon Forrest (30W) in 1992 to crossfrom the Western North Pacific to the North Indian Ocean.
Soon after moving into the Andaman Sea, a weakness in the subtropical ridge began to developto the north, causing Linda’s forward speed to slow. Over open water once again, Lindareintensified and became a typhoon once again at 0000Z on the 6th. This was short-lived,however, as interaction with a mid-latitude trough began to introduce vertical wind shear. Lindastalled in the Bay of Bengal within an area of weak steering located between the subtropical
Figure 3-30-1 Typhoon Linda (30W) re-intensifying over theAndaman Sea after crossing the Malay Peninsula (051025ZNovember visible GMS imagery).

116
ridge axis at 500 mb and sub-tropical ridge axis at 200 mb. Upper level vertical wind shearcontinued across the system center, allowing slow weakening of the system for several days. By10 November, Linda had dissipated.
Linda produced considerable damage and loss of life in Vietnam and Thailand. Vietnam’s CaMau province, located to the northern side of Linda’s passage, reported significant damage.Newspaper reports as late as 08 November indicated that at least 330 people were killed inVietnam and Thailand with approximately 2250 people still missing. Many of the missing wereVietnamese fisherman or sailors caught at sea in the path of the tropical cyclone.

Typhoon Linda (30W)25 Oct to 09 Nov 1997
MIN SLP 976 mbMAX INTENSITY 65 kt

117
TYPHOON MORT (31W)
I. HIGHLIGHTS
Typhoon Mort (31W) was the last tropicalcyclone to form west of the internationaldateline (IDL) for the western North Pacificseason. It tracked over the open waters ofthe Philippine Sea but vertical shearweakened it to a tropical depression by thetime it made landfall over the island ofLuzon.
II. TRACK AND INTENSITY
The disturbance that would becomeTyphoon Mort (31W) was first noted on theSignificant Tropical Weather Advisory(ABPW) as an area of convection south ofGuam on 08 November at 0600Z. Theconvection was located within a weakmonsoon trough that stretched from thesouthern Philippine Sea to just south ofGuam. An area of divergence overlaid thedisturbance, which was located equatorwardof mid-level ridging. By 09 November, the disturbance had become better organized withsatellite imagery indicating a developing banding feature. Animation of satellite imagery alsoindicated some cyclonic motion within the convection. As development continued to progress, aTropical Cyclone Formation Alert (TCFA) was issued at 1900Z on 09 November. Thedisturbance was upgraded to tropical depression (TD) status with a 101800Z warning. Figure 3-31-1 shows the TD just four and a half hours after this warning, and is an example of how atypical 25 - 30 kt (13 - 15 m/sec) system appears in visible satellite imagery.
The system tracked in a westerly direction at speeds of 7 to 9 kt (13 to 17-km/hr) due to easterlysteering flow in the lower to mid-levels south of the subtropical ridge. This motion wouldcontinue for the remainder of the tropical cyclone's lifecycle. Figure 3-31-2 indicates theprogression in development as seen by visible satellite imagery during a 66- hour periodbeginning at 0425Z on 11 November. The image at top left is Mort near the time it was upgradedto a tropical storm. Eighteen hours later (top right image), Mort is a strong tropical storm withwinds estimated to be 55 kt (28m/sec). The system has a cold dense overcast over the center,with a good banding feature. Twenty-four hours later (bottom left image), the overall convectivecloud structure is becoming disorganized, probably due to increased vertical wind shear relativeto the moving system. At this time, Mort was at its peak intensity of 65 kt (33 m/sec), and woulddevelop no further. Between 0600Z and 2100Z on the 13th, vertical wind shear caused the low-
Figure 3-31-1 Visible satellite imagery of TD 31W; validtime is 102225Z November

118
level circulation to separate from the deep convection. The convection was sheared off to theeast-southeast of the low-level circulation, which continued to track westward toward thePhilippine Islands. The low-level circulation, and the associated convection can be seen in theimage at bottom right. Due to the presence of an exposed low level circulation, the system wasdowngraded to tropical storm intensity (35 kt/ 18 m/sec) on the 14th at 0000Z. However, verticalwind shear lessened over the next day and a convective banding feature soon re-developed. Thiswas only short-lived as vertical wind shear once again increased late on the 15th, eventuallycausing convection to shear to the south of the center. Mort proceeded to weaken to TD strengthby 0600Z on the 16th and shortly thereafter made landfall on the island of Luzon. The systemsubsequently dissipated over the mountains within the island's interior.
III. DISCUSION
Unexpected Vertical Wind Shear
The shearing of Mort's convection on the 14th was unexpected and surprised JTWC forecasters.Strong vertical wind shear was not indicated by NOGAPS prognostic charts. Although animatedsatellite imagery indicated the system's development had arrested on the 13th, it didn't appear toindicate the presence of strong vertical wind shear. Some calculations were made using upper-level water vapor wind derived data (supplied by the University of Wisconsin) and the storm'smotion. The upper-level wind data was used to find an average wind vector across the systemcenter, and the storm's motion vector was used as a proxy for the lower-level wind vector. Thedifference between the two vectors gave the shear across the system center. Values werecalculated for the 13th and 14th at 0000Z. The shear vector value more than doubled over the 24-hour period, changing from a west-southwest direction at 12 kt (22 km/hr), to west-southwest at26 kt (48 km/hr). In a statistical study, Zehr (1992) found a shear value of 20 kt generally inhibitstropical cyclone development. This illustrates one of the ways in which water vapor windderived wind data can help forecasters in evaluating tropical cyclones.
IV. IMPACT:
No reports of damage or injuries associated with Typhoon Mort (31W) were received by JTWC.

119
Figure 3-31-2 The different developmental stages of Typhoon Mort as seen by visible satelliteimagery over a 66-hour period. Tropical cyclone best track intensities and valid times of imagery are:top left, 35 kt (18 m/sec) at 110425Z; top right, 55 kt (28 m/sec) at 112225Z; bottom left, 65 kt (33m/sec) at 122225Z; bottom right, 35 kt (18 m/sec) at 132225Z. Note the exposed low level circulationcenter northwest of the convection at 132225Z.

Typhoon Mort (31W)07 Nov to 16 Nov 1997
MIN SLP 976 mbMAX INTENSITY 65 kt

120
SUPER TYPHOON PAKA (05C)
I. HIGHLIGHTS
Paka formed in the Central Pacific southwest of Hawaii on 28 November 1997. Paka trackedsteadily westward for two and one half weeks before slamming into the islands of Guam andRota. As Paka's eye passed over northern Guam, destructive winds caused extensive damage toprivate and commercial buildings, infrastructure, crops, and vegetation. More intense thanTyphoons Pamela (May 1976) and Omar (August 1992), Paka, with estimated maximumsustained surface winds of 130 kt (67 m/sec) gusting to 160 kt (82 m/sec) approached, but didnot exceed, the intensity of Karen (estimated 135 kt (69 m/sec) gusting to 165 kt (85 m/sec)) inNovember 1962. No life was lost as a direct result of Paka's passage. Preliminary estimates oftotal losses run in the hundreds of millions of dollars.
II. TRACK AND INTENSITY
During the last week of Novemberconvection associated with an equatorialwesterly wind burst flared up 1080 nm(2000 km) southwest of Hawaii. This ledto the formation of twin tropical cyclones -Paka (05C), in the Northern Hemisphere,and Pam (07P) in the Southern. Pam (07P),in the summer hemisphere, became ahurricane and began recurvingsoutheastward (Figure 3-05C-1). Afterissuing the first 17 advisories on Paka, theCentral Pacific Hurricane Centertransferred warning responsibility to theJoint Typhoon Warning Center as thesystem approached the internationaldateline (IDL). The first JTWC warningwas number 18, valid at 1800Z on 06December. After reaching 60 kt (31 m/sec)on 08 December, Paka began to weakenagain. JTWC forecasters believed thisweakening trend would continue, because upper level analysis and prognostic charts indicatedthat the cyclone would remain in a region of significant vertical shear. At 1800Z on 09December, JTWC analyzed the cyclone as a 45 kt (23 m/sec) system and forecast this to remainconstant for 36 hours, followed by a weakening trend. However, by 0600Z on 10 December, thisthinking had begun to change, as upper level analysis showed that vertical shear was lessening.JTWC now depicted a 55 kt (28 m/sec) system which would peak as a minimal strength typhoonwithin 24 hours. Eighteen hours later, it became apparent that Paka was continuing to develop,and the 00Z warning on 11 December predicted it would peak at over 100 kt (50 m/sec). Majuro
Figure 3-05C-1 Paka (05C) and Southern Hemisphere twinPam (07P) early on 6 December, 1997
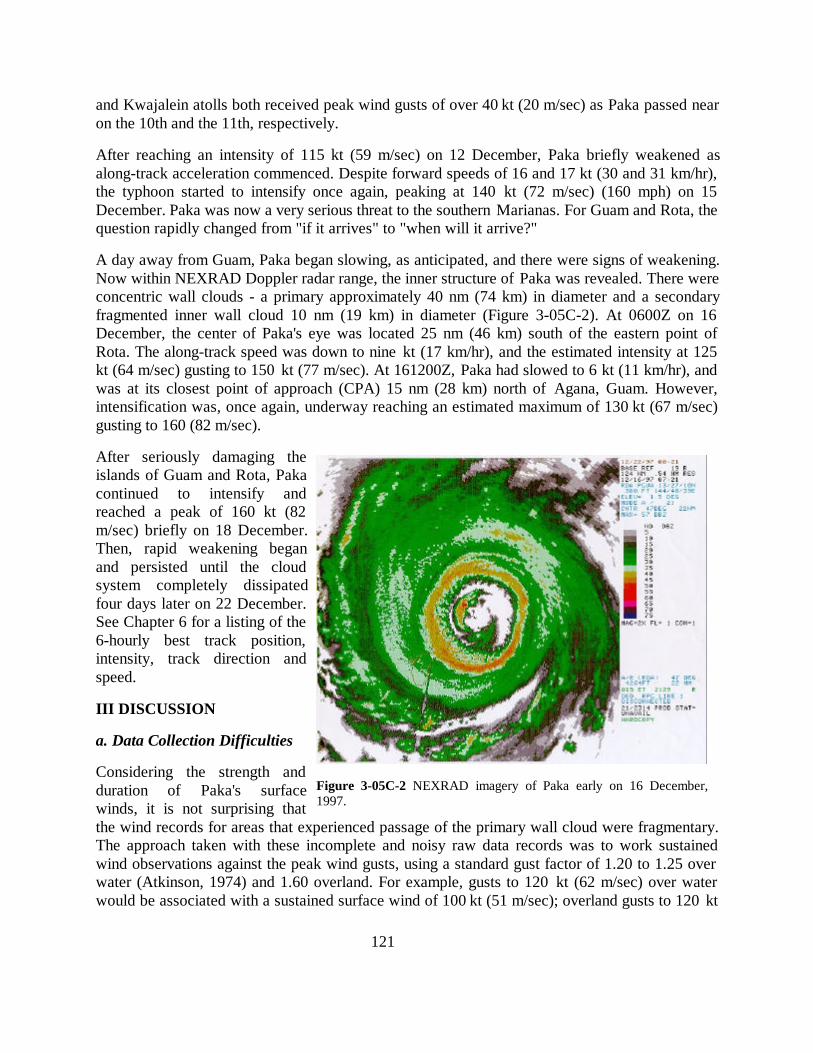
121
and Kwajalein atolls both received peak wind gusts of over 40 kt (20 m/sec) as Paka passed nearon the 10th and the 11th, respectively.
After reaching an intensity of 115 kt (59 m/sec) on 12 December, Paka briefly weakened asalong-track acceleration commenced. Despite forward speeds of 16 and 17 kt (30 and 31 km/hr),the typhoon started to intensify once again, peaking at 140 kt (72 m/sec) (160 mph) on 15December. Paka was now a very serious threat to the southern Marianas. For Guam and Rota, thequestion rapidly changed from "if it arrives" to "when will it arrive?"
A day away from Guam, Paka began slowing, as anticipated, and there were signs of weakening.Now within NEXRAD Doppler radar range, the inner structure of Paka was revealed. There wereconcentric wall clouds - a primary approximately 40 nm (74 km) in diameter and a secondaryfragmented inner wall cloud 10 nm (19 km) in diameter (Figure 3-05C-2). At 0600Z on 16December, the center of Paka's eye was located 25 nm (46 km) south of the eastern point ofRota. The along-track speed was down to nine kt (17 km/hr), and the estimated intensity at 125kt (64 m/sec) gusting to 150 kt (77 m/sec). At 161200Z, Paka had slowed to 6 kt (11 km/hr), andwas at its closest point of approach (CPA) 15 nm (28 km) north of Agana, Guam. However,intensification was, once again, underway reaching an estimated maximum of 130 kt (67 m/sec)gusting to 160 (82 m/sec).
After seriously damaging theislands of Guam and Rota, Pakacontinued to intensify andreached a peak of 160 kt (82m/sec) briefly on 18 December.Then, rapid weakening beganand persisted until the cloudsystem completely dissipatedfour days later on 22 December.See Chapter 6 for a listing of the6-hourly best track position,intensity, track direction andspeed.
III DISCUSSION
a. Data Collection Difficulties
Considering the strength andduration of Paka's surfacewinds, it is not surprising thatthe wind records for areas that experienced passage of the primary wall cloud were fragmentary.The approach taken with these incomplete and noisy raw data records was to work sustainedwind observations against the peak wind gusts, using a standard gust factor of 1.20 to 1.25 overwater (Atkinson, 1974) and 1.60 overland. For example, gusts to 120 kt (62 m/sec) over waterwould be associated with a sustained surface wind of 100 kt (51 m/sec); overland gusts to 120 kt
Figure 3-05C-2 NEXRAD imagery of Paka early on 16 December,1997.

122
(62 m/sec) would relate to 75 kt (39 m/sec) sustained wind. This technique identifies therepresentative data, for example: Commercial Port NWS HANDAR at Apra Harbor reportedsustained/peak gust of 100/149 kt (51/77 m/sec) which is plausible; the Andersen AFBanemometer recorded 96/205 kt (49/105 m/sec) which is not considered representative. TheCommercial Port sensor failed after recording four hours of 135 to 149 kt (69 to 77 m/sec) gustsin the wall cloud, Andersen AFB sensor lost power during passage of the western wall cloud.Additionally, the NWS sensor at Tiyan lost power during the onset of the primary wall cloud, theNPMOCW/JTWC anemometer at Nimitz Hill failed at 103 kt (53 m/sec) before the wall cloudarrived, the wind bird at the Apra Harbor tide guage failed in the wall cloud, and the NWSHANDAR at the University of Guam, Mangilao weathered the storm to report a peak gust to 123kt (63 m/sec). In the final analysis the HANDAR instrument at Apra Harbor becomes thebenchmark. It faithfully recorded peak gusts up to 149 kt (77 m/sec) until the winds beganbacking to the southwest, at which point it failed. This implies that the later southwesterly flowor second wind was stronger than the initial northwest to west wind (or first wind). This is borneout by the reports from other records at the Rota HANDAR and airport, DanDan and Merizo(Figure 3-05C-3). The only complete wind trace that records the peak winds in the wall cloudand the relative calm within the eye was from the Kuentos Communications, Inc. in Maite(Figure 3-05C-4). Relative to the lowest pressure which occurred at the CPA of Paka, thestrength and duration of the highest winds on either side were compared. The wind from thesouthwest after the eye passage was more intense and of a longer duration. If this increase of 10kt (5 m/sec) at Maite is applied to the Apra Harbor benchmark, a peak gust of 160 kt (82 m/sec)can be inferred.
b. Pressure Assessment
Microbarographs fortunately are less exposed than wind sensors which accounts for theirsurvival, hence the pressure records were complete for Guam. The minimum sea-level pressure(MSLP) values (see Figure 3-05C-3) dropped from a high at DanDan (983 mb) and Merizo (980mb) to Mangilao (953 mb), Apra Harbor (953 mb) and Tiyan (951 mb) to the lowest at AndersenAFB of 948 mb (Figure 3-05C-5). Using the MSLPs, which occurred at CPA, the passage of thecenter of Paka to the north of Guam can be followed across the checkerboard (Figure 3-05C-3).In addition, there is an empirical relationship (Dvorak, 1984) that can be used to relate theintensity (maximum sustained 1-minute mean surface winds over water) with the MSLP. Therelationship has two scales: one for the Pacific and one for the Atlantic (Figure 3-05C-6). Thereason for this is that the ambient pressure for the Pacific is in the mean lower than the AtlanticOcean. Applying Dvorak's scale to Paka's 130 kt (67 m/sec) estimated intensity yields a 914 mbMSLP on the Pacific scale, which is much too low in relation to the values observed on Guam.However, a value for the Atlantic is 935 mb which is closer to what was observed. In summary,the basic reason for the difference between Pacific and Atlantic scales is that most tropicalcyclones in the western North Pacific occur during the summer monsoon season when theambient pressures are lower because of the presence of the monsoon trough. The Pacific scaledoesn't address seasonal differences, therefore a bias exists. If a tropical cyclone, such as Paka,occurs in the winter, it follows that the scale will yield too low a MSLP. Therefore, a MSLP of935 mb for Paka's 130-kt intensity appears reasonable.
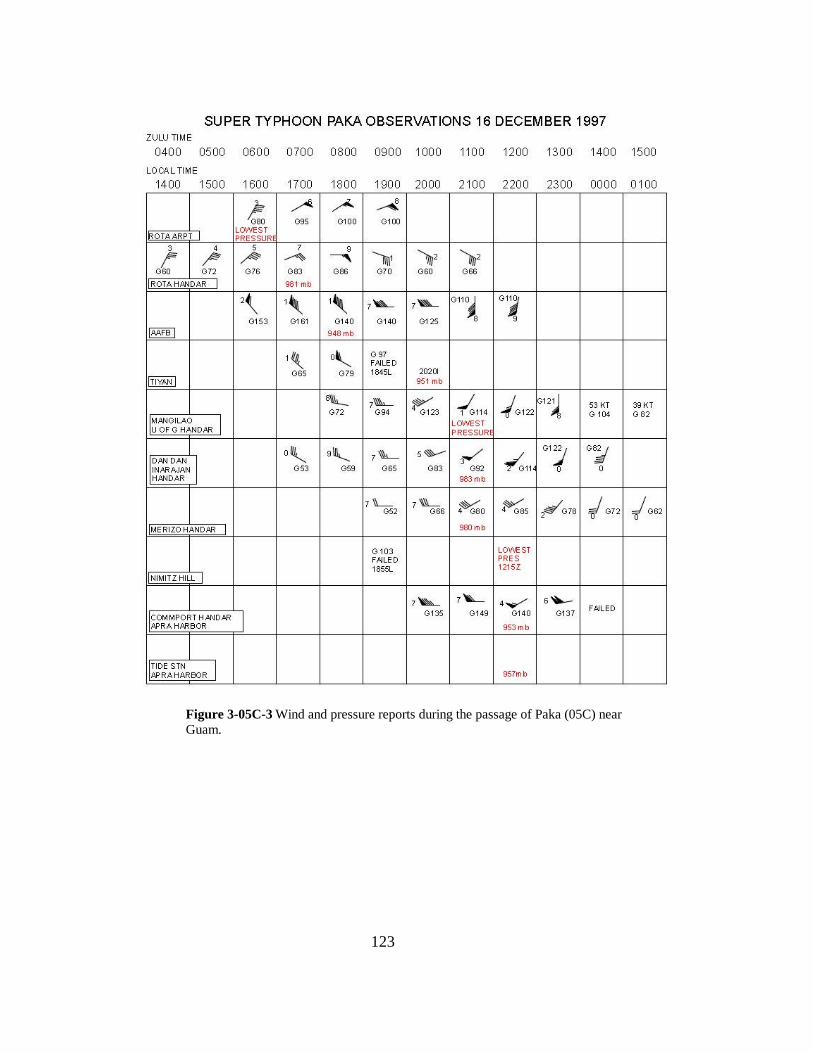
123
Figure 3-05C-3 Wind and pressure reports during the passage of Paka (05C) nearGuam.

124
c. Radar Assessment
1) The NEXRAD Dopplerradar, which is located atMangilao and is maintainedby Andersen AFB proved tobe an invaluable tool forlocating the center of Paka'seye and observing itsconvective structure. Thelast reflectivity product(Figure 3-05C-2) shows PatiPoint, at the extremenortheastern end of Guam,just entering the relativelyconvection-free portion ofthe eye. The fragmentedinner wall cloud is locatedover the Rota Channel to thenortheast. The comparison radial velocity product (Figure 3-05C-7) indicates 144 kt (75m/sec) inbound at the radar at 2000 feet (610 m) and 124 kt (64 m/sec) outbound. The 1-hourprecipitation product (Figure 3-05C-8) indicates 1.50 to 2.00 inches (3.8 to 5 cm) in the wallcloud. Note: the absence of return over Rota to the northeast of the radar is due to lowestelevation beams being blocked by Mount Barrigada. No products were received after thesebecause the NEXRAD radar went into standby mode and could not be remotely reset fromthe Unit Control Position at Andersen AFB. (The radar site weathered the storm withoutmajor damage.)
2) The conventional FAA (Center-Radar Approach Control) CERAP radar located at MountSanta Rosa proved invaluable for fixing Paka after the NEXRAD went into standby mode at160721Z December. This support continued until the FAA radar failed at 161119Z.
IV IMPACT
Based on aerial and surface surveys, the following can be stated:
1) On Guam, as indicated by vegetation and crop blow downs and debris trails, the first wind(northwest through west) was less damaging than the second from the southwest through south .On Rota, the first wind (northeast through east) was less severe than the later second from thesoutheast. These observations support the fact that Paka was becoming more intense as it passedwestward through the Rota Channel.
2) Moderate damage with pockets of heavy damage to private and commercial structuresoccurred on the northern half of Guam, which experienced outer wall cloud passage (Figure 3-05C-9). The slow passage (six hours) of the outer wall cloud across the center portion of theisland allowed more time for high winds and rain to weaken structures.
Figure 3-05C-4 This wind instrument, owned by KuentosCommunications, Inc, was the only one on Guam to recort theentire system passage.

125
3) In general, concrete roofs survived in areas where all structures with corrugated sheet ironlost their roofs. Steel framed buildings withstood the winds’ onslaught and, although manylost sheet iron paneling and roofs, the structural integrity was maintained.
4) Minor distortion occurred to two smaller fuel storage tanks at Commercial Port, and onelarge, empty storage tank lost its fixed roof and collapsed. Damage to the powerinfrastructure was similar to that caused by Typhoon Omar in 1992.
5) Steel reinforced hollow concrete power poles failed under wind loading when they were notguyed, planted in shallow holes, or set in concrete without guys. These poles when guyedwere observed to also fail when adjacent poles snapped, bringing the whole series downtogether.
In general, the damage assessment of northern Guam indicated a mixture of tropical cyclonescale categories 3 and 4 (Saffir-Simpson Hurricane Scale as modified by Guard and Lander,1995) depending upon the exposure sites. This provides a wide range of maximum sustainedwind speeds from 96-115 kt (49-59 m/sec) for category 3 to 116-135 kt (59-69 m/sec) forcategory 4.
Considering the magnitude and size of the debris trails, and the private structure and powerinfrastructure failures which occurred, it is indeed a tribute to preparation and common sensedisplayed by the combined population (160,000) of Guam and Rota that not a single life was lostas a direct result of Paka's passage.
Figure 3-05C-5 Andersen AFB micro-barograph trace of Paka's (05C) passage.

126
Figure 3-05C-6 Wind, pressure, and Dvorak relationship for both the Atlantic and Pacific.
Figure 3-05C-7 NEXRAD radial velocity product for0721Z on 16 December 97.
Figure 3-05C-8 NEXRAD one hour precipitationproduct for 0721Z on 16 December 97.

127
Figure 3-05C-9 Paka's (05C) track across Guam.

Super Typhoon Paka (05C)28 Nov to 22 Dec 1997
MIN SLP 901 mbMAX INTENSITY 160 kt

128
TROPICAL CYCLONE 01B
Tropical Cyclone (TC) 01B emergedfrom a poorly organized area ofconvection embedded within the near-equatorial trough. It was first noted on theSignificant Tropical Weather Advisory(ABIO) bulletin for the Indian Oceanvalid 13 May. The system slowlydeveloped as it drifted in a generallynorthward direction within the Bay ofBengal. The first warning was issued at1800Z on 14 May based on a satellitederived intensity estimate of 25 kt (13m/sec) and indications that the systemwas developing. The presence ofequatorial westerlies and good upper leveloutflow meant that the cyclone shouldcontinue to intensify. Intensity estimatesranging from 35 to 40 kt (18-21 m/sec)were received less than six hours later.Beginning at 1200Z on the 15th, TC 01Bslowed and veered toward the east,remaining at a constant intensity of 50 kt(26 m/sec) for approximately 24 hours.Afterwards the cyclone picked up speedand again tracked generally northwardwhile further intensifying. By 0000Z on the 17th, TC 01B had reached 65 kt (33 m/sec). By1800Z on the 18th the system developed an eye. Twelve hours later it peaked at 115 kt (59m/sec). This intensity was maintained until landfall occurred in Bangladesh shortly after 1200Zon 19 May. Once over land, the system continued its north-northeastward track, increased itsspeed significantly north of the subtropical ridge axis, and dissipated due to land interaction as itneared China. TC 01B caused significant damage and several hundred casualties in Bangladesh.
Figure 3-01B-1 Visible imagery of TC 01B from 180034ZMay.

Tropical Cyclone 01B13 May to 20 May 1997
MIN SLP 927 mbMAX INTENSITY 115 kt.
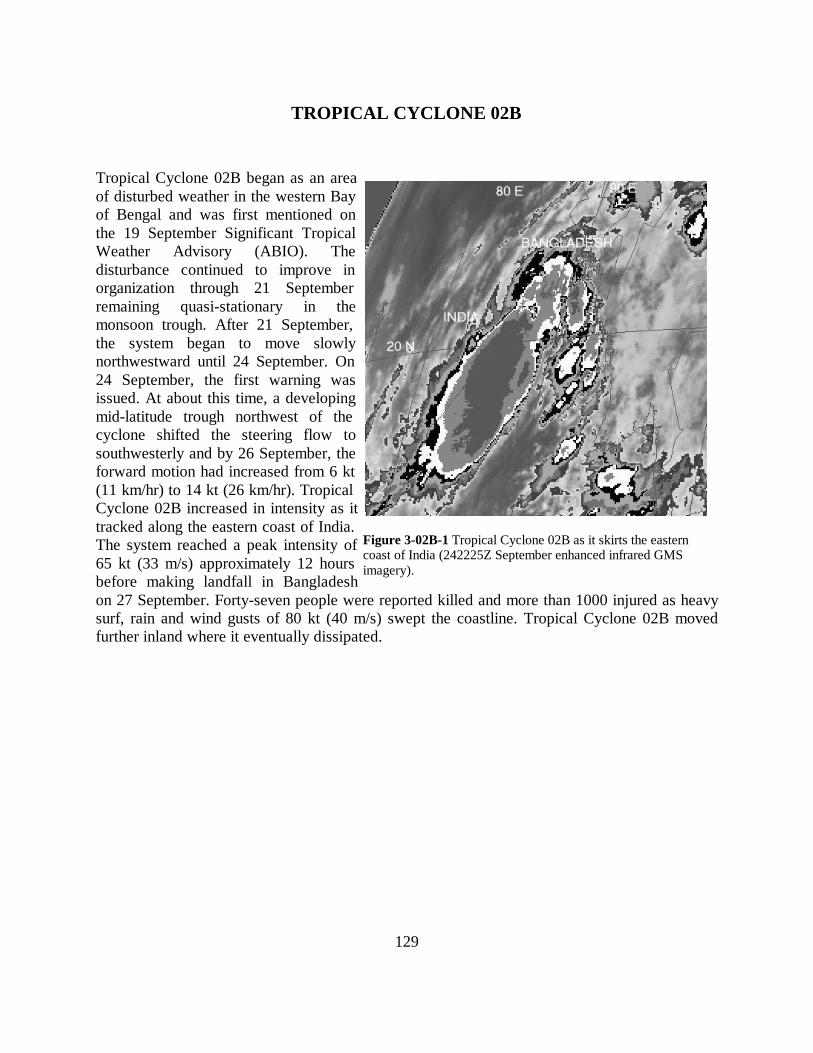
129
TROPICAL CYCLONE 02B
Tropical Cyclone 02B began as an areaof disturbed weather in the western Bayof Bengal and was first mentioned onthe 19 September Significant TropicalWeather Advisory (ABIO). Thedisturbance continued to improve inorganization through 21 Septemberremaining quasi-stationary in themonsoon trough. After 21 September,the system began to move slowlynorthwestward until 24 September. On24 September, the first warning wasissued. At about this time, a developingmid-latitude trough northwest of thecyclone shifted the steering flow tosouthwesterly and by 26 September, theforward motion had increased from 6 kt(11 km/hr) to 14 kt (26 km/hr). TropicalCyclone 02B increased in intensity as ittracked along the eastern coast of India.The system reached a peak intensity of65 kt (33 m/s) approximately 12 hoursbefore making landfall in Bangladeshon 27 September. Forty-seven people were reported killed and more than 1000 injured as heavysurf, rain and wind gusts of 80 kt (40 m/s) swept the coastline. Tropical Cyclone 02B movedfurther inland where it eventually dissipated.
Figure 3-02B-1 Tropical Cyclone 02B as it skirts the easterncoast of India (242225Z September enhanced infrared GMSimagery).

Tropical Cyclone 02B20 Sep to 27 Sep 1997
MIN SLP 976 mbMAX INTENSITY 65 kt.

130
TROPICAL CYCLONE 03A
The disturbance which became TropicalCyclone (TC) 03A was first noted on the07 November Significant TropicalWeather Advisory (ABIO) at 9N 54E. Itwas embedded within a widespread areaof convection associated with broadtroughing. The first warning was issuedat 0600Z on 08 November. The systeminitially tracked northwestward at 6 kt(11 km/hr) towards the coast of Somaliawith an intensity of 35 kt (18 m/sec), Itmaintained a 35 kt (18 m/sec) intensityover the next 18 hours despite thepresence of moderate vertical wind shearas it approached the coast. By 0000Z on09 November, TC 03A had made landfallover the northeast tip of Somalia. The partially exposed low-level center dissipated completelyover land within the next 06 to 18 hours. No reports of damage were received by JTWC.
Figure 3-3A-1 TC 03A after reaching landfall (080830ZNovember visible Meteosat imagery).

Tropical Cyclone 03A04 Nov to 10 Nov 1997
MIN SLP 997 mbMAX INTENSITY 35 kt

131
TROPICAL CYCLONE 04A
Tropical Cyclone 04A started as adisturbance over Sri Lanka. It was firstmentioned on the Indian OceanSignificant Tropical Weather Advisory(ABIO) at 1800Z on 6 November.Near 1200Z on the 7th, the circulationbegan moving to the north and then tothe west over the lower tip of India. ATropical Cyclone Formation Alert(TCFA) was issued at 1900Z on 9November. The first warning wasissued valid at 0000Z on 10November. At 110600Z TC 04Areached its peak intensity of 55 kt (28m/sec) while moving northwestward.It held this intensity for just over 24hours, then began weakening under vertical wind shear. The remaining low-level circulationweakened, lost latitude, and dissipated over water. JTWC issued its final warning at 0000Z onthe 14th. No reports of damage were received at JTWC.
Figure 3-04A-1 Infrared imagery from 101200Z.

Tropical Cyclone (04A)02 Nov to 14 Nov 1997
MIN SLP 984 mbMAX INTENSITY 55 kt

132
4. SUMMARY OF SOUTH PACIFIC AND SOUTH INDIAN OCEAN TROPICAL CYCLONES
4.1 GENERAL
On 1 October 1980, JTWC's areaof responsibility (AOR) was expanded toinclude the Southern Hemisphere from180° longitude, westward to the coast ofAfrica. Details on Southern Hemispheretropical cyclones and JTWC warningsfrom July 1980 through June 1982 arecontained in Diercks et al. (1982), andfrom July 1982 through June 1984 inWirfel and Sandgathe (1986).Information on Southern Hemispheretropical cyclones after June 1984 can befound in the applicable Annual TropicalCyclone Report.
The NAVPACMETOCCEN,Pearl Harbor, Hawaii issues warnings ontropical cyclones in the South Pacific,which are east of 180° longitude. Inaccordance with CINCPACINST3140.1W, Southern Hemisphere tropicalcyclones are numbered sequentially from1 July through 30 June. This conventionis established to encompass the SouthernHemisphere tropical cyclone season,which primarily occurs from Januarythrough April. There are two SouthernHemisphere ocean basins for warningpurposes - the South Indian Ocean (westof 135° East longitude) and the SouthPacific (east of 135° East longitude) -which are identified by appending thesuffixes "S" and "P," respectively, to thetropical cyclone number.
Intensity estimates for SouthernHemisphere tropical cyclones arederived from the interpretation ofsatellite imagery using the Dvorak(1984) technique and, when available,from surface observations and radardata. The Dvorak technique relatesspecific cloud signatures to maximum
sustained one-minute average surfacewind speeds. The conversion frommaximum sustained winds to minimumsea-level pressure is obtained fromAtkinson and Holliday (1977) (Table 4-1).
4.2 SOUTH PACIFIC AND SOUTHINDIAN OCEAN TROPICALCYCLONES
The total number of significanttropical cyclones during the 1997 season(1 July 1996 - 30 June 1997; Table 4-2)was 38 which was approximately, morethan the overall climatological mean forthe previous 16 years as shown in Table4-3. Looking at the annual variation ofSouthern Hemisphere Tropical Cyclonesby ocean basins (Table 4-4), it becomesapparent that tropical cyclone activitywas enhanced in the southern IndianOcean and Australian regions, andremained slightly reduced in the SouthPacific.
The JTWC warned on SouthernHemisphere tropical cyclones for 266days of the 1997 season. This equates toroughly to 3 out of every 4 days of the1997 Southern Hemisphere seasonhaving a tropical cyclone in activewarning status. During 63 of the 266days there were two or more SouthernHemisphere tropical cyclones in warningstatus at the same time.
A chronology of 1997 SouthernHemisphere tropical activity is providedin Figure 4-1. Composites of thetropical cyclone best tracks for theSouthern Indian Ocean, the AustralianRegion, and the South Pacific Ocean,appear in Figures 4-2, 4-3, 4-4, 4-5, and4-6 respectively.

133
Table 4-1 MAXIMUM SUSTAINED 1-MINUTE MEAN SURFACE WINDS AND EQUIVALENT MINIMUM SEA-LEVEL PRESSURE RELATIONSHIP (ATKINSON AND HOLLIDAY, 1977)
WIND-KT (M/SEC) PRESSURE (MB)30 o(15) ............100035 o(18) ............o99740 o(21) ............ 99445 o(23) ............o99150 o(26) ............o98755 o(28) ............o98460 o(31) ............o98065 o(33) ............o97670 o(36) ............o97275 o(39) ............o96780 o(41) ............p96385 o(44) ............o95890 o(46) ............o95495 o(49) ............o948100 o(51) ............o943105 o(54) ............o938110 o(57) ............o933115 o(59) ............o927120 o(62) ............ 922125 o(64) ............o916130 o(67) .............910135 o(69) ............o906140 o(72) ............o898145 o(75) .............892150 o(77) ............o885155 o(80) ............o879160 o(82) ............ 872165 o(85) ............ 965170 o(87) ............ 858175 o(90) ............o851180 o(93) ............o844

134
TABLE 4-2 SOUTHERN HEMISPHERE TROPICAL CYCLONES FOR 1997 (01 JULY 1996 - 30 JUNE 1997)
TROPICAL CYCLONE PERIOD OF WARNING
NUMBERS OFWARNINGSISSUED
ESTIMATED MAXIMUMINTENSITY
KT (M/SEC)ESTIMATEDMSLP (MB)
01S LINDSAY 10 JUL - 11 JUL 2 35 (18) 99702S - 17 AUG - 20 AUG 7 45 (23) 99103S - 07 SEP - 09 SEP 9 40 (21) 99404S ANTOINETTE 17 OCT - 21 OCT 10 65 (33) 97605S MELANIE/BELLAMINE 29 OCT - 11 NOV 27 125 (64) 91606P CYRIL 23 NOV - 26 NOV 7 50 (26) 98707S CHANTELLE 24 NOV - 29 NOV 16 65 (33) 97608S DANIELLA 02 DEC - 10 DEC 17 120 (62) 92209S ELVINA 09 DEC - 14 DEC 12 55 (28) 98410P NICHOLAS 13 DEC - 15 DEC 5 45 (23) 99111S OPHELIA 14 DEC - 20 DEC 16 55 (28) 98412P PHIL* 23 DEC-02 JAN/09-12 JAN 36 85 (44) 95813P FERGUS 24 DEC - 30 DEC 14 90 (46) 95414S FABRIOLA 02 JAN - 08 JAN 13 60 (31) 98015S RACHEL 02 JAN - 08 JAN 16 80 (41) 96316P DRENA 03 JAN - 10 JAN 16 120 (62) 92217P EVAN♦ 10 JAN - 16 JAN 0 (13) 70 (36) 97218S - 11 JAN - 13 JAN 6 45 (23) 99119S PANCO-HELINDA 19 JAN - 06 FEB 36 125 (64) 91620S GRETELLE 20 JAN - 31 JAN 26 115 (59) 92721S ILETTA 23 JAN - 28 JAN 11 75 (39) 96822P FREDA* 26-30 JAN/31-02 FEB 18 65 (33) 97623S JOSIE 08 FEB - 16 FEB 17 90 (46) 95424P GILLIAN 10 FEB - 12 FEB 11 45 (23) 99125S KARLETTE 16 FEB - 26 FEB 21 65 (33) 97626P HAROLD 16 FEB - 21 FEB 15 55 (38) 98427S - 19 FEB - 25 FEB 21 45 (23) 99128P ITA♦ 24 FEB - 24 FEB 0 (3) 35 (18) 99729P - 26 FEB - 27 FEB 3 45 (23) 99130S LIZETTE 27 FEB - 02 MAR 8 75 (39) 96831P GAVIN 03 MAR - 12 MAR 23 115 (59) 92732P JUSTIN 06 MAR - 25 MAR 77 90 (46) 95433P HINA 13 MAR - 18 MAR 12 75 (39) 96834P IAN♦ 17 APR - 19 APR 0 (7) 55 (28) 98435P JUNE 02 MAY - 05 MAY 12 65 (33) 97636S RHONDA 10 MAY - 16 MAY 16 100 (51) 94437P - 28 MAY - 30 MAY 5 35 (18) 99738P KELI 10 JUN - 15 JUN 5 (6) 115 (59) 927
JTWC TOTAL 566♦ NPMOC TOTAL (29)GRAND TOTAL 595
* REGENERATED♦ WARNINGS ISSUED BY NPMOC

135
Table 4-3 MONTHLY DISTRIBUTION OF SOUTH PACIFIC AND SOUTH INDIAN OCEAN TROPICAL CYCLONES
YEAR JUL AUG SEP OCT NOV DEC JAN FEB MAR APR MAY JUN TOTAL
(1958-1977)
AVERAGE * - - - 0.4 1.5 3.6 6.1 5.8 4.7 2.1 0.5 - 24.7
1981 0 0 0 1 3 2 6 5 3 3 1 0 24
1982 1 0 0 1 1 3 9 4 2 3 1 0 25
1983 1 0 0 1 1 3 5 6 3 5 0 0 25
1984 1 0 0 1 2 5 5 10 4 2 0 0 30
1985 0 0 0 0 1 7 9 9 6 3 0 0 35
1986 0 0 1 0 1 1 9 9 6 4 2 0 33
1987 0 1 0 0 1 3 6 8 3 4 1 1 28
1988 0 0 0 0 2 3 5 5 3 1 2 0 21
1989 0 0 0 0 2 1 5 8 6 4 2 0 28
1990 2 0 1 1 2 2 4 4 10 2 1 0 29
1991 0 0 1 1 1 3 2 5 5 2 1 1 22
1992 0 0 1 1 2 5 4 11 3 2 1 0 30
1993 0 0 1 1 0 5 7 7 2 2 2 0 27
1994 0 0 0 0 2 4 8 4 9 3 0 0 30
1995 0 0 0 0 2 2 5 4 5 4 0 0 22
1996 0 0 0 0 1 3 7 6 6 4 1 0 28
1997 1 1 1 2 2 6 9 8 3 1 3 1 38
TOTAL 6 2 6 10 26 58 105 113 79 49 18 3 475
AVERAGE 0.4 0.1 0.4 0.6 1.5 3.4 6.2 6.6 4.6 2.9 1.1 0.2 28
(1981-1997)
* (Gray, 1978)

136
Table 4-4 ANNUAL VARIATION OF SOUTHERN HEMISPHERE TROPICAL CYCLONES BY OCEAN BASINS
YEAR SOUTH INDIAN AUSTRALIAN SOUTH PACIFIC(1958-1977) (WEST OF 105°E) (105°E - 165°E) (EAST OF 165°E) TOTALAVERAGE* 8.4 10.3 5.9 24.6
1981 13 o8 o3 241982 12 11 o2 251983 7 o6 12 251984 14 14 o2 301985 14 15 o6 351986 14 16 o3 331987 9 o8 11 281988 14 o2 o5 211989 12 o9 o7 281990 18 o8 o3 291991 11 10 o1 221992 11 o6 13 301993 10 16 o1 271994 16 10 o4 301995 11 o7 o4 221996 13 11 o4 281997 17 5 16 38
TOTAL 216 162 97 475
AVERAGE 12.7 9.5 5.7 27.9(1981-1996)
* (Gray,1978)

137
Figure 4-1 Chronology of South Pacific and Indian Ocean tropical cyclones for 1997 (01 July 1996 - 30 June 1997)

138
Figure 4-2 Tropical Cyclone best tracks for the South Indian Ocean

139
Figure 4-3 Tropical Cyclone best tracks for the South Indian Ocean

140
Figure 4-4 Tropical Cyclone best tracks for the Australian Region

141
Figure 4-5 Tropical Cyclone best tracks for the South Pacific Ocean

142
Figure 4-6 Tropical Cyclone best tracks for the South Pacific Ocean

143
5. SUMMARY OR FORECAST VERIFICATION
5.1 ANNUAL FORECASTVERIFICATION
Verification of warning positions andintensities at initial, 12-, 24-, 48- and 72-hour forecast periods was made against thefinal best track. The (scalar) track forecast,along-track and cross-track errors(illustrated in Figure 5-1) were calculatedfor each verifying JTWC forecast. Thesedata, in addition to a detailed summary foreach tropical cyclone, are included asChapter 6. This section summarizesverification data for 1997 and contrasts itwith annual verification statistics fromprevious years.
Figure 5-1 Definition of cross-track error (XTE),along-track error (ATE) and forecast track error(FTE). In this example, the forecast position isahead of and to the right of the verifying best trackposition. Therefore, the XTE is positive (to theright of the best track) and the ATE is positive(ahead or faster than the best track). Adapted fromTsui and Miller, 1988.
5.1.1 NORTHWEST PACIFIC OCEANThe frequency distributions of errors forinitial warning positions and 12-, 24-, 36-,48- and 72-hour forecasts are presented inFigures 5-2a through 5-2f. Table 5-1includes mean track, along-track and cross-track errors for 1983-1997. Figure 5-3shows mean track errors and a 5-yearrunning mean of track errors at 24-, 48- and72-hours for the past 20 years. Table 5-2lists annual mean track errors from 1959,when the JTWC was founded, until thepresent.
5.1.2 NORTH INDIAN OCEAN Thefrequency distributions of errors for warningpositions and 12-, 24-, 36-, 48- and 72-hourforecasts are presented in Figures 5-4athrough 5-4f, respectively. Table 5-3includes mean track, along-track and cross-track errors for 1983-1997. Figure 5-5shows mean track errors and a 5-yearrunning mean of track errors at 24-, 48- and72-hours for the past 20 years.
5.1.3 SOUTH PACIFIC AND SOUTHINDIAN OCEANS The frequencydistributions of errors for warning positionsand 12-, 24-, 36-, 48- and 72-hour forecastsare presented in Figures 5-6a through 5-6f,respectively. Table 5-4 includes mean track,along-track and cross-track errors for 1983-1997. Figure 5-7 shows mean track errorsand a 5-year running mean of track errors at24-, 48- and 72-hours for the 17 years thatthe JTWC has issued warnings in the region.
5.2 COMPARISON OF OBJECTIVETECHNIQUES
JTWC uses a variety of objectivetechniques for guidance in the warningpreparation process. Multiple techniques arerequired, because each technique has

144
particular strengths and weaknesses whichvary by basin, numerical modelinitialization, time of year, synoptic situationand forecast period. The accuracy ofobjective aid forecasts depends on both thespecified position and the past motion of thetropical cyclone as determined by theworking best track. JTWC initializes itsobjective techniques using an extrapolatedworking best track position so that theoutput of the techniques will start at thevalid time of the next warning initialposition. Unless stated otherwise, all of theobjective techniques discussed below run inall basins covered by JTWC’s AOR andprovide forecast positions at 12-, 24-, 36-,48-, and 72-hours unless the techniqueaborts prematurely during computations.The techniques can be divided into sixgeneral categories: extrapolation,climatology and analogs, statistical,dynamic, hybrids, and empirical oranalytical.
5.2.1 EXTRAPOLATION (XTRP) Pastspeed and direction are computed using therhumb line distance between the current and12 hour old positions of the tropical cyclone.Extrapolation from the current warningposition is used to compute forecastpositions.5.2.2 CLIMATOLOGY and ANALOGS
5.2.2.1 CLIMATOLOGY (CLIM)Employs time and location windows relativeto the current position of the tropicalcyclone to determine which historical stormswill be used to compute the forecast. Thehistorical database is 1945-1981 for theNorthwest Pacific, and 1900 to 1990 for therest of JTWC’s AOR. Objective intensityforecasts are available from these databases.Scatter diagrams of expected tropical
cyclone motion at bifurcation points are alsoavailable from these databases.5.2.2.2 ANALOG A revised TyphoonAnalog 1993 (TYAN93) picks the topmatches with the basin climatology ofhistorical tropical cyclone best tracks.Matches are based upon the differencesbetween the direction and speed of thesuperimposed historical best track positionsand the past direction and speed of thecyclone. Specifically, the directions andspeeds are calculated from the 12-hour oldposition to the current "fix" position and the24-hr old position to the "fix" position.Separate comparisons are made forclimatology cyclone tracks classified as"straight," " recurver" and "other". There isalso a "total" group, that includes the topmatches without regard to classification oftracks.
TYAN93 works in the same mannerfor all basins. The time-window is +/- 35days from the "fix." The space-window is+/- 2.5 degrees latitude and +/- 5 degreeslongitude from the "fix" position on the firstpass of each forecast. The maximum-wind-speed window is as follows (for basins withclimatology wind speeds): a. If "fix" windspeed is < 25 kt, (13 m/s) climatologycyclone wind speed must be < 30 kt. (15m/s) b. If "fix" wind speed is 30 kt, (15 m/s)climatology cyclone wind speed must be inrange from 25 to 35 kt. (13 to 17 m/s) c. If"fix" wind speed is > 35 kt (17 m/s),climatology cyclone wind speed must be atleast 35 kt. (17 m/s). Matching is basedupon weighted direction and speed errors.Forecasting is based upon "straight" and"recurver" type climatology tropicalcyclones, where the 12-hour and 24-hourbest "straight" (" recurver") matches arecombined into one set of best matches for"straight" (" recurver").

145
Figure 5-2a Frequency distribution of initial warningposition errors (10-nm increments) for western NorthPacific Ocean tropical cyclones in 1997. The largesterror, 168 nm, occurred on Super Typhoon Keith(29W).
Figure 5-2b Frequency distribution of 12-hour trackforecast errors (15-nm increments) for western NorthPacific Ocean tropical cyclones in 1997. The largesterror, 334 nm, occurred on Super Typhoon Keith(29W).
Figure 5-2c Frequency distribution of 24-hour trackforecast errors for western North Pacific Ocean tropicalcyclones in 1997. The largest error, 499 nm, occurredon Tropical Storm Levi (05W).
Figure 5-2d Frequency distribution of 36-hour trackforecast errors for western North Pacific Ocean tropicalcyclones in 1997. The largest error, 706 nm, occurredon Typhoon Linda (30W).
Figure 5-2e Frequency distribution of 48-hour trackerrors for western North Pacific Ocean tropicalcyclones in 1997. The largest error, 891 nm, occurredon Tropical Storm Levi (05W).
Figure 5-2f Frequency distribution of 72-hour trackforecast errors for western North Pacific Ocean tropicalcyclones in 1997. The largest error, 1382 nm, occurredon Super Typhoon Oliwa (02C).

146
5.2.3 STATISTICAL
5.2.3.1 CLIMATOLOGY ANDPERSISTENCE (CLIPER or CLIP) Astatistical regression technique that is basedon climatology, current position and 12-hourand 24-hour past movement. This techniqueis used as a crude baseline against which tomeasure the forecast skill of other, moresophisticated techniques. CLIP in thewestern North Pacific uses third-orderregression equations, and is based on thework of Xu and Neumann (1985). CLIPERhas been available outside this basin sincemid-1990, with regression coefficientsrecently recomputed by FNMOC based onthe updated 1900-1989 database.
5.2.3.2 COLORADO STATEUNIVERSITY MODEL (CSUM) Astatistical-dynamical technique based on thework of Matsumoto (1984). Predictorparameters include the current and 24-hr oldposition of the storm, heights from thecurrent and 24-hr old NOGAPS 500-mbanalyses, and heights from the 24-hr and 48-hr NOGAPS 500-mb prognoses. Heightvalues from 200-mb fields are substitutedfor storms that have an intensity exceeding90 kt (45 m/s) and are located north of thesubtropical ridge. Three distinct sets ofregression equations are used depending onwhether the storm’s direction of motion fallsinto “below,” “on” or “above” thesubtropical ridge categories. During thedevelopment of the regression equationcoefficients for CSUM, the so-called“perfect prog” approach was used, in whichverifying analyses were substituted for thenumerical prognoses that are used whenCSUM is run operationally. Thus, CSUMwas not “tuned” to any particular version ofNOGAPS, and in fact, the performance ofCSUM should presumably improve as newversions of NOGAPS improve. CSUM runs
only in the western North Pacific, SouthChina Sea, and North Indian Ocean basins.
5.2.3.3 JTWC92 or JT92 JTWC92 is astatistical-dynamical model for the westernNorth Pacific Ocean basin which forecaststropical cyclone positions at 12-hourintervals to 72 hours. The model uses thedeep-layer mean height field derived fromthe NOGAPS forecast fields. These deep-layer mean height fields are spectrallytruncated to wave numbers 0 through 18prior to use in JTWC92. Separate forecastsare made for each position. That is, theforecast 24-hour position is not a 12-hourforecast from the forecasted 12-hourposition.
JTWC92 uses five internal sub-models which are blended and iterated toproduce the final forecasts. The first sub-model is a statistical blend of climatologyand persistence, known as CLIPER. Thesecond sub-model is an analysis modepredictor, which only uses the “analysis”field. The third sub-model is the forecastmode predictor, which uses only the forecastfields. The fourth sub-model is acombination of 1 and 2 to produce a “firstguess” of the 12-hourly forecast positions.The fifth sub-model uses the output of the“first guess” combined with 1, 2, and 3 toproduce the forecasts. The iteration isaccomplished by using the output of sub-model 5 as though it were the output fromsub-model 4. The optimum number ofiterations has been determined to be three.
When JTWC92 is used in theoperational mode, all the NOGAPS fieldsare forecast fields. The 00Z and 12Z tropicalforecasts are based upon the previous 12-hour old synoptic time NOGAPS forecasts.The 06Z and 18Z tropical forecasts arebased on the previous 00Z and 12ZNOGAPS forecasts, respectively. Therefore,operationally, the second sub-model uses
147
forecast fields and not analysis fields.
5.2.4 DYNAMIC
5.2.4.1 NOGAPS VORTEX TRACKINGROUTINE (NGPS/X) Tropical cyclonevortices are tracked at FNMOC byconverting the 1000-mb u and v windcomponent fields into isogons. Theintersection of isogons are either the centerof a cyclonic or anticyclonic circulation, or acol. The tracking program starts at the lastknown location of the cyclone - a warningposition. Based on this position and the lastknown speed and direction of movement,the program hunts for the next cycloniccenter representing the tropical cyclone.Confidence factors are generated within theprogram and are modified, as required, by aquality control program that formats the datafor transmission.
5.2.4.2 GEOPHYSICAL FLUIDDYNAMICS MODEL - NAVY (GFDN)This model uses a triple nested movablemesh with 18 sigma levels. The outer meshdomain covers a 75°x75° area with ahorizontal resolution of 1° and is fixed forthe duration of the model run based on theinitial location and movement of the tropicalcyclone (TC). The 10°x10° middle and a5°x5° inner (resolution 1/6°) nested meshesmove with the cyclone. Based on the globalanalysis and an initialization message, theTC is removed from the global analysis, andreplaced by a synthetic vortex which has anasymmetric (beta-advection) componentadded. Boundary conditions are updatedperiodically from forecast fields generatedby a global forecast model. In addition tostandard output fields, the model outputs TCtrack forecasts and maximum isotach swathsindicating the location of maximum winds inrelation to the TC track.
5.2.4.3 ONE-WAY (INTERACTIVE)TROPICAL CYCLONE MODEL(OTCM) This technique is a coarseresolution (205-km grid), three layer,primitive equation model with a horizontaldomain of 6400 x 4700 km. OTCM isinitialized using 6-hour or 12-hourprognostic fields from the latest NOGAPSrun, and the initial fields are smoothed andadjusted in the vicinity of the storm toinduce a persistence bias into OTCM’sforecast. A symmetric bogus vortex is theninserted, and the boundaries updated every12 hours by NOGAPS fields as theintegration proceeds. The bogus vortex ismaintained against frictional dissipation byan analytical heating function. The forecastpositions are based on the movement of thevortex in the lowest layer of the model(effectively 850-mb).
5.2.4.4 FNMOC BETA ANDADVECTION MODEL (FBAM) Thismodel is an adaptation of the Beta andAdvection model used by the NationalCenter for Environmental Prediction(NCEP). The forecast motion results from acalculation of environmental steering and anempirical correction for the observed vectordifference between that steering and the 12-hour old storm motion. The steering iscomputed from the NOGAPS Deep LayerMean (DLM) wind fields which are aweighted average of the wind fieldscomputed for the 1000-mb to 100-mb levels.The difference between past storm motionand the DLM steering is treated as if thestorm were a Rossby wave with an“effective radius” propagating in response tothe horizontal gradient of the coriolisparameter, beta. The forecast proceeds inone-hour steps, recomputing the effectiveradius as beta changes with storm latitude,and blending in a persistence bias for thefirst 12 hours.

148
5.2.5 HYBRIDS
5.2.5.1 HALF PERSISTENCE ANDCLIM-ATOLOGY (HPAC) Forecastpositions generated by equally weighting theforecasts given by XTRP and CLIM.
5.2.5.2 BLENDED (BLND) A simpleaverage of JTWC's six primary forecastaids: OTCM, CSUM, FBAM, JT92, CLIP,and HPAC.
5.2.5.3 WEIGHTED (WGTD) Aweighted average of the forecast guidanceused to compute BLND: OTCM (29%),CSUM (22%), FBAM (14%), JT92 (14%),HPAC (14%), and CLIP (7%).
5.2.5.4 DYNAMIC AVERAGE (DAVE)A simple average of all dynamic forecastaids: NOGAPS (NGPS), Bracknell (EGRR),Japanese Typhoon Model (JTYM), JT92,FBAM, OTCM, and CSUM.
5.2.6 EMPIRICAL OR ANALYTICAL
5.2.6.1 DVORAK An estimation of atropical cyclone’s current and 24-hourforecast intensity is made from theinterpretation of satellite imagery ( Dvorak,1984). These intensity estimates are usedwith other intensity related data and trendsto forecast short-term tropical cycloneintensity.
5.2.6.2 MARTIN/HOLLAND Thetechnique adapts an earlier work (Holland,1980) and specifically addresses the need forrealistic 35-, 50- and 100-kt (18-, 26- and51-m/sec) wind radii around tropicalcyclones. It solves equations for basicgradient wind relations within the tropicalcyclone area, using input parametersobtained from enhanced infrared satelliteimagery. The diagnosis also includes an
asymmetric area of winds caused by tropicalcyclone movement. Satellite-derived sizeand intensity parameters are also used todiagnose internal steering components oftropical cyclone motion known collectivelyas “beta-drift.”
5.2.6.3 TYPHOON ACCELERATIONPREDICTION TECHNIQUE (TAPT) —This technique (Weir, 1982) utilizes upper-tropospheric and surface wind fields toestimate acceleration associated with thetropical cyclone’s interaction with the mid-latitude westerlies. It includes guidelines forthe duration of acceleration, upper limits andprobable path of the cyclone.
5.3 TESTING AND RESULTS
A comparison of selected techniquesis included in Table 5-5 for all westernNorth Pacific tropical cyclones, Table 5-6for all North Indian Ocean tropical cyclonesand Table 5-7 for the Southern Hemisphere.For example, in Table 5-5 for the 12-hourmean forecast error, 734 cases available fora homogeneous comparison, the averageforecast error at 12 hours was 72 nm (133km) for NGPS and 53 nm (98 km) forJTWC. The difference of 19 nm (35 km) isshown in the lower right. Differences arenot always exact, due to computationalround-off which occurs for each of the casesavailable for comparison.

149
Table 5-1 INITIAL POSITION AND FORECAST ERRORS (NM) FOR THE WESTERN NORTH PACIFICFOR 1983-1997
Initial Position 24-Hour 48-Hour 72-Hour
Num Error Num Track Along Cross Num Track Along Cross Num Track Along Cross
1983 445 16 342 117 76 73 253 260 169 164 184 407 259 2631984 611 22 492 117 84 64 378 232 163 131 286 363 238 2161985 592 18 477 117 80 68 336 231 153 138 241 367 230 2271986 743 21 645 126 85 70 535 261 183 151 412 394 276 2271987 657 18 563 107 71 64 465 204 134 127 389 303 198 1861988 465 23 373 114 85 58 262 216 170 103 183 315 244 1591989 710 20 625 120 83 69 481 231 162 127 363 350 265 1771990 794 21 658 103 72 60 525 203 148 110 432 310 225 1681991 835 22 733 96 69 53 599 185 137 97 484 287 229 1461992 941 25 841 107 77 59 687 205 143 116 568 305 210 1721993 853 26 725 112 79 63 570 212 151 117 437 321 226 1731994 1058 24 938 105 76 56 776 186 131 105 631 258 176 1521995 599 29 539 123 89 67 421 215 159 117 319 325 240 1671996 922 25 880 105 76 56 711 178 134 89 607 272 203 1371997 910 20 865 93 76 55 752 164 134 87 642 245 202 120 15-Year Average1983-1997 742 22 646 111 79 62 517 212 151 119 412 321 228 179

150
Figure 5-3 Mean track forecast error (nm) and 5-year running mean for a) 24 hours b) 48 hours and c) 72 hoursfor the western North Pacific Ocean tropical cyclones for the period 1975 to 1997.

151
Table 5-2 MEAN FORECAST TRACK ERRORS (NM) FOR WESTERN NORTH PACIFIC TROPICALCYCLONES FOR 1959-1997
24-HOUR 48-HOUR 72-HOUR
YEAR TY (1) TCCROSSTRACK(2)
ALONGTRACK(2)
TY (1) TCCROSSTRACK(2)
ALONGTRACK(2)
TY (1) TCCROSSTRACK(2)
ALONGTRACK (2)
1959 117* 267*1960 177* 354*1961 136 2741962 144 287 4761963 127 246 3741964 133 284 4291965 151 303 4181966 136 280 4321967 125 276 4141968 105 229 3371969 111 237 3491970 98 104 181 190 272 2791971 99 111 64 203 212 118 308 317 1771972 116 117 72 245 245 146 382 381 2101973 102 108 74 193 197 134 245 253 1621974 114 120 78 218 226 157 357 348 2451975 129 138 84 279 288 181 442 450 2901976 117 117 71 232 230 132 336 338 2021977 140 148 83 266 283 157 390 407 2281978 120 127 71 87 241 271 151 194 459 410 218 2961979 113 124 76 81 219 226 138 146 319 316 182 2141980 116 126 76 86 221 243 147 165 362 389 230 2661981 117 124 77 80 215 221 131 146 342 334 219 2061982 114 113 70 74 229 238 142 162 337 342 211 2231983 110 117 73 76 247 260 164 169 384 407 263 2591984 110 117 64 84 228 232 131 163 361 363 216 2381985 112 117 68 80 228 231 138 153 355 367 227 2301986 117 126 70 85 261 261 151 183 403 394 227 2761987 101 107 64 71 211 204 127 134 318 303 186 1981988 107 114 58 85 222 216 103 170 327 315 159 2441989 107 120 69 83 214 231 127 162 325 350 177 2651990 98 103 60 72 191 203 110 148 299 310 168 2251991 93 96 53 69 187 185 97 137 298 287 146 2291992 97 107 59 77 194 205 116 143 295 305 172 2101993 102 112 63 79 205 212 117 151 320 321 173 2261994** 96 105 56 76 172 186 105 131 244 258 152 1761995 105 123 67 89 200 215 117 159 311 325 167 2401996 85 105 56 76 157 178 89 134 252 272 137 2031997 86 93 55 76 159 164 87 134 251 245 120 202
1. Forecasts were verified for typhoons when intensities were at least 35kt (18 m/sec).
2. Cross-track and along-track errors were adopted by the JTWC in 1986. Right angle errors (used prior to1986) were recomputed as cross-track errors after-the fact to extend the data base. See Figure 5-1 for thedefinitions of cross-track and along-track.
*Forecast positions north of 35 degrees north latitude were not verified.
**Statistics were recalculated to resolve earlier ALONG- and CROSS-Track discrepancies.
152
Figure 5-4a Frequency distribution of initial warningposition errors (10-nm increments) for North IndianOcean tropical cyclones in 1997. The largest error, 87nm, occurred on Tropical Cyclone 02B.
Figure 5-4b Frequency distribution of 12-hour trackforecast errors (15-nm increments) for North IndianOcean tropical cyclones in 1997. The largest error, 232nm, occurred on Tropical Cyclone 01B.
Figure 5-4c Frequency distribution of 24-hour trackforecast errors for North Indian Ocean tropical cyclonesin 1997. The largest error, 316 nm, occurred onTropical Cyclone 01B.
Figure 5-4d Frequency distribution of 36-hour trackforecast errors for North Indian Ocean tropical cyclonesin 1997. The largest error, 406 nm, occurred onTropical Cyclone 02B.
Figure 5-4e Frequency distribution of 48-hour trackerrors for North Indian Ocean tropical cyclones in 1997.The largest error, 541 nm, occurred on TyphoonCyclone 02B.
Figure 5-4f Frequency distribution of 72-hour trackforecast errors for North Indian Ocean tropical cyclonesin 1997. The largest error, 545 nm, occurred onTropical Cyclone 02B.

153
Table 5-3 INITIAL POSITION AND FORECAST POSITION ERRORS (NM) FOR THE NORTHINDIAN OCEAN FOR
1983 - 1997
Initial Position 24-Hour 48-Hour 72-Hour
Num Error Num Track Along Cross Num Track Along Cross Num Track Along Cross1983 18 38 7 117 90 50 18 153 137 53 0 1984 67 33 42 154 124 67 20 274 217 139 16 338 339 1211985 53 31 30 122 102 53 8 242 119 194 0 1986 28 52 16 134 118 53 7 168 131 80 5 269 189 1801987 83 42 54 144 97 100 25 205 125 140 21 305 219 1881988 44 34 30 120 89 63 18 219 112 176 12 409 227 3031989 44 19 33 88 62 50 17 146 94 86 12 216 164 1111990 46 31 36 101 85 43 24 146 117 67 17 185 130 1041991 56 38 43 129 107 54 27 235 200 89 14 450 356 1781992 191 35 149 128 73 86 100 244 141 166 62 398 276 2181993 36 27 28 125 87 79 20 198 171 74 12 231 176 1161994 60 25 44 97 80 44 28 153 124 63 13 213 177 921995 54 30 47 138 119 58 32 262 247 77 20 342 304 1091996 135 33 123 134 94 80 85 238 181 127 58 311 172 2371997 56 29 42 119 87 49 29 201 168 92 17 228 195 11015-YEAR AVERAGE1983-1997 65 33 48 123 94 62 31 206 152 108 19 300 225 159

154
Figure 5-5 Mean track forecast error (nm) and 5-year running mean for a) 24 hours b) 48 hours and c) 72 hoursfor the western North Indian Ocean tropical cyclones for the period 1981 to 1997.

155
Figure 5-6a Frequency distribution of initial warningposition errors for South Pacific and South IndianOcean tropical cyclones in 1997. The largest error, 251nm, occurred on Tropical Cyclone 21S ( Iletta).
Figure 5-6b Frequency distribution of 12-hour trackforecast errors for South Pacific and South IndianOcean tropical cyclones in 1997. The largest error ,373 nm, occurred on Tropical Cyclone 25S ( Karlette).
Figure 5-6c Frequency distribution of 24-hour trackforecast errors for South Pacific and South IndianOcean tropical cyclones in 1997. The largest error, 412nm, occurred on Tropical Cyclone 25S ( Karlette)
Figure 5-6d Frequency distribution of 36-hour trackforecast errors for South Pacific and South IndianOcean tropical cyclones in 1997. The largest error, 545nm, occurred on Tropical Cyclone 05S (Melanie).
Figure 5-6e Frequency distribution of 48-hour trackforecast errors for South Pacific and South IndianOcean tropical cyclones in 1997. The largest error, 732nm, occurred on Tropical Cyclone 05S (Melanie).
Figure 5-6f Frequency distribution of 72-hour trackforecast errors for South Pacific and South IndianOcean tropical cyclones in 1997. The largest error, 854nm, occurred on Tropical Cyclone 26S (Harold).

156
TABLE 5-4 INITIAL POSITION AND FORECAST POSITION ERRORS (NM) FOR THE SOUTHERNHEMISPHERE FOR 1983-1997
Initial Position 24-Hour 48-Hour 72-Hour Warnings ErrorNum Track Along Cross Num Track Along Cross Num Track Along Cross1983 191 35 163 130 88 77 126 241 158 145 1984 301 36 252 133 90 79 191 231 159 134 1985 306 36 257 134 92 79 193 236 169 132 1986 279 40 227 129 86 77 171 262 169 164 1987 189 46 138 145 94 90 101 280 153 138 1988 204 34 99 146 98 83 48 290 246 144 1989 287 31 242 124 84 73 186 240 166 136 1990 272 27 228 143 105 74 177 263 178 152 1991 264 24 231 115 75 69 185 220 152 129 1992 267 28 230 124 91 64 208 240 177 129 1993 257 21 225 102 74 57 176 199 142 114 1994 386 28 345 115 77 68 282 224 147 134 1995 245 24 222 108 82 55 175 198 144 108 53 291 169 1901996 343 24 298 125 90 67 237 240 174 129 46 277 221 1331997 561 24 499 109 82 72 442 210 163 135 150 288 248 17515-YEAR AVERAGE1983-1997 290 31 244 125 87 72 193 87 166 135 83 285 213 166
Figure 5-5 Mean track forecast error (nm) and 5-year running mean for a) 24 hours b) 48 hours for the SouthIndian Ocean tropical cyclones for the period 1981 to 1997.

157
Table 5-5 1997 ERROR STATISTICS FOR SELECTED OBJECTIVE TECHNIQUES THE NORTHWEST PACIFIC(1 JAN 1997 - 31 DEC 1997)
12-HOUR MEAN FORECAST ERROR(NM)
JTWC NGPS GFDN FBAM CSUM JGSM JTYM CLIP DAVE
JTWC 849 5555 0
NGPS 734 53 758 7372 19 73 0
GFDN 700 51 647 70 712 6767 16 65 -5 67 0
FBAM 814 55 717 72 677 66 868 6056 1 55 -17 51 -15 60 0 KEY FOR ERROR STATISTICS TABLES
CSUM 743 55 652 72 618 66 787 59 793 6359 4 57 -15 54 -12 63 4 63 0
JGSM 315 47 312 60 262 64 310 49 291 51 321 5353 6 52 -8 52 -12 53 4 53 2 53 0
JTYM 313 47 267 72 299 55 302 47 282 51 6 92 319 5656 9 56 -16 55 0 55 8 55 4 83 -9 56 0
CLIP 840 55 739 72 698 66 865 60 792 63 319 53 310 56 897 6461 6 59 -13 56 -10 64 4 64 1 52 -1 52 -4 64 0
DAVE 757 56 673 73 640 67 770 59 723 62 284 54 276 57 792 63 793 5856 0 54 -19 51 -16 57 -2 57 -5 47 -7 49 -8 58 -5 58 0
24- HOUR MEAN FORECAST ERROR (NM)
JTWC NGPS GFDN FBAM CSUM EGRR JGSM JTYM CLIP DAVE
JTWC 816 9292 0
NGPS 718 90 739 112111 21 112 0
GFDN 678 87 635 109 686 9998 11 99 -10 99 0
FBAM 786 93 703 111 658 98 841 10499 6 99 -12 91 -7 104 0
CSUM 716 93 639 111 601 98 762 102 767 114110 17 108 -3 105 7 114 12 114 0
EGRR 336 87 329 102 269 99 340 100 317 107 376 10599 12 97 -5 97 -2 100 0 97 -10 105 0
JGSM 312 81 312 97 262 98 307 93 288 100 279 89 319 8181 0 81 -16 82 -16 82 -11 82 -18 79 -10 81 0
JTYM 306 81 265 110 295 87 296 84 276 100 6 129 6 133 312 8988 7 88 -22 87 0 88 4 88 -12 134 5 109 -24 89 0
CLIP 809 93 723 111 677 98 838 104 766 114 352 100 317 81 304 88 867 116112 19 110 -1 106 8 115 11 116 2 113 13 100 19 100 12 116 0
DAVE 728 93 657 111 619 97 744 101 698 113 316 95 282 82 271 89 763 114 764 9188 -5 87 -24 83 -14 90 -11 90 -23 84 -11 80 -2 80 -9 91 -23 91 0
158
Table 5-5 (Continued) 36-HOUR MEAN FORECAST ERROR(NM)
JTWC NGPS GFDN FBAM CSUM JGSM JTYM CLIP DAVE
JTWC 770 129129 0
NGPS 666 125 682 149148 23 149 0
GFDN 643 124 590 146 648 135135 11 131 -15 135 0
FBAM 742 129 654 150 625 135 801 159153 24 148 -2 145 10 159 0
CSUM 674 129 595 150 570 135 724 156 729 170165 36 162 12 159 24 170 14 170 0
JGSM 293 117 288 135 249 134 289 149 270 152 300 109110 -7 109 -26 109 -25 110 -39 111 -41 109 0
JTYM 293 116 249 147 283 124 284 132 264 155 6 179 299 116111 -5 109 -38 110 -14 114 -18 114 -41 142 -37 116 0
CLIP 763 129 671 149 643 135 798 159 728 170 298 110 292 115 825 176170 41 167 18 164 29 175 16 176 6 158 48 161 46 176 0
DAVE 684 129 610 148 585 131 708 157 664 168 265 112 259 116 724 174 725 128123 -6 121 -27 117 -14 128 -29 127 -41 118 6 115 -1 128 -46 128 0
48-HOUR MEAN FORECAST ERROR(NM)
JTWC NGPS GFDN FBAM CSUM EGRR JGSM JTYM CLIP DAVEJTWC 707 163
163 0NGPS 596 159 615 189
189 30 189 0GFDN 594 159 529 186 602 176
176 17 173 -13 176 0FBAM 682 164 591 190 582 177 756 220
211 47 208 18 203 26 220 0CSUM 617 161 538 193 528 175 683 215 686 227
219 58 216 23 211 36 227 12 227 0EGRR 296 157 274 175 238 177 304 214 281 218 334 168
163 6 153 -22 155 -22 162 -52 153 -65 168 0JGSM 283 157 269 178 238 183 278 211 259 215 252 156 288 139
139 -18 139 -39 135 -48 138 -73 139 -76 133 -23 139 0JTYM 276 155 231 197 269 170 271 196 251 213 6 188 6 212 284 151
146 -9 141 -56 143 -27 148 -48 150 -63 158 -30 176 -36 151 0CLIP 701 163 607 188 598 176 755 220 685 227 314 163 287 139 278 149 779 244
231 68 228 40 224 48 242 22 242 15 241 78 228 89 229 80 244 0DAVE 625 164 551 189 543 170 664 217 623 225 277 156 254 141 246 151 681 241 681 166
159 -5 157 -32 154 -16 166 -51 166 -59 158 2 161 20 158 7 166 -75 166 0

159
Table 5-5 (Continued) 72-HOUR MEAN FORECAST ERROR(NM)
JTWC NGPS GFDN FBAM CSUM EGRR JGSM JTYM CLIP DAVEJTWC 598 245
245 0NGPS 491 229 515 279
284 55 279 0GFDN 484 232 431 278 500 284
282 50 270 -8 284 0FBAM 578 245 497 282 485 285 662 351
328 83 332 50 320 35 351 0CSUM 523 243 448 285 440 283 594 341 597 338
319 76 311 26 310 27 337 -4 338 0EGRR 239 239 222 264 189 284 255 339 232 336 280 233
232 -7 216 -48 218 -66 227 -112 213 -123 233 0JGSM 239 240 225 277 197 296 241 341 222 336 210 223 249 214
215 -25 211 -66 197 -99 213 -128 215 -121 204 -19 214 0JTYM 232 240 194 297 222 277 232 322 211 329 3 155 5 277 242 238
232 -8 211 -86 219 -58 235 -87 239 -90 248 93 200 -77 238 0CLIP 592 245 508 280 496 284 661 351 596 338 261 227 248 213 236 236 680 389
354 109 353 73 344 60 387 36 382 44 396 169 378 165 367 131 389 0DAVE 525 246 460 280 447 274 579 351 542 342 229 216 218 213 206 236 591 385 591 264
251 5 248 -32 249 -25 263 -88 262 -80 259 43 276 63 259 23 264 -121 264 0
Table 5-6 1997 ERROR STATISTICS FOR SELECTED OBJECTIVE TECHNIQUES IN THE NORTH INDIAN OCEAN(1 JAN 1997 - 31 DEC 1997)
12 HOUR MEAN FORECAST ERRORS(NM)
JTWC NGPS OTCM GFDN CLIP HPAC
JTWC 52 76 76 0
NGPS 47 72 48 75 74 2 75 0
OTCM 40 77 38 70 40 96 96 19 92 22 96 0
GFDN 43 79 41 78 35 98 44 110 108 29 105 27 106 8 110 0
CLIP 50 78 47 71 40 96 42 106 56 83 86 8 79 8 83 -13 89 -17 83 0
HPAC 51 77 47 71 40 96 42 106 56 83 57 86 86 9 80 9 84 -12 90 -16 87 4 86 0
24 HOUR MEAN FORECAST ERRORS(NM) JTWC NGPS OTCM GFDN CLIP HPAC
JTWC 42 119 119 0
NGPS 39 122 43 112 113 -9 112 0
OTCM 25 111 27 94 27 123 123 12 123 29 123 0
GFDN 33 128 36 121 23 125 36 209 216 88 209 88 205 80 209 0
CLIP 41 121 43 112 27 123 36 209 50 133 135 14 139 27 134 11 144 -65 133 0
HPAC 42 119 43 112 27 123 36 209 50 133 51 138 135 16 141 29 122 -1 148 -61 140 7 138 0

160
Table 5-6 (Continued) 36 HOUR MEAN FORECAST ERRORS(NM) JTWC NGPS OTCM GFDN CLIP HPAC
JTWC 35 164 164 0
NGPS 32 167 35 136 133 -34 136 0
OTCM 15 159 17 120 17 167 176 17 167 47 167 0
GFDN 27 172 27 145 13 178 27 314 314 142 314 169 281 103 314 0
CLIP 34 168 35 136 17 167 27 314 42 195 198 30 206 70 217 50 208 -106 195 0
HPAC 35 164 35 136 17 167 27 314 42 195 43 200 195 31 205 69 196 29 209 -105 203 8 200 0
48 HOUR MEAN FORECAST ERRORS(NM) JTWC NGPS OTCM GFDN CLIP HPAC
JTWC 29 201 201 0
NGPS 26 200 27 157 154 -46 157 0
OTCM 8 231 8 171 8 224 224 -7 224 53 224 0
GFDN 21 206 21 170 8 224 21 352 352 146 352 182 375 151 352 0
CLIP 28 206 27 157 8 224 21 352 34 248 258 52 260 103 326 102 264 -88 248 0
HPAC 29 201 27 157 8 224 21 352 34 248 35 243 239 38 240 83 292 68 245 -107 247 -1 243 0
72 HOUR MEAN FORECAST ERRORS(NM) JTWC NGPS OTCM GFDN CLIP HPAC
JTWC 17 228 228 0
NGPS 13 203 13 125 125 -78 125 0
OTCM 2 108 1 136 2 413 413 305 464 328 413 0
GFDN 11 200 9 149 2 413 11 441 441 241 376 227 538 125 441 0
CLIP 17 228 13 125 2 413 11 441 22 343 358 130 289 164 420 7 382 -59 343 0
HPAC 17 228 13 125 2 413 11 441 22 343 22 300 285 57 226 101 172 -241 261 -180 300 -43

161
Table 5-7 1997 ERROR STATISTICS FOR SELECTED OBJECTIVE TECHNIQUES IN THE SOUTHERN HEMISPHERE(1 JUL 1996 - 30 JUN 1997)
12-HOUR MEAN FORECAST ERROR (NM)
JTWC NGPS OTCM GFDN CLIP HPAC
JTWC 540 64
64 0 NGPS 434 60 721 85
83 23 85 0 OTCM 416 60 636 83 700 110
108 48 109 26 110 0 GFDN 209 58 284 76 274 111 314 84
83 25 82 6 84 -27 84 0 CLIP 536 64 505 84 488 109 242 83 704 124
108 44 104 20 100 -9 123 40 124 0 HPAC 529 63 499 83 485 109 238 82 693 122 696 76
70 7 70 -13 69 -40 66 -16 76 -46 76 0
24-HOUR MEAN FORECAST ERROR (NM)
JTWC NGPS OTCM GFDN EGRR CLIP HPAC
JTWC 503 110 110 0
NGPS 412 107 705 127 125 18 127 0
OTCM 385 104 606 123 662 171 171 67 170 47 171 0
GFDN 196 99 275 121 258 184 299 122 117 18 119 -2 120 -64 122 0
EGRR 186 101 276 116 235 163 104 123 342 134 111 10 114 -2 112 -51 116 -7 134 0
CLIP 501 109 497 127 463 171 231 118 225 115 684 178 158 49 156 29 149 -22 182 64 164 49 178 0
HPAC 496 109 492 126 461 171 228 118 223 115 675 175 678 132 122 13 124 -2 123 -48 116 -2 124 9 132 -43 132 0
36-HOUR MEAN FORECAST ERROR (NM) JTWC NGPS OTCM GFDN CLIP HPAC
JTWC 478 158 158 0
NGPS 393 156 667 174 165 9 174 0
OTCM 358 150 564 171 615 235 230 80 234 63 235 0
GFDN 188 143 263 167 237 255 283 165 156 13 160 -7 158 -97 165 0
CLIP 476 157 473 168 431 235 222 160 656 237 213 56 215 47 205 -30 239 79 237 0
HPAC 466 156 459 163 428 235 214 158 638 231 641 188 175 19 179 16 179 -56 169 11 187 -44 188 0

162
Table 5-7 (continued) 48-HOUR MEAN FORECAST ERROR (NM) JTWC NGPS OTCM GFDN EGRR CLIP HPAC
JTWC 446 211
211 0 NGPS 367 210 630 211
212 2 211 0 OTCM 318 201 518 203 563 302
300 99 301 98 302 0 GFDN 175 192 248 216 219 319 271 221
213 21 217 1 209 -110 221 0 EGRR 156 200 234 192 194 286 89 229 298 190
191 -9 183 -9 177 -109 186 -43 190 0 CLIP 444 210 449 212 399 306 214 216 194 187 627 301
277 67 277 65 269 -37 300 84 292 105 301 0 HPAC 433 208 436 207 397 306 206 212 189 183 609 296 611 247
231 23 241 34 238 -68 226 14 241 58 248 -48 247 0
72-HOUR MEAN FORECAST ERROR (NM)
JTWC NGPS OTCM GFDN EGRR CLIP HPAC
JTWC 147 295
295 0 NGPS 137 303 541 286
319 16 286 0 OTCM 114 297 415 274 461 426
435 138 419 145 426 0 GFDN 90 265 213 313 184 438 238 343
329 64 332 19 331 -107 343 0 EGRR 54 280 190 255 153 406 72 370 244 258
273 -7 246 -9 247 -159 263 -107 258 0 CLIP 146 295 390 295 328 428 194 351 156 265 551 417
387 92 399 104 394 -34 406 55 409 144 417 0 HPAC 147 295 379 290 325 426 188 342 151 259 536 411 538 635
299 4 348 58 343 -83 352 10 347 88 366 -45 365 0

163
6. TROPICAL CYCLONE WARNING VERIFICATION STATISTICS
6.1 GENERAL
Since 1959, JTWC has compiled data ontropical cyclones (TC) within its Area ofResponsibility (AOR). In this 39-yearperiod, over 32,000 warnings were verifiedon over 1,800 TCs. The verification datainclude best tracks (6-hourly positions andassociated intensities), JTWC forecasts (12-,24-, 36-, 48- and 72-hour position, intensityand wind radii), and fixes made fromsatellite, aircraft, radar, and synoptic data.These data are archived and available uponrequest. Efforts are underway to make thisinformation available via anonymous FileTransfer Protocol (FTP) over the Internet;however, until this project is complete
JTWC will provide the data by FTP uponrequest. To request data by Internet, send e-mail to: [email protected]. If theInternet is not an option, data can be copiedto 3.5" computer diskettes (that you provide)upon request. Plan for one diskette for eachyear and ocean basin. Mail them with yourrequest to: NAVPACMETOCCEN/JTWC,Box 113, Pearl Harbor, HI, 96860-5050.
6.2 WARNING VERIFICATIONSTATISTICS
6.2.1 WESTERN NORTH PACIFICThis section includes verification statisticsfor each significant TC in the western NorthPacific during 1997.
JTWC BEST TRACK, FORECAST TRACK AND INTENSITY ERRORS BY WARNING
TROPICAL STORM HANNAH (01W)
WRN BEST TRACK POSITION ERRORS WIND ERRORS DTG NO. LAT LONG WIND 00 12 24 36 48 72 00 12 24 36 48 72 97011100 4.0N 176.0E 15 97011106 4.0N 175.4E 15 97011112 4.0N 174.7E 15 97011118 4.0N 173.9E 15 97011200 4.0N 173.2E 15 97011206 4.0N 172.2E 15 97011212 4.0N 171.0E 15 97011218 3.9N 169.5E 15 97011300 3.9N 167.8E 15 97011306 4.0N 166.4E 15 97011312 4.2N 164.8E 15 97011318 4.4N 163.2E 15 97011400 4.6N 161.3E 15 97011406 4.8N 159.7E 15 97011412 5.0N 158.2E 15 97011418 5.0N 156.5E 15 97011500 5.0N 155.0E 15 97011506 5.0N 153.5E 15 97011512 5.1N 151.9E 15 97011518 5.2N 150.6E 15 97011600 5.4N 149.3E 15 97011606 5.6N 148.3E 15 97011612 5.8N 147.4E 15 97011618 6.0N 146.4E 15 97011700 6.2N 145.4E 15 97011706 6.4N 144.5E 20 97011712 6.5N 143.6E 20
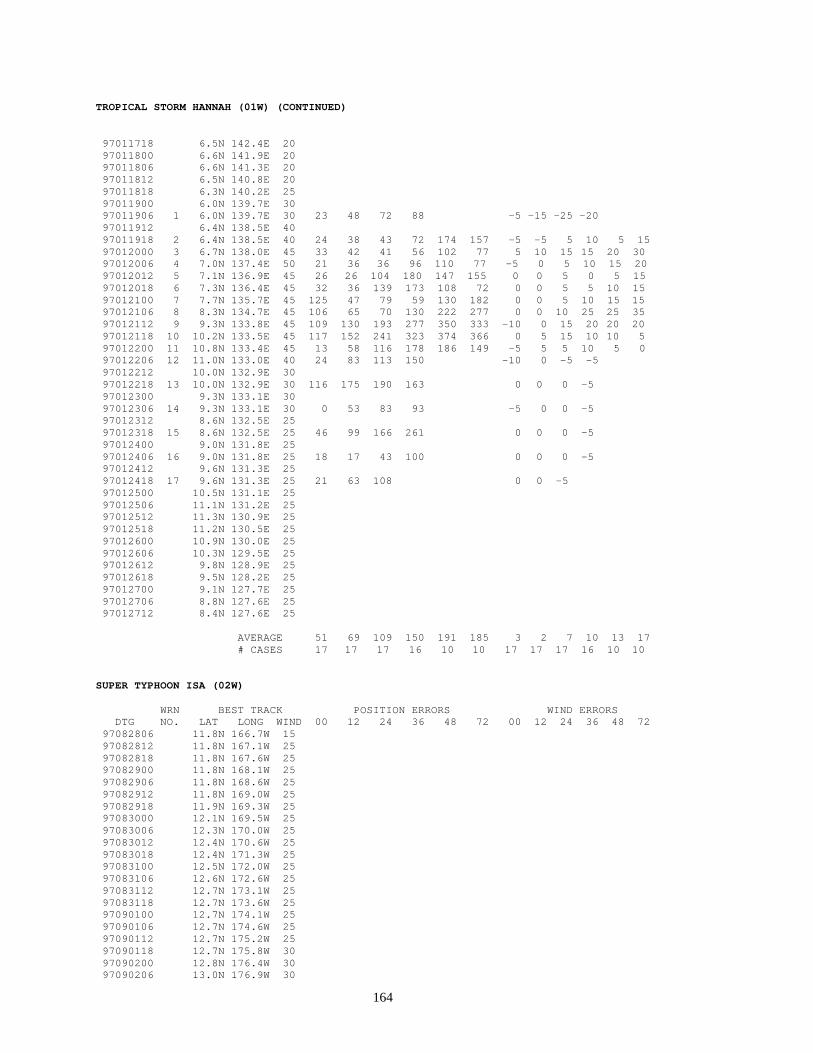
164
TROPICAL STORM HANNAH (01W) (CONTINUED)
97011718 6.5N 142.4E 20 97011800 6.6N 141.9E 20 97011806 6.6N 141.3E 20 97011812 6.5N 140.8E 20 97011818 6.3N 140.2E 25 97011900 6.0N 139.7E 30 97011906 1 6.0N 139.7E 30 23 48 72 88 -5 -15 -25 -20 97011912 6.4N 138.5E 40 97011918 2 6.4N 138.5E 40 24 38 43 72 174 157 -5 -5 5 10 5 15 97012000 3 6.7N 138.0E 45 33 42 41 56 102 77 5 10 15 15 20 30 97012006 4 7.0N 137.4E 50 21 36 36 96 110 77 -5 0 5 10 15 20 97012012 5 7.1N 136.9E 45 26 26 104 180 147 155 0 0 5 0 5 15 97012018 6 7.3N 136.4E 45 32 36 139 173 108 72 0 0 5 5 10 15 97012100 7 7.7N 135.7E 45 125 47 79 59 130 182 0 0 5 10 15 15 97012106 8 8.3N 134.7E 45 106 65 70 130 222 277 0 0 10 25 25 35 97012112 9 9.3N 133.8E 45 109 130 193 277 350 333 -10 0 15 20 20 20 97012118 10 10.2N 133.5E 45 117 152 241 323 374 366 0 5 15 10 10 5 97012200 11 10.8N 133.4E 45 13 58 116 178 186 149 -5 5 5 10 5 0 97012206 12 11.0N 133.0E 40 24 83 113 150 -10 0 -5 -5 97012212 10.0N 132.9E 30 97012218 13 10.0N 132.9E 30 116 175 190 163 0 0 0 -5 97012300 9.3N 133.1E 30 97012306 14 9.3N 133.1E 30 0 53 83 93 -5 0 0 -5 97012312 8.6N 132.5E 25 97012318 15 8.6N 132.5E 25 46 99 166 261 0 0 0 -5 97012400 9.0N 131.8E 25 97012406 16 9.0N 131.8E 25 18 17 43 100 0 0 0 -5 97012412 9.6N 131.3E 25 97012418 17 9.6N 131.3E 25 21 63 108 0 0 -5 97012500 10.5N 131.1E 25 97012506 11.1N 131.2E 25 97012512 11.3N 130.9E 25 97012518 11.2N 130.5E 25 97012600 10.9N 130.0E 25 97012606 10.3N 129.5E 25 97012612 9.8N 128.9E 25 97012618 9.5N 128.2E 25 97012700 9.1N 127.7E 25 97012706 8.8N 127.6E 25 97012712 8.4N 127.6E 25
AVERAGE 51 69 109 150 191 185 3 2 7 10 13 17 # CASES 17 17 17 16 10 10 17 17 17 16 10 10
SUPER TYPHOON ISA (02W)
WRN BEST TRACK POSITION ERRORS WIND ERRORS DTG NO. LAT LONG WIND 00 12 24 36 48 72 00 12 24 36 48 72 97082806 11.8N 166.7W 15 97082812 11.8N 167.1W 25 97082818 11.8N 167.6W 25 97082900 11.8N 168.1W 25 97082906 11.8N 168.6W 25 97082912 11.8N 169.0W 25 97082918 11.9N 169.3W 25 97083000 12.1N 169.5W 25 97083006 12.3N 170.0W 25 97083012 12.4N 170.6W 25 97083018 12.4N 171.3W 25 97083100 12.5N 172.0W 25 97083106 12.6N 172.6W 25 97083112 12.7N 173.1W 25 97083118 12.7N 173.6W 25 97090100 12.7N 174.1W 25 97090106 12.7N 174.6W 25 97090112 12.7N 175.2W 25 97090118 12.7N 175.8W 30 97090200 12.8N 176.4W 30 97090206 13.0N 176.9W 30
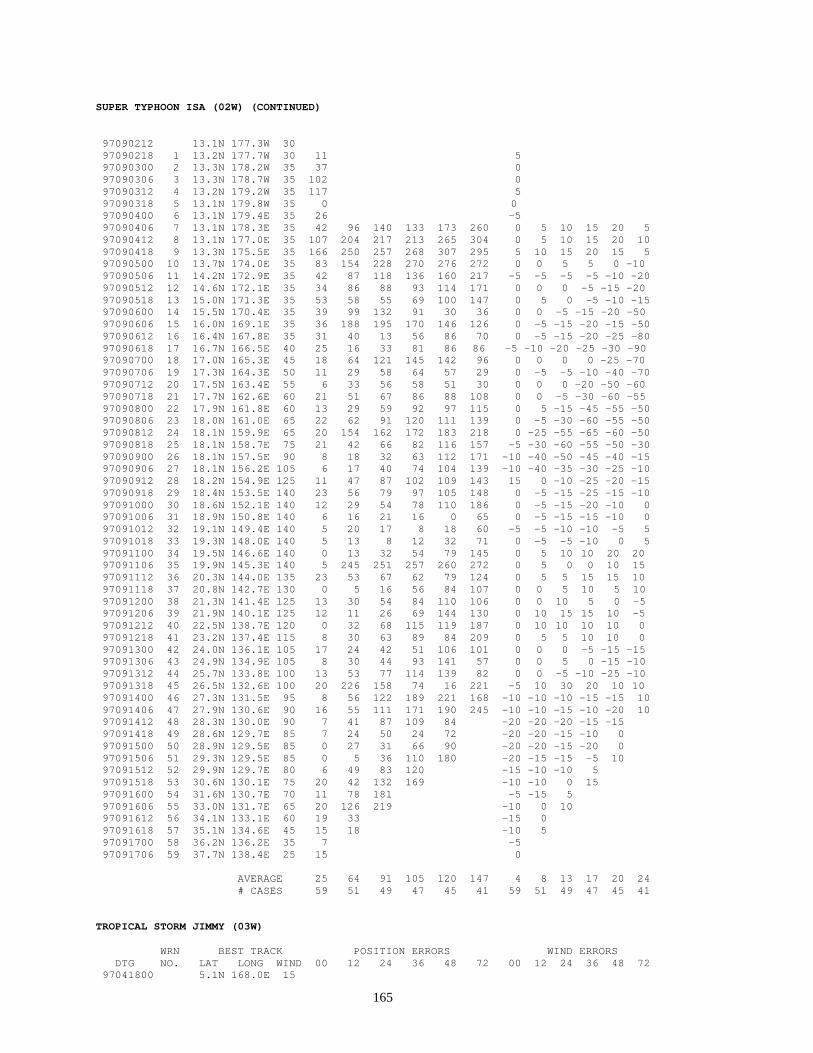
165
SUPER TYPHOON ISA (02W) (CONTINUED)
97090212 13.1N 177.3W 30 97090218 1 13.2N 177.7W 30 11 5 97090300 2 13.3N 178.2W 35 37 0 97090306 3 13.3N 178.7W 35 102 0 97090312 4 13.2N 179.2W 35 117 5 97090318 5 13.1N 179.8W 35 0 0 97090400 6 13.1N 179.4E 35 26 -5 97090406 7 13.1N 178.3E 35 42 96 140 133 173 260 0 5 10 15 20 5 97090412 8 13.1N 177.0E 35 107 204 217 213 265 304 0 5 10 15 20 10 97090418 9 13.3N 175.5E 35 166 250 257 268 307 295 5 10 15 20 15 5 97090500 10 13.7N 174.0E 35 83 154 228 270 276 272 0 0 5 5 0 -10 97090506 11 14.2N 172.9E 35 42 87 118 136 160 217 -5 -5 -5 -5 -10 -20 97090512 12 14.6N 172.1E 35 34 86 88 93 114 171 0 0 0 -5 -15 -20 97090518 13 15.0N 171.3E 35 53 58 55 69 100 147 0 5 0 -5 -10 -15 97090600 14 15.5N 170.4E 35 39 99 132 91 30 36 0 0 -5 -15 -20 -50 97090606 15 16.0N 169.1E 35 36 188 195 170 146 126 0 -5 -15 -20 -15 -50 97090612 16 16.4N 167.8E 35 31 40 13 56 86 70 0 -5 -15 -20 -25 -80 97090618 17 16.7N 166.5E 40 25 16 33 81 86 86 -5 -10 -20 -25 -30 -90 97090700 18 17.0N 165.3E 45 18 64 121 145 142 96 0 0 0 0 -25 -70 97090706 19 17.3N 164.3E 50 11 29 58 64 57 29 0 -5 -5 -10 -40 -70 97090712 20 17.5N 163.4E 55 6 33 56 58 51 30 0 0 0 -20 -50 -60 97090718 21 17.7N 162.6E 60 21 51 67 86 88 108 0 0 -5 -30 -60 -55 97090800 22 17.9N 161.8E 60 13 29 59 92 97 115 0 5 -15 -45 -55 -50 97090806 23 18.0N 161.0E 65 22 62 91 120 111 139 0 -5 -30 -60 -55 -50 97090812 24 18.1N 159.9E 65 20 154 162 172 183 218 0 -25 -55 -65 -60 -50 97090818 25 18.1N 158.7E 75 21 42 66 82 116 157 -5 -30 -60 -55 -50 -30 97090900 26 18.1N 157.5E 90 8 18 32 63 112 171 -10 -40 -50 -45 -40 -15 97090906 27 18.1N 156.2E 105 6 17 40 74 104 139 -10 -40 -35 -30 -25 -10 97090912 28 18.2N 154.9E 125 11 47 87 102 109 143 15 0 -10 -25 -20 -15 97090918 29 18.4N 153.5E 140 23 56 79 97 105 148 0 -5 -15 -25 -15 -10 97091000 30 18.6N 152.1E 140 12 29 54 78 110 186 0 -5 -15 -20 -10 0 97091006 31 18.9N 150.8E 140 6 16 21 16 0 65 0 -5 -15 -15 -10 0 97091012 32 19.1N 149.4E 140 5 20 17 8 18 60 -5 -5 -10 -10 -5 5 97091018 33 19.3N 148.0E 140 5 13 8 12 32 71 0 -5 -5 -10 0 5 97091100 34 19.5N 146.6E 140 0 13 32 54 79 145 0 5 10 10 20 20 97091106 35 19.9N 145.3E 140 5 245 251 257 260 272 0 5 0 0 10 15 97091112 36 20.3N 144.0E 135 23 53 67 62 79 124 0 5 5 15 15 10 97091118 37 20.8N 142.7E 130 0 5 16 56 84 107 0 0 5 10 5 10 97091200 38 21.3N 141.4E 125 13 30 54 84 110 106 0 0 10 5 0 -5 97091206 39 21.9N 140.1E 125 12 11 26 69 144 130 0 10 15 15 10 -5 97091212 40 22.5N 138.7E 120 0 32 68 115 119 187 0 10 10 10 10 0 97091218 41 23.2N 137.4E 115 8 30 63 89 84 209 0 5 5 10 10 0 97091300 42 24.0N 136.1E 105 17 24 42 51 106 101 0 0 0 -5 -15 -15 97091306 43 24.9N 134.9E 105 8 30 44 93 141 57 0 0 5 0 -15 -10 97091312 44 25.7N 133.8E 100 13 53 77 114 139 82 0 0 -5 -10 -25 -10 97091318 45 26.5N 132.6E 100 20 226 158 74 16 221 -5 10 30 20 10 10 97091400 46 27.3N 131.5E 95 8 56 122 189 221 168 -10 -10 -10 -15 -15 10 97091406 47 27.9N 130.6E 90 16 55 111 171 190 245 -10 -10 -15 -10 -20 10 97091412 48 28.3N 130.0E 90 7 41 87 109 84 -20 -20 -20 -15 -15 97091418 49 28.6N 129.7E 85 7 24 50 24 72 -20 -20 -15 -10 0 97091500 50 28.9N 129.5E 85 0 27 31 66 90 -20 -20 -15 -20 0 97091506 51 29.3N 129.5E 85 0 5 36 110 180 -20 -15 -15 -5 10 97091512 52 29.9N 129.7E 80 6 49 83 120 -15 -10 -10 5 97091518 53 30.6N 130.1E 75 20 42 132 169 -10 -10 0 15 97091600 54 31.6N 130.7E 70 11 78 181 -5 -15 5 97091606 55 33.0N 131.7E 65 20 126 219 -10 0 10 97091612 56 34.1N 133.1E 60 19 33 -15 0 97091618 57 35.1N 134.6E 45 15 18 -10 5 97091700 58 36.2N 136.2E 35 7 -5 97091706 59 37.7N 138.4E 25 15 0
AVERAGE 25 64 91 105 120 147 4 8 13 17 20 24 # CASES 59 51 49 47 45 41 59 51 49 47 45 41
TROPICAL STORM JIMMY (03W)
WRN BEST TRACK POSITION ERRORS WIND ERRORS DTG NO. LAT LONG WIND 00 12 24 36 48 72 00 12 24 36 48 72 97041800 5.1N 168.0E 15
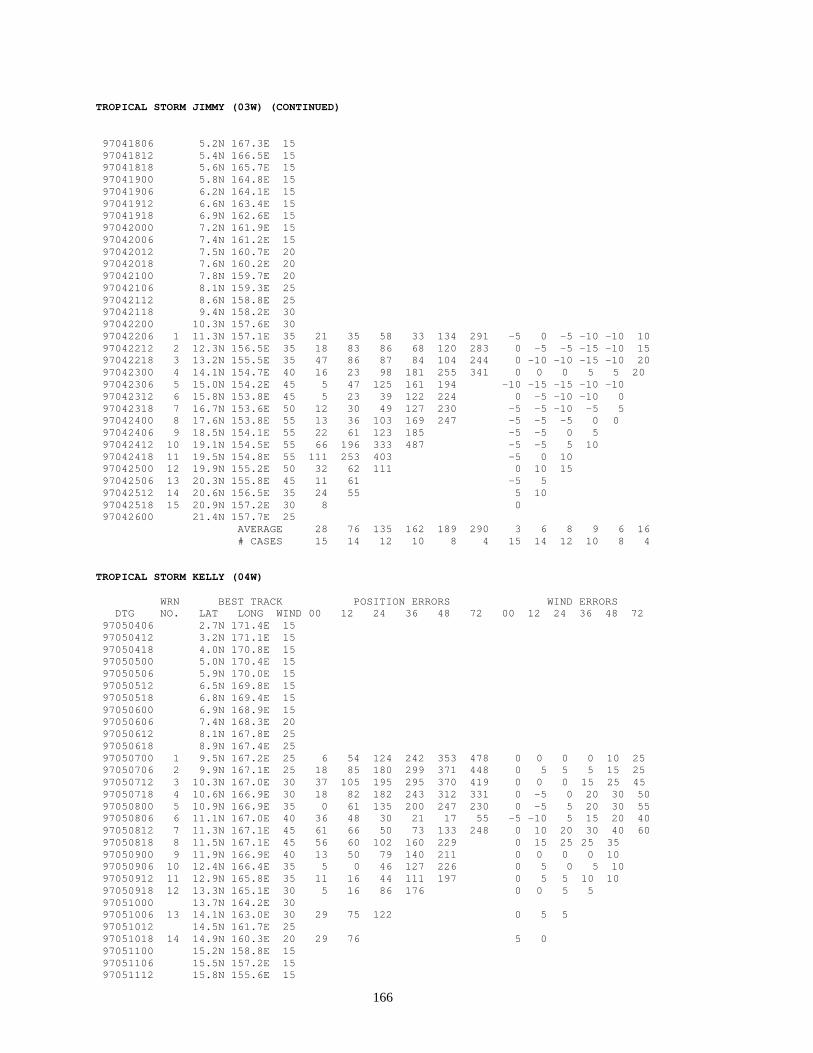
166
TROPICAL STORM JIMMY (03W) (CONTINUED)
97041806 5.2N 167.3E 15 97041812 5.4N 166.5E 15 97041818 5.6N 165.7E 15 97041900 5.8N 164.8E 15 97041906 6.2N 164.1E 15 97041912 6.6N 163.4E 15 97041918 6.9N 162.6E 15 97042000 7.2N 161.9E 15 97042006 7.4N 161.2E 15 97042012 7.5N 160.7E 20 97042018 7.6N 160.2E 20 97042100 7.8N 159.7E 20 97042106 8.1N 159.3E 25 97042112 8.6N 158.8E 25 97042118 9.4N 158.2E 30 97042200 10.3N 157.6E 30 97042206 1 11.3N 157.1E 35 21 35 58 33 134 291 -5 0 -5 -10 -10 10 97042212 2 12.3N 156.5E 35 18 83 86 68 120 283 0 -5 -5 -15 -10 15 97042218 3 13.2N 155.5E 35 47 86 87 84 104 244 0 -10 -10 -15 -10 20 97042300 4 14.1N 154.7E 40 16 23 98 181 255 341 0 0 0 5 5 20 97042306 5 15.0N 154.2E 45 5 47 125 161 194 -10 -15 -15 -10 -10 97042312 6 15.8N 153.8E 45 5 23 39 122 224 0 -5 -10 -10 0 97042318 7 16.7N 153.6E 50 12 30 49 127 230 -5 -5 -10 -5 5 97042400 8 17.6N 153.8E 55 13 36 103 169 247 -5 -5 -5 0 0 97042406 9 18.5N 154.1E 55 22 61 123 185 -5 -5 0 5 97042412 10 19.1N 154.5E 55 66 196 333 487 -5 -5 5 10 97042418 11 19.5N 154.8E 55 111 253 403 -5 0 10 97042500 12 19.9N 155.2E 50 32 62 111 0 10 15 97042506 13 20.3N 155.8E 45 11 61 -5 5 97042512 14 20.6N 156.5E 35 24 55 5 10 97042518 15 20.9N 157.2E 30 8 0 97042600 21.4N 157.7E 25 AVERAGE 28 76 135 162 189 290 3 6 8 9 6 16 # CASES 15 14 12 10 8 4 15 14 12 10 8 4
TROPICAL STORM KELLY (04W)
WRN BEST TRACK POSITION ERRORS WIND ERRORS DTG NO. LAT LONG WIND 00 12 24 36 48 72 00 12 24 36 48 72 97050406 2.7N 171.4E 15 97050412 3.2N 171.1E 15 97050418 4.0N 170.8E 15 97050500 5.0N 170.4E 15 97050506 5.9N 170.0E 15 97050512 6.5N 169.8E 15 97050518 6.8N 169.4E 15 97050600 6.9N 168.9E 15 97050606 7.4N 168.3E 20 97050612 8.1N 167.8E 25 97050618 8.9N 167.4E 25 97050700 1 9.5N 167.2E 25 6 54 124 242 353 478 0 0 0 0 10 25 97050706 2 9.9N 167.1E 25 18 85 180 299 371 448 0 5 5 5 15 25 97050712 3 10.3N 167.0E 30 37 105 195 295 370 419 0 0 0 15 25 45 97050718 4 10.6N 166.9E 30 18 82 182 243 312 331 0 -5 0 20 30 50 97050800 5 10.9N 166.9E 35 0 61 135 200 247 230 0 -5 5 20 30 55 97050806 6 11.1N 167.0E 40 36 48 30 21 17 55 -5 -10 5 15 20 40 97050812 7 11.3N 167.1E 45 61 66 50 73 133 248 0 10 20 30 40 60 97050818 8 11.5N 167.1E 45 56 60 102 160 229 0 15 25 25 35 97050900 9 11.9N 166.9E 40 13 50 79 140 211 0 0 0 0 10 97050906 10 12.4N 166.4E 35 5 0 46 127 226 0 5 0 5 10 97050912 11 12.9N 165.8E 35 11 16 44 111 197 0 5 5 10 10 97050918 12 13.3N 165.1E 30 5 16 86 176 0 0 5 5 97051000 13.7N 164.2E 30 97051006 13 14.1N 163.0E 30 29 75 122 0 5 5 97051012 14.5N 161.7E 25 97051018 14 14.9N 160.3E 20 29 76 5 0 97051100 15.2N 158.8E 15 97051106 15.5N 157.2E 15 97051112 15.8N 155.6E 15

167
TROPICAL STORM KELLY (04W) (CONTINUED)
AVERAGE 24 57 106 174 243 316 1 5 6 13 21 43 # CASES 14 14 13 12 11 7 14 14 13 12 11 7
TROPICAL STORM LEVI (05W)
WRN BEST TRACK POSITION ERRORS WIND ERRORS DTG NO. LAT LONG WIND 00 12 24 36 48 72 00 12 24 36 48 72 97052300 16.8N 111.0E 15 97052306 16.8N 111.7E 15 97052312 16.8N 112.5E 15 97052318 16.8N 113.3E 15 97052400 16.8N 114.1E 15 97052406 16.8N 114.9E 15 97052412 16.8N 115.7E 15 97052418 16.8N 116.5E 15 97052500 16.8N 117.2E 20 97052506 16.8N 117.9E 20 97052512 16.8N 118.6E 20 97052518 1 16.6N 119.3E 25 39 23 104 136 0 5 0 -5 97052600 2 16.5N 120.0E 25 17 73 158 183 196 305 0 0 0 -10 0 5 97052606 3 16.4N 120.9E 25 0 67 120 134 143 247 0 0 -5 -5 5 10 97052612 4 16.5N 122.2E 25 18 117 132 135 142 306 0 0 -5 0 0 0 97052618 5 17.0N 123.6E 25 50 99 103 124 153 395 0 -5 -5 -5 -5 -10 97052700 6 17.6N 124.7E 25 38 23 25 42 108 456 0 -10 -5 -10 -5 -5 97052706 7 18.2N 125.4E 30 17 24 40 52 84 436 0 0 0 0 -5 -5 97052712 8 18.7N 125.8E 35 21 116 186 195 114 131 0 10 -10 -15 -20 -10 97052718 9 19.4N 126.0E 35 21 71 124 131 151 250 0 5 -10 -15 -20 -5 97052800 10 20.2N 126.1E 35 28 86 125 89 129 103 0 -5 -10 -15 -10 0 97052806 11 21.1N 126.2E 40 22 33 20 76 186 139 0 0 0 -5 -5 5 97052812 12 22.0N 126.3E 45 62 74 49 96 137 284 0 0 0 0 0 5 97052818 13 23.1N 126.6E 45 69 54 144 252 211 220 0 0 0 0 5 5 97052900 14 24.1N 127.3E 45 16 94 204 234 143 0 -5 0 0 10 97052906 15 25.2N 128.6E 45 12 81 155 143 0 -5 -5 5 97052912 16 26.2N 130.4E 45 0 42 64 231 0 0 0 10 97052918 17 27.3N 132.6E 45 8 38 136 0 0 5 97053000 18 28.4N 135.2E 40 6 121 362 630 891 0 5 10 10 5 97053006 19 29.4N 137.6E 40 38 231 499 0 5 10 97053012 30.1N 139.6E 35 97053018 30.6N 141.0E 30 97053100 30.9N 142.2E 25 97053106 31.3N 143.8E 25 97053112 31.6N 145.4E 25 97053118 32.0N 147.3E 25 97060100 32.5N 149.5E 25 97060106 32.9N 151.8E 25 97060112 33.1N 154.5E 30 97060118 33.2N 157.6E 30 97060200 33.3N 161.1E 30 97060206 33.5N 164.8E 35 97060212 34.1N 168.8E 35 97060218 34.8N 173.1E 45 97060300 35.7N 177.7E 40 97060306 36.7N 177.2W 40 97060312 37.8N 171.8W 40 97060318 38.9N 166.1W 35 97060400 40.0N 160.2W 35
AVERAGE 26 78 145 170 200 273 0 3 4 6 7 5 # CASES 19 19 19 17 14 12 19 19 19 17 14 12

168
TYPHOON MARIE (06W)
WRN BEST TRACK POSITION ERRORS WIND ERRORS DTG NO. LAT LONG WIND 00 12 24 36 48 72 00 12 24 36 48 72 97052512 9.1N 161.4E 20 97052518 9.3N 161.2E 20 97052600 9.5N 161.0E 20 97052606 9.7N 160.8E 25 97052612 9.8N 160.5E 25 97052618 1 10.1N 159.9E 25 25 62 102 158 192 267 0 -5 0 5 10 -20 97052700 2 10.7N 159.3E 30 51 103 136 201 260 372 -5 -5 0 5 0 -25 97052706 3 11.4N 158.7E 30 68 114 161 232 323 440 -5 -5 0 0 -10 -25 97052712 4 12.1N 158.1E 30 84 126 197 263 320 348 -5 -5 0 -10 -20 -25 97052718 5 12.6N 157.8E 30 102 142 212 306 379 466 -5 -5 -5 -20 -30 -30 97052800 6 13.0N 157.8E 30 102 151 223 310 367 434 -5 0 -10 -25 -30 -30 97052806 7 13.3N 157.9E 30 109 154 245 324 373 469 -5 -5 -20 -35 -30 -30 97052812 8 13.6N 158.0E 30 11 58 127 176 204 296 -5 -15 -30 -40 -30 -50 97052818 9 13.9N 158.2E 35 37 54 59 83 84 196 -5 -25 -40 -40 -50 -55 97052900 10 14.4N 158.5E 45 26 84 160 211 242 367 -5 -25 -40 -40 -55 -45 97052906 11 15.0N 158.9E 55 13 50 136 218 283 526 -5 -20 -20 -15 -15 5 97052912 12 15.8N 159.3E 65 0 13 41 115 212 558 -15 -25 -20 -20 -20 0 97052918 13 16.7N 159.6E 75 12 23 73 143 235 604 -25 -25 -25 -20 -15 5 97053000 14 17.6N 159.9E 80 8 13 86 178 294 705 -15 -5 -5 -15 -10 0 97053006 15 18.5N 160.0E 80 12 72 110 171 275 698 -10 -10 -5 -10 -5 5 97053012 16 19.6N 160.1E 80 6 17 61 131 238 586 -10 -25 -25 -20 -20 -5 97053018 17 20.8N 160.2E 85 0 23 36 49 80 354 -15 -25 -20 -15 -15 -5 97053100 18 22.0N 160.3E 90 0 13 64 148 233 0 -15 -10 -10 -10 97053106 19 23.1N 160.7E 90 0 27 106 212 344 0 -10 -5 -5 -5 97053112 20 24.2N 161.6E 90 8 60 98 156 217 0 0 0 0 -5 97053118 21 25.3N 162.6E 85 16 5 49 135 256 -10 -5 -5 -5 -10 97060100 22 26.4N 164.0E 75 17 79 201 332 0 -5 -5 -5 97060106 23 27.8N 166.0E 70 22 64 149 224 -5 -5 0 -5 97060112 24 29.0N 168.3E 65 0 34 136 0 -5 0 97060118 25 30.6N 171.3E 60 31 133 281 0 0 0 97060200 26 32.3N 174.6E 55 46 139 0 -5 97060206 27 34.3N 178.4E 50 77 152 -5 -5 97060212 36.5N 177.4W 50 97060218 38.4N 172.4W 50
AVERAGE 33 73 131 195 258 453 6 11 12 16 19 21 # CASES 27 27 25 23 21 17 27 27 25 23 21 17
SUPER TYPHOON NESTOR (07W)
WRN BEST TRACK POSITION ERRORS WIND ERRORS DTG NO. LAT LONG WIND 00 12 24 36 48 72 00 12 24 36 48 72 97060106 6.0N 171.0E 15 97060112 5.9N 170.3E 15 97060118 5.8N 169.6E 15 97060200 5.7N 168.9E 15 97060206 5.6N 168.2E 15 97060212 5.5N 167.5E 15 97060218 5.5N 166.8E 15 97060300 5.4N 166.1E 15 97060306 5.3N 165.6E 15 97060312 5.3N 165.2E 15 97060318 5.4N 164.8E 15 97060400 5.7N 164.3E 20 97060406 6.1N 163.8E 20 97060412 6.6N 163.3E 20 97060418 7.3N 162.5E 20 97060500 7.9N 161.6E 20 97060506 8.3N 160.6E 20 97060512 8.7N 159.5E 25 97060518 9.0N 158.2E 30 97060600 1 9.3N 156.8E 35 18 67 114 157 171 230 -10 -5 0 0 -5 -40 97060606 2 9.7N 155.4E 35 38 75 129 168 178 248 -5 0 5 10 -5 -35 97060612 3 10.1N 154.3E 35 8 54 106 132 162 243 -5 0 5 0 -15 -50 97060618 4 10.5N 153.4E 35 24 79 133 157 205 265 -5 0 0 -15 -30 -65 97060700 5 11.0N 152.5E 35 43 104 133 159 197 287 -5 0 -10 -25 -45 -70 97060706 6 11.7N 151.8E 35 30 48 72 116 158 266 0 5 -10 -25 -45 -75 97060712 7 12.4N 151.2E 35 8 39 125 220 303 444 0 -5 -20 -35 -50 -50

169
SUPER TYPHOON NESTOR (07W) (CONTINUED)
97060718 8 12.9N 150.5E 35 26 99 195 236 271 243 0 -15 -30 -45 -60 -40 97060800 9 13.3N 150.2E 45 29 65 100 133 154 131 0 -20 -40 -60 -65 -40 97060806 10 13.7N 149.9E 55 24 60 103 139 149 211 -10 -30 -50 -70 -70 -35 97060812 11 14.3N 149.8E 65 16 23 52 63 51 143 -10 -25 -40 -40 -40 -25 97060818 12 14.8N 149.7E 75 0 18 26 18 56 142 0 -10 -25 -20 -10 0 97060900 13 15.2N 149.5E 90 0 16 34 59 74 138 0 -15 -15 -15 -5 0 97060906 14 15.6N 149.2E 100 5 6 24 49 86 100 0 -20 -20 -5 0 0 97060912 15 16.1N 149.0E 115 18 20 22 48 58 32 0 -10 -15 0 25 10 97060918 16 16.6N 148.8E 125 12 46 61 71 65 22 -10 -15 -5 5 25 15 97061000 17 17.2N 148.4E 130 12 12 16 17 17 96 -5 -10 5 25 15 20 97061006 18 17.8N 148.0E 135 5 16 32 53 39 107 0 10 20 25 20 20 97061012 19 18.4N 147.4E 140 11 28 33 33 60 87 0 10 30 25 20 45 97061018 20 18.9N 146.8E 130 17 45 46 52 69 100 0 15 15 5 -5 15 97061100 21 19.4N 146.0E 130 0 24 37 47 60 228 0 15 5 0 0 25 97061106 22 20.1N 145.2E 125 5 25 32 53 71 236 0 5 0 0 0 30 97061112 23 20.7N 144.4E 115 8 24 21 16 48 285 0 -5 -10 -10 5 20 97061118 24 21.5N 143.6E 115 0 36 43 66 72 145 0 -5 -10 -15 5 15 97061200 25 22.1N 142.8E 115 0 6 17 16 20 95 0 -5 -5 10 15 15 97061206 26 22.9N 142.1E 115 0 12 24 58 73 198 0 0 -5 15 20 15 97061212 27 24.0N 141.7E 115 12 12 11 30 98 302 0 5 20 25 25 20 97061218 28 25.3N 141.6E 110 0 30 28 24 105 0 -5 15 15 10 97061300 29 26.6N 141.7E 105 12 44 75 117 216 0 10 15 10 5 97061306 30 28.0N 142.0E 105 18 33 73 109 187 0 15 20 10 5 97061312 31 29.6N 142.8E 80 31 33 74 192 252 0 0 0 -10 -15 97061318 32 31.2N 143.9E 75 15 46 106 177 0 5 0 -10 97061400 33 33.1N 145.6E 65 25 58 23 44 0 10 0 -5 97061406 34 34.9N 147.8E 60 11 24 47 5 10 0 97061412 35 36.2N 150.8E 55 0 68 69 5 0 0 97061418 36 37.5N 154.6E 55 0 54 0 0 97061500 37 38.4N 159.0E 55 11 11 0 5 97061506 39.2N 162.7E 55 97061512 40.0N 166.7E 50
AVERAGE 14 40 64 92 121 187 2 9 13 18 21 29 # CASES 37 37 35 33 31 27 37 37 35 33 31 27
TYPHOON OPAL (08W)
WRN BEST TRACK POSITION ERRORS WIND ERRORS DTG NO. LAT LONG WIND 00 12 24 36 48 72 00 12 24 36 48 72 97061312 12.1N 138.8E 15 97061318 12.1N 138.0E 15 97061400 12.2N 137.2E 15 97061406 12.4N 136.4E 15 97061412 12.7N 135.6E 15 97061418 13.1N 134.9E 20 97061500 1 13.6N 134.2E 25 67 100 166 220 248 259 0 5 0 0 -10 -15 97061506 2 14.1N 133.6E 25 13 8 45 79 103 219 0 0 -5 -10 -20 -15 97061512 3 14.5N 133.2E 25 8 50 74 99 120 210 0 0 0 -10 -25 -15 97061518 4 14.8N 133.0E 30 55 105 141 149 152 214 0 0 -5 -15 -20 -10 97061600 5 15.0N 132.8E 35 8 39 72 95 152 262 0 -5 -15 -30 -20 -10 97061606 6 15.3N 132.6E 40 5 24 51 96 151 236 0 -5 -20 -25 -15 10 97061612 7 15.6N 132.5E 45 8 5 26 95 149 271 0 -10 -25 -15 -5 5 97061618 8 16.0N 132.4E 55 29 47 90 134 179 293 -10 -20 -25 -15 -5 10 97061700 9 16.5N 132.4E 65 0 18 88 143 223 369 -10 -20 -10 10 10 25 97061706 10 17.3N 132.6E 75 12 41 89 147 222 394 0 -5 10 25 20 35 97061712 11 18.2N 132.8E 90 0 46 74 115 147 383 0 10 25 25 35 30 97061718 12 19.5N 133.2E 90 13 42 90 125 136 436 0 10 25 30 40 30 97061800 13 20.9N 133.6E 90 11 36 60 93 156 398 0 10 25 35 45 30 97061806 14 22.4N 133.6E 90 13 20 31 8 99 61 0 10 20 30 35 25 97061812 15 24.0N 133.6E 90 8 22 15 27 126 0 10 25 40 30 97061818 16 25.7N 133.6E 90 13 15 24 87 171 0 5 15 25 10 97061900 17 27.4N 133.6E 90 0 28 35 141 159 0 10 20 10 15 97061906 18 29.1N 133.7E 85 5 23 90 204 167 0 5 15 5 20 97061912 19 30.6N 134.2E 80 0 30 143 171 0 5 5 5 97061918 20 32.1N 135.0E 75 15 97 194 123 0 5 -5 5 97062000 21 33.9N 136.5E 65 15 130 132 0 0 5 97062006 22 35.9N 138.8E 55 9 95 180 0 -10 5

170
TYPHOON OPAL (08W) (CONTINUED)
97062012 23 38.6N 141.1E 55 11 135 -5 0 97062018 24 40.5N 143.2E 55 43 218 -10 5 97062100 25 41.2N 145.5E 45 36 0 97062106 26 41.4N 148.0E 40 73 5
AVERAGE 18 58 87 118 159 287 2 7 14 18 21 19 # CASES 26 24 22 20 18 14 26 24 22 20 18 14
TYPHOON PETER (09W)
WRN BEST TRACK POSITION ERRORS WIND ERRORS DTG NO. LAT LONG WIND 00 12 24 36 48 72 00 12 24 36 48 72 97061512 5.5N 162.4E 15 97061518 5.7N 161.4E 15 97061600 5.9N 160.4E 15 97061606 6.1N 159.4E 15 97061612 6.4N 158.4E 15 97061618 6.7N 157.4E 15 97061700 7.0N 156.4E 15 97061706 7.4N 155.5E 15 97061712 7.8N 154.6E 15 97061718 8.1N 153.6E 15 97061800 8.5N 152.7E 15 97061806 8.9N 151.6E 15 97061812 9.3N 150.2E 15 97061818 9.7N 148.6E 15 97061900 10.0N 146.7E 15 97061906 10.2N 144.7E 15 97061912 10.4N 143.0E 15 97061918 10.6N 141.7E 15 97062000 11.0N 140.9E 15 97062006 11.6N 140.6E 15 97062012 11.9N 140.4E 15 97062018 12.1N 140.0E 15 97062100 12.2N 139.5E 25 97062106 12.3N 138.7E 25 97062112 12.5N 137.7E 20 97062118 12.8N 136.4E 20 97062200 13.0N 135.0E 20 97062206 13.2N 133.8E 25 97062212 13.3N 132.8E 30 97062218 13.4N 131.9E 30 97062300 13.5N 131.1E 30 97062306 1 13.6N 130.4E 30 31 129 161 190 248 314 -5 -10 -5 -5 -10 -20 97062312 2 13.8N 129.7E 35 34 34 105 200 258 332 -10 -5 0 10 10 0 97062318 3 14.0N 129.0E 35 11 45 108 143 169 243 0 5 10 5 5 0 97062400 4 14.2N 128.2E 35 37 104 174 164 160 262 0 0 5 0 -5 -5 97062406 5 14.8N 127.7E 35 50 119 148 152 174 343 0 0 -5 -5 -15 -5 97062412 6 15.7N 127.3E 35 84 159 188 219 289 528 0 0 -5 -10 -15 -5 97062418 7 16.7N 127.0E 35 96 126 135 162 205 362 0 -10 -10 -20 -15 0 97062500 8 17.6N 127.0E 35 96 69 62 92 145 329 0 -5 -10 -15 -10 5 97062506 9 18.4N 127.0E 45 30 76 94 94 128 139 0 0 -10 -5 -5 5 97062512 10 19.1N 126.9E 45 13 24 16 81 160 368 0 -5 -10 -5 -5 10 97062518 11 20.0N 126.8E 50 6 23 78 157 222 373 0 -10 -5 0 10 25 97062600 12 20.9N 126.7E 55 5 30 72 102 70 294 0 0 5 10 5 0 97062606 13 22.1N 126.6E 65 12 49 103 121 104 457 0 10 20 35 20 -5 97062612 14 23.5N 126.5E 65 0 21 52 66 133 518 0 10 20 40 25 -10 97062618 15 24.9N 126.3E 65 13 60 109 144 336 633 0 10 25 30 25 -15 97062700 16 26.5N 126.3E 65 17 72 83 253 492 708 0 0 5 0 -5 -35 97062706 17 28.3N 126.4E 65 6 37 34 160 400 376 -5 0 -5 0 -15 -35 97062712 18 30.0N 127.0E 65 26 19 127 333 512 270 -5 5 0 -5 -20 -35 97062718 19 31.6N 128.0E 60 7 30 184 399 414 138 0 0 0 -15 -25 -30 97062800 20 32.8N 129.7E 55 0 119 305 468 374 213 0 0 -10 -20 -35 -25 97062806 21 33.9N 132.5E 50 11 153 346 359 246 0 5 -15 -25 -35 97062812 22 35.6N 136.4E 45 0 77 181 206 296 311 0 -5 -20 -35 -35 -5 97062818 23 37.6N 140.3E 40 0 125 96 13 0 -10 -25 -35 97062900 24 39.9N 144.0E 45 9 60 129 325 -5 -20 -35 -35 97062906 42.5N 148.3E 50

171
TYPHOON PETER (09W) (CONTINUED)
97062912 44.2N 151.8E 55 97062918 44.9N 154.2E 60 97063000 45.2N 155.9E 70 97063006 45.4N 157.2E 70 97063012 45.6N 158.5E 70 97063018 45.8N 159.7E 65 97070100 46.0N 160.8E 60 97070106 46.2N 161.7E 55 97070112 46.5N 162.6E 50 97070118 46.8N 163.6E 45 97070200 47.1N 164.5E 40 97070206 47.3N 165.5E 40 97070212 47.6N 166.7E 35 97070218 47.9N 167.9E 35 97070300 48.3N 169.9E 30 97070306 48.6N 172.6E 30 97070312 48.9N 176.0E 30 97070318 49.2N 179.8E 30 97070400 49.3N 176.0W 30
AVERAGE 25 74 129 192 252 358 1 5 11 15 16 13 # CASES 24 24 24 24 22 21 24 24 24 24 22 21
SUPER TYPHOON ROSIE (10W)
WRN BEST TRACK POSITION ERRORS WIND ERRORS DTG NO. LAT LONG WIND 00 12 24 36 48 72 00 12 24 36 48 72 97071500 7.9N 142.4E 15 97071506 8.0N 142.1E 15 97071512 8.1N 141.8E 15 97071518 8.2N 141.5E 15 97071600 8.2N 141.2E 15 97071606 8.2N 140.9E 15 97071612 8.2N 140.6E 15 97071618 8.2N 140.3E 15 97071700 8.2N 140.0E 15 97071706 8.3N 139.7E 15 97071712 8.5N 139.4E 15 97071718 8.8N 139.0E 15 97071800 9.1N 138.5E 15 97071806 9.7N 138.1E 20 97071812 10.3N 137.8E 25 97071818 1 10.9N 137.8E 25 67 144 187 192 225 317 0 0 0 -5 -15 -40 97071900 2 11.5N 138.0E 30 42 72 96 133 166 276 0 0 -5 -10 -25 -50 97071906 3 12.1N 138.3E 30 8 53 123 159 176 225 0 0 -5 -15 -30 -60 97071912 4 12.8N 138.3E 30 29 111 191 227 250 220 0 -5 -10 -20 -30 -75 97071918 5 13.4N 137.8E 35 37 90 123 135 144 111 0 -5 -15 -30 -35 -75 97072000 6 13.7N 137.0E 40 52 98 121 139 143 91 -5 -10 -15 -20 -25 -35 97072006 7 14.1N 136.3E 45 33 91 141 186 236 250 0 -10 -15 -15 -25 -20 97072012 8 14.5N 135.6E 55 5 30 45 66 68 91 0 -5 -10 -10 -40 -20 97072018 9 15.0N 135.1E 60 18 56 71 104 125 139 0 -15 -15 -25 -40 -15 97072100 10 15.5N 134.6E 70 25 44 91 128 158 171 5 5 0 -25 -15 10 97072106 11 16.0N 134.1E 80 8 0 45 86 112 90 0 0 -15 -25 -10 20 97072112 12 16.5N 133.6E 85 8 25 57 99 130 116 -5 -10 -40 -20 -10 30 97072118 13 17.0N 133.1E 90 13 58 117 169 185 176 0 -15 -35 -15 -5 30 97072200 14 17.4N 132.6E 100 12 55 90 126 158 200 0 -30 -15 0 15 30 97072206 15 17.7N 132.2E 115 8 21 54 86 120 189 0 -10 0 0 15 30 97072212 16 18.2N 132.0E 140 0 13 34 73 114 215 0 0 -5 5 20 30 97072218 17 18.7N 131.9E 140 12 32 54 82 125 227 0 0 -5 10 20 20 97072300 18 19.3N 131.8E 135 12 6 16 37 78 166 0 0 5 20 20 15 97072306 19 19.9N 131.9E 130 0 16 28 57 101 139 0 -5 5 10 10 0 97072312 20 20.7N 132.1E 130 11 24 36 67 127 116 0 5 15 10 10 -5 97072318 21 21.5N 132.3E 125 8 16 37 82 118 38 0 10 15 10 10 0 97072400 22 22.4N 132.5E 115 11 5 39 96 129 60 0 10 5 5 0 -5 97072406 23 23.4N 132.8E 105 0 8 28 57 95 274 0 5 0 0 -5 0 97072412 24 24.6N 133.2E 95 8 12 5 28 74 307 0 -5 -5 -10 -15 -5 97072418 25 25.9N 133.6E 90 0 18 31 51 141 248 0 0 0 -5 -10 0 97072500 26 27.1N 134.0E 90 18 15 39 68 192 285 0 5 0 0 0 5

172
SUPER TYPHOON ROSIE (10W) (CONTINUED)
97072506 27 28.3N 134.5E 85 16 5 4 86 146 285 0 5 5 0 5 5 97072512 28 29.5N 134.8E 80 5 16 64 118 109 246 0 0 0 5 0 10 97072518 29 30.7N 135.0E 75 7 31 86 116 161 486 0 0 5 10 5 10 97072600 30 31.9N 135.0E 75 6 64 116 155 271 660 0 0 5 5 5 10 97072606 31 33.3N 134.7E 70 7 99 125 222 367 829 0 0 5 5 5 10 97072612 32 34.8N 134.2E 65 20 101 220 285 412 0 10 5 10 10 97072618 33 35.7N 133.0E 55 18 91 102 174 283 0 10 10 10 10 97072700 34 36.0N 132.3E 45 26 117 164 248 318 0 0 10 10 10 97072706 35 35.8N 132.5E 40 5 53 151 249 306 0 0 5 10 5 97072712 36 35.9N 132.9E 40 15 51 110 187 0 5 10 10 97072718 37 36.2N 133.7E 35 5 75 179 294 0 0 0 -5 97072800 38 36.3N 134.6E 30 34 125 214 0 0 0 97072806 35.9N 135.5E 30 97072812 35.5N 136.4E 25 97072818 35.0N 137.2E 25 97072900 34.4N 137.5E 25 97072906 33.8N 137.6E 25
AVERAGE 16 51 91 132 174 234 0 5 8 11 15 22 # CASES 38 38 38 37 35 31 38 38 38 37 35 31
TROPICAL STORM SCOTT (11W)
WRN BEST TRACK POSITION ERRORS WIND ERRORS DTG NO. LAT LONG WIND 00 12 24 36 48 72 00 12 24 36 48 72 97072012 23.5N 149.9E 20 97072018 23.7N 149.4E 20 97072100 24.0N 149.1E 20 97072106 24.2N 148.8E 20 97072112 24.4N 148.6E 20 97072118 24.7N 148.3E 20 97072200 25.2N 148.0E 20 97072206 25.8N 147.8E 20 97072212 26.3N 148.1E 20 97072218 26.8N 148.6E 20 97072300 27.5N 149.3E 20 97072306 28.4N 149.9E 20 97072312 29.3N 150.4E 20 97072318 30.2N 150.9E 20 97072400 30.9N 151.3E 25 97072406 1 31.5N 151.3E 30 10 42 78 204 0 0 0 -5 97072412 31.7N 151.1E 30 97072418 2 31.9N 150.8E 30 10 94 214 442 0 0 -5 -5 97072500 31.7N 151.4E 30 97072506 3 31.3N 151.6E 30 41 28 170 0 -5 -10 97072512 30.7N 151.6E 30 97072518 29.9N 152.0E 30 97072600 28.5N 152.6E 30 97072606 26.9N 153.3E 30 97072612 25.3N 153.8E 30 97072618 23.6N 154.3E 30 97072700 4 22.7N 154.9E 30 26 126 180 168 150 152 -5 0 10 20 20 30 97072706 5 22.0N 155.7E 35 26 71 73 69 75 136 0 20 35 40 30 45 97072712 6 23.0N 156.6E 35 16 154 233 192 209 164 0 5 15 15 15 25 97072718 7 23.8N 156.1E 35 21 101 111 86 123 308 0 10 15 5 15 25 97072800 8 24.0N 155.1E 35 22 92 102 152 191 405 0 5 0 -5 5 5 97072806 9 24.0N 154.7E 35 10 106 270 388 524 964 0 0 -10 -10 0 5 97072812 10 23.9N 154.2E 35 8 97 168 272 423 827 0 -5 -10 0 0 5 97072818 11 24.3N 154.5E 40 21 124 185 306 503 957 0 -10 -10 0 0 0 97072900 12 24.9N 155.5E 45 8 89 198 360 578 1024 0 -5 10 15 20 15 97072906 13 25.4N 155.8E 55 24 60 168 355 562 970 0 10 20 20 25 15 97072912 14 25.6N 156.0E 55 13 46 184 394 592 1039 0 20 20 20 25 15 97072918 15 26.2N 156.2E 55 11 40 190 369 538 928 0 20 25 25 25 20 97073000 16 26.7N 156.4E 45 0 55 165 237 302 439 0 -5 0 0 -5 -5 97073006 17 27.4N 156.9E 45 31 39 30 36 110 174 0 0 5 0 -5 -5 97073012 18 28.4N 157.7E 45 15 31 61 120 151 264 0 0 5 -5 -5 -5 97073018 19 29.4N 159.0E 40 59 79 122 211 206 333 0 0 0 -10 -10 -15 97073100 20 30.2N 160.3E 40 33 84 188 261 203 0 0 -5 -10 -5 97073106 21 30.8N 161.7E 35 31 88 190 194 121 0 0 -10 -5 -5

173
TROPICAL STORM SCOTT (11W) (CONTINUED)
97073112 22 31.1N 163.1E 35 11 96 150 123 116 0 -5 -10 -5 -5 97073118 23 31.2N 164.5E 35 20 70 73 46 226 -5 -10 -5 -5 -5 97080100 24 31.3N 166.1E 40 20 96 157 226 -10 -10 -5 -5 97080106 25 31.6N 168.1E 40 21 36 114 241 0 5 5 5 97080112 26 32.3N 169.9E 40 0 15 52 0 5 0 97080118 27 33.4N 170.9E 35 0 54 194 0 0 0 97080200 28 35.1N 172.1E 35 0 91 0 0 97080206 29 36.7N 172.8E 35 0 106 0 0 97080212 30 38.1N 174.6E 35 0 0 97080218 40.4N 177.7E 35
AVERAGE 17 77 149 228 296 568 1 5 9 10 11 15 # CASES 30 29 27 24 20 16 30 29 27 24 20 16
TYPHOON TINA (12W)
WRN BEST TRACK POSITION ERRORS WIND ERRORS DTG NO. LAT LONG WIND 00 12 24 36 48 72 00 12 24 36 48 72 97072100 4.3N 152.3E 15 97072106 4.9N 151.5E 15 97072112 5.4N 150.8E 15 97072118 5.9N 150.0E 15 97072200 6.4N 149.2E 15 97072206 6.7N 148.8E 15 97072212 6.9N 148.4E 15 97072218 7.0N 148.0E 15 97072300 7.0N 147.6E 20 97072306 7.0N 147.1E 20 97072312 7.2N 146.4E 20 97072318 7.5N 145.6E 20 97072400 8.0N 144.9E 20 97072406 8.5N 144.1E 20 97072412 9.0N 143.5E 20 97072418 9.4N 143.0E 20 97072500 10.1N 142.8E 20 97072506 10.8N 142.7E 20 97072512 11.5N 142.7E 20 97072518 12.2N 142.8E 20 97072600 12.8N 142.6E 15 97072606 12.9N 142.4E 15 97072612 12.9N 141.9E 15 97072618 12.8N 141.3E 15 97072700 12.6N 140.7E 15 97072706 12.5N 140.0E 15 97072712 12.4N 139.0E 15 97072718 12.4N 137.9E 15 97072800 12.6N 136.8E 15 97072806 13.2N 136.0E 15 97072812 14.0N 135.7E 25 97072818 14.8N 135.6E 25 97072900 15.4N 135.4E 25 97072906 15.6N 135.2E 25 97072912 15.5N 134.8E 25 97072918 1 15.4N 134.2E 25 8 71 204 292 371 437 0 -5 -5 0 -5 -10 97073000 2 15.2N 133.9E 25 42 125 226 278 314 309 0 -5 -5 0 -10 -10 97073006 3 14.8N 133.9E 30 68 167 236 294 330 401 0 0 5 10 10 10 97073012 4 14.3N 134.3E 30 35 36 51 76 113 233 0 0 5 5 5 10 97073018 5 13.9N 134.7E 35 34 56 85 126 178 315 0 5 5 5 0 10 97073100 6 13.6N 135.0E 35 8 6 42 113 187 331 0 0 -5 -5 -10 -10 97073106 7 13.5N 135.1E 35 18 55 111 158 201 265 0 0 0 -5 -5 -5 97073112 8 13.4N 135.2E 35 8 63 119 147 159 193 0 -5 -5 -5 -5 -10 97073118 9 13.2N 135.2E 40 11 76 138 164 193 235 0 0 -5 0 0 -20 97080100 10 13.1N 135.0E 45 17 76 116 154 183 208 0 5 5 10 5 -5 97080106 11 13.2N 134.7E 45 13 37 60 94 110 198 0 5 10 10 10 0 97080112 12 13.3N 134.3E 50 41 80 96 91 67 58 -5 0 10 10 15 10 97080118 13 13.4N 134.0E 55 67 75 79 62 35 73 0 5 10 10 10 0 97080200 14 13.6N 133.6E 55 5 16 44 63 103 138 0 5 5 5 5 -5 97080206 15 13.8N 133.2E 55 0 29 35 42 80 196 0 5 5 -5 -5 -15 97080212 16 14.0N 132.7E 55 13 16 26 67 114 189 0 0 0 -10 -5 -15

174
TYPHOON TINA (12W) (CONTINUED)
97080218 17 14.2N 132.1E 55 29 84 128 171 199 227 0 -5 -10 -10 -10 -15 97080300 18 14.6N 131.5E 60 8 32 48 41 45 67 0 5 5 15 5 0 97080306 19 15.1N 130.9E 60 0 12 12 46 76 89 0 0 5 10 0 0 97080312 20 15.8N 130.3E 65 13 18 21 28 55 60 0 0 15 15 20 25 97080318 21 16.5N 129.7E 70 25 64 66 61 78 93 -5 0 10 10 20 25 97080400 22 17.3N 129.0E 75 33 56 73 95 100 91 0 5 10 15 20 30 97080406 23 18.0N 128.4E 75 21 56 84 119 125 182 0 0 5 15 20 30 97080412 24 18.7N 127.8E 75 21 41 16 42 96 213 0 -10 -10 0 5 5 97080418 25 19.4N 127.3E 80 8 12 45 68 125 258 -5 -15 -10 0 5 10 97080500 26 20.1N 127.0E 85 11 11 17 17 31 71 -5 0 0 10 15 25 97080506 27 20.9N 126.7E 90 12 49 60 84 99 122 0 10 20 25 20 30 97080512 28 21.6N 126.5E 90 8 25 20 18 21 23 5 10 25 30 25 35 97080518 29 22.3N 126.4E 90 20 52 50 72 91 246 0 -5 0 0 5 25 97080600 30 23.2N 126.4E 90 11 12 5 5 7 235 0 0 5 5 10 30 97080606 31 24.1N 126.4E 90 0 11 6 5 44 398 0 0 5 10 15 30 97080612 32 24.9N 126.4E 85 0 16 19 23 69 463 0 0 5 10 15 20 97080618 33 25.7N 126.5E 85 5 0 18 11 57 264 0 0 10 15 20 5 97080700 34 26.8N 126.5E 80 0 37 72 93 66 179 0 0 5 10 10 0 97080706 35 27.5N 126.4E 80 0 18 43 38 43 0 5 10 20 10 97080712 36 28.5N 126.2E 75 0 35 65 24 126 0 5 10 10 0 97080718 37 29.2N 126.2E 70 0 39 63 50 108 0 5 20 0 -5 97080800 38 30.4N 125.9E 65 0 27 39 185 368 0 0 5 -5 -15 97080806 39 31.5N 126.0E 60 20 41 108 143 0 5 5 -5 97080812 40 32.6N 126.4E 55 20 38 150 185 0 5 0 -10 97080818 41 34.0N 127.4E 45 23 112 110 0 -5 -10 97080900 42 35.6N 128.8E 40 15 88 162 0 -5 -10 97080906 43 37.5N 131.3E 40 0 23 -5 -5 97080912 44 39.1N 134.4E 40 0 29 -5 -10 97080918 40.9N 137.5E 40 97081000 42.5N 141.6E 45
AVERAGE 16 46 76 97 126 208 1 4 7 9 10 14 # CASES 44 44 42 40 38 34 44 44 42 40 38 34
TYPHOON VICTOR (13W)
WRN BEST TRACK POSITION ERRORS WIND ERRORS DTG NO. LAT LONG WIND 00 12 24 36 48 72 00 12 24 36 48 72 97072812 15.0N 119.6E 15 97072818 15.0N 119.0E 15 97072900 15.1N 118.4E 15 97072906 15.2N 117.8E 15 97072912 15.3N 117.2E 15 97072918 15.4N 116.6E 15 97073000 15.5N 116.0E 15 97073006 15.8N 115.5E 20 97073012 16.1N 115.1E 20 97073018 1 16.4N 114.7E 25 17 28 57 62 82 112 0 -5 -10 -15 -15 -5 97073100 2 16.6N 114.2E 30 18 17 26 50 47 197 0 0 -5 0 -5 20 97073106 3 16.8N 113.8E 30 8 12 58 66 84 282 0 -5 -5 -5 -10 25 97073112 4 17.1N 113.5E 35 13 18 26 16 57 178 -5 -5 0 -5 -5 25 97073118 5 17.7N 113.5E 40 45 82 58 55 138 318 -5 -5 -5 -10 10 30 97080100 6 18.3N 113.7E 45 8 23 36 17 98 259 0 5 0 -10 5 10 97080106 7 18.9N 113.9E 45 21 49 41 36 126 0 0 -5 0 5 97080112 8 19.4N 114.0E 45 12 36 16 90 174 0 -5 -10 10 5 97080118 9 19.8N 114.0E 50 0 11 66 132 186 -5 -10 5 10 10 97080200 10 20.3N 114.0E 55 0 42 114 186 199 -10 -15 15 10 15 97080206 11 21.1N 114.0E 60 0 50 112 150 -5 5 15 15 97080212 12 22.3N 114.1E 65 0 52 109 158 -10 10 10 15 97080218 13 23.6N 113.8E 50 0 53 115 0 10 10 97080300 14 24.9N 113.8E 35 0 5 70 0 5 10 97080306 15 26.3N 113.7E 30 13 50 0 5 97080312 27.6N 113.9E 25 97080318 28.8N 114.3E 20

175
TYPHOON VICTOR (13W) (CONTINUED)
97080400 30.0N 114.8E 15
AVERAGE 11 36 65 85 120 225 3 6 8 9 9 19 # CASES 15 15 14 12 10 6 15 15 14 12 10 6
SUPER TYPHOON WINNIE (14W)
WRN BEST TRACK POSITION ERRORS WIND ERRORS DTG NO. LAT LONG WIND 00 12 24 36 48 72 00 12 24 36 48 72 97080500 5.6N 168.0E 15 97080506 5.7N 167.7E 15 97080512 5.8N 167.4E 15 97080518 5.9N 167.1E 15 97080600 6.1N 166.7E 20 97080606 6.3N 166.2E 20 97080612 6.5N 165.4E 20 97080618 6.8N 164.4E 20 97080700 7.2N 163.0E 20 97080706 7.8N 161.7E 20 97080712 8.7N 160.6E 20 97080718 9.5N 159.7E 20 97080800 10.3N 158.8E 25 97080806 1 11.3N 158.1E 25 29 67 106 122 142 138 0 0 0 -10 -20 -30 97080812 2 12.2N 157.3E 30 37 61 94 151 173 273 0 5 0 -10 -20 -25 97080818 3 13.0N 156.5E 30 36 54 87 137 167 305 0 0 -10 -20 -30 -35 97080900 4 13.7N 155.8E 30 49 77 130 140 183 302 0 -10 -20 -30 -35 -50 97080906 5 14.4N 155.2E 35 0 26 72 136 180 236 0 -20 -30 -40 -40 -50 97080912 6 14.8N 154.6E 45 18 60 96 151 198 233 -5 -20 -30 -35 -40 -40 97080918 7 15.1N 154.1E 55 18 42 95 132 163 139 -5 -20 -35 -35 -40 -35 97081000 8 15.4N 153.6E 65 5 29 59 82 106 99 -5 -15 -20 -30 -40 -30 97081006 9 15.8N 152.8E 75 5 30 78 114 109 70 -5 -20 -20 -35 -40 -25 97081012 10 16.0N 151.8E 85 8 48 72 84 79 12 -5 -15 -25 -45 -35 -15 97081018 11 16.1N 150.8E 95 0 25 49 37 24 54 -10 -15 -30 -40 -30 -5 97081100 12 16.2N 150.1E 100 5 57 110 125 162 244 -5 -10 -25 -15 -10 25 97081106 13 16.4N 149.4E 105 13 44 77 101 154 201 -10 -20 -25 -15 -5 15 97081112 14 16.6N 148.7E 115 12 30 48 80 123 152 -15 -35 -25 -15 -5 20 97081118 15 16.8N 148.0E 125 0 41 57 72 86 99 -15 -25 -20 -10 0 25 97081200 16 17.2N 147.1E 140 16 49 72 101 102 77 -10 0 0 5 25 25 97081206 17 17.6N 146.0E 140 0 5 41 56 85 120 0 0 0 0 10 25 97081212 18 18.0N 144.9E 140 0 18 41 55 73 88 0 0 0 15 15 30 97081218 19 18.4N 143.9E 140 8 45 57 83 96 109 0 0 0 10 15 25 97081300 20 18.9N 143.1E 140 8 37 46 65 66 123 0 -5 10 10 10 25 97081306 21 19.5N 142.2E 135 8 29 61 77 118 225 0 0 10 15 20 25 97081312 22 20.1N 141.3E 135 5 21 40 63 102 198 0 15 15 15 25 30 97081318 23 20.5N 140.3E 130 0 17 12 34 71 168 0 10 15 20 20 25 97081400 24 21.0N 139.5E 115 8 30 53 50 65 124 0 0 -5 5 5 10 97081406 25 21.5N 138.7E 115 6 36 51 66 100 153 0 5 5 5 5 10 97081412 26 22.0N 137.7E 110 11 28 45 77 121 214 0 0 5 10 10 10 97081418 27 22.5N 136.7E 105 12 42 65 105 147 207 0 5 5 5 5 0 97081500 28 22.8N 135.7E 105 0 13 28 69 100 171 0 15 15 20 20 15 97081506 29 23.0N 134.8E 95 0 0 28 60 94 151 0 0 0 0 5 5 97081512 30 23.3N 134.0E 90 5 17 29 50 82 175 0 5 5 5 5 -5 97081518 31 23.6N 133.1E 90 0 16 40 60 97 239 0 0 5 5 5 5 97081600 32 23.8N 132.1E 85 0 29 42 66 91 218 0 5 10 5 5 15 97081606 33 24.0N 131.1E 85 0 24 52 75 117 254 0 5 10 5 5 25 97081612 34 24.1N 130.2E 80 5 6 8 30 73 206 0 5 0 -5 -10 15 97081618 35 24.3N 129.2E 80 0 28 36 73 112 290 0 0 0 -5 0 20 97081700 36 24.7N 128.2E 75 8 6 30 78 132 379 0 -5 -10 -15 -5 5 97081706 37 25.1N 127.0E 75 11 34 22 36 98 312 0 0 -5 -10 -10 0 97081712 38 25.4N 126.0E 75 0 20 55 111 161 533 0 0 -5 0 0 0 97081718 39 25.9N 124.9E 75 0 30 67 114 197 552 0 0 5 10 5 0 97081800 40 26.6N 124.0E 75 0 24 55 72 166 417 0 0 0 0 0 -5 97081806 41 27.4N 122.7E 75 16 30 38 89 124 0 0 0 0 -10 97081812 42 28.2N 121.4E 75 15 36 31 104 198 0 5 10 0 -10 97081818 43 29.1N 120.2E 65 24 42 13 95 193 0 15 15 0 -5 97081900 44 30.1N 119.0E 55 16 65 195 318 0 0 -5 -10 97081906 31.2N 118.3E 45 97081912 32.1N 117.8E 35

176
SUPER TYPHOON WINNIE (14W) (CONTINUED)
97081918 33.7N 117.8E 30 97082000 35.4N 117.8E 30 97082006 37.0N 118.4E 30 97082012 38.4N 119.4E 30 97082018 39.5N 120.9E 30 97082100 40.7N 122.5E 30 97082106 41.8N 124.6E 30 97082112 42.9N 126.7E 30 97082118 44.1N 128.8E 30 97082200 45.1N 130.7E 25 97082206 45.7N 131.8E 25 97082212 46.2N 133.1E 25 97082218 46.7N 134.3E 25 97082300 47.2N 135.5E 20
AVERAGE 10 34 59 91 122 207 2 8 11 14 15 20 # CASES 44 44 44 44 43 40 44 44 44 44 43 40
TYPHOON YULE (15W)
WRN BEST TRACK POSITION ERRORS WIND ERRORS
DTG NO. LAT LONG WIND 00 12 24 36 48 72 00 12 24 36 48 72
97080906 3.1N 179.0E 20 97080912 3.1N 178.0E 20 97080918 3.4N 177.1E 20 97081000 4.0N 176.0E 20 97081006 4.9N 175.2E 20 97081012 5.2N 174.1E 20 97081018 5.9N 173.0E 20 97081100 6.8N 172.0E 20 97081106 7.5N 171.1E 20 97081112 7.4N 170.7E 20 97081118 7.2N 170.4E 20 97081200 7.0N 170.0E 20 97081206 8.1N 169.5E 20 97081212 8.7N 169.7E 20 97081218 8.3N 170.4E 20 97081300 7.9N 170.9E 20 97081306 7.6N 171.4E 20 97081312 7.0N 171.1E 20 97081318 6.7N 170.4E 20 97081400 6.6N 169.0E 20 97081406 7.4N 168.0E 20 97081412 7.5N 166.9E 20 97081418 7.2N 165.7E 20 97081500 6.8N 164.1E 25 97081506 7.1N 163.3E 25 97081512 7.7N 163.3E 25 97081518 8.0N 163.6E 25 97081600 8.3N 163.9E 25 97081606 8.5N 164.0E 25 97081612 8.8N 164.1E 25 97081618 1 9.7N 164.6E 30 46 176 304 442 540 659 0 -5 0 5 10 5 97081700 2 10.6N 165.1E 30 11 41 124 209 191 291 0 -5 0 10 10 0 97081706 3 11.2N 165.8E 35 26 101 175 223 213 396 0 5 10 15 15 5 97081712 4 11.8N 166.3E 35 56 113 177 137 159 367 0 5 15 15 10 5 97081718 5 12.3N 167.0E 35 23 76 109 92 159 298 0 5 10 10 5 5 97081800 6 13.0N 167.6E 35 48 125 192 234 213 296 0 5 0 -10 -15 -10 97081806 7 13.8N 168.0E 35 30 23 46 54 127 373 0 0 -5 -5 0 10 97081812 8 14.5N 168.6E 30 53 143 210 207 133 290 5 0 -10 -10 0 10 97081818 9 15.7N 168.1E 35 54 137 136 116 103 306 0 -5 -15 -10 0 10 97081900 10 16.3N 167.3E 35 63 95 77 66 116 398 0 -10 -15 -10 0 10 97081906 11 17.1N 166.9E 40 47 26 37 80 140 476 0 -5 -5 0 5 15

177
TYPHOON YULE (15W) (CONTINUED)
97081912 12 17.9N 166.8E 45 29 33 87 123 177 507 -5 -10 -5 0 5 15 97081918 13 18.5N 167.2E 50 13 71 134 153 189 457 -5 -5 0 5 10 20 97082000 14 19.1N 167.2E 55 12 34 58 97 181 499 -5 0 5 10 15 15 97082006 15 19.7N 167.5E 55 16 63 77 120 238 534 0 5 10 15 15 5 97082012 16 20.2N 167.7E 55 30 61 97 188 361 675 0 5 10 15 15 0 97082018 17 20.8N 168.0E 55 39 73 110 283 471 704 0 5 10 15 15 0 97082100 18 21.9N 168.0E 55 20 95 116 128 134 324 0 5 5 0 -10 -30 97082106 19 23.0N 168.2E 55 11 64 132 223 364 326 0 0 0 -5 -15 -30 97082112 20 24.0N 168.6E 55 6 32 118 222 349 0 0 0 -5 -25 97082118 21 25.0N 169.0E 55 0 73 114 236 320 0 0 0 -10 -25 97082200 22 27.3N 169.9E 55 0 35 136 297 377 0 0 0 -15 -25 97082206 23 29.5N 170.9E 55 12 73 143 139 -10 -15 -25 -30 97082212 24 32.1N 171.8E 55 36 159 343 -10 -15 -30 97082218 25 35.2N 171.8E 55 58 270 464 -5 -20 -30 97082300 26 38.7N 171.1E 55 68 304 -5 -30 97082306 27 41.9N 169.0E 60 50 105 251 475 0 10 15 10 97082312 44.3N 167.1E 65 97082318 45.7N 166.0E 65 97082400 47.0N 165.0E 65 97082406 48.3N 163.9E 65 97082412 48.7N 163.4E 65 97082418 49.2N 163.0E 65 97082500 49.6N 163.1E 65 97082506 49.7N 163.6E 65 97082512 49.6N 164.8E 65 97082518 50.4N 166.2E 65 97082600 51.1N 167.3E 60 97082606 51.2N 168.8E 50 97082612 51.3N 170.5E 45 97082618 51.3N 172.4E 40 97082700 52.0N 174.1E 35
AVERAGE 32 97 153 190 239 431 2 6 9 10 11 11 # CASES 27 27 26 24 22 19 27 27 26 24 22 19
TROPICAL DEPRESSION (16W)
WRN BEST TRACK POSITION ERRORS WIND ERRORS DTG NO. LAT LONG WIND 00 12 24 36 48 72 00 12 24 36 48 72 97081300 9.3N 174.3W 15 97081306 9.6N 174.8W 15 97081312 9.9N 175.3W 15 97081318 10.1N 175.7W 15 97081400 10.2N 176.2W 15 97081406 10.4N 176.7W 15 97081412 10.7N 177.4W 15 97081418 11.0N 178.1W 15 97081500 11.3N 178.8W 15 97081506 11.6N 179.3W 15 97081512 12.0N 180.0W 15 97081518 12.4N 179.3E 15 97081600 12.7N 178.8E 15 97081606 13.1N 178.3E 15 97081612 13.6N 177.6E 15 97081618 14.3N 176.8E 15 97081700 14.8N 175.7E 20 97081706 15.4N 174.3E 20 97081712 16.1N 172.9E 25 97081718 16.7N 171.7E 30 97081800 1 17.2N 170.4E 30 71 46 45 -5 -5 0 97081806 2 17.3N 169.2E 30 56 103 -5 0 97081812 3 17.2N 168.3E 30 62 118 -5 0 97081818 4 16.8N 167.6E 25 24 0 97081900 5 16.3N 167.3E 25 0 0

178
TROPICAL DEPRESSION (16W) (CONTINUED)
AVERAGE 43 90 45 3 2 0 # CASES 5 3 1 5 3 1
TYPHOON ZITA (17W)
WRN BEST TRACK POSITION ERRORS WIND ERRORS DTG NO. LAT LONG WIND 00 12 24 36 48 72 00 12 24 36 48 72 97081912 16.9N 115.0E 25 97081918 17.5N 115.5E 25 97082000 18.1N 116.4E 30 0 -10 97082006 18.7N 117.3E 30 18 -5 97082012 19.1N 117.2E 35 49 -10 97082018 19.6N 116.7E 35 17 -15 97082100 1 20.0N 115.5E 40 34 100 137 213 274 -5 -10 -20 -20 -35 97082106 2 20.1N 114.3E 45 0 17 16 27 53 -5 0 -10 0 10 97082112 3 20.1N 113.2E 50 13 33 30 53 96 -5 -10 -10 0 35 97082118 4 20.1N 112.3E 55 0 63 111 153 246 0 -10 -10 15 55 97082200 5 20.5N 111.4E 65 12 49 50 101 0 -10 0 25 97082206 6 21.0N 110.1E 75 16 62 105 116 0 0 10 25 97082212 7 21.3N 108.8E 75 6 68 49 0 -15 15 97082218 8 21.3N 107.8E 75 11 38 107 -15 -10 5 97082300 9 21.2N 106.8E 75 8 63 -20 10 97082306 10 21.2N 105.6E 55 12 121 -15 97082312 22.0N 104.4E 30 97082318 22.8N 102.9E 25
AVERAGE 14 62 76 111 168 8 8 10 14 34 # CASES 14 10 8 6 4 14 10 8 6 4
TYPHOON AMBER (18W)
WRN BEST TRACK POSITION ERRORS WIND ERRORS DTG NO. LAT LONG WIND 00 12 24 36 48 72 00 12 24 36 48 72 97081912 14.0N 136.0E 25 97081918 14.0N 135.5E 25 97082000 14.0N 135.0E 25 97082006 14.0N 134.5E 25 97082012 14.1N 134.0E 25 97082018 14.2N 133.6E 25 97082100 14.3N 133.2E 25 97082106 1 14.5N 133.0E 30 118 100 96 124 151 175 -5 -15 -30 -35 -35 -40 97082112 2 14.6N 132.7E 35 18 39 46 55 66 72 -5 -20 -30 -30 -35 -45 97082118 3 14.6N 132.4E 40 17 23 29 39 37 53 -5 -25 -30 -30 -30 -45 97082200 4 14.7N 132.0E 50 18 48 84 104 117 147 5 0 10 10 15 5 97082206 5 15.0N 131.7E 60 13 48 78 84 92 53 -5 0 5 10 15 10 97082212 6 15.3N 131.5E 65 18 49 54 45 37 51 0 5 0 5 10 0 97082218 7 15.7N 131.3E 65 25 45 45 31 31 54 0 0 0 0 5 10 97082300 8 16.0N 131.1E 65 31 40 41 54 67 84 0 -5 -5 -5 0 25 97082306 9 16.3N 130.8E 70 17 26 49 78 96 138 0 0 -5 -10 -5 25 97082312 10 16.5N 130.6E 75 16 23 58 93 117 157 0 0 -5 -10 -5 20 97082318 11 16.7N 130.4E 75 8 21 56 87 121 150 0 -5 -10 -10 5 15 97082400 12 16.9N 130.1E 80 11 12 24 39 66 114 0 -5 -10 -5 15 20 97082406 13 17.1N 129.7E 85 8 33 47 66 84 72 0 -5 -5 10 20 15 97082412 14 17.2N 129.3E 90 0 6 24 58 77 102 0 -5 0 20 20 15 97082418 15 17.3N 128.9E 95 8 21 62 90 95 88 0 0 15 25 20 15 97082500 16 17.4N 128.5E 100 0 8 33 53 61 29 0 5 25 25 20 15 97082506 17 17.6N 128.2E 100 8 23 51 54 56 29 0 15 25 15 10 10 97082512 18 17.7N 127.9E 100 5 29 49 43 25 50 0 20 20 10 5 15 97082518 19 17.8N 127.7E 90 17 47 57 51 33 91 10 20 15 5 -5 10 97082600 20 17.9N 127.5E 85 0 18 41 41 42 162 15 10 0 -15 -10 0 97082606 21 18.1N 127.3E 85 5 18 28 17 39 172 15 5 -5 -15 -5 10 97082612 22 18.4N 127.0E 90 11 18 18 50 85 210 10 15 15 5 15 15 97082618 23 18.8N 126.6E 95 13 17 34 64 121 217 5 10 15 10 15 30 97082700 24 19.1N 126.2E 100 0 13 8 37 94 183 0 0 5 10 0 35 97082706 25 19.4N 125.7E 105 11 17 38 79 118 168 -5 0 10 10 5 25 97082712 26 19.7N 125.1E 110 0 17 48 102 135 174 0 15 25 15 20 15
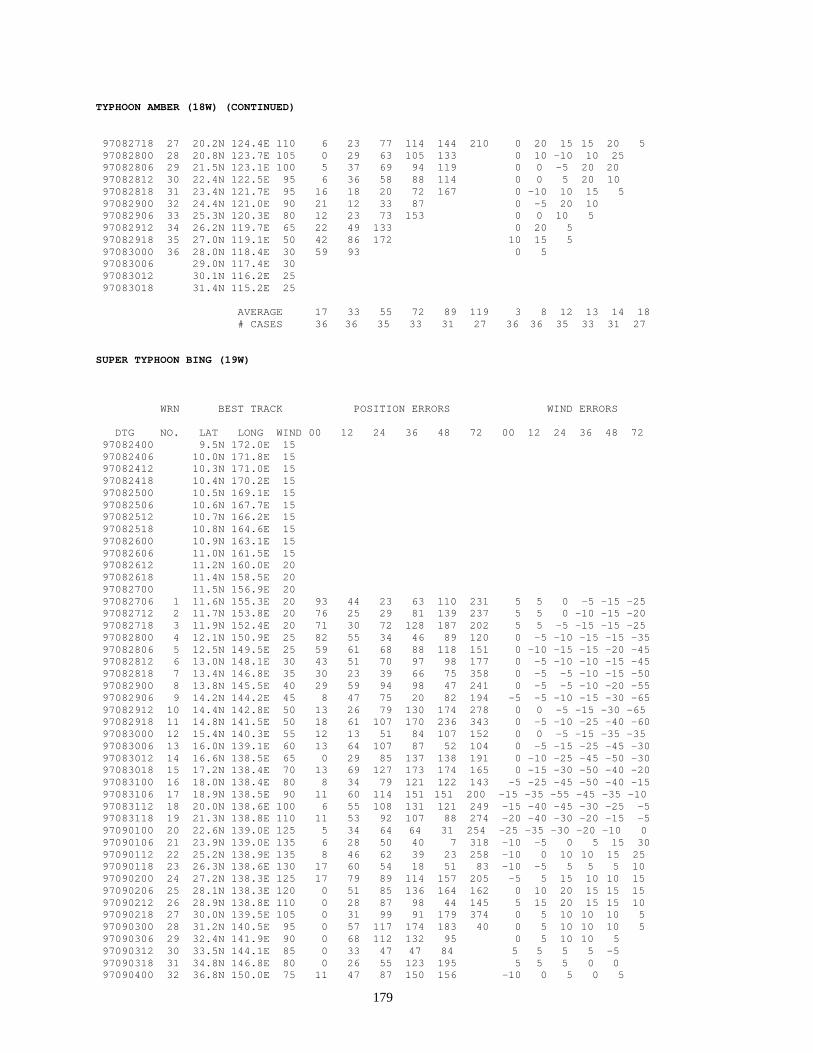
179
TYPHOON AMBER (18W) (CONTINUED)
97082718 27 20.2N 124.4E 110 6 23 77 114 144 210 0 20 15 15 20 5 97082800 28 20.8N 123.7E 105 0 29 63 105 133 0 10 -10 10 25 97082806 29 21.5N 123.1E 100 5 37 69 94 119 0 0 -5 20 20 97082812 30 22.4N 122.5E 95 6 36 58 88 114 0 0 5 20 10 97082818 31 23.4N 121.7E 95 16 18 20 72 167 0 -10 10 15 5 97082900 32 24.4N 121.0E 90 21 12 33 87 0 -5 20 10 97082906 33 25.3N 120.3E 80 12 23 73 153 0 0 10 5 97082912 34 26.2N 119.7E 65 22 49 133 0 20 5 97082918 35 27.0N 119.1E 50 42 86 172 10 15 5 97083000 36 28.0N 118.4E 30 59 93 0 5 97083006 29.0N 117.4E 30 97083012 30.1N 116.2E 25 97083018 31.4N 115.2E 25
AVERAGE 17 33 55 72 89 119 3 8 12 13 14 18 # CASES 36 36 35 33 31 27 36 36 35 33 31 27
SUPER TYPHOON BING (19W)
WRN BEST TRACK POSITION ERRORS WIND ERRORS
DTG NO. LAT LONG WIND 00 12 24 36 48 72 00 12 24 36 48 72 97082400 9.5N 172.0E 15 97082406 10.0N 171.8E 15 97082412 10.3N 171.0E 15 97082418 10.4N 170.2E 15 97082500 10.5N 169.1E 15 97082506 10.6N 167.7E 15 97082512 10.7N 166.2E 15 97082518 10.8N 164.6E 15 97082600 10.9N 163.1E 15 97082606 11.0N 161.5E 15 97082612 11.2N 160.0E 20 97082618 11.4N 158.5E 20 97082700 11.5N 156.9E 20 97082706 1 11.6N 155.3E 20 93 44 23 63 110 231 5 5 0 -5 -15 -25 97082712 2 11.7N 153.8E 20 76 25 29 81 139 237 5 5 0 -10 -15 -20 97082718 3 11.9N 152.4E 20 71 30 72 128 187 202 5 5 -5 -15 -15 -25 97082800 4 12.1N 150.9E 25 82 55 34 46 89 120 0 -5 -10 -15 -15 -35 97082806 5 12.5N 149.5E 25 59 61 68 88 118 151 0 -10 -15 -15 -20 -45 97082812 6 13.0N 148.1E 30 43 51 70 97 98 177 0 -5 -10 -10 -15 -45 97082818 7 13.4N 146.8E 35 30 23 39 66 75 358 0 -5 -5 -10 -15 -50 97082900 8 13.8N 145.5E 40 29 59 94 98 47 241 0 -5 -5 -10 -20 -55 97082906 9 14.2N 144.2E 45 8 47 75 20 82 194 -5 -5 -10 -15 -30 -65 97082912 10 14.4N 142.8E 50 13 26 79 130 174 278 0 0 -5 -15 -30 -65 97082918 11 14.8N 141.5E 50 18 61 107 170 236 343 0 -5 -10 -25 -40 -60 97083000 12 15.4N 140.3E 55 12 13 51 84 107 152 0 0 -5 -15 -35 -35 97083006 13 16.0N 139.1E 60 13 64 107 87 52 104 0 -5 -15 -25 -45 -30 97083012 14 16.6N 138.5E 65 0 29 85 137 138 191 0 -10 -25 -45 -50 -30 97083018 15 17.2N 138.4E 70 13 69 127 173 174 165 0 -15 -30 -50 -40 -20 97083100 16 18.0N 138.4E 80 8 34 79 121 122 143 -5 -25 -45 -50 -40 -15 97083106 17 18.9N 138.5E 90 11 60 114 151 151 200 -15 -35 -55 -45 -35 -10 97083112 18 20.0N 138.6E 100 6 55 108 131 121 249 -15 -40 -45 -30 -25 -5 97083118 19 21.3N 138.8E 110 11 53 92 107 88 274 -20 -40 -30 -20 -15 -5 97090100 20 22.6N 139.0E 125 5 34 64 64 31 254 -25 -35 -30 -20 -10 0 97090106 21 23.9N 139.0E 135 6 28 50 40 7 318 -10 -5 0 5 15 30 97090112 22 25.2N 138.9E 135 8 46 62 39 23 258 -10 0 10 10 15 25 97090118 23 26.3N 138.6E 130 17 60 54 18 51 83 -10 -5 5 5 5 10 97090200 24 27.2N 138.3E 125 17 79 89 114 157 205 -5 5 15 10 10 15 97090206 25 28.1N 138.3E 120 0 51 85 136 164 162 0 10 20 15 15 15 97090212 26 28.9N 138.8E 110 0 28 87 98 44 145 5 15 20 15 15 10 97090218 27 30.0N 139.5E 105 0 31 99 91 179 374 0 5 10 10 10 5 97090300 28 31.2N 140.5E 95 0 57 117 174 183 40 0 5 10 10 10 5 97090306 29 32.4N 141.9E 90 0 68 112 132 95 0 5 10 10 5 97090312 30 33.5N 144.1E 85 0 33 47 47 84 5 5 5 5 -5 97090318 31 34.8N 146.8E 80 0 26 55 123 195 5 5 5 0 0 97090400 32 36.8N 150.0E 75 11 47 87 150 156 -10 0 5 0 5
180
SUPER TYPHOON BING (19W) (CONTINUED)
97090406 33 38.8N 153.3E 70 15 21 75 121 -5 5 5 0 97090412 34 40.7N 156.8E 65 12 27 82 93 0 5 5 5 97090418 35 42.6N 160.4E 60 50 144 242 0 0 0 97090500 36 44.7N 164.3E 55 154 293 313 0 -10 -10 97090506 46.6N 168.4E 55 97090512 48.5N 172.8E 55 97090518 49.8N 177.5E 55 97090600 50.5N 178.3W 50
AVERAGE 25 54 89 101 115 209 5 10 14 16 20 27 # CASES 36 36 36 34 32 28 36 36 36 34 32 28
TROPICAL STORM CASS (20W)
WRN BEST TRACK POSITION ERRORS WIND ERRORS DTG NO. LAT LONG WIND 00 12 24 36 48 72 00 12 24 36 48 72 97082600 19.1N 112.3E 15 97082606 19.1N 112.6E 25 97082612 19.1N 112.9E 25 97082618 19.0N 113.2E 25 97082700 18.8N 113.6E 25 97082706 18.5N 114.1E 25 97082712 18.2N 114.5E 25 97082718 17.9N 114.8E 25 97082800 1 17.6N 114.9E 30 23 36 8 106 250 392 0 10 10 10 30 50 97082806 2 17.3N 115.1E 30 13 24 82 209 327 452 0 5 0 10 25 50 97082812 3 17.1N 115.5E 30 29 103 219 352 426 0 -5 -15 0 5 97082818 4 17.1N 116.0E 30 37 76 179 282 314 0 -10 -10 0 10 97082900 5 17.6N 117.0E 35 80 148 248 306 332 0 -10 0 10 20 97082906 6 18.3N 117.9E 40 69 181 294 334 391 0 5 10 25 35 97082912 7 19.9N 118.3E 45 60 169 250 306 0 10 15 25 97082918 8 21.6N 118.6E 40 121 226 270 332 5 10 20 30 97083000 9 23.1N 118.7E 35 114 128 132 10 20 15 97083006 10 24.6N 118.2E 35 0 32 88 0 5 5 97083012 11 25.5N 117.6E 30 16 72 0 0 97083018 26.2N 117.0E 25 97083100 26.9N 116.4E 25 97083106 27.8N 115.5E 20
AVERAGE 51 109 177 279 340 422 1 8 10 14 21 50 # CASES 11 11 10 8 6 2 11 11 10 8 6 2
TYPHOON DAVID (21W)
WRN BEST TRACK POSITION ERRORS WIND ERRORS DTG NO. LAT LONG WIND 00 12 24 36 48 72 00 12 24 36 48 72 97090900 9.9N 171.1E 15 97090906 10.0N 170.5E 15 97090912 10.1N 169.9E 20 97090918 10.1N 169.3E 20 97091000 10.1N 168.7E 20 97091006 10.4N 168.4E 25 97091012 10.5N 168.8E 25 97091018 10.4N 169.3E 25 97091100 10.8N 169.8E 25 97091106 11.2N 170.2E 25 97091112 11.8N 170.4E 25 97091118 1 12.3N 170.1E 25 50 88 133 144 154 313 0 -10 -20 -25 -30 -50 97091200 2 12.9N 169.7E 30 77 147 175 183 225 370 -5 -5 -10 -15 -25 -45 97091206 3 13.4N 168.9E 35 30 64 51 72 111 256 -5 -10 -15 -20 -30 -45 97091212 4 14.0N 168.0E 40 13 29 34 38 94 197 -10 -15 -20 -25 -35 -35 97091218 5 14.5N 167.2E 45 13 30 33 51 101 152 -5 -5 -10 -10 -20 -10 97091300 6 14.7N 166.4E 50 35 122 176 214 216 207 -5 -5 -5 -5 -5 20 97091306 7 15.0N 165.6E 55 11 64 114 157 164 105 0 0 5 -5 15 25 97091312 8 15.5N 164.9E 60 16 74 141 196 203 175 0 -5 -5 -5 15 30 97091318 9 16.1N 164.2E 65 24 84 170 241 260 278 -5 -10 -15 -5 15 35 97091400 10 17.0N 163.3E 70 37 108 209 247 269 355 -5 -10 -10 0 10 40 97091406 11 17.9N 162.5E 75 13 71 138 177 223 389 0 -10 -5 0 10 40

181
TYPHOON DAVID (21W) (CONTINUED)
97091412 12 19.0N 161.5E 85 17 69 124 158 219 356 -5 -10 -5 0 15 40 97091418 13 20.1N 160.3E 95 30 78 95 105 141 207 -10 0 5 10 25 50 97091500 14 21.1N 158.9E 95 0 21 24 65 135 301 -5 5 10 20 35 60 97091506 15 21.9N 157.5E 95 5 8 0 38 81 114 -5 5 10 25 35 60 97091512 16 22.4N 156.3E 95 6 30 60 110 135 157 0 5 15 30 30 45 97091518 17 23.0N 155.2E 95 12 29 70 117 144 210 0 5 20 25 35 35 97091600 18 23.5N 154.0E 95 11 55 93 112 115 245 0 10 25 25 35 30 97091606 19 24.0N 152.6E 95 0 27 55 68 77 189 0 15 25 35 35 30 97091612 20 24.4N 151.0E 90 20 57 65 91 73 322 0 15 20 35 30 30 97091618 21 24.8N 149.4E 85 24 44 68 109 142 141 0 10 20 20 15 20 97091700 22 25.3N 147.8E 80 8 20 70 109 243 198 0 0 15 10 5 5 97091706 23 25.8N 146.2E 80 0 18 85 190 295 292 0 10 10 5 0 0 97091712 24 26.5N 144.9E 80 5 53 10 26 76 262 0 15 10 5 5 0 97091718 25 27.2N 143.6E 70 0 31 60 98 174 213 0 0 0 -5 -5 -10 97091800 26 27.9N 142.4E 65 30 25 84 192 276 0 -5 -10 -15 -25 97091806 27 29.1N 141.9E 65 5 25 68 126 84 0 -5 -10 -15 -20 97091812 28 30.5N 141.6E 65 6 61 146 104 12 0 -5 -5 -15 -20 97091818 29 32.2N 141.5E 65 0 33 68 17 41 0 -5 -5 -10 -20 97091900 30 34.0N 142.5E 65 15 77 91 58 -10 -15 -25 -20 97091906 31 36.5N 144.4E 65 38 149 141 147 -15 -15 -20 -20 97091912 32 39.1N 147.4E 60 17 84 96 109 136 0 0 5 0 5 97091918 33 41.8N 151.0E 60 37 77 90 98 118 0 5 0 0 0 97092000 34 44.7N 154.8E 60 65 100 54 96 195 0 5 0 5 0 97092006 35 47.3N 158.9E 55 17 77 79 128 0 0 0 5 97092012 49.5N 163.7E 55 97092018 51.2N 169.1E 55 97092100 51.2N 174.9E 55 97092106 50.8N 179.6W 55 97092112 50.4N 174.4W 50 97092118 49.9N 169.5W 50 97092200 49.3N 165.3W 50
AVERAGE 20 61 91 120 155 241 3 7 11 13 19 32
# CASES 35 35 35 35 32 25 35 35 35 35 32 25
TYPHOON FRITZ (22W)
WRN BEST TRACK POSITION ERRORS WIND ERRORS DTG NO. LAT LONG WIND 00 12 24 36 48 72 00 12 24 36 48 72 97091712 13.0N 114.0E 15 97091718 13.3N 114.3E 15 97091800 13.6N 114.0E 15 97091806 13.7N 113.6E 20 97091812 13.6N 113.2E 20 97091818 13.4N 112.8E 20 97091900 13.2N 112.5E 20 97091906 13.0N 112.2E 20 97091912 12.8N 111.9E 20 97091918 12.5N 111.6E 20 97092000 12.4N 111.3E 20 97092006 12.3N 111.0E 20 97092012 12.5N 110.7E 20 97092018 1 12.7N 110.4E 25 17 51 98 114 127 159 0 0 5 5 5 -10 97092100 2 13.1N 110.2E 25 37 94 120 120 120 150 0 10 15 15 5 -10 97092106 3 13.6N 109.9E 25 58 102 102 102 105 144 0 0 0 0 -5 -30 97092112 4 14.3N 109.8E 25 78 87 88 93 121 265 0 0 0 -10 -5 -30 97092118 5 14.8N 110.1E 25 64 36 41 78 125 282 0 -5 -5 -10 -15 -30 97092200 6 15.2N 110.6E 25 31 43 68 101 139 270 0 -5 -15 -10 -25 -30 97092206 7 15.4N 110.9E 30 37 80 101 127 152 285 0 0 -5 -10 -25 -15 97092212 8 15.6N 111.1E 30 59 75 75 74 72 209 0 -10 -5 -20 -25 -5 97092218 9 15.8N 111.3E 35 55 58 75 84 119 304 0 -10 -20 -35 -30 15 97092300 10 15.9N 111.3E 45 6 26 55 112 190 424 0 0 -15 -25 -20 25 97092306 11 16.0N 111.2E 45 13 34 84 142 179 291 0 -10 -20 -20 -20 20 97092312 12 16.0N 111.1E 45 26 49 80 112 149 0 -10 -20 -25 -20 97092318 13 16.0N 111.0E 55 13 50 91 146 191 0 -10 -10 -5 0 97092400 14 16.0N 110.8E 65 6 36 88 144 187 0 -10 -10 10 20 97092406 15 16.0N 110.4E 75 11 46 110 174 224 0 0 10 35 45 97092412 16 16.0N 109.9E 75 18 26 47 47 -5 -10 -20 -10
182
TYPHOON FRITZ (22W) (CONTINUED)
97092418 17 16.0N 109.4E 75 23 52 92 136 0 -10 -5 0 97092500 18 16.0N 108.7E 75 30 53 95 0 -5 0 97092506 19 15.8N 107.9E 65 33 75 120 0 5 10 97092512 20 15.5N 107.1E 55 28 75 0 10 97092518 21 15.1N 106.3E 40 47 104 0 10 97092600 14.7N 105.6E 30 97092606 14.3N 104.9E 20
AVERAGE 33 60 86 113 147 254 0 6 10 14 18 20 # CASES 21 21 19 17 15 11 21 21 19 17 15 11
TROPICAL STORM ELLA (23W)
WRN BEST TRACK POSITION ERRORS WIND ERRORS
DTG NO. LAT LONG WIND 00 12 24 36 48 72 00 12 24 36 48 72 97091818 22.0N 175.6W 15 97091900 22.1N 176.5W 15 97091906 22.2N 177.7W 15 97091912 22.4N 178.9W 15 97091918 22.5N 179.9E 20 97092000 22.7N 178.7E 25 97092006 22.9N 177.3E 30 97092012 23.2N 175.9E 35 97092018 23.6N 174.0E 35 97092100 1 24.2N 171.9E 35 16 99 165 228 223 458 -10 0 -5 5 10 15 97092106 2 24.9N 169.4E 30 16 76 129 140 95 435 -5 -5 -5 5 15 15 97092112 3 25.6N 166.8E 30 34 99 144 128 46 415 0 -5 5 10 20 15 97092118 4 26.1N 164.5E 35 37 97 140 88 44 72 -5 -5 5 10 20 15 97092200 5 26.5N 162.3E 40 41 120 137 101 35 189 -5 5 10 15 10 10 97092206 6 26.8N 160.2E 40 10 39 83 134 110 0 5 10 10 5 97092212 7 27.1N 158.3E 35 13 95 234 271 242 5 0 0 -5 -5 97092218 8 27.6N 157.2E 35 5 123 342 497 344 0 0 0 -5 -5 97092300 9 28.6N 156.2E 35 31 208 464 606 449 0 5 0 -5 0 97092306 10 30.5N 156.2E 35 90 267 424 415 0 5 0 -5 97092312 11 32.2N 157.4E 30 121 287 368 342 0 0 -5 -5 97092318 34.2N 158.9E 30 97092400 12 36.3N 160.8E 30 0 7 25 0 -5 -5 97092406 37.7N 163.3E 30 97092412 13 38.6N 165.7E 30 34 172 0 0 97092418 39.3N 167.9E 30 97092500 14 39.8N 169.7E 25 0 0
AVERAGE 32 130 222 269 177 314 2 3 4 7 10 14 # CASES 14 13 12 11 9 5 14 13 12 11 9 5
TYPHOON GINGER (24W)
WRN BEST TRACK POSITION ERRORS WIND ERRORS DTG NO. LAT LONG WIND 00 12 24 36 48 72 00 12 24 36 48 72 97092112 10.3N 174.7E 15 97092118 10.3N 174.4E 15 97092200 10.2N 173.7E 15 97092206 10.2N 173.0E 20 97092212 10.2N 171.8E 20 97092218 1 10.2N 170.3E 25 41 108 159 196 216 336 0 5 5 10 5 5 97092300 2 10.6N 168.8E 25 26 97 164 231 308 472 0 0 5 0 0 -5 97092306 3 11.2N 167.4E 25 29 83 163 242 326 514 0 0 0 -5 0 -15 97092312 4 12.1N 166.3E 30 24 85 138 192 256 255 0 5 0 0 15 -25 97092318 5 12.9N 165.3E 30 25 67 113 179 257 314 0 0 -5 0 10 -35 97092400 6 13.7N 164.5E 35 26 49 90 152 193 250 0 -10 -10 -5 0 -50 97092406 7 14.6N 163.8E 40 12 40 90 136 186 257 0 -5 0 0 -10 -45 97092412 8 15.3N 163.2E 45 50 108 165 202 245 315 0 0 5 0 -25 -35

183
TYPHOON GINGER (24W) (CONTINUED)
97092418 9 16.0N 162.6E 50 21 85 158 167 209 299 0 5 5 -5 -30 -25 97092500 10 16.9N 162.1E 55 18 74 111 170 218 307 0 5 0 -30 -40 -5 97092506 11 17.9N 161.6E 60 12 11 61 117 155 237 0 0 -10 -40 -45 0 97092512 12 18.9N 161.1E 65 13 38 92 117 133 199 0 -10 -45 -60 -50 -20 97092518 13 19.8N 160.7E 70 18 100 138 155 163 174 0 -15 -45 -60 -45 -15 97092600 14 20.1N 160.5E 75 33 82 113 138 139 238 0 -30 -50 -45 -15 -5 97092606 15 20.4N 160.3E 85 0 11 13 48 121 413 0 -30 -45 -30 -5 5 97092612 16 20.8N 160.1E 115 13 50 50 84 150 514 0 -10 -5 25 30 45 97092618 17 21.4N 159.7E 125 42 49 23 26 112 568 0 -15 0 30 30 50 97092700 18 21.9N 159.2E 145 21 50 60 87 101 36 0 0 0 -10 -20 -10 97092706 19 22.4N 158.7E 145 12 36 49 87 67 104 0 5 5 -10 -15 -10 97092712 20 22.9N 158.2E 140 8 32 92 172 121 215 0 25 5 0 -10 -5 97092718 21 23.7N 157.8E 135 8 50 115 125 156 179 0 15 5 5 0 0 97092800 22 24.6N 157.4E 115 22 44 65 87 175 212 0 -10 -10 -15 -20 -10 97092806 23 25.6N 157.3E 110 21 12 43 45 83 0 -10 -5 -5 -20 97092812 24 26.8N 157.3E 110 10 20 77 156 189 0 0 0 0 -10 97092818 25 28.2N 157.6E 110 0 36 71 190 194 0 5 10 0 -5 97092900 26 29.8N 158.5E 100 18 73 154 189 182 0 5 5 -5 -5 97092906 27 31.6N 159.8E 95 12 30 116 146 0 10 5 0 97092912 28 33.8N 161.9E 90 35 138 156 203 0 5 5 5 97092918 29 36.4N 164.1E 80 38 62 120 0 0 5 97093000 30 39.5N 166.9E 75 69 149 263 0 0 0 97093006 31 42.1N 170.3E 75 106 249 0 5 97093012 43.8N 173.5E 65 97093018 45.5N 176.8E 60 97100100 47.1N 179.5W 55
AVERAGE 26 69 108 145 180 292 0 8 10 14 18 19 # CASES 31 31 30 28 26 22 31 31 30 28 26 22
TROPICAL STORM HANK (25W)
WRN BEST TRACK POSITION ERRORS WIND ERRORS
DTG NO. LAT LONG WIND 00 12 24 36 48 72 00 12 24 36 48 72
97092700 18.2N 111.2E 15
97092706 18.2N 111.6E 15 97092712 18.2N 112.0E 15 97092718 18.4N 112.5E 15 97092800 18.5N 113.0E 15 97092806 18.6N 113.5E 15 97092812 18.6N 113.8E 20 97092818 18.6N 114.1E 20 97092900 18.6N 114.3E 20 97092906 18.6N 114.5E 20 97092912 18.5N 114.7E 20 97092918 18.4N 114.8E 20 97093000 18.2N 114.9E 20 97093006 18.0N 114.9E 20 97093012 17.8N 114.8E 20 97093018 17.6N 114.6E 20 97100100 17.4N 114.4E 20 97100106 17.2N 114.0E 20 97100112 16.9N 113.6E 25 97100118 16.6N 113.3E 25 97100200 16.2N 113.0E 25 97100206 15.7N 112.7E 25 97100212 15.3N 112.5E 30 97100218 14.9N 112.2E 35 97100300 1 14.8N 111.7E 40 18 32 110 196 294 -5 10 15 0 -10 97100306 2 14.8N 111.2E 40 30 66 155 255 0 15 0 -5 97100312 3 14.9N 110.7E 35 13 62 119 192 0 0 -5 -5 97100318 4 15.3N 110.0E 30 24 84 144 0 -5 -5 97100400 5 16.0N 109.2E 30 16 74 149 0 5 5

184
TROPICAL STORM HANK (25W) (CONTINUED)
97100406 6 16.6N 108.3E 30 18 29 59 0 5 10 97100412 7 17.3N 107.3E 25 39 53 5 0 97100418 18.0N 106.3E 25 97100500 18.9N 105.4E 25 97100506 19.6N 104.7E 20
AVERAGE 23 57 123 215 295 1 6 7 3 10 # CASES 7 7 6 3 1 7 7 6 3 1
TROPICAL DEPRESSION (26W)
WRN BEST TRACK POSITION ERRORS WIND ERRORS DTG NO. LAT LONG WIND 00 12 24 36 48 72 00 12 24 36 48 72 97092912 13.0N 151.0E 15 97092918 13.4N 150.9E 15 97093000 13.8N 150.8E 15 97093006 14.4N 150.8E 15 97093012 14.8N 150.7E 15 97093018 15.2N 150.6E 15 97100100 15.7N 150.5E 15 97100106 16.2N 150.3E 15 97100112 16.4N 149.5E 15 97100118 16.2N 148.1E 15 97100200 15.7N 146.4E 15 97100206 15.6N 145.0E 15 97100212 16.1N 143.5E 20 97100218 16.7N 141.8E 25 97100300 17.1N 140.9E 30 97100306 17.4N 140.1E 30 97100312 17.6N 139.5E 30 97100318 17.7N 139.2E 30 97100400 1 17.8N 138.9E 30 8 30 76 119 152 159 -5 -5 0 0 5 20 97100406 2 17.8N 138.7E 30 34 82 139 173 176 130 -5 -5 0 0 5 15 97100412 3 17.8N 138.5E 30 30 47 61 69 74 34 -5 -5 0 5 10 20 97100418 4 17.8N 138.4E 30 24 54 66 73 72 18 -5 -5 0 5 10 20 97100500 5 17.8N 138.3E 30 24 54 106 130 114 -5 -5 0 5 10 97100506 6 17.9N 138.1E 30 29 80 127 145 132 -5 -5 0 0 10 97100512 7 18.1N 137.9E 30 36 97 151 193 -5 -5 -5 5 97100518 18.5N 137.6E 30 97100600 8 18.9N 137.2E 30 72 132 187 249 0 0 5 5 97100606 19.2N 136.6E 30 97100612 9 19.5N 136.0E 30 6 28 73 0 5 0 97100618 19.6N 135.2E 30 97100700 10 19.6N 134.2E 25 0 18 0 -5 97100706 19.5N 133.1E 25 97100712 19.3N 132.2E 25 97100718 19.1N 131.3E 25
AVERAGE 27 63 110 144 120 85 4 5 1 3 8 19 # CASES 10 10 9 8 6 4 10 10 9 8 6 4
SUPER TYPHOON IVAN (27W)
WRN BEST TRACK POSITION ERRORS WIND ERRORS
DTG NO. LAT LONG WIND 00 12 24 36 48 72 00 12 24 36 48 72
97100912 7.0N 177.0E 15 97100918 7.0N 175.0E 15 97101000 7.0N 173.0E 15 97101006 6.9N 171.0E 15 97101012 6.7N 169.2E 15 97101018 6.6N 167.6E 15
185
SUPER TYPHOON IVAN (27W) (CONTINUED)
97101100 6.6N 166.2E 20 97101106 6.7N 164.9E 20 97101112 7.0N 163.2E 20 97101118 7.6N 161.6E 20 97101200 8.3N 160.0E 20 97101206 9.0N 158.3E 20 97101212 9.5N 156.8E 20 97101218 9.9N 155.3E 20 97101300 10.1N 154.1E 20 97101306 1 10.4N 152.8E 25 29 54 96 152 161 214 0 -10 -15 -20 -25 -35 97101312 2 10.8N 151.5E 35 11 47 109 159 193 232 -5 -5 -5 0 0 -5 97101318 3 11.2N 150.1E 40 13 42 106 128 146 286 0 5 5 10 5 -20 97101400 4 11.6N 148.6E 40 13 66 99 134 158 278 0 0 5 5 0 -40 97101406 5 12.0N 147.0E 45 6 26 30 29 60 180 0 0 0 -5 5 -40 97101412 6 12.4N 145.4E 50 5 13 16 13 53 125 0 5 0 -5 -5 -50 97101418 7 12.7N 143.8E 55 8 8 34 5 46 117 0 -5 -10 -5 -30 -50 97101500 8 13.0N 142.6E 60 6 32 55 67 89 120 0 -5 -10 -10 -45 -40 97101506 9 13.3N 141.4E 65 8 16 13 64 114 140 0 -5 5 -20 -35 -25 97101512 10 13.7N 140.0E 70 11 13 69 125 158 203 0 -5 -5 -40 -45 -25 97101518 11 14.0N 138.8E 80 29 63 134 184 211 243 0 10 -15 -35 -45 -15 97101600 12 14.3N 137.6E 85 29 55 104 141 188 225 0 0 -35 -45 -35 -15 97101606 13 14.4N 136.1E 95 12 60 118 151 182 221 0 -25 -40 -50 -30 -10 97101612 14 14.5N 134.6E 105 11 44 90 125 150 213 -5 -40 -45 -40 -40 -35 97101618 15 14.6N 133.1E 120 0 37 60 93 116 173 -5 -20 -35 -30 -35 -25 97101700 16 14.5N 131.7E 140 13 16 13 52 93 146 0 -30 -25 -30 -35 -15 97101706 17 14.5N 130.5E 145 13 18 60 94 129 133 -5 -35 -20 -25 -30 -5 97101712 18 14.6N 129.3E 155 21 75 131 175 216 238 0 -10 -15 -25 -25 15 97101718 19 14.6N 128.3E 160 0 63 108 145 179 199 0 -5 -20 -20 -15 10 97101800 20 14.8N 127.2E 150 8 49 97 145 172 130 0 -10 -15 -15 -5 25 97101806 21 15.2N 126.3E 145 0 21 75 144 163 100 0 -5 -10 -5 5 30 97101812 22 15.6N 125.4E 145 5 18 46 96 142 168 0 -5 -5 5 20 35 97101818 23 16.0N 124.7E 140 5 16 80 122 171 209 0 0 5 15 30 35 97101900 24 16.5N 124.0E 140 12 40 62 92 103 126 0 0 5 20 35 30 97101906 25 17.1N 123.4E 135 6 49 119 178 196 204 0 0 5 15 25 25 97101912 26 17.6N 122.7E 130 0 23 86 123 141 158 0 0 10 25 30 15 97101918 27 18.1N 122.2E 120 12 16 42 60 75 42 0 10 20 30 30 15 97102000 28 18.4N 122.0E 110 6 26 90 135 161 114 0 5 25 30 20 10 97102006 29 18.7N 121.9E 100 5 41 117 168 172 188 0 10 20 20 10 0 97102012 30 19.0N 121.9E 90 6 62 147 198 194 231 0 15 20 15 5 5 97102018 31 19.3N 122.3E 80 16 86 155 175 171 275 0 15 20 15 5 5 97102100 32 19.5N 123.0E 70 16 33 49 90 134 185 0 5 -5 -10 -15 -25 97102106 33 19.8N 123.7E 65 17 6 21 61 94 95 0 5 -5 -10 -15 -25 97102112 34 20.1N 124.6E 60 5 28 48 72 126 120 0 0 -10 -10 -15 -20 97102118 35 20.4N 125.5E 60 8 49 98 110 137 115 -5 -5 -15 -15 -20 -15 97102200 36 20.8N 126.4E 60 13 71 108 121 140 284 -5 -10 -10 -15 -20 -10 97102206 37 21.4N 127.1E 60 12 55 82 103 182 282 -5 -15 -10 -15 -20 -10 97102212 38 22.0N 127.7E 65 24 21 50 81 138 147 -10 -10 -10 -15 -15 -10 97102218 39 22.6N 128.4E 65 11 54 99 161 203 218 -10 -10 -15 -20 -15 -10 97102300 40 23.2N 129.2E 60 0 21 12 56 82 94 -10 -15 -20 -20 -15 -20 97102306 41 24.0N 130.3E 60 0 6 43 95 132 -10 -15 -20 -15 -10 97102312 42 24.9N 131.5E 60 20 76 174 234 334 -10 -15 -15 -10 -10 97102318 43 25.6N 132.7E 60 8 17 37 94 209 -10 -15 -10 -10 -10 97102400 44 26.2N 134.0E 60 8 36 45 62 132 -10 -10 -5 -10 -10 97102406 45 26.8N 135.0E 60 12 10 30 84 -15 -5 -5 -10 97102412 46 27.5N 136.3E 55 12 37 55 150 -5 0 -5 -10 97102418 28.3N 137.7E 50 97102500 28.7N 139.5E 45 97102506 29.0N 141.3E 45 97102512 29.2N 143.0E 45 97102518 29.2N 144.9E 45 97102600 29.2N 146.9E 45
AVERAGE 11 38 77 115 149 180 3 9 14 18 20 21 # CASES 46 46 46 46 44 40 46 46 46 46 44 40

186
SUPER TYPHOON JOAN (28W)
WRN BEST TRACK POSITION ERRORS WIND ERRORS
DTG NO. LAT LONG WIND 00 12 24 36 48 72 00 12 24 36 48 72
97101100 3.8N 178.6E 15 97101106 4.3N 177.0E 15 97101112 5.2N 175.3E 15 97101118 6.1N 173.6E 20 97101200 6.9N 171.9E 20 97101206 7.9N 170.5E 20 97101212 9.1N 169.3E 25 97101218 10.2N 168.4E 25 97101300 10.9N 168.0E 25 97101306 1 11.4N 167.4E 25 21 121 139 156 181 192 0 0 0 0 5 -40 97101312 2 11.7N 167.0E 30 34 46 47 65 118 225 0 5 5 5 5 -35 97101318 3 11.9N 166.5E 30 23 0 6 51 107 170 0 5 5 10 0 -30 97101400 4 12.3N 165.5E 30 25 65 74 47 72 138 0 0 0 5 -15 -45 97101406 5 12.7N 164.4E 35 37 60 47 59 90 152 0 0 5 -5 -30 -65 97101412 6 13.0N 163.4E 40 13 34 41 42 46 110 -5 -5 -5 -25 -50 -65 97101418 7 13.2N 162.4E 45 5 29 37 29 24 115 0 -5 -20 -45 -55 -50 97101500 8 13.4N 161.5E 50 18 47 66 89 145 236 -5 -5 -25 -50 -50 -20 97101506 9 13.4N 160.5E 50 8 29 51 75 105 127 0 -10 -35 -45 -65 -20 97101512 10 13.4N 159.4E 60 0 6 8 60 102 155 0 -20 -45 -50 -60 -30 97101518 11 13.4N 158.3E 70 5 18 32 68 120 197 0 -30 -40 -65 -35 -20 97101600 12 13.5N 157.1E 90 8 25 73 122 177 232 -5 -25 -35 -50 -15 -20 97101606 13 13.6N 155.9E 105 0 35 96 156 229 294 -15 -25 -55 -30 -20 -15 97101612 14 13.7N 154.7E 125 6 49 105 166 215 265 0 0 -20 -10 -25 -25 97101618 15 13.9N 153.2E 125 13 57 109 164 203 176 0 -20 -5 -15 -30 -35 97101700 16 14.2N 151.6E 140 5 18 76 91 135 154 -15 -20 0 -25 -30 -35 97101706 17 14.4N 150.1E 160 5 13 70 122 144 127 -5 10 5 -10 -15 -25 97101712 18 14.8N 148.6E 160 11 60 92 109 100 98 0 25 -5 -10 -15 -25 97101718 19 15.3N 147.1E 140 0 24 21 6 24 101 0 -10 -30 -35 -50 -65 97101800 20 15.9N 145.6E 135 8 18 42 68 156 465 0 -25 -35 -40 -55 -65 97101806 21 16.5N 144.3E 140 0 13 58 119 277 595 0 -20 -30 -40 -50 -60 97101812 22 17.0N 143.1E 150 6 24 85 177 337 740 0 -5 -10 -15 -25 -45 97101818 23 17.6N 141.8E 145 6 48 106 214 368 739 0 0 -10 -15 -40 -40 97101900 24 18.1N 140.7E 145 0 32 103 268 475 802 0 0 -15 -20 -40 -40 97101906 25 18.5N 139.7E 140 5 13 102 299 510 845 0 -10 -15 -30 -40 -40 97101912 26 19.0N 138.8E 140 0 49 126 234 382 667 0 -10 -15 -25 -40 -40 97101918 27 19.5N 138.0E 140 0 28 54 101 173 417 0 0 -15 -15 -25 -30 97102000 28 20.1N 137.4E 140 5 17 66 142 255 439 0 -5 -15 -20 -25 -25 97102006 29 20.8N 137.0E 135 5 39 105 186 257 452 0 -15 -15 -15 -25 -25 97102012 30 21.5N 136.7E 135 5 24 34 12 0 230 0 -5 -10 -10 -20 -25 97102018 31 22.3N 136.6E 140 0 21 53 88 94 210 0 0 0 -5 -15 -20 97102100 32 23.2N 136.9E 135 12 27 70 122 138 244 0 0 0 -5 -5 -15 97102106 33 24.1N 137.4E 130 5 37 89 112 160 303 0 0 5 0 0 -10 97102112 34 25.0N 138.3E 130 0 16 55 66 102 352 0 10 5 10 0 -10 97102118 35 26.0N 139.5E 120 0 27 58 87 147 338 0 0 -5 0 -10 -15 97102200 36 27.1N 141.1E 115 12 31 97 164 263 346 0 -5 -5 -15 -15 -5 97102206 37 28.1N 143.1E 110 8 66 141 173 269 186 0 -10 -5 -15 -10 -5 97102212 38 28.9N 145.3E 110 12 90 114 198 306 138 0 0 -5 -15 -10 -5 97102218 39 29.2N 147.7E 105 13 57 99 180 269 0 5 0 -10 0 97102300 40 29.5N 150.1E 95 10 62 136 233 362 0 -5 -5 -10 0 97102306 41 29.6N 152.5E 90 37 54 125 161 59 0 -5 -5 -5 -5 97102312 42 29.9N 155.1E 90 31 109 199 300 365 0 0 -5 0 -5 97102318 43 29.9N 158.0E 85 55 98 210 343 517 5 10 10 5 -5 97102400 44 29.9N 161.0E 80 60 109 249 468 0 0 5 0 97102406 30.0N 164.2E 75 97102412 30.1N 167.6E 75 97102418 31.1N 171.7E 65 97102500 33.2N 175.8E 60 97102506 36.4N 178.5E 60 97102512 39.9N 179.7W 60 97102518 43.4N 178.1W 60
AVERAGE 12 43 86 141 200 310 1 8 13 19 24 31 # CASES 44 44 44 44 43 38 44 44 44 44 43 38

187
SUPER TYPHOON KEITH (29W)
WRN BEST TRACK POSITION ERRORS WIND ERRORS DTG NO. LAT LONG WIND 00 12 24 36 48 72 00 12 24 36 48 72 97102212 6.5N 175.5E 15 97102218 6.5N 175.2E 15 97102300 6.6N 175.0E 15 97102306 6.7N 174.7E 15 97102312 6.8N 174.5E 15 97102318 6.9N 174.2E 15 97102400 7.0N 174.0E 15 97102406 7.0N 173.7E 15 97102412 7.1N 173.5E 20 97102418 7.2N 173.2E 20 97102500 7.3N 173.0E 20 97102506 7.5N 172.8E 20 97102512 7.6N 172.5E 20 97102518 7.7N 172.3E 20 97102600 7.7N 172.1E 20 97102606 7.7N 171.8E 20 97102612 7.6N 171.4E 20 97102618 7.2N 170.8E 25 97102700 6.8N 170.2E 25 97102706 6.4N 169.7E 25 97102712 6.0N 169.3E 30 97102718 1 5.9N 169.1E 30 101 136 139 132 118 93 -5 0 10 10 15 -5 97102800 2 5.9N 168.8E 35 122 137 131 119 86 72 0 10 15 20 15 -10 97102806 3 6.0N 168.4E 35 149 189 221 242 239 275 0 5 5 10 10 -15 97102812 4 6.2N 167.9E 35 168 149 147 144 141 166 5 10 15 20 10 -25 97102818 5 6.4N 167.1E 35 114 80 80 72 83 75 5 5 10 10 -5 -35 97102900 6 6.5N 166.1E 40 118 86 47 21 8 33 0 0 0 -5 -25 -45 97102906 7 6.6N 165.1E 45 67 42 34 29 47 100 -5 -5 -10 -20 -35 -50 97102912 8 6.8N 164.1E 45 42 35 58 72 45 50 0 -10 -20 -35 -45 -55 97102918 9 7.2N 163.1E 50 17 72 103 88 71 102 -5 -15 -30 -40 -50 -50 97103000 10 7.6N 162.0E 55 29 24 29 48 60 74 0 -10 -25 -35 -40 -25 97103006 11 7.9N 160.8E 65 24 30 71 89 76 53 0 -10 -25 -30 -30 -10 97103012 12 8.3N 159.7E 75 11 8 38 53 65 45 0 -15 -20 -30 -30 -5 97103018 13 8.6N 158.5E 90 17 47 74 79 72 32 0 -10 -15 -20 -5 -15 97103100 14 8.9N 157.5E 105 5 30 51 85 101 88 0 -10 -20 -15 5 0 97103106 15 9.4N 156.6E 115 17 61 105 146 151 125 -10 -20 -25 -10 10 10 97103112 16 10.1N 155.6E 125 21 54 98 122 127 99 -5 -10 -10 10 5 15 97103118 17 10.7N 154.4E 135 8 26 62 87 109 81 -5 -15 -5 15 -5 15 97110100 18 11.4N 153.1E 145 0 37 71 87 91 63 -5 -10 5 10 10 10 97110106 19 12.1N 151.7E 150 5 44 63 84 75 53 -5 0 15 0 20 5 97110112 20 12.7N 150.1E 155 5 31 42 51 37 87 0 15 10 10 20 15 97110118 21 13.3N 148.6E 150 0 18 43 51 54 58 10 15 -5 15 15 15 97110200 22 13.9N 147.2E 145 0 21 21 23 54 68 15 10 10 20 10 20 97110206 23 14.4N 145.8E 140 6 23 41 79 106 79 15 0 20 20 5 25 97110212 24 14.8N 144.3E 145 0 8 32 72 121 174 5 5 15 5 5 25 97110218 25 15.2N 142.9E 155 0 21 32 91 143 204 -5 15 15 0 10 30 97110300 26 15.5N 141.7E 140 0 24 56 94 123 150 10 20 10 10 15 35 97110306 27 15.7N 140.5E 130 0 31 42 45 41 116 15 15 0 10 15 25 97110312 28 15.9N 139.2E 125 5 23 42 75 96 155 15 5 5 10 15 20 97110318 29 16.1N 138.0E 125 0 23 16 36 78 142 15 0 10 15 20 20 97110400 30 16.2N 137.1E 130 5 36 61 92 127 244 0 0 5 10 15 15 97110406 31 16.5N 136.2E 135 0 37 64 96 128 232 -10 0 5 10 10 5 97110412 32 17.0N 135.6E 125 8 0 45 84 123 274 -5 0 5 5 -5 0 97110418 33 17.4N 135.1E 120 8 40 85 113 128 306 -5 5 10 5 -15 -5 97110500 34 18.0N 134.9E 115 8 41 73 107 118 301 -5 0 5 0 -5 0 97110506 35 18.6N 135.0E 110 8 50 89 107 157 473 -10 -10 -10 -20 -20 -10 97110512 36 19.1N 135.4E 105 6 23 104 147 220 671 -5 -5 -10 -15 -15 -10 97110518 37 19.6N 135.8E 100 17 53 65 49 41 485 -5 0 -10 -20 -20 -20 97110600 38 20.3N 136.3E 95 16 61 90 146 216 745 0 0 -5 -15 -15 -15 97110606 39 21.3N 137.0E 90 6 82 145 152 82 488 0 -10 -10 -10 -10 -10 97110612 40 22.3N 137.7E 90 8 17 29 82 250 700 -5 -10 -10 -10 -15 -5 97110618 41 23.3N 138.5E 90 8 46 91 212 441 778 -10 -10 -10 -10 -15 -5 97110700 42 24.4N 139.6E 85 12 56 81 221 400 432 -10 -5 -5 -10 -10 -5 97110706 43 25.5N 141.3E 80 13 39 106 290 482 -5 0 0 -10 -5 97110712 44 26.5N 143.1E 75 12 74 281 528 725 -10 -5 -5 -5 0 97110718 45 27.8N 145.4E 70 27 162 429 704 826 -10 -10 -15 -10 -5 97110800 46 28.6N 148.3E 65 24 143 363 562 602 -5 -5 -5 -5 -5 97110806 47 30.2N 152.4E 60 66 237 392 389 -5 -10 -5 -5 97110812 48 31.7N 157.3E 60 124 334 453 407 -5 0 5 0
188
SUPER TYPHOON KEITH (29W) (CONTINUED)
97110818 33.5N 162.7E 60 97110900 35.7N 168.1E 55 97110906 37.0N 174.0E 50 97110912 37.7N 179.2E 45 97110918 38.0N 176.5W 45 97111000 38.0N 172.9W 45
AVERAGE 30 64 105 144 167 216 6 7 11 13 15 18 # CASES 48 48 48 48 46 42 48 48 48 48 46 42
TYPHOON LINDA (30W)
WRN BEST TRACK POSITION ERRORS WIND ERRORS DTG NO. LAT LONG WIND 00 12 24 36 48 72 00 12 24 36 48 72 97102500 6.0N 140.0E 15 97102506 6.3N 139.1E 15 97102512 6.9N 137.8E 15 97102518 7.7N 136.6E 15 97102600 8.4N 135.5E 15 97102606 9.2N 134.7E 15 97102612 10.0N 133.7E 15 97102618 10.7N 133.1E 15 97102700 11.0N 132.7E 15 97102706 11.1N 132.0E 15 97102712 11.5N 131.3E 15 97102718 11.6N 130.7E 15 97102800 11.8N 129.9E 15 97102806 11.8N 129.2E 15 97102812 11.8N 128.4E 15 97102818 11.8N 127.6E 15 97102900 11.6N 126.9E 15 97102906 11.0N 126.3E 15 97102912 10.5N 125.5E 15 97102918 9.9N 124.5E 15 97103000 9.8N 123.3E 15 97103006 9.5N 122.0E 15 97103012 9.3N 120.6E 15 97103118 1 8.2N 114.7E 35 34 36 37 88 111 168 -5 -5 -5 5 0 20 97110100 2 8.2N 113.5E 40 51 56 80 97 124 219 -5 -10 -5 0 0 30 97110106 3 8.2N 112.2E 45 24 77 133 162 192 300 -10 -15 -5 -10 0 30 97110112 4 8.2N 110.5E 50 21 86 120 131 153 231 -5 0 10 -10 0 30 97110118 5 8.4N 108.8E 55 13 36 47 52 88 143 0 10 -5 5 30 35 97110200 6 8.7N 107.2E 55 21 45 34 48 94 138 0 10 0 10 25 30 97110206 7 8.9N 105.9E 55 8 34 83 103 133 114 0 0 0 25 25 30 97110212 8 9.2N 104.6E 55 0 25 51 84 116 96 0 -5 5 10 25 30 97110218 9 9.5N 103.6E 65 6 36 74 120 125 114 0 10 35 15 25 30 97110300 10 10.0N 102.6E 65 18 48 91 123 116 151 0 10 30 35 30 30 97110306 11 10.5N 101.6E 65 0 46 96 101 85 104 0 25 20 30 30 30 97110312 12 11.0N 100.5E 65 6 40 72 67 76 221 0 10 20 25 30 20 97110318 13 11.6N 99.3E 50 31 70 53 33 58 208 0 -5 10 15 20 15 97110400 14 12.1N 98.0E 45 54 50 45 68 87 208 0 0 0 10 15 10 97110406 15 12.7N 96.8E 45 67 85 114 132 151 308 0 0 0 10 15 5 97110412 16 13.1N 95.9E 45 21 53 106 172 256 0 -5 -10 -20 -40 97110418 17 13.4N 95.1E 45 21 59 125 195 290 0 -5 -10 -20 -40 97110500 18 13.6N 94.3E 50 41 96 150 203 246 0 0 -10 -35 -40 97110506 19 13.8N 93.6E 50 23 30 42 95 151 292 0 0 0 -20 -25 -25 97110512 20 14.0N 93.1E 50 32 79 137 187 251 380 0 0 -20 -25 -20 -20 97110518 21 14.2N 92.8E 50 41 88 143 176 242 372 0 0 -20 -20 -20 -15 97110600 22 14.6N 92.5E 50 36 70 96 151 219 334 0 -15 -20 -15 -20 -10 97110606 23 14.8N 92.2E 50 29 46 64 138 216 0 -20 -20 -20 -20 97110612 24 14.9N 92.0E 65 8 37 130 257 409 0 5 5 -5 -15 97110618 25 15.0N 91.8E 65 18 58 139 249 380 0 10 5 0 -10 97110700 26 15.0N 91.4E 65 35 91 157 257 388 0 15 5 5 -5 97110706 27 14.9N 90.9E 60 18 78 150 253 359 -5 -5 -5 0 5 97110712 28 14.8N 90.7E 55 36 90 158 240 343 0 -5 0 5 10 97110718 29 14.7N 90.5E 55 13 49 68 90 -5 0 5 10 97110800 30 14.7N 90.4E 55 16 36 73 116 5 10 10 15 97110806 31 14.7N 90.4E 50 26 39 84 5 10 15

189
TYPHOON LINDA (30W) (CONTINUED)
97110812 32 14.7N 90.2E 45 55 90 137 0 10 20 97110818 33 14.9N 90.1E 40 63 99 -5 5 97110900 34 15.1N 90.2E 35 47 77 0 10 97110906 35 15.3N 90.3E 30 0 0 97110912 15.5N 90.5E 25
AVERAGE 27 60 97 140 195 216 1 7 10 14 19 23 # CASES 35 34 32 30 28 19 35 34 32 30 28 19
TYPHOON MORT (31W)
WRN BEST TRACK POSITION ERRORS WIND ERRORS
DTG NO. LAT LONG WIND 00 12 24 36 48 72 00 12 24 36 48 72
97110700 10.1N 150.8E 15
97110706 10.2N 149.8E 15 97110712 10.3N 148.8E 15 97110718 10.5N 147.8E 20 97110800 10.7N 146.9E 20 97110806 10.8N 146.0E 20 97110812 10.9N 145.1E 20 97110818 11.0N 144.2E 20 97110900 11.1N 143.3E 20 97110906 11.1N 142.6E 20 97110912 11.1N 142.2E 20 97110918 11.1N 141.9E 20 97111000 11.1N 141.5E 20 97111006 11.1N 141.1E 20 97111012 11.1N 140.4E 20 97111018 1 11.2N 139.6E 25 23 34 62 76 62 72 0 -5 -15 -15 -10 20 97111100 2 11.4N 138.9E 30 24 18 21 35 36 93 0 -10 -15 -15 -10 35 97111106 3 11.7N 138.3E 35 16 47 65 82 76 151 0 0 5 10 25 65 97111112 4 12.1N 137.5E 45 23 59 85 99 116 210 -5 -5 5 10 35 65 97111118 5 12.4N 136.6E 50 0 13 29 48 83 187 -5 -10 0 10 45 55 97111200 6 12.7N 135.7E 55 5 11 25 48 48 105 0 5 10 30 60 55 97111206 7 13.0N 134.9E 60 5 12 32 60 72 88 0 0 10 40 60 50 97111212 8 13.3N 134.1E 60 5 26 47 66 91 99 0 0 20 50 60 50 97111218 9 13.4N 133.3E 65 16 54 69 78 82 133 0 0 30 50 50 60 97111300 10 13.5N 132.6E 65 18 36 62 102 139 171 0 15 45 50 50 65 97111306 11 13.6N 131.9E 65 5 17 52 98 115 146 0 25 40 40 35 65 97111312 12 13.6N 131.1E 55 5 24 58 92 95 129 10 35 40 35 35 70 97111318 13 13.7N 130.2E 45 33 57 81 92 96 171 20 35 30 30 45 65 97111400 14 13.8N 129.2E 35 11 5 34 28 50 0 0 -15 -25 -10 97111406 15 13.9N 128.2E 35 8 24 24 21 36 0 -10 -20 -15 0 97111412 16 14.1N 127.1E 35 44 50 58 71 0 -15 -25 -10 97111418 17 14.4N 126.1E 45 18 39 64 59 0 -15 -10 5 97111500 18 14.7N 125.1E 50 0 34 54 67 0 0 10 10 97111506 19 14.9N 124.4E 55 18 55 66 0 10 10 97111512 20 15.0N 123.8E 55 26 62 72 0 10 15 97111518 21 15.1N 123.2E 45 26 50 84 0 15 15 97111600 22 15.3N 122.5E 35 13 23 0 10 97111606 23 15.6N 121.8E 25 0 6 0 0 97111612 15.9N 121.1E 20 97111618 16.0N 120.5E 15
AVERAGE 15 33 55 68 80 136 2 10 18 25 35 55 # CASES 23 23 21 18 15 13 23 23 21 18 15 13

190
SUPER TYPHOON OLIWA (02C)
WRN BEST TRACK POSITION ERRORS WIND ERRORS
DTG NO. LAT LONG WIND 00 12 24 36 48 72 00 12 24 36 48 72 97082806 11.8N 166.7W 15 97082812 11.8N 167.1W 25 97082818 11.8N 167.6W 25 97082900 11.8N 168.1W 25 97082906 11.8N 168.6W 25 97082912 11.8N 169.0W 25 97082918 11.9N 169.3W 25 97083000 12.1N 169.5W 25 97083006 12.3N 170.0W 25 97083012 12.4N 170.6W 25 97083018 12.4N 171.3W 25 97083100 12.5N 172.0W 25 97083106 12.6N 172.6W 25 97083112 12.7N 173.1W 25 97083118 12.7N 173.6W 25 97090100 12.7N 174.1W 25 97090106 12.7N 174.6W 25 97090112 12.7N 175.2W 25 97090118 12.7N 175.8W 30 97090200 12.8N 176.4W 30 97090206 13.0N 176.9W 30 97090212 13.1N 177.3W 30 97090218 1 13.2N 177.7W 30 11 5 30 146 363 738 5 0 5 10 15 25 97090300 2 13.3N 178.2W 35 37 66 145 363 615 988 0 5 10 15 20 30 97090306 3 13.3N 178.7W 35 102 204 285 453 689 1150 0 5 10 15 20 30 97090312 4 13.2N 179.2W 35 117 174 329 592 831 1380 5 10 10 15 20 30 97090318 5 13.1N 179.8W 35 0 170 295 525 718 1210 0 10 10 15 20 25 97090400 6 13.1N 179.4E 35 26 235 367 593 829 1382 -5 10 10 15 20 20 97090406 7 13.1N 178.3E 35 42 96 140 133 173 260 0 5 10 15 20 5 97090412 8 13.1N 177.0E 35 107 204 217 213 265 304 0 5 10 15 20 10 97090418 9 13.3N 175.5E 35 166 250 257 268 307 295 5 10 15 20 15 5 97090500 10 13.7N 174.0E 35 83 154 228 270 276 272 0 0 5 5 0 -10 97090506 11 14.2N 172.9E 35 42 87 118 136 160 217 -5 -5 -5 -5 -10 -20 97090512 12 14.6N 172.1E 35 34 86 88 93 114 171 0 0 0 -5 -15 -20 97090518 13 15.0N 171.3E 35 53 58 55 69 100 147 0 5 0 -5 -10 -15 97090600 14 15.5N 170.4E 35 39 99 132 91 30 36 0 0 -5 -15 -20 -50 97090606 15 16.0N 169.1E 35 36 188 195 170 146 126 0 -5 -15 -20 -15 -50 97090612 16 16.4N 167.8E 35 31 40 13 56 86 70 0 -5 -15 -20 -25 -80 97090618 17 16.7N 166.5E 40 25 16 33 81 86 86 -5 -10 -20 -25 -30 -90 97090700 18 17.0N 165.3E 45 18 64 121 145 142 96 0 0 0 0 -25 -70 97090706 19 17.3N 164.3E 50 11 29 58 64 57 29 0 -5 -5 -10 -40 -70 97090712 20 17.5N 163.4E 55 6 33 56 58 51 30 0 0 0 -20 -50 -60 97090718 21 17.7N 162.6E 60 21 51 67 86 88 108 0 0 -5 -30 -60 -55 97090800 22 17.9N 161.8E 60 13 29 59 92 97 115 0 5 -15 -45 -55 -50 97090806 23 18.0N 161.0E 65 22 62 91 120 111 139 0 -5 -30 -60 -55 -50 97090812 24 18.1N 159.9E 65 20 154 162 172 183 218 0 -25 -55 -65 -60 -50 97090818 25 18.1N 158.7E 75 21 42 66 82 116 157 -5 -30 -60 -55 -50 -30 97090900 26 18.1N 157.5E 90 8 18 32 63 112 171 -10 -40 -50 -45 -40 -15 97090906 27 18.1N 156.2E 105 6 17 40 74 104 139 -10 -40 -35 -30 -25 -10 97090912 28 18.2N 154.9E 125 11 47 87 102 109 143 15 0 -10 -25 -20 -15 97090918 29 18.4N 153.5E 140 23 56 79 97 105 148 0 -5 -15 -25 -15 -10 97091000 30 18.6N 152.1E 140 12 29 54 78 110 186 0 -5 -15 -20 -10 0 97091006 31 18.9N 150.8E 140 6 16 21 16 0 65 0 -5 -15 -15 -10 0 97091012 32 19.1N 149.4E 140 5 20 17 8 18 60 -5 -5 -10 -10 -5 5 97091018 33 19.3N 148.0E 140 5 13 8 12 32 71 0 -5 -5 -10 0 5 97091100 34 19.5N 146.6E 140 0 13 32 54 79 145 0 5 10 10 20 20 97091106 35 19.9N 145.3E 140 5 245 251 257 260 272 0 5 0 0 10 15 97091112 36 20.3N 144.0E 135 23 53 67 62 79 124 0 5 5 15 15 10 97091118 37 20.8N 142.7E 130 0 5 16 56 84 107 0 0 5 10 5 10 97091200 38 21.3N 141.4E 125 13 30 54 84 110 106 0 0 10 5 0 -5 97091206 39 21.9N 140.1E 125 12 11 26 69 144 130 0 10 15 15 10 -5 97091212 40 22.5N 138.7E 120 0 32 68 115 119 187 0 10 10 10 10 0 97091218 41 23.2N 137.4E 115 8 30 63 89 84 209 0 5 5 10 10 0 97091300 42 24.0N 136.1E 105 17 24 42 51 106 101 0 0 0 -5 -15 -15 97091306 43 24.9N 134.9E 105 8 30 44 93 141 57 0 0 5 0 -15 -10 97091312 44 25.7N 133.8E 100 13 53 77 114 139 82 0 0 -5 -10 -25 -10

191
SUPER TYPHOON OLIWA (02C) (CONTINUED)
97091318 45 26.5N 132.6E 100 20 226 158 74 16 221 -5 10 30 20 10 10 97091400 46 27.3N 131.5E 95 8 56 122 189 221 168 -10 -10 -10 -15 -15 10 97091406 47 27.9N 130.6E 90 16 55 111 171 190 245 -10 -10 -15 -10 -20 10 97091412 48 28.3N 130.0E 90 7 41 87 109 84 -20 -20 -20 -15 -15 97091418 49 28.6N 129.7E 85 7 24 50 24 72 -20 -20 -15 -10 0 97091500 50 28.9N 129.5E 85 0 27 31 66 90 -20 -20 -15 -20 0 97091506 51 29.3N 129.5E 85 0 5 36 110 180 -20 -15 -15 -5 10 97091512 52 29.9N 129.7E 80 6 49 83 120 -15 -10 -10 5 97091518 53 30.6N 130.1E 75 20 42 132 169 -10 -10 0 15 97091600 54 31.6N 130.7E 70 11 78 181 -5 -15 5 97091606 55 33.0N 131.7E 65 20 126 219 -10 0 10 97091612 56 34.1N 133.1E 60 19 33 -15 0 97091618 57 35.1N 134.6E 45 15 18 -10 5 97091700 58 36.2N 136.2E 35 7 -5 97091706 59 37.7N 138.4E 25 15 0
AVERAGE 25 73 108 144 185 274 4 8 13 17 20 24 # CASES 59 57 55 53 51 47 59 57 55 53 51 47
SUPER TYPHOON PAKA (05C)
WRN BEST TRACK POSITION ERRORS WIND ERRORS
DTG NO. LAT LONG WIND 00 12 24 36 48 72 00 12 24 36 48 72 97112818 5.6N 166.3W 20 97112900 5.9N 166.1W 25 97112906 6.1N 166.0W 25 97112912 6.4N 165.8W 25 97112918 6.7N 165.5W 25 97113000 7.1N 165.3W 25 97113006 7.4N 165.2W 25 97113012 7.7N 165.2W 25 97113018 7.8N 165.3W 25 97120100 7.9N 165.4W 25 97120106 8.0N 165.6W 30 97120112 8.0N 165.9W 30 97120118 8.0N 166.3W 30 97120200 8.0N 166.7W 30 97120206 8.0N 167.1W 35 97120212 1* 8.0N 167.2W 40 NOTE: * = ADVISORY ISSUED BY CENTRAL PACIFIC 97120218 2* 8.1N 167.3W 45 HURRICANE CENTER 97120300 3* 8.1N 167.4W 45 97120306 4* 8.1N 167.5W 50 97120312 5* 8.1N 167.6W 55 97120318 6* 8.2N 167.8W 55 97120400 7* 8.3N 168.2W 55 97120406 8* 8.4N 168.7W 55 97120412 9* 8.4N 169.3W 50 97120418 10* 8.4N 170.1W 50 97120500 11* 8.3N 171.3W 50 97120506 12* 8.2N 172.3W 50 97120512 13* 8.1N 173.5W 45 97120518 14* 7.9N 175.0W 45 97120600 15* 7.7N 176.7W 40 97120606 16* 7.6N 177.7W 35 97120612 17* 7.5N 178.4W 35 97120618 18 7.4N 179.1W 40 93 119 165 203 253 356 -5 -15 -25 -20 -10 -15 97120700 19 7.4N 179.7W 45 62 84 110 148 182 336 -5 -15 -20 -10 -15 -25 97120706 20 7.4N 179.9E 50 55 82 124 182 253 424 -10 -20 -20 -10 -15 -30 97120712 21 7.4N 179.4E 55 76 110 164 219 312 467 -10 -15 -5 -10 -10 -40 97120718 22 7.4N 178.8E 60 107 147 197 250 291 427 -5 5 15 0 -10 -50 97120800 23 7.3N 178.1E 60 93 120 150 179 232 418 -10 5 0 -5 -15 -60 97120806 24 7.1N 177.2E 55 18 42 84 149 237 402 -10 0 -5 -5 -25 -70 97120812 25 6.9N 176.5E 45 30 48 63 122 224 386 0 0 -5 -10 -35 -75 97120818 26 6.7N 175.5E 45 42 59 106 186 275 473 0 0 -5 -20 -45 -80 97120900 27 6.6N 174.6E 45 0 42 72 113 155 280 0 0 -5 -25 -55 -85
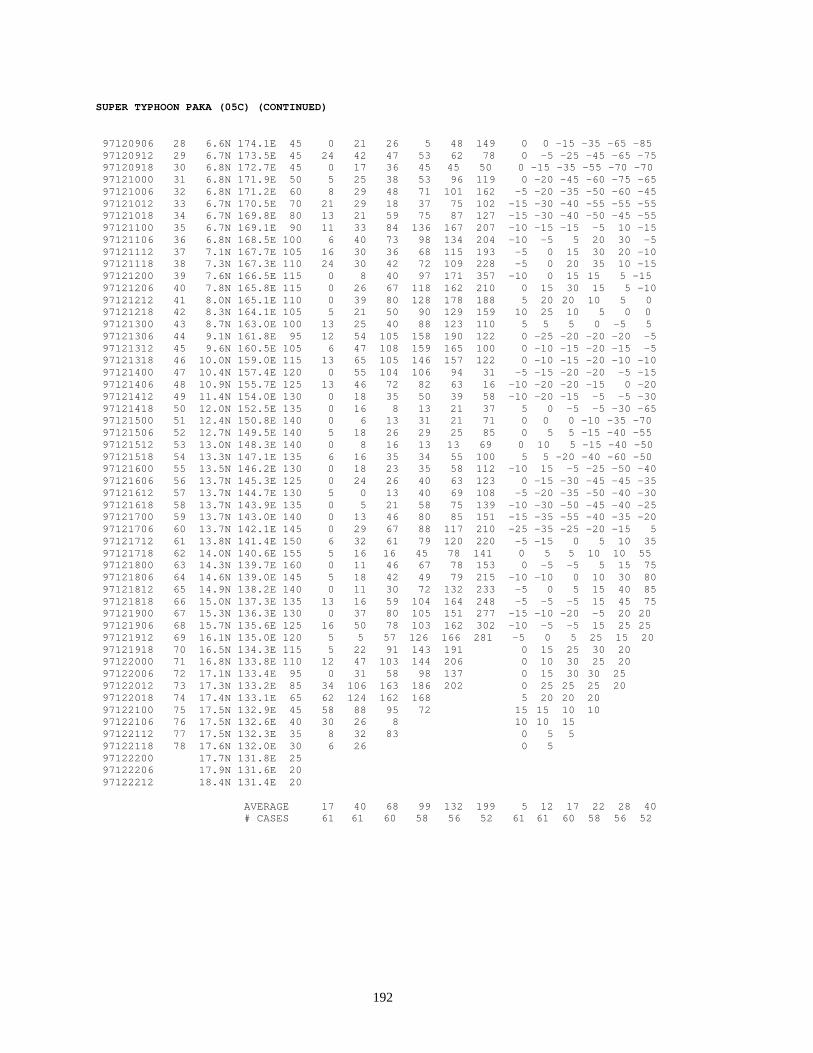
192
SUPER TYPHOON PAKA (05C) (CONTINUED)
97120906 28 6.6N 174.1E 45 0 21 26 5 48 149 0 0 -15 -35 -65 -85 97120912 29 6.7N 173.5E 45 24 42 47 53 62 78 0 -5 -25 -45 -65 -75 97120918 30 6.8N 172.7E 45 0 17 36 45 45 50 0 -15 -35 -55 -70 -70 97121000 31 6.8N 171.9E 50 5 25 38 53 96 119 0 -20 -45 -60 -75 -65 97121006 32 6.8N 171.2E 60 8 29 48 71 101 162 -5 -20 -35 -50 -60 -45 97121012 33 6.7N 170.5E 70 21 29 18 37 75 102 -15 -30 -40 -55 -55 -55 97121018 34 6.7N 169.8E 80 13 21 59 75 87 127 -15 -30 -40 -50 -45 -55 97121100 35 6.7N 169.1E 90 11 33 84 136 167 207 -10 -15 -15 -5 10 -15 97121106 36 6.8N 168.5E 100 6 40 73 98 134 204 -10 -5 5 20 30 -5 97121112 37 7.1N 167.7E 105 16 30 36 68 115 193 -5 0 15 30 20 -10 97121118 38 7.3N 167.3E 110 24 30 42 72 109 228 -5 0 20 35 10 -15 97121200 39 7.6N 166.5E 115 0 8 40 97 171 357 -10 0 15 15 5 -15 97121206 40 7.8N 165.8E 115 0 26 67 118 162 210 0 15 30 15 5 -10 97121212 41 8.0N 165.1E 110 0 39 80 128 178 188 5 20 20 10 5 0 97121218 42 8.3N 164.1E 105 5 21 50 90 129 159 10 25 10 5 0 0 97121300 43 8.7N 163.0E 100 13 25 40 88 123 110 5 5 5 0 -5 5 97121306 44 9.1N 161.8E 95 12 54 105 158 190 122 0 -25 -20 -20 -20 -5 97121312 45 9.6N 160.5E 105 6 47 108 159 165 100 0 -10 -15 -20 -15 -5 97121318 46 10.0N 159.0E 115 13 65 105 146 157 122 0 -10 -15 -20 -10 -10 97121400 47 10.4N 157.4E 120 0 55 104 106 94 31 -5 -15 -20 -20 -5 -15 97121406 48 10.9N 155.7E 125 13 46 72 82 63 16 -10 -20 -20 -15 0 -20 97121412 49 11.4N 154.0E 130 0 18 35 50 39 58 -10 -20 -15 -5 -5 -30 97121418 50 12.0N 152.5E 135 0 16 8 13 21 37 5 0 -5 -5 -30 -65 97121500 51 12.4N 150.8E 140 0 6 13 31 21 71 0 0 0 -10 -35 -70 97121506 52 12.7N 149.5E 140 5 18 26 29 25 85 0 5 5 -15 -40 -55 97121512 53 13.0N 148.3E 140 0 8 16 13 13 69 0 10 5 -15 -40 -50 97121518 54 13.3N 147.1E 135 6 16 35 34 55 100 5 5 -20 -40 -60 -50 97121600 55 13.5N 146.2E 130 0 18 23 35 58 112 -10 15 -5 -25 -50 -40 97121606 56 13.7N 145.3E 125 0 24 26 40 63 123 0 -15 -30 -45 -45 -35 97121612 57 13.7N 144.7E 130 5 0 13 40 69 108 -5 -20 -35 -50 -40 -30 97121618 58 13.7N 143.9E 135 0 5 21 58 75 139 -10 -30 -50 -45 -40 -25 97121700 59 13.7N 143.0E 140 0 13 46 80 85 151 -15 -35 -55 -40 -35 -20 97121706 60 13.7N 142.1E 145 0 29 67 88 117 210 -25 -35 -25 -20 -15 5 97121712 61 13.8N 141.4E 150 6 32 61 79 120 220 -5 -15 0 5 10 35 97121718 62 14.0N 140.6E 155 5 16 16 45 78 141 0 5 5 10 10 55 97121800 63 14.3N 139.7E 160 0 11 46 67 78 153 0 -5 -5 5 15 75 97121806 64 14.6N 139.0E 145 5 18 42 49 79 215 -10 -10 0 10 30 80 97121812 65 14.9N 138.2E 140 0 11 30 72 132 233 -5 0 5 15 40 85 97121818 66 15.0N 137.3E 135 13 16 59 104 164 248 -5 -5 -5 15 45 75 97121900 67 15.3N 136.3E 130 0 37 80 105 151 277 -15 -10 -20 -5 20 20 97121906 68 15.7N 135.6E 125 16 50 78 103 162 302 -10 -5 -5 15 25 25 97121912 69 16.1N 135.0E 120 5 5 57 126 166 281 -5 0 5 25 15 20 97121918 70 16.5N 134.3E 115 5 22 91 143 191 0 15 25 30 20 97122000 71 16.8N 133.8E 110 12 47 103 144 206 0 10 30 25 20 97122006 72 17.1N 133.4E 95 0 31 58 98 137 0 15 30 30 25 97122012 73 17.3N 133.2E 85 34 106 163 186 202 0 25 25 25 20 97122018 74 17.4N 133.1E 65 62 124 162 168 5 20 20 20 97122100 75 17.5N 132.9E 45 58 88 95 72 15 15 10 10 97122106 76 17.5N 132.6E 40 30 26 8 10 10 15 97122112 77 17.5N 132.3E 35 8 32 83 0 5 5 97122118 78 17.6N 132.0E 30 6 26 0 5 97122200 17.7N 131.8E 25 97122206 17.9N 131.6E 20 97122212 18.4N 131.4E 20
AVERAGE 17 40 68 99 132 199 5 12 17 22 28 40 # CASES 61 61 60 58 56 52 61 61 60 58 56 52

193
6.2.2 NORTH INDIAN OCEAN— This section includes verification statistics for each warningin the North Indian Ocean during 1997.
JTWC BEST TRACK, FORECAST TRACK AND INTENSITY ERRORS BY WARNING
TROPICAL CYCLONE 01B
WRN BEST TRACK POSITION ERRORS WIND ERRORS DTG NO. LAT LONG WIND 00 12 24 36 48 72 00 12 24 36 48 72 97051300 3.2N 91.9E 15 97051306 3.3N 91.9E 15 97051312 3.5N 91.8E 15 97051318 3.7N 91.7E 15 97051400 4.0N 91.6E 20 97051406 4.4N 91.6E 25 97051412 5.1N 91.4E 30 97051418 1 6.2N 90.8E 35 66 120 118 179 269 305 -10 -15 -15 -5 -5 -5 97051500 2 7.2N 90.4E 40 81 91 135 255 354 397 5 5 15 20 25 15 97051506 3 8.0N 90.2E 45 53 96 178 267 296 264 0 5 15 15 20 10 97051512 4 8.3N 90.3E 50 54 135 185 190 124 32 0 5 10 10 15 5 97051518 5 8.6N 90.4E 50 53 102 157 174 146 169 0 5 5 5 10 0 97051600 6 9.0N 90.6E 50 13 85 171 228 276 420 5 0 -5 -5 -5 -10 97051606 7 9.7N 91.0E 50 21 87 150 189 235 319 0 -5 -10 -10 -15 -15 97051612 8 10.6N 91.3E 55 13 69 134 180 199 209 -5 -10 -15 -20 -20 -15 97051618 9 11.6N 91.5E 60 31 106 172 149 133 132 0 0 0 -5 -5 20 97051700 10 12.6N 91.5E 65 41 108 145 136 139 82 0 -5 -15 -10 -25 -25 97051706 11 13.6N 91.2E 70 11 44 47 52 62 299 -5 -10 -20 -15 -20 -10 97051712 12 14.4N 90.7E 75 18 34 23 39 44 -10 -15 -20 -15 -45 97051718 13 15.2N 90.4E 80 11 43 74 86 122 -5 -10 -10 -10 5 97051800 14 16.2N 90.2E 90 6 50 74 84 232 0 0 -5 0 30 97051806 15 17.2N 90.3E 95 5 21 18 39 329 -5 -5 -10 15 20 97051812 16 18.3N 90.4E 100 5 8 18 186 -10 -15 -15 5 97051818 17 19.3N 90.5E 105 6 11 45 345 0 0 15 15 97051900 18 20.2N 90.8E 110 23 55 231 0 0 35 97051906 19 21.1N 91.1E 115 0 21 316 0 10 15 97051912 20 22.1N 91.6E 115 8 173 0 10 97051918 21 23.2N 92.3E 90 0 232 0 5 97052000 22 25.5N 94.7E 65 32 0 97052006 27.8N 97.5E 50
AVERAGE 25 81 126 164 198 239 3 6 13 11 18 12 # CASES 22 21 19 17 15 11 22 21 19 17 15 11
TROPICAL CYCLONE 02B
WRN BEST TRACK POSITION ERRORS WIND ERRORS
DTG NO. LAT LONG WIND 00 12 24 36 48 72 00 12 24 36 48 72
97092000 13.1N 83.8E 15
97092006 13.2N 83.7E 15 97092012 13.3N 83.6E 15 97092018 13.4N 83.5E 15 97092100 13.5N 83.5E 20 97092106 13.7N 83.4E 20 97092112 13.9N 83.4E 20 97092118 14.1N 83.3E 25 97092200 14.3N 83.2E 25 97092206 14.5N 83.1E 25

194
TROPICAL CYCLONE 02B (CONTINUED)
97092212 14.7N 83.1E 25 97092218 15.0N 83.0E 25 97092300 15.2N 82.9E 25 97092306 15.3N 82.7E 25 97092312 15.4N 82.4E 25 97092318 15.7N 82.3E 25 97092400 16.1N 82.3E 30 97092406 16.5N 82.5E 30 97092412 16.9N 82.7E 30 97092418 1 17.2N 83.2E 35 12 54 92 194 302 545 0 5 0 -10 -35 0 97092500 17.3N 83.8E 35 97092506 2 17.6N 84.4E 35 81 151 261 385 485 0 -10 -15 -25 -30 97092512 3 18.1N 84.9E 35 87 174 309 406 541 0 -15 -20 -25 5 97092518 4 18.8N 85.7E 45 12 111 220 313 428 0 -5 -15 -10 30 97092600 5 19.4N 86.7E 55 16 107 170 288 0 0 0 35 97092606 6 20.0N 88.0E 55 38 131 211 329 0 0 5 50 97092612 7 21.0N 89.4E 60 6 29 95 0 5 20 97092618 8 21.8N 90.4E 65 24 28 133 0 -5 10 97092700 9 22.6N 91.2E 65 85 125 0 15 97092706 10 23.7N 92.3E 65 0 54 0 25 97092712 24.8N 93.4E 35 97092718 26.0N 94.4E 25
AVERAGE 37 97 187 320 440 545 0 9 11 26 25 0 # CASES 10 10 8 6 4 1 10 10 8 6 4 1
TROPICAL CYCLONE 03A
WRN BEST TRACK POSITION ERRORS WIND ERRORS DTG NO. LAT LONG WIND 00 12 24 36 48 72 00 12 24 36 48 72 97110400 7.8N 68.7E 15 97110406 7.8N 68.3E 15 97110412 7.9N 67.9E 15 97110418 8.0N 67.6E 15 97110500 8.0N 67.3E 15 97110506 8.1N 66.8E 15 97110512 8.3N 66.0E 15 97110518 8.5N 65.2E 15 97110600 8.9N 64.5E 15 97110606 9.1N 63.6E 15 97110612 9.2N 62.6E 15 97110618 9.4N 61.3E 15 97110700 9.5N 60.3E 20 97110706 9.5N 59.3E 25 97110712 9.8N 58.2E 25 97110718 10.1N 56.6E 30 97110800 10.2N 55.5E 35 97110806 1 10.3N 54.6E 35 50 8 42 24 63 0 5 5 15 15 97110812 2 10.5N 53.6E 35 60 54 64 0 -5 -20 97110818 3 10.6N 52.7E 30 60 18 5 -10 97110900 4 10.9N 51.7E 30 59 32 0 -10 97110906 5 11.2N 51.1E 35 104 164 -5 10 97110912 6 11.4N 50.9E 35 120 186 0 5 97110918 7 11.7N 50.8E 20 43 10 97111000 11.9N 50.7E 20 97111006 12.3N 50.5E 20
AVERAGE 71 77 54 24 64 3 8 13 15 15 # CASES 7 6 2 1 1 7 6 2 1 1
TROPICAL CYCLONE 04A
WRN BEST TRACK POSITION ERRORS WIND ERRORS DTG NO. LAT LONG WIND 00 12 24 36 48 72 00 12 24 36 48 72 97110212 7.9N 81.6E 15

195
TROPICAL CYCLONE 04A (CONTINUED)
97110218 7.7N 81.5E 15 97110300 7.5N 81.4E 15 97110306 7.4N 81.3E 15 97110312 7.3N 81.2E 15 97110318 7.2N 81.1E 15 97110400 7.2N 81.0E 15 97110406 7.2N 80.8E 15 97110412 7.3N 80.7E 15 97110418 7.4N 80.6E 15 97110500 7.6N 80.5E 15 97110506 7.8N 80.4E 20 97110512 8.0N 80.3E 20 97110518 8.2N 80.2E 20 97110600 8.5N 80.1E 20 97110606 9.1N 80.1E 20 97110612 9.7N 80.2E 20 97110618 10.0N 80.2E 20 97110700 10.2N 80.1E 20 97110706 10.2N 79.9E 20 97110712 10.2N 79.5E 20 97110718 10.3N 79.0E 20 97110800 10.3N 78.1E 20 97110806 10.3N 77.1E 20 97110812 10.3N 76.0E 25 97110818 10.3N 74.9E 25 97110900 10.3N 73.7E 25 97110906 10.7N 72.6E 25 97110912 11.0N 71.6E 25 97110918 11.3N 70.6E 30 97111000 1 11.5N 69.8E 30 69 132 174 216 258 265 0 0 -10 -10 -5 10 97111006 2 11.7N 69.0E 35 41 68 91 114 128 108 0 -5 -10 -10 -10 10 97111012 3 11.9N 68.2E 35 21 29 48 66 96 58 0 -10 -10 -10 -10 10 97111018 4 12.2N 67.4E 45 13 8 26 55 70 51 0 -5 0 5 15 35 97111100 5 12.5N 66.7E 50 13 11 11 21 40 214 0 0 5 5 25 40 97111106 6 12.8N 66.1E 55 21 21 13 23 79 0 5 10 20 35 97111112 7 13.2N 65.5E 55 31 13 13 13 85 0 5 10 30 35 97111118 8 13.5N 65.1E 55 5 18 24 30 112 0 5 15 35 40 97111200 9 13.8N 64.8E 55 18 24 17 75 181 5 5 25 35 40 97111206 10 14.1N 64.5E 55 11 16 56 141 0 10 25 30 97111212 11 14.4N 64.2E 55 12 56 130 248 0 20 20 20 97111218 12 14.6N 63.7E 50 21 92 183 0 10 15 97111300 13 14.6N 63.2E 40 33 104 212 5 5 5 97111306 14 14.6N 62.6E 35 55 147 0 0 97111312 15 14.5N 61.9E 35 29 101 0 0 97111318 16 14.2N 61.2E 30 6 0 97111400 17 13.7N 60.4E 30 6 0
AVERAGE 24 56 77 92 117 140 0 5 12 20 24 21 # CASES 17 15 13 11 9 5 17 15 13 11 9 5
196
7. TROPICAL CYCLONE (TC) SUPPORT SUMMARY
7.1 SOUTHERN HEMISPHEREAPPLICATION OF THESYSTEMATIC APPROACH TOTROPICAL CYCLONETRACK FORECASTING
Author: Russell L. ElsberryNaval Postgraduate SchoolMonterey, CA 93943
The environment structureconceptual models of the SystematicApproach to Tropical Cyclone TrackForecasting technique of Carr andElsberry have been applied to allSouthern Hemisphere tropical cyclonesduring January 1994 - June 1997.Whereas three of the four synopticpatterns from the western North Pacificcould be applied with relatively smallmodifications, a new High (H) amplitudesynoptic pattern was defined to classifythe situations with large meridionalpenetrations of mid-latitude troughs deepinto the Southern Hemisphere tropics.Some changes in terminology wererequired to describe the synoptic regionsthat have characteristic track directions.All 1592 cases during the period couldbe described as existing within one ormore of these four synoptic patterns and11 synoptic regions. Important trackchanges were found to be associatedwith transitions between these synopticpatterns and regions. Three binarytropical cyclone interactions defined forthe western North Pacific were adaptedfor use in the Southern Hemisphere withconsiderable success. A preliminaryclimatology of occurrences for thesynoptic pattern/region combinations,transitions between combinations, andbinary tropical cyclone interactions arecalculated. Sequences of synoptic
analyses related to the transitions aredescribed to aid in the application.
7.2 STATISTICAL POST-PROCESSING OF NOGAPS TRACKFORECASTS
Author: Russell L. ElsberryNaval Postgraduate SchoolMonterey, CA 93943
A statistical post-processing techniquehas been developed and tested to reducethe Navy global model (NOGAPS) trackforecast errors for a sample of westernNorth Pacific tropical cyclones during1992-96. In addition to the basic stormcharacteristics, the set of 24 predictorsincludes various segments in the 00-36hour NOGAPS forecast track as well asa 00-36 hour backward extrapolationthat is compared with the known recenttrack positions. Another key piece ofinformation is the offset of the initialNOGAPS position relative to an updated(here best-track) position that will beknown by about 6 hours after thecorresponding synoptic times, which iswhen the NOGAPS forecast is actuallyavailable for use by the forecaster. Forthe development sample, the adjustedNOGAPS track errors are reduced byabout 50 nm (93 km) at 12 hours, 33 nm(61 km) at 36 hours, and 24 nm (44 km)at 72 hours. Independent tests with a1997 western North Pacific sample,1995-97 Atlantic sample, and 1996-97eastern and central North Pacific sampleof NOGAPS forecasts have similarimprovements from the post-processingtechnique. Thus, the technique appearsto have a general applicability toNorthern Hemisphere tropical cyclones.

197
7.3 AUTOMATED TROPICALCYCLONE FORECASTINGSYSTEM
Authors: C.R. Sampson and A.J.Schrader, Naval Research Laboratory,Monterey CA 93943
The Automated Tropical CycloneForecasting System (ATCF) version 3.2was installed at JTWC, NPMOC, andNLMOC. This version features thefollowing capabilities: an improvedconventional meteorological database -TEDS 3.52; electronic logs for forecastoperations; web pages for use in ATCFsystem support and communications;ECMWF and NCEP NWP model datadisplay; scatterometer and cloud trackwind display; NOAA compliant four-quadrant wind radii capability;geographic labels, and Tropical CycloneFormation Alert (TCFA) graphic overlaygeneration for use on Joint MaritimeCommand Information System (JMCIS)workstations. Current work is focused onATCF 3.3, to be installed in the spring of1999. This version should include thecapability to forecast beyond 72 hoursand be year 2000 compliant. Thesecapabilities involve a redesign of thetropical cyclone database format and asignificant number of code changes.The new database will have capability tostore a number of tropical cycloneparameters such as: minimum sea levelpressure; radius of outermost closedisobar; radius of maximum winds;maximum wind gusts and eye diameter.It should also be easy to incorporatemore forecast periods and tropicalcyclone parameters with this newformat.
7.4 SSM/I TROPICAL CYCLONESTRUCTURE
Authors: Jeff Hawkins, Naval ResearchLaboratory, Monterey, CA 93943Co-authors: Richard Bankert, Paul Tag,Naval Research Laboratory, Monterey,CA 93943,Juanita Chase, Doug May, Ron Holyer,Naval Research Laboratory, StennisSpace Center, MS 93943, andMarla Helveston, Analysis &Technology, Bay St. Louis, MS 39520
The Special SensorMicrowave/Imager (SSM/I) has a suiteof passive microwave channels thatenable it to penetrate non-raining cloudsand map out tropical cyclone (TC)associated rain and moisture structure.This ability to detect rainbands,eyewall(s) and eye/center locations cansignificantly assist the analyst andtyphoon duty officer (TDO) when upper-level clouds obscure geostationaryand/or polar orbiter visible ( vis) andinfrared (IR) imagery. TC structure isvaluable for positioning andunderstanding storm intensity. Thisinformation, as well as any intensitytrend, can then be used to upgrade theconfidence and accuracy of stormwarnings/advisories. The Naval Research Laboratory’sMarine Meteorology Division inMonterey, CA (NRL-MRY) has beenexploring new methods to extractadditional information from the wealthalready contained in TC SSM/I imagery.Initial focus has been aimed at the highresolution (12-15 km) 85 GHz channelsthat nicely map TC structure and readilydepict storm rainbands, eyewall(s) andcenter locations. This has been done byprocessing over 1500 SSM/I passes

198
coincident with TCs ranging in strengthfrom tropical disturbances to supertyphoons and, east of the dateline, CAT5 hurricanes. Results to date indicate the SSM/Ican greatly assist the analyst locate thestorm center when intensities are inexcess of 30-40 kt. This threshold canchange for given systems, but is usedhere as a generic number. The usershould note that the cloud (and thus rain)organization for weak systems is poor atbest and vis/IR data can be just as goodand/or better than SSM/I data for tryingto determine the center in the beginningstages of tropical systems. However,there is no upper bound for SSM/Icapabilities, and it is useful with systemsin the range of 150 kt-sustained winds.Particular note should be made that theseSSM/I views are not constrained bycentral dense overcasts, shear orembedded centers that can causeproblems with vis/IR imagery. Two methods have been explored toextract TC intensities from automatedanalyses of SSM/I digital data. The firsteffort involves a neural network methodwhich:
1) Uses 85 GHz, H-polarizationbrightness temperatures.
2) Represents the TC pattern in85 GHz images via its EmpiricalOrthogonal Functions (EOF).
3) Trains the neural net with theEOFs most highly correlated withintensity.
4) Trains the net with adependent storm data base usingJTWC/NHC best track intensities.
The data base now contains over 750TCs in the dependent data set andverification using “independent” cases
has now shown skill ramping up stormintensity and weakening the storm asseen in real cases. The RMS error is stillgreater than our goal of 15 kts, butsignificant progress indicates this maybecome a viable technique within thenext year. The second effort utilizes computervision capabilities to analyze both 85GHz and rainrate products from theSSM/I. The same set of storms used totrain the neural network is also usedhere. Spatial and textural measures, aswell as those using various frequencieswithin the spectrum, were developed toextract features that are most highlycorrelated with TC intensity. Some ofthese features are analogous to thoseused within the Dvorak method, such asbanding of particular temperatureranges, minimum brightnesstemperature, rainrates above a certainthreshold, etc. Results to date indicatean RMS error less than 20 m/s andgetting close to 15 m/s. Some largeoutliers exit, but many of them appear tobe related to poor best track values.Note that no time averaging has yet beenapplied in either the neural network orcomputer vision methods. Additional work, with well over1,000 high quality storm hits, isunderway. The Tropical RainfallMapping Mission (TRMM) MicrowaveImager (TMI) and radar data will beadded in the next update to this effort.TMI channels are basically identical tothe SSM/I, with the addition of a lowfrequency 10 GHz channel that canassist with the determination of seasurface temperature and wind speedretrieval. TMI is mounted on a platformwith an orbital altitude approximatelyone-half that utilized by the SSM/Iplatforms. This results in twice the
199
spatial resolution (5 km) but half of thefootprint (approximately 750 km). Alsoof note, the 35 degree orbit inclinationwill permit more frequent TC coveragecompared to more typical polar orbiterssuch as the DMSP/NOAA suite ofsatellites.
7.5 TROPICAL CYCLONESCATTEROMETER STUDIES
Authors: Jeff Hawkins, Naval ResearchLaboratory, Monterey, CA 93943, andRoger Edson, Analysis & Technology,Guam
The ERS series of scatterometers haveprovided the bulk of the activemicrowave surface derived windmeasurements from space since thelaunch of ERS-1 in 1991. ERS-2continued to produce a 500-km swath ofsurface wind vectors throughout JTWC’sArea Of Responsibility (AOR) during1997, using a frequency that permitswind retrievals even under rainyconditions prevalent with tropicalcyclones (TCs). The 50-km spatialresolution is coarse, but can often besufficient to specify the radii of galeforce winds as well as help positionstorm centers. Storm positioning isespecially important for the weakerdeveloping systems, when cloud/rainpatterns are poorly defined andknowledge of the surface wind field iscritical is assisting the analysts toachieve their goal. ERS-2’s 500-km swath presents oftenclustered but infrequent TC overflights.TCs can often move for days before thenext pass clips or passes sufficientlyover the storm to provide useful data.This major limitation was partiallymitigated with the availability of the
NASA SCATterometer (NSCAT) in thesummer of 1996. Although the satelliteplatform suffered a terminal powerfailure in the Spring of 1997, theinstrument produced a wealth of surfacewind vectors in two 600-km swaths, oneon each side of the spacecraft. Thepercentage of swaths detecting TCs rosesignificantly when compared with ERS-2 and the “revisit time” betweenoverflights for a given storm wasreduced dramatically. NSCAT surface winds proved veryuseful for specifying the radius of galeforce winds and assisting in findingstorm centers. Some problems wereencountered in early versions of thewind retrieval algorithm and theseimproved with time. The spectralwindow utilized by NSCAT was not asimpervious to TC rainbands and thusrain attenuation in heavy rain wastroublesome. Although heavy rainshould boost the backscattered returnand create higher winds, cases wereoften found where the wind speeds weresignificantly reduced. Efforts areunderway to utilize SSM/I and/orcombined SSM/I-IR methods to map outrain areas that can then be used toincorporate attenuation corrections forenhanced wind vector retrievals. NSCAT’s premature termination hasled to a new NASA program calledQUIKSCAT. This new scatterometerwill have frequencies similar to NSCAT,but will employ a rotating dish antennainstead of the multiple stick antennas forERS and NSCAT. QUIKSCAT willhave a major advantage in providing acontiguous 1800-km swath and thusremove the NSCAT problem of dealingwith the 350-km gap that existed in themiddle of the two 600-km swaths.Validation will occur during the winter

200
of 98-99 and JTWC should haveoperational access to the data set bySpring of 1999.
7.6 UPPER TROPOSPHERICOUTFLOW PATTERNS OVERSEVERAL VERY INTENSETROPICAL CYCLONES OF THEWESTERN NORTH PACIFIC ASREVEALED BY SOUNDINGS,DOPPLER RADAR, AND WATER-VAPOR WINDS
Authors: Bill Ward National WeatherService, Tiyan, Guam andMark A. Lander, ONR-sponsoredresearch at the University of Guam,Mangilao, Guam
As a warm-core vortex, the cycloniccirculation of a tropical cyclone (TC)weakens with height. In a mature TC,the peak winds occur within the lowestkilometer of the atmosphere. Theintensity and areal extent of the cyclonicwind field decreases with altitude. Inmost text-book illustrations (e.g., Chenand Gray 1986), the cyclonic-flowregion of the tropical cyclone is shownto decrease in size as one ascends to theupper troposphere, and in the outflowlayer (above 200 hPa) the flow isdepicted as predominantly anticyclonic. Soundings from islands of the westernNorth Pacific, vertical wind profiles oftropical cyclones obtained from Dopplerradars located on Guam and Kwajalein,and water-vapor winds from theUniversity of Wisconsin, have beencollected during the lifetimes of severalvery intense tropical cyclones that haveoccurred in the western North Pacific.These data reveal that the extent ofcyclonic circulation at upper levels is farmore extensive than is commonly
depicted, and that the signature bandsand plumes of anticyclonically curvedcirrus surrounding these tropicalcyclones (which are unusuallyinterpreted as evidence of antcyclonicoutflow aloft) are not indicative ofanticyclonic flow; but rather, they existin cyclonically curved flow for severalhundred km outward from the TC core,propagating outward and deriving theircurvature from horizontal shear. Outflow jets -- often referred to asoutflow channels -- (another featurecommonly thought to exist in the uppertropospheric flow surrounding TCs) arenot found in our data set. Instead, broadareas of flow with an outward directedradial component (with respect to thecyclone center) nearly encircle the TC.Specific areas may contain somewhatenhanced flow, but these tend to beregions that are no smaller than a fullquadrant of azimuth (in earth-relativecoordinates). In storm-relativecoordinates, the radially directedoutward flow is even more symmetrical,and exhibits a decreased azimuthalconcentration of outflow. High-speed jet streaks existing at theperiphery of tropical cyclones (usuallymarked by long cirrus plumes) have noconcentrated links to the TC's core.Indeed, all airflow directed outward atupper levels from the tropical cyclonecore appears to flow across a velocityminimum before it accelerates and entersthese peripheral jets. Some common tropical cycloneoutflow patterns emerge from our data.They show that common operationalestimation of tropical cyclone outflowfrom satellite imagery -- specifically ,determination of the regions of good orpoor outflow, and the assumption of theexistence of outflow jets (or channels)

201
based on the pattern of the cirrus cloudplumes -- is flawed.
7.7 SOME CHARACTERISTICS OFTROPICAL CYCLONEINTENSIFICATION AS REVEALEDBY HOURLY DIGITAL DVORAKANALYSIS
Author: Mark A. Lander, ONR-sponsored research at the University ofGuam, Mangilao, Guam
One of the utilities installed on thesatellite image processing equipment atthe Joint Typhoon Warning Center(JTWC), Guam, is an automated routinefor computing Dvorak "T" numbers forTCs that possess eyes. The routineadapts the rules of the Dvorak techniqueas subjectively applied to enhancedinfrared imagery in order to arrive at anobjective T number, or "Digital Dvorak"T number (referred to as DD numbers).In the western North Pacific, infraredimagery is available hourly from theGMS satellite. When applicable, hourlyDD numbers were calculated for alltyphoons of 1996 and some of the moreintense typhoons of 1995 and 1997. The evolution of the DD numbers forseveral of the more intense typhoons thatoccurred during 1995, 1996 and 1997,has revealed some characteristic changesthat occur during the lifetimes of manyof these TCs. In many cases, largefluctuations in the time series of the DDnumbers can be correlated with changesin the structure of the eye -- theformation of concentric wall cloudsbeing the most common type of change.Also, when compared with the TC'sbest-track data, other common featuresof the DD numbers emerge: during theintensifying phase of the TC, the DDnumbers tend to rise more rapidly and
peak earlier than the operationallydetermined T numbers fromconventional subjective Dvorak analysis. The characteristics of the time seriesof the DD numbers imply short-termfluctuations in the convective behaviorof TCs. These fluctuations suggest thatthere may be corresponding rapid andlarge fluctuations in the TC's intensity. Ifreal, this behavior has majorramifications for operational warningaccuracy and for intensity research(which depends largely on best-trackdata for its intensity input and for itssource of validation data). This alsoquestions our knowledge of the rates ofTC spin-up and spin-down in relation tothe convective fluctuations. Anexploration of the behavior of the DDnumbers may lay the groundwork forfuture modifications to current methodsof estimating tropical cyclone intensityfrom satellite imagery.
7.8 EVALUATION OF A SIMPLETECHNIQUE FOR PREDICTINGTHE PEAK INTENSITY AND THETIMING OF PEAK INTENSITYFOR TROPICAL CYCLONES OFTHE WESTERN NORTH PACIFIC
Authors: G. McCulloch, S. Cocks, andP. Hildebrand, Joint Typhoon WarningCenter, Guam, and Mark A. Lander,ONR-sponsored research at theUniversity of Guam, Mangilao, Guam
In recent years, operational regionalnumerical models designed for tropicalcyclone applications (e.g., the JapaneseTyphoon Model (JTYM), and the modeldeveloped by the Geophysical FluidDynamics Laboratory (GFDL),Princeton) have become capable ofsimulating realistic tropical cyclone

202
structure, as well as the capacity forlarge magnitude intensity change thatapproach those which can occur innature. Intensity predictions from real-time model runs are now routinelydistributed to tropical cyclone warningcenters. The level of skill of theseintensity predictions (and of those madeby the warning agencies) is difficult toevaluate since there are few simplebaselines against which to comparethem. Many specific problems reside underthe umbrella of tropical cyclone intensityforecasting. Presently, at JTWC, theforecaster is required to produceintensity forecasts in short (e.g., 12 hour)increments for periods of up to 72 hours.Additional forecast challenges remainlargely unexplored such as thedetermination of the peak intensity andthe timing of the peak intensity from agiven stage in the development of thetropical cyclone. Contained in the widelyused Dvorak techniques is a basic rulethat an intensifying tropical cycloneintensifies at an average rate of one "T"number per day (up to a particularpoint). This corresponds to an increaseof wind speed of approximately 20 ktper day. Dvorak also found thatwestward moving tropical cyclones areallowed a longer time in which todevelop than are those that movenorthwestward. These, in turn, developfor a longer period of time than thosetropical cyclones moving northward. A simple technique (unpublished),developed by Mundell (a formertyphoon forecaster at Joint TyphoonWarning Center, Guam), providesguidance in determining the tropicalcyclone peak intensity and the timing ofthis intensity. He found that the time topeak intensity as measured from specific
intensity thresholds, such as minimaltropical storm intensity (35 kt) andminimum typhoon intensity (65 kt), wasa strong function of the latitude at whichthese thresholds were reached. Further,the magnitude of the peak intensity wasalso a function of the latitude ofoccurrence of the benchmark intensities(e.g., the lower the latitude of achievingminimal typhoon intensity, the higherthe peak and the longer the time delayuntil peak). The Mundell techniques alsoencourage the forecaster to considerparameters that are often not given asmuch thought as the track forecast,diagnostic intensity estimate, and short-range intensity predictions. Theseinclude issues such as the number ofdays will it take a particular TC to reachpeak intensity; and the eventual peakintensity. Such statistics are not evenroutinely compiled in post-analysis. Asefforts are made to provide betterintensity forecasts, and to considerquestions such as the peak and time topeak of individual TCs, the Mundelltechniques offer a simple starting pointfor producing and evaluating forecast ofthese parameters, and for understandingthe problem of TC intensity change.
203
7.9 A LOOK AT GLOBALTROPICAL CYCLONE ACTIVITY:BASIN INTERCOMPARISONS ANDRELATIONSHIPS WITH ENSO,QBO, AND OTHER LARGE-SCALECLIMATE FEATURES
Authors: Mark A. Lander, and CharlesP. Guard, ONR-sponsored researach atthe University of Guam, Mangilao,Guam
The time series representing theannual tabulation of tropical cyclone(TC) numbers (from the annual globaltotal, as well as the annual totals withinindividual ocean basins) appears highlyerratic (i.e., there is no persistence andthe values seem to jump substantiallyfrom one year to the next). Time-lagautocorrelations of these time seriesconfirm this - all have small negativevalues at a one-year time lag. Also, mostof the time series have prominent spikesof both exceptionally low and highvalues. The high years are referred to as'prolific' years, and the low years as'meager' years. The 'prolific' years and'meager' years are identified within theglobal and basin distributions. The rangein the annual TC numbers within anygivin basin is large. The global annualaverage is 85 with a range of 66 to 105;the western North Pacific annual averageis 27 with a range of 19 to 36; the NorthAtlantic annual average is 10 with arange of 4 to 19; the eastern NorthPacific annual average is 16 with a rangeof 8 to 24; the North Indian Oceanannual average is 5 with a range of 2 to13; and the Southern Hemisphere annualaverage is 27 with a range of 19 to 38.The difference of 39 between themaximum and minimum annual global
number of TCs is more than twice that ofany individual basin. Given the relative rarity of TCformation (as a global atmosphericphenomenon) coupled with theaforementioned phenomenon of basin"prolific" and "meager" years, a naturalquestion arises. Are there compensationsamong the annual individual basin TCnumbers that act in a manner as tostabilize the global TC number (i.e.,negative correlations among some or allof the TC basins); or is the annual globalTC number destabilized by positivecorrelations among some or all of the TCbasins? The latter appears to be true.Cross-correlations between the basinsreveal weak positive correlationsamongst the western North Pacific,eastern North Pacific, and the SouthernHemisphere. During the 27-year period1969 to 1997 there were 16 years with atleast one basin experiencing a "prolific"or a "meager" year. Five of these yearshad two, or more, "prolific" and/or"meager" years. Only two of the years(1969 and 1995) had different basinssimultaneously qualified for both"prolific" and "meager" labels; the"prolific" years during these two yearswere those of the North Atlantic. There are strong relationships of theannual number of tropical cyclones inthe North Atlantic with El NiñoSouthern Oscillation (ENSO) and withthe Quasi Biennial Oscillation (QBO). Inother basins these relationships areweaker, and, at least with ENSO, theeffects are primarily upon the locationsof the TCs and not the annual numbers.Ongoing reasearch includes furtherexploration of the spatial and temporalproperties of the global TC distributionand examination of the effects of ENSO,QBO, and other climatic features on the

204
global and basin tropical-cyclone timeseries. The effects of the strong ENSOevent of 1997-98 on the global TCdistribution are receiving emphasis.
7.10 TECHNIQUESINCORPORATING SSM/IIMAGERY INTO DVORAKTROPICAL CYCLONE INTENSITYESTIMATES
Authors: S.B. Cocks, and I. Johnson,Joint Typhoon Warning Center, GuamCo-authors: Mark A. Lander and CharlesP. Guard, ONR-sponsored research atthe Univeristy of Guam, Guam
The Dvorak tropical cyclone intensityestimation technique for use on visiblesatellite data was introduced in 1975,with an additional technique for infraredsatellite data introduced in 1984. Thetechniques have performed wellthroughout ocean basins across theworld for nearly two decades ofoperational use. There are, however,cases where determination of theintensity of a tropical cyclone using theDvorak methods has been inaccurate -particularly with the infrared techniques.This often occurs when the exactlocation and/or structure of the low-levelcirculation center is not known.Instances include the central denseovercast feature, the central cold cover,or the embedded center pattern (infraredimagery only). The Special SensorMicrowave/Imager (SSM/I) has theadvantage of sensing through thick cloudcover, which can show the structure of atropical cyclone that would otherwise beunseen in infrared or visible satelliteimagery. SSM/I imagery can indicate thepresence and location of low-levelcirculation centers and banding features;and can detect whether or not an eye is
developing or already exists. Theseparticular structural features of the TCare often not discernible in conventionalsatellite imagery. This study endeavorsto develop similar rules for estimatingthe intensity of TCs using SSM/Iimagery, and to explore ways toincorporate the SSM/I into Dvorak'sconventional techniques- producingmore versatile and accurate intensityestimates. Using time matched visible, infrared,and SSM/I imagery in cases where theintensity estimate, given by Dvorakinfrared or visible satellite methods, isclear-cut, features in the SSM/I imageryare found that are indicative of tropicalcyclone intensity. There is clearly arelationship between TC intensity andspecific properties as seen on microwaveimagery. The SSM/I technique forestimating intensity was applied upon anindependent set of tropical cyclones andthe results were compared to thoseproduced by established methods. Results of the study so far indicatethat subjective estimation of SSM/Iimagery is possible; however, theaccuracy of such estimates, on average,are not as good as those provided by theuse of Dvorak's techniques onconventional visible and infraredsatellite imagery. While it is possiblethat further research may uncoveradditional properties of microwaveimagery that may allow a more accurateestimate of TC intensity, we feel that thebiggest pay-off of the SSM/I imagerywill come from providing a discipline toconventional Dvorak estimates of TCintensity. When the Dvorak intensityestimate for a given TC is not clear-cut,SSM/I imagery can provide valuableinformation that will allow one to arriveat a more representative estimate.

205
BIBLIOGRAPHY
Arnold, C.P., and C.C. Olsen, 1974: Tropicalcyclone position and intensity analysis usingsatellite data. First Weather Wing Pamphlet 105-10, 97 pp.
Atkinson, G.D., 1974: Investigation of gustfactors in tropical cyclones. Fleet WeatherCenter Technical Note: JTWC 74-1, 9pp.
______, and C.R. Holliday, 1977: Tropicalcyclone minimum sea-level pressure andmaximum sustained wind relationship for thewestern North Pacific. Mon. Wea. Rev., 105, No.4, pp 421-427 (also Fleet Weather Central/JTWCTechnical Note 75-1).
Black, and F.D. Marks, 1991: the structure ofan eye wall meso-vortex in Hurricane Hugo(1989). Preprints, 19th Conf. on Hurricanes andTropical Meteor., AMS, Miami, FL, pp 357-358.
Brand, S., 1970: Interaction of binary tropicalcyclones in the western North Pacific Ocean. J.Meteor. Soc. Japan, 50, pp 332-341.
Businger, S., and Baik, J-J., 1991: An arctichurricane over the Bering Sea. Mon. Wea. Rev.,119, pp 2293-2322.
Carr, L.E., and R.L. Elsberry, 1994:Monsoonal interactions leading to suddentropical cyclone track changes. Mon. Wea. Rev.,123, pp 265-289.
______, and ______, 1994: Systematic andintegrated approach to tropical cyclone trackforecasting, Part I: Description of basicapproach. Naval Postgraduate School publicationNPS-MR-002. Naval Postgraduate School,Monterey, CA 93943. 65 pp. plus figs. andappend.
______, ______, and Boothe, 1997: Systematicapproach to tropical cyclone forecasting:scenario-specific model and objective guidancetraits. Preprints, 22 nd Conference on Hurricanesand Tropical Meteorology. AmericanMeteorlogical Society, Boston, MA.
______, ______,and ______, 1997b:Condensed and updated version of the systematicapproach meteorological knowledge base –
Western North Pacific. Tech. Rep. NavalPostgraduate School (in press).
Chen, L., and W.M. Gray, 1986: Global viewof the upper level outflow patterns associatedwith tropical cyclone intensity change duringFGGE. Dept. of Atmos. Science Paper No. 392,Colorado State University, Fort Collins, CO,80523, 126 pp.
Climate Prediction Center (CPC), 1997:Graphical illustrations of global wind, pressure,and temperature patterns and their anomalies(also ENSO advisories and discussions). ClimateDiagnostics Bulletin. No. 97(1-12)Approximately 80 pp per monthly issue.[Available from U.S. Dept. of Commerce,Washington, DC, 20233.]
Diercks, J.M., R.C. Weir and M.K. Kopper,1982: Forecast verification and reconnaissancedata for Southern Hemisphere tropical cyclones(July 1980 through June 1982). NOCC/JTWCTechnical Note 82-1, 77 pp.
Dong, K., 1988: El Niño and tropical cyclonefrequency in the Australian region and thenorthwest pacific. Aust. Meteor. Mag., 36, 219-255.
______, and C.J. Neumann, 1983: On therelative motion of binary tropical cyclones. Mon.Wea. Rev., 111, pp 945-953
Dunnavan, G.M., 1981: Forecasting intensetropical cyclones using 700-mb equivalentpotential temperature and central sea-levelpressure. NOCC/JTWC Technical Note 81-1, 12pp.
Dvorak, V.F., 1975: Tropical Cyclone intensityanalysis and forecasting from satellite imagery.Mon. Wea. Rev., 103, pp 420-430.
______, 1984: Tropical Cyclone intensityanalysis using satellite data. NOAA Tech. Rep.NESDIS 11. US Dept. of Commerce, 46 pp.
Gray, W.M., 1978: Hurricanes: their formation,structure and likely role in the tropicalcirculation. Meteorology over the tropicaloceans, Roy. Meteor. Soc., pp 155-218.

206
Guard, C. P., 1997: Preprints of the 22nd AMSConference on Hurricanes and TropicalMeteorology, Ft. Collins, CO, May 19-23, 1997.American Meteorological Society, Boston MA,pp. 476-477.
Guard, C.P., 1983: A study of western NorthPacific tropical storms and typhoons thatintensify after recurvature. First Weather WingTechnical Note-83/002, 28 pp.
______, and M.A. Lander, 1995: Scale relatingtropical cyclone wind speed to potential damagefor the tropical Western Pacific Ocean.
Hebert, P.H., and K.O. Poteat, 1975: Asatellite classification technique for subtropicalcyclones. NOAA Technical Memorandum NWSSR-83, 25 pp.
Holland, G.J., 1980: An analytical model ofwind and pressure profiles in hurricanes. Mon.Wea. Rev., 108, No. 8, pp 1212-1218.
Holliday, C.R., and A.H. Thompson, 1979:Climatological characteristics of rapidlyintensifying typhoons . Mon. Wea. Rev., 107, No8, pp 1022-1034.
Jorgensen, D.P., 1984: Mesoscale andconvective scale characteristics of maturehurricanes. Part II: core structure of HurricaneAllen (1980). J. Atmos. Sci., 41, 1287-1311.
JTWC, 1960: Typhoon Carmen. 1960 AnnualTropical Typhoon Report, JTWC, 103-108.[NTIS AD 786147.]
______, 1979: Super Typhoon Tip. 1979Annual Tropical Typhoon Report, JTWC, 72-77.[NTIS AD A082071.]
______, 1993: Illustration of the clouddistribution in a monsoon depression. 1993Annual Tropical Cyclone Report, JTWC, p 130.[NTIS AD A285097].
______, 1994: Timing of peak intensity withrespect to the time of recurvature. 1994 AnnualTropical Cyclone Report, JTWC, Figure 3-03-3,p 51. [NTIS AD A301618] Lander, 1994a: Description of a monsoon gyreand its effects on the tropical cyclones in thewestern North Pacific during August 1991.Weather and Forecasting, 9, pp 640-654.
______, 1994b: An exploration of therelationships between tropical storm formation inthe Western North Pacific and ENSO, Mon.Wea. Rev., 122, No. 4, pp 636-651.
______, and G.J. Holland, 1993: On theinteraction of tropical-cyclone scale vortices. I:Observations. Quart. J. Roy. Meteor. Soc., 119,pp 1347-1361.
Marks, F.D. Jr., and R.A. Houze Jr., 1984:Airborne Doppler radar observations inHurricane Debby. Bull. Amer. Meteor. Soc., 44,pp 1296-1317.
Matsumoto, C.R., 1984: A statistical methodfor one- to three-day tropical cyclone trackprediction. Department of Atmospheric SciencePaper No. 379, Colorado State University, FortCollins, CO 80523, 201 pp.
Miller, D.W., and M.A. Lander, 1997a:Intensity estimation of tropical cyclones duringextratropical transition. JTWC/SATOPSTechnical Note 97-002.
Mundell, D.B., 1990: Prediction of tropicalcyclone rapid intensification events. Thesis forfulfillment of Master’s degree submitted toColorado State University, Fort Collins, CO80523, 186 pp.
Ramage, C.S., 1971: Monsoon Meteorology.Academic Press, 296 pp.
Stewart, S.R., and D. Wolff, 1997:Convectively induced mesocyclonic vortices inthe eyewall of tropical cyclones as seen byWSR-88D doppler radars. Preprints 22 nd Conf.On Hurricanes and Tropical Meteor., Ft. Collins,CO.
______, and S.W. Lyons, 1996: A WSR-88Dradar view of Tropical Cyclone Ed. Weather andForecasting, 11, pp 115-135.
Wakimoto, R.M., and P.G. Black, 1993:Damage survey of Hurricane Andrew and itsrelationship to the radar-detected eyewall. Proc.20th Conf. Hurr. and Trop. Meteor., SanAntonio, Texas, Amer. Meteor. Soc., pp 54-57.
Weatherford, C.L., 1984: Typhoon structuralvariability. Colorado State UniversityAtmospheric Science Paper No. 391, 77 pp.[Available from Department of Atmospheric

207
Science, Colorado State University, Fort Collins,CO 80523.]
Weir, R.C., 1982: Predicting the acceleration ofnorthward-moving tropical cyclones usingupper-tropospheric winds. NOCC/JTWCTechnical Note 82-2, 40 pp.
Willoughby, H.E., 1990: Temporal changes inthe primary circulation in tropical cyclones . J.Atmos. Sci., 47, pp 242-264.
______, J.A. Clos, and M.G. Shoreibah, 1982:Concentric eye walls, secondary wind maxima,and the evolution of the hurricane vortex. J.Atmos. Sci., 39, pp 395-411.
Wirfel, W.P. and S.A. Sandgathe, 1986:Forecast verification and reconnaissance data forSouthern Hemisphere tropical cyclones (July1982 through June 1984). NOCC/JTWCTechnical Note 86-1, 102 pp.
Xu, Y., and C.J. Neumann, 1985: A statisticalmodel for the prediction of western North Pacifictropical cyclone motion. NOAA TechnicalMemorandum NWS NHC 28, 30 pp.
Zehr, R.M., 1992: Tropical cyclogenesis in thewestern North Pacific. NOAA TechnicalReport, NESDIS 61, U.S. Dept. of Commerce,Washington DC, 181 pp.

208
APPENDIX ADEFINITIONS
BEST TRACK - A subjectivelysmoothed path, versus a precise and veryerratic fix-to-fix path, used to representtropical cyclone movement, and basedon an assessment of all available data.
BINARY INTERACTION - Binaryinteraction is a mutual cyclonic orbit oftwo tropical cyclones around theircentroid. Lander and Holland (1993)showed that the behavior of most binarytropical cyclones consists of anapproach, sudden capture, then a periodof steady cyclonic orbit followed by asudden escape or (less frequently) amerger.
CENTER - The vertical axis or core of atropical cyclone. Usually determined bycloud vorticity patterns, wind and/orpressure distribution.
EPHEMERIS - Position of a body(satellite) in space as a function of time;used for gridding satellite imagery.Since ephemeris gridding is based solelyon the predicted position of the satellite,it is susceptible to errors from vehiclewobble, orbital eccentricity, theoblateness of the Earth, and variation invehicle speed.
EXPLOSIVE DEEPENING - Adecrease in the minimum sea-levelpressure of a tropical cyclone of 2.5mb/hr for at least 12 hours or 5 mb/hr forat least six hours (Dunnavan 1981).
EXTRATROPICAL - A term used toindicate that a cyclone has lost its“tropical” characteristics. The termimplies both poleward displacementfrom the tropics and the conversion of
the cyclone’s primary energy sourcefrom the release of latent heat ofcondensation to baroclinic processes. Inthe XT technique (Miller and Lander1997a) a tropical cyclone is defined ashaving completed extratropical transitionwhen the circulation center has movedpoleward of the polar jet maximum orwhen water vapor imagery clearlyindicates the system has become entirelycold-core. It is important to note thatcyclones can become extratropical andstill maintain winds of typhoon or stormforce.
EYE - The central area of a tropicalcyclone when it is more than halfsurrounded by wall cloud.
INTENSITY - The maximum sustained1-minute mean surface wind speed,typically within one degree of the centerof a tropical cyclone.
MAXIMUM SUSTAINED WIND -The highest surface wind speed averagedover a 1-minute period of time. (Peakgusts over water average 20 to 25percent higher than sustained winds).
MEI-YU FRONT - The Term " mei-yu"is the Chinese expression for "plumrains". The mei-yu front is a persistanteast-west zone of disturbed weatherduring spring which is quasi -stationaryand stretches from the east China coast,across Taiwan, and eastward into thePacific south of Japan.
MONSOON DEPRESSION - Atropical cyclonic vortex characterizedby: 1) its large size, the outer-mostclosed isobar may have a diameter on

209
the order of 600 nm (1000 km); 2) aloosely organized cluster of deepconvective elements; 3) a low-level winddistribution which features a 100-nm(200-km) diameter light-wind corewhich may be partially surrounded by aband of gales; and, 4) a lack of a distinctcloud system center. Note: mostmonsoon depressions which form in thewestern North Pacific eventually acquirepersistent central convection andaccelerated core winds marking itstransition into a conventional tropicalcyclone.
MONSOON GYRE - A mode of thesummer monsoon circulation of thewestern North Pacific characterized by:1) a very large nearly circular low-levelcyclonic vortex that has an outer-mostclosed isobar with diameter on the orderof 1200 nm (2500 km); 2) a cloud bandrimming the southern through easternperiphery of the vortex/surface low; 3) arelatively long (two week) life span -initially, a subsident regime exists in itscore and western and northwesternquadrants with light winds and scatteredlow cumulus clouds; later, the areawithin the outer closed isobar may fillwith deep convective cloud and becomea monsoon depression or tropicalcyclone; and, 4) the large vortex cannotbe the result of the expanding wind fieldof a preexisting monsoon depression ortropical cyclone. Note: a series of smallor very small tropical cyclones mayemerge from the "head" or leading edgeof the peripheral cloud band of amonsoon gyre (JTWC 1993; Lander1994a).
RAPID DEEPENING - A decrease inthe minimum sea-level pressure of atropical cyclone of 1.75 mb/hr or 42 mbfor 24-hours (Holliday and Thompson
1979).
RECURVATURE - The turning of atropical cyclone from an initial pathtoward the west and poleward to eastand poleward, after moving poleward ofthe mid- tropospheric subtropical ridgeaxis.REVERSE-ORIENTED MONSOONTROUGH - The distinguishingcharacteristics of a reverse-orientedmonsoon trough in the western NorthPacific are a SW-NE (i.e., reverse)orientation of the trough axis withrespect to the normal NW-SE orientationof the trough axis, and the penetration ofthe trough axis into subtropical areasnormally the province of easterly flow.
SIGNIFICANT TROPICALCYCLONE - A tropical cyclonebecomes “significant” with the issuanceof the first numbered warning by theresponsible warning agency.
SIZE - The areal extent of a tropicalcyclone, usually measured radiallyoutward from the center to the outer-most closed isobar. Based on an averageradius of the outer-most closed isobar,size categories in degrees of latitudefollow: < 2° = very small, 2° to 3° =small, 3° to 6° = medium (average), 6°to 8° = large, and 8° or greater = verylarge (Brand 1972 and a modification ofMerrill 1982).
STRENGTH - The average wind speedof the surrounding low-level wind flow,usually measured within a one to threedegree annulus of the center of a tropicalcyclone (Weatherford and Gray 1985).
SUBTROPICAL CYCLONE - A lowpressure system that forms over the

210
ocean in the subtropics and has somecharacteristics of a tropical circulation,but not a central dense overcast.Although of upper cold low or low-levelbaroclinic origins, the system cantransition to a tropical cyclone.
SUPER TYPHOON - A typhoon withmaximum sustained 1-minute meansurface winds of 130 kt (67 m/sec) orgreater.
TROPICAL CYCLONE - A non-frontal, migratory low-pressure system,usually of synoptic scale, originatingover tropical or subtropical waters andhaving a definite organized circulation.
TROPICAL DEPRESSION - Atropical cyclone with maximumsustained 1-minute mean surface windsof 33 kt (17 m/sec) or less.
TROPICAL DISTURBANCE - Adiscrete system of apparently organizedconvection, generally 100 to 300 nm(185 to 555 km) in diameter, originatingin the tropics or subtropics, having anon-frontal, migratory character andhaving maintained its identity for 12- to24-hours. The system may or may notbe associated with a detectableperturbation of the low-level wind orpressure field. It is the basic genericdesignation which, in successive stagesof development, may be classified as atropical depression, tropical storm,typhoon or super typhoon.
TROPICAL STORM - A tropicalcyclone with maximum 1-minute meansustained surface winds in the range of34 to 63 kt (18 to 32 m/sec), inclusive.
TROPICAL UPPER-TROPOSPHERICTROUGH (TUTT) - A dominant
climatological system and a daily upper-level synoptic feature of the summerseason, over the tropical North Atlantic,North Pacific and South Pacific Oceans(Sadler 1979). Cold core lows in theTUTT are referred to as cells, or TUTTcells.
TYPHOON (HURRICANE) - Atropical cyclone with maximumsustained 1-minute mean surface windsof 64 to 129 kt (33 to 66 m/sec). Westof 180° E longitude they are calledtyphoons and east of 180° E longitudehurricanes.
WALL CLOUD - An organized band ofdeep cumuliform clouds thatimmediately surrounds the central areaof a tropical cyclone. The wall cloudmay entirely enclose or partiallysurround the center.
WESTERLY WIND BURST - A short-duration low-level westerly wind eventalong and near the equator in the westernPacific Ocean (and sometimes in theIndian Ocean) (Luther et al. 1983).Typically, a westerly wind burst (WWB)lasts several days and has westerly windsof at least 10 kt (5 m/sec) (Keen 1988).Most WWBs occur during the monsoontransition months of April-May, andNovember-December. They show somerelationship to the ENSO phenomenon(Luther et al. 1983 ; Ramage 1986).Some WWBs are even more energetic,with wind speeds of 30 kt (15 m/sec)observed during well-developedsystems. These intense WWBs areassociated with a large cluster of deep-convective cloud along the equator. Anintense WWB is a necessary precursor tothe formation of tropical cyclone twinssymmetrical with respect to the equator(Keen 1982; Lander 1990
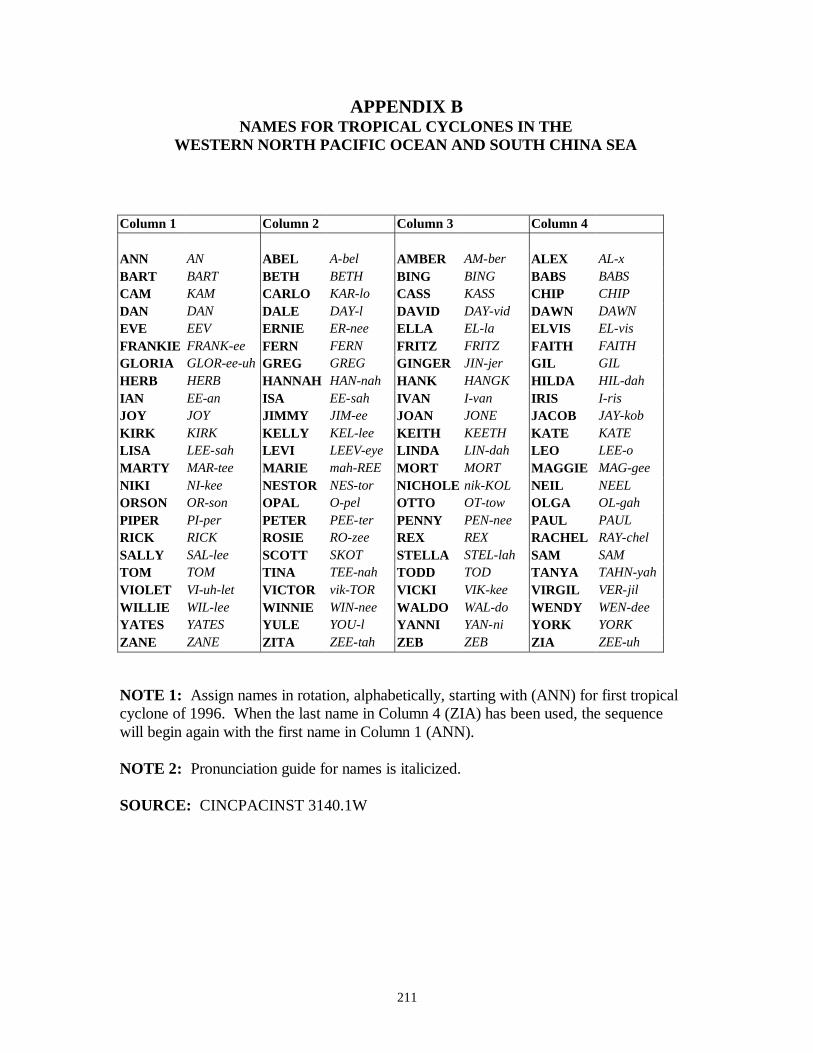
211
APPENDIX BNAMES FOR TROPICAL CYCLONES IN THE
WESTERN NORTH PACIFIC OCEAN AND SOUTH CHINA SEA
Column 1 Column 2 Column 3 Column 4
ANN AN ABEL A-bel AMBER AM-ber ALEX AL-xBART BART BETH BETH BING BING BABS BABSCAM KAM CARLO KAR-lo CASS KASS CHIP CHIPDAN DAN DALE DAY-l DAVID DAY-vid DAWN DAWNEVE EEV ERNIE ER-nee ELLA EL-la ELVIS EL-visFRANKIE FRANK-ee FERN FERN FRITZ FRITZ FAITH FAITHGLORIA GLOR-ee-uh GREG GREG GINGER JIN-jer GIL GILHERB HERB HANNAH HAN-nah HANK HANGK HILDA HIL-dahIAN EE-an ISA EE-sah IVAN I-van IRIS I-risJOY JOY JIMMY JIM-ee JOAN JONE JACOB JAY-kobKIRK KIRK KELLY KEL-lee KEITH KEETH KATE KATELISA LEE-sah LEVI LEEV-eye LINDA LIN-dah LEO LEE-oMARTY MAR-tee MARIE mah-REE MORT MORT MAGGIE MAG-geeNIKI NI-kee NESTOR NES-tor NICHOLE nik-KOL NEIL NEELORSON OR-son OPAL O-pel OTTO OT-tow OLGA OL-gahPIPER PI-per PETER PEE-ter PENNY PEN-nee PAUL PAULRICK RICK ROSIE RO-zee REX REX RACHEL RAY-chelSALLY SAL-lee SCOTT SKOT STELLA STEL-lah SAM SAMTOM TOM TINA TEE-nah TODD TOD TANYA TAHN-yahVIOLET VI-uh-let VICTOR vik-TOR VICKI VIK-kee VIRGIL VER-jilWILLIE WIL-lee WINNIE WIN-nee WALDO WAL-do WENDY WEN-deeYATES YATES YULE YOU-l YANNI YAN-ni YORK YORKZANE ZANE ZITA ZEE-tah ZEB ZEB ZIA ZEE-uh
NOTE 1: Assign names in rotation, alphabetically, starting with (ANN) for first tropicalcyclone of 1996. When the last name in Column 4 (ZIA) has been used, the sequencewill begin again with the first name in Column 1 (ANN).
NOTE 2: Pronunciation guide for names is italicized.
SOURCE: CINCPACINST 3140.1W

212
APPENDIX CCONTRACTIONS
AB Air Base
ABW Air Base Wing
ABIO Significant TropicalWeather Advisory for
the Indian Ocean
ABPW Significant TropicalWeather Advisory for the Western PacificOcean
ACCS Air Control CenterSquadron
ACFT Aircraft
ADEOS Japanese Advanced Earth Observing Satellite
ADP Automated Data Processing
AFB Air Force Base
AFDIS Air Force Dial-In System
AFWA Air Force Weather Agency
AIREP Aircraft (Weather) Report
AJTWC Alternate Joint Typhoon Warning Center
AMOS AutomaticMeteorologicalObserving Station
AOR Area of Responsibility
ARC Automated Remote Collection (system)
ARGOS (International Service for Drifting Buoys)
ARQ Automated Response to Query
ATCF Automated Tropical Cyclone Forecast (system)
ATCR Annual Tropical Cyclone Report
AUTODIN AutomatedDigital Network
AVHRR Advanced Very High Resolution Radiometer
AWDS Automated WeatherDistribution System
AWN Automated Weather Network
BLND Blended (Hybrid Aid)
BRAC Base Realignment and Closure
CDO Central Dense Overcast
CI Current Intensity
CIMSS Cooperative Institute for Meterological Satellite Studies
CIV Civilian
CLD Cloud
CLIM Climatology
CLIP or Climatology andCLIPER Persistence Technique
CM Centimeter(s)
C-MAN Coastal-Marine Automated Network
CMOD Compact meteorological and Oceanographic Drifter (buoy)
COMNAVMETOCCOM orCNMOC Commander Naval Meteorology and Oceanography Command
CPA Closest Point of Approach
CPHC Central Pacific Hurricane Center
CSC Cloud System Center
CSUM Colorado State University Model
CW Continuous Wave
DAVE Name of a Hybrid Aid
DD Digital Dvorak
DDN Defense Data Network
DEG Degree(s)
DFS Digital Facsimile System
DISN Defense Information Systems Network
DMS Defense Messaging System
DMSP Defense MeteorologicalSatellite Program
DOD Department of Defense
DSN Defense Switched Network
DTG Date Time Group
EGRR Bracknell Model

213
ENSO El Niño-Southern Oscillation
ERS European Remote Sensing Satellite
FBAM FNOC Beta and Advection Model
FI Forecast Intensity (Dvorak)
FLENUMETOCCEN FleetNumerical Meteorology and Oceanography Center
FT Foot/Feet
FTP File Transfer Protocol
GFDN Geophysical Fluid Dynamics-Navy Model
GCA Great Circle Arc
GFDN Geophysical Fluid Dynamics - Navy
GMS Japan Geostationary Meteorological Satellite
GMT Greenwich Mean Time
GOES Geostationary OperationalEnvironmental Satellite
GSRS Geostationary SatelliteReceiving System
GTS Global Telecommun- ications System
HIRS High Resolution Infrared Sounder
hPa Hectopascal
HPAC Mean of XTRP and CLIM Techniques (HalfPersistence and Climatology)
HF High Frequency
HR Hour(s)
HRPT High ResolutionPicture Transmission
ICAO International Civil Aviation Organization
INIT Initial
INST Instruction
IP Internet ProtocolIR Infrared
JGSM Japanese Global Spectral model
JTWC Joint Typhoon Warning Center
JTWC92 Statistical-Dynamical or JT92 ObjectiveTechnique
JTYM Japanese Typhoon Model
KM Kilometer(s)
KT Knot(s)
LAN Local Area Network
LAT Latitude
LLCC Low-Level CirculationCenter
LONG Longitude
LUT Local User Terminal
LVL Level
M Meter(s)
MAX Maximum
MB Millibar(s)
MBAM Medium Beta and Advection Model
MCAS Marine CorpsAir Station
MCS Mesoscale Convective System
MET Meteorological
METEOSAT EuropeanMeteorological Satellite
MIDDAS MeteorologicalImagery, Data Display,and Analysis System
MIN Minimum
MINI-MET Mini-Meteorological (buoy)
MISTIC Mission Sensor Tactical Imaging Computer
MM Millimeter(s)
MOVG Moving
MSLP Minimum Sea-level Pressure
MSU Microwave Sounding Unit
NARDAC Naval Regional DataAutomation Center
NAS Naval Air Station
NASA National Aeronautics and SpaceAdministration
NAVPACMETOCCEN NavalPacific Meteorology and Oceanography Center(Hawaii)
NAVPACMETOCCEN WESTNaval PacificMeteorology andOceanography Center
West (Guam)
NCEP National Centers for EnvironmentalPrediction
NEDN Naval Environmental Data Network

214
NESDIS National EnvironmentalSatellite, Data, andInformation S ervice
NESN Naval Environmental Satellite Network
NEXRAD Next Generation (Doppler Weather) Radar (WSR-88D)
NGDC National Geophysical Data Center
NHC National Hurricane Center
NIPRNET Non-secure Internet Protocol Router Network
NM Nautical Mile(s)
NMC National Meteorological Center
NOAA National Oceanic andAtmosphericAdministration
NODDES Naval Environmental Data Network Oceanographic DataDistribution and Expansion System
NOGAPS Navy Operationalor NGPS Global Atmospheric
Prediction System
NODDS Naval Oceanography Data Distribution Systems
NPS Naval Postgraduate School
NR Number
NRL Naval Research Laboratory
NRL-MRY Naval Research Laboratory atMonterey, CA
NRPS or Navy Operational
NORAPS Regional Atmospheric Prediction System
NSCAT NASA Scatterometer
NSDS-G Naval Satellite DisplaySystem - Geostationary
NTWP Naval Telecommunications Area Master Station, Western Pacific
SIPRNET Secret InternetProtocol Router Network
NWP Northwest Pacific
NWS National Weather Service
OBS Observations
OLS Operational LinescanSystem
ONR Office of Naval Research
OSS Operations SupportSquadron
OSB Ocean Sciences Branch
OTCM One-Way (Interactive)Tropical Cyclone Model
PACAF Pacific Air Force
PACMEDS PacificMeteorological DataSystem
PACOM Pacific Command
PAGASA PhilippineAtmosphericGeophysical, and Astronomical Services Administation
PC Personal Computer
PCN Position Code Number
PDN Public Data Network
PIREP Pilot Weather Report(s)
QBO Quasi-Biennial Oscillation
RADOB Radar Observation
RECON Reconnaissance
RECR Recurve (Forecast Aid)
RMSE Root mean square error
ROCI Radius of outer-mostclosed isobar
SAT Satellite
SCS South China Sea
SDHS Satellite Data HandlingSystem
SEC Second(s)
SFC Surface
SGDB Satellite Global Data Base
SIPRNET Secret InternetProtocol Router Network
SLP Sea-Level Pressure
SPAWRSYSCOM Space and Naval Warfare Systems Command
SPIDR Space Physics Interactive Data Resource
SSM/I Special SensorMicrowave/Imager
SST Sea Surface Temperature
SSU Stratosphere Sounding Unit

215
ST Subtropical
STNRY Stationary
STR Subtropical Ridge
STRT Straight (Forecast Aid)
STY Super Typhoon
SWDIS Satellite Weather Data Imaging System
TAPT Typhoon AccelerationPrediction Technique
TC Tropical Cyclone
TCFA Tropical Cyclone Formation Alert
TD Tropical Depression
TDA Typhoon Duty Assistant
TDO Typhoon Duty Officer
TELEFAX Telephone Facsimile
TESS Tactical Environmental Support System
TIFF Tagged Image File Format
TIROS-N Television InfraredObservational Satellite- Next Generation
TOGA Tropical Ocean Global Atmosphere
TOVS TIROS OperationalVertical Sounder
TS Tropical Storm
TUTT Tropical Upper-Tropospheric Trough
TY Typhoon
TYAN Typhoon Analog (Forecast Aid)
ULCC Upper-Level Circulation Center
US United States
USAF United States Air Force
USCINCPAC Commander-in-Chief Pacific (AF - Air Force, FLT - Fleet)
USN United States Navy
VIS Visual
WAN Wide Area Network
WESTPAC Western (North)Pacific
WGTD Weighted (Hybrid Aid)
WMO World MeteorologicalOrganization
WNP Western North Pacific
WRN or Warning(s)WRNG
WSD Wind Speed and Direction
WSR-88D Weather Surveillance Radar - 1988 Doppler
WVTW Water Vapor Tracked Winds
WWB Westerly Wind Burst
WWW World Wide Web
XT Extratropical
XTRP Extrapolation
Z Zulu time(Greenwich Mean Time/Universal Coordinated Time)

216
APPENDIX D
PAST ANNUAL TROPICAL CYCLONE REPORTS
Copies of the past Annual Tropical Cyclone Reports for DOD agencies or contractorscan be obtained through:
Defense Technical Information Center (DTIC)DTIC-BR (Reference & Retrieval Division)
8725 John J. Kingman RoadSuite 0940
Ft. Belvoir, VA 22060-6218
Phone: comm (703) 767-8274DSN 427-9070
Fax: comm (703) 767-9070DSN 427-9070
Copies for non-DOD agencies or users can be obtained from:
National Technical Information Service5285 Port Royal RoadSpringfield, VA 22161
Phone: (703) 487-4650Fax: (703) 321-8547
Refer to the following numbers when ordering:
Acquisition Acquisition AcquisitionYear Number Year Number Year Number
1959 AD 786147 1972 AD 768334 1985 AD A1682841960 AD 786148 1973 AD 777093 1986 AD A1840821961 AD 786149 1974 AD 010271 1987 AD A1918831962 AD 786128 1975 AD A023601 1988 AD A2072061963 AD 786208 1976 AD A038484 1989 AD A2324691964 AD 786209 1977 AD A055512 1990 AD A2399101965 AD 786210 1978 AD A070904 1991 AD A2519521966 AD 785891 1979 AD A082071 1992 AD A2744641967 AD 785344 1980 AD A094668 1993 AD A2850971968 AD 785251 1981 AD A112002 1994 AD A3016181969 AD 785178 1982 AD A124860 1995 AD A3216111970 AD 785252 1983 AD A137836 1996 AD A3329161971 AD 768333 1984 AD A153395