Evaluation of a Wind-Wave System for Ensemble Tropical Cyclone Wave Forecasting. Part I: Winds

1 23
Natural HazardsJournal of the International Societyfor the Prevention and Mitigation ofNatural Hazards ISSN 0921-030XVolume 59Number 2 Nat Hazards (2011) 59:1161-1174DOI 10.1007/s11069-011-9827-3
Developing a new sinuosity index forcyclone tracks in the tropical South Pacific
James P. Terry & Gennady Gienko

1 23
Your article is protected by copyright and
all rights are held exclusively by Springer
Science+Business Media B.V.. This e-offprint
is for personal use only and shall not be self-
archived in electronic repositories. If you
wish to self-archive your work, please use the
accepted author’s version for posting to your
own website or your institution’s repository.
You may further deposit the accepted author’s
version on a funder’s repository at a funder’s
request, provided it is not made publicly
available until 12 months after publication.

ORI GIN AL PA PER
Developing a new sinuosity index for cyclone tracksin the tropical South Pacific
James P. Terry • Gennady Gienko
Received: 22 December 2009 / Accepted: 20 April 2011 / Published online: 6 May 2011� Springer Science+Business Media B.V. 2011
Abstract This paper introduces a new metric for tropical cyclone track shape within the
tropical South Pacific (TSP) basin, based on measurements of track sinuosity. A sinuosity
index (SI) is developed by applying a simple cube-root transformation to original track
sinuosity values. Based on the resulting near-normal SI distribution, an ordinal four-
category (quartile) naming system is then proposed for track-type classification. Track
sinuosity patterns are also investigated over the last four decades (1970–2008). Analytical
findings suggest that cyclone track sinuosity is an important parameter influencing the
potential vulnerability of island archipelagoes to cyclone hazard. Principally, sinuously
moving cyclones show some tendency for greater longevity and intensity than straighter-
tracking storms and make up a larger proportion of systems forming in the western tropical
South Pacific than those generated farther east. Although no long-term statistical trend can
be established, track sinuosity is highly variable through time, implying that the TSP basin
and the islands therein will continue to experience large but irregular inter-annual fluc-
tuations in cyclone track morphology.
Keywords Tropical cyclones � South Pacific � Track sinuosity
1 Introduction and aims
The majority of developing island nations across the South Pacific Ocean are vulnerable to
both the environmental and economic impacts of tropical cyclones. In terms of numbers of
communities afflicted and overall hardship produced, these severe storms pose the most
J. P. Terry (&)Department of Geography, National University of Singapore, AS2, 1 Arts Link,Kent Ridge 117570, Singaporee-mail: [email protected]
G. GienkoDepartment of Geomatics, School of Engineering, University of Alaska Anchorage,3211 Providence Drive, Anchorage, AK 99508-4514, USAe-mail: [email protected]
123
Nat Hazards (2011) 59:1161–1174DOI 10.1007/s11069-011-9827-3
Author's personal copy

significant annual threat to the livelihoods of scattered populations inhabiting the region
and adversely affect the sustainability of small-island economies when they strike. For
example, widespread flooding generated by Cyclone Kina in 1993 across Fiji wiped out
food crops and livestock herds, with the total costs of flood damage reaching FJD188
million (FMS 1997; Raucher 2000). Similarly, Cyclone Heta in 2004 wrought devastation
on the tiny nation of Niue (Barnett and Ellemor 2007), amounting to approximately double
the national GDP. Fortunately, not all tropical cyclones result in such extreme conse-
quences. Nevertheless, such examples highlight the importance of maintaining a concerted
scientific focus on understanding cyclone behaviour in the tropical South Pacific (TSP)
region, especially because evolving scenarios of climate change suggest that some cyclone
characteristics (e.g. intensity and rainfall) may respond to rising sea-surface temperatures
associated with enhanced greenhouse conditions (e.g. Emanuel 2004; Elsner et al. 2008;
Knutson and Tuleya 2008).
While research has traditionally focused on the origins, frequency and intensity of
tropical cyclones in affected ocean basins (e.g. Emanuel 2004; Webster et al. 2005), in part
because these characteristics bear directly on the insurable risk of the hazard, there has also
been a growing interest in examining the nature of and patterns in cyclone tracks (e.g.
Dengler 1997; Fraedrich and Leslie 1989; Chand and Walsh 2009). The track is the
‘meandering’ path a cyclone follows as it matures and migrates away from its point of
cyclogenesis. As track shape is the surficial linear expression of cyclone movement,
impetus for investigating this feature arises both from the influence it has on which parts of
the South Pacific (and therefore which islands) face a risk of strike by active cyclones and
from overarching questions about how cyclone track characteristics globally might be
affected by long-term climate change (Walsh 2004; Kossin et al. 2010). Furthermore,
assessment of track density and clustering has recently been demonstrated to assist in
determining whether cyclone activity is enhanced or suppressed by certain (phases of)
broad-scale environmental modulators such as ENSO or MJO (Kim et al. 2010a; Kossin
et al. 2010).
Within this context, one parameter that has received less attention in studies of cyclone
movement is the sinuosity of the storm tracks. Sinuosity is one measure of linear shape,
specifically how much a meandering track deviates from a straight line (Terry and Feng
2010). For a flat surface, sinuosity is simply calculated as the ratio of the actual distance
(numerator) against the straight-line distance between two points (denominator) (DeMers
2008). The lowest possible sinuosity measurement is therefore 1. In the case of cyclones
moving over the curved surface of the Earth, determining sinuosity is slightly more
involved: the ‘actual’ and ‘straight’ distances are measured using the law of haversines
from spherical trigonometry. Nonetheless, sinuosity can be easily quantified if tracks are
analysed within a GIS environment. It is perhaps surprising that track sinuosity has been
neglected in cyclone research since it is both a simple metric to comprehend and is
mathematically easier to manage than, for instance, trying to fit complex non-linear
equations to convoluted track shapes. Also, if track sinuosity correlates well with other
important cyclone parameters such as duration, it may prove to be a useful indicator of the
hazard facing particular islands within the TSP region.
Tropical cyclones in the TSP region generally move south and east away from their
point of formation (Terry 2007), although individual systems may follow any compass
bearing at some stage in their lifespan. Consequently, many storm tracks have relatively
simple shapes without sharp bends, but others describe complex morphology with sharp
inflections or recurving backtracks. Infrequently, storm tracks loop with either open or
tight curvature, in clockwise or counter-clockwise directions. The movement of cyclones
1162 Nat Hazards (2011) 59:1161–1174
123
Author's personal copy
describing these atypical track shapes is notoriously hard to predict. In spite of these
considerations, no analysis has yet determined whether cyclone track sinuosity is geo-
spatially organised across the region or shows any temporal change over the modern period
of satellite observations. Hence, the objectives of the current investigation are to: 1.
measure sinuosity (S) values for all individual cyclone tracks in the study area since 1970,
2. devise an appropriate ‘sinuosity index’ (SI) metric based on transformed (normalised)
sinuosity values, 3. categorise cyclone track sinuosity into appropriately named groups and
4. identify any spatio-temporal patterns in sinuosity. Key findings are then summarised
with reference to the vulnerability of small island nations in the TSP region.
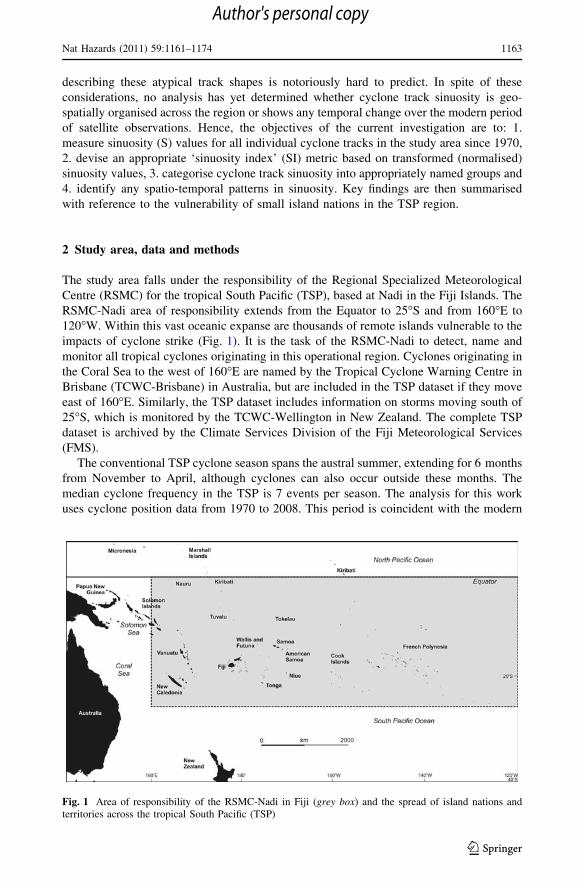
2 Study area, data and methods
The study area falls under the responsibility of the Regional Specialized Meteorological
Centre (RSMC) for the tropical South Pacific (TSP), based at Nadi in the Fiji Islands. The
RSMC-Nadi area of responsibility extends from the Equator to 25�S and from 160�E to
120�W. Within this vast oceanic expanse are thousands of remote islands vulnerable to the
impacts of cyclone strike (Fig. 1). It is the task of the RSMC-Nadi to detect, name and
monitor all tropical cyclones originating in this operational region. Cyclones originating in
the Coral Sea to the west of 160�E are named by the Tropical Cyclone Warning Centre in
Brisbane (TCWC-Brisbane) in Australia, but are included in the TSP dataset if they move
east of 160�E. Similarly, the TSP dataset includes information on storms moving south of
25�S, which is monitored by the TCWC-Wellington in New Zealand. The complete TSP
dataset is archived by the Climate Services Division of the Fiji Meteorological Services
(FMS).
The conventional TSP cyclone season spans the austral summer, extending for 6 months
from November to April, although cyclones can also occur outside these months. The
median cyclone frequency in the TSP is 7 events per season. The analysis for this work
uses cyclone position data from 1970 to 2008. This period is coincident with the modern
Fig. 1 Area of responsibility of the RSMC-Nadi in Fiji (grey box) and the spread of island nations andterritories across the tropical South Pacific (TSP)
Nat Hazards (2011) 59:1161–1174 1163
123
Author's personal copy

era of satellite observation (Steiner 1980). At the start Fiji relied on imagery from US and
Russian (Meteor series) polar-orbiting satellites, until 1979 when geostationary satellite
imagery became available (S. Ready personal communication, New Zealand Meteoro-
logical Service). Thus, there are issues surrounding data homogeneity as satellite coverage
was thinner and image quality poorer in the 1970s compared to recent times (see ‘Results
and Discussion’).
The current RSMC-Nadi best-track data comprise a set of records containing the
cyclone name, time stamp, position (latitude, longitude), sea-level pressure and wind speed
recorded at fixed time intervals. Although essential information from 1970 until 2008 is
generally congruent, various different arrangements to store data have been used over time.
The source data were therefore reformatted into a uniform style to create a single database
containing information on 291 tropical cyclones in the TSP study area. Several iterations
were developed for data checking and consistency of date/time stamps, while geographical
coordinates were checked automatically by programming appropriate scripts. The uniform
database was then filtered to exclude the early or late depressional phases of storms (winds
B34 knots). Since wind speed has been recorded in 5-knot increments, the first position
along a track with wind strength at 35 knots was therefore selected to identify the genesis
location for each cyclone. To establish decay points, in practice, it was decided against
using the mathematically closest recorded value (35 knots) as the threshold, as the storm is
still in a cyclonic phase at this wind speed. Instead, the first reading of 30 knots was chosen
to identify the end of the cyclone track.
Filtering also excluded position data beyond the southern boundary of the TSP region
(25�S). In practice, this means that of the total 291 cyclones on record, entire tracks are
used for 122 storms that decayed within the TSP area, whereas partial tracks are used for
the 169 storms that travelled poleward of 25�S. Intuitively, quantifying sinuosity for a mix
of whole and partial tracks may appear questionable, but there are compelling arguments
for taking this approach. The principal reason is that most of the territory and virtually all
the islands of developing South Pacific nations are located above 25�S, and it is within the
framework of island vulnerability to tropical cyclones that this study is carried out. A
previous study of cyclone climatology successfully used similar methodology (Terry and
Gienko 2010). Another consideration is that cyclones migrating beyond 25�S become
extra-tropical systems, the remains of which may eventually transform into mid-latitude
depressions. Recognising the time of this transition is not always easy, thus affecting the
location of ‘official’ track end points. Lastly, comparison of ‘like with like’ is important.
The majority of cyclones surviving into sub-tropical waters follow relatively straight tracks
poleward of 25�S, even if they meandered significantly within the tropics (Terry 2007).
Consequently, measuring sinuosity of a whole cyclone track that might stretch as far as the
mid-latitudes gives a misleading impression of track shape within the tropical zone,
thereby making comparison difficult with the 42% of cyclones that remained entirely
within the TSP region. For illustration, Fig. 2 plots cyclones Harry in February 1989 and
Zuman in March 1998. Both show far more sinuous track morphology equatorward of 25�S
than poleward of this boundary. Such examples indicate how analysis of track sinuosity
patterns across the tropical South Pacific requires sinuosity values measured within the
equivalent area, but not beyond.
Within the confines outlined above, track sinuosity for each cyclone was measured
using GIS tools as the actual distance of storm travel, divided by the vector distance
between start and finish points. Each pair of distances was measured on the Earth-surface
sphere using the law of haversines from spherical trigonometry.
1164 Nat Hazards (2011) 59:1161–1174
123
Author's personal copy

3 Results and discussion
3.1 Sinuosity values: statistical distribution and data transformation
Table 1 summarises the sinuosity observations for 291 cyclone tracks in the TSP region
between 1970 and 2008. Figure 3a shows the shape of the data distribution. It is seen that
although the sinuosity median is small (1.105), the range is large (1–52.7), thus giving a
Fig. 2 Tracks of cyclones Harry (February 1989) and Zuman (April 1998) illustrate how sinuous cyclonetracks within the tropical South Pacific (north of 25�S) normally become straighter if storms migrate deepinto extra-tropical latitudes. Consequently, track sinuosity here is measured only until the 25�S boundary ofthe study area, to validate comparison with the proportion of cyclones (42%) that remain entirely withintropical waters
Table 1 Sinuosity distribution and descriptive statistics for cyclone tracks in the tropical South Pacific
Statisticalparameter
Measuredsinuosity (S)(to 25�S)
Measured sinuosity(S) (to end ofcyclone track)
Sinuosity indexvalues (SI)(to 25�S)
Sinuosity indexvalues (SI) (to endof cyclone track)
No. of cyclones 291 291 291 291
Mean 1.426 1.446 5.155 5.501
Median 1.105 1.123 4.724 4.975
SD 3.047 3.045 3.266 3.123
Kurtosis 280.386 280.335 31.498 36.264
Skewness 16.602 16.599 3.614 3.966
Range 51.744 51.744 37.264 37.264
Minimum 1 1 0 0
Maximum 52.744 52.744 37.264 37.264
Dataset statistical attributes are similar for track sinuosity measured to the 25�S boundary and for completetracks to cyclone decay (see text)
Nat Hazards (2011) 59:1161–1174 1165
123
Author's personal copy

highly skewed distribution (skewness = 16.6). Observed skewing is directly related to the
mathematical limits of sinuosity values, since the minimum possible S-value is unity
whereas high S-values have no upper bound. To exemplify the point, the largest measured
value for track sinuosity is 52.7 for Cyclone Katrina in January 1998, meaning this storm
travelled nearly 53 times as far as the straight distance between its genesis and decay
points. This and other cases of highly convoluted tracks effectively stretch the right side of
the sinuosity distribution to produce the strong positive skewing. Consequently, it is less
meaningful to perform statistical analysis on the raw sinuosity observations because a few
extreme values in the dataset are likely to produce spurious results.
In response, measured sinuosity values were checked against various distributions using
both graphical and quantitative (parametric) approaches. First, the histogram in Fig. 3a was
examined to identify the general form of data distribution, and then several theoretical
distributions were tested to fit the real data. Fitting theoretical distributions suggested that
the Frechet distribution (Fisher-Tippett type 2) has the best fit to the source data with
DXCDF = 2.95%. DXCDF is the absolute difference between calculated and observed fre-
quencies in the cumulative density function, expressed as a percentage. Next, in order to
Fig. 3 Distributions of a measured sinuosity values (S) and b normalised values of a proposed sinuosityindex (SI), for 291 cyclone tracks in the tropical South Pacific over the period 1970–2008
1166 Nat Hazards (2011) 59:1161–1174
123
Author's personal copy

bring the observed distribution close to normal, the original data need to be transformed.
There are many valid reasons for utilising data transformations, including improvement of
normality, variance stabilization and conversion of scales to interval measurement. Here,
transforming the data to approach a normal shape is beneficial so that outliers can be
identified and eliminated from further analysis and to validate the use of parametric sta-
tistics in the investigation of relationships (e.g. correlation) between sinuosity and other
cyclone variables of interest.
Data transformations are the application of a mathematical modification to the values of
a variable. There are a great variety of possible data transformations, from adding constants
to multiplying, squaring or raising to a power, converting to logarithmic scales, inverting
and reflecting, taking the square root of the values and even applying trigonometric
transformations such as sine wave transformations (Osborne 2002a). Some other trans-
formations include Logit, Normal z-transform, Box–Cox (power transforms) and angular
transforms (Kottegoda and Rosso 1997; De Smith et al. 2007, Rosenshein et al. 2011). The
most common transformation techniques used for data normalisation are: radical trans-
formation (N-th root, but mostly square root and cube root), log transformations
(with different bases) and inverse transformation (computing 1/X for the source variable
X) (Osborne 2002b). Several transformations were tested to bring observed sinuosity
values close to the normal distribution (Table 2).
As the square-root transformation shows better results in comparative tests, several
further options were explored based on radical function (roots) to normalise the sinuosity
values. The source variables were transformed by a combination of data shift, multipli-
cation and squaring. The general formula for calculating the SI (a dimensionless norma-
lised sinuosity index) is as follows:
SI ¼ffiffiffiffiffiffiffiffiffiffiffiffiffiffiffi
ðS� 1Þnp
� 10
where, SI = Sinuosity Index value, S = measured sinuosity for an individual cyclone
track
The subtraction (S-1) allows the transformed distribution for SI to start at zero. The
product 910 is introduced for convenience, so that SI values are mainly [1, to avoid
dealing in small decimal fractions. Results of applying several transformations, based on
radical functions with different N numbers, were tested against various theoretical distri-
butions. Transformation with N = 3 (cube root) yields a ‘quasi-normal’ approximation of
the original sinuosity data, with reasonable deviation from theoretical normal distribution
(DXCDF = 3.53%). While higher N numbers result in slightly closer approximations to the
normal distribution, such transformations more rigorously alter the original data.
Table 2 Results of applying various data transformations on measured values of cyclone track sinuosity
Applied transformation Resulting distribution DXCDF (%)
Square root Log-normal 0.95
Inverse Exponential 1.57
Freeman-Tukey (for inverse sinuosity) Exponential 1.65
Natural log Frechet (Fisher-Tippett, type 2) 2.67
Box–Cox (K = 2) Frechet (Fisher-Tippett, type 2) 3.63
Exponential Frechet (Fisher-Tippett, type 2) 9.17
Nat Hazards (2011) 59:1161–1174 1167
123
Author's personal copy
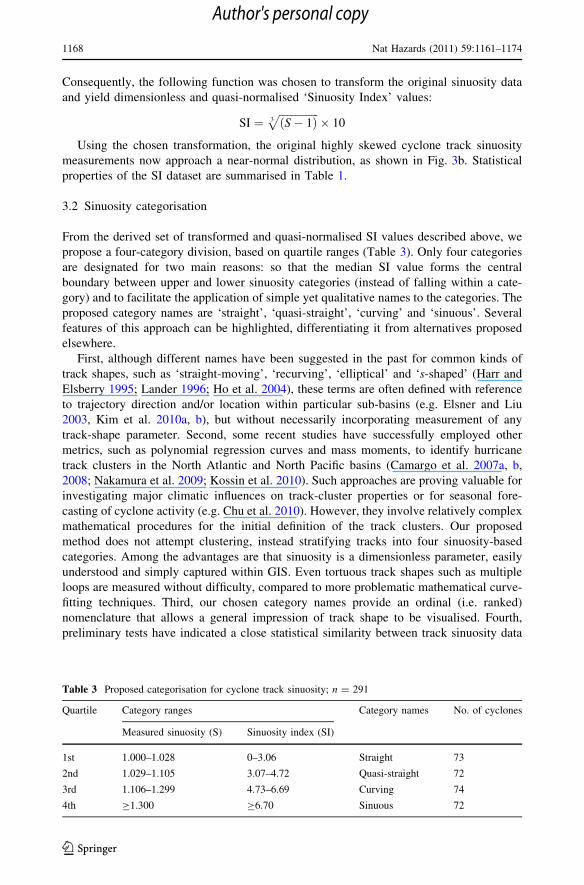
Consequently, the following function was chosen to transform the original sinuosity data
and yield dimensionless and quasi-normalised ‘Sinuosity Index’ values:
SI ¼ffiffiffiffiffiffiffiffiffiffiffiffiffiffiffi
ðS� 1Þ3p
� 10
Using the chosen transformation, the original highly skewed cyclone track sinuosity
measurements now approach a near-normal distribution, as shown in Fig. 3b. Statistical
properties of the SI dataset are summarised in Table 1.
3.2 Sinuosity categorisation
From the derived set of transformed and quasi-normalised SI values described above, we
propose a four-category division, based on quartile ranges (Table 3). Only four categories
are designated for two main reasons: so that the median SI value forms the central
boundary between upper and lower sinuosity categories (instead of falling within a cate-
gory) and to facilitate the application of simple yet qualitative names to the categories. The
proposed category names are ‘straight’, ‘quasi-straight’, ‘curving’ and ‘sinuous’. Several
features of this approach can be highlighted, differentiating it from alternatives proposed
elsewhere.
First, although different names have been suggested in the past for common kinds of
track shapes, such as ‘straight-moving’, ‘recurving’, ‘elliptical’ and ‘s-shaped’ (Harr and
Elsberry 1995; Lander 1996; Ho et al. 2004), these terms are often defined with reference
to trajectory direction and/or location within particular sub-basins (e.g. Elsner and Liu
2003, Kim et al. 2010a, b), but without necessarily incorporating measurement of any
track-shape parameter. Second, some recent studies have successfully employed other
metrics, such as polynomial regression curves and mass moments, to identify hurricane
track clusters in the North Atlantic and North Pacific basins (Camargo et al. 2007a, b,
2008; Nakamura et al. 2009; Kossin et al. 2010). Such approaches are proving valuable for
investigating major climatic influences on track-cluster properties or for seasonal fore-
casting of cyclone activity (e.g. Chu et al. 2010). However, they involve relatively complex
mathematical procedures for the initial definition of the track clusters. Our proposed
method does not attempt clustering, instead stratifying tracks into four sinuosity-based
categories. Among the advantages are that sinuosity is a dimensionless parameter, easily
understood and simply captured within GIS. Even tortuous track shapes such as multiple
loops are measured without difficulty, compared to more problematic mathematical curve-
fitting techniques. Third, our chosen category names provide an ordinal (i.e. ranked)
nomenclature that allows a general impression of track shape to be visualised. Fourth,
preliminary tests have indicated a close statistical similarity between track sinuosity data
Table 3 Proposed categorisation for cyclone track sinuosity; n = 291
Quartile Category ranges Category names No. of cyclones
Measured sinuosity (S) Sinuosity index (SI)
1st 1.000–1.028 0–3.06 Straight 73
2nd 1.029–1.105 3.07–4.72 Quasi-straight 72
3rd 1.106–1.299 4.73–6.69 Curving 74
4th C1.300 C6.70 Sinuous 72
1168 Nat Hazards (2011) 59:1161–1174
123
Author's personal copy
for TSP cyclones and North Pacific typhoons, so demonstrating the inter-basin transfer-
ability of a sinuosity-based track classification system (Terry and Feng 2010).
Therefore, the intention here is not to promote our track-sinuosity metric or categori-
sation as superior to alternatives developed elsewhere, but to demonstrate that the meth-
odology provides a convenient system for comparing temporal and spatial changes in one
neglected feature in cyclone track morphometric analysis, as described below.
3.3 Variability and trends
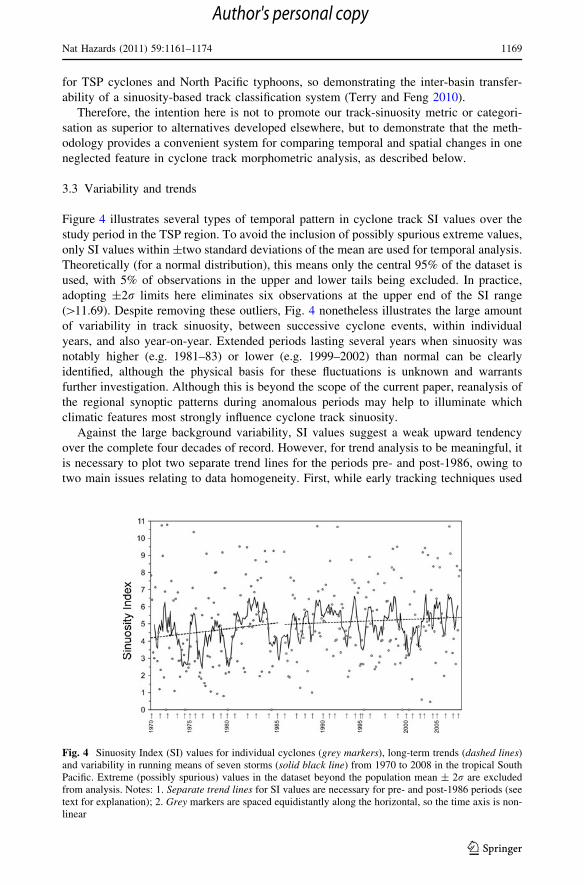
Figure 4 illustrates several types of temporal pattern in cyclone track SI values over the
study period in the TSP region. To avoid the inclusion of possibly spurious extreme values,
only SI values within ±two standard deviations of the mean are used for temporal analysis.
Theoretically (for a normal distribution), this means only the central 95% of the dataset is
used, with 5% of observations in the upper and lower tails being excluded. In practice,
adopting ±2r limits here eliminates six observations at the upper end of the SI range
([11.69). Despite removing these outliers, Fig. 4 nonetheless illustrates the large amount
of variability in track sinuosity, between successive cyclone events, within individual
years, and also year-on-year. Extended periods lasting several years when sinuosity was
notably higher (e.g. 1981–83) or lower (e.g. 1999–2002) than normal can be clearly
identified, although the physical basis for these fluctuations is unknown and warrants
further investigation. Although this is beyond the scope of the current paper, reanalysis of
the regional synoptic patterns during anomalous periods may help to illuminate which
climatic features most strongly influence cyclone track sinuosity.
Against the large background variability, SI values suggest a weak upward tendency
over the complete four decades of record. However, for trend analysis to be meaningful, it
is necessary to plot two separate trend lines for the periods pre- and post-1986, owing to
two main issues relating to data homogeneity. First, while early tracking techniques used
Fig. 4 Sinuosity Index (SI) values for individual cyclones (grey markers), long-term trends (dashed lines)and variability in running means of seven storms (solid black line) from 1970 to 2008 in the tropical SouthPacific. Extreme (possibly spurious) values in the dataset beyond the population mean ± 2r are excludedfrom analysis. Notes: 1. Separate trend lines for SI values are necessary for pre- and post-1986 periods (seetext for explanation); 2. Grey markers are spaced equidistantly along the horizontal, so the time axis is non-linear
Nat Hazards (2011) 59:1161–1174 1169
123
Author's personal copy

12-h intervals to mark cyclone positions, monitoring since 1986 used 6-h fixes to obtain
more precise positioning. The lower temporal resolution for cyclone tracks before 1986
causes sinuosity measurements to be underestimated relative to the later period, especially
for more elaborate track shapes. Second, high-resolution satellite imagery for the RSMC-
Nadi region only became available in 1986 (R. Prasad, personal communication, former
director of the Fiji Meteorological Services and RSMC-Nadi). These secular changes
affecting data homogeneity therefore restrict the use of the dataset in toto for investigating
long-term trends in track sinuosity over the entire period since 1970. Similar problems
have been highlighted elsewhere as limiting both our abilities to recognise changes in
cyclone activity and the possibilities for extrapolation and prediction (Kuleshov et al.
2010; Buckley et al. 2003).
Notwithstanding these challenges, commenting on the measured trends over the two
sub-periods remains worthwhile. For the pre-1986 sub-set of cyclone tracks, the apparent
positive trend in sinuosity is likely to be spurious. With reference to Australian region
datasets, observed trends in several cyclone parameters are in reality artefacts of advances
in technology leading to improvements in observing capabilities and cyclone detection
(Solow and Nicholls 1990), and increased understanding of tropical storms allowing better
discrimination between cyclones and other systems, with consequent adjustments to
cyclone definition (Nicholls et al. 1998). Such influences can be assumed to have affected
RSMC-Nadi cyclone observations also (Terry and Gienko 2010). In contrast, for the more
homogenous post-1986 data sub-set, the lack of a statistically significant trend in track
sinuosity is probably more realistic, and suggests that this feature of cyclone behaviour
remains unaffected by recent climate change. An absence of any long-term trend in track
sinuosity has also been established for typhoons in the north west Pacific (Terry and Feng
2010).
Further analysis of the post-1986 dataset (n = 155 with 5 outliers removed) reveals that
track SI values show their strongest and most significant positive correlations with cyclone
duration (Pearson’s r = 0.64, P B 0.001, Fig. 5), i.e. longer-lasting storms tend to be those
that follow more complex tracks, although no causality is implied. For example, the record
for most sinuous track is set by Cyclone Katrina, which survived for over 21 days in
Fig. 5 Relationship between track Sinuosity Index (SI) values and durations of tropical cyclones from 1986to 2008 in the tropical South Pacific; n = 155 with 5 statistical outliers removed
1170 Nat Hazards (2011) 59:1161–1174
123
Author's personal copy

January 1998 and attained a minimum pressure of 940 hPa. Katrina and other storms with
high SI values are those that described elaborate looping tracks and/or backtracked to
decay relatively near their origins. SI values also return significant although weaker linear
correlations with several other cyclone parameters such as cyclone minimum pressure
(r = 0.48, P B 0.001) and track length (r = 0.37, P B 0.001).
3.4 Spatial patterns
Apparent geospatial patterns in cyclone track sinuosity are also suggested by the maps
presented in Fig. 6. These show all cyclone tracks in each sinuosity category from 1970 to
2008. Straighter tracks seem to be spread more evenly across the TSP study region study,
whereas sinuous category storms (SI C6.7, upper quartile) show some tendency for
bunching in the west. As a preliminary test of this apparent pattern, analysis using chi-
square (v2) was performed on numbers of cyclones falling into different track sinuosity
categories, sorted into 10� longitudinal zones according to cyclogenesis origin (Table 4).
The v2 test did not reveal a significant difference between the 10� zones in terms of general
sinuosity characteristics. However, a v2 test performed only on the percentages of cyclones
in each 10� zone falling in the sinuous category did indicate a significant difference
(P B 0.001) between the zones, i.e. revealing that the proportion of sinuous tracks in each
10� zone is not consistent from west to east across the South Pacific. Exploring this finding
further, scrutiny of top-end sinuosity values shows that over three quarters ([78%) of the
most convoluted tracks (measured sinuosity C2, SI C10) were produced by cyclones
originating within an 11� longitudinal band in the western portion of the study area
(158�–169�E).
4 Conclusions
The sinuosity of 291 tropical cyclone tracks from 1970 to 2008 in the tropical South Pacific
was measured using GIS tools. Observed sinuosity values are highly positively skewed, but
may be transformed using a simple cube-root function to Sinuosity Index (SI) values
characterised by a near-normal distribution. Using SI as a measurement of cyclone track
shape is simpler than mathematical curve fitting and, within certain limitations associated
with data homogeneity, permits investigation of spatial and temporal patterns. To aid track-
shape conceptualisation, four sinuosity categories are proposed based on quartile ranges of
SI values, with an ordinal system of names: straight, quasi-straight, curving and sinuous.
This improves on existing binary nomenclature that tends often to distinguish only
‘straight’ or ‘recurving’ track types.
Analytical findings are as follows, several of which have implications regarding the
vulnerability of South Pacific islands to cyclone hazards. First, track sinuosity displays a
high degree of variability over the last four decades, suggesting that the region is likely to
continue to experience episodes of anomalous cyclone behaviour at irregular intervals in
future. Second, no overall trend can be established in track sinuosity since the mid-1980s;
an apparent increasing sinuosity trend from 1970 to 1985 is probably unreliable owing to
improving cyclone monitoring over this period. Third, island groups in the west of the TSP
region face a greater chance than elsewhere of experiencing cyclones that follow more
convoluted tracks, the movement of which is difficult to predict and model compared to
‘normal’ storm migration. Fourth, other cyclone variables being equal (e.g. size, speed and
precipitation), cyclones following sinuous tracks pose a greater risk for several reasons.
Nat Hazards (2011) 59:1161–1174 1171
123
Author's personal copy

1172 Nat Hazards (2011) 59:1161–1174
123
Author's personal copy

They show some tendency for longer lifespans and higher intensity than storms that
migrate along straighter tracks. Also, cyclones with looping tracks may strike an island
nation more than once, as has been observed occasionally in the historical record. These
findings indicate that further scope exists for examining the physical influences on atypical
cyclone track shape, especially in the vicinity of island archipelagoes or immediately prior
to landfall. More generally, the evidence above also reinforces the need for improved
cyclone hazard education, better community preparedness and effective national disaster
response planning throughout the developing Pacific Islands.
Acknowledgments This work would not have been possible without the kind assistance of the FijiMeteorological Services. Rajendra Prasad and Simon McGree (former Director of FMS and Head of ClimateServices Division) in particular are thanked for their advice on many issues concerning historical obser-vations of cyclones in the South Pacific. The insightful comments of two anonymous referees are appre-ciated, as these enabled the original manuscript to be improved. Research funding from the Taiwan TradeMission to Fiji, the University of the South Pacific and the National University of Singapore is gratefullyacknowledged.
References
Barnett J, Ellemor H (2007) Niue after Cyclone Heta. Aust J Emerg Manag 22:3–4Buckley BW, Leslie LM, Speer MS (2003) The impact of observational technology on climate database
quality Tropical cyclones in the Tasman Sea. J Clim 16:2640–2645Camargo SJ, Robertson AW, Gaffney SJ, Smyth P, Ghil M (2007a) Cluster analysis of typhoon tracks: part
I: general properties. J Clim 20:3635–3653Camargo SJ, Robertson AW, Gaffney SJ, Smyth P, Ghil M (2007b) Cluster analysis of typhoon tracks: part
II: large-scale circulation and ENSO. J Clim 20:3654–3676Camargo SJ, Robertson AW, Barnston AG, Ghil M (2008) Clustering of eastern North Pacific tropical
cyclone tracks: ENSO and MJO effects. Geochem Geophys Geosyst 9:Q06V05. doi:10.1029/2007GC001861
Chand SS, Walsh KJE (2009) Tropical cyclone activity in the Fiji region: spatial patterns and relationship tolarge-scale circulation. J Clim 22:3877–3893
Chu P-S, Zhao X, Ho C-H, Kim H-S, Lu M-M, Kim J-H (2010) Bayesian forecasting of seasonal typhoonactivity: a track-pattern-oriented categorization approach. J Clim 23:6654–6668. doi:10.1175/2010JCLI37101
Table 4 Numbers (and percentages) of cyclone tracks in four sinuosity categories, arranged by 10� lon-gitudinal zones of cyclogenesis origin
Sinuosity category Cyclone origin
150�–160�E 160�–170�E 170�E–180� 180�–170�W 170�–160�W 160�–150�W
Straight 11 (31) 12 (19) 17 (27) 14 (27) 10 (33) 4 (22)
Quasi-straight 9 (25) 15 (23) 14 (22) 13 (25) 5 (17) 6 (33)
Curving 6 (17) 11 (17) 18 (28) 19 (37) 10 (33) 5 (28)
Sinuous 10 (28) 26 (41) 15 (23) 6 (12) 5 (17) 3 (17)
Total no. of cyclones 36 (100) 64 (100) 64 (100) 52 (100) 30 (100) 18 (100)
1. Data for 1970–2008; 2. n = 264; 3. Zones 140�–150�E, 150�–140�W and 140�–130�W are omitted due tolow cyclone counts (i.e. \10)
Fig. 6 Tropical cyclone track maps for 1970–2008, plotted according to four quartile sinuosity categories:a straight, b quasi-straight, c curving, d sinuous. Note: track sinuosity within the tropical South Pacific (TSP)is determined from either whole or partial tracks lying north of 25�S (see text)
b
Nat Hazards (2011) 59:1161–1174 1173
123
Author's personal copy

De Smith M, Goodchild M, Longley P (2007) Geospatial analysis, 2nd edn. Troubador, Leicester, UKDeMers MN (2008) Fundamentals of geographical information systems, 4th edn. Wiley, New YorkDengler K (1997) A numerical study of the effects of land proximity and changes in sea surface temperature
on hurricane tracks. Q J Royal Meteorol Soc 123:1307–1321Elsner JB, Liu KB (2003) Examining the ENSO-typhoon hypothesis. Clim Res 25:43–54Elsner JB, Kossin JP, Jagger TH (2008) The increasing intensity of the strongest tropical cyclones. Nature
455:92–95Emanuel K (2004) Response of tropical cyclone activity to climate change: theoretical basis. In: Murnane
RJ, Liu K-B (eds) Hurricanes and typhoons: past present and future. Columbia University Press, NewYork, pp 395–407
FMS (1997) Fiji Meteorological Services. In: Tropical cyclone damages in Fiji (from 1939/40–96/97).Information sheet no. 123, Climate Services Division, Nadi Airport, Fiji
Fraedrich K, Leslie LM (1989) Estimates of cyclone track predictability I: tropical cyclones in the Aus-tralian region. Q J Royal Meteorol Soc 115:79–92
Harr PA, Elsberry RL (1995) Large-scale circulation variability over the tropical western north Pacific partI: spatial patterns and tropical cyclone characteristics. Mon Weather Rev 123:1225–1246
Ho CH, Baik JJ, Kim JH, Gong DY, Sui CH (2004) Interdecadal changes in summertime typhoon tracks.J Clim 17:1767–1776
Kim H-M, Webster PJ, Curry JA (2010a) Modulation of north Pacific tropical cyclone activity by threephases of ENSO. J Clim 24:1839–1849. doi:10.1175/2010JCLI3939.1
Kim H-S, Kim J-H, Ho C-H, Chu P-S (2010b) Pattern classification of typhoon tracks using fuzzy c-meansclustering method. J Clim 24:488–508. doi:10.1175/2010JCLI3751.1
Knutson TR, Tuleya RE (2008) Tropical cyclones and climate change: revisiting recent studies at GFDL. In:Diaz HF, Murnane RJ (eds) Climate extremes and society. Cambridge University Press, UK,pp 120–143
Kossin JP, Camargo SJ, Sitkowski M (2010) Climate modulation of north Atlantic hurricane tracks. J Clim23:3057–3076
Kottegoda NT, Rosso R (1997) Statistics probability and reliability methods for civil and environmentalengineers. McGraw-Hill, New York
Kuleshov Y, Fawcett R, Qi L, Trewin B, Jones D, McBride J, Ramsay H (2010) Trends in tropical cyclonesin the south Indian Ocean and south Pacific Ocean. J Geophys Res 115:D01101. doi:10.1029/2009JD012372
Lander MA (1996) Specific tropical cyclone track types and unusual tropical cyclone motions associatedwith a reverse-oriented monsoon trough in the western north Pacific. Weather Forecast 11:170–186
Nakamura J, Lall U, Kushnir Y, Camargo SJ (2009) Classifying north Atlantic tropical cyclone tracks bytheir mass moments. J Clim 22:5481–5494
Nicholls N, Landsea C, Gill J (1998) Recent trends in Australian region tropical cyclone activity. MeteorolAtmospheric Phys 65:197–205
Osborne JW (2002a) Normalizing data transformations. ERIC digest (ERIC No. ED470204). ERIC clear-inghouse on assessment and evaluation, College Park, MD
Osborne JW (2002b) Notes on the use of data transformations. Pract Assess Res Eval 8(6)Raucher RS (2000) Economic implications of climate change in two Pacific Island country locations. Case
illustration of Tarawa, Kiribati and Viti Levu. Report prepared under sub-contract to the Centre forInternational Climate and Environmental Research, Oslo, Norway for the World Bank, Stratus Con-sulting, Boulder, Colorado, December, 16 chapters individually paginated
Rosenshein L, Scott L, Pratt M (2011) Finding a meaningful model. ArcUser, Winter 2011: 40–45. Accessedfrom http://www.esri.com/news/arcuser/0111/files/findmodel.pdf
Solow A, Nicholls N (1990) The relationship between the southern oscillation and tropical cyclone fre-quency in the Australian region. Journal Clim 3:1097–1101
Steiner JT (1980) The climate of the south-west Pacific region. A review for pilots. New Zealand Meteo-rological Service, Miscellaneous Publication no. 166, Wellington
Terry JP (2007) Tropical Cyclones: Climatology and Impacts in the South Pacific. Springer, New York,p 210
Terry JP, Feng CC (2010) On quantifying the sinuosity of typhoon tracks in the western north Pacific basin.Appl Geogr 30:678–686
Terry JP, Gienko G (2010) Climatological aspects of south Pacific tropical cyclones, based on analysis of theRSMC-Nadi (Fiji) regional archive. Clim Res 42:223–233
Walsh KJE (2004) Tropical cyclones and climate change: unresolved issues. Clim Res 27:77–83Webster PJ, Holland GL, Curry JA, Chang H-R (2005) Changes in tropical cyclone number, duration, and
intensity in a warming environment. Science 309:1844–1846
1174 Nat Hazards (2011) 59:1161–1174
123
Author's personal copy
Copyright © 2022 FDOKUMEN