
Long-term sustained observing system for climatic variability studies in the Mediterranean
Upload
independentCategory
view
7download
0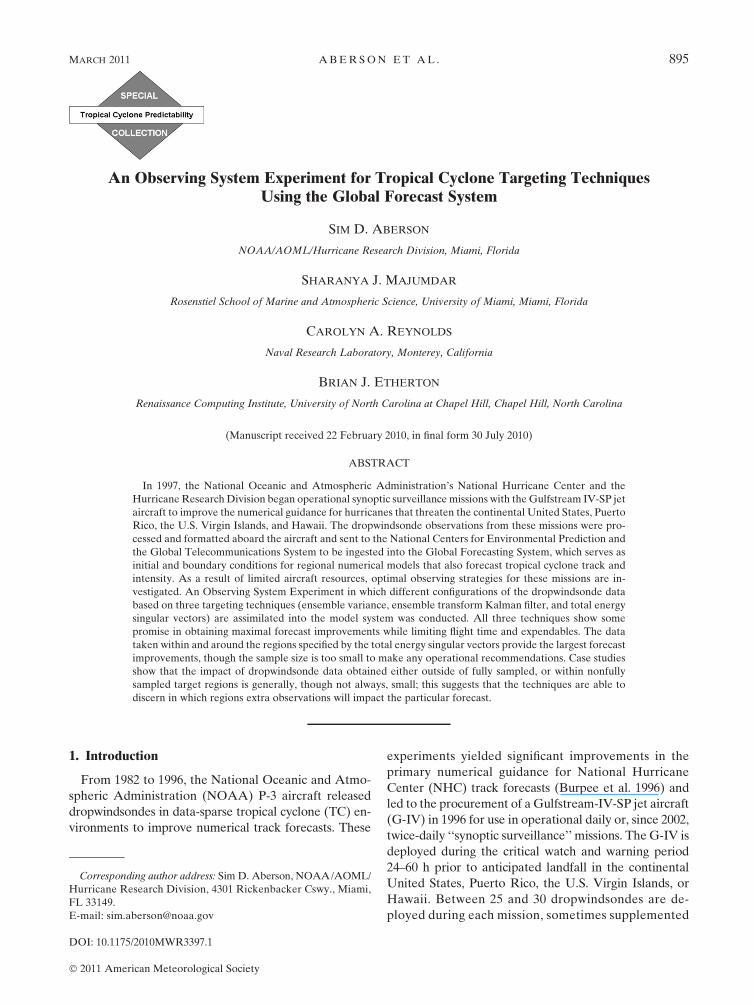
An Observing System Experiment for Tropical Cyclone Targeting TechniquesUsing the Global Forecast System
SIM D. ABERSON
NOAA/AOML/Hurricane Research Division, Miami, Florida
SHARANYA J. MAJUMDAR
Rosenstiel School of Marine and Atmospheric Science, University of Miami, Miami, Florida
CAROLYN A. REYNOLDS
Naval Research Laboratory, Monterey, California
BRIAN J. ETHERTON
Renaissance Computing Institute, University of North Carolina at Chapel Hill, Chapel Hill, North Carolina
(Manuscript received 22 February 2010, in final form 30 July 2010)
ABSTRACT
In 1997, the National Oceanic and Atmospheric Administration’s National Hurricane Center and the
Hurricane Research Division began operational synoptic surveillance missions with the Gulfstream IV-SP jet
aircraft to improve the numerical guidance for hurricanes that threaten the continental United States, Puerto
Rico, the U.S. Virgin Islands, and Hawaii. The dropwindsonde observations from these missions were pro-
cessed and formatted aboard the aircraft and sent to the National Centers for Environmental Prediction and
the Global Telecommunications System to be ingested into the Global Forecasting System, which serves as
initial and boundary conditions for regional numerical models that also forecast tropical cyclone track and
intensity. As a result of limited aircraft resources, optimal observing strategies for these missions are in-
vestigated. An Observing System Experiment in which different configurations of the dropwindsonde data
based on three targeting techniques (ensemble variance, ensemble transform Kalman filter, and total energy
singular vectors) are assimilated into the model system was conducted. All three techniques show some
promise in obtaining maximal forecast improvements while limiting flight time and expendables. The data
taken within and around the regions specified by the total energy singular vectors provide the largest forecast
improvements, though the sample size is too small to make any operational recommendations. Case studies
show that the impact of dropwindsonde data obtained either outside of fully sampled, or within nonfully
sampled target regions is generally, though not always, small; this suggests that the techniques are able to
discern in which regions extra observations will impact the particular forecast.
1. Introduction
From 1982 to 1996, the National Oceanic and Atmo-
spheric Administration (NOAA) P-3 aircraft released
dropwindsondes in data-sparse tropical cyclone (TC) en-
vironments to improve numerical track forecasts. These
experiments yielded significant improvements in the
primary numerical guidance for National Hurricane
Center (NHC) track forecasts (Burpee et al. 1996) and
led to the procurement of a Gulfstream-IV-SP jet aircraft
(G-IV) in 1996 for use in operational daily or, since 2002,
twice-daily ‘‘synoptic surveillance’’ missions. The G-IV is
deployed during the critical watch and warning period
24–60 h prior to anticipated landfall in the continental
United States, Puerto Rico, the U.S. Virgin Islands, or
Hawaii. Between 25 and 30 dropwindsondes are de-
ployed during each mission, sometimes supplemented
Corresponding author address: Sim D. Aberson, NOAA/AOML/
Hurricane Research Division, 4301 Rickenbacker Cswy., Miami,
FL 33149.
E-mail: [email protected]
MARCH 2011 A B E R S O N E T A L . 895
DOI: 10.1175/2010MWR3397.1
� 2011 American Meteorological Society

with additional dropwindsondes from missions conducted
with the U.S. Air Force C-130 or NOAA P-3 aircraft,
thus providing broader environmental sampling than the
G-IV accomplishes alone. Similar missions have been
regularly conducted in the western Pacific since 2003 as
part of Dropwindsonde Observations for Typhoon Sur-
veillance near the Taiwan Region (DOTSTAR), with
additional participation of other international agencies
during 2008 as part of The Observing System Research
and Predictability Experiment (THORPEX) Pacific Area
Regional Campaign (T-PARC; Wu et al. 2005, 2007;
Weissmann et al. 2011; Harnisch and Weissmann 2010).
During the first 10 yr of surveillance (1997–2006), 175
missions were conducted (Aberson 2010), leading to a
10%–15% improvement in 12–60-h track forecasts from
the NOAA Global Forecast System (GFS). Since a com-
plete mission costs about $40,000, far less than the esti-
mated $1 million average needed to evacuate just one
mile of coastline for landfall (Aberson et al. 2006), such
missions, regularly conducted, are very cost effective.
Questions remain as to whether the dropwindsondes
are deployed optimally and as to whether larger error
reductions are possible. If the TC environment is sam-
pled symmetrically in all directions from the storm cen-
ter, for example, the various sensitive areas in which
additional observations would most improve the fore-
cast may not be sampled. One strategy to find these
sensitive ‘‘targets’’ was based on the hypothesis that
regularly spaced observations collected in areas of high
deep-layer-mean (DLM; 850–200 hPa) wind variance
from the National Centers for Environmental Predic-
tion (NCEP) Global Ensemble Forecasting System valid
at the observing time would reduce growing analysis
errors in the steering flow, thereby reducing track fore-
casts errors (Aberson 2003). The advantage of targeting
observations based on this ensemble variance (EV) ver-
sus uniform sampling has been demonstrated in simple
models (Lorenz and Emanuel 1998; Morss et al. 2001).
Aberson (2003) showed that the assimilation of the data
subset from fully sampled1 targets produced a statisti-
cally significant GFS track forecast error reduction of up
to 25%, thereby yielding larger improvements than were
possible by assimilating all available surveillance data.
The deficiencies of symmetric sampling were attributed
to suboptimal data assimilation schemes and their im-
pact near targets that were bisected or otherwise not fully
sampled.
Advanced techniques, such as the ensemble transform
Kalman filter (ETKF; Bishop et al. 2001) and singular
vectors (SVs; Palmer et al. 1998), have been evaluated
in idealized and operational models. These techniques
have now been extended for use in tropical cyclone pre-
diction. Their respective guidance has been compared
in the Atlantic and western Pacific basins (Majumdar
et al. 2006; Reynolds et al. 2007; Wu et al. 2009). Unlike
the EV, they focus on specific forecasts and seek optimal
sampling locations in which the assimilation of new data
would modify that particular forecast. Yamaguchi et al.
(2009) showed, in one case with one targeting technique,
that the assimilation of a small subset of dropwindsonde
data in a well-chosen target area may provide significant
track forecast improvements.
The applicability of these three techniques for im-
proving TC forecasts is presented in the framework of
an Observing System Experiment. Either all the drop-
windsonde data or only those data within the fully sam-
pled targets are included in the model runs described
below. Given that dropwindsonde data obtained in trop-
ical cyclone environments lead to an average 10%–15%
reduction2 in track forecast error during the first 60 h
(Aberson 2010), the resulting track forecasts from these
model runs are compared to those obtained from model
runs in which all the dropwindsonde data have been as-
similated. The focus of this study is to examine whether,
for each targeting technique, using the subsample of
dropwindsonde data obtained only in fully sampled tar-
gets provides the same average results as using all the
dropwindsonde data (suggesting that the particular tech-
nique is able to accurately define sensitive regions). The
model and the three targeting techniques are briefly
described in the next section. General results from the
three targeting techniques and individual case studies
are provided in section 3, followed by a discussion and
the conclusions.
2. Overview and procedures
a. Background
The G-IV released 25–30 dropwindsondes at 150–
200-km intervals during each mission. The dropwind-
sondes sample the atmosphere below the aircraft flight
level (near 150 hPa). In those cases in which additional
aircraft supplemented the G-IV, 20–25 dropwindsondes
1 Aberson (2003) considers a target to be ‘‘fully sampled’’ if
dropwindsondes, with rawinsondes released from land stations,
sample the extremum and the edges of the feature in an approxi-
mately regularly spaced grid at about the resolution of the North
American Rawinsonde Network (about 250 km).
2 Each of the targeting subsamples shows similar improvements,
though they are slightly larger (18%–29%) during the first 24 h of
the forecasts. This could be because many of these cases include
sampling by multiple aircraft; Aberson (2002) showed that the
number of aircraft sampling the tropical cyclone environment was
related to the amount of forecast improvement in each case.
896 M O N T H L Y W E A T H E R R E V I E W VOLUME 139

were released at the same horizontal resolution from
around 400 (P-3) or 300 hPa (C-130). The G-IV did not
penetrate the TC core during surveillance missions; when
other aircraft participated in the missions, at least one
usually gathered data near the center. Hurricane Research
Division (HRD) meteorologists aboard the NOAA air-
craft validated the wind and thermodynamic data and
generated standard (TEMPDROP) messages for trans-
mission to NCEP and the Global Telecommunications
System in preparation for assimilation into numerical
models until 2006. This task on the G-IV has been car-
ried out by NOAA/Aircraft Operations Center meteo-
rologists in most cases since then.
b. Model
The version of the GFS operational at the time of
each mission was used to assess the impact of the drop-
windsonde data. Several upgrades to the quality control
algorithm, vortex initialization, data assimilation, and
global spectral model were made during the 3 yr covered
in this study. The quality control algorithm involves op-
timal interpolation and hierarchical decision making to
evaluate observations before they are input to the anal-
ysis (Woollen 1991). Vortex relocation (Liu et al. 2000)
places TCs in the first guess (background) field to their
operationally analyzed positions (as in Kurihara et al.
1995) ensuring that they are initialized in the proper lo-
cations. The data assimilation scheme was the spectral
statistical interpolation (Parrish and Derber 1992): the
background field (the previous 6-h forecast) is combined
with observations with a three-dimensional variational
multivariate formalism. The global spectral model hori-
zontal resolution was spectral triangular 254 (T254), and
the vertical coordinate extended from the surface to
about 2.7 hPa with 64 (L64) unequally spaced sigma
levels on a Lorenz grid (Caplan et al. 1997; Surgi et al.
1998) in 2004; the resolution was increased to T382L64
in 2005. Minor changes to model physics were made
during the 3 yr encompassed in the study.
c. Choice of data to assimilate
Multiple GFS runs were made for each mission. The
first run has all dropwindsonde observations assimilated
(hereafter operational). To demonstrate the effective-
ness of each of the three targeting techniques (described
below) to define sensitive regions, additional GFS runs
have been performed when less than two-thirds of the
dropwindsonde observations fully sample a particular
target, as in Aberson (2003). All dropwindsonde data
outside target regions (for any technique), or within tar-
gets that are not fully sampled, are removed from the
data assimilation system. The numerical values provided
by each technique are ignored, as in Aberson (2003) since
any maximum is expected to be an area of relative sen-
sitivity. The choice of which dropwindsondes to include
in each test run is therefore subjective, but consistent
from case to case and between techniques. The key is to
sample targets so as to limit potentially spurious incre-
ment spread outside the observed region into locations
where they are likely to grow. In this way, the growth
of errors introduced into the model by the suboptimal
data assimilation scheme is minimized. This agrees with
Bergot et al. (1999), who state that with then-current data
assimilation techniques, the entire target must be sam-
pled, not only the extremum. All other observations from
the NCEP ‘‘final’’ archive were ingested into the assimi-
lation system for both sets of runs.
d. Targeting techniques
1) ENSEMBLE VARIANCE
The EV from the NCEP Global Ensemble Forecast
System (GEFS) provides a general approach to TC tar-
geting (Aberson 2003). Random perturbations are evolved
and rescaled using a low-resolution (T126) version of the
GFS (Toth and Kalnay 1993; Lorenz and Emanuel 1998).
Since a forecast is the first guess for a subsequent GFS
cycle, locations in which perturbations are large are
those in which initial condition errors have recently
grown. The TC tracks depend on the environmental
DLM flow, so the DLM wind variance at the targeting
(observing) time is used. Aberson (2003) showed that
GFS DLM increments grow where the EV is large, and
decay where it is small, and that the growth is inde-
pendent of the increment size.
Numerous upgrades to the GEFS have been imple-
mented since the Aberson (2003) study. Most involve
perturbation rescaling, masking, and sizing. On 16 August
2005, the breeding cycle was reduced from 24 to 6 h, and
a TC vortex relocation technique was instituted; the lat-
ter change increased the GEFS effectiveness by requir-
ing that the TC existed near the diagnosed location. On
30 May 2006, the ensemble size was increased from 10
to 14 every 6 h, and the ensemble transform technique
replaced breeding (Wei et al. 2008). However, the es-
sence of the original breeding technique remains within
the GEFS.
2) ETKF
The ETKF uses ensemble-based data assimilation the-
ory (Bishop et al. 2001) to predict the reduction in fore-
cast error variance within a verification area for feasible
deployments of targeted observations. To mimic opera-
tions, the NCEP GEFS output available when flight track
planning must be completed that initialized 48 h prior
to the observing time ta is used. The ETKF computation
MARCH 2011 A B E R S O N E T A L . 897

is a two-stage process. First, the analysis error covariance
matrix at ta pertaining to the routine observational net-
work of rawinsonde and satellite-based temperature ob-
servations Pr(ta) is found by solving the Kalman filter
error statistics equations. Next, the analysis error covar-
iance matrix for the observational network augmented
by the qth hypothetical targeted observation Pq(ta) is
computed. The associated ‘‘signal covariance’’ matrix, or
the reduction in forecast error covariance valid at the
verification time (here, ty 5 ta 1 48 h), is deduced. The
trace of this matrix localized within a verification region,
defined as a 500-km radius circle centered at the Official
NHC forecast location at ty, is referred to as the ‘‘signal
variance.’’ The ETKF guidance represents this as a func-
tion of the central location of adjacent targeted obser-
vations. The area with the highest signal variance within
the verification region (the target) is deemed optimal for
sampling. Since TC tracks depend on the environmental
DLM flow, that flow is used as the metric in this study.
Further details are provided in Majumdar et al. (2006).
3) NAVY OPERATIONAL GLOBAL ATMOSPHERIC
PREDICTION SYSTEM SVS
Localized SVs are a type of targeted analysis error
covariance (AEC) optimals that have been used to iden-
tify observation target areas for both midlatitude storms
and TCs (Palmer et al. 1998; Buizza and Montani 1999;
Majumdar et al. 2006; Reynolds et al. 2007). The optimals
of the tangent forward propagator L(ta; ty) and its adjoint
LT sample the directions of maximum growth during the
optimization time interval between ta and ty, evolving
into the leading eigenvectors of the forecast error co-
variance matrix P(ty). For an analysis error covariance
metric kvk2a 5 hv(ta); [Pa(ta)]�1v(ta)i and verification-time
metric kvk2y 5 hv(t
y); [Py(t
y)]�1v(t
y)i, where h�;�i indicates
an inner product, the analysis-time optimals vi(ta), where
i indicates an index number, are computed via the eigen-
value problem:
(GL)T[Py(ty)]�1(GL)v
i(t
a) 5 s2
i [Pa(ta)]�1v
i(t
a), (1)
where G localizes perturbations within the verification re-
gion (Buizza 1994). The square roots of the eigenvalues
si are the singular values, and the eigenvectors vi(ta) are
the right SVs, of GL with respect to the metrics (Noble
and Daniel 1977).
Targeted AEC optimals in which Pa and Py are identi-
cal, diagonal, and elements equal to the fixed total energy
weights, such that (Pa)21 5 (Py)21 5 E and kvkE2 5
hv; Evi, are known as total energy SVs (TESVs). The
sensitivity pattern s is a composite of the vertically in-
tegrated total energy of the leading SV weighted by the
singular values:
s 5 �3
j51
s2j
s21
ej(x, t), (2)
where ej(x, t) is the vertically integrated total energy
of the jth SV at location x, and the first three SVs are
used. The TESVs are calculated using the Navy Opera-
tional Global Atmospheric Prediction System (NOGAPS;
Hogan and Rosmond 1991; Peng et al. 2004) tangent and
adjoint models. The SVs are calculated at a reduced
T79L30 resolution, although the linearization is based
on the trajectory from the full physics, high-resolution
(T239L30) operational NOGAPS forecast. The models
include surface drag and horizontal and vertical diffusion,
but not moist processes (Rosmond 1997). The optimization
time and lead time are both 48 h. A local projection op-
erator is used to define the verification region, here a large
fixed area covering the Gulf of Mexico eastward (i.e., the
box in Fig. 4c). Examination of the final-time SVs confirms
that the targets are relevant to the forecast of interest.
Although the SVs used here are from the NOGAPS
forecasting system, the similarity noted in previous stud-
ies of SVs calculated using different forecasting systems
TABLE 1. Track forecast errors (km) for homogeneous samples of synoptic surveillance missions for each of the three targeting
techniques. Times at which one version of the GFS provides statistically significantly smaller errors than another at the 85% level are
shown in boldface; those at the 95% level are shown in boldface italics.
Model 12 h 24 h 36 h 48 h 60 h 72 h 84 h 96 h 108 h 120 h
Operational 43.2 67.5 104.8 141.7 200.1 280.7 328.7 413.4 489.5 607.6
EV 46.6 76.4 108.6 152.9 215.7 284.8 314.4 398.4 446.0 594.1
No. of cases 27 27 27 27 27 27 25 23 21 19
Operational 47.6 68.7 100.2 132.6 193.3 258.4 294.5 375.2 427.5 500.7
ETKF 51.9 79.9 112.7 137.4 176.1 233.1 267.9 349.0 375.2 468.5
No. of cases 35 35 35 35 34 33 31 29 26 24
Operational 30.3 51.9 86.2 146.4 179.2 235.8 295.7 305.2 292.6 495.7
SV 32.2 36.1 71.1 128.6 154.1 165.8 265.5 310.8 340.5 540.0
No. of cases 6 6 6 6 5 5 4 3 3 2
898 M O N T H L Y W E A T H E R R E V I E W VOLUME 139

supports their relevance for NCEP forecasts. For exam-
ple, Majumdar et al. (2006) find that for 78 guidance
products for 2-day forecasts for the 2004 Atlantic hurri-
cane season, the European Centre for Medium-Range
Weather Forecasts (ECMWF) and NOGAPS SV guid-
ance identifies similar synoptic-scale target regions in
90% of the cases. Wu et al. (2009) likewise find strong
similarities between SVs calculated using the ECMWF,
NOGAPS, and the Japan Meteorological Agency (JMA)
systems for typhoons in the western Pacific for the 2006
season (e.g., the products on the large domain were sim-
ilar to each other in about 80% of the 84 cases consid-
ered). Although a comparison with NCEP SVs is not
possible, the strong similarity between the ECMWF,
NOGAPS, and JMA SV guidance suggests that the
sensitive regions identified by the NOGAPS system will
be relevant to other large-scale (i.e., global) forecast
systems.
3. Results
Table 1 shows homogeneous comparisons of GFS
track forecast errors for runs in which all dropwindsonde
observations (operational), or subsets of observations
that fully sample each of the three sets of targets, are
assimilated. The two sets of forecast errors are statisti-
cally significantly different at the 85% level at 12, 24, 48,
60, 84, and 108 h in the EV cases, though only at the last
two times does the subset improve the forecasts. Minor
improvements to the forecasts during the critical watch
and warning period (24–60 h before landfall when pre-
parations must be completed) are produced when all
data are assimilated.3 The two sets of forecast errors are
statistically significantly different at the 85% level at
12, 24, 84, and 108 h in the ETKF sample; the first two
forecast times are degradations, and the last two are
improvements, so these results are slightly better than
those for the EV cases. Fewer cases are available for the
SV targets than for the others because the relatively
large SV target size prohibits full sampling of the entire
target regions with the usual one-aircraft missions. The
two sets of forecast errors are statistically significantly
different at the 85% level from 24 to 72 h, and the dif-
ferences are improvements at all these forecast times.
As a result of the small sample size, any conclusive
statement that SVs are a superior targeting technique
is premature. The important result is that, for the ETKF
and SV techniques, the data outside the target regions
have no, or very little, positive impact on the ultimate
track forecasts; for the EV, the data outside the target
regions has some positive impact early in the forecast. A
discussion of two examples in which all three targeting
FIG. 1. GFS forecast tracks for Hurricane Emily initialized at
0000 UTC 18 Jul 2005 for the operational run and for those runs
in which only a subset of targeted observations were assimilated.
The best track is shown with the tropical storm symbols. Positions
are plotted every 12 h through 120 h. Emily dissipated 84 h into the
forecast. The operational GFS did not forecast dissipation. The
ETKF and EV runs forecast dissipation at 90 h; the SV run forecasts
dissipation at 96 h.
FIG. 2. Initial DLM wind analysis of the operational GFS at
0000 UTC 18 Jul 2005. The hurricane symbol marks the best-track
location of Emily. The dotted line represents the subtropical ridge
axis.
3 Contrary to these results, Aberson (2003) reported that the
assimilation of those dropwindsonde data within and around target
regions as defined by the EV provided statistically better forecasts
than those using all the data. Since 1999, the sampling strategy
employed during missions has largely followed recommendations
reported in Aberson (2003). The cases reported here are generally
those in which additional aircraft increased the data coverage,
improving forecasts (Aberson 2002), or in which targets could
not be fully sampled with one aircraft, leading to degradations
(Aberson 2003). These results should therefore not be construed as
meaning that the EV technique is no longer valid, nor that it is less
capable than the other techniques to define sensitive regions.
MARCH 2011 A B E R S O N E T A L . 899
techniques are available, and of another illuminating
example, follows.
a. Hurricane Emily: 0000 UTC 18 July 2005
Figure 1 shows the operational GFS forecast track, as
well as those from runs in which data subsets, depending
upon the targeting techniques, were assimilated. The
removal of the nontargeted data had a small positive
impact during the first 2 days of the forecast, though by
the approximate landfall time, the forecast spread from
the various model runs increased to about 250 km. This
suggests that all three targeting techniques are effective
in discerning the regions in which additional data will
have a large impact on the subsequent forecast.
Emily was located in the northwestern Caribbean Sea
moving westward under the influence of a strong sub-
tropical high centered over the southeastern United States
at the targeting time (Fig. 2). Some of the guidance sug-
gested a northward turn before a possible Texas landfall
since the ridge extended only to the western edge of the
Gulf of Mexico. NHC tasked a two-aircraft mission, with
the G-IV sampling the region around Emily and the
southeastern Gulf of Mexico, and a C-130 sampling the
remainder of the Gulf of Mexico (Fig. 3). The two-plane
mission allowed for adequate sampling of the target re-
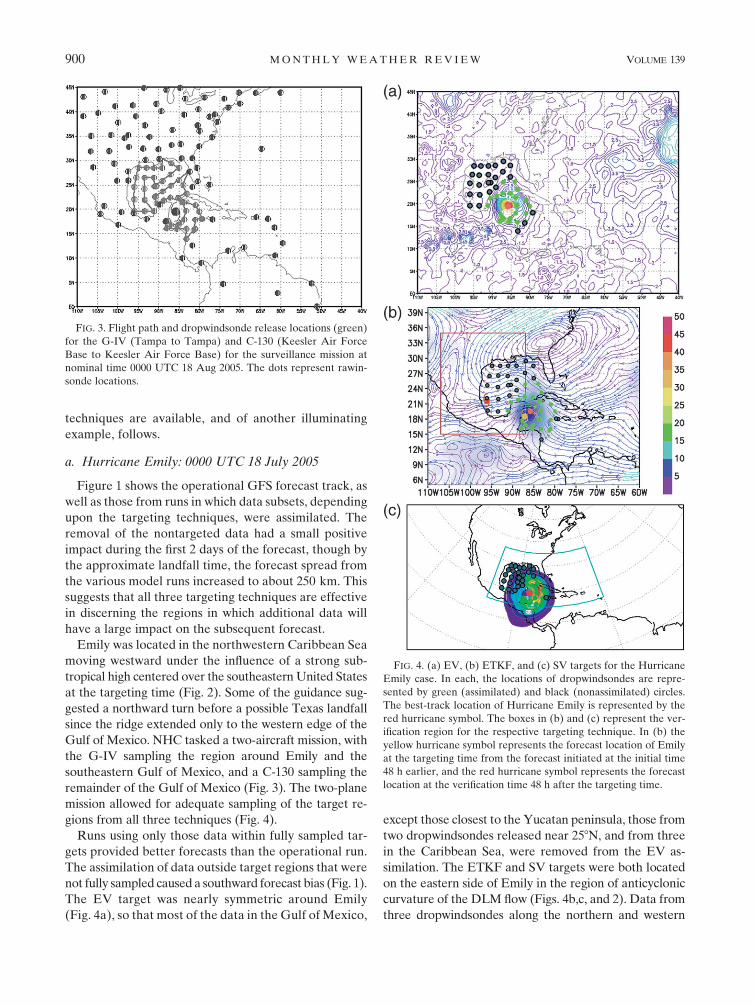
gions from all three techniques (Fig. 4).
Runs using only those data within fully sampled tar-
gets provided better forecasts than the operational run.
The assimilation of data outside target regions that were
not fully sampled caused a southward forecast bias (Fig. 1).
The EV target was nearly symmetric around Emily
(Fig. 4a), so that most of the data in the Gulf of Mexico,
except those closest to the Yucatan peninsula, those from
two dropwindsondes released near 258N, and from three
in the Caribbean Sea, were removed from the EV as-
similation. The ETKF and SV targets were both located
on the eastern side of Emily in the region of anticyclonic
curvature of the DLM flow (Figs. 4b,c, and 2). Data from
three dropwindsondes along the northern and western
FIG. 3. Flight path and dropwindsonde release locations (green)
for the G-IV (Tampa to Tampa) and C-130 (Keesler Air Force
Base to Keesler Air Force Base) for the surveillance mission at
nominal time 0000 UTC 18 Aug 2005. The dots represent rawin-
sonde locations.
FIG. 4. (a) EV, (b) ETKF, and (c) SV targets for the Hurricane
Emily case. In each, the locations of dropwindsondes are repre-
sented by green (assimilated) and black (nonassimilated) circles.
The best-track location of Hurricane Emily is represented by the
red hurricane symbol. The boxes in (b) and (c) represent the ver-
ification region for the respective targeting technique. In (b) the
yellow hurricane symbol represents the forecast location of Emily
at the targeting time from the forecast initiated at the initial time
48 h earlier, and the red hurricane symbol represents the forecast
location at the verification time 48 h after the targeting time.
900 M O N T H L Y W E A T H E R R E V I E W VOLUME 139
coasts of the Yucatan peninsula and from the eastern-
most two dropwindsondes were removed from the SV
assimilation, in addition to the Gulf of Mexico drop-
windsonde data removed in the EV run, resulting in the
northernmost forecast. The ETKF Gulf of Mexico data
were the same as for the EV run, but the data from the
two easternmost and one southernmost dropwindsondes
were removed. The EV and ETKF forecast tracks were
closest to each other because their targets were the most
similar to each other, though they slowly diverged through
the forecast. The removal of the dropwindsonde data in
the Gulf of Mexico appears to cause subtle differences
in the initial analyses leading to the northward motion
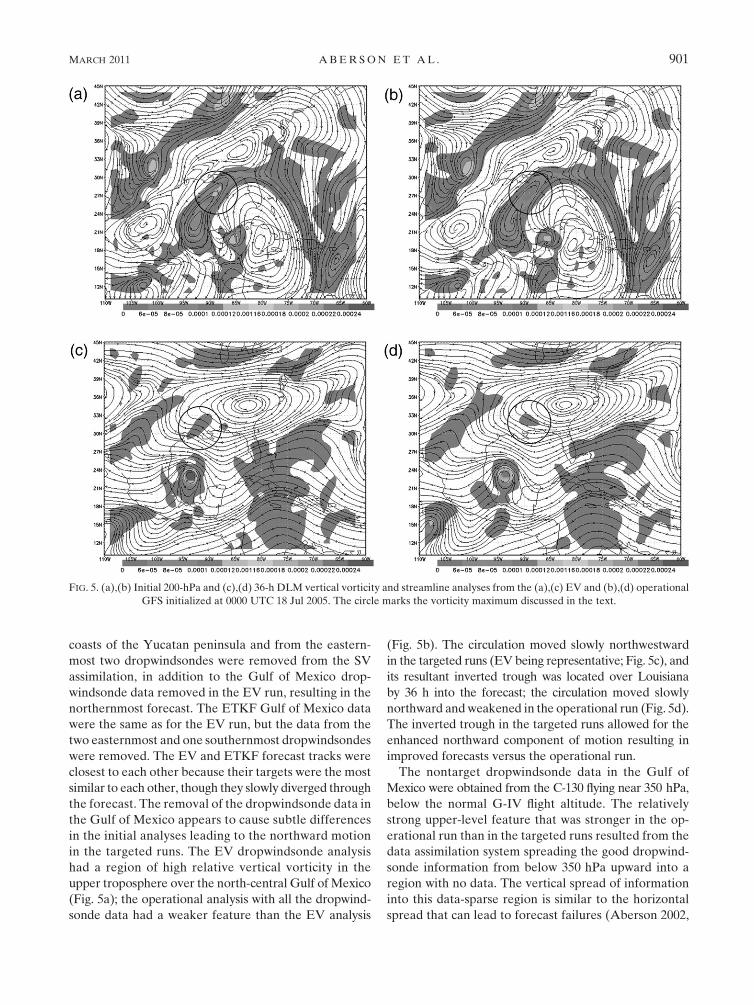
in the targeted runs. The EV dropwindsonde analysis
had a region of high relative vertical vorticity in the
upper troposphere over the north-central Gulf of Mexico
(Fig. 5a); the operational analysis with all the dropwind-
sonde data had a weaker feature than the EV analysis
(Fig. 5b). The circulation moved slowly northwestward
in the targeted runs (EV being representative; Fig. 5c), and
its resultant inverted trough was located over Louisiana
by 36 h into the forecast; the circulation moved slowly
northward and weakened in the operational run (Fig. 5d).
The inverted trough in the targeted runs allowed for the
enhanced northward component of motion resulting in
improved forecasts versus the operational run.
The nontarget dropwindsonde data in the Gulf of
Mexico were obtained from the C-130 flying near 350 hPa,
below the normal G-IV flight altitude. The relatively
strong upper-level feature that was stronger in the op-
erational run than in the targeted runs resulted from the
data assimilation system spreading the good dropwind-
sonde information from below 350 hPa upward into a
region with no data. The vertical spread of information
into this data-sparse region is similar to the horizontal
spread that can lead to forecast failures (Aberson 2002,
FIG. 5. (a),(b) Initial 200-hPa and (c),(d) 36-h DLM vertical vorticity and streamline analyses from the (a),(c) EV and (b),(d) operational
GFS initialized at 0000 UTC 18 Jul 2005. The circle marks the vorticity maximum discussed in the text.
MARCH 2011 A B E R S O N E T A L . 901
2003, 2008). Though sampling the entire troposphere in
this region may not have led to a forecast track improve-
ment, this case illustrates that the data assimilation can
spread information vertically into data-sparse regions.
Obtaining soundings through the depth of the troposphere
for improving hurricane track forecasting may be impor-
tant since the DLM flow usually steers tropical cyclones.
This case confirms that the removal of data outside fully
sampled target regions can lead to the larger forecast
track improvements than the inclusion of all the data
(Aberson 2003).
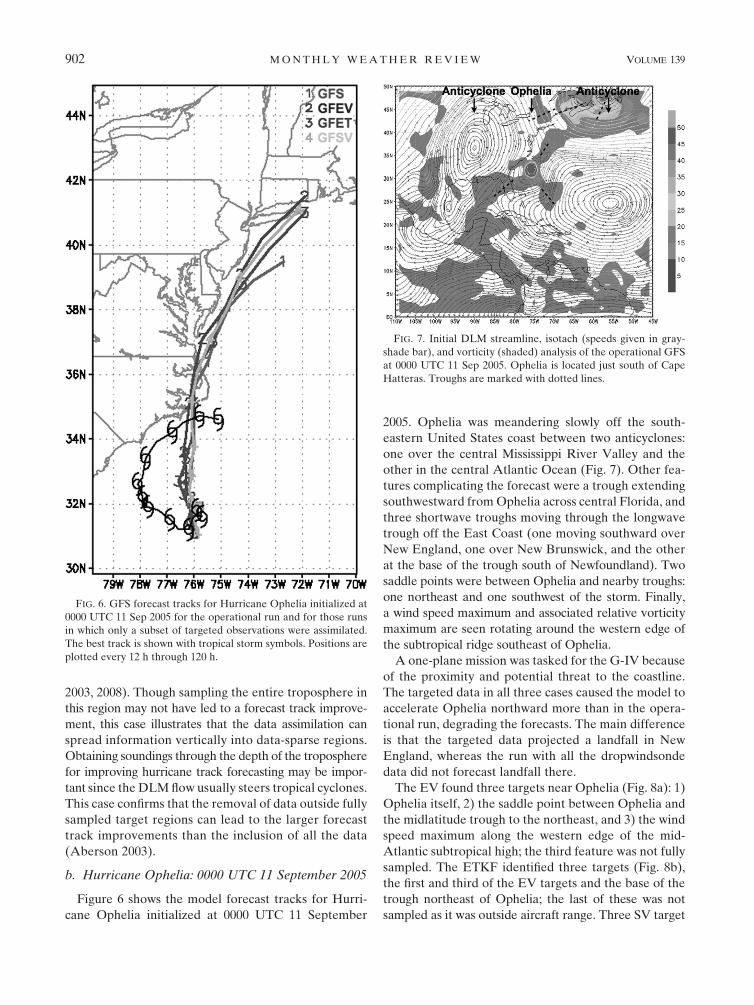
b. Hurricane Ophelia: 0000 UTC 11 September 2005
Figure 6 shows the model forecast tracks for Hurri-
cane Ophelia initialized at 0000 UTC 11 September
2005. Ophelia was meandering slowly off the south-
eastern United States coast between two anticyclones:
one over the central Mississippi River Valley and the
other in the central Atlantic Ocean (Fig. 7). Other fea-
tures complicating the forecast were a trough extending
southwestward from Ophelia across central Florida, and
three shortwave troughs moving through the longwave
trough off the East Coast (one moving southward over
New England, one over New Brunswick, and the other
at the base of the trough south of Newfoundland). Two
saddle points were between Ophelia and nearby troughs:
one northeast and one southwest of the storm. Finally,
a wind speed maximum and associated relative vorticity
maximum are seen rotating around the western edge of
the subtropical ridge southeast of Ophelia.
A one-plane mission was tasked for the G-IV because
of the proximity and potential threat to the coastline.
The targeted data in all three cases caused the model to
accelerate Ophelia northward more than in the opera-
tional run, degrading the forecasts. The main difference
is that the targeted data projected a landfall in New
England, whereas the run with all the dropwindsonde
data did not forecast landfall there.
The EV found three targets near Ophelia (Fig. 8a): 1)
Ophelia itself, 2) the saddle point between Ophelia and
the midlatitude trough to the northeast, and 3) the wind
speed maximum along the western edge of the mid-
Atlantic subtropical high; the third feature was not fully
sampled. The ETKF identified three targets (Fig. 8b),
the first and third of the EV targets and the base of the
trough northeast of Ophelia; the last of these was not
sampled as it was outside aircraft range. Three SV target
FIG. 6. GFS forecast tracks for Hurricane Ophelia initialized at
0000 UTC 11 Sep 2005 for the operational run and for those runs
in which only a subset of targeted observations were assimilated.
The best track is shown with tropical storm symbols. Positions are
plotted every 12 h through 120 h.
FIG. 7. Initial DLM streamline, isotach (speeds given in gray-
shade bar), and vorticity (shaded) analysis of the operational GFS
at 0000 UTC 11 Sep 2005. Ophelia is located just south of Cape
Hatteras. Troughs are marked with dotted lines.
902 M O N T H L Y W E A T H E R R E V I E W VOLUME 139
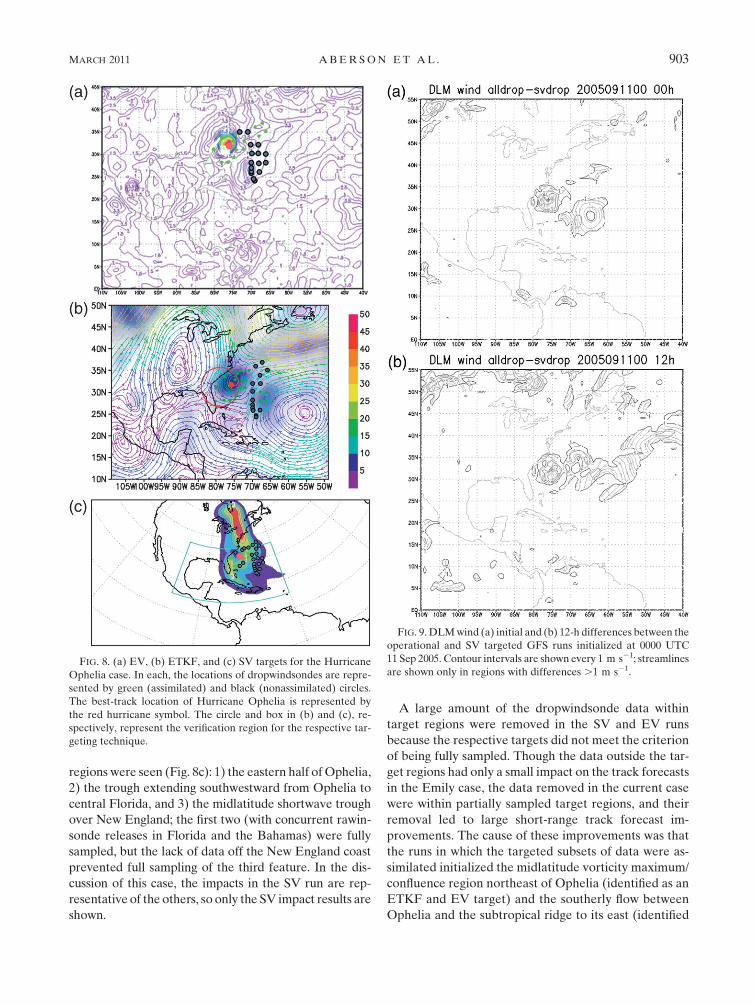
regions were seen (Fig. 8c): 1) the eastern half of Ophelia,
2) the trough extending southwestward from Ophelia to
central Florida, and 3) the midlatitude shortwave trough
over New England; the first two (with concurrent rawin-
sonde releases in Florida and the Bahamas) were fully
sampled, but the lack of data off the New England coast
prevented full sampling of the third feature. In the dis-
cussion of this case, the impacts in the SV run are rep-
resentative of the others, so only the SV impact results are
shown.
A large amount of the dropwindsonde data within
target regions were removed in the SV and EV runs
because the respective targets did not meet the criterion
of being fully sampled. Though the data outside the tar-
get regions had only a small impact on the track forecasts
in the Emily case, the data removed in the current case
were within partially sampled target regions, and their
removal led to large short-range track forecast im-
provements. The cause of these improvements was that
the runs in which the targeted subsets of data were as-
similated initialized the midlatitude vorticity maximum/
confluence region northeast of Ophelia (identified as an
ETKF and EV target) and the southerly flow between
Ophelia and the subtropical ridge to its east (identified
FIG. 8. (a) EV, (b) ETKF, and (c) SV targets for the Hurricane
Ophelia case. In each, the locations of dropwindsondes are repre-
sented by green (assimilated) and black (nonassimilated) circles.
The best-track location of Hurricane Ophelia is represented by
the red hurricane symbol. The circle and box in (b) and (c), re-
spectively, represent the verification region for the respective tar-
geting technique.
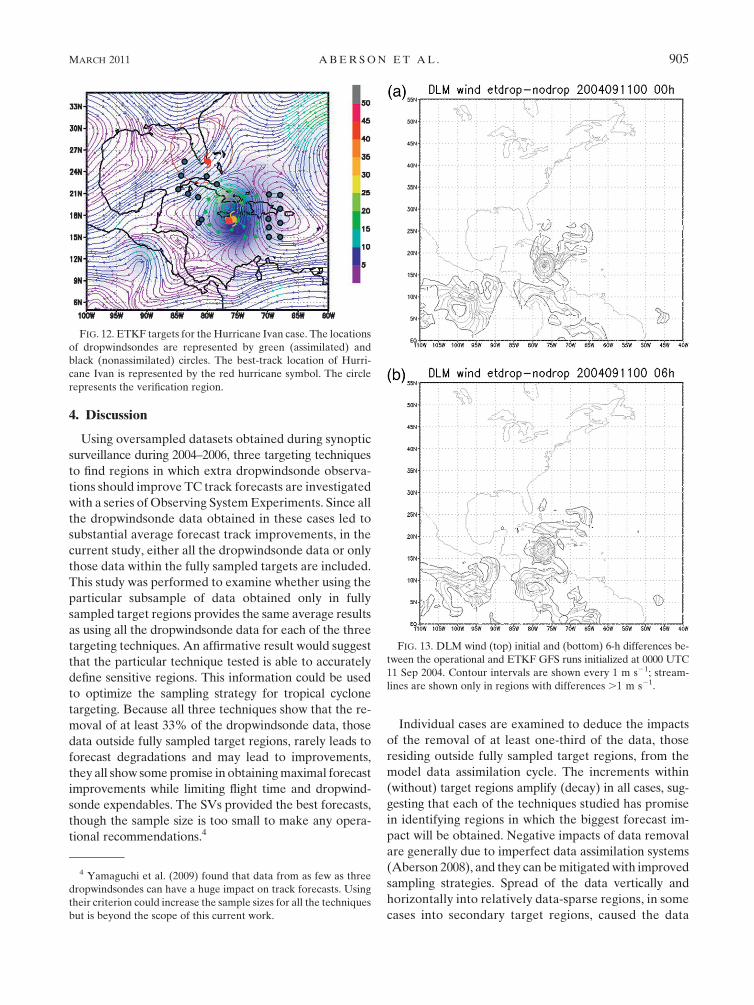
FIG. 9. DLM wind (a) initial and (b) 12-h differences between the
operational and SV targeted GFS runs initialized at 0000 UTC
11 Sep 2005. Contour intervals are shown every 1 m s21; streamlines
are shown only in regions with differences .1 m s21.
MARCH 2011 A B E R S O N E T A L . 903

as an ETKF and EV target) to be stronger than in the
operational run initial condition. The vorticity maximum/
confluence northeast of Ophelia (the cyclonic difference
streamlines in Fig. 9a) was advected westward, and the
enhanced southerly flow to the east of Ophelia moved
northward. The two features combined and acted to ad-
vect Ophelia northward more rapidly in the targeted runs
than in the operational one during the early part of the
forecast. These increments are expected to grow be-
cause each of these regions was identified as targets;
the actual growth might be erroneous since the targets
were not fully sampled during the mission. This case
shows that the targeting techniques can be effective in
discerning which regions will have error growth that
affect the TC track forecast; it also shows the importance
of fully sampling the target regions, because removing
data that only partially sampled targets improved the
track forecasts.
c. Hurricane Ivan: 0000 UTC 11 September 2004
Relatively small track forecast differences between
the targeted and symmetrically sampled data are shown
in the above two cases. The Hurricane Ivan case ini-
tialized at 0000 UTC 11 September 2004 shows that
large differences can occur. Figure 10 shows the ETKF
and operational forecast tracks for this case. Neither SV
nor EV cases were run because few or no data outside
their targets were gathered. Ivan was moving toward the
west-northwest just south of Jamaica. A ridge extended
east-northeastward from central Florida, and a large
mid- and upper-level cyclonic circulation was centered
about 2500 km northeast of Ivan (Fig. 11). The opera-
tional forecast track called for Ivan to recurve and make
landfall near Tampa Bay.
A one-plane mission was tasked for the G-IV because
of the potential threat to Florida and the Gulf Coast.
The ETKF target was centered on Hurricane Ivan (Fig. 12)
with weak secondary maxima located outside the sam-
pled region south of Guatemala and on the western side
of the cyclonic circulation northeast of Ivan. The data
obtained between 678 and 708W were removed from the
ETKF run; the impact of these data was spread north-
eastward by the data assimilation into the cyclonic cir-
culation northeast of Ivan, where rapid error growth is
expected by the ETKF. This led to a westward extension
of the low, resulting in a northward component of mo-
tion to Ivan (Fig. 13). This case again shows the effec-
tiveness of the ETKF in finding where errors affecting the
particular forecast are expected to be large and grow and
suggests that data should be obtained mainly close to
targets since the then-current data assimilation techniques
may erroneously spread the data impact into other regions
degrading the forecast (Aberson 2003).
FIG. 10. GFS forecast tracks for Hurricane Ivan initialized at
0000 UTC 11 Sep 2004 for the operational run and for the run in
which only a subset of ETKF targeted observations were assimi-
lated. The best track is shown with tropical storm symbols. Posi-
tions are plotted every 12 h through 120 h.
FIG. 11. Initial DLM wind analysis of the operational GFS at
0000 UTC 11 Sep 2004.
904 M O N T H L Y W E A T H E R R E V I E W VOLUME 139
4. Discussion
Using oversampled datasets obtained during synoptic
surveillance during 2004–2006, three targeting techniques
to find regions in which extra dropwindsonde observa-
tions should improve TC track forecasts are investigated
with a series of Observing System Experiments. Since all
the dropwindsonde data obtained in these cases led to
substantial average forecast track improvements, in the
current study, either all the dropwindsonde data or only
those data within the fully sampled targets are included.
This study was performed to examine whether using the
particular subsample of data obtained only in fully
sampled target regions provides the same average results
as using all the dropwindsonde data for each of the three
targeting techniques. An affirmative result would suggest
that the particular technique tested is able to accurately
define sensitive regions. This information could be used
to optimize the sampling strategy for tropical cyclone
targeting. Because all three techniques show that the re-
moval of at least 33% of the dropwindsonde data, those
data outside fully sampled target regions, rarely leads to
forecast degradations and may lead to improvements,
they all show some promise in obtaining maximal forecast
improvements while limiting flight time and dropwind-
sonde expendables. The SVs provided the best forecasts,
though the sample size is too small to make any opera-
tional recommendations.4
Individual cases are examined to deduce the impacts
of the removal of at least one-third of the data, those
residing outside fully sampled target regions, from the
model data assimilation cycle. The increments within
(without) target regions amplify (decay) in all cases, sug-
gesting that each of the techniques studied has promise
in identifying regions in which the biggest forecast im-
pact will be obtained. Negative impacts of data removal
are generally due to imperfect data assimilation systems
(Aberson 2008), and they can be mitigated with improved
sampling strategies. Spread of the data vertically and
horizontally into relatively data-sparse regions, in some
cases into secondary target regions, caused the data
FIG. 12. ETKF targets for the Hurricane Ivan case. The locations
of dropwindsondes are represented by green (assimilated) and
black (nonassimilated) circles. The best-track location of Hurri-
cane Ivan is represented by the red hurricane symbol. The circle
represents the verification region.
FIG. 13. DLM wind (top) initial and (bottom) 6-h differences be-
tween the operational and ETKF GFS runs initialized at 0000 UTC
11 Sep 2004. Contour intervals are shown every 1 m s21; stream-
lines are shown only in regions with differences .1 m s21.
4 Yamaguchi et al. (2009) found that data from as few as three
dropwindsondes can have a huge impact on track forecasts. Using
their criterion could increase the sample sizes for all the techniques
but is beyond the scope of this current work.
MARCH 2011 A B E R S O N E T A L . 905
outside target regions to degrade the forecasts. The re-
sults continue to suggest that data should be obtained
mainly within and immediately around target regions so
as to adequately sample them and to limit spread of data,
both horizontally and vertically, into regions with rela-
tively sparse data, and which the targeting techniques
suggest will have amplifying errors.
These results can be extended to other, similar observing
systems, such as rawinsondes and satellite wind and radi-
ance data. During threatening situations, NHC requests
that regular observing sites in the southeastern United
States release off-time (0600 and 1800 UTC) rawinsondes.
Since rawinsonde data are obtained through the tropo-
sphere in regularly spaced grids like dropwindsonde data,
the techniques reported here may be used to decide
whether to request off-time releases, to maximize the data
impact if such a request is made, and to include additional
regions outside the southeastern United States.
Acknowledgments. The first author thanks NCEP/
EMC for help in running the models and in providing the
computer resources to make this study possible. Bob
Kohler and Bill Barry provided computer support at
HRD. Altug Aksoy, Sundararaman Gopalakrishnan,
Mike Jankulak, Tomislava Vukicevic, and an anonymous
reviewer improved previous versions of this manuscript.
The authors thank the NOAA/Aircraft Operations
Center (AOC) flight crews, AOC G-IV project manager
Jack Parrish, and HRD personnel who participated in the
flights, in addition to Air Force C-130 crews that also
provided surveillance data over the years. CAR grate-
fully acknowledges the support from the sponsor, ONR
PE-0601153N, and computer resources provided by the
Department of Defense High-performance Computing
program. The Joint Hurricane Testbed funded SJM and
BJE for some of this work.
REFERENCES
Aberson, S. D., 2002: Two years of operational hurricane synoptic
surveillance. Wea. Forecasting, 17, 1101–1110.
——, 2003: Targeted observations to improve operational tropical
cyclone track forecast guidance. Mon. Wea. Rev., 131, 1613–
1628.
——, 2008: Large forecast degradations due to synoptic surveil-
lance during the 2004 and 2005 hurricane seasons. Mon. Wea.
Rev., 136, 3138–3150.
——, 2010: Ten years of hurricane synoptic surveillance (1997–
2006). Mon. Wea. Rev., 138, 1536–1549.
——, M. L. Black, R. A. Black, R. W. Burpee, J. J. Cione,
C. W. Landsea, and F. D. Marks Jr., 2006: Thirty years of
tropical cyclone research with the NOAA P-3 aircraft. Bull.
Amer. Meteor. Soc., 87, 1039–1055.
Bergot, T., G. Hello, A. Joly, and S. Malardel, 1999: Adaptive obser-
vations during FASTEX: A systematic survey of upstream flights.
Quart. J. Roy. Meteor. Soc., 125, 3271–3298.
Bishop, C. H., B. J. Etherton, and S. J. Majumdar, 2001: Adaptive
sampling with the ensemble transform Kalman filter. Part I:
Theoretical aspects. Mon. Wea. Rev., 129, 420–436.
Buizza, R., 1994: Localization of optimal perturbations using a pro-
jection operator. Quart. J. Roy. Meteor. Soc., 120, 1647–1681.
——, and A. Montani, 1999: Targeting observation using SVs.
J. Atmos. Sci., 56, 2965–2985.
Burpee, R. W., J. L. Franklin, S. J. Lord, R. E. Tuleya, and
S. D. Aberson, 1996: The impact of omega dropwindsondes
on operational hurricane track forecast models. Bull. Amer.
Meteor. Soc., 77, 925–933.
Caplan, P., J. Derber, W. Gemmill, S.-Y. Hong, H.-L. Pan, and
D. Parrish, 1997: Changes to the 1995 NCEP operational
medium-range forecast model analysis-forecast system. Wea.
Forecasting, 12, 581–594.
Harnisch, F., and M. Weissmann, 2010: Sensitivity of typhoon
forecasts to different subsets of targeted dropsonde observa-
tions. Mon. Wea. Rev., 138, 2664–2680.
Hogan, T. F., and T. E. Rosmond, 1991: The description of the Navy
Operational Global Atmospheric Prediction System’s Spectral
Forecast Model. Mon. Wea. Rev., 119, 1786–1815.
Kurihara, Y., M. A. Bender, R. E. Tuleya, and R. J. Ross, 1995:
Improvements in the GFDL hurricane prediction system.
Mon. Wea. Rev., 123, 2791–2801.
Liu, Q., T. Marchok, H.-L. Pan, M. Bender, and S. Lord, 2000:
Improvements in hurricane initialization and forecasting at
NCEP with the global and regional (GFDL) models. EMC
Tech. Procedures Bull. 472, 7 pp.
Lorenz, E. N., and K. A. Emanuel, 1998: Optimal sites for sup-
plementary weather observations: Simulation with a small
model. J. Atmos. Sci., 55, 399–414.
Majumdar, S. J., S. D. Aberson, C. H. Bishop, R. Buizza, M. S. Peng, and
C. A. Reynolds, 2006: A comparison of adaptive observing guid-
ance for Atlantic tropical cyclones. Mon. Wea. Rev., 134, 2354–2372.
Morss, R. E., K. A. Emanuel, and C. Snyder, 2001: Idealized adaptive
observation strategies for improving numerical weather pre-
diction. J. Atmos. Sci., 58, 210–232.
Noble, B., and J. W. Daniel, 1977: Applied Linear Algebra. 2nd ed.
Prentice-Hall, 477 pp.
Palmer, T. N., R. Gelaro, J. Barkmeijer, and R. Buizza, 1998:
Singular vectors, metrics, and adaptive observations. J. Atmos.
Sci., 55, 633–653.
Parrish, D. F., and J. C. Derber, 1992: The National Meteorological
Center’s spectral statistical-interpolation analysis system. Mon.
Wea. Rev., 120, 1747–1763.
Peng, M. S., J. A. Ridout, and T. F. Hogan, 2004: Recent modifi-
cations of the Emanuel convective scheme in the Naval Op-
erational Global Atmospheric Prediction System. Mon. Wea.
Rev., 132, 1254–1268.
Reynolds, C. A., M. S. Peng, S. J. Majumdar, S. D. Aberson,
C. H. Bishop, and R. Buizza, 2007: Interpretation of adaptive
observing guidance for Atlantic tropical cyclones. Mon. Wea.
Rev., 135, 4006–4029.
Rosmond, T. E., 1997: A technical description of the NRL adjoint
modeling system. NRL/MR/7532/97/7230, NRL, 53 pp.
Surgi, N., H.-L. Pan, and S. J. Lord, 1998: Improvement of the NCEP
global model over the tropics: An evaluation of model performance
during the 1995 hurricane season. Mon. Wea. Rev., 126, 1287–1305.
Toth, Z., and E. Kalnay, 1993: Ensemble forecasting at NMC: The
generation of perturbations. Bull. Amer. Meteor. Soc., 74, 2317–
2330.
Wei, M., Z. Toth, R. Wobus, and Y. Zhu, 2008: Initial pertur-
bations based on the ensemble transform (ET) technique in
906 M O N T H L Y W E A T H E R R E V I E W VOLUME 139

the NCEP global operational forecast system. Tellus, 60A,
62–79.
Weissmann, M., and Coauthors, 2011: The influence of assimilating
dropsonde data on typhoon track and midlatitude forecasts.
Mon. Wea. Rev., 139, 908–920.
Woollen, J. R., 1991: New NMC operational OI quality control.
Preprints, Ninth Conf. on Numerical Weather Prediction,
Denver, CO, Amer. Meteor. Soc., 24–27.
Wu, C.-C., and Coauthors, 2005: Dropwindsonde Observations for
Typhoon Surveillance near the Taiwan Region (DOTSTAR):
An overview. Bull. Amer. Meteor. Soc., 86, 787–790.
——, K.-H. Chou, P.-H. Lin, S. D. Aberson, M. S. Peng, and
T. Nakazawa, 2007: The impact of dropwindsonde data on
typhoon track forecasts in DOTSTAR. Wea. Forecasting,
22, 1157–1176.
——, and Coauthors, 2009: Intercomparison of targeted observa-
tion guidance for tropical cyclones in the northwestern Pacific.
Mon. Wea. Rev., 137, 2471–2492.
Yamaguchi, M., T. Iriguchi, T. Nakazawa, and C.-C. Wu, 2009: An
observing system experiment for Typhoon Conson (2004) using
a singular vector method and DOTSTAR data. Mon. Wea. Rev.,
137, 2801–2816.
MARCH 2011 A B E R S O N E T A L . 907
Copyright © 2022 FDOKUMEN