Impacts of the Tropical Cyclone Idai in Mozambique - MDPI
17
remote sensing Article Impacts of the Tropical Cyclone Idai in Mozambique: A Multi-Temporal Landsat Satellite Imagery Analysis Alberto Bento Charrua 1,2,3 , Rajchandar Padmanaban 4 , Pedro Cabral 5 , Salomão Bandeira 6 and Maria M. Romeiras 1, * Citation: Charrua, A.B.; Padmanaban, R.; Cabral, P.; Bandeira, S.; Romeiras, M.M. Impacts of the Tropical Cyclone Idai in Mozambique: A Multi-Temporal Landsat Satellite Imagery Analysis. Remote Sens. 2021, 13, 201. https://doi.org/10.3390/ rs13020201 Received: 26 November 2020 Accepted: 6 January 2021 Published: 8 January 2021 Publisher’s Note: MDPI stays neu- tral with regard to jurisdictional clai- ms in published maps and institutio- nal affiliations. Copyright: © 2021 by the authors. Li- censee MDPI, Basel, Switzerland. This article is an open access article distributed under the terms and con- ditions of the Creative Commons At- tribution (CC BY) license (https:// creativecommons.org/licenses/by/ 4.0/). 1 Linking Landscape, Environment, Agriculture and Food (LEAF), Instituto Superior de Agronomia (ISA), Universidade de Lisboa, Tapada da Ajuda, 1349-017 Lisbon, Portugal; [email protected] 2 Nova School of Business and Economics, Universidade Nova de Lisboa, Campus de Carcavelos, Rua da Holanda, n.1, Carcavelos, 2775-405 Cascais, Portugal 3 Department of Earth Sciences and Environment, Faculty of Science and Technology, Licungo University, P.O. Box 2025, Beira 2100, Mozambique 4 Forest Research Center (CEF), Instituto Superior de Agronomia (ISA), Universidade de Lisboa, Tapada da Ajuda, 1349-017 Lisbon, Portugal; [email protected] 5 NOVA IMS, Universidade Nova de Lisboa, Campus de Campolide, 1070-312 Lisbon, Portugal; [email protected] 6 Department of Biological Sciences, Eduardo Mondlane University, P.O. Box 257, Maputo 1100, Mozambique; [email protected] * Correspondence: [email protected] Abstract: The Central Region of Mozambique (Sofala Province) bordering on the active cyclone area of the southwestern Indian Ocean has been particularly affected by climate hazards. The Cyclone Idai, which hit the region in March 2019 with strong winds causing extensive flooding and a massive loss of life, was the strongest recorded tropical cyclone in the Southern Hemisphere. The aim of this study was to use pre- and post-cyclone Idai Landsat satellite images to analyze temporal changes in Land Use and Land Cover (LULC) across the Sofala Province. Specifically, we aimed—(i) to quantify and map the changes in LULC between 2012 and 2019; (ii) to investigate the correlation between the distance to Idai’s trajectory and the degree of vegetation damage, and (iii) to determine the damage caused by Idai on different LULC. We used Landsat 7 and 8 images (with 30 m resolution) taken during the month of April for the 8-year period. The April Average Normalized Difference Vegetation Index (NDVI) over the aforementioned period (2012–2018, pre-cyclone) was compared with the values of April 2019 (post-cyclone). The results showed a decreasing trend of the productivity (NDVI 0.5 to 0.8) and an abrupt decrease after the cyclone. The most devastated land use classes were dense vegetation (decreased by 59%), followed by wetland vegetation (-57%) and shrub land (-56%). The least damaged areas were barren land (-23%), barren vegetation (-27%), and grassland and dambos (-27%). The Northeastern, Central and Southern regions of Sofala were the most devastated areas. The Pearson Correlation Coefficient between the relative vegetation change activity after Idai (NDVI%) and the distance to Idai’s trajectory was 0.95 (R-square 0.91), suggesting a strong positive linear correlation. Our study also indicated that the LULC type (vegetation physiognomy) might have influenced the degree of LULC damage. This study provides new insights for the management and conservation of natural habitats threatened by climate hazards and human factors and might accelerate ongoing recovery processes in the Sofala Province. Keywords: Cyclone Idai; remote sensing; vegetation damage; land use and land cover; vegetation in- dex 1. Introduction Tropical cyclones are among the most devastating natural disasters owing to their great potential for loss of human life, significant economic decline and severe environmental damage [1–3]. The Southwestern Indian Ocean is one of the main tropical cyclone areas Remote Sens. 2021, 13, 201. https://doi.org/10.3390/rs13020201 https://www.mdpi.com/journal/remotesensing
-
Upload
khangminh22 -
Category
Documents
-
view
0 -
download
0
Transcript of Impacts of the Tropical Cyclone Idai in Mozambique - MDPI

remote sensing
Article
Impacts of the Tropical Cyclone Idai in Mozambique:A Multi-Temporal Landsat Satellite Imagery Analysis
Alberto Bento Charrua 1,2,3 , Rajchandar Padmanaban 4, Pedro Cabral 5 , Salomão Bandeira 6 andMaria M. Romeiras 1,*
�����������������
Citation: Charrua, A.B.;
Padmanaban, R.; Cabral, P.; Bandeira,
S.; Romeiras, M.M. Impacts of the
Tropical Cyclone Idai in Mozambique:
A Multi-Temporal Landsat Satellite
Imagery Analysis. Remote Sens. 2021,
13, 201. https://doi.org/10.3390/
rs13020201
Received: 26 November 2020
Accepted: 6 January 2021
Published: 8 January 2021
Publisher’s Note: MDPI stays neu-
tral with regard to jurisdictional clai-
ms in published maps and institutio-
nal affiliations.
Copyright: © 2021 by the authors. Li-
censee MDPI, Basel, Switzerland.
This article is an open access article
distributed under the terms and con-
ditions of the Creative Commons At-
tribution (CC BY) license (https://
creativecommons.org/licenses/by/
4.0/).
1 Linking Landscape, Environment, Agriculture and Food (LEAF), Instituto Superior de Agronomia (ISA),Universidade de Lisboa, Tapada da Ajuda, 1349-017 Lisbon, Portugal; [email protected]
2 Nova School of Business and Economics, Universidade Nova de Lisboa, Campus de Carcavelos,Rua da Holanda, n.1, Carcavelos, 2775-405 Cascais, Portugal
3 Department of Earth Sciences and Environment, Faculty of Science and Technology, Licungo University,P.O. Box 2025, Beira 2100, Mozambique
4 Forest Research Center (CEF), Instituto Superior de Agronomia (ISA), Universidade de Lisboa,Tapada da Ajuda, 1349-017 Lisbon, Portugal; [email protected]
5 NOVA IMS, Universidade Nova de Lisboa, Campus de Campolide, 1070-312 Lisbon, Portugal;[email protected]
6 Department of Biological Sciences, Eduardo Mondlane University, P.O. Box 257, Maputo 1100, Mozambique;[email protected]
* Correspondence: [email protected]
Abstract: The Central Region of Mozambique (Sofala Province) bordering on the active cyclone areaof the southwestern Indian Ocean has been particularly affected by climate hazards. The CycloneIdai, which hit the region in March 2019 with strong winds causing extensive flooding and a massiveloss of life, was the strongest recorded tropical cyclone in the Southern Hemisphere. The aim of thisstudy was to use pre- and post-cyclone Idai Landsat satellite images to analyze temporal changes inLand Use and Land Cover (LULC) across the Sofala Province. Specifically, we aimed—(i) to quantifyand map the changes in LULC between 2012 and 2019; (ii) to investigate the correlation betweenthe distance to Idai’s trajectory and the degree of vegetation damage, and (iii) to determine thedamage caused by Idai on different LULC. We used Landsat 7 and 8 images (with 30 m resolution)taken during the month of April for the 8-year period. The April Average Normalized DifferenceVegetation Index (NDVI) over the aforementioned period (2012–2018, pre-cyclone) was comparedwith the values of April 2019 (post-cyclone). The results showed a decreasing trend of the productivity(NDVI 0.5 to 0.8) and an abrupt decrease after the cyclone. The most devastated land use classes weredense vegetation (decreased by 59%), followed by wetland vegetation (−57%) and shrub land (−56%).The least damaged areas were barren land (−23%), barren vegetation (−27%), and grassland anddambos (−27%). The Northeastern, Central and Southern regions of Sofala were the most devastatedareas. The Pearson Correlation Coefficient between the relative vegetation change activity after Idai(NDVI%) and the distance to Idai’s trajectory was 0.95 (R-square 0.91), suggesting a strong positivelinear correlation. Our study also indicated that the LULC type (vegetation physiognomy) mighthave influenced the degree of LULC damage. This study provides new insights for the managementand conservation of natural habitats threatened by climate hazards and human factors and mightaccelerate ongoing recovery processes in the Sofala Province.
Keywords: Cyclone Idai; remote sensing; vegetation damage; land use and land cover; vegetation in-dex
1. Introduction
Tropical cyclones are among the most devastating natural disasters owing to their greatpotential for loss of human life, significant economic decline and severe environmentaldamage [1–3]. The Southwestern Indian Ocean is one of the main tropical cyclone areas
Remote Sens. 2021, 13, 201. https://doi.org/10.3390/rs13020201 https://www.mdpi.com/journal/remotesensing

Remote Sens. 2021, 13, 201 2 of 17
in the world [4], and also the most cyclone active area in the Southern Hemisphere [5].Currently, the negative effects of climate change are an omnipresent reality in Mozambique,as this southern African country frequently experiences extreme weather and climateevents such as drought, floods and cyclones [6]. The cyclone season in Mozambiquegenerally spans the period of November to April. Every year, three to twelve cyclonesform in the Mozambique Channel [7,8]. The Central region of Mozambique, including theSofala Province, is the area most prone to cyclones (six cyclones in 16 years) and climatehazards. This region is characterized by a large tidal range (up to 7 m), and extensive lowflatland [9–11]. The most severe tropical cyclones striking Sofala and affecting the livesof millions of inhabitants were—Nadia in 1994, Bonita in 1996, Lisete in 1997, Eline in2000, Japhete in 2003, and Idai in March 2019 [12,13]. Idai (category four) was the mostdevastating and deadliest cyclone recorded in the Southern Hemisphere, in terms of theloss of human life, of facilities and of infrastructures [14,15]. Idai primarily affected Sofalaand impacted the surrounding provinces (Manica, Inhambane, Tete and Zambézia), whilealso wreaking havoc in Zimbabwe as well. It brought torrential rain (more than 200 mmin 24 h) and strong winds (up to 220 km/h), causing severe widespread flooding (floodwaters rose more than 10 m). Idai affected more than 1.5 million people in Mozambique,resulting in more than 600 deaths while over 1600 persons were injured. However, severeLand Use and Land Cover (LULC) damage has not yet been fully quantified. Cyclone Idai’ssocioeconomic impact in Mozambique was considered the highest to date, with damagesand losses estimated at US $3.2 billion (2019 estimate) [12].
Several studies using satellite images to assess the impact of cyclones on naturalhabitats have been reported from different parts of the world, including the USA [16], theGulf of Mexico and Caribbean/Mesoamerican Region [17], Australia [18], and India andBangladesh [19]. In Africa and Mozambique in particular, cyclone impact studies on LULCare comparatively rare.
The Sofala Province is an under-researched area. With the exception of two studiescarried out on the Save River Delta (forming the border between South and CentralMozambique), which assessed the response of mangroves to cyclone Eline (2000) usingSPOT images [20], and the qualitative analysis of natural system management underrecurrent catastrophic events (cyclones and floods) [21], no published reports have beendetected. Our study is the first to document the impact of the category four Cyclone Idaion LULC.
Studying the impact of cyclones on LULC in the context of climate change is crucial toinform the design and implementation of natural vegetation management, identify threat-ened habitats, prevent and/or counter environmental threats, and enhance conservationefforts. Moreover, our study provides valuable information for evidence-based decisionmaking and disaster management for a more effective recovery of both natural habitatsand human infrastructures in the Sofala Province. It also gives relevant insights into thesensitivity and recovery of natural vegetation following a devastating cyclone. Since Idaidamaged communication and transport networks, as well as other basic infrastructures, tra-ditional field work to survey the large-scale destruction of vegetation is difficult, expensiveand time-consuming when compared to remote sensing [22–24].
Vegetation indicators, including the Normalized Difference Vegetation Index (NDVI)and the Enhanced Vegetation Index, have been widely used to obtain useful information onvegetation destruction and sensitivity, particularly after a damage event [24–26]. Landsatdata images are easy to access, and have long been used to monitor land use and changesin vegetation cover [27–29]. Therefore, the main purpose of this study was to use pre- andpost-Idai Landsat imagery to analyze temporal changes in Sofala’s LULC from 2012 to2019. Specifically, we aimed—(i) to quantify and map LULC dynamics from 2012 to 2019;(ii) to investigate how the distance to Idai’s trajectory related to vegetation damage, and(iii) to determine the degree of damage caused by the cyclone on different LULC classes.The findings of this study are meant to assist managers of natural resources to designand implement efficient strategies and practices in order to safeguard natural ecosystems

Remote Sens. 2021, 13, 201 3 of 17
and their services such as provisioning (e.g., food, and timber), regulating (e.g., climateregulation, and water purification), supporting (e.g., nutrient cycling, and soil formation),and cultural (recreation, and spiritual) [30].
2. Materials and Methods2.1. Study Area
Sofala is a coastal province in Central Mozambique, occupying a surface area ofapproximately 68,018 km2 (about 8.5% of the country). It borders on the Indian Ocean tothe east, on the Zambezi River to the north, and the Save River to the south (Figure 1a).The Central part of Sofala is intersected by the Púnguè and the Buzi River, and the provinceis characterized by an inter-connected hydrological system of creeks, swamps, and lakes.All the region’s main rivers discharge into the Indian Ocean, providing a suitable habitatfor the growth and establishment of a great variety animal and plant species. Accordingto the 2017 census, the total population of Sofala province was estimated at 2,259,248inhabitants, most of them living in rural areas [31] and largely dependent on unstablenatural resources (threatened by climate hazards) for their subsistence. The main economicactivities of the local population are slash and burn agriculture, fishing, raising cattle andcommerce. The Province of Sofala is characterized by a tropical climate with rainy season(summer) running from November to March, and a dry season (winter) from April toOctober; southeasterly trade winds are predominant. The annual average temperatureis 25 ◦C and average rainfall amounts to approximately 1300 mm/year [32]. Accordingto Marzoli [33], LULC classes in Sofala are primarily composed of vast native forests(48.81%), wetlands (19%), agricultural lands (5.57%), urban areas (0.16%), barren areas(0.5%), with water and other vegetation formations (height < 5 m) accounting for 25.96%.Sofala’s coastline is characterized by the so-called swamp coast [34] and it has one of thelargest mangrove areas (932 km2) in Mozambique, second only to the Zambezia province(1219 km2) [33]. Sofala is the province most prone to floods and cyclones (occurring insummer) which greatly affect LULC [9,11].
Remote Sens. 2021, 13, x FOR PEER REVIEW 3 of 17
2012 to 2019; (ii) to investigate how the distance to Idai’s trajectory related to vegetation
damage, and (iii) to determine the degree of damage caused by the cyclone on different
LULC classes. The findings of this study are meant to assist managers of natural resources
to design and implement efficient strategies and practices in order to safeguard natural
ecosystems and their services such as provisioning (e.g., food, and timber), regulating
(e.g., climate regulation, and water purification), supporting (e.g., nutrient cycling, and
soil formation), and cultural (recreation, and spiritual) [30].
2. Materials and Methods
2.1. Study Area
Sofala is a coastal province in Central Mozambique, occupying a surface area of ap-
proximately 68,018 km2 (about 8.5% of the country). It borders on the Indian Ocean to the
east, on the Zambezi River to the north, and the Save River to the south (Figure 1a). The
Central part of Sofala is intersected by the Púnguè and the Buzi River, and the province is
characterized by an inter-connected hydrological system of creeks, swamps, and lakes. All
the region’s main rivers discharge into the Indian Ocean, providing a suitable habitat for
the growth and establishment of a great variety animal and plant species. According to
the 2017 census, the total population of Sofala province was estimated at 2,259,248 inhab-
itants, most of them living in rural areas [31] and largely dependent on unstable natural
resources (threatened by climate hazards) for their subsistence. The main economic activ-
ities of the local population are slash and burn agriculture, fishing, raising cattle and com-
merce. The Province of Sofala is characterized by a tropical climate with rainy season
(summer) running from November to March, and a dry season (winter) from April to
October; southeasterly trade winds are predominant. The annual average temperature is
25 °C and average rainfall amounts to approximately 1300 mm/year [32]. According to
Marzoli [33], LULC classes in Sofala are primarily composed of vast native forests
(48.81%), wetlands (19%), agricultural lands (5.57%), urban areas (0.16%), barren areas
(0.5%), with water and other vegetation formations (height < 5 m) accounting for 25.96%.
Sofala’s coastline is characterized by the so-called swamp coast [34] and it has one of the
largest mangrove areas (932 km2) in Mozambique, second only to the Zambezia province
(1219 km2) [33]. Sofala is the province most prone to floods and cyclones (occurring in
summer) which greatly affect LULC [9,11].
(a) (b)
Figure 1. Location of the study area (a) and trajectory of Cyclone Idai (b) (adapted from Meteo France). Figure 1. Location of the study area (a) and trajectory of Cyclone Idai (b) (adapted from Meteo France).

Remote Sens. 2021, 13, 201 4 of 17
2.2. The Cyclone IDAI
Cyclone Idai originated from a tropical depression that formed in the MozambiqueChannel on 4 March 2019. On 9 March, the depression intensified, transforming it into the,as yet, moderate tropical storm Idai. The reigning conditions in the Mozambique Channelgreatly favored the intensification of the winds to speeds of 175 km/h on 11 March. Idaithen weakened and died down for a day, only to re-activate on 13 March. On the nightof 14 to 15 March, Idai turned into a category four tropical cyclone making landfall nearBeira, the main city in Central Sofala, Mozambique’s second largest city, and a strategicmaritime port which serves Mozambique’s interior as well as a vast southern Africanhinterland region (e.g., Zimbabwe, Botswana, Malawi, Zambia, and Democratic Republicof Congo) (Figure 1b). It brought strong winds (180–220 km/h) and torrential rain (morethan 200 mm in 24 h), flooding more than 3000 km2 of agricultural land. It displaced around400,000 inhabitants, provoking over 600 deaths, while severely damaging LULC classes [12].The winds receded as the cyclone moved inland, affecting provinces bordering on Sofala(Manica, Zambézia, Tete, and Inhambane) before moving to neighboring Zimbabwe.
2.3. Data
We used Landsat 7 Enhanced Thematic Mapper Plus (ETM+) and Landsat 8 Oper-ational Land Imager (OLI) images from April of each year, from 2012 to 2015, and 2016to 2019, respectively. Landsat 7 ETM+ and Landsat 8 OLI data both had a 30 m resolu-tion and were downloaded from the United States Geological Survey (USGS) gateway(https://earthexplorer.usgs.gov/). Table 1 shows the list of satellite images used, acquisi-tion date, and path row for the study area. The LULC and NDVI analyses can be influencedby seasonal differences (because of changes in atmospheric conditions and photosyntheticactivities) [35].
Table 1. Satellite imagery used in this study.
Date Sensor Path Row
12 April 2012 Landsat 7 ETM+ 166/7319 April 2012 Landsat 7 ETM+ 167/72, 73, 74, 7528 April 2012 Landsat 7 ETM+ 168/72, 73, 7413 April 2013 Landsat 7 ETM+ 166/7315 April 2013 Landsat 7 ETM+ 167/72, 73, 74, 7522 April 2013 Landsat 7 ETM+ 168/72, 73, 742 April 2014 Landsat 7 ETM+ 166/73
16 April 2014 Landsat 7 ETM+ 167/72, 73, 74, 7518 April 2014 Landsat 7 ETM+ 168/72, 73, 7412 April 2015 Landsat 7 ETM+ 166/7312 April 2015 Landsat 7 ETM+ 167/72, 73, 74, 7519 April 2015 Landsat 7 ETM+ 168/72, 73, 746 April 2016 Landsat 8 OLI 166/73
13 April 2016 Landsat 8 OLI 167/72, 73, 74, 7529 April 2016 Landsat 8 OLI 168/72, 73, 749 April 2017 Landsat 8 OLI 166/73
16 April 2017 Landsat 8 OLI 167/72, 73, 74, 7525 April 2017 Landsat 8 OLI 168/72, 73, 7412 April 2018 Landsat 8 OLI 166/7319 April 2018 Landsat 8 OLI 167/72, 73, 74, 7528 April 2018 Landsat 8 OLI 168/72, 73, 746 April 2019 Landsat 8 OLI 166/73
15 April 2019 Landsat 8 OLI 167/72, 73, 74, 7522 April 2019 Landsat 8 OLI 168/72, 73, 74
2.4. Methods
This study was carried out in four main steps—(1) satellite data pre-processing, whichincluded cloud detection, atmospheric correction, and geometric correction; (2) calculation

Remote Sens. 2021, 13, 201 5 of 17
of the vegetation indicators, including the Normalized Difference Vegetation Index (NDVI),the difference in NDVI (∆NDVI), and the relative change in vegetation productivity afterIdai (NDVI%); (3) producing the LULC map for April 2019; and (4) producing a distancebands map obtained using buffer analysis. These steps are detailed in Figure 2. The distanceto the cyclone’s trajectory was subjected to statistical analyses to evaluate its relationshipwith vegetation damage using a linear regression model with a single explanatory variable.
Remote Sens. 2021, 13, x FOR PEER REVIEW 5 of 17
2.4. Methods
This study was carried out in four main steps—(1) satellite data pre-processing,
which included cloud detection, atmospheric correction, and geometric correction; (2) cal-
culation of the vegetation indicators, including the Normalized Difference Vegetation In-
dex (NDVI), the difference in NDVI (∆NDVI), and the relative change in vegetation
productivity after Idai (NDVI%); (3) producing the LULC map for April 2019; and (4) pro-
ducing a distance bands map obtained using buffer analysis. These steps are detailed in
Figure 2. The distance to the cyclone’s trajectory was subjected to statistical analyses to
evaluate its relationship with vegetation damage using a linear regression model with a
single explanatory variable.
Figure 2. Workflow of Land Use and Land Cover (LULC) classification.
Initially, the Landsat 7 and 8 satellite data were geometrically corrected and ortho-
rectified (Figure 2) using the Landsat packages (“georef” and “geoshift”) in RStudio Soft-
ware [36–38]. All satellite images were georeferenced through the Universal Transverse
Mercator (UTM) coordinate system. We were aware of the limitation of Landsat 7 ETM+
because of the Scan Line Corrector (SLC) failure [39,40]. To fill the gaps (Not available
“NA” values) caused by that error, we applied the Landsat 7 Scan Line Corrector (SLC)-
off Gap function, using the traditional Local Linear Histogram Matching method—LLHM
[37,41]. The ERDAS image processing software (version 8.7) was applied to perform Scan
line error correction with the help of band-specific gap mask files, made with the Landsat
7 Level-1 data product. These mask files help to classify the location of every pixel affected
by the original data gaps in the primary SLC-off scene [36]. For this purpose, the DV val-
ues (0–255) were converted into top-of-atmosphere (TOA) radiance (at-satellite radiance
values) using the parameters provided in metadata files [38,42,43]. We also applied abso-
lute atmospheric compensation techniques (Dark Object and Modified Dark Object Sub-
traction Method) to identify and remove clouds, aerosols, and cirri [36,44].
Figure 2. Workflow of Land Use and Land Cover (LULC) classification.
Initially, the Landsat 7 and 8 satellite data were geometrically corrected and ortho-rectified (Figure 2) using the Landsat packages (“georef” and “geoshift”) in RStudio Soft-ware [36–38]. All satellite images were georeferenced through the Universal TransverseMercator (UTM) coordinate system. We were aware of the limitation of Landsat 7 ETM+because of the Scan Line Corrector (SLC) failure [39,40]. To fill the gaps (Not available “NA”values) caused by that error, we applied the Landsat 7 Scan Line Corrector (SLC)-off Gapfunction, using the traditional Local Linear Histogram Matching method—LLHM [37,41].The ERDAS image processing software (version 8.7) was applied to perform Scan line errorcorrection with the help of band-specific gap mask files, made with the Landsat 7 Level-1data product. These mask files help to classify the location of every pixel affected by theoriginal data gaps in the primary SLC-off scene [36]. For this purpose, the DV values (0–255)were converted into top-of-atmosphere (TOA) radiance (at-satellite radiance values) usingthe parameters provided in metadata files [38,42,43]. We also applied absolute atmosphericcompensation techniques (Dark Object and Modified Dark Object Subtraction Method) toidentify and remove clouds, aerosols, and cirri [36,44].
The pseudo-invariant features (PIF) function was used to examine the homogeneity ofreflectance values of LULC in the images, and then corrected by using major axis regression.The Landsat 7 and 8 data were radiometrically and atmospherically corrected by using anatmospheric simulation model available in the Landsat and R package (RStoolBox) [38,45].

Remote Sens. 2021, 13, 201 6 of 17
2.5. Land Use and Land Cover Classification
The satellite images for 2019 were classified into nine LULC classes—dense vegetation,shrub land, grassland and dambos, agricultural land, wetland vegetation, barren vegetation,barren land, built-up areas, and water bodies (Table 2). This was performed by applyingthe Random Forest (RF) classifier. This technique has been recently used for mappingplant species and landscape due to its processing speed, improved accuracy, and reliableclassification outputs [46,47]. The processing chain for the RF classification algorithmoptimized the proximities between data points [48]:
• Produces n-tree bootstrap model from the raster data;• Runs an unpruned classification grown for all bootstrap models according to the
DN values;• Produces N number of polygons in line with the DN raster values;• Chooses the number of classifications of the LULC classes; and• Illustrates LULC classification.
For the LULC classification, we used “randomForest” packages [49] in the open-sourceRStudio software version 1.3.1073 [50]. Furthermore, the packages Classes and Methodsfor Spatial Data (Sp) [51], raster [52], and Raster Geospatial Data Abstraction Library(Rgdal) [53] were used to process and visualize the spatial data.
Table 2. Land use and land cover types identified for the Sofala Province.
ID Land Use and Land Cover Types Description
1 Dense Vegetation Woodland and forest2 Shrub land Brush, scrubland, shrubs and bush3 Grassland and dambos Grasses, rush and sedge
4 Agricultural land Pasture, crop cultivation area, hay and otherfruit plants
5 Wetland vegetation Coastal and marine ecosystems including swamps,saltmarshes, and mangroves
6 Barren vegetation Stunted, sparse and limited vegetationform/structure
7 Barren land Sand, rocks, dry salt flats (including salt pans), mines,gravel pits and quarries
8 Built-up areas Settlements, roads, bridges, urban and otherinfrastructures
9 Waterbodies River, open water, lakes, streams, estuaries and ponds
2.6. Accuracy Assessment
The accuracy assessment is a widely applied technique to quantify how close theresult of land cover classification is to the reference image. In this study, the accuracywas assessed by comparing the results of the obtained LULC map (classified image) withreference Google Earth images retrieved from the Google Earth Engine (GEE) [54] for theyear 2019. From the classified LULC, seventy-five random point samples were producedfor the study period. They were visually distinguished from GEE by comparison withthe classified map. A confusion matrix was constructed to assess accuracy [48]. Thequantitative accuracy assessment of the classified map was obtained by calculating thekappa coefficient (k) using ERDAS Imagine (version 8.7) [55]. The model’s accuracy isclassified according to k values as follows—poor (k < 0.2), moderate (0.4 < k < 0.6) andnear perfect (k > 0.8) (see Jensen [35] and Louarn et al. [47], for further detail).

Remote Sens. 2021, 13, 201 7 of 17
2.7. Vegetation Indices
The Normalized Difference Vegetation Index (NDVI) is generally used to measurevegetation density and its health status (level of photosynthetic activity) and is less affectedby topographic factors and illumination [24]. The NDVI is calculated as follows:
NDVI =(NIR − RED)
(NIR + RED), (1)
where NIR and RED are the spectral reflectances corresponding to the fourth (0.77–0.90 µm)and third (0.63–0.69 µm) Landsat ETM+ bands, respectively [24]. For Landsat 8 OLI, NIR isthe fifth band (0.85–0.88 µm) and RED is the fourth band (0.64–0.67 µm) [23]. Normally,NDVI ranges between −1.0 and 1.0 with vegetation land covers ranging from 0.0 to 1.0.The difference in NDVI (hereafter referred to as ∆NDVI) can show the change in LULC,while a negative ∆NDVI represents the vegetation damage caused by Cyclone Idai. It iscalculated by subtracting the NDVI image of one date (after) from that of another (before)using map algebra, which is a cell-by-cell process [24,56]. In this study, the Average NDVIin April over the 7-year period (2012–2018) represents the situation before Cyclone Idai(hereafter referred as pre-cyclone) whereas the NDVI of April 2019 represents the post-cyclone situation (hereafter referred as post-cyclone). The ∆NDVI is calculated using thefollowing equation:
∆NDVI = NDVIpost − NDVIpre, (2)
where NDVIpre and NDVIpost are NDVI before and after cyclone, respectively. We alsocalculated the relative vegetation change activity after Idai (NDVI%) by using the equationbelow:
NDVI% =∆NDVI
NDVIpre× 100 (3)
Please note that a higher NDVI% indicates lower damage. We used Sp [51], raster [52],rts [57], and Rgdal [53] packages in R studio for calculation of NDVI and the changes invegetation productivity.
2.8. Distance to the Cyclone Trajectory
A distance map based on the Cyclone Idai’s track was produced with distance bandscalculated using ArcGIS (ESRI, 2020); 10 multiple buffers at the specified distance of 25 kmfrom the best track line were obtained [23].
2.9. Correlation Analysis
We used the Pearson Correlation Coefficient to assess the relationship between vegeta-tion damage and the distance to the cyclone’s trajectory. This relationship was measuredby means of a least squares estimator from the linear regression model with a singleinfluencing/explanatory variable [23,24].
3. Results3.1. Land Use and Land Cover
Figure 3 displays the nine LULC classes obtained for the Sofala Province. The kappacoefficient (>0.80) (Table 3) shows a high accuracy level, indicating a good agreementbetween the LULC map for April 2019 and ground-truth based on GEE images [35,47].Table 3 shows that the Producer’s accuracy (i.e., how often are real features on the groundcorrectly shown on the LULC map) and user’s accuracy (i.e., how often the class on theLULC map will actually be present on the ground) presented different values for each class,with a much higher accuracy for barren vegetation (PA: 92.5; UA: 94.1) [58].

Remote Sens. 2021, 13, 201 8 of 17Remote Sens. 2021, 13, x FOR PEER REVIEW 8 of 17
Figure 3. Land cover map of the Sofala Province in April 2019.
Table 3. The confusion matrix of the LULC map.
LULC Types Producer Accuracy User Accuracy
Dense vegetation 83.6 91.6
Shrub land 81.2 83.6
Grassland and dambos 89.9 92.7
Agriculture land 87.1 89.3
Wetland vegetation 88.3 92.4
Barren vegetation 92.5 94.1
Barren land 87.7 89.3
Built-up areas 80.6 84.2
Waterbodies 86.4 86.4
Figure 3. Land cover map of the Sofala Province in April 2019.
Table 3. The confusion matrix of the LULC map.
LULC Types Producer Accuracy User Accuracy
Dense vegetation 83.6 91.6Shrub land 81.2 83.6
Grassland and dambos 89.9 92.7Agriculture land 87.1 89.3
Wetland vegetation 88.3 92.4Barren vegetation 92.5 94.1
Barren land 87.7 89.3Built-up areas 80.6 84.2Waterbodies 86.4 86.4
Remote Sens. 2021, 13, 201 9 of 17
3.2. NDVI
Figure 4 illustrates the spatial distribution of pre-cyclone (left) and post-cyclone (right)NDVI. The comparison by optical remote sensing shows the loss of green leaves on the post-cyclone imagery, as indicated by the increase of no productivity and/or low productivitypixels [23,24]. Significant NDVI alterations were observed across the entire Province,with the largest LULC changes detected in the Northeast (NE), Central (C), and Southern(S) regions.
Remote Sens. 2021, 13, x FOR PEER REVIEW 9 of 17
3.2. NDVI
Figure 4 illustrates the spatial distribution of pre-cyclone (left) and post-cyclone
(right) NDVI. The comparison by optical remote sensing shows the loss of green leaves
on the post-cyclone imagery, as indicated by the increase of no productivity and/or low
productivity pixels [23,24]. Significant NDVI alterations were observed across the entire
Province, with the largest LULC changes detected in the Northeast (NE), Central (C), and
Southern (S) regions.
Figure 4. Spatial distribution of April Normalized Difference Vegetation Index (NDVI) averages in
the Sofala Province. Pre-cyclone (left: Average NDVI over 7 years (2012–2018), and post-cyclone
(right: 2019). NE—Northeastern, C—Central, and Southern (S) regions of the Province.
Table 4 shows the land cover classes affected by the Cyclone Idai. All post-cyclone
images were acquired within three or four weeks of Idai’s passage through the Sofala
Province, i.e., before the damaged vegetation had recovered. The ∆NDVI ranged from
−0.07 to −0.46; the highest damage was found for dense vegetation (−58.9%), wetland veg-
etation (−57.4%), and shrub land (−55.5%); the least damage was observed in barren land
(−22.5%), barren vegetation (−26.9%), and grassland and dambos (−27.1%).
Table 4. Land cover classes affected by the cyclone (pre-cyclone—average April NDVI over 2012–2018; after-cyclone—
April 2019).
Land Cover Types Counts (Pixels) Total Area
(SqKm)
Mean NDVI
Pre-Cyclone
Mean NDVI Post-
Cyclone ∆NDVI NDVI%
Dense vegetation 45,393,777 40,854.4 0.78 0.32 −0.46 −58.9
Shrub land 1,1070,577 9963.52 0.63 0.28 −0.35 −55.5
Grassland and dambos 3,980,911 3582.82 0.59 0.43 −0.16 −27.1
Agriculture land 5,705,377 5134.84 0.66 0.45 −0.21 −31.8
Wetland vegetation 8,104,666 7294.20 0.54 0.23 −0.31 −57.4
Barren vegetation 23,711 21.34 0.52 0.38 −0.14 −26.9
Barren land 399,033 359.13 0.31 0.24 −0.07 −22.5
Built-up areas 42,977 38.68 0.28 0.19 −0.09 −32.1
Figure 4. Spatial distribution of April Normalized Difference Vegetation Index (NDVI) averages in the Sofala Province.Pre-cyclone (left: Average NDVI over 7 years (2012–2018), and post-cyclone (right: 2019). NE—Northeastern, C—Central,and Southern (S) regions of the Province.
Table 4 shows the land cover classes affected by the Cyclone Idai. All post-cycloneimages were acquired within three or four weeks of Idai’s passage through the SofalaProvince, i.e., before the damaged vegetation had recovered. The ∆NDVI ranged from−0.07 to −0.46; the highest damage was found for dense vegetation (−58.9%), wetlandvegetation (−57.4%), and shrub land (−55.5%); the least damage was observed in barrenland (−22.5%), barren vegetation (−26.9%), and grassland and dambos (−27.1%).
Table 4. Land cover classes affected by the cyclone (pre-cyclone—average April NDVI over 2012–2018; after-cyclone—April2019).
Land Cover Types Counts(Pixels)
Total Area(SqKm)
Mean NDVIPre-Cyclone
Mean NDVIPost-Cyclone ∆NDVI NDVI%
Dense vegetation 45,393,777 40,854.4 0.78 0.32 −0.46 −58.9Shrub land 1,1070,577 9963.52 0.63 0.28 −0.35 −55.5
Grassland and dambos 3,980,911 3582.82 0.59 0.43 −0.16 −27.1Agriculture land 5,705,377 5134.84 0.66 0.45 −0.21 −31.8
Wetland vegetation 8,104,666 7294.20 0.54 0.23 −0.31 −57.4Barren vegetation 23,711 21.34 0.52 0.38 −0.14 −26.9
Barren land 399,033 359.13 0.31 0.24 −0.07 −22.5Built-up areas 42,977 38.68 0.28 0.19 −0.09 −32.1

Remote Sens. 2021, 13, 201 10 of 17
Figure 5 clearly shows an abrupt decrease of the area of highly productive vegetationclasses (0.5–0.8) in April 2019, associated with a substantial growth of the low productivityvegetation area. Overall, almost all the highly productive vegetation experienced a severedecrease (over 99%) while the areas with low productivity vegetation increased by 22–80%as shown in the inset table of Figure 5.
Remote Sens. 2021, 13, x FOR PEER REVIEW 10 of 17
Figure 5 clearly shows an abrupt decrease of the area of highly productive vegetation
classes (0.5–0.8) in April 2019, associated with a substantial growth of the low productivity
vegetation area. Overall, almost all the highly productive vegetation experienced a severe
decrease (over 99%) while the areas with low productivity vegetation increased by 22–
80% as shown in the inset table of Figure 5.
Figure 5. The time series of average of April NDVI from 2012 to 2019. Low Productivity—0.1–0.2
and 0.2–0.3, Moderate Productivity—0.3–0.4 and 0.4–0.5, and High Productivity—0.5–0.8. The
inset table shows vegetation productivity changes (pre-cyclone vs. post-cyclone).
3.3. Influence of the Distance to the Cyclone Trajectory
The distance to the Cyclone Idai trajectory map is shown in Figure 6 for Sofala Prov-
ince. The NDVI% was calculated for each distance class (Table 5). NDVI% increased with
the distance from the cyclone trajectory (Figure 7 and Table 5).
At distances shorter than 75 km from the cyclone trajectory, land degradation was
higher than 50% in NDVI. Even at distances over 200 km, NDVI was still above 20%
(Figure 7 and Table 5).
Figure 5. The time series of average of April NDVI from 2012 to 2019. Low Productivity—0.1–0.2and 0.2–0.3, Moderate Productivity—0.3–0.4 and 0.4–0.5, and High Productivity—0.5–0.8. The insettable shows vegetation productivity changes (pre-cyclone vs. post-cyclone).
3.3. Influence of the Distance to the Cyclone Trajectory
The distance to the Cyclone Idai trajectory map is shown in Figure 6 for Sofala Province.The NDVI% was calculated for each distance class (Table 5). NDVI% increased with thedistance from the cyclone trajectory (Figure 7 and Table 5).
Table 5. Values of the vegetation indices changes at different distances from the cyclone trajectory.
Distance (km) Counts (Pixels) ∆NDVI NDVI%
0–25 7,516,910 −0.38 −55.0725–50 8,079,493 −0.32 −53.350–75 8,605,728 −0.36 −52.9
75–100 8,768,752 −0.25 −45.4100–125 10,234,104 −0.19 −30.1125–150 10,724,540 −0.13 −26.5150–175 8,988,106 −0.15 −26.3175–200 5,451,298 −0.13 −25.01200–225 3,909,496 −0.11 −21.5225–250 3,003,413 −0.12 −18.4

Remote Sens. 2021, 13, 201 11 of 17Remote Sens. 2021, 13, x FOR PEER REVIEW 11 of 17
Figure 6. The Distance bands map (km) of Sofala Province.
Table 5. Values of the vegetation indices changes at different distances from the cyclone trajectory.
Distance (km) Counts (Pixels) ∆NDVI NDVI%
0–25 7,516,910 −0.38 −55.07
25–50 8,079,493 −0.32 −53.3
50–75 8,605,728 −0.36 −52.9
75–100 8,768,752 −0.25 −45.4
100–125 10,234,104 −0.19 −30.1
125–150 10,724,540 −0.13 −26.5
150–175 8,988,106 −0.15 −26.3
175–200 5,451,298 −0.13 −25.01
200–225 3,909,496 −0.11 −21.5
225–250 3,003,413 −0.12 −18.4
Figure 6. The Distance bands map (km) of Sofala Province.
At distances shorter than 75 km from the cyclone trajectory, land degradation washigher than 50% in NDVI. Even at distances over 200 km, NDVI was still above 20%(Figure 7 and Table 5).
Remote Sens. 2021, 13, 201 12 of 17Remote Sens. 2021, 13, x FOR PEER REVIEW 12 of 17
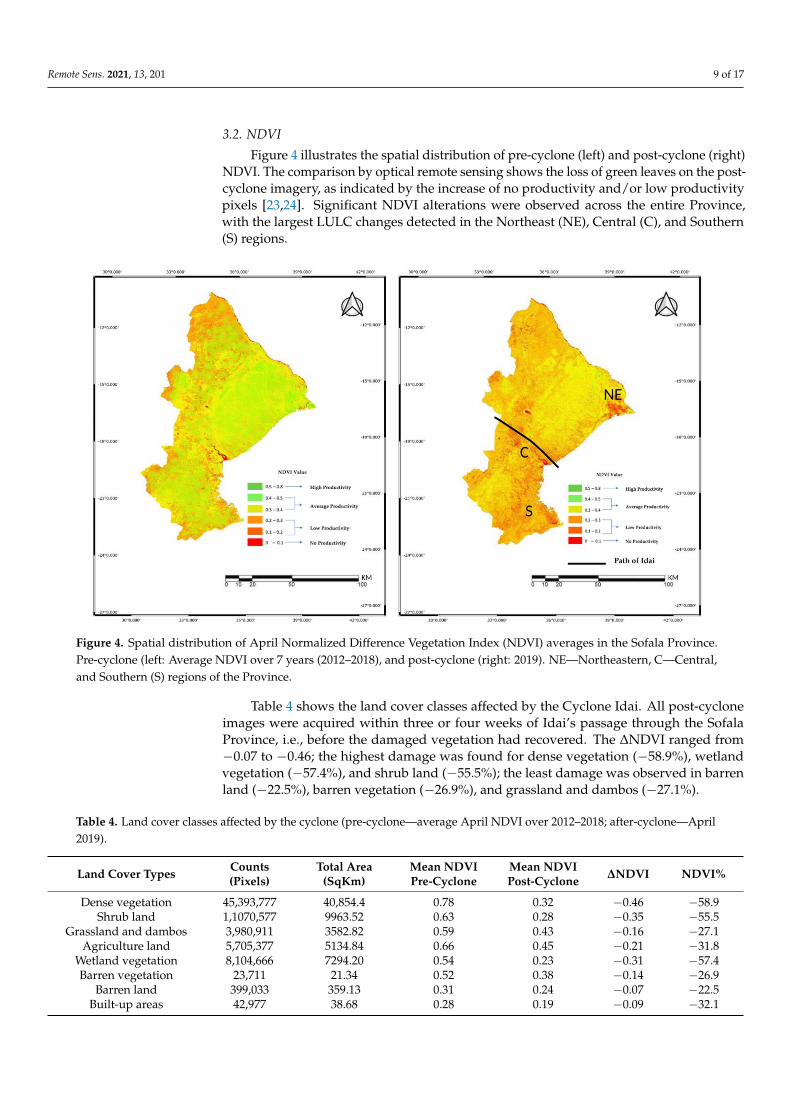
Figure 7. Pearson’s correlation between mean NDVI% and distance to the Idai’s trajectory.
4. Discussion
4.1. The Changes in NDVI
The vegetation productivity changes from 2012 to 2019 were quantified (Figure 5). In
general, the areas with no productivity and/or low productivity tended to increase with
time and an abrupt increase was observed in April 2019 (post-cyclone), whereas the high
productivity pixels showed an opposite trend. The loss of vegetation productivity with
time is a great concern globally and, most particularly, in low-income countries like
Mozambique prone to climatic hazards. Mozambican forests and other natural ecosys-
tems are under greater anthropogenic pressure (e.g., slash and burn agriculture, timber
for building local infrastructures, firewood, and charcoal production, and urban expan-
sion) while being adversely affected by natural factors (e.g., climate hazards, rising sea
levels and frequent flooding) [11,59,60]. The category four tropical Cyclone Idai was the
most devastating and deadliest ever recorded in the Southern Hemisphere. It brought
strong winds and torrential rains, causing extensive flooding and leaving many commu-
nities in the Sofala Province submerged under 10 m of water [61]. It also caused a loss of
99.5% of high-productivity vegetation and an increment of up to 80.5% of the low- and
moderate-productivity areas (Figure 5).
NDVI clearly changed over the whole Sofala Province after Idai’s passage. The
Northeastern, Central, and Southern regions (Figure 4) appear to be the most devastated
areas. At “NE” a high concentration of the pixels of no productivity and/or low produc-
tivity region is clearly visible, where our results show the predominance of dense vegeta-
tion, agricultural area and water courses with regularly flooded wood and/or herbaceous
species (Figures 3 and 4) [62]. Our findings are in line with Couto et al. [63] and Ramsar
[64] who described this Northeastern region as part of the Ramsar site of the Zambezi
Delta and of the Marromeu Complex, which are designated Wetlands of International Im-
portance (conservation hotspot). This region is characterized by a broad flat alluvial area
with a rich mosaic of grassland and dambos, woodland, thicket, large water swamps, and
an extensive area covered in mangrove. The devastation in Central Sofala Province is
Figure 7. Pearson’s correlation between mean NDVI% and distance to the Idai’s trajectory.
4. Discussion4.1. The Changes in NDVI
The vegetation productivity changes from 2012 to 2019 were quantified (Figure 5).In general, the areas with no productivity and/or low productivity tended to increase withtime and an abrupt increase was observed in April 2019 (post-cyclone), whereas the highproductivity pixels showed an opposite trend. The loss of vegetation productivity with timeis a great concern globally and, most particularly, in low-income countries like Mozambiqueprone to climatic hazards. Mozambican forests and other natural ecosystems are undergreater anthropogenic pressure (e.g., slash and burn agriculture, timber for building localinfrastructures, firewood, and charcoal production, and urban expansion) while beingadversely affected by natural factors (e.g., climate hazards, rising sea levels and frequentflooding) [11,59,60]. The category four tropical Cyclone Idai was the most devastating anddeadliest ever recorded in the Southern Hemisphere. It brought strong winds and torrentialrains, causing extensive flooding and leaving many communities in the Sofala Provincesubmerged under 10 m of water [61]. It also caused a loss of 99.5% of high-productivityvegetation and an increment of up to 80.5% of the low- and moderate-productivity areas(Figure 5).
NDVI clearly changed over the whole Sofala Province after Idai’s passage. The North-eastern, Central, and Southern regions (Figure 4) appear to be the most devastated areas.At “NE” a high concentration of the pixels of no productivity and/or low productivityregion is clearly visible, where our results show the predominance of dense vegetation, agri-cultural area and water courses with regularly flooded wood and/or herbaceous species(Figures 3 and 4) [62]. Our findings are in line with Couto et al. [63] and Ramsar [64] whodescribed this Northeastern region as part of the Ramsar site of the Zambezi Delta andof the Marromeu Complex, which are designated Wetlands of International Importance(conservation hotspot). This region is characterized by a broad flat alluvial area with a richmosaic of grassland and dambos, woodland, thicket, large water swamps, and an extensivearea covered in mangrove. The devastation in Central Sofala Province is closely related toIdai’s trajectory and the influence of the Púnguè and Buzi rivers and Urema Lake whosebasins are locally considered as wetlands [65,66]. In this region we found a mixed spatial

Remote Sens. 2021, 13, 201 13 of 17
distribution of the land cover, which mainly includes dense vegetation, agricultural land,and wetland along the coastline. The Southern region is characterized by abundant shrubland and a mixed vegetation distribution pattern including wetland vegetation, densevegetation, and agriculture land which were all strongly affected by Cyclone Idai. To thesouth, the Save River, constituting the southern border of the Sofala Province, forms anestuary that is also considered wetland [63]. Li et al. [62] reported particularly significantlevels of land degradation in the south-eastern region of the province, which could explainthe more reduced agricultural land coverage we observed in this region.
4.2. Effects of Idai on Different LULC
The changes in the different land-cover classes were calculated and compared withpublished literature. Dense vegetation (decreased by 58.9%), wetland vegetation (−57.4%)and shrub land (−55.5%) were among the most devastated vegetation classes, while barrenland (−22.5%), barren vegetation (−26.9%) and grassland and dambos (−27.1%) were theleast affected. From a biological perspective, our results show that the intensity of damageto different vegetation classes is closely related to their physiognomy. Dense vegetation,wetland vegetation, and shrub land are more vulnerable to physical damage by a tropicalcyclone than the barren areas and herbaceous or sparse vegetation because of the highertree layer and greater tree canopy cover. Numerous studies reported that forest stands witholder and bigger trees (height, diameter and canopy) are more prone to wind damage thanopen, short and sparse forest stands [67–69]. An intense tropical cyclone like Idai typicallycauses great defoliation, branch stripping, bole snapping and uprooting [70–72]. Otherindividual tree characteristics, such as less dense wood, poor health status, and growthin more exposed sites (e.g., coastal Sofala, as shown by Cabral et al. [11] and Charruaet al. [10]), contribute to increasing its vulnerability to cyclone-related damage [70,73].Other factors, such as the size of each LULC area, need to be deeply investigated. Rossiet al. [74] reported greater damage in larger forests in Northern Nicaragua as a resultof hurricane Felix (2007). Generally, the spatial distribution of severe post-Cyclone Idaidamage in Sofala closely matched the spatial distribution of the most devastated LULC.The damage behavior shown in different LULC in our study is consistent with otherfindings [23,24,70,73].
4.3. The Influence of Distance on Damage
Our results demonstrate a strong positive correlation between distance and damage.The greatest damage in NDVI was found at distances shorter than 75 km (NDVI% from−52.29 to −55.07, Table 5), in accordance with previous studies [16,23,75]. The PearsonCorrelation Coefficient between NDVI% and distance was 0.95 and R-square was 0.91,indicating a strong positive linear correlation (Figure 7). The spatial distribution of highlydamaged regions across the Sofala Province (Figure 4) and the distance to Idai’s trajectorysuggest that the degree of damage does not entirely depend on the latter and that otherfactors may interfere, like the LULC type (vegetation physiognomy) [74,76].
Although this was not a ground data-based study because of the well-known diffi-culties of field research (e.g., time-consuming, limited availability of human and logisticresources), our results are realistic and they were satisfactorily verified with the localdamage reports [12]. In fact, Landsat image analyses provided reliable results, and havebeen widely and successfully used to map LULC damages from cyclones [16,24,27,77].This study can be employed as a future reference in related studies. Our approach clearlyidentified changes between pre- and post-cyclone LULC in Sofala; moreover, we found astrong correlation between the degree of damage and the distance from Idai’s trajectory.Nevertheless, further studies are needed to quantify the local/regional changes that didnot fit the linear model.

Remote Sens. 2021, 13, 201 14 of 17
5. Conclusions
This study focuses on an analysis of the damage caused to the LULC by CycloneIdai, which hit Sofala Province in Mozambique in March 2019. For that purpose, we usedLandsat 7 and Landsat 8 images taken during the month of April over an 8-year period(2012–2019). All of the LULC classified areas showed a decrease of NDVI after the cyclone.The greatest damage was found in dense vegetation, wetland vegetation, and shrub land;barren land, barren vegetation, and grassland and dambos showed the lowest relativedamage. The most heavily affected regions were the Northeast, Central and SouthernSofala. The distance to Idai’s trajectory greatly influenced LULC damage levels—the greaterthe distance, the lower the damage. Besides the distance to Idai’s trajectory, other factorssuch as LULC type (vegetation physiognomy) may have played an important role in termsof vegetation damage. The information here provided is relevant for LULC managers andall stakeholders to take appropriate measures for better planning and future managementof the territory. In addition, our findings may help to speed up ongoing recovery processesthat were activated in the wake of tropical Cyclone Idai.
Author Contributions: Conceptualization, A.B.C. and M.M.R.; methodology, A.B.C., R.P. and P.C.;formal analysis, A.B.C. and R.P.; investigation, A.B.C.; writing—original draft preparation, A.B.C.;writing—review and editing, A.B.C., R.P., P.C., S.B. and M.M.R.; supervision, P.C. and M.M.R. Allauthors have read and agreed to the published version of the manuscript.
Funding: This research was funded by Fundação para a Ciência e Tecnologia (FCT) of the Por-tuguese Government through the grants to A.C. (SFRB/BD/135360/2017), and research unitsUID/AGR/04129/2020-Linking Landscape, Environment, Agriculture and Food (LEAF) and UIDB/04152/2020-Centro de Investigação em Gestão de Informação (MagIC).
Data Availability Statement: Publicly available datasets were analyzed in this study. This data canbe found here: https://earthexplorer.usgs.gov.
Acknowledgments: The authors would like to acknowledge the financial support provided by theFundação para a Ciência e Tecnologia (FCT).
Conflicts of Interest: The authors declare no conflict of interest.
References1. Alam, E.; Dominey-Howes, D. A new catalogue of tropical cyclones of the northern Bay of Bengal and the distribution and effects
of selected landfalling events in Bangladesh. Int. J. Clim. 2015, 35, 801–835. [CrossRef]2. Tonkin, H.; Landsea, C.; Holland, G.J.; Li, S. Tropical cyclones and climate change: A preliminary assessment. In Assessing Climate
Change: Results from the Model Evaluation Consortium for Climate Assessment; Howe, W., Henderson-Sellers, A., Eds.; Gordon andBreach: London, UK, 1997; pp. 327–360.
3. Lee, J.; Im, J.; Cha, D.H.; Park, H.; Sim, S. Tropical cyclone intensity estimation using multi-dimensional convolutional neuralnetworks from geostationary satellite data. Remote Sens. 2020, 12, 108. [CrossRef]
4. Gray, W.M. Global View of the Origin of Tropical Disturbances and Storms. Mon. Weather Rev. 1968, 96, 669–700. [CrossRef]5. Henderson-Sellers, A.; Zhang, H.; Berz, G.; Emanuel, K.; Gray, W.; Landsea, C.; Holland, G.; Lighthill, J.; Shieh, S.-L.; Webster, P.;
et al. Tropical Cyclones and Global Climate Change: A Post-IPCC Assessment. Bull. Am. Meteorol. Soc. 1998, 79, 19–38. [CrossRef]6. MICOA. Avaliação da Vulnerabilidade as Mudanças Climáticas e Estratégias de Adaptação; Ministry of Environment, Government of
Mozambique: Maputo, Mozambique, 2005.7. Consultec. Estudo Ambiental Simplificado da Dragagem do Canal de Acesso ao Porto da Beira; Consultec Consultores Associados Ltd.:
Maputo, Mozambique, 2007.8. Mavume, A.; Rydberg, L.; Rouault, M.; Lutjeharms, J. Climatology and Landfall of Tropical Cyclones in the South- West Indian
Ocean. West. Indian Ocean J. Mar. Sci. 2009, 8, 15–36. [CrossRef]9. Asante, K.; Brito, R.; Brundrit, G.; Epstein, P.; Fernandes, A.; Marques, M.R.; Mavume, A.; Metzger, M.; Nussbaumer, P.; Patt,
A.; et al. National Institute for Disaster Management Study on the Impact of Climate Change on Disaster Risk in Mozambique: SynthesisReport Acknowledgements; Ministery of State Administration, Government of Mozambique: Maputo, Mozambique, 2009.
10. Charrua, A.B.; Bandeira, S.O.; Catarino, S.; Cabral, P.; Romeiras, M.M. Assessment of the vulnerability of coastal mangroveecosystems in Mozambique. Ocean Coast. Manag. 2020, 189, 105145. [CrossRef]
11. Cabral, P.; Augusto, G.; Akande, A.; Costa, A.; Amade, N.; Niquisse, S.; Atumane, A.; Cuna, A.; Kazemi, K.; Mlucasse, R.; et al.Assessing Mozambique’s exposure to coastal climate hazards and erosion. Int. J. Disaster Risk Reduct. 2017, 23, 45–52. [CrossRef]

Remote Sens. 2021, 13, 201 15 of 17
12. Post Cyclone Idai Cabinet for Reconstruction. Mozambique Cyclone Idai Post Disaster Needs Assessment; Government of Mozambique:Beira, Mozambique, 2019.
13. UEM; FEWS; INGC. Atlas For Deaster Preparedness and Response in the Limpopo Basin; Government of Mozambique: Maputo,Mozambique, 2003.
14. Kolstad, E.W. Prediction and precursors of Idai and 38 other tropical cyclones and storms in the Mozambique Channel. Q. J. R.Meteorol. Soc. 2020, 1–13. [CrossRef]
15. Salih, A.A.M.; Baraibar, M.; Mwangi, K.K.; Artan, G. Climate change and locust outbreak in East Africa. Nat. Clim. Chang. 2020,10, 584–585. [CrossRef]
16. Zhang, C.; Durgan, S.D.; Lagomasino, D. Modeling risk of mangroves to tropical cyclones: A case study of Hurricane Irma.Estuar. Coast. Shelf Sci. 2019, 224, 108–116. [CrossRef]
17. Taillie, P.J.; Roman-Cuesta, R.; Lagomasino, D.; Cifuentes-Jara, M.; Fatoyinbo, T.; Ott, L.E.; Poulter, B. Widespread mangrovedamage resulting from the 2017 Atlantic mega hurricane season. Environ. Res. Lett. 2020, 15. [CrossRef]
18. Paling, E.I.; Kobryn, H.T.; Humphreys, G. Assessing the extent of mangrove change caused by Cyclone Vance in the easternExmouth Gulf, northwestern Australia. Estuar. Coast. Shelf Sci. 2008, 77, 603–613. [CrossRef]
19. Bhowmik, A.K.; Cabral, P. Cyclone Sidr impacts on the Sundarbans floristic diversity. Earth Sci. Res. 2013, 2, 62–79. [CrossRef]20. Macamo, C.C.F.; Massuanganhe, E.; Nicolau, D.K.; Bandeira, S.O.; Adams, J.B. Mangrove’s response to cyclone Eline (2000): What
is happening 14 years later. Aquat. Bot. 2016, 134, 10–17. [CrossRef]21. Massuanganhe, E.A.; Macamo, C.; Westerberg, L.O.; Bandeira, S.; Mavume, A.; Ribeiro, E. Deltaic coasts under climate-relate
catastrophic events—Insights from the Save River delta, Mozambique. Ocean Coast. Manag. 2015, 116, 331–340. [CrossRef]22. Hoque, A.-A.M.; Phinn, S.; Roelfsema, C.; Childs, I.R. Assessing tropical cyclone impacts using object-based moderate spatial
resolution image analysis: A case study in Bangladesh. Int. J. Remote Sens. 2016, 37, 5320–5343. [CrossRef]23. Hu, T.; Smith, R.S. The Impact of Hurricane Maria on the Vegetation of Dominica and Puerto Rico Using Multispectral Remote
Sensing. Remote Sens. 2018, 10, 827. [CrossRef]24. Zhang, X.; Wang, Y.; Jiang, H.; Wang, X. Remote-sensing assessment of forest damage by Typhoon Saomai and its related factors
at landscape scale. Int. J. Remote Sens. 2013, 34, 7874–7886. [CrossRef]25. Ballanti, L.; Byrd, K.B.; Woo, I.; Ellings, C. Remote sensing for wetland mapping and historical change detection at the Nisqually
River Delta. Sustainability 2017, 9, 1919. [CrossRef]26. Li, D.; Lu, D.; Wu, M.; Shao, X.; Wei, J. Examining land cover and greenness dynamics in Hangzhou Bay in 1985–2016 using
Landsat time-series data. Remote Sens. 2018, 10, 32. [CrossRef]27. Hu, L.; Li, W.; Xu, B. Monitoring mangrove forest change in China from 1990 to 2015 using Landsat-derived spectral-temporal
variability metrics. Int. J. Appl. Earth Obs. Geoinf. 2018, 73, 88–98. [CrossRef]28. Schneibel, A.; Stellmes, M.; Röder, A.; Frantz, D.; Kowalski, B.; Haß, E.; Hill, J. Assessment of spatio-temporal changes of
smallholder cultivation patterns in the Angolan Miombo belt using segmentation of Landsat time series. Remote Sens. Environ.2017, 195, 118–129. [CrossRef]
29. He, Y.; Yang, J.; Guo, X. Green Vegetation Cover Dynamics in a Heterogeneous Grassland: Spectral Unmixing of Landsat TimeSeries from 1999 to 2014. Remote Sens. 2020, 12, 3826. [CrossRef]
30. Millennium Ecosystem Assessment. Ecosystems and Human Well-Being: Synthesis; Island Press: Washington, DC, USA, 2005.31. INE. IV Recenceamento Geral da População e Habitação 2017—Resultados Definitivos; National Institute of Statistics, Government of
Mozambique: Maputo, Mozambique, 2019.32. Hoguane, A.M. Perfil Diagnóstico da Zona Costeira de Moçambique. Rev. Gest. Costeira Integr. 2007, 7, 69–82. [CrossRef]33. Marzoli, A. Avaliação Integrada de Florestas em Moçambique—Inventário Florestal Nacional; Ministery of Agriculture, Government of
Mozambique: Maputo, Mozambique, 2007.34. Macamo, C.; Bandeira, S.; Muando, S.; Abreu, D.; Mabilana, H. Mangroves of Mozambique. In Mangroves of the Western Indian
Ocean: Status and Management; Bosire, J.O., Mangora, M.M., Bandeira, S.O., Rajkaran, A., Appadoo, C., Kairo, J.G., Eds.; WIOMSA:Zanzibar Town, Tanzania, 2016; pp. 51–73. ISBN 9987955940.
35. Jensen, J.R. Introductory Digital Image Processing: A Remote Sensing Perspective, 2nd ed.; Prentice Hall: Upper Saddle River, NJ,USA, 2005.
36. Padmanaban, R.; Bhowmik, A.K.; Cabral, P. A remote sensing approach to environmental monitoring in a reclaimed mine area.ISPRS Int. J. Geo Inf. 2017, 6, 401. [CrossRef]
37. Chen, J.; Zhu, X.; Vogelmann, J.E.; Gao, F.; Jin, S. A simple and effective method for filling gaps in Landsat ETM+ SLC-off images.Remote Sens. Environ. 2011, 115, 1053–1064. [CrossRef]
38. Goslee, S.C. Analyzing Remote Sensing Data in R: The landsat Package. J. Stat. Softw. 2011, 43, 1–25. [CrossRef]39. Hossain, M.S.; Bujang, J.S.; Zakaria, M.H.; Hashim, M. Assessment of Landsat 7 Scan Line Corrector-off data gap-filling methods
for seagrass distribution mapping. Int. J. Remote Sens. 2015, 36, 1188–1215. [CrossRef]40. USGS. Preliminary Assessment of the Value of Landsat 7 ETM+ SLC-off Data. Available online: https://www.usgs.gov/media/
files/preliminary-assessment-value-landsat-7-etm-slc-data (accessed on 25 November 2020).41. USGS. Phase 2 Gap-Fill Algorithm: SLC-Off Gap-Filled Products Gap-Fill Algorithm Methodology. Available online: https:
//landsat.usgs.gov/sites/default/files/documents/L7SLCGapFilledMethod.pdf (accessed on 19 September 2020).

Remote Sens. 2021, 13, 201 16 of 17
42. Chander, G.; Markham, B.L.; Helder, D.L. Summary of current radiometric calibration coefficients for Landsat MSS, TM, ETM+,and EO-1 ALI sensors. Remote Sens. Environ. 2009, 113, 893–903. [CrossRef]
43. Gupta, K.; Mukhopadhyay, A.; Giri, S.; Chanda, A.; Datta Majumdar, S.; Samanta, S.; Mitra, D.; Samal, R.N.; Pattnaik, A.K.; Hazra,S. An index for discrimination of mangroves from non-mangroves using LANDSAT 8 OLI imagery. MethodsX 2018, 5, 1129–1139.[CrossRef]
44. Pathak, V.N.; Patel, K.D.; Trevedi, H.J. Development of an Atmospheric Correction Method for Retrieval of Surface Reflectance fromSatellite Data; Sardar Patel University: Gujarat, India, 2016.
45. Leutner, B.; Horning, N.; Schwalb-Willmann, J. Stoolbox: Tools for Remote Sensing Data Analysis. R Package Version 0.2.6.Available online: https://cran.r-project.org/web/packages/RStoolbox/index.html (accessed on 18 September 2020).
46. Li, W.; El-askary, H.; Qurban, M.A.; Li, J.; Manikandan, K.P.; Piechota, T. Using multi-indices approach to quantify mangrovechanges over the Western Arabian Gulf along Saudi Arabia coast. Ecol. Indic. 2019, 102, 734–745. [CrossRef]
47. Louarn, M.L.; Clergeau, P.; Briche, E.; Deschamps-Cottin, M. “Kill two birds with one stone”: Urban tree species classificationusing Bi-Temporal pléiades images to study nesting preferences of an invasive bird. Remote Sens. 2017, 9, 916. [CrossRef]
48. Padmanaban, R.; Bhowmik, A.K.; Cabral, P.; Zamyatin, A.; Almegdadi, O.; Wang, S. Modelling urban sprawl using remotelysensed data: A case study of Chennai city, Tamilnadu. Entropy 2017, 19, 163. [CrossRef]
49. Liaw, A.; Wiener, M. Classification and regression by randomForest. R News 2002, 2, 18–22.50. R Core Team. A Language and Environment for Statistical Computing: R Foundation for Statistical Computing, Viena, Austria.
Available online: https://rstudio.com/products/rstudio/ (accessed on 16 September 2020).51. Bivand, R.S.; Pebesma, E.J.; Gómez-Rubio, V. Applied Spatial Data Analysis with R; Springer International Publishing: Berlin,
Germany, 2008; Volume 65, ISBN 978-0-387-78170-9.52. Hijmans, R.J. Raster: Geographic Data Analysis and Modeling: R Package Version 3.3-13. Available online: https://cran.r-project.
org/web/packages/raster/index.html (accessed on 16 September 2020).53. Bivand, R.; Keitt, T.H.; Rowlingson, B. Rgdal: Bindings for the Geospatial Data Abstraction Library. R Package Version 1.5-16.
Available online: http://cran.r-project.org/%0Apackage=rgdal (accessed on 25 September 2020).54. Assal, T.J.; Anderson, P.J.; Sibold, J. Mapping forest functional type in a forest-shrubland ecotone using SPOT imagery and
predictive habitat distribution modelling. Remote Sens. Lett. 2015, 6, 755–764. [CrossRef]55. Walston, L.J.; Cantwell, B.L.; Krummel, J.R. Quantifying spatiotemporal changes in a sagebrush ecosystem in relation to energy
development. Ecography 2009, 32, 943–952. [CrossRef]56. Cakir, H.I.; Khorram, S.; Nelson, S.A.C. Correspondence analysis for detecting land cover change. Remote Sens. Environ. 2006, 102,
306–317. [CrossRef]57. Naimi, B. rts: Raster Time Series Analysis: R Package Version 1.0-49. Available online: https://cran.r-project.org/web/packages/
rts/index.html (accessed on 9 October 2020).58. Zhu, Z.; Woodcock, C.E. Continuous change detection and classification of land cover using all available Landsat data. Remote Sens.
Environ. 2014, 144, 152–171. [CrossRef]59. Amone-Mabuto, M.; Bandeira, S.; Silva, A. Long-term changes in seagrass coverage and potential links to climate-related factors:
The case of Inhambane Bay, southern Mozambique. WIO J. Mar. Sci. 2017, 16, 13–25.60. Silva, J.A.; Sedano, F.; Flanagan, S.; Ombe, Z.A.; Machoco, R.; Meque, C.H.; Sitoe, A.; Ribeiro, N.; Anderson, K.; Baule, S.; et al.
Charcoal-related forest degradation dynamics in dry African woodlands: Evidence from Mozambique. Appl. Geogr. 2019, 107,72–81. [CrossRef]
61. Devi, S. Cyclone Idai: 1 month later, devastation persists. Lancet 2019, 393, 1585. [CrossRef]62. Li, Z.; Wang, S.; Song, S.; Wang, Y.; Musakwa, W. Detecting land degradation in Southern Africa using Time Series Segment and
Residual Trend (TSS-RESTREND). J. Arid Environ. 2021, 184. [CrossRef]63. Couto, A.; Bonate, P.; Simango, Y. Inventário de Terras Húmidas em Moçambique: Identificação de Áreas com 500 Hectares ou Mais; WWF
and Biofund: Maputo, Mozambique, 2019.64. Ramsar. Mozambique’s Zambezi Delta Extended to Cover 3000 Square Kilometres. Available online: https://www.ramsar.org/
news/mozambiques-zambezi-delta-extended-to-cover-3000-square-kilometres (accessed on 3 November 2020).65. Chabwela, H.N. Wetlands: A Conservation Programme for Southern Africa. A Report Document. In Proceedings of the
IUCN, Wetlands Conservation Programme Southern African Development Coordination Conference, Gaborone, Botswana, 3–5June 1991.
66. Saket, M. Report on the Updating of the Exploratory National Forest Inventory; Government of Mozambique: Maputo, Mozambique,1994.
67. Gardiner, B.; Byrne, K.; Hale, S.; Kamimura, K.; Mitchell, S.J.; Peltola, H.; Ruel, J.C. A Review of Mechanistic Modeling of WindDamage Risk to Forests. Forestry 2008, 81, 447–463. [CrossRef]
68. Lanquaye-Opoku, N.; Mitchell, S.J. Portability of Stand-Level Empirical Windthrow Risk Models. For. Ecol. Manag. 2005, 216,134–148. [CrossRef]
69. Macisaac, D.A.; Krygier, R. Development and Long-Term Evaluation of Harvesting Patterns to Reduce Windthrow Risk ofUnderstorey Spruce in Aspen-White Spruce Mixed Wood Stands in Alberta, Canada. Forestry 2009, 82, 323–342. [CrossRef]
70. Everham, E.M.; Brokaw, N.V. Forest damage and recovery from catastrophic wind. Bot. Rev. 1996, 62, 113–185. [CrossRef]

Remote Sens. 2021, 13, 201 17 of 17
71. Zimmerman, J.K.; Everham, E.M., III; Waide, R.B.; Lodge, D.J.; Taylor, C.M.; Brokaw, N.V.L. Responses of Tree Species toHurricane Winds in Subtropical Wet Forest in Puerto Rico: Implications for Tropical Tree Life Histories. J. Ecol. 1994, 82, 911–922.[CrossRef]
72. Lin, T.C.; Hogan, J.A.; Chang, C.-T. Tropical Cyclone Ecology: A Scale-Link Perspective. Trends Ecol. Evol. 2020, 35, 594–604.[CrossRef]
73. Doyle, T.W.; Smith III, T.J.; Robblee, M.B. Wind damage effects of Hurricane Andrew on mangrove communities along thesouthwest coast of Florida, USA. J. Coast. Res. 1995, 21, 159–168. Available online: https://www.jstor.org/stable/25736006(accessed on 7 January 2021).
74. Rossi, E.; Rogan, J.; Schneider, L. Mapping forest damage in northern Nicaragua after Hurricane Felix (2007) using MODISenhanced vegetation index data. GIScience Remote Sens. 2013, 50, 385–399. [CrossRef]
75. Doyle, T.W.; Girod, G.F.; Books, M.A. Modeling mangrove forest migration along the southwest coast of Florida under climatechange. In Integrated Assessment of the Climate Change Impacts on the Gulf Coast Region; Ning, Z.H., Turner, R.E., Doyle, T.W.,Abdollahi, K., Eds.; GCRCC: Baton Rouge, LA, USA, 2003; pp. 211–221.
76. Foster, D.R.; Boose, E.R. Patterns of Forest Damage Resulting From Catastrophic Wind in Central New England, USA. J. Ecol.1992, 80, 79–98. [CrossRef]
77. Chamberlain, D.; Phinn, S.; Possingham, H. Remote sensing of mangroves and estuarine communities in central Queensland,Australia. Remote Sens. 2020, 12, 197. [CrossRef]