Severe tropical cyclone Lam post-event report
24
Severe tropical cyclone Lam post-event report Northern Territory Region
-
Upload
khangminh22 -
Category
Documents
-
view
0 -
download
0
Transcript of Severe tropical cyclone Lam post-event report
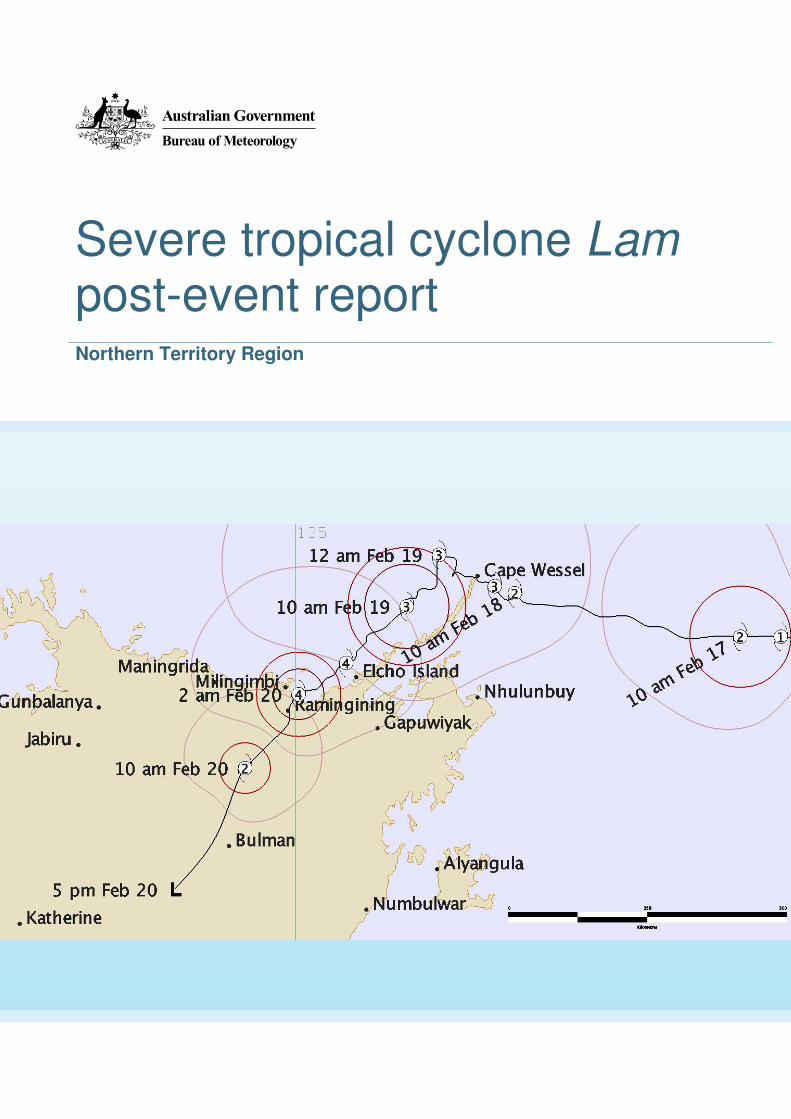
Severe tropical cyclone Lam post-event report Northern Territory Region

Published by the Bureau of Meteorology 2015 Cover image: The observed track of severe tropical cyclone Lam.
© Commonwealth of Australia 2015 This work is copyright. Apart from any use as permitted under the Copyright Act 1968, no part may be reproduced without prior written permission from the Bureau of Meteorology. Requests and inquiries concerning reproduction and rights should be addressed to the Production Manager, Communication Section, Bureau of Meteorology, GPO Box 1289, Melbourne 3001. Information regarding requests for reproduction of material from the Bureau website can be found at www.bom.gov.au/other/copyright.shtml.
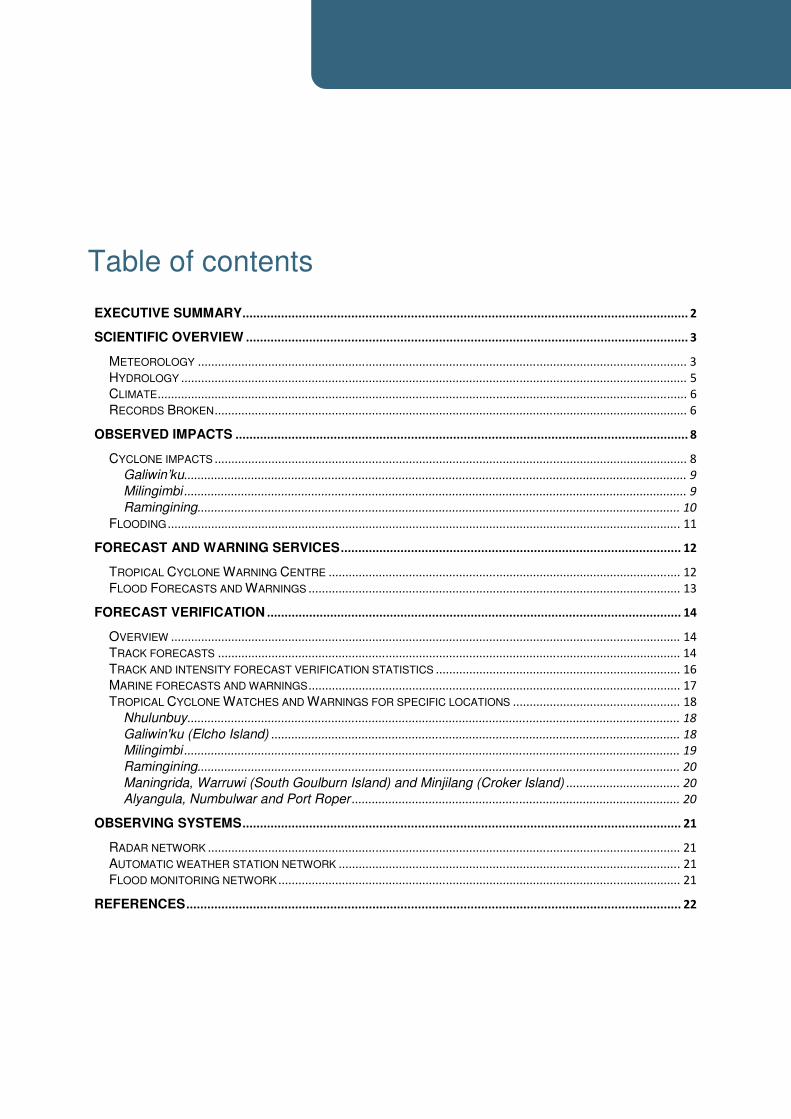
EXECUTIVE SUMMARY ............................................................................................................................... 2
SCIENTIFIC OVERVIEW .............................................................................................................................. 3
METEOROLOGY .................................................................................................................................................. 3
HYDROLOGY ....................................................................................................................................................... 5
CLIMATE .............................................................................................................................................................. 6
RECORDS BROKEN ............................................................................................................................................. 6
OBSERVED IMPACTS ................................................................................................................................. 8
CYCLONE IMPACTS ............................................................................................................................................. 8
Galiwin’ku ...................................................................................................................................................... 9
Milingimbi ...................................................................................................................................................... 9
Ramingining ................................................................................................................................................ 10
FLOODING ......................................................................................................................................................... 11
FORECAST AND WARNING SERVICES ................................................................................................. 12
TROPICAL CYCLONE WARNING CENTRE ......................................................................................................... 12
FLOOD FORECASTS AND WARNINGS ............................................................................................................... 13
FORECAST VERIFICATION ...................................................................................................................... 14
OVERVIEW ........................................................................................................................................................ 14
TRACK FORECASTS .......................................................................................................................................... 14
TRACK AND INTENSITY FORECAST VERIFICATION STATISTICS ......................................................................... 16
MARINE FORECASTS AND WARNINGS ............................................................................................................... 17
TROPICAL CYCLONE WATCHES AND WARNINGS FOR SPECIFIC LOCATIONS .................................................. 18
Nhulunbuy ................................................................................................................................................... 18
Galiwin'ku (Elcho Island) .......................................................................................................................... 18
Milingimbi .................................................................................................................................................... 19
Ramingining ................................................................................................................................................ 20
Maningrida, Warruwi (South Goulburn Island) and Minjilang (Croker Island) .................................. 20
Alyangula, Numbulwar and Port Roper .................................................................................................. 20
OBSERVING SYSTEMS ............................................................................................................................. 21
RADAR NETWORK ............................................................................................................................................. 21
AUTOMATIC WEATHER STATION NETWORK ...................................................................................................... 21
FLOOD MONITORING NETWORK ........................................................................................................................ 21
REFERENCES ............................................................................................................................................. 22
Table of contents
Severe tropical cyclone Lam post-event report 2
Severe tropical cyclone Lam was the first
cyclone for the 2014–15 cyclone season in the
Northern Region, and the first severe cyclone
to cross the Northern Territory coast for nearly
a decade. Perhaps most significantly, the
destructive core of the cyclone impacted three
relatively large Northern Territory
communities—Galiwin'ku, Milingimbi and
Ramingining.
The Bureau of Meteorology tracked the full life
cycle of the system for some 11 days, issued
67 Tropical Cyclone Advices (including 54
consecutive hourly updates leading into
landfall), 14 Severe Weather Warnings, 8
Flood Warnings and 7 Flood Watches.
The Gove and Warruwi radars provided high-
quality, 10-minute radar image updates for
forecasters and communities across north
eastern Arnhem Land throughout the event.
Assessment of the recovered data from the
Bureau’s Automatic Weather Station network,
as well as a survey of damage to infrastructure
and vegetation in affected communities,
suggests that Elcho Island and Milingimbi
experienced low-end category 3 winds, while
Ramingining likely experienced high-end
category 3 winds.
An aerial survey of the remote areas
surrounding the location of landfall suggests
that damage to coastlines and vegetation was
more extensive than that observed in the
communities of Galiwin'ku, Milingimbi and
Ramingining. Indications from the damage
assessment suggest that Lam was a category
4 cyclone at landfall.
The Bureau of Meteorology's Northern
Territory Regional Office is pleased to present
this report on severe tropical cyclone Lam.
Todd Smith
Northern Territory Regional Director
Executive summary
Severe tropical cyclone Lam post-event report 3
Meteorology
On Sunday 15 February 2015, a tropical low
over the northwest Coral Sea crossed Cape
York Peninsula and entered the Gulf of
Carpentaria. It developed quickly during
Monday 16 and Tuesday 17 February as it
moved slowly and steadily towards the west.
The system was named tropical cyclone Lam
at 3.30 am CST on Tuesday 17 February,
whilst located over the northern Gulf of
Carpentaria, about 340 km east of Nhulunbuy.
Lam strengthened into a category 2 tropical
cyclone by 9.30 am CST that same day.
Over the following 24 hours tropical cyclone
Lam intensified slowly, continuing its westward
movement towards the Wessel Islands, at a
speed of 10–15 km/h. The nearest pass of
tropical cyclone Lam to the major township of
Nhulunbuy occurred at 10.00 am CST on
Wednesday 18 February, when the category 2
cyclone was 115 km north of the township. At
this time, mean winds in the destructive core of
the intensifying cyclone were estimated to be
110 km/h, with gusts up to 155 km/h. However,
gales were not reported at Gove Airport due to
the compact nature of the cyclone.
Lam was upgraded to a category 3 severe
tropical cyclone at 11.30 am CST on
Wednesday 18 February, shortly before it
passed directly over the Cape Wessel
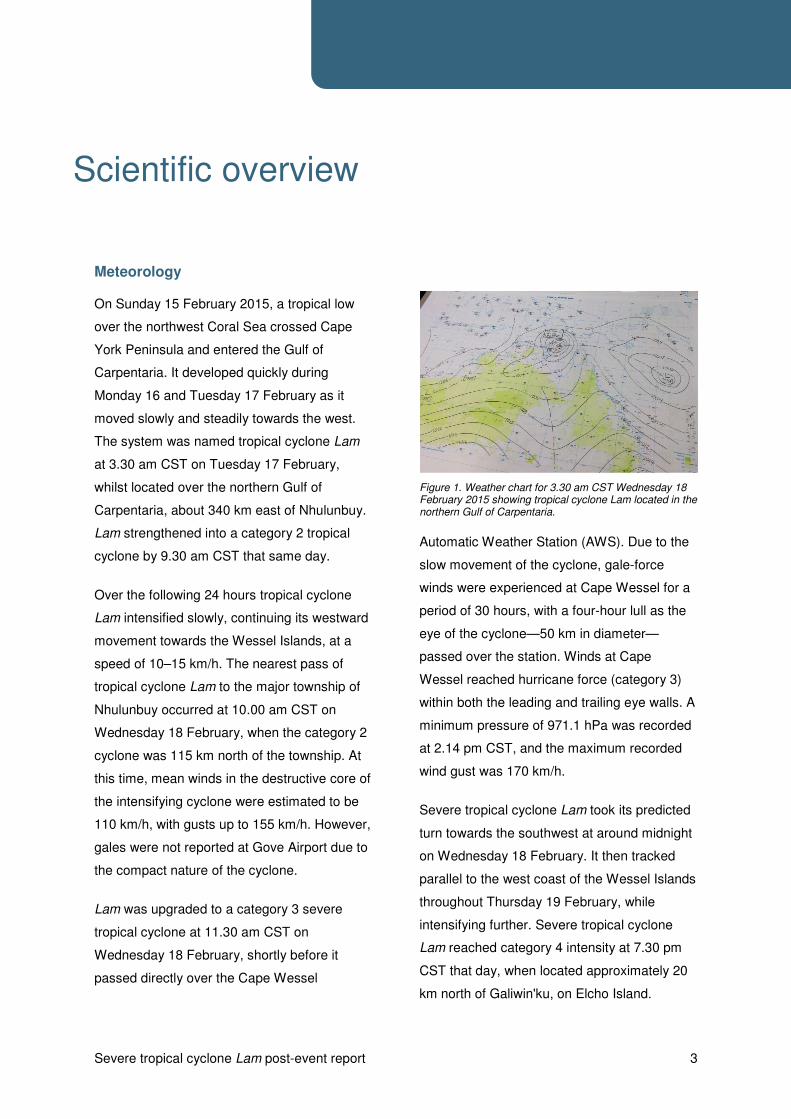
Figure 1. Weather chart for 3.30 am CST Wednesday 18 February 2015 showing tropical cyclone Lam located in the northern Gulf of Carpentaria.
Automatic Weather Station (AWS). Due to the
slow movement of the cyclone, gale-force
winds were experienced at Cape Wessel for a
period of 30 hours, with a four-hour lull as the
eye of the cyclone—50 km in diameter—
passed over the station. Winds at Cape
Wessel reached hurricane force (category 3)
within both the leading and trailing eye walls. A
minimum pressure of 971.1 hPa was recorded
at 2.14 pm CST, and the maximum recorded
wind gust was 170 km/h.
Severe tropical cyclone Lam took its predicted
turn towards the southwest at around midnight
on Wednesday 18 February. It then tracked
parallel to the west coast of the Wessel Islands
throughout Thursday 19 February, while
intensifying further. Severe tropical cyclone
Lam reached category 4 intensity at 7.30 pm
CST that day, when located approximately 20
km north of Galiwin'ku, on Elcho Island.
Scientific overview

Severe tropical cyclone Lam post-event report 4
Figure 2. The Gove radar shows an impressive circulation as the eye of cyclone Lam approaches Cape Wessel on the morning of Wednesday 18 February.
Transmission of observations from the
Automatic Weather Station (AWS) at
Ngayawili, north of Galiwin'ku, was disrupted
by a telecommunications failure during the
impact of Lam's very destructive core.
Fortunately, the observations were able to be
retrieved several days after the event. Gales
affected the Elcho Island community for
approximately 21 hours from mid-afternoon
Thursday until mid-morning Friday, with peak
hurricane-force winds of 128 km/h, and a gust
to 174 km/h, recorded at 9.30 pm CST
Thursday 19 February. Importantly, Elcho
Island was only 'grazed' by the outer bands of
the core of the cyclone, as the inner eye wall
remained just offshore. Therefore the
Ngayawili AWS is unlikely to have sampled the
maximum winds from severe tropical cyclone
Lam.
Lam crossed the mainland coast around 2.00
am CST on Friday 20 February as a category 4
severe tropical cyclone, about 15 km northeast
of Ramingining and 20 km southeast of
Milingimbi. At the time of landfall, estimated
maximum mean winds were 185 km/h, with
gusts reaching 260 km/h. Severe tropical
cyclone Lam’s peak intensity was based on the
emergence of a clear eye feature in satellite
imagery shortly before landfall. Radars at Gove
and Warruwi indicated that the eye wall may
have contracted prior to landfall—a circular eye
of 14 km in diameter was observed just to the
east of Ramingining at around 3.30 am CST.
Over the course of the day on Friday 20
February, severe tropical cyclone Lam
weakened rapidly as it moved southwest over
central Arnhem Land. Lam was downgraded to
Figure 3. Colour enhanced MTSAT infra-red image of severe tropical cyclone Lam as it crossed the coast. (Source: NOAA/JMA)

Severe tropical cyclone Lam post-event report 5
Figure 4. Observed track of severe tropical cyclone Lam over its lifetime.
below tropical cyclone strength at 4.30 pm
CST on the Friday, approximately 75 km
southwest of Bulman. The tropical system
produced heavy rain over parts of the Arnhem,
Carpentaria, Daly and Gregory forecast
districts. 258.5 mm was recorded at Diljin Hill
in the Waterhouse River catchment in the 24
hours to 9.00 am CST on Saturday 21
February. This contributed to moderate
flooding of the Waterhouse River at Beswick
Bridge.
Severe tropical cyclone Lam was the first
tropical cyclone in the Northern Region for the
2014–15 season, and the first severe tropical
cyclone to impact the Northern Territory coast
since severe tropical cyclone Monica in April
2006.
Hydrology
Initial forecasts for tropical cyclone Lam
indicated that significant rainfall totals were
likely to be recorded in the Arnhem and
Carpentaria Coastal Rivers basins. As the
event unfolded and the forecast track for Lam
became clearer, attention focused on the
Waterhouse and Katherine Rivers as the main
catchments likely to be affected. Flood
watches issued for the Arnhem and
Carpentaria Coastal Rivers basins on Tuesday
17 February indicated the potential for rainfall
totals in the range of 200–300 mm.
Rainfall totals of 110–260 mm were recorded
throughout the Waterhouse River catchment
on 20 February 2015, following the landfall of
severe tropical cyclone Lam.
River levels in the Waterhouse River at
Beswick Bridge reached minor flood level (7.7
metres) early on the morning of Saturday 21
February 2015. The river peaked just under
major flood level (8.30 m) at 8.298 m at 5.10
pm CST later that day, before receding below
minor flood level on the morning of Sunday 22
February.
Severe tropical cyclone Lam post-event report 6
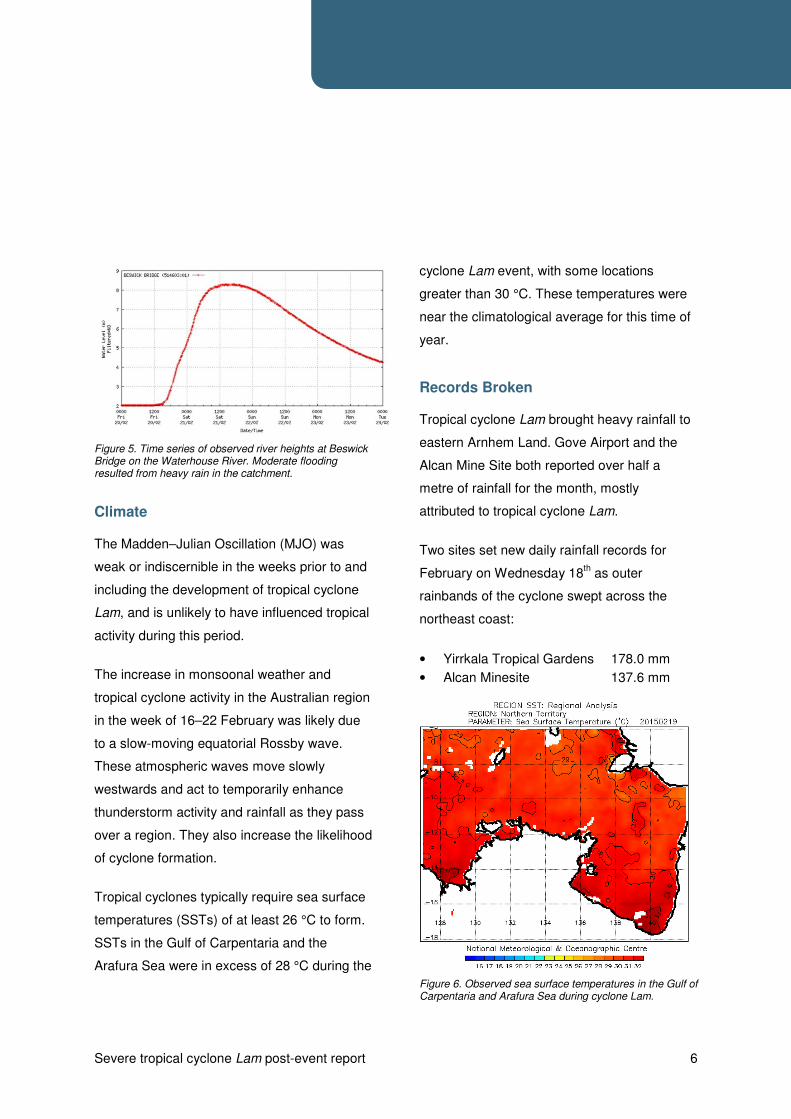
Figure 5. Time series of observed river heights at Beswick Bridge on the Waterhouse River. Moderate flooding resulted from heavy rain in the catchment.
Climate
The Madden–Julian Oscillation (MJO) was
weak or indiscernible in the weeks prior to and
including the development of tropical cyclone
Lam, and is unlikely to have influenced tropical
activity during this period.
The increase in monsoonal weather and
tropical cyclone activity in the Australian region
in the week of 16–22 February was likely due
to a slow-moving equatorial Rossby wave.
These atmospheric waves move slowly
westwards and act to temporarily enhance
thunderstorm activity and rainfall as they pass
over a region. They also increase the likelihood
of cyclone formation.
Tropical cyclones typically require sea surface
temperatures (SSTs) of at least 26 °C to form.
SSTs in the Gulf of Carpentaria and the
Arafura Sea were in excess of 28 °C during the
cyclone Lam event, with some locations
greater than 30 °C. These temperatures were
near the climatological average for this time of
year.
Records Broken
Tropical cyclone Lam brought heavy rainfall to
eastern Arnhem Land. Gove Airport and the
Alcan Mine Site both reported over half a
metre of rainfall for the month, mostly
attributed to tropical cyclone Lam.
Two sites set new daily rainfall records for
February on Wednesday 18th as outer
rainbands of the cyclone swept across the
northeast coast:
• Yirrkala Tropical Gardens 178.0 mm
• Alcan Minesite 137.6 mm
Figure 6. Observed sea surface temperatures in the Gulf of Carpentaria and Arafura Sea during cyclone Lam.
Severe tropical cyclone Lam post-event report 7
As tropical cyclone Lam moved inland after
crossing the coast, two other Arnhem Land
stations set new daily rainfall records for
February on Thursday 20th:
• Bulman 105.8 mm
• Flying Fox 153.0 mm
A number of others set daily rainfall records for
February on Friday 21st:
• West Waterhouse 135.8 mm
• Upper Waterhouse River 133.6 mm
• Cave Creek Station 140.0 mm
• Yeuralba Ridge 83.2 mm
• Mataranka Homestead Resort 136.2 mm
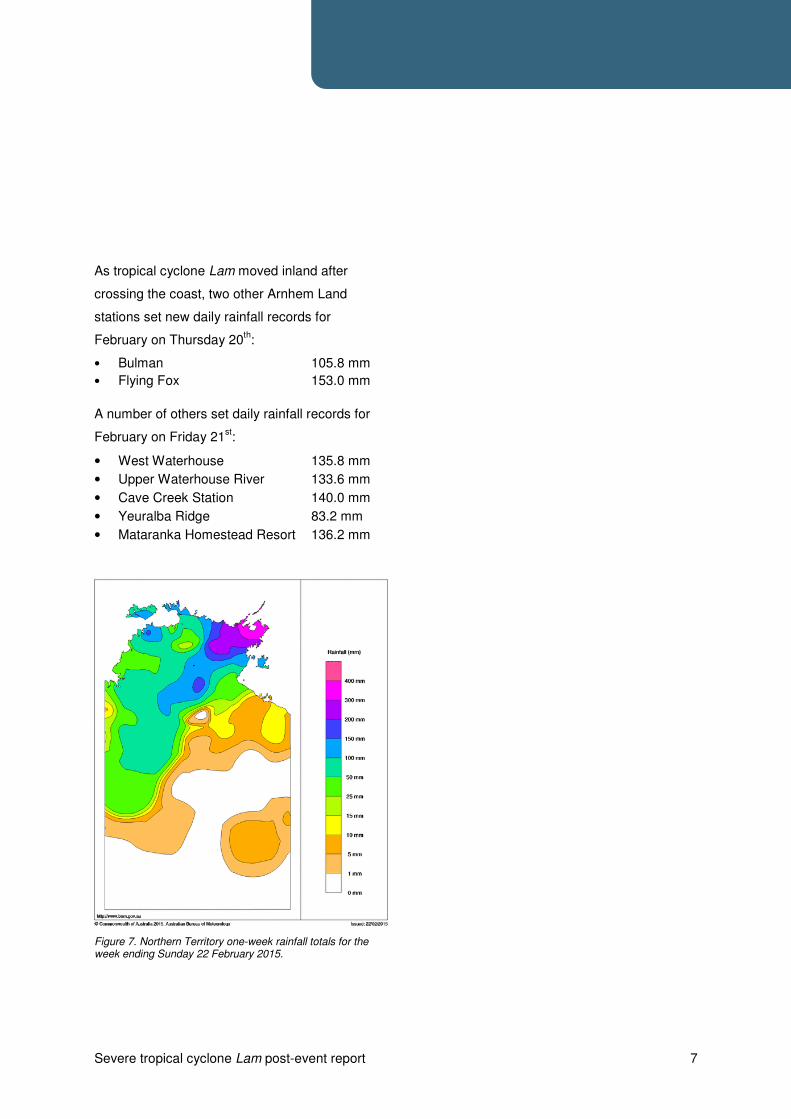
Figure 7. Northern Territory one-week rainfall totals for the week ending Sunday 22 February 2015.

Severe tropical cyclone Lam post-event report 8
Cyclone impacts
Severe tropical cyclone Lam caused significant
damage to infrastructure and vegetation at
Galiwin'ku, Milingimbi, Ramingining and nearby
outstations on the mainland. Immediate impacts
to these communities following the passage of
the cyclone included: loss of power, water and
communications; contamination of water
supplies by sewerage overflows; uninhabitable
houses; and blocked access roads. Nhulunbuy
and the Gove Peninsula escaped significant
damage as Lam passed further to the north.
An assessment of damage at Galiwin'ku,
Milingimbi and Ramingining was undertaken by
Bureau of Meteorology staff on Wednesday 25
February, in conjunction with the Northern
Territory Police and Emergency Services.
Figure 8. NT Chief Minister Adam Giles, Nathan Barrett MLA, NTES Director, Andrew Warton, and NT Police commissioner, Reece Kershaw in Galiwin'ku during the recovery from cyclone Lam. (Source: NT Government)
Figure 9. Rachel Yunupingu, Erica Dhamarnandji, Vivien D, Rosita Gurriwiwi and Abigail D in Galiwin'ku during recovery from cyclone Lam. (Source: ABC News—Steven Schubert)
Residents in these three communities were
hardest hit, but remarkably no deaths and only
a few minor injuries were recorded. This is
testament to the communication of warnings
and assistance provided in these communities
by Police, Emergency Services and community
leaders. Several residents reported that severe
tropical cyclone Lam was the worst in living
memory, apart from those who had experienced
Cyclone Tracy in Darwin, in 1974.
Hurricane-force winds caused damage to older
structures in all three communities. However,
most modern housing came through the event
largely unscathed.
Significant damage was also inflicted on
houses, power lines and other infrastructure by
downed trees and airborne branches. The
surrounding savanna vegetation was severely
affected, with felled and snapped trees
Observed impacts
Severe tropical cyclone Lam post-event report 9
widespread throughout the area near the path
of the cyclone core.
Aerial photos were taken during transit between
the three communities, as well as on the
ground, to aid assessment of vegetation and
building damage together with storm surge
impacts.
Galiwin’ku
Beach erosion around smaller islands on the
approach to Galiwin'ku suggested a storm tide
exceeding Highest Astronomical Tide (HAT).
On the ground, debris lines were identified
around 2 m above HAT level along the bay to
the west of the community.
Savanna trees still had some foliage and small
branches, with defoliation estimated at around
30 per cent. Aerial views of the area suggested
that less than 50 per cent of trees in the
surrounding savanna were felled by the
cyclone.
Figure 10. Debris extending approximately 2m above HAT along the shoreline at Galiwin'ku.
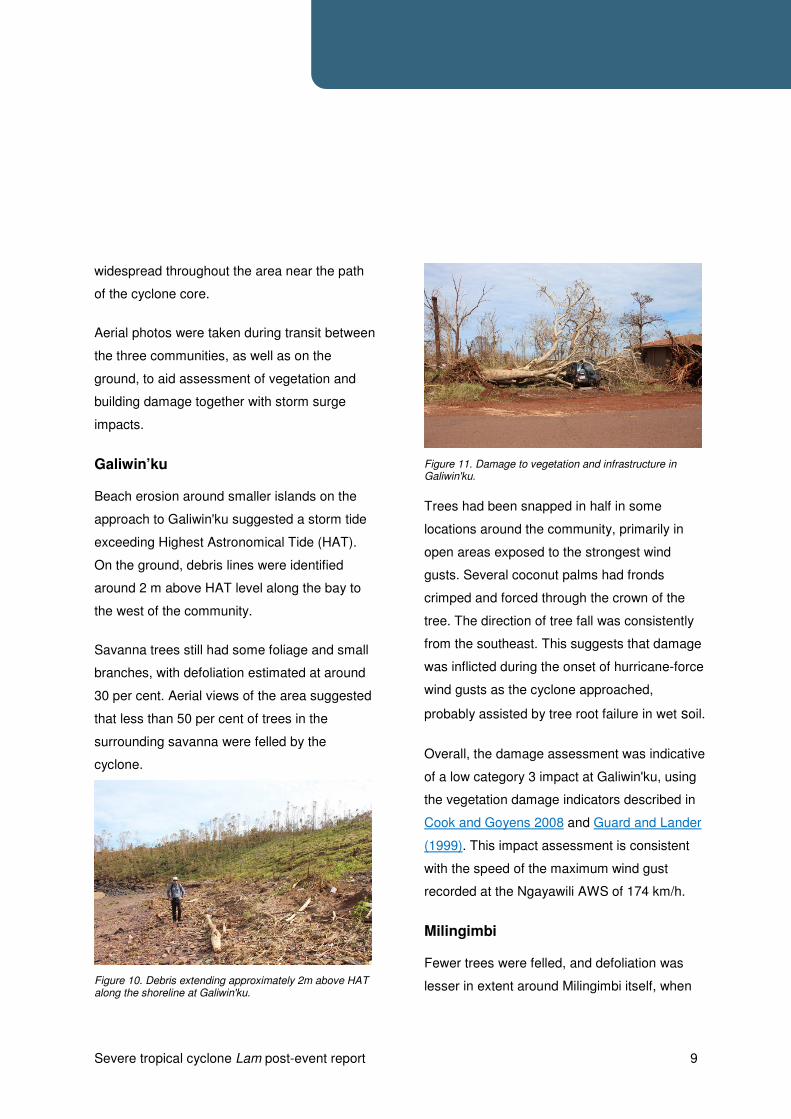
Figure 11. Damage to vegetation and infrastructure in Galiwin'ku.
Trees had been snapped in half in some
locations around the community, primarily in
open areas exposed to the strongest wind
gusts. Several coconut palms had fronds
crimped and forced through the crown of the
tree. The direction of tree fall was consistently
from the southeast. This suggests that damage
was inflicted during the onset of hurricane-force
wind gusts as the cyclone approached,
probably assisted by tree root failure in wet soil.
Overall, the damage assessment was indicative
of a low category 3 impact at Galiwin'ku, using
the vegetation damage indicators described in
Cook and Goyens 2008 and Guard and Lander
(1999). This impact assessment is consistent
with the speed of the maximum wind gust
recorded at the Ngayawili AWS of 174 km/h.
Milingimbi
Fewer trees were felled, and defoliation was
lesser in extent around Milingimbi itself, when
Severe tropical cyclone Lam post-event report 10
compared to Galiwin'ku. Most felled trees were
in exposed locations and had shallow root
systems. Some coconut trees had some palm
fronds crimped and pushed backwards, but not
all the way through the crown. Damage to weak
structures was clearly evident but most
buildings remained intact, except where trees
had fallen on them. The direction of tree fall
was consistently from the southwest.
An assessment of debris at the high tide mark
suggested a storm surge of around 0.5-1 m
above HAT. The smaller surge than at
Galiwin'ku is not surprising given that the
community was on the western flank of the
cyclone, where winds were directed offshore.
Ramingining
Aerial views en route to Ramingining from
Milingimbi indicated extensive damage to
savanna vegetation. An estimated 50 per cent
of trees close to Ramingining were felled or
Figure 12. Debris extending approximately 0.5–1.0 m above HAT along the shoreline at Milingimbi.
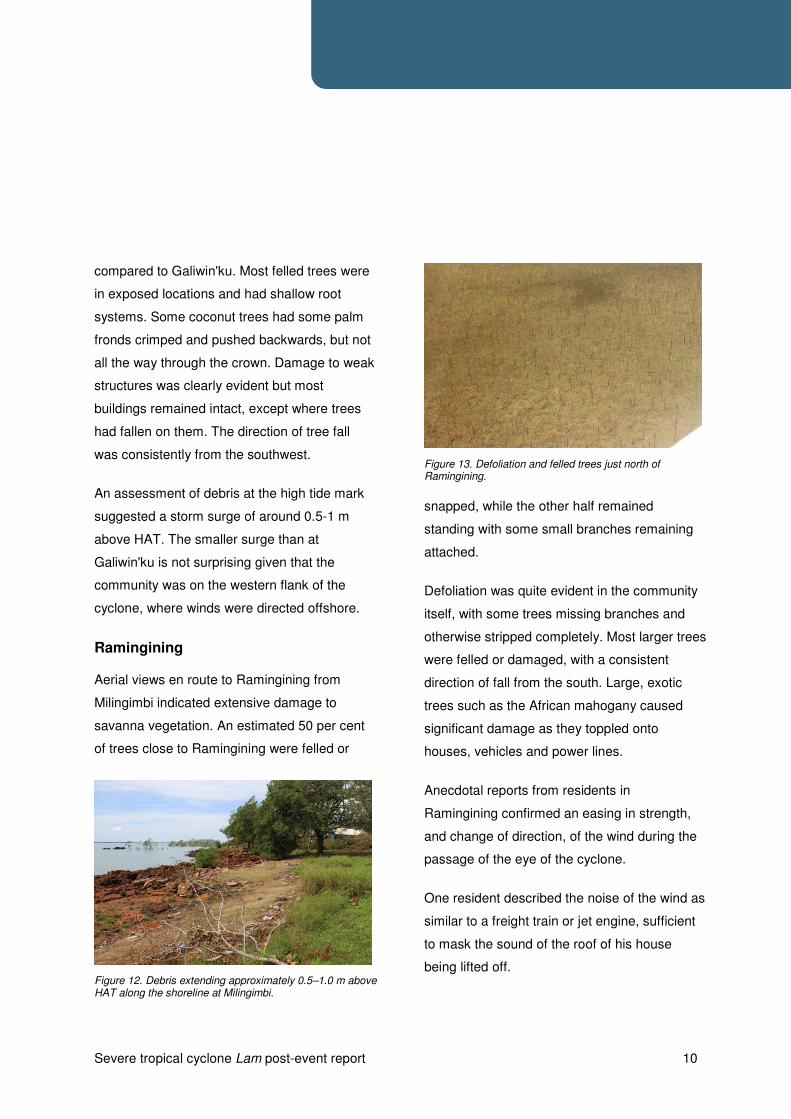
Figure 13. Defoliation and felled trees just north of Ramingining.
snapped, while the other half remained
standing with some small branches remaining
attached.
Defoliation was quite evident in the community
itself, with some trees missing branches and
otherwise stripped completely. Most larger trees
were felled or damaged, with a consistent
direction of fall from the south. Large, exotic
trees such as the African mahogany caused
significant damage as they toppled onto
houses, vehicles and power lines.
Anecdotal reports from residents in
Ramingining confirmed an easing in strength,
and change of direction, of the wind during the
passage of the eye of the cyclone.
One resident described the noise of the wind as
similar to a freight train or jet engine, sufficient
to mask the sound of the roof of his house
being lifted off.

Severe tropical cyclone Lam post-event report 11
Figure 14. Damage to infrastructure and vegetation in Ramingining. (ABC News—Steven Schubert)
The duration of very destructive winds at
Ramingining may have been shorter than at
Galiwin'ku, but slightly greater damage to
vegetation at Ramingining indicates winds were
at the high end of the category 3 range.
Severe tropical cyclone Lam crossed the coast
to the west of Howard Island, at a remote
location approximately 15 km northeast of
Ramingining. Initial aerial views of this area
were obtained while en route from Galiwin'ku to
Milingimbi.
Figure 15. Felled trees in Ramingining.
Beach scarps present in this area were
indicative of erosion associated with the storm
tide. It is likely that a full survey at ground level
of vegetation damage in this remote area may
indeed reveal that even stronger winds were
experienced near the point of coastal crossing.
Flooding
Three homes in low-lying parts of Beswick in
southwest Arnhem Land reported water
entering the premises during moderate flooding
of the Waterhouse River on Saturday 21
February. This riverine flooding was caused by
heavy rainfall in the Waterhouse catchment as
Lam tracked inland across Arnhem Land and
weakened into a tropical low.
Severe tropical cyclone Lam post-event report 12
Tropical Cyclone Warning Centre
The Darwin Tropical Cyclone Warning Centre
began tracking a developing low pressure
system in the Coral Sea on Tuesday 10
February. The likelihood of cyclone formation in
the Gulf of Carpentaria was first communicated
in the Tropical Cyclone Outlook issued on
Thursday 12 February, indicating a moderate
chance (20–50 per cent) of a cyclone forming
on Tuesday 17 February.
The first Tropical Cyclone Watch for the
developing tropical low in the northeastern Gulf
of Carpentaria was issued at 2.27 pm CST on
Monday 16 February. The areas under watch
covered the northwestern coast of Cape York
Peninsula (Queensland) and the eastern coast
of Arnhem Land, including Groote Eylandt.
Although the Tropical Cyclone Watch for the
Queensland area was cancelled later the same
evening, a Tropical Cyclone Watch was
maintained for the Arnhem coast. A marine
Strong Wind Warning for the western Gulf of
Carpentaria commenced earlier that day, at
4.45 am CST Monday 16 February. This was
upgraded to an ocean gale warning at 5.00 pm
CST that afternoon, and then further to a storm
force wind warning at 5.30 am CST on Tuesday
17 February.
The first Tropical Cyclone Warning for the
northeast Arnhem Land coast was issued at
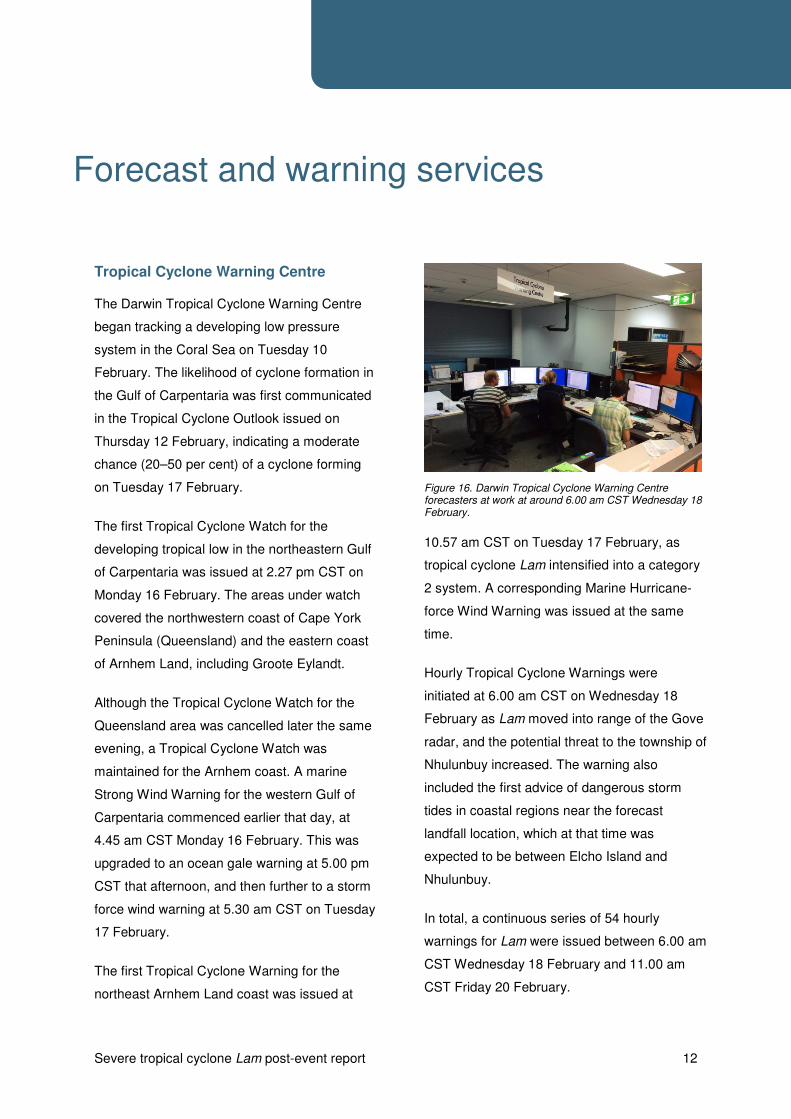
Figure 16. Darwin Tropical Cyclone Warning Centre forecasters at work at around 6.00 am CST Wednesday 18 February.
10.57 am CST on Tuesday 17 February, as
tropical cyclone Lam intensified into a category
2 system. A corresponding Marine Hurricane-
force Wind Warning was issued at the same
time.
Hourly Tropical Cyclone Warnings were
initiated at 6.00 am CST on Wednesday 18
February as Lam moved into range of the Gove
radar, and the potential threat to the township of
Nhulunbuy increased. The warning also
included the first advice of dangerous storm
tides in coastal regions near the forecast
landfall location, which at that time was
expected to be between Elcho Island and
Nhulunbuy.
In total, a continuous series of 54 hourly
warnings for Lam were issued between 6.00 am
CST Wednesday 18 February and 11.00 am
CST Friday 20 February.
Forecast and warning services
Severe tropical cyclone Lam post-event report 13
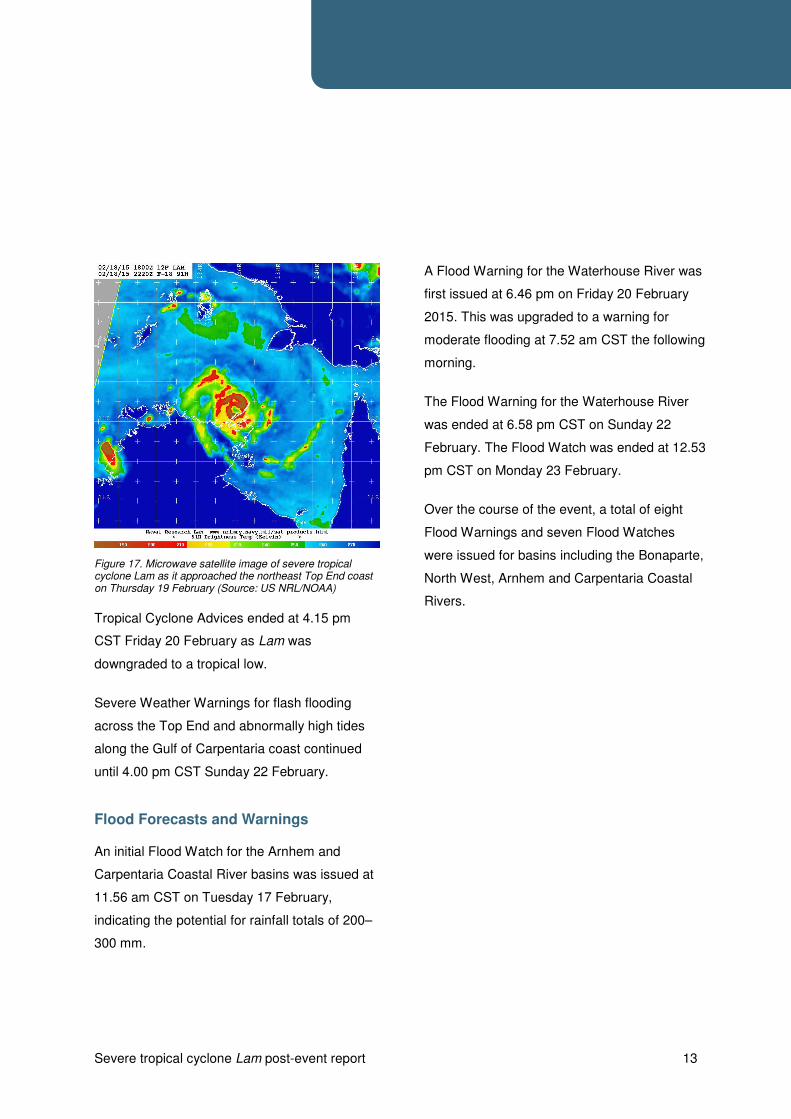
Figure 17. Microwave satellite image of severe tropical cyclone Lam as it approached the northeast Top End coast on Thursday 19 February (Source: US NRL/NOAA)
Tropical Cyclone Advices ended at 4.15 pm
CST Friday 20 February as Lam was
downgraded to a tropical low.
Severe Weather Warnings for flash flooding
across the Top End and abnormally high tides
along the Gulf of Carpentaria coast continued
until 4.00 pm CST Sunday 22 February.
Flood Forecasts and Warnings
An initial Flood Watch for the Arnhem and
Carpentaria Coastal River basins was issued at
11.56 am CST on Tuesday 17 February,
indicating the potential for rainfall totals of 200–
300 mm.
A Flood Warning for the Waterhouse River was
first issued at 6.46 pm on Friday 20 February
2015. This was upgraded to a warning for
moderate flooding at 7.52 am CST the following
morning.
The Flood Warning for the Waterhouse River
was ended at 6.58 pm CST on Sunday 22
February. The Flood Watch was ended at 12.53
pm CST on Monday 23 February.
Over the course of the event, a total of eight
Flood Warnings and seven Flood Watches
were issued for basins including the Bonaparte,
North West, Arnhem and Carpentaria Coastal
Rivers.
Severe tropical cyclone Lam post-event report 14
Overview
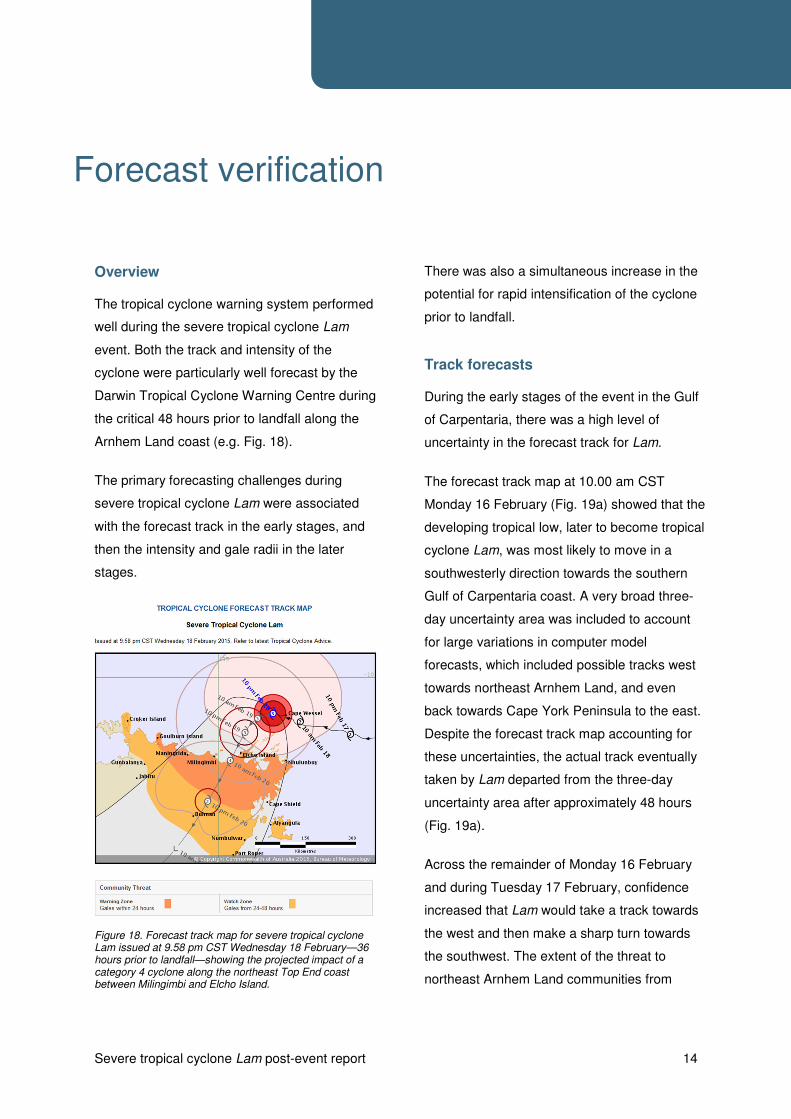
The tropical cyclone warning system performed
well during the severe tropical cyclone Lam
event. Both the track and intensity of the
cyclone were particularly well forecast by the
Darwin Tropical Cyclone Warning Centre during
the critical 48 hours prior to landfall along the
Arnhem Land coast (e.g. Fig. 18).
The primary forecasting challenges during
severe tropical cyclone Lam were associated
with the forecast track in the early stages, and
then the intensity and gale radii in the later
stages.
Figure 18. Forecast track map for severe tropical cyclone Lam issued at 9.58 pm CST Wednesday 18 February—36 hours prior to landfall—showing the projected impact of a category 4 cyclone along the northeast Top End coast between Milingimbi and Elcho Island.
There was also a simultaneous increase in the
potential for rapid intensification of the cyclone
prior to landfall.
Track forecasts
During the early stages of the event in the Gulf
of Carpentaria, there was a high level of
uncertainty in the forecast track for Lam.
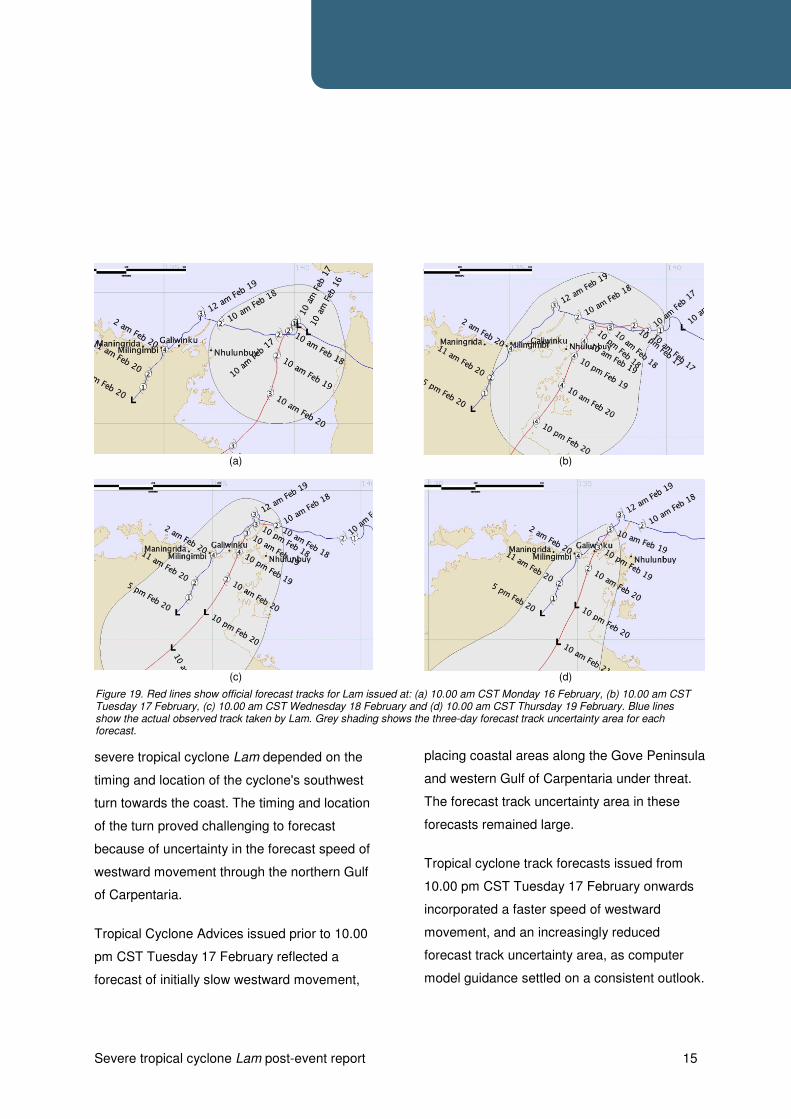
The forecast track map at 10.00 am CST
Monday 16 February (Fig. 19a) showed that the
developing tropical low, later to become tropical
cyclone Lam, was most likely to move in a
southwesterly direction towards the southern
Gulf of Carpentaria coast. A very broad three-
day uncertainty area was included to account
for large variations in computer model
forecasts, which included possible tracks west
towards northeast Arnhem Land, and even
back towards Cape York Peninsula to the east.
Despite the forecast track map accounting for
these uncertainties, the actual track eventually
taken by Lam departed from the three-day
uncertainty area after approximately 48 hours
(Fig. 19a).
Across the remainder of Monday 16 February
and during Tuesday 17 February, confidence
increased that Lam would take a track towards
the west and then make a sharp turn towards
the southwest. The extent of the threat to
northeast Arnhem Land communities from
Forecast verification
Severe tropical cyclone Lam post-event report 15
(a)
(c)
severe tropical cyclone Lam depended on the
timing and location of the cyclone's southwest
turn towards the coast. The timing and location
of the turn proved challenging to forecast
because of uncertainty in the forecast speed of
westward movement through the northern Gulf
of Carpentaria.
Tropical Cyclone Advices issued prior to 10.00
pm CST Tuesday 17 February reflected a
forecast of initially slow westward movement,
(b)
(d)
placing coastal areas along the Gove Peninsula
and western Gulf of Carpentaria under threat.
The forecast track uncertainty area in these
forecasts remained large.
Tropical cyclone track forecasts issued from
10.00 pm CST Tuesday 17 February onwards
incorporated a faster speed of westward
movement, and an increasingly reduced
forecast track uncertainty area, as computer
model guidance settled on a consistent outlook.
Figure 19. Red lines show official forecast tracks for Lam issued at: (a) 10.00 am CST Monday 16 February, (b) 10.00 am CST Tuesday 17 February, (c) 10.00 am CST Wednesday 18 February and (d) 10.00 am CST Thursday 19 February. Blue lines show the actual observed track taken by Lam. Grey shading shows the three-day forecast track uncertainty area for each forecast.
Severe tropical cyclone Lam post-event report 16
After 10.00 pm CST Tuesday 17 February,
successive official forecast tracks (see Fig.
19b–d) consistently projected landfall of a
category 4 cyclone along a small section of
coast between Milingimbi and Gapuwiyak, with
a significant risk of impact on Elcho Island and
adjacent mainland communities, either late
night Thursday 19 February or early morning
Friday 20 February.
The timing of the critical southwest turn of the
cyclone track towards the coast was accurately
forecast with a lead time of 36 hours.
Track and intensity forecast verification statistics
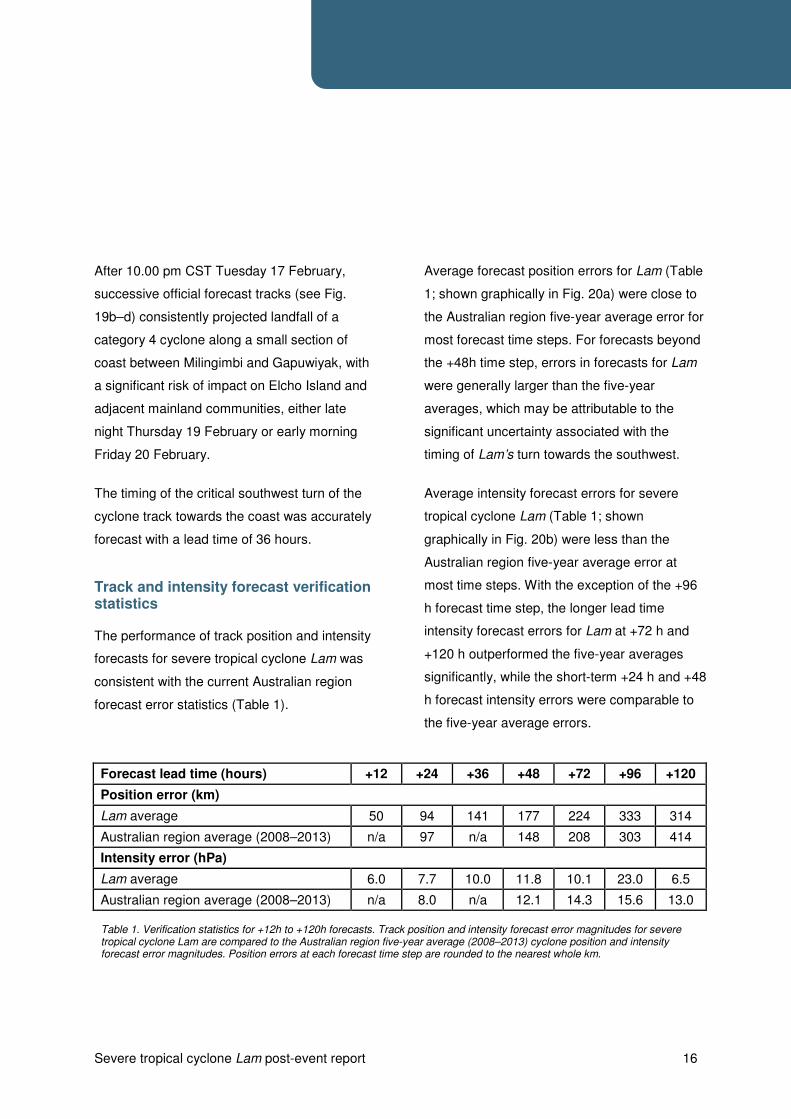
The performance of track position and intensity
forecasts for severe tropical cyclone Lam was
consistent with the current Australian region
forecast error statistics (Table 1).
Average forecast position errors for Lam (Table
1; shown graphically in Fig. 20a) were close to
the Australian region five-year average error for
most forecast time steps. For forecasts beyond
the +48h time step, errors in forecasts for Lam
were generally larger than the five-year
averages, which may be attributable to the
significant uncertainty associated with the
timing of Lam’s turn towards the southwest.
Average intensity forecast errors for severe
tropical cyclone Lam (Table 1; shown
graphically in Fig. 20b) were less than the
Australian region five-year average error at
most time steps. With the exception of the +96
h forecast time step, the longer lead time
intensity forecast errors for Lam at +72 h and
+120 h outperformed the five-year averages
significantly, while the short-term +24 h and +48
h forecast intensity errors were comparable to
the five-year average errors.
Forecast lead time (hours) +12 +24 +36 +48 +72 +96 +120
Position error (km)
Lam average 50 94 141 177 224 333 314
Australian region average (2008–2013) n/a 97 n/a 148 208 303 414
Intensity error (hPa)
Lam average 6.0 7.7 10.0 11.8 10.1 23.0 6.5
Australian region average (2008–2013) n/a 8.0 n/a 12.1 14.3 15.6 13.0
Table 1. Verification statistics for +12h to +120h forecasts. Track position and intensity forecast error magnitudes for severe tropical cyclone Lam are compared to the Australian region five-year average (2008–2013) cyclone position and intensity forecast error magnitudes. Position errors at each forecast time step are rounded to the nearest whole km.

Severe tropical cyclone Lam post-event report 17
Marine forecasts and warnings
The first Marine Gale Warning was issued at
4.50 pm CST Monday 16 February for gales to
develop within 12–18 hours. Gales were
observed at 3.30am CST Tuesday 17 February,
when category 1 tropical cyclone Lam was first
named. This was approximately 11 hours after
the warning was first issued.
The first Storm-force Wind Warning was issued
at 5.30 am CST Tuesday 17 February for
storm-force winds to develop within 12 hours.
Storm-force winds were observed
approximately four hours later at 9.30 am CST
Tuesday 17 February as tropical cyclone Lam
reached category 2 intensity.
The first Hurricane-force Wind Warning was
issued at 11.00 am CST Tuesday 17 February
for hurricane-force winds to develop within 24
hours. Hurricane-force winds were first
observed 24 hours later at 11.00 am CST
Wednesday 18 February as Lam reached
category 3 intensity.
Very high seas of around 8–9 m were forecast
close to the centre of severe tropical cyclone
Lam at its maximum intensity on 18 and 19
February, decreasing to 3–4 m around the
periphery of the cyclone. No observations exist
from close to the cyclone centre to verify these
predictions, but reports on 17, 18 and 19
February from ships on the periphery of the
cyclone provided sea state estimates of 3–5 m
in the northern semicircle, at a range of 110–
150 nautical miles from the cyclone centre.
0
50
100
150
200
250
300
350
400
450
+12 +24 +36 +48 +72 +96 +120
Cy
clo
ne
po
siti
on
err
or
(km
)
Forecast lead time (hours)
Cyclone Lam 2008-2013 Australian region average
0
5
10
15
20
25
+12 +24 +36 +48 +72 +96 +120
Cy
clo
ne
in
ten
sity
err
or
(hP
a)
Forecast lead time (hours)
Cyclone Lam 2008-2013 Australian region average
(a) (b)
Figure 20. Average forecast error statistics for cyclone Lam, compared to the Australian region five-year average cyclone forecast error statistics: (a) forecast track position error statistics, in km, and (b) average forecast intensity error statistics, in hPa.
Severe tropical cyclone Lam post-event report 18
Tropical Cyclone Watches and Warnings for specific locations
During the course of the event, Tropical
Cyclone Watches were issued for the Top End
coastline between Croker Island and Port
Roper, as well as offshore islands including
Goulburn Island, Elcho Island and Groote
Eylandt. Tropical Cyclone Warnings were
issued for coastal areas from Goulburn Island
to Groote Eylandt and areas of Arnhem Land
inland as far as Bulman. This included the
major communities of Warruwi, Maningrida,
Milingimbi, Ramingining, Galiwin'ku,
Gapuwiyak, Nhulunbuy and Alyangula.
Nhulunbuy
The first Tropical Cyclone Watch for Nhulunbuy
was issued at 2.00 pm CST Monday 16
February, approximately 40 hours before the
strongest winds were observed at Gove
Airport.
A Tropical Cyclone Warning for Nhulunbuy was
issued at 5.00 am CST Tuesday 17 February in
anticipation of gale force winds developing
within the following 24 hours, and for the
possibility of very destructive winds with gusts
greater than 170 km/h (category 3 threshold)
developing within 36 hours. The warning was
maintained throughout Tuesday, and
Wednesday morning, because of the risk that
the outer perimeter of Lam’s very destructive
core could impact Nhulunbuy as it turned
towards the southwest.
Tropical cyclone Lam passed 115 km to the
north of Nhulunbuy at around 10.00 am CST
Wednesday 18 February at category 2 intensity,
with the area of strongest winds remaining
offshore. The warning for very destructive winds
for Nhulunbuy was downgraded to a warning for
gale-force winds at 11.00 am CST Wednesday
18 February, and then maintained until 8.00am
CST Friday 20 February once the cyclone had
made landfall well to the west of the township.
At the conclusion of the event, the area of
cyclone-strength, gale-force winds surrounding
Lam traversed just to the north and west of
Nhulunbuy, meaning that the township and
surrounding nearby communities experienced
only fresh and squally winds, accompanied by
very heavy rainfall.
Galiwin'ku (Elcho Island)
The first Tropical Cyclone Watch for Galiwin'ku,
on Elcho Island, was issued at 5.00 am
Tuesday 17 February. This provided the
community with a lead time of approximately 54
hours before gale-force, cyclone-strength winds
were observed at the Ngyawili AWS, located
close to the town.
The first Tropical Cyclone Warning for
Galiwin'ku was issued at 11.00 am Tuesday 17

Severe tropical cyclone Lam post-event report 19
February, approximately 50 hours prior to the
commencement of observed gales. This advice
also indicated the possibility of very destructive
winds with gusts greater than 170 km/h
developing within the following 36 hours, as
well as warning for a very dangerous storm tide.
Destructive winds commenced at Galiwin'ku at
approximately 4.00 pm Thursday 19 February,
but the strongest winds associated with the very
destructive core of the category 4 cyclone are
estimated to have remained offshore as it
passed just to the west of Galiwin'ku. The
strongest wind gust recorded at Ngyawili AWS
was 174 km/h, which corresponds to a low-end
category 3 cyclone intensity impact.
Figure 21. The Gove radar showed the eye wall of cyclone Lam tracking along the Wessel Islands, towards Elcho Island, on Thursday 19 February.
Milingimbi
Milingimbi was placed under a Tropical Cyclone
Watch at 5.00 am CST Tuesday 17 February,
which was upgraded to a Tropical Cyclone
Warning at 5.00 pm CST the same day. Very
destructive winds with gusts greater than 170
km/h were first warned for Milingimbi at 11.00
pm CST Tuesday 17 February, and then
upgraded on Thursday 19 February for gusts up
to 230 km/h (category 4 intensity) near the
intensifying cyclone centre as it approached the
coast.
It is estimated that the Milingimbi community
was provided with approximately 66 hours lead
time from the time of issue of the Tropical
Cyclone Watch, and 54 hours lead time from
the time of issue of the Tropical Cyclone
Warning, ahead of the commencement of gale-
force, cyclone-strength winds. However, the
timing of gale onset at Milingimbi is an estimate
only, due to the cessation of data transmission
from the Milingimbi AWS at 11.00pm CST
Thursday 19 February, shortly after winds
became dangerously gusty.
A post-event damage assessment suggested
that peak wind gusts in Milingimbi were
associated with the periphery of the cyclone,
within the category 2 intensity range (125–155
km/h). However this is an estimation only, in the
Severe tropical cyclone Lam post-event report 20
absence of AWS wind observations from
Milingimbi during the period of strongest winds.
Ramingining
Due to its close proximity, the timings and
details of Tropical Cyclone Watches and
Warnings for Ramingining were the same as for
Milingimbi. In contrast to Milingimbi, though,
Ramingining was impacted directly by the very
destructive core of the cyclone. A post-event
damage assessment indicated peak winds at
high-end category 3 intensity range, and
accordingly, significantly greater damage to
trees and structures than at Milingimbi.
There is no AWS located near Ramingining to
provide wind speed observations.
Maningrida, Warruwi (South Goulburn Island) and Minjilang (Croker Island)
Tropical Cyclone Warnings for Maningrida and
Warruwi, and Tropical Cyclone Watches for
Minjilang, were issued at various times on
Wednesday 18 February and Thursday 19
February as cyclone Lam tracked westward,
offshore.
Cyclone-strength winds were not observed at
these communities, and there were no
significant impacts from severe tropical cyclone
Lam.
Alyangula, Numbulwar and Port Roper
Groote Eylandt and the western Gulf of
Carpentaria coast were placed under a Tropical
Cyclone Watch early on Tuesday 17 February,
and then under Warning at various times until
Friday 20 February, accounting for the
possibility that Lam may have turned southward
and moved over Gulf of Carpentaria waters.
As Lam eventually tracked to the west, and
away from the Gulf of Carpentaria, these
communities did not experience cyclone-
strength winds and were not directly affected by
Lam.
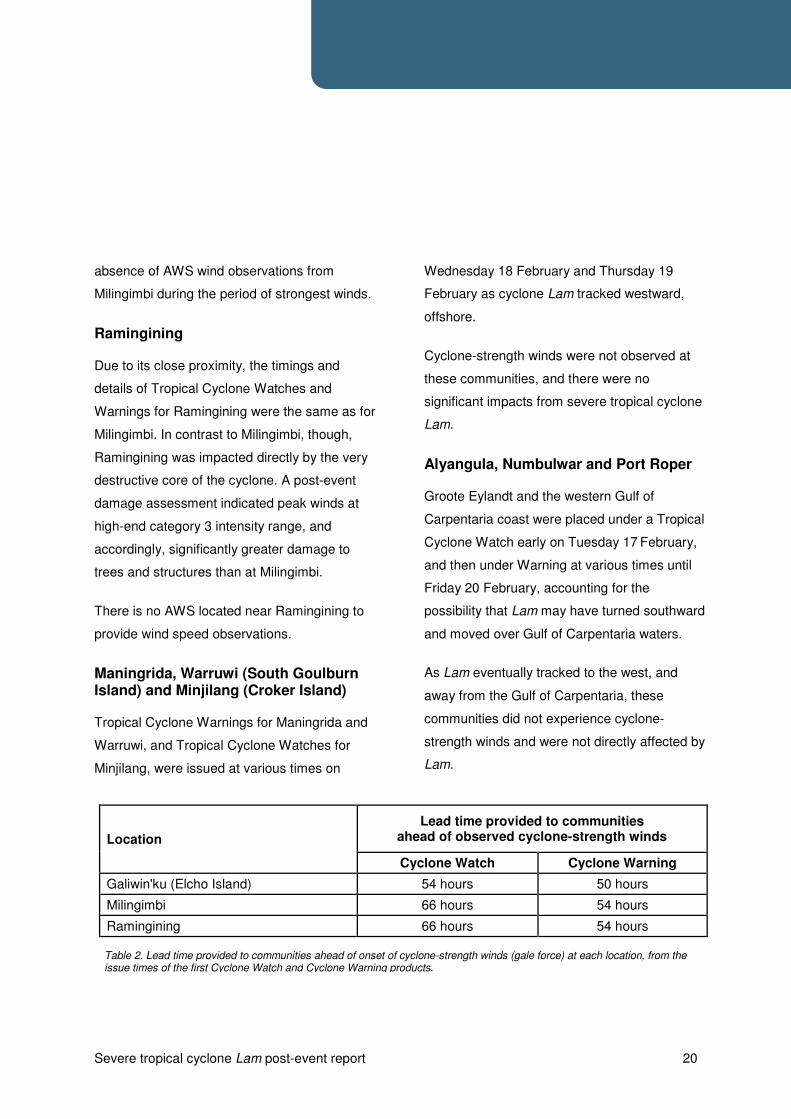
Location
Lead time provided to communities ahead of observed cyclone-strength winds
Cyclone Watch Cyclone Warning
Galiwin'ku (Elcho Island) 54 hours 50 hours
Milingimbi 66 hours 54 hours
Ramingining 66 hours 54 hours
Table 2. Lead time provided to communities ahead of onset of cyclone-strength winds (gale force) at each location, from the issue times of the first Cyclone Watch and Cyclone Warning products.
Severe tropical cyclone Lam post-event report 21
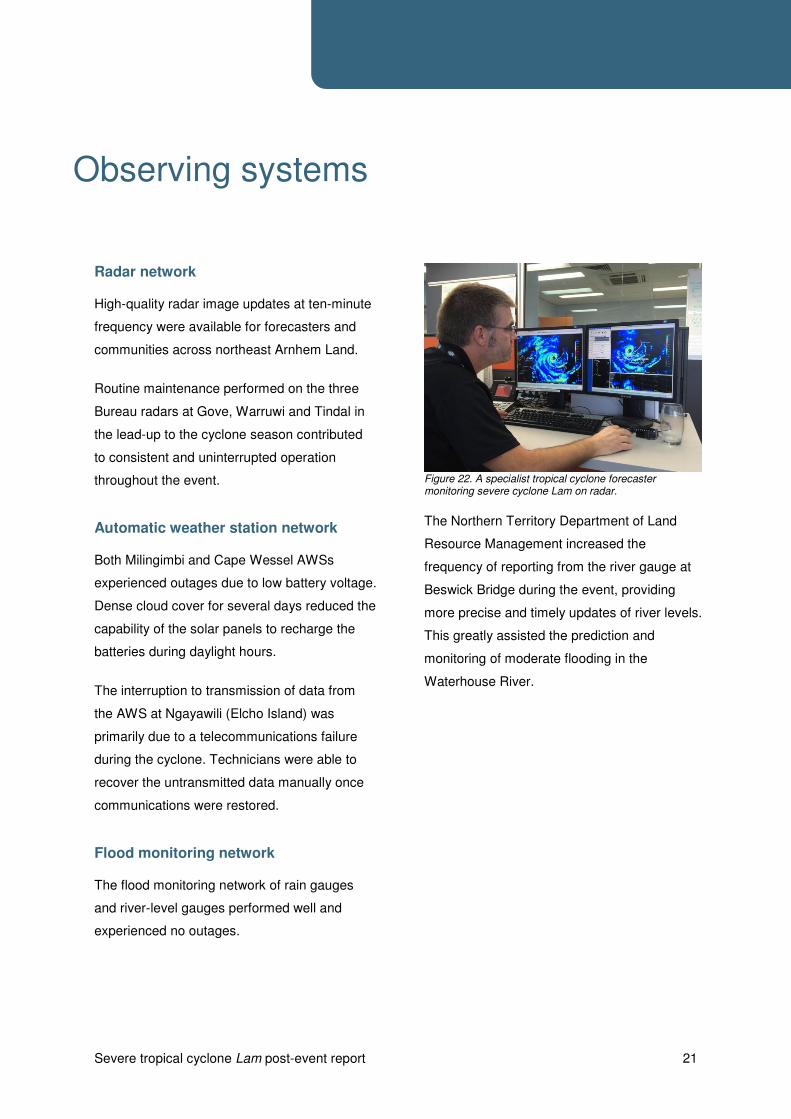
Radar network
High-quality radar image updates at ten-minute
frequency were available for forecasters and
communities across northeast Arnhem Land.
Routine maintenance performed on the three
Bureau radars at Gove, Warruwi and Tindal in
the lead-up to the cyclone season contributed
to consistent and uninterrupted operation
throughout the event.
Automatic weather station network
Both Milingimbi and Cape Wessel AWSs
experienced outages due to low battery voltage.
Dense cloud cover for several days reduced the
capability of the solar panels to recharge the
batteries during daylight hours.
The interruption to transmission of data from
the AWS at Ngayawili (Elcho Island) was
primarily due to a telecommunications failure
during the cyclone. Technicians were able to
recover the untransmitted data manually once
communications were restored.
Flood monitoring network
The flood monitoring network of rain gauges
and river-level gauges performed well and
experienced no outages.
Figure 22. A specialist tropical cyclone forecaster monitoring severe cyclone Lam on radar.
The Northern Territory Department of Land
Resource Management increased the
frequency of reporting from the river gauge at
Beswick Bridge during the event, providing
more precise and timely updates of river levels.
This greatly assisted the prediction and
monitoring of moderate flooding in the
Waterhouse River.
Observing systems
Severe tropical cyclone Lam post-event report 22
Cook G. D. and C. M. Goyens (2008). The impact of wind on trees in Australian tropical savannas:
lessons from Cyclone Monica. Austral Ecology 33, 462–470.
Guard C. P. and M. A. Lander (1999). A Scale Relating Tropical Cyclone Wind Speed to Potential
Damage for the Tropical Pacific Ocean Region: a User's Manual. Report No 86, Water and
Environmental Research Institute of the Western Pacific, University of Guam.
References