developing a solar resource map for a stored solar cooker
70
DEVELOPING A SOLAR RESOURCE MAP FOR A STORED SOLAR COOKER BY EMILY MARIE FLOESS THESIS Submitted in partial fulfillment of the requirements for the degree of Master of Science in Environmental Engineering in Civil Engineering in the Graduate College of the University of Illinois at Urbana-Champaign, 2019 Urbana, Illinois Adviser: Professor Tami C. Bond
-
Upload
khangminh22 -
Category
Documents
-
view
2 -
download
0
Transcript of developing a solar resource map for a stored solar cooker

DEVELOPING A SOLAR RESOURCE MAP FOR A STORED SOLAR COOKER
BY
EMILY MARIE FLOESS
THESIS
Submitted in partial fulfillment of the requirements
for the degree of Master of Science in Environmental Engineering in Civil Engineering
in the Graduate College of the
University of Illinois at Urbana-Champaign, 2019
Urbana, Illinois
Adviser:
Professor Tami C. Bond

ii
ABSTRACT
Stored solar cookers collect energy using existing parabolic solar cookers and store the heat in a vessel filled with a
salt. This stored solar cooker enables users to cook even when there is no radiation from the sun.
The ability of the stored solar cooker to collect heat depends on the ambient conditions (solar radiation, percent
cloud cover, temperature, and wind speed). Solar resource maps can quantify the global potential for solar energy
use, but existing maps do not take storage aspects into account. Such a global resource map can be used to identify
where the cookers may be most useful, and can also identify the parts of the world suitable for initial testing and
development of stored solar thermal cooking.
An energy balance to describe the solar cooker was developed with inputs of solar radiation, fraction direct solar
radiation, wind and temperature. Heat loss occurs due to convective, conductive, and radiative losses due to ambient
conditions. The energy balance was created using a combination of theoretical equations and data and design
parameters from a stored solar cooker under development. Outputs were energy stored in a day and number of
vessels which can be charged.
A monthly world map of input was developed to combine with the energy balance using four times daily
meteorological reanalysis data averaged over 19 years. Using the energy balance, the average amount of energy that
can be stored was calculated. The resulting monthly world maps show the average daily energy which can be stored
in the cooker, and how many days in a month at least one, two, and three vessels can be charged.
Percent cloud cover has the greatest effect on storage, and high percentage of cloud, resulting in low amounts of
direct solar radiation, result in slow charging of the stored solar cooker. The length of day and the strength of the
sunlight are also important in the ability to use the stored solar cooker. Additionally, locations with enough sunshine
to reliably charge at least one stored solar cooker a day during most of the year are ideal for the stored solar cooker
to be used.
Throughout the world, dry climates, climates with a long dry season with consistent daily cloud-free days, high
elevations with dry seasons or a dry climate, and dry summer months are ideal for using the stored solar cooker
reliably. It is recommended that the stored solar cooker be used in these regions.

iii
ACKNOWLEDGEMENTS
Thank you to the Sun Buckets stored solar team, especially Professor Bruce Litchfield and Dr. Matthew Alonso, for
providing the Sun Bucket field and laboratory data to validate this model, and for your help and guidance with the
project.
Thank you to the Bond research group for your help and support, and especially my advisor Professor Tami Bond,
for your guidance, and the opportunity to be involved in amazing projects around the world.
Thank you to my family and friends here and around the world for your support and encouragement!

iv
Table of Contents
Chapter 1: INTRODUCTION ................................................................................................................................. 1
1.1 Household Energy Needs ................................................................................................................... 1
1.2 Solar Energy and Solar Cookers ......................................................................................................... 2
1.3 Solar Cooker Field Tests .................................................................................................................... 2
1.4 Solar Cooker Acceptance ................................................................................................................... 3
1.5 Modelling Stored Solar Cookers ........................................................................................................ 3
1.6 Solar Cooker Energy Balance ............................................................................................................ 4
1.7 Solar Resource Maps ......................................................................................................................... 4
1.8 Environmental Inputs......................................................................................................................... 4
1.9 Solar Resource Maps ......................................................................................................................... 5
1.10 Research Objectives .......................................................................................................................... 5
Chapter 2: ENERGY BALANCE AND ENVIRONMENTAL MODEL .................................................................. 7
2.1 Stored Solar Cooker Energy Balance.................................................................................................. 7
2.2 Environmental Model ........................................................................................................................ 9
2.3 Environmental data used in model ................................................................................................... 10
2.4 Clear Sky Solar Radiation ................................................................................................................ 12
2.5 Direct Solar Radiation Fraction ........................................................................................................ 13
2.6 Solar Energy Collected by Parabolic Dish ........................................................................................ 14
2.7 Collection efficiency of parabolic dish ............................................................................................. 14
2.8 Convective losses from wind ........................................................................................................... 15
Chapter 3: MODEL VALIDATION ..................................................................................................................... 17
3.1 Design of Vessel Used in Model Calibration .................................................................................... 17
3.2 Description of Laboratory Tests ....................................................................................................... 19
3.3 Description of Field Tests ................................................................................................................ 21
3.4 Solar Radiation Model Validation Results ........................................................................................ 21
3.5 Solar Storage Model Validation ....................................................................................................... 22
Chapter 4: INFLUENCE OF ENVIRONMENTAL FACTORS ............................................................................. 25
4.1 Seasons ........................................................................................................................................... 25
4.2 Latitude ........................................................................................................................................... 26
4.3 Fraction Direct Solar Radiation ........................................................................................................ 27
4.4 Windspeed ...................................................................................................................................... 28
4.5 Ambient Temperature ...................................................................................................................... 28
4.6 Altitude ........................................................................................................................................... 29
Chapter 5: USABILITY ....................................................................................................................................... 31
5.1 Available Temperature .................................................................................................................... 31

v
5.2 Available Energy in a Given Year .................................................................................................... 32
5.3 Reliability of the Stored Solar Cooker .............................................................................................. 34
5.4 Long term trends in available energy and monthly usability .............................................................. 36
Chapter 6: SUMMARY AND RECOMMENDATIONS ....................................................................................... 46
6.1 Summary ......................................................................................................................................... 46
6.2 Recommendations ........................................................................................................................... 46
BIBLIOGRAPHY ................................................................................................................................................ 48
Appendix A: VESSEL HEAT LOSS PARAMETERS INFERRED FROM LABORATORY TESTS .................... 57
A1. Vessel heat transfer .................................................................................................................................... 57
A2. Heat balance during cooling and solidifying ............................................................................................... 60
A3. Comparison of experimental and theoretical resistance ............................................................................... 61
1
Chapter 1
INTRODUCTION
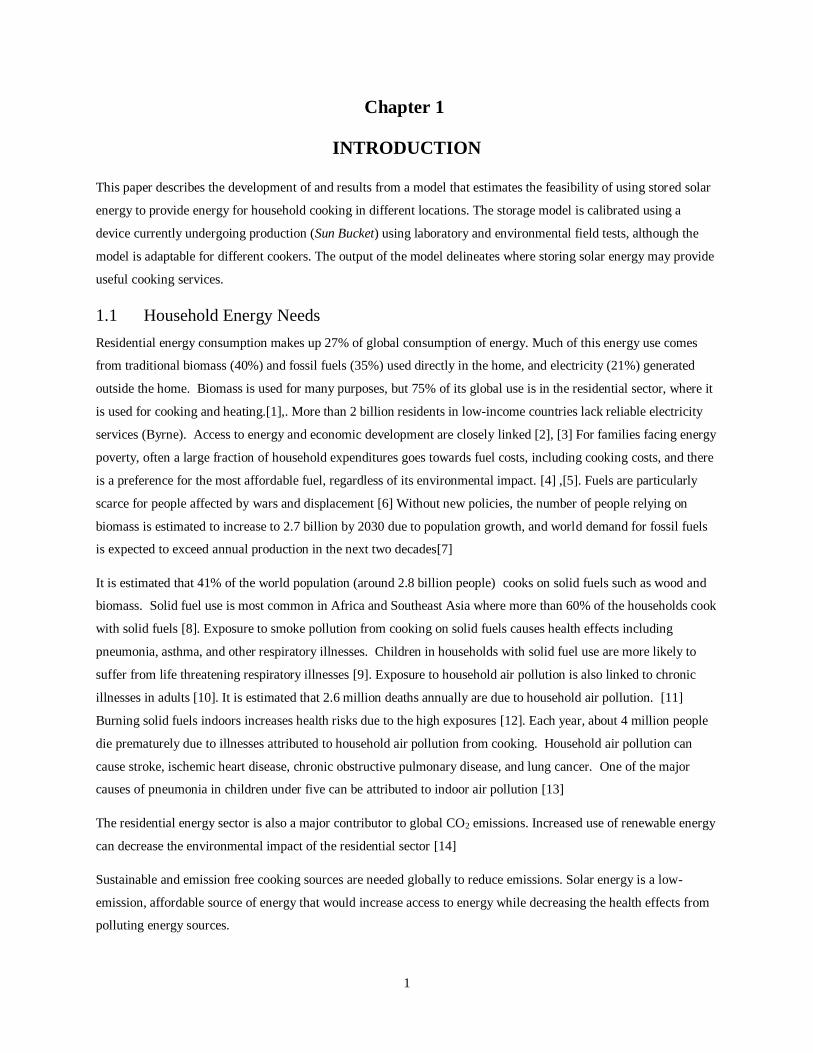
This paper describes the development of and results from a model that estimates the feasibility of using stored solar
energy to provide energy for household cooking in different locations. The storage model is calibrated using a
device currently undergoing production (Sun Bucket) using laboratory and environmental field tests, although the
model is adaptable for different cookers. The output of the model delineates where storing solar energy may provide
useful cooking services.
1.1 Household Energy Needs
Residential energy consumption makes up 27% of global consumption of energy. Much of this energy use comes
from traditional biomass (40%) and fossil fuels (35%) used directly in the home, and electricity (21%) generated
outside the home. Biomass is used for many purposes, but 75% of its global use is in the residential sector, where it
is used for cooking and heating.[1],. More than 2 billion residents in low-income countries lack reliable electricity
services (Byrne). Access to energy and economic development are closely linked [2], [3] For families facing energy
poverty, often a large fraction of household expenditures goes towards fuel costs, including cooking costs, and there
is a preference for the most affordable fuel, regardless of its environmental impact. [4] ,[5]. Fuels are particularly
scarce for people affected by wars and displacement [6] Without new policies, the number of people relying on
biomass is estimated to increase to 2.7 billion by 2030 due to population growth, and world demand for fossil fuels
is expected to exceed annual production in the next two decades[7]
It is estimated that 41% of the world population (around 2.8 billion people) cooks on solid fuels such as wood and
biomass. Solid fuel use is most common in Africa and Southeast Asia where more than 60% of the households cook
with solid fuels [8]. Exposure to smoke pollution from cooking on solid fuels causes health effects including
pneumonia, asthma, and other respiratory illnesses. Children in households with solid fuel use are more likely to
suffer from life threatening respiratory illnesses [9]. Exposure to household air pollution is also linked to chronic
illnesses in adults [10]. It is estimated that 2.6 million deaths annually are due to household air pollution. [11]
Burning solid fuels indoors increases health risks due to the high exposures [12]. Each year, about 4 million people
die prematurely due to illnesses attributed to household air pollution from cooking. Household air pollution can
cause stroke, ischemic heart disease, chronic obstructive pulmonary disease, and lung cancer. One of the major
causes of pneumonia in children under five can be attributed to indoor air pollution [13]
The residential energy sector is also a major contributor to global CO2 emissions. Increased use of renewable energy
can decrease the environmental impact of the residential sector [14]
Sustainable and emission free cooking sources are needed globally to reduce emissions. Solar energy is a low-
emission, affordable source of energy that would increase access to energy while decreasing the health effects from
polluting energy sources.

2
1.2 Solar Energy and Solar Cookers
The Sun provides 1.5 x 10¹⁸ kWh to the earth, 10,000 times larger than the current annual energy consumption of the
world. However, 80% of the present worldwide energy consumption is still based on fossil fuels [7]. The earth
receives 1.73 x 10¹⁴ kW, an average of 340 W/m2 over the whole earth’s surface. Approximately 30% is reflected
back to space and 20% is absorbed by clouds, dust and aerosols [15]. The solar radiation reaching the surface is
made up of two components, direct and diffuse. Direct radiation travels unimpeded through space and the
atmosphere to the surface. Diffuse radiation has been scattered by atmospheric constituents such as molecules,
aerosols and clouds [15].
Solar energy has been used successfully for many applications, including electricity, driers, and solar water heaters
[7]. Solar panels generate 1% of the electricity in the United States [16], and are also promising in countries without
a regular or reliable electricity supply [17] . Solar water heating is also prevalent and can be cost effective [18].
There are many cooking devices that cook with solar energy, including those that concentrate direct solar radiation
to a central point to cook food (e.g. parabolic solar cookers) using both direct and diffuse solar radiation, by trapping
heat to bake or cook [19], [20].
Stored solar cookers use direct solar radiation by concentrating sunlight into a point, similar to a parabolic cooker;
they differ from parabolic cookers because the concentrated energy is collected in a storage medium for later use. To
use only direct solar radiation, the collection device is manually or automatically adjusted to face the sun,
maximizing the solar radiation absorbed [21].
To optimize absorbance of collected solar energy, black paint is usually used. Some stored solar cookers use
parabolic dishes to collect sunlight while others use mirrors. Wheels can enable easy movement and tracking [22] .
Many stored solar cookers use glass panels to prevent heat losses, especially convective losses [23] [24] [25] [26] .
1.3 Solar Cooker Field Tests
Pilotstudies of solar cookers and their acceptance have taken place in regions around the world. Some studies
focused on solar cooker performance alone. A box solar cooker was tested for usability in Giza, Egypt, where it
reached 160oC and cooked several foods including rice, meat and fish [27]. A box solar cooker with a booster
mirror reflector was tested in Egypt. The solar cooker was able to cook meat, chicken, rice, peas, beans, potatoes,
soup, eggs, and cakes. An energy balance was also made for the solar cooker. [28]
Solar energy can be stored using phase-changing materials [29] such as acetamide [30], or sensible heat stored in
mediums such as cooking or engine oil [31] [32] [33]. Mixtures of different phase change salts can also be used
[22]. Safety, cost, and melting temperatures are some of the considerations in choosing storage materials [34].
A stored solar cooker using a phase change material as thermal storage, with steam used to transfer the heat from a
parabolic solar cooker, was tested in Ethiopia for making injera, a traditional Ethiopian bread. They showed that the
solar cooker was successfully able to cook injera.[35]

3
Alonso et al developed a sealed, portable energy-storage vessel that operates in the 300 400° Celsius range. The
phase change material chosen was potassium nitrate salt, and during energy recovery testing, the solar charged
vessel heated an average of 7 liters of water, producing 2.3 MJ of useful energy. Alsonso also tested additional
energy storage materials, including aluminum, potassium nitrate, and a 60/40 % mixture of sodium nitrate and
potassium nitrate [36].
1.4 Solar Cooker Acceptance
Other studies focused on the usability and acceptance of solar cookers. In South Africa, 7 different types of solar
cookers were tested with 66 families in three areas. The cookers tested included box, concentrators, and flat plate
collectors, and models of different sizes. Families used solar cookers on 38% of the days and for 35% of all cooked
meals. Families combined the use of solar cookers with wood (used on 42% of the days). Using solar cookers
resulted in average fuel savings of 38%, and pay-back periods of 8 months in this study. [37].
In Burkina Faso and India, Scheffler reflector solar cookers were installed among bakeries, shea nut butter
producers, and steam kitchens. The study showed that when solar cookers conform to socio-cultural factors they can
be successfully adopted. In Burkina Faso, the use of the solar cookers did not conform well to preferred time of
cooking for a bakery (night) and to wanting to cook in the privacy of a kitchen when making shea nut butter.
However, at some testing sites in India, concern for the environment was a factor in using the solar cooker [38].
These studies show that factors for the success of solar cookers include usability, conforming to social and cultural
traditions, economic benefits, and convenience. Users need to be able to cook at times that are convenient for them,
and foods which they are used to, regardless of the season and available sunlight. Cookers need to fit well into users’
culture and cooking traditions, while the need for extra attention or unfamiliar steps makes solar cooking
unattractive. Savings from using a solar cooker instead of buying fuel is important. When the weather does not
allow cooking, and users continue to purchase fuel intermittently, using a cooker is less optimal [39]–[41], [42] .
Solar cookers perform best around solar noon under clear skies. The performance degrades due to lack of collected
energy at other times or when clouds scatter incoming energy and reduce direct solar radiation. Traditionally, many
families eat early-morning and evening meals, with the need to cook at times when there is limited sunlight. The
need to cook at non-optimal times creates a demand for storage of solar energy, so food can be cooked any time of
day. Many stored solar cookers have been developed [22] [33] [43] [44].
1.5 Modelling Stored Solar Cookers
Lecuona et al modeled a stored solar vessel with a parabolic dish [34]. The phase change material was a mixture of
technical grade paraffin and erythritol, melting at 110-118 C. The lower phase-change temperature was chosen to
make reaching phase temperatures easier. They assumed that food would cook at its sterilization temperature of 70°
C to cook food, and used 1 kg of water to represent food. The solar cooker was only tested on sunny days. They
found that the stored energy could be used to cook lunch, and after being stored inside, could be used to cook dinner
and then breakfast. A one-dimensional numerical heat transfer model was developed and calibrated using
experimentation. The optical efficiencies of the solar cookers were determined experimentally using temperature-

4
time evolution for tests from 7 am to 5 am. Using water to represent cooking, this study demonstrated the utility of
the cooker for three meals in climate conditions similar to Madrid, Spain.
1.6 Solar Cooker Energy Balance
Energy balances that incorporate solar input under different environmental conditions, and losses from the storage
vessel, are essential to understanding the heat storage capabilities of a solar cooker under different conditions.
Several such energy balances have been developed. Some examples are a box solar cooker under Egyptian climate
conditions [28], a basin solar still with a phase change material for treating drinking water evaluated under Jeddah,
Saudi Arabia weather conditions [45], a storage system for a solar still [46], an energy balance using pebbles and oil
[47], a solar domestic cooking unit integrated with a thermal energy storage system [48], and a kitchen solar thermal
system [49].
In this work, we develop an energy-balance model that incorporates environmental data to estimate the amount of
energy stored in multiple locations, using both weather data from a single year and long-term averaged weather data.
We use the model to identify locations where storage of solar energy can provide the ability to use an emission-free
device.
1.7 Solar Resource Maps
Solar resource maps show the solar potential in a given location. Many existing regional and global solar resource
maps are available indicating monthly or yearly solar radiation averages[50] [51] [52] [53]; for example, they show
how much electricity or hot water can be generated at a particular location.
Renewable energy maps have been created for specific uses, such as generation of energy or hot water, or to show
overall energy potential. A Geographical Information System (GIS) mapped renewable energy potential (solar,
wind, bioenergy, and small hydro energy) in Karnataka State, as affected by that region’s solar radiation, mean
temperature, relative humidity, and specific humidity [15]. Satellite derived solar resource maps were developed for
Brazil [54], [55]. These resource maps incorporate environmental variables, such as direct normal solar radiation
and cloud cover, but long-term averages do not indicate how a storage vessel would perform. To determine the
usability of stored solar energy, a solar resource map that incorporates time-varying storage is necessary.
1.8 Environmental Inputs
Environmental variables that describe solar energy input are direct solar radiation and cloud cover; those that affect
losses from a storage device are temperature and wind. Because weather is variable, the evaluation should occur
over many years. Unfortunately, very few stations in the world have measured solar radiation consistently and
accurately over very long periods.
There are several sources of solar radiation, cloud cover, and weather data. Ground-based data from weather
stations are useful in evaluating solar models [56], but are concentrated in specific locations. There are over 1,500
ground solar radiation measurement stations in the United States, . However, only four stations in the United States
5
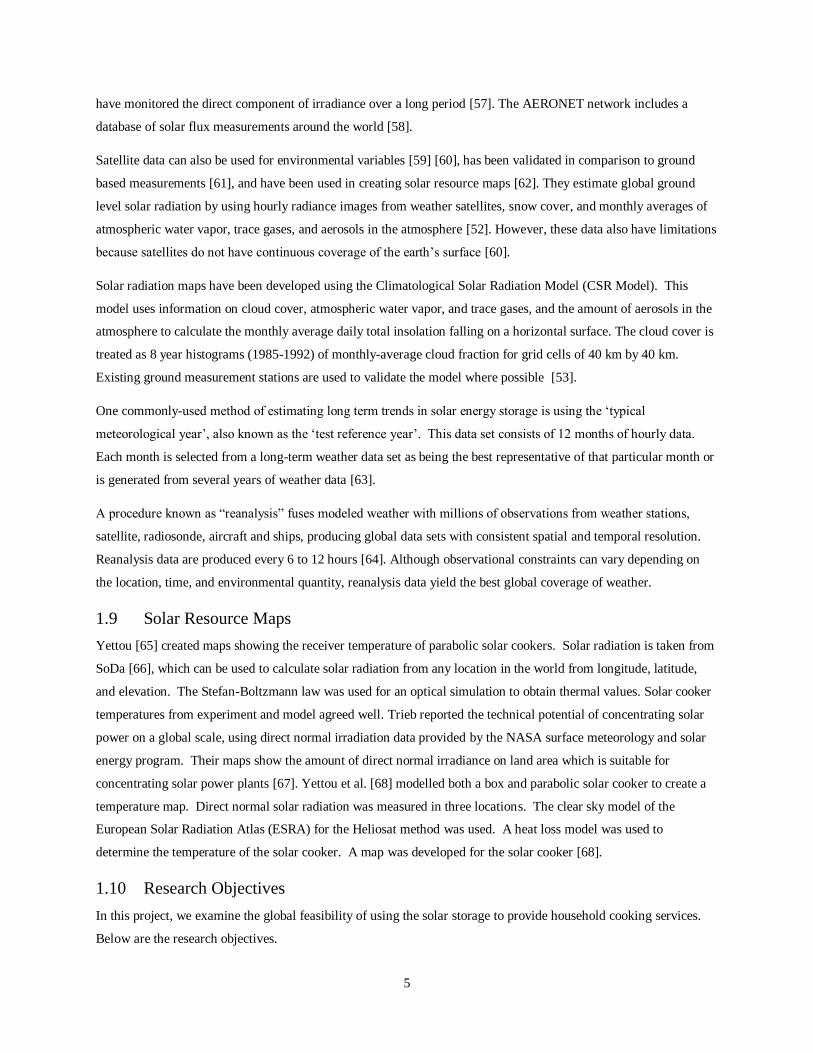
have monitored the direct component of irradiance over a long period [57]. The AERONET network includes a
database of solar flux measurements around the world [58].
Satellite data can also be used for environmental variables [59] [60], has been validated in comparison to ground
based measurements [61], and have been used in creating solar resource maps [62]. They estimate global ground
level solar radiation by using hourly radiance images from weather satellites, snow cover, and monthly averages of
atmospheric water vapor, trace gases, and aerosols in the atmosphere [52]. However, these data also have limitations
because satellites do not have continuous coverage of the earth’s surface [60].
Solar radiation maps have been developed using the Climatological Solar Radiation Model (CSR Model). This
model uses information on cloud cover, atmospheric water vapor, and trace gases, and the amount of aerosols in the
atmosphere to calculate the monthly average daily total insolation falling on a horizontal surface. The cloud cover is
treated as 8 year histograms (1985-1992) of monthly-average cloud fraction for grid cells of 40 km by 40 km.
Existing ground measurement stations are used to validate the model where possible [53].
One commonly-used method of estimating long term trends in solar energy storage is using the ‘typical
meteorological year’, also known as the ‘test reference year’. This data set consists of 12 months of hourly data.
Each month is selected from a long-term weather data set as being the best representative of that particular month or
is generated from several years of weather data [63].
A procedure known as “reanalysis” fuses modeled weather with millions of observations from weather stations,
satellite, radiosonde, aircraft and ships, producing global data sets with consistent spatial and temporal resolution.
Reanalysis data are produced every 6 to 12 hours [64]. Although observational constraints can vary depending on
the location, time, and environmental quantity, reanalysis data yield the best global coverage of weather.
1.9 Solar Resource Maps
Yettou [65] created maps showing the receiver temperature of parabolic solar cookers. Solar radiation is taken from
SoDa [66], which can be used to calculate solar radiation from any location in the world from longitude, latitude,
and elevation. The Stefan-Boltzmann law was used for an optical simulation to obtain thermal values. Solar cooker
temperatures from experiment and model agreed well. Trieb reported the technical potential of concentrating solar
power on a global scale, using direct normal irradiation data provided by the NASA surface meteorology and solar
energy program. Their maps show the amount of direct normal irradiance on land area which is suitable for
concentrating solar power plants [67]. Yettou et al. [68] modelled both a box and parabolic solar cooker to create a
temperature map. Direct normal solar radiation was measured in three locations. The clear sky model of the
European Solar Radiation Atlas (ESRA) for the Heliosat method was used. A heat loss model was used to
determine the temperature of the solar cooker. A map was developed for the solar cooker [68].
1.10 Research Objectives
In this project, we examine the global feasibility of using the solar storage to provide household cooking services.
Below are the research objectives.

6
A. Develop an energy balance for a Stored Solar Cooker
A device that stores solar energy in a phase-change salt, known as a Sun Bucket, was developed by a team at the
University of Illinois Urbana-Champaign. It is currently used by several nonprofit and community partners. An
energy balance helps to understand the potential for energy storage by the stored solar cooker, including how fast the
stored solar cooker becomes fully charged, how quickly the energy is lost, and therefore how long the energy can be
stored. The energy balance is to be validated using laboratory heat loss tests.
B. Develop an environmental model for the Stored Solar Cooker
An environmental model of the Stored Solar Cooker determines how much energy is stored under different weather
conditions, including solar radiation, cloud cover, ambient temperature, and wind speed. The environmental model
determines the conditions under which the stored solar cooker is usable by storing sufficient energy to cook. The
environmental model is to be validated using field heat storage tests.
C. Develop a global map of locations for stored solar energy usability, by
combining energy balance and environmental models
The energy balance and environmental models are coupled to develop a global solar resource map for each month,
showing the number of days in that month at least one stored solar cooker is fully charged. This shows the optimal
global locations where the stored solar cooker can be used.

7
Chapter 2
ENERGY BALANCE AND ENVIRONMENTAL MODELS
2.1 Stored Solar Cooker Energy Balance
This section discusses the physical principles of energy storage in a vessel. This model can represent different types
and sizes of parabolic dishes, as well as different sizes of vessels, types of insulation, and salts. A schematic of the
stored solar cooker with the parabolic dish is shown in figure 1. Figure 2 shows the dimensions and temperatures
used to describe the vessel.
Figure 1 Energy Balance of the Stored Solar Cooker
Figure 2 Diagram of Stored Solar Vessel
Salt TA
TS
Lid

8
The vessel storage capacity (J/K) is equal to the mass of the salt, Ms (kg), times the heat capacity of the salt, CPS
(J/kg K). T represents the temperature (Ts is the temperature of the salt and TA is the ambient temperature). Ro is the
outer radius, ri is the inner radius, and z is the height, all in meters.
The change in temperature across the vessel (difference between the salt temperature and the outside temperature,
in Kelvin) is the heat flow (Q, W/m2) times the heat resistance (R K/Wm2)
S AT T T QR = − = (1)
The thermal resistance from conduction from the bottom of the vessel, cylindrical sides, convection, and radiation is
calculated for each component of the vessel, as given in equations (2)- (5), tv is the thickness of the vessel insulation
and aluminum outside (m), kA is the conductivity of the salt and aluminum (W/mK), h is the convective heat
transfer (W/m2K), ε is the emissivity , and σ is Stephan Boltzmann’s constant (5.67*10-8 W/m2K).
1
vtRk
= (2)
0 02
ln( / )ir r rR
k= (3)
3
1R
h= (4)
4 2 2
1
( )( )S A S A
RT T T T
=+ +
(5)
Equations 1-4 are combined to determine the total thermal resistivity of the vessel (Equation (6).
1
1 2
3 4
1 1( )TOTR R RR R
−= + + + (6)
RTOT is combined with the area (A, meters) and change in temperature (ΔT) to get the heat transfer coefficient
(UTOT, W) (Equation (7))
TOT
TOT
A TU
R
= (7)
During heating and cooling, below melting temperature, the salt temperature can be modelled using a differential
loss equation (Equation (8), where EAS (W) is equal to the incoming solar radiation absorbed by the parabolic solar
cooker and CP*Ms in J/K is the vessel storage capacity of the salt and aluminum in the stored solar cooker.

9
( ) ( )*
exp 1 *
expPS
O
AS TOTo v
T
s
P S
S
T M
CE Uk
M
U
tT t T t
C
= − + − −
(8)
This equation is valid until the salt reaches melting temperature and starts melting.
The energy stored in the thermal salt is given by equation (9), where m is the mass of the salt, fm is the fraction of
the salt melted, hf is the heat of fusion of the salt (J/g), Cp,s is the heat capacity of the solid salt (J/K), Tm is the
melting temperature of the salt, and Ta is the ambient temperature . The salt is never heated above melting
temperature, so the energy stored above melting temperature is not calculated.
( ), ( ' )v m f p s S aE m f h C T T= + − (9)
The change in energy in a charging vessel (ΔEV, Joules) is given by equation (10), where EAS is the solar radiation
absorbed by the stored solar vessel (W), UTOT are the losses given in equation , ΔTm is the difference between the (7)
salt melting temperature and ambient temperature, and dt is the change in time with seconds.
(E )OAv MS T TE U T dt = − (10)
Once the total energy stored in the vessel is equal to the energy required to melt all of the salt, the vessel is
considered fully charged. That particular vessel is removed from charging, and a new vessel at ambient temperature
is placed on the parabolic solar cooker to start charging.
2.2 Environmental Model
The environmental model describes the response of the stored solar cooker to its environment. Figure 3 shows the
weather inputs for the model: solar radiation, direct solar radiation fraction, windspeed and temperature

10
Figure 3 Environmental Model for the Stored Solar Cooker
2.3 Environmental data used in model
The global environmental data needed for the model was taken from the NCEP/NCAR Reanalysis 1 Project data.
The selected variables are shown in Table 1 [64]. Four times daily data is taken from four time periods daily:
Midnight to 6 am, 6 am to noon, noon to 6 pm, and 6 pm to midnight, universal coordinated time (UTC). Each
location’s local time was converted to UTC time to apply the appropriate value. The clear sky solar radiation, visible
beam downward solar flux, near infrared beam downward solar flux, and air temperature were means averaged over
each six hour period. The wind speed in the u and v direction was an individual observation taken every six hours.
The four times daily values were used to get diurnal effects on charging the stored solar cooker.
Table 1 Reanalysis Parameters Used in Solar Environmental Validation
Parameter Level Units Interval
Resolution
(longitude
x latitude)
Year Model
Inputs Source
Clear Sky
Solar
Radiation
Surface Watts/m2 4 Time
Daily Mean 1.875 x 1.9 2015
Incoming
energy
NCEP/NCAR
Reanalysis 1
Visible Beam
Downward
Solar Flux
Surface Watts/m2 4 Time
Daily Mean 1.875 x 1.9 2015
Direct Solar
Radiation
Fraction
NCEP/NCAR
Reanalysis 1
Near IR
Beam
Downward
Solar Flux
Surface Watts/m2 4 Time
Daily Mean 1.875 x 1.9 2015
Direct Solar
Radiation
Fraction
NCEP/NCAR
Reanalysis 1

11
Table 1 cont: Reanalysis Parameters Used in Solar Environmental Validation
Air
Temperature 2 meters Kelvin
4 Time
Daily Mean 1.875 x 1.9 2015
Overall heat
loss and
starting
temperature
NCEP/NCAR
Reanalysis 1
U Wind
speed
Sig 995 -
Surface
Meters/sec
ond
4 Time
Daily
Individual
Observation
2.5 x 2.5 2015 Convective
heat loss
NCEP/NCAR
Reanalysis 1
V Wind
speed
Sig 995-
Surface
Meters/sec
ond
4 Time
Daily
Individual
Observation
2.5 x 2.5 2015 Convective
heat loss
NCEP/NCAR
Reanalysis 1
In addition to a single year, the long-term trends in stored solar cooker daily energy and usability were evaluated.
NCEP/NCAR Reanalysis 1 Project’s four times daily average values from 1981 to 2010 were used. The selected
data is shown in Table 1 [64]. These 19 year averaged weather inputs where used in the solar cooker global model
to calculate average daily energy stored and days per month in which at least one, at least two, and at least three
solar cookers can be charged in a location in a given month.
Table 2 Long Term Averaged Environmental Inputs
Parameter Level Units Interval
Resolution
(longitude x
latitude)
Averagin
g Period
Model
Inputs Source
Clear Sky
Solar
Radiation
Surface Watts/m2 4 Time
Daily 1.875 x 1.9
1981-
2010
Incoming
energy
NCEP/NCAR
Reanalysis 1
Visible Beam
Downward
Solar Flux
Surface Watts/m2
4 Time
Daily
Mean
1.875 x 1.9 1981-
2010
Direct Solar
Radiation
Fraction
NCEP/NCAR
Reanalysis 1
Near IR
Beam
Downward
Solar Flux
Surface Watts/m2
4 Time
Daily
Mean
1.875 x 1.9 1981-
2010
Direct Solar
Radiation
Fraction
NCEP/NCAR
Reanalysis 1
Air
Temperature
2
meters Kelvin
4 Time
Daily
Mean
1.875 x 1.9 1981-
2010
Overall heat
loss and
starting
temperature
NCEP/NCAR
Reanalysis 1
U Wind
speed
Sig 995
-
Surface
Meters/se
cond
4 Time
Daily
Individual
Observati
on
2.5 x 2.5 1981-
2010
Convective
heat loss
NCEP/NCAR
Reanalysis 1

12
Table 2 cont.
V Wind
speed
Sig
995-
Surface
Meters/se
cond
4 Time
Daily
Individual
Observati
on
2.5 x 2.5 1981-
2010
Convective
heat loss
NCEP/NCAR
Reanalysis 1
In addition, Elevation and Land Sea mask values were used [69], [70] ( Table 3). Solar radiation was adjusted by
the elevation of a location [69].
Table 3 Elevation and fractional land data
Parameter Units
Resolution
(longitude x
latitude)
Model Inputs Source
Elevation meters 0.25 x 0.25 Solar Radiation JISAO, University of Washington and
TerrainBase Global Terrain Model
Fractional land 0-1 0.25 x 0.25 Land- sea mask JISAO, University of Washington and
TerrainBase Global Terrain Model
2.4 Clear Sky Solar Radiation
Solar radiation received on a surface perpendicular to incoming rays is known as direct normal radiation. Under
clear skies, a parabolic device that tracks the sun collects direct normal radiation, and tracking is assumed for the
solar collector. Equations are available to calculate the direct normal solar radiation at each hour and location on the
earth. The tilt of the earth (AE) is given in equation (11). This is used with the day of year (DOY) to calculate the
declination gamma (δ) (11). The hour angle (hA) is calculated from the current time (tc) and the time of solar noon
(TSN) (Equation (13) ) [71]. The latitude (lat), declination gamma, and hour angle are used to calculate the solar
zenith angle (θ), which is the angle between the sun and the zenith .
23.45EA = (11)
*sin((360 / 365)*(284 ))EA DOY = + (12)
15*( )A c SNh t T= − (13)
cos sin( )*sin( ) cos( )*cos( )*cos( )Alat lat h = + (14)
Next, the solar zenith angle is used to calculate the airmass (AM) (15) [72] or the amount of air between the
collector and the sun. The airmass and elevation (E, local height above sea level, kilometers) are used to calculate
the direct solar radiation (ID, W/m2) Equation (16) [73], [74], accounting for the amount of radiation scattered out of
the direct beam by the atmosphere. On a clear day, 10 percent of the incoming solar radiation is diffuse [75].

13
Therefore, clear sky global horizontal radiation (W/m2), the sum of direct and diffuse solar radiation, is given by
equation (17) The clear sky global horizontal radiation calculation is used to validate the model by comparing with
field measurements made with a pyranometer.
1.6364
1
cos( ) 0.50572*(96.07995 )AM
−=
+ − (15)
0.678
1.353* (1 0.14* )*0.7 0.14*AM
DI E E = − +
(16)
1.1*G DI I= (17)
The length of day (LOD) is calculated using the latitude and declination gamma and is given by (18). Daily sunrise
(TSR) and sunset (TSS) times are used to determine when the vessel starts and ends charging; it is assumed that the
user takes advantage of the maximum length of day. The length of day is used to calculate the sunrise and sunset
times (equation (19) and (20)).
1(2 /15)*cos (tan( )* tan( ))ODL lat −= (18)
2
ODSR SN
LT T= − (19)
TSS
=TSN
+LOD
2 (20)
2.5 Direct Solar Radiation Fraction
Many models have attempted to determine a relationship between percent total cloud cover, clear sky solar
radiation, and solar radiation. It has been found that this is a nonlinear relationship. Models have attempted to find
a correlation at given locations [76] [77] [78] [79]. Since the goal of this study is to create a global model, a method
was needed for the entire globe.
Two methods were explored to determine the direct solar radiation on a given day. One method is using the
reanalysis four times daily direct solar radiation values over the clear sky solar radiation. Direct solar radiation is
given by the visible beam downward solar radiation and the near infrared visible downward solar radiation. The
fraction of direct solar radiation (SD), the type of solar radiation used by a parabolic solar cooker, was calculated by
taking the sum of the visible beam downward solar radiation (SVB) and the near infrared visible beam down solar
radiation (SNIR), over the downward clear sky solar radiation flux (SC) (Equation (21)).

14
VB NIR
D
C
S SS
S
+= (21)
This fraction of direct solar radiation (SD) is multiplied by the global horizontal radiation calculated hourly by
equation 7 to get the hourly direct solar radiation..This method inherently accounts for cloud cover by reducing the
expected clear-sky radiation by the amount of radiation actually observed during the reanalysis period.
Another method uses percent total cloud cover. The effect of cloud cover on the incoming clear sky solar radiation is
estimated using the Ånström-Savinov formula, where C is the percent cloudiness, k is the transmission of solar
radiation within the clouds, and Go is the clear sky solar radiation [79] [78], k was set to zero to determine the direct
solar radiation (Equation (22)).
( ) ] 1 1[G G k C= − −
(22)
Both methods give similar results. Since the direct solar radiation is what the solar cooker uses, it was decided the
fraction of direct solar radiation was the best method.
2.6 Solar Energy Collected by Parabolic Dish
There are many existing parabolic solar cookers [80]. The stored solar cooker system is designed for single family
use, and to be used with existing solar cookers [36]. The following equations calculate the energy collected by a
typical parabolic dish.
Equation (23) shows the energy collected by the stored solar vessel (Ea in Watts), which is a function of the direct
solar radiation (EIN , W/m2) collected by the parabolic dish, the dish area (AS), the vessel absorbance (VA), the
reflectivity of the parabolic dish (Dr), and the transfer efficiency (Te), which represents how efficiently the stored
energy is transferred to the vessel (Equation (23))
* * * *A IN S A R EE E A V D T= (23)
The parabolic area (DA) of the parabolic dish was calculated using the diameter (D) and Focal Length (FL) in
equation (24) [81] .
3222
8((1 (( ) 1)*( * )
4 3A L
L
DD F
F
= + − (24)
2.7 Collection efficiency of parabolic dish
There are several factors in the efficiency of a parabolic dish collection. Several studies have looked at the thermal
performance of parabolic concentrators around the world. A study of thermal performance in Malaysia estimated
optical efficiencies of 60%, 60% and 50% for three parabolic concentrators [82]

15
The optical efficiency (OE) is defined as the ratio of the conecentrated solar radiation intercepted by the receiver
aperture (Pa) over the solar radiation incident to the mirror or reflective aperature (PM) (Equation (25)) [82]
a
E
m
PO
P= (25)
In a study of a parabolic concentrator at noon in India, three different procedures were used to determine optical
efficiencies of 33.5 %, 27.3%, and 34.7% [83]
A study which built parabolic dishes of 5 m diameter and focus of 2.5 m used an energy balance to determine the
overall optical efficiency of the collector as 86% to 89% [84]
In a study looking at a low-cost steam generating system using a parabolic dish, it was found that the reflectivity of
the mirror greatly influenced the collector efficiency of the dish collector system. Over a 7 year period, from 1992,
to 1998, the reflectivity decreased from 0.9 to 0.64, and the collection efficiency decreased from 80.85% to 57.34%
[85].
The optical efficiency for the model in the present study was experimentally determined by comparing the change in
temperature with time from the field test with that determined from the model.
2.8 Convective losses from wind
Various studies have been done on the effects of wind speed on convective heat loss from a solar device. Wattmuff
and Kumar studied the convective heat loss from solar collectors in a wind tunnel [86] Kumar and Mullick derived
wind heat transfer coefficients for flat plate solar cookers on roofs in Delhi, India [87]. Table 4 shows different
relationships between windspeed and convective heat transfer from past studies, both inside and outside.
Table 4 Convective heat transfer from Windspeed
Name Relationship Description Area of Plate Source
A Hw =8.55+2.56V
W/m2K
Rectangular plate
outside
Copper plate, 1.22
m by 0.813 m =
0.99186 m2
Test et al 1981
[88]
B Hw = 3.0V + 2.8
W/m2K
Wind tunnel Watmuff et al 1977
[89]
C Hw = 3.8V+5.7
W/m2k
0.5 m2 copper plate
mounted vertically
in a wind tunnel
0.5 m2 McAdams 1954
[90]
D Hw = 10.03 + 4.687V
(V < 5 m/s)
Indoor experiment
on square plate
(0.3678 m2)
0.3678 m2 plate Kumar et al (1997)
[86]

16
Table 4 cont.
E Hw = 6.5+3.3V
0.8<V <6 m/s at 90 degree
Flat aluminum
plate on roof, with
aluminum top
plate, wind parallel
to plate, windspeed
range is 0.8 to 6.2
m/s
1.81 m x 0.89 m =
1.6109 m2
Sharples &
Charlesworth (1998)
[93]
F Hw = 6.9+3.87V
V < 1.12 m/s
Plate .925 m by
0.865 m flat on
roof, linear
correlation, windspeed is less
than 1.12 m/s
.925 m x .865 Kumar and Mullick
2010
[87]
G H=10.45-V+10*V0.5
W/m2K
Carried out on
water in Antarctica
Cylinder with length
5.875 in , diemater
2.259 in and filled
with water
Shitzer 2006 [94]
Siple and Passel 1945
[95]
H H = 7.07+3.25V,
V< 1.12 m/s
Square plate on
roof of building
.925x.865 m Mullick et al 2007
[96]
In the environmental model, the convective windspeed correlation recommended by [87] was used. In their study,
they found a linear correlation between heat loss and windspeed on a plate 0.925 m by 0.865 meters. This
correlation is most applicable since it was found in outdoor conditions and on a similar flat exposed surface. This is
given in equation (26)
6.9 3.87*WH V= + (26)
Wind speed in two horizontal directions, U and V, is taken from reanalysis data. These are combined to find the
total windspeed (27)
2 2
TOT W WU U V= + (27)

17
Chapter 3
MODEL VALIDATION
3.1 Design of Vessel Used in Model Calibration
For the calibration of the model, a stored solar cooker called Sun Buckets (Figure 4, while charging, and Figure 5,
while cooking) was used. This vessel was selected because it is available for field and laboratory testing and has
been tested in many locations across the globe. It is similar to other available stored solar cookers, ensuring that this
model can be applied to other stored solar cooker models [97], [98].
Figure 4 Charging a Sun Bucket (Photo from Matthew Alonso)
Figure 5 Cooking on a Sun Bucket
Figure 6 shows the dimensions of the Sun Bucket solar cooker. Different Sun Buckets contain one of three phase
change materials: potassium nitrate salt, odium nitrate salt, and a combination of the two salts, all which have high
melting point, which is comparable to temperatures needed for cooking (including frying) and its storage ability
(heat capacity) [99]. For the validation of the model, vessels containing potassium nitrate salt were used (Table 5).
The insulation used is Pyrogel insulation and surrounded by aluminum. Pyrogel insulation is a technical grade
insulation chosen for its high thermal resistance properties [100].

18
Figure 6 Dimensions of the Sun Bucket Solar Cooker
Table 5 Properties of Potassium Nitrate Salt ( [99], [101].)
Parameter Value and Units Variable
Salt Mass 5 kg SM
Solid Salt heat
capacity
940. J/kgoK SHC
Melted Salt
Heat Capacity
1395 J/kgoK SMHC
Salt melting
temperature
607.15 degrees Kelvin SMT
Heat of fusion 90996 Joules/kg SHF
Aluminum
Mass
2.15 kg AM
Aluminum Heat
Capacity
900 J/kgK AHC
The salt is contained in an aluminum container, and the plate which absorbs heat is also aluminum. The
conductivity of aluminum is assumed to be 2015 W/mK. The top of the vessel is covered with paint with emissivity
of 0.25. The mass of aluminum was not negligible in heat storage and is taken into account when calculating the
energy stored and heat losses.
5 kg

19
The conductivity of the pyrogel (PC) (Units: W/m*K) used in the insulation is dependent on the temperature of the
vessel (TV) in degrees Celsius (equation (28)) [100].
0.0025( )
0.001*17.989* VT
CP e= (28)
Commercially available parabolic dishes were used to collect sunlight onto the vessel, which was placed where a
cooking pot would normally be placed. Use of commercial collectors is assumed as the stored-solar vessel is likely
to be marketed separately from the collector. During testing, three dishes were used: Solar Burner from Cantina
West (1.5 m2 parabolic concentrator), Sol Source from One Earth Designs (1 m2 Parabolic Concentrator), and a
Parabolic cooker from Eco-Worthy (1.5 m2 Parabolic Concentrator). The diameter and focal length for the parabolic
solar cooker are taken from the Cantina West concentrator [102] .
The absorbance and emissivity of the vessel were determined from the paint used (SOLKOTE HI/SORB-II ) on the
exposed surface of the vessel [103]. The collection efficiency of the vessel, which consists of the optical efficiency,
and the transfer efficiency of the energy collected by the parabolic dish to the stored solar vessel were determined
from the model validation. These values are less than one due to losses from the heat gained by the parabolic dish,
and losses from the heat transfer from the dish to the vessel.
Table 6 Parabolic dish and heating surface parameters
3.2 Description of Laboratory Tests
Lab tests were performed on the stored solar cooker vessel to experimentally determine the heat transfer coefficient.
Vessels were heated to slightly above melting temperature in an oven, then removed to cool while the temperature
was monitored for different sections of the vessel. Figure 7 shows the location and name of each temperature
measurement point for the uncovered vessel. Figure 8 shows the temperature measurement point for the vessel
which was fully covered during the heat loss test. Three types of tests were performed: insulated, fully covered
Name Variable Value used in Calculations
Dish Diameter Dd 1.5 m
Focal Length FL 0.60 m
Vessel Absorbance Va 0.94
Vessel Emissivity VE 0.25
Dish reflectivity Dr 0.85
Collection efficiency Ce 0.5

20
vessels; uncovered vessels, and uncovered vessels with fans to simulate wind (Table 7). Analysis of the laboratory
tests caused slight adjustments to some parameters, which are detailed in Appendix B.
Figure 7 Thermocouple Locations for uncovered heat lost tests and vessel charging tests
Figure 8 Thermocouple Locations for Insulated Vessel Heat Loss Test
21
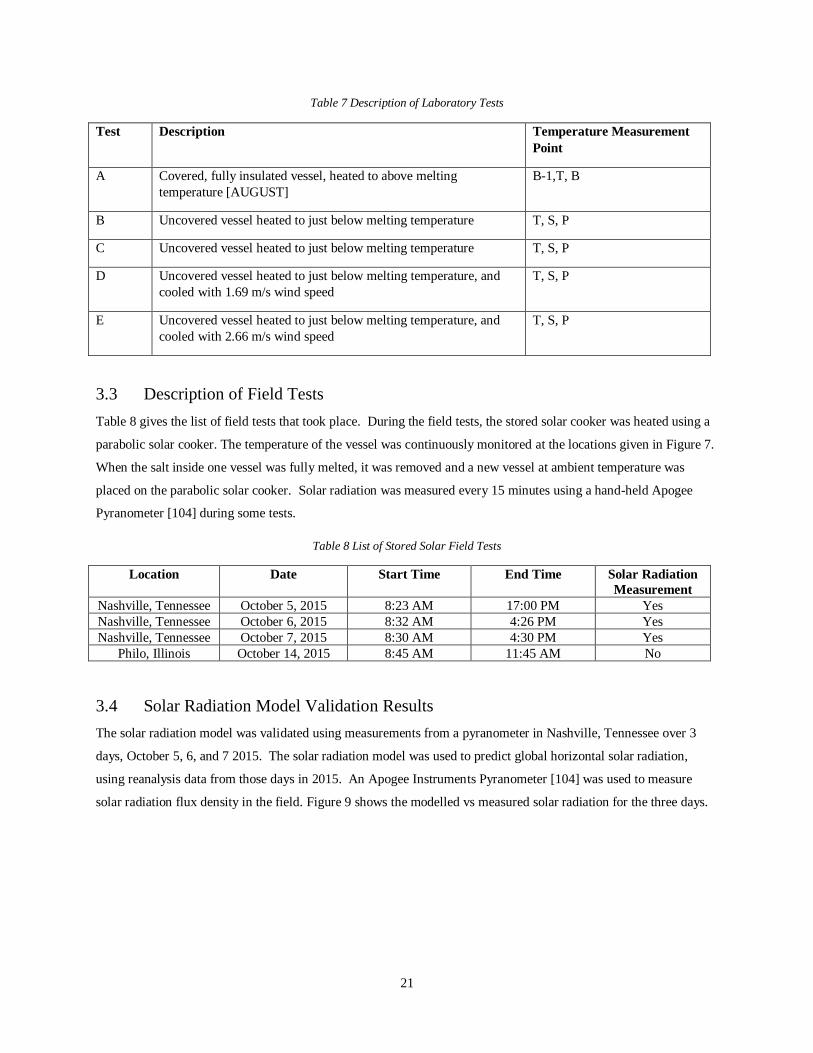
Table 7 Description of Laboratory Tests
Test Description Temperature Measurement
Point
A Covered, fully insulated vessel, heated to above melting
temperature [AUGUST]
B-1,T, B
B Uncovered vessel heated to just below melting temperature T, S, P
C Uncovered vessel heated to just below melting temperature T, S, P
D Uncovered vessel heated to just below melting temperature, and
cooled with 1.69 m/s wind speed
T, S, P
E Uncovered vessel heated to just below melting temperature, and
cooled with 2.66 m/s wind speed
T, S, P
3.3 Description of Field Tests
Table 8 gives the list of field tests that took place. During the field tests, the stored solar cooker was heated using a
parabolic solar cooker. The temperature of the vessel was continuously monitored at the locations given in Figure 7.
When the salt inside one vessel was fully melted, it was removed and a new vessel at ambient temperature was
placed on the parabolic solar cooker. Solar radiation was measured every 15 minutes using a hand-held Apogee
Pyranometer [104] during some tests.
Table 8 List of Stored Solar Field Tests
Location Date Start Time End Time Solar Radiation
Measurement
Nashville, Tennessee October 5, 2015 8:23 AM 17:00 PM Yes
Nashville, Tennessee October 6, 2015 8:32 AM 4:26 PM Yes
Nashville, Tennessee October 7, 2015 8:30 AM 4:30 PM Yes
Philo, Illinois October 14, 2015 8:45 AM 11:45 AM No
3.4 Solar Radiation Model Validation Results
The solar radiation model was validated using measurements from a pyranometer in Nashville, Tennessee over 3
days, October 5, 6, and 7 2015. The solar radiation model was used to predict global horizontal solar radiation,
using reanalysis data from those days in 2015. An Apogee Instruments Pyranometer [104] was used to measure
solar radiation flux density in the field. Figure 9 shows the modelled vs measured solar radiation for the three days.

22
Figure 9 Modelled vs Measured Solar Radiation
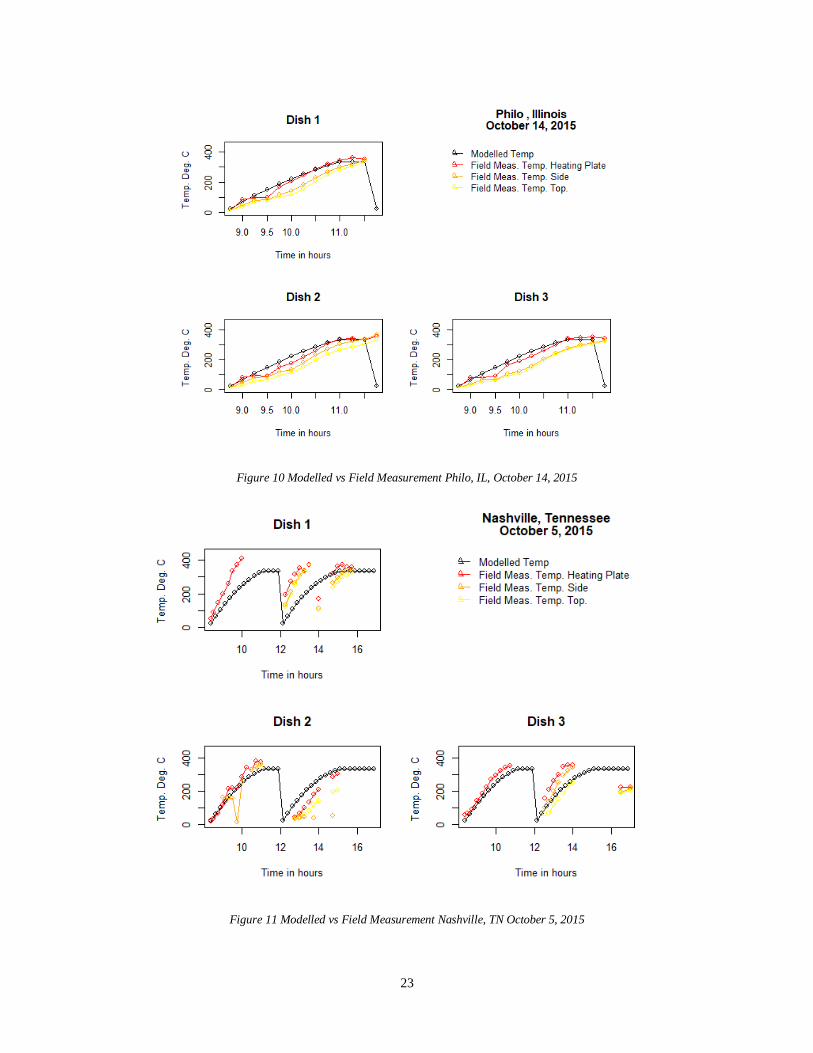
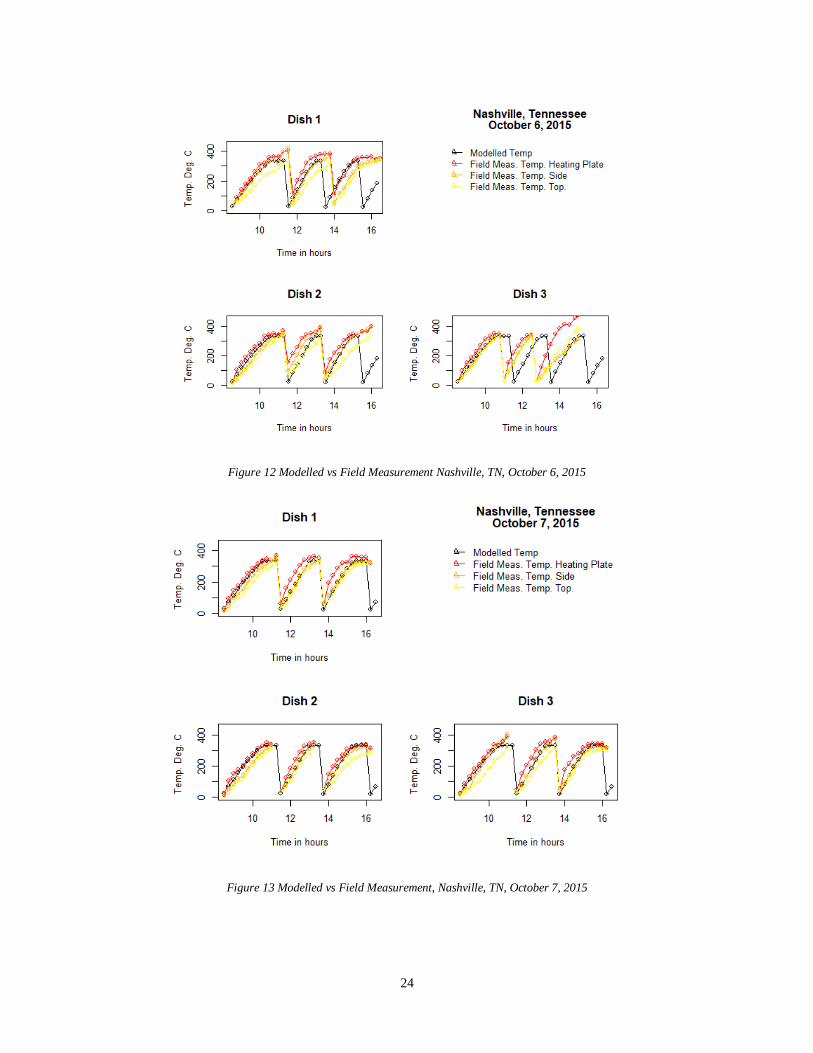
3.5 Solar Storage Model Validation
The stored solar model was validated using a heat storage field test in Philo, Illinois on October 14, 2015, with three
Sun Bucket stored solar cookers, (Figure 10) and in Nashville, Tennessee on October 5, 6 and 7, 2015 using three
Sun Bucket Solar Cookers. (Figure 11, Figure 12 , and Figure 13). Measurements were taken just under the top
plate, side, and the heating surface of each dish. The heating surface heated the fastest, followed by the side of the
vessel and then under the top plate. After each vessel was fully charged, it was removed, and a new vessel was
placed on the parabolic dish to be charged. The model accurately predicts the number of fully charged vessels
produced for each day.
23
Figure 10 Modelled vs Field Measurement Philo, IL, October 14, 2015
Figure 11 Modelled vs Field Measurement Nashville, TN October 5, 2015
24
Figure 12 Modelled vs Field Measurement Nashville, TN, October 6, 2015
Figure 13 Modelled vs Field Measurement, Nashville, TN, October 7, 2015

25
Chapter 4
INFLUENCE OF ENVIRONMENTAL FACTORS
Several environmental and location factors influence the performance of the stored solar cooker, including time of
year, latitude, fraction direct solar radiation, wind speed, and ambient temperature. The effect of these factors on the
ability to charge solar cookers is explored in this section using the energy-balance model coupled with the
environmental model. .Results are shown as the time-dependent temperature of an energy-storage vessel as it
charges
4.1 Seasons
Figure 14 shows the stored solar cooker performance at different times of year in Chicago, Illinois (latitude 41.88
degrees North and longitude 87.63 degrees West). It was assumed to be a sunny day (direct solar radiation fraction
0.9), with minimal wind (0.1 m/s on average), and the temperature is set to 0 degrees Celsius so that heat loss is
constant. It is assumed that the solar cookers start charging when the sun rises and charging ends when the sun sets.
On the fall and spring equinoxes, 7 stored solar cookers are fully charged, on the summer solstice, 10 stored solar
cookers are charged. On the winter solstice, four stored solar cookers are fully charged and a fifth is almost charged.
Given optimal conditions (very sunny, minimal wind, and no extreme cold temperatures), any time of year in
Chicago (which can represent the mid latitudes), at least one stored solar cooker can be fully charged. Given the
shorter winter days, in the winter, if some of the day is cloudy, it is less likely there is enough time to charge a fully
Sun Bucket. There is more energy potential in the summer given the longer days and stronger solar radiation.
Figure 14 Effect of Season on Solar Cooker Performance

26
This result was confirmed on the winter solstice in 2015, in Philo IL (latitude 40 degrees north and 88.16 degrees
West) when 3 sun buckets were fully charged starting at 9 am and ending at 4 pm.
4.2 Latitude
Figure 15 and Figure 16 show the effect of latitude on the Sun Bucket performance on June 21 2015 and March 21
2015. The location was on the prime meridian (0 degrees longitude), with moderately sunny conditions (0.5 fraction
direct solar radiation), minimal wind (0.1 m/s) and at 0 degrees Celsius, and the elevation was set to 0 meters. At
these conditions, number of stored solar cookers which can be charged at different latitudes was examined. The
Arctic and Antarctic circles are located at 66.5 degrees North of the equator and 66.5 degrees south of the equator
respectively, and the tropic of Cancer and the tropic of Capricorn are located at 23.5 degrees north and 23.5 degrees
south of the equator respectively, and the equator is at 0 degrees latitude. On the summer solstice for the northern
and southern hemisphere, the sun is directly overhead at the tropic of cancer and the tropic of Capricorn,
respectively.
Figure 15 shows that at the Antarctic Circle, where it is currently winter, no stored solar cookers are heated at all. At
the Tropic of Capricorn, where it is currently winter, 2 stored solar cookers are fully charged, and one is partially
charged. At the equator, three solar cookers are fully charged and one is partially charged. At the tropic of cancer,
where the sun is directly overhead, 4 solar cookers are charged. 4 solar cookers are charged at the arctic solar.
Although similar numbers of stored solar cookers are charged at every latitude, the rate at which they charge is
slower at higher latitudes, and fastest at the Tropic of Cancer. The longer days at the Arctic circle allow for more
solar cookers to be charged, even if they charge at a slower rate. On December 21, the number of stored solar
cookers which charge is the opposite, and they charge the fastest at the tropic of Capricorn and slowest at the Arctic
Circle. The stored solar cooker still works very well, unless it is being used very far north and very far south.
Figure 15 Effect of Latitude on Sun Bucket Performance on June 21, 2015

27
In Figure 16, the Arctic and Antarctic circles receive the same amount of sunlight and charge few solar cookers, and
the Tropic of Cancer, Capricorn, and equator all receive high amounts of sunlight and charge a similar number of
solar cookers.
Figure 16 Effect of Latitude on the number of stored solar cookers charged on the Spring Equinox
4.3 Fraction Direct Solar Radiation
Figure 17 shows the effect of direct solar radiation fraction on the number of stored solar cookers charged in
Chicago, Illinois on December 21, 2015. Direct solar radiation fraction has the biggest impact on the number of
stored solar cookers stored. On a sunny day the direct solar radiation fraction can be up to 90% (since even the
sunniest day has about 10% diffuse radiation). On cloudy days, the direct solar radiation can be reduced by 100%
[105].
On December 21, on a clear sunny day, almost four solar cookers are fully charged. With 70% direct solar radiation
almost three are charged. At 30% direct solar radiation, no stored solar cooker is completely charged, but some heat
is stored. On an almost completely cloudy day (10% direct solar radiation), the stored solar cooker is barely heated.

28
Figure 17 Changes in Fraction Direct Solar Radiation
4.4 Windspeed
Wind causes convective heat loss from the cooker while it is charging, reducing the speed of charging. Figure 18
shows the effect of different windspeeds on the number of stored solar cookers charged in Chicago Illinois, on
December 21 with sunny conditions (90% direct fraction), and at 0 degrees Celsius.. In the reanalysis data, the 2 m
high windspeed ranges from 0 m/s to 17 m/s (38 mph). At 0 m/s, almost 3 vessels are fully charged, and a fourth is
almost charged. At 5 m/s, only two vessels are fully charged. Below 9 m/s at this location, one full vessel can still
be charged.. Above 10 m/s, in very windy conditions, it is much more difficult to fully charge a solar cooker.
Figure 18 Effect of windspeed on Stored Solar Cookers Charged
4.5 Ambient Temperature
Low temperatures also cause heat loss from the cooker and slower charging. Figure 19 shows the effect on ambient
temperature on the number of stored solar cookers charged in Chicago Illinois, on December 21, with 90% direct

29
solar radiation, and low wind (0.1 m/s). The reanalysis temperature data ranges from -81 degrees Celsius to 50
degrees Celsius. Even at extremely low temperatures, in sunny conditions there is enough incoming heat, and the
stored solar cooker is well insulated enough, that the low temperatures do not effect the rate of charging much.
Extremely cold conditions in locations with sunlight are unlikely, so ambient temperature has a minimal effect on
the number of stored solar cookers which are charged. At the warmest conditions, 50oC, four full vessels are
charged. At the coldest conditions, -100oC, three full vessels are still charged. This shows there is minimal heat
loss on a sunny day due to the well insulated vessel.
Figure 19 Effect of Ambient Temperature on the number of stored solar cookers charged
4.6 Altitude
Figure 20 shows the effect of altitude on the number of stored solar cookers which can be charged. These
simulations assumed direct solar radiation is at 90% and minimal windspeed (0.1 m/s) At higher altitudes, stored
solar cookers charge at a slightly higher rate; they receive more direct solar radiation because there is less
atmosphere to scatter radiation. The highest city in the world is La Paz, Bolivia, at 3650 meters, so 3000 meters is
used as a reference for elevation. At 3000 meters one more solar cooker can be charged in a day than at 0 meters,
so higher elevations are better for using stored solar cookers.

30
Figure 20 Effect of Altitude on the number of Stored Solar Cookers Charged

31
Chapter 5
USABILITY
A stored solar device with the same characteristics as the Sun Bucket is used to determine the global feasibility of
this kind of cooker. The model is used with environmental conditions given by reanalysis data (Chapter 2) at a
resolution of 2° x 2° (longitude by latitude) to calculate daily useful energy stored. In addition, the available
temperature and recovered energy is compared with other cooking devices to evaluate the cooking potential. The
model can be used with parameters of other types of cookers to evaluate their potential as well. This information
can be used to determine the locations in the world a stored solar cooker would be most useful.
5.1 Available Temperature
Cooking temperature is one requirement for usability of stored energy. The stored solar cooker uses heat conduction
to transfer heat to the pot, just as an electric stove does, so temperatures needed for tasks performed by an electric
stove are summarized in Table 9 [106]
The available temperature in a stored-energy cooker depends on the storage medium, the rate of heat loss, and heat
transfer to the cooking task. From continuous water boil tests, Alonso showed how long the cooker stayed at each
temperature range, as shown in Table 9 [36]. With a melting temperature of 334oC, a stored solar cooker with
potassium nitrate as the thermal storage salt can cook the full range of foods an electric stove can. The cooker does
not maintain the highest temperatures for very long, but lower temperatures are maintained for a long period.
Cooking tasks should be staged with high-temperature activities like frying first, and lower-temperature activities
later; then, a fully charged cooker can be used to cook a variety of food at different temperatures. Although the Sun
Bucket can hold lower temperatures for longer, it is most useful when fully charged, allowing a family to use it for
the full range of cooking needs.
Table 9 Temperature of Electric Stove Burner settings and Cooking Tasks
Burner Setting Temperature
Range (oC)
Task Time from start Sun Bucket
Plate is above minimum
Temperature (minutes)
Low Heat 107-120 Boiling, Simmering,
Poaching
90
Medium/Low Heat 121-161 Slower cooking, leaner
meats, stews
90
Medium Heat 162-189 Simmer or reduction,
cook foods all the way
through
40
Medium/High Heat 190-231 Pan Frying 13
High Heat 232-343 Sauté, Grilling and Pan
Roasting
5

32
5.2 Available Energy in a Given Year
Alonso showed that a stored solar vessel with potassium nitrate salt could store 3.1 MJ of energy. A fully charged
cooker could heat 8 liters of water to 95oC, showing that 2.3 MJ of the stored energy was recovered as useful energy
neglecting any energy lost through evaporation and remaining energy left in the vessel, giving a usage efficiency of
74%. In additional, the vessel produces useful energy for only about 50 minutes of continuous use [36]
The energy efficiency and useful energy recovered are similar to that of a liquified petroleum gas ( LPG) stove.
Reddy estimated the efficiency of recovering energy of an LPG stove to be around 60 percent [107]. Reddy also
estimated that per year per family in India 7.5 GJ of energy are used on LPG stoves but 4.5 GJ of this is useful
energy. Since LPG stoves have similar percentage efficiencies and useful energy, the energy consumption of
families who cook on LPG stoves will be used as a basis for the usability of the stored solar cooker.
Johnson et al., 2013 found that in India, in 7 homes which primarily used LPG stoves as an energy source and had
an average size of 4.1 people per home, 2.3 MJ per standard adult was required to cook one meal, and 8.9 MJ of
energy per standard adult per day of energy was needed. These energy amounts were calculated using kitchen
performance tests (KPT), with daily weights of LPG consumed measured and calculated. Considering the efficiency
of LPG, 1.38 MJ of useful energy per standard adult are required to cook one meal, and 5.3 MJ of useful energy are
required per adult per day [108]. Therefore, a single fully charged cooker of this size has enough energy to cook
more than one standard adult meal per day, but more than two charged vessels are needed to cook for the entire day
for one person. For a family of two to three, four to six charged vessels would be required. One vessel could still be
useful in cooking a small evening meal or heating water.
Using the usage efficiency of 74% for the storage solar cooker and Johnson’s numbers, it is estimated that 7.16 MJ
of stored energy in the solar cooker are needed to cooker for one day, and 1.86 MJ of stored energy are needed to
cook for a single person.
To determine the energy stored per day, the stored solar cooker model was used to calculate the energy and number
of solar storage vessels that can be charged per day, on a single parabolic dish. This assumes that when a vessel is
fully charged, it is removed and replaced by a different vessel. This calculation also assumes that after the vessel is
removed, it is covered and placed in a well-insulated box, so that it does not lose heat until it is used to cook. Figure
21 shows the monthly average daily energy stored in the potassium nitrate salt, in MJ throughout the world, for each
month in 2015. The energy stored in the aluminum vessel would increase the energy stored by 30%.

33
Figure 21 shows that in a single year (2015), there are several locations where the vessel on average stores at least 5.3
MJ of energy per day, which would be enough to cook enough food for one average adult. Not enough energy is
stored to cook for an entire household. A home would require multiple parabolic dishes, and vessels per dish, or
larger parabolic dishes, to store enough energy.
There is a lot of seasonal variation in the amount of stored energy, and as expected, stored energy decreases in
winter. In areas with monsoon seasons, energy storage potential is high in the dry season, and much less during
rainy seasons. Families would be able to rely on stored solar energy during only some seasons.
January February
March April
May June
Figure 21 Monthly average daily energy stored in phase-change salt (MJ) in a stored solar cooker for the year 2015

34
Figure 21 cont.
July August
September
October
November December
5.3 Reliability of the Stored Solar Cooker
Being able to reliably charge at least one vessel per day increases the usability of the stored solar cooker. Weather
conditions that result in not being able to regularly use a solar cooker have been cited as major reasons why solar
cookers are not used [39]–[41], [42] .

35
As discussed in 5.1, having a fully charged vessel, with all of the salt melted, is much more useful for cooking than a
partially or barely heated stored solar cooker. Here, an estimate of reliability is given by how many days in amonth
at least one vessel can be fully charged. Figure 22 shows the number of days per month at least one vessel can be
charged at each 2o longitude by 2o latitude location, using reanalysis data from 2015 (Chapter 2). Locations in
which one solar cooker can be reliably charged per day are the most feasible for stored solar cookers, because the
solar cooker can be used to replace some of the cooking energy needs, perhaps for an evening meal, or heating water
for tea. This would aid in the clean energy adoption and the ability for a household to move up the energy ladder,
since it has been found that households typically accumulate different energy options first, rather than simply
completely adopting the new technology [109]. When at least one vessel can be charged on many days, multiple
vessels and parabolic collectors would benefit a family or organization. If at least one stored solar cooker cannot be
charged on many days, having multiple collectors and storage vessels would not be useful.
Global usability maps using days-per-month as a measure show that at least one vessel can be charged per day in
regions which are dry most of the year and at higher elevation. Usability is seasonal for the stored solar cooker for
the midlatitudes. One vessel can be charged per day in much of the African continent, western part of South
America, India, and middle east, southwestern United States, and Australia, which some monthly variability.
In higher and lower latitudes, during the winter months, there are many days in which at least one stored solar
cooker can be charged. However, the days are shorter and the sun is lower in the sky, and fewer solar cookers can
be charged than during the summer months. A somewhat cloudy day is much more likely to prevent charging a
single solar cooker than during the summer months, with long days and more direct sunlight. Colder conditions do
not prevent charging solar cookers but the low angle and strength of the sunlight reduces the amount of energy
available.

36
January February
March April
May June
Figure 22 Number of days in which at least one stored-solar vessel can be charged year 2015 weather data

37
Figure 22 cont.
July
August
September October
November December
5.4 Long term trends in available energy and monthly usability
Figure 23 shows the average daily energy stored per day using long term averaged reanalysis data. When weather
data are averaged over 19 years, the predicted average daily energy stored in each month is higher than for a single
year, indicating that in 2015, some locations might have had more clouds or rain than usual, or that average weather
data produces different results than using actual weather. Some locations that stored a lot of energy in 2015 have
lower daily energy averaged over 19 years, indicating that 2015 was sunnier in that location and month than usual.

38
January February
March April
May June
Figure 23 Average energy stored in the phase-change salt of a vessel each day

39
Figure 23 cont.
July
August
September October
November December
Using the long-term averaged environmental day, the number of days in a month in each location that at least one,
two or three vessels can be charged was calculated.
Figure 24 shows how many days in a month at least one vessel can be charged, using weather data averaged from
1981 to 2010. When the model uses globally-averaged weather data, most locations can store at least one vessel for
the entire month, with the exception of the areas in the poles and very high and low latitudes. This shows that there
is a lot of potential for using the stored solar cooker. However, looking at specific year is more realistic in

40
determining the actual potential usability of the stored solar cooker, since the long term averages do not show how
many days were completely cloudy or rainy and the stored solar cooker could not be used at all.
January February
March April
May June
Figure 24 Number of days in a month one vessel can be charged, averaged from 1981-2010
41
Figure 24 cont
July
August
September October
November December
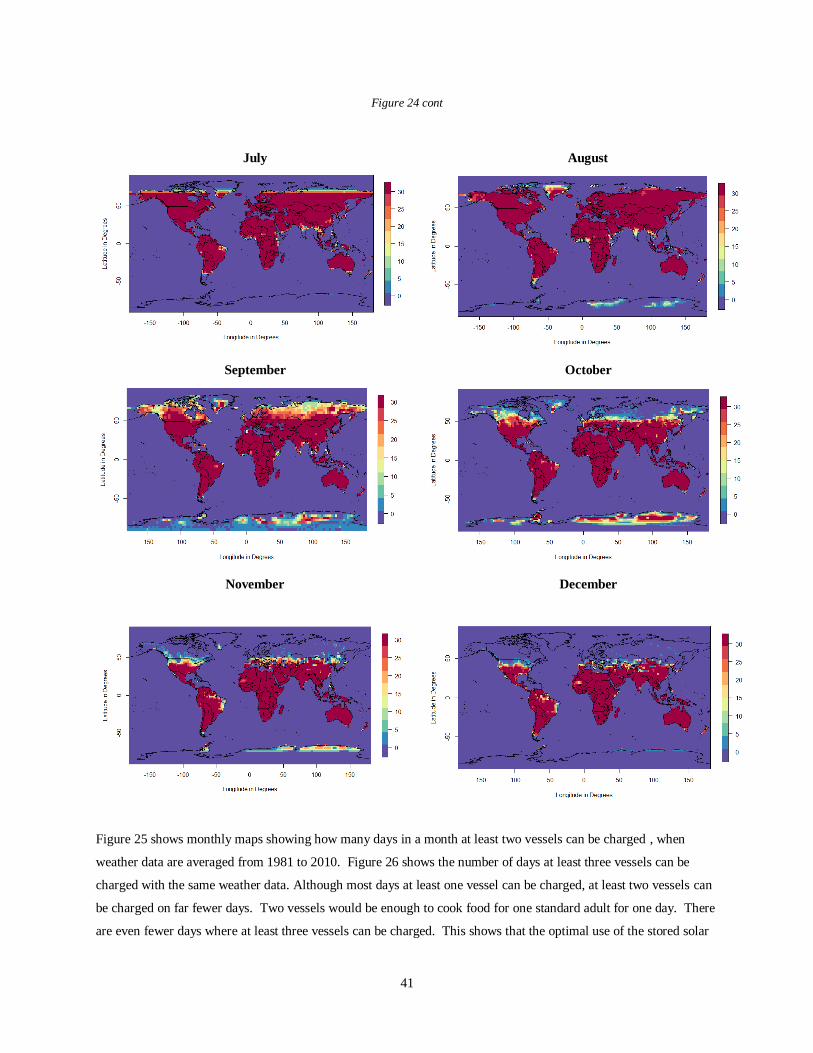
Figure 25 shows monthly maps showing how many days in a month at least two vessels can be charged , when
weather data are averaged from 1981 to 2010. Figure 26 shows the number of days at least three vessels can be
charged with the same weather data. Although most days at least one vessel can be charged, at least two vessels can
be charged on far fewer days. Two vessels would be enough to cook food for one standard adult for one day. There
are even fewer days where at least three vessels can be charged. This shows that the optimal use of the stored solar

42
cooker is to charge for one day, to cook a portion of the day’s food, as a small energy transition, rather than
replacing all of the cooking energy needs at once.
January February
March April
May June
Figure 25 Number of days in a month two vessels can be charged, averaged from 1981-2010

43
Figure 25 cont.
July
August
September October
November December

44
January February
March April
May June
Figure 26 Number of days in a month at least three vessels can be charged, averaged from 1981-2010

45
Figure 26 cont.
July
August
September October
November December

46
Chapter 6
SUMMARY AND RECOMMENDATIONS
6.1 Summary
This study developed an energy balance model and environmental model to evaluate the feasibility of storing solar
energy to provide all or part of cooking needs. Monthly maps were created showing the number of days the stored
solar cooker can be reliably fully charged and used to cook food, and the average daily energy energy which can be
stored in a solar cooker. This model can also be used to evaluate the energy potential and usability of other solar
cookers, since the stored solar cooker uses direct solar radiation, similar to parabolic solar cookers, and is charged
on a solar cooker. Being able to charge at least one solar cooker shows that there is enough incoming energy to
cook a meal in that solar cooker too.
On days with clear weather and lots of sunshine, three to four solar cookers can be fully charged, enough to provide
energy to cook all meals for an average adult. Many locations can reliably charge at least one vessel a day. It is
recommended that the stored solar cooker be used in additional to the traditional energy sources to cook food, rather
than to replace all energy sources.
Having more than one parabolic cooker and more vessels to charge would enable a family to heat more vessels.
However, for many families, owning several parabolic solar cookers and vessels might be cost prohibitive or too
time consuming.
Combining a stored solar cooker such as a Sun Bucket with other solar cookers is another way of maximizing the
potential solar energy used for cooking. Vessels can be charged during the day with the specific purpose of cooking
the evening and morning meal.
6.2 Recommendations for future work
1. The global model can be adjusted for different scenarios and cooker types. It can be applied to both solar
cookers with storage capacity and solar cookers without storage capacity, to determine the reliability of the
solar cooker usage. It is recommended that this model be applied to other commonly used solar cookers to
determine the global feasibility by determining which locations have the most potential to cook food..
2. Specific household cooking energy needs in different regions should be explored, based on cooking habits
and household size, to replace the constant value used here. Regions in which stored solar energy is
promising should be re-evaluated with regionally specific energy needs.
3. The combination of the energy balance model and the environmental model should be validated with field
measurements under different climatic conditions.

47
4. Single year (2015) and multiple year environmental averages were used in the model. It is recommended
that determining the average number of vessels which can be charged over many years be calculated.

48
BIBLIOGRAPHY
[1] P. Nejat, F. Jomehzadeh, M. M. Taheri, M. Gohari, and M. Z. Muhd, “A global review of energy
consumption, CO2 emissions and policy in the residential sector (with an overview of the top ten CO2
emitting countries),” Renewable and Sustainable Energy Reviews, vol. 43. Pergamon, pp. 843–862, 01-Mar-
2015.
[2] M. González-Eguino, “Energy poverty: An overview,” Renewable and Sustainable Energy Reviews, vol. 47.
pp. 377–385, Jul-2015.
[3] OECD/EIA, “Energy Poverty: How to make modern energy access universal?,” Spec. early excerpt World
Energy Outlook, no. September, p. 52, 2010.
[4] B. Ouedraogo, “Household energy preferences for cooking in urban Ouagadougou, Burkina Faso,” Energy
Policy, vol. 34, no. 18, pp. 3787–3795, Dec. 2006.
[5] D. B. Rahut, B. Behera, and A. Ali, “Household energy choice and consumption intensity: Empirical
evidence from Bhutan,” Renewable and Sustainable Energy Reviews, vol. 53. Pergamon, pp. 993–1009, 01-
Jan-2016.
[6] J. Barbieri, F. Riva, and E. Colombo, “Cooking in refugee camps and informal settlements: A review of
available technologies and impacts on the socio-economic and environmental perspective,” Sustain. Energy
Technol. Assessments, vol. 22, pp. 194–207, 2017.
[7] M. Thirugnanasambandam, S. Iniyan, and R. Goic, “A review of solar thermal technologies,” Renew.
Sustain. Energy Rev., vol. 14, no. 1, pp. 312–322, Jan. 2010.
[8] S. Bonjour et al., “Solid fuel use for household cooking: Country and regional estimates for 1980-2010,”
Environ. Health Perspect., vol. 121, no. 7, pp. 784–790, 2013.
[9] A. K. Upadhyay, A. Singh, K. Kumar, and A. Singh, “Impact of indoor air pollution from the use of solid
fuels on the incidence of life threatening respiratory illnesses in children in India Environmental and
occupational health,” BMC Public Health, vol. 15, no. 1, 2015.
[10] T. Siddharthan et al., “Association between household air pollution exposure and chronic obstructive
pulmonary disease outcomes in 13 low- and middle-income country settings,” Am. J. Respir. Crit. Care
Med., vol. 197, no. 5, pp. 611–620, 2018.
[11] E. Gakidou et al., “Global, regional, and national comparative risk assessment of 84 behavioural,
environmental and occupational, and metabolic risks or clusters of risks, 1990-2016: A systematic analysis
for the Global Burden of Disease Study 2016,” Lancet, 2017.
[12] M. A. Desai, S. Mehta, K. R. Smith, and World Health Organization. Protection of the Human

49
Environment., Indoor smoke from solid fuels : assessing the environmental burden of disease at national
and local levels. Protection of the Human Environment, World Health Organization, 2004.
[13] M. Dherani, D. Pope, M. Mascarenhas, K. Smith, M. Weber, and N. Bruce, “Indoor air pollution from
unprocessed solid fuel use and pneumonia risk in children aged under five years: a systematic review and
meta-analysis,” Bull. World Health Organ., vol. 86, no. 5, pp. 390-398C, 2008.
[14] M. del P. Pablo-Romero, R. Pozo-Barajas, and R. Yñiguez, “Global changes in residential energy
consumption,” Energy Policy, vol. 101, pp. 342–352, 2017.
[15] T. V. Ramachandra and B. V. Shruthi, “Spatial mapping of renewable energy potential,” Renewable and
Sustainable Energy Reviews, vol. 11, no. 7. Pergamon, pp. 1460–1480, 01-Sep-2007.
[16] US Energy Information Administration, “Electricity in the United States,” Energy Explained, 2019.
[Online]. Available: https://www.eia.gov/energyexplained/index.php?page=electricity_in_the_united_states.
[Accessed: 17-Jul-2019].
[17] M. A. Muntasser, M. F. Bara, H. A. Quadri, R. El-Tarabelsi, and I. F. La-azebi, “Photovoltaic marketing in
developing countries,” in Applied Energy, 2000, vol. 65, no. 1–4, pp. 67–72.
[18] M. Raisul Islam, K. Sumathy, and S. Ullah Khan, “Solar water heating systems and their market trends,”
Renewable and Sustainable Energy Reviews, vol. 17. pp. 1–25, 2013.
[19] R. M. Muthusivagami, R. Velraj, and R. Sethumadhavan, “Solar cookers with and without thermal
storage—A review,” Renew. Sustain. Energy Rev., vol. 14, no. 2, pp. 691–701, Feb. 2010.
[20] E. Cuce and P. M. Cuce, “A comprehensive review on solar cookers,” Appl. Energy, vol. 102, pp. 1399–
1421, Feb. 2013.
[21] M. S. Al-Soud, E. Abdallah, A. Akayleh, S. Abdallah, and E. S. Hrayshat, “A Parabolic solar cooker with
automatic two axes sun tracking system,” Appl. Energy, vol. 87, no. 2, pp. 463–470, Feb. 2010.
[22] G. Coccia, G. Di Nicola, S. Tomassetti, G. Gabrielli, M. Chieruzzi, and M. Pierantozzi, “Experimental
characterization of a solar cooker with thermal energy storage based on solar salt,” in Journal of Physics:
Conference Series, 2017, vol. 923, no. 1, p. 012048.
[23] N. Akhtar and S. C. Mullick, “Approximate method for computation of glass cover temperature and top
heat-loss coefficient of solar collectors with single glazing,” Sol. Energy, 1999.
[24] J. Nayak, S. S. Sahoo, R. K. Swain, and A. Mishra, “Heat loss modelling and analsyis of solar cooker cavity:
An analytical approach,” in 2016 International Conference on Electrical, Electronics, and Optimization
Techniques (ICEEOT), 2016, pp. 454–459.
[25] B. Zalba, J. M. Marın, L. F. Cabeza, and H. Mehling, “Review on thermal energy storage with phase

50
change: materials, heat transfer analysis and applications,” Appl. Therm. Eng., vol. 23, no. 3, pp. 251–283,
Feb. 2003.
[26] E. H. Amer, “Theoretical and experimental assessment of a double exposure solar cooker,” Energy Convers.
Manag., vol. 44, no. 16, pp. 2651–2663, Sep. 2003.
[27] A. M. Abdel Dayem, “Design, construction and field test of hot -box solar cookers for African Sahel
region,” Renew. Energy, vol. 14, no. 1–4, pp. 49–54, May 1998.
[28] S. M. A. Ibrahim and M. K. El-Reidy, “The performance of a solar cooker in Egypt,” Renew. Energy, vol. 6,
no. 8, pp. 1041–1050, Nov. 1995.
[29] M. Kenisarin and K. Mahkamov, “Solar energy storage using phase change materials,” Renewable and
Sustainable Energy Reviews, vol. 11, no. 9. Pergamon, pp. 1913–1965, 01-Dec-2007.
[30] S. D. Sharma, D. Buddhi, R. L. Sawhney, and A. Sharma, “Design, development and performance
evaluation of a latent heat storage unit for evening cooking in a solar cooker,” Energy Convers. Manag., vol.
41, no. 14, pp. 1497–1508, Sep. 2000.
[31] K. Schwarzer and M. E. Vieira da Silva, “Solar cooking system with or without heat storage for families and
institutions,” Sol. Energy, vol. 75, no. 1, pp. 35–41, Jul. 2003.
[32] K. Schwarzer and M. E. V da Silva, “Characterisation and design methods of solar cookers,” Sol. Energy,
vol. 82, no. 2, pp. 157–163, 2008.
[33] N. M. Nahar, “Performance and testing of a hot box storage solar cooker,” Energy Convers. Manag., vol. 44,
no. 8, pp. 1323–1331, May 2003.
[34] A. Lecuona, J.-I. Nogueira, R. Ventas, M.-C. Rodríguez-Hidalgo, and M. Legrand, “Solar cooker of the
portable parabolic type incorporating heat storage based on PCM,” Appl. Energy, vol. 111, pp. 1136–1146,
Nov. 2013.
[35] A. H. Tesfay, M. B. Kahsay, and O. J. Nydal, “Solar Powered Heat Storage for Injera Baking in Ethiopia,”
Energy Procedia, vol. 57, pp. 1603–1612, 2014.
[36] M. P. Alonso, “The Development of a Portable Vessel for the Collection, Storage, and Utilization of Solar
Thermal Energy for Household Use,” University of Illinois Urbana-Champaign, 2018.
[37] E. Biermann, M. Grupp, and R. Palmer, “Solar cooker acceptance in South Africa: Results of a comparative
field-test,” Sol. Energy, vol. 66, no. 6, pp. 401–407, Sep. 1999.
[38] P. P. Otte, “A (new) cultural turn toward solar cooking - Evidence from six case studies across India and
Burkina Faso,” Energy Res. Soc. Sci., vol. 2, pp. 49–58, Jun. 2014.
[39] A. Herez, M. Ramadan, and M. Khaled, “Review on solar cooker systems: Economic and environmental

51
study for different Lebanese scenarios,” Renew. Sustain. Energy Rev., vol. 81, pp. 421–432, Jan. 2018.
[40] P. P. Otte, “Solar cookers in developing countries-What is their key to success?,” Energy Policy, vol. 63, pp.
375–381, Dec. 2013.
[41] P. P. Otte, “Solar cooking in Mozambique—an investigation of end-user׳s needs for the design of solar
cookers,” Energy Policy, vol. 74, pp. 366–375, Nov. 2014.
[42] L. Iessa, Y. A. De Vries, C. E. Swinkels, M. Smits, and C. A. A. Butijn, “What’s cooking? Unverified
assumptions, overlooking of local needs and pro-solution biases in the solar cooking literature,” Energy
Research and Social Science, vol. 28. Elsevier, pp. 98–108, 01-Jun-2017.
[43] L. Nkhonjera, T. Bello-Ochende, G. John, and C. K. King’ondu, “A review of thermal energy storage
designs, heat storage materials and cooking performance of solar cookers with heat storage,” Renewable and
Sustainable Energy Reviews, vol. 75. pp. 157–167, Aug-2017.
[44] D. Buddhi, S. D. Sharma, and A. Sharma, “Thermal performance evaluation of a latent heat storage unit for
late evening cooking in a solar cooker having three reflectors,” Energy Convers. Manag., vol. 44, no. 6, pp.
809–817, Apr. 2003.
[45] A. A. El-Sebaii, A. A. Al-Ghamdi, F. S. Al-Hazmi, and A. S. Faidah, “Thermal performance of a single
basin solar still with PCM as a storage medium,” Appl. Energy, vol. 86, no. 7–8, pp. 1187–1195, 2009.
[46] A. E. Kabeel and M. Abdelgaied, “Improving the performance of solar still by using PCM as a thermal
storage medium under Egyptian conditions,” Desalination, vol. 383, pp. 22–28, 2016.
[47] A. Mawire, M. McPherson, and R. R. J. Van Den Heetkamp, “Simulated energy and exergy analyses of the
charging of an oil-pebble bed thermal energy storage system for a solar cooker,” Sol. Energy Mater. Sol.
Cells, vol. 92, no. 12, pp. 1668–1676, 2008.
[48] G. Kumaresan, V. S. Vigneswaran, S. Esakkimuthu, and R. Velraj, “Performance assessment of a solar
domestic cooking unit integrated with thermal energy storage system,” J. Energy Storage, vol. 6, pp. 70–79,
2016.
[49] U. R. Prasanna and L. Umanand, “Modeling and design of a solar thermal system for hybrid cooking
application,” Appl. Energy, vol. 88, no. 5, pp. 1740–1755, 2011.
[50] The National Renewable Energy Laboratory, “Solar Maps | Geospatial Data Science | NREL,” 2018.
[Online]. Available: https://www.nrel.gov/gis/solar.html. [Accessed: 14-Dec-2018].
[51] World Bank Group, “Global Solar Atlas,” 2018. [Online]. Available: https://globalsolaratlas.info/.
[Accessed: 14-Dec-2018].
[52] R. Perez et al., “A new operational model for satellite-derived irradiances: Description and validation,” Sol.

52
Energy, vol. 73, no. 5, pp. 307–317, 2002.
[53] S. M. Maxwell, Eugene L. Raymond, L. George Wilcox, “A climatological solar radiation model,” in
Proceedings of the 1998 American Solar Energy Society Annual Conference, 1998.
[54] F. R. Martins, E. B. Pereira, S. A. B. Silva, S. L. Abreu, and S. Colle, “Solar energy scenarios in Brazil, Part
one: Resource assessment,” Energy Policy, vol. 36, no. 8, pp. 2853–2864, Aug. 2008.
[55] F. R. Martins, E. B. Pereira, and S. L. Abreu, “Satellite-derived solar resource maps for Brazil under
SWERA project,” Sol. Energy, vol. 81, no. 4, pp. 517–528, Apr. 2007.
[56] C. A. Gueymard and S. M. Wilcox, “Assessment of spatial and temporal variability in the US solar resource
from radiometric measurements and predictions from models using ground-based or satellite data,” Sol.
Energy, vol. 85, no. 5, pp. 1068–1084, May 2011.
[57] S. Wilcox, “2005 National Solar Radiation Database,” 2010.
[58] NASA, “Solar Radiation Network,” AERONET Solar Radiation Network, 2012. [Online]. Available:
https://solrad-net.gsfc.nasa.gov/. [Accessed: 01-Jul-2019].
[59] J. S. Bojanowski, A. Vrieling, and A. K. Skidmore, “A comparison of data sources for creating a long-term
time series of daily gridded solar radiation for Europe,” Sol. Energy, vol. 99, pp. 152–171, Jan. 2014.
[60] B. Thies and J. Bendix, “Satellite based remote sensing of weather and climate: Recent achievements and
future perspectives,” Meteorological Applications, vol. 18, no. 3. John Wiley & Sons, Ltd, pp. 262–295, 01-
Sep-2011.
[61] J. Cristóbal and M. C. Anderson, “Validation of a Meteosat Second Generation solar radiation dataset over
the northeastern Iberian Peninsula,” Hydrol. Earth Syst. Sci., vol. 17, no. 1, pp. 163–175, Jan. 2013.
[62] R. A. Suárez, G. Abal, P. Musé, and R. Siri, “Satellite-derived solar irradiation map for Uruguay,” in Energy
Procedia, 2014, vol. 57, pp. 1237–1246.
[63] S. A. Kalogirou, “Generation of typical meteorological year (TMY-2) for Nicosia, Cyprus,” Renew. Energy,
vol. 28, no. 15, pp. 2317–2334, 2003.
[64] E. Kalnay et al., “The NCEP/NCAR 40-year reanalysis project,” Bull. Am. Meteorol. Soc., vol. 77, no. 3, pp.
437–471, Mar. 1996.
[65] F. Yettou, “RECEIVER TEMPERATURE MAPS OF PARABOLIC COLLECTOR USED FOR SOLAR
FOOD COOKING APPLICATION IN ALGERIA,” J. Therm. Eng., pp. 1656–1667, Dec. 2017.
[66] SoDa Service, “Solar Energy Services for Professionals,” MINES ParisTech, 2018. [Online]. Available:
http://www.soda-pro.com/. [Accessed: 15-Dec-2018].

53
[67] F. Trieb, C. Schillings, M. O’sullivan, T. Pregger, and C. Hoyer-Klick, “Global Potential of Concentrating
Solar Power,” in SolarPaces Conference Berlin, 2009.
[68] F. Yettou, A. Gama, B. Azoui, A. Malek, and N. L. Panwar, “Experimental investigation and thermal
modelling of box and parabolic type solar cookers for temperature mapping,” J. Therm. Anal. Calorim., pp.
1–18, Oct. 2018.
[69] Todd Mitchell, “Elevation data sets in netCDF,” Joint Institute for the Study of the Atmosphere and Ocean,
2014. [Online]. Available: http://research.jisao.washington.edu/data_sets/elevation/. [Accessed: 10-Dec-
2018].
[70] N. J. Lim, “Topographic Data and Roughness Parameterisation.” [Online]. Available:
https://www.ngdc.noaa.gov/mgg/topo. [Accessed: 15-Jul-2019].
[71] J. Twidell, Renewable Energy Resources. Routledge, 2015.
[72] F. Kasten and A. T. Young, “Revised optical air mass tables and approximation formula,” 1989.
[73] A. B. Meinel and M. P. Meinel, Applied solar energy : an introduction. Addison-Wesley Pub. Co, 1976.
[74] E. G. Laue, “The measurement of solar spectral irradiance at different terrestrial elevations,” Sol. Energy,
vol. 13, no. 1, 1970.
[75] National Renewable Energy Laboratory, “Shining On.,” Solar Radiation Resource Information, 2019.
[Online]. Available: https://rredc.nrel.gov/solar/pubs/shining/chap4.html. [Accessed: 01-Jul-2019].
[76] H. C. Kim and E. E. Hofmann, “Evaluation and derivation of cloud-cover algorithms for calculation of
surface irradiance in sub-Antarctic and Antarctic environments,” Antarct. Sci., 2005.
[77] L. Luo, D. Hamilton, and B. Han, “Estimation of total cloud cover from solar radiation observations at Lake
Rotorua, New Zealand,” Sol. Energy, vol. 84, no. 3, pp. 501–506, 2010.
[78] S. Rangarajan, M. S. Swaminathan, and A. Mani, “Computation of solar radiation from observations of
cloud cover,” Sol. Energy, vol. 32, no. 4, pp. 553–556, Jan. 1984.
[79] M. N. I. Sarkar, “Estimation of solar radiation from cloud cover data of Bangladesh,” Renewables Wind.
Water, Sol., vol. 3, no. 1, p. 11, Dec. 2016.
[80] A. Z. Hafez, A. Soliman, K. A. El-Metwally, and I. M. Ismail, “Design analysis factors and specifications of
solar dish technologies for different systems and applications,” Renewable and Sustainable Energy Reviews.
2017.
[81] a R. El Ouederni, M. Ben Salah, F. Askri, M. Ben Nasrallah, and F. Aloui, “Experimental study of a
parabolic solar concentrator,” Rev. des Energies Renouvelables, vol. 12, pp. 395–404, 2009.

54
[82] Y. Rafeeu and M. Z. A. Ab Kadir, “Thermal performance of parabolic concentrators under Malaysian
environment: A case study,” Renewable and Sustainable Energy Reviews, vol. 16, no. 6. pp. 3826–3835,
2012.
[83] S. Kumar, T. C. Kandpal, and S. C. Mullick, “Experimental test procedures for determination of the optical
effeciency factor of a parabolloid concentrator solar cooker,” Renew. Energy, vol. 7, no. 2, pp. 145–151,
1996.
[84] M. Eccher, S. Turrini, A. Salemi, M. Bettonte, A. Miotello, and R. S. Brusa, “Construction method and
optical characterization of parabolic solar modules for concentration systems,” Sol. Energy, vol. 94, pp. 19–
27, 2013.
[85] N. D. Kaushika and K. S. Reddy, “Performance of a low cost solar paraboloidal dish steam generating
system,” Energy Convers. Manag., vol. 41, no. 7, pp. 713–726, 2000.
[86] S. Kumar, V. B. Sharma, T. C. Kandpal, and S. C. Mullick, “Wind Induced Heat Losses from Outer Cover
of Solar Collectors,” 1997.
[87] S. Kumar and S. C. Mullick, “Wind heat transfer coefficient in solar collectors in outdoor conditions,” Sol.
Energy, vol. 84, pp. 956–963, 2010.
[88] F. L. Test, R. C. Lessmann, and A. Johary, “Heat transfer during wind flow ower rectangular bodies in the
natural environment,” J. Heat Transfer, vol. 103, no. 2, pp. 262–267, 1981.
[89] J. H. Watmuff, W. W. S. Charters, and D. Proctor, “Solar and wind induced external coefficients - Solar
collectors,” Coop. Mediterr. pour l’Energie Solaire, Rev. Int. d’Heliotechnique, 2nd Quarter, 1977, p. 56.,
p. 56, 1977.
[90] W. H. McAdams, Heat transmission. New York : McGraw-Hill, 1954.
[91] S. Kumar, V. B. Sharma, T. C. Kandpal, and S. C. Mullick, “Wind Induced Heat Losses from Outer Cover
of Solar Collectors,” 1997.
[92] S. Kumar, V. B. Sharma, T. C. Kandpal, and S. C. Mullick, “Wind induced heat losses from outer cover of
solar collectors,” Renew. Energy, vol. 10, no. 4, pp. 613–616, 1997.
[93] S. Sharples and P. S. Charlesworth, “FULL-SCALE MEASUREMENTS OF WIND-INDUCED
CONVECTIVE HEAT TRANSFER FROM A ROOF-MOUNTED FLAT PLATE SOLAR COLLECTOR,”
Sol. Energy, vol. 62, no. 2, pp. 69–77, 1998.
[94] A. Shitzer, “Wind-chill-equivalent temperatures: regarding the impact due to the variability of the
environmental convective heat transfer coefficient,” Int J Biometeorol, vol. 50, pp. 224–232, 2006.
[95] P. A. Siple and C. F. Passel, “Measurements of Dry Atmospheric Cooling in Subfreezing Temperatures,”
55
1945.
[96] S. C. Mullick, S. Kumar, and B. K. Chourasia, “WIND INDUCED HEAT TRANSFER COEFFICIENT
FROM FLAT HORIZONTAL SURFACES EXPOSED TO SOLAR RADIATION,” 2007.
[97] Sun Buckets, “Sun Buckets,” 2019. [Online]. Available: https://www.sunbuckets.com/. [Accessed: 01-Jul-
2019].
[98] Solar Cookers International, “Solar Cooking Wiki,” 2019. [Online]. Available:
https://solarcooking.fandom.com/wiki/Solar_Cooking_Wiki_(Home). [Accessed: 01-Jul-2019].
[99] Cameo Chemicals, “Potassium Nitrate,” Cameo Chemicals, 2019. [Online]. Available:
https://cameochemicals.noaa.gov/chemical/1370. [Accessed: 01-Jul-2019].
[100] Aspen Aerogels, “High-Performance Aerogel Insulation for Industrial and Commercial Applications,” 2017.
[101] J. G. Cordaro, A. M. Kruizenga, R. Altmaier, M. Sampson, and A. Nissen, “Thermodynamic properties of
molten nitrate salts,” in Granada (Spain): SolarPACES, 2011, vol. 1, no. 925, p. 2011.
[102] Solar Cooker at Cantina West, “Solar Ovens Comparison Page,” Solar Cooker at Cantina West, 2019.
[Online]. Available: http://www.solarcooker-at-cantinawest.com/solar_oven_comparisons.html. [Accessed:
01-Jul-2019].
[103] SOLEC-Solar Energy Corporation, “SOLKOTE HI/SORB-II Selective Solar Coating,” 2011.
[104] Apogee Instruments, “MP-200: Pyranometer Separate Sensor with Handheld Meter,” Apogee Instruments,
2019. [Online]. Available: https://www.apogeeinstruments.com/mp-200-pyranometer-separate-sensor-with-
handheld-meter/#manuals-downloads-tab-description.
[105] Office of Energy Efficiency and Renewable Energy, “Solar radiation basics,” Office of Energy Efficiency
and Renewable Energy, 2018. [Online]. Available: ttps://www.energy.gov/eere/solar/articles/solar-radiation-
basics. [Accessed: 01-Jul-2019].
[106] Smart Kitchen, “Easy Heat Chart,” Smart Kitchen, 2019. [Online]. Available:
https://www.smartkitchen.com/resources/cooking-appendices/reference-materials/heat-temperature-
charts/easy-heat-chart. [Accessed: 01-Jul-2019].
[107] B. S. Reddy, “Overcoming the energy efficiency gap in India’s household sector,” Energy Policy, vol. 31,
no. 11, pp. 1117–1127, 2003.
[108] M. A. Johnson et al., “Impacts on household fuel consumption from biomass stove programs in India,
Nepal, and Peru,” Energy Sustain. Dev., vol. 17, no. 5, pp. 403–411, 2013.
[109] O. R. Masera, B. D. Saatkamp, and D. M. Kammen, “From linear fuel switching to multiple cooking
strategies: A critique and alternative to the energy ladder model,” World Dev., vol. 28, no. 12, pp. 2083–

56
2103, 2000.
[110] S. Kumar and S. C. Mullick, “Wind heat transfer coefficient in solar collectors in outdoor conditions,” Sol.
Energy, vol. 84, no. 6, pp. 956–963, 2010.
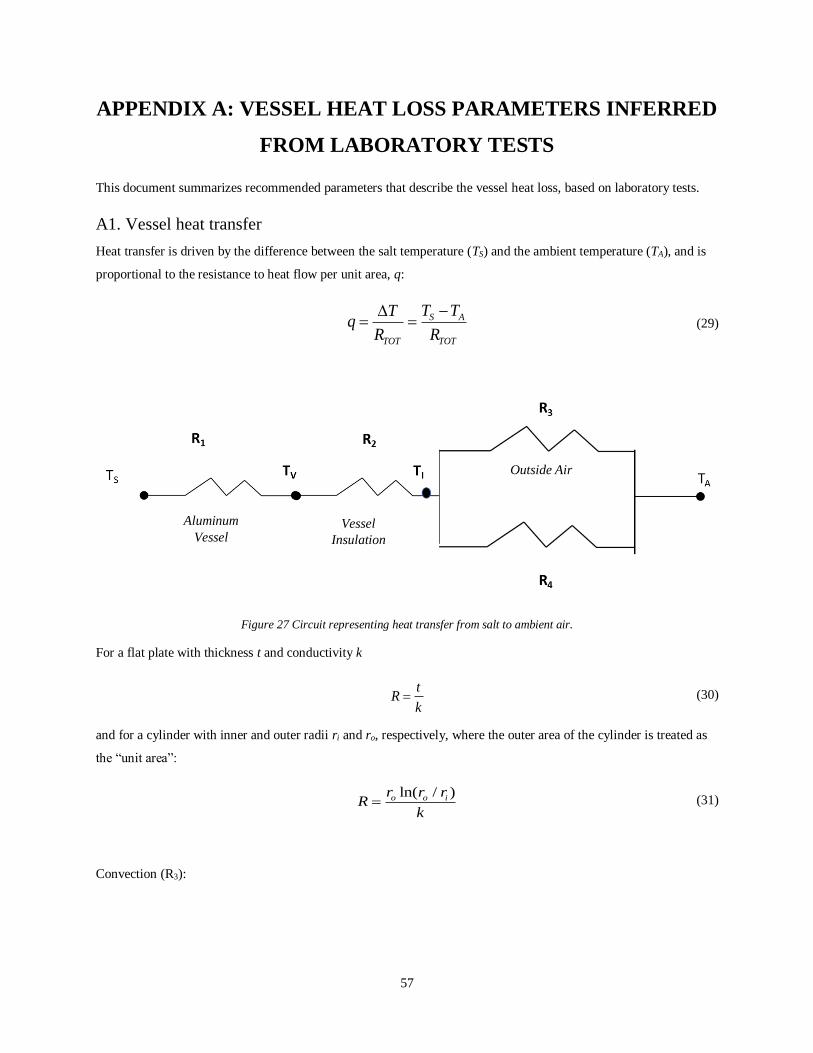
57
APPENDIX A: VESSEL HEAT LOSS PARAMETERS INFERRED
FROM LABORATORY TESTS
This document summarizes recommended parameters that describe the vessel heat loss, based on laboratory tests.
A1. Vessel heat transfer
Heat transfer is driven by the difference between the salt temperature (TS) and the ambient temperature (TA), and is
proportional to the resistance to heat flow per unit area, q:
S A
TOT TOT
T TTq
R R
−= = (29)
Figure 27 Circuit representing heat transfer from salt to ambient air.
For a flat plate with thickness t and conductivity k
t
Rk
= (30)
and for a cylinder with inner and outer radii ri and ro, respectively, where the outer area of the cylinder is treated as
the “unit area”:
ln( / )o o ir r r
Rk
= (31)
Convection (R3):
Vessel
Insulation
Aluminum
Vessel
Outside Air

58
1
Rh
= (32)
Radiative heat transfer (R4) is linearized to become:
2 2
1
( )( )S A S A
RT T T T
=+ +
(33)
The combined resistance is:
1
1 2
3 4
1 1TOTR R R
R R
−
= + + +
(34)
Table 10 shows the product of each resistance and area with a salt temperature of 600 K and the characteristics of
the insulation used in the laboratory tests. Three conditions are shown: an insulated flat plate, a flat plate without
insulation, and a cylinder with insulation. The temperatures resulting from each configuration are also shown in the
table. As expected, the resistance of the aluminum vessel (R1) is negligible under all conditions and it will be
ignored in the following equations. When insulation is present, it dominates resistance; R2 is an order of magnitude
greater than any other resistance. Radiation is not negligible relative to convection, particularly when the vessel is
uninsulated.
Table 10 Resistances and temperatures for steady-state heat transfer at TS=600 K, TA = 298 K.
Flat plate Cylinder Flat plate
Note insulated Fully ins. No ins.
Resistance (K m2/W)
R1 Vessel conduction a 7.71E-06 7.77E-06 7.71E-06
R2 Insulation conduction a 1.25 1.52 0
R3 Convection a 0.145 0.145 0.145
R4 Radiation 0.73 0.75 0.22
(R3||R4) Conv+Rad 0.121 0.122 0.087
RTOT [1-2-(3||4)] 1.37 1.64 0.08

59
Table 10 cont.
Temperatures (K)
vessel Ts 600 600 600
interface Ti 600 600 600
surface Ts 322 322 600
ambient b Ta 298 298 298
a Calculated UA uses initial assumptions for conduction and convection coefficients.
b Assumed value used for demonstration
Resistance of the insulation is temperature-dependent, so total resistance of the vessel varies as the salt changes
temperature, and the values in Table 10 are illustrative only.
Total heat transfer, Q, occurs through three surfaces in parallel: the top plate, which may be insulated or uninsulated;
the bottom plate, which is always insulated; and the cylinder, which is always insulated.
, , ,
( )top cylbot
S A
TOT tflat TOT bflat TOT icyl
A AAQ T T
R R R
= + + −
(35)
The sum of terms in the first bracket is typically written as a sum of conductances for all surfaces, UA. This sum will
be called UAall for simplicity in derivation.
( ) ( )all S A surf surf S A
surf
Q UA T T U A T T
= − = − (36)
Table 11 Overall conductancea and UA for each vessel surface with no wind speed.
Area Top insulated Top uninsulated
(m2) 325 C 200 C 25 C 325 C 200 C 25 C
Top plate 0.0324 0.730 0.543 0.360 12.50 10.31 8.40
Cylinder 0.0973 0.606 0.452 0.299 0.606 0.452 0.299
Bot plate 0.0324 0.730 0.543 0.360 0.730 0.543 0.360
Sum of UA
(W/K) 0.1621 0.106 0.079 0.052 0.488 0.396 0.313
a Calculated UA uses initial assumptions for conduction and convection coefficients.

60
A2. Heat balance during cooling and solidifying
We assume that the salt in the vessel is well mixed. We also assume that the heat stored in the salt is much greater
than the heat stored in the vessel or the insulation. The energy contained in the vessel (Ev) relative to ambient
temperature is:
( ), ,( ) ( ' )v m p l S m m f p s S aE m f C T T f h C T T= − + + − (37)
where m is the mass of the salt, fm is the fraction of the salt melted, Cp,l and Cp,s are the heat capacities of the liquid
and solid salt, respectively; and hf is the heat of fusion. Tm is the melting temperature, and Ts' is a modified salt
temperature which is equal to Tm if the temperature is higher than melting temperature, and Ts otherwise.
The energy balance for the vessel is
( )vin all S A
dEE UA T T
dt= − − (38)
When there is no energy input (Ein=0), the vessel cools and UAall is the only determinant of temperature change.
Below melting temperature, fm = 0 and
,
( )v S Ap s
dE d T TmC
dt dt
−= (39)
Setting this equal to Equation (12xx) and solving the differential equation,
0
,
ln( ) ln( ) allS A S A
p s
UA tT T T T
mC
−− − − = (40)
for TS<Tm
The slope of a regression of ln(TS-TA) versus time would give the effective value of
(-UAall / m Cp,s)
Above melting temperature, fm = 1 and
,
( )v S mp l
dE d T TmC
dt dt
−= (41)
The derivative may also be written d(Ts-Ta)/dt since the second temperature is constant, so likewise
0
,
ln( ) ln( ) allS A S A
p l
UA tT T T T
mC
−− − − = (42)
for TS>Tm

61
At melting temperature, (Ts-Tm) is zero, the third term in Equation 11xx is constant, and
v mf
dE dfmh
dt dt= (43)
During the length of time required to solidify ( tmelt), fm goes from 1 to 0, temperatures remain constant, and
1
( )f all m Amh UA T Tt
−= − −
(44)
An apparent value of UAall can be derived from an observation of the solidifying time:
( )
f
all
melt m A
mhUA
t T T= −
(45)
A3. Comparison of experimental and theoretical resistance
As described in the previous section, values of UAall can be inferred from experiments in which the vessel was
heated to temperatures near or above melting, and then allowed to cool. In this section, experimental values are
compared with values of UAall calculated from vessel components. Experiments where the vessel temperature is
cooling are most reliable for inferring UAall, compared to tests where the salt is solidifying at constant temperature.
The latter type of inference relies on detecting the beginning and end of melting and does not account for partial
melting within the vessel.
Measured salt temperatures often showed a plateau at 100° C rather than a decay passing directly through this
temperature. A small amount of heat may have been stored in water associated with the salt.
During Test E, temperatures were measured in a fully insulated vessel over 16 hours. Table SX4 summarizes
inferred and predicted values of UAall. UAall inferred from measurements is 2.5 times greater than predicted at
temperatures above melting, 1.9 times greater than the prediction at melting, and about 70% greater than predicted
for temperatures below the melting point.
In this situation, heat loss is governed by the greatest resistance: conduction through the insulation. None of the
other resistance components could change UAall by more than 5%. The idealized resistance model did not consider
conduction through corners, which could add losses.

62
Table 12 Inferred and calculated UA for fully insulated heat storage vessel (Test E).
Condition
Tcouple
Salt T (K)
Inferred UAalla
(W/K)
Calculated UAall b
(W/K)
Melted, cooling top, T1 600-630 0.28 0.111
Solidifying top, T1 605 0.21 0.108
Solid, cooling top, T1 473-573 0.15 0.089
Solid, cooling top, T1 373-473 0.12 0.071
a From temperature measurements, interpreted with Equation XX or XX.
b From vessel components; resistance of insulation calculated at average salt temperature
Higher conduction than predicted at melting temperature reduces how long the vessel can store heat when it is
charged. Higher conduction than predicted below melting temperature could reduce the time of utility when the
cooking surface is open, although the uninsulated cooking surface is the dominant heat loss under those conditions.
To ensure that this additional loss is modeled in assessing usability, we recommend reducing the estimated pyrogel
resistance by a conservative factor of 2.5 at or above melting temperature, and by a factor of 1.7 below melting
temperature.
When one surface is uninsulated, most of the heat flows through that surface, and convection and radiation are the
dominant heat losses. Table 13 summarizes values of UAall inferred from experiments and calculated from vessel
components. The table also shows the percentage of heat loss estimated to flow through the uninsulated surface.
Because salt temperatures and ambient conditions were not very different, calculated values of UAall are quite
similar among tests. The average value of UAall inferred from three experiments is 0.60 W/K, about 32% higher than
the average calculated value of 0.45 W/K. The minimum and maximum values of inferred UAall vary by about 50%
of the average value.
Most of the heat was lost from the uninsulated surface, according to heat loss calculations (last column in the table),
so errors in representing the insulation likely do not explain the large variability. Inferred UAall values vary by about
10% depending on the thermocouple used to infer loss rates, as shown by comparing the two results from Test A.
Convective and radiative losses from the uninsulated surface are about the same order of magnitude. An error in
estimating vessel emissivity would create a constant bias under all conditions, and assumptions about surface
temperatures cannot create the magnitude of variability observed here. We conclude that slight differences in
convection cause the variability in UAall. In addition, test configurations were not exactly the same and may have
caused some variability as well.

63
Table 13 Calculated and inferred UAall for stored heat vessel with one uninsulated surface (W/K). All tests were done below melting temperature.
Test
Tcouple
Salt T (K)
Inferred UAall
a
(W/K)
Calculated
UAallb (W/K)
% heat loss
from unins.
C (Sept.) top, plate 400-580 0.40 0.45 77%
C (Sept.) top, plate 310-370 0.34 0.36 79%
D (no wind) top, side 390-560 0.60 0.44 77%
a From temperature measurements, interpreted with Equation XX.
b From vessel components; resistance of insulation calculated at average salt temperature. Calculated UA assumes
the increased pyrogel conductivity recommended in the previous section, and initial assumptions for convection.
We conclude that the average inferred UAall value of about 0.60 W/K is reasonable and close to calculated values for
no-wind conditions. Further discussion of the difference between measured and calculated UA, including this no-
wind condition, appears in the next section.
Three tests investigated the effect of wind speed on heat loss with an uninsulated surface. Moving air at constant
velocity was directed across the uninsulated cooking surface. Table 14 gives values of inferred UAall. Total heat loss
from the insulated surfaces and radiative heat loss from the uninsulated surface proceed in parallel to convective
heat loss from the uninsulated surface; these UA values were subtracted from the inferred UAall value to give an
estimate of convective UA and an inferred value of the convection coefficient, h. Supporting values for this
calculation are listed in Table 14. Values of inferred h versus wind speed are plotted in Figure 28 , along with of the
relationship given by Kumar and Mullick [110]. The convection coefficient from the latter study was used in the
original calculations of UAall.
The inferred value of convection coefficient is about 40% higher than that of Kumar and Mullick without wind and
about 90% greater than the other study with wind. An approximately linear relationship with wind speed is
confirmed. The cooking surface is not an infinite flat plate and some differences from an ideal plate could be
expected. Other relationships between flat-plate convection and wind speed have been published, showing some
variability; the relationship given here lies within this uncertainty.

64
Table 14 Inferred UA and convection coefficient for stored heat vessel with one uninsulated surface (W/K).
wind speed
(m/s)
Inferred UA
(W/K)
UA ins. surf a
(W/K)
UA unins.
rad b (W/K)
inferred
convective UA c
(W/K)
inferred h
(W/m2 K)
0 0.600 0.103 0.116 0.38 11.8
1.69 1.145 0.102 0.114 0.93 28.7
2.66 1.344 0.106 0.121 1.12 34.5
a UA for one flat surface and cylindrical surfaces calculated from vessel components; resistance of insulation
calculated at average salt temperature. Assumes the increased pyrogel conductivity recommended in the previous
sections.
b UA for uninsulated flat surface.
Figure 28 Plot of Inferred Convective Heat Transfer Coefficient
y = 8.6967x + 12.352
0.0
5.0
10.0
15.0
20.0
25.0
30.0
35.0
40.0
0 1 2 3
con
vect
ion
co
effi
cien
t (W
/K m
2)
wind speed (m/s)
inferred (this work)
Kumar and Mullick 2010

65
where h is the convection coefficient in W/m2 K, and w is wind speed in m/s. This relationship is consistent with the
variability within a large number of published studies and has been derived under the exact physical configuration
needed to model a stored solar vessel.
The previous section reported variations in UAall between 0.34 and 0.87 for a vessel with one uninsulated surface in
apparently still air. Varying wind speed cannot explain the lower value, but a wind speed of about 0.8 m/s could
account for the higher heat loss rate. Conservative estimates of heat loss would assume a slight wind speed; this
assumption would account for heat loss due to turbulent eddies.
Adjusting this convection coefficient has a small effect on the previous analysis of pyrogel conductivity, because
convection was only a small fraction of the heat loss for the fully insulated vessel.