MicroRNA Profiles Discriminate among Colon Cancer Metastasis
Upload
independentCategory
view
1download
0
Chromosomal Breakpoints in Primary Colon Cancer Cluster
at Sites of Structural Variants in the Genome
Jordi Camps,1Marian Grade,
1,3Quang Tri Nguyen,
1Patrick Hormann,
1Sandra Becker,
1
Amanda B. Hummon,1Virginia Rodriguez,
2Settara Chandrasekharappa,
2Yidong Chen,
1
Michael J. Difilippantonio,1Heinz Becker,
3B. Michael Ghadimi,
3and Thomas Ried
1
1Genetics Branch, Center for Cancer Research, National Cancer Institute/NIH; 2Genome Technology Branch, National HumanGenome Research Institute/NIH, Bethesda, Maryland; and 3Department of General and Visceral Surgery, University MedicineGottingen, Gottingen, Germany
Abstract
Genomic aberrations on chromosome 8 are common in coloncancer, and are associated with lymph node and distantmetastases as well as with disease susceptibility. Thisprompted us to generate a high-resolution map of genomicimbalances of chromosome 8 in 51 primary colon carcinomasusing a custom-designed genomic array consisting of a tilingpath of BAC clones. This analysis confirmed the dominant roleof this chromosome. Unexpectedly, the position of the break-points suggested colocalization with structural variants in thehuman genome. In order to map these sites with increasedresolution and to extend the analysis to the entire genome,we analyzed a subset of these tumors (n = 32) by comparativegenomic hybridization on a 185K oligonucleotide arrayplatform. Our comprehensive map of the colon cancer genomeconfirmed recurrent and specific low-level copy numberchanges of chromosomes 7, 8, 13, 18, and 20, and unveiledadditional, novel sites of genomic imbalances includingamplification of a histone gene cluster on chromosome6p21.1-21.33 and deletions on chromosome 4q34-35. Thesystematic comparison of segments of copy number changewith gene expression profiles showed that genomic imbal-ances directly affect average expression levels. Strikingly, weobserved a significant association of chromosomal break-points with structural variants in the human genome: 41% ofall copy number changes occurred at sites of such copynumber variants (P < 2.2e�16). Such an association has notbeen previously described and reveals a yet underappreciatedplasticity of the colon cancer genome; it also points topotential mechanisms for the induction of chromosomalbreakage in cancer cells. [Cancer Res 2008;68(5):1284–95]
Introduction
Colorectal cancer is the second leading cause of cancer deathin Europe and in the United States, with f300,000 new casesand 200,000 deaths each year (1). Cytogenetic and molecularcytogenetic studies clearly established that the colorectal cancergenome is defined by a specific distribution of genomic imbalances,most prominently, gains of chromosomes and chromosome arms 7,
8q, 13, and 20q as well as losses of chromosomes 4q, 8p, 17p,and 18q (2).
Within the last decade, microarray technology has beenextensively applied to survey the cellular transcriptome of commonsolid tumors, including colorectal cancer, and for colon cancers,gene expression signatures were subsequently correlated withclinical outcome ( for reviews, see refs. 3–5). However, high-resolution mapping of chromosomal copy number changes hasonly recently been achieved using BAC or cDNA clone-based arrays(6–10).
Chromosome 8q is one of the most frequently gainedchromosomal arms in colorectal cancers (2), and it isconceivable that it contains more oncogenes than just theMYC oncogene, which maps to chromosome band 8q24.21. Apotential role of chromosome 8q for the development of lymphnode metastases has been previously reported (11), andoverexpression of a gene, PRL-3 , that maps to chromosome8q24.3 has been implied in the development of liver metastases(12). Moreover, the 8q24 locus contains single nucleotidepolymorphisms that are associated with an increased risk forthe development of colon cancer (13–15).
Recently, a new class of genetic variation among humans hasbecome recognized as a major source of genetic diversity. Termedstructural variations, these polymorphisms can present themselvesas copy number variants (CNV) and segmental duplications,which could be CNVs, but are not necessarily so (16–19). Thesepolymorphisms could induce chromosomal rearrangements (20).One of our previous analyses of chromosomal aberrations in celllines established from different carcinomas indicated that genomiccopy number changes could be triggered by jumping trans-locations, many of which originated in the pericentromericheterochromatin of several chromosomes (21). These regionsfrequently contain segmental duplications and other structuralvariants of the genome (22). Taken together, these data enticed usto systematically explore the genomic aberration profile and thepotential involvement of structural variants of the human genomein the genesis of chromosomal aberrations in this common cancer.We therefore established a high-resolution map of genomic copynumber changes in 51 primary colon carcinomas using compar-ative genomic hybridization (CGH) on both a BAC-based genomictiling array for chromosome 8 and, for a subset of those, using a185K oligonucleotide platform for whole genome coverage.
Materials and Methods
Patients and Sample CollectionThe 51 patients included in this study were diagnosed with primary
adenocarcinomas of the colon, and treated at the Department of General
Note: Supplementary data for this article are available at Cancer Research Online(http://cancerres.aacrjournals.org/).Requests for reprints: Thomas Ried, Genetics Branch, Center for Cancer
Research, National Cancer Institute/NIH, Building 50, Room 1408, 50 South Drive,Bethesda, MD 20892. Phone: 301-594-3118; Fax: 301-435-4428; E-mail: [email protected].
I2008 American Association for Cancer Research.doi:10.1158/0008-5472.CAN-07-2864
Cancer Res 2008; 68: (5). March 1, 2008 1284 www.aacrjournals.org
Research Article
Research. on December 27, 2015. © 2008 American Association for Cancercancerres.aacrjournals.org Downloaded from
Surgery, University Medicine Gottingen, Gottingen, Germany. All patientsreceived standardized surgery and histopathologic workup, and tumor
staging was based on WHO criteria (23). Twenty-five tumors were associated
with lymph node metastases [International Union Against Cancer (UICC)-
III], whereas 26 tumors were not (UICC-II). Tumor samples were obtained
immediately after surgery and stored on ice for inspection by an experiencedpathologist. Consistent with standard procedures, only samples with a
tumor cell content of at least 70% were included in this study. Biopsies of
normal adjacent mucosa were collected from some patients when possible.
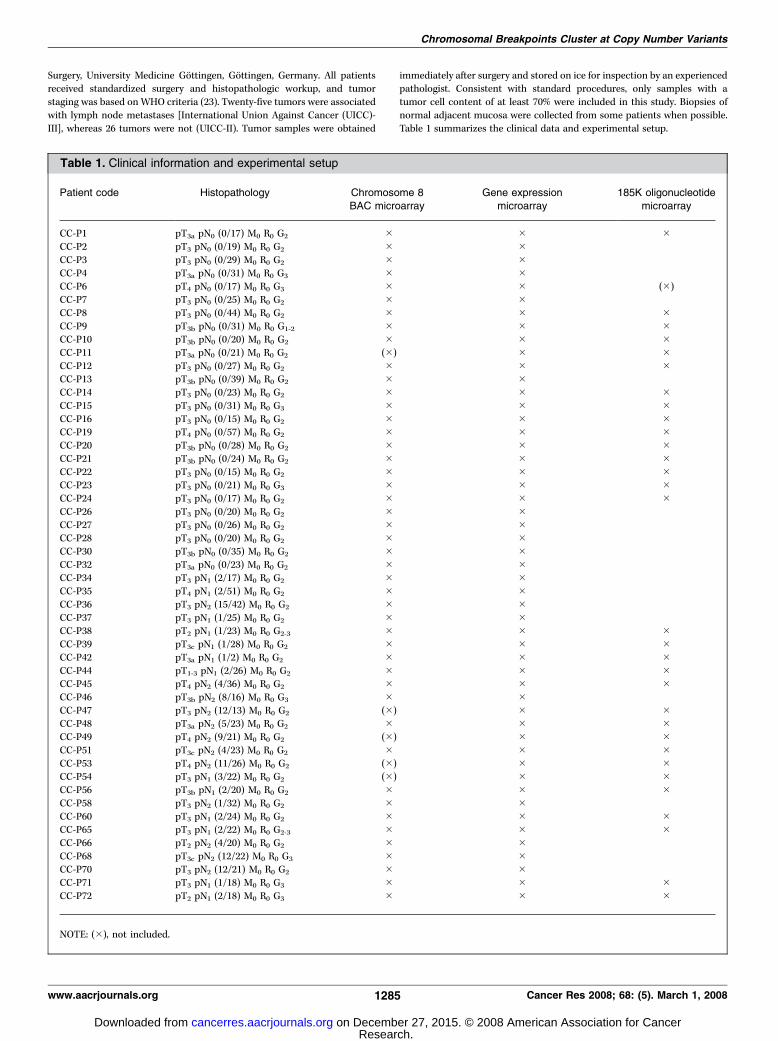
Table 1 summarizes the clinical data and experimental setup.
Table 1. Clinical information and experimental setup
Patient code Histopathology Chromosome 8
BAC microarray
Gene expression
microarray
185K oligonucleotide
microarray
CC-P1 pT3a pN0 (0/17) M0 R0 G2 � � �CC-P2 pT3 pN0 (0/19) M0 R0 G2 � �CC-P3 pT3 pN0 (0/29) M0 R0 G2 � �CC-P4 pT3a pN0 (0/31) M0 R0 G3 � �CC-P6 pT4 pN0 (0/17) M0 R0 G3 � � (�)
CC-P7 pT3 pN0 (0/25) M0 R0 G2 � �CC-P8 pT3 pN0 (0/44) M0 R0 G2 � � �CC-P9 pT3b pN0 (0/31) M0 R0 G1-2 � � �CC-P10 pT3b pN0 (0/20) M0 R0 G2 � � �CC-P11 pT3a pN0 (0/21) M0 R0 G2 (�) � �CC-P12 pT3 pN0 (0/27) M0 R0 G2 � � �CC-P13 pT3b pN0 (0/39) M0 R0 G2 � �CC-P14 pT3 pN0 (0/23) M0 R0 G2 � � �CC-P15 pT3 pN0 (0/31) M0 R0 G3 � � �CC-P16 pT3 pN0 (0/15) M0 R0 G2 � � �CC-P19 pT4 pN0 (0/57) M0 R0 G2 � � �CC-P20 pT3b pN0 (0/28) M0 R0 G2 � � �CC-P21 pT3b pN0 (0/24) M0 R0 G2 � � �CC-P22 pT3 pN0 (0/15) M0 R0 G2 � � �CC-P23 pT3 pN0 (0/21) M0 R0 G3 � � �CC-P24 pT3 pN0 (0/17) M0 R0 G2 � � �CC-P26 pT3 pN0 (0/20) M0 R0 G2 � �CC-P27 pT3 pN0 (0/26) M0 R0 G2 � �CC-P28 pT3 pN0 (0/20) M0 R0 G2 � �CC-P30 pT3b pN0 (0/35) M0 R0 G2 � �CC-P32 pT3a pN0 (0/23) M0 R0 G2 � �CC-P34 pT3 pN1 (2/17) M0 R0 G2 � �CC-P35 pT4 pN1 (2/51) M0 R0 G2 � �CC-P36 pT3 pN2 (15/42) M0 R0 G2 � �CC-P37 pT3 pN1 (1/25) M0 R0 G2 � �CC-P38 pT2 pN1 (1/23) M0 R0 G2-3 � � �CC-P39 pT3c pN1 (1/28) M0 R0 G2 � � �CC-P42 pT3a pN1 (1/2) M0 R0 G2 � � �CC-P44 pT1-3 pN1 (2/26) M0 R0 G2 � � �CC-P45 pT4 pN2 (4/36) M0 R0 G2 � � �CC-P46 pT3b pN2 (8/16) M0 R0 G3 � �CC-P47 pT3 pN2 (12/13) M0 R0 G2 (�) � �CC-P48 pT3a pN2 (5/23) M0 R0 G2 � � �CC-P49 pT4 pN2 (9/21) M0 R0 G2 (�) � �CC-P51 pT3c pN2 (4/23) M0 R0 G2 � � �CC-P53 pT4 pN2 (11/26) M0 R0 G2 (�) � �CC-P54 pT3 pN1 (3/22) M0 R0 G2 (�) � �CC-P56 pT3b pN1 (2/20) M0 R0 G2 � � �CC-P58 pT3 pN2 (1/32) M0 R0 G2 � �CC-P60 pT3 pN1 (2/24) M0 R0 G2 � � �CC-P65 pT3 pN1 (2/22) M0 R0 G2-3 � � �CC-P66 pT2 pN2 (4/20) M0 R0 G2 � �CC-P68 pT3c pN2 (12/22) M0 R0 G3 � �CC-P70 pT3 pN2 (12/21) M0 R0 G2 � �CC-P71 pT3 pN1 (1/18) M0 R0 G3 � � �CC-P72 pT2 pN1 (2/18) M0 R0 G3 � � �
NOTE: (�), not included.
Chromosomal Breakpoints Cluster at Copy Number Variants
www.aacrjournals.org 1285 Cancer Res 2008; 68: (5). March 1, 2008
Research. on December 27, 2015. © 2008 American Association for Cancercancerres.aacrjournals.org Downloaded from

DNA and RNA IsolationBioptic material was in the range of 24 to 370 mg, and nucleic acids were
extracted using TRIZOL (Invitrogen) following standard procedures.4
On average, we obtained 200 Ag each of RNA and DNA. Nucleic acidquantification was determined using the Nanodrop ND-1000 UV-VIS
spectrophotometer (Nanodrop). The quality of the nucleic acids after
preparation was assessed using a 2100 Bioanalyzer (Agilent Technologies).
Array CGHBAC array CGH platform. The 1,463 BAC clones and DNA used to
construct the chromosome 8 Human-BAC microarray were a subset of
the Human ‘‘32K’’ BAC Re-Array library from the BACPAC Resources(Children’s Hospital Oakland Research Institute, Oakland, CA).5 The
platform and details of the procedure are described in ref. 24.
Genomic DNA was digested using RsaI and AluI (Roche Applied
Science), and the appropriate fragment size was confirmed on an agarosegel. After protein removal using a phenol-chloroform extraction, 600 ng
of digested DNA were labeled using the Bioprime Labeling Kit (Invitrogen)
to incorporate Cy5-dCTP or Cy3-dCTP (Amersham). Sex-matched tumorand reference DNA were combined and hybridized to the custom chro-
mosome 8 BAC array in specifically designed hybridization cassettes
(TeleChem International). After overnight hybridization, slides were washed
and scanned on an Axon scanner using GenePixPro (3.0) software (AxonInstruments).
Oligo array CGH platform. Oligonucleotide array CGH (aCGH) was
performed according to the protocol provided by the manufacturer (Agilent
Oligonucleotide Array-Based CGH for Genomic DNA Analysis, protocolversion 4.0, June 2006; Agilent Technologies), with minor modifications.
Commercially available pooled control DNA (Promega) was used as sex-
matched reference DNA in all hybridizations. Briefly, 3 Ag of genomic DNA
was digested for 2 h with AluI and RsaI (Promega). QIAprep Spin MiniprepKit (Qiagen) was used for purifying the digested DNA. Tumor and reference
DNA was labeled with Cy3-dUTP and Cy5-dUTP (Promega), respectively, in
a random priming reaction using Bioprime Array CGH Genomic LabelingModule (Invitrogen). After 2 h of reaction, unincorporated nucleotides were
removed using Microcon YM-30 columns (Millipore). Cy3 and Cy5-labeled
samples were combined in equal amounts according to the incorporation
of labeled nucleotides as measured using Nanodrop. Hybridization andwashes were performed according to the manufacturer’s protocol. Slides
were scanned using a scanner (G2565BA; Agilent Technologies), and Agilent
Feature Extraction software (version 9.1; Agilent Technologies) was applied
for image analysis. To visualize the aCGH data, we used Agilent CGHAnalytics 3.4 software (Agilent Technologies). The quality of the slides was
assessed using metrics provided by CGH Analytics.
Gene Expression ProfilingGene expression profiles for all 51 primary colon tumors and 21
associated mucosa samples were established as previously reported (25).
Data AnalysisBAC aCGH platform. In order to compensate for scanner distortion
between the Cy3 and Cy5 channel readings, we applied a 90th inter-
percentile range (90IPR) normalization procedure to equalize the spread
of Cy3 measurement to the spread of Cy5 measurements per array (in
natural scale):
cCy3 ¼ Cy3� ð90IPR:Cy5=90IPR:Cy3Þ;
where cCy3 is the corrected Cy3 measurement, and 90IPR.Cy5 and90IPR.Cy3 are the 95th percentile minus the 5th percentile measurements
in the Cy5 and Cy3 channels, respectively. cCy3 and Cy5 measurements are
then log 2–transformed, and their log 2 (ratio) are median-centralized by
array using the following formula:
log 2ðRÞ ¼ log 2ðcCy3Þ � log 2ðCy5Þ þMD:log 2ðCy5Þ �MD:log 2ðcCy3Þ;
where MD.log 2 (Cy5) and MD.log 2 (cCy3) are the medians of log 2 (Cy5)and log 2 (cCy3) measurements, respectively. An aCGH segmentation
algorithm developed under MATLAB was applied to all normalized arrays
to extract segmented regions. Consensus gain or loss regions were obtained
as described previously (24).Oligo aCGH platform. The analysis of the aCGH experiments was
performed with in-house developed software based on R version 2.4.16 and
the DNA copy package from Bioconductor.7 One array that did not passthe quality control criteria (derivative log ratio spread or DLRSpread > 0.3)
was discarded. We also discarded features with no precise chromosomal
location. The final data set was comprised of 29 arrays and 181,984
features. The data were smoothed using ‘‘smooth.CNA’’ function (witharguments smooth.region = 1, and smooth.SD.scale = 3), followed by the
generation of chromosome segments using circular binary segmentation
(CBS; ref. 26). We centralized DNA segments to the most common ploidy
per array through an algorithm similar to the one offered in Agilent CGHAnalytics 3.4 software. The cumulative frequency of loss score for each
feature is the percentage of samples for which the segment value is below
the threshold log 2 (5/6) corresponding to a loss of one DNA copy in 30%
of diploid cells. Cumulative frequency is scaled to 100% = 4 (e.g., 25% = 1)in order to take advantage of the maximum range of the representation in
genome, chromosome, and gene views in Agilent CGH Analytics 3.4.
Likewise, the cumulative frequency of gain score for each feature is thepercentage of samples for which the segment value is above the threshold
log 2 (7/6).
The significance of association of chromosomal breakpoints within CNV
loci was calculated as follows: the statistics for breakpoints in CNV loci isthe m2 goodness of fit between the observed fraction of breakpoint in CNV
loci (count of observed breakpoint in CNV loci/total observed breakpoints),
and the fraction of expected breakpoints in CNV loci (total base pair of CNV
areas in array/total base pair covered in array). The significance thresholdfor this statistical test was P < a = 0.05 (two-sided).
The correlation between average CGH copy number and average gene
expression was performed using Pearson’s correlation for each CBS segmentwith (a) ratio average values (CBS segment mean from this article), as the
X-axis versus (b) average of gene expression [log 2 (ratio); from ref. 25],
as the Y-axis. We excluded gene expression arrays with >30% missing data
points, and to prevent distortion caused by outliers, we excluded segmentscontaining less than six features for either gene expression or CGH prior to
calculating the correlation, i.e., 10 samples and 314 of 369 segments were
retained. The significance threshold for this statistical test was P < a = 0.05
(two-sided).
Results
CGH using chromosome 8–specific tiling BAC arrays.Chromosome arm 8q is one of the most common targets ofgenomic amplification in colon cancer. It is also associated withthe development of both lymph node and distant metastases, andcontains single nucleotide polymorphisms that predispose to thedevelopment of this malignancy (2, 11, 12, 14, 15). We thereforeaimed to generate a high-resolution map of genomic copy numberchanges by analyzing 51 primary colon tumors by CGH using aBAC clone-based genomic tiling array. Twenty-five of these tumorswere associated with lymph node metastases at the time of surgery(UICC-III), whereas the remaining patients were free of lymph nodemetastases (UICC-II, n = 26). The clinical information is presentedin Table 1.
4 http://www.riedlab.nci.nih.gov/protocols.asp5 http://bacpac.chori.org/
6 http://www.R-project.org7 http://www.bioconductor.org
Cancer Research
Cancer Res 2008; 68: (5). March 1, 2008 1286 www.aacrjournals.org
Research. on December 27, 2015. © 2008 American Association for Cancercancerres.aacrjournals.org Downloaded from

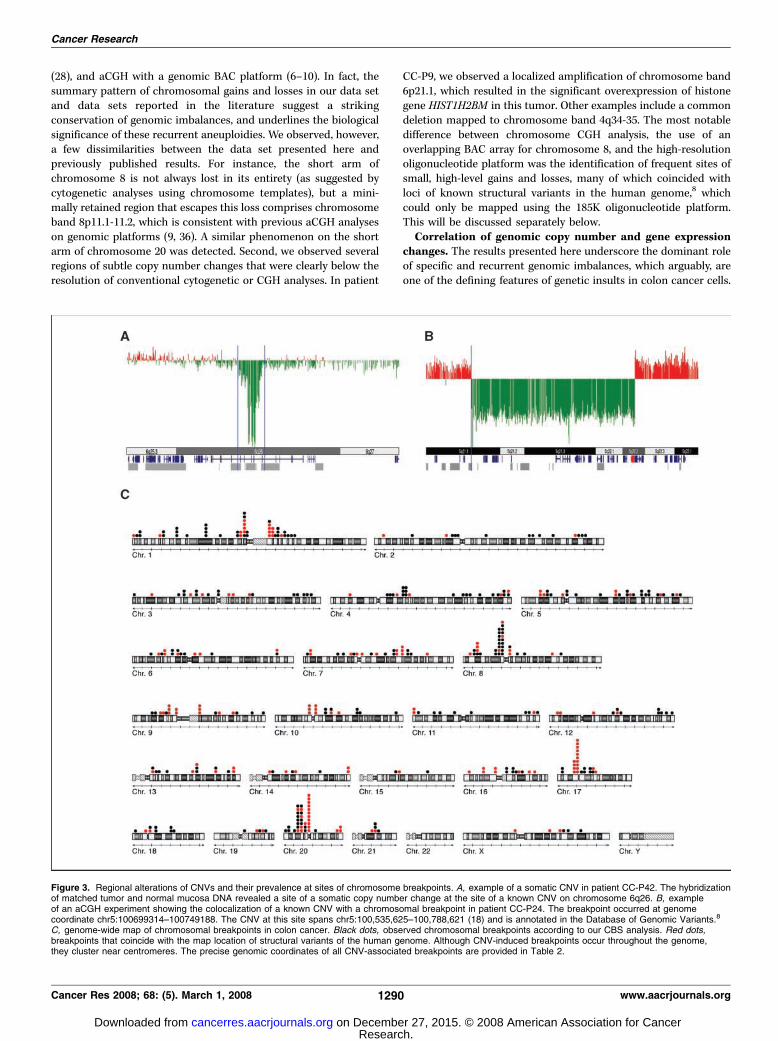
Confirming previous results, 50% of the cases showed aberra-tions on chromosome 8; 37% had gains on the long arm, and 45%had losses on 8p. Two regions with the highest copy numberincreases mapped to genome locations 105 to 120 Mbp and 127 to142 Mbp. This includes chromosome band 8q24.21, the genomiclocation of the MYC oncogene. Interestingly, in striking differencefrom the results suggested by conventional CGH, the short arm ofchromosome 8 was not subject to loss in its entirety: in themajority of samples with 8p alterations, the loss of this arm did notinclude a small region close to the centromere. This region, whichincludes 5.5 Mbp of the short arm, was either present in normalcopy number, or in fact gained to the same extent as the long arm.The summary of this analysis is presented in Fig. 1A and B .Interestingly, when we then tried to understand why chromosome8p was prone to chromosomal breaks to such an extent, we noticedthat in 9 out of 14 cases, the breakpoints coincided with sites ofknown structural variants identified within the human population,either CNVs or segmental duplication (Supplementary Table S1).Figure 1B summarizes the BAC array data of the 8p aberrationpatterns in individual cases.High-resolution genome-wide mapping of DNA copy num-
ber changes. In order to more precisely map these breakpointsand to investigate whether the observed predilection for chromo-somal breaks at sites of known structural variants applies toregions other than 8p, we profiled 31 of the 51 colon cancersanalyzed with the BAC arrays by aCGH on a 185K oligonucleotide,genome-wide platform (see Table 1 for the respective cases).Regions of genomic imbalances in these tumors were determinedusing CBS (26). Taking the different resolution limits of theplatforms into consideration, we observed an excellent congruencebetween the techniques, and the aberration patterns on 8p wereconfirmed. Our analyses also confirmed the recurrent low-levelcopy number changes of chromosomes 7, 8, 13, 18, and 20, whichare specific for sporadic colorectal cancers (27). However,attributable to the increased resolution of this platform for aCGH,additional novel sites of chromosomal gains and deletions could beidentified. Specifically, we detected 393 chromosomal breakpoints(defined as segments of copy number change) in 31 cases, for anaverage of 12.7 breakpoints per case (0–34). One hundred and sixty-nine breakpoint segments (including those that affected entirechromosomes) resulted in copy number increases, whereas 202regions of copy number loss were present. Segments with copynumber increase were recurrently mapped to chromosomes andchromosome arms 7, 8q, 13, and 20q, whereas losses occurred mostfrequently on 1p, 5q, 8p, 14, 15, 17p, 18, 21, and 22. A summary ofthese results is presented as cumulative gain or loss in Fig. 1C , andas a frequency distribution in Supplementary Fig. S1. Gains onchromosomes 13 and 20 were most commonly observed, and alsorevealed the highest level of genomic amplification, followed bycopy number increases of chromosomes 7 and 8q. Chromosomearms 18q, 17p, and 8p showed the highest degree of genomic loss(both in terms of cases and actual copy number reduction).
We detected several regions whose recurrent copy numberchanges were not appreciated in our previous analyses of colorectalcarcinomas using conventional CGH analysis (28). In addition tothe above-described retention on 8p, we observed a similar patternon chromosome 20: the breakpoint that results in copy numberincrease resides in the euchromatic region of 20p, and not in thecentromere. In addition, we observed interstitial deletions ofchromosome band 4q34.3-35.2 in three cases (CC-P19, CC-P20, andCC-P65), and a deletion that included the terminal band of the
short arm of chromosome 11 (11p15.5) in two cases (CC-P23 andCC-P38). Bands 13q21.32 to 13q31.2 were deleted on this commonlygained chromosome in CC-P23, and remained in normal copynumber (with the rest of the chromosome gained) in CC-P65. A fewlocalized high-level amplifications were mapped to chromosomebands 4q13.2-13.4, 5q32-33.2, and 6p21.1 (CC-P14), and 16q12.2 inCC-P65. In CC-P23, we observed the genomic amplification of theANKRD10 gene, which maps to distal chromosome 13.Comparison between lymph node–negative and -positive
cancers. The presence of synchronous lymph node metastasesdictates the inclusion of chemotherapy in the treatment of patientswith colon cancer. In order to explore whether lymph node statuscould be reflected by specific copy number changes on chromo-some 8, as previously suggested (11), or elsewhere in the genome,we compared the distribution of genomic imbalances as deter-mined in both groups using the oligonucleotide array platform. Thepercentage of chromosomal gains and losses was not differentbetween the lymph node–positive (average, 12.9 per case) andlymph node–negative (average, 11.7 per case) carcinomas. Theaverage number of gained or lost segments in the UICC-II tumorswas 6.8 and 6.1, respectively, and for the UICC-III tumors, it was 4.8and 7.5, respectively. In order to further analyze whether tumorsassociated with lymph node metastases carry distinct genomicaberration profiles, we analyzed the frequency of all CBS units inthe two groups: we could not detect any CBS units that wereuniquely gained or lost in either the UICC-II or UICC-III samples,nor did we detect a differential distribution of CBS units betweenthe groups that exceeded a 30% difference threshold. The summaryplots of the UICC-II and UICC-III tumors are displayed inSupplementary Fig. S2A and B .Influence of genomic imbalances on gene expression.
Genomic copy number changes are arguably one of the mostrecurrent features of solid tumors of epithelial origin. Consequent-ly, numerous groups attempted to clarify the relationship betweengenomic copy number changes and gene expression levels;however, most of these studies focused either on the effect ofwhole chromosomes, or on regional amplicons (25, 29–33). We nowanalyzed, for the entire colon cancer genome, this correlation byplotting the average gene expression values for all CBS unitsagainst their genomic copy number (we only included those 17cases for which we had gene expression results in both the tumorand matched normal mucosa, and those CBS segments thatcontained more than five genes). The analysis, shown in Fig. 2,revealed a significant correlation of genomic copy number withaverage gene expression levels, therefore suggesting a direct effectof gene copy on relative message levels (R = 0.66709, P = 2.2e�16).CNVs. In addition to low level copy number changes, the CBS
analysis revealed numerous recurrent loci of localized high-levelcopy number increases or decreases relative to the reference DNA.Such changes could be indicative of structural variations in thegenome, either germ line or somatic. Structural variations,including CNVs, have recently emerged as a novel class of DNAsegments that differ from one individual to another (20). Thesystematic mapping of CNVs in 270 individuals that constitute thehuman HapMap collection (34) suggests that f12% of the humangenome could be subject to copy number variation (20), with asmuch as 3% of these regions (f0.3% of the total genome) varyingfrom one individual to another (35). CNVs therefore contributesignificantly to human sequence variation. Applying the CBSalgorithm, we could identify 120 sites that were suggestive of CNVs(i.e., sites of high-level copy number increase or decrease of no
Chromosomal Breakpoints Cluster at Copy Number Variants
www.aacrjournals.org 1287 Cancer Res 2008; 68: (5). March 1, 2008
Research. on December 27, 2015. © 2008 American Association for Cancercancerres.aacrjournals.org Downloaded from

Figure 1. A, summary of the BAC aCGH analysis of chromosome 8 from 51 patients. Chromosome losses (green ) and gains (red ) are in log 2 ratios. Note the retentionof a portion of the short arm of chromosome 8 from the commonly observed loss of this chromosome arm. Left, genome coordinates and cytogenetic bands.B, summary of BAC aCGH analysis of individual cases (see patient numbers on top of graph) for those cases that revealed chromosome 8p abnormalities.Note the varying degrees of retention/amplification of chromosome 8p material (red). DNA copy number losses (green ). The red line at 6 Mbp observed in all casesindicates a novel, common CNV which includes the gene GATA4 . The amplicon at 11 Mbp in CC-P1 includes two genes, SOX7 and PINX1. Left, genome coordinates.C, summary of oligonucleotide aCGH analysis from 31 cases. Copy number increases (red ) and decreases (green ). Sites suggestive of CNVs are indicated as thinlines in light green or red. Numbers below the graph refer to chromosomes. Average values are in log 2 ratios.
Cancer Research
Cancer Res 2008; 68: (5). March 1, 2008 1288 www.aacrjournals.org
Research. on December 27, 2015. © 2008 American Association for Cancercancerres.aacrjournals.org Downloaded from

more than 200 kbp). The comparison of the variants detected inour data set derived from 31 tumors with the database on genomicvariation8 indicated that 81 of those variants (67.5%) overlappedwith known CNVs, whereas 39 (32.5%) were potentially novel sitesof CNVs. A complete list is provided in Supplementary Table S2.
In order to assess whether these alterations were genomic copynumber changes that emerged de novo in the tumors, i.e., somatic,or whether they would have to be considered germ line events, wehybridized tumor DNA from five patients against DNA preparedfrom matched normal mucosa tissue. CNVs detectable in suchexperiments can be considered bona fide somatic events. Theinitial CGH experiments revealed 54 known CNVs in these fivepatients (9–13). We now observe that 13 of these CNVs remainedwhen tumor DNA was hybridized against DNA from matchednormal mucosa (1–4). Based on these observations, we concludethat 24% of the CNVs are actual variants that emerged in the tumortissue, and hence, somatic CNVs. Examples of these variant regionsare shown in Fig. 3A .
Similar to fragile sites, regions of genomic copy number variationcould trigger genomic rearrangements (20, 22). In order to establishto which extent genomic regions containing CNVs contribute tothe emergence of chromosomal translocations (as deduced fromthe presence of segments of genomic copy number change byCGH), we asked how frequently chromosomal translocationscoincided with the location of previously identified CNVs. Giventhe high resolution of our platform (16 kbp), we could manuallyannotate the breakpoint sequence for each segment using theDatabase of Genomic Variation8 in order to search for structural
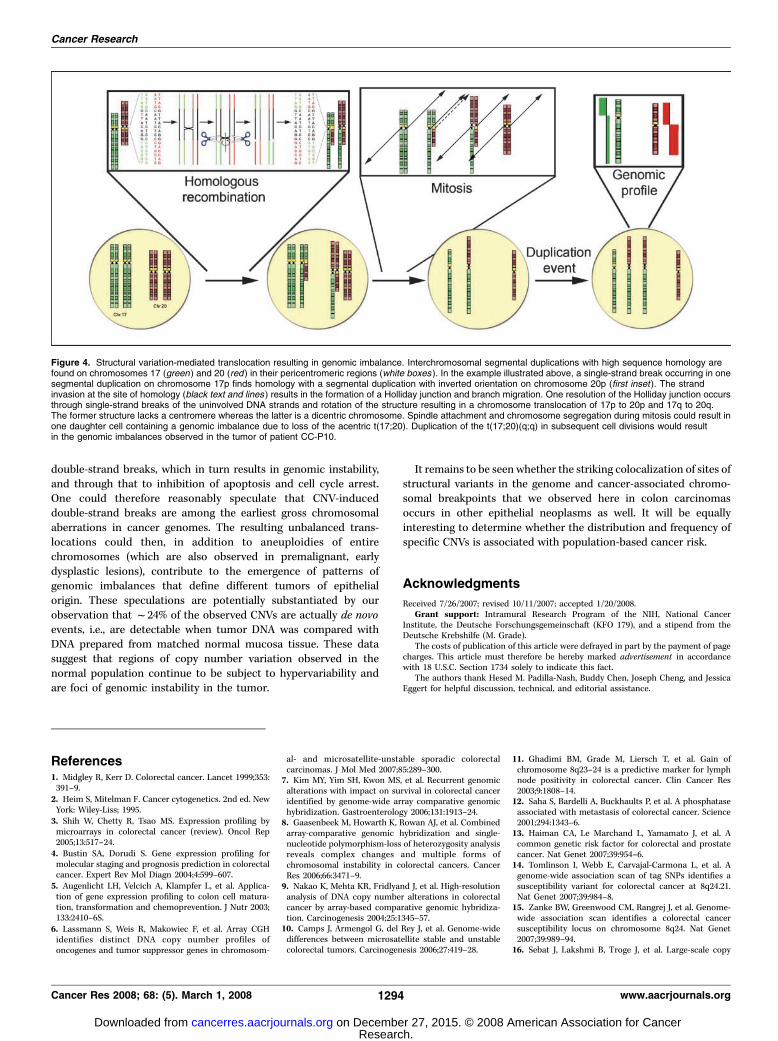
genomic variants at these genome coordinates. In the 31 casesanalyzed with the oligonucleotide platform, we mapped 393 sitesof genomic copy number change, 161 of which occurred at the siteof known CNVs (Fig. 3C). Taking into account that f18% of thegenome consists of segments identified as CNV, the probability that41% of all translocations mapped to CNVs by coincidence isexceedingly low (P < 2.2e�16). This suggests that CNV loci(including segmental duplications) contribute significantly to theemergence of chromosomal breaks in colon cancer, and hence,to the development of genomic imbalances. CNVs that colocalizedto chromosomal breakpoints in our data set are listed in Table 2.Figure 3B presents an example of a subchromosomal genomicdeletion that eliminates one copy of the tumor suppressor geneAPC and shows the association between the site of the chro-mosomal break with a known CNV. Figure 4 shows the possibleemergence of genomic copy number changes in CC-P10. In thistumor, we observed chromosomal breakpoints that coincidedwith two segmental duplications, DC3225 on chromosome 17pand DC2472on chromosome 20p. A sequence homology of94.51% between these two sites suggests that homologousrecombination events could have contributed to a chromosomaltranslocation, which eventually leads to the observed pattern ofDNA gain and loss.
Discussion
Patterns of imbalances. Here, we present a comprehensivemap of genomic imbalances in primary colon carcinomasgenerated using high-resolution aCGH on a genomic tiling arrayfor chromosome 8 and a 185K oligonucleotide platform. The resultsare, in general, congruent with previous analyses using chromo-some banding techniques (2), CGH on metaphase chromosomes
Figure 2. Correlation of genomic copy number of all CBS units with gene expression levels.
8 http://projects.tcag.ca/variation/
Chromosomal Breakpoints Cluster at Copy Number Variants
www.aacrjournals.org 1289 Cancer Res 2008; 68: (5). March 1, 2008
Research. on December 27, 2015. © 2008 American Association for Cancercancerres.aacrjournals.org Downloaded from
(28), and aCGH with a genomic BAC platform (6–10). In fact, thesummary pattern of chromosomal gains and losses in our data setand data sets reported in the literature suggest a strikingconservation of genomic imbalances, and underlines the biologicalsignificance of these recurrent aneuploidies. We observed, however,a few dissimilarities between the data set presented here andpreviously published results. For instance, the short arm ofchromosome 8 is not always lost in its entirety (as suggested bycytogenetic analyses using chromosome templates), but a mini-mally retained region that escapes this loss comprises chromosomeband 8p11.1-11.2, which is consistent with previous aCGH analyseson genomic platforms (9, 36). A similar phenomenon on the shortarm of chromosome 20 was detected. Second, we observed severalregions of subtle copy number changes that were clearly below theresolution of conventional cytogenetic or CGH analyses. In patient
CC-P9, we observed a localized amplification of chromosome band6p21.1, which resulted in the significant overexpression of histonegene HIST1H2BM in this tumor. Other examples include a commondeletion mapped to chromosome band 4q34-35. The most notabledifference between chromosome CGH analysis, the use of anoverlapping BAC array for chromosome 8, and the high-resolutionoligonucleotide platform was the identification of frequent sites ofsmall, high-level gains and losses, many of which coincided withloci of known structural variants in the human genome,8 whichcould only be mapped using the 185K oligonucleotide platform.This will be discussed separately below.Correlation of genomic copy number and gene expression
changes. The results presented here underscore the dominant roleof specific and recurrent genomic imbalances, which arguably, areone of the defining features of genetic insults in colon cancer cells.
Figure 3. Regional alterations of CNVs and their prevalence at sites of chromosome breakpoints. A, example of a somatic CNV in patient CC-P42. The hybridizationof matched tumor and normal mucosa DNA revealed a site of a somatic copy number change at the site of a known CNV on chromosome 6q26. B, exampleof an aCGH experiment showing the colocalization of a known CNV with a chromosomal breakpoint in patient CC-P24. The breakpoint occurred at genomecoordinate chr5:100699314–100749188. The CNV at this site spans chr5:100,535,625–100,788,621 (18) and is annotated in the Database of Genomic Variants.8
C, genome-wide map of chromosomal breakpoints in colon cancer. Black dots, observed chromosomal breakpoints according to our CBS analysis. Red dots,breakpoints that coincide with the map location of structural variants of the human genome. Although CNV-induced breakpoints occur throughout the genome,they cluster near centromeres. The precise genomic coordinates of all CNV-associated breakpoints are provided in Table 2.
Cancer Research
Cancer Res 2008; 68: (5). March 1, 2008 1290 www.aacrjournals.org
Research. on December 27, 2015. © 2008 American Association for Cancercancerres.aacrjournals.org Downloaded from

Table 2. Colocalization of chromosomal breakpoints and structural variants in the genome
BP
ID
Cytoband Breakpoint
start
Breakpoint
stop
CNV
locus ID
Segmental
duplications
Interchromosomal/
intrachromosomal
Patient ID
(CC-P no.)
Genes mapping
to the breakpoint
1.1 1p36.33 1,594,502 1,686,141 0003 DC0021, DC0022 Intra 14 SSU72, CDC2L2
1.2 1p35.2 31,435,129 31,444,435 0053 — — 14 WDR57, ZCCHC17
1.3 1p13.2–1p13.1 113,299,763 113,313,396 0141 — — 56 —1.4 1p11.2–1p12 120,357,104 120,525,002 0144 DC0153, DC0154 Intra 10, 11, 16, 42 —
1.5 1q12 120,961,845 141,468,205 0145 DC0165 Intra 20 —
1.6 1q21.1–1q12 143,526,765 143,543,580 0146 DC0185 Intra 1, 44, 53, 56, 71 NBPF111.7 1q21.1–1q12 145,338,927 145,359,805 0148 DC0206 Inter 1 NBPF15
1.8 1q21.1 146,599,106 146,628,218 0148 DC0218 Inter 1 HIST2H4, H2BE,
HIST2H3C
1.9 1q23.1 154,677,866 154,699,522 — DC0238 Inter 1 —2.1 2p25.1 8,053,090 8,078,648 0278 — — 65 LOC339789
2.2 2p13.1 73,638,384 73,655,615 0354 — — 14 ALMS1
2.3 2q34 211,358,859 211,368,373 0485 — — 8 CPS1
3.1 3p24.3 20,205,874 20,219,511 0544 — — 483.2 3p14.2 60,979,549 60,993,090 0597 — — 53 FHIT
3.3 3p12.3 74,382,590 74,402,458 0612 — — 9 CNTN3
3.4 3q11.2 95,112,766 95,126,868 — DC0913 Intra 47 PROS13.5 3q13.11 105,937,188 105,980,769 0639 — — 42 —
3.6 3q13.33 121,044,859 121,064,116 0658 — — 8 GSK3B
4.1 4p15.31 20,205,995 20,212,010 0784 — — 16 SLIT2
4.2 4q13.2 69,310,017 69,319,707 0867 DC1229 Intra 244.3 4q13.3 71,229,595 71,238,968 0869 — — 9
4.4 4q22.3 94,893,243 94,904,635 0906 — — 9 GRID2
4.5 4q35.1 184,012,774 184,022,817 1051 — — 20 —
5.1 5p14.3 20,507,734 20,530,987 1090 — — 8 —5.2 5p14.3 20,507,734 20,530,987 1090 — — 19, 24 —
5.3 5p12 45,125,704 45,157,897 1116 — — 14 —
5.4 5q21.1 99,432,472 99,447,496 1183 DC1732, DC1733 Inter, Intra 51 —
5.5 5q21.1 100,703,233 100,734,459 1184 — — 24 —5.6 5q23.1 115,529,614 115,544,817 1203 — — 42 COMMD10
5.7 5q33.2 153,090,806 153,106,089 1242 — — 14 GRIA1
5.8 5q34 165,144,873 165,198,317 1251 — — 8 —6.1 6p21.33–6p22.1 29,949,864 29,967,114 1311 DC1955 Intra 20 —
6.2 6p21.33 30,085,931 30,095,973 — DC1958 Intra 23 —
6.3 6p21.1 46,134,331 46,141,981 1330 — — 8 —
6.4 6q12 65,074,130 65,145,208 1353 — — 8, 20 —6.5 6q13 73,616,917 73,628,301 1369 — — 23 KCNQ5
6.6 6q25.1 149,905,776 149,946,488 — DC2020 Intra 48 C6orf72, PPIL4
7.1 7p21.3 7,153,539 7,187,740 1491 — — 1, 47 C1GALT1
7.2 7p11.2 55,572,233 55,593,091 — DC2177 Inter 47, 48 —7.3 7q11.21 62,195,037 62,271,252 1558 DC2233 Inter 65 —
7.4 7q11.23 76,397,789 76,426,065 1572 DC2356, DC2357 Intra 20, 48 KIAA1505
7.5 7q21.3 97,132,792 97,132,822 1596 DC2371 Inter 48 ASNS7.6 7q22.1 101,837,056 101,878,089 1604 DC2398, DC2399 Intra, Inter 48 RASA4, POLR2J2
7.7 7q22.1 101,914,350 101,929,241 1604 DC2399 Inter 1, 20
7.8 7q32.2 130,012,776 130,017,714 1642 — — 42
8.1 8p23.1 7,709,141 7,735,365 1691 DC2508 Inter 48 DEFB106A, DEFB104A,DEFB105A,
8.2 8p22 12,916,574 12,922,059 1698 — — 72 FLJ36980, KIAA1456
8.3 8p22 16,642,931 16,684,703 1704 — — 48
8.4 8p11.23–8p12 38,471,875 38,487,158 1733 — — 658.5 8p11.22–8p11.23 39,356,595 39,369,686 1734 — — 9, 51, 65 ADAM18
8.6 8q11.1 47,658,706 47,680,223 1742 — — 10 —
8.7 8q11.21 51,143,041 51,151,309 1749 — — 10 SNTG18.8 8q22.1 93,686,213 93,707,355 1811 — — 1 —
9.1 9p21.1 30,929,344 30,963,839 1931 — — 14 —
9.2 9p13.1 38,758,232 38,799,072 1944 DC2781, 2806, 2807 Intra, Inter 8, 9, 12, 42, 47, 71
9.3 9q12 68,141,956 68,151,359 1945 DC2382 Inter 8, 12, 14 KGFLP1, FOXD4L3
(Continued on the following page)
Chromosomal Breakpoints Cluster at Copy Number Variants
www.aacrjournals.org 1291 Cancer Res 2008; 68: (5). March 1, 2008
Research. on December 27, 2015. © 2008 American Association for Cancercancerres.aacrjournals.org Downloaded from

Table 2. Colocalization of chromosomal breakpoints and structural variants in the genome (Cont’d)
BP
ID
Cytoband Breakpoint
start
Breakpoint
stop
CNV
locus ID
Segmental
duplications
Interchromosomal/
intrachromosomal
Patient ID
(CC-P no.)
Genes mapping
to the breakpoint
9.4 9q21.33–9q22.1 87,362,045 87,376,119 1960 — — 8 DAPK1
9.5 9q31.1 104,443,646 104,448,713 1980 — — 8 OR13C2
10.1 10p11.21 37,523,207 37,536,450 2086 DC3033 Inter 71 ANKRD30A10.2 10p11.21 37,561,205 37,573,675 2086 — — 8 ANKRD30A
10.3 10q11.21 42,066,866 42,097,773 2093 DC3061, DC6062 Inter 71
10.4 10q11.21 42,676,347 42,724,171 2093 DC3077, DC3078 Inter 810.5 10q11.22 45,489,352 45,507,880 2095 DC3091 Intra 14, 49 —
10.6 10q21.1 58,591,323 58,643,177 2111 — — 8 —
10.7 10q21.3 66,455,837 66,527,887 2124 — — 14 —
11.1 11p15.5 1,341,557 1,478,016 2201 — — 38 HCCA2, BRSK211.2 11p15.4 3,625,683 3,638,563 2204 — — 38 ART1
11.3 11q24.2 124,745,557 124,758,015 2349 — — 8 PKNOX2
12.1 12p13.31 8,908,348 8,909,373 2370 — — 8 —
12.2 12p13.2 11,040,946 11,045,834 2374 — — 42 TAS2R4912.3 12p13.2 11,113,176 11,274,374 2374 DC3675 Intra 45 TAS2R46, TAS2R43,
TAS2R44
12.4 12q13.11 47,046,663 47,074,456 2418 — — 49 —13.1 13q12.11 21,020,530 21,029,004 2540 — — 20 EFHA1
13.2 13q21.31 62,773,029 62,811,083 2578 — — 65 —
13.3 13q21.33 70,415,095 70,460,603 2590 — — 47 —
13.4 13q31.3 89,088,605 89,156,716 2615 — — 23 —13.5 13q33.3 108,193,190 108,202,800 2631 — — 47 RP11-54H7.1
13.6 13q34 111,053,779 111,083,506 2633 — — 47 —
14.1 14q11.2 20,923,484 20,941,004 2641 — — 42 CHD8
14.2 14q21.1 38,759,886 38,773,059 2668 — — 19 MIA214.3 14q21.1 40,612,280 40,647,692 2671 — — 51 —
14.4 14q21.2 43,688,550 43,723,219 2676 — — 9 —
14.5 14q32.33 105,881,961 105,902,383 2747 — — 9 KIAA0125
15.1 15q21.1 43,050,880 43,057,665 2772 DC3877 Intra 53 C15ORF4316.1 16p13.3 5,085,210 5,132,553 2870 DC3528 Inter 20 FAM86A
16.2 16p12.1 22,578,173 22,625,780 2893 — — 45, 65 —
16.3 16p11.2 28,141,539 28,154,008 2899 — — 20 —16.4 16p11.2 32,181,810 32,206,373 2905 DC3586 Inter 14 —
16.5 16q13 56,228,731 56,242,451 2924 — — 47 GPR56
16.6 16q22.1 68,534,408 68,575,859 2935 DC3625 Inter 45 LOC348174
16.7 16q22.3 73,128,535 73,148,905 2940 DC3635 Intra 45 GLG117.1 17p11.2 17,935,146 17,945,526 2998 — — 71 DRG2
17.2 17p11.2 18,823,700 18,845,631 3001 — — 51 SLC5A10
17.3 17p11.2 21,471,897 21,627,596 3005 DC3225, DC3226,
DC3227
Inter 10, 48, 72 —
17.4 17p11.2 22,324,326 22,367,302 3006 DC3241, DC3242,
DC3243
Intra, Inter 1, 16, 20, 24, 42,
45, 53, 56, 71
—
17.5 17q21.2 35,991,941 36,017,353 3020 — — 56 —17.6 17q21.2 37,142,507 37,148,208 3021 — — 56 HAP1
18.1 18p11.21 14,968,075 15,042,839 3109 DC2923, DC2924,
DC2925
Inter 1 —
18.2 18q11.2 18,905,068 18,910,922 3112 — — 1 —19.1 19q13.12 42,671,304 42,678,874 3252 — — 42 —
19.2 19q13.32 53,178,403 53,192,305 3271 — — 71 ELSPBP1
20.1 20p13 98,836 111,637 3294 — — 47 —
20.2 20p13 1,546,858 1,557,784 3300 — — 47 SIRPB120.3 20p12.1 14,802,986 14,816,751 3327 — — 9, 44 C20orf133
20.4 20p12.1 15,234,450 15,249,882 3330 — — 1, 9, 47 C20orf133
20.5 20p11.22 22,297,096 22,316,323 3347 — — 65 —20.6 20p11.1 26,023,784 26,096,870 3352 DC2471, DC2472 Inter 10, 42, 49 —
20.7 20q11.1 28,209,786 28,225,117 3353 DC2479, DC2480 Inter 12, 14, 16, 20, 44, 48, 53, 71 —
20.8 20q13.33 58,950,616 59,000,615 3414 — — 39 —
20.9 20q13.33 62,234,272 62,235,717 3419 — — 39 —
(Continued on the following page)
Cancer Research
Cancer Res 2008; 68: (5). March 1, 2008 1292 www.aacrjournals.org
Research. on December 27, 2015. © 2008 American Association for Cancercancerres.aacrjournals.org Downloaded from

We and others have therefore tried to understand the consequen-ces of such genomic imbalances on the cancer transcriptome(25, 29–33). In general, the data are consistent with theinterpretation that genomic copy number is positively correlatedto transcript levels. The data set generated here now affords us thepossibility to interrogate the relationship of genomic imbalances,as detected by segments of copy number change based on the CBSanalysis (185K oligonucleotide arrays), with the expression levels ofresident genes for the entire genome (Fig. 2). The data show thatthere is indeed a general, and statistically significant correlation ofgenomic copy number and gene expression levels and thus providefurther evidence that these imbalances exert a direct effect on thecancer transcriptome, and hence, result in a massive and complexderegulation of the transcriptional equilibrium of malignantepithelial cells. This observation underlines the importance of thequestion as to which extent such rather global gene expressionchanges contribute to tumorigenesis vis-a-vis the targetedderegulation of specific genes by mutation, deletion, amplification,or epigenetic deregulation.CNVs and potential mechanisms of induction of chromo-
some breakage. CNVs constitute a subset of structural variantsthat represent a substantial amount of interindividual geneticvariation (20). The most comprehensive catalogue of structuralvariants in the human genome can be found at http://projects.tcag.ca/variation/. The data summarized there was generated byanalyzing the genomes of 270 individuals from the human HapMapconsortium using both aCGH and genome-wide single nucleotidepolymorphism platforms. These variants are rather ubiquitous,comprising f12% of the human genome. Some of them have beenshown to be associated with a particular phenotype and withdisease (20). Based on a comprehensive evaluation of chromosomalbreakpoints and associated genomic copy number changes in celllines derived from solid tumors (i.e., bladder, prostate, cervix,pancreas, and breast), we could previously show that a consider-able fraction of chromosomal translocations (in that case referredto as jumping translocations) originated in the pericentromericheterochromatin of several chromosomes (21). Such heterochro-matin is enriched for segmental duplications, and these show a6:1 ratio of interchromosomal to intrachromosomal duplications.These regions can also vary in copy number between individuals,and if so, could be classified as CNVs (22). We were thereforecurious as to which extent chromosomal breakpoints (as definedby sites of genomic copy number change using aCGH) colocalizewith such structural variants in the genome of primary coloncancers. Surprisingly, f41% of all translocations resided at sites ofknown CNVs, including segmental duplications (Fig. 3; Table 2).Such an association is highly significant (P < 2.2e�16). Figure 4suggests a possible scenario on how the observed pattern ofgenomic gain and loss could be explained in one of the tumors
analyzed here (CC-P10). It is, however, not possible to performcytogenetic analysis on this very sample, and therefore, one cannotformally prove that the observed pattern of imbalance is indeedcaused by translocations between chromosomes 17 and 20 despitethe high degree of homology (95%) between the segmentalduplications that colocalize with these breakpoints. Alternatively,CNVs and segmental duplications are simply regions more prone tochromosome breakage, which can result in loss of genomicsegments due to the lack of a centromere, or translocation withother regions in the genome without homology. The difference incopy number of these regions between individuals, however, isperhaps an indication that they are particularly susceptible tohomology-mediated recombination, i.e., formation of chiasmata, inmeiotic cells. In cells experiencing DNA damage, one could easilyenvision that aberrant homology-mediated repair of segmentallyduplicated regions might also lead to chromosome aberrations insomatic cells, such as deletions, inversions, and translocations.Such analyses will have to be conducted using cell lines establishedfrom primary tumors. The mere fact that homologous chromo-somes in an interphase nucleus rarely tend to be in the sametopographical neighborhood (37) makes it more likely that ahomology search will identify a duplicated region ona different chromosome. This may explain the relatively highfrequency of whole chromosome arm gains and losses in aneuploidtumors. Why might these regions be more susceptible to DNAdamage? First, CNVs are often found in association with genecoding regions and therefore might be expected to be in an openconfiguration, making them more susceptible to DNA damage. Alusequences, satellite repeats, and regions with hallmarks of DNAfragility are found to be enriched at the boundaries of theseregions, supporting the hypothesis that these areas are preferentialsites of DNA double-strand breaks, making them ideal substratesfor repair pathways with the potential for causing increased copynumber or rearrangements. Gorgoulis et al. (38) and Bartkova et al.(39) observed an early activation of DNA damage responsepathways in precancerous lesions. Serrano and colleagues showedthat high expression of oncogenes triggers a permanent block inreplication, termed oncogene-induced senescence (40). Oncogene-induced senescence has recently been shown to induce a DNAdamage response in tissue culture models (41, 42) as well as in vivoduring the development of thymocytes (43), and is able to restrictthe growth of human and murine precancerous tissues (44–48).These early incidents set the stage for the events outlined above.Further progression to more advanced dysplastic lesions and toinvasive carcinomas was associated with p53 inactivation andreduction of apoptosis. Interestingly, allelic loss of loci prone toDNA double-strand break formation, i.e., fragile sites was common.The authors put forward a model in which, at early stagesof tumorigenesis, replicative stress triggers the formation of
Table 2. Colocalization of chromosomal breakpoints and structural variants in the genome (Cont’d)
BP
ID
Cytoband Breakpoint
start
Breakpoint
stop
CNV
locus ID
Segmental
duplications
Interchromosomal/
intrachromosomal
Patient ID
(CC-P no.)
Genes mapping
to the breakpoint
21.1 21q21.1 21,148,687 21,166,248 3430 — — 44 NCAM2
21.2 21q21.2 24,275,094 24,312,332 3435 — — 14 —X.1 Xp11.22 52,775,986 52,782,545 — DC1465 Intra 42 GAGED4
X.2 Xq21.31 91,052,975 91,151,194 — DC1550, DC1551 Inter 71 PCDH11X
X.3 Xq22.1 101,404,534 101,556,005 — DC1569 Intra 8 NXF2
Chromosomal Breakpoints Cluster at Copy Number Variants
www.aacrjournals.org 1293 Cancer Res 2008; 68: (5). March 1, 2008
Research. on December 27, 2015. © 2008 American Association for Cancercancerres.aacrjournals.org Downloaded from
double-strand breaks, which in turn results in genomic instability,and through that to inhibition of apoptosis and cell cycle arrest.One could therefore reasonably speculate that CNV-induceddouble-strand breaks are among the earliest gross chromosomalaberrations in cancer genomes. The resulting unbalanced trans-locations could then, in addition to aneuploidies of entirechromosomes (which are also observed in premalignant, earlydysplastic lesions), contribute to the emergence of patterns ofgenomic imbalances that define different tumors of epithelialorigin. These speculations are potentially substantiated by ourobservation that f24% of the observed CNVs are actually de novoevents, i.e., are detectable when tumor DNA was compared withDNA prepared from matched normal mucosa tissue. These datasuggest that regions of copy number variation observed in thenormal population continue to be subject to hypervariability andare foci of genomic instability in the tumor.
It remains to be seen whether the striking colocalization of sites ofstructural variants in the genome and cancer-associated chromo-somal breakpoints that we observed here in colon carcinomasoccurs in other epithelial neoplasms as well. It will be equallyinteresting to determine whether the distribution and frequency ofspecific CNVs is associated with population-based cancer risk.
Acknowledgments
Received 7/26/2007; revised 10/11/2007; accepted 1/20/2008.Grant support: Intramural Research Program of the NIH, National Cancer
Institute, the Deutsche Forschungsgemeinschaft (KFO 179), and a stipend from theDeutsche Krebshilfe (M. Grade).
The costs of publication of this article were defrayed in part by the payment of pagecharges. This article must therefore be hereby marked advertisement in accordancewith 18 U.S.C. Section 1734 solely to indicate this fact.
The authors thank Hesed M. Padilla-Nash, Buddy Chen, Joseph Cheng, and JessicaEggert for helpful discussion, technical, and editorial assistance.
Figure 4. Structural variation-mediated translocation resulting in genomic imbalance. Interchromosomal segmental duplications with high sequence homology arefound on chromosomes 17 (green ) and 20 (red ) in their pericentromeric regions (white boxes ). In the example illustrated above, a single-strand break occurring in onesegmental duplication on chromosome 17p finds homology with a segmental duplication with inverted orientation on chromosome 20p (first inset ). The strandinvasion at the site of homology (black text and lines ) results in the formation of a Holliday junction and branch migration. One resolution of the Holliday junction occursthrough single-strand breaks of the uninvolved DNA strands and rotation of the structure resulting in a chromosome translocation of 17p to 20p and 17q to 20q.The former structure lacks a centromere whereas the latter is a dicentric chromosome. Spindle attachment and chromosome segregation during mitosis could result inone daughter cell containing a genomic imbalance due to loss of the acentric t(17;20). Duplication of the t(17;20)(q;q) in subsequent cell divisions would resultin the genomic imbalances observed in the tumor of patient CC-P10.
References1. Midgley R, Kerr D. Colorectal cancer. Lancet 1999;353:391–9.2. Heim S, Mitelman F. Cancer cytogenetics. 2nd ed. NewYork: Wiley-Liss; 1995.3. Shih W, Chetty R, Tsao MS. Expression profiling bymicroarrays in colorectal cancer (review). Oncol Rep2005;13:517–24.4. Bustin SA, Dorudi S. Gene expression profiling formolecular staging and prognosis prediction in colorectalcancer. Expert Rev Mol Diagn 2004;4:599–607.5. Augenlicht LH, Velcich A, Klampfer L, et al. Applica-tion of gene expression profiling to colon cell matura-tion, transformation and chemoprevention. J Nutr 2003;133:2410–6S.6. Lassmann S, Weis R, Makowiec F, et al. Array CGHidentifies distinct DNA copy number profiles ofoncogenes and tumor suppressor genes in chromosom-
al- and microsatellite-unstable sporadic colorectalcarcinomas. J Mol Med 2007;85:289–300.7. Kim MY, Yim SH, Kwon MS, et al. Recurrent genomicalterations with impact on survival in colorectal canceridentified by genome-wide array comparative genomichybridization. Gastroenterology 2006;131:1913–24.8. Gaasenbeek M, Howarth K, Rowan AJ, et al. Combinedarray-comparative genomic hybridization and single-nucleotide polymorphism-loss of heterozygosity analysisreveals complex changes and multiple forms ofchromosomal instability in colorectal cancers. CancerRes 2006;66:3471–9.9. Nakao K, Mehta KR, Fridlyand J, et al. High-resolutionanalysis of DNA copy number alterations in colorectalcancer by array-based comparative genomic hybridiza-tion. Carcinogenesis 2004;25:1345–57.10. Camps J, Armengol G, del Rey J, et al. Genome-widedifferences between microsatellite stable and unstablecolorectal tumors. Carcinogenesis 2006;27:419–28.
11. Ghadimi BM, Grade M, Liersch T, et al. Gain ofchromosome 8q23–24 is a predictive marker for lymphnode positivity in colorectal cancer. Clin Cancer Res2003;9:1808–14.12. Saha S, Bardelli A, Buckhaults P, et al. A phosphataseassociated with metastasis of colorectal cancer. Science2001;294:1343–6.13. Haiman CA, Le Marchand L, Yamamato J, et al. Acommon genetic risk factor for colorectal and prostatecancer. Nat Genet 2007;39:954–6.14. Tomlinson I, Webb E, Carvajal-Carmona L, et al. Agenome-wide association scan of tag SNPs identifies asusceptibility variant for colorectal cancer at 8q24.21.Nat Genet 2007;39:984–8.15. Zanke BW, Greenwood CM, Rangrej J, et al. Genome-wide association scan identifies a colorectal cancersusceptibility locus on chromosome 8q24. Nat Genet2007;39:989–94.16. Sebat J, Lakshmi B, Troge J, et al. Large-scale copy
Cancer Research
Cancer Res 2008; 68: (5). March 1, 2008 1294 www.aacrjournals.org
Research. on December 27, 2015. © 2008 American Association for Cancercancerres.aacrjournals.org Downloaded from
number polymorphism in the human genome. Science2004;305:525–8.17. Iafrate AJ, Feuk L, Rivera MN, et al. Detection oflarge-scale variation in the human genome. Nat Genet2004;36:949–51.18. Redon R, Ishikawa S, Fitch KR, et al. Global variationin copy number in the human genome. Nature 2006;444:444–54.19. Stranger BE, Forrest MS, Dunning M, et al. Relativeimpact of nucleotide and copy number variation ongene expression phenotypes. Science 2007;315:848–53.20. Feuk L, Carson AR, Scherer SW. Structural variationin the human genome. Nat Rev Genet 2006;7:85–97.21. Padilla-Nash HM, Heselmeyer-Haddad K, Wangsa D,et al. Jumping translocations are common in solidtumor cell lines and result in recurrent fusions of wholechromosome arms. Genes Chromosomes Cancer 2001;30:349–63.22. Bailey JA, Eichler EE. Primate segmental duplica-tions: crucibles of evolution, diversity and disease. NatRev Genet 2006;7:552–64.23. Sobin LH, Wittekind C. UICC: TNM classification ofmalignant tumors. 6th ed. New York: Wiley-Liss; 2002.24. Rodriguez V, Chen Y, Elkahloun A, Dutra A, Pak E,Chandrasekharappa S. Chromosome 8 BAC arraycomparative genomic hybridization and expressionanalysis identify amplification and overexpression ofTRMT12 in breast cancer. Genes Chromosomes Cancer2007;46:694–707.25. Grade M, Hormann P, Becker S, et al. Geneexpression profiling reveals a massive, aneuploidy-dependent transcriptional deregulation and distinctdifferences between lymph node-negative and lymphnode-positive colon carcinomas. Cancer Res 2007;67:41–56.26. Olshen AB, Venkatraman ES, Lucito R, Wigler M.Circular binary segmentation for the analysis of array-based DNA copy number data. Biostatistics 2004;5:557–72.27. Ried T, Knutzen R, Steinbeck R, et al. Comparativegenomic hybridization reveals a specific pattern of
chromosomal gains and losses during the genesis ofcolorectal tumors. Genes Chromosomes Cancer 1996;15:234–45.28. Grade M, Becker H, Liersch T, Ried T, Ghadimi BM.Molecular cytogenetics: Genomic imbalances in colo-rectal cancer and their clinical impact. Cell Oncol 2006;28:71–84.29. Upender MB, Habermann JK, McShane LM, et al.Chromosome transfer induced aneuploidy results incomplex dysregulation of the cellular transcriptome inimmortalized and cancer cells. Cancer Res 2004;64:6941–9.30. Monni O, Barlund M, Mousses S, et al. Comprehen-sive copy number and gene expression profiling of the17q23 amplicon in human breast cancer. Proc Natl AcadSci U S A 2001;98:5711–6.31. Pollack JR, Sorlie T, Perou CM, et al. Microarrayanalysis reveals a major direct role of DNA copynumber alteration in the transcriptional program ofhuman breast tumors. Proc Natl Acad Sci U S A 2002;99:12963–8.32. Tsafrir D, Bacolod M, Selvanayagam Z, et al.Relationship of gene expression and chromosomalabnormalities in colorectal cancer. Cancer Res 2006;66:2129–37.33. Grade M, Ghadimi BM, Varma S, et al. Aneuploidy-dependent massive deregulation of the cellular tran-scriptome and apparent divergence of the Wnt/h-catenin signaling pathway in human rectal carcinomas.Cancer Res 2006;66:267–82.34. The International HapMap Consortium. A haplotypemap of the human genome. Nature 2005;437:1299–320.35. Wong KK, de Leeuw RJ, Dosanjh NS, et al. Acomprehensive analysis of common copy-number var-iations in the human genome. Am J Hum Genet 2007;80:91–104.36. Pole JC, Courtay-Cahen C, Garcia MJ, et al. High-resolution analysis of chromosome rearrangements on8p in breast, colon and pancreatic cancer reveals acomplex pattern of loss, gain and translocation.Oncogene 2006;25:5693–706.
37. Cremer T, Cremer C. Chromosome territories,nuclear architecture and gene regulation in mammaliancells. Nat Rev Genet 2001;2:292–301.38. Gorgoulis VG, Vassiliou LV, Karakaidos P, et al.Activation of the DNA damage checkpoint and genomicinstability in human precancerous lesions. Nature 2005;434:907–13.39. Bartkova J, Horejsi Z, Koed K, et al. DNA damageresponse as a candidate anti-cancer barrier in earlyhuman tumorigenesis. Nature 2005;434:864–70.40. Serrano M, Lin AW, McCurrach ME, Beach D, LoweSW. Oncogenic ras provokes premature cell senescenceassociated with accumulation of p53 and p16INK4a. Cell1997;88:593–602.41. Di Micco R, Fumagalli M, Cicalese A, et al. Oncogene-induced senescence is a DNA damage responsetriggered by DNA hyper-replication. Nature 2006;444:638–42.42. Bartkova J, Rezaei N, Liontos M, et al. Oncogene-induced senescence is part of the tumorigenesis barrierimposed by DNA damage checkpoints. Nature 2006;444:633–7.43. Xu M, Yu Q, Subrahmanyam R, et al. B–Cateninexpression results in p53-independent DNA damageand oncogene-induced-senescence in pre-lymph-omagenic thymocytes in vivo . Mol Cell Bio. In press2008.44. Braig M, Lee S, Loddenkemper C, et al. Oncogene-induced senescence as an initial barrier in lymphomadevelopment. Nature 2005;436:660–5.45. Chen Z, Trotman LC, Shaffer D, et al. Crucial roleof p53-dependent cellular senescence in suppressionof Pten-deficient tumorigenesis. Nature 2005;436:725–30.46. Collado M, Gil J, Efeyan A, et al. Tumour biology:senescence in premalignant tumours. Nature 2005;436:642.47. Michaloglou C, Vredeveld LC, Soengas MS, et al.BRAFE600-associated senescence-like cell cycle arrest ofhuman naevi. Nature 2005;436:720–4.48. Sharpless NE, DePinho RA. Cancer: crime andpunishment. Nature 2005;436:636–7.
Chromosomal Breakpoints Cluster at Copy Number Variants
www.aacrjournals.org 1295 Cancer Res 2008; 68: (5). March 1, 2008
Research. on December 27, 2015. © 2008 American Association for Cancercancerres.aacrjournals.org Downloaded from
2008;68:1284-1295. Cancer Res Jordi Camps, Marian Grade, Quang Tri Nguyen, et al. at Sites of Structural Variants in the GenomeChromosomal Breakpoints in Primary Colon Cancer Cluster
Updated version
http://cancerres.aacrjournals.org/content/68/5/1284
Access the most recent version of this article at:
Material
Supplementary
http://cancerres.aacrjournals.org/content/suppl/2008/02/27/68.5.1284.DC1.html
Access the most recent supplemental material at:
Cited articles
http://cancerres.aacrjournals.org/content/68/5/1284.full.html#ref-list-1
This article cites 45 articles, 14 of which you can access for free at:
Citing articles
http://cancerres.aacrjournals.org/content/68/5/1284.full.html#related-urls
This article has been cited by 14 HighWire-hosted articles. Access the articles at:
E-mail alerts related to this article or journal.Sign up to receive free email-alerts
Subscriptions
Reprints and
To order reprints of this article or to subscribe to the journal, contact the AACR Publications
Permissions
To request permission to re-use all or part of this article, contact the AACR Publications
Research. on December 27, 2015. © 2008 American Association for Cancercancerres.aacrjournals.org Downloaded from
Copyright © 2022 FDOKUMEN