Mapping of the chromosomal amplification 1p21-22 in bladder cancer
8
RESEARCH ARTICLE Open Access Mapping of the chromosomal amplification 1p21-22 in bladder cancer Mauro Scaravilli 1 , Paola Asero 1 , Teuvo LJ Tammela 1,2 , Tapio Visakorpi 1 and Outi R Saramäki 1* Abstract Background: The aim of the study was to characterize a recurrent amplification at chromosomal region 1p21-22 in bladder cancer. Methods: ArrayCGH (aCGH) was performed to identify DNA copy number variations in 7 clinical samples and 6 bladder cancer cell lines. FISH was used to map the amplicon at 1p21-22 in the cell lines. Gene expression microarrays and qRT-PCR were used to study the expression of putative target genes in the region. Results: aCGH identified an amplification at 1p21-22 in 10/13 (77%) samples. The minimal region of the amplification was mapped to a region of about 1 Mb in size, containing a total of 11 known genes. The highest amplification was found in SCaBER squamous cell carcinoma cell line. Four genes, TMED5, DR1, RPL5 and EVI5, showed significant overexpression in the SCaBER cell line compared to all the other samples tested. Oncomine database analysis revealed upregulation of DR1 in superficial and infiltrating bladder cancer samples, compared to normal bladder. Conclusions: In conclusions, we have identified and mapped chromosomal amplification at 1p21-22 in bladder cancer as well as studied the expression of the genes in the region. DR1 was found to be significantly overexpressed in the SCaBER, which is a model of squamous cell carcinoma. However, the overexpression was found also in a published clinical sample cohort of superficial and infiltrating bladder cancers. Further studies with more clinical material are needed to investigate the role of the amplification at 1p21-22. Keywords: Gene amplification, Bladder cancer, DR1, aCGH Background Bladder cancer is the fourth most common cancer in men in developed countries and the second most common ma- lignancy of the urinary tract [1]. The majority of bladder cancer cases arise from the urothelium, the epithelium lining the inside of the bladder and these cases are thus called urothelial carcinomas. Squamous cell carcinoma of the urinary bladder is a rarer malignant neoplasm and it accounts for 3–5% of bladder cancer in Western popula- tions [2]. Several studies have investigated the chromosomal alter- ations associated with development and progression of bladder cancer. Different methods to detect copy number changes, such as classical cytogenetics, interphase fluores- cence in situ hybridization (FISH), Southern blot analysis, quantitative polymerase chain reaction (PCR)-based assays and comparative genomic hybridization (CGH) have been used [3]. Several CGH studies providing information about typ- ical losses, gains and amplifications in bladder cancer have been published [4-8]. However, the resolution of conven- tional CGH is generally limited to regions greater than 10 Mb. The development of array-based technologies for CGH [9,10] led to > 10-fold increase of the resolution and consequently to the analysis of copy number alterations at single gene level. A few array-CGH (aCGH) genome-wide studies have been performed on both clinical bladder cancers [11,12] as well as cell lines [13]. They have highlighted copy-number alterations in smaller scale, with high accuracy of localization. Some of these genetic changes have been associated with known oncogenes or tumor suppressor genes. Loss of genetic material on chromosome 9 is one of the most frequent alteration in TCC, with 9p and 9q, often both, lost entirely or in part * Correspondence: [email protected] 1 Prostate Cancer Research Center, Institute of Biosciences and Medical Technology - BioMediTech, University of Tampere and Tampere University Hospital, Tampere, Finland Full list of author information is available at the end of the article © 2014 Scaravilli et al.; licensee BioMed Central Ltd. This is an Open Access article distributed under the terms of the Creative Commons Attribution License (http://creativecommons.org/licenses/by/4.0), which permits unrestricted use, distribution, and reproduction in any medium, provided the original work is properly credited. The Creative Commons Public Domain Dedication waiver (http://creativecommons.org/publicdomain/zero/1.0/) applies to the data made available in this article, unless otherwise stated. Scaravilli et al. BMC Research Notes 2014, 7:547 http://www.biomedcentral.com/1756-0500/7/547
Transcript of Mapping of the chromosomal amplification 1p21-22 in bladder cancer

Scaravilli et al. BMC Research Notes 2014, 7:547http://www.biomedcentral.com/1756-0500/7/547
RESEARCH ARTICLE Open Access
Mapping of the chromosomal amplification1p21-22 in bladder cancerMauro Scaravilli1, Paola Asero1, Teuvo LJ Tammela1,2, Tapio Visakorpi1 and Outi R Saramäki1*
Abstract
Background: The aim of the study was to characterize a recurrent amplification at chromosomal region 1p21-22 inbladder cancer.
Methods: ArrayCGH (aCGH) was performed to identify DNA copy number variations in 7 clinical samples and 6bladder cancer cell lines. FISH was used to map the amplicon at 1p21-22 in the cell lines. Gene expression microarraysand qRT-PCR were used to study the expression of putative target genes in the region.
Results: aCGH identified an amplification at 1p21-22 in 10/13 (77%) samples. The minimal region of the amplificationwas mapped to a region of about 1 Mb in size, containing a total of 11 known genes. The highest amplification wasfound in SCaBER squamous cell carcinoma cell line. Four genes, TMED5, DR1, RPL5 and EVI5, showed significantoverexpression in the SCaBER cell line compared to all the other samples tested. Oncomine database analysis revealedupregulation of DR1 in superficial and infiltrating bladder cancer samples, compared to normal bladder.
Conclusions: In conclusions, we have identified and mapped chromosomal amplification at 1p21-22 in bladder canceras well as studied the expression of the genes in the region. DR1 was found to be significantly overexpressed in theSCaBER, which is a model of squamous cell carcinoma. However, the overexpression was found also in a publishedclinical sample cohort of superficial and infiltrating bladder cancers. Further studies with more clinical material areneeded to investigate the role of the amplification at 1p21-22.
Keywords: Gene amplification, Bladder cancer, DR1, aCGH
BackgroundBladder cancer is the fourth most common cancer in menin developed countries and the second most common ma-lignancy of the urinary tract [1]. The majority of bladdercancer cases arise from the urothelium, the epitheliumlining the inside of the bladder and these cases are thuscalled urothelial carcinomas. Squamous cell carcinoma ofthe urinary bladder is a rarer malignant neoplasm and itaccounts for 3–5% of bladder cancer in Western popula-tions [2].Several studies have investigated the chromosomal alter-
ations associated with development and progression ofbladder cancer. Different methods to detect copy numberchanges, such as classical cytogenetics, interphase fluores-cence in situ hybridization (FISH), Southern blot analysis,
* Correspondence: [email protected] Cancer Research Center, Institute of Biosciences and MedicalTechnology - BioMediTech, University of Tampere and Tampere UniversityHospital, Tampere, FinlandFull list of author information is available at the end of the article
© 2014 Scaravilli et al.; licensee BioMed CentraCommons Attribution License (http://creativecreproduction in any medium, provided the orDedication waiver (http://creativecommons.orunless otherwise stated.
quantitative polymerase chain reaction (PCR)-based assaysand comparative genomic hybridization (CGH) have beenused [3].Several CGH studies providing information about typ-
ical losses, gains and amplifications in bladder cancer havebeen published [4-8]. However, the resolution of conven-tional CGH is generally limited to regions greater than10 Mb. The development of array-based technologies forCGH [9,10] led to > 10-fold increase of the resolution andconsequently to the analysis of copy number alterations atsingle gene level. A few array-CGH (aCGH) genome-widestudies have been performed on both clinical bladdercancers [11,12] as well as cell lines [13]. They havehighlighted copy-number alterations in smaller scale, withhigh accuracy of localization. Some of these geneticchanges have been associated with known oncogenes ortumor suppressor genes. Loss of genetic material onchromosome 9 is one of the most frequent alteration inTCC, with 9p and 9q, often both, lost entirely or in part
l Ltd. This is an Open Access article distributed under the terms of the Creativeommons.org/licenses/by/4.0), which permits unrestricted use, distribution, andiginal work is properly credited. The Creative Commons Public Domaing/publicdomain/zero/1.0/) applies to the data made available in this article,
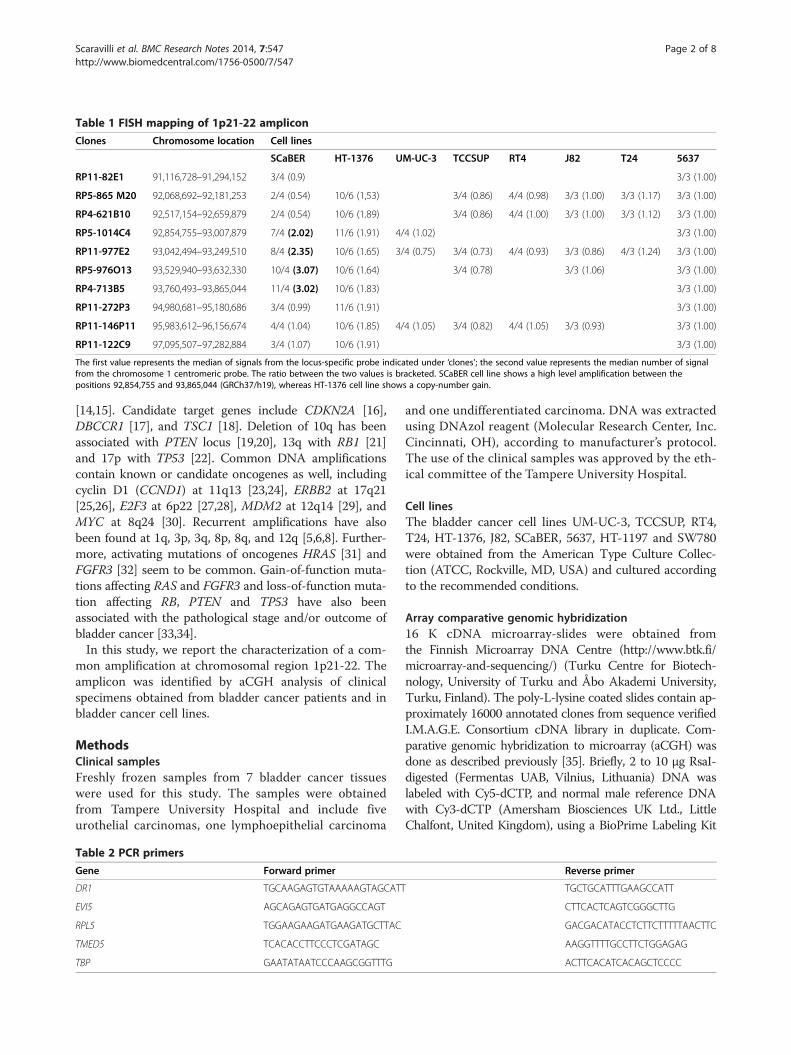
Table 1 FISH mapping of 1p21-22 amplicon
Clones Chromosome location Cell lines
SCaBER HT-1376 UM-UC-3 TCCSUP RT4 J82 T24 5637
RP11-82E1 91,116,728–91,294,152 3/4 (0.9) 3/3 (1.00)
RP5-865 M20 92,068,692–92,181,253 2/4 (0.54) 10/6 (1,53) 3/4 (0.86) 4/4 (0.98) 3/3 (1.00) 3/3 (1.17) 3/3 (1.00)
RP4-621B10 92,517,154–92,659,879 2/4 (0.54) 10/6 (1.89) 3/4 (0.86) 4/4 (1.00) 3/3 (1.00) 3/3 (1.12) 3/3 (1.00)
RP5-1014C4 92,854,755–93,007,879 7/4 (2.02) 11/6 (1.91) 4/4 (1.02) 3/3 (1.00)
RP11-977E2 93,042,494–93,249,510 8/4 (2.35) 10/6 (1.65) 3/4 (0.75) 3/4 (0.73) 4/4 (0.93) 3/3 (0.86) 4/3 (1.24) 3/3 (1.00)
RP5-976O13 93,529,940–93,632,330 10/4 (3.07) 10/6 (1.64) 3/4 (0.78) 3/3 (1.06) 3/3 (1.00)
RP4-713B5 93,760,493–93,865,044 11/4 (3.02) 10/6 (1.83) 3/3 (1.00)
RP11-272P3 94,980,681–95,180,686 3/4 (0.99) 11/6 (1.91) 3/3 (1.00)
RP11-146P11 95,983,612–96,156,674 4/4 (1.04) 10/6 (1.85) 4/4 (1.05) 3/4 (0.82) 4/4 (1.05) 3/3 (0.93) 3/3 (1.00)
RP11-122C9 97,095,507–97,282,884 3/4 (1.07) 10/6 (1.91) 3/3 (1.00)
The first value represents the median of signals from the locus-specific probe indicated under ‘clones’; the second value represents the median number of signalfrom the chromosome 1 centromeric probe. The ratio between the two values is bracketed. SCaBER cell line shows a high level amplification between thepositions 92,854,755 and 93,865,044 (GRCh37/h19), whereas HT-1376 cell line shows a copy-number gain.
Scaravilli et al. BMC Research Notes 2014, 7:547 Page 2 of 8http://www.biomedcentral.com/1756-0500/7/547
[14,15]. Candidate target genes include CDKN2A [16],DBCCR1 [17], and TSC1 [18]. Deletion of 10q has beenassociated with PTEN locus [19,20], 13q with RB1 [21]and 17p with TP53 [22]. Common DNA amplificationscontain known or candidate oncogenes as well, includingcyclin D1 (CCND1) at 11q13 [23,24], ERBB2 at 17q21[25,26], E2F3 at 6p22 [27,28], MDM2 at 12q14 [29], andMYC at 8q24 [30]. Recurrent amplifications have alsobeen found at 1q, 3p, 3q, 8p, 8q, and 12q [5,6,8]. Further-more, activating mutations of oncogenes HRAS [31] andFGFR3 [32] seem to be common. Gain-of-function muta-tions affecting RAS and FGFR3 and loss-of-function muta-tion affecting RB, PTEN and TP53 have also beenassociated with the pathological stage and/or outcome ofbladder cancer [33,34].In this study, we report the characterization of a com-
mon amplification at chromosomal region 1p21-22. Theamplicon was identified by aCGH analysis of clinicalspecimens obtained from bladder cancer patients and inbladder cancer cell lines.
MethodsClinical samplesFreshly frozen samples from 7 bladder cancer tissueswere used for this study. The samples were obtainedfrom Tampere University Hospital and include fiveurothelial carcinomas, one lymphoepithelial carcinoma
Table 2 PCR primers
Gene Forward primer
DR1 TGCAAGAGTGTAAAAAGTAGCATT
EVI5 AGCAGAGTGATGAGGCCAGT
RPL5 TGGAAGAAGATGAAGATGCTTAC
TMED5 TCACACCTTCCCTCGATAGC
TBP GAATATAATCCCAAGCGGTTTG
and one undifferentiated carcinoma. DNA was extractedusing DNAzol reagent (Molecular Research Center, Inc.Cincinnati, OH), according to manufacturer’s protocol.The use of the clinical samples was approved by the eth-ical committee of the Tampere University Hospital.
Cell linesThe bladder cancer cell lines UM-UC-3, TCCSUP, RT4,T24, HT-1376, J82, SCaBER, 5637, HT-1197 and SW780were obtained from the American Type Culture Collec-tion (ATCC, Rockville, MD, USA) and cultured accordingto the recommended conditions.
Array comparative genomic hybridization16 K cDNA microarray-slides were obtained fromthe Finnish Microarray DNA Centre (http://www.btk.fi/microarray-and-sequencing/) (Turku Centre for Biotech-nology, University of Turku and Åbo Akademi University,Turku, Finland). The poly-L-lysine coated slides contain ap-proximately 16000 annotated clones from sequence verifiedI.M.A.G.E. Consortium cDNA library in duplicate. Com-parative genomic hybridization to microarray (aCGH) wasdone as described previously [35]. Briefly, 2 to 10 μg RsaI-digested (Fermentas UAB, Vilnius, Lithuania) DNA waslabeled with Cy5-dCTP, and normal male reference DNAwith Cy3-dCTP (Amersham Biosciences UK Ltd., LittleChalfont, United Kingdom), using a BioPrime Labeling Kit
Reverse primer
TGCTGCATTTGAAGCCATT
CTTCACTCAGTCGGGCTTG
GACGACATACCTCTTCTTTTTAACTTC
AAGGTTTTGCCTTCTGGAGAG
ACTTCACATCACAGCTCCCC

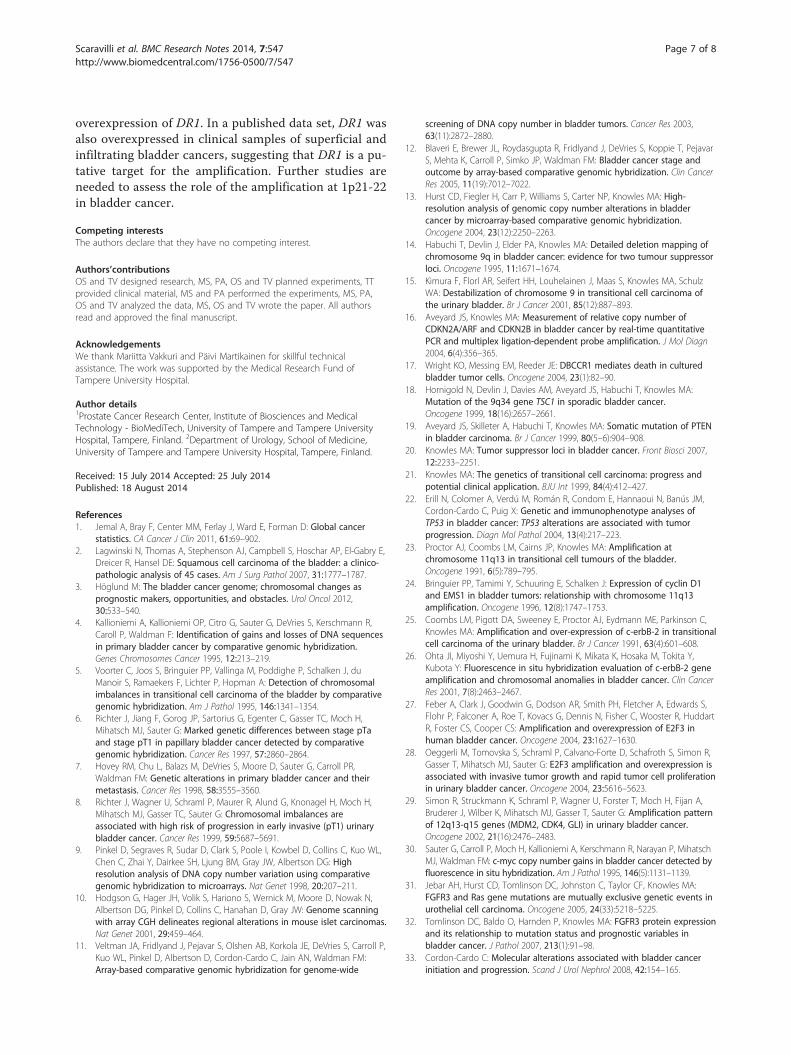
Figure 1 Fluorescence in situ hybridization. (a) HT-1376 cell line nuclei hybridized with the BAC clone RP11-122C9 showing copy number gain(RED: RP11-122C9, GREEN: pericentromeric chr.1), and (b) nuclei of SCaBER squamous cell carcinoma cell line model hybridized with the PACclone RP4-713B5, showing a high level amplification (colors as in a).
Scaravilli et al. BMC Research Notes 2014, 7:547 Page 3 of 8http://www.biomedcentral.com/1756-0500/7/547
(Invitrogen). The sample and reference DNAs were co-hybridized overnight at +65°C, under cover slips, to micro-array slides, in a final volume of 38.5 μl of hybridizationmix containing 3.4 × SSC, 0.3% SDS, 1.3 ×Denhardt’s(Sigma-Aldrich, St. Louis, MO), and 0.5 ×DIG BlockingBuffer (Roche Diagnostics, Mannheim, Germany). Afterstringent washes, the slides were scanned with ScanAr-ray4000 confocal laser scanner (Perkin Elmer, Boston, MA).Signal volumes were quantified using the QuantArray soft-ware program (Packard Bioscience, Bio- Chip TechnologyLCC, Billerica, MA). Data were analyzed using the clusteralong chromosomes (CLAC) algorithm, as previously de-scribed and visualized using the software CGH-Miner [36].
Fluorescence in situ hybridizationHuman genome PAC/BAC clones were purchased fromInvitrogen™ Corporation. The list of clones is shown inTable 1 and the chromosome positions are indicatedaccording to UCSC (University of California Santa Cruz)Genome Browser, February 2009 assembly (GRCh37/h19).The clones were labeled with digoxigenin-dUTP (RocheDiagnostics) or Alexa Fluor®-dUTP (Invitrogen™) by nick
Table 3 Known human genes at chromosome 1 position 92,9
NAME DESCRIPTION
GFI1 Growth factor independent 1 transcription repressor (GFI1
EVI5 Ecotropic viral integration site 5 (EVI5)
RPL5 Ribosomal protein L5 (RPL5)
SNORD21 Small nucleolar RNA, C/D box 21 (SNORD21), small nucleo
SNORA66 Small nucleolar RNA, H/ACA box 66 (SNORA66), small nuc
FAM69A Family with sequence similarity 69, member A (FAM69A)
MTF2 Metal response element binding transcription factor 2 (MT
TMED5 Transmembrane emp24 protein transport domain contain
CCDC18 Coiled-coil domain containing 18 (CCDC18)
LOC100131564 Uncharacterized LOC100131564 (LOC100131564), non-cod
DR1 Down-regulator of transcription 1, TBP-binding (negative c
translation. A pericentromeric probe for chromosome 1labeled with FITC-dUTP was obtained from Roche. Themetaphase slides from the bladder cancer cell lines wereprepared using standard techniques. The slides were dena-tured in 70% formamide/2xSSC at 70°C for 2 min anddehydrated in an ascending ethanol series. Hybridizationwas performed over night at 37°C. After stringent washes,the slides were stained with antidigoxigenin-rhodamine(Roche Diagnostics) for the digoxigenin-labeled probesand embedded in an antifade solution (Vectashied, VectorLaboratories, Burlingame, CA, USA) containing 4,6-dia-midino-2-phenylindole (DAPI) as counter stain. Stainedslides were analyzed on an epifluorescence microscope(Olympus) and acquired images were processed usingImage-Pro® image-processing software (Media Cybernet-ics). A total of 50 nuclei were considered for statisticalanalysis of the FISH signals in each experiment. An ampli-fication was defined as a locus-specific probe/centromereratio >2. In each experiment the hybridization efficiencyof the locus-specific and centromeric probes was evalu-ated using 5637 bladder cancer cell line as a triploidcontrol.
40,318 - 93,828,148 (GRCh37/h19)
LOCATION GENOMIC SIZE (bp)
) chr1:92,940,318 – 92,952,433 12116
chr1:92,974,253 – 93,257,961 283709
chr1:93,297,594 – 93,307,481 9887
lar RNA chr1:93,302,846 – 93,302,940 95
leolar RNA chr1:93,306,276 – 93,306,408 133
chr1:93,307,717 – 93,427,079 128794
F2) chr1:93,544,792 – 93,604,638 59847
ing 5 (TMED5) chr1:93,615,299 – 93,646,246 30948
chr1:93,646,281 – 93,744,287 98007
ing RNA chr1:93,775,666 – 93,811,368 35703
ofactor 2) (DR1) chr1:93,811,478 – 93,828,148 16671

Figure 2 (See legend on next page.)
Scaravilli et al. BMC Research Notes 2014, 7:547 Page 4 of 8http://www.biomedcentral.com/1756-0500/7/547

(See figure on previous page.)Figure 2 Fine mapping the region of amplification. Chromosome 1 ideogram showing the region of amplification according to aCGH(above), the FISH scoring data on SCaBER cell lines indicating the minimal region of amplicon (in gray), and (below) an expression heatmap ofthe genes at chromosome 1, position 92,940,318 – 93,828,148 (red: overexpression, blue: underexpression), showing significant relativeoverexpression of TMED5, DR1, EVI5 and RPL5 in the SCaBER cell line.
Scaravilli et al. BMC Research Notes 2014, 7:547 Page 5 of 8http://www.biomedcentral.com/1756-0500/7/547
RNA extraction and gene expression microarrayTotal RNA from bladder cancer cell lines was collectedand extracted using TRIzol reagent (Invitrogen, Carlsbad,CA, USA), according to the manufacturer’s protocol. Thesamples were then amplified and hybridized using theAgilent whole genome oligo microarray platform (AgilentTechnologies, Palo Alto, CA, USA) and Xpress Ref ™Human Universal Reference Total RNA (SuperArray Bio-science Corporation) was used as a reference. The result-ing data files from Agilent Feature Extraction Software(version 9.5.1.1) were imported into the Agilent Gene-Spring GX software (version 11.0) for further analysis. Afold-change cutoff of 2 was used to determine differentialgene expression.
Real time quantitative polymerase chain reaction(qRT-PCR)Total RNA from bladder cancer cell lines, extracted asdescribed above, was reverse transcribed using randomhexamere primers and AMV reverse transcriptase(Thermo Scientific). Quantitative Real Time PCR wasperformed using Maxima SYBR Green/ROX qPCR Mas-ter Mix (Thermo Scientific) and a BioRad CFX96 ™ Real-Time PCR Detection System. Each sample was run induplicate and expression values were normalized againstTATA-binding protein (TBP). The primer sequences areshown in Table 2.
ResultsIdentification of the common amplicon at 1p21-22The CLAC-analysis of the aCGH data from clinical sam-ples and bladder cancer cell lines showed a region of in-creased copy number at chromosome 1p21-22 in 5 of 7total clinical samples as well as in bladder cancer cell lines,5637, RT4, T24, SW780 and SCaBER (data not shown).According to aCGH, the common region of gain com-prised of 2 Mb.
Fine mapping of the 1p21-22 regionThe region 1p21-22 was studied in bladder cancer celllines by FISH analysis on interphase nuclei (Figure 1).All cell lines showed increased copy number of 1p21-22region, and SCaBER cells where the only one whichshowed high-level amplification of the region (Figure 1b).We extensively analyzed cell lines with the PAC/BACclones spanning a total of 6 Mb and were able to identify aminimal region of amplification between the chromosome
positions 92,940,318 and 93,828,148 (Table 2). Ac-cording to UCSC Genes Feb. 2009 GRCh37/hg19, atotal of 11 human genes are located within the ampli-con. Nine of them are known protein-coding genes(Table 3).
Microarray and qRT-PCR validationThe analysis of gene expression by microarray showedsignificant overexpression of 4 genes, namely DR1, EVI5,RPL5 and TMED5 only in the SCaBER, which harborsthe highest level of amplification of the region (Figure 2).The results were validated by qRT-PCR and confirmedthe overexpression of the genes in SCaBER, as comparedto all the other cell lines (Figure 3). In addition, Onco-mine database analysis for DR1 expression in bladdercancer revealed a statistically significant (P < 0.0001) up-regulation of the gene in clinical samples of both super-ficial and infiltrating bladder cancer, when compared tonormal bladder [37] (Figure 4). TMED5 showed signifi-cant upregulation in superficial bladder cancer, whencompared to normal, whereas RPL5 and EVI5 did notshow significant changes of expression levels in the samedataset.
DiscussionIn this study, aCGH technology was utilized to identifynew regions of amplifications in bladder cancer. Recurrentamplification was found in chromosomal locus 1p21-22.Subsequently, the locus was fine-mapped and character-ized in the bladder cancer cell lines. Of the cell lines SCa-BER showed the highest amplification of the region, thusit was used for mapping the amplicon. Fine mapping withthe SCaBER model, the region was defined to ~1 Mb ofsize, containing 11 genes.cDNA microarray and qRT-PCR analyses were used to
measure the expression of these genes in bladder cancercell lines. DR1, EVI5, RPL5, and TMED5 showed overex-pression in SCaBER compared to the other cell lines.DR1 was found to be the most significantly overex-pressed of the examined genes. Since SCaBER is a squa-mous cell carcinoma cell line, we wished to interrogatewhether DR1 is overexpressed also in the urothelialcarcinoma. We utilized Oncomine database of clinicalsamples, which showed overexpression of DR1 also insuperficial and infiltrating bladder cancer.DR1 is also known as NC2beta and has been shown to
bind DRAP1 to repress RNA polymerase II gene tran-scription [38]. Despite targeting the general transcription

Figure 3 qRT-PCR validation of microarray expression data. DR1 (a), EVI5 (b), RPL5 (c) and TMED5 (d), showing the highest level ofexpression in the SCaBER model, when compared to the other cell lines tested. The expression values of the genes were normalized against TBP.
Scaravilli et al. BMC Research Notes 2014, 7:547 Page 6 of 8http://www.biomedcentral.com/1756-0500/7/547
machinery, only a subset of mRNAs has been shown torespond to the DR1/DRAP1 inhibition [39] and the op-posite transcription inducing effect of DR1/DRAP1 hasalso been shown for some mRNAs, suggesting the possi-bility of a specific regulatory effect [40].According to Oncomine database DR1, EVI5, TMED5
and RPL5 are co-amplified also in brain [41-43], colon[44], lung cancer [45] and melanoma [46], indicating that
Figure 4 DR1 expression in bladder cancer according to Oncomine. Sfound in superficial (a) and infiltrating (b) bladder cancer, when comparedSanchez-Carbayo study (Sanchez-Carbayo et al., 2006).
amplification of 1p21-22 may be a recurrent alteration inseveral different types of cancers.
ConclusionsWe have identified and mapped a common chromo-somal amplification at 1p21-22 in bladder cancer. Squa-mous cell carcinoma cell line SCaBER, which had thehighest level of amplification of the region, showed
tatistically significant (p < 0.0001) upregulation of DR1 expression wasto normal bladder. A total of 157 samples were used in the
Scaravilli et al. BMC Research Notes 2014, 7:547 Page 7 of 8http://www.biomedcentral.com/1756-0500/7/547
overexpression of DR1. In a published data set, DR1 wasalso overexpressed in clinical samples of superficial andinfiltrating bladder cancers, suggesting that DR1 is a pu-tative target for the amplification. Further studies areneeded to assess the role of the amplification at 1p21-22in bladder cancer.
Competing interestsThe authors declare that they have no competing interest.
Authors’contributionsOS and TV designed research, MS, PA, OS and TV planned experiments, TTprovided clinical material, MS and PA performed the experiments, MS, PA,OS and TV analyzed the data, MS, OS and TV wrote the paper. All authorsread and approved the final manuscript.
AcknowledgementsWe thank Mariitta Vakkuri and Päivi Martikainen for skillful technicalassistance. The work was supported by the Medical Research Fund ofTampere University Hospital.
Author details1Prostate Cancer Research Center, Institute of Biosciences and MedicalTechnology - BioMediTech, University of Tampere and Tampere UniversityHospital, Tampere, Finland. 2Department of Urology, School of Medicine,University of Tampere and Tampere University Hospital, Tampere, Finland.
Received: 15 July 2014 Accepted: 25 July 2014Published: 18 August 2014
References1. Jemal A, Bray F, Center MM, Ferlay J, Ward E, Forman D: Global cancer
statistics. CA Cancer J Clin 2011, 61:69–902.2. Lagwinski N, Thomas A, Stephenson AJ, Campbell S, Hoschar AP, El-Gabry E,
Dreicer R, Hansel DE: Squamous cell carcinoma of the bladder: a clinico-pathologic analysis of 45 cases. Am J Surg Pathol 2007, 31:1777–1787.
3. Höglund M: The bladder cancer genome; chromosomal changes asprognostic makers, opportunities, and obstacles. Urol Oncol 2012,30:533–540.
4. Kallioniemi A, Kallioniemi OP, Citro G, Sauter G, DeVries S, Kerschmann R,Caroll P, Waldman F: Identification of gains and losses of DNA sequencesin primary bladder cancer by comparative genomic hybridization.Genes Chromosomes Cancer 1995, 12:213–219.
5. Voorter C, Joos S, Bringuier PP, Vallinga M, Poddighe P, Schalken J, duManoir S, Ramaekers F, Lichter P, Hopman A: Detection of chromosomalimbalances in transitional cell carcinoma of the bladder by comparativegenomic hybridization. Am J Pathol 1995, 146:1341–1354.
6. Richter J, Jiang F, Gorog JP, Sartorius G, Egenter C, Gasser TC, Moch H,Mihatsch MJ, Sauter G: Marked genetic differences between stage pTaand stage pT1 in papillary bladder cancer detected by comparativegenomic hybridization. Cancer Res 1997, 57:2860–2864.
7. Hovey RM, Chu L, Balazs M, DeVries S, Moore D, Sauter G, Carroll PR,Waldman FM: Genetic alterations in primary bladder cancer and theirmetastasis. Cancer Res 1998, 58:3555–3560.
8. Richter J, Wagner U, Schraml P, Maurer R, Alund G, Knonagel H, Moch H,Mihatsch MJ, Gasser TC, Sauter G: Chromosomal imbalances areassociated with high risk of progression in early invasive (pT1) urinarybladder cancer. Cancer Res 1999, 59:5687–5691.
9. Pinkel D, Segraves R, Sudar D, Clark S, Poole I, Kowbel D, Collins C, Kuo WL,Chen C, Zhai Y, Dairkee SH, Ljung BM, Gray JW, Albertson DG: Highresolution analysis of DNA copy number variation using comparativegenomic hybridization to microarrays. Nat Genet 1998, 20:207–211.
10. Hodgson G, Hager JH, Volik S, Hariono S, Wernick M, Moore D, Nowak N,Albertson DG, Pinkel D, Collins C, Hanahan D, Gray JW: Genome scanningwith array CGH delineates regional alterations in mouse islet carcinomas.Nat Genet 2001, 29:459–464.
11. Veltman JA, Fridlyand J, Pejavar S, Olshen AB, Korkola JE, DeVries S, Carroll P,Kuo WL, Pinkel D, Albertson D, Cordon-Cardo C, Jain AN, Waldman FM:Array-based comparative genomic hybridization for genome-wide
screening of DNA copy number in bladder tumors. Cancer Res 2003,63(11):2872–2880.
12. Blaveri E, Brewer JL, Roydasgupta R, Fridlyand J, DeVries S, Koppie T, PejavarS, Mehta K, Carroll P, Simko JP, Waldman FM: Bladder cancer stage andoutcome by array-based comparative genomic hybridization. Clin CancerRes 2005, 11(19):7012–7022.
13. Hurst CD, Fiegler H, Carr P, Williams S, Carter NP, Knowles MA: High-resolution analysis of genomic copy number alterations in bladdercancer by microarray-based comparative genomic hybridization.Oncogene 2004, 23(12):2250–2263.
14. Habuchi T, Devlin J, Elder PA, Knowles MA: Detailed deletion mapping ofchromosome 9q in bladder cancer: evidence for two tumour suppressorloci. Oncogene 1995, 11:1671–1674.
15. Kimura F, Florl AR, Seifert HH, Louhelainen J, Maas S, Knowles MA, SchulzWA: Destabilization of chromosome 9 in transitional cell carcinoma ofthe urinary bladder. Br J Cancer 2001, 85(12):887–893.
16. Aveyard JS, Knowles MA: Measurement of relative copy number ofCDKN2A/ARF and CDKN2B in bladder cancer by real-time quantitativePCR and multiplex ligation-dependent probe amplification. J Mol Diagn2004, 6(4):356–365.
17. Wright KO, Messing EM, Reeder JE: DBCCR1 mediates death in culturedbladder tumor cells. Oncogene 2004, 23(1):82–90.
18. Hornigold N, Devlin J, Davies AM, Aveyard JS, Habuchi T, Knowles MA:Mutation of the 9q34 gene TSC1 in sporadic bladder cancer.Oncogene 1999, 18(16):2657–2661.
19. Aveyard JS, Skilleter A, Habuchi T, Knowles MA: Somatic mutation of PTENin bladder carcinoma. Br J Cancer 1999, 80(5–6):904–908.
20. Knowles MA: Tumor suppressor loci in bladder cancer. Front Biosci 2007,12:2233–2251.
21. Knowles MA: The genetics of transitional cell carcinoma: progress andpotential clinical application. BJU Int 1999, 84(4):412–427.
22. Erill N, Colomer A, Verdú M, Román R, Condom E, Hannaoui N, Banús JM,Cordon-Cardo C, Puig X: Genetic and immunophenotype analyses ofTP53 in bladder cancer: TP53 alterations are associated with tumorprogression. Diagn Mol Pathol 2004, 13(4):217–223.
23. Proctor AJ, Coombs LM, Cairns JP, Knowles MA: Amplification atchromosome 11q13 in transitional cell tumours of the bladder.Oncogene 1991, 6(5):789–795.
24. Bringuier PP, Tamimi Y, Schuuring E, Schalken J: Expression of cyclin D1and EMS1 in bladder tumors: relationship with chromosome 11q13amplification. Oncogene 1996, 12(8):1747–1753.
25. Coombs LM, Pigott DA, Sweeney E, Proctor AJ, Eydmann ME, Parkinson C,Knowles MA: Amplification and over-expression of c-erbB-2 in transitionalcell carcinoma of the urinary bladder. Br J Cancer 1991, 63(4):601–608.
26. Ohta JI, Miyoshi Y, Uemura H, Fujinami K, Mikata K, Hosaka M, Tokita Y,Kubota Y: Fluorescence in situ hybridization evaluation of c-erbB-2 geneamplification and chromosomal anomalies in bladder cancer. Clin CancerRes 2001, 7(8):2463–2467.
27. Feber A, Clark J, Goodwin G, Dodson AR, Smith PH, Fletcher A, Edwards S,Flohr P, Falconer A, Roe T, Kovacs G, Dennis N, Fisher C, Wooster R, HuddartR, Foster CS, Cooper CS: Amplification and overexpression of E2F3 inhuman bladder cancer. Oncogene 2004, 23:1627–1630.
28. Oeggerli M, Tomovska S, Schraml P, Calvano-Forte D, Schafroth S, Simon R,Gasser T, Mihatsch MJ, Sauter G: E2F3 amplification and overexpression isassociated with invasive tumor growth and rapid tumor cell proliferationin urinary bladder cancer. Oncogene 2004, 23:5616–5623.
29. Simon R, Struckmann K, Schraml P, Wagner U, Forster T, Moch H, Fijan A,Bruderer J, Wilber K, Mihatsch MJ, Gasser T, Sauter G: Amplification patternof 12q13-q15 genes (MDM2, CDK4, GLI) in urinary bladder cancer.Oncogene 2002, 21(16):2476–2483.
30. Sauter G, Carroll P, Moch H, Kallioniemi A, Kerschmann R, Narayan P, MihatschMJ, Waldman FM: c-myc copy number gains in bladder cancer detected byfluorescence in situ hybridization. Am J Pathol 1995, 146(5):1131–1139.
31. Jebar AH, Hurst CD, Tomlinson DC, Johnston C, Taylor CF, Knowles MA:FGFR3 and Ras gene mutations are mutually exclusive genetic events inurothelial cell carcinoma. Oncogene 2005, 24(33):5218–5225.
32. Tomlinson DC, Baldo O, Harnden P, Knowles MA: FGFR3 protein expressionand its relationship to mutation status and prognostic variables inbladder cancer. J Pathol 2007, 213(1):91–98.
33. Cordon-Cardo C: Molecular alterations associated with bladder cancerinitiation and progression. Scand J Urol Nephrol 2008, 42:154–165.

Scaravilli et al. BMC Research Notes 2014, 7:547 Page 8 of 8http://www.biomedcentral.com/1756-0500/7/547
34. Puzio-Kuter AM, Castillo-Martin M, Kinkade CW, Wang X, Shen TH, Matos T,Shen MM, Cordon-Cardo C, Abate-Shen C: Inactivation of p53 and Ptenpromotes invasive bladder cancer. Genes Dev 2009, 23(6):675–680.
35. Saramäki OR, Porkka KP, Vessella RL, Visakorpi T: Genetic aberrations inprostate cancer by microarray analysis. Int J Cancer 2006,119(6):1322–1329.
36. Wang P, Kim Y, Pollack J, Narasimhan B, Tibshirani R: A method for callinggains and losses in array CGH data. Biostatistics 2005, 6(1):45–58.
37. Sanchez-Carbayo M, Socci ND, Lozano J, Saint F, Cordon-Cardo C: Definingmolecular profiles of poor outcome in patients with invasive bladdercancer using oligonucleotide microarrays. J Clin Oncol 2006,24(5):778–789.
38. Mermelstein F, Yeung K, Cao J, Inostroza JA, Erdjument-Bromage H,Eagelson K, Landsman D, Levitt P, Tempst P, Reinberg D: Requirement of acorepressor for Dr1-mediated repression of transcription. Genes Dev 1996,10:1033–1048.
39. Geisberg JV, Holstege FC, Young RA, Struhl K: Yeast NC2 associates withthe RNA polymerase II preinitiation complex and selectively affectstranscription in vivo. Mol Cell Biol 2001, 21:2736–2742.
40. Cang Y, Prelich G: Direct stimulation of transcription by negative cofactor2 (NC2) through TATA-binding protein (TBP). Proc Natl Acad Sci U S A2002, 99:12727–12732.
41. Kurashina K, Yamashita Y, Ueno T, Koinuma K, Ohashi J, Horie H, Miyakura Y,Hamada T, Haruta H, Hatanaka H, Soda M, Choi YL, Takada S, Yasuda Y,Nagai H, Mano H: Chromosome copy number analysis in screening forprognosis-related genomic regions in colorectal carcinoma. Cancer Sci2008, 99(9):1835–1840.
42. Ramos AH, Dutt A, Mermel C, Perner S, Cho J, Lafargue CJ, Johnson LA,Stiedl AC, Tanaka KE, Bass AJ, Barretina J, Weir BA, Beroukhim R, Thomas RK,Minna JD, Chirieac LR, Lindeman NI, Giordano T, Beer DG, Wagner P,Wistuba II, Rubin MA, Meyerson M: Amplification of chromosomalsegment 4q12 in non-small cell lung cancer. Cancer Biol Ther 2009,8(21):2042–2050.
43. Maser RS, Choudhury B, Campbell PJ, Feng B, Wong KK, Protopopov A,O’Neil J, Gutierrez A, Ivanova E, Perna I, Lin E, Mani V, Jiang S, McNamara K,Zaghlul S, Edkins S, Stevens C, Brennan C, Martin ES, Wiedemeyer R,Kabbarah O, Nogueira C, Histen G, Aster J, Mansour M, Duke V, Foroni L,Fielding AK, Goldstone AH, Rowe JM et al. Chromosomally unstablemouse tumors have genomic alterations similar to diverse humancancers. Nature 2007, 447(7147):966–971.
44. George RE, Attiyeh EF, Li S, Moreau LA, Neuberg D, Li C, Fox EA, MeyersonM, Diller L, Fortina P, Look AT, Maris JM: Genome-wide analysis ofneuroblastomas using high-density single nucleotide polymorphismarrays. PLoS One 2007, 2(2):e255.
45. Northcott PA, Nakahara Y, Wu X, Feuk L, Ellison DW, Croul S, Mack S,Kongkham PN, Peacock J, Dubuc A, Ra YS, Zilberberg K, McLeod J, SchererSW, Sunil Rao J, Eberhart CG, Grajkowska W, Gillespie Y, Lach B, Grundy R,Pollack IF, Hamilton RL, Van Meter T, Carlotti CG, Boop F, Bigner D,Gilbertson RJ, Rutka JT, Taylor MD: Multiple recurrent genetic eventsconverge on control of histone lysine methylation in medulloblastoma.Nat Genet 2009, 4:465–472.
46. Kotliarov Y, Steed ME, Christopher N, Walling J, Su Q, Center A, Heiss J,Rosenblum M, Mikkelsen T, Zenklusen JC, Fine HA: High-resolution globalgenomic survey of 178 gliomas reveals novel regions of copy numberalteration and allelic imbalances. Cancer Res 2006, 66(19):9428–9436.
doi:10.1186/1756-0500-7-547Cite this article as: Scaravilli et al.: Mapping of the chromosomalamplification 1p21-22 in bladder cancer. BMC Research Notes 2014 7:547.
Submit your next manuscript to BioMed Centraland take full advantage of:
• Convenient online submission
• Thorough peer review
• No space constraints or color figure charges
• Immediate publication on acceptance
• Inclusion in PubMed, CAS, Scopus and Google Scholar
• Research which is freely available for redistribution
Submit your manuscript at www.biomedcentral.com/submit