Transcriptional recapitulation and subversion of embryonic colon development by mouse colon tumor...
26
Genome Biology 2007, 8:R131 comment reviews reports deposited research refereed research interactions information Open Access 2007 Kaiser et al. Volume 8, Issue 7, Article R131 Research Transcriptional recapitulation and subversion of embryonic colon development by mouse colon tumor models and human colon cancer Sergio Kaiser ¤* , Young-Kyu Park ¤† , Jeffrey L Franklin † , Richard B Halberg ‡ , Ming Yu § , Walter J Jessen * , Johannes Freudenberg * , Xiaodi Chen ‡ , Kevin Haigis ¶ , Anil G Jegga * , Sue Kong * , Bhuvaneswari Sakthivel * , Huan Xu * , Timothy Reichling ¥ , Mohammad Azhar # , Gregory P Boivin ** , Reade B Roberts § , Anika C Bissahoyo § , Fausto Gonzales †† , Greg C Bloom †† , Steven Eschrich †† , Scott L Carter ‡‡ , Jeremy E Aronow * , John Kleimeyer * , Michael Kleimeyer * , Vivek Ramaswamy * , Stephen H Settle † , Braden Boone † , Shawn Levy † , Jonathan M Graff §§ , Thomas Doetschman # , Joanna Groden ¥ , William F Dove ‡ , David W Threadgill § , Timothy J Yeatman †† , Robert J Coffey Jr † and Bruce J Aronow * Addresses: * Biomedical Informatics, Cincinnati Children's Hospital Medical Center, Cincinnati, OH 45229, USA. † Departments of Medicine, and Cell and Developmental Biology, Vanderbilt University and Department of Veterans Affairs Medical Center, Nashville, TN 37232, USA. ‡ McArdle Laboratory for Cancer Research, University of Wisconsin, Madison, WI 53706, USA. § Department of Genetics and Lineberger Cancer Center, University of North Carolina, Chapel Hill, NC 27599, USA. ¶ Molecular Pathology Unit and Center for Cancer Research, Massachusetts General Hospital, Charlestown, MA 02129, USA. ¥ Division of Human Cancer Genetics, The Ohio State University College of Medicine, Columbus, Ohio 43210-2207, USA. # Institute for Collaborative BioResearch, University of Arizona, Tucson, AZ 85721-0036, USA. ** University of Cincinnati, Department of Pathology and Laboratory Medicine, Cincinnati, OH 45267, USA. †† H Lee Moffitt Cancer Center and Research Institute, Tampa, FL 33612, USA. ‡‡ Children's Hospital Informatics Program at the Harvard-MIT Division of Health Sciences and Technology (CHIP@HST), Harvard Medical School, Boston, Massachusetts 02115, USA. §§ University of Texas Southwestern Medical Center at Dallas, Dallas, TX 75390, USA. ¤ These authors contributed equally to this work. Correspondence: Bruce J Aronow. Email: [email protected] © 2007 Kaiser et al.; licensee BioMed Central Ltd. This is an open access article distributed under the terms of the Creative Commons Attribution License (http://creativecommons.org/licenses/by/2.0), which permits unrestricted use, distribution, and reproduction in any medium, provided the original work is properly cited. Colon tumours recapitulate embryonic transcription <p>Colon tumors from four independent mouse models and 100 human colorectal cancers all exhibited striking recapitulation of embry- onic colon gene expression from embryonic days 13.5-18.5.</p> Abstract Background: The expression of carcino-embryonic antigen by colorectal cancer is an example of oncogenic activation of embryonic gene expression. Hypothesizing that oncogenesis-recapitulating- ontogenesis may represent a broad programmatic commitment, we compared gene expression patterns of human colorectal cancers (CRCs) and mouse colon tumor models to those of mouse colon development embryonic days 13.5-18.5. Published: 5 July 2007 Genome Biology 2007, 8:R131 (doi:10.1186/gb-2007-8-7-r131) Received: 22 August 2006 Revised: 12 February 2007 Accepted: 5 July 2007 The electronic version of this article is the complete one and can be found online at http://genomebiology.com/2007/8/7/R131
-
Upload
vanderbilt -
Category
Documents
-
view
1 -
download
0
Transcript of Transcriptional recapitulation and subversion of embryonic colon development by mouse colon tumor...

com
ment
reviews
reports
deposited research
refereed researchinteractio
nsinfo
rmatio
n
Open Access2007Kaiseret al.Volume 8, Issue 7, Article R131ResearchTranscriptional recapitulation and subversion of embryonic colon development by mouse colon tumor models and human colon cancerSergio Kaiser¤*, Young-Kyu Park¤†, Jeffrey L Franklin†, Richard B Halberg‡, Ming Yu§, Walter J Jessen*, Johannes Freudenberg*, Xiaodi Chen‡, Kevin Haigis¶, Anil G Jegga*, Sue Kong*, Bhuvaneswari Sakthivel*, Huan Xu*, Timothy Reichling¥, Mohammad Azhar#, Gregory P Boivin**, Reade B Roberts§, Anika C Bissahoyo§, Fausto Gonzales††, Greg C Bloom††, Steven Eschrich††, Scott L Carter‡‡, Jeremy E Aronow*, John Kleimeyer*, Michael Kleimeyer*, Vivek Ramaswamy*, Stephen H Settle†, Braden Boone†, Shawn Levy†, Jonathan M Graff§§, Thomas Doetschman#, Joanna Groden¥, William F Dove‡, David W Threadgill§, Timothy J Yeatman††, Robert J Coffey Jr† and Bruce J Aronow*
Addresses: *Biomedical Informatics, Cincinnati Children's Hospital Medical Center, Cincinnati, OH 45229, USA. †Departments of Medicine, and Cell and Developmental Biology, Vanderbilt University and Department of Veterans Affairs Medical Center, Nashville, TN 37232, USA. ‡McArdle Laboratory for Cancer Research, University of Wisconsin, Madison, WI 53706, USA. §Department of Genetics and Lineberger Cancer Center, University of North Carolina, Chapel Hill, NC 27599, USA. ¶Molecular Pathology Unit and Center for Cancer Research, Massachusetts General Hospital, Charlestown, MA 02129, USA. ¥Division of Human Cancer Genetics, The Ohio State University College of Medicine, Columbus, Ohio 43210-2207, USA. #Institute for Collaborative BioResearch, University of Arizona, Tucson, AZ 85721-0036, USA. **University of Cincinnati, Department of Pathology and Laboratory Medicine, Cincinnati, OH 45267, USA. ††H Lee Moffitt Cancer Center and Research Institute, Tampa, FL 33612, USA. ‡‡Children's Hospital Informatics Program at the Harvard-MIT Division of Health Sciences and Technology (CHIP@HST), Harvard Medical School, Boston, Massachusetts 02115, USA. §§University of Texas Southwestern Medical Center at Dallas, Dallas, TX 75390, USA.
¤ These authors contributed equally to this work.
Correspondence: Bruce J Aronow. Email: [email protected]
© 2007 Kaiser et al.; licensee BioMed Central Ltd. This is an open access article distributed under the terms of the Creative Commons Attribution License (http://creativecommons.org/licenses/by/2.0), which permits unrestricted use, distribution, and reproduction in any medium, provided the original work is properly cited.Colon tumours recapitulate embryonic transcription<p>Colon tumors from four independent mouse models and 100 human colorectal cancers all exhibited striking recapitulation of embry-onic colon gene expression from embryonic days 13.5-18.5.</p>
Abstract
Background: The expression of carcino-embryonic antigen by colorectal cancer is an example ofoncogenic activation of embryonic gene expression. Hypothesizing that oncogenesis-recapitulating-ontogenesis may represent a broad programmatic commitment, we compared gene expressionpatterns of human colorectal cancers (CRCs) and mouse colon tumor models to those of mousecolon development embryonic days 13.5-18.5.
Published: 5 July 2007
Genome Biology 2007, 8:R131 (doi:10.1186/gb-2007-8-7-r131)
Received: 22 August 2006Revised: 12 February 2007Accepted: 5 July 2007
The electronic version of this article is the complete one and can be found online at http://genomebiology.com/2007/8/7/R131
Genome Biology 2007, 8:R131

R131.2 Genome Biology 2007, Volume 8, Issue 7, Article R131 Kaiser et al. http://genomebiology.com/2007/8/7/R131
Results: We report here that 39 colon tumors from four independent mouse models and 100human CRCs encompassing all clinical stages shared a striking recapitulation of embryonic colongene expression. Compared to normal adult colon, all mouse and human tumors over-expresseda large cluster of genes highly enriched for functional association to the control of cell cycleprogression, proliferation, and migration, including those encoding MYC, AKT2, PLK1 and SPARC.Mouse tumors positive for nuclear β-catenin shifted the shared embryonic pattern to that of earlydevelopment. Human and mouse tumors differed from normal embryonic colon by their loss ofexpression modules enriched for tumor suppressors (EDNRB, HSPE, KIT and LSP1). Human CRCadenocarcinomas lost an additional suppressor module (IGFBP4, MAP4K1, PDGFRA, STAB1 andWNT4). Many human tumor samples also gained expression of a coordinately regulated moduleassociated with advanced malignancy (ABCC1, FOXO3A, LIF, PIK3R1, PRNP, TNC, TIMP3 andVEGF).
Conclusion: Cross-species, developmental, and multi-model gene expression patterningcomparisons provide an integrated and versatile framework for definition of transcriptionalprograms associated with oncogenesis. This approach also provides a general method foridentifying pattern-specific biomarkers and therapeutic targets. This delineation and categorizationof developmental and non-developmental activator and suppressor gene modules can thus facilitatethe formulation of sophisticated hypotheses to evaluate potential synergistic effects of targetingwithin- and between-modules for next-generation combinatorial therapeutics and improved mousemodels.
BackgroundThe colon is composed of a dynamic and self-renewing epi-thelium that turns over every three to five days. It is generallyaccepted that at the base of the crypt, variable numbers(between 1 and 16) of slowly dividing, stationary, pluripotentstem cells give rise to more rapidly proliferating, transientamplifying cells. These cells differentiate chiefly into post-mitotic columnar colonocytes, mucin-secreting goblet cells,and enteroendocrine cells as they migrate from the crypt baseto the surface where they are sloughed into the lumen [1]. Sev-eral signaling pathways, notably Wnt, Tgfβ, Bmp, Hedgehogand Notch, play pivotal roles in the control of proliferationand differentiation of the developing and adult colon [2].Their perturbation, via mutation or epigenetic modification,occurs in human colorectal cancer (CRC) and the instillationof these changes via genetic engineering in mice confers a cor-respondingly high risk for neoplasia in the mouse models.Moreover, tumor cell de-differentiation correlates with keytumor features, such as tumor progression rates, invasive-ness, drug resistance and metastatic potential [3-5].
A variety of scientific and organizational obstacles make it achallenging proposition to undertake large-scale compari-sons of human cancer to the wide range of genetically engi-neered mouse models. To evaluate the potential of thisapproach to provide integrated views of the molecular basis ofcancer risk, tumor development and malignant progression,we have undertaken a comparative analysis of a variety ofindividually developed mouse colon tumor models (reviewedin [6,7]) to human CRC. The ApcMin/+ (multiple intestinalneoplasia) mouse model harbors a germline mutation in theApc tumor suppressor gene and exhibits multiple tumors in
the small intestine and colon [8]. A major function of APC isto regulate the canonical WNT signaling pathway as part of aβ-catenin degradation complex. Loss of APC results in a fail-ure to degrade β-catenin, which instead enters the nucleus toact as a transcriptional co-activator with the lymphoidenhancer factor/T-cell factor (LEF/TCF) family of transcrip-tion factors [9]. The localization of β-catenin within thenucleus indicates activated canonical WNT signaling. In addi-tion to germline APC mutations that occur in persons withfamilial adenomatous polyposis coli (FAP) and ApcMin/+ mice,loss of functional APC and activation of canonical WNT sign-aling occurs in more than 80% of human sporadic CRCs [10].Similar to the ApcMin/+ model, tumors in the azoxymethane(AOM) carcinogen model, which occur predominantly in thecolon [11], have signaling alterations marked by activatedcanonical WNT signaling.
Two other mouse models that carry different genetic altera-tions leading to colon tumor formation are based on theobservation that transforming growth factor (TGF)β type IIreceptor (TGFBR2) gene mutations are present in up to 30%of sporadic CRCs and in more than 90% of tumors that occurin patients with the DNA mismatch repair deficiency associ-ated with hereditary non-polyposis colon cancer (HNPCC)[12]. In the mouse, a deficiency of TGFβ1 combined with anabsence of T-cells (Tgfb1-/-; Rag2-/-) results in a high occur-rence of colon cancer [13]. These mice develop adenomas bytwo months of age, and adenocarcinomas, often mucinous, bythree to six months of age. Immunohistochemical analyses ofthese tumors are negative for nuclear β-catenin, suggestingthat TGFβ1 does not suppress tumors via a canonical WNTsignaling-dependent pathway. The SMAD family proteins are
Genome Biology 2007, 8:R131
http://genomebiology.com/2007/8/7/R131 Genome Biology 2007, Volume 8, Issue 7, Article R131 Kaiser et al. R131.3
com
ment
reviews
reports
refereed researchdepo
sited researchinteractio
nsinfo
rmatio
n
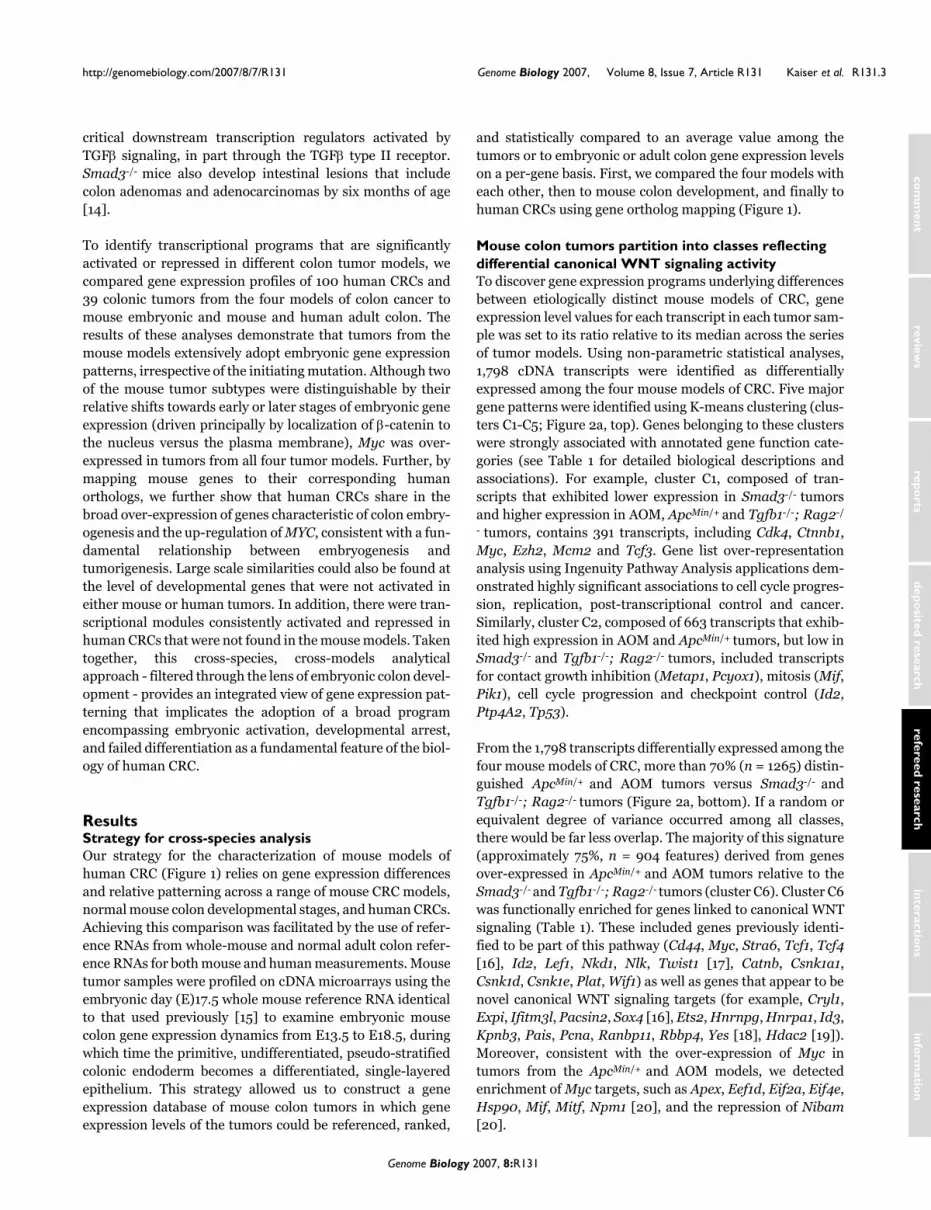
critical downstream transcription regulators activated byTGFβ signaling, in part through the TGFβ type II receptor.Smad3-/- mice also develop intestinal lesions that includecolon adenomas and adenocarcinomas by six months of age[14].
To identify transcriptional programs that are significantlyactivated or repressed in different colon tumor models, wecompared gene expression profiles of 100 human CRCs and39 colonic tumors from the four models of colon cancer tomouse embryonic and mouse and human adult colon. Theresults of these analyses demonstrate that tumors from themouse models extensively adopt embryonic gene expressionpatterns, irrespective of the initiating mutation. Although twoof the mouse tumor subtypes were distinguishable by theirrelative shifts towards early or later stages of embryonic geneexpression (driven principally by localization of β-catenin tothe nucleus versus the plasma membrane), Myc was over-expressed in tumors from all four tumor models. Further, bymapping mouse genes to their corresponding humanorthologs, we further show that human CRCs share in thebroad over-expression of genes characteristic of colon embry-ogenesis and the up-regulation of MYC, consistent with a fun-damental relationship between embryogenesis andtumorigenesis. Large scale similarities could also be found atthe level of developmental genes that were not activated ineither mouse or human tumors. In addition, there were tran-scriptional modules consistently activated and repressed inhuman CRCs that were not found in the mouse models. Takentogether, this cross-species, cross-models analyticalapproach - filtered through the lens of embryonic colon devel-opment - provides an integrated view of gene expression pat-terning that implicates the adoption of a broad programencompassing embryonic activation, developmental arrest,and failed differentiation as a fundamental feature of the biol-ogy of human CRC.
ResultsStrategy for cross-species analysisOur strategy for the characterization of mouse models ofhuman CRC (Figure 1) relies on gene expression differencesand relative patterning across a range of mouse CRC models,normal mouse colon developmental stages, and human CRCs.Achieving this comparison was facilitated by the use of refer-ence RNAs from whole-mouse and normal adult colon refer-ence RNAs for both mouse and human measurements. Mousetumor samples were profiled on cDNA microarrays using theembryonic day (E)17.5 whole mouse reference RNA identicalto that used previously [15] to examine embryonic mousecolon gene expression dynamics from E13.5 to E18.5, duringwhich time the primitive, undifferentiated, pseudo-stratifiedcolonic endoderm becomes a differentiated, single-layeredepithelium. This strategy allowed us to construct a geneexpression database of mouse colon tumors in which geneexpression levels of the tumors could be referenced, ranked,
and statistically compared to an average value among thetumors or to embryonic or adult colon gene expression levelson a per-gene basis. First, we compared the four models witheach other, then to mouse colon development, and finally tohuman CRCs using gene ortholog mapping (Figure 1).
Mouse colon tumors partition into classes reflecting differential canonical WNT signaling activityTo discover gene expression programs underlying differencesbetween etiologically distinct mouse models of CRC, geneexpression level values for each transcript in each tumor sam-ple was set to its ratio relative to its median across the seriesof tumor models. Using non-parametric statistical analyses,1,798 cDNA transcripts were identified as differentiallyexpressed among the four mouse models of CRC. Five majorgene patterns were identified using K-means clustering (clus-ters C1-C5; Figure 2a, top). Genes belonging to these clusterswere strongly associated with annotated gene function cate-gories (see Table 1 for detailed biological descriptions andassociations). For example, cluster C1, composed of tran-scripts that exhibited lower expression in Smad3-/- tumorsand higher expression in AOM, ApcMin/+ and Tgfb1-/-; Rag2-/
- tumors, contains 391 transcripts, including Cdk4, Ctnnb1,Myc, Ezh2, Mcm2 and Tcf3. Gene list over-representationanalysis using Ingenuity Pathway Analysis applications dem-onstrated highly significant associations to cell cycle progres-sion, replication, post-transcriptional control and cancer.Similarly, cluster C2, composed of 663 transcripts that exhib-ited high expression in AOM and ApcMin/+ tumors, but low inSmad3-/- and Tgfb1-/-; Rag2-/- tumors, included transcriptsfor contact growth inhibition (Metap1, Pcyox1), mitosis (Mif,Pik1), cell cycle progression and checkpoint control (Id2,Ptp4A2, Tp53).
From the 1,798 transcripts differentially expressed among thefour mouse models of CRC, more than 70% (n = 1265) distin-guished ApcMin/+ and AOM tumors versus Smad3-/- andTgfb1-/-; Rag2-/- tumors (Figure 2a, bottom). If a random orequivalent degree of variance occurred among all classes,there would be far less overlap. The majority of this signature(approximately 75%, n = 904 features) derived from genesover-expressed in ApcMin/+ and AOM tumors relative to theSmad3-/- and Tgfb1-/-; Rag2-/- tumors (cluster C6). Cluster C6was functionally enriched for genes linked to canonical WNTsignaling (Table 1). These included genes previously identi-fied to be part of this pathway (Cd44, Myc, Stra6, Tcf1, Tcf4[16], Id2, Lef1, Nkd1, Nlk, Twist1 [17], Catnb, Csnk1a1,Csnk1d, Csnk1e, Plat, Wif1) as well as genes that appear to benovel canonical WNT signaling targets (for example, Cryl1,Expi, Ifitm3l, Pacsin2, Sox4 [16], Ets2, Hnrnpg, Hnrpa1, Id3,Kpnb3, Pais, Pcna, Ranbp11, Rbbp4, Yes [18], Hdac2 [19]).Moreover, consistent with the over-expression of Myc intumors from the ApcMin/+ and AOM models, we detectedenrichment of Myc targets, such as Apex, Eef1d, Eif2a, Eif4e,Hsp90, Mif, Mitf, Npm1 [20], and the repression of Nibam[20].
Genome Biology 2007, 8:R131

R131.4 Genome Biology 2007, Volume 8, Issue 7, Article R131 Kaiser et al. http://genomebiology.com/2007/8/7/R131
Nuclear β-catenin expression distinguishes murine modelsTo establish a molecular basis for over-expression of canoni-cal WNT target genes in ApcMin/+ and AOM tumors, we usedimmunohistochemistry to characterize the relative cellulardistribution of β-catenin. Tumors from ApcMin/+ (Figure 2b,bottom left panel) and AOM (not shown) mice exhibitedstrong nuclear β-catenin immunoreactivity and reduced mem-brane staining (see inset), whereas tumors from Smad3-/-
(Figure 2b, bottom right panel) and Tgfb1-/-; Rag2-/- (notshown) mice showed strong plasma membrane β-cateninstaining with no nuclear accumulation (see inset). Additionaltests to confirm the microarray results were also carried outusing an independent set of C57BL/6 ApcMin/+ colon tumorsamples analyzed by quantitative real-time PCR (qRT-PCR;Figure 3a) and immunohistochemistry (Figure 3b). Allexpression patterns identified via microarray analysis wereconsistent with the qRT-PCR results (n = 9 transcripts, cho-sen for their demonstration of a range of differential expres-sion characteristics). In situ hybridization analyses usingC57BL/6 ApcMin/+ colon tumor samples also validated thatWif, Tesc, Spock2 and Casp6 were strongly expressed in dys-plastic cells of the tumors (data not shown). At the proteinlevel, immunohistochemical analyses confirmed relativelygreater expression of the oncoprotein stathmin 1 in ApcMin/+
mice and tyrosine phosphatase 4a2 in Smad3-/- mice (Figure3b).
Overall, cluster C6 genes (that is, genes with greater up-regu-lation in tumors from ApcMin/+ and AOM models than inSmad3-/- and Tgfb1-/-; Rag2-/-) were consistent withincreased tumor cell proliferation (for example, Myc, Pcna),cytokinesis (for example, Amot, Cxcl5), chromatin remode-ling (for example, Ets2, Hdac2, Set) as well as cell cycle pro-gression and mitosis (for example, Cdk1, Cdk4, Cul1, Plk1). Itis important to note that Myc is up-regulated in all fourmouse tumor models relative to normal colon tissue (seebelow). Biological processes showing increased transcriptionin tumors from the Smad3-/- and Tgfb1-/-; Rag2-/- models(cluster C7) included immune and defense responses (forexample, Il18, Irf1, Myd88), endocytosis (for example, Lrp1,Ldlr, Rac1), transport (for example, Abca3, Slc22a5,Slc30a4), and oxidoreductase activity (for example, Gcdh,Prdx6, Xdh) (Table 1). Taken together, these transcriptionalobservations are both consistent with and extend our under-standing of the histological features of the CRC models [7].For example, while ApcMin/+ and AOM tumors are character-ized by cytologic atypia (that is, nuclear crowding, hyperchro-masia, increased nucleus-to-cytoplasm ratios and minimalinflammation), tumors from Smad3-/- and Tgfb1-/-; Rag2-/-
mice show less overt dysplastic changes but exhibit a signifi-cant inflammatory component.
Stratification of murine colon tumor models by localization of β-catenin and plan for analysisFigure 1Stratification of murine colon tumor models by localization of β-catenin and plan for analysis. Colon tumors from four etiologically distinct mouse models of CRC were subjected to microarray gene expression profiling. The gene expression profiles from the different mouse model tumors were compared and contrasted to each other, as well as to those from embryonic mouse colon development and 100 human CRCs.
Identification of differentially regulated genes
Compare tumor models to:
Embryonic colon development
Human colon cancer
Each other
β-c
aten
in
AOMApcMin /+
Smad3-/- Tgfb1 -/-; Rag2 -/-
Nuc
lea
rP
lasm
a m
embr
ane
Genome Biology 2007, 8:R131

http://genomebiology.com/2007/8/7/R131 Genome Biology 2007, Volume 8, Issue 7, Article R131 Kaiser et al. R131.5
com
ment
reviews
reports
refereed researchdepo
sited researchinteractio
nsinfo
rmatio
n
Table 1
Detailed cluster analysis: differential and statistically significant biological functions in clusters C1-C7
Cluster no. Number oftranscripts/
ProbeSets (PS)
Reference Pattern Biology Example genes
1 391 Global Up (A/M/T);down (S)
RNA post-transcriptional modification, cell cycle, DNA replication/recombination/repair, molecular transport, post-translational modification, cellular assembly and organization, cellular movement, cardiovascular system development and function, connective tissue development and function, cancer
Cell cycle progression (Cdk4, Ctnnb1, Id1, Id3, Myc, Pcna, Tcf3), replication of DNA (Idi1, Mcm2, Myc, Orc4l, Pcna, Polb, Set), checkpoint control (Bub3, Myc, Rae1, Smc1l1), invasion of mammary epithelial cells (Ezh2), recovery of ATP (Hspd1, Hspe1), hyperplasia of secretory structure (Cdk4, Ctnnb1, Ptpre, Sdc1), cell proliferation (Id1, Id3, Myc, Pcna)
2 663 Global Up (A/M); down (S/T)
Cell cycle, cellular response to therapeutics, cellular assembly and organization, molecular transport, connective tissue development and function, genetic disorder, gastrointestinal disease, cancer, Wnt-signaling pathway
Contact growth inhibition of connective tissue cells (Metap2, Pcyox1), mitosis of tumor cells (Mif, Plk1), cell cycle progression (Id2, Tp53), checkpoint control (Mad2l1, Tp53), DNA modification (Apex1, Dnmt3a, Dnmt3b), infiltrating duct carcinoma (Esr1, Ing4), mitosis of tumor cells (Mif, Plk1), myotonic dystrophy (Dmpk, Znf9), Wnt-signaling (Csnk1d, Csnk1e, Lef1, Nlk, Tcf3, Tcf4, Wif1)
3 170 Global Up (A/S); down (M/T)
Cancer, cell death, cellular development, cellular growth and proliferation, cell cycle
Apoptosis of colon carcinoma cells (Tnfsf10), sarcoma (Ewsr1, Mdm2, Tnfsf10), hyperpoliferation (Map2k7), survival (Mdm2, Nras, Tnfsf10), tumorigenesis (Ewsr1, Mdm2, Nras, Tnfsf10), fibroblast proliferation (Arid5b, E4f1, Map2k7, Mdm2, Nras), mitosis of embryonic cells (E4f1)
4 142 Global Up (M/S); down (A/T)
Cellular movement, hematological system development and function, immune response, hematological disease, immune and lymphatic system development and function, organ morphology, cell-to-cell signaling and interaction, cell death, molecular transport
Cell movement/chemotaxis (Alox5AP, C3, Ctsb, Cxcl12, Dcn, Fcgr3a, Fgfr1, Hif1a, Igf2, Itgb2, Lsp1, S100A9, Slp1), invasion of tumor cell lines (Cbx5, Ctsb, Cxcl12, Fstl1, Hif1a, Ighg1, Igf2, Itgb2), chemotaxis/migration of leukocytes (C3, Cxcl12, Icam2, Itgb2, Lgals1, Lsp1, S100a9, Slpi), growth of tumor (Fgfr1, Hif1a, Igf2, Igfbp5, Ighg1), invasion of tumor cell lines (Cbx5, Ctsb, Cxcl12, Fstl1, Hif1a, Igf2, Ighg1, Itgb2)
5 432 Global Up (S/T); down (A/M)
Cell death, neurological disease, drug metabolism, endocrine system development and function, cancer, drug metabolism, lipid metabolism, gastrointestinal disease, organismal functions, organismal injury and abnormalities
Gut epithelium differentiation (Chgb, Klf4, Klf6, Sst), cell death/apoptosis of microglia (Btg1, Casp3, Casp9, Cx3cl1, Grin1, Myd88), uptake of prostaglandin E2 (Slco2a1), tumorigenesis of brain tumor (Nf2, Stat2), tumorigenesis of polyp (Asph, Smad4), aggregatability of colon cancer cell lines (Cd82), cell spreading of colon cancer cell lines (Smad4), contact inhibition of colon cancer cell lines (Prkg1)
6 904 Global Up (A/M); down (S/T)
Cell proliferation, cell cycle progression and mitosis, DNA replication/recombination/repair, molecular transport, RNA post-transcriptional modification, post-translational modification, cellular growth and proliferation, connective tissue development and function, cancer, gastrointestinal disease, digestive system development and function
Cell cycle progression/proliferation (Cdk4, Clu, Id2, Mki67, Magoh, Myc, Pcna, Tcf3, Tp53), tumor cell mitosis (Mif, Plk1), DNA excision repair (Apex1, Ddb1, Hmgb1, Polb), DNA methylation (Dnmt3a, Dnmt3b), accumulation of colonocytes (Clu, Myc), tumorigenesis (Cd44, Cdk4, Ctnnb1, Esr1, Myc, Prkar1a, Tp53), Wnt-signaling pathway (Csnk1a1, Cskn1d, Cskn1e, Ctnnb1, Lef1, Myc, Nlk, Ppp2cb, Tcf3, Tcf4, Wif1)
Genome Biology 2007, 8:R131

R131.6 Genome Biology 2007, Volume 8, Issue 7, Article R131 Kaiser et al. http://genomebiology.com/2007/8/7/R131
Large-scale activation of the embryonic colon transcriptome in mouse tumor modelsWe hypothesized that comparisons of genes over-expressedin both colon tumors and embryonic mouse colon couldprovide valuable insights into tumor programs important forfundamental aspects of tumor growth and regulation of dif-ferentiation. To identify genes and observe regulatory pat-terns that were shared or differed between colon tumors andembryonic development, we applied a global quantitative ref-erencing strategy to both tumor and embryonic samples bycalculating the relative expression of each gene as the ratio ofits expression in any sample as that relative to its mean levelin adult colon. From this adult baseline reference, genes over-expressed in the four mouse tumor models appeared strik-ingly similar. Moreover, the vast majority of genes over-expressed in tumors were also over-expressed in embryoniccolon (Figure 4a). If the fraction of fetal over-expressed genesfrom the entire microarray (5,796 of 20,393 features; 28.4%)was maintained at a similar occurrence frequency in thetumor over-expressed fraction (8,804 of 20,393), one wouldexpect an overlap of 2,502 transcripts ((8,804/20,393) ×28.4%). Rather, 4,693 out of the 5,796 fetal over-expressedtranscripts were observed to be over-expressed in the 8,804tumor over-expressed genes (Figure 4b). The probability cal-culated by Fisher's exact test is p < 1-300, and thus represents
highly significant over-representation of fetal genes amongthe tumor over-expressed genes. Similarly, genes under-expressed in developing colon were disproportionatelyunderexpressed in tumors relative to normal adult colon(3,282 of 3,541; p < 1-300). Combining these results, approxi-mately 85% of the developmentally regulated transcripts(7,975 out of 9,337 features) were recapitulated in tumorexpression patterns relative to adult colon (Figure 4a,b, greenand red markers represent the corresponding 7,975 features).
To explore the potential biological significance of genes over-expressed in both embryonic colon development and mousetumors, we used K-means clustering to generate C8-C10 clus-ter patterns as shown in a hierarchical tree heatmap (Figure4c; Table 2). Several sub-patterns were evident, some ofwhich clearly separated ApcMin/+ and AOM from Smad3-/- andTgfb1-/-; Rag2-/- tumors. One strong cluster, cluster C8, con-sisted of genes more strongly expressed in ApcMin/+ and AOMthan Smad3-/- and Tgfb1-/-; Rag2-/- tumors. This group ofgenes represented a large fraction of all differences foundbetween nuclear β-catenin-positive (ApcMin/+ and AOM) andnegative (Smad3-/- and Tgfb1-/-; Rag2-/-) tumors (approxi-mately 45%; 1,636 out of 3,592 features), as well as differ-ences detected between early (that is, E13.5-E15.5, ED) andlate (E.16.5-E18.5, LD) embryonic colon developmental
7 361 Global Up (S/T); down (A/M)
Cell death, neurological disease, cancer, drug metabolism, embryonic development, endocrine system development and function, lipid metabolism, organismal injury and abnormalities, infectious disease, immune response, immunological disease, hematological disease; gastrointestinal disease; antigen +presentation pathway
Antigen presentation (B2m, Cd74, H2-D1, HLA-DMA, HLA-DRB, Psmb8, Tap2), embryonic development (C3, Celsr1, Erbb3, Impk, Mcl1), infectious disease (B2m, Ifngr1, Irf1, Myd88, Nr3c1), mast cell chemotaxis (C3, Cx3cl1), apoptosis of microglia (Btg1, Casp3, Cx3cl1, Myd88), tumorigenesis of polyp (Asph, Smad4), transport of prostaglandin E2 (Slco2a1), quantity of colonocytes (Guca2a), gastrointestinal disease (Asph, Cd84, Smad4)
A, AOM-induced; M, ApcMin/+; S, Smad3-/-; T, Tgfb1-/-; Rag2-/-.
Table 1 (Continued)
Detailed cluster analysis: differential and statistically significant biological functions in clusters C1-C7
Active canonical WNT signaling (as determined by nuclear β-catenin) stratifies the four murine colon tumor models into two groupsFigure 2 (see following page)Active canonical WNT signaling (as determined by nuclear β-catenin) stratifies the four murine colon tumor models into two groups. (a) Hierarchical clustering of gene transcripts separates the four models into two groups. The upper panel shows 1,798 gene transcripts identified as differentially expressed among any of the four mouse tumor models (Kruskal-Wallis test + Student-Newman-Keuls test + FDR < 5.10-5). Results demonstrate that AOM (A) and ApcMin/+ (M) tumors are transcriptionally more similar to each other than to tumors from Smad3-/- (S) and Tgfb1-/-; Rag2-/- (T) mice. Five clusters have been identified (C1-C5) that correspond to the K-means functional clusters listed in Table 1. Please refer to Table 1 for an in-depth description of the functional classification of the genes found in these clusters. The lower panel illustrates the extent of the similarity between A/M and S/T tumors by identifying the top-ranked 1,265 transcripts of the 1,798 that were higher or lower in the two tumor super-groups (rank based on Wilcoxon-Mann-Whitney test for between-group differences with a FDR < 5.10-5 cutoff). Up-regulated transcripts in A/M tumors are highly enriched for genes associated with canonical WNT signaling activity, cell proliferation, chromatin remodeling, cell cycle progression and mitosis; transcripts over-expressed in S/T tumors are highly enriched for genes related to immune and defense responses, endocytosis, transport, oxidoreductase activity, signal transduction and metabolism. (b) Representative histologies for each of the four tumor models. The lower panel illustrates the model-dependent localization of β-catenin. Tumors from M (bottom left) and A (not shown) mice exhibited prominent nuclear β-catenin accumulation and reduced cell surface staining. Conversely, tumors from S (bottom right) and T(not shown) mice exhibited retention of plasma membrane β-catenin immunoreactivity. A and M in top panel 100× magnification; S and T 200× magnification. M and S in lower panel both 400× magnification.
Genome Biology 2007, 8:R131

http://genomebiology.com/2007/8/7/R131 Genome Biology 2007, Volume 8, Issue 7, Article R131 Kaiser et al. R131.7
com
ment
reviews
reports
refereed researchdepo
sited researchinteractio
nsinfo
rmatio
n
Figure 2 (see legend on previous page)
1,2
65 fe
atu
res
[ A+
M v
s. S
+T ]
C6C6
C7C7
3.0
0.3
1.0
1,7
98 fe
atu
res
[ any
of (
A v
s. M
vs.
S v
s. T
) ]
C1C1
C3C3C4C4
C2C2
C5C5
A ( AOM treatment )M ( ApcMin/+ )
S ( Smad3-/- )T ( Tgfb1-/-; Rag2-/- )
A M S T
(a)
(b)
M S
Gen
e ex
pres
sion
rela
tive
to tu
mo
r med
ian
Genome Biology 2007, 8:R131

R131.8 Genome Biology 2007, Volume 8, Issue 7, Article R131 Kaiser et al. http://genomebiology.com/2007/8/7/R131
stages. Thus, the fraction of developmentally regulated genesthat are more characteristic of the earlier stages of normalcolon development (E13.5-E15.5), are clearly expressed athigher levels in nuclear β-catenin-positive tumors. Thisobservation is illustrated by 750 transcripts selected solely forstronger expression in ED versus LD (Figure 4d). Note thatmost of these transcripts overlap with cluster C6 containing230 features (Figure 2a, lower panel) and illustrate the ten-dency of the earlier-expressed developmental genes to bemore strongly expressed in ApcMin/+ and AOM mice. In addi-tion, transcripts associated with increased differentiation andmaturation, observed at later stages of colon developmentE16.5-E18.5 (for example, Klf4 [21], Crohn's disease-relatedSlc22a5/Octn2 [22], Slc30a4/Znt4 [23], Sst [24]), wereexpressed at higher levels by tumors from Smad3-/- andTgfb1-/-; Rag2-/- mice.
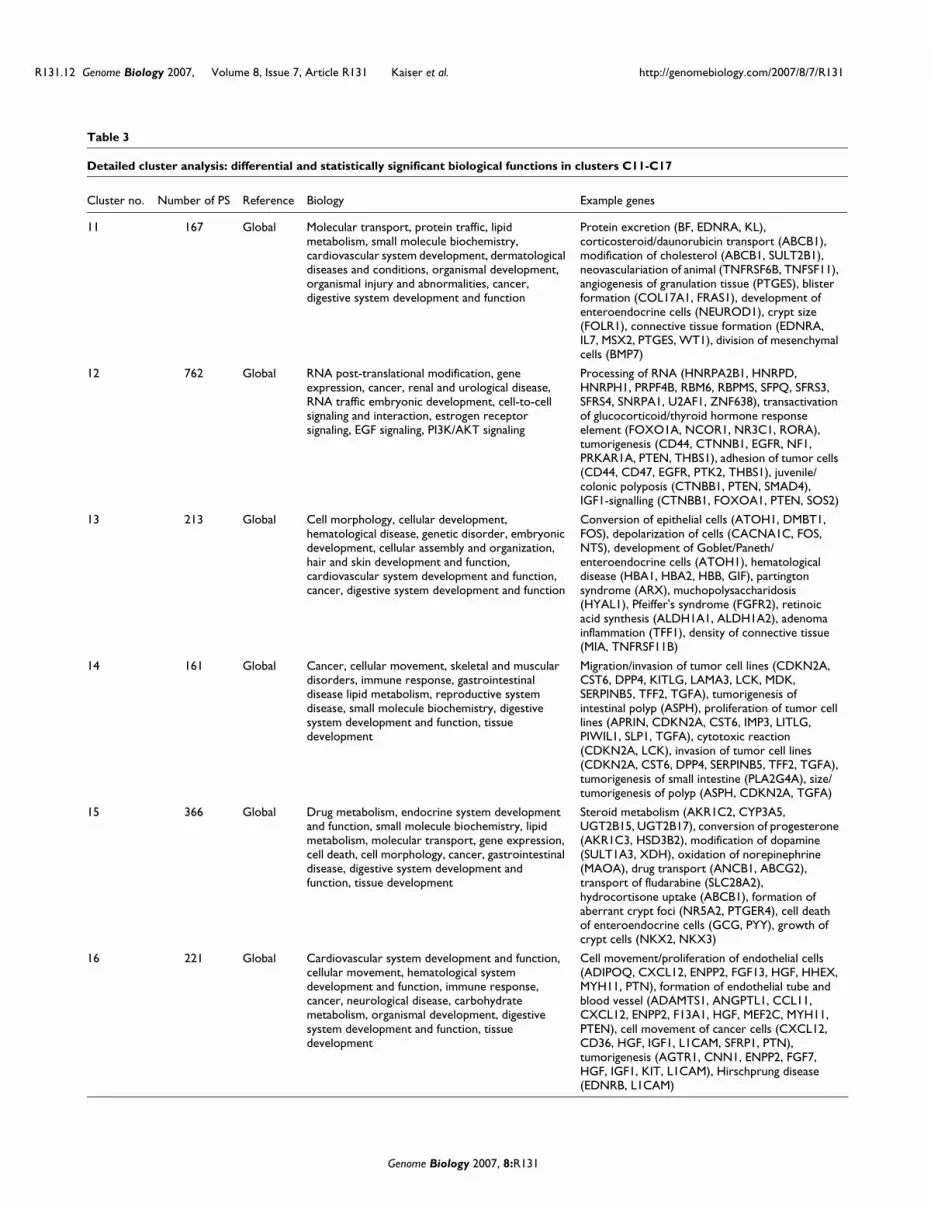
Human CRCs reactivate an embryonic gene signatureSince mouse tumors recapitulated developmental signaturesirrespective of their etiology, we asked whether a similar com-mitment to embryonic gene programming was shared by spo-radic human CRCs. Tumor classification by microarrayprofiling is usually accomplished by referencing relative geneexpression levels to the median value for each gene across aseries of tumor samples. Using this 'between-tumors mediannormalization' approach, as well as a gene filtering strategythat detects significantly regulated genes in at least 10% of thecases, led to the identification of a set of 3,285 probe sets cor-responding to transcripts whose expression was highly variedbetween independent human tumor cases. As shown in Fig-ure 5, there was striking heterogeneity of gene expressionamong 100 human CRCs. For example, cluster 15 contained aset of genes (principally metallothionein genes) recently iden-tified to be predictive of microsatellite instability [25,26].This analysis indicates that human CRCs have a greater levelof complexity than the mouse colon tumors studied here(compare Figures 2 and 5). There was no correlation betweenthese distinguishing clusters and the stage of the tumor (notethe broad overlapping distributions of Dukes stages A-Dacross these different clusters). However, as shown in Table3, gene ontology and network analysis of the individual geneclusters (clusters C11-C17) that were differentially active insubgroups of the tumors, map to genes highly associated witha diverse set of biological functions, including lipid metabo-
lism, digestive tract development and function, immuneresponse and cancer
To evaluate if similar sets of genes are systematically acti-vated or repressed in human CRC, as in the mouse colontumors, we undertook two procedures to align the data. First,gene expression values for the mouse and human tumorswere separately normalized and referenced relative to theirrespective normal adult colon controls; second, mouse andhuman gene identifiers were reduced to a single orthologgene identifier. The latter is a somewhat complex procedurethat requires identifying microarray probes from each plat-form that can be mapped to a single gene ortholog andundertaking a procedure to aggregate redundant probeswithin a platform (see Materials and methods). Thisapproach allowed the identification of 8,621 gene transcriptson the HG-U133 plus2 and Vanderbilt NIA 20 K cDNA arraysfor which relative expression values could be mapped fornearly all mouse and human samples. A clustering-basedassessment of expression across the whole mouse-humanortholog gene set identified a large number of transcriptsbehaving similarly across colon tumors, many irrespective,but some respective of species. Notably, the great majority ofgenes over-expressed in all tumors were also over-expressedduring colon development (Figure 6a). To evaluate the statis-tical significance of this pattern, we used a Venn overlap fil-tering strategy and Fisher's exact test analysis. Approximately50% of the 2,212 ortholog genes over-expressed in at least10% of the human cancers relative to adult colon were alsoover-expressed in developing colon. If there was not a selec-tion for developmental genes among those over-expressed intumors, the expected overlap would be (2,718/8,621) × 2,212= 697 transcripts. Using Fisher's exact test for the significanceof the increased overlap of 1,080 versus 697 transcripts is p <1e-300. Similarly, genes under-expressed in mouse colondevelopment and human CRCs also strongly overlapped (Fig-ure 6b; 431 of 737, p < 1e-76). This result is significantlygreater than the 8-19% of genes that were estimated to beover-expressed in human colon tumors and fetal gut morpho-genesis based upon a computational extrapolation of SAGEdata [27]. Thus, our findings not only confirm but also signif-icantly expand and experimentally validate the previouslysuggested recapitulation of embryonic signatures by humanCRCs.
Selective validation of microarray results by qRT-PCR and immunohistochemistryFigure 3 (see following page)Selective validation of microarray results by qRT-PCR and immunohistochemistry. Differential expression of transcripts identified by the microarray analyses was examined using (a) qRT-PCR and (b) immunohistochemistry. Additional colon tumors from five ApcMin/+ (M; nuclear β-catenin-positive) mice and four Smad3-/- (S; nuclear β-catenin-negative) mice were harvested, and qRT-PCR was performed on nine genes that exhibited representative strong or subtle patterns in the microarray analyses. All nine patterns detected in the microarray set were validated by the qRT-PCR results. Alox12, Arachidonate 12-lipoxygenase; Casp6, Caspase 6; Matn2, Matrilin 2; Ptplb, Protein tyrosine phosphatase-like B; Sox21, SRY (sex determining region Y)-box 21; Spock2, Sparc/osteonectin, CWCV, and Kazal-like domains proteoglycan (testican) 2; Tesc, Tescalcin; Tpm2, Tropomysin 2; Wif1, WNT inhibitory factor; Stmn1, stathmin 1; Ptp4a2, phosphatase 4a2. In (a), *p < 0.05 and **p < 0.01.
Genome Biology 2007, 8:R131

http://genomebiology.com/2007/8/7/R131 Genome Biology 2007, Volume 8, Issue 7, Article R131 Kaiser et al. R131.9
com
ment
reviews
reports
refereed researchdepo
sited researchinteractio
nsinfo
rmatio
n
Figure 3 (see legend on previous page)
Stmn1
Ptp4a2
0
0
1
10
100
1000ApcMin/+Smad3-/-
1000
100
10
1
-10
-1000
0
1
10
100
1000ApcMin/+Smad3-/-
0
0
1
10
100
1000ApcMin/+Smad3-/-
0
0
1
10
100
1000ApcMin/+Smad3-/-
1,000
100
10
1
-10
-100
ApcMin/+
Smad3-/-
Alox12Casp6
Matn2 Sox21 TescPtplb Spock2
Wif1Tpm2
***
* *
* *
M S
M S
qRT
-PC
R t
rans
crip
t le
vel r
elat
ive
to
norm
al a
dult
colo
n(a)
(b)
Genome Biology 2007, 8:R131

R131.10 Genome Biology 2007, Volume 8, Issue 7, Article R131 Kaiser et al. http://genomebiology.com/2007/8/7/R131
Figure 4 (see legend on next page)
3.0
0.3
1.0
3.0
0.3
1.0
Ob se rve d Exp e cte d O b se rve d E xp e cte d
Total feature count 2,0393 5 ,7 9 6 n a 3 ,5 4 1 n /a
Over-expressed 8,804 4 ,6 9 3 * 2 ,5 0 2 5 8 8 *** 1 ,5 2 9
Under-expressed 8,018 2 ,0 0 4 ** 2 ,2 7 8 3 ,2 8 2 **** 1 ,3 9 2
Em b r yo n ic C o lo n
Murine tumor models
Ov e r-e x p re sse d Un d e r-e x p re sse d
(a)
(c) C8C8
C9C9
C10C10
(b)
Gen
e ex
pres
sion
rela
tive
to a
dult
colo
n
**
(d)
ED (E13.5-E15.5)LD (E16.5-E18.5)
AMAM
STST
Gen
e ex
pres
sion
re
lativ
e to
adu
lt co
lon
nAC
4.0
0.3
1.0
4.0
0.3
1.0
20,3
93 fe
atur
es4,
693
feat
ures
750
feat
ures
Genome Biology 2007, 8:R131

http://genomebiology.com/2007/8/7/R131 Genome Biology 2007, Volume 8, Issue 7, Article R131 Kaiser et al. R131.11
com
ment
reviews
reports
refereed researchdepo
sited researchinteractio
nsinfo
rmatio
n
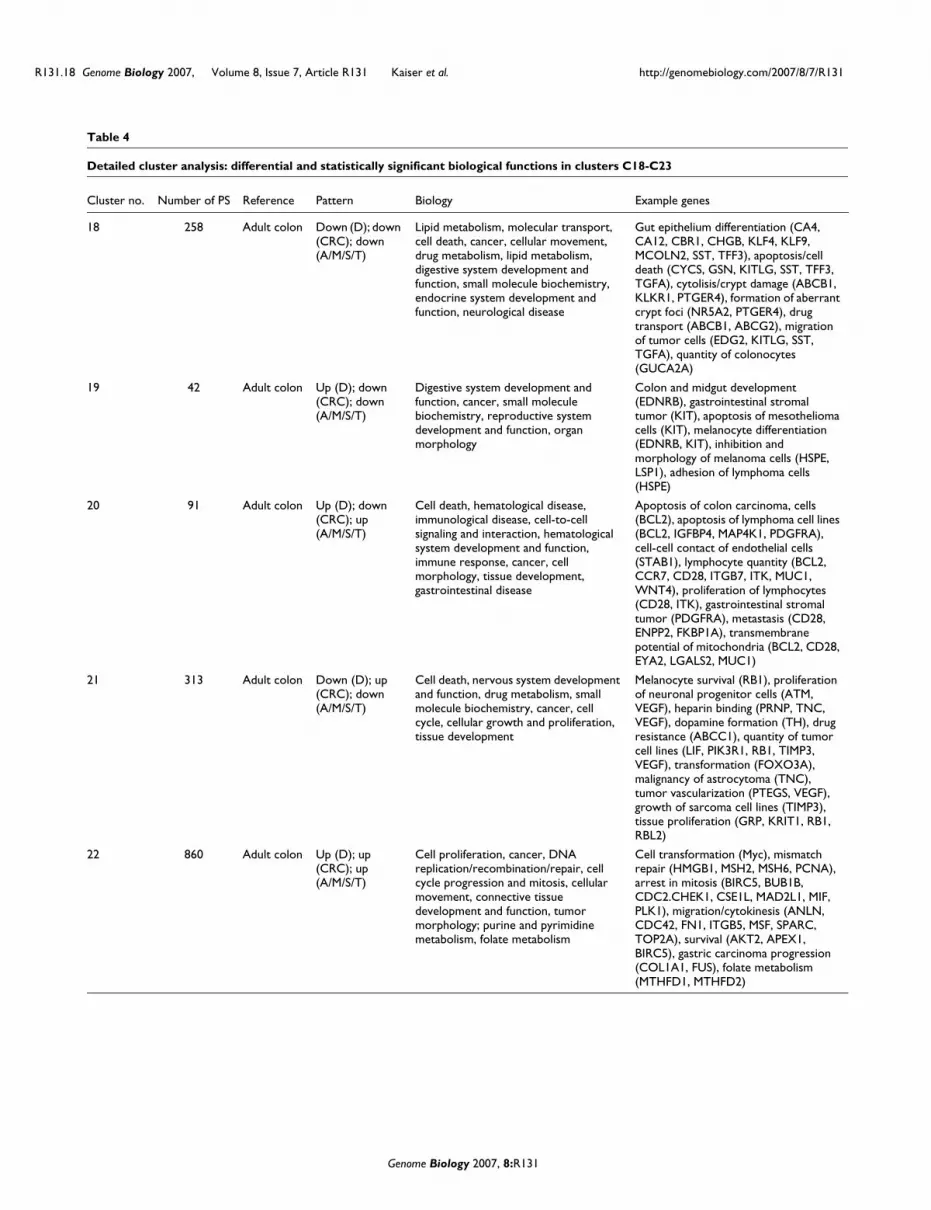
All overlaps between tumor expression and developmentwere pooled to form a set of 2,116 ortholog gene transcripts.This was subjected to hierarchical tree and K-means cluster-ing to define six expression clusters, C18-C23 (Figure 6c;Table 4). These clusters provide an impressive partitioning ofgroups of genes associated with different biological functionscritical for colon development, maturation and oncogenesis.Cluster C22 (860 transcripts of genes strongly expressed bothdevelopmentally and across all tumors) is highly enrichedwith genes associated with cell cycle progression, replication,
cancer, tumor morphology and cellular movement. ClusterC18 (258 transcripts down-regulated in mouse and humantumors, as well as in development) is highly enriched in genesassociated with digestive tract function, biochemical and lipidmetabolism. This cluster is clearly composed of genes associ-ated with the mature GI tract. Thus, as opposed to recapitu-lating developmental gene activation, the cluster C18 patternindicates a corresponding arrest of differentiation in bothmouse and human tumors. Cluster C23 (142 transcripts over-expressed in all mouse models and human CRC, but with low
All four murine tumor models exhibit reactivation of embryonic gene expressionFigure 4 (see previous page)All four murine tumor models exhibit reactivation of embryonic gene expression. The expression level of each gene in each sample was calculated relative to that in adult colon. Genes and samples were subjected to unsupervised hierarchical tree clustering for similarities among genes and tumors. (a) Heatmap shows the relative behaviors of 20,393 transcripts that passed basic signal quality filters with gene transcripts shown as separate rows and samples as separate columns. Note that the majority of genes over-expressed in tumors (red) are also over-expressed in embryonic colon; similarly, the genes under-expressed in tumors (blue) are under-expressed in embryonic colon. The color bars to the right indicate the position of 4,693 transcripts over-expressed in both tumors and development (red) or under-expressed in both (green). In addition, there are genes over-expressed in embryonic colon that are under-expressed in tumors and vice versa (asterisks). (b) The genes represented in (a) were divided into those over-expressed and under-expressed in embryonic colon and in the tumors, respectively. Fisher's exact test was used to calculate expected overlaps between lists and confirmed significant over-representation of development-regulated signatures among the tumors (*p < 1-300, **p < 1.3-19, ***p < 4-296, ****p < 1-300). (c) Heatmap showing the behavior of a subset of the transcripts in (a) (n = 4,693 features) that were over-expressed in both embryonic colon and tumor samples. Refer to Table 2 for a complete description of the genes associated with these clusters. (d) Embryonic gene expression can be further refined into genes expressed differentially during early (ED; E13.5-15.5) and late (LD; E16.5-18.5) embryonic development. Heatmap showing the relative behaviors of 750 transcripts that are highest-ranked for early versus late embryonic regulation. Overall, transcripts with the highest early embryonic expression were expressed at higher levels in nuclear β-catenin-positive tumors (A and M), whereas nuclear β-catenin-negative tumors (S and T) were representative of later stages of embryonic development. Sample groups: ED, early development (E13.5-E15.5); LD, late development (E16.5-E18.5); A, AOM-induced; M, ApcMin/+; T, Tgfb1-/-; Rag2-/-; S, Smad3-/-. Staging: nAC, normal colon. Clusters C8-C10 to the right of the heatmap correspond to the K-means functional clusters listed in Table 2.
Table 2
Detailed cluster analysis: differential and statistically significant biological functions in clusters C8-C10
Cluster no. Number of PS Reference Biology Example genes
8 1,240 Adult RNA post-transcriptional modification, cell cycle, cellular assembly and organization, DNA replication/recombination/repair, cancer, molecular transport, protein traffic and synthesis, cellular development, gastrointestinal disease, IGF-1 signaling, Wnt-signaling
Mitosis (Ask, Birc5, Bcra1, Cdc2, Cdk4, Chek1, Mad2l1, Mif, Plk1), DNA mismatch repair (Hgmb1, Msh2, Pcna, Rev1l, Xrcc5), cell transformation (Cdc37, Id2, Myc), cell proliferation (Ctnnb1, Pcna, Plat, Plk1, Rala, Top2a), colorectal cancer (Birc5, Brca1, Cdc37, Myc, Top53), IGF-1 signaling (Igf1, Igfb4, Mapk1, Prkc, Ptpn11), Wnt signaling (Csnk1a1, Csnk2a1, Ctnnb1, Gs3kb, Myc, Nlk, Tcf3, Tcf4)
9 1,676 Adult Protein synthesis, RNA-post transcriptional modification, cancer, connective tissue development and function, embryonic development, organ morphology, tissue morphology, cell-to-cell signaling and interaction, tissue development
Protein synthesis (Csf1, Eif5, Gadd45g, Itgb1, Sars, Tnf, Traf6), transformation (Ccnd1), formation of hepatoma cell line (Hras, Pin1, Shfm1), cell growth (Nrp1, Tnf), invasion of lymphoma cell line (Itgb1, Itgb2), proliferation of ovarian cancer cell lines (Fst, Hras, Itgfb5, Sod2, Sparc), fibroblast cell cycle progression (Ccnf, E2f5, Hras, Map4, Rhoa, Skil), survival of epiblast (Dag1, Itgb1), cell adhesion (Icam1, Itgb1, Itgb2, Lu, Rhoa, Tnf)
10 1,051 Adult Cell cycle, cellular assembly and organization, DNA replication, recombination/repair, cellular function and maintenance, cancer, cardiovascular system development and function, gene expression, immunological disease, digestive system development and function, activin/inhibin signaling
Cell cycle (Cdk2, Ccnd3, Siah), exocytosis (Nos3, Snap23, Stx6, Vamp2), Burkitt's lymphoma (Dmtf1), cell transformation (Mmp2, Pecam1), angiogenesis (Mdk, Nos3), activation of RNA (Hrsp12, Rps6kb1), development of gastrointestinal tract (Pdgfra, Sptbn1), activin/inhibin signaling (Acvr2b, Bmpr1b, Inha, Map3k7, Mapk8, Tgfbr1)
PS, ProbeSets.
Genome Biology 2007, 8:R131
R131.12 Genome Biology 2007, Volume 8, Issue 7, Article R131 Kaiser et al. http://genomebiology.com/2007/8/7/R131
Table 3
Detailed cluster analysis: differential and statistically significant biological functions in clusters C11-C17
Cluster no. Number of PS Reference Biology Example genes
11 167 Global Molecular transport, protein traffic, lipid metabolism, small molecule biochemistry, cardiovascular system development, dermatological diseases and conditions, organismal development, organismal injury and abnormalities, cancer, digestive system development and function
Protein excretion (BF, EDNRA, KL), corticosteroid/daunorubicin transport (ABCB1), modification of cholesterol (ABCB1, SULT2B1), neovasculariation of animal (TNFRSF6B, TNFSF11), angiogenesis of granulation tissue (PTGES), blister formation (COL17A1, FRAS1), development of enteroendocrine cells (NEUROD1), crypt size (FOLR1), connective tissue formation (EDNRA, IL7, MSX2, PTGES, WT1), division of mesenchymal cells (BMP7)
12 762 Global RNA post-translational modification, gene expression, cancer, renal and urological disease, RNA traffic embryonic development, cell-to-cell signaling and interaction, estrogen receptor signaling, EGF signaling, PI3K/AKT signaling
Processing of RNA (HNRPA2B1, HNRPD, HNRPH1, PRPF4B, RBM6, RBPMS, SFPQ, SFRS3, SFRS4, SNRPA1, U2AF1, ZNF638), transactivation of glucocorticoid/thyroid hormone response element (FOXO1A, NCOR1, NR3C1, RORA), tumorigenesis (CD44, CTNNB1, EGFR, NF1, PRKAR1A, PTEN, THBS1), adhesion of tumor cells (CD44, CD47, EGFR, PTK2, THBS1), juvenile/colonic polyposis (CTNBB1, PTEN, SMAD4), IGF1-signalling (CTNBB1, FOXOA1, PTEN, SOS2)
13 213 Global Cell morphology, cellular development, hematological disease, genetic disorder, embryonic development, cellular assembly and organization, hair and skin development and function, cardiovascular system development and function, cancer, digestive system development and function
Conversion of epithelial cells (ATOH1, DMBT1, FOS), depolarization of cells (CACNA1C, FOS, NTS), development of Goblet/Paneth/enteroendocrine cells (ATOH1), hematological disease (HBA1, HBA2, HBB, GIF), partington syndrome (ARX), muchopolysaccharidosis (HYAL1), Pfeiffer's syndrome (FGFR2), retinoic acid synthesis (ALDH1A1, ALDH1A2), adenoma inflammation (TFF1), density of connective tissue (MIA, TNFRSF11B)
14 161 Global Cancer, cellular movement, skeletal and muscular disorders, immune response, gastrointestinal disease lipid metabolism, reproductive system disease, small molecule biochemistry, digestive system development and function, tissue development
Migration/invasion of tumor cell lines (CDKN2A, CST6, DPP4, KITLG, LAMA3, LCK, MDK, SERPINB5, TFF2, TGFA), tumorigenesis of intestinal polyp (ASPH), proliferation of tumor cell lines (APRIN, CDKN2A, CST6, IMP3, LITLG, PIWIL1, SLP1, TGFA), cytotoxic reaction (CDKN2A, LCK), invasion of tumor cell lines (CDKN2A, CST6, DPP4, SERPINB5, TFF2, TGFA), tumorigenesis of small intestine (PLA2G4A), size/tumorigenesis of polyp (ASPH, CDKN2A, TGFA)
15 366 Global Drug metabolism, endocrine system development and function, small molecule biochemistry, lipid metabolism, molecular transport, gene expression, cell death, cell morphology, cancer, gastrointestinal disease, digestive system development and function, tissue development
Steroid metabolism (AKR1C2, CYP3A5, UGT2B15, UGT2B17), conversion of progesterone (AKR1C3, HSD3B2), modification of dopamine (SULT1A3, XDH), oxidation of norepinephrine (MAOA), drug transport (ANCB1, ABCG2), transport of fludarabine (SLC28A2), hydrocortisone uptake (ABCB1), formation of aberrant crypt foci (NR5A2, PTGER4), cell death of enteroendocrine cells (GCG, PYY), growth of crypt cells (NKX2, NKX3)
16 221 Global Cardiovascular system development and function, cellular movement, hematological system development and function, immune response, cancer, neurological disease, carbohydrate metabolism, organismal development, digestive system development and function, tissue development
Cell movement/proliferation of endothelial cells (ADIPOQ, CXCL12, ENPP2, FGF13, HGF, HHEX, MYH11, PTN), formation of endothelial tube and blood vessel (ADAMTS1, ANGPTL1, CCL11, CXCL12, ENPP2, F13A1, HGF, MEF2C, MYH11, PTEN), cell movement of cancer cells (CXCL12, CD36, HGF, IGF1, L1CAM, SFRP1, PTN), tumorigenesis (AGTR1, CNN1, ENPP2, FGF7, HGF, IGF1, KIT, L1CAM), Hirschprung disease (EDNRB, L1CAM)
Genome Biology 2007, 8:R131

http://genomebiology.com/2007/8/7/R131 Genome Biology 2007, Volume 8, Issue 7, Article R131 Kaiser et al. R131.13
com
ment
reviews
reports
refereed researchdepo
sited researchinteractio
nsinfo
rmatio
n
expression in development) maps to genes highly associatedwith the disruption of basement membranes, invasion andcell cycle progression, as well as altered transcriptional con-trol. Cluster C21 (313 transcripts in which human tumorssomewhat variably express a set of genes that are rarelyexpressed by the mouse tumors) is remarkable for its compo-sition of genes associated with cell cycle proliferation, tissuedisruption and angiogenesis. Thus, while categorically quitesimilar to cluster C23, the genes in cluster C21 represent aseparately regulated module that is enriched for genesassociated with invasion. Clusters C21 and C23 reveal sets ofgenes likely involved in tumor progression. Cluster C22 (withgenes over-expressed in all mouse and human tumors andstrongly expressed in embryonic colon) represents a group ofgenes highly correlated with transformation. The top-rankedtranscription factor present in this cluster, with regulationindependent of β-catenin localization, is Myc/MYC (Figure7b). Although Myc was lower in expression in the Smad3-/-
tumors compared to tumors from the other three models, itwas elevated in all four models relative to normal adult colon.Myc/MYC was over-expressed in all mouse and humantumors as well as in development. This contrasts with Sox4,which is unaltered in expression in the Smad3-/- and Tgfb1-/-;Rag2-/- tumors but is up-regulated in AOM and ApcMin/+
tumors relative to normal adult colon (Figure 7b). Myc/MYCover-expression may be independent of nuclear β-cateninstatus. Increased Myc/MYC expression may reflect both acti-vation of canonical Wnt signaling, as it is a target of nuclearβ-catenin/TCF [28], and deregulation of TGFβ signaling, asTGFβ1 is known to repress Myc/MYC [29-31]. These observa-tions suggest a fundamental role for Myc/MYC in colonicneoplasia.
DiscussionNumerous mouse models of intestinal neoplasia have beendeveloped, each with unique characteristics. The models con-structed to date, however, do not fully represent the complex-ity of human CRCs principally because most are unigenic inorigin and produce primarily adenomas and early stage can-cers. Although models like ApcMin/+ show molecular similari-ties to human CRCs, such as initiation of adenoma formation
by inactivation of Apc, little is known about the molecularsimilarities of tumors from the different mouse models. It isalso unknown how such common and perhaps large-scalemolecular changes in mouse models relate to the molecularprogramming of human CRC. To shed light on the underlyingmolecular changes in tumors from mouse models and humanCRC, we assessed the relationship at the molecular level offour widely used, but genetically distinct, mouse models thatdevelop colon tumors. A subsequent analysis of the models inthe context of embryonic mouse colon development was alsoundertaken. Finally, to identify consensus species-independ-ent cancer signatures that may define gene expressionchanges common to all CRCs, we projected relevant mousemodel signatures onto a large set of human primary CRCs ofvaried histopathology and stage.
Differential canonical WNT signaling activity discriminates two major classes of mouse models of CRC with distinct molecular characteristicsTumors from mouse models of CRC exhibit significant phe-notypic diversity [6], and, therefore, were expected to exhibitdifferential gene expression patterns. Using a combination ofinter-model and normal adult gene expression level referenc-ing, our analysis of tumors from mouse models of CRC hasrevealed a low complexity between models and strains, andhas identified common and unique transcriptional patternsassociated with a variety of biological processes and pathway-associated activities. Our results demonstrate an imbalancebetween proliferation and differentiation, with nuclear β-cat-enin-positive tumors being more proliferative, less differenti-ated and with lower immunogenic characteristics thantumors from nuclear β-catenin-negative tumors. Mousetumors characterized by signatures of relative up-regulationof genes associated with cell cycle progression also showedincreased canonical WNT signaling activity (ApcMin/+ andAOM). Tumors from mouse models not showing canonicalWNT signaling pathway activation (Smad3-/- and Tgfb1-/-;Rag2-/-) were characterized by up-regulation of genes associ-ated with inflammatory and innate immunological responses,and intestinal epithelial cell differentiation. Recent studieshave indicated that chronic inflammation caused either byinfection with Helicobacter pylori [32] or Helicobacter
17 734 Global Immune response, cellular movement, hematological system development and function, cell-to-cell signaling and interaction, immune and lymphatic system development and interaction, tissue development, connective tissue disorders, inflammatory disease, cancer
Cell invasion (CD14, CTSB, CTSL, ETS1, FN1, FSCN, FST, INHBA, ITGB2, LOX, MMP2, MMP9, MMP11, MMP12, MMP13, MYLK, OSM, PLAU, RECK, RGS4, RUNX2, S100A4, SPP1, SULF1, TIMP3), adhesion of tumor cells (ADAM12, ANXA1, CCL3, CCL4, FN1, ICAM1, IL6, ITGA4, ITGB2, PLAU, SELE, THBS1), metastasis of carcinoma cell lines (CCL2, DAPK1, S100A4, TWIST1, WISP1), tumor cell spreading (FN1, PLAU, SNAI2, THBS1, TNC), progression of gastric carcinoma (APOE, COL1A1, COL1A2)
PS, ProbeSets.
Table 3 (Continued)
Detailed cluster analysis: differential and statistically significant biological functions in clusters C11-C17
Genome Biology 2007, 8:R131

R131.14 Genome Biology 2007, Volume 8, Issue 7, Article R131 Kaiser et al. http://genomebiology.com/2007/8/7/R131
hepaticus [13] is a prerequisite for intestinal tumor develop-ment in Smad3-/- and Tgfb1-/-; Rag2-/- mice, respectively.
The activation of canonical WNT signaling in AOM tumorswas identified using a between-tumor global median normal-ization to gene expression data. However, when tumor sam-ple expression was referenced to that of normal adultintestinal tissue, many more genes are up-regulated, includ-ing developmental genes that are not dependent on nuclear β-catenin. That canonical WNT signaling-related genes arealtered similarly in both AOM and ApcMin/+ tumors suggests
biological similarities between the two models. In addition,the relatively consistent programming within the AOM modelalso emphasizes its value for examining the more complicatedgenetics that result in strain-specific sensitivity to environ-mental agents that induce cancer.
Activation of canonical WNT signaling leads to nuclear trans-location of β-catenin and, through its interaction with LEF/TCF, the regulation of genes relevant to embryonic develop-ment and proliferation [16], as well as stem cell self-renewal[33]. Consequently, the activated canonical WNT signaling
Human CRCs exhibit gene expression profile complexity consistent with significant tumor subclassesFigure 5Human CRCs exhibit gene expression profile complexity consistent with significant tumor subclasses. Genes potentially able to distinguish cancer subtypes were identified from Affymetrix HG-U133 plus2 Genechip expression profiles by filtering for 3,285 probe sets that were top-ranked by raw expression and their differential regulation in at least 10 out of 100 human colorectal cancer tumors. Coordinately regulated transcripts and similarly behaving samples were identified via hierarchical tree clustering. Seven different gene clusters (C11-17) were identified that distinguished ten or more tumors from the other tumors. Gene clusters were found to be highly enriched for gene functions listed in Table 3. Data were processed using Robust Microarray Analysis (RMA) with expression value ratios depicted as the relative expression per probe set in each sample relative to the median of its expression across the 100 CRCs. A striking heterogeneity of gene expression was observed, including metallothionein genes in cluster C15 previously shown to be predictive of microsatellite instability (indicated by asterisk), and C17 represented by 734 probesets rich in genes associated with extracellular matrix and connective tissue, tumor invasion and malignancy. Tissue groups: AC, adult colon; CRC, human CRC. Staging: nAC, normal colon; Dukes A-D, human tumors obtained from individuals. Clusters C11-C17 labeled to the right of the heatmap correspond to the K-means functional clusters listed in Table 3.
3.0
0.3
1.0
C17C17
C11C11
C15C15
C12C12
C16C16
C14C14
Gen
e ex
pres
sion
rel
ativ
e to
tum
or m
edia
n
C13
3,28
5 fe
atur
es
*
nACCRC
Sample type Dukes stage
nACAC
BD
Sample typeDukes stage
Genome Biology 2007, 8:R131

http://genomebiology.com/2007/8/7/R131 Genome Biology 2007, Volume 8, Issue 7, Article R131 Kaiser et al. R131.15
com
ment
reviews
reports
refereed researchdepo
sited researchinteractio
nsinfo
rmatio
n
observed in ApcMin/+ and AOM models suggests that tumorsmay arise as a consequence of proliferation of the stem cell or'transient amplifying' compartment. In the colonic crypt, lossof TCF4 [34] or DKK1 over-expression [35] promotes loss ofstem cells, suggesting that canonical WNT signaling isrequired for the maintenance of the intestinal stem cell com-partment [34-36]. Conversely, increased nuclear β-catenin/TCF4 activity imposes a crypt progenitor phenotype on tumorcells [18]. In this study, we identified transcriptional activa-tion of the canonical WNT signaling pathway in tumors fromApcMin/+ and AOM mice. This was confirmed by immunohis-tochemistry (Figure 2b).
In colon tumors and perhaps intestinal stem cells, activationof canonical WNT signaling promotes a hyperproliferativestate. Proliferation-related characteristics of nuclear β-cat-enin-positive tumors include increased expression of CCND1,MYC, PCNA [18], and Sox4 [16]. These genes were alsoidentified as a component of our nuclear-β-catenin-positivesignatures. In turn, increased MYC decreases intestinal celldifferentiation by binding to and repressing the Cdkn1a (cod-ing for p21CIP1/WAF1) promoter [37], the gene encoding Wnt-inhibitory factor Wif1, the gene encoding the negative regula-tor of WNT Naked1 [38], and the gene encoding the Tak1/Nemo-like kinase, Nlk [39]. Wif1 displays a graded expres-sion in colonic tissue, with higher expression in the stem cellcompartments and lower expression in the more differenti-ated cells at the luminal surface, suggesting that Wif1 maycontribute to stem cell pool maintenance independent ofWNT signaling inhibition. [40].
Canonical WNT signaling not only governs intestinal cell pro-liferation, but also cell differentiation and cell positioningalong the crypt-lumen axis of epithelial differentiation.Increased canonical WNT signaling activity enhancesMATH1-mediated amplification of the gut secretory lineages[41]. Canonical WNT signaling also influences cellpositioning by regulating the gradient of EPHB2/EPHB3 andEPHB1 ligand expression [42,43]. Together, our data suggesta complex imbalance of crypt homeostasis due to enhancedcanonical WNT activity.
Our results indicate that tumors arising in response to abnor-mal TGFβ1/SMAD signaling [14,44] are similar to oneanother in their specific gene signatures and broadly distinctfrom those with activated canonical WNT signaling by theirabsence of nuclear β-catenin. Unique to the dysregulatedTGFβ1/SMAD4 signaling models is the strong signature of animmunologically altered state, with up-regulation of genesdetermining immune and defense responses, such as Il18,Irf1 and mucin pathway-associated genes. Again, thesetumors are usually characterized by a strong inflammatorycomponent when evaluated histopathologically, even in theabsence of T- and B-cells such as in the Tgfb1-/-; Rag2-/- back-ground.
As shown in Figure 2a, the microarray patterns of geneexpression for AOM and ApcMin/+ tumors are mirror imagesof those for Tgfb1-/-; Rag2-/- tumors. It is perhaps not surpris-ing that combining these two transcriptional programsresults in increased number and invasiveness of colonictumors as recently reported for ApcMin/+ mice crossed toSmad3-/- mice [45]. Moreover, combined activation of canon-ical WNT signaling and inhibition of TGFβ signaling alsoresults in more advanced intestinal tumors in Apcdelta716/+;Smad4+/- mice [46], and intestine-specific deletion of thetype II TGFβ receptor in Apc1638N/wt mice [47].
The findings that shared over-expressed signatures are iden-tifiable in all four mouse models of CRC, which are also rep-resentative of the majority of embryonic colonic over-expressed signatures, and that these signatures are alsopresent in all human CRCs, suggest that colon tumors mayarise independently of canonical WNT signaling status. Alikely candidate to impart this oncogenic signaling is Myc,which is an embryonic up-regulated transcript that is alsoupregulated in all human CRCs and mouse tumor modelsindependently of nuclear β-catenin status.
Embryology provides insight into the biology of mouse and human colon tumorsIt has long been suggested that cancer represents a reversionto an embryonic state, partly based upon the observation thatseveral oncofetal antigens are diagnostic for some tumors[48,49]. To assess the embryology-related aspects of tumori-genesis and tumor progression in CRC, we analyzed and com-pared the transcriptomes of normal mouse colondevelopment and models of CRC. Our data show that devel-opmentally regulated genes represent approximately 56% ofmouse tumor signatures, and that the tumor signatures fromthe four mouse models recapitulate approximately 85% ofdevelopmentally regulated genes.
There are at least two regulatory programs that determine theexpression of developmental genes by mouse tumors (Figures2, 4, and 8). The simpler program is evident by the over-expression of the earliest genes of colon development by thenuclear β-catenin-positive models. The more subtle programcould be detected only in reference to adult colon and ishighly shared by nuclear β-catenin-negative models. Thisprogram, though modified by nuclear β-catenin status, is rep-resented by a large scale over-expression of developmentallyexpressed genes in tumors that are both positive and negativefor canonical WNT signaling. Genes found within this signa-ture have a large overlap with those present in the colon atlater developmental stages (E16.5-E18.5).
How do genes tightly regulated during mouse colon develop-ment become activated in colon tumors? While activatedcanonical WNT signaling imparts a strong influence, itsabsence in Tgfb1-/-; Rag2-/- and Smad3-/- tumors, as deter-mined by the absence of nuclear β-catenin, did not prevent
Genome Biology 2007, 8:R131

R131.16 Genome Biology 2007, Volume 8, Issue 7, Article R131 Kaiser et al. http://genomebiology.com/2007/8/7/R131
Figure 6 (see legend on next page)
(a)2,
216
feat
ures
(c)
3.0
0.3
1.0
3.0
0.3
1.0
Observed Expected Observed Expected
Ortholog genome 8,621 2,718 n/a 2,365 n/a
Ov er-expressed 2,212 1,080* 697 549*** 607
Under-expressed 737 156** 232 431**** 202
Embryonic colon
Human CRCs
Ov er-expressed Under-expressed
8,62
1 fe
atur
es 3.0
0.3
1.0
3.0
0.3
1.0
EDLD
nACAM
ST CRC
C22C22
C18C18C19C19
C23C23
C20C20C21C21
EDLD
nACAM
ST CRC
(b)
Gen
e ex
pres
sion
rela
tive
to a
dult
colo
nG
ene
expr
essi
on re
lativ
e to
adu
ltco
lon
Genome Biology 2007, 8:R131

http://genomebiology.com/2007/8/7/R131 Genome Biology 2007, Volume 8, Issue 7, Article R131 Kaiser et al. R131.17
com
ment
reviews
reports
refereed researchdepo
sited researchinteractio
nsinfo
rmatio
n
the large scale activation of developmental/embryonic geneexpression. One mechanism may be through epigenetic alter-ations. In human CRCs, these types of alterations in geneexpression programs [50] suggest a link between cellularhomeostasis and tumorigenesis. The recruitment of histoneacetyltransferases and histone deacetylases (HDACs) are keysteps in the regulation of cell proliferation and differentiationduring normal development and carcinogenesis [51].Induction of Hdac2 expression occurs in 82% of human CRCsas well as in tumors from ApcMin/+ mice [19]. Alternatively,common regulatory controls may operate in parallel growthand differentiation/anti-diifferentiation pathways such that asingle or small subset of regulators, such as MYC or one ormore micro RNAs, may be responsible for the control ofmultiple pathways. Indeed, consistent with our observationof nuclear β-catenin-independent activation of Myc in allmouse models and across the board for human CRC, deletionof Myc has recently been demonstrated to completely abro-gate nuclear β-catenin-driven small bowel oncogenesis inmouse models [52].
Comparative analysis reveals underlying development-related signatures in human CRCsAs shown in Figure 5, considerable and intriguing heteroge-neity of human CRC is observed among genes highly relevantfor differential malignant behavior. However, employingbetween-tumors normalization and referencing strategiesprevents the detection of gene expression patterns that areshared between tumors. Using the adult normal colon as areference, as shown in Figure 6, a large fraction of differentialgene expression relative to adult colon could be demonstratedthat recapitulated developmental gene expression by virtue ofboth activating embryonic colon gene expression and failingto express genes associated with normal colon maturation.Within these developmentally regulated gene sets, our analy-
ses revealed little evidence of CRC subsets, including thosesuggestive of nuclear β-catenin negative tumors that mightapproximate the Smad3-/- and Tgfb1-/-; Rag2-/- signature.Our inability to identify distinct subclasses with respect todevelopmental genes in the human CRCs is perhaps not sur-prising in that over 80% of microsatellite-unstable (MSI+)CRCs from HNPCC families exhibit nuclear β-catenin [53]. Inaddition, within the developmental genes, little evidence wasapparent for signatures related to MSI+ tumors, often associ-ated with HNPCC, although some of this type of signature wasperhaps apparent in the median normalized depiction of thetumors as highlighted in Figure 5.
This report constitutes a comprehensive molecular evalua-tion and comparison of mouse and human colon tumor geneexpression profiles. We have greatly improved our ability tocompare tumor gene expression profiles between mouse andhuman tumors by using a referencing strategy in which geneexpression levels in the tumor samples are analyzed in rela-tion to gene expression in corresponding normal colon epi-thelium. This approach has revealed that gene expressionpatterns are both shared and distinct between mouse modelsand human CRCs. Although several recent studies have sug-gested that tumors recapitulate embryonic gene expression[16,27,54,55], the present study demonstrates the magnitudeof this similarity.
Finally, our results suggest that comparisons made betweenmouse tumor models, developing embryonic tissues, andhuman CRCs provides a powerful biological framework fromwhich to observe shared and unique genetic programs associ-ated with human cancer. While ortholog-gene based analyseshave been used previously to obtain direct comparison of themolecular features of mouse and human hepatocellular carci-nomas [56], our results provide striking support for the
Both human CRCs and mouse colon tumors reactivate an embryonic gene signatureFigure 6 (see previous page)Both human CRCs and mouse colon tumors reactivate an embryonic gene signature. When human and murine tumors are compared, they both broadly re-express an embryonic gene expression pattern. Gene expression profiles from the mouse tumor models and human CRC samples were combined into a single non-redundant gene ortholog genome table structure and subjected to comparative profile analysis. Informative probe-sets from human and mouse platforms were selected, mapped to corresponding ortholog genes, and used to populate a table in which normalized expression for each gene is relative to normal adult colon. (a) Heatmap plot for all cross-species gene orthologs both present and successfully measured on both the Affymetrix Hg-U133 and Vanderbilt Mouse NIA 20 K microarrays (n = 8,621 features). This representation suggests that a large number of human CRC signatures exhibit similar behaviors in the mouse tumors and during embryonic mouse colon development (sidebar: 1,080 (red) and 431 (green) gene lists from (b)). (b) Based on results in (a), four separate gene lists were generated with criteria of over- or under-expression in development or over-expression or under-expression in human CRCs (2,718, 2,365, 2,212, and 737, respectively, with the overlaps shown as a sidebar in (a); red, 1,080 transcripts, and green, 431 transcripts). Genes over-expressed and under-expressed in embryonic mouse colon and human CRCs were found to be over-represented as determined by Fisher's exact test analysis (*p < 7 × 10-88, **p < 1 × 10-76, ***p < 5 × 10⁻⁴, ****p < 1 × 10-76). (c) Heatmap plot of all genes co-regulated in human CRCs and during early (ED) and late (LD) mouse embryonic colon development (n = 2,216 features). Six predominant clusters (C18-C23) characterize the transcriptional relationship between human CRC and mouse colon tumor models and embryonic development. Two clusters (C20 and 21) primarily distinguish human CRCs from murine tumors (A, M, S and T). For example, CRC up-regulated transcripts that are either developmentally up- or down-regulated are represented by cluster C22 (n = 860 features) and clusters C21/C23 (n = 142 features), respectively. Conversely, CRC down-regulated transcripts that are either down- or up-regulated during development are shown in clusters C18/C19 (n = 258 features) and cluster C20 (n = 42 features), respectively. Interestingly, while approximately 80% and approximately 60% of genes up- and down-regulated in both human CRCs and mouse development were also up- and down-regulated in tumors from the various mouse models, several clusters provide very interesting exceptions: cluster C20 comprises genes down-regulated in human CRCs that are routinely over-expressed in mouse tumors and development; cluster C21 comprises genes robustly expressed in human CRC that are rarely expressed in embryonic colon or murine tumors. Sample groups: ED, early development (E13.5-E15.5); LD, late development (E16.5-E18.5); A, AOM-induced; M, ApcMin/+; T, Tgfb1-/-; Rag2-/-; S, Smad3-/-. Tissue groups: AC, adult colon; CRC, human CRC. Staging: nAC, normal colon.
Genome Biology 2007, 8:R131
R131.18 Genome Biology 2007, Volume 8, Issue 7, Article R131 Kaiser et al. http://genomebiology.com/2007/8/7/R131
Table 4
Detailed cluster analysis: differential and statistically significant biological functions in clusters C18-C23
Cluster no. Number of PS Reference Pattern Biology Example genes
18 258 Adult colon Down (D); down (CRC); down (A/M/S/T)
Lipid metabolism, molecular transport, cell death, cancer, cellular movement, drug metabolism, lipid metabolism, digestive system development and function, small molecule biochemistry, endocrine system development and function, neurological disease
Gut epithelium differentiation (CA4, CA12, CBR1, CHGB, KLF4, KLF9, MCOLN2, SST, TFF3), apoptosis/cell death (CYCS, GSN, KITLG, SST, TFF3, TGFA), cytolisis/crypt damage (ABCB1, KLKR1, PTGER4), formation of aberrant crypt foci (NR5A2, PTGER4), drug transport (ABCB1, ABCG2), migration of tumor cells (EDG2, KITLG, SST, TGFA), quantity of colonocytes (GUCA2A)
19 42 Adult colon Up (D); down (CRC); down (A/M/S/T)
Digestive system development and function, cancer, small molecule biochemistry, reproductive system development and function, organ morphology
Colon and midgut development (EDNRB), gastrointestinal stromal tumor (KIT), apoptosis of mesothelioma cells (KIT), melanocyte differentiation (EDNRB, KIT), inhibition and morphology of melanoma cells (HSPE, LSP1), adhesion of lymphoma cells (HSPE)
20 91 Adult colon Up (D); down (CRC); up(A/M/S/T)
Cell death, hematological disease, immunological disease, cell-to-cell signaling and interaction, hematological system development and function, immune response, cancer, cell morphology, tissue development, gastrointestinal disease
Apoptosis of colon carcinoma, cells (BCL2), apoptosis of lymphoma cell lines (BCL2, IGFBP4, MAP4K1, PDGFRA), cell-cell contact of endothelial cells (STAB1), lymphocyte quantity (BCL2, CCR7, CD28, ITGB7, ITK, MUC1, WNT4), proliferation of lymphocytes (CD28, ITK), gastrointestinal stromal tumor (PDGFRA), metastasis (CD28, ENPP2, FKBP1A), transmembrane potential of mitochondria (BCL2, CD28, EYA2, LGALS2, MUC1)
21 313 Adult colon Down (D); up (CRC); down (A/M/S/T)
Cell death, nervous system development and function, drug metabolism, small molecule biochemistry, cancer, cell cycle, cellular growth and proliferation, tissue development
Melanocyte survival (RB1), proliferation of neuronal progenitor cells (ATM, VEGF), heparin binding (PRNP, TNC, VEGF), dopamine formation (TH), drug resistance (ABCC1), quantity of tumor cell lines (LIF, PIK3R1, RB1, TIMP3, VEGF), transformation (FOXO3A), malignancy of astrocytoma (TNC), tumor vascularization (PTEGS, VEGF), growth of sarcoma cell lines (TIMP3), tissue proliferation (GRP, KRIT1, RB1, RBL2)
22 860 Adult colon Up (D); up (CRC); up (A/M/S/T)
Cell proliferation, cancer, DNA replication/recombination/repair, cell cycle progression and mitosis, cellular movement, connective tissue development and function, tumor morphology; purine and pyrimidine metabolism, folate metabolism
Cell transformation (Myc), mismatch repair (HMGB1, MSH2, MSH6, PCNA), arrest in mitosis (BIRC5, BUB1B, CDC2.CHEK1, CSE1L, MAD2L1, MIF, PLK1), migration/cytokinesis (ANLN, CDC42, FN1, ITGB5, MSF, SPARC, TOP2A), survival (AKT2, APEX1, BIRC5), gastric carcinoma progression (COL1A1, FUS), folate metabolism (MTHFD1, MTHFD2)
Genome Biology 2007, 8:R131

http://genomebiology.com/2007/8/7/R131 Genome Biology 2007, Volume 8, Issue 7, Article R131 Kaiser et al. R131.19
com
ment
reviews
reports
refereed researchdepo
sited researchinteractio
nsinfo
rmatio
n
hypothesis that cancer represents a subversion of normalembryonic development. By inclusion of detailed mouseembryonic and developmental profile information, ourresults have revealed critical similarities and differencesbetween the mouse and human tumors that are particularlyrevealing of oncogenic and tumor suppressor programs, somegenes from which should be useful for development ofdiagnostic biomarkers and identification of therapeutic tar-gets and pathways.
Materials and methodsMouse models, human CRC patients and tumor collectionMouse tumorsAll tumors were isolated as spontaneously occurring lesionsin ApcMin/+ [57], Smad3-/- [58], and Tgfb1-/-; Rag2-/-, col-lected at three-to-nine months of age depending on the model(for a review, see [6]). The only exceptions were two ApcMin/+
tumors, UW_3_2778 and UW_6_2748, that were 13 and 14months and the three Tgfb1-/-; Rag2-/- tumors, all five ofwhich had histological features of locally invasive carcinoma[7]. Three- to four-month old mice from various AXB recom-binant inbred lines were treated with AOM doses chosen forenhancement of inter-strain differences in susceptibility [11].Mice were given four weekly i.p. injections of 10 mg AOM perkg body weight, and tumors were collected six months afterthe first injection. Animals were euthanized with CO2, colonsremoved, flushed with 1× phosphate-buffered saline (PBS),and laid out on Whatman 3 MM paper. A summary of themouse strains, mutant alleles and source laboratories is pre-sented in Table 5. All tumors were obtained from the colononly, the particular segment of which is indicated in the GeneExpression Omnibus (GEO) database [59] reposited sampleinformation (GSE5261). The majority of Tgfb1-/-; Rag2-/- andSmad3-/- tumors occur in the cecum and proximal colon andall samples isolated for characterization were obtained fromthere. In contrast, tumors isolated from ApcMin/+ and AOMmice occurred predominantly in the mid- and distal colon. Asmall portion of the tumor was placed in formalin for histol-ogy, with the remainder finely dissected into RNAlater(Ambion Inc., Austin, TX, USA) and stored at -20°C. Normal
adult colon RNA for reference was obtained from whole colonsamples harvested from ten eight-week-old C57BL/6 malemice. The tissue was lysed in Trizol Reagent (Invitrogen Sys-tems Inc., Carlsbad, CA, USA) and homogenized. Total RNAwas purified using a Qiagen kit (USA-Qiagen Inc., Valencia,CA, USA).
Human samples: collection/biopsies, regulatory aspects, compliance and informed consentsSample collection protocol and analyses at the H Lee MoffittCancer Center and Research Institute have been describedpreviously [37]. Information collected with the samples forthis study includes solid tumor staging criteria for tumor,nodes, and metastases (TNM), Dukes staging/presentationcriteria, pathological diagnosis, and differentiation criteria.
RNA isolationAll RNA samples were purified using Trizol Reagent fromfinely dissected tumors and were subjected to quality controlscreening using the Agilent BioAnalyzer 2100 (Agilent Tech-nologies, Santa Clara, CA, USA).
Microarray procedures and data analysisMouse cDNA arraysMouse tumors were analyzed on Vanderbilt UniversityMicroarray Core (VUMC)-printed 20 K mouse cDNA arrays,composed principally of PCR products derived from threesources: the 15 K National Institute of Aging mouse cDNAlibrary; the Research Genetics mouse 5 K set; and an addi-tional set of cDNAs mapped to RefSeq transcripts. Labeling,hybridization, scanning, and quantitative evaluation of thesetwo-color channel arrays were performed according to VUMCprotocols [60] using a whole mouse Universal Referencestandard (E17.5 whole fetal mouse RNA). Arrays were ana-lyzed by GenePix version 3.0 (MDS Inc., Sunnyvale, CA,USA), flagged and filtered for unreliable measurements, withdye channel ratios corrected using Lowess and dye-specificcorrection normalization as previously described [15].
Human Affymetrix oligonucleotide arraysHuman RNA samples were labeled for hybridization toAffymetrix HG-U133plus2 microarrays using the Affymetrix-
23 142 Adult colon Down (D); up (CRC); up (A/M/S/T)
Connective tissue development and function, cell-to-cell signaling, development disorder, organismal injury and abnormalities, tumor morphology, hematological system development and function, immune and lymphatic system development and function, cancer
Cell transformation (ESR1, SRC), basal membrane disruption (MMP7), cell extension (ATF3, CD82, IL6, SRC), contact growth inhibition (JUN, IL6), osteocyte differentiation (IL6, JUN, SMAD6, SRC), cell cycle progression (ESR1, IER3, IL6, PSEN2), ERK/MAPK signaling (ESR1, ETS2, PPP1R10, PPP2R5C), development of tumor (CXCL6, ESR1, IER3, IL6, JUN), invasion of colon cancer cell lines (CD82, SRC), colon cancer (JUN, PDGFRL, SRC)
A, AOM-induced; M, ApcMin/+; PS, ProbeSets; S, Smad3-/-; T, Tgfb1-/-; Rag2-/-.
Table 4 (Continued)
Detailed cluster analysis: differential and statistically significant biological functions in clusters C18-C23
Genome Biology 2007, 8:R131

R131.20 Genome Biology 2007, Volume 8, Issue 7, Article R131 Kaiser et al. http://genomebiology.com/2007/8/7/R131
Figure 7 (see legend on next page)
(b)
(a)
MYC
SOX4
nAC-m nAC-h
A M S T Human CRCsMurine tumor
models
Dev
Genome Biology 2007, 8:R131

http://genomebiology.com/2007/8/7/R131 Genome Biology 2007, Volume 8, Issue 7, Article R131 Kaiser et al. R131.21
com
ment
reviews
reports
refereed researchdepo
sited researchinteractio
nsinfo
rmatio
n
recommended standard labeling protocol (Small-scalelabeling protocol version 2.0 with 0.5 μg of total RNA;Affymetrix Technical Bulletin). Microarrays were scannedwith MicroarraySuite version 5.0 to generate 'CEL' files thatwere processed using the RMA algorithm as implemented byBioconductor [15].
Analysis strategyThe four different mouse models of CRC were compared formodel-specific differences, then compared to mouse colondevelopment stages, and then to human CRC samples (Figure1). The mouse tumor sample array data are composed of Low-ess-normalized Cy3:Cy5 labeling ratios of each individualtumor sample versus a universal E17.5 whole fetal mouse ref-erence RNA (described using MIAME guidelines in the NCBIGEO database under series accession number GSE5261). Thefirst approach to referencing was to compare normalizedratios across the tumor series. To do this, for each gene, theLowess-corrected ratio for each probe element (sample ver-sus E17.5 whole fetal mouse reference) was divided by themedian ratio for that probe across the entire tumor sampleseries. This is termed the median-per-tumor expression ratioand was useful for identifying, clustering and visualizing dif-ferences that occur between the different tumor samples.Since we previously collected mouse expression data for nor-mal E13.5-E18.5 colon samples from inbred C57BL/6J andoutbred CD-1 mice [15] using the identical E17.5 whole fetalmouse reference, this allowed us to combine the data directly.Differential expression profiles in the tumors were combinedwith relative developmental gene expression levels by directcomparisons of ratios determined within each experimentalseries. Initial comparisons were made between median nor-malized tumor data to gene expression levels observed in theE13.5-E18.5 and adult (eight week post-natal) colon samples,which were referenced to either E13.5 samples or to the adultcolon. The latter approach subsequently allowed for thebroadest comparison of mouse and human data using geneortholog mapping. Correlated phenomena could be observedfrom any of the different referencing strategies.
Inter-organism gene ortholog and inter-platform comparison strategyPairs of human and mouse ortholog genes (12,693) werecurated using the Mouse Genome Informatics (MGI; TheJackson Laboratory) [61] and National Center for Biotechnol-
ogy Information (NCBI) Homologene [62] databases. Indi-vidual microarray elements or features were mapped to these.The concatenated human and mouse RefSeq IDs was used asthe composite ID for the orthologous gene pair in the orthologgenome definition. NIA/Research Genetics mouse cDNAswere mapped to human orthologs using a variety of resources,usually via the Stanford Online Universal Reference resource[63]. Gene transcript assignments were made unique bychoosing the longest corresponding transcript. To map theAffymetrix human and mouse array data into the orthologgenome, we used a sequence matching approach. First, weobtained human and mouse transcript sequences fromRefSeq [64] and probe sequences from the manufacturer'swebsite [65]. Next, we computed all perfect probe-transcriptpairs. We excluded probes that matched multiple gene sym-bols but accepted probes that matched multiple transcripts.Probe sets were assigned to represent a given transcript if atleast 50% of the perfect match probes of the probe setmatched to that transcript. The newly assigned transcriptidentifiers were then used to map probe sets to orthologgenes. Since some transcripts have multiple probe-set repre-sentations on both the Affymetrix and cDNA microarrays toone ortholog identifier, we employed an ad hoc strategy to usethe average of those probe sets or cDNAs that exhibited con-sistent regulation across a sample series. In such cases, thesignals of the regulated probe sets that were interpreted asbeing in agreement were averaged and assigned to the corre-sponding ortholog. We excluded probe sets or cDNAs that wewere aware corresponded to non-transcript genomicsequence as tested using BLAT at the UCSC Goldenpath web-site [66].
Mouse-human RefSeq gene ortholog assignments can befound at GenomeTrafac [67,68]. All ortholog assignmentsand cross-species mapping annotations were incorporatedinto annotations associated with the Affymetrix HG-U133plus2.0 genome. Gene expression ratios obtained for themouse samples were then represented as expression valueswithin the human platform for all of the probe sets thatmapped to the corresponding mouse gene ortholog. Data forthe primary human sample series, as well as the combinedmouse-human data sets, are available in the Cincinnati Chil-dren's Hospital Medical Center microarray data server [69] inthe HG-U133 genome under the KaiserEtAl_2006 folders
The up-regulated signature in tumors from ApcMin/+ (M) and AOM (A) models (cluster C6, Figure 2) is enriched with genes associated with the activation of the canonical WNT signaling pathway, as determined by nuclear β-catenin positivityFigure 7 (see previous page)The up-regulated signature in tumors from ApcMin/+ (M) and AOM (A) models (cluster C6, Figure 2) is enriched with genes associated with the activation of the canonical WNT signaling pathway, as determined by nuclear β-catenin positivity. (a) Schematic diagram of the canonical WNT signaling pathway showing elements present in cluster C6 (gene symbols with gray background). Key elements of this pathway (Ctnnb1, Lef1, Tcf and Myc) are outlined in blue. (b) Relative gene expression for MYC and SOX4 is plotted for individual murine and human tumors. The relative expression level of MYC and SOX4 is normalized to adult colon. Note that whereas Sox4, a canonical WNT target gene, is expressed at high levels in all human CRCs, A/M tumors and during embryonic mouse colon development, it is not expressed in Smad3-/- (S) and Tgfb1-/-; Rag2-/- (T) tumors (black). In contrast, MYC is over-expressed in all human and murine tumors and during colonic embryonic development (red), irrespective of the activation of canonical WNT signaling, as determined by nuclear β-catenin positivity (Figure 2). Tissue groups: as above and: nAC-m, normal adult mouse colon; nAC-h, normal adult human colon; Dev, developing mouse colon.
Genome Biology 2007, 8:R131

R131.22 Genome Biology 2007, Volume 8, Issue 7, Article R131 Kaiser et al. http://genomebiology.com/2007/8/7/R131
Figure 8 (see legend on next page)
Non-developmental p
rograms
invoked by colon cancer
Terminal differentiation/ developmental maturation-associated tumor suppression
Late embryonicgenes
Early embryonicgenes
Embryonic Adult
Gene expression
Human CRC
AOM,AOM,ApcApcMinMin/+/+
Maturegenes
Oncogenes acting via embryonic colon gene
program activation
Adenoma
Human CRC
Mouse CRC models
Normal colon
Tumor suppressors acting via control of
terminal differentiation
Shared colorectal carcinomapatterns
Oncogenes acting via non-developmental tumor growth
program activation
Tumor suppressors acting via inhibition of malignant behaviors
(b)
(a)
Smad3Smad3--//--
Tgfb1Tgfb1--//--
C18C18 Arrest of Arrest of differentiationdifferentiation
C19 C19 Digestive Digestive system development system development
and maturationand maturation
C23 C23 Invasion, Cell Invasion, Cell cycle control Icycle control IC22 C22
TransformationTransformation
C20C20 Loss of apoptosis
C21C21 Cell cycle Cell cycle control IIcontrol II
Subtype-specific colorectal carcinomas
C17 C17 inflammation, Inflammation, extracellular extracellular matrix, metastasismatrix, metastasis
C12C12 Growth, adhesion, RNAadhesion, RNA
Non-developmental malignancy pathways
Genome Biology 2007, 8:R131

http://genomebiology.com/2007/8/7/R131 Genome Biology 2007, Volume 8, Issue 7, Article R131 Kaiser et al. R131.23
com
ment
reviews
reports
refereed researchdepo
sited researchinteractio
nsinfo
rmatio
n
('guest' login; all cross-platform ortholog gene identifiers arecontained as annotation fields within the HG-U133 genometable).
Statistical and data visualization approachesMost normalization, expression-level referencing, statisticalcomparisons, and data visualization were performed usingGeneSpring v7.0 (Silicon Genetics-Agilent (part of AgilentTechnologies). Fisher's exact test was performed online at theMATFORSK Fisher's Exact Test server [70]. To identify dif-ferentially expressed features between two or more classes,we applied GeneSpring's Wilcoxon-Mann-Whitney or theKruskal-Wallis test, respectively. For three or more classes,the initial non-parametric test was followed by the Student-Newman-Keuls post-hoc test. Results from the primary anal-yses were corrected for multiple testing effects by applyingBenjamini and Hochberg false discovery rate (FDR) correc-tion [71]. In general, due to the referencing strategies, goodplatform technical performances, and moderately low within-group biological variation of gene expression, stringent cut-offs could be used, that is, the FDR level of significance wasset between FDR < 5.10-5 and FDR < 5.10-4. K-means cluster-ing was performed using the GeneSpring K-means tool andthe Pearson correlation similarity measure.
Ontology-based analysis of gene cluster-associated functional correlatesGene expression clusters were analyzed for the occurrence ofmultiple genes involved in related gene function categories bycomparing each list of coordinately regulated clustered genesto categories within Gene Ontology, pathways, or literature-based gene associations using GATACA [72], Ontoexpress[73], and Ingenuity Pathway Analysis, version 3 (IPA, Inge-nuity Systems, Redwood City, CA, USA) [74]. To do this, eachcluster indicated in Figures 2, 4, 5, 6 and 8 was converted to alist of gene identifiers, uploaded to the application, and exam-ined for over-representation of multiple genes from one ormore molecular networks, or functional or disease associa-tions as developed from literature mining. Networks of thesefocus genes were algorithmically generated based on the rela-tionships of individual genes as derived from literature reviewand used to identify the biological functions and/or associ-ated pathological processes most significant for each genecluster. Fisher's exact test was used to calculate a p value esti-mating the probability that a particular functional classifica-tion or category of genes is associated with a particularpattern or cluster of gene expression more than would beexpected by chance. For each cluster, only the top significantfunctional classes and canonical pathways are shown. Figure
An integrated view of colon cancer transcriptional programs provides novel insight into neoplasiaFigure 8 (see previous page)An integrated view of colon cancer transcriptional programs provides novel insight into neoplasia. Murine colon tumor adenomas and human CRCs both show adoption and dysregulation of signatures tightly controlled during embryonic mouse colon development. The use of etiologically distinct mouse models of colon cancer allows for the identification of models that resemble different stages of embryonic mouse colon development and that are recapitulated by specific tumor types. (a) All tumors exhibit large-scale activation of developmental patterns. Nuclear β-catenin-positive (ApcMin/+ and AOM) tumors map more strongly to early development stages during (more proliferative, less differentiated), whereas nuclear β-catenin-negative (Tgfb1-/-
; Rag2-/- and Smad3-/-) tumors map more strongly to later stages consistent with increased epithelial differentiation. (b) Overall representation of the relationship of mouse colon tumor models and human CRC to development and non-developmental expression patterns. Gene expression clusters mapped to the progression of adenomatous and carcinomatous transformation identified in Figures 5 and 6 are shown as the clusters of genes whose expression is either gained or lost associated with the stage of progression. For example normal development could be considered as 'subverted' if there is an absence of expression of genes normally expressed at high level in the developing colon that fail to be expressed in tumors (for example, C18, C19), or that are activated in tumor but not normally expressed in development (C20). Upregulated clusters are enriched for genes with known oncogenic functions and down-regulated clusters for genes associated with tumor suppression. Both mouse colon tumor models and human CRC share in the activation of embryonic colon expression (C22), or partially overlap (C23, dotted lines) the loss or repression of adult differentiation-associated genes (C19), and the loss of tumor suppressor genes (C18). Many human CRCs also lack the expression of additional tumor suppressor programs and gain the expression of oncogenes that are not over-expressed during normal developmental morphogenesis (C21).
Table 5
Mouse models of colon cancer
Model Mm strain N Tumor-generating laboratory
Azoxymethane (AOM) A × B 14 Threadgill
ApcMin/+ (SWR × B6) F1 2 Dove
ApcMin/+ (BR × B6) F1 2 Dove
ApcMin/+ C57BL/6 5 Groden
Smad3-/- 129 6 Graff
Smad3-/- 129 7 Coffey
Tgfb1-/-; Rag2-/- C57BL/6 3 Doetschman
Tumors from four established mouse models of CRC (ApcMin/+, AOM, Smad3-/- and Tgfb1-/-; Rag2-/- were analyzed. The table provides details on the mouse strains used for the four models, as well as information on the number of samples generated per model and sample-originating laboratory.
Genome Biology 2007, 8:R131

R131.24 Genome Biology 2007, Volume 8, Issue 7, Article R131 Kaiser et al. http://genomebiology.com/2007/8/7/R131
7a shows a diagram of the canonical WNT signaling pathwayand an associated-gene network that was a top-rankedassociation of the clusters that exhibited significant over-expression in AOM and ApcMin/+ versus Smad3-/- and Tgfb1-/-;Rag2-/- mouse models. Genes or gene products are repre-sented as nodes, and biological relationships between nodesare represented as edges (lines). All edges are supported by atleast one literature reference from a manuscript, or fromcanonical information stored in the Ingenuity PathwaysKnowledge Base.
qRT-PCRTo confirm the validity of data normalization and referencingprocedures as well as the cDNA gene assignments of theprinted arrays used in the microarray analyses, we used qRT-PCR to measure relative levels of nine genes found by micro-array data analysis to be differentially expressed (FDR <5.10-5) in tumors from ApcMin/+ and Smad3-/- mice. TotalRNAs from C57BL6 ApcMin/+ and 129 Smad3-/- tumor sam-ples (20 μg) were reverse-transcribed to cDNA using the HighCapacity cDNA Archive Kit (oligo-dT primed; Applied Biosys-tems, Foster City, CA, USA). qRT-PCR reactions (20 μl) wereset up in 96-well MicroAmp Reaction Plates (Applied Biosys-tems) using 10 ng of cDNA template in Taqman UniversalPCR Master Mix and 6-FAM-labeled Assays-on-Demandprimer-probe sets (Applied Biosystems). Reactions were runon an MX3000P (Stratagene, a division of Agilent Technolo-gies) with integrated analysis software. Threshold cycle num-bers (Ct) were determined for each target gene using analgorithm that assigns a fluorescence baseline based on meas-urements prior to exponential amplification. Relative geneexpression levels were calculated using the ΔΔCt method [75],with the Gusb gene as a control. Fold-change was determinedrelative to expression in normal adult colon from two C57BL/6J mice.
ImmunohistochemistryImmunohistochemical procedures were performed asdescribed [15]. ApcMin/+ and Smad3-/- colon tumors were rap-idly dissected, fixed in 4% paraformaldehyde, and embeddedin paraffin before cutting 10 μm thick sections. Antigenretrieval was performed by boiling for 20 minutes in citratebuffer, pH 6.0. Sections were treated with 0.3% hydrogenperoxide in PBS for 30 minutes, washed in PBS, blocked inPBS plus 3% goat serum and 0.1% Triton X-100, and thenincubated with primary antibodies and HRP-conjugated goatanti-rabbit secondary antibody (Sigma, St Louis, MO, USA).Antigen-antibody complexes were detected with a DAB per-oxidase substrate kit (Vector Laboratories, Burlingame, CA,USA) according to the manufacturer's protocol.
AcknowledgementsThis study was supported by grants from GI SPOREs P50 CA95103 (RJC)and P50 CA106991 (DWT), R01 CA079869 (DWT), R01 CA046413 (RJC),R01 CA063507 (JG), R37 CA63677 (WFD), and the NCI-sponsored MouseModels of Human Cancer Consortium (MMHCC) with U01 CA84239
(RJC), U01 CA84227 (WFD), U01 CA98013 (JG), U01 CA105417 (DWT),R24 DK 064403 (BJA), T32 HL07382-28 (WJ), The authors thank SusanKasper and Ritwick Ghosh for performing stathmin immunostaining. Theauthors also acknowledge The State of Ohio Biotechnology Research andTechnology Transfer Partnership award for sponsorship of the Gastroin-testinal Cancer Consortium (TD, JG) and the Center for ComputationalMedicine (BJA). Additional sponsorship for important collaborative interac-tions and strategy development among the investigators from each of theparticipating research groups was provided under the auspices of 'ColonCancer 2004', a conference sponsored by the AACR and the MMHCC andhosted by The Jackson Laboratory.
References1. Heath JP: Epithelial cell migration in the intestine. Cell Biol Int
1996, 20:139-146.2. Sancho E, Batlle E, Clevers H: Signaling pathways in intestinal
development and cancer. Annu Rev Cell Dev Biol 2004,20:695-723.
3. Brabletz T, Hlubek F, Spaderna S, Schmalhofer O, Hiendlmeyer E, JungA, Kirchner T: Invasion and metastasis in colorectal cancer:epithelial-mesenchymal transition, mesenchymal-epithelialtransition, stem cells and beta-catenin. Cells Tissues Organs2005, 179:56-65.
4. Helm J, Enkemann SA, Coppola D, Barthel JS, Kelley ST, Yeatman TJ:Dedifferentiation precedes invasion in the progression fromBarrett's metaplasia to esophageal adenocarcinoma. ClinCancer Res 2005, 11:2478-2485.
5. Kaihara T, Kusaka T, Nishi M, Kawamata H, Imura J, Kitajima K, Itoh-Minami R, Aoyama N, Kasuga M, Oda Y, et al.: Dedifferentiationand decreased expression of adhesion molecules, E-cadherinand ZO-1, in colorectal cancer are closely related to livermetastasis. J Exp Clin Cancer Res 2003, 22:117-123.
6. Boivin GP, Groden J: Mouse models of intestinal cancer. CompMed 2004, 54:15-18.
7. Boivin GP, Washington K, Yang K, Ward JM, Pretlow TP, Russell R,Besselsen DG, Godfrey VL, Doetschman T, Dove WF, et al.: Pathol-ogy of mouse models of intestinal cancer: consensus reportand recommendations. Gastroenterology 2003, 124:762-777.
8. Moser AR, Pitot HC, Dove WF: A dominant mutation that pre-disposes to multiple intestinal neoplasia in the mouse. Science1990, 247:322-324.
9. Logan CY, Nusse R: The Wnt signaling pathway in develop-ment and disease. Annu Rev Cell Dev Biol 2004, 20:781-810.
10. Oving IM, Clevers HC: Molecular causes of colon cancer. Eur JClin Invest 2002, 32:448-457.
11. Bissahoyo A, Pearsall RS, Hanlon K, Amann V, Hicks D, Godfrey VL,Threadgill DW: Azoxymethane is a genetic background-dependent colorectal tumor initiator and promoter in mice:effects of dose, route, and diet. Toxicol Sci 2005, 88:340-5.
12. Grady WM, Myeroff LL, Swinler SE, Rajput A, Thiagalingam S, Lutter-baugh JD, Neumann A, Brattain MG, Chang J, Kim SJ, et al.: Muta-tional inactivation of transforming growth factor betareceptor type II in microsatellite stable colon cancers. CancerRes 1999, 59:320-324.
13. Engle SJ, Ormsby I, Pawlowski S, Boivin GP, Croft J, Balish E, Doet-schman T: Elimination of colon cancer in germ-free trans-forming growth factor beta 1-deficient mice. Cancer Res 2002,62:6362-6366.
14. Zhu Y, Richardson JA, Parada LF, Graff JM: Smad3 mutant micedevelop metastatic colorectal cancer. Cell 1998, 94:703-714.
15. Park YK, Franklin JL, Settle SH, Levy SE, Chung E, Jeyakumar LH, ShyrY, Washington MK, Whitehead RH, Aronow BJ, Coffey RJ: Geneexpression profile analysis of mouse colon embryonicdevelopment. Genesis 2005, 41:1-12.
16. Reichling T, Goss KH, Carson DJ, Holdcraft RW, Ley-Ebert C, WitteD, Aronow BJ, Groden J: Transcriptional profiles of intestinaltumors in Apc(Min) mice are unique from those of embry-onic intestine and identify novel gene targets dysregulated inhuman colorectal tumors. Cancer Res 2005, 65:166-176.
17. Nusse R: The Wnt Homepage; "Wnt target genes". 2007[http://www.stanford.edu/%7ernusse/wntwindow.html].
18. van de Wetering M, Sancho E, Verweij C, de Lau W, Oving I, Hurl-stone A, van der Horn K, Batlle E, Coudreuse D, Haramis AP, et al.:The beta-catenin/TCF-4 complex imposes a crypt progeni-tor phenotype on colorectal cancer cells. Cell 2002,
Genome Biology 2007, 8:R131
http://www.ncbi.nlm.nih.gov/entrez/query.fcgi?cmd=Retrieve&db=PubMed&dopt=Abstract&list_uids=8935158
http://www.ncbi.nlm.nih.gov/entrez/query.fcgi?cmd=Retrieve&db=PubMed&dopt=Abstract&list_uids=2296722
http://www.ncbi.nlm.nih.gov/entrez/query.fcgi?cmd=Retrieve&db=PubMed&dopt=Abstract&list_uids=2296722
http://www.ncbi.nlm.nih.gov/entrez/query.fcgi?cmd=Retrieve&db=PubMed&dopt=Abstract&list_uids=9927040
http://www.ncbi.nlm.nih.gov/entrez/query.fcgi?cmd=Retrieve&db=PubMed&dopt=Abstract&list_uids=9927040
http://www.ncbi.nlm.nih.gov/entrez/query.fcgi?cmd=Retrieve&db=PubMed&dopt=Abstract&list_uids=9927040
http://www.ncbi.nlm.nih.gov/entrez/query.fcgi?cmd=Retrieve&db=PubMed&dopt=Abstract&list_uids=9753318

http://genomebiology.com/2007/8/7/R131 Genome Biology 2007, Volume 8, Issue 7, Article R131 Kaiser et al. R131.25
com
ment
reviews
reports
refereed researchdepo
sited researchinteractio
nsinfo
rmatio
n
111:241-250.19. Zhu P, Martin E, Mengwasser J, Schlag P, Janssen KP, Gottlicher M:
Induction of HDAC2 expression upon loss of APC in colorec-tal tumorigenesis. Cancer Cell 2004, 5:455-463.
20. Watson JD, Oster SK, Shago M, Khosravi F, Penn LZ: Identifyinggenes regulated in a Myc-dependent manner. J Biol Chem 2002,277:36921-36930.
21. Katz JP, Perreault N, Goldstein BG, Actman L, McNally SR, SilbergDG, Furth EE, Kaestner KH: Loss of Klf4 in mice causes alteredproliferation and differentiation and precancerous changesin the adult stomach. Gastroenterology 2005, 128:935-945.
22. Lamhonwah AM, Ackerley C, Onizuka R, Tilups A, Lamhonwah D,Chung C, Tao KS, Tellier R, Tein I: Epitope shared by functionalvariant of organic cation/carnitine transporter, OCTN1,Campylobacter jejuni and Mycobacterium paratuberculosismay underlie susceptibility to Crohn's disease at 5q31. Bio-chem Biophys Res Commun 2005, 337:1165-1175.
23. Cragg RA, Phillips SR, Piper JM, Varma JS, Campbell FC, Mathers JC,Ford D: Homeostatic regulation of zinc transporters in thehuman small intestine by dietary zinc supplementation. Gut2005, 54:469-478.
24. Jenny M, Uhl C, Roche C, Duluc I, Guillermin V, Guillemot F, JensenJ, Kedinger M, Gradwohl G: Neurogenin3 is differentiallyrequired for endocrine cell fate specification in the intestinaland gastric epithelium. EMBO J 2002, 21:6338-6347.
25. Kruhoffer M, Jensen JL, Laiho P, Dyrskjot L, Salovaara R, Arango D,Birkenkamp-Demtroder K, Sorensen FB, Christensen LL, Buhl L, etal.: Gene expression signatures for colorectal cancer micros-atellite status and HNPCC. Br J Cancer 2005, 92:2240-2248.
26. Giacomini CP, Leung SY, Chen X, Yuen ST, Kim YH, Bair E, PollackJR: A gene expression signature of genetic instability in coloncancer. Cancer Res 2005, 65:9200-9205.
27. Hu M, Shivdasani RA: Overlapping gene expression in fetalmouse intestine development and human colorectal cancer.Cancer Res 2005, 65:8715-8722.
28. He TC, Sparks AB, Rago C, Hermeking H, Zawel L, da Costa LT,Morin PJ, Vogelstein B, Kinzler KW: Identification of c-MYC as atarget of the APC pathway. Science 1998, 281:1509-1512.
29. Feng XH, Liang YY, Liang M, Zhai W, Lin X: Direct interaction ofc-Myc with Smad2 and Smad3 to inhibit TGF-beta-mediatedinduction of the CDK inhibitor p15(Ink4B). Mol Cell 2002,9:133-143.
30. Frederick JP, Liberati NT, Waddell DS, Shi Y, Wang XF: Transform-ing growth factor beta-mediated transcriptional repressionof c-myc is dependent on direct binding of Smad3 to a novelrepressive Smad binding element. Mol Cell Biol 2004,24:2546-2559.
31. Warner BJ, Blain SW, Seoane J, Massague J: Myc downregulationby transforming growth factor beta required for activationof the p15(Ink4b) G(1) arrest pathway. Mol Cell Biol 1999,19:5913-5922.
32. Maggio-Price L, Treuting P, Zeng W, Tsang M, Bielefeldt-Ohmann H,Iritani BM: Helicobacter infection is required for inflammationand colon cancer in SMAD3-deficient mice. Cancer Res 2006,66:828-838.
33. Reya T, Clevers H: Wnt signalling in stem cells and cancer.Nature 2005, 434:843-850.
34. Korinek V, Barker N, Moerer P, van Donselaar E, Huls G, Peters PJ,Clevers H: Depletion of epithelial stem-cell compartments inthe small intestine of mice lacking Tcf-4. Nat Genet 1998,19:379-383.
35. Pinto D, Gregorieff A, Begthel H, Clevers H: Canonical Wnt sig-nals are essential for homeostasis of the intestinalepithelium. Genes Dev 2003, 17:1709-1713.
36. Kuhnert F, Davis CR, Wang HT, Chu P, Lee M, Yuan J, Nusse R, KuoCJ: Essential requirement for Wnt signaling in proliferationof adult small intestine and colon revealed by adenoviralexpression of Dickkopf-1. Proc Natl Acad Sci USA 2004,101:266-271.
37. Kwong KY, Bloom GC, Yang I, Boulware D, Coppola D, Haseman J,Chen E, McGrath A, Makusky AJ, Taylor J, et al.: Synchronous glo-bal assessment of gene and protein expression in colorectalcancer progression. Genomics 2005, 86:142-158.
38. Zeng W, Wharton KA Jr, Mack JA, Wang K, Gadbaw M, Suyama K,Klein PS, Scott MP: naked cuticle encodes an inducible antago-nist of Wnt signalling. Nature 2000, 403:789-795.
39. Smit L, Baas A, Kuipers J, Korswagen H, van de Wetering M, CleversH: Wnt activates the Tak1/Nemo-like kinase pathway. J Biol
Chem 2004, 279:17232-17240.40. Byun T, Karimi M, Marsh JL, Milovanovic T, Lin F, Holcombe RF:
Expression of secreted Wnt antagonists in gastrointestinaltissues: potential role in stem cell homeostasis. J Clin Pathol2005, 58:515-519.
41. Yang Q, Bermingham NA, Finegold MJ, Zoghbi HY: Requirement ofMath1 for secretory cell lineage commitment in the mouseintestine. Science 2001, 294:2155-2158.
42. Batlle E, Bacani J, Begthel H, Jonkheer S, Gregorieff A, van de Born M,Malats N, Sancho E, Boon E, Pawson T, et al.: EphB receptor activ-ity suppresses colorectal cancer progression. Nature 2005,435:1126-1130.
43. Batlle E, Henderson JT, Beghtel H, van den Born MM, Sancho E, HulsG, Meeldijk J, Robertson J, van de Wetering M, Pawson T, Clevers H:Beta-catenin and TCF mediate cell positioning in the intesti-nal epithelium by controlling the expression of EphB/ephrinB. Cell 2002, 111:251-263.
44. Engle SJ, Hoying JB, Boivin GP, Ormsby I, Gartside PS, Doetschman T:Transforming growth factor beta1 suppresses nonmeta-static colon cancer at an early stage of tumorigenesis. CancerRes 1999, 59:3379-3386.
45. Sodir NM, Chen X, Park R, Nickel AE, Conti PS, Moats R, Bading JR,Shibata D, Laird PW: Smad3 deficiency promotes tumorigene-sis in the distal colon of ApcMin/+ mice. Cancer Res 2006,66:8430-8438.
46. Taketo MM, Takaku K: Gastro-intestinal tumorigenesis inSmad4 mutant mice. Cytokine Growth Factor Rev 2000, 11:147-157.
47. Munoz NM, Upton M, Rojas A, Washington MK, Lin L, Chytil A, Soz-men EG, Madison BB, Pozzi A, Moon RT, et al.: Transforminggrowth factor beta receptor type II inactivation induces themalignant transformation of intestinal neoplasms initiatedby Apc mutation. Cancer Res 2006, 66:9837-9844.
48. Plebani M, Basso D, Panozzo MP, Fogar P, Del Favero G, NaccaratoR: Tumor markers in the diagnosis, monitoring and therapyof pancreatic cancer: state of the art. Int J Biol Markers 1995,10:189-199.
49. Zbar AP: The immunology of colorectal cancer. Surg Oncol2004, 13:45-53.
50. Valk-Lingbeek ME, Bruggeman SW, van Lohuizen M: Stem cells andcancer; the polycomb connection. Cell 2004, 118:409-418.
51. Kim DH, Kim M, Kwon HJ: Histone deacetylase incarcinogenesis and its inhibitors as anti-cancer agents. J Bio-chem Mol Biol 2003, 36:110-119.
52. Sansom OJ, Meniel VS, Muncan V, Phesse TJ, Wilkins JA, Reed KR,Vass JK, Athineos D, Clevers H, Clarke AR: Myc deletion rescuesApc deficiency in the small intestine. Nature 2007,446:676-679.
53. Abdel-Rahman WM, Ollikainen M, Kariola R, Jarvinen HJ, Mecklin JP,Nystrom-Lahti M, Knuutila S, Peltomaki P: Comprehensive char-acterization of HNPCC-related colorectal cancers revealsstriking molecular features in families with no germline mis-match repair gene mutations. Oncogene 2005, 24:1542-1551.
54. Kho AT, Zhao Q, Cai Z, Butte AJ, Kim JY, Pomeroy SL, Rowitch DH,Kohane IS: Conserved mechanisms across development andtumorigenesis revealed by a mouse development perspec-tive of human cancers. Genes Dev 2004, 18:629-640.
55. Lepourcelet M, Tou L, Cai L, Sawada J, Lazar AJ, Glickman JN, Wil-liamson JA, Everett AD, Redston M, Fox EA, et al.: Insights intodevelopmental mechanisms and cancers in the mammalianintestine derived from serial analysis of gene expression andstudy of the hepatoma-derived growth factor (HDGF). Devel-opment 2005, 132:415-427.
56. Lee JS, Chu IS, Mikaelyan A, Calvisi DF, Heo J, Reddy JK, ThorgeirssonSS: Application of comparative functional genomics to iden-tify best-fit mouse models to study human cancer. Nat Genet2004, 36:1306-1311.
57. Haigis KM, Hoff PD, White A, Shoemaker AR, Halberg RB, Dove WF:Tumor regionality in the mouse intestine reflects the mech-anism of loss of Apc function. Proc Natl Acad Sci USA 2004,101:9769-9773.
58. Mithani SK, Balch GC, Shiou SR, Whitehead RH, Datta PK, Beau-champ RD: Smad3 has a critical role in TGF-beta-mediatedgrowth inhibition and apoptosis in colonic epithelial cells. JSurg Res 2004, 117:296-305.
59. GEO [http://www.ncbi.nlm.nih.gov/geo/]60. VUMC: Protocols. 2006 [http://array.mc.vanderbilt.edu/microarray/
expr/protocol.vmsr].61. MGI TJL: Mouse Genome Informatics; curated mouse-human
Genome Biology 2007, 8:R131
http://www.ncbi.nlm.nih.gov/entrez/query.fcgi?cmd=Retrieve&db=PubMed&dopt=Abstract&list_uids=9727977
http://www.ncbi.nlm.nih.gov/entrez/query.fcgi?cmd=Retrieve&db=PubMed&dopt=Abstract&list_uids=9727977
http://www.ncbi.nlm.nih.gov/entrez/query.fcgi?cmd=Retrieve&db=PubMed&dopt=Abstract&list_uids=9697701
http://www.ncbi.nlm.nih.gov/entrez/query.fcgi?cmd=Retrieve&db=PubMed&dopt=Abstract&list_uids=9697701
http://www.ncbi.nlm.nih.gov/entrez/query.fcgi?cmd=Retrieve&db=PubMed&dopt=Abstract&list_uids=8750644

R131.26 Genome Biology 2007, Volume 8, Issue 7, Article R131 Kaiser et al. http://genomebiology.com/2007/8/7/R131
gene orthologs. [http://www.informatics.jax.org/].62. National Library of Medicine N: The Homologene Database.
[http://www.ncbi.nlm.nih.gov/entrez/query.fcgi?db=homologene].63. SOURCE: Stanford Online Universal Resource for Genes,
mRNAs, ESTs, ETC. [http://source.stanford.edu].64. NCBI NLoM: The Reference Sequence (RefSeq) collection.
[http://www.ncbi.nlm.nih.gov/RefSeq/].65. Affymetrix: Technical Resources at Affymetrix. [http://
www.affymetrix.com/support/technical/byproduct.affx?cat=arrays].66. UCSC_Genomics: BLAT. [http://genome.ucsc.edu/cgi-bin/
hgBlat?command=start].67. CHMC-Bioinformatics: GenomeTrafac Comparative Genomics
Resources. [http://genometrafac.cchmc.org/].68. Jegga AG, Chen J, Gowrisankar S, Deshmukh MA, Gudivada R, Kong
S, Kaimal V, Aronow BJ: GenomeTrafac: a whole genomeresource for the detection of transcription factor bindingsite clusters associated with conventional and microRNAencoding genes conserved between mouse and human geneorthologs. Nucleic Acids Res 2007, 35:D116-121.
69. CHMC Bioinformatics: CHMC Genespring Workgroup Server.[http://genet.cchmc.org/]. HG U133 genome, Vandy_NIAgenome; guest login
70. Langsrud Ø: Online Fisher's Exact Test Resource. 2006 [http://www.matforsk.no/ola/fisher.htm].
71. Benjamini Y, Drai D, Elmer G, Kafkafi N, Golani I: Controlling thefalse discovery rate in behavior genetics research. Behav BrainRes 2001, 125:279-284.
72. CHMC-Bioinformatics: GATACA - Gene Association to Ana-tomic and Clinical Abnormalities Webserver. [http://gataca.cchmc.org/].
73. Khatri P, Voichita C, Kattan K, Ansari N, Khatri A, Georgescu C,Tarca AL, Draghici S: Onto-Tools: new additions and improve-ments in 2006. Nucleic Acids Res 2007, 35:W206-11.
74. Ingenuity: IPA, Ingenuity Pathway Analysis. [http://www.ingenuity.com/].
75. Livak KJ, Schmittgen TD: Analysis of relative gene expressiondata using real-time quantitative PCR and the 2(-Delta DeltaC(T)) Method. Methods 2001, 25:402-408.
Genome Biology 2007, 8:R131