Chemical composition of atmospheric aerosols during the 2003 summer intense forest fire period
14
Chemical composition of atmospheric aerosols during the 2003 summer intense forest fire period C.A. Pio a, * , M. Legrand b , C.A. Alves a , T. Oliveira a , J. Afonso a , A. Caseiro a, c , H. Puxbaum c , A. Sanchez-Ochoa c , A. Gelencse ´r d a CESAM & Department of Environment, University of Aveiro, 3810 Aveiro, Portugal b Laboratoire de Glaciologie et Ge´ophysique de l’Environnement, CNRS, France c Technical University of Vienna, Austria d University of Pannonia, Hungary article info Article history: Received 14 February 2008 Received in revised form 23 April 2008 Accepted 1 May 2008 Keywords: Atmospheric aerosols Portugal Forest fires Levoglucosan Potassium Monosugars Polyols Diacids abstract In Portugal, during summer 2003, unusually large forested areas (>300,000 ha) were destroyed by fire, emitting pollutants to the atmosphere. During this period, aerosol samples were collected in the Aveiro region, and analysed for total mass and a set of inorganic and organic compounds, including tracers of biomass burning. Comparisons of aerosol size distributions, levels of particulate mass and chemical aerosol composition between heavily smoke-impacted periods and the rest of the summer permit to evaluate the contribution of forest fires to the regional aerosol load. The absolute and relative variability of the particulate inorganic and organic constituents were used to evaluate the importance of wildfires as emission sources responsible for the presence of compounds such as molecular tracers in the summer atmosphere. From organic carbon to levoglucosan or to potassium ratios it was estimated that 40–55% of primary organic carbon could be attributed to wood smoke. The large fraction of secondary organic carbon suggested that forest fires may strongly contribute to gas-to-particle processes. It was found a better correlation of organic carbon with potassium than with levoglucosan, indicating that, during more complete combustive processes, potassium is possibly a more reasonable biomass burning tracer. Ó 2008 Elsevier Ltd. All rights reserved. 1. Introduction The major aerosol components include inorganic substances, such as sulphates and carbonaceous species. At the global scale, the major source of primary carbonaceous aerosols is biomass burning, due to forest fires and to the widespread use as fuel for heating homes and cooking (Sapkota et al., 2005; Ward and Smith, 2005; Zheng et al., 2002). Smoke aerosols are able, at least at regional scale, to influence the radiation budget by their light-scattering effects and their influence on cloud microphysics (e.g. Lyamani et al., 2006). Epidemiological studies have sug- gested that a substantial part of the causes of mortality (21– 38% of the total excess deaths) could be attributed to high ozone and aerosol levels encountered during large forest fire events following a heat wave (Stedman, 2004). In addition, long range transport of smoke particles can lead to redistributions of plant nutrients (e.g. NO 3 , PO 4 3 and K þ ), whereas deposition on leaves can affect rates of diffusion of CO 2 and O 2 between plant tissues and the atmosphere (Allen et al., 2004, and references therein). Several investigations of the contribution of biomass smoke to ambient aerosol levels have been performed over rain forests (e.g., Andreae et al., 2002; Formenti et al., 2003; * Corresponding author. E-mail address: [email protected] (C.A. Pio). Contents lists available at ScienceDirect Atmospheric Environment journal homepage: www.elsevier.com/locate/atmosenv 1352-2310/$ – see front matter Ó 2008 Elsevier Ltd. All rights reserved. doi:10.1016/j.atmosenv.2008.05.032 Atmospheric Environment 42 (2008) 7530–7543
-
Upload
independent -
Category
Documents
-
view
6 -
download
0
Transcript of Chemical composition of atmospheric aerosols during the 2003 summer intense forest fire period
ilable at ScienceDirect
Atmospheric Environment 42 (2008) 7530–7543
Contents lists ava
Atmospheric Environment
journal homepage: www.elsevier .com/locate/atmosenv
Chemical composition of atmospheric aerosols during the 2003summer intense forest fire period
C.A. Pio a,*, M. Legrand b, C.A. Alves a, T. Oliveira a, J. Afonso a, A. Caseiro a,c,H. Puxbaum c, A. Sanchez-Ochoa c, A. Gelencser d
a CESAM & Department of Environment, University of Aveiro, 3810 Aveiro, Portugalb Laboratoire de Glaciologie et Geophysique de l’Environnement, CNRS, Francec Technical University of Vienna, Austriad University of Pannonia, Hungary
a r t i c l e i n f o
Article history:Received 14 February 2008Received in revised form 23 April 2008Accepted 1 May 2008
Keywords:Atmospheric aerosolsPortugalForest firesLevoglucosanPotassiumMonosugarsPolyolsDiacids
* Corresponding author.E-mail address: [email protected] (C.A. Pio).
1352-2310/$ – see front matter � 2008 Elsevier Ltddoi:10.1016/j.atmosenv.2008.05.032
a b s t r a c t
In Portugal, during summer 2003, unusually large forested areas (>300,000 ha) weredestroyed by fire, emitting pollutants to the atmosphere. During this period, aerosolsamples were collected in the Aveiro region, and analysed for total mass and a set ofinorganic and organic compounds, including tracers of biomass burning. Comparisons ofaerosol size distributions, levels of particulate mass and chemical aerosol compositionbetween heavily smoke-impacted periods and the rest of the summer permit to evaluatethe contribution of forest fires to the regional aerosol load. The absolute and relativevariability of the particulate inorganic and organic constituents were used to evaluate theimportance of wildfires as emission sources responsible for the presence of compoundssuch as molecular tracers in the summer atmosphere. From organic carbon to levoglucosanor to potassium ratios it was estimated that 40–55% of primary organic carbon could beattributed to wood smoke. The large fraction of secondary organic carbon suggested thatforest fires may strongly contribute to gas-to-particle processes. It was found a bettercorrelation of organic carbon with potassium than with levoglucosan, indicating that,during more complete combustive processes, potassium is possibly a more reasonablebiomass burning tracer.
� 2008 Elsevier Ltd. All rights reserved.
1. Introduction
The major aerosol components include inorganicsubstances, such as sulphates and carbonaceous species. Atthe global scale, the major source of primary carbonaceousaerosols is biomass burning, due to forest fires and to thewidespread use as fuel for heating homes and cooking(Sapkota et al., 2005; Ward and Smith, 2005; Zheng et al.,2002). Smoke aerosols are able, at least at regional scale, toinfluence the radiation budget by their light-scattering
. All rights reserved.
effects and their influence on cloud microphysics (e.g.Lyamani et al., 2006). Epidemiological studies have sug-gested that a substantial part of the causes of mortality (21–38% of the total excess deaths) could be attributed to highozone and aerosol levels encountered during large forestfire events following a heat wave (Stedman, 2004). Inaddition, long range transport of smoke particles can leadto redistributions of plant nutrients (e.g. NO3
�, PO43� and
Kþ), whereas deposition on leaves can affect rates ofdiffusion of CO2 and O2 between plant tissues and theatmosphere (Allen et al., 2004, and references therein).
Several investigations of the contribution of biomasssmoke to ambient aerosol levels have been performed overrain forests (e.g., Andreae et al., 2002; Formenti et al., 2003;
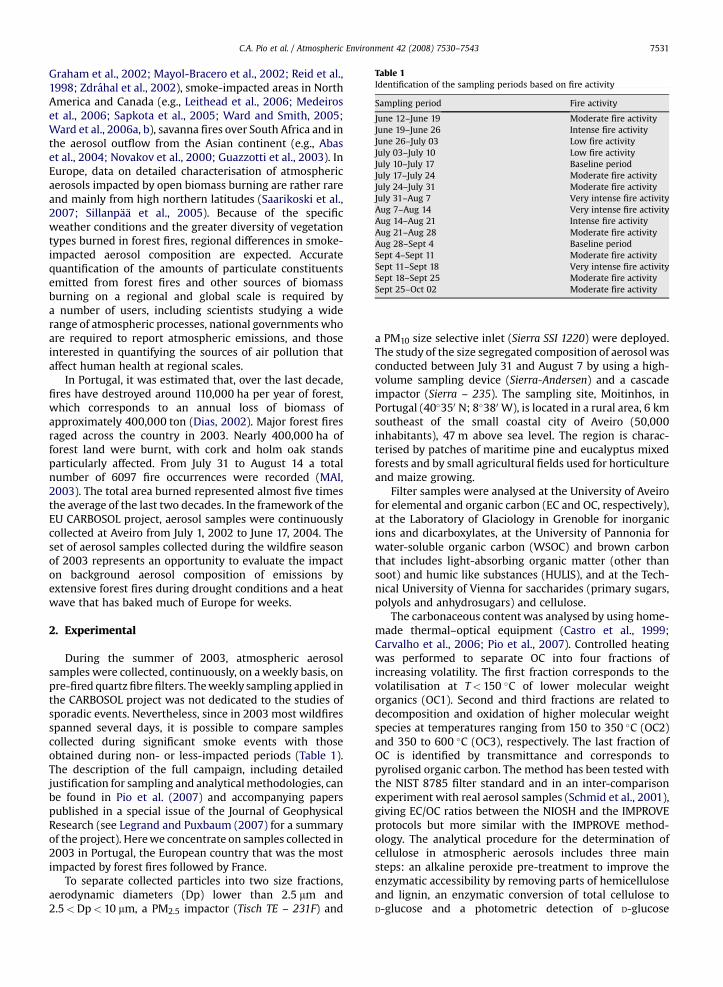
Table 1Identification of the sampling periods based on fire activity
Sampling period Fire activity
June 12–June 19 Moderate fire activityJune 19–June 26 Intense fire activityJune 26–July 03 Low fire activityJuly 03–July 10 Low fire activityJuly 10–July 17 Baseline periodJuly 17–July 24 Moderate fire activityJuly 24–July 31 Moderate fire activityJuly 31–Aug 7 Very intense fire activityAug 7–Aug 14 Very intense fire activityAug 14–Aug 21 Intense fire activityAug 21–Aug 28 Moderate fire activityAug 28–Sept 4 Baseline periodSept 4–Sept 11 Moderate fire activitySept 11–Sept 18 Very intense fire activitySept 18–Sept 25 Moderate fire activitySept 25–Oct 02 Moderate fire activity
C.A. Pio et al. / Atmospheric Environment 42 (2008) 7530–7543 7531
Graham et al., 2002; Mayol-Bracero et al., 2002; Reid et al.,1998; Zdrahal et al., 2002), smoke-impacted areas in NorthAmerica and Canada (e.g., Leithead et al., 2006; Medeiroset al., 2006; Sapkota et al., 2005; Ward and Smith, 2005;Ward et al., 2006a, b), savanna fires over South Africa and inthe aerosol outflow from the Asian continent (e.g., Abaset al., 2004; Novakov et al., 2000; Guazzotti et al., 2003). InEurope, data on detailed characterisation of atmosphericaerosols impacted by open biomass burning are rather rareand mainly from high northern latitudes (Saarikoski et al.,2007; Sillanpaa et al., 2005). Because of the specificweather conditions and the greater diversity of vegetationtypes burned in forest fires, regional differences in smoke-impacted aerosol composition are expected. Accuratequantification of the amounts of particulate constituentsemitted from forest fires and other sources of biomassburning on a regional and global scale is required bya number of users, including scientists studying a widerange of atmospheric processes, national governments whoare required to report atmospheric emissions, and thoseinterested in quantifying the sources of air pollution thataffect human health at regional scales.
In Portugal, it was estimated that, over the last decade,fires have destroyed around 110,000 ha per year of forest,which corresponds to an annual loss of biomass ofapproximately 400,000 ton (Dias, 2002). Major forest firesraged across the country in 2003. Nearly 400,000 ha offorest land were burnt, with cork and holm oak standsparticularly affected. From July 31 to August 14 a totalnumber of 6097 fire occurrences were recorded (MAI,2003). The total area burned represented almost five timesthe average of the last two decades. In the framework of theEU CARBOSOL project, aerosol samples were continuouslycollected at Aveiro from July 1, 2002 to June 17, 2004. Theset of aerosol samples collected during the wildfire seasonof 2003 represents an opportunity to evaluate the impacton background aerosol composition of emissions byextensive forest fires during drought conditions and a heatwave that has baked much of Europe for weeks.
2. Experimental
During the summer of 2003, atmospheric aerosolsamples were collected, continuously, on a weekly basis, onpre-fired quartz fibre filters. The weekly sampling applied inthe CARBOSOL project was not dedicated to the studies ofsporadic events. Nevertheless, since in 2003 most wildfiresspanned several days, it is possible to compare samplescollected during significant smoke events with thoseobtained during non- or less-impacted periods (Table 1).The description of the full campaign, including detailedjustification for sampling and analytical methodologies, canbe found in Pio et al. (2007) and accompanying paperspublished in a special issue of the Journal of GeophysicalResearch (see Legrand and Puxbaum (2007) for a summaryof the project). Here we concentrate on samples collected in2003 in Portugal, the European country that was the mostimpacted by forest fires followed by France.
To separate collected particles into two size fractions,aerodynamic diameters (Dp) lower than 2.5 mm and2.5<Dp< 10 mm, a PM2.5 impactor (Tisch TE – 231F) and
a PM10 size selective inlet (Sierra SSI 1220) were deployed.The study of the size segregated composition of aerosol wasconducted between July 31 and August 7 by using a high-volume sampling device (Sierra-Andersen) and a cascadeimpactor (Sierra – 235). The sampling site, Moitinhos, inPortugal (40�350 N; 8�380 W), is located in a rural area, 6 kmsoutheast of the small coastal city of Aveiro (50,000inhabitants), 47 m above sea level. The region is charac-terised by patches of maritime pine and eucalyptus mixedforests and by small agricultural fields used for horticultureand maize growing.
Filter samples were analysed at the University of Aveirofor elemental and organic carbon (EC and OC, respectively),at the Laboratory of Glaciology in Grenoble for inorganicions and dicarboxylates, at the University of Pannonia forwater-soluble organic carbon (WSOC) and brown carbonthat includes light-absorbing organic matter (other thansoot) and humic like substances (HULIS), and at the Tech-nical University of Vienna for saccharides (primary sugars,polyols and anhydrosugars) and cellulose.
The carbonaceous content was analysed by using home-made thermal–optical equipment (Castro et al., 1999;Carvalho et al., 2006; Pio et al., 2007). Controlled heatingwas performed to separate OC into four fractions ofincreasing volatility. The first fraction corresponds to thevolatilisation at T< 150 �C of lower molecular weightorganics (OC1). Second and third fractions are related todecomposition and oxidation of higher molecular weightspecies at temperatures ranging from 150 to 350 �C (OC2)and 350 to 600 �C (OC3), respectively. The last fraction ofOC is identified by transmittance and corresponds topyrolised organic carbon. The method has been tested withthe NIST 8785 filter standard and in an inter-comparisonexperiment with real aerosol samples (Schmid et al., 2001),giving EC/OC ratios between the NIOSH and the IMPROVEprotocols but more similar with the IMPROVE method-ology. The analytical procedure for the determination ofcellulose in atmospheric aerosols includes three mainsteps: an alkaline peroxide pre-treatment to improve theenzymatic accessibility by removing parts of hemicelluloseand lignin, an enzymatic conversion of total cellulose toD-glucose and a photometric detection of D-glucose

C.A. Pio et al. / Atmospheric Environment 42 (2008) 7530–75437532
(Puxbaum and Tenze-Kunit, 2003). The determination oflevoglucosan, other sugars and polyols was performed byhigh-performance liquid chromatography with an electro-chemical detector (Dionex ED40, pulsed amperometry withgold working electrode). The separation was performed ona high pH anion-exchange column for sugar analysis (Dio-nex CarboPac PA1, 250� 4 mm) (Caseiro et al., 2007; Pux-baum et al., 2007). The filter aliquot to be analysed (about4.5 cm2 from a quartz fibre filter from a high-volumesampler) was extracted in 3 mL of Milli-Q water by ultra-sonic bath agitation for 45 min. Undissolved samplematerial and filter debris were removed from the samplesolution by centrifugation (3 min at 13.4�103 rpm) and in-line filtration (35 and 5 mm, Dionex�) prior to injection.
Apart from minimising the time between extraction andanalysis (24 h at most) and keeping the extracts in closedrecipients, no additional steps to prevent losses were taken.However, reproducibility studies over typical analysis runtime showed no significant differences in the concentra-tions detected (see Caseiro et al., 2007).
For the determination of soluble inorganic ions anddicarboxylates, small parts of the filters were extractedwith ultra pure Milli-Q water. For cations, a Dionex 500chromatograph equipped with a CS12 separator columnwas used. For anions, a Dionex 600 equipped with an AS11separator column was run with a quaternary gradient ofeluents (H2O, NaOH at 2.5 and 100 mM, and CH3OH). Asdetailed in Legrand et al. (2007), these working conditionsallow the determination of inorganic anions as well as C2–C5 dicarboxylates oxalate (–OOCCOO–), malonate(–OOCCH2COO–), succinate (–OOC(CH2)2COO–), malate(–OOCCH2CHOHCOO–), tartarate (–OOC(CHOH)2COO–),and glutarate (–OOC(CH2)3COO–), hereafter also referred asdiacids. Determination of water-soluble organic carbon(WSOC) included soaking a spot of filter in 25 mL of Milli-Qwater for 2 h. The total carbon contents of the extractedfilter spot, as well as of a non-extracted spot of identicalsize, were analysed by an Astro 2100 TOC analyser in thesolid mode. The determination involved catalytic burningat 680 �C in O2, followed by non-dispersive infra-reddetection of the evolved CO2 (Varga et al., 2001). Browncarbon concentrations were determined by measuringabsorbance of the Milli-Q water extracts with a UV-VISspectrophotometer at the wavelengths of 250 and 350 nm(Lukacs et al., 2007).
3. Results and discussion
3.1. Meteorological conditions, air quality and particulatecarbonaceous content
The summer of 2003 was one of the hottest on record inEurope. In Portugal, the heat wave fanned the country’sworst forest fires in more than 20 years. Air mass back-trajectories computed using the HYSPLIT (Hybrid Single-Particle Lagrangian Integrated Trajectory) model (Draxlerand Hess, 1997) and satellite images (Fig. 1) indicatecontinental transport of the smoke from different inlandregions of the Iberian Peninsula to the western coastalsampling site of Moitinhos. Forest fires occurred, inparticular, when the atmospheric circulation formed an
important ridge associated with south-easterly flow, anda strong advection of hot and dry air from northern Africathat was additionally heated when passing over centralIberia (Pereira et al., 2005). Meteorological data for theAveiro region over the periods of large scale forest firesconfirm an abrupt increase in the temperature, anda significant drop in the relative humidity records. BetweenJuly 29 and August 13, all districts in Portugal experiencedunusually high temperatures. At least 8 of the 18 mainlandPortuguese districts continuously experienced dailymaximum temperatures above 32 �C during this period.Four districts located inland Portugal experienced dailymaximum temperatures above 35 �C during this period(the highest temperature ever registered in Portugal of47.6 �C in Alentejo). This period and several days afterSeptember 11 were the most affected by fire activity(Table 1).
During these episodes, in the Aveiro region, particulatematter levels were elevated 2- to 3-fold above the prior andpost smoke baseline periods of w30 mg m�3 (Fig. 2). PM10
hourly-averaged concentrations reached values higherthan 300 mg m�3, and sometimes 500 mg m�3 at some airquality monitoring stations closer to the forest fire fronts.As seen in Fig. 2, the smoke layers and the reduced solarradiation may have lowered the photochemical activity,reducing the ozone produced, during the first few days ofthe plumes’ history. The O3 production in the boundarylayer may also be hindered by UV-B absorption by aerosols.It was calculated that soot particles and mineral dusts canreduce the O3 photolysis rate by 6–11% (Liao et al., 1999).
Average weekly PM10/PM2.5 ratios of 1.6 and 1.7 wereobserved during the smoke events and the baselineperiods, respectively. In general, previous studies suggestedthat forest fires produce mainly fine-mode particles. Forinstance, Ward et al. (2006a) calculated a ratio of 1.3 duringsmoke events and a value of 2.4 for all other daysthroughout the summer of 2003 in Montana. A PM10/PM2.5
ratio of 1.7 was found in an airshed greatly impacted byresidential wood burning with wintry conditions in Libby,Montana (Ward et al., 2006b). Ratios of 1.5 and 2.0 weremeasured in Seattle for the heating and non-heatingseasons, respectively (Liu et al., 2003). For wildfires in 2003in Portugal the decrease in the PM10/PM2.5 ratios was not ashigh as expected during extreme burning events. This isprobably due to a co-emission of coarse particles composedby ash, partially burned foliage and lofted soil particles,which are entrained by the turbulent nature of theuncontrolled high-intensity fires under extreme droughtconditions. It is also possible that emitted smaller particleshave been scavenged by coagulation with larger particles inthe smoke plume (Phuleria et al., 2005).
On average, the carbonaceous material accounted for28� 8% of the PM2.5 mass. Excepting for the week ofAugust 7–August 14, during which PM2.5 had a greatcontribution from inorganic constituents, the carbona-ceous fraction was rather high (up to 43%) throughoutvery intense fire periods. The PM2.5 sample that was notdominated by carbon during the week ended August 14may have had the contribution of intense fires closest tothe sampling site, which promoted lofting of dust andashes. A white deposit layer of ashes was observed over

Fig. 1. (a) Web hotspot/fire maps (NASA/University of Maryland, 2002) taken on the event of greatest smoke and during a cleaner period; (b) one day back-trajectories of air parcels ending at Moitinhos from the HYSPLIT model.
C.A. Pio et al. / Atmospheric Environment 42 (2008) 7530–7543 7533
ground surface at the sampling site as result of atmo-spheric transport and dry deposition during the mostintensive fire period. The carbonaceous content in theaerosol from Moitinhos is lower than values obtained inbiomass burning aerosols over Amazonia (Graham et al.,2002) and in the same range than that in aerosol samplesfrom the Lower Fraser Valley, Canada, impacted by forestfires (Leithead et al., 2006).
The light-absorbing soot-like structures (EC) contrib-uted to 12–26% of the particulate carbon content. Usually,more OC than EC is emitted by forest fires compared withother anthropogenic sources, resulting in a relativelyhigher OC/EC ratio during the smoke events (Gelencseret al., 2007; Watson et al., 2001). As seen in Fig. 3, the OC/ECratio was consistently lower (w3) for baseline periods thanover large smoke events (up to 7).
The OC concentrations changed from a mean baselinelevel of 2.6 to 6.4 mg m�3 in samples strongly impacted bysmoke, which represents an increase of about 60% (Table 2).Compounds that evaporate during analysis at lowertemperatures (<150 �C) represented 6–10% of OC, indi-cating that the contribution of semi-volatile species to theorganic particulate loading is small regardless of theconsidered time period. Higher molecular weight species,or highly substituted low molecular weight constituents,evolving above 350 �C in the thermogram constituted 12–21% of the OC mass. Pyrolised carbon dominated the OCfraction (52–63% of OC, Fig. 3). Its average contribution toOC increased from 50% during baseline periods to 57% forthe weeks more impacted by smoke plumes. Comparisonbetween concentrations measured during the two periodsof more intense fires and those obtained for the two

Date
03/0
7/03
10/0
7/03
17/0
7/03
24/0
7/03
31/0
7/03
07/0
8/03
14/0
8/03
21/0
8/03
28/0
8/03
Co
ncen
tratio
n (µg
m
-3)
0
100
200
300
400
O3 Coimbra
PM10 Coimbra
Fig. 2. Particulate matter and ozone levels recorded in the city of Coimbra,located about 50 km southeast of Moitinhos (Aveiro).
C.A. Pio et al. / Atmospheric Environment 42 (2008) 7530–75437534
baseline weeks reveals increases of 45, 46, 48 and 44% inthe OC1, OC2, OC3 and PC values, respectively.
During the 16-week sampling period, the WSOC contentof the samples represented 43–83% of OC, which indicatesthe ability of aerosol to act as cloud condensation nucleiand, as a consequence, influence cloud physics and climate.Its variation between the biomass burning and cleanerperiods is very significant, showing concentrations around4–5 mg m�3 and less than 1 mg m�3, respectively. The goodcorrelation between the higher molecular weight fractionplus pyrolised carbon (OC3þ PC) and WSOC (Fig. 4)suggests that the biomass burning aerosol may havecontributed to the water-soluble refractory matter (solublefraction of brown carbon). However, WSOC is also posi-tively correlated with other OC fractions, which alsoincrease in fire periods. Thus, it seems that there is noabsolutely specific link between WSOC and soluble refrac-tory matter.
Start Sampling date
12/0
6/03
19/0
6/03
26/0
6/03
03/0
7/03
10/0
7/03
17/0
7/03
24/0
7/03
31/0
7/03
07/0
8/03
14/0
8/03
21/0
8/03
28/0
8/03
04/0
9/03
11/0
9/03
18/0
9/03
25/0
9/03
02/1
0/03
Co
ncen
tratio
n (µg
m
-3)
0
5
10
15
20
OC
/E
C
2
3
4
5
6
7
8OC1OC2OC3PCECOC/EC
Fig. 3. Variations of various carbon fractions and of the ratio betweenorganic and elemental carbon.
The size distribution of aerosol collected during theweek of more intense forest fires (Fig. 5a) showed that theWSOC was concentrated in the 0.49–1.5 mm size range,though a small mode skewed towards the larger size wasalso observed. This additional mode may be related withaging processes of the smoke aerosol.
3.2. Anhydrosugars and cellulose
Three anhydrosugars (levoglucosan, mannosan andgalactosan) were identified in aerosol samples, showinghigh correlations with each other. Levoglucosan and therelated degradation products from cellulose and hemi-celluloses can be used as specific and overall indicatorcompounds for emissions from biomass burning (Simoneitet al., 1999). These compounds accounted for 0.8–4.0% and1.3–6.5% of OC and WSOC, respectively, over the entirestudy period. Their total concentrations were in the range130–145 ng m�3 during the periods of peak smoke impact,decreasing to values between 20 and 85 ng m�3 over theremaining weeks. Levoglucosan levels varied froma minimum of 17 ng m�3 to a maximum of 105 ng m�3,corresponding to the vast wildfire period. The average ratioof levoglucosan to mannosan was found to be 3.5� 0.8. Theratio of levoglucosan to mannosan in wood smoke isdifferent for deciduous and conifer trees, being on average25 and 4.7 in US-studies (Fine et al., 2004, and relatedpapers by the same authors), and around 15 and 3.7 ina mid-European study (Schmidl et al., 2008), respectively.The composition of the Portuguese aerosol is consistentwith a greater input of coniferous than deciduous woodcombustion.
As expected, the anhydrosugars were mainly present inthe fine fraction (Fig. 5b), since smoke aerosol consists, forthe most part, of accumulation mode particles (Schkolniket al., 2005). On average, the PM2.5 fraction contained 97%of the levoglucosan PM10 mass concentration. Interestingly,the size distribution of levoglucosan also exhibiteda coarser peak probably due to ejection of levoglucosancontaining-particles from the surfaces of plants and ground(e.g. soil, uncompleted burned vegetation detritus, ash,etc.) as a consequence of the strong turbulence associatedwith the very intensive combustion of these fires. Incombustion experiments, Engling et al. (2006) also foundthe majority of the levoglucosan mass in the accumulationmode, although the anhydrosugar was also present in thecoarse-particle fraction for some fuel types. The massconcentrations in the upper size classes were observed tobe slightly higher for duff than for sage brush and oakwood. On the other hand, it is known that levoglucosanemissions vary greatly with burning conditions, but theimpact of smouldering versus flaming conditions on sizedistribution is unsolved (Gao et al., 2003; Schkolnik et al.,2005). During smouldering combustion, or in the initialthermal decomposition, large quantities of levoglucosanare formed. During the flaming phase at higher tempera-tures (>400 �C) levoglucosan re-polymerises into poly-saccharides, which then further react to form organic solidscontaining conjugated double bonds and carbonyl groups,as can be found in HULIS (Kawamoto et al., 2003). Anotherpossibility is that some or all the HULIS is just humic matter

Table 2Averaged levels of PM2.5, carbonaceous constituents, potassium related tobiomass burning (see text) and anhydrosugars, and concentration rangefor diacids, during baseline conditions and very intense fires
Baselineperiods
Veryintense fires
Fireinput
PM2.5 (mg m�3) 18.4 38.1 19.7Total carbon (mg m�3) 3.5 7.7 4.2OC (mg m�3) 2.6 6.4 3.8EC (mg m�3) 0.86 1.26 0.40WSOC (mg m�3) 1.6 4.2 2.6Brown carbon (mg m�3) 1.8 4.0 2.2Cellulose (ng m�3) 22.6 39.3 16.7Diacids (ng m�3) C5 11� 1 (13%) 39� 10 (19%) 27.8 (22%)
DhC4 1.3� 0.3 (1.5%) 7.5� 3.8 (3.6%) 6.2 (5%)hC4 27� 5 (32%) 61� 14 (29%) 33.7 (27%)C4 14� 1 (17%) 42� 11 (20%) 27.2 (22%)C3 30� 5 (36%) 60� 15 (29%) 29.5 (23%)C2 303� 75 611� 175 308
Mannosan (ng m�3) 17.6 20.6 3.0Levoglucosan (ng m�3) 58 79 21KBBþ (ng m�3) 102 285 182
The last column, obtained by subtracting baseline conditions from fireconditions, refers to the composition of the ambient aerosol stronglyinfluenced by wildfire smoke. For C5–C3, values in parenthesis refer to thepercentage of individual diacid to the sum of C3–C5 diacids. C2 is oxalic, C3malonic, dhC4 tartaric, hC4 malic, C4 succinic, and C5 glutaric acid.
C.A. Pio et al. / Atmospheric Environment 42 (2008) 7530–7543 7535
from soil and/or putrefying leaf litter lofted duringcombustion (Mayol-Bracero et al., 2002). Significantcorrelations between both brown carbon and biomasscombustion tracers (not shown) support the hypothesis ofbiomass combustion emissions as precursors for a sizeablefraction of atmospheric HULIS in aerosols from Moitinhos.
Cellulose itself experienced somewhat enhancedconcentrations during the periods of fire activity (Table 2),whereas a slight drop of its contribution to OC was observedat the same time. Cellulose decomposes on heating or onexposure to an ignition source, giving rise to diversebreakdown products, such as anhydrosugars (Simoneitet al., 1999). In wood combustion experiments also only lowconcentrations of cellulose were observed, i.e. around 1/100of the levoglucosan value (Schmidl et al., 2008).
WSOC (µµg C/m3)
OC
3 +
P
C (µg
C
/m
3)
0
1
2
3
4
5
6
OC3+PC versus WSOCRegression: y=0.375+1.005x, r2=0.87
0 1 2 3 4 5 6
Fig. 4. Linear correlations between OC fractions and water-soluble
3.3. Monosugars and sugar alcohols
The terms ‘‘monosaccharides’’ and ‘‘monosugars’’ aregoing to be used interchangeably throughout the paper torefer to this class of compounds. In the same manner, theterms ‘‘sugar alcohols’’ and ‘‘polyols’’ will henceforth beconsidered as synonyms. Total sugar alcohol and mono-sugar concentrations ranged from about 40 to 100 ng m�3,with the maximum level found in a sample less affected bythe smoke plumes. In general, sugar alcohols were found tobe most prevalent in the coarse fraction (Table 3). Polyolsare known components of bacteria, fungi, lichens, inver-tebrates and lower plants, acting as osmoregulators, stressinhibitors or carbohydrate suppliers (Graham et al., 2003;Medeiros et al., 2006). A general lack of correlation withvarious biomass burning tracers and higher coarse fractionconcentrations were taken as indication that thesecompounds may be part of the natural background aerosolwith a likely association with primary biological particles,e.g. from fungal spores (Bauer et al., 2002, 2008). Xylitol isbetter correlated with monosaccharides than with otherpolyols and presents a fine/coarse ratio between 2 and 4during the weeks of intense forest fires, inverting theproportion over periods with less influence of smoke. Thispolyol was also detected in smoke aerosols from savannafires by Gao et al. (2003). These researchers considered thatxylitol may be a secondary species produced during theupward transport of aerosols, though the possibility that itconstitutes a primary emission from biomass burning wasnot excluded.
The dominant primary monosaccharides in aerosolsfrom Moitinhos are comprised of glucose, mannose, fruc-tose, arabinose, with minor quantities of galactose. Thereare several sources of these constituents, including micro-rganisms, vascular plants and animals (Medeiros et al.,2006). Simoneit et al. (2004) suggested soil and associatedmicrobiota as the main source of saccharides to the atmo-sphere. According to these findings, the primary sugarsderive from soil resuspension and from biogenic emissionsinto the atmosphere, though emissions of considerableamounts may occur by thermal stripping during biomass
WSOC (µg C/m3)
0 1 2 3 4 5 6
Bro
wn
C
arb
on
(µg
C
/m
3)
0
1
2
3
4Brown Carbon versus WSOCRegression: y=0.204+0.403x, r2=0.85
organic compounds and between these and brown carbon.

Diameter (µµm)
0.01 0.1 1 10 100
dC
/d
Ln
(D
p)
0
1
2
3
4a
Diameter (µm)
0.01 0.1 1 10 100
dC
/d
Ln
(D
p)
0
5
10
15
20
25
30
35b
Diameter (µm)
0.01 0.1 1 10 100
dC
/d
Ln
(D
p)
0
2
4
6
8
10
12
14
16
18c
Diameter (µm)
0.01 0.1 1 10 100
dC
/d
Ln
(D
p)
0
1
2
3
4
5
6d
Diameter (µm)
0.01 0.1 1 10 100
dC
/d
Ln
(D
p)
0
100
200
300
400
500e
Diameter (µm)
0.01 0.1 1 10 100
dC
/d
Ln
(D
p)
0
20
40
60
80
100
120
140
160
180f
WSOCfitfit 1fit 2
Levoglucosanfitfit 1fit 2
Arabitolfitfit 1fit 2
Xylitolfitfit 1fit 2
Oxalic acidfitfit 1fit 2
Potassiumfitfit 1fit 2
Fig. 5. Size segregated distributions of selected compounds in an aerosol sample strongly impacted by smoke from wildfires. Two-mode Lognormal curves thatbest-fit the experimental data are also shown.
C.A. Pio et al. / Atmospheric Environment 42 (2008) 7530–75437536
burning events. Contrarily to the majority of sugar alcohols,the monosaccharide constituents presented higher finefraction concentrations and a moderate correlation(r2¼ 0.42–0.75) with levoglucosan. The proportionbetween the fine and the coarse fraction increases duringperiods of severe forest fires, indicating an origin frombiomass burning (Graham et al., 2002; Medeiros et al.,2006). In fact, it is possible that a number of theseconstituents are primary products, formed either throughdirect volatilisation from plant materials or as breakdownproducts of polysaccharides. Another formation pathway isthe hydrolysis of the parent anhydrosugars under the acidicatmospheric conditions resulting from biomass burning
(Graham et al., 2002). The observation of higher sugarconcentration ratios between the fine and the coarseaerosol sizes is in accordance with the results presented byMedeiros et al. (2006), who registered enrichments byfactors of 2–5 in samples collected under the influence ofsmoke plumes from Quebec forest burning, indicating thatwildfires also enhance emissions of uncombusted saccha-rides. Moreover, good correlations were generally obtainedbetween pairs of sugars within each group, suggestinga common origin.
The size-distributed sample taken during the week ofmore intense forest fires showed that polyols predominatein particles >3 mm, suggesting that these compounds are

Table 3Mass concentrations (range and average) of sugar alcohols, mono-saccharides, dicarboxylic acids and inorganic ions in fine and coarse PMsamples
PM2.5
(ng m�3)PM2.5–10
(ng m�3)Fine/coarseratios
Sugar alcoholsXylitol 0.30–3.74 (0.92) 0.44–1.90 (1.02) 0.24–4.83Sorbitol LOD–2.11 (0.47) 0.84–6.88 (2.43) n.d.Mannitol 0.98–13.93 (7.82) 5.90–21.57 (12.01) 0.17–0.95Arabitol 1.54–11.41 (5.20) 9.82–27.25 (16.73) 0.12–0.72
MonosaccharidesGlucose 1.78–13.04 (5.59) 1.21–6.12 (2.80) 0.78–4.65Mannose 1.25–8.25 (4.12) 0.25–1.33 (0.58) 2.77–23.16Fructose 2.03–8.45 (3.88) 0.30–3.26 (1.26) n.d.Arabinose 0.95–3.72 (2.27) 0.15–0.92 (0.46) 1.96–10.33Galactose 0.27–1.60 (0.78) 0.08–0.79 (0.31) 1.05–15.05
DiacidsGlutarate (C5) 2.0–47.5 (14.9) 0.3–2.0 (0.9) 7.4–57.0Succinate (C4) 2.7–54.6 (19.1) 1.2–7.0 (2.7) 1.2–35.0Malate (hC4) 5.1–76.8 (30.3) 0.6–4.0 (1.9) 8.4–34.2Tartarate (dhC4) 0.3–10.4 (3.2) LOD–0.8 (0.2) 3.5–58.0Malonate (C3) 6.8–73.4 (31.3) 2.5–18.9 (8.4) 1.3–5.6Oxalate (C2) 180.2–782.8 (359.5) 10.0–22.6 (17.3) 10.7–41.5
IonsSO4
2� 2289–12,980 (5293) 135–1768 (885) 11.9–39.4NH4þ 608–4098 (1821) 0.2–23 (6.4) 120–6841
NO3� 71–1236 (401) 286–1450 (706) 0.08–3.07
Naþ 157–719 (372) 119–784 (502) 0.39–2.36Kþ 85–353 (183) 8–33 (22) 3.76–27.8Ca2þ 45–404 (151) 74–414 (181) 0.32–1.95Mg2þ 28–93 (53) 33–136 (83) 0.29–1.38Cl� 6–75 (29) 106–1768 (885) 0.01–0.71
LOD, limit of detection; n.d., not determined (not present in a significantnumber of PM2.5 or PM2.5–10 samples).
C.A. Pio et al. / Atmospheric Environment 42 (2008) 7530–7543 7537
associated with primary biological material (Fig. 5c). Xylitolconstitutes an exception, presenting a mass distributionthat peaks for diameters smaller than 0.49 mm, as observedfor the anhydrosugars (Fig. 5d). These small sizes resultedmost likely from nucleation/condensation mechanisms ofthermal decomposition products of biomass. Anothermode was present for compounds in particles with diam-eters between 0.95 and 3 mm as a probable result ofcondensation on the surface of the pre-existing particles.
3.4. Dicarboxylates
Short chain dicarboxylic acids have been identified asubiquitous aerosol components, which may have a primaryorigin from fossil fuel, biogenic sources or biomasscombustion, or be formed in the atmosphere by photo-chemical reactions (Graham et al., 2002). The budget ofthese species was reviewed by Legrand et al. (2007) on thebasis of their climatology established during the CARBOSOLproject. It was shown that, in winter, European surface sitesare influenced by fast production of C2–C5 diacids in woodburning plumes, and secondary aqueous phase productionof oxalic acid from aldehydes formed by the rapid oxidationof toluene and ethene emitted by cars. Whereas C3–C5diacids seem to come mainly from wood burning plumes, itwas suggested that around two-thirds of C2 are related tothis source and one-third of C2 to secondary production
from toluene and ethene vehicular emissions. In summer,the contribution of these anthropogenic processes isweakened but the contribution of biogenic emissionsbecomes important. It was suggested that 30–40% of C2 arerelated to aqueous production from biogenic precursors(isoprene and acetic acid emitted by vegetation). Thepresence of C3–C5 diacids and of the left fraction of oxalicacid is less clear, likely related to other biogenic precursors(unsaturated fatty acids and oxygenated volatile organiccompounds).
All diacids are mainly present in PM2.5 (Table 3; Fig. 5e),indicating that primary biogenic sources (e.g. fungi) mainlyemitting coarse particles are insignificant and pointing outthe secondary nature of diacids. The lowest partitioningratios between the fine and the coarse fractions wereobtained for malonic acid. This specie is more volatile thanother diacids and can be transferred from fine to coarsesizes through evaporation and condensation onto largerparticles.
The changing concentration of diacids between stronglyimpacted and baseline time periods reported in Table 2clearly indicates that diacids were either emitted by fires orsubsequently produced during aging of the plumes. Oxalicacid has been suggested to be formed in the atmosphere asa secondary product by the oxidation of aromatic hydro-carbons, which are known to be emitted during wildfires(Narukawa et al., 1999). It is also likely that other diacids areformed in the hazy atmosphere by gas-to-particle conver-sion of the volatile hydrocarbons emitted during forest fires(Narukawa et al., 1999; Gao et al., 2003). Graham et al.(2002) and Gao et al. (2003) have proposed a probableformation pathway of C5–C3 related to the breakdown ofcellulose, hemicellulose and lignin. Considering aerosolsamples collected at Aveiro in summers 2002 and 2003over time periods during which no significant fires hadtaken place we found a y-intercept of the linear relation-ship between C2 and C3 of 124 ng m�3 (i.e. 40% of C2). Thatsuggests that for summertime period non-impacted byfires 40% of C2 are not related to the oxidation of glyoxylicacid but to longer chain diacids. Doing the same for aerosolscollected during fires the y-intercept remains similar(127 ng m�3), suggesting that most of C2 produced by firesare related to aqueous phase oxidation of longer chaindiacids.
As far as we know the most complete data set on C2–C5diacids in wood burning plumes is from Gao et al. (2003) onsavanna fires. Using potassium to account for the dilution ofthe plumes, Gao et al. (2003) showed that the concentra-tions of glutaric, succinic and oxalic acids stronglyincreased after 40 min of aging. For instance the glutarateto potassium ratio, close to 1% reached 15% after 40 min. Asimilar increase was observed for the oxalate to potassiumratio, 2% over the fire and 25% after 40 min. The chemicalcomposition of the material related to the large smokeevents at Aveiro indicates an oxalate to potassium ratio of240% and a glutarate to potassium ratio of 20%. The ratherhigh oxalate to potassium ratio seen in smoke reachingAveiro suggests that during the transport of the plumesoxalic acid was formed from longer chain diacids. Evenhigher enrichment of diacids with respect to potassium hasbeen observed in long range transported (a few days)

C.A. Pio et al. / Atmospheric Environment 42 (2008) 7530–75437538
boreal wildfire smokes in summer with ratios of oxalate topotassium of 1000% (Sillanpaa et al., 2005). In the case ofAveiro the aging of smoke plume was likely shorter (a day)as suggested by back-trajectories (Fig. 1).
Comparing the baseline and the peak fire periods (Table2), it was observed that the increase of diacids was largerfor long chain diacids (glutaric and C4) than for C3 and C2.C5 represents 19% of the C3–C5 total during fire eventsinstead of 13% for baseline conditions. At the opposite C3represents only 29% of the C3–C5 total during fire eventsinstead of 36% for baseline conditions. This may suggestthat, in addition to the aging of several plumes, the air masswas replenished with a fresh plume a few hours before itsarrival at Aveiro. Gao et al. (2003) pointed out the singu-larity of malonic acid with respect to other diacids, beingmost of the time absent from the smoke plumes. That is notthe case at Aveiro. Reversely, malonic acid was found to bethe most abundant C3–C5 diacids emitted by pine woodburning (Rogge et al., 1998).
3.5. Inorganic ions
In this study, eight major water-soluble inorganicspecies were quantified (SO4
2�, NH4þ, Cl�, NO3
�, Naþ, Kþ,Ca2þ, and Mg2þ), of which SO4
2�was the most abundant ion,followed by NH4
þ and NO3� (Table 3). The mass concentra-
tions of NO3�, SO4
2� and NH4þ, i.e. typical species for inor-
ganic secondary aerosols, reached their highest valuesduring the intense fire events between July 31 and August13. During this period, the fine/coarse ratios of thesespecies increased by a factor of 2–4. In particular, sulphatepeaked between August 7 and August 14 (w13 mg m�3),during the second week of intense fires, but showeda rather low value between September 11 and September18 (w4 mg m�3), also a period of very intense fire activities.Therefore, the influence of fires on sulphate concentrationsappears quite unclear. The study of the water-solublecomponents in aerosols from savanna fires by Gao et al.(2003) pointed out a rather very moderate impact forsulphate in plumes (median 10.5 mg m�3, range 1.5–35 mg m�3) compared to background conditions (median2.5 mg m�3, range 1–9 mg m�3), although it was clear thatSO2 was emitted in substantial quantities.
Potassium is an important species emitted by biomassburning, since the combustion of plant matter, whichcontains Kþ as a major electrolyte within the cytoplasm,releases great quantities of K-rich particles. Biomassburning aerosols can be identified by the ratio of fine tocoarse mode Kþ. The enrichment of Kþ in the fine mode wasobvious during the intense forest fire periods (fine/coarseratio of 14, instead of 4 for baseline periods) (Figs. 5f and 6).Contrarily to calcium, potassium is an easily volatisedelement (Ca boiling point – 1484 �C; K boiling point –759 �C). Thus, during the cooling of combustion emissions,potassium would condense on pre-existing particles in theaccumulation size mode. The fraction of soluble potassiumnot related to sea-salt and soil dust has been used asa qualitative tracer for biomass combustion (Cachier et al.,1991). In an attempt to estimate the fraction of potassiumrelated to biomass burning (KBB
þ ), the sea-salt contributionwas subtracted from the soluble potassium in fine aerosol
particles, considering the mass ratio of potassium to sodiumin seawater (0.036) and the marine sodium levels (Pio et al.,2007). Since the dust material may contain leachablepotassium, its contribution was also subtracted by using nonsea-salt calcium levels and assuming a mean crustal Kþ/Ca2þ ratio of 0.12 as proposed by Pio et al. (2007) using theslope of the lower envelope of the relationship foundbetween Knss
þ and Canss2þ for concentration observed over
2 years in different CARBOSOL sites. In addition, sincebiomass burning may also emit calcium, its contributionshould be subtracted, as follows, when calculating KBB
þ :
KþBB ¼ Kþ � 0:036Naþ � 0:12�
Ca2þnss � Ca2þ
BB
�(1)
For deriving CaBB2þ, a mass ratio of 10 between KBB
þ and CaBB2þ
was assumed. This ratio corresponds to the upper envelope(i.e. the maximum possible ratio) in the relationshipbetween Knss
þ and Canss2þ observed over the summer period.
Since primary organic aerosol emission from biomassburning was found to represent the greatest singlecontributor to aerosol OC in winter over rural Europe(Gelencser et al., 2007), the relationships between Knss
þ andCanss
2þ were also examined for the entire (winter andsummer) data sets from Aveiro and other CARBOSOL sites(as well as for results gained in other studies carried outin Portugal - unpublished data), in order to evaluate therange of the upper envelopes. Whatever the considereddata set, the upper envelopes of the relationship indicatepotassium to calcium mass ratios ranging between 8 and12, suggesting that a KBB
þ /CaBB2þ value of 10 is reasonable.
Eq. (1) applied to periods with very intense fires andbaseline periods can be used to calculate, by difference, fireinputs (see Table 2). The airborne particulate matter relatedto the most important fire inputs contained around182 ng m�3 of fine potassium against 21 ng m�3 of levo-glucosan. For savannah forest fires, Gao et al. (2003) founda potassium/levoglucosan ratio of 33.3 during flamingphase and from 0.2 to 0.6 for smouldering phase. Therelatively high KBB
þ /levoglucosan ratio over the fire periodat Aveiro (8.7) tends to indicate the flaming character of thefires. The significant presence of a coarse and fine fractionof calcium in aerosol collected at Aveiro during fires alsosupports their flaming character, resulting probably fromlofting of dust and soil by hot turbulent air. Comparatively,much lower KBB
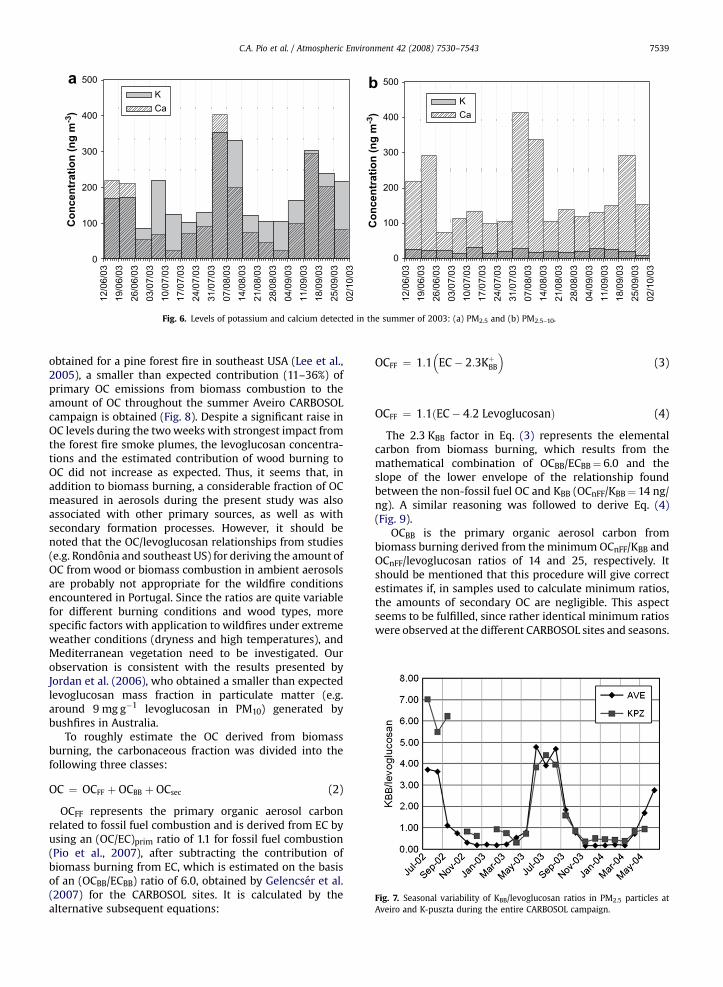
þ /levoglucosan ratios (less than 1) wereobtained during the winter period, whether in Aveiro orK-puzsta on the Great Hungarian Plain, another CARBOSOLsite also impacted by domestic wood burning in the coldseason (see Fig. 7). Ratios lower than 0.25 and 0.1 have beenobtained for PM2.5 emissions for wood stove combustion ofprevalent USA tree species (Fine et al., 2004) and prescribedburning in an USA pine forest (Lee et al., 2005), respec-tively. The variability of this ratio for distinct biomasscombustion types stresses the need for further investiga-tions to obtain more source-specific emission ratios.
3.6. Estimation of OC from biomass burning
Based on the average value between the OC/levogluco-san ratio of 12.3 measured for the fine dry season aerosol inRondonia (Graham et al., 2002) and the ratio of 10.5
12/0
6/03
19/0
6/03
26/0
6/03
03/0
7/03
10/0
7/03
17/0
7/03
24/0
7/03
31/0
7/03
07/0
8/03
14/0
8/03
21/0
8/03
28/0
8/03
04/0
9/03
11/0
9/03
18/0
9/03
25/0
9/03
02/1
0/03
Co
ncen
tratio
n (n
g m
-3)
0
100
200
300
400
500KCa
12/0
6/03
19/0
6/03
26/0
6/03
03/0
7/03
10/0
7/03
17/0
7/03
24/0
7/03
31/0
7/03
07/0
8/03
14/0
8/03
21/0
8/03
28/0
8/03
04/0
9/03
11/0
9/03
18/0
9/03
25/0
9/03
02/1
0/03
Co
ncen
tratio
n (n
g m
-3)
0
100
200
300
400
500
KCa
ab
Fig. 6. Levels of potassium and calcium detected in the summer of 2003: (a) PM2.5 and (b) PM2.5–10.
Fig. 7. Seasonal variability of KBB/levoglucosan ratios in PM2.5 particles atAveiro and K-puszta during the entire CARBOSOL campaign.
C.A. Pio et al. / Atmospheric Environment 42 (2008) 7530–7543 7539
obtained for a pine forest fire in southeast USA (Lee et al.,2005), a smaller than expected contribution (11–36%) ofprimary OC emissions from biomass combustion to theamount of OC throughout the summer Aveiro CARBOSOLcampaign is obtained (Fig. 8). Despite a significant raise inOC levels during the two weeks with strongest impact fromthe forest fire smoke plumes, the levoglucosan concentra-tions and the estimated contribution of wood burning toOC did not increase as expected. Thus, it seems that, inaddition to biomass burning, a considerable fraction of OCmeasured in aerosols during the present study was alsoassociated with other primary sources, as well as withsecondary formation processes. However, it should benoted that the OC/levoglucosan relationships from studies(e.g. Rondonia and southeast US) for deriving the amount ofOC from wood or biomass combustion in ambient aerosolsare probably not appropriate for the wildfire conditionsencountered in Portugal. Since the ratios are quite variablefor different burning conditions and wood types, morespecific factors with application to wildfires under extremeweather conditions (dryness and high temperatures), andMediterranean vegetation need to be investigated. Ourobservation is consistent with the results presented byJordan et al. (2006), who obtained a smaller than expectedlevoglucosan mass fraction in particulate matter (e.g.around 9 mg g�1 levoglucosan in PM10) generated bybushfires in Australia.
To roughly estimate the OC derived from biomassburning, the carbonaceous fraction was divided into thefollowing three classes:
OC ¼ OCFF þ OCBB þ OCsec (2)
OCFF represents the primary organic aerosol carbonrelated to fossil fuel combustion and is derived from EC byusing an (OC/EC)prim ratio of 1.1 for fossil fuel combustion(Pio et al., 2007), after subtracting the contribution ofbiomass burning from EC, which is estimated on the basisof an (OCBB/ECBB) ratio of 6.0, obtained by Gelencser et al.(2007) for the CARBOSOL sites. It is calculated by thealternative subsequent equations:
OCFF ¼ 1:1 EC� 2:3KþBB (3)
� �OCFF ¼ 1:1ðEC� 4:2 LevoglucosanÞ (4)
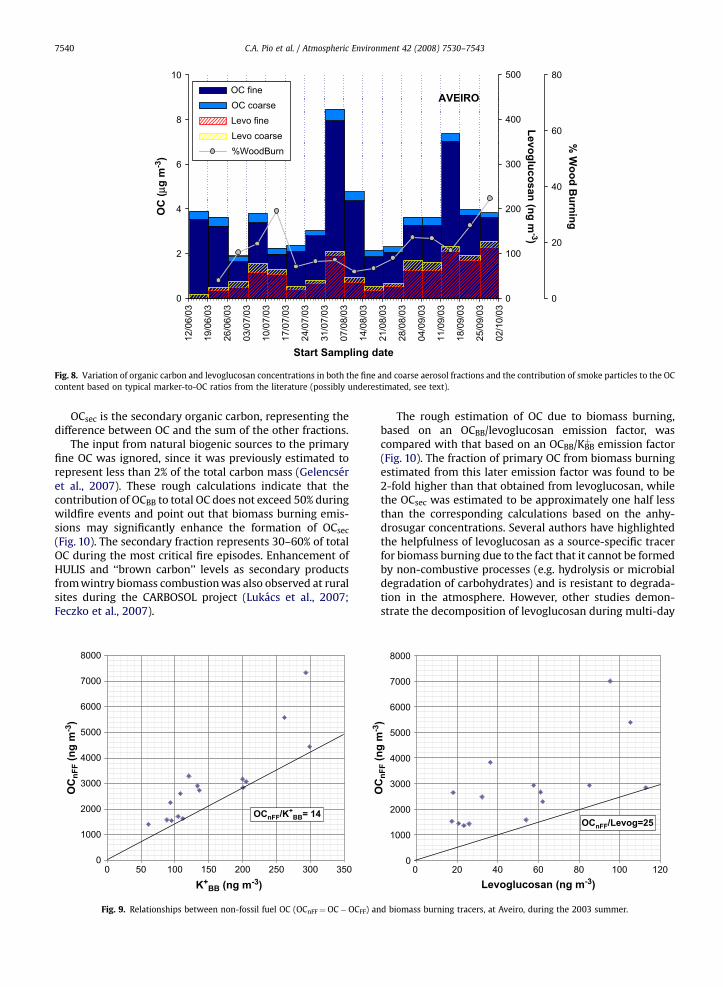
The 2.3 KBB factor in Eq. (3) represents the elementalcarbon from biomass burning, which results from themathematical combination of OCBB/ECBB¼ 6.0 and theslope of the lower envelope of the relationship foundbetween the non-fossil fuel OC and KBB (OCnFF/KBB¼ 14 ng/ng). A similar reasoning was followed to derive Eq. (4)(Fig. 9).
OCBB is the primary organic aerosol carbon frombiomass burning derived from the minimum OCnFF/KBB andOCnFF/levoglucosan ratios of 14 and 25, respectively. Itshould be mentioned that this procedure will give correctestimates if, in samples used to calculate minimum ratios,the amounts of secondary OC are negligible. This aspectseems to be fulfilled, since rather identical minimum ratioswere observed at the different CARBOSOL sites and seasons.
AVEIRO
Start Sampling date
12/0
6/03
19/0
6/03
26/0
6/03
03/0
7/03
10/0
7/03
17/0
7/03
24/0
7/03
31/0
7/03
07/0
8/03
14/0
8/03
21/0
8/03
28/0
8/03
04/0
9/03
11/0
9/03
18/0
9/03
25/0
9/03
02/1
0/03
OC
(µg
m
-3)
0
2
4
6
8
10
Levo
glu
co
san
(n
g m
-3)
0
100
200
300
400
500
% W
oo
d B
urn
in
g
0
20
40
60
80OC fineOC coarseLevo fineLevo coarse%WoodBurn
Fig. 8. Variation of organic carbon and levoglucosan concentrations in both the fine and coarse aerosol fractions and the contribution of smoke particles to the OCcontent based on typical marker-to-OC ratios from the literature (possibly underestimated, see text).
C.A. Pio et al. / Atmospheric Environment 42 (2008) 7530–75437540
OCsec is the secondary organic carbon, representing thedifference between OC and the sum of the other fractions.
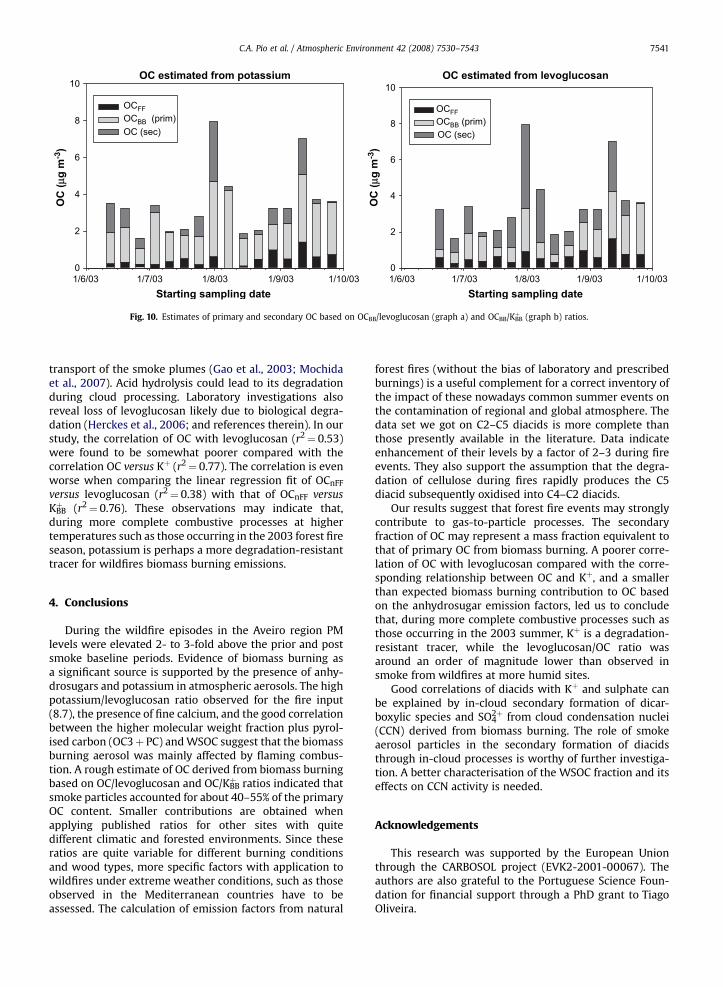
The input from natural biogenic sources to the primaryfine OC was ignored, since it was previously estimated torepresent less than 2% of the total carbon mass (Gelencseret al., 2007). These rough calculations indicate that thecontribution of OCBB to total OC does not exceed 50% duringwildfire events and point out that biomass burning emis-sions may significantly enhance the formation of OCsec
(Fig. 10). The secondary fraction represents 30–60% of totalOC during the most critical fire episodes. Enhancement ofHULIS and ‘‘brown carbon’’ levels as secondary productsfrom wintry biomass combustion was also observed at ruralsites during the CARBOSOL project (Lukacs et al., 2007;Feczko et al., 2007).
0
1000
2000
3000
4000
5000
6000
7000
8000
0 50 100 150 200 250 300 350
K+
BB (ng m
-3)
OC
nF
F (n
g m
-3)
OCnFF
/K+
BB= 14
Fig. 9. Relationships between non-fossil fuel OC (OCnFF¼OC�OCFF) an
The rough estimation of OC due to biomass burning,based on an OCBB/levoglucosan emission factor, wascompared with that based on an OCBB/KBB
þ emission factor(Fig. 10). The fraction of primary OC from biomass burningestimated from this later emission factor was found to be2-fold higher than that obtained from levoglucosan, whilethe OCsec was estimated to be approximately one half lessthan the corresponding calculations based on the anhy-drosugar concentrations. Several authors have highlightedthe helpfulness of levoglucosan as a source-specific tracerfor biomass burning due to the fact that it cannot be formedby non-combustive processes (e.g. hydrolysis or microbialdegradation of carbohydrates) and is resistant to degrada-tion in the atmosphere. However, other studies demon-strate the decomposition of levoglucosan during multi-day
OC
nF
F (n
g m
-3)
0
1000
2000
3000
4000
5000
6000
7000
8000
0 20 40 60 80 100 120Levoglucosan (ng m
-3)
OCnFF
/Levog=25
d biomass burning tracers, at Aveiro, during the 2003 summer.
Starting sampling date Starting sampling date
1/6/03 1/7/03 1/8/03 1/9/03 1/10/031/6/03 1/7/03 1/8/03 1/9/03 1/10/030
2
4
6
8
10
0
2
4
6
8
10
OCFFOCBB (prim)OC (sec)
OC estimated from potassium OC estimated from levoglucosan
OC
(µg
m
-3)
OC
(µg
m
-3)
OCFFOCBB (prim)OC (sec)
Fig. 10. Estimates of primary and secondary OC based on OCBB/levoglucosan (graph a) and OCBB/KBBþ (graph b) ratios.
C.A. Pio et al. / Atmospheric Environment 42 (2008) 7530–7543 7541
transport of the smoke plumes (Gao et al., 2003; Mochidaet al., 2007). Acid hydrolysis could lead to its degradationduring cloud processing. Laboratory investigations alsoreveal loss of levoglucosan likely due to biological degra-dation (Herckes et al., 2006; and references therein). In ourstudy, the correlation of OC with levoglucosan (r2¼ 0.53)were found to be somewhat poorer compared with thecorrelation OC versus Kþ (r2¼ 0.77). The correlation is evenworse when comparing the linear regression fit of OCnFF
versus levoglucosan (r2¼ 0.38) with that of OCnFF versusKBBþ (r2¼ 0.76). These observations may indicate that,
during more complete combustive processes at highertemperatures such as those occurring in the 2003 forest fireseason, potassium is perhaps a more degradation-resistanttracer for wildfires biomass burning emissions.
4. Conclusions
During the wildfire episodes in the Aveiro region PMlevels were elevated 2- to 3-fold above the prior and postsmoke baseline periods. Evidence of biomass burning asa significant source is supported by the presence of anhy-drosugars and potassium in atmospheric aerosols. The highpotassium/levoglucosan ratio observed for the fire input(8.7), the presence of fine calcium, and the good correlationbetween the higher molecular weight fraction plus pyrol-ised carbon (OC3þ PC) and WSOC suggest that the biomassburning aerosol was mainly affected by flaming combus-tion. A rough estimate of OC derived from biomass burningbased on OC/levoglucosan and OC/KBB
þ ratios indicated thatsmoke particles accounted for about 40–55% of the primaryOC content. Smaller contributions are obtained whenapplying published ratios for other sites with quitedifferent climatic and forested environments. Since theseratios are quite variable for different burning conditionsand wood types, more specific factors with application towildfires under extreme weather conditions, such as thoseobserved in the Mediterranean countries have to beassessed. The calculation of emission factors from natural
forest fires (without the bias of laboratory and prescribedburnings) is a useful complement for a correct inventory ofthe impact of these nowadays common summer events onthe contamination of regional and global atmosphere. Thedata set we got on C2–C5 diacids is more complete thanthose presently available in the literature. Data indicateenhancement of their levels by a factor of 2–3 during fireevents. They also support the assumption that the degra-dation of cellulose during fires rapidly produces the C5diacid subsequently oxidised into C4–C2 diacids.
Our results suggest that forest fire events may stronglycontribute to gas-to-particle processes. The secondaryfraction of OC may represent a mass fraction equivalent tothat of primary OC from biomass burning. A poorer corre-lation of OC with levoglucosan compared with the corre-sponding relationship between OC and Kþ, and a smallerthan expected biomass burning contribution to OC basedon the anhydrosugar emission factors, led us to concludethat, during more complete combustive processes such asthose occurring in the 2003 summer, Kþ is a degradation-resistant tracer, while the levoglucosan/OC ratio wasaround an order of magnitude lower than observed insmoke from wildfires at more humid sites.
Good correlations of diacids with Kþ and sulphate canbe explained by in-cloud secondary formation of dicar-boxylic species and SO4
2þ from cloud condensation nuclei(CCN) derived from biomass burning. The role of smokeaerosol particles in the secondary formation of diacidsthrough in-cloud processes is worthy of further investiga-tion. A better characterisation of the WSOC fraction and itseffects on CCN activity is needed.
Acknowledgements
This research was supported by the European Unionthrough the CARBOSOL project (EVK2-2001-00067). Theauthors are also grateful to the Portuguese Science Foun-dation for financial support through a PhD grant to TiagoOliveira.
C.A. Pio et al. / Atmospheric Environment 42 (2008) 7530–75437542
References
Abas, M.R., Oros, D.R., Simoneit, B.R.T., 2004. Biomass burning as the mainsource of organic aerosol particulate matter in Malaysia during hazeepisodes. Chemosphere 55, 1089–1095.
Allen, A.G., Cardoso, A.A., Rocha, G.O., 2004. Influence of sugar caneburning on aerosol soluble ion composition in Southeastern Brazil.Atmospheric Environment 38, 5025–5038.
Andreae, M.O., Artaxo, P., Brandao, C., Carswell, F.E., Ciccioli, P., da Costa, A.L.,Culf, A.D., Esteves, J.L., Gash, J.H.C., Grace, J., Kabat, P., Lelieveld, J.,Malhi, Y., Manzi, A.O., Meixner, F.X., Nobre, A.D., Nobre, C., Ruivo, M.D.L.P.,Silva-Dias, M.A., Stefani, P., Valentini, R., von Jouanne, J., Waterloo, M.J.,2002. Biogeochemical cycling of carbon, water, energy, trace gases, andaerosols in Amazonia: the LBA-EUSTACH experiments. Journal ofGeophysical Research 107 (D20) Art. No. 8066.
Bauer, H., Kasper-Giebl, A., Loflund, M., Giebl, H., Hitzenberger, R.,Zibuschka, F., Puxbaum, H., 2002. The contribution of bacteria andfungal spores to the organic carbon content of cloud water, precipi-tation and aerosols. Atmospheric Research 64, 109–119.
Bauer, H., Claeys, M., Vermeylen, R., Schueller, E., Weinke, G., Berger, A.,Puxbaum, H., 2008. Arabitol and mannitol as tracers for the quanti-fication of airborne fungal spores. Atmospheric Environment 42,588–593.
Cachier, H., Ducret, J., Bremond, M.P., Gaudichet, A., Lacaux, J.P., Yoboue, V.,Baudet, J.J., 1991. Characterisation of biomass burning aerosols insavannah region of the Ivory Coast. In: Levine, J. (Ed.), Global BiomassBurning. MIT Press, Cambridge, pp. 174–180.
Carvalho, A., Pio, C., Santos, C., Alves, C., 2006. Particulate carbon in theatmosphere of a Finnish forest and a German anthropogenicallyinfluenced grassland. Atmospheric Research 80, 133–150.
Caseiro, A., Marr, I.L., Claeys, M., Kasper-Giebl, A., Puxbaum, H., Pio, C.A.,2007. Determination of saccharides in atmospheric aerosol usinganion-exchange high-performance liquid chromatography andpulsed amperometric detection. Journal of Chromatography A 1171,37–45.
Castro, L.M., Pio, C.A., Harrison, R.M., Smith, D.J.T., 1999. Carbonaceousaerosol in urban and rural European atmospheres: estimation ofsecondary organic carbon concentrations. Atmospheric Environment33, 2771–2781.
Dias, J.J.M., 2002. Utilizaçao da biomassa: avaliaçao dos resıduos e uti-lizaçao de pellets em caldeiras domesticas. M.Sc. Thesis. SuperiorTechnical Institute of the Technical University of Lisbon.
Draxler, R.R., Hess, G.D., 1997. Description of HYSPLIT_4 modeling system.NOAA Technical Memorandum Report, ERL, ARL-224. Available at:<http://www.arl.noaa.gov/ready/hysplit4.html>.
Engling, G., Carrico, C.M., Kreindenweis, S.M., Collet, J.L., Day, D.E.,Malm, W.C., Lincoln, E., Hao, W.M., Iinuma, Y., Herrmann, H.,2006. Determination of levoglucosan in biomass combustionaerosol by high-performance anion-exchange chromatographywith pulsed amperometric detection. Atmospheric Environment40, S299–S311.
Feczko, T., Puxbaum, H., Kasper-Giebl, A., Handler, M., Limbeck, A.,Gelencser, A., Pio, C., Preunkert, S., Legrand, M., 2007. Determinationof water and alkaline extractable atmospheric humic-like substanceswith the TU Vienna HULIS analyzer in samples from six backgroundsites in Europe. Journal of Geophysical Research 112, D23S10. doi:10.1029/2006JD008331.
Fine, P.M., Cass, G.R., Simoneit, B.R.T., 2004. Chemical characterization offine particle emissions from the fireplace combustion of wood typesgrown in the midwestern and western United States. EnvironmentalEngineering Science 21, 387–409.
Formenti, P., Elbert, W., Maenhaut, W., Haywood, J., Osborne, S.,Andreae, M.O., 2003. Inorganic and carbonaceous aerosols during theSouthern African Regional Science Initiative (SAFARI 2000) experi-ment: chemical characteristics, physical properties, and emissiondata for smoke from African biomass burning. Journal of GeophysicalResearch 108 (D13) Art. No. 8488.
Gao, S., Hegg, D.A., Hobbs, P.V., Kirchstetter, T.W., Magi, B.I., Sadilek, M.,2003. Water-soluble organic components in aerosols associated withsavanna fires in southern Africa: identification, evolution, anddistribution. Journal of Geophysical Research 108, 8491. doi:10.1029/2002JD002324.
Gelencser, A., May, B., Simpson, D., Sanchez-Ochoa, A., Kasper-Giebl, A.,Puxbaum, H., Caseiro, A., Pio, C., Legrand, M., 2007. Source appor-tionment of PM2.5 organic aerosol over Europe: primary/secondary,natural/anthropogenic, fossil/biogenic origin. Journal of GeophysicalResearch 112, D23S04. doi:10.1029/2006JD008094.
Graham, B., Guyon, P., Taylor, P.E., Artaxo, P., Maenhaut, W., Glovsky, M.M.,Flagan, R.C., Andreae, M.O., 2003. Organic compounds present in the
natural Amazonian aerosol: characterization by gas chromatography-mass spectrometry. Journal of Geophysical Research 108 (D24), 4766.
Graham, B., Mayol-Bracero, O.L., Guyon, P., Roberts, G.C., Decesari, S.,Facchini, M.C., Artaxo, P., Maenhaut, W., Koll, P., Andreae, M.O., 2002.Water-soluble organic compounds in biomass burning aerosols overAmazonia – 1. Characterization by NMR and GC-MS. Journal ofGeophysical Research 107, D20. Art. No. 8047.
Guazzotti, S.A., Suess, D.T., Coffee, K.R., Quinn, P.K., Bates, T.S., Wisthaler, A.,Hansel, A., Ball, W.P., Dickerson, R.R., Neususs, C., Crutzen, P.J.,Prather, K.A., 2003. Characterization of carbonaceous aerosols outflowfrom India and Arabia: biomass/biofuel burning and fossil fuelcombustion. Journal of Geophysical Research 108, D15. Art. No. 4485.
Herckes, P., Engling, G., Kreidenweis, S.M., Collet, J.L., 2006. Particle sizedistributions of organic aerosol constituents during the 2002Yosemite aerosol characterization study. Environmental Science andTechnology 40, 4554–4562.
Jordan, T.B., Seen, A.J., Jacobson, G.E., 2006. Levoglucosan as an atmo-spheric tracer for woodsmoke. Atmospheric Environment 40,5316–5321.
Kawamoto, H., Murayama, M., Saka, S., 2003. Pyrolysis behaviour of lev-oglucosan as an intermediate in cellulose pyrolysis: polymerizationinto polysaccharide as a key reaction to carbonized product forma-tion. Journal of Wood Science 49, 469–473.
Lee, S., Baumann, K., Schauer, J.J., Sheesley, R.J., Naeher, L.P., Meinardi, S.,Blake, D.B., Edgerton, E.S., Russell, A.G., Clements, M., 2005. Gaseousand particulate emissions from prescribed burning in Georgia. Envi-ronmental Science and Technology 39, 9049–9056.
Legrand, M., Puxbaum, H., 2007. Summary of the CARBOSOL project:present and retrospective state of organic versus inorganic aerosolover Europe. Journal of Geophysical Research 112. doi:10.1029/2006JD008271.
Legrand, M., Preunkert, S., Oliveira, T., Pio, C., Hammer, S., Gelencser, A.,Kasper-Giebl, A., Laj, P., 2007. Origins of C2–C5 dicarboxylic acids inthe European atmosphere inferred from year-round aerosol studyconducted at a west–east European transect. Journal of GeophysicalResearch 112, D23S07. doi:10.1029/2006JD008019.
Leithead, A., Li, S.M., Hoff, R., Cheng, Y., Brook, J., 2006. Levoglucosan anddehydroabietic acid: evidence of biomass burning impact on aerosolsin the Lower Fraser Valley. Atmospheric Environment 40, 2721–2734.
Liao, H., Yung, Y.L., Seinfeld, J.H., 1999. Effects of aerosols on troposphericphotolysis rates in clear and cloudy atmospheres. Journal ofGeophysical Research 104, 23697–23707.
Liu, W., Hopke, P.K., Van Curen, R.A., 2003. Origins of fine aerosol mass inthe western United States using positive matrix factorization. Journalof Geophysical Research 108D, D23. Art. No. 4716.
Lukacs, H., Gelencser, A., Pio, C.A., Legrand, M., Preunkert, S., Schock, M.,Puxbaum, H., Kasper-Giebl, A., Fialho, P., 2007. Comparative study onconcentrations of humic-like substances (HULIS) and their seasonalvariations across Europe. Journal of Geophysical Research 112,D23S18. doi:10.1029/2006JD008151.
Lyamani, H., Olmo, F.J., Alcantara, A., Alados-Arboledas, L., 2006. Atmo-spheric aerosols during the 2003 heat wave in southeastern Spain II:microphysical columnar properties and radiative forcing. Atmo-spheric Environment 40, 6465–6476.
MAI, 2003. Livro Branco dos Incendios Florestais Ocorridos no Verao de2003. Ministerio da Administraçao Interna, Portugal.
Mayol-Bracero, O.L., Guyon, P., Graham, B., Roberts, G., Andreae, M.O.,Decesari, S., Facchini, M.C., Fuzzi, S., Artaxo,P., 2002. Water-soluble organiccompounds in biomass burning aerosols over Amazonia – 2. Apportion-ment of the chemical composition and importance of the polyacidicfraction. Journal of Geophysical Research 107 (D20) Art. No. 8091.
Medeiros, P.M., Conte, M.H., Weber, J.C., Simoneit, B.R.T., 2006. Sugars as sourceof biogenic organic carbon in aerosols collected above the HowlandExperimental Forest, Maine. Atmospheric Environment 40, 1694–1705.
Mochida, M., Umemoto, N., Kurokawa, A., Kawamura, K., 2007. Three-yearobservation of levoglucosan over Chichi-jima island in the North-western Pacific. Eos Transactions AGU 88 (52) Fall Meeting Supple-ment, Abstract A33A-0835.
Narukawa, M., Kawamura, K., Takeuchi, N., Nakajima, T., 1999. Distributionof dicarboxylic acids and carbon isotopic ratios in aerosols from 1997Indonesian forest fires. Geophysical Research Letters 26, 3101–3104.
NASA/University of Maryland, 2002. MODIS Hotspot/Active Fire Detec-tions. Data set. MODIS Rapid Response Project. NASA/GSFC [producer],University of Maryland, Fire Information for Resource ManagementSystem [distributors]. Available at: http://maps.geog.umd.edu.
Novakov, T., Andreae, M.O., Gabriel, R., Kirchstetter, T.W., Mayol-Bracero, O.L., Ramanathan, V., 2000. Origin of carbonaceous aerosolsover the tropical Indian Ocean: biomass burning or fossil fuels?Geophysical Research Letters 27, 4061–4064.

C.A. Pio et al. / Atmospheric Environment 42 (2008) 7530–7543 7543
Pereira, M.G., Trigo, R.M., Camara, C.C., Pereira, J.M.C., Leite, S.L., 2005.Synoptic patterns associated with large summer forest fires in Por-tugal. Agricultural and Forest Meteorology 129, 11–25.
Phuleria, H.C., Fine, P.M., Zhu, Y., Sioutas, C., 2005. Air quality impacts ofthe October 2003 Southern California wildfires. Journal of Geophys-ical Research 110. doi:10.1029/2004JD004626.
Pio, C.A., Legrand, M., Oliveira, T., Afonso, J., Santos, C., Caseiro, A.,Fialho, P., Barata, F., Puxbaum, H., Sanchez-Ochoa, A., Kasper-Giebl, A.,Gelencser, A., Preunkert, S., Schock, M., 2007. Climatology of aerosolcomposition (organic versus inorganic) at non-urban areas ona West–East transect across Europe. Journal of Geophysical Research112, D23S02. doi:10.1029/2006JD008038.
Puxbaum, H., Caseiro, A., Sanchez-Ochoa, A., Kasper-Giebl, A., Claeys, M.,Gelencser, A., Legrand, M., Preunkert, S., Pio, C., 2007. Levoglucosanlevels at background sites in Europe for assessing the impact ofbiomass combustion on the European aerosol background. Journal ofGeophysical Research 112, D23S05. doi:10.1029/2006JD008114.
Puxbaum, H., Tenze-Kunit, M., 2003. Size distribution and seasonal variationof atmospheric cellulose. Atmospheric Environment 37, 3693–3699.
Reid, J.S., Hobbs, P.V., Ferek, R.J., Blake, D.R., Martins, J.V., Dunlap, M.R.,Liousse, C., 1998. Physical, chemical, and optical properties of regionalhazes dominated by smoke in Brazil. Journal of Geophysical Research103 (D24), 32,059–32,080.
Rogge, W.F., Hildemann, L.M., Mazurek, M.A., Cass, G.R., Simoneit, B.R.T.,1998. Sources of fine organic aerosol. 9. Pine, oak, and synthetic logcombustion in residential fireplaces. Environmental Science andTechnology 32, 13–22.
Saarikoski, S., Sillanpaa, M., Sofiev, M., Timonen, H., Saaenio, K., Teinila, K.,Karppinen, A., Kukkonen, J., Hillamo, R., 2007. Chemical compositionof aerosols during a major biomass burning episode over northernEurope in spring 2006: experimental and modelling assessments.Atmospheric Environment 41, 3577–3589.
Sapkota, A., Symons, M., Kleissl, J., Wang, L., Parlange, M., Ondov, J.,Breysse, P., Diette, G., Eggleston, P., Buckley, T., 2005. Impact of the2002 Canadian forest fires on particulate matter air quality in Balti-more city. Environmental Science and Technology 39, 24–32.
Schkolnik, G., Falkovich, A.H., Rudich, Y., Maenhaut, W., Artaxo, P., 2005. Anew analytical method for the determination of levoglucosan, poly-hydroxy compounds, and 2-methylerythritol and its application tosmoke and rainwater samples. Environmental Science and Tech-nology 39, 2744–2752.
Schmid, H., Laskus, L., Abraham, H.J., Baltensperger, U., Lavanchy, V.,Bizjak, M., Burba, P., Cachier, H., Crow, D., Chow, J., Gnauk, T., Even, A.,ten Brink, H.M., Giesen, K.-P., Hitzenberger, R., Hueglin, C.,Maenhaut, W., Pio, C., Carvalho, A., Putaud, J.-P., Toom-Sauntry, D.,Puxbaum, H., 2001. Results of the carbon conference internationalaerosol carbon round robin test stage 1. Atmospheric Environment35, 2111–2121.
Schmidl, C., Marr, I.L., Caseiro, A., Kotianova, P., Berner, A., Bauer, H.,Kasper-Giebl, A., Puxbaum, H., 2008. Chemical characterisation of fineparticle emissions from woodstove combustion of common woodsgrowing in mid-European Alpine regions. Atmospheric Environment42, 126–141.
Sillanpaa, M., Saarikoski, S., Pennanen, A., Makkonen, U., Spolnik, Z.,Grieken, R., Koskentalo, T., Salonen, R.O., 2005. Chemical composition,mass size distribution and source analysis of long-range transportedwildfire smokes in Helsinki. Science of the Total Environment 350,119–135.
Simoneit, B.R.T., Schauer, J.J., Nolte, C.G., Oros, D.R., Elias, V.O., Fraser, M.P.,Rogge, W.F., Cass, G.R., 1999. Levoglucosan, a tracer for cellulose inbiomass burning and atmospheric particles. Atmospheric Environ-ment 33, 173–182.
Simoneit, B.R.T., Elias, V.O., Kobayashi, M., Kawamura, K., Rushdi, A.I.,Medeiros, P.M., Rogge, W.F., Didyk, B.M., 2004. Sugars – dominantwater-soluble organic components in soils and characterization astracers in atmospheric particulate matter. Environmental Science andTechnology 38, 5939–5949.
Stedman, J.R., 2004. The predicted number of air pollution related deathsin the UK during the August 2003 heatwave. Atmospheric Environ-ment 38, 1087–1090.
Varga, B., Kiss, G., Ganszky, I., Gelencser, A., Krivacsy, Z., 2001. Isolation ofwater-soluble organic matter from atmospheric aerosol. Talanta 55,561–572.
Ward, T.J., Hamilton, R.F., Dixon, R.W., Paulsen, M., Simpson, C.D., 2006a.Characterisation and evaluation of smoke tracers in PM: results fromthe 2003 Montana wildfire season. Atmospheric Environment 40,7005–7017.
Ward, T.J., Rinehart, L.R., Lange, T., 2006b. The 2003/04 Libby, MontanaPM2.5 source apportionment research study. Aerosol Science andTechnology 40, 166–177.
Ward, T.J., Smith, G.C., 2005. The 2000/2001 Missoula Valley PM2.5 chem-ical mass balance study, including the 2000 wildfire season – seasonalsource apportionment. Atmospheric Environment 39, 709–717.
Watson, J.G., Chow, J.C., Houck, J.E., 2001. PM2.5 chemical source profilesfor vehicle exhaust, vegetative burning, geological material, and coalburning in Northwestern Colorado during 1995. Chemosphere 43,1141–1151.
Zdrahal, Z., Oliveira, J., Vermeylen, R., Claeys, M., Maenhaut, W., 2002.Improved method for quantifying levoglucosan and related mono-saccharides in atmospheric aerosols and application to samples fromurban and tropical locations. Environmental Science and Technology36, 747–753.
Zheng, M., Cass, G.R., Schauer, J.J., Edgerton, E.S., 2002. Source appor-tionment of PM2.5 in the southeastern United States using solvent-extractable organic compounds as tracers. Environmental Science andTechnology 36, 2361–2371.