
Lecture # 4: Biochemical Classes and Elemental Considerations- II

ACPD3, 2547–2573, 2003
Size resolved massconcentration and
elementalcomposition
J. Smolik et al.
Title Page
Abstract Introduction
Conclusions References
Tables Figures
J I
J I
Back Close
Full Screen / Esc
Print Version
Interactive Discussion
c© EGU 2003
Atmos. Chem. Phys. Discuss., 3, 2547–2573, 2003www.atmos-chem-phys.org/acpd/3/2547/c© European Geosciences Union 2003
AtmosphericChemistry
and PhysicsDiscussions
Size resolved mass concentration andelemental composition of atmosphericaerosols over the eastern MediterraneanareaJ. Smolik1, V. Zdimal1, J. Schwarz1, M. Lazaridis3, V. Havranek2,K. Eleftheriadis4, N. Mihalopoulos5, C. Bryant6, and I. Colbeck6
1Institute of Chemical Process Fundamentals, ASCR, Prague, Czech Republic2Nuclear Physics Institute AS CR, Prague, Czech Republic3Technical University of Crete, Department of Environmental Engineering, 73100 Chania,Greece4N. C. S. R. Demokritos, 15310 Ag. Paraskeui, Attiki, Greece5Environmental Chemical Processes Laboratory (ECPL), Department of Chemistry, Universityof Crete 71409 Heraklion, Greece6Department of Biological Sciences, University of Essex, UK
Received: 24 March 2003 – Accepted: 18 April 2003 – Published: 19 May 2003
Correspondence to: M. Lazaridis ([email protected])
2547

ACPD3, 2547–2573, 2003
Size resolved massconcentration and
elementalcomposition
J. Smolik et al.
Title Page
Abstract Introduction
Conclusions References
Tables Figures
J I
J I
Back Close
Full Screen / Esc
Print Version
Interactive Discussion
c© EGU 2003
Abstract
A Berner low pressure impactor was used to collect size-segregated aerosol samplesat Finokalia, located on the north-eastern coast of Crete, Greece during July 2000and January 2001. Several samples were also collected during the summer campaignaboard the research vessel “AEGAIEO” in the Aegean Sea. Gravimetric analysis and5
inversion techniques yielded daily PM1 and PM10 mass concentrations. Further, thesamples were analysed by PIXE giving elemental size distributions of Al, Si, K, Ca, Ti,Mn, Fe, Sr, S, Cl, Ni, V, Cu, Cr, Zn, and Pb. The crustal elements and sea-salt had aunimodal supermicron size distribution. Sulphur was found predominantly in submicronfractions. K, V, and Ni exhibited bimodal distribution with a submicron mode produced10
by forest fires and oil combustion. The anthropogenic elements had broad and notwell-defined distributions. The time series for PM1 and PM10 mass and elementalconcentrations showed both daily and seasonal variation. Higher mass concentrationswere observed during two incursions of Saharan dust. Higher concentrations of S, Cu,Zn, and Pb were encountered in samples collected in air masses arriving from northern15
Greece or the western coast of Turkey. Higher concentrations of chlorine were foundin samples with air masses either originating above the Atlantic Ocean and arriving atFinokalia via western Europe or recirculating over the western coast of the Black Sea.
1. Introduction
Intensive aerosol and gaseous pollutant measurement campaigns have been per-20
formed at Finokalia on the island of Crete (Greece) in combination with boat measure-ments in the eastern part of the Mediterranean area as part of the SUB-AERO project.The measurements were performed with the participation of 9 European research insti-tutions. The above measurements together with regional/mesoscale/subgrid modellingstudies were utilized to investigate the dynamics/characteristics of photochemical and25
fine particle pollutants in the Mediterranean area. The research work was performed
2548

ACPD3, 2547–2573, 2003
Size resolved massconcentration and
elementalcomposition
J. Smolik et al.
Title Page
Abstract Introduction
Conclusions References
Tables Figures
J I
J I
Back Close
Full Screen / Esc
Print Version
Interactive Discussion
c© EGU 2003
under the auspices of the European Union Fifth Framework Programme (project SUB-AERO).
Under this research framework gaseous phase measurements for a number of photo-oxidants, fine particle concentration measurements and detailed PM1 and PM10 par-ticulate matter characterisation were carried out in the eastern Mediterranean area5
during summer 2000 and winter 2001. The experimental data were compared withmodeling studies of the dynamics of photochemical gaseous species and particulatematter.
To the north of the Mediterranean Sea are the highly populated European countrieswith industrial, semi-industrial, and rural economies, whilst to the south is Africa. A de-10
tailed wind trajectory analyses shows that more than 60% of air masses which arrive inthe eastern Mediterranean come from the N-NW and 13–16% from the Sahara (Guer-zoni et al., 1990). Air masses from the N-NW contain particles related to industrialand urban inputs; those from Sahara carry predominantly mineral dust. Transport ofSahara dust occurs mostly during the spring and summer and causes non-continuous15
crustal aerosol pulses to the Mediterranean area (e.g. Bergametti et al., 1989b; Moulinet al., 1998). On the other hand, precipitation scavenging during the rainy seasonbetween October and May reduces aerosol concentrations (e.g. Dulac et al., 1987;Bergametti et al., 1989a). The summer time is also characterised by low-inversion lay-ers, and strong sunlight, causing photochemical smog. Moreover, forest fires, which20
occur during the summer months in the Mediterranean region and in North Africa,increase black carbon and fine particle emissions. Thus, the Mediterranean Sea con-stitutes an area where atmospheric particles originating from continental natural andanthropogenic sources, marine sources and gas-to-particle conversion simultaneouslyexist. Furthermore, specific meteorological conditions result in high temporal variability25
of aerosol concentrations. Consequently, the Mediterranean area offers unique condi-tions for modelling/measurement studies.
Most of the studies on the chemical composition of Mediterranean particulate aerosolhave been conducted in the western and north-western region (e. g. Dulac et al., 1987;
2549

ACPD3, 2547–2573, 2003
Size resolved massconcentration and
elementalcomposition
J. Smolik et al.
Title Page
Abstract Introduction
Conclusions References
Tables Figures
J I
J I
Back Close
Full Screen / Esc
Print Version
Interactive Discussion
c© EGU 2003
Bergametti et al., 1989a, b; Dulac et al., 1989; Migon et al., 1991; Migon et al., 1993;Sandroni and Migon, 1997) or on the eastern coast including Turkey and Israel (e. g.Mamane et al., 1980; Ganor et al., 1991; Kubilay et al., 1994; Luria et al., 1996; Maen-haut et al., 1999; Gullu et al., 2000; Yatin et al., 2000; Erduran and Tuncel, 2001).However relatively few studies have been undertaken in the southern part of the east-5
ern Mediterranean and Greece (e.g. Chester et al., 1993; Mihalopoulos et al., 1997;Danalatos and Glavas, 1999; Chabas and Lefevre, 2000). Here we report on the at-mospheric aerosol measurement on the island of Crete (south-eastern Mediterranean)using cascade impactors and the characterisation of the collected particulate matter.Emphasis is placed on the mass and elemental size distributions and the temporal10
variability of PM1 and PM10.
2. Experimental
2.1. Sampling site
Aerosol samples were collected on Crete during the periods 10–31 July 2000 and7–14 January 2001. According to analysis of 10 years air mass back trajectories15
(WMO, 1985; Guerzoni et al., 1990; Chester et al., 1993) 39% of air masses arriveat Crete from the north across Greece, eastern Europe and the former USSR, 28%of air masses arrive from the west-northwest, crossing western Europe, 16% comefrom the south, carrying with them aerosols from the Sahara and North Africa deserts,and 17% come from the east crossing the Middle East desert regions. Mihalopoulos20
et al. (1997) report similar figures. The main sampling site was located at Finokalia.Finokalia (35◦19′ N, 25◦40′ E) is a coastal remote site eastward Heraklion on the topa hill (∼150 m a.s.l.) facing the sea within the sector of 270◦ to 90◦. The samplingwas carried out in open terrain about 3 m above the ground. In addition samples ofatmospheric aerosol were also collected during the period 25–29 July 2000 aboard the25
research vessel “AEGAIEO”. The vessel cruised in the Aegean Sea along selected
2550

ACPD3, 2547–2573, 2003
Size resolved massconcentration and
elementalcomposition
J. Smolik et al.
Title Page
Abstract Introduction
Conclusions References
Tables Figures
J I
J I
Back Close
Full Screen / Esc
Print Version
Interactive Discussion
c© EGU 2003
tracks calculated by forward and back trajectory modelling with the Finokalia samplingsite as the end point.
2.2. Sampling
Samples of atmospheric particulate matter were collected and size-segregated into 10size fractions by two Berner type low pressure cascade impactors BLPI 25/0, 018/2,5
one from ICPF Prague and the second from “Demokritos”, Athens. The impactorswere used alternately at Finokalia station during the period 10–19 July 2000. Afterthat the measurements at Finokalia continued with an impactor from Prague and theimpactor from “Demokritos” was used aboard the “AEGAION” vessel. Both impactorswere used alternately during the winter campaign (7–14 January 2001). In order to de-10
termine the real cut diameters and shapes of collection efficiency curves the impactorfrom Prague was calibrated at the Finnish Meteorological Institute by the method de-scribed by Hillamo and Kauppinen (1991). It was found that real cut diameters (D50values) for stages 1–10 were 0.026, 0.062, 0.110, 0.173, 0.262, 0.46, 0.89, 1.77, 3.4,and 6.8µm. Further, it was found that all stages of impactor have reasonably sharp15
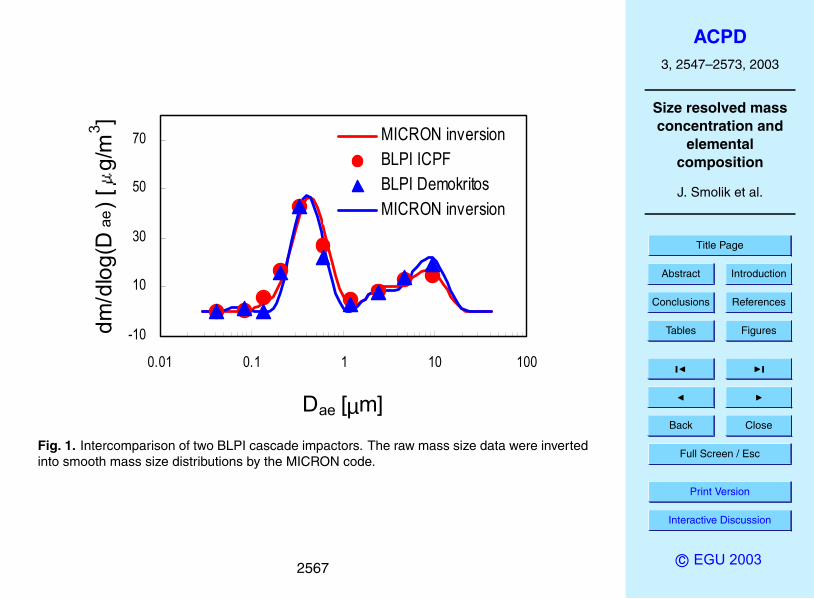
collection efficiency curves, which makes the impactor response suitable for use with adata inversion technique (Hillamo et al., 1999). Before both campaigns the impactorswere compared during 2-day measurements of mass size distribution of urban aerosolin Athens. For this purpose both impactors were connected in parallel to the samevacuum pump and two 24-hour samples were taken. The result of intercomparison is20
shown in Fig. 1, where Dae is the geometric mean aerodynamic diameter. As can beseen the instruments were practically identical.
The sampling at Finokalia was carried out on the roof of small building. The impactor,with an inlet providing approximately 15µm upper cut-off particle size, was positionedat a height of about 3 m above the ground. To reduce particle bounce the samples were25
deposited on Nuclepore polycarbonate foils greased with Apiezon L vacuum grease.Sampling was carried out in approximately 24-hour intervals with a flow rate of 25 l/min(in some cases the real time was shorter due to electrical current interruptions). The
2551
ACPD3, 2547–2573, 2003
Size resolved massconcentration and
elementalcomposition
J. Smolik et al.
Title Page
Abstract Introduction
Conclusions References
Tables Figures
J I
J I
Back Close
Full Screen / Esc
Print Version
Interactive Discussion
c© EGU 2003
first sample was taken from 10 July 2000, 10:00 to 11 June 2000, 10:00 local time. Dueto some technical problems samples on the boat were not taken at standard times, asat the Finokalia, and sampling times were usually shorter. In total 5 samples were col-lected aboard the boat over the following time intervals 25 July (23:10)–26 July (09:53),26 July (11:15)–27 July (10:20), 27 July (11:12)–28 July (09:15), 28 July (10:45)–295
July (01:15), and on 29 July between 09:00–18:43. During the winter sampling startedat about 14:00. Thus the first sample was taken between 7 January 2001 (14:00) and8 January 2001 (14:00). In total 21 samples from the summer campaign, 5 samplesfrom the boat and 7 samples from the winter measurements were obtained, with eachsample consisting of 10 size fractions.10
2.3. Gravimetric analysis
The mass size distributions were obtained from the mass of particulate matter de-posited on the individual stages of the impactor, volume flow rate of aerosol and totaltime of sampling. The electronic microbalances ATTA Cahn and Sartorius BP211Dwith a maximum attainable precision of 10µg were used for weighing the aerosol sam-15
ples from the summer campaign. During the winter campaign Sartorius M5P-000V001electronic microbalances with maximum attainable precision of 1µg were used. Foilswere transported from the sampling site in Petri dishes and equilibrated in the weighingroom for at least 24 hours before weighing at conditions R.H. 56 ± 13% and temper-ature 24.7 ± 1.0◦ C (summer), R.H. 62.8 ± 2.5% and temperature 26.8 ± 1.0◦ C (boat)20
and R.H. 69.2± 1.8 and temperature 21.4± 0.8 (winter). Internal calibration of the bal-ance was performed regularly, at least once at the beginning of each weighing run. Tocheck reproducibility of the weighing procedure, a control aluminum foil was weighedat least once during each weighing run. Before and after each weighing run anothercontrol substrate (blank made of the same polycarbonate foil processed the same way25
but without a sample) was weighed to check the influence of possible temperature andRH fluctuations.
2552

ACPD3, 2547–2573, 2003
Size resolved massconcentration and
elementalcomposition
J. Smolik et al.
Title Page
Abstract Introduction
Conclusions References
Tables Figures
J I
J I
Back Close
Full Screen / Esc
Print Version
Interactive Discussion
c© EGU 2003
2.4. Elemental analysis
All samples were analysed by particle-induced X-ray emission (PIXE). Analyses wereperformed on the 3 MeV Van de Graaff electrostatic accelerator at the Nuclear PhysicsInstitute in Rez at Prague. The samples consisted of annular deposit of individualspots, with number of spots depending on the stage. The 8 mm collimator of proton5
beam for stage 1 and 3 mm collimator for stages 2–10 were used. Usually, 6 spotsfrom stage 1, 2 spots from stage 2, and 1 spot from stages 3–10 were analysed. Toobtain the elemental concentrations for individual size fractions deposited on impactionfoils, the results of analysis was related to the actual number of spots on each stage.Two proton beam energies of 1.31 MeV and 2.35 MeV were used to irradiate samples.10
Usually the proton fluence of about 10µC and 50µC were used for the 1.31 MeV and2.35 MeV measurement, respectively. The typical time for one irradiation was about5 min. The 1 mm polyethylene absorption filter was used for the 2.35 MeV irradiationto reduce the intensive low energy X-rays from sample. In samples from the summercampaign Al, Si, K, Ca, Ti, Mn, Fe, Sr, S, Cl, Ni, V, Cu, Cr, Zn, and Pb were determined.15
During the winter campaign a new set of polycarbonate foils with low blank of Br wasused. This allowed the determination of Br in the samples. Elements up to Ti weredetermined from 1.31 MeV while the rest of elements from the 2.35 MeV measurement.The influence of the observed matrix effect due to the deposit thickness was correctedusing the Equivalent Layer Thickness Model (Havranek et al., 1999). The ratio of the20
Fe signal from 1.35 MeV and 2.35 MeV irradiation was used to estimate the effectivethickness of aerosol deposit for individual spots.
2553

ACPD3, 2547–2573, 2003
Size resolved massconcentration and
elementalcomposition
J. Smolik et al.
Title Page
Abstract Introduction
Conclusions References
Tables Figures
J I
J I
Back Close
Full Screen / Esc
Print Version
Interactive Discussion
c© EGU 2003
3. Results and discussion
3.1. Mass size distributions
A total of 21 mass size distributions from the summer campaign, 5 mass size distribu-tions from the boat and 7 mass size distributions from the winter measurements wereobtained. The distributions were predominantly bimodal with mode mean diameters5
around 0.4 and 5µm and with minimum between both modes at around 1µm. The rawmass size data were inverted into smooth mass size distributions by the MICRON code(Wolfenbarger and Seinfeld, 1990). The inverted distributions were integrated to obtainPM1 and PM10 mass concentrations. The time series of PM1 and PM10 for both sum-mer and winter campaigns are shown in Fig. 2. As can be seen PM1 and PM10 mass10
concentrations show both short-term (daily) and long-term (seasonal) variations. In ourcase the daily PM10 mass concentration, measured at Finokalia during the summer,ranged from 20.7 to 40µg/m3 (10–18 July 2000), after that it was practically constantbeing approximately 29µg/m3 (19–25 July 2000) before increasing up to 67.2µg/m3
(27 July 2000) and finally decreasing to 37µg/m3 (30 July 2000). A similar increase of15
PM10 concentration was observed in samples collected aboard the boat, with a max-imum of 75.1µg/m3 (28 July 2000). The daily PM1 mass concentration, measuredduring the summer, ranged from 3.7 to 20.2µg/m3 and from 11.6 to 25.9µg/m3 at Fi-nokalia and aboard the boat, respectively. During the winter the daily PM1 and PM10concentrations varied from 2.4 to 8.6µg/m3 and from 10.1 to 19.5µg/m3, respectively.20
The short-term variation in aerosol mass and composition, is observed frequently inthe Mediterranean area and surrounding regions. It is caused mainly by changes in airmass transport arriving from different sectors toward the sampling point (e.g. Dulac etal., 1987; Bergametti et al., 1989a, b, 1992; Guerzoni et al., 1990; Ganor et al., 1991;Hacisalihoglu et al., 1991, 1992; Migon et al., 1993; Kubilay et al., 1994, 1995; Luria25
et al., 1996; Mihalopoulos et al., 1997; Sandroni and Migon, 1997; Gullu et al., 2000;Danalatos and Glavas, 1999; Chabas and Lefevre, 2000; Yatin et al., 2000; Erduranand Tuncel, 2001).
2554

ACPD3, 2547–2573, 2003
Size resolved massconcentration and
elementalcomposition
J. Smolik et al.
Title Page
Abstract Introduction
Conclusions References
Tables Figures
J I
J I
Back Close
Full Screen / Esc
Print Version
Interactive Discussion
c© EGU 2003
To estimate the effect of air mass transport we computed the backward trajectories(HYSPLIT4 Trajectory Model with 6 h time steps 72 h backward in time for two trans-port layers 300–2000 m and 1500–3000 m). The results showed that the air massesarriving in Crete changed direction several times between north and west during thefirst period (10–18 July 2000). Higher PM10 concentrations were observed with air5
masses originating over the Atlantic Ocean and western Europe (10, 13, and 16 July2000). The relatively constant PM10 concentration observed during 19–25 July 2000corresponded to air masses originating from the area of western coast of the BlackSea. The peak PM10 mass concentrations, observed during the end of the summercampaign, corresponded to air masses from North Africa. During the winter campaign10
higher mass concentrations were observed with air masses originatinating over the At-lantic Ocean and arriving via Northern Africa and the Mediterranean Sea (9 January2001). Higher mass concentrations were also observed with air masses originatinatingfrom southern Greece and the Ionian Sea, that recirculated above Crete (7 January2001) or originated above the Mediterranean Sea and recirculated above the North15
Africa coast. However, for similar meteorological conditions low aerosol mass concen-trations were also found (8 January 2001).
The long-term (seasonal) variation results in different average aerosol concentrationsobserved during the different seasons. In our case the geometric mean PM1 andPM10 mass concentrations, measured at Finokalia during the summer, were 11.4420
and 32.09µg/m3, respectively. Corresponding winter mass concentrations were 4.22and 14.17µg/m3, respectively. Similar seasonal variability of aerosol concentrationsin the Mediterranean region was observed by other authors (e. g. Bergametti et al.,1989a, b; Gullu et al., 2000; Chabas and Lefevre, 2000). This may be attributed to thescavenging by precipitation during transport from source areas that is more frequent25
during the rainy period in autumn and winter.
2555

ACPD3, 2547–2573, 2003
Size resolved massconcentration and
elementalcomposition
J. Smolik et al.
Title Page
Abstract Introduction
Conclusions References
Tables Figures
J I
J I
Back Close
Full Screen / Esc
Print Version
Interactive Discussion
c© EGU 2003
3.2. Elemental size distributions
As already mentioned in previous paragraphs Al, Si, K, Ca, Ti, Mn, Fe, Sr, S, Cl, Ni, V,Cu, Cr, Zn, and Pb were determined in the BLPI samples using PIXE. In addition a newset of polycarbonate foils with low blank of Br was used during the winter campaign thatallowed Br to be determined. Typically samples collected on stages 1–6 (i.e. with par-5
ticles < 1µm in diameter) were black indicating the presence of soot from combustion.The samples with coarse particles were beige in colour corresponding to mineral dust.Principally three types of elemental size distribution were observed. A monomodal dis-tribution with particle size > 1µm and mode centered at about 4µm was typical for Al,Si, Ca, Ti, Mn, Fe, and Sr. Also Cl exhibited a monomodal distribution with particle size10
> 1µm and mode around 5µm. S, Br, K, V, and Ni exhibited bimodal distributions withmodes around 0.3 and 3µm and minimum at about 1µm. Cu, Cr, Zn, and Pb showedrather flat multimodal distributions centered at approximately 1µm. The raw elementalsize data were inverted into smooth elemental size distributions by the MICRON codeand the inverted distributions were integrated to obtain PM1 and PM10 elemental con-15
centrations. Geometric mean mass and elemental concentrations in PM1 and PM10fractions of atmospheric aerosols collected at Finokalia during the summer and wintercampaigns are compared in Table 1. As can be seen the winter values are consider-ably lower except for Cl. Further, Table 2 shows comparison of mass and elementalconcentrations in PM1 and PM10 aerosols collected during corresponding days at Fi-20
nokalia and aboard the “AEGAIEO” vessel. Both mass and elemental concentrationsfound at Finokalia and aboard the vessel are comparable with the exception of Cl, V,and Ni.
In addition the PM10 mass and elemental concentrations, determined from 21 sum-mer samples collected at Finokalia were used in principal component analysis (Varimax25
rotated factor analysis) to identify possible sources of individual elements. The resultsare given in Table 3. The first factor contains the group of crustal elements Ca, Al,Fe, Mn, K, Ca, Ti, Cr and Sr and explains 39% of the total system variance. The sec-
2556

ACPD3, 2547–2573, 2003
Size resolved massconcentration and
elementalcomposition
J. Smolik et al.
Title Page
Abstract Introduction
Conclusions References
Tables Figures
J I
J I
Back Close
Full Screen / Esc
Print Version
Interactive Discussion
c© EGU 2003
ond factor, mainly associated with Cl, represents the marine factor and explains 19%of the variance. Thus cumulative variance from crustal and marine influence explainup to 60% of the variability indicating greater influence of natural sources comparedto anthropogenic ones in the region. The third factor includes Pb, S, Cu and Zn andis attributed to pure anthropogenic sources. Finally the last factor contains V and Ni5
having mixed origin from both anthropogenic and crustal sources. As can be seen theresults of factor analysis agree fairly well with the individual elemental size distributions.Coarse modes observed for crustal elements and chlorine correspond to mineral dustand sea-salt particles produced by bursting of bubbles. The size distribution of sulphur,where the accumulation mode dominates, shows that particulate sulphur is mainly a10
product of gas-to-particle conversion (Finlayson-Pitts and Pitts, 2000). Bimodal dis-tributions for K, Ni, and V indicate that these elements are both anthropogenic andnatural in origin. Potassium in submicrometer particles results from biomass burning,nickel and vanadium come from oil combustion. Rather broad distributions of Cu, Cr,Zn and Pb with not too well-defined peaks indicate more sources and an aged aerosol.15
The next figures show the temporal variation of PM1 and PM10 for several elementscharacteristic for individual groups of elements as found from factor analysis and alsofor different types of the above mentioned elemental size distributions. Figure 3a showsthe time series of PM1 and PM10 for Si as a typical crustal element. As can be seenPIXE revealed another peak in concentration of Si on 12 July 2000. According to back-20
ward trajectories and Meteosat pictures this increase was caused by Saharan dust.Figure 3b shows the temporal variation of another crustal element potassium, whichexhibited a bimodal distribution. Here the higher concentrations correspond both toSaharan dust, where the potassium is present in illite (e.g. Ganor et al., 1991; Moli-naroli, 1996), and to forest fires. This follows from satellite pictures showing forest fires25
in Greece and surrounding areas that occurred at the beginning of summer campaign,and from higher concentrations of potassium in the PM1 fraction found in the corre-sponding samples. The latter is typical for wood combustion (e. g. Valmari et al., 1998)and biomass burning (e. g. Jaffrezo et al., 1998). Figure 3c shows the temporal varia-
2557

ACPD3, 2547–2573, 2003
Size resolved massconcentration and
elementalcomposition
J. Smolik et al.
Title Page
Abstract Introduction
Conclusions References
Tables Figures
J I
J I
Back Close
Full Screen / Esc
Print Version
Interactive Discussion
c© EGU 2003
tion of chlorine. For chlorine we have not observed any specific dependence on the airmass trajectories, but rather on the velocity of air mass transport. Higher chlorine con-centrations were observed for air masses which originated over the Atlantic Ocean andwere transported with a higher velocity across Europe (10, 13–17 July 2000, 9 and 10January 2001) or originated above the western coast of the Black Sea (20 and 21 July5
2000). Low chlorine concentrations were found for calm days. The origin of chlorine inatmospheric aerosol is mainly sea-salt particles produced by bursting of air bubbles atthe ocean surface. The number of sea-salt particles depends approximately exponen-tially on the wind speed (Lovett, 1978; Monahan et al. 1986; Smith et al. 1993). Thisshows the exponential dependence of marine elements concentrations on the local10
wind speed observed in the Mediterranean area (e.g. Bergametti et al., 1989a; Chabasand Lefevre, 2000). Since, we have not found any correlation with the local wind speedthe observed chlorine concentrations depend on distant marine source strength andlong range transport to Crete, and that both should be also related to the wind speed.Figure 3d shows the behaviour of sulphur. As can be seen sulphur was predominantly15
found in submicron particles. Concentrations of sulphur determined in the PM1 andPM10 fractions by PIXE were well correlated with the concentrations determined in thesoluble fraction by ion chromatography (Bardouki et al., 2002) with a slope of unity. Itshows that sulphur was present as sulphate. Lower concentrations were observed forair masses which originated over the Ligurian Sea and the Mediterranean Sea to the20
west of Crete. Higher concentrations were observed for air masses arriving from thewest coast of the Black Sea or from the west Europe but recirculated later above thewest coast of the Black Sea and arriving from the North. Figure 3d also shows the sea-sonal variation in sulphur, with higher concentrations being observed in the summer.This is in agreement with other results from this region (Tsitouridou and Samara, 1993;25
Luria et al., 1996; Mihalopoulos et al., 1997; Danalatos and Glavas, 1999). Higher sul-phate concentrations in the summer may be caused by higher phytoplanktonic activityproducing gaseous dimethylsulphide that is later oxidised to methanesulphonic acidand sulphur dioxide (Finlayson-Pitts and Pitts, 2000) and larger conversion rates due
2558

ACPD3, 2547–2573, 2003
Size resolved massconcentration and
elementalcomposition
J. Smolik et al.
Title Page
Abstract Introduction
Conclusions References
Tables Figures
J I
J I
Back Close
Full Screen / Esc
Print Version
Interactive Discussion
c© EGU 2003
to higher concentrations of oxidising species (Danalatos and Glavas, 1999).As found earlier at Finokalia, the biogenic sulphur can account for 0.6 to 28.3% of the
total non-sea sulphate concentrations (Mihalopoulos et al., 1997) with higher valuesobserved during the summer. Also the long range transport of sulphates may havegreater influence in summer due to rare precipitation events in the region during this5
period (Luria et al., 1996). In our case the non-sea sulphate concentrations followedthe 222Rn variation and this indicates air of continental origin (Bardouki et al., 2002).This can be supported by the similar behaviour of time series found for sulphur andanthropogenic elements Cu, Pb, and Zn. The temporal variation of vanadium is shownin Fig. 3e. As found from factor analysis vanadium should have mixed origin, it is10
produced by the fuel oil combustion, but it is also by crustal elements (Finlayson-Pittsand Pitts, 2000). As a result vanadium is found both in submicron and coarse particles.The effect of the oil combustion is clearly seen from the high concentration of vanadiumfound aboard the boat, coming from oil driven engines of both the “AEGAIEO” and othervessels cruising in the area. Also vanadium in Saharan dust increased its concentration15
towards the end of the summer campaign (Schutz and Rahn, 1982; Bonelli et al., 1996).It follows that the atmospheric input of trace elements into the central and eastern
Mediterranean is a complex phenomenon that depends on the transport of pollutantsfrom their sources. This includes air mass movement, strength and spatial distribu-tion of sources, precipitation scavenging by distant and local rain events, and for some20
elements such as halogens even on chemical reactions. Thus, it is very difficult to gen-eralize and continuing long-term measurements of size- and time resolved chemicalcomposition of atmospheric particles is needed.
4. Conclusions
Size resolved aerosol samples were collected at Finokalia, a coastal site in Crete and25
aboard the research vessel “AEGAIO” cruising the Aegean Sea during two periods inJuly 2000 and January 2001. Gravimetric analysis of samples yielded PM1 and PM10
2559

ACPD3, 2547–2573, 2003
Size resolved massconcentration and
elementalcomposition
J. Smolik et al.
Title Page
Abstract Introduction
Conclusions References
Tables Figures
J I
J I
Back Close
Full Screen / Esc
Print Version
Interactive Discussion
c© EGU 2003
temporal variations. The elemental composition of samples was determined by PIXE.The time series for PM1 and PM10 showed both daily and seasonal variation. Thedaily variation was caused mainly by air masses arriving at Crete from different direc-tions including two incursions of Saharan dust. The seasonal variation was probablycaused by precipitation scavenging, which is more frequent in winter. The elemental5
analysis showed practically monomodal distributions for crustal elements, chlorine, andsulphur. Sulphur has most of its mass in the submicron size range, crustal elementsand chlorine in the supermicron fractions. Three elements K, V, and Ni, which haveboth anthropogenic and crustal origin, exhibited bimodal distributions. Higher concen-trations of potassium in submicron particles corresponded to forest fires, and vanadium10
and nickel to the oil combustion. High concentrations of vanadium and nickel in submi-cron particles, produced probably by oil driven engines of both “AEGAION” and othervessels, was found in samples collected aboard the boat. Anthropogenic elements Cr,Cu, Pb, and Zn exhibited broad and not too well-defined distributions. Higher concen-trations of these elements were found for air masses originating from the west coast15
of the Black Sea and advected across northern Greece and western Turkey. The timeseries for Cu, Pb, and Zn, resemble behaviour of sulphur that indicates a similar source.
Acknowledgement. The authors gratefully acknowledge the help of G. Kouvarakis in factoranalysis. This work was supported by the European Commission under grant ENVK2-1999-00052.20
References
Bardouki, H., Liakakou, H., Economou, C., Sciare, J., Smolik, J., Zdimal, V., Eleftheriadis ,K.,Lazaridis, M., and Mihalopoulos, N.: Chemical composition of size resolved atmosphericaerosols in the eastern Mediterranean during summer and winter, Atmospheric Environment,37, 195–208, 2003.25
Bergametti, G., Dutot, A.-L., Buat-Menard, P., Losno, R., and Remoudaki, E.: Seasonal vari-ability of the elemental composition of atmospheric aerosol particles over the northwesternMediterranean, Tellus, 41B, 353–361, 1989a.
2560

ACPD3, 2547–2573, 2003
Size resolved massconcentration and
elementalcomposition
J. Smolik et al.
Title Page
Abstract Introduction
Conclusions References
Tables Figures
J I
J I
Back Close
Full Screen / Esc
Print Version
Interactive Discussion
c© EGU 2003
Bergametti, G., Gomes, L., Remoudaki, E., Desbois, M., Martin, D., and Buat-Menard, P.:Present transport and deposition patterns of African dust to the North-Western Mediter-ranean, in: Paleoclimatology and Paleometeorology: Modern and Past Patterns of GlobalAtmospheric Transport (Leinen, M. and Sarthein, M., eds.), Kluwer Academic Publishers,Dordrecht, 227–252, 1989b.5
Bonelli, P., Braga Marcazzan, G. M., and Cereda, E.: Elemental composition and air trajecto-ries of African dust transported in northern Italy, in The Iimpact of Desert Dust Across theMediterranean (Guerzoni, S. and Chester, R., eds.), Kluwer Academic Publishers, Dordrecht,275–283, 1996.
Chabas, A. and Lefevre, R. A.: Chemistry and microscopy of atmospheric particulates at Delos10
(Cyclades-Greece), Atmospheric Environment, 34, 225–238, 2000.Chester, R., Nimmo, M, Alarcon, M., Saydam, C., Murphy, K. J. T., Sanders, S. G., and Cor-
coran, P.: Defining the chemical character of aerosols from the atmosphere of the Mediter-ranean Sea and surrounding regions, Oceanologica Acta, 16, 231–246, 1993.
Danalatos, D. and Glavas, S.: Gas phase nitric acid, ammonia and related particulate matter15
at a Mediterranean coastal site, Patras, Greece, Atmospheric Environment, 33, 3417–3425,1999.
Dulac, F., Buat-Menard, P., Arnold, M., Ezat, U., and Martin, D.: Atmospheric input of tracemetals to the western Mediterranean Sea: 1. Factors controlling the variability of atmosphericconcentrations, J. Geophys. Res., 92, 8437–8453, 1987.20
Dulac, F., Buat-Menard, P., Ezat, U., and Melki, S.: Atmospheric input of trace metals to thewestern Mediterranean: uncertainties in modelling dry deposition from cascade impactordata, Tellus 41B, 362–378, 1989.
Erduran, M. S. and Tuncel, S. G.: Gaseous and particulate air pollutants in the northeasternMediterranean Coast, Sci. Total Environ., 281, 205–215, 2001.25
Finlayson-Pitts, B. J. and Pitts, J. N., Jr.: Chemistry of the Upper and Lower Atmosphere,Theory, Experiments, and Applications, Academic Press, San Diego, 2000.
Ganor, E., Foner, H. A., Brenner, S., Neeman, E., and Lavi, N.: The chemical composition ofaerosols settling in Israel following dust storms, Atmospheric Environment, 25A, 2665–2670,1991.30
Guerzoni, S., Correggiari, I., and Miserocchi, S.: Wind-blown particles from ships and land-based stations in the Mediterranean See: A review of trace metal sources, Water Poll. Res.Rep., 20, 377–386, 1990.
2561

ACPD3, 2547–2573, 2003
Size resolved massconcentration and
elementalcomposition
J. Smolik et al.
Title Page
Abstract Introduction
Conclusions References
Tables Figures
J I
J I
Back Close
Full Screen / Esc
Print Version
Interactive Discussion
c© EGU 2003
Gullu, G., Olmez, I., and Tuncel, G.: Temporal variability of atmospheric trace element con-centrations over the eastern Mediterranean Sea, Spectrochimica Acta B, 55, 1135–1150,2000.
Hacisalihoglu, G., Balkas, T. I., Tuncel, S. G., Herman, D. H., Olmez, I., and Tuncel, G.: Traceelement composition of the Black Sea aerosols, Deep-Sea Res., 38, S1255–S1266, 1991.5
Hacisalihoglu, G., Eliyakut, F., Olmez, I., Balkas, T. I., and Tuncel, G.: Chemical composition ofparticles in the Black Sea atmosphere, Atmospheric Environment, 26A, 3207–3218, 1992.
Havranek, V., Kucera, J., Horakova, J., Vosecek, V., Smolik, J., Schwarz, J., and Sykorova, I.:Matrix effects in PIXE analysis of aerosols and ashes, Biological Trace Elements Research,71–72, 431–442, 1999.10
Hillamo, R. E. and Kauppinen, E. I.: On the performance of the Berner low pressure impactor,Aerosol Sci. Technol., 14, 33–47, 1991.
Hillamo, R. E., Makela, T., Schwarz, J., and Smolik, J.: Collection characteristics of the model25/0, 018/2 Berner low pressure impactor, J. Aerosol Sci., 30, S1, 901–902, 1999.
Jaffrezo, J. L., Davidson, C. I., Kuhns, H. D., Bergin, M. H., Hillamo, R., Maenhaut, W., Kahl, J.15
W., and Harris, J. M.: Biomass burning signatures in the atmosphere of central Greenland,J. Geophys. Res., 103, 31 067–31 078. 1998.
Kubilay, N., Yemenicioglu, S., and Saydam, C.: Trace metal characterization of airborne parti-cles from the northeastern Mediterranean, Fresenius Envir. Bull., 3, 444–448, 1994.
Kubilay, N., Yemenicioglu, S., and Saydam, C.: Airborne material collections and their chemical20
composition over the Black Sea, Marine Pollution Bull., 30, 475–483, 1995.Lovett, R. F.: Quantitative measurements of airborne sea-salt in the north Atlantic, Tellus, 30,
358–363, 1978.Luria, M., Peleg, M., Sharf, G., Tov-Alper, D. S., Spitz, N., Ben Ami, Y., Gawii, Z., Lifschitz,
B., Yitzchaki, A., and Seter, I.: Atmospheric sulfur over the east Mediterranean region, J.25
Geophys. Res., 101, 25 917–25 930, 1996.Maenhaut, W., Ptasinski, J., and Cafmeyer, J.: Detailed mass size distributions of atmospheric
aerosol species in the Negev desert, Israel, during ARACHNE-96, Nucl. Instrum. Meth. B,150, 422–427, 1999.
Mamane, Y., Ganor, E., and Donagi, A. E.: Aerosol composition of urban and desert origin in30
the Eastern Mediterranean, I. Individual particle analysis, Water Air Soil Pollut., 14, 29–43,1980.
Migon, C., Morelli, J., Nicolas, E., and Copin-Montegut, G.: Evolution of total atmospheric
2562

ACPD3, 2547–2573, 2003
Size resolved massconcentration and
elementalcomposition
J. Smolik et al.
Title Page
Abstract Introduction
Conclusions References
Tables Figures
J I
J I
Back Close
Full Screen / Esc
Print Version
Interactive Discussion
c© EGU 2003
deposition of Pb, Cd, Cu and Zn to the Ligurian Sea, Sci. Total Environ., 105, 135–148,1991.
Migon, C., Alleman, L., Leblond, N., and Nicolas, E.: Evolution of atmospheric lead overthe northwestern Mediterranean between 1986 and 1992, Atmospheric Environment, 27A,2161–2167, 1993.5
Mihalopoulos, N., Stephanou, E., Kanakidou, M., Pilitsidis, S., and Bosquet, P.: Troposphericaerosol ionic composition in the Eastern Mediterranean region, Tellus, 49B, 314–326, 1997.
Molinaroli, E.: Mineralogical characterisation of Saharan dust with a view of its final destinationin Mediterranean sediments, In The Impact of Desert Dust Across the Mediterranean (Guer-zoni, S. and Chester, R., eds,), Kluwer Academic Publishers, Dordrecht, 153–162, 1996.10
Monahan, E. C., Spiel, D., and Spiel, K.: Oceanic whitecaps, Reidel, 1986.Moulin, C., Lambert, C. E., Dayan, U., Masson, V., Ramonet, M., Bousquet, P., Legrand, M.,
Balkanski, Y. J., Guelle, W., Marticorena, B., Bergametti, G., and Dulac, F.: Satellite clima-tology of African dust transport in the Mediterranean atmosphere, J. Geophys. Res., 103,13 137–13 144, 1998.15
Sandroni, V. and Migon, C.: Significance of trace metal medium-range transport in the westernMediterranean, Sci. Total Environ., 196, 83–89, 1997.
Schutz, L. and Rahn, K. A.: Trace-element concentrations in erodible soil, Atmospheric Envi-ronment, 16, 171–176, 1982.
Smith, M. H., Park, P. M., and Consterdine, I. E.: Marine aerosol concentration and estimated20
fluxes over seas, Q. J. R. Meteorol. Soc., 809–824, 1993.Tsitouridou, R. and Samara, C.: First results of acidic and alkaline constituents determination
in air particulates of Thessaloniki, Greece, Atmospheric Environment, 27B, 313–319, 1993.Valmari, T., Kaupinnen, E. I., Kurkela, J., Jokiniemi, J. K., Sfiris, G., and Revitzer, H.: Fly
ash formation and deposition during fludized bed combustion of willow, J. Aerosol Sci., 29,25
445–459, 1998.Wolfenbarger, J. K. and Seinfeld, J.K.: Inversion of aerosol size distribution data, J. Aerosol
Sci., 21, 227–247, 1990.World Meteorological Organization: Atmospheric transport of contaminants into the Mediter-
ranean region, GESAMP Report and Studies, 26, 53, 1985.30
Yatin, M., Tuncel, S., Aras, N. K., Olmez, I., Aygun, S., and Tuncel, G.: Atmospheric traceelements in Ankara, Turkey: 1. factors affecting chemical composition of fine particles, At-mospheric Environment 23, 1305–1318, 2000.
2563

ACPD3, 2547–2573, 2003
Size resolved massconcentration and
elementalcomposition
J. Smolik et al.
Title Page
Abstract Introduction
Conclusions References
Tables Figures
J I
J I
Back Close
Full Screen / Esc
Print Version
Interactive Discussion
c© EGU 2003
Table 1. Geometric mean mass (µg/m3) and elemental (ng/m3) concentrations in PM1 andPM10 fractions of atmospheric aerosol collected at Finokalia during the summer (10–31 July2000) and winter (7–14 January 2001) campaigns
PM1 PM10Summer Winter Summer Winter
Mass 11 4 32 14Al 44 27 251 99Si 130 69 1106 257S 1837 575 2167 740Cl 0 6 724 825K 81 78 269 138
Ca 21 7 549 153Ti 2 0 22 2V 4 2 6 3Cr 0 0 1 0Mn 1 0 6 1Fe 19 5 246 34Ni 1 1 2 2Cu 0 0 2 1Zn 6 2 10 3Sr 0 0 2 1Pb 8 3 12 6Br nd 3 nd 5
2564

ACPD3, 2547–2573, 2003
Size resolved massconcentration and
elementalcomposition
J. Smolik et al.
Title Page
Abstract Introduction
Conclusions References
Tables Figures
J I
J I
Back Close
Full Screen / Esc
Print Version
Interactive Discussion
c© EGU 2003
Table 2. Geometric mean mass (µg/m3) and elemental (ng/m3) concentrations in PM1 andPM10 fractions of atmospheric aerosol collected at Finokalia station and aboard the researchvessel “AEGAIEO” during 25–29 July 2000
PM1 PM10Finokalia Vessel Finokalia Vessel
Mass 17 20 46 53Al 39 35 496 426Si 294 167 2866 2838S 2705 2703 2913 3043Cl 0 0 155 417K 109 87 455 468
Ca 62 25 1093 896Ti 9 6 79 87V 7 13 11 18Cr 1 1 1 1Mn 2 2 16 16Fe 80 51 800 828Ni 2 6 3 7Cu 1 1 2 2Zn 9 10 15 20Sr 0 0 5 4Pb 10 13 16 20Br nd nd nd nd
2565

ACPD3, 2547–2573, 2003
Size resolved massconcentration and
elementalcomposition
J. Smolik et al.
Title Page
Abstract Introduction
Conclusions References
Tables Figures
J I
J I
Back Close
Full Screen / Esc
Print Version
Interactive Discussion
c© EGU 2003
Table 3. Factor loadings of concentrations of elements in PM10 particulate matter
Factor isolated Factor 1 Factor 2 Factor 3 Factor 4
Mass 0.799 0.038 0.392 0.309Sr 0.961 0.110 0.010 0.135Si 0.959 −0.133 0.183 0.125Al 0.953 −0.082 0.087 −0.024Fe 0.953 −0.147 0.160 0.176Ti 0.953 −0.140 0.133 0.205K 0.928 0.068 0.287 0.037
Mn 0.927 −0.175 0.234 0.183Ca 0.926 0.023 0.259 0.080Cr 0.730 0.019 0.285 0.117V 0.670 −0.139 0.342 0.603Ni 0.544 −0.093 0.265 0.755Cl −0.237 0.812 −0.343 −0.137Pb 0.133 −0.103 0.925 0.017Cu 0.355 0.125 0.880 −0.060S 0.284 −0.207 0.841 0.164Zn 0.190 −0.265 0.791 0.234
Eigenvalues 9.87 4.63 5.16 2.01Fractional 0.39 0.19 0.21 0.08variance
2566
ACPD3, 2547–2573, 2003
Size resolved massconcentration and
elementalcomposition
J. Smolik et al.
Title Page
Abstract Introduction
Conclusions References
Tables Figures
J I
J I
Back Close
Full Screen / Esc
Print Version
Interactive Discussion
c© EGU 2003
25
Figure 1
-10
10
30
50
70
0.01 0.1 1 10 100
Dae [µm]
dm/d
log(
Dae
) [
g/m
3 ]MICRON inversionBLPI ICPF BLPI DemokritosMICRON inversion
Fig. 1. Intercomparison of two BLPI cascade impactors. The raw mass size data were invertedinto smooth mass size distributions by the MICRON code.
2567

ACPD3, 2547–2573, 2003
Size resolved massconcentration and
elementalcomposition
J. Smolik et al.
Title Page
Abstract Introduction
Conclusions References
Tables Figures
J I
J I
Back Close
Full Screen / Esc
Print Version
Interactive Discussion
c© EGU 2003
26
0
10
20
30
40
50
60
70
8010
Jul
00
12 J
ul 0
0
14 J
ul 0
0
16 J
ul 0
0
18 J
ul 0
0
20 J
ul 0
0
22 J
ul 0
0
24 J
ul 0
0
26 J
ul 0
0
28 J
ul 0
0
30 J
ul 0
0
7 Ja
n 01
9 Ja
n 01
11 J
an 0
1
13 J
an 0
1
Sampling date
Mas
s co
nc. [
µg/m
3 ]
PM1 - darkPM10 - light
VESSEL
Figure 2
Fig. 2. Daily PM1 and PM10 mass concentrations at Finokalia and aboard the research vessel“AEGAIEO”.
2568

ACPD3, 2547–2573, 2003
Size resolved massconcentration and
elementalcomposition
J. Smolik et al.
Title Page
Abstract Introduction
Conclusions References
Tables Figures
J I
J I
Back Close
Full Screen / Esc
Print Version
Interactive Discussion
c© EGU 2003
27
Si
0
1000
2000
3000
4000
5000
6000
7000
8000
10 J
ul 0
0
12 J
ul 0
0
14 J
ul 0
0
16 J
ul 0
0
18 J
ul 0
0
20 J
ul 0
0
22 J
ul 0
0
24 J
ul 0
0
26 J
ul 0
0
28 J
ul 0
0
30 J
ul 0
0
7 Ja
n 01
9 Ja
n 01
11 J
an 0
1
13 J
an 0
1
Sampling date
Mas
s co
nc. [
ng/m
3 ]
PM1 - darkPM10 - light
VESSEL
Figure 3a
Fig. 3. (a) Daily concentrations of (a) Si, (b) K, (c) Cl, (d) S, and (e) V in PM1 and PM10 atFinokalia and aboard of the research vessel “AEGAIEO”.
2569

ACPD3, 2547–2573, 2003
Size resolved massconcentration and
elementalcomposition
J. Smolik et al.
Title Page
Abstract Introduction
Conclusions References
Tables Figures
J I
J I
Back Close
Full Screen / Esc
Print Version
Interactive Discussion
c© EGU 2003
28
K
0100200300400500600700800900
1000
10 J
ul 0
0
12 J
ul 0
0
14 J
ul 0
0
16 J
ul 0
0
18 J
ul 0
0
20 J
ul 0
0
22 J
ul 0
0
24 J
ul 0
0
26 J
ul 0
0
28 J
ul 0
0
30 J
ul 0
0
7 Ja
n 01
9 Ja
n 01
11 J
an 0
1
13 J
an 0
1
Sampling date
Mas
s co
nc. [
ng/m
3 ]
PM1 - darkPM10 - light
VESSEL
Figure 3b
Fig. 3. (b) Continued.
2570

ACPD3, 2547–2573, 2003
Size resolved massconcentration and
elementalcomposition
J. Smolik et al.
Title Page
Abstract Introduction
Conclusions References
Tables Figures
J I
J I
Back Close
Full Screen / Esc
Print Version
Interactive Discussion
c© EGU 2003
29
Cl
0
500
1000
1500
2000
2500
3000
3500
4000
10 J
ul 0
0
12 J
ul 0
0
14 J
ul 0
0
16 J
ul 0
0
18 J
ul 0
0
20 J
ul 0
0
22 J
ul 0
0
24 J
ul 0
0
26 J
ul 0
0
28 J
ul 0
0
30 J
ul 0
0
7 Ja
n 01
9 Ja
n 01
11 J
an 0
1
13 J
an 0
1
Sampling date
Mas
s co
nc. [
ng/m
3 ]
PM1 - darkPM10 - light
VESSEL
Figure 3c
Fig. 3. (c) Continued.
2571

ACPD3, 2547–2573, 2003
Size resolved massconcentration and
elementalcomposition
J. Smolik et al.
Title Page
Abstract Introduction
Conclusions References
Tables Figures
J I
J I
Back Close
Full Screen / Esc
Print Version
Interactive Discussion
c© EGU 2003
30
S
0
500
1000
1500
2000
2500
3000
3500
4000
10 J
ul 0
0
12 J
ul 0
0
14 J
ul 0
0
16 J
ul 0
0
18 J
ul 0
0
20 J
ul 0
0
22 J
ul 0
0
24 J
ul 0
0
26 J
ul 0
0
28 J
ul 0
0
30 J
ul 0
0
7 Ja
n 01
9 Ja
n 01
11 J
an 0
1
13 J
an 0
1
Sampling date
Mas
s co
nc. [
ng/m
3 ]
PM1 - darkPM10 - light
VESSEL
Figure 3d
Fig. 3. (d) Continued.
2572

ACPD3, 2547–2573, 2003
Size resolved massconcentration and
elementalcomposition
J. Smolik et al.
Title Page
Abstract Introduction
Conclusions References
Tables Figures
J I
J I
Back Close
Full Screen / Esc
Print Version
Interactive Discussion
c© EGU 2003
31
V
0
5
10
15
20
25
30
10 J
ul 0
0
12 J
ul 0
0
14 J
ul 0
0
16 J
ul 0
0
18 J
ul 0
0
20 J
ul 0
0
22 J
ul 0
0
24 J
ul 0
0
26 J
ul 0
0
28 J
ul 0
0
30 J
ul 0
0
7 Ja
n 01
9 Ja
n 01
11 J
an 0
1
13 J
an 0
1
Sampling date
Mas
s co
nc. [
ng/m
3 ]
PM1 - darkPM10 - light
VESSEL
Figure 3e
Fig. 3. (e) Continued.
2573
Copyright © 2022 FDOKUMEN