Carbonaceous Aerosols and Radiative Effects Study R. A. ...
102
ACPD 12, 1299–1400, 2012 Carbonaceous Aerosols and Radiative Effects Study R. A. Zaveri et al. Title Page Abstract Introduction Conclusions References Tables Figures Back Close Full Screen / Esc Printer-friendly Version Interactive Discussion Discussion Paper | Discussion Paper | Discussion Paper | Discussion Paper | Atmos. Chem. Phys. Discuss., 12, 1299–1400, 2012 www.atmos-chem-phys-discuss.net/12/1299/2012/ doi:10.5194/acpd-12-1299-2012 © Author(s) 2012. CC Attribution 3.0 License. Atmospheric Chemistry and Physics Discussions This discussion paper is/has been under review for the journal Atmospheric Chemistry and Physics (ACP). Please refer to the corresponding final paper in ACP if available. Overview of the 2010 Carbonaceous Aerosols and Radiative Effects Study (CARES) R. A. Zaveri 1 , W. J. Shaw 1 , D. J. Cziczo 2 , B. Schmid 1 , R. A. Ferrare 3 , M. L. Alexander 4 , M. Alexandrov 5 , R. J. Alvarez 6 , W. P. Arnott 7 , D. B. Atkinson 8 , S. Baidar 9 , R. M. Banta 6 , J. C. Barnard 1 , J. Beranek 1 , L. K. Berg 1 , F. Brechtel 10 , W. A. Brewer 6 , J. F. Cahill 11 , B. Cairns 12 , C. D. Cappa 13 , D. Chand 1 , S. China 14 , J. M. Comstock 1 , M. K. Dubey 15 , R. C. Easter 1 , M. H. Erickson 16 , J. D. Fast 1 , C. Floerchinger 17 , B. A. Flowers 15 , E. Fortner 18 , J. S. Gaffney 19 , M. K. Gilles 20 , K. Gorkowski 14 , W. I. Gustafson 1 , M. Gyawali 7 , J. Hair 3 , R. M. Hardesty 6 , J. W. Har- worth 8 , S. Herndon 18 , N. Hiranuma 1 , C. Hostetler 3 , J. M. Hubbe 1 , J. T. Jayne 18 , H. Jeong 21 , B. T. Jobson 16 , E. I. Kassianov 1 , L. I. Kleinman 22 , C. Kluzek 1 , B. Knighton 17 ,K. R. Kolesar 13 , C. Kuang 22 , A. Kub ´ atov ´ a 21 , A. O. Langford 6 , A. Laskin 4 , N. Laulainen 1 , R. D. Marchbanks 6 , C. Mazzoleni 14 , F. Mei 22 , R. C. Moffet 23 , D. Nelson 1 , M. D. Obland 3 , H. Oetjen 9 , T. B. Onasch 18 , I. Ortega 9 , M. Ottaviani 24 , M. Pekour 1 , K. A. Prather 11 , J. G. Radney 8 , R. R. Rogers 3 , S. P. Sandberg 6 , A. Sedlacek 22 , C. J. Senff 6 , G. Senum 22 , A. Setyan 25 , J. E. Shilling 1 , M. Shrivastava 1 , C. Song 1 , S. R. Springston 22 , 1299
-
Upload
khangminh22 -
Category
Documents
-
view
0 -
download
0
Transcript of Carbonaceous Aerosols and Radiative Effects Study R. A. ...

ACPD12, 1299–1400, 2012
CarbonaceousAerosols and
Radiative EffectsStudy
R. A. Zaveri et al.
Title Page
Abstract Introduction
Conclusions References
Tables Figures
J I
J I
Back Close
Full Screen / Esc
Printer-friendly Version
Interactive Discussion
Discussion
Paper
|D
iscussionP
aper|
Discussion
Paper
|D
iscussionP
aper|
Atmos. Chem. Phys. Discuss., 12, 1299–1400, 2012www.atmos-chem-phys-discuss.net/12/1299/2012/doi:10.5194/acpd-12-1299-2012© Author(s) 2012. CC Attribution 3.0 License.
AtmosphericChemistry
and PhysicsDiscussions
This discussion paper is/has been under review for the journal Atmospheric Chemistryand Physics (ACP). Please refer to the corresponding final paper in ACP if available.
Overview of the 2010 CarbonaceousAerosols and Radiative Effects Study(CARES)R. A. Zaveri1, W. J. Shaw1, D. J. Cziczo2, B. Schmid1, R. A. Ferrare3,M. L. Alexander4, M. Alexandrov5, R. J. Alvarez6, W. P. Arnott7, D. B. Atkinson8,S. Baidar9, R. M. Banta6, J. C. Barnard1, J. Beranek1, L. K. Berg1, F. Brechtel10,W. A. Brewer6, J. F. Cahill11, B. Cairns12, C. D. Cappa13, D. Chand1, S. China14,J. M. Comstock1, M. K. Dubey15, R. C. Easter1, M. H. Erickson16, J. D. Fast1,C. Floerchinger17, B. A. Flowers15, E. Fortner18, J. S. Gaffney19, M. K. Gilles20,K. Gorkowski14, W. I. Gustafson1, M. Gyawali7, J. Hair3, R. M. Hardesty6, J. W. Har-worth8, S. Herndon18, N. Hiranuma1, C. Hostetler3, J. M. Hubbe1, J. T. Jayne18,H. Jeong21, B. T. Jobson16, E. I. Kassianov1, L. I. Kleinman22, C. Kluzek1,B. Knighton17,K. R. Kolesar13, C. Kuang22, A. Kubatova21, A. O. Langford6,A. Laskin4, N. Laulainen1, R. D. Marchbanks6, C. Mazzoleni14, F. Mei22,R. C. Moffet23, D. Nelson1, M. D. Obland3, H. Oetjen9, T. B. Onasch18,I. Ortega9, M. Ottaviani24, M. Pekour1, K. A. Prather11, J. G. Radney8,R. R. Rogers3, S. P. Sandberg6, A. Sedlacek22, C. J. Senff6, G. Senum22,A. Setyan25, J. E. Shilling1, M. Shrivastava1, C. Song1, S. R. Springston22,
1299

ACPD12, 1299–1400, 2012
CarbonaceousAerosols and
Radiative EffectsStudy
R. A. Zaveri et al.
Title Page
Abstract Introduction
Conclusions References
Tables Figures
J I
J I
Back Close
Full Screen / Esc
Printer-friendly Version
Interactive Discussion
Discussion
Paper
|D
iscussionP
aper|
Discussion
Paper
|D
iscussionP
aper|
R. Subramanian26, K. Suski11, J. Tomlinson1, R. Volkamer9, H. W. Wallace16,J. Wang22, A. M. Weickmann6, D. R. Worsnop18, X.-Y. Yu1, A. Zelenyuk27,Q. Zhang25
1Atmospheric Sciences & Global Change Division, Pacific Northwest National Laboratory,Richland, WA, USA2Massachusetts Institute of Technology, Cambridge, MA, USA3NASA Langley Research Center, Hampton, VA, USA4Environmental Molecular Sciences Laboratory, Pacific Northwest National Laboratory,Richland, WA, USA5Department of Applied Physics and Applied Mathematics, Columbia University, New York, NY,USA6Chemical Sciences Division, NOAA Earth System Research Laboratory, Boulder, CO, USA7University of Nevada, Reno, NV, USA8Portland State University, Portland, OR, USA9Department of Chemistry and Biochemistry, University of Colorado at Boulder, CO, USA10Brechtel Manufacturing, Inc, Hayward, CA, USA11University of California, San Diego, CA, USA12NASA Goddard Institute for Space Studies, New York, NY, USA13Department of Civil and Environmental Engineering, University of California, Davis, CA, USA14Atmospheric Science Program, Michigan Technological University, Houghton, MI, USA15Los Alamos National Laboratory, Los Alamos, NM, USA16Washington State University, Pullman, WA, USA17Montana State University, Bozeman, MT, USA18Aerodyne Research, Inc., Billerica, MA, USA19University of Arkansas, Little Rock, AR, USA20Lawrence Berkeley National Laboratory, Berkeley, CA, USA21University of North Dakota, ND, USA
1300

ACPD12, 1299–1400, 2012
CarbonaceousAerosols and
Radiative EffectsStudy
R. A. Zaveri et al.
Title Page
Abstract Introduction
Conclusions References
Tables Figures
J I
J I
Back Close
Full Screen / Esc
Printer-friendly Version
Interactive Discussion
Discussion
Paper
|D
iscussionP
aper|
Discussion
Paper
|D
iscussionP
aper|
22Brookhaven National Laboratory, Upton, NY, USA23University of the Pacific, Stockton, CA, USA24NASA Postdoctoral Program Fellow, NASA Goddard Institute for Space Studies, New York,NY, USA25Department of Environmental Toxicology, University of California, Davis, CA, USA26Droplet Measurements Technologies, Boulder, CO, USA27Chemical and Materials Sciences Division, Pacific Northwest National Laboratory, Richland,WA, USA
Received: 5 December 2011 – Accepted: 9 December 2011 – Published: 13 January 2012
Correspondence to: R. A. Zaveri ([email protected])
Published by Copernicus Publications on behalf of the European Geosciences Union.
1301

ACPD12, 1299–1400, 2012
CarbonaceousAerosols and
Radiative EffectsStudy
R. A. Zaveri et al.
Title Page
Abstract Introduction
Conclusions References
Tables Figures
J I
J I
Back Close
Full Screen / Esc
Printer-friendly Version
Interactive Discussion
Discussion
Paper
|D
iscussionP
aper|
Discussion
Paper
|D
iscussionP
aper|
Abstract
Substantial uncertainties still exist in the scientific understanding of the possible inter-actions between urban and natural (biogenic) emissions in the production and trans-formation of atmospheric aerosol and the resulting impact on climate change. The USDepartment of Energy (DOE) Atmospheric Radiation Measurement (ARM) program’s5
Carbonaceous Aerosol and Radiative Effects Study (CARES) carried out in June 2010in Central Valley, California, was a comprehensive effort designed to improve this un-derstanding. The primary objective of the field study was to investigate the evolutionof secondary organic and black carbon aerosols and their climate-related propertiesin the Sacramento urban plume as it was routinely transported into the forested Sierra10
Nevada foothills area. Urban aerosols and trace gases experienced significant physicaland chemical transformations as they mixed with the reactive biogenic hydrocarbonsemitted from the forest. Two heavily-instrumented ground sites – one within the Sacra-mento urban area and another about 40 km to the northeast in the foothills area – wereset up to characterize the evolution of meteorological variables, trace gases, aerosol15
precursors, aerosol size, composition, and climate-related properties in freshly pollutedand “aged” urban air. On selected days, the DOE G-1 aircraft was deployed to makesimilar measurements upwind and across the evolving Sacramento plume in the morn-ing and again in the afternoon. The NASA B-200 aircraft, carrying remote sensinginstruments, was also deployed to characterize the vertical and horizontal distribution20
of aerosols and aerosol optical properties within and around the plume. This overviewprovides: (a) the scientific background and motivation for the study, (b) the operationaland logistical information pertinent to the execution of the study, (c) an overview of keyobservations and initial results from the aircraft and ground-based sampling platforms,and (d) a roadmap of planned data analyses and focused modeling efforts that will fa-25
cilitate the integration of new knowledge into improved representations of key aerosolprocesses in climate models.
1302

ACPD12, 1299–1400, 2012
CarbonaceousAerosols and
Radiative EffectsStudy
R. A. Zaveri et al.
Title Page
Abstract Introduction
Conclusions References
Tables Figures
J I
J I
Back Close
Full Screen / Esc
Printer-friendly Version
Interactive Discussion
Discussion
Paper
|D
iscussionP
aper|
Discussion
Paper
|D
iscussionP
aper|
1 Introduction
The strategy of the US Department of Energy for improving the treatments of atmo-spheric aerosol processes and properties in global climate models involves building upfrom the microscale with observational validation at every step (Ghan and Schwartz,2007). Particular emphasis is placed on improving the scientific understanding of the5
possible interactions between various urban (anthropogenic) and natural (biogenic)emissions in aerosol formation and evolution of aerosol properties over a range of me-teorological and chemical environments via an integrated approach of field, laboratory,and modeling studies. The Carbonaceous Aerosols and Radiative Effects (CARES)field campaign conducted in June 2010 in Sacramento, California, was a comprehen-10
sive effort designed to contribute toward accomplishing this goal.Field observations show that ambient aerosol can be composed of a wide variety
of compounds, including sulfate, nitrate, ammonium, sea salt, crustal species fromsoil dust, and carbonaceous materials (e.g., Murphy et al., 1998; Seinfeld and Pan-dis, 1998). Primary carbonaceous aerosols include black carbon (BC) particles mixed15
with varying amounts of organic compounds that are directly emitted from fossil fuelcombustion, cooking, industrial processes, and biomass burning (agricultural burningand natural wildfires). Secondary carbonaceous aerosols, more commonly referred toas secondary organic aerosols (SOA), are those formed in the atmosphere via homo-geneous nucleation, condensation, and heterogeneous reactions of myriad gas-phase20
oxidation products from numerous volatile and semi-volatile organic compounds of bothanthropogenic and biogenic origins. Analyses of ambient aerosols in urban and ruralareas have shown that carbonaceous compounds may constitute up to 90 % of the drysubmicron particle mass (Kanakidou et al., 2005; Zhang et al., 2007).
Depending on their size and composition, aerosol particles can efficiently scatter25
and absorb solar radiation and serve as cloud condensation nuclei (CCN), therebyaffecting climate (Forster et al., 2007). Significant progress has been made in thepast two decades in representing the various inorganic and carbonaceous species in
1303

ACPD12, 1299–1400, 2012
CarbonaceousAerosols and
Radiative EffectsStudy
R. A. Zaveri et al.
Title Page
Abstract Introduction
Conclusions References
Tables Figures
J I
J I
Back Close
Full Screen / Esc
Printer-friendly Version
Interactive Discussion
Discussion
Paper
|D
iscussionP
aper|
Discussion
Paper
|D
iscussionP
aper|
state-of-the-art aerosol models that include treatments for trace gas photochemistry,aerosol microphysics, aerosol thermodynamics, gas-particle mass transfer, and het-erogeneous chemistry (e.g., Wexler and Seinfeld, 1991; Jacobson, 2002; Zhang etal., 2004; Bauer et al., 2008; Zaveri et al., 2008). However, substantial uncertaintiesstill exist in our understanding of the evolution of organic and black carbon aerosols of5
both anthropogenic and biogenic origins and the associated optical and CCN activa-tion properties. The CARES campaign was therefore motivated by three inter-relatedscience questions: (1) How do anthropogenic and biogenic precursors interact to formSOA? (2) How rapidly does BC mix with other species, and what are the relative con-tributions of condensation and coagulation to BC mixing state evolution? (3) What are10
the effects of aerosol mixing state and organic (primary and secondary) species on theassociated optical and CCN activation properties?
During summer, the Sacramento urban plume transport is controlled by consistent,terrain-driven upslope winds that draw polluted air to the northeast, into the SierraNevada foothills area rich in biogenic emissions (Dillon et al., 2002). As a result, the15
anthropogenic BC, primary organic aerosols (POA), SOA, and reactive trace gasesfrom the Sacramento urban area undergo significant photochemical ageing as they mixwith biogenic SOA precursors such as isoprene, monoterpenes, and related species.Some of these aged aerosols and trace gases could be transported back into the ur-ban area by nighttime downslope flows. In this way, the Sacramento plume forms a20
natural chemical reactor useful for studying evolution of various carbonaceous and re-lated aerosols. The CARES campaign observational strategy was designed to takeadvantage of this flow pattern by setting up two observation sites – one located withinthe Sacramento urban area, referred to as the “T0 site”, and another located about40 km to the northeast in Cool, CA, a small town in the foothills area, referred to as25
the “T1 site” (Fig. 1). Comprehensive measurement suites deployed at the T0 andT1 sites provided continuous information on the evolution of meteorological variables,trace gases, aerosol size, composition, optical properties, solar radiation, and CCNactivation properties during the entire campaign period from 2 through 28 June. The
1304

ACPD12, 1299–1400, 2012
CarbonaceousAerosols and
Radiative EffectsStudy
R. A. Zaveri et al.
Title Page
Abstract Introduction
Conclusions References
Tables Figures
J I
J I
Back Close
Full Screen / Esc
Printer-friendly Version
Interactive Discussion
Discussion
Paper
|D
iscussionP
aper|
Discussion
Paper
|D
iscussionP
aper|
ground measurements were complemented by a similar set of airborne measurementsonboard the DOE Gulfstream-1 (G-1) aircraft, with flight plans involving sampling up-wind, within, and outside of the evolving Sacramento urban plume in the morning andagain in the afternoon. The NASA B-200 King Air aircraft, equipped with remote sens-ing instruments, was also deployed to characterize the vertical and horizontal distribu-5
tion of aerosol optical properties and provide the vertical context for the G-1 and groundmeasurements.
The DOE CARES campaign overlapped temporally with the CalNex campaign in theCentral Valley and Southern California regions in May and June 2010. CalNex wassponsored by the National Oceanic and Atmospheric Administration (NOAA) and the10
California Air Resources Board (CARB), and it focused on the atmospheric chemistryand meteorological processes that affect air quality and climate change issues bothin California and nationally. The CalNex sampling platforms included the NOAA WP-3D and Twin Otter aircraft, the NOAA R/V Atlantis, and two ground sites in southernCalifornia – one in Bakersfield and another in Los Angeles. The NOAA Twin Otter air-15
craft moved its operation from Southern California to Sacramento (McClellan Airfield)to collaborate with CARES from 14–28 June. It carried a combination of downward-looking ozone/aerosol and Doppler wind lidars and the scanning University of ColoradoAirborne Multi-Axis DOAS (CU AMAX-DOAS) system to investigate NOx emission in-ventories and the 3-dimensional distribution and transport processes of ozone and20
aerosols in the Central Valley.This paper provides an overview of the CARES project, and presents: (1) the scien-
tific background and motivation for the field campaign, (2) the operational and logisticalinformation pertinent to the execution of the campaign, (3) an overview of key obser-vations from the aircraft and ground-based sampling platforms, and (4) a roadmap of25
planned data analyses and focused modeling efforts that will facilitate the integrationof new knowledge into regional and global climate-chemistry models.
1305

ACPD12, 1299–1400, 2012
CarbonaceousAerosols and
Radiative EffectsStudy
R. A. Zaveri et al.
Title Page
Abstract Introduction
Conclusions References
Tables Figures
J I
J I
Back Close
Full Screen / Esc
Printer-friendly Version
Interactive Discussion
Discussion
Paper
|D
iscussionP
aper|
Discussion
Paper
|D
iscussionP
aper|
2 Brief review of previous research related to CARES objectives
2.1 SOA formation and interactions between anthropogenic andbiogenic emissions
Several field studies have shown that SOA forms rapidly in urban plumes, with mostof the SOA mass forming within the first 12 h (Volkamer et al., 2006; Kleinman et al.,5
2007; de Gouw et al., 2008). In contrast, modeling studies using Raoult’s-Law-basedschemes, parameterized using laboratory chamber SOA yield data, significantly under-predict SOA formation in the ambient urban atmosphere as well as in the upper tropo-sphere (de Gouw et al., 2005; Heald et al., 2005; Johnson et al., 2006; Volkamer et al.,2006). In a more recent study, de Gouw et al. (2009) demonstrated that the growth of10
SOA at a suburban site in Mexico City could not be explained in terms of the measuredvolatile organic compounds (VOCs) and their chamber-based particulate mass yieldsand formation kinetics. Robinson et al. (2007) have suggested that some SOA massat urban to regional scales may be produced by volatilization of high molecular weightsemi-volatile and intermediate volatility organic compounds (SVOCs and IVOCs) from15
diesel exhaust primary organic aerosols (POA), followed by condensation of their ox-idation products. Recent modeling efforts incorporating these and other previouslymissing SOA sources have begun to close the gap between predicted and measuredSOA levels (Dzepina et al., 2009; Hodzic et al., 2010; Slowik et al., 2010; Lee-Tayloret al., 2011). However, comparisons of higher-order modeling endpoints to measure-20
ments, such as organic aerosol (OA) oxygen-to-carbon ratio (O/C), OA volatility, andageing kinetics continue to indicate discrepancies in our understanding of SOA forma-tion and atmospheric ageing (Dzepina et al., 2009; Hodzic et al., 2010; Lee-Taylor etal., 2011).
In addition to these discrepancies, results from field studies suggest that anthro-25
pogenic and biogenic emissions may somehow interact, resulting in increased overallyields of SOA. Weber et al. (2007) found that fine-particle water soluble organic carbon(WSOC) in aged urban plumes in the eastern United States was highly correlated with
1306
ACPD12, 1299–1400, 2012
CarbonaceousAerosols and
Radiative EffectsStudy
R. A. Zaveri et al.
Title Page
Abstract Introduction
Conclusions References
Tables Figures
J I
J I
Back Close
Full Screen / Esc
Printer-friendly Version
Interactive Discussion
Discussion
Paper
|D
iscussionP
aper|
Discussion
Paper
|D
iscussionP
aper|
anthropogenic emissions from fossil fuel combustion. However, the carbon isotope(14C) analysis of the WSOC samples indicated that roughly 70–80 % of the carbonwas of biogenic (modern) origin. Formation of organosulfate and organic nitrate com-pounds as a result of interactions between anthropogenic pollutants (e.g., sulfate, NOx)and biogenic hydrocarbons (e.g., isoprene) has been suggested to contribute to SOA5
mass (Bruns et al., 2010; Farmer et al., 2010; Surratt et al., 2008, 2010; Zaveri etal., 2010a). In contrast, hydrophobic POA formed from fossil fuel combustion may notreadily absorb oxidized (polar) biogenic hydrocarbons, as was previously assumed inmany models, to enhance the overall SOA yields (Song et al., 2007). Many laboratorystudies have implicated heterogeneous chemistry of semi-volatile and volatile organic10
vapors within aqueous inorganic aerosols as a potential route for SOA formation frombiogenic precursors (Jang et al., 2003; Kroll et al., 2005; Liggio et al., 2005, 2007;Limbeck et al., 2003). Also, accretion reactions, including aldol condensation, aciddehydration, and gem-diol condensation can transform volatile organic species intooligomeric products of low volatility (Gao et al., 2004; Jang et al., 2003; Kalberer et al.,15
2004; Tolocka et al., 2004), potentially increasing SOA mass beyond that predicted byRaoult’s Law based models. Recent laboratory and field studies (including CARES)indicate that biogenic SOA particles may exist in amorphous solid form, in which casethe Raoult’s Law may not even be applicable to calculate gas-particle partitioning oforganic species on atmospherically relevant timescales (Vaden et al., 2011a; Virtanen20
et al., 2010).One of the key instruments deployed during this and many previous campaigns for
characterizing aerosol chemistry is the Aerodyne Aerosol Mass Spectrometer (AMS).The AMS provides real-time, quantitative, and size-resolved data on submicron aerosolcomposition with a time resolution of a few minutes or faster (Canagaratna et al.,25
2007). The HR-ToF-AMS, i.e., AMS built with a high-resolution time-of-flight massspectrometer, is further able to determine the elemental ratios (e.g., oxygen-to-carbon,hydrogen-to-carbon, and nitrogen-to-carbon ratios) of aerosol-phase organics (Aikenet al., 2008). In addition, multivariate statistical analysis of AMS mass spectra is able
1307

ACPD12, 1299–1400, 2012
CarbonaceousAerosols and
Radiative EffectsStudy
R. A. Zaveri et al.
Title Page
Abstract Introduction
Conclusions References
Tables Figures
J I
J I
Back Close
Full Screen / Esc
Printer-friendly Version
Interactive Discussion
Discussion
Paper
|D
iscussionP
aper|
Discussion
Paper
|D
iscussionP
aper|
to effectively determine organic aerosol factors representative of distinct sources andatmospheric processes (Zhang et al., 2005; Ulbrich et al., 2009). Recent studies haveshown that comprehensive analyses of the mass spectra (i.e., chemical information)and temporal variation profiles of the OA factors, in conjunction with measurements ofaerosol physics, tracer compounds, secondary aerosol precursors, and meteorological5
conditions, may reveal insights into organic aerosol lifecycle processes, such as SOAformation and evolution (Zhang et al., 2011).
While significant progress has been made on this topic, the physical and chemi-cal interactions between anthropogenic and biogenic emissions leading to enhancedSOA formation remain poorly understood and are not represented well in regional and10
global atmospheric models. The CARES campaign observational strategy was de-signed to examine SOA formation at the urban (source) and rural (receptor) sites whenthe Sacramento urban plume mixed with biogenic emissions and when it did not. Thecomprehensive observations of precursor gases, aerosol composition, size distribu-tion, etc. at the two sites and aboard the G-1 aircraft will be useful in constraining15
and evaluating SOA models designed to investigate the various possible physical andchemical interactions between anthropogenic and biogenic SOA precursors.
2.2 Evolution of aerosol mixing state
Primary aerosol emissions typically consist of particles from sources such as wind-blown soil and road dust, sea spray, diesel and gasoline engine exhaust, biomass20
burning, cooking, etc. Primary particles and particles formed via homogeneous nu-cleation are initially “externally mixed,” such that each particle type has a distinct sizedistribution and chemical composition. The optical and hygroscopic properties of theseparticles from different sources are also different. Upon physical and chemical inter-actions with various reactive and condensable trace gases and coagulation with other25
particles of different compositions, these particles undergo changes in size, morphol-ogy, and chemical composition and gradually become internally mixed to varying de-grees. This process is referred to as evolution or “ageing” of aerosols. The optical
1308

ACPD12, 1299–1400, 2012
CarbonaceousAerosols and
Radiative EffectsStudy
R. A. Zaveri et al.
Title Page
Abstract Introduction
Conclusions References
Tables Figures
J I
J I
Back Close
Full Screen / Esc
Printer-friendly Version
Interactive Discussion
Discussion
Paper
|D
iscussionP
aper|
Discussion
Paper
|D
iscussionP
aper|
properties, CCN activation super-saturations, and chemical reactivity of freshly emitted(or formed) and aged aerosol particles can therefore differ significantly and dependstrongly on their mixing state.
Amongst all the different types of primary and secondary aerosols present in thetroposphere, BC (the refractory component of soot particles) is the most efficient and5
significant particulate absorber of solar radiation, and plays an important role in bothregional- and global-scale climate forcing (Ramanathan et al., 2001; Jacobson, 2002,2006; Bond, 2007; Levy et al., 2008). Freshly emitted soot particles consist of fractal-like chain agglomerates of primary soot spherules of 10 to 30 nm diameter (Wentzel etal., 2003). Ageing of soot particles by condensation of hygroscopic species such as sul-10
fate, nitrate, and SOA typically leads to a compaction of the initially non-spherical chainagglomerate structures (Zhang et al., 2008; Tritscher et al., 2011), although coated yetnon-compacted BC particles have also been observed in urban plumes (Adachi andBuseck, 2008). The mixing state and morphology of BC-containing particles is of par-ticular interest from a climate change perspective, as a non-light-absorbing coating on15
BC particles can increase the ensemble averaged absorption cross section of the BCcore by up to a factor of 2 due to the focusing of light by the coating to the BC core(Lesins et al., 2002; Saathoff et al., 2003; Schnaiter et al., 2005; Bond et al., 2006;Adachi et al., 2010; Cross et al., 2010). The coating on BC particles also greatly in-creases their scattering cross sections, and the resulting single scattering albedo (i.e.,20
the ratio of scattering cross section to the sum of scattering and absorption cross sec-tions) is a function of the BC core size and the coating thickness. Hygroscopic coatingsalso dramatically affect the CCN activation properties and atmospheric lifetime of BCparticles (Cantrell et al., 2001; Mochida et al., 2006; Kuwata et al., 2007; Medina et al.,2007; Cubison et al., 2008; Furutani et al., 2008; Tritscher et al., 2011).25
Field studies of BC mixing state evolution with single particle soot photometer (SP2,Baumgardner et al., 2004; Schwarz et al., 2006; Moteki et al., 2007) reveal that BCparticles tend to be thinly coated in urban areas, and become “thickly” coated as theurban plume undergoes photochemical ageing (Schwarz et al., 2008b; Subramanian
1309

ACPD12, 1299–1400, 2012
CarbonaceousAerosols and
Radiative EffectsStudy
R. A. Zaveri et al.
Title Page
Abstract Introduction
Conclusions References
Tables Figures
J I
J I
Back Close
Full Screen / Esc
Printer-friendly Version
Interactive Discussion
Discussion
Paper
|D
iscussionP
aper|
Discussion
Paper
|D
iscussionP
aper|
et al., 2010). Several modeling studies have examined the roles of condensation andcoagulation in transforming externally-mixed BC aerosols into internal mixtures (Fassi-Fihri et al., 1997; Jacobson, 2001, 2002; Jacobson et al., 1994; Strom et al., 1992).Recently, Riemer et al. (2008) developed a stochastic particle-resolved aerosol box-model, PartMC-MOSAIC, that explicitly resolves the composition and mixing state of5
individual particles in a given population of different types of aerosols, including, butnot limited to BC. The model was applied to an idealized urban plume scenario basedon Los Angeles emissions, and the results indicate that BC particles have a widerange of mixing states after 12 to 24 h of processing. Evolution of aerosol mixingstate was shown to be a highly complex phenomenon that strongly depended on the10
concentration and composition of the emitted particles, gas-phase photochemical oxi-dation rates, dynamic mass transfer of condensable trace gases to particles of differentsizes and compositions, coagulation rates, temperature, relative humidity, dilution withbackground air, and processing time since emission. In a follow-on study, Zaveri etal. (2010b) investigated the evolution of aerosol optical, hygroscopic, and cloud activa-15
tion properties with the particle-resolved aerosol model, and found that these proper-ties can be sensitive to the aerosol mixing state even after 1 to 2 days of ageing. Whilefield observations of evolution of BC mixing state are qualitatively consistent with theresults from particle-resolved modeling studies, a quantitative validation of the detailedtheoretical picture of aerosol mixing state evolution is necessary before a reliable, com-20
putationally efficient mixing state framework can be developed for use in regional andglobal climate models.
The SP2 instrument, when combined with the state-of-the-art single particle massspectrometer (SP-MS) instruments such as the single particle mass spectrometer(SPLAT II, Zelenyuk et al., 2009), Particle Analysis by Laser Mass Spectrometry25
(PALMS, Murphy and Thomson, 1997), and Aircraft-Aerosol Time-of-Flight Mass Spec-trometer (A-ATOFMS, Pratt et al., 2009; Pratt and Prather, 2010), can provide a morecomplete picture of the different particle types and mixing states present in a populationof aerosols. Recent advances in single particle characterizations have made it possible
1310

ACPD12, 1299–1400, 2012
CarbonaceousAerosols and
Radiative EffectsStudy
R. A. Zaveri et al.
Title Page
Abstract Introduction
Conclusions References
Tables Figures
J I
J I
Back Close
Full Screen / Esc
Printer-friendly Version
Interactive Discussion
Discussion
Paper
|D
iscussionP
aper|
Discussion
Paper
|D
iscussionP
aper|
to extend the analysis of data to determine aerosol density, optical properties, shape,number concentrations, and size distributions (Murphy et al., 2004; Moffet and Prather,2005; Spencer et al., 2007; Zelenyuk et al., 2008; Zelenyuk and Imre, 2009a; Vadenet al., 2011b) as well as combining data from other sources (or acquired while withinclouds) to determine composition as a function of hygroscopicity and CCN activity (Bu-5
zorius et al., 2002; Herich et al., 2009; Kamphus et al., 2010; Zelenyuk et al., 2010;Hiranuma et al., 2011). Furthermore, offline analyses of field-collected aerosol sam-ples can provide additional details on the composition, mixing state, and morphologyof individual particles. These offline analytical techniques range from scanning elec-tron microscopy (SEM) and micro-spectroscopy (STXM/NEXAFS) studies of individual10
particles (Laskin, 2010, Moffet et al., 2010b) to ultra-high resolution mass spectrometryanalysis of individual components in OA material (Nizkorodov et al., 2011).
The CARES campaign included SP2 and SP-MS instruments as well as particlesamplers (for offline analyses) at both ground sites and onboard the G-1 to charac-terize the evolution of aerosol mixing states in the Sacramento plume. The resulting15
composite picture of different particle types, size, composition, and morphology will beuseful for constraining the particle-resolved aerosol model to evaluating the roles ofcondensation and coagulation in the evolution of aerosol mixing state, with a focus onBC-containing particles.
2.3 Aerosol optical properties20
As already discussed, the optical properties of freshly emitted and aged BC-containingparticles can differ significantly. The mass absorption cross-section (MAC) of uncoated,pure BC is estimated to be 7.5±1.2 m2 g−1 for radiation of wavelength λ = 550 nm(Bond and Bergstrom, 2006). Laboratory studies and the “core-shell” Mie theory cal-culations show that ensemble average MAC of coated BC particles is amplified by25
up to a factor of ∼2 (Schnaiter et al., 2005; Bond et al., 2006; Bueno et al., 2011), al-though MAC values as high as 20 to 30 m2 g−1 are possible for very small BC cores (10to 50 nm diameter) with relatively thick coatings of non-absorbing species (composite
1311

ACPD12, 1299–1400, 2012
CarbonaceousAerosols and
Radiative EffectsStudy
R. A. Zaveri et al.
Title Page
Abstract Introduction
Conclusions References
Tables Figures
J I
J I
Back Close
Full Screen / Esc
Printer-friendly Version
Interactive Discussion
Discussion
Paper
|D
iscussionP
aper|
Discussion
Paper
|D
iscussionP
aper|
particle diameters >150 nm) (Fuller et al., 1999). In addition to BC, organic compoundssuch as humic-like substances (HULIS) present in biomass burning aerosols also con-tribute to light absorption in the atmosphere (Mukai and Ambe, 1986; Havers et al.,1998; Hoffer et al., 2006; Lukacs et al., 2007). While light absorption by BC parti-cles from diesel and motor vehicle soot typically displays an inverse dependence on5
wavelength, light absorbing organic carbon (LAOC) typically displays much strongerwavelength dependence. This increased absorption of light at wavelengths shorterthan 600 nm causes the LAOC particles to appear brown (or yellow) (Bergstrom et al.,2002; Kirchstetter et al., 2004; Andreae and Gelencser, 2006; Barnard et al., 2008;Gyawali et al., 2011). Furthermore, biomass burning particles composed of a small10
BC core (∼50 nm) and a thick coating of LAOC species may experience even largerenhancements in the absorption of light at wavelengths shorter than 600 nm (Gyawaliet al., 2009).
Recent field measurements also indicate secondary sources of LAOC particulatematter that exhibit some chemical similarities to HULIS (Duarte et al., 2005; Marley et15
al., 2009; Hecobian et al., 2010). While the exact mechanisms for secondary LAOCformation in the ambient atmosphere are not fully understood, laboratory studies showthat chromophores (components of molecules that absorb light) can form via a varietyof heterogeneous chemical reactions, including ozonolysis of terpenes in the pres-ence of ammonium ions (Bones et al., 2010) and isoprene oxidation in the presence of20
acidic solutions (Limbeck et al., 2003). Carbonyls such as glyoxal and methylglyoxal,produced from gas-phase photooxidation of many anthropogenic and biogenic VOCs,can also lead to the formation of LAOC material via heterogeneous reactions in acidicsolutions (Noziere et al., 2007; Noziere and Esteve, 2005; Sareen et al., 2010), withamino acids (de Haan et al., 2009a; Noziere et al., 2007), methyl amines (de Haan et25
al., 2009b), and ammonium salts (Noziere et al., 2009; Sareen et al., 2010; Shapiro etal., 2009). Nighttime oxidation of biogenic VOCs via nitrate radical chemistry may alsolead to secondary LAOC material (Brown et al., 2009; Zaveri et al., 2010a).
Thus, along with investigating SOA formation and aerosol mixing state evolution in
1312

ACPD12, 1299–1400, 2012
CarbonaceousAerosols and
Radiative EffectsStudy
R. A. Zaveri et al.
Title Page
Abstract Introduction
Conclusions References
Tables Figures
J I
J I
Back Close
Full Screen / Esc
Printer-friendly Version
Interactive Discussion
Discussion
Paper
|D
iscussionP
aper|
Discussion
Paper
|D
iscussionP
aper|
the Sacramento urban plume, a major objective of CARES was to observe the evolutionof aerosol light absorption and scattering in the near-UV and visible spectral regionsas SOA of both anthropogenic and biogenic origin condensed (or formed via heteroge-neous reactions) on urban BC particles and other, non-BC containing particles. Recentstudies (Lack et al., 2008; Cappa et al., 2008) suggest that absorption measurements5
from filter-based instruments such as the Particle/Soot Absorption Photometer (PSAP)are suspect in the presence of OA. Photoacoustic and cavity ring-down spectroscopyinstruments that bypass the filter problems and are useful for determining absorptioncoefficients in the visible region (Lewis et al., 2008; Radney et al., 2009). DuringCARES, the spectral ranges of these instruments were extended down to λ= 355 nm10
to specifically examine the absorption and scattering properties of OA.
3 Design and measurements
3.1 Campaign venue and geography
The CARES campaign was based in Sacramento, CA, and took place from 2 through28 June 2010. Sacramento is located in California’s expansive Central Valley, and is15
the sixth most populous city in California with a 2009 estimated population of 490 000.The seven-county Sacramento Metropolitan Area is the largest in the Central Valley,with an estimated population of 2.46 million. The western half of Greater Sacramentois agricultural area while the eastern portion of the region consists of the Sierra Nevadaand its foothills, which are dominated by coniferous and oak forests. Figure 2 shows20
the spatial distribution of total anthropogenic VOCs and biogenic isoprene emissionsin central California along with the locations of the T0 and T1 measurement supersites.The anthropogenic VOC emissions are from California Air Resources Board (CARB)emission inventory and the biogenic emissions are calculated online using MEGAN(Model of Emissions of Gases and Aerosols from Nature; Guenther et al., 2006).25
The climate in Sacramento and the valley area is characterized by damp to wet, cool
1313

ACPD12, 1299–1400, 2012
CarbonaceousAerosols and
Radiative EffectsStudy
R. A. Zaveri et al.
Title Page
Abstract Introduction
Conclusions References
Tables Figures
J I
J I
Back Close
Full Screen / Esc
Printer-friendly Version
Interactive Discussion
Discussion
Paper
|D
iscussionP
aper|
Discussion
Paper
|D
iscussionP
aper|
winters (October through April) and hot, dry summers (June through August). Sum-mer heat is often moderated by a sea breeze, locally known as the “delta breeze”,which comes from the San Francisco Bay through the Carquinez Strait (a narrow gapin the Coast Range) into the Sacramento-San Joaquin River Delta. While transportprocesses over the entire Central Valley can be complex (Bao et al., 2008), the local5
transport of the Sacramento urban plume during the summer is controlled by consis-tent, terrain-driven upslope winds that draw polluted air northeast over oak and pinetrees in the Blodgett Forest area in the Sierra Nevada Mountains by late afternoon.The Sacramento-Blodgett Forest corridor effectively serves as a mesoscale flow reac-tor where the daily evolution of the Sacramento urban plume can be characterized as a10
Lagrangian air mass transported from the urban core into the sparsely populated SierraNevada Mountains (Dillon et al., 2002; Murphy et al., 2007). The CARES campaignobservational strategy was designed to take advantage of this natural flow pattern bysetting up the two observation sites – one located within the Sacramento urban area(T0) and another located about 40 km to the northeast in Cool (T1), a small town in the15
forested foothills of the Sierra Nevada Mountains.
3.2 Ground sites and instruments
The T0 site (altitude approximately 30 m MSL) was located in the campus of Ameri-can River College, about 14 km northeast of the Sacramento downtown area. The T1site (altitude approximately 450 m MSL) was located on the property of the Northside20
School in Cool, California, situated amidst a forested area rich in biogenic emissions.The aged urban plume typically arrived at the T1 site around mid- to late-afternoonwhen ozone and SOA from urban and biogenic precursors were near their peak con-centrations. The T0 and T1 ground sites thus characterized the diurnal evolution ofmeteorological variables, trace gases, aerosol precursors, and aerosol composition25
and properties in freshly polluted and aged urban air, respectively.Nearly identical sets of measurements were made at both ground sites.
Key measurements included trace gases, aerosol precursor gases, size-resolved1314

ACPD12, 1299–1400, 2012
CarbonaceousAerosols and
Radiative EffectsStudy
R. A. Zaveri et al.
Title Page
Abstract Introduction
Conclusions References
Tables Figures
J I
J I
Back Close
Full Screen / Esc
Printer-friendly Version
Interactive Discussion
Discussion
Paper
|D
iscussionP
aper|
Discussion
Paper
|D
iscussionP
aper|
particle concentration and chemical composition, particle physical properties (morphol-ogy, density, optical properties, hygroscopicity, and CCN activation), solar radiationmeasurements, and meteorological measurements. The measurement techniques,uncertainties, and time resolutions are summarized in Table 1. Two 40×10 ft trailerswere set up at each site to house the instruments. The trailers were placed side by5
side, with the aerosol stack (∼8 m high) erected between them, and inlet lines goinginto both trailers from the same stack. The trailer aerosol inlet system was based on theNOAA Global Monitoring Division (GMD) Aerosol Observing System (AOS) tower andinlet design (Delene and Ogren, 2002). The sample air was pulled through the stackand split into 2 components – an overall stack flow of ∼1000 l min−1 and an aerosol10
flow (∼120 l min−1) through an internal concentric stainless steel tube (∼5 cm OD). Thelower end of the 5-cm tube terminated in a 5-port manifold, four of which were 3/4 -instainless tubes and the fifth a 1/2-in tube (central flow for temperature and relative hu-midity measurements, as well as an auxiliary aerosol port for an Aerosol Particle Sizer,APS). Flow through the system was provided by a stand-alone pump box external to15
the trailers. Separate inlet lines were provided for trace gas and particle instruments.The trace gas inlet lines were Teflon and the particle inlet lines were made of stainlesssteel. One of the ports was connected to the AOS rack in one of the trailers. Two of theports were used to provide aerosol flow to each of the trailers, respectively. Each inletline coming into the trailer was further split (by a 3/4-in “Y”) into lines that were wrapped20
around the internal walls of the trailer with 1/2-in pick-off ports strategically placed forthe instrument configuration of each trailer. The return lines from these sampling man-ifolds were also attached to the pump box. The AOS rack had special return linesgoing to a carbon-vane pump and a diaphragm pump, respectively (also contained inthe pump box).25
The Washington State University mobile laboratory was also deployed at the T0 siteand contained instruments for gas phase measurements. The inlet consisted of 1/2”PFA tubing that was mounted to a 10-m telescoping meteorology tower attached to thetrailer. A Vaisala WXT-510 weather station was mounted on the top of the meteorology
1315

ACPD12, 1299–1400, 2012
CarbonaceousAerosols and
Radiative EffectsStudy
R. A. Zaveri et al.
Title Page
Abstract Introduction
Conclusions References
Tables Figures
J I
J I
Back Close
Full Screen / Esc
Printer-friendly Version
Interactive Discussion
Discussion
Paper
|D
iscussionP
aper|
Discussion
Paper
|D
iscussionP
aper|
tower. Approximately 0.5 m below the weather station was the main inlet. Approxi-mately 32 l min−1 of air was pulled through the inlet by a diaphragm pump with the flowmeasured by a TSI inline flow meter. Each instrument inside the trailer subsampledfrom this main inlet line. The NOxy instrument had a dedicated NOy converter inlet thatwas mounted about 1 m below the main inlet line.5
The trace gas measurements included carbon monoxide (CO), nitric oxide (NO), to-tal reactive odd nitrogen species (NOy), and ozone (O3). Nitrogen dioxide (NO2) andsulfur dioxide (SO2) analyzers were deployed at the T0 site (and on the G-1). Near sur-face NO2mixing ratios and partial vertical column densities (VCD, integral over bound-ary layer height) were measured at T1 by the University of Colorado Ground Multi10
AXis DOAS instrument (CU GMAX-DOAS, Volkamer et al., 2009). Proton-TransferReaction Mass Spectrometers (PTR-MS) were used to measure mixing ratios of se-lected volatile organic compounds (VOC) of both anthropogenic and biogenic origin.The PTR-MS at T0 was modified to also characterize the total concentration of semi-volatile long chain alkanes (>C10) and heavier monoaromatics associated with diesel15
exhaust vapor emissions. The modification was to add a second inlet to the PTR-MS toallow in-situ thermal desorption sampling from a dedicated heat traced inlet. PTR-MSsampling alternated between thermal desorption analysis for diesel exhaust speciesand continuous de-humidified VOC sampling as described in Erickson et al. (2011).In addition, a gas chromatograph ion trap mass spectrometer (GC-ITMS) was used at20
T0 to measure selected C6-C10 VOCs to determine the abundance of SOA precursorssuch as monoaromatics emitted in vehicle exhaust and monoterpene compounds emit-ted from biogenic sources. Finally, near-surface concentrations of formaldehyde andglyoxal and VCDs were measured by CU GMAX-DOAS at T1 (Sinreich et al., 2010).
Condensation particle counters (CPC) were used to measure total particle number25
concentrations for particles larger than 10 nm diameter, and scanning mobility parti-cle sizers (SMPS) and aerosol particle sizers (APS) were used to measure particlesize distributions from 10 to 20 000 nm. An Aerodyne High Resolution Time-of-FlightAerosol Mass Spectrometer (HR-ToF-AMS), coupled to a thermal denuder (Fierz et al.,
1316

ACPD12, 1299–1400, 2012
CarbonaceousAerosols and
Radiative EffectsStudy
R. A. Zaveri et al.
Title Page
Abstract Introduction
Conclusions References
Tables Figures
J I
J I
Back Close
Full Screen / Esc
Printer-friendly Version
Interactive Discussion
Discussion
Paper
|D
iscussionP
aper|
Discussion
Paper
|D
iscussionP
aper|
2007), was deployed at each ground site to measure aerosol composition and volatilitydistributions of submicron inorganic and organic aerosols. The HR-ToF-AMS uses anaerodynamic lens to sample submicron particles (∼50–1000 nm) into vacuum wherethey are aerodynamically sized, thermally vaporized on a heated surface (∼600 ◦C),and chemically analyzed via 70 eV electron impact ionization time-of-flight mass spec-5
trometry (Canagaratna et al., 2007). Since aerosol species must be vaporized to bedetected, the HR-ToF-AMS does not measure refractory materials such as elementalcarbon and dust particles. However, non-refractory (NR) materials internally mixed withrefractory substances can be determined by the AMS and the presence of significantquantities of refractory particles can be detected via comparison between aerosol size10
distributions (from the SMPS or the AMS) and total mass detected, with appropriateassumptions about the particle density.
A Particle-Into-Liquid Sampler (PILS, Sooroshian et al., 2006) with an autosamplerwas deployed at each site to collect vials every hour for offline analysis of water solubleaerosol species. A PM1 impactor (BMI) was used upstream of the PILS, CCN, and15
HR-ToF-AMS. Droplet Measurement Technologies (DMT) Single Particle Soot Pho-tometers (SP2, Stephens et al., 2003; Schwarz et al., 2006) were used to measuresingle particle and ensemble black carbon mass loadings along with information onthe amount of the particles’ coatings and cores. Single particle mass spectrometersSPLAT II (Zelenyuk et al., 2009) and PALMS (Murphy and Thomson, 1997) were de-20
ployed at the T0 and T1 sites, respectively. A number of different impactors werealso deployed at both sites to collect aerosol samples for offline analysis of particulatematter, ranging from electron microscopy and micro-spectroscopy studies of individualparticles (Laskin, 2010, Moffet et al., 2010b) to ultra high resolution mass spectrometryanalysis of individual components in OA material (Nizkorodov et al., 2011).25
High-volume samplers (using brushless motors) equipped with slotted impactorswere used at the T1 site to obtain sub-micron samples for carbon isotopic characteri-zation using quartz fiber filters as described previously (Marley, et al., 2009). Anotherhigh-volume semi-volatile aerosol sampler was deployed at the T0 site from 2 to 15
1317
ACPD12, 1299–1400, 2012
CarbonaceousAerosols and
Radiative EffectsStudy
R. A. Zaveri et al.
Title Page
Abstract Introduction
Conclusions References
Tables Figures
J I
J I
Back Close
Full Screen / Esc
Printer-friendly Version
Interactive Discussion
Discussion
Paper
|D
iscussionP
aper|
Discussion
Paper
|D
iscussionP
aper|
June and at the T1 site from 16 to 28 June to collect particles of aerodynamic diame-ter ≤ 2.5 µm (PM2.5) to study distribution of organic reactive species, particularly acidsand aldehydes with respect to total organic carbon. Samples were collected for 12 hperiods, from 08:00 a.m. to 08:00 p.m., and from 08:00 p.m. to 08:00 a.m. Half of eachfilter was spiked with recovery standards consisting of deuterated acids and aldehyde,5
derivatized using pentafluorobenzyl hydroxyl amine (PFBHA) in methanol to stabilizealdehydes, and stored at −20 ◦C in vials closed with Teflon stopper until the analysis.The other half of the filter was also stored at −20 ◦C without any modifications.
Aerosol optical properties were measured at multiple wavelengths with several tech-niques, including cavity ring-down spectroscopy for light extinction (CRDS, Smith and10
Atkinson, 2001; Radney et al., 2009; Langridge et al., 2011), photoacoustic spec-troscopy for light absorption (PAS, Arnott et al., 1999; Lack et al., 2006), nephelometerfor light scattering (Anderson et al., 1996), and particle soot absorption photometer(PSAP, Ogren, 2010). These measurements provide the absorption, scattering, andextinction coefficients as well as intensive (not dependent on aerosol concentration)15
properties such as the single scattering albedo and Angstrom exponents, and depend-ing on the particular operating procedures, their response to heating and changes inrelative humidity. Radiation observations at the ground sites included broadband so-lar fluxes as well as Multi-Filter Rotating Shadowband Radiometer (MFRSR, Harrisonet al., 1994) measurements of downwelling visible and near-IR solar irradiance at six20
discrete wavelengths, which provide information needed to estimate aerosol opticaldepth and intensive properties. Partial column integrals over boundary layer height ofaerosol extinction were observed at three wavelengths (360 nm, 477 nm, 630 nm) as in-ferred from solar stray light column observations of oxygen dimer by CU GMAX-DOAS(Volkamer et al., 2009; Sinreich et al., 2010).25
Concentrations of CCN were measured at multiple supersaturations (0.07 to 0.5 %)at both sites using Droplet Measurement Technologies CCN Counters (Model 200-013and 100-081). The T1 site also included measurement of size-resolved CCN (SCCN)concentrations and variable relative humidity nephelometry (commonly referred to as
1318

ACPD12, 1299–1400, 2012
CarbonaceousAerosols and
Radiative EffectsStudy
R. A. Zaveri et al.
Title Page
Abstract Introduction
Conclusions References
Tables Figures
J I
J I
Back Close
Full Screen / Esc
Printer-friendly Version
Interactive Discussion
Discussion
Paper
|D
iscussionP
aper|
Discussion
Paper
|D
iscussionP
aper|
f (RH) measurement). Finally, atmospheric state observations were made at the sur-face and aloft including wind speed and direction, pressure, temperature, and relativehumidity at both sites using several instruments.
3.3 Aircraft payloads
The aircraft component of the CARES field campaign was based out of McClellan Air-5
field, located about 4 km northwest of the T0 ground site. The trace gas and aerosolmeasurements onboard the G-1 aircraft were similar to those deployed at the groundsites. The techniques, uncertainties, and time resolutions of all the G-1 measurementsare summarized in Table 2. Trace gas measurements included CO, NO, NO2, NOy,O3, and SO2 (references?). An Ionicon high-sensitivity quadrupole PTR-MS was used10
to measure VOCs. Condensation particle counters CPC-3025 and CPC-3010 (Semet al., 2002) were deployed to measure particle number concentrations for optical di-ameter (Dp) greater than 3 and 10 nm, respectively. A combination of Fast IntegratingMobility Spectrometer (FIMS) (Kulkarni and Wang, 2006; Olfert et al., 2008), Ultra-HighSensitivity Aerosol Spectrometer-Airborne (UHSAS-A, Cai et al., 2008), and the Cloud15
Aerosol Spectrometer (CAS) portion of the Cloud Aerosol Precipitation Spectrometer(CAPS) probe (Baumgardner et al., 2001) were used to measure the particle size dis-tribution for mobility diameters (Dm) between 30 and 70 nm, and geometric diameters(Dg) between 60 and 1000 nm, and 500 and 50 000 nm, respectively.
An Aerodyne HR-ToF-AMS was deployed to measure non-refractory aerosol com-20
ponents, a DMT SP2 was used to measure BC number and mass concentrations, andthe A-ATOFMS was used to measure single-particle composition and mixing state. APILS with an autosampler was deployed to collect vials every 3 minutes for offline anal-ysis of water soluble aerosol species. Automated sampling of aerosol particles formicroscopy and spectromicroscopy analyses was carried out using a Time-Resolved25
Aerosol Collector (TRAC, Laskin et al., 2006). Aerosol optical properties (scatteringand absorption) at three wavelengths (405, 532, and 781 nm) were measured with anintegrated PAS/nephelometer instrument (DMT PASS3) (Flowers et al., 2010), a TSI
1319

ACPD12, 1299–1400, 2012
CarbonaceousAerosols and
Radiative EffectsStudy
R. A. Zaveri et al.
Title Page
Abstract Introduction
Conclusions References
Tables Figures
J I
J I
Back Close
Full Screen / Esc
Printer-friendly Version
Interactive Discussion
Discussion
Paper
|D
iscussionP
aper|
Discussion
Paper
|D
iscussionP
aper|
3563 nephelometer (Anderson et al., 1996), and a Radiance Research PSAP (Ogren,2010). The aerosol inlet on the G-1 allowed particles up to 5 µm aerodynamic diame-ter wit close to 100 % transmission efficiency. Meteorological measurements includedtemperature, dew point, static pressure, and wind speed and direction.
The NASA B-200 King Air (B-200) aircraft deployed a High Spectral Resolution Li-5
dar (HSRL) (Hair et al., 2008; Rogers et al., 2009) that measures aerosol backscat-ter ratio, backscatter and extinction coefficients, and depolarization. It also carrieda digital camera and the GISS Research Scanning Polarimeter (RSP). The latter in-strument measures total and polarized reflectances in nine spectral bands across thevisible and short-wave infrared portion of the electromagnetic spectrum. From these10
measurements, column-averaged aerosol optical (e.g. optical depth) and microphysi-cal (e.g. refractive index and size distribution) parameters can be derived. The HSRLand RSP have been deployed together in several major field campaigns since 2008,in an effort to assess the potential of the synergistic exploitation of active and passivesensors in aerosol research (Waquet et al., 2009; Knobelspiesse et al., 2011; Ottaviani15
et al., 2011). The uncertainties and time resolutions of the B-200 measurements aresummarized in Table 3.
As part of the CalNex field program, the NOAA Twin Otter aircraft moved its operationfrom Southern California to Sacramento (McClellan Airfield) to collaborate with CARESfrom 14–28 June. The NOAA Twin Otter was configured as a remote sensing platform20
carrying an ozone/aerosol lidar, a Doppler wind lidar, a scanning DOAS system, andseveral radiometers. The nadir-pointing Tunable Ozone Profiler for Aerosol and oZone(TOPAZ) lidar (Alvarez et al, 2011; Langford et al., 2011) measured ozone and aerosolbackscatter profiles below the aircraft while the downward-looking, conically-scannedDoppler lidar (Pearson et al., 2009) provided measurements of horizontal and verti-25
cal winds. The zenith-to-nadir scanning University of Colorado Airborne Multi-AXisDOAS (CU AMAX-DOAS; Volkamer et al., 2009) instrument provided reactive tracegas column observations (i.e., nitrogen dioxide, aerosol extinction, formaldehyde andglyoxal) and the radiometers were used to measure surface albedo and surface skin
1320

ACPD12, 1299–1400, 2012
CarbonaceousAerosols and
Radiative EffectsStudy
R. A. Zaveri et al.
Title Page
Abstract Introduction
Conclusions References
Tables Figures
J I
J I
Back Close
Full Screen / Esc
Printer-friendly Version
Interactive Discussion
Discussion
Paper
|D
iscussionP
aper|
Discussion
Paper
|D
iscussionP
aper|
temperature. These remote sensors were complemented by in situ measurements ofozone mixing ratio and temperature at flight level. The specifications for all instrumentsonboard the NOAA Twin Otter are listed in Table 4. This unique instrument packageenabled the characterization of the horizontal and vertical structure of chemically andradiatively important trace gases and particulates within the boundary layer and lower5
free troposphere. The primary objectives of the NOAA Twin Otter deployment duringCARES were the investigation of NOx emission inventories, and the mapping of the3-D distribution and transport processes of ozone and aerosols in the Central Valley.
3.4 Aircraft flights
The Weather Research and Forecasting (WRF) model (Grell et al., 2005) was run daily10
at PNNL to provide 72-h forecasts of tracer plumes, which were used to guide aircraftoperations and flight planning. The tracer plumes were based on CO emissions aswell as meteorological parameters, using a horizontal grid spacing of 4 km. The trac-ers were categorized into 20 sub-regions based on anthropogenic emissions sourceregion that could impact the CARES sampling domain. Each forecast was made us-15
ing the National Centers for Environmental Prediction’s 00:00 UTC North AmericanMesoscale analysis and corresponding forecasts as initial and boundary conditions.Tracers were initialized with the previous day’s forecasted tracer fields at 00:00 UTC.After the WRF forecast was completed, graphics depicting tracer positions at the sur-face and at select altitudes were generated automatically and made available on the20
CARES website (http://campaign.arm.gov/cares/forecast). Figure 3 shows examplesof tracer forecasts (at 16:00 PDT) under southwesterly and northwesterly flows, whichrespectively occurred for 15 and 9 days out of the total 27 days from 2 through 28 June.More detailed analysis of the CO tracer forecasts and an analysis of them to categorizedominant transport scenarios during CARES can be found in Fast et al. (2011).25
Table 5 summarizes pertinent details of all the aircraft flights carried out duringCARES. The G-1 and B-200 aircraft performed a total of 22 (67.5 h) and 23 (68 h)research flights, respectively, while the NOAA Twin Otter performed 17 flights (60 h).
1321

ACPD12, 1299–1400, 2012
CarbonaceousAerosols and
Radiative EffectsStudy
R. A. Zaveri et al.
Title Page
Abstract Introduction
Conclusions References
Tables Figures
J I
J I
Back Close
Full Screen / Esc
Printer-friendly Version
Interactive Discussion
Discussion
Paper
|D
iscussionP
aper|
Discussion
Paper
|D
iscussionP
aper|
The G-1 flight plans included several patterns that were designed for a specific pur-pose or the given wind flow condition. These patterns can be grouped into 3 basictypes of missions: (1) morning or afternoon flight plan designed to characterize theinflow from the Bay Area under southwesterly flow; (2) morning and afternoon flightplans designed to characterize the evolution of the Sacramento urban plume under5
southwesterly flow; (3) morning and afternoon flight plans designed to characterize theevolution of the Sacramento urban plume under northwesterly flow. A late morningflight was also conducted on 27 June to characterize isoprene emission flux over theSierra Nevada foothills region.
The B-200 flew at an altitude of approximately 7 km above ground, with most flights10
coordinated with the G-1 to characterize the vertical and horizontal distribution ofaerosol optical properties and provide the vertical context for the G-1 and ground mea-surements. B-200 also sampled over a larger area than the G-1 so that the G-1 ob-servations could be interpreted within the larger spatial context. Figure 4 shows theG-1 and B-200 flight tracks grouped according to the type of the mission based on the15
expected transport scenario from WRF tracer forecast. Additional missions flown bythe G-1 and B-200, not shown here, included coordination with R/V Atlantis that movedalong the Sacramento Deep Water Channel from San Francisco Bay on 3 June andan intercomparison flight with the NOAA WP-3D on 18 June in the San Joaquin Valley,from Fresno to Bakersfield, CA.20
While the NOAA Twin Otter flights were not closely coordinated with the G-1 or theB-200, they were mostly in the same general area, with some flights extending over alarger domain (Fig. 4). The main objective was to sample the greater Sacramento areaextensively, including regular overpasses over the T1 site. The Twin Otter flew morn-ing and afternoon missions, typically lasting 3–4 h. The morning flights were generally25
focused on investigating NOx emissions whereas the afternoon flights were designedto characterize ozone distribution and transport downwind of Sacramento and the BayArea. Flight altitudes varied from 600 to 5000 m MSL. Another objective was the detec-tion and characterization of pollution plumes transported from Asia.
1322

ACPD12, 1299–1400, 2012
CarbonaceousAerosols and
Radiative EffectsStudy
R. A. Zaveri et al.
Title Page
Abstract Introduction
Conclusions References
Tables Figures
J I
J I
Back Close
Full Screen / Esc
Printer-friendly Version
Interactive Discussion
Discussion
Paper
|D
iscussionP
aper|
Discussion
Paper
|D
iscussionP
aper|
4 Overview of observations
4.1 Meteorological context of CARES
An overview of meteorology during CARES is provided by Fast et al. (2011). Here wegive a brief summary of the meteorological conditions that prevailed during the studyperiod. During late May the Central Valley experienced strong northwesterly flow and5
precipitation events, which were likely due to the lingering effects of the moderate ElNino that occurred in early 2010. The campaign thus began with cooler than normaltemperatures and intermittent cloudiness through 6 June, followed by mostly sunnydays for the remainder of the campaign. Figure 5 displays the time series of winddirection, wind speed, temperature (T ), and relative humidity (RH) at the T0 and T110
sites. The wind direction at both sites during the daytime was typically southwesterly towesterly, favoring transport of the Sacramento urban plume to the T1 site area by lateafternoon or early evening. For the days labeled SW, the wind direction at T0 typicallyshifted to southerly by 18:00 PDT and to southeasterly by midnight, bringing relativelycleaner background air into the urban area. In contrast, the wind direction at the T1 site15
typically experienced a reversal from westerly (upslope) in the afternoon to easterly ornortheasterly (downslope) at night, gradually recirculating the air mass in the foothillsregion back into the valley in the residual layer by next morning.
Days with synoptic southwesterly (SW) flow were generally favorable for transport-ing the urban plume from Sacramento to the T1 site and vicinity. These days include:20
2–4, 6–9, 14–15, 17–19, and 23–28 June. The period from 22 to 28 June also expe-rienced a steady buildup of aged pollutants (particularly of organic aerosols as shownin Sect. 4.3) due to more pronounced recirculation of pollutants coupled with warmertemperatures toward the end of June. These conditions resulted in the highest pollu-tion days (25 through 28 June) at the end of the campaign. Observations across the25
cleaner periods in the beginning of the campaign and the relatively more polluted pe-riods towards the end will thus provide an exceptional opportunity to examine aerosolformation and evolution processes in the same region under a range of environmental
1323

ACPD12, 1299–1400, 2012
CarbonaceousAerosols and
Radiative EffectsStudy
R. A. Zaveri et al.
Title Page
Abstract Introduction
Conclusions References
Tables Figures
J I
J I
Back Close
Full Screen / Esc
Printer-friendly Version
Interactive Discussion
Discussion
Paper
|D
iscussionP
aper|
Discussion
Paper
|D
iscussionP
aper|
conditions.The SW wind pattern was interrupted by northwesterly (NW) flows three times dur-
ing the campaign: 10–13, 16–17, and 20–21 June. During these NW flow events theSacramento urban plume was transported to the southeast along San Joaquin Val-ley, with relatively less mixing with biogenic emissions when compared to SW flow5
events. Conversely, the biogenic emissions at and around the T1 site were not sig-nificantly influenced by urban emissions during the NW flow periods. This contrastingfeature between the SW and NW flow events will be valuable in investigating the roleof anthropogenic-biogenic interactions in SOA formation from each source type. TheSW and NW flow periods are respectively identified with green and orange bars at10
the top in Fig. 5 (and subsequent figures showing time series of other variables), withsemi-transparent orange shading shown through all the plots for the NW flow periods.
The wind speeds at both T0 and T1 sites were generally small (<4 m s−1), with largevalues occurring around noon and the smallest values around midnight. Diurnal varia-tions in surface temperatures at the T0 and T1 sites were similar, with highs between15
25 and 35 ◦C occurring around 18:00 PDT and lows between 10 and 15 ◦C occurringaround 06:00 PDT. Due to the higher elevation of the T1 site, the air was usually a fewdegrees (0 to 5 ◦C) cooler at T1 than at T0. The last three days (26–28 June) werethe warmest of the entire campaign, with temperatures at T0 reaching a maximum of39 ◦C on 27 June. Relative humidity displayed an opposite diurnal behavior compared20
to temperature, with highs between 70 and 90 % occurring at 06:00 PDT and lows ofabout 20 % occurring around 18:00 PDT.
4.2 Trace gases observations
Figure 6 shows comparisons of the time series of key trace gases (SO2, CO, NOy, O3,toluene, and isoprene) observed at the T0 and T1 sites (SO2 was not measured at25
T1). The plots also show the same observations made on the G-1 aircraft when it flewover or within 2 km (horizontally) of the T0 and T1 sites. Major sources SO2 from oilrefineries are located around the Carquinez Strait in the Bay Area. As a result, SO2 was
1324

ACPD12, 1299–1400, 2012
CarbonaceousAerosols and
Radiative EffectsStudy
R. A. Zaveri et al.
Title Page
Abstract Introduction
Conclusions References
Tables Figures
J I
J I
Back Close
Full Screen / Esc
Printer-friendly Version
Interactive Discussion
Discussion
Paper
|D
iscussionP
aper|
Discussion
Paper
|D
iscussionP
aper|
routinely transported to the Sacramento area and into the Central Valley during SW flowand SO2 mixing ratios of 1.5 to 2 ppbv were observed at T0 during the daytime underthese conditions. In contrast, SO2 mixing ratios were nearly zero at the T0 site at nightor during NW flow. SO2 mixing ratios measured onboard the G-1 during overpassesat T0 were typically equal to or up to 50 % higher than those measured at the T0 site.5
Such differences between ground and airborne observations could be expected as theSO2 plume was quite narrow with sharp gradients.
As expected, the T0 urban site experienced significantly higher CO mixing ratioscompared to the T1 site in the rural foothills area. The minimum values at T0 weregenerally around 100 ppbv while they were as low as 80 ppbv at the T1 site. The highs10
at T0 were typically about 400 ppbv around noon, with occasional spikes reaching up to1000 ppbv, likely due to local vehicular traffic at the site. During the NW flow periods COmixing ratios ranging from 400 to 1000 ppbv were observed around midnight, likely dueto transport of pollution from Interstate I-80 just 2 miles north of the T0 site. The highs atT1 were typically around 200 ppbv, which occurred in the evening after 18:00 PDT when15
the diluted Sacramento plume was transported to the site under SW winds. CO mixingratios measured onboard the G-1 were in very good agreement with those measuredat the respective ground sites during the overpasses, except when the ground sitesexperienced spikes due to local emissions. Diurnal behavior of NOy mixing ratios atT0 was similar to that of CO, with lows around 3 ppbv and highs ranging between 2020
and 40 ppbv. During the NW flow periods, NOy mixing ratios ranged between 40 and80 ppbv at midnight. The G-1 based NOy observations were also in good agreementwith the ground sites.
The diurnal behavior of O3 mixing ratios at the T0 and T1 sites were quite similar de-spite the marked differences in the precursor trace gas composition and concentrations25
between the two sites. The highs ranged between 60 and 80 ppbv, except for a peakof nearly 120 ppbv on 28 June. The daily O3 peaks at T0 typically occurred around15:00 PDT while it was often delayed by ∼3 h at T1 on days when the urban plumewas transported to the site during the SW flow periods. The lows were typically around
1325

ACPD12, 1299–1400, 2012
CarbonaceousAerosols and
Radiative EffectsStudy
R. A. Zaveri et al.
Title Page
Abstract Introduction
Conclusions References
Tables Figures
J I
J I
Back Close
Full Screen / Esc
Printer-friendly Version
Interactive Discussion
Discussion
Paper
|D
iscussionP
aper|
Discussion
Paper
|D
iscussionP
aper|
20 ppbv at night and early morning at both sites throughout the campaign, except dur-ing the NW flow periods when O3 mixing ratios at T0 were nearly zero at midnight dueto titration by increased NO emissions reaching the site. O3 measured aloft during theG-1 overpasses were in excellent agreement with the respective ground sites.
The toluene time series is shown here as representative of primary urban VOC emis-5
sions. As expected, its diurnal behavior at both sites was similar to that of CO. Thehighs at T0 ranged from about 0.5 to 1 ppbv under SW flow and from 1.5 to 3 ppbv dur-ing NW flow conditions. In contrast, the diurnal behavior of biogenic isoprene mixingratios at both the sites followed that of the surface temperatures. The highs rangedbetween 2 and 12 ppbv around 14:00 PDT while the lows were nearly zero from mid-10
night until dawn. Since the T1 site was located amidst biogenic emissions, isoprenemixing ratios at T1 were generally about 0.5 to 3 ppbv higher than at T0. Also, sinceboth toluene and isoprene are primary species (emitted at the surface) and chemicallyreactive, their mixing ratios observed aloft onboard the G-1 were typically about 20 to50 % lower than at the ground sites during overpasses.15
4.3 Aerosol observations
4.3.1 Aerosol composition
Figure 7 shows comparisons of time series of non-refractory aerosol species concen-trations observed with the HR-ToF-AMS instruments and black carbon mass observedwith SP2 instruments at the T0 and T1 sites. The plots also show the same observa-20
tions made on the G-1 aircraft during overpasses at the ground sites. Non-refractoryaerosol composition at both the ground sites and aboard the G-1 was dominated byorganics, followed by sulfate, followed by nitrate and ammonium, while chloride wasnegligibly small (not shown). Organic aerosol (OA) displayed a diurnal cycle that wassimilar to that of O3 at both sites. The peak OA mass concentrations at the T0 site25
ranged from 2 to 6 µg m−3 STP (i.e., at standard temperature and pressure of 273.15 Kand 1 atm, respectively) around 15:00 PDT when O3 mixing ratio also reached its daily
1326

ACPD12, 1299–1400, 2012
CarbonaceousAerosols and
Radiative EffectsStudy
R. A. Zaveri et al.
Title Page
Abstract Introduction
Conclusions References
Tables Figures
J I
J I
Back Close
Full Screen / Esc
Printer-friendly Version
Interactive Discussion
Discussion
Paper
|D
iscussionP
aper|
Discussion
Paper
|D
iscussionP
aper|
maximum, which is consistent with SOA production from photochemical oxidation ofanthropogenic and biogenic VOCs. Minimum OA mass concentrations of less than0.5 µg m−3 STP typically occurred at or after midnight as the wind direction shiftedto southeasterly, which brought relatively cleaner background air into the urban area.While the OA mass concentrations remained low during the daytime under NW flow5
conditions, they were often found to peak around midnight at the T0 site. CO, NOy,toluene, and BC concentrations also peaked during these events, suggesting that thiswas primary OA emitted along I-80 (possibly from the road work being performed atnight during the campaign period) and brought to the site with NW winds.
In contrast, OA mass concentration at the T1 site peaked at 18:00 PDT or later as10
the urban plume was transported to the site during the SW flow periods. Note thatthe peak concentrations at T1 were similar to or slightly higher than those observedat the T0 site even though the urban plume experienced significant dilution as it wastransported to the T1 site. During this transit the urban plume mixed with increasedbiogenic emissions, which could have potentially contributed the additional SOA mass15
that was observed at T1. Furthermore, the OA mass concentrations at the T1 siteoften remained high at night and experienced a minimum of ∼2 µg m−3 STP in themorning. Preliminary WRF simulation results suggest that the aged OA accumulatingin the foothills area at night were frequently recirculated to the Sacramento urban areawithin the residual layer the next morning. Evidence of enriched organic aerosol mass20
in the residual layer is presented at the end of this subsection. As mentioned earlier,the period from 22 to 28 June experienced a steady buildup of aged OA due to morepronounced recirculation of pollutants in the area coupled with possibly more SOA for-mation from increased biogenic emissions due to warmer temperatures. The OA massconcentrations observed onboard the G-1 were in good agreement with the ground25
sites values during the overpasses, although there were a factor of 1.5 to 2 higher thanobserved at T1 during the 27 and 28 June flights, likely due to strong spatial gradientsof OA in the air in the vicinity of that site on those days.
Sulfate (SO4) mass concentrations typically ranged from 0 to 2 µg m−3 STP at both
1327

ACPD12, 1299–1400, 2012
CarbonaceousAerosols and
Radiative EffectsStudy
R. A. Zaveri et al.
Title Page
Abstract Introduction
Conclusions References
Tables Figures
J I
J I
Back Close
Full Screen / Esc
Printer-friendly Version
Interactive Discussion
Discussion
Paper
|D
iscussionP
aper|
Discussion
Paper
|D
iscussionP
aper|
the ground sites, with highs occurring early afternoon and lows around midnight. Am-monium (NH4) mass concentrations followed SO4, suggesting it was mostly in theform of ammonium sulfate or bisulfate. In contrast, nitrate (NO3) mass concentrationstended to peak later in the afternoon and appeared to follow OA mass. SO4 and NH4mass concentrations observed onboard the G-1 were in fairly good agreement with5
the corresponding values at both the ground sites during the overpasses, although theG-1 based SO4 concentrations were sometimes found to be up to 50 % lower than theground sites values. In comparison, NO3 mass concentrations aloft were found to be50 % higher than the ground sites values during overpasses.
Lastly, as expected, the T0 site experienced significantly higher BC mass concen-10
trations than the rural T1 site. The BC mass concentrations tended to follow the COmixing ratios in time. During the SW flow periods, the nighttime minimum values at boththe sites were about 0.02 µg m−3 STP or lower while the daytime maximum values wereup to about 0.3 µg m−3 STP. Interestingly, after 22 June, the daily minimum BC massconcentrations ranged between 0.05 and 0.07 µg m−3 STP as there was increased re-15
circulation of aged aerosols and a steady buildup of OA mass concentrations in theregion. The pre- and post-22 June periods thus provide opportunities to examine SOAformation and BC mixing state evolution in the same region under significantly differentageing time scales. BC mass concentrations measured onboard the G-1 were in verygood agreement with those measured at the respective ground sites during the over-20
passes. As discussed earlier, during the NW flow periods BC mass concentrationsusually peaked at the T0 site at midnight, with values ranging from 0.5 to 1 µg m−3
STP. These events provide opportunities to characterize the size distribution, composi-tion, mixing state, and the associated optical and CCN activation properties of freshlyemitted BC and OA particles.25
Enhanced concentrations of aged organic aerosols, likely recirculated from the pre-vious day, were often observed in the residual layer (Stull, 1988) during the morningflights over the Sacramento urban area. Figure 8 illustrates such an occurrence duringthe morning flight on 15 June. The top panel shows a map with the G-1 flight tracks
1328

ACPD12, 1299–1400, 2012
CarbonaceousAerosols and
Radiative EffectsStudy
R. A. Zaveri et al.
Title Page
Abstract Introduction
Conclusions References
Tables Figures
J I
J I
Back Close
Full Screen / Esc
Printer-friendly Version
Interactive Discussion
Discussion
Paper
|D
iscussionP
aper|
Discussion
Paper
|D
iscussionP
aper|
(solid lines) color coded by altitude. The flight started at 08:56 PDT and consistedof several legs crisscrossing over the T0 site at ∼360 and ∼660 m MSL altitudes. Aspiral up to about 1300 m MSL was performed at about 09:30 PDT over a location be-tween the T0 and T1 sites. The G-1 then flew back and forth along the foothills from11:00 PDT to 11:50 PDT, passing over the T1 site three times. The left portion of the5
bottom panel shows the vertical profile of potential temperature obtained during thespiral. Based on the inflections in this profile, the boundary layer height was estimatedat about 590 m MSL and the residual layer height was estimated to extend up to about950 m MSL, which implies that the G-1 legs at 360 m MSL were within the boundarylayer while the legs at 660 m MSL were in the residual layer. The right portion of the10
bottom panel shows the G-1 flight altitude plotted against local time, with the approxi-mate locations of the T0 and T1 sites noted at the bottom of the plot along the time axis.The plot also includes OA and NO3 mass concentrations and NOx/NOy ratio along theflight as a function of local time. NOx/NOy ratios were as high as 0.8 (right over theurban center) within the boundary layer due to fresh emissions of NOx in the morning.15
NOx/NOy ratios were between 0.2 and 0.3 in the residual layer, which is indicative ofaged pollution. Interestingly, OA mass concentrations in the boundary layer were onlyabout 2 µg m−3 STP while they were about 6 µg m−3 STP in the aged residual layer.Similarly, NO3 concentrations were about 0.5 µg m−3 STP in the boundary layer andabout 1.5 µg m−3 STP in the residual layer.20
The dotted white and pink lines in the top panel of Fig. 8 represent forward trajecto-ries (computed using WRF forecasts) of air parcels that originated over the ocean (atsurface level) off the coast of San Francisco on 14 June at 19:00 PDT and 15 June at02:00 PDT, respectively, such that both air parcels arrived over the T0 site on 15 Juneat 10:00 PDT (i.e., during the time period when G-1 was sampling in the area). The25
filled circles along the trajectories mark the locations of the air parcels at hourly inter-vals. The air parcel along the pink trajectory was present within the boundary layer andhad passed over the Sacramento downtown area at about 08:00 PDT before reachingT0 at 10:00 PDT. In contrast, the air parcel along the white trajectory was present in the
1329

ACPD12, 1299–1400, 2012
CarbonaceousAerosols and
Radiative EffectsStudy
R. A. Zaveri et al.
Title Page
Abstract Introduction
Conclusions References
Tables Figures
J I
J I
Back Close
Full Screen / Esc
Printer-friendly Version
Interactive Discussion
Discussion
Paper
|D
iscussionP
aper|
Discussion
Paper
|D
iscussionP
aper|
residual layer, and it had undergone a recirculation in the Sacramento Valley at nightbefore arriving over the T0 site at 10:00 PDT. These results are consistent with theaerosol composition and NOx/NOy ratio observed in the boundary and residual layersas discussed above. Detailed analyses of the chemical composition of the aerosols inthe boundary and residual layers will be conducted, and the potential contributions of5
the Bay Area and Sacramento emissions and the ensuing daytime as well as nighttimechemistry in the formation of these aerosols will be examined in subsequent studies.
4.3.2 Aerosol number concentration and size distribution
Figure 9 shows time series of aerosol number concentrations above 10 nm diameter(denoted as N>10) measured by the CPC-3010 instruments at the T0 and T1 sites along10
with the CPC-3010 observations onboard the G-1 during the overpasses above thesesites. These number concentrations are put in context with the time series of SO2 mix-ing ratio at the T0 site along with the G-1 overpasses at T0. During SW flow periods,the T0 site experienced significant increases in aerosol number concentrations fromthe nighttime lows of ∼5000 cm−3 to about 35 000 cm−3 (maximum of 45 000 cm−3)15
between 08:00 and 13:00 PDT. These rapid increases in number concentrations coin-cided with increases in SO2 mixing ratios from below detection limit at night to about1–2 ppbv, suggesting that these particles were either nucleated at the T0 site via H2SO4formation from SO2 photooxidation, followed by growth to 10 nm and larger sizes, orthey were transported to the T0 site shortly after nucleating elsewhere, with contin-20
ued growth during transit. The increases in the number concentrations at the T1 sitewere usually delayed by 1–3 h compared to the T0 site and the daily maximum valuesreached up to 20 000 cm−3 (i.e., about a factor of 2 lower than at T0). Unfortunately,SO2 was not measured at the T1 site, so a similar comparison could not be made.As the SO2 mixing ratios were small and mostly below detection limit during the NW25
flow periods, the daytime increases in N>10 values were also significantly reduced atboth the sites, with highs reaching less than 20 000 and 10 000 cm−3 at T0 and T1, re-spectively. The daily increases in N>10 values at T0 and T1 were also greatly reduced
1330

ACPD12, 1299–1400, 2012
CarbonaceousAerosols and
Radiative EffectsStudy
R. A. Zaveri et al.
Title Page
Abstract Introduction
Conclusions References
Tables Figures
J I
J I
Back Close
Full Screen / Esc
Printer-friendly Version
Interactive Discussion
Discussion
Paper
|D
iscussionP
aper|
Discussion
Paper
|D
iscussionP
aper|
during the period from 25 through 28 June despite the high SO2 mixing ratios observedaboard the G-1 during overpasses. This reduction in N>10 was likely due to the steadybuildup of aged aerosols of larger sizes, which effectively suppressed new particle for-mation and survival of newly formed particles by providing large pre-existing surfacearea for H2SO4 condensation and coagulation. The CPC-3010 number concentrations5
observed aboard the G-1 were in excellent agreement with those measured at bothground sites during the overpasses through the entire campaign.
The G-1 also carried a CPC-3025 which measured the total number concentrationsof particles larger than 3 nm, denoted as N>3. Figure 10a shows a scatter plot of all theCPC-3025 versus CPC-3010 number concentrations observed aboard the G-1, with10
points colored by SO2 mixing ratio that was also observed aboard the G-1. Note thatvalues of both N>3 and N>10 were generally found to increase with increasing SO2mixing ratios, and while the N>3/N>10 ratios reached as high as 4, the high valuesgenerally did not coincide with enhanced SO2 mixing ratios, with some of the highestratios corresponding to the lowest SO2 mixing ratios. This result is reasonable if the15
increased sulfate formation (and SOA) caused the large number of newly formed par-ticles to more rapidly grow larger than 10 nm. Figure 10b shows the same scatter plot,with points colored by isoprene mixing ratio observed aboard the G-1. Points with iso-prene mixing ratios less than 1 ppbv were removed from the plot for clarity. Note thatthe highest N>3/N>10 ratios corresponded to the highest isoprene mixing ratios (and20
the lowest SO2 mixing ratios), suggesting that biogenic species may have played animportant role (in the absence of appreciable amounts of SO2) in new particle formationand their initial growth to detectable sizes.
Figure 11 shows the time series of aerosol number size distributions at the T0 andT1 sites. The plot for each site consists of size distribution data from the Scanning Mo-25
bility Particle Sizer (SMPS) and Aerosol Particle Sizer (APS) instruments. The SMPSmeasures particle mobility diameter (Dm) ranging from 0.01 to 0.7 µm while the APSmeasures particle aerodynamic diameter (Da) ranging from 0.5 to 20 µm. Note thatthe size distribution data from both the instruments are plotted using the same color
1331

ACPD12, 1299–1400, 2012
CarbonaceousAerosols and
Radiative EffectsStudy
R. A. Zaveri et al.
Title Page
Abstract Introduction
Conclusions References
Tables Figures
J I
J I
Back Close
Full Screen / Esc
Printer-friendly Version
Interactive Discussion
Discussion
Paper
|D
iscussionP
aper|
Discussion
Paper
|D
iscussionP
aper|
scheme but with instrument-specific color scales that differ by three orders of magni-tudes.
The APS data at both ground sites show the appearance of coarse mode particleson several days (e.g., 8, 14, 15, 18 June) when the wind direction was predominantlysouthwesterly. As discussed in the previous section and shown in Fig. 8 for 15 June,5
WRF tracer forecast simulations for these periods indicated appreciable transport ofair from the Pacific Ocean into Sacramento through the Carquinez Strait, suggestingthat the coarse particles were composed of sea salt, with some dust particles mixedinto the air mass along the way. Indeed, the single particle mass spectrometer data(discussed in the next subsection) support this hypothesis. The coarse particles were10
mostly absent during the NW flow periods.Consistent with the N>10 time series shown previously in Fig. 9, the SMPS data at
both ground sites show the appearance of ∼10 nm diameter particles in large concen-trations between 08:00 to 10:00 PDT. These particles were then found to rapidly growuntil mid-afternoon, with the particle composition data indicating this was largely due15
to condensation of secondary organics and to a lesser extent due to condensation ofsulfuric acid, nitric acid, and ammonia as shown previously in Fig. 7. More detailedanalysis of carefully selected aerosol growth events should provide valuable informa-tion for constraining aerosol chemistry and microphysics models to evaluate and testSOA formation and BC ageing mechanisms under different conditions. Such studies20
will be the subject of subsequent papers.
4.3.3 Aerosol mixing state from SP-MS instruments
A state-of-the-art single particle mass spectrometer (SP-MS) instrument was deployedat each site and on the G-1 to obtain a more complete picture of the different par-ticle types and evolution of aerosol mixing states. SPLAT II was located at the T025
site to continuously measure the size, composition, and density of individual particleswith diameters between 50 to 2000 nm. Each day, SPLAT II characterized the size of∼7 million and composition of ∼350 000 particles. It also measured the aerosol size
1332

ACPD12, 1299–1400, 2012
CarbonaceousAerosols and
Radiative EffectsStudy
R. A. Zaveri et al.
Title Page
Abstract Introduction
Conclusions References
Tables Figures
J I
J I
Back Close
Full Screen / Esc
Printer-friendly Version
Interactive Discussion
Discussion
Paper
|D
iscussionP
aper|
Discussion
Paper
|D
iscussionP
aper|
distribution and number concentrations of particles with diameters larger than 85 nm(Vaden et al., 2011b,c). Simultaneous measurements of individual particle size, den-sity and composition were conducted for 121 000 individual particles. These measure-ments were performed 2–3 times per day. In addition, SPLAT II was used to conductthe first measurements of the kinetics of evaporation, phase, and morphology for size-5
selected ambient SOA particles at ambient temperature (Vaden et al., 2011a).PALMS was located at the T1 site to sample the relatively aged urban aerosols.
PALMS measured the same quantities as SPLAT II (i.e., particle size, composition, anddensity) on a single particle basis. PALMS is not an automated instrument and there-fore could not be run unattended. Data were nonetheless acquired on most field days,10
with a particular emphasis on acquisition during aircraft flights and afternoon periodswhen the Sacramento plume had transited to the T1 site. PALMS detected individualparticles from ∼125 to 3000 nm, although it is noteworthy that transmission rate rapidlydropped at sizes lower than ∼200 nm and greater than ∼2000 nm. In total ∼100 000particles were analyzed. Particular emphasis was placed on collecting PALMS data15
simultaneously with f (RH) measurements to determine the effect of chemical compo-sition on particle hygroscopicity (Cziczo et al., 2011) (an f (RH) measurement was alsomade at the T0 site during the second half of the campaign).
An A-ATOFMS was flown on the G-1 to measure the size-resolved mixing state ofindividual particles with diameters ranging from 70 to 1200 nm. Dual polarity mass20
spectra were acquired which allows for the identification of the source and the extentof atmospheric processing of the particles. Over all flights, ∼60 000 particles wereanalyzed. Due to particle transmission efficiencies, most particles that were sampledranged from 100 to 1000 nm diameters, with a mode centered at ∼360 nm during mostflights. These airborne measurements will be particularly useful in understanding how25
the mixing state of different types of particles evolved in the Sacramento urban plumeas it was advected downwind.
Analysis of individual particle mass spectra at all locations indicates that at anygiven time there were always a number of different types of particles with different
1333

ACPD12, 1299–1400, 2012
CarbonaceousAerosols and
Radiative EffectsStudy
R. A. Zaveri et al.
Title Page
Abstract Introduction
Conclusions References
Tables Figures
J I
J I
Back Close
Full Screen / Esc
Printer-friendly Version
Interactive Discussion
Discussion
Paper
|D
iscussionP
aper|
Discussion
Paper
|D
iscussionP
aper|
compositions and size distributions present. Figure 12 shows the average fraction ofparticles observed by A-ATOFMS for each G-1 flight and 12-minute averaged fractionof particles observed by PALMS at the T1 site classified into specific particle types.The vast majority of aerosol particles characterized during the study were composedof oxygenated organics mixed with various amounts of sulfates: from sulfate-dominated5
particles to those containing mostly organic species. In addition, fresh and processedsoot particles, biomass burning aerosol, amines, sea salt (both fresh and processed),and a small number of mineral dust and other inorganic particles were present. Therelatively larger number fraction of sea salt particles observed aloft by the G-1 and atboth ground sites on 8 and 15 June is consistent with the APS size distribution data10
shown previously in Fig. 11.SPLAT II data for 6 June are shown in Fig. 13 to illustrate a more detailed view of
the evolution of relative fractions of different particle types in a single day. Early inthe morning aerosol mass loadings and number concentrations were low and mostparticles were composed of organics mixed with a significant fraction of sulfate. Larger15
particles containing a higher fraction of sulfate were evident from the size-dependenceof particle density. An example of size-dependent particle density data measured bySPLAT II is illustrated in Fig. 14. In general, density tended to increase with particlesize. For example, during the morning of 6 June, 80 nm particles had a density of∼1.3 g cm−3 while the density of 200 nm particles was ∼1.6 g cm−3.20
By around 09:00 PDT, the number concentrations of particles smaller than 14 nm(measured by SMPS) began to increase, which indicated the growth of newly formedparticles by SOA condensation. As the day progressed and the emitted VOCs wereoxidized, SOA-containing particles increased in size, making it possible to characterizetheir size, composition, and density with SPLAT II. By early afternoon aerosol com-25
position was dominated by oxygenated organics mixed with small amount of aminesand sulfate (∼10 % volume fraction), and the density of 80 nm to 150 nm particles was∼1.3 g cm−3. These SOA-dominated particles were then used to study evaporation ki-netics at room temperature (Vaden et al., 2011a). The results of this study show that
1334

ACPD12, 1299–1400, 2012
CarbonaceousAerosols and
Radiative EffectsStudy
R. A. Zaveri et al.
Title Page
Abstract Introduction
Conclusions References
Tables Figures
J I
J I
Back Close
Full Screen / Esc
Printer-friendly Version
Interactive Discussion
Discussion
Paper
|D
iscussionP
aper|
Discussion
Paper
|D
iscussionP
aper|
evaporation of these size- and composition selected ambient organic particles was ex-tremely slow and size-independent, suggesting that the particles were in a quasi-solidstate.
While the single particle data described above provide valuable information, they areparticularly useful when used in combination with other instruments. Three examples5
are noteworthy and are listed among the analyses envisioned in the next subsection.First, BC concentration, size and coating state can be obtained by the SP2 instrumentwhich was deployed at both ground sites and aboard the G-1 during CARES. The SP-MS data complement the SP2 data by providing a qualitative measure of the chemicalcomposition of the coating material internally mixed with the BC. Second, biomass10
burning aerosol was episodically present during CARES, particularly during the warmerand drier period later in the field study. Gas-phase acetonitrile can be used as a tracerto detect the presence of biomass burning aerosol and the resulting perturbations toSOA when biomass burning aerosol was present can be investigated. Finally, SP-MSdata can be used to determine periods of particular interest for off-line analyses of15
collected and archived TRAC, DRUM, and SEM samples to further probe the chemicalcomposition, mixing state, and morphology of particles.
4.3.4 BC mixing state from SP2 instruments
The single particle soot photometer (SP2) measures BC via laser-induced incandes-cence and can obtain some useful information about particle size, relative coating thick-20
ness and mixing-state based on the scattering signal from the both BC and non-BCcontaining particles (Stephens et al., 2003; Schwarz et al., 2006; Subramanian et al,2010). The heart of the SP2 is the laser-induced (1064 nm, Nd:YAG) incandescencesignal from BC. Incorporation of narrowband and broadband filters enables the SP2 tobe highly selective towards BC. The incandescence intensity is linearly proportional to25
the BC: more mass leads to stronger incandescence. In addition to providing data onthe BC number density and mass concentration, since the SP2 is inherently a particle-by-particle instrument, individual incandescence signals can be collected and binned
1335

ACPD12, 1299–1400, 2012
CarbonaceousAerosols and
Radiative EffectsStudy
R. A. Zaveri et al.
Title Page
Abstract Introduction
Conclusions References
Tables Figures
J I
J I
Back Close
Full Screen / Esc
Printer-friendly Version
Interactive Discussion
Discussion
Paper
|D
iscussionP
aper|
Discussion
Paper
|D
iscussionP
aper|
to provide a mass equivalent diameter (MED) size distribution (dNBC/dLogDMED) andmass distribution, (dMBC/dLogDMED). The nominal BC mass detection range for theSP2 units deployed at CARES was from ∼0.2 fg/particle to ∼250 fg/particle – 60 nm to650 nm MED, for an assumed particle density of 1.9 g cm−3.
The SP2 is also outfitted with a scattering channel that, when combined with the in-5
candescence signal, allows the BC mixing-state to be probed (Moteki and Kondo 2008;Subramanian et al., 2010). The cornerstone of this technique is that a fully coated BCparticle must first boil-off its coating before the BC will incandesce. The time necessaryto vaporize this coating is referred to as the lagtime (∆τ), which is the temporal lag ofthe incandescence signal relative to the scattering signal – the larger the lagtime the10
thicker the coating, although the relationship between these two quantities is complex.By plotting the observed lagtimes versus the BC MED, a semi-quantitative picture ofthe BC mixing-state can be rendered enabling the evolution of the mixing-state to bedirectly probed. As advocated by Moteki and Kondo (2008) and more recently by Sub-ramanian et al. (2010), due to instrument limitations, a demarcation between “thinly”15
coated (nascent) BC and “thickly” coated BC is strongly encouraged when using thelagtime analysis. For the current study, this dividing line between thinly and thicklycoated BC particles is 1.25 µs; that is, ∆τ > 1.25 µs indicates the presence of thicklycoated BC particles while shorter lagtimes designate the presence of thinly coated BCparticles. In addition to the lagtime analysis, the complementary analysis technique20
of estimating the coating thickness through examination of the difference between cal-culated BC core mass equivalent diameter and an estimate of the coated BC particlediameter determined from the scattering signal amplitude, was also conducted (Gao etal., 2007; Moteki and Kondo 2006).
An example of the incandescence-scattering lagtime analysis as a function of BC25
mass equivalent diameter is shown in Fig. 15 for the 28 June morning and afternoonflights. Contours are normalized number concentrations in an effort to highlight thedifferences between the two flights (red=0.9/blue=0.2). Using the linear relationshipbetween lagtime and coating thickness shown by Subramanian et al. (2010), the right
1336

ACPD12, 1299–1400, 2012
CarbonaceousAerosols and
Radiative EffectsStudy
R. A. Zaveri et al.
Title Page
Abstract Introduction
Conclusions References
Tables Figures
J I
J I
Back Close
Full Screen / Esc
Printer-friendly Version
Interactive Discussion
Discussion
Paper
|D
iscussionP
aper|
Discussion
Paper
|D
iscussionP
aper|
axis is the estimated coating thickness outlined above. It is important to note thatan SP2-based analysis of the BC mixing state requires usable signals from both thescattering and incandescence channels. Despite the fact that the incandescence signalcan probe BC mass equivalent diameter ranging from nominally 60–600 nm, the limitedrange of the scattering channel (∼175 nm to 350 nm) limits this analysis to only those5
coated BC particles that fall into the latter range. Examination of the morning flightlagtime data (top trace in Fig. 15) reveals that the observed distribution is dominated bythinly coated BC particles while the 28 June afternoon flight reveals an increase in thenumber of thickly coated BC cores, consistent with BC ageing. Preliminary analysisof the BC mass distributions for the two flights reveal that the mean mass diameter10
(MMD) increases from 137 (±1.2) with a geometric standard deviation (GSD) of 1.4(±0.03) for the morning flight to 142 (±1.1) nm with a (GSD) of 1.4 (±0.03), where theerror is 1-σ. Whether this MMD shift (or alternatively, loss of smaller diameter, thicklycoated BC particles) is due to instrument limitation(s) or advection will be the subject ofthe ensuing analysis on this G-1 dataset. Additional lines of analysis will include better15
quantification of the BC mixing-state (coating thickness) by correcting the estimatedcoating thicknesses for host material loss due to heat transfer from the light absorbingcore (Gao et al., 2007; Moteki and Kondo, 2006) and estimating the ratio of the coatingmass/BC mass as well as examining the light absorbing properties in the core-shelllimit. Towards this end, preliminary analysis indicates an increase in the coating mass20
to BC ratio between the morning and afternoon flights.
4.3.5 Offline analyses of particle samples
Comprehensive analyses of particle samples collected at T0, T1 grounds sited and on-board the G-1 can be performed using an array of modern, state-of-the-art analyticaltechniques available at two DOE scientific user facilities (Environmental Molecular Sci-25
ences Laboratory at Pacific Northwest National Laboratory and Advanced Light Sourceat Lawrence Berkeley National Laboratory) and at Michigan Technological University(Applied Chemical and Morphological Analysis Laboratory). The primary techniques
1337

ACPD12, 1299–1400, 2012
CarbonaceousAerosols and
Radiative EffectsStudy
R. A. Zaveri et al.
Title Page
Abstract Introduction
Conclusions References
Tables Figures
J I
J I
Back Close
Full Screen / Esc
Printer-friendly Version
Interactive Discussion
Discussion
Paper
|D
iscussionP
aper|
Discussion
Paper
|D
iscussionP
aper|
for analysis are Computer Controlled Scanning Electron Microscopy with Energy Dis-persed analysis of X-rays (CCSEM/EDX) (Li et al., 2003; Laskin et al., 2006) andScanning Transmission X-ray Microscopy with Near Edge X-ray Absorption Fine Struc-ture spectroscopy (STXM/NEXAFS) (Moffet et al., 2011c). These techniques provideinformation on particle morphology, elemental composition, mixing states, and par-5
titioning of oxidation states, which yield deeper insights into atmospheric ageing ofdifferent types of aerosols. Although particle samples were collected continuously atthe ground sites and on many G-1 flights, only a small subset will be chosen for de-tailed analysis. The periods of interest are chosen based on observations from othercollocated instruments and meteorological considerations.10
Figure 16 shows examples of SEM images of aerosol particles collected at the T0site. The low magnification image (a) includes (i) a large dust particle, (ii) relativelysmall spherical particles, (iii) fractal-like soot particles, and (iv) an irregularly shapedparticle. Image (b) shows a close-up view of a fractal-like BC particle with an openstructure (i) without substantial coating and (ii) with coating. Since SEM imaging is15
operated under vacuum, volatile aerosol components typically evaporate from the fil-ter. An example of an evaporated liquid particle is visible in the lower right corner ofimage (b). Image (c) shows a compacted, internally mixed BC particle, and image(d) shows a particle with BC inclusion. These micrographs highlight the morphologi-cal complexities of freshly emitted and aged BC particles as well as of the underlying20
ageing mechanisms that produce the variation in coating thickness. From these im-ages it is also evident that coated and compacted internally mixed BC monomers arelarger in size and have higher polydispersity than monomer distributions in nascent BC.For example, the geometric mean diameter for thickly coated BC is 68 nm with a stan-dard deviation of 10 nm (Fig. 16b-(ii)), whereas for compacted internally mixed soot25
the geometric mean diameter of the monomers is 42.1 nm and the standard deviationis 10.2 nm (Fig. 16c), versus a geometric mean diameter of 39.8 nm and a standarddeviation of 5.6 nm for nascent soot (Fig. 16b-(i)). The polydispersity in various mixingstates affects the fractal and optical properties of soot. Future studies will focus on the
1338

ACPD12, 1299–1400, 2012
CarbonaceousAerosols and
Radiative EffectsStudy
R. A. Zaveri et al.
Title Page
Abstract Introduction
Conclusions References
Tables Figures
J I
J I
Back Close
Full Screen / Esc
Printer-friendly Version
Interactive Discussion
Discussion
Paper
|D
iscussionP
aper|
Discussion
Paper
|D
iscussionP
aper|
analysis of the aerosol mixing state and association with optical properties, the diurnalvariation of fractal properties of soot, the relation between particle morphology typeand optical properties, and the elemental composition of single particles using EDXanalysis.
In addition to information on carbonaceous particle ageing, composition, organic5
coatings, and size resolved mixing state, spectromicroscopy studies can also provideinformation on sulfur bonding (Hopkins et al., 2008), organic coatings on sea salt (Prattet al., 2010), and Fe oxidation states (Moffet et al., 2011a). Figure 17 shows character-istic SEM images and STXM/NEXAFS chemical maps for particles collected during thephotochemical aerosol buildup period at the end of the field campaign (27–29 June).10
Particles sampled on the morning of 27 June at T0 were primarily composed of inor-ganic cores surrounded by varying amounts of organics, whereas particles sampledat T1 on the afternoon of 28 June were primarily composed of a homogenous inor-ganic/organic mixed phase. This evidence of photochemical aging is analogous toobservations in Mexico City during the MILAGRO campaign (Moffet et al., 2010).15
The microscopy and spectromicroscopy methods discussed above help visualizeparticle morphology and internal structure at the nanometer scale (Moffet et al., 2011b;Laskin, 2011) and provide valuable chemical information on elemental composition(SEM/EDX) and organic group functionalities present in particles (STXM/NEXAFS).High resolution Nanospray Desorption Electrospray Ionization (Nano-DESI) mass20
spectrometry on field-collected particles can provide additional detailed informationon the molecular structures of organic aerosol species, but this method acquires in-tegrated signal from an ensemble of particles and therefore eliminates knowledge ofindividual particle composition (Roach et al., 2010). Thus, analyses of the various par-ticle samples collected during CARES will include complementary analytical methods25
that provide comprehensive information ranging from microscopic details of individ-ual particles to advanced molecular characterization of complex molecules comprisingparticulate matter.
Other types of offline chemical and radio isotopic analyses of ambient aerosol require
1339

ACPD12, 1299–1400, 2012
CarbonaceousAerosols and
Radiative EffectsStudy
R. A. Zaveri et al.
Title Page
Abstract Introduction
Conclusions References
Tables Figures
J I
J I
Back Close
Full Screen / Esc
Printer-friendly Version
Interactive Discussion
Discussion
Paper
|D
iscussionP
aper|
Discussion
Paper
|D
iscussionP
aper|
large amounts of samples, which were obtained during CARES using several high-volume samplers. Carbon levels in the submicron particle samples taken at the T1 sitewith high-volume samplers were found to be quite low, and visual examination indi-cated little BC present for most of the study. This result is qualitatively consistent withthe measurements of BC mass by the SP2 at the T1 site. Carbon-14 analysis of four5
samples collected over 12 and 24 h periods at the beginning and end of the CAREScampaign show that 74±0.6 % of the carbon was modern, suggesting that there wasa significant biogenic component in the carbonaceous aerosols. Furthermore, stablecarbon isotopic content (δ13C) for these samples was found to be −27.5 ±3.5‰ rela-tive to the Pee Dee Belemnite standard. This is equal to the global average δ13C for10
C3 plants such as Ponderosa Pines, which dominate the region (Ehleringer and Mon-son, 1993; Cerling and Harris, 1999). The combined data indicate that a significantamount of the carbonaceous aerosols at this site were from secondary organic car-bonaceous aerosols, likely produced from oxidation of isoprene, monoterpenes, andsesquiterpenes by ozone and OH radicals. Further work on these quartz filter samples15
is planned, including examination of natural radionuclides (7Be and 210Pb) as well asuse of integrating sphere methods to examine the UV-Visible absorption of the terpene-dominated SOA (Gaffney, et al, 2004; Marley, et al., 2009).
Another high-volume PM2.5 sampler was deployed at the T0 site from 2 to 15 Juneand at the T1 site from 16 to 28 June. Detailed chemical analysis of these samples is20
also planned, with a focus on studying the distribution of organic acids and aldehydeswith respect to total organic carbon (Jaoui et al., 2004).
4.4 Optical properties and radiation observations
4.4.1 In situ aerosol optical properties
In situ aerosol optical properties were measured at multiple wavelengths at each site25
with several instruments, including nephelometer, PSAP, PAS, and CRDS. The flow tothe nephelometer and PSAP instruments at each site was subjected to alternating size
1340
ACPD12, 1299–1400, 2012
CarbonaceousAerosols and
Radiative EffectsStudy
R. A. Zaveri et al.
Title Page
Abstract Introduction
Conclusions References
Tables Figures
J I
J I
Back Close
Full Screen / Esc
Printer-friendly Version
Interactive Discussion
Discussion
Paper
|D
iscussionP
aper|
Discussion
Paper
|D
iscussionP
aper|
cutoffs of 1 and 10 µm aerodynamic diameters for 6 min each; the difference betweenthe two gives the scattering and absorption by super-micron particles. Such variablesize cutoffs were not applied to flows on other instruments. Nephelometer, PSAP,and PAS instruments were also deployed aboard the G-1. As mentioned earlier, theaerosol inlet on the G-1 allowed transmission of particles up to 5 µm aerodynamic5
diameters, and no additional cutoffs were applied to the flows to the optical instruments.In this report we limit the discussion to the nephelometer, PSAP, and PAS observationsat green wavelength to illustrate the behavior and consistency of the scattering andabsorption coefficients observed on the three different platforms through the entirecampaign. Detailed analyses of the optical properties at different wavelengths from10
each instrument and a comparison of observations from all three instruments will bepresented in separate papers.
Figure 18 shows the time series of scattering coefficients (Bsp) measured at λ =550 nm by the nephelometers along with the surface area size distribution derived fromAPS measurements at both sites. Also shown are the scattering coefficients observed15
aboard the G-1 during overpasses at each site. Coarse mode particles were largelyabsent at both sites during the first week of June and later again during the NW flowperiods. During these periods, scattering coefficients for the 1 µm cutoff channel wererather low and ranged between 2 and 15 Mm−1 while scattering coefficients for the10 µm cutoff channel were only about 2 to 5 Mm−1 higher. On days when the volume20
size distributions indicate increased presence of coarse mode particles, scattering co-efficients for the 10 µm cutoff channels reached as high as 40 to 75 Mm−1 and 20 to50 Mm−1 at the T0 and T1 sites, respectively, and were about 2 to 4 times higher thanthe values for the 1 µm cutoff channel at each site. Scattering for both channels atboth sites shows a steady increase after 22 June, which is consistent with the steady25
buildup of submicron size aged aerosols in the region as discussed previously. Duringthis period, the increase in the scattering in the 10 µm channel was largely driven bythe increase in scattering in the 1 µm channel. According to the surface area size distri-bution data at both sites, about 95 % of the total surface area was present below 5 µm
1341

ACPD12, 1299–1400, 2012
CarbonaceousAerosols and
Radiative EffectsStudy
R. A. Zaveri et al.
Title Page
Abstract Introduction
Conclusions References
Tables Figures
J I
J I
Back Close
Full Screen / Esc
Printer-friendly Version
Interactive Discussion
Discussion
Paper
|D
iscussionP
aper|
Discussion
Paper
|D
iscussionP
aper|
aerodynamic diameter when a significant coarse mode was present. Consequently,the scattering coefficients observed aboard the G-1 were in very good agreement withor only slightly smaller than the 10 µm cutoff values at both the ground sites duringthe overpasses, through all periods of low and high concentrations of coarse modeparticles.5
Figure 19 shows time series of absorption coefficients (Bap) measured by PSAP(Da<1 µm) and PAS instruments at λ = 532 nm at both the sites. Also shown areabsorption coefficients measured with the PSAP (λ= 522 nm) aboard the G-1 duringoverpasses at each site. The ground sites PSAP data are 1-min averages, the G-1PSAP data are 10-sec averages, and the PAS data are 30-min averages. Through10
the entire campaign, PSAP absorption coefficients for the 10 µm cutoff channel (notshown) were nearly identical to the 1 µm cutoff values, indicating that the coarse modeparticles were largely non-absorbing at λ= 532 nm. The ground sites PSAP and PASabsorption coefficients are in good agreement. The PSAP absorption coefficients ob-served aboard the G-1 are also in very good agreement with the PSAP and PAS based15
values at both ground sites during the overpasses.
4.4.2 Ground-based remote sensing observations
A Multi-Filter Rotating Shadowband Radiometer (MFRSR) was deployed at eachground site to measure the total all-sky surface downwelling irradiance, and its dif-fuse and direct components. These were measured at six narrowband (10 nm, FWHM)20
wavelengths centered at 415, 500, 615, 673, 870, and 940 nm (visible and near-IRspectral region) with 20-s temporal resolution. The measured irradiances were usedto obtain column aerosol microphysical and optical properties, such as aerosol opti-cal depth (AOD), single scattering albedo (SSA), and asymmetry parameter, g. Thehigh-temporal resolution MFRSR observations at the two sites provided the diurnal,25
day-to-day, and site-by-site variations of AOD (Fig. 20). For example, the AOD values(at λ=500 nm) were observed to range from about 0.025 (which represents very cleanair) at the start of the campaign to about 0.12 towards the end of the campaign. Note
1342

ACPD12, 1299–1400, 2012
CarbonaceousAerosols and
Radiative EffectsStudy
R. A. Zaveri et al.
Title Page
Abstract Introduction
Conclusions References
Tables Figures
J I
J I
Back Close
Full Screen / Esc
Printer-friendly Version
Interactive Discussion
Discussion
Paper
|D
iscussionP
aper|
Discussion
Paper
|D
iscussionP
aper|
that there were several cloudy-sky periods when AOD values are not available.In addition to the AOD values, the MFRSR observations were used to retrieve aerosol
microphysical (e.g., size distribution, including fine and coarse size modes) and theintensive optical properties (SSA and g) using spectrally resolved direct and diffuseirradiances (Kassianov et al., 2007). The original version of this technique has been5
developed for clear sky conditions. Its updated version (Kassianov et al., 2011) extendsthe clear-sky aerosol retrievals to partly cloudy conditions, so that aerosol propertiescan be determined for some cloudy sky conditions. Similar to the AOD, the aerosol sizedistributions and intensive properties have significant variations over the course of thecampaign. To illustrate this we show temporal changes in the aerosol size distribution10
(a bimodal distribution consisting of fine and coarse modes) retrieved at the two sites(Fig. 21). It is notable that the coarse mode was substantial for several time periods(e.g., during 16 June). In general, the existence of a large coarse mode in the column,as retrieved from the MFRSR measurements, is consistent with measurements of thecoarse mode made by the APS instruments at the T0 and T1 sites (shown previously15
in Fig. 18).
4.4.3 Airborne remote sensing observations
Consistent with the ground sites and G-1 observations, the HSRL measurementsaboard the B-200 showed that aerosol extinction and AOD (532 nm) were generallyquite low during CARES; average AOD values (for the layer between 0.1 to 7 km) in20
and around the Sacramento area were generally between 0.05 and 0.1. Smaller val-ues were found earlier during the mission (e.g. 3 and 6 June); larger (>0.1) AOD valueswere measured later during the mission (e.g. June 28). The HSRL measurements alsoshowed that much (30–70 %) of the AOD was above the top of the planetary boundarylayer (PBL).25
The HSRL measurements of aerosol intensive parameters and aerosol optical depthhave also been used to identify aerosol types and apportion aerosol optical thickness tothe various aerosol types (Burton et al., 2011). Eight distinct types with different aerosol
1343

ACPD12, 1299–1400, 2012
CarbonaceousAerosols and
Radiative EffectsStudy
R. A. Zaveri et al.
Title Page
Abstract Introduction
Conclusions References
Tables Figures
J I
J I
Back Close
Full Screen / Esc
Printer-friendly Version
Interactive Discussion
Discussion
Paper
|D
iscussionP
aper|
Discussion
Paper
|D
iscussionP
aper|
intensive properties were identified. The identification of these types were guided bythe analyses of Cattrall et al. (2005) and Muller et al. (2007) that provide values of a setof lidar-observed aerosol intensive parameters corresponding to various aerosol types.The HSRL aerosol classification results were used to identify smoke aerosols duringthe ARCTAS mission (Warneke et al., 2010) and urban aerosols during the MILAGRO5
mission (Molina et al., 2010).The HSRL data indicate significant variability in the vertical and horizontal distribu-
tions of aerosols during CARES. An example of such aerosol variability is illustrated inFig. 22 which shows HSRL measurements acquired between 17:45 UT and 18:12 UTon 19 June when the B200 flew from the Sacramento region northeast over the moun-10
tains. Aerosol backscatter and AOD decreased as the aircraft flew northeast along thetrack. The variability of the aerosol intensive parameters (i.e. aerosol depolarization,depolarization spectral ratio, and backscatter wavelength dependence) is indicative ofchanges in aerosol type. Over Sacramento, lower depolarization and higher backscat-ter wavelength dependence is consistent with smaller, spherical particles typically seen15
over urban areas; in contrast, over the mountains east of Sacramento, higher depolar-ization and smaller backscatter wavelength dependence is consistent with larger, morenon-spherical particles often associated with dust.
The HSRL data showed a difference in the backscatter color ratio (532/1064 nm)and aerosol depolarization (532 nm) between the SW and NW flow regimes discussed20
in Sects. 4.1 and 4.3.2. These parameters were used to qualitatively classify theHSRL aerosol measurements into several aerosol types. The NW flow suggests larger,more non-spherical particles that, based on the prior observations and the classifica-tion scheme, appear like a dusty mix. The SW flow regime suggests, smaller, morespherical particles that are more consistent with urban and occasionally maritime con-25
ditions.
1344

ACPD12, 1299–1400, 2012
CarbonaceousAerosols and
Radiative EffectsStudy
R. A. Zaveri et al.
Title Page
Abstract Introduction
Conclusions References
Tables Figures
J I
J I
Back Close
Full Screen / Esc
Printer-friendly Version
Interactive Discussion
Discussion
Paper
|D
iscussionP
aper|
Discussion
Paper
|D
iscussionP
aper|
4.5 Aircraft observations of sacramento plume evolution
To complement the extensive observations at the T0 and T1 sites, the G-1 was de-ployed on selected days during both SW and NW flow periods to sample upwind of,within, and outside the evolving Sacramento urban plume as it was advected down-wind. Other flight plans included sampling the inflow from the Bay Area into the Central5
Valley and characterizing isoprene emission flux over the forested areas in the SierraNevada foothills. An intercomparison flight with the NOAA WP-3 was also carried on18 June in the San Joaquin Valley, from Fresno to Bakersfield, CA. The G-1 flew ata similar altitude as the WP-3 while the B-200 and NOAA Twin Otter flew above bothaircraft. Full analysis of all the aircraft data will be reported in the future. Here we10
briefly show an example of the G-1, B-200, and NOAA Twin Otter observations in theSacramento urban plume on 28 June as it was transported under light westerly windsto the foothills area by late afternoon. Figure 23 shows semi-Lagrangian tracks of theG-1 flight in the afternoon, with the points color coded by CO and (isoprene+methylvinyl ketone + methacrolein) mixing ratios in the top panels, organic aerosol and BC15
mass concentrations in the middle panels, and scattering and absorption coefficientsin the bottom panels. While the flight began at 14:20 PDT and ended at 17:42 PDT,only the portion of the flight between 15:51 and 16:51 PDT is shown here for clarity. Allflight legs in the valley were performed at an altitude of ∼340 m MSL while the leg overthe foothills area (passing over the T1 site) was performed at ∼850 m MSL due to the20
higher elevation of the terrain.The Sacramento urban plume is clearly noticeable from the enhanced CO mixing ra-
tios, with highs above 250 ppbv in the plume and lows around 120 ppbv in the surround-ing air. Sum of isoprene and its first generation photooxidation products – methyl vinylketone (MVK) and methacrolein (MACR) – were around 1 ppbv or less west of T0 and25
gradually increased to the east, with values between 4 and 8 ppbv over the foothills.Organics constituted more than 90 % of the total observed submicron aerosol massand was significantly enhanced in the urban plume, with highs over 25 µg m−3 STP and
1345

ACPD12, 1299–1400, 2012
CarbonaceousAerosols and
Radiative EffectsStudy
R. A. Zaveri et al.
Title Page
Abstract Introduction
Conclusions References
Tables Figures
J I
J I
Back Close
Full Screen / Esc
Printer-friendly Version
Interactive Discussion
Discussion
Paper
|D
iscussionP
aper|
Discussion
Paper
|D
iscussionP
aper|
lows ∼10 µg m−3 STP in the surrounding air. BC mass concentrations in the Sacra-mento plume ranged between 0.1 and 0.2 µg m−3 STP and were between 0.03 and0.07 µg m−3 STP in the surrounding air. High BC mass concentrations were also ob-served in the western-most portion of the flight track, which coincides with Woodland,a relatively small town (population ∼50 000) located about 25 km northwest of Sacra-5
mento. The nephelometer scattering coefficient in the plume was as high as 54 Mm−1
STP and the lows were ∼20 Mm−1 STP in the surrounding air. Finally, PSAP absorp-tion coefficient tracked with BC mass concentration and was as high as ∼8 Mm−1 STP;the values in the surrounding air ranged from ∼1 to 3 Mm−1 STP.
Figure 24 shows HSRL measurements of aerosol extinction profiles and AOD values10
(at λ= 532 nm) acquired along a portion of the B200 flight track over the Sacramentoregion during the afternoon of 28 June (15:56 PDT to 17:28 PDT). This portion of theB-200 flight track matched that of the G-1, which acquired comprehensive in situ ob-servations within these lidar “curtains”. The height of the boundary layer derived fromthe HSRL data varied between about 1200–2000 m above ground level. The B-20015
aerosol extinction and AOD values were enhanced east of the T0 site and were largestjust south of the T1 site, consistent with the location of the plume as identified from insitu G-1 observations. While the aerosol extinction derived from HSRL measurementsappears to be comparable to the estimated in situ extinction values (sum of scatteringand absorption), a detailed comparison of the two will be the topic of a separate study.20
Figure 25 depicts ozone profiles observed with the TOPAZ lidar (Fig. 25a) and NO2vertical column densities (VCD) measured with the CU AMAX DOAS (Fig. 25 b) alongthe NOAA Twin Otter flight track over the Sacramento area on 28 June for two flightsegments from 11:28–12:03 and 13:04–13:52 PDT. The TOPAZ lidar data clearly showthe elevated ozone concentrations in the Sacramento plume downwind to the east of25
the city. Peak ozone concentrations in the plume approach 125 ppbv and were mea-sured about 30 km to the east of Sacramento at about 13:40 PDT. Mixing heights weregenerally between 800 and 1100 m MSL, except 1500 m MSL or higher within the coreof the Sacramento plume. The Twin Otter data were taken about three hour prior to the
1346

ACPD12, 1299–1400, 2012
CarbonaceousAerosols and
Radiative EffectsStudy
R. A. Zaveri et al.
Title Page
Abstract Introduction
Conclusions References
Tables Figures
J I
J I
Back Close
Full Screen / Esc
Printer-friendly Version
Interactive Discussion
Discussion
Paper
|D
iscussionP
aper|
Discussion
Paper
|D
iscussionP
aper|
G-1 and B-200 observations shown in Figs. 23 and 24. The Sacramento plume hadnot yet progressed as far east as shown by the G-1 and B-200 measurements and wasjust approaching the base of the Sierra Nevada Foothills south of the T1 site. Mixingheights were lower by several hundred meters compared to the B-200 observations,which is consistent with a midday convective boundary layer that is still growing. The5
CU AMAX-DOAS data showed significant variability in the NO2 VCD below the aircraft.The boundary conditions upwind of Sacramento are characterized by an elevated yetvariable NO2 VCD in the range 3 to 4×10¹⁵ molecule cm−2, or 1.2 and 1.7 ppb NO2averaged over the mixed air column. Along the West to East transect overpassingthe Sacramento urban core, a distinct increase in the NO2 VCD is observed near the10
City center, indicating NOx emissions most likely from mobile sources. The NO2 VCDreaches peak values above 1×10¹⁶ molecule cm−2 over the urban core, and decreasesto about half that value about 15 km to the East of Sacramento. No significant suppres-sion of O3 is observed over the City center. Rather, in the area of peak NO2 also O3increases simultaneously and immediately, reflecting hydrocarbon to NOx ratios that15
are favorable for fast photochemical O3 production in the Sacramento plume. The O3background levels upwind (50 ppb) increase along this flight track to 80 ppb near theNO2 maximum, and peak O3 exceeds 100 ppb only about 15 km to the East of Sacra-mento. The NO2 VCDs measured by CU AMAX-DOAS provide unique column integraldata over mixing height that are insensitive to model errors in predicting mixing height.20
The column data facilitate a direct comparison to model predicted NO2 VCDs, andenable more direct testing of the NOx emission inventory in the Sacramento area. Ac-curate NOx emissions are prerequisite for predicting photochemical O3 production bychemical transport models. The combination of the TOPAZ lidar and CU AMAX-DOASin principle also allow to constrain Ox (sum of O3 +NO2), which is a useful metrics for25
estimating SOA formation.
1347

ACPD12, 1299–1400, 2012
CarbonaceousAerosols and
Radiative EffectsStudy
R. A. Zaveri et al.
Title Page
Abstract Introduction
Conclusions References
Tables Figures
J I
J I
Back Close
Full Screen / Esc
Printer-friendly Version
Interactive Discussion
Discussion
Paper
|D
iscussionP
aper|
Discussion
Paper
|D
iscussionP
aper|
5 Outline of envisioned analyses
The complete CARES data set has been processed for final calibrations and quality re-views and uploaded into the final ARM data archive (http://campaign.arm.gov/cares).As mentioned throughout this paper, several detailed studies using various CARESdata are planned or presently underway and will be reported via subsequent publica-5
tions in this special issue and elsewhere as appropriate. Here we briefly summarizesome of the key science questions that will be addressed using CARES data:
Secondary organic aerosols
1. Can we reliably infer IVOC (and SVOC) concentrations in the urban air, how theyvaried diurnally and scaled with VOC and CO concentrations, and how did these10
aerosol precursor gases correlate with organic aerosol number and mass con-centrations in freshly polluted urban air?
2. What were the chemical composition, volatility spectrum, and hygroscopicity ofOA, and how did they evolve as a function of atmospheric processing time andphotochemical age?15
3. How did the size distribution of aerosols evolve with SOA formation in the urbanplume? Does the SOA condensation kinetics appear to be driven by Raoult’sLaw type gas absorption thermodynamics or is it similar to that of a condensingnon-volatile species?
4. Is there evidence for enhanced SOA formation in the urban plume when it mixed20
with biogenic emissions compared to instances when the urban plume did not mixwith biogenic emissions? Can the observed SOA in the aged urban plume be sep-arated into anthropogenic and biogenic fractions using carbon isotope analysesand other methods based on PTRMS observations and positive matrix factoriza-tion of AMS mass spectra?25
1348

ACPD12, 1299–1400, 2012
CarbonaceousAerosols and
Radiative EffectsStudy
R. A. Zaveri et al.
Title Page
Abstract Introduction
Conclusions References
Tables Figures
J I
J I
Back Close
Full Screen / Esc
Printer-friendly Version
Interactive Discussion
Discussion
Paper
|D
iscussionP
aper|
Discussion
Paper
|D
iscussionP
aper|
5. What was the role of organic species in the observed growth of ultrafine particlesto CCN and optically active sizes?
Aerosol mixing state
1. What was the distribution of BC mass fraction (BC mixing state) as a function ofparticle size in fresh and aged urban plumes? How rapidly did POA, BC, SOA,5
and inorganics become internally mixed?
2. What were the relative roles of condensation and coagulation processes in shap-ing the aerosol composition and size distribution?
3. What were the contributions and mixing states of other primary emissions suchas mineral dust and sea salt, and how did these aerosols evolve?10
4. What were the effects of aerosol mixing state on the ensemble aerosol opticalproperties, hygroscopicity, and CCN activity?
Aerosol optical properties
1. What was the role of changes in BC mixing state and morphology on enhancedlight absorption?15
2. Was there increased (by OA over BC) near-UV absorption? Did OA absorptionextend into the visible part of the spectrum? If so, how did it relate to OA compo-sition?
3. What were the absolute and relative contributions of sub-micron and super-micronaerosols to the total aerosol direct radiative forcing?20
1349

ACPD12, 1299–1400, 2012
CarbonaceousAerosols and
Radiative EffectsStudy
R. A. Zaveri et al.
Title Page
Abstract Introduction
Conclusions References
Tables Figures
J I
J I
Back Close
Full Screen / Esc
Printer-friendly Version
Interactive Discussion
Discussion
Paper
|D
iscussionP
aper|
Discussion
Paper
|D
iscussionP
aper|
4. Which compounds or particle types have the strongest radiative impacts, andcan these be related to specific emission sources or atmospheric formation pro-cesses?
The combination of optical (especially UV) and mass-based (incandescence and massspectrometry) black carbon instruments will enable the calculation of mass-specific ab-5
sorption coefficients of soot particles and allow examination of potential light absorbingorganic compounds in urban and biomass burning plumes.
The resulting detailed picture for the evolution of different types of carbonaceousaerosols and their optical and CCN activation properties will then help improve the keyaerosol process and property modules that are used in regional and global climate10
models. Specific modeling studies that are planned by CARES participants include:
1. Local closures for optical and CCN activation properties.
2. Constrained Lagrangian modeling of SOA formation and interactions between an-thropogenic and biogenic emissions.
3. Constrained Lagrangian modeling of black carbon mixing state evolution.15
4. Regional simulations of SOA formation that include long-range transport of tracegases and aerosols
5. Assessments of new treatments of SOA and aerosol mixing state on aerosol opti-cal and hygroscopic properties and their impact on radiative forcing over Californiaand surrounding regions.20
Acknowledgements. The authors thank the DOE G-1, NASA Langley B-200 King Air, andNOAA Twin Otter flight crew and numerous staff from all the involved institutions for their out-standing work in support of the CARES field mission. The contributions and cooperation of thefollowing in this research effort are gratefully acknowledged: Eileen McCauley, Ajith Kaduwela,James Pederson, Leon Dolislager, and colleagues at California Air Resources Board (CARB)25
1350

ACPD12, 1299–1400, 2012
CarbonaceousAerosols and
Radiative EffectsStudy
R. A. Zaveri et al.
Title Page
Abstract Introduction
Conclusions References
Tables Figures
J I
J I
Back Close
Full Screen / Esc
Printer-friendly Version
Interactive Discussion
Discussion
Paper
|D
iscussionP
aper|
Discussion
Paper
|D
iscussionP
aper|
for their assistance in planning this study; Anthony Wexler (UC Davis), Ron Cohen (UC Berke-ley), and Allen Goldstein (UC Berkeley) for helpful discussions during the planning stages of thestudy; John Ogren and his group at NOAA for their assistance with aerosol rack and data collec-tion during the campaign; Ms. Wendy Westsmith and the staff at Northside School in Cool, Mr.Laduan Smedley and the staff at American River College in Sacramento, and staff at McClellan5
Airfield for the use of their facilities. Funding for data collection onboard the G-1 aircraft andat the ground sites was provided by the Atmospheric Radiation Measurement (ARM) Programsponsored by the U.S. Department of Energy (DOE), Office of Science, Office of Biological andEnvironmental Research (OBER), Climate and Environmental Sciences Division. Partial sup-port was also provided by the Environmental Molecular Sciences Laboratory (EMSL), a national10
scientific user facility sponsored by the DOE’s OBER at Pacific Northwest National Laboratory(PNNL). Funding for the B-200/HSRL/RSP deployment and investigations came from the NASAHQ Science Mission Directorate Radiation Sciences Program, the NASA CALIPSO project, andthe DOE ARM Program, Interagency Agreement No. DE-AI02-05ER63985. Funding for datacollection and analysis of the measurements taken onboard the NOAA Twin Otter was provided15
by the NOAA Health of the Atmosphere Program. Participation of R. Volkamer, S. Baidar, H.Oetjen, and I. Ortega (University of Colorado, Boulder) was made possible by the CaliforniaAir Resources Board contract 09-317, and NSF-CAREER award AGS-0847793. Participationof A. Kubatova and H. Jeong (University of North Dakota) was made possible by funding fromND EPSCoR through NSF grant #EPS-814442. Participation of C. D. Cappa and K. R. Kolesar20
(University of California, Davis) was made possible by funding from NOAA and U.S. EPA. Thisresearch was also supported by the US DOE’s Atmospheric System Research (ASR) Programunder Contract DE-AC06-76RLO 1830 at PNNL. PNNL is operated for the US DOE by BattelleMemorial Institute.
References25
Adachi, K. and Buseck, P. R.: Internally mixed soot, sulfates, and organic matter in aerosolparticles from Mexico City, Atmos. Chem. Phys., 8, 6469–6481, doi:10.5194/acp-8-6469-2008, 2008.
Adachi, K., Chung, S. H., and Buseck, P. R.: Shapes of soot aerosol particles and implications
1351
ACPD12, 1299–1400, 2012
CarbonaceousAerosols and
Radiative EffectsStudy
R. A. Zaveri et al.
Title Page
Abstract Introduction
Conclusions References
Tables Figures
J I
J I
Back Close
Full Screen / Esc
Printer-friendly Version
Interactive Discussion
Discussion
Paper
|D
iscussionP
aper|
Discussion
Paper
|D
iscussionP
aper|
for their effects on climate, J. Geophys. Res., 115, D15206, doi:10.1029/2009JD012868,2010.
DeCarlo, P. F., Kroll, J. H., Worsnop, D. R., Huffman, J. A., Docherty, K. S., Ulbrich, I. M., Mohr,C., Kimmel, J. R., Sueper, D., Sun, Y., Zhang, Q., Trimborn, A., Northway, M., Ziemann P. J.,Canagaratna, M. R., Onasch, T. B., Alfarra, M. R., Prevot, A. S. H., Dommen, J., Duplissy, J.,5
Metzger, A., Baltensperger, U., and Jimenez, J. L.: O/C and OM/OC Ratios of Primary, Sec-ondary, and Ambient Organic Aerosols with a High Resolution Time-of-Flight Aerosol MassSpectrometer, Environ. Sci. Technol., 42, 4478–4485, doi:4410.1021/es703009q, 2008.
Alvarez II, R. J., Senff, C. J., Langford, A. O., Weickmann, A. M., Law, D. C., Machol, J.L., Merritt, D. A., Marchbanks, R. D., Sandberg, S. P., Brewer, W. A., Hardesty, R. M.,10
Banta, R. M.: Development and application of a compact, tunable, solid-state airborneozone lidar system for boundary layer profiling, J. Atmos. Oceanic Technol., 28, 1258–1272,doi:10.1175/JTECH-D-10-05044.1, 2011.
Anderson, T. L., Covert, D. S., Marshalll, S. F., Laucks, M. L, Charlson, R. J., Waggoner, A. P.,Ogren, J. A., Caldow, R., Holm, R. L., Quant, F. R., Sem, G. J., Wiedensohler, A., Ahlquist,15
N. A., and Bates, T. S.: Performance characteristics of a high-sensitivity, three-wavelengthtotal scatter/backscatter nephelometer, J. Atmos. Ocean. Tech., 13, 967–986, 1996.
Andreae, M. O. and Gelencser, A.: Black carbon or brown carbon? The nature of light-absorbing carbonaceous aerosols, Atmos. Chem. Phys., 6, 3131–3148, doi:10.5194/acp-6-3131-2006, 2006.20
Arnott, W. P., Moosmuller, H., Rogers, C. F., Jin, T. F. and Bruch, R.: Photoacoustic spectrom-eter for measuring light absorption by aerosol: instrument description, Atmos. Environ., 33,2845–2852, 1999.
Barsanti, K. C. and Pankow, J. F.: Thermodynamics of the formation of atmospheric organicparticulate matter by accretion reactions – 2, Dialdehydes, methylglyoxal, and diketones,25
Atmos. Environ., 39, 6597–6607, 2005.Bauer, S. E., Wright, D. L., Koch, D., Lewis, E. R., McGraw, R., Chang, L. S., Schwartz, S. E.,
and Rued, R.:, MATRIX (Multiconfiguration Aerosol TRacker of mIXing state): An aerosolmicrophysical module for global atmospheric models, Atmos. Chem. Phys., 8, 6003–6035,doi:10.5194/acp-8-6003-2008, 2008.30
Baumgardner, D., Jonsson, H., Dawson, W., O’Connor, D., Newton, R.: The cloud, aerosol andprecipitation spectrometer: a new instrument for cloud investigations, Atmos. Res., 59–60,251–264, doi:10.1016/S0169-8095(01)00119-3, 2001.
1352

ACPD12, 1299–1400, 2012
CarbonaceousAerosols and
Radiative EffectsStudy
R. A. Zaveri et al.
Title Page
Abstract Introduction
Conclusions References
Tables Figures
J I
J I
Back Close
Full Screen / Esc
Printer-friendly Version
Interactive Discussion
Discussion
Paper
|D
iscussionP
aper|
Discussion
Paper
|D
iscussionP
aper|
Bergstrom, R. W., Russell, P. B., and Hignett, P.: Wavelength Dependence of the Absorption ofBlack Carbon Particles: Predictions and Results from the TARFOX Experiment and Implica-tions for the Aerosol Single Scattering Albedo, J. Atmos. Sci., 59, 567–577, 2002.
Bond, T. C.: Can warming particles enter global climate discussions?, Environ. Res. Lett., 2,045030, doi:10.1088/1748-9326/2/4/045030, 2007.5
Bond, T. C., Habib, G., and Bergstrom, R. W.: Limitations in the enhancement of visible lightabsorption due to mixing state, J. Geophys. Res., 111, D20211, doi:10.1029/2006JD007315,2006.
Bones, D. L., Henricksen, D. K., Mang, S. A., Gonsior, M., Bateman, A. P., Nguyen, T. B.,Cooper, W. J., and Nizkorodov, S. A.: Appearance of strong absorbers and fluorophores in10
limonene-O3 secondary organic aerosol due to NH4+-mediated chemical aging over longtime scales, J. Geophys. Res., 115, D05203, doi:10.1029/2009JD012864, 2010.
Bruns, E. A., Perraud, V., Zelenyuk, A., Ezell, M. J., Johnson, S. N., Yu, Y., Imre, D., Finlayson-Pitts, B. J., and Alexander, M. L.: Comparison of FTIR and Particle Mass Spectrometry forthe Measurement of Particulate Organic Nitrates, Environ. Sci. Technol., 44, 1056–1061,15
doi:10.1021/es9029864, 2010.Bueno, P. A., Havey, D. K., Mulholland, G. W., Hodges, J. T., Gillis, K. A., Dickerson,
R. R., and Zachariah, M. R.: Photoacoustic measurements of amplification of the ab-sorption cross section for coated soot aerosols, Aerosol Sci. Technol. 45, 1217–1230,doi:10.1080/02786826.2011.587477, 2011.20
Burton, S. P., Ferrare, R. A., Hostetler, C. A., Hair, J. W., Rogers, R. R., Obland, M. D., Butler,C. F., Cook, A. L., Harper, D. B., and Froyd, K. D.: Aerosol classification using airborne HighSpectral Resolution Lidar measurements – methodology and examples, Atmos. Meas. Tech.Discuss., 4, 5631–5688, doi:10.5194/amtd-4-5631-2011, 2011.
Buzorius, G., Zelenyuk, A., Brechtel, F. and Imre, D.: Simultaneous determination of individ-25
ual ambient particle size, hygroscopicity and composition, Geophys. Res. Lett., 29, 1974,doi:10.1029/2001GL014221, 2002.
Cai, Y., Montague, D.C., Mooiweer-Bryan, W., Deshler, T.: Performance characteristics of theultra high sensitivity aerosol spectrometer for particles between 55 and 800 nm: Laboratoryand field studies, J. Aerosol. Sci., 39, 759–769, doi:10.1016/j.jaerosci.2008.04.007, 2008.30
Canagaratna, M., Jayne, J., Jimenez, J. L., Allan, J. A., Alfarra, R., Zhang, Q., Onasch, T.,Drewnick, F., Coe, H., Middlebrook, A., Delia, A., Williams, L., Trimborn, A., Northway, M.,DeCarlo, P., Kolb, C., Davidovits, P., and Worsnop, D.: Chemical and Microphysical Charac-
1353

ACPD12, 1299–1400, 2012
CarbonaceousAerosols and
Radiative EffectsStudy
R. A. Zaveri et al.
Title Page
Abstract Introduction
Conclusions References
Tables Figures
J I
J I
Back Close
Full Screen / Esc
Printer-friendly Version
Interactive Discussion
Discussion
Paper
|D
iscussionP
aper|
Discussion
Paper
|D
iscussionP
aper|
terization of Ambient Aerosols with the Aerodyne Aerosol Mass Spectrometer, Mass Spec-trom. Rev., 26, 185–222, doi:110.1002/mas.20115, 2007.
Cantrell, W., Shaw, G., Cass, G. R., Chowdhury, Z., Hughes, L. S., Prather, K. A., Guaz-zotti, S. A., and Coffee, K. R.: Closure between aerosol particles and cloud condensa-tion nuclei at Kaashidhoo Climate Observatory, J. Geophys. Res., 106, 28,711–28,718,5
doi:10.1029/2000JD900781, 2001.Cappa, C. D., Lack, D. A., Burkholder, J. B. and Ravishankara, A. R.: Bias in filter-based aerosol
light absorption measurements due to organic aerosol loading: Evidence from laboratorymeasurements, Aerosol Sci. Tech., 42, 1022–1032, 2008.
Cattrall, C., Reagan, J., Thome, K., and Dubovik, O.: Variability of aerosol and spectral lidar and10
backscatter and extinction ratios of key aerosol types derived from selected Aerosol RoboticNetwork locations, J. Geophys. Res., 110, D10S11, doi:10.1029/2004JD005124, 2005.
Cerling, T. E. and Harris, J. M.: Carbon isotope fractionation between diet and bioapatite inungulate mammals and implications for ecological and paleoecological studies, Oecologia,120, 347–363, 1999.15
Cross, E. Onasch, T. B., Ahern, A., Wrobel, W., Slowik, J. G., Olfert, J., Lack, D. A., Massoli,P., Cappa, C. D., Schwarz, J. P., Spackman, J. R., Fahey, D. W., Sedlacek, A., Trimborn,A., Jayne, J. T., Freedman, A., Williams, L. R., Ng, N. L., Mazzoleni, C., Dubey, M., Brem,B., Kok, G., Subramanian, R., Freitag, S., Clarke, A., Thornhill, D., Marr, L. C., Kolb, C. E.,Worsnop, D. R., and Davidovits, P.: Soot particle studies – Instrument inter-comparison –20
Project overview, Aerosol Sci. Technol., 44, 592–611, 2010.Cziczo, D. J.: Atmospheric aerosol analysis by laser ionization, in: The Encyclopedia of Mass
Spectrometry, 5, edited by: Gross, M. L., Carioli, R. M., Beauchemin, D., and Matthews, D.E., Elsevir, Amsterdam, The Netherlands, 2010.
Cziczo, D. J., Thomson, D. S., Thompson, T. L., DeMott, P. J., and Murphy, D. M.: Particle25
analysis by laser mass spectrometry (PALMS) studies of ice nuclei and other low numberdensity particles, Int. J. Mass Spectrom., 2006, 258, 21–29, 2006.
Cziczo, D. J., Pekour, M. S., Nelson, D. A., and Zaveri, R. The relationship of chemical compo-sition and particle hygroscopicity determined during the CARES field study, Atmos. Chem.Phys., in preparation, 2011.30
Cubison, M. J., Ervens, B., Feingold, G., Docherty, K. S., Ulbrich, I. M., Shields, L., Prather, K.,Hering, S., and Jimenez, J. L.: The influence of chemical composition and mixing state ofLos Angeles urban aerosol on CCN number and cloud properties, Atmos. Chem. Phys., 8,
1354

ACPD12, 1299–1400, 2012
CarbonaceousAerosols and
Radiative EffectsStudy
R. A. Zaveri et al.
Title Page
Abstract Introduction
Conclusions References
Tables Figures
J I
J I
Back Close
Full Screen / Esc
Printer-friendly Version
Interactive Discussion
Discussion
Paper
|D
iscussionP
aper|
Discussion
Paper
|D
iscussionP
aper|
5649–5667, doi:10.5194/acp-8-5649-2008, 2008.de Haan, D. O., Corrigan, A. L., Smith, K.W., Stroik, D. R., Turley, J. J., Lee, F. E., Tolbert, M.
A., Jimenez, J. L., Cordova, K. E., and Ferrell, G. R.: Secondary organic aerosol-formingreactions of glyoxal with amino acids, Environ. Sci. Tech., 43, 2818–2824, 2009a.
de Haan, D. O., Tolbert, M. A., and Jimenez, J. L.: Atmospheric condensed-5
phase reactions of glyoxal with methylamine, Geophys. Res. Lett., 36, L11819,doi:11810.11029/12009GL037441, 2009b.
Delene, D. J. and Ogren, J. A.: Variability of Aerosol Optical Properties at Four North AmericanSurface Monitoring Sites, J. Atmos. Sci., 59, 1135–1150, 2002.
Dzepina, K., Volkamer, R. M., Madronich, S., Tulet, P., Ulbrich, I. M., Zhang, Q., Cappa,10
C. D., Ziemann, P. J., and Jimenez, J. L.: Evaluation of recently-proposed secondary or-ganic aerosol models for a Case study in Mexico City, Atmos. Chem. Phys., 9, 5681–5709,doi:10.5194/acp-9-5681-2009, 2009.
Duarte, R. M. B. O., Pio, C. A., and Duarte, A. C.: Spectroscopic study of the water-soluble or-ganic matter isolated from atmospheric aerosols collected under different atmospheric con-15
ditions, Anal. Chim. Acta, 530, 7–14, 2005.Ehleringer, J. R. and Monson, R. K.: Evolutionary and ecological aspects of photosynthetic
pathway variation., Ann. Rev. Ecolog. Syst., 24, 411–439, 1993.Ervens, B. and Kreidenweis, S. M.: SOA formation by biogenic and carbonyl compounds: Data
evaluation and application. Environ. Sci. Technol., 41, 3904–3910, 2007.20
Erickson, M. H., Wallace, H. W., and Jobson, B. T.: Quantification of diesel exhaust inter-mediate volatile organic compounds by a thermal desorption proton transfer reaction massspectrometer, to be submitted, Atmos. Chem. Phys. Discuss., 2011.
Farmer, D. K., Matsunaga, A., Docherty, K. S., Surratt, J. D., Seinfeld, J. H., Ziemann, P.J., and Jimenez, J. L.: Response of an aerosol mass spectrometer to organonitrates and25
organosulfates and implications for atmospheric chemistry, Proc. Natl. Acad. Sci. U. S. A.,107, 6670–6675, 2010.
Fast, J. D., Gustafson Jr., W. I., Easter, R. C., Zaveri, R. A., Barnard, J. C., Chapman, E. G.,Grell, G. A., and Peckham, S. E.: Evolution of ozone, particulates, and aerosol direct radiativeforcing in the vicinity of Houston using a fully coupled meteorology-chemistry-aerosol model,30
J. Geophys. Res., 111, D21305, doi:10.1029/2005JD006721, 2006.Fast, J. D., Gustafson Jr., W. I., Berg, L. K., Shaw, W. J., Pekour, M., Shrivastava, M., Barnard,
J. C., Ferrare, R. A., Hostetler, C. A., Hair, J. A., Erickson, M., Jobson, B. T., Flowers, B.,
1355

ACPD12, 1299–1400, 2012
CarbonaceousAerosols and
Radiative EffectsStudy
R. A. Zaveri et al.
Title Page
Abstract Introduction
Conclusions References
Tables Figures
J I
J I
Back Close
Full Screen / Esc
Printer-friendly Version
Interactive Discussion
Discussion
Paper
|D
iscussionP
aper|
Discussion
Paper
|D
iscussionP
aper|
Dubey, M. K., Springston, S., Pierce, R. B., Dolislager, L., Pederson, J., and Zaveri, R.A.: Transport and mixing patterns over Central California during the Carbonaceous Aerosoland Radiative Effects Study (CARES), Atmos. Chem. Phys. Discuss., 11, 29949–30008,doi:10.5194/acpd-11-29949-2011, 2011.
Flowers, B. A., Dubey, M. K., Mazzoleni, C., Stone, E. A., Schauer, J. J., Kim, S.-W., and Yoon,5
S. C.: Optical-chemical-microphysical relationships and closure studies for mixed carbona-ceous aerosols observed at Jeju Island; 3-laser photoacoustic spectrometer, particle sizing,and filter analysis, Atmos. Chem. Phys., 10, 10387–10398, doi:10.5194/acp-10-10387-2010,2010.
Fierz, M., Vernooij, M. G. C., and Burtscher, H.: An improved low-flow thermodenuder, J.10
Aerosol Sci., 38, 1163–1168, 2007.Forster, P. V., Ramaswamy, V., Artaxo, P., Berntsen, T., Betts, R., Fahey, D. W., Haywood, J.,
Lean, J., Lowe, D. C., Myhre, G., Nganga, J., Prinn, R., Raga, G., Schulz, M., and VanDorland, R.: Changes in Atmospheric Constituents and in Radiative Forcing, in ClimateChange 2007: The Physical Science Basis: Working Group I Contribution to the Fourth15
Assessment Report of the IPCC, edited by: Solomon, S., Qin, D., Manning, M., Chen, Z.,Marquis, M., Averyt, K. B., Tignor, M., and Miller, H. L., 129–234, Cambridge Univ. Press,New York, USA, 2007.
Fuller, K. A., Malm, W. C., and Kriedenweis, S. M.: Effects of mixing on extinction by carbona-ceous particles, J. Geophys. Res., 104, 15,941–15,954, 1999.20
Furutani, H., Dall’osto, M., Roberts, G. C., and Prather, K. A.: Assessment of the relativeimportance of atmospheric aging on CCN activity derived from field observations, Atmos.Environ., 42, 3130–3142, doi:10.1016/j.atmosenv.2007.09.024, 2008.
Gaffney, J. S., Marley, N. A., and Cunningham, M. M.: Natural radionuclides in fine aerosols inthe Pittsburgh area, Atmos. Environ., 38, 3191–3200, 2004.25
Gao, R. S., Schwarz, J. P., Kelly, K. K., Fahey, D. W., Watts, L. A., Thompson, T. L., Spackman,J. R., Slowik, J. G., Cross, E. S., Han, J.-H., Davidovits, P., Onasch, T. B., and Worsnop,D. R.: A Novel Method for Estimating Light-Scattering Properties of Soot Aerosols Using aModified Single-Particle Soot Photometer, Aerosol Sci. Tech. 41 125–135, 2007.
Ghan, S. J. and Schwartz, S. E.: Aerosol properties and processes: A Path from field and30
laboratory measurements to global climate models, BAMS, 88, 1059–1083, 2007.Grell, G. A., Peckham, S. E., Schmitz, R., McKeen, S. A., Frost, G., Skamarock, W. C., and
Eder, B.: Fully coupled “online” chemistry within the WRF model, Atmos. Environ., 39, 6957–
1356

ACPD12, 1299–1400, 2012
CarbonaceousAerosols and
Radiative EffectsStudy
R. A. Zaveri et al.
Title Page
Abstract Introduction
Conclusions References
Tables Figures
J I
J I
Back Close
Full Screen / Esc
Printer-friendly Version
Interactive Discussion
Discussion
Paper
|D
iscussionP
aper|
Discussion
Paper
|D
iscussionP
aper|
6975, 2005.Guenther, A., Karl, T., Harley, P., Wiedinmyer, C., Palmer, P. I., and Geron, C.: Estimates
of global terrestrial isoprene emissions using MEGAN (Model of Emissions of Gases andAerosols from Nature), Atmos. Chem. Phys., 6, 3181–3210, doi:10.5194/acp-6-3181-2006,2006.5
Gyawali, M., Arnott, W. P., Lewis, K., and Moosmuller, H.: In situ aerosol optics in Reno, NV,USA during and after the summer 2008 California wildfires and the influence of absorbingand non-absorbing organic coatings on spectral light absorption, Atmos. Chem. Phys., 9,8007–8015, doi:10.5194/acp-9-8007-2009, 2009.
Gyawali, M., Arnott, W. P., Zaveri, R. A., Song, C., Moosmuller, H., Liu, L., Mishchenko, M.10
I., Chen, L.-W. A., Green, M. C., Watson, J. G., and Chow, J. C.: Photoacoustic opticalproperties at UV, VIS, and near IR wavelengths for laboratory generated and winter timeambient urban aerosols, Atmos. Chem. Phys. Discuss., 11, 25063–25098, doi:10.5194/acpd-11-25063-2011, 2011.
Hair, J. W., Hostetler, C. A., Cook, A. L., Harper, D. B., Ferrare, R. A., Mack, T. L., Welch,15
W., Izquierdo, L. R., and Hovis, F. E.: Airborne High Spectral Resolution Lidar for profilingaerosol optical properties, Appl. Optics, 47, 6734–6752, 2008.
Harrison, L., Michalsky, J., and Berndt, J.: Automated Multifilter Rotating Shadow-Band Ra-diometer: An Instrument for Optical Depth and Radiation Measurements, Appl. Optics, 33,5118–5125, 1994.20
Hasegawa, S. and Ohta, S.: Some measurements of the mixing state of soot-containing parti-cles at urban and non-urban sites, Atmos. Environ., 36, 3899–3908, 2002.
Hastings, W. P., Koehler, C. A., Bailey, E. L., De Haan, D. O.: Secondary organic aerosolformation by glyoxal hydration and oligomer formation: Humidity effects and equilibrium shiftsduring analysis, Environ. Sci. Technol., 39, 8728–8735, 2005.25
Havers, N., Burba, P., Lambert, J., and Klockow, D.: Spectroscopic characterization of humic-like substances in airborne particulate matter, J. Atmos. Chem., 29, 45–54, 1998.
Hecobian, A., Zhang, X., Zheng, M., Frank, N., Edgerton, E. S., and Weber, R. J.: Water-Soluble Organic Aerosol material and the light-absorption characteristics of aqueous ex-tracts measured over the Southeastern United States, Atmos. Chem. Phys., 10, 5965–5977,30
doi:10.5194/acp-10-5965-2010, 2010.Herich, H., Kammermann, L., Friedman, B., Gross, D. S., Weingartner, E., Lohmann, U.,
Spichtinger, P., Gysel, M., Baltensperger, U., and Cziczo, D. J.: Subarctic atmospheric
1357

ACPD12, 1299–1400, 2012
CarbonaceousAerosols and
Radiative EffectsStudy
R. A. Zaveri et al.
Title Page
Abstract Introduction
Conclusions References
Tables Figures
J I
J I
Back Close
Full Screen / Esc
Printer-friendly Version
Interactive Discussion
Discussion
Paper
|D
iscussionP
aper|
Discussion
Paper
|D
iscussionP
aper|
aerosol composition: 2. Hygroscopic growth properties, J. Geophys. Res., 114, D13204,doi:10.1029/2008JD011574, 2009.
Hiranuma, N., Kohn, M., Pekour, M. S., Nelson, D. A., Shilling, J. E., and Cziczo, D. J.: Dropletactivation, separation, and compositional analysis: laboratory studies and atmospheric mea-surements, Atmos. Meas. Tech., 4, 2333–2343, doi:10.5194/amt-4-2333-2011, 2011.5
Hodzic, A., Jimenez, J. L., Madronich, S., Canagaratna, M. R., DeCarlo, P. F., Kleinman, L., andFast, J.: Modeling organic aerosols in a megacity: potential contribution of semi-volatile andintermediate volatility primary organic compounds to secondary organic aerosol formation,Atmos. Chem. Phys., 10, 5491–5514, doi:10.5194/acp-10-5491-2010, 2010.
Hoffer, A., Gelencsr, A., Guyon, P., Kiss, G., Schmid, O., Frank, G. P., Artaxo, P., and Andreae,10
M. O.: Optical properties of humic-like substances (HULIS) in biomass-burning aerosols,Atmos. Chem. Phys., 6, 3563–3570, doi:10.5194/acp-6-3563-2006, 2006.
Hopkins, R. J., Desyaterik, Y., Tivanski, A. V., Zaveri, R. A., Berkowitz, C. M., Tyliszczak, T.,Gilles, M. K., and Laskin, A.: Chemical speciation of sulfur in marine cloud droplets andparticles: Analysis of individual particles from the marine boundary layer over the California15
current, J. Geophys. Res.-Atmos., 113, D04209, doi:10.1029/2007JD008954, 2008.Jacobson, M. Z.: Strong radiative heating due to the mixing state of black carbon in atmospheric
aerosols, Nature, 409, 695–697, 2001.Jacobson, M. Z.: Control of fossil-fuel particulate black carbon and organic matter, possi-
bly the most effective method of slowing global warming, J. Geophys. Res., 107, 4410,20
doi:10.1029/2001JD001376, 2002.Jacobson, M. Z.: Effects of externally-through-internally-mixed soot inclusions within
clouds and precipitation on global climate, J. Phys. Chem. A, 110, 6860–6873,doi:10.1021/jp056391r, 2006.
Jaoui, M., Kleindienst, T. E., Lewandowski, M., Offenberg, J. H., Edney, E. O.: Identification25
and quantification of aerosol polar oxygenated compounds bearing carboxylic or hydroxylgroups. 2. Organic tracer compounds from monoterpenes. Environ. Sci. Technol., 39, 5661–5673, 2005.
Johnson, K. S., Zuberi, B., Molina, L. T., Molina, M. J., Iedema, M. J., Cowin, J. P., Gaspar, D.J., Wang, C., and Laskin, A.: Processing of soot in an urban environment: case study from30
the Mexico City Metropolitan Area, Atmos. Chem. Phys., 5, 3033–3043, doi:10.5194/acp-5-3033-2005, 2005.
Kamphus, M., Ettner-Mahl, M., Klimach, T., Drewnick, F., Keller, L., Cziczo, D. J., Mertes,
1358

ACPD12, 1299–1400, 2012
CarbonaceousAerosols and
Radiative EffectsStudy
R. A. Zaveri et al.
Title Page
Abstract Introduction
Conclusions References
Tables Figures
J I
J I
Back Close
Full Screen / Esc
Printer-friendly Version
Interactive Discussion
Discussion
Paper
|D
iscussionP
aper|
Discussion
Paper
|D
iscussionP
aper|
S., Borrmann, S., and Curtius, J.: Chemical composition of ambient aerosol, ice residuesand cloud droplet residues in mixed-phase clouds: single particle analysis during the Cloudand Aerosol Characterization Experiment (CLACE 6), Atmos. Chem. Phys., 10, 8077–8095,doi:10.5194/acp-10-8077-2010, 2010.
Kanakidou, M., Seinfeld, J. H., Pandis, S. N., Barnes, I., Dentener, F. J., Facchini, M. C., Van5
Dingenen, R., Ervens, B., Nenes, A., Nielsen, C. J., Swietlicki, E., Putaud, J. P., Balkanski,Y., Fuzzi, S., Horth, J., Moortgat, G. K., Winterhalter, R., Myhre, C. E. L., Tsigaridis, K.,Vignati, E., Stephanou, E. G., and Wilson, J.: Organic aerosol and global climate modelling:a review, Atmos. Chem. Phys., 5, 1053–1123, doi:10.5194/acp-5-1053-2005, 2005.
Kassianov, E., Barnard, J. C., Berg, L. K., Long, C. N., and Flynn, C. J.: Shortwave spec-10
tral radiative forcing of cumulus clouds from surface observations, Geophys. Res. Lett., 38,L07801, doi:10.1029/2010GL046282, 2011.
Kassianov, E. I., Flynn, C. J., Ackerman, T. P., and Barnard, J. C.: Aerosol single-scatteringalbedo and asymmetry parameter from MFRSR observations during the ARM Aerosol IOP2003, Atmos. Chem. Phys., 7, 3341–3351, doi:10.5194/acp-7-3341-2007, 2007.15
Kirchstetter, T. W., Novakov, T., and Hobbs, P. V.: Evidence that the spectral dependence oflight absorption by aerosols is affected by organic carbon, J. Geophys. Res., 109, D21208,doi:10.1029/2004JD004999, 2004.
Kleinman, L. I., Daum, P. H., Lee, Y.-N., Senum, G., Springston, S. R., Wang, J., Berkowitz,C., Hubbe, J., Zaveri, R. A., Brechtel, F. J., Jayne, J. T., and Onasch, T. B.: Aircraft obser-20
vations of aerosol composition in New England and Mid-Atlantic States during the summer2002 NEAQS Field Campaign, J. Geophys. Res., 112, D09310, doi:10.1029/2006JD007786,2007.
Knobelspiesse, K., Cairns, B., Ottaviani, M., Ferrare, R., Hair, J., Hostetler, C., Obland, M.,Rogers, R., Redemann, J., Shinozuka, Y., Clarke, A., Freitag, S., Howell, S., Kapustin, V.,25
and McNaughton, C.: Combined retrievals of boreal forest fire aerosol properties with apolarimeter and lidar, Atmos. Chem. Phys., 11, 7045–7067, doi:10.5194/acp-11-7045-2011,2011.
Kroll, J. H. and Seinfeld, J. H.: Chemistry of secondary organic aerosol: Formation and evolu-tion of low-volatility organics in the atmosphere, Atmos. Environ., 42, 3593–3624, 2008.30
Kulkarni, P. and Wang, J.: New Fast Integrated Mobility Spectrometer for Real-Time Measure-ment of Aerosol Size Distribution: II. Design, Calibration, and Performance Characterization,J. Aerosol Sci., 37, 1326–1339, 2006.
1359

ACPD12, 1299–1400, 2012
CarbonaceousAerosols and
Radiative EffectsStudy
R. A. Zaveri et al.
Title Page
Abstract Introduction
Conclusions References
Tables Figures
J I
J I
Back Close
Full Screen / Esc
Printer-friendly Version
Interactive Discussion
Discussion
Paper
|D
iscussionP
aper|
Discussion
Paper
|D
iscussionP
aper|
Kuwata, M., Kondo, Y., Mochida, M., Takegawa, N., and Kawamura, K., Dependence of CCNactivity of less volatile particles on the amount of coating observed in Tokyo, J. Geophys.Res., 112, D11207, doi:10.1029/2006JD007758, 2007.
Lack, D. A., Lovejoy, E. R., Baynard, T., Pettersson, A., and Ravishankara, A. R.: AerosolAbsorption Measurement using Photoacoustic Spectroscopy: Sensitivity, Calibration, and5
Uncertainty Developments, Aerosol Sci. Tech., 40, 697–708, 2006.Lack, D. A., Cappa, C. D., Covert, D. S., Baynard, T., Massoli, P., Sierau, B., Bates, T. S., Quinn,
P. K., Lovejoy, E. R., and Ravishankara, A. R.: Bias in filter-based aerosol light absorp-tion measurements due to organic aerosol loading: Evidence from ambient measurements,Aerosol Sci. Tech., 42, 1033–1041, doi:10.1080/02786820802389277, 2008.10
Langford, A. O., Senff, C. J., Alvarez II, R. J., Banta, R. M., Hardesty, R. M., Parrish, D. D., Ryer-son, T. B.: Comparison between the TOPAZ airborne ozone lidar and in situ measurementsduring TexAQS 2006, J. Atmos. Oceanic Technol., 28, 1243–1257, doi:10.1175/JTECH-D-10-05043.1, 2011.
Lee-Taylor, J., Madronich, S., Aumont, B., Camredon, M., Hodzic, A., Tyndall, G. S., Apel, E.,15
and Zaveri, R. A.: Explicit modeling of organic chemistry and secondary organic aerosolpartitioning for Mexico City and its outflow plume, Atmos. Chem. Phys. Discuss., 11, 17013–17070, doi:10.5194/acpd-11-17013-2011, 2011.
Li, J., Posfai, M., Hobbs, P. V., and Buseck, P. R.: Individual aerosol particles from biomassburning in southern Africa: 2. Compositions and aging of inorganic particles, J. Geophys.20
Res., 108, 8484, doi:10.1029/2002JD002310, 2003.Liggio, J., Li, S. M., and McLaren, R.: Heterogeneous reactions of glyoxal on particulate matter:
Identification of acetals and sulfate esters, Environ. Sci. Technol., 39, 1532–1541, 2005.Langridge, J. M., Richardson, M. S., Lack, D., Law, D., and Murphy, D. M.: Aircraft Instru-
ment for Comprehensive Characterization of Aerosol Optical Properties, Part I: Wavelength-25
Dependent Optical Extinction and Its Relative Humidity Dependence Measured Using CavityRingdown Spectroscopy, Aerosol Sci. Tech., 45, 1305–1318, 2011.
Laskin, A.: Electron Beam Analysis and Microscopy of Individual Particles, Fundamentals andApplications in Aerosol Spectroscopy, edited by: Signorell, R. and Reid, J. P., CRC Press,Boca Raton, 2011.30
Laskin, A., Cowin, J. P., and Iedema, M. J.: Analysis of individual environmental particles usingmodern methods of electron microscopy and X-ray microanalysis, J. Electron. Spectrosc.,150, 260–274, 2006.
1360

ACPD12, 1299–1400, 2012
CarbonaceousAerosols and
Radiative EffectsStudy
R. A. Zaveri et al.
Title Page
Abstract Introduction
Conclusions References
Tables Figures
J I
J I
Back Close
Full Screen / Esc
Printer-friendly Version
Interactive Discussion
Discussion
Paper
|D
iscussionP
aper|
Discussion
Paper
|D
iscussionP
aper|
Lesins, G., Chylek, P., and Lohmann, U.: A study of internal and external mixing scenarios andits effect on aerosol optical properties and direct radiative forcing, J. Geophys. Res., 107,4094, doi:10.1029/2001JD000973, 2002.
Levy, H., Schwarzkopf, M. D., Horowitz, L., Ramaswamy, V., and Findell, K. L.: Strong sensitivityof late 21st century climate to projected changes in short-lived air pollutants, J. Geophys.5
Res.-Atmos., 113, D06102, doi:10.1029/2007JD009176, 2008.Lewis, K., Arnott, W. P., Moosmuller, H., and Wold, C. E.: Strong spectral variation of biomass
smoke light absorption and single scattering albedo observed with a novel dual wavelengthphotoacoustic instrument, J. Geophys. Res., 113, D16203, doi:10.1029/2007JD009699,2008.10
Limbeck, A., Kulmala, M., and Puxbaum, H.: Secondary organic aerosol formation in the atmo-sphere via heterogeneous reaction of gaseous isoprene on acidic particles, Geophys. Res.Lett., 30, 1996, doi:10.1029/2003GL017738, 2003.
Lukacs, H., Gelencser, A., Hammer, S., Puzbaum, H., Pio, C., Legrand, M., Kasper-Giebl, A.,Handler, M., Limbeck, A., Simpson, D., and Preunkert, S.: Seasonal trends and possible15
sources of brown carbon based on 2-year aerosol measurements at six sites in Europe, J.Geophys. Res., 112, D23S18, doi:10.1029/2006JD008151, 2007.
Marley, N. A., Gaffney, J. S., Tackett, M., Sturchio, N. C., Heraty, L., Martinez, N., Hardy,K. D., Marchany-Rivera, A., Guilderson, T., MacMillan, A., and Steelman, K.: The impactof biogenic carbon sources on aerosol absorption in Mexico City, Atmos. Chem. Phys., 9,20
1537–1549, doi:10.5194/acp-9-1537-2009, 2009.Martins, J. V., Artaxo, P., Liousse, C., Reid, J. S., Hobbs, P. V., and Kaufman, Y. J.: Effects of
black carbon content, particle size, and mixing on light absorption by aerosols from biomassburning in Brazil, J. Geophys. Res., 103, 32041–32050, 1998.
Medina, J., Nenes, A., Sotiropoulou, R.-E. P., Cottrell, L. D., Ziemba, L. D., Beckman, P. J.,25
and Griffin, R. J.: Cloud condensation nuclei closure during the International Consortiumfor Atmospheric Research on Transport and Transformation 2004 campaign: Effects of size-resolved composition, J. Geophys. Res., 112, D10S31, doi:10.1029/2006JD007588, 2007.
Mochida, M., Kuwata, M., Miyakawa, T., Takegawa, N., Kawamura, K., and Kondo, Y.: Rela-tionship between hygroscopicity and cloud condensation nuclei activity for urban aerosols in30
Tokyo, J. Geophys. Res., 111, D23204, doi:10.1029/2005JD006980, 2006.Moffet, R. C. and Prather, K. A.: Extending ATOFMS measurements to include refractive index
and density, Anal. Chem., 77, 6535–6541, 2005.
1361

ACPD12, 1299–1400, 2012
CarbonaceousAerosols and
Radiative EffectsStudy
R. A. Zaveri et al.
Title Page
Abstract Introduction
Conclusions References
Tables Figures
J I
J I
Back Close
Full Screen / Esc
Printer-friendly Version
Interactive Discussion
Discussion
Paper
|D
iscussionP
aper|
Discussion
Paper
|D
iscussionP
aper|
Moffet, R. C., Henn, T., Laskin, A., and Gilles, M. K.: Automated chemical analysis of internallymixed aerosol particles using X-ray spectromicroscopy at the carbon K-edge, Anal. Chem.,82, 7906–7914, 2010a.
Moffet, R. C., Tivanski, A. V., Gilles, M. K.: “Scanning Transmission X-ray Microscopy” in Fun-damentals and Applications in Aerosol Spectroscopy, Eds. R. Signorell and J. Reid, CRC5
Press Taylor and Francis Group, Boca Raton, FL, 419–462, 2010b.Moffet, R. C., Henn, T. R., Tivanski, A. V., Hopkins, R. J., Desyaterik, Y., Kilcoyne, A. L. D.,
Tyliszczak, T., Fast, J., Barnard, J., Shutthanandan, V., Cliff, S. S., Perry, K. D., Laskin, A.,and Gilles, M. K.: Microscopic characterization of carbonaceous aerosol particle aging in theoutflow from Mexico City, Atmos. Chem. Phys., 10, 961–976, doi:10.5194/acp-10-961-2010,10
2010.Moffet, R. C., Furutani, H. F., Rodel, T., Henn, T., Sprau, P. O., Prakash, S., Laskin, A., Uematsu,
M., and Gilles, M. K.: Iron Speciation and Mixing in Single Aerosol Particles from the AsianContinental Outflow, J. Geophys. Res., submitted, 2011a.
Moffet, R. C., Tivanski, A. V., and Gilles, M. K.: Scanning Transmission X-ray Mircoscopy:15
Applications in Atmospheric Aerosol Research, Fundamentals and Applications in AerosolSpectroscopy, edited by: Signorell, R., and Reid, J. P., CRC Press, Boca Raton, 2011b.
Molina, L. T., Madronich, S., Gaffney, J. S., Apel, E., de Foy, B., Fast, J., Ferrare, R., Herndon,S., Jimenez, J. L., Lamb, B., Osornio-Vargas, A. R., Russell, P., Schauer, J. J., Stevens, P.S., Volkamer, R., and Zavala, M.: An overview of the MILAGRO 2006 Campaign: Mexico20
City emissions and their transport and transformation, Atmos. Chem. Phys., 10, 8697–8760,doi:10.5194/acp-10-8697-2010, 2010.
Moteki N. and Kondo, Y.: Method to measure time-dependent scattering cross-sections of par-ticles evaporating in a laser beam, J. Aerosol Sci., 39 348–364, doi:10.1029/2006JD007076,2008.25
Mukai, H. and Ambe, Y.: Characterization of a humic acid-like brown substance in airborneparticulate matter and tentative identification of its origin, Atmos. Environ., 20, 813–819,1986.
Murphy, D. M.: The design of single particle laser mass spectrometers, Mass Spectrom Rev.,26, 150–165, 2005.30
Murphy, D. M., Thomson, D. S., and Mahoney, T. M. J.: In situ measurements of organics,meteoritic material, mercury, and other elements in aerosols at 5 to 19 kilometers, Science,282, 1664–1669, 1998.
1362

ACPD12, 1299–1400, 2012
CarbonaceousAerosols and
Radiative EffectsStudy
R. A. Zaveri et al.
Title Page
Abstract Introduction
Conclusions References
Tables Figures
J I
J I
Back Close
Full Screen / Esc
Printer-friendly Version
Interactive Discussion
Discussion
Paper
|D
iscussionP
aper|
Discussion
Paper
|D
iscussionP
aper|
Murphy, D. M., Cziczo, D. J., Hudson, P. K., Schein, M. E., and Thomson, D. S.: Particle densityinferred from simultaneous optical and aerodynamic diameters sorted by composition, J.Aerosol Sci., 35, 135–139, 2004.
Nizkorodov, S. A., Laskin, J., and Laskin, A.: Molecular Chemistry of Organic Aerosols ThroughApplications of the High Resolution Mass Spectrometry, Phys. Chem. Chem. Phys., 13,5
3612–3629, doi:10.1039/C0CP02032J, 2011.Noziere, B. and Esteve, W.: Organic reactions increasing the absorption index of atmospheric
sulfuric acid aerosols, J. Geophys. Res., 32, L03812, doi:10.1029/2004GL021942, 2005.Noziere, B., Dziedzic, P., and Cordova, A.: Formation of secondary light-absorbing “fulvic-like”
oligomers: A common process in aqueous and ionic atmosphric particles?, Geophys. Res.10
Lett., 34, L21812, doi:10.1029/2007GL031300, 2007.Noziere, B., Dziedzic, P., and Cordova, A.: Products and kinetics of the liquid-phase reation of
glyoxal catalyzed by ammonium ions (NH4+), J. Phys. Chem. A, 113, 231–237, 2009.Muller, D., Ansmann, A., Mattis, I., Tesche, M., Wandinger, U., Althausen, D., and Pisani,
G.: Aerosol-type-dependent lidar ratios observed with Raman lidar, J. Geophys. Res., 112,15
D16202, doi:10.1029/2006JD008292, 2007.Ogren, J.: Comment on “Calibration and Intercomparison of Filter-Based Measurements
of Visible Light Absorption by Aerosols” Aerosol Sci. Tech., 44, 589–591, 1521-7388,doi:10.1080/02786826.2010.482111, 2010.
Olfert, J., Kulkarni, P. S., and Wang, J.: Measurements of particle size distribu-20
tions using a Fast Integrated Mobility Spectrometer, J. Aerosol Sci., 39, 940–956,doi:10.1016/j.jaerosci.2008.06.005, 2008.
Ottaviani, M., Cairns, B., Chowdhary, J., Van Diedenhoven, B., Knobelspiesse, K., Hostetler, C.,Ferrare, R., Burton, S., Hair, J., Obland, M. D., Rogers, R.: Polarimetric retrievals of surfaceproperties in the region affected by the Deepwater Horizon oil spill, submitted, Remote Sens.25
Environ., 2011.Pearson, G., Davies, F., and Collier, C.: An Analysis of the Performance of the UFAM Pulsed
Doppler Lidar for Observing the Boundary Layer, J. Atmos. Oceanic Technol., 26, 240–250,2009.
Pratt, K. A., Mayer, J. E., Holecek, J. C., Moffet, R. C., Sanchez, R. O., Rebotier, T. P., Furu-30
tani, H., Gonin, M., Fuhrer, K., Su, Y., Guazzotti, S., and Prather, K. A.: Development andCharacterization of an Aircraft Aerosol Time-of-Flight Mass Spectrometer, Anal. Chem., 81,1792–1800, 2009.
1363

ACPD12, 1299–1400, 2012
CarbonaceousAerosols and
Radiative EffectsStudy
R. A. Zaveri et al.
Title Page
Abstract Introduction
Conclusions References
Tables Figures
J I
J I
Back Close
Full Screen / Esc
Printer-friendly Version
Interactive Discussion
Discussion
Paper
|D
iscussionP
aper|
Discussion
Paper
|D
iscussionP
aper|
Pratt, K. A., Twohy, C. H., Murphy, S. M., Moffet, R. C., Heymsfield, A. J., Gaston, C. J., DeMott,P. J., Field, P. R., Henn, T. R., Rogers, D. C., Gilles, M. K., Seinfeld, J. H., and Prather, K.A.: Observation of playa salts as nuclei in orographic wave clouds, J. Geophys. Res.-Atmos.,115, D15301, doi:10.1029/2009JD013606, 2010.
Radney, J. G., Bazargan, M. H., Wright, M. E., and Atkinson, D. B.: Laboratory validation5
of aerosol extinction coefficient measurements by a field-deployable pulsed cavity ring-down transmissometer, Aerosol Sci. Technol., 43, 71–80, doi:10.1080/02786820802482536,2009.
Ramanathan, V., Crutzen, P. J., Lelieveld, J., Mitra, A. P., Althausen, D., Anderson, J., Andreae,M. O., Cantrell, W., Cass, G. R., Chung, C. E., Clarke, A. D., Coakley, J. A., Collins, W.10
D., Conant, W. C., Dulac, F., Heintzenberg, J., Heymsfield, A. J., Holben, B., Howell, S.,Hudson, J., Jayaraman, A., Kiehl, J. T., Krishnamurti, T. N., Lubin, D., McFarquhar, G.,Novakov, T., Ogren, J. A., Podgorny, I. A., Prather, K., Priestley, K., Prospero, J. M., Quinn, P.K., Rajeev, K., Rasch, P., Rupert, S., Sadourny, R., Satheesh, S. K., Shaw, G. E., Sheridan,P., and Valero, F. P. J.: Indian Ocean experiment: An integrated analysis of the climate15
forcing and effects of the great Indo-Asian haze, J. Geophys. Res., 106, 28,371–28,398,doi:10.1029/2001JD900133, 2001.
Riemer, N., West, M., Zaveri, R. A., and Easter, R. C.: Simulating the evolution of sootmixing state with a particle-resolved aerosol model, J. Geophys. Res., 114, D09202,doi:10.1029/2008JD011073, 2009.20
Roach, P. J., Laskin, A., and Laskin, J.: Molecular Characterization of Organic Aerosols UsingNanospray Desorption Electrospray Ionization Mass Spectrometry, Anal. Chem., 82, 7979–7986, 2010.
Robinson, A. L., Donahue, N. M., Shrivastava, M. K., Weitkamp, E. A., Sage, A. M., Grieshop,A. P., Lane, T. E., Pierce, J. R., and Pandis, S. N.: Rethinking organic aerosols: Semivolatile25
emissions and photochemical aging, Science, 315, 1259–1262, 2007.Rogers, R. R., Hair, J. W., Hostetler, C. A., Ferrare, R. A., Obland, M. D., Cook, A. L., Harper,
D. B., Burton, S. P., Shinozuka, Y., McNaughton, C. S., Clarke, A. D., Redemann, J., Russell,P. B., Livingston, J. M., and Kleinman, L. I.: NASA LaRC airborne high spectral resolutionlidar aerosol measurements during MILAGRO: observations and validation, Atmos. Chem.30
Phys., 9, 4811–4826, doi:10.5194/acp-9-4811-2009, 2009.Saathoff, H., Naumann, K. -H., Schnaiter, M., Schock, W., Mohler, O., Schurath, U., Weingart-
ner, E., Gysel, M., Baltensperger, U.: Coating of soot and (NH4)2SO4 particles by ozonolysis
1364

ACPD12, 1299–1400, 2012
CarbonaceousAerosols and
Radiative EffectsStudy
R. A. Zaveri et al.
Title Page
Abstract Introduction
Conclusions References
Tables Figures
J I
J I
Back Close
Full Screen / Esc
Printer-friendly Version
Interactive Discussion
Discussion
Paper
|D
iscussionP
aper|
Discussion
Paper
|D
iscussionP
aper|
products of α-pinene, J. Aerosol Sci., 34, 1297–1321, 2003.Sareen, N., Schwier, A. N., Shapiro, E. L., Mitroo, D., and McNeil, V. F.: Secondary organic
material formed by methylglyoxal in aqueous aerosol mimics, Atmos. Chem. Phys., 10, 997–1016, doi:10.5194/acp-10-997-2010, 2010.
Seinfeld, J. H. and Pandis, S.N.: Atmospheric Chemistry and Physics: From Air Pollution to5
Climate Change, John Wiley, Hoboken, N. J., 1998.Schnaiter, M., Linke, C., Mohler, O., Naumann, K.-H., Saathoff, H., Wagner, R., Schurath, U.,
and Wehner, B.: Absorption amplification of black carbon internally mixed with secondaryorganic aerosol, J. Geophys. Res., 110, D19204, doi:10.1029/2005JD006046, 2005.
Schwarz, J. P., Gao, R. S., Fahey, D. W., Thomson, D. S., Watts, L. A., Wilson, J. C., Reeves, J.10
M., Darbeheshti, M., Baumgardner, D. G., Kok, G. L., Chung, S. H., Schulz, M., Hendricks,J., Lauer, A., Karcher, B., Slowik, J. G., Rosenlof, K. H., Thompson, T. L., Langford, A. O.,Loewenstein, M., and Aikin, K. C.: Single-particle measurements of midlatitude black carbonand light-scattering aerosols from the boundary layer to the lower stratosphere, J. Geophys.Res., 111, D16207, doi:10.1029/2006JD007076, 2006.15
Schwarz, J. P., Spackman, J. R., Fahey, D. W., Gao, R. S., Lohmann, U., Stier, P., Watts, L.A., Thomson, D. S., Lack, D. A., Pfister, L., Mahoney, M. J., Baumgardner, D., Wilson, J. C.,and Reeves, J. M.: Coatings and their enhancement of black carbon light absorption in thetropical atmosphere, J. Geophys. Res., 113, D03203, doi:10.1029/2007JD009042, 2008a.
Schwarz, J. P., Spackman, J. R., Fahey, D. W., Gao, R. S., Lohmann, U., Stier, P., Watts, L. A.,20
Thomson, D. S., Lack, D. A., Pfister, L., Mahoney, M. J., Baumgardner, D., Wilson, J. C., andReeves, J. M.: Measurement of the mixing state, mass, and optical size of individual blackcarbon particles in urban and biomass burning emissions, Geophys. Res. Lett., 35, L13810,doi:10.1029/2008GL033968, 2008b.
Shapiro, E. L., Szprengiel, J., Sareen, N., Jen, C. N., Giordano, M. R., and McNeill, V. F.: Light-25
absorbing secondary organic material formed by glyoxal in aqueous aerosol mimics, Atmos.Chem. Phys., 9, 2289–2300, doi:10.5194/acp-9-2289-2009, 2009.
Sem, G. J.: Design and performance characteristics of three continuous-flow condensa-tion particle counters: a summary, Atmos. Res., 62(3–4), 267–294, doi:10.1016/S0169-8095(02)00014-5, 2002.30
Sinreich, R., Coburn, S., Dix, B., and Volkamer, R.: Ship-based detection of glyoxal over theremote tropical Pacific Ocean, Atmos. Chem. Phys., 10, 11359–11371, doi:10.5194/acp-10-11359-2010, 2010.
1365

ACPD12, 1299–1400, 2012
CarbonaceousAerosols and
Radiative EffectsStudy
R. A. Zaveri et al.
Title Page
Abstract Introduction
Conclusions References
Tables Figures
J I
J I
Back Close
Full Screen / Esc
Printer-friendly Version
Interactive Discussion
Discussion
Paper
|D
iscussionP
aper|
Discussion
Paper
|D
iscussionP
aper|
Slowik, J. G., Stroud, C., Bottenheim, J. W., Brickell, P. C., Chang, R. Y.-W., Liggio, J., Makar,P. A., Martin, R. V., Moran, M. D., Shantz, N. C., Sjostedt, S. J., van Donkelaar, A., Vlasenko,A., Wiebe, H. A., Xia, A. G., Zhang, J., Leaitch, W. R., and Abbatt, J. P. D.: Characterizationof a large biogenic secondary organic aerosol event from eastern Canadian forests, Atmos.Chem. Phys., 10, 2825–2845, doi:10.5194/acp-10-2825-2010, 2010.5
Smith, J. D. and Atkinson, D. B.: A portable pulsed cavity ring-down transmissometer for mea-surement of the optical extinction of the atmospheric aerosol, Analyst, 126, 1216–1220,2001.
Song, C., Zaveri, R. A., Alexander, M. L., Thornton, J. A., Madronich, S., Ortega, J. V., Zelenyuk,A., Yu, X.-Y., Laskin, A., and Maughan, D.: Effect of hydrophobic primary organic aerosol on10
secondary organic aerosol formation from ozonolysis of α-pinene, Geophys. Res. Lett., 34,L20803, doi:10.1029/2007GL030720, 2007.
Sorooshian, A. , Brechtel, F. J., Ma, Y., Weber, R. J., Corless, A., Flagan, R. C., and Seinfeld,J. H.: Modeling and Characterization of a Particle-into-Liquid Sampler (PILS), Aerosol Sci.Tech., 40, 396–409, doi:10.1080/02786820600632282, 2006.15
Spencer, M. T., Shields, L. G. and Prather, K A.: Simultaneous measurement of the effectivedensity and chemical composition of ambient aerosol particles, Environ. Sci. Technol., 41,1303–1309, 2007.
Stephens, M., Turner, N., and Sandberg, J.: Particle Identification by Laser-Induced Incandes-cence in A Solid-State Laser Cavity, Appl. Optics., 42, 3726–3736, 2003.20
Steiner, A. L., Cohen, R. C., Harley, R. A., Tonse, S., Millet, D. B., Schade, G. W., and Goldstein,A. H.: VOC reactivity in central California: comparing an air quality model to ground-basedmeasurements, Atmos. Chem. Phys., 8, 351–368, doi:10.5194/acp-8-351-2008, 2008.
Stull, R. B.: An Introduction to Boundary Layer Meteorology, Kluwer, Boston, 1988.Subramanian, R., Kok, G. L., Baumgardner, D., Clarke, A., Shinozuka, Y., Campos, T. L.,25
Heizer, C. G., Stephens, B. B., de Foy, B., Voss, P. B., and Zaveri, R. A.: Black carbon overMexico: the effect of atmospheric transport on mixing state, mass absorption cross-section,and BC/CO ratios, Atmos. Chem. Phys., 10, 219–237, doi:10.5194/acp-10-219-2010, 2010.
Sugimoto, N. and Lee, C.H.: Characteristics of dust aerosols inferred from lidar depolarizationmeasurements at two wavelengths, Appl. Optics, 45, 7468–7474, 2006.30
Surratt, J. D., Gomez-Gonzalez, Y., Chan, A. W. H., Vermeylen, R., Shahgholi, M., Kleindienst,T. E., Edney, E. O., Offenberg, J. H., Lewandowski, M., Jaoui, M., Maenhaut, W., Claeys, M.,Flagan, R. C., and Seinfeld, J. H.: Organosulfate formation in biogenic secondary organic
1366

ACPD12, 1299–1400, 2012
CarbonaceousAerosols and
Radiative EffectsStudy
R. A. Zaveri et al.
Title Page
Abstract Introduction
Conclusions References
Tables Figures
J I
J I
Back Close
Full Screen / Esc
Printer-friendly Version
Interactive Discussion
Discussion
Paper
|D
iscussionP
aper|
Discussion
Paper
|D
iscussionP
aper|
aerosol, J. Phys. Chem. A, 112, 8345–8378, 2008.Surratt, J. D., Chan, A. W. H., Eddingsaas, N. C., Chan, M., Loza, C. L., Kwan, A. J., Hersey,
S. P., Flagan, R. C., Wennberg, P. O., and Seinfeld, J. H.: Reactive intermediates revealedin secondary organic aerosol formation from isoprene, Proc. Natl. Acad. Sci. U.S.A., 107,6640–6645, 2010.5
Tritscher, T., Juranyi, Z., Martin, M., Chirico, R., Gysel, M., Heringa, M. F., DeCarlo, P. F., Sierau,B., Prevot, A. S. H., Weingartner, E., and Baltensperger, U.: Changes of hygroscopicity andmorphology during ageing of diesel soot, Environ. Res. Lett., 6, 034026, doi:10.1088/1748-9326/6/3/034026, 2011.
Ulbrich, I. M., Canagaratna, M. R., Zhang, Q., Worsnop, D. R., and Jimenez, J. L.: Interpreta-10
tion of organic components from Positive Matrix Factorization of aerosol mass spectrometricdata, Atmos. Chem. Phys., 9, 2891–2918, doi:10.5194/acp-9-2891-2009, 2009.
Vaden, T. D., Imre, D., Beranek, J., Shrivastava, M., and Zelenyuk, A.: Evaporation kinetics andphase of laboratory and ambient secondary organic aerosol, Proc. Natl. Acad. Sci. U. S. A.,108, 2190–2195, 2011a.15
Vaden, T. D., Imre, D., Beranek, J., and Zelenyuk, A.: Extending the Capabilities of SingleParticle Mass Spectrometry: I. Measurements of Aerosol Number Concentration, Size Dis-tribution, and Asphericity, Aerosol Sci. Technol., 45, 113–124, 2011b.
Vaden, T. D., Imre, D., Beranek, J., and Zelenyuk, A.: Extending the Capabilities of SingleParticle Mass Spectrometry: II. Measurements of Aerosol Particle Density without DMA,20
Aerosol Sci. Technol., 45, 125–135, 2011c.Virtanen, A., Joutsensaari, J., Koop, T., Kannosto, J., Yli-Pirila, P., Leskinen, J., Makela, J.
M., Holopainen, J. K., Poschl, U., Kulmala, M., Worsnop, D. R. and Laaksonen, A.: Anamorphous solid state of biogenic secondary organic aerosol particles, Nature, 467, 824–827, 2010.25
Volkamer, R., Jimenez, J. L., San Martini, F., Dzepina, K., Zhang, Q., Salcedo, D., Molina, L.T., Worsnop, D. R., and Molina, M. J.: Secondary organic aerosol formation from anthro-pogenic air pollution: Rapid and higher than expected, Geophys. Res. Lett., 33, L17811,doi:10.1029/2006GL026899, 2006.
Volkamer, R., Coburn, S., Dix, B., and Sinreich, R.: MAX-DOAS observations from ground,30
ship, and research aircraft: maximizing signal-to-noise to measure “weak” absorbers, in:SPIE Proceedings Ultraviolet and Visible Ground- and Space-based Measurements, TraceGases, Aerosols and Effects, San Diego, 2–9 August 2009, 746203, doi:10.1117/12.826792,
1367

ACPD12, 1299–1400, 2012
CarbonaceousAerosols and
Radiative EffectsStudy
R. A. Zaveri et al.
Title Page
Abstract Introduction
Conclusions References
Tables Figures
J I
J I
Back Close
Full Screen / Esc
Printer-friendly Version
Interactive Discussion
Discussion
Paper
|D
iscussionP
aper|
Discussion
Paper
|D
iscussionP
aper|
2009.Waquet, F., Cairns, B., Knobelspiesse, K., Chowdhary, J., Travis, L. D., Schmid, B., and
Mishchenko, M. I.: Polarimetric remote sensing of aerosols over land, J. Geophys. Res.,114, D01206, doi:10.1029/2008JD010619, 2009.
Warneke, C., Froyd, K. D., Brioude, J., Bahreini, R., Brock, C. A., Cozic, J., de Gouw, J.5
A., Fahey, D. W., Ferrare, R., Holloway, J. S., Middlebrook, A. M., Miller, L., Montzka, S.,Schwarz, J. P., Sodemann, H., Spackman, J. R., and Stohl, A.: An important contribution tospringtime Arctic aerosol from biomass burning in Russia, Geophys. Res. Lett., 37, L01801,doi:10.1029/2009GL041816, 2010.
Weber, R. J., Sullivan, A. P., Peltier, R. E., Russell, A., Yan, B., Zheng, M., Gouw, J. A. d.,10
Warneke, C., Brock, C., Holloway, J. S., Atlas, E. L., and Edgerton, E.: A study of secondaryorganic aerosol formation in the anthropogenic influenced southeastern United States, J.Geophys. Res., 112, D13302, doi:10.1029/2007JD008408, 2007.
Wentzel, M., Gorzawski, H., Naumann, K. H., Saathoff, H., and Weinbruch, S.: Transmissionelectron microscopical and aerosol dynamical characterization of soot aerosols, J. Aerosol15
Sci., 34, 1347–1370, 2003.Wexler, A. S. and Seinfeld, J. H.: Second-generation inorganic aerosol model, Atmos. Environ.,
25A, 2731–2748, 1991.Zaveri, R. A., Easter, R. C., Fast, J. D., and Peters, L. K.: Model for Simulat-
ing Aerosol Interactions and Chemistry (MOSAIC), J. Geophys. Res., 113, D13204,20
doi:10.1029/2007JD008782, 2008.Zaveri, R. A., Berkowitz, C. M., Brechtel, F. J., Gilles, M. K., Hubbe, J. M., Jayne, J. T., Kleinman,
L. I., Laskin, A., Madronich, S., Onasch, T. B., Pekour, M., Springston, S. R., Thornton, J.A., Tivanski, A. V., and Worsnop, D. R.: Nighttime chemical evolution of aerosol and tracegases in a power plant plume: Implications for secondary organic nitrate and organosulfate25
aerosol formation, NO3 radical chemistry, and N2O5 heterogeneous hydrolysis, J. Geophys.Res., 115, D12304, doi:10.1029/2009JD013250, 2010a.
Zaveri, R. A., Barnard, J. C., Easter, R. C., Riemer, N., and West, M.: Particle-resolved simu-lation of aerosol size, composition, mixing state, and the associated optical and cloud con-densation nuclei activation properties in an evolving urban plume, J. Geophys. Res., 115,30
D17210, doi:10.1029/2009JD013616, 2010b.Zelenyuk, A. and Imre, D.: Single particle laser ablation time-of-flight mass spectrometer: An
introduction to SPLAT, Aerosol Sci. Tech., 39, 554–568, 2005.
1368

ACPD12, 1299–1400, 2012
CarbonaceousAerosols and
Radiative EffectsStudy
R. A. Zaveri et al.
Title Page
Abstract Introduction
Conclusions References
Tables Figures
J I
J I
Back Close
Full Screen / Esc
Printer-friendly Version
Interactive Discussion
Discussion
Paper
|D
iscussionP
aper|
Discussion
Paper
|D
iscussionP
aper|
Zelenyuk, A. and Imre, D.: Beyond single particle mass spectrometry: multidimensional char-acterisation of individual aerosol particles, Int. Rev. Phys. Chem., 28, 309–358, 2009a.
Zelenyuk, A., Imre, D., Han, J. H., and Oatis, S.: Simultaneous measurements of individualambient particle size, composition, effective density, and hygroscopicity, Anal. Chem., 80,1401–1407, 2008.5
Zhang, Q., Alfarra, M. R., Worsnop, D. R., Allan, J. D., Coe, H., Canagaratna, M. R., andJimenez, J. L.: Deconvolution and quantification of hydrocarbon-like and oxygenated or-ganic aerosols based on aerosol mass spectrometry, Environ. Sci. Technol., 39, 4938–4952,doi:4910.1021/es048568l, 2005.
Zelenyuk, A., Yang, J., Choi, E., and Imre, D.: SPLAT II: An Aircraft Compatible, Ultra-Sensitive,10
High Precision Instrument for In-Situ Characterization of the Size and Composition of Fineand Ultrafine Particles, Aerosol Sci. Technol., 43, 411–424, 2009b.
Zelenyuk, A., Imre, D., Earle, M., Easter, R., Korolev, A., Leaitch, R., Liu, P., Macdonald, A.M., Ovchinnikov, M., and Strapp, W.: In Situ Characterization of Cloud Condensation Nuclei,Interstitial, and Background Particles Using the Single Particle Mass Spectrometer, SPLAT15
II, Anal Chem., 82, 7943–7951, 2010.Zhang, Q., Jimenez, J. L., Canagaratna, M. R., Allan, J. D., Coe, H., Ulbrich, I., Alfarra, M.
R., Takami, A., Middlebrook, A. M., Sun, Y. L., Dzepina, K., Dunlea, E., Docherty, K., De-Carlo, P. F., Salcedo, D., Onasch, T., Jayne, J. T., Miyoshi, T., Shimono, A., Hatakeyama, S.,Takegawa, N., Kondo, Y., Schneider, J., Drewnick, F., Borrmann, S., Weimer, S., Demerjian,20
K., Williams, P., Bower, K., Bahreini, R., Cottrell, L., Griffin, R. J., Rautiainen, J., Sun, J. Y.,Zhang, Y. M., and Worsnop, D. R.: Ubiquity and dominance of oxygenated species in organicaerosols in anthropogenically-influenced Northern Hemisphere mid-latitudes, Geophys. Res.Lett., 34, L13801, doi:10.1029/2007GL029979, 2007.
Zhang, Q., Jimenez, J. L., Canagaratna, M., Ng, N. L., Ulbrich, I., Worsnop, D., and Sun, Y. L.:25
Understanding organic aerosols via factor analysis of aerosol mass spectrometry: a review,Anal. Bioanal. Chem., 401, 3045–3067, doi:10.1007/s00216-00011-05355-y, 2011.
Zhang, R., Khalizov, A. F., Pagels, J., Zhang, D., Xue, H., and McMurry, P. H.: Variabilityin morphology, hygroscopicity, and optical properties of soot aerosols during atmosphericprocessing, Proc. Natl. Acad. Sci. U.S. A., 105, 10291–10296, 2008.30
1369

ACPD12, 1299–1400, 2012
CarbonaceousAerosols and
Radiative EffectsStudy
R. A. Zaveri et al.
Title Page
Abstract Introduction
Conclusions References
Tables Figures
J I
J I
Back Close
Full Screen / Esc
Printer-friendly Version
Interactive Discussion
Discussion
Paper
|D
iscussionP
aper|
Discussion
Paper
|D
iscussionP
aper|
Table 1. Measurements and Instruments at the T0 and T1 Ground Sites.
Measurement T0 T1 Instrument/Technique Avg.Time
Accuracy DL PI (Institution)
Meteorology
Wind profile • Wind Profiler, Sodar Berg (PNNL)Temperature, RH profile • • Radiosonde Berg (PNNL)TemperaturePressureRelative humidityWind speedWind direction
• • Vaisala WXT-510 1 min 0.3 ◦C0.5 mbar3 %0.3 m s−1
3 deg
T0: Jobson (WSU)T1: Berg (PNNL)
Trace Gases
VOCs • • PTR-MS T0: Jobson (WSU)T1: Knighton (MSU)
SVOCs • GC-ITMS Jobson (WSU)FormaldehydeGlyoxal
• CU GMAX-DOAS 15 min 10 % 2×1015∗
3×1014∗Volkamer (CUBoulder)
CO • • T0: VUV fluorescenceT1: Teledyne Model300U
1 min1 min
2 % 5 ppbv T0: Jobson (WSU)T1: Dubey (LANL)
CO2-CH4-H2O • Picarro Cavity Ringdown Dubey (LANL)O3 • • UV absorption 1 min 10 % 3 ppbv T0: Jobson (WSU)
T1: Dubey (LANL)NO • • Chemiluminescence 2 min 2 % 5 pptv T0: Jobson (WSU)
T1: Dubey (LANL)NO2 • • Photolytic conversion
CU GMAX-DOAS2 min15 min
5 %5 %
5 pptv5×1014∗
T0: Jobson (WSU)T1: Volkamer (CU Boulder)
NOy • • Mo converter 2 min 5 % 5 pptv T0: Jobson (WSU)T1: Dubey (LANL)
SO2 • Thermo Model 43i 1 min 5 % 1 ppbv Song (PNNL)
Aerosol Size & Comp.
Size distribution • • SMPS+CPC: 12.2 nm–710 nmSMPS+CPC: 8.75–858 nm
2.5 min5 min
3 % T0: Song (PNNL)T1: Zhang (UC Davis)
Size distribution • • APS: 520–20000 nm 1 min T0: Jobson (WSU)T1: Pekour (PNNL)
Number Concentration • • TSI CPC-3010 1 min Pekour (PNNL)Composition, volatility • • HR-ToF-AMS+
thermodenuderT0: Song (PNNL)T1: Zhang (UC Davis)
Single particle size, com-position, density
• • T0: SPLAT IIT1: PALMS
T0: Zelenyuk (PNNL)T1: Cziczo (PNNL)
Black carbon mass • • SP2 1 min Subramanian (DMT)Water-soluble species • • PILS with autosampler Zhang (UC Davis)OC/EC • • Sunset OC/EC 1 h Laulainen (PNNL)Chemical Composition • • TRAC Collector Laskin (EMSL), Gilles (LBNL)Chemical Composition DRUM Sampler Laskin (EMSL)Aerosol Morphology • • SEM Collector Mazzoleni (MTU)Aldehydes and polarorganics & OC/EC
• • Hi-vol Filter 12 h 5 % Kubatova (UND)
Radiocarbon • Hi-vol Filter Gaffney (UArk)
∗ Vertical Column Density (VCD); detection limit in units of molecule cm−2.
1370

ACPD12, 1299–1400, 2012
CarbonaceousAerosols and
Radiative EffectsStudy
R. A. Zaveri et al.
Title Page
Abstract Introduction
Conclusions References
Tables Figures
J I
J I
Back Close
Full Screen / Esc
Printer-friendly Version
Interactive Discussion
Discussion
Paper
|D
iscussionP
aper|
Discussion
Paper
|D
iscussionP
aper|
Table 1. Continued.
Measurement T0 T1 Instrument/Technique Avg.Time
Accuracy DL PI (Institution)
Radiation
J-NO2 • 4π J-NO2 radiometer 1 s Laulainen (PNNL)Actinic flux • Diode-Array Spectrora-
diometer1 s Laulainen (PNNL)
Broadband solar rad flux • • Pyranometer (EppleyPSP)
1 min 4 % Barnard (PNNL)
AOD from narrowbandsolar irradiance
• • MFRSR 20 s <0.01 Barnard (PNNL)
Aerosol extinction profilesand AOD from diffuse so-lar stray light
• CU GMAX-DOAS 15 min ∼0.01 Volkamer (CU Boulder)
Optical Properties
Scattering • • TSI Nephelometer3563 at 450, 550, 700 nm
1 min 0.3 Mm−1 Pekour (PNNL)
Absorption • • PSAP at 470, 532, 660 nm 1 min 0.3 Mm−1 Pekour (PNNL)Absorption • Athelometer Sedlacek (BNL)Absorption & scattering • • Photoacoustic instruments
T0: 375, 405, 532, 781, 870,1047 nmT1: 355, 405, 532, 781,870 nm
Varies byinstrumentand λ
T0, T1: Arnott (UNR)T0, T1: Dubey(LANL)T0: Cappa (UCD)
Extinction & scattering • • Cavity Ring-down at355, 405, 532,1064 nm
Varies byinstrumentand λ
T0, T1: Atkinson (PSU)T0: Cappa (UCD)
Hygroscopic growth • • Humidigraph – f (RH) T0: Cappa (UCD)T1: Cziczo (PNNL)
CCN • • CCN Counter Cziczo (PNNL)CCN • Size-resolved CCN Counter Wang (BNL)
∗ Vertical Column Density (VCD); detection limit in units of molecule cm−2.
1371

ACPD12, 1299–1400, 2012
CarbonaceousAerosols and
Radiative EffectsStudy
R. A. Zaveri et al.
Title Page
Abstract Introduction
Conclusions References
Tables Figures
J I
J I
Back Close
Full Screen / Esc
Printer-friendly Version
Interactive Discussion
Discussion
Paper
|D
iscussionP
aper|
Discussion
Paper
|D
iscussionP
aper|
Table 2. Measurements and Instruments aboard the DOE G-1 Aircraft during CARES 2010.
Measurement Instrument/Technique Avg. Time Accuracy DL PI (Institution)
Meteorology
Temperature Rosemount 102 1 s ±0.5 ◦C −50 to 50 ◦C Hubbe (PNNL)Dewpoint temperature General Eastern 1011B
chilled-mirror hygrometer1 s ±0.5 ◦C −75 to 50 ◦C Hubbe (PNNL)
Static pressure Rosemount 1201F1 1 s 3 mb 400–1060 mb Hubbe (PNNL)Gust probe, alpha All-Sensor 20-inch-G-4V 0.1 s 0.125 mb 0 to 50 mb Senum (BNL)Gust probe, beta Rosemount 1221S1 0.1 s 0.35 mb 0 to 35 mb Senum (BNL)Gust probe, dynamic Rosemount 1221F2 1 s 0.3 mb 0 to 100 mb,
−55 to 71 ◦CHubbe (PNNL)
Trace Gases
CO Resonance Limited VUV-Fluorescence
1 s Springston (BNL)
SO2 TEI 43S 1 s Springston (BNL)O3 TEI 49-100 1 s Springston (BNL)NO, NO2, and NOy Research Grade Instru-
ments1 s Springston (BNL)
VOCs Ionikon PTR-MS 3.5 s Species dependent Species dependent Shilling (PNNL)
Aerosol Size
Number conc. >3 nm TSI-3025 CPC 1 s 0–105 cm-3 Tomlinson (PNNL)Number conc. >10 nm TSI-3010 CPC 1 s 0–104 cm-3 Tomlinson (PNNL)Particle size distribution(PSD): 30–70 nm
FIMS 1 s Wang (BNL)
PSD: 60–1000 nm UHSAS-A 1 s 0–7200 cm−3 Tomlinson (PNNL)PSD: 500–50 000 nm CAPS/CAS 1 s Senum (BNL)
Aerosol Composition
Aerosol composition HR-ToF-AMS (EMSL) 13 s ∼30 % 0.1 µg m−3 for org Shilling (PNNL)Single particle composi-tion and size
ATOFMS Prather (UCSD)
Black carbon mass DMT SP2 Particle-by-particle
∼35 % 10 ng m−3 Sedlacek (BNL)
Water soluble aerosolchemical composition
PILS with autosampler 3 min Species dependent 0.02–0.28µg m−3
background
Zhang (UCD)
Aerosol chemicalcomposition
TRAC Collector Laskin (EMSL), Gilles(LBNL)
Optical Properties
Aerosol light scattering TSI 3563 Nephelometerat 450, 550, and 700 nm
1 s 4–7 % 1–104 Mm-1 Hubbe (PNNL)
Aerosol light absorption Radiance ResearchPSAP at 461, 522, and648 nm
1 s 20 % 10−1–104 Mm−1
(log channel);0–50 Mm−1 (linearchannel)
Hubbe (PNNL)
Aerosol light absorptionand scattering
Photoacoustic spectrom-eter at 405, 532, and870 nm
Dubey (LANL)
1372

ACPD12, 1299–1400, 2012
CarbonaceousAerosols and
Radiative EffectsStudy
R. A. Zaveri et al.
Title Page
Abstract Introduction
Conclusions References
Tables Figures
J I
J I
Back Close
Full Screen / Esc
Printer-friendly Version
Interactive Discussion
Discussion
Paper
|D
iscussionP
aper|
Discussion
Paper
|D
iscussionP
aper|
Table 3. Measurements and Instruments aboard the NASA B-200 King Air Aircraft duringCARES 2010.
Parameter Instrument/Technique Averaging Time Uncertaintya orAccuracy
PI (Institution)
Backscatter ratio (532 nm) High Spectral Resolution Lidar 10 s (∼1 km) <5% Ferrare, Hostetler (NASA)
Backscatter coefficient(532 & 1064 nm)
High Spectral Resolution Lidar 10 s (∼1 km) 0.16 (Mm-sr)−1 Ferrare, Hostetler (NASA)
Extinction coefficient(532 nm)
High Spectral Resolution Lidar 1 min (∼6 km) 10 Mm−1 Ferrare, Hostetler (NASA)
Depolarization High Spectral Resolution Lidar 10 s (∼1 km) 0.004 Ferrare, Hostetler (NASA)
Aerosol optical depth Research ScanningPolarimeter
scene-dependentd 0.02/8 %b Cairns (NASA/GISS)
Mode effective radius Research ScanningPolarimeter
scene-dependentd 0.02µm/10 %c Cairns (NASA/GISS)
Mode effective variance Research ScanningPolarimeter
scene-dependentd 0.05/50 %c Cairns (NASA/GISS)
Real refractive index Research ScanningPolarimeter
scene-dependentd 0.02 Cairns (NASA/GISS)
Imaginary refractive index Research ScanningPolarimeter
scene-dependentd 50 % Cairns (NASA/GISS)
aSee Hair et al. (2008) for a description of HSRL aerosol measurement uncertainties.bThe appropriate accuracy is whichever value is larger (i.e. lower accuracy at higher optical depths).cAbsolute accuracy applies to accumulation/fine mode and relative accuracy to coarse.dScan rate is 1.1885 Hz (0.8414 s), with angular resolution (instrument IFOV) equal to 14 mrad. The time required
for scene aggregation is defined by the ratio of aircraft speed to target distance (see http://data.giss.nasa.gov/rsp air/
specs.html).
1373

ACPD12, 1299–1400, 2012
CarbonaceousAerosols and
Radiative EffectsStudy
R. A. Zaveri et al.
Title Page
Abstract Introduction
Conclusions References
Tables Figures
J I
J I
Back Close
Full Screen / Esc
Printer-friendly Version
Interactive Discussion
Discussion
Paper
|D
iscussionP
aper|
Discussion
Paper
|D
iscussionP
aper|
Table 4. Measurements and Instruments aboard the NOAA Twin Otter Aircraft during CARES2010.
Parameter Instrument/Technique Avg. Time Vertical/RangeResolution
MeasurementPrecision
Measurement Accuracy PI (Institution)
Ozone profiles Differential AbsorptionLidar
10 s(∼600 m)
90 m(smoothedover 450 m)
5–10 % (upto 30 % forlow SNR)
< 5 % (up to 15 % for lowSNR)
Senff (NOAA/CU Boulder)
Aerosol backscatter pro-files (300 nm)
Differential AbsorptionLidar
10 s(∼600 m)
6 m ∼10;% <30 % Senff (NOAA/CU Boulder)
Boundary layer height Differential AbsorptionLidar
10 s(∼600 m)
– ∼50 m ∼50 m Senff (NOAA/CU Boulder)
Line-of-sight wind speedprofiles (at 4 azimuth an-gles)
Doppler Lidar 2–6 s(∼240 m)
50 m 0.1 m s−1 up to 0.1 m s−1 Hardesty (NOAA)
Relative aerosolbackscatter profiles(1.6 µm)
Doppler Lidar 1 s(∼60 m)
50 m Uncalibrated Uncalibrated Hardesty (NOAA)
NO2 vertical column den-sity (VCD)
CU Airborne Multi AXisDOAS
2 s(∼1 km)
– ∼ 10 % (upto 30 % athigh solarzenith angle)
1.5×10¹⁵ molec cm-2 Volkamer (CU Boulder)
NO2, HCHO, CHOCHOvertical profiles
CU Airborne Multi AXisDOAS
ascent/descent∼150 m ∼10 % Depends on gas and av-eraging time
Volkamer (CU Boulder)
Aerosol extinction profiles(360 nm, 477 nm, 630 nm)
CU Airborne Multi AXisDOAS
ascent/descent∼150 m – ∼0.01−0.03 km−1 (variesat different wavelengths)
Volkamer (CU Boulder)
Ozone (at flightlevel)
UV light absorption 10 s(∼600 m)
– 1 ppbv/2 % 1 ppbv/2 % Langford (NOAA)
Temperature (at flightlevel)
1 s(∼60 m)
– 0.1 K 0.1 K Senff (NOAA/CU Boulder)
Surface temperature IR pyrometer 1 s(∼60 m)
– 0.06 K 0.5 K Senff (NOAA/CU Boulder)
Surface albedo 4-channel UV and visirradiance
30 s(∼1.8 km)
– ∼5 % ∼5 % Volkamer (CU Boulder)
1374

ACPD12, 1299–1400, 2012
CarbonaceousAerosols and
Radiative EffectsStudy
R. A. Zaveri et al.
Title Page
Abstract Introduction
Conclusions References
Tables Figures
J I
J I
Back Close
Full Screen / Esc
Printer-friendly Version
Interactive Discussion
Discussion
Paper
|D
iscussionP
aper|
Discussion
Paper
|D
iscussionP
aper|
Table 5. Summary of DOE G-1, NASA-B200, and NOAA Twin Otter aircraft flights in the CARES domain during themonth of June 2010.
Date DOE G-1Takeoff-LandingPDT
NASA B-200Takeoff-LandingPDT
NOAA Twin OtterTakeoff-LandingPDT
Wind Dir Remarks
3 June 12:41–15:07 12:24–15:49 – SW Coordinated with R/V Atlantis; Very lowAOD throughout region
5 June – 11:29–13:43 – SW B-200 flew survey over SAC, northernSJV, and SF/Bay area.
6 June 10:35–13:4315:35–18:20
09:26–12:24 – SW Very low AOD and shallow PBL.
8 June 08:55–12:1215:24–18:47
08:54–12:1014:35–17:56
– SW B-200 legs also over Bay area
10 June 15:36–18:31 14:31–17:56 – NW B-200 flew over SAC and also overSierra Nevada mountains for RSPsnow measurements
12 June 08:55–11:5915:24–18:28
09:08–12:4015:05–17:50
– NW B-200 legs also over northern SJV andSF/Bay Area. HSRL observed highaerosol depolarization associated withdust.
14 June 09:56–13:10 10:09–13:4215:18–18:00
– SW Bay Area inflow; B200 flew two flightsand covered regions between SF/Bayarea and SAC. Second B200 flight flewover NOAA P3 track.
15 June 08:56–12:0014:51–18:07
09:09–12:2314:39–18:02
11:52–15:1216:15–19:15
SW B-200 legs over SF/Bay area, SAC,and mountains east of SAC. Inflowfrom SF/Bay area. Highest AOD overSAC.
18 June 15:38–18:48 15:19–18:53 12:36–15:3916:40–20:10
SW Intercomparison between G-1, NOAAWP-3, B-200, and NOAA TO fromFresno to Bakersfield.
19 June 15:28–18:31 09:46–11:5215:32–18:33
- SW B-200 also flew over mountains eastof SAC. HSRL observed elevated dustlayer 5–8 km.
21 June 09:02–12:1115:25–18:44
15:32–18:52 10:05–13:5015:15–18:40
NW NOAA TO coordinated with OMIsatellite∗
22 June – 14:08–16:16 08:20–11:2713:39–17:12
W B-200 and NOAA TO flew coordinatedflight for long range transport.
23 June 09:34–12:5114:24–18:12
09:51–12:0114:52–17:09
14:40–17:55 SW HSRL observed elevated layers andclouds over SAC. NOAA TO coordi-nated with OMI satellite∗
24 June 09:00–12:1614:24–18:12
14:56–17:45 9:42–13:1515:12–18:55
SW Bay Area Inflow; HSRL observed con-siderable midlevel clouds over SAC
26 June – – 15:15–19:03 SW
27 June 10:24–13:47 9:19–12:25 9:37–13:3215:15–19:02
SW Isoprene flux flight to the northeastover the foothills area: B-200 had legover SF/Bay Area. Highest AOD overSAC region.
28 June 09:23–12:3314:20–17:42
10:10–13:2015:56–18:18
10:15–14:06 W MISR Overpass, highest pollution andAOD day of the campaign. LargestAOD over SAC, observed SAC plumein AOD. NOAA TO coordinated withOMI satellite∗
29 June – – 08:00–11:1012:29–16:17
Bakersfield NOx emission inventory,San Francisco, San Joaquin Valley
Total 21 23 17
∗NO2 tropospheric VCD are measured by the OMI instrument onboard the NASA Aura satellite. Global coverage is achieved within one day.
1375
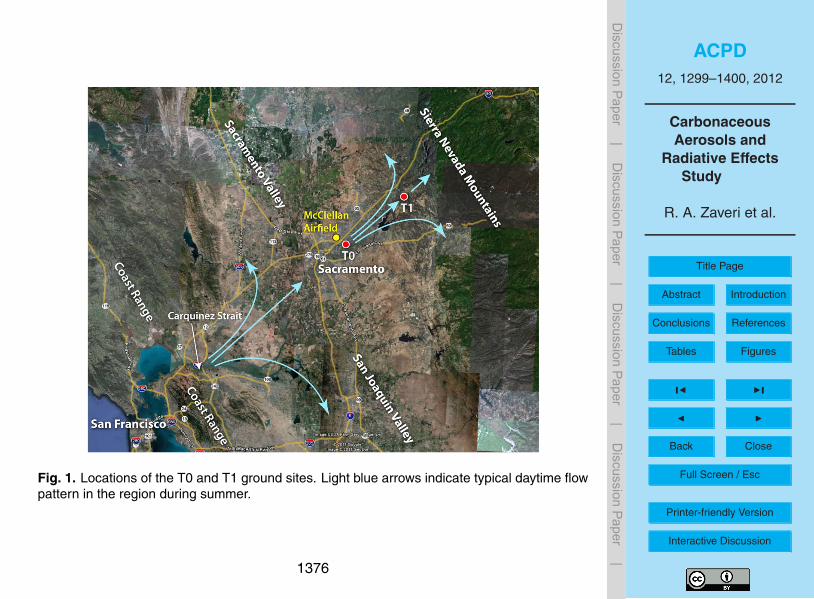
ACPD12, 1299–1400, 2012
CarbonaceousAerosols and
Radiative EffectsStudy
R. A. Zaveri et al.
Title Page
Abstract Introduction
Conclusions References
Tables Figures
J I
J I
Back Close
Full Screen / Esc
Printer-friendly Version
Interactive Discussion
Discussion
Paper
|D
iscussionP
aper|
Discussion
Paper
|D
iscussionP
aper|
Fig. 1. Locations of the T0 and T1 ground sites. Light blue arrows indicate typical daytime flowpattern in the region during summer.
1376

ACPD12, 1299–1400, 2012
CarbonaceousAerosols and
Radiative EffectsStudy
R. A. Zaveri et al.
Title Page
Abstract Introduction
Conclusions References
Tables Figures
J I
J I
Back Close
Full Screen / Esc
Printer-friendly Version
Interactive Discussion
Discussion
Paper
|D
iscussionP
aper|
Discussion
Paper
|D
iscussionP
aper|
Fig. 2. Emission rates in the Central Valley at 11:00 PDT. Left panel: sum of all anthropogenicVOCs. Right panel: biogenic isoprene.
1377

ACPD12, 1299–1400, 2012
CarbonaceousAerosols and
Radiative EffectsStudy
R. A. Zaveri et al.
Title Page
Abstract Introduction
Conclusions References
Tables Figures
J I
J I
Back Close
Full Screen / Esc
Printer-friendly Version
Interactive Discussion
Discussion
Paper
|D
iscussionP
aper|
Discussion
Paper
|D
iscussionP
aper|
Fig. 3. Examples of tracer forecasts, based on CO emitted from Sacramento, shown at16:00 PDT under southwesterly (left panel) and northwesterly wind (right panel) flow condi-tions.
1378

ACPD12, 1299–1400, 2012
CarbonaceousAerosols and
Radiative EffectsStudy
R. A. Zaveri et al.
Title Page
Abstract Introduction
Conclusions References
Tables Figures
J I
J I
Back Close
Full Screen / Esc
Printer-friendly Version
Interactive Discussion
Discussion
Paper
|D
iscussionP
aper|
Discussion
Paper
|D
iscussionP
aper|
Fig. 4. DOE G-1, NASA B-200, and NOAA Twin Otter Flight Tracks during the SW and NW flowperiods.
1379

ACPD12, 1299–1400, 2012
CarbonaceousAerosols and
Radiative EffectsStudy
R. A. Zaveri et al.
Title Page
Abstract Introduction
Conclusions References
Tables Figures
J I
J I
Back Close
Full Screen / Esc
Printer-friendly Version
Interactive Discussion
Discussion
Paper
|D
iscussionP
aper|
Discussion
Paper
|D
iscussionP
aper|
Fig. 5. Time series of standard meteorological variables at the T0 and T1 ground sites. Thegreen-orange bar at the top indicates periods during which the synoptic wind was either south-westerly (SW) or northwesterly (NW). Semi-transparent orange shading for the NW flow periodsis also shown over all the plots.
1380

ACPD12, 1299–1400, 2012
CarbonaceousAerosols and
Radiative EffectsStudy
R. A. Zaveri et al.
Title Page
Abstract Introduction
Conclusions References
Tables Figures
J I
J I
Back Close
Full Screen / Esc
Printer-friendly Version
Interactive Discussion
Discussion
Paper
|D
iscussionP
aper|
Discussion
Paper
|D
iscussionP
aper|
Fig. 6. Comparison of trace gases time series at T0 and T1 ground sites along with observa-tions onboard the G-1 during overpasses at the respective sites. The NOy instrument at theT1 site did not operate until 11 June and the SO2 instrument at the T0 site did not operate on27–28 June.
1381
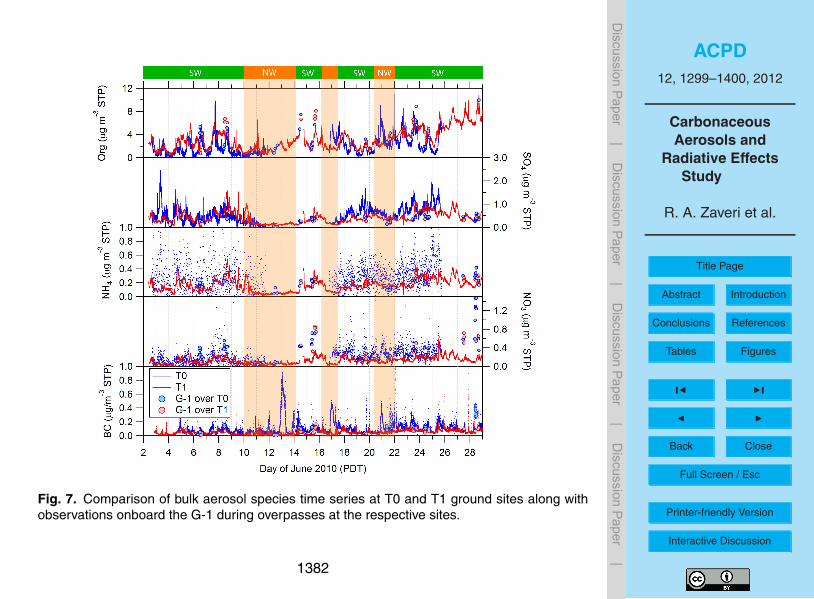
ACPD12, 1299–1400, 2012
CarbonaceousAerosols and
Radiative EffectsStudy
R. A. Zaveri et al.
Title Page
Abstract Introduction
Conclusions References
Tables Figures
J I
J I
Back Close
Full Screen / Esc
Printer-friendly Version
Interactive Discussion
Discussion
Paper
|D
iscussionP
aper|
Discussion
Paper
|D
iscussionP
aper|
Fig. 7. Comparison of bulk aerosol species time series at T0 and T1 ground sites along withobservations onboard the G-1 during overpasses at the respective sites.
1382
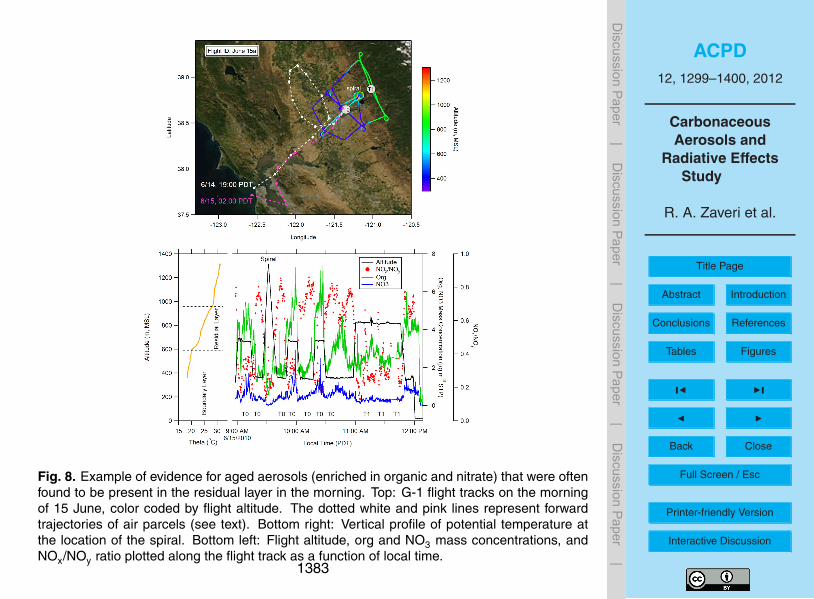
ACPD12, 1299–1400, 2012
CarbonaceousAerosols and
Radiative EffectsStudy
R. A. Zaveri et al.
Title Page
Abstract Introduction
Conclusions References
Tables Figures
J I
J I
Back Close
Full Screen / Esc
Printer-friendly Version
Interactive Discussion
Discussion
Paper
|D
iscussionP
aper|
Discussion
Paper
|D
iscussionP
aper|
Fig. 8. Example of evidence for aged aerosols (enriched in organic and nitrate) that were oftenfound to be present in the residual layer in the morning. Top: G-1 flight tracks on the morningof 15 June, color coded by flight altitude. The dotted white and pink lines represent forwardtrajectories of air parcels (see text). Bottom right: Vertical profile of potential temperature atthe location of the spiral. Bottom left: Flight altitude, org and NO3 mass concentrations, andNOx/NOy ratio plotted along the flight track as a function of local time.
1383

ACPD12, 1299–1400, 2012
CarbonaceousAerosols and
Radiative EffectsStudy
R. A. Zaveri et al.
Title Page
Abstract Introduction
Conclusions References
Tables Figures
J I
J I
Back Close
Full Screen / Esc
Printer-friendly Version
Interactive Discussion
Discussion
Paper
|D
iscussionP
aper|
Discussion
Paper
|D
iscussionP
aper|
Fig. 9. Time series of SO2 mixing ratio at T0 site and comparison of CPC 3010 numberconcentration (N>10) time series at T0 and T1 sites along with observations onboard the G-1during overpasses at the respective sites.
1384

ACPD12, 1299–1400, 2012
CarbonaceousAerosols and
Radiative EffectsStudy
R. A. Zaveri et al.
Title Page
Abstract Introduction
Conclusions References
Tables Figures
J I
J I
Back Close
Full Screen / Esc
Printer-friendly Version
Interactive Discussion
Discussion
Paper
|D
iscussionP
aper|
Discussion
Paper
|D
iscussionP
aper|
Fig. 10. Scatter plots of CPC-3025 vs. CPC-3010 number concentrations observed on the G-1:(a) the points are colored by the corresponding SO2 mixing ratios; (b) the points are coloredby the corresponding isoprene mixing ratios (points with isoprene mixing ratios < 1 ppbv wereremoved from the plot for clarity). Grey lines show slopes of 4:1 and 1:1.
1385

ACPD12, 1299–1400, 2012
CarbonaceousAerosols and
Radiative EffectsStudy
R. A. Zaveri et al.
Title Page
Abstract Introduction
Conclusions References
Tables Figures
J I
J I
Back Close
Full Screen / Esc
Printer-friendly Version
Interactive Discussion
Discussion
Paper
|D
iscussionP
aper|
Discussion
Paper
|D
iscussionP
aper|
Fig. 11. Comparison of aerosol number size distributions at T0 and T1 sites. Note that thecolor scales for APS and SMPS distributions differ by three orders of magnitude.
1386

ACPD12, 1299–1400, 2012
CarbonaceousAerosols and
Radiative EffectsStudy
R. A. Zaveri et al.
Title Page
Abstract Introduction
Conclusions References
Tables Figures
J I
J I
Back Close
Full Screen / Esc
Printer-friendly Version
Interactive Discussion
Discussion
Paper
|D
iscussionP
aper|
Discussion
Paper
|D
iscussionP
aper|
Fig. 12. Variations in fractions of different particles observed by ATOFMS aboard the G-1(upper panel) and by PALMS at the T1 site (lower panel). EC is elemental carbon, BB isbiomass burning particles, V-OC is organic particles containing vanadium, MinMet is mineraldust and metallic particles.
1387

ACPD12, 1299–1400, 2012
CarbonaceousAerosols and
Radiative EffectsStudy
R. A. Zaveri et al.
Title Page
Abstract Introduction
Conclusions References
Tables Figures
J I
J I
Back Close
Full Screen / Esc
Printer-friendly Version
Interactive Discussion
Discussion
Paper
|D
iscussionP
aper|
Discussion
Paper
|D
iscussionP
aper|
Fig. 13. Temporal evolution of particle number concentration (upper panel) and the correspond-ing fraction of particles with different compositions (lover panel) as observed by SPLAT II on 6June at the T0 site. SS is sea salt, BB is biomass burning particles.
1388

ACPD12, 1299–1400, 2012
CarbonaceousAerosols and
Radiative EffectsStudy
R. A. Zaveri et al.
Title Page
Abstract Introduction
Conclusions References
Tables Figures
J I
J I
Back Close
Full Screen / Esc
Printer-friendly Version
Interactive Discussion
Discussion
Paper
|D
iscussionP
aper|
Discussion
Paper
|D
iscussionP
aper|
Fig. 14. Size-dependent particle densities as measured by SPLAT II on 6 June at 10:00 a.m.
1389

ACPD12, 1299–1400, 2012
CarbonaceousAerosols and
Radiative EffectsStudy
R. A. Zaveri et al.
Title Page
Abstract Introduction
Conclusions References
Tables Figures
J I
J I
Back Close
Full Screen / Esc
Printer-friendly Version
Interactive Discussion
Discussion
Paper
|D
iscussionP
aper|
Discussion
Paper
|D
iscussionP
aper|
Fig. 15. The time delay between the observance of the incandescence signal peak relative tothe peak in the scattering signal (incandescence-scattering lagtime, ∆τ) is plotted as a functionof the BC mass equivalent diameter (MED) for the morning and afternoon flights conducted on28 June. Lagtime contours are normalized 1 (red=0.9/blue=0.2). Since the non-refractorycoating must be burned off before the BC core will incandesce, the recorded lagtime can serveas a proxy for coating thickness – the larger the lagtime, the greater the coating thickness. Themorning ensemble lagtimes are dominated by thinly coated soot whereas in the afternoon anincrease in the fraction of thickly coated larger diameter BC core is observed.
1390

ACPD12, 1299–1400, 2012
CarbonaceousAerosols and
Radiative EffectsStudy
R. A. Zaveri et al.
Title Page
Abstract Introduction
Conclusions References
Tables Figures
J I
J I
Back Close
Full Screen / Esc
Printer-friendly Version
Interactive Discussion
Discussion
Paper
|D
iscussionP
aper|
Discussion
Paper
|D
iscussionP
aper|
Fig. 16. FE-SEM images of aerosol particles collected at the T0 site: (a) a low magnificationimage showing (i) dust particle, (ii) spherical particle, (iii) fractal-like particles, (iv) irregularly-shaped particle; (b) fractal-like particle with open structure, (i) soot without evident coating, (ii)soot with relatively thick coating, ELP – evaporated liquid particle; (c) compacted BC particleinternally mixed; (d) particle with BC inclusion. The dark dots are the pores in the filter.
1391

ACPD12, 1299–1400, 2012
CarbonaceousAerosols and
Radiative EffectsStudy
R. A. Zaveri et al.
Title Page
Abstract Introduction
Conclusions References
Tables Figures
J I
J I
Back Close
Full Screen / Esc
Printer-friendly Version
Interactive Discussion
Discussion
Paper
|D
iscussionP
aper|
Discussion
Paper
|D
iscussionP
aper|
Fig. 17. SEM (left panel) and STXM (right panel) images showing internal heterogeneity ofparticles collected in CARES study. STXM maps derived by singular value decompositiondepict organic dominant phase (green), inorganic dominant phase (blue) and elemental carbon(red). Images are not from the same sample region.
1392

ACPD12, 1299–1400, 2012
CarbonaceousAerosols and
Radiative EffectsStudy
R. A. Zaveri et al.
Title Page
Abstract Introduction
Conclusions References
Tables Figures
J I
J I
Back Close
Full Screen / Esc
Printer-friendly Version
Interactive Discussion
Discussion
Paper
|D
iscussionP
aper|
Discussion
Paper
|D
iscussionP
aper|
Fig. 18. Comparison of scattering coefficient measured by nephelometer at the T0 and T1 sitesand onboard the G-1 during overpasses at the respective sites.
1393

ACPD12, 1299–1400, 2012
CarbonaceousAerosols and
Radiative EffectsStudy
R. A. Zaveri et al.
Title Page
Abstract Introduction
Conclusions References
Tables Figures
J I
J I
Back Close
Full Screen / Esc
Printer-friendly Version
Interactive Discussion
Discussion
Paper
|D
iscussionP
aper|
Discussion
Paper
|D
iscussionP
aper|
Fig. 19. Comparison of absorption coefficient measured at λ= 532 nm by PSAP and photoa-coustic instruments at the T0 and T1 sites and by PSAP (λ= 522 nm) aboard the G-1 duringoverpasses at the respective sites.
1394

ACPD12, 1299–1400, 2012
CarbonaceousAerosols and
Radiative EffectsStudy
R. A. Zaveri et al.
Title Page
Abstract Introduction
Conclusions References
Tables Figures
J I
J I
Back Close
Full Screen / Esc
Printer-friendly Version
Interactive Discussion
Discussion
Paper
|D
iscussionP
aper|
Discussion
Paper
|D
iscussionP
aper|
Fig. 20. Comparison of aerosol optical depth derived from MFRSR observations at T0 and T1sites.
1395

ACPD12, 1299–1400, 2012
CarbonaceousAerosols and
Radiative EffectsStudy
R. A. Zaveri et al.
Title Page
Abstract Introduction
Conclusions References
Tables Figures
J I
J I
Back Close
Full Screen / Esc
Printer-friendly Version
Interactive Discussion
Discussion
Paper
|D
iscussionP
aper|
Discussion
Paper
|D
iscussionP
aper|
Fig. 21. Daily average volume size distributions derived from MFRSR observations at T0 andT1 ground sites.
1396

ACPD12, 1299–1400, 2012
CarbonaceousAerosols and
Radiative EffectsStudy
R. A. Zaveri et al.
Title Page
Abstract Introduction
Conclusions References
Tables Figures
J I
J I
Back Close
Full Screen / Esc
Printer-friendly Version
Interactive Discussion
Discussion
Paper
|D
iscussionP
aper|
Discussion
Paper
|D
iscussionP
aper|
Fig. 22. (a) Aerosol backscatter (532 nm), (b) aerosol depolarization (532 nm), (c) ratio ofaerosol depolarization (532/1064 nm), (d) backscatter wavelength dependence ((1064/532 nm)measured by the airborne HSRL between 17:45–18:12 UT on 19 June. This portion of theB200 flight covered about 160 km between the Sacramento area (left) and the mountains eastof Sacramento (right). The dark area in the bottom part of the images represents the groundsurface. (e) aerosol type inferred from the HSRL measurements of aerosol intensive parame-ters. (f) AOD apportioned to aerosol type.
1397

ACPD12, 1299–1400, 2012
CarbonaceousAerosols and
Radiative EffectsStudy
R. A. Zaveri et al.
Title Page
Abstract Introduction
Conclusions References
Tables Figures
J I
J I
Back Close
Full Screen / Esc
Printer-friendly Version
Interactive Discussion
Discussion
Paper
|D
iscussionP
aper|
Discussion
Paper
|D
iscussionP
aper|
Fig. 23. Semi-Lagrangian G-1 flight tracks on the afternoon of 28 June, with the points colorcoded by: (a) CO, (b) sum of isoprene, methyl vinyl ketone (MVK), and methacrolein (MACR),(c) organic aerosol mass concentration, (d) BC mass concentration, (e) Nephelometer scatter-ing coefficient at λ=550 nm, and (f) PSAP absorption coefficient at λ=523 nm.
1398

ACPD12, 1299–1400, 2012
CarbonaceousAerosols and
Radiative EffectsStudy
R. A. Zaveri et al.
Title Page
Abstract Introduction
Conclusions References
Tables Figures
J I
J I
Back Close
Full Screen / Esc
Printer-friendly Version
Interactive Discussion
Discussion
Paper
|D
iscussionP
aper|
Discussion
Paper
|D
iscussionP
aper|
Fig. 24. (a) Aerosol extinction (532 nm) profiles derived from airborne HSRL measurementsacquired over the Sacramento region between 15:56 PDT and 17:28 PDT on 28 June. Profilesbetween the surface and 3 km altitude are shown. (b) AOD derived from the HSRL measure-ments along this same flight track. In both panels the locations of the T0 and T1 ground sitesare indicated by red crosses.
1399

ACPD12, 1299–1400, 2012
CarbonaceousAerosols and
Radiative EffectsStudy
R. A. Zaveri et al.
Title Page
Abstract Introduction
Conclusions References
Tables Figures
J I
J I
Back Close
Full Screen / Esc
Printer-friendly Version
Interactive Discussion
Discussion
Paper
|D
iscussionP
aper|
Discussion
Paper
|D
iscussionP
aper|
Fig. 25. (a) Ozone mixing ratio profiles measured with the TOPAZ lidar and (b) NO2 verticalcolumn densities measured with the CU AMAX DOAS system over the Sacramento area on28 June. Data are from two flight segments from 11:28–12:03 and 13:04–13:52 PDT. Theozone profiles extend from near the ground to 1500 m MSL. The colored line above the ozone“curtain” plot represents the ozone in situ measurements at flight level (approx. 2100 m MSL).The locations of the T0 and T1 ground sites are indicated by yellow pushpin markers.
1400