Radiative decay properties of charmonia in nonrelativistic QCD

Chapter 13Impact of Dust Radiative Forcing upon Climate
Ron L. Miller, Peter Knippertz, Carlos Pérez García-Pando,Jan P. Perlwitz, and Ina Tegen
Abstract Dust aerosols perturb the atmospheric radiative flux at both solar andthermal wavelengths, altering the energy and water cycles. The climate adjustsby redistributing energy and moisture, so that local temperature perturbations,for example, depend upon the forcing over the entire extent of the perturbedcirculation. Within regions frequently mixed by deep convection, including thedeep tropics, dust particles perturb the surface air temperature primarily throughradiative forcing at the top of the atmosphere (TOA). Many models predict that dustreduces global precipitation. This reduction is typically attributed to the decreaseof surface evaporation in response to dimming of the surface. A counterexampleis presented, where greater shortwave absorption by dust increases evaporationand precipitation despite greater dimming of the surface. This is attributed to thedependence of surface evaporation upon TOA forcing through its influence uponsurface temperature and humidity. Perturbations by dust to the surface wind speedand vegetation (through precipitation anomalies) feed back upon the dust aerosolconcentration. The current uncertainty of radiative forcing attributed to dust and the
R.L. Miller (�) • C. Pérez García-Pando • J.P. PerlwitzNASA Goddard Institute for Space Studies, 2880 Broadway, New York, NY 10025, USA
Department of Applied Physics and Applied Mathematics, Columbia University,New York, NY, USAe-mail: [email protected]; [email protected]; [email protected]
P. KnippertzSchool of Earth and Environment, University of Leeds, Leeds, UK
Institute for Meteorology and Climate Research, Karlsruhe Institute of Technology,Karlsruhe, Germanye-mail: [email protected]
I. TegenLeibniz Institute for Tropospheric Research, Permoserstr. 15, 04318 Leipzig, Germanye-mail: [email protected]
P. Knippertz and J.-B.W. Stuut (eds.), Mineral Dust: A Key Playerin the Earth System, DOI 10.1007/978-94-017-8978-3__13,© Springer ScienceCBusiness Media Dordrecht (outside the USA) 2014
327

328 R.L. Miller et al.
resulting range of climate perturbations calculated by models remain a useful test ofour understanding of the mechanisms relating dust radiative forcing to the climateresponse.
Keywords Aerosol radiative forcing • Climate response • Precipitation response •Feedback upon dust mobilization
13.1 Introduction
Mineral dust from the Chinese deserts routinely shrouds western North America(Kavouras et al. 2009), extending as far downwind as the French Alps (Groussetet al. 2003), while African dust replenishes mineral nutrients within the Amazon(Swap et al. 1992). Dust perturbs the radiative flux within the atmosphere, changingtransports of energy and moisture to alter temperature and precipitation thousandsof kilometers beyond the dust layer (Miller and Tegen 1998). Deposition measure-ments suggest that the global mass of dust aerosols doubled during the twentiethcentury (Mahowald et al. 2010). This demonstrates the potential importance of dustradiative forcing to climate trends observed during the Anthropocene and the needto anticipate future changes in the dust load.
Mineral dust (also referred to as “soil” dust due to its origin through winderosion of the land surface) alters climate through a number of mechanisms that aredescribed in this volume. However, robust inferences of the effect of dust remainelusive, even in recent decades when the aerosol distribution is better observed dueto multiple satellite retrievals and an expanding network of surface measurements.Scientists study dust aerosols because of their potential importance for climate, butmuch of the activity within this large interdisciplinary community is directed towardsimply deriving more precise constraints upon the dust burden and its regionaldistribution, along with the particle radiative properties needed to compute theforcing. This remains a key unsolved problem as noted throughout this volume(e.g., Chaps. 7, 9, and 11).
During recent decades, large teams of scientists have built comprehensiveEarth system models (ESMs) that have been tested against a widening range ofobservations (e.g., Randall et al. 2007). These models explicitly calculate the dustcycle and the mechanisms by which it perturbs climate. However, the climateresponse to direct radiative forcing by dust remains uncertain for several reasons.First, the ESMs show varying sensitivity to radiative forcing as a result of theirdifferent treatments of clouds, for example. Global average projections of thetwenty-first century warming in response to rising concentrations of greenhousegases vary by a factor of 2, and discrepancies among projections of regional climateare even larger (e.g., Meehl et al. 2007). This is especially relevant for dust whereprolific sources are highly localized so that the aerosol concentration and forcingshow strong regional contrasts. In practice, models calculate a variety of temperatureand precipitation anomalies in response to dust radiative forcing. It is difficult toknow what behavior exhibited by the models is robust and likely to be corroborated

13 Impact of Dust Radiative Forcing upon Climate 329
by future studies. Here, mechanistic arguments relating the forcing to the responsemay provide guidance, although these arguments are typically based upon simplemodels lacking the complexity that may be necessary to simulate the regionalclimate anomalies resulting from dust.
In this chapter, we discuss the influence of dust radiative forcing upon climate.Our discussion of the climate response emphasizes variables like surface airtemperature and precipitation that directly impact our society. The climate effectof dust through its influence upon clouds and the carbon cycle is discussedelsewhere in this volume (Chaps. 12 and 14, respectively). Our method is tosummarize calculations by ESMs, attempting to identify robust behavior and turningto mechanistic arguments when available. In Sect. 13.2, we summarize the physicaland environmental factors contributing to varying estimates of the forcing amongmodels. We discuss the climate response to this forcing in Sect. 13.3. In Sect. 13.4,we consider the feedback of the climate perturbation upon the process by whichdust enters the atmosphere. In particular, we discuss the relation of dust radiativeforcing to surface wind speed and vegetation. Our concluding remarks are presentedin Sect. 13.5, where we emphasize outstanding questions.
13.2 Radiative Forcing by Dust Aerosols
Direct radiative forcing is defined as the change in the radiative flux by dust particlesprior to any response by the climate (e.g., Hansen et al. 2005). Forcing is typicallycalculated at the top of the atmosphere (TOA), but because the aerosol perturbationto the flux at the surface can be markedly different and modify the hydrologiccycle, the forcing is characterized at this level as well. Within a few months ofthe forcing onset, the stratosphere returns to approximate radiative equilibrium,and the radiative flux at TOA approaches the value at the tropopause. The initialtropopause forcing is often a better indicator of the radiative perturbation at TOAfollowing stratospheric adjustment (Hansen et al. 1997). It is this adjusted fluxat TOA that perturbs the climate within the troposphere, but here we neglect thedistinction between the initial forcing at TOA and the tropopause that is smallfor dust (Miller et al. 2004b). Direct radiative forcing by dust is described morefully in Chap. 11. Here, we summarize the physical properties that contribute todifferences in the forcing among the models because these differences ultimatelyresult in uncertainties in the effect of dust radiative forcing upon climate.
Dust particles scatter and absorb both solar and thermal (or “longwave”)radiation (Tegen and Lacis 1996). At TOA, net insolation is reduced by scatteringbut increased by absorption of sunlight that otherwise would be reflected back tospace. The dust layer also acts like a greenhouse gas, reducing outgoing longwaveradiation (OLR) at TOA, while increasing thermal emission toward the surface.
One model calculation of dust radiative forcing for boreal summer is shownin Fig. 13.1. The dust distribution is prescribed from Miller et al. (2006), whilethe forcing is calculated using a development version of the NASA GoddardInstitute for Space Studies (GISS) ModelE: an ESM that is intermediary between the

330 R.L. Miller et al.
TOA Forcing (JJAS): Sinyuka
b
c
d
e
f
Glb. Avg. = -0.39 Wm-2
Min = -25 ( 51.2E,27N) Max = 7 ( 3.8W,19N)-27
-21
-15
-9
-3
3
9
15
21
27
TOA Forcing (JJAS): PattersonGlb. Avg. = 0.39 Wm-2
Min = -17 ( 51.2E,27N) Max = 26 ( 3.8W,19N)-27
-21
-15
-9
-3
3
9
15
21
27
TOA Forcing (JJAS): 0.9xϖ0(Pat)Glb. Avg. = 1.35 Wm-2
Min = -9 ( 51.2E,27N) Max = 46 ( 3.8W,19N)-27
-21
-15
-9
-3
3
9
15
21
46
Surface Forcing (JJAS): SinyukGlb. Avg. = -1.13 Wm-2
Min = -35 ( 53.8E,25N) Max = 0 ( 41.2W,79N)-55
-45
-35
-25
-15
-5
5
Surface Forcing (JJAS): PattersonGlb. Avg. = -1.81 Wm-2
Min = -49 ( 53.8E,25N) Max = 0 ( 41.2W,79N)-55
-45
-35
-25
-15
-5
5
Surface Forcing (JJAS): 0.9xϖ0(Pat)Glb. Avg. = -2.68 Wm-2
Min = -68 ( 53.8E,25N) Max = 0 ( 13.8W,75S)-68
-45
-35
-25
-15
-5
5
Fig. 13.1 Forcing calculated at TOA and the surface during Northern Hemisphere (NH) summerwith the dust distribution prescribed from Miller et al. (2006). Shortwave absorption is prescribedusing (a, d) the compilation of Sinyuk et al. (2003), (b, e) Patterson et al. (1977), and (c, f)Patterson et al. (1977) but with the particle single scattering albedo reduced by 10 %. The forcingis calculated using the “double-call” method, and represents an average during the initial 5 years ofa simulation whose climate is perturbed by dust. Ocean temperature evolves according to a mixed-layer model (Miller et al. 1983). The forcing equals the contrast between radiative fluxes calculatedwith and without dust. Note that extreme values of the color scale may vary among panels
versions documented by Schmidt et al. (2006, 2014). Three different versions of theforcing are calculated using distinct prescriptions of the particle optical properties.The first prescription is taken from the compilation of shortwave absorption as afunction of wavelength by Sinyuk et al. (2003) that includes values retrieved byDubovik et al. (2002) and Colarco et al. (2002). The second is based uponmeasurements of far-travelled Saharan dust (Patterson et al. 1977). These two casesprobably bracket the global solar absorption. For the third case, we arbitrarily reducethe single scattering albedo calculated from Patterson et al. (1977) by 10 %, whichroughly doubles the solar absorption. This third case is intended to emphasize the

13 Impact of Dust Radiative Forcing upon Climate 331
-20 -10 0 10 20Yos
hiok
a 20
07
-4.73Net
3.35LW
-8.08SW
TOA
a
-20 -10 0 10 20
-4.00Net
-11.39LW
7.38SW
Atm
b
-20 -10 0 10 20
-0.73Net
14.74LW
-15.47SW
Srf
c
-20 -10 0 10 20
Mill
er 2
006
-1.76Net
1.63LW
-3.39SW
TOA
d
-20 -10 0 10 20
3.39Net
-3.60LW
6.99SW
Atm
e
-20 -10 0 10 20
-5.14Net
5.23LW
-10.38SW
Srf
f
Forcing: North Africa (5°-35°N, 18°W-40°E)
Fig. 13.2 Annual dust radiative forcing (Wm�2) over North Africa at the (left) top of atmosphere(TOA) and (right) surface (Srf ), with the atmospheric flux divergence (Atm) calculated as theirdifference (center). Forcing is calculated by Yoshioka et al. (2007) and using the dust concentrationof Miller et al. (2006) with optical properties compiled by Sinyuk et al. (2003)
sensitivity of both the forcing and response to the particle optical properties, butmay also be realistic in some regions due to the mineral composition of the dustsource. Longwave absorption for all three cases is based upon measurements byVolz (1973).
Figure 13.1 illustrates the dependence of TOA forcing upon the surfacealbedo. Forcing is positive over the Sahara desert, where the bright surfacereflects sunlight back into the dust plume, resulting in additional absorption(Liao and Seinfeld 1998). The region of positive forcing extends across the Sahelto the Guinea coast for the cases with greater solar absorption (Fig. 13.1b, c),presumably due to the presence of dust among the bright clouds that accompanythe monsoon precipitation during this season. TOA forcing is negative where thedust plume extends downwind over the subtropical Atlantic Ocean and ArabianSea, where the reflectivity of the aerosol particles is in contrast to the low albedoof the ocean surface, especially for the case of small solar absorption (Fig. 13.1a).At the surface, the forcing is negative and generally marks the region of high dustconcentration (Fig. 13.1d–f). Both local and global dimming increase by roughly afactor of 2 for the range of shortwave absorption considered in the figure.
Figure 13.2 compares two calculations of annual forcing over North Africa,based upon either Yoshioka et al. (2007) or the Sinyuk et al. (2003) compila-tion illustrated in Fig. 13.1. The prescribed particle index of refraction is nearlyidentical in both calculations, so that forcing differences indicate the influence ofcontrasting particle size distributions and environmental factors including surfacealbedo, temperature, and humidity. In both cases, dust aerosols reduce the energycaptured at TOA, resulting in net forcing that is negative but of different magnitude(Fig. 13.2a, d). The compensation between scattering of insolation on the one handand solar absorption and reduced OLR on the other results in net TOA forcing thatis the small residual of opposing effects, magnifying the contrast in net forcingbetween the two calculations that results from differences between the separateshortwave and longwave fluxes. The largest difference between the models occurs in

332 R.L. Miller et al.
the surface longwave forcing (Fig. 13.2c, f). Yoshioka et al. (2007) calculate such alarge longwave value that the net surface forcing is small and even positive when theregional average is restricted to the Sahara (not shown). In this region, dust increasesthe net radiative flux incident upon the ground (Figures 2b and c of Yoshioka et al.2007). As a consequence of the longwave forcing, the atmospheric forcing (equal tothe difference in forcing between TOA and the surface) has contrasting signs in thetwo models (Fig. 13.2b, e). The dust layer is heated according to Miller et al. (2006),while this layer is cooled in Yoshioka et al. (2007). The contrasting estimates of thesign of atmospheric forcing by dust have implications for the dynamical response,as described in the following sections.
Shortwave forcing at the surface is smaller in the GISS ESM (Fig. 13.2c, f), partlyas a result of its brighter desert surface (Yoshioka et al. 2007). The net solar fluxat this level is small due to reflection, so that any perturbation by aerosols is alsosmall (Liao and Seinfeld 1998). The warm, dry climate of the Sahara exaggeratesdifferences in surface longwave forcing between the models. The low humidityallows dust particles to absorb longwave radiation with reduced competition fromwater vapor, while high temperatures within the boundary layer increase downwardlongwave emission by dust (Liao and Seinfeld 1998).
Near dust sources, aerosol radiative forcing is intermittently much larger than theannual averages illustrated by Fig. 13.2. Dust was mobilized along a cold front overNorth Africa on March 8, 2006. Surface radiometers at Niamey, Niger, measureda dimming of 250 W m�2, compared to an unperturbed value near 1;000 W m�2
(Slingo et al. 2006). The sun was almost completely obscured, but the surfaceremained illuminated by diffuse radiation scattered within the dust layer. Such largeepisodic forcing results in an initial temperature response that is large compared tothe seasonal average, as described in the next section.
13.3 Dust Radiative Impacts upon Climate
13.3.1 Temperature
A dust outbreak interrupts the daily cycle of solar heating by dimming the surface.Over land, the ground cools with the passage of the dust layer overhead, reducingthe upward transfer of heat by the longwave and sensible fluxes, as documentedby measurements in the Sahel (Miller et al. 2009). Measured temperature anomaliescan be attributed to dust using models. Within the Bodélé Depression, a prolific dustsource at the southern margin of the Sahara, midday temperature is reduced by a fewdegrees K during dust outbreaks, while warmer nights result from the inhibition oflongwave cooling by the surface (Tegen et al. 2006).
Pérez et al. (2006) simulated the regional cooling accompanying a dust outbreakthat extended across North Africa during April 2002. Figure 13.3a shows middaydimming of the surface as large as 700 W m�2 beneath the dust plume. Dust reduces

13 Impact of Dust Radiative Forcing upon Climate 333
Fig. 13.3 Midday (a) forcing at the surface by a dust outbreak on April 12, 2002 (W m�2), and (b)contemporaneous change in surface air temperature attributed to dust by contrasting experimentswith radiatively active dust and no dust (Reproduced from Pérez et al. (2006). Copyright (2006)with permission from the American Geophysical Union)
surface air temperature by up to 6 K coincident with the surface forcing, comparedto an experiment without dust radiative forcing (Fig. 13.3b). Behind the dust plume,the surface air temperature is quickly restored to its unperturbed value following thepassage of the dust layer.
Temperature Adjustment in Convectively Mixed Regions
On time scales longer than a few days, the atmospheric temperature adjusts to theaerosol forcing at TOA and the perturbed energy exchange at the lateral margins ofthe dust layer. In regions of frequent vertical mixing, forcing at TOA is an especiallystrong constraint upon temperature at the surface.
Figure 13.4 shows the adjustment to a succession of weekly dust outbreaks ina simple single-column model of a coupled atmosphere and ocean (Miller 2012).During each outbreak, the prescribed radiative forcing peaks within a day, withgradual decay during the subsequent week. The atmospheric temperature anomalyis assumed to be identical at all levels as a result of vigorous vertical mixingby convection. Figure 13.4a shows that the atmosphere initially warms after eachoutbreak, while cooling of the ocean is smaller in magnitude due to its greaterheat capacity. (Warming of the surface air in the simple model is in contrast tothe continental cooling beneath the dust plume in Fig. 13.3b and is an artifact ofthe instantaneous coupling between the dust layer and surface that is assumed bythe simple model.) In response to each dust outbreak, temperature anomalies inboth the ocean and atmosphere diminish within a few days (Fig. 13.4a), but totalrestoration of the unperturbed state occurs over a time scale of several months,representing the time required for the ocean temperature to return to its originalvalue through reduced longwave radiation to space from the upper troposphere(cf. Schopf 1983). Because the dust outbreaks are frequent compared to thisslow restoration, the residual cooling accumulates with each additional outbreak,

334 R.L. Miller et al.
a
b
Fig. 13.4 Anomalous atmospheric (red) and ocean (blue) temperature during the first (a) 20 daysand (b) 2 years after the onset of forcing in a simple single-column model. The forcing consists ofa succession of weekly dust outbreaks where the magnitude of aerosol radiative forcing increasesrapidly for a day before diminishing more gradually with a 1 day e-folding time. The time averagedforcing equals �5 W m�2 at TOA and �10 W m�2 at the surface. The dotted line shows the oceantemperature response in the absence of coupling by the surface turbulent and radiative fluxes, sothat the ocean temperature responds only to the surface forcing (Reproduced from Miller (2012).Copyright (2012) with permission from the American Meteorological Society)
reaching equilibrium when the temperature increment due to a new outbreak isbalanced by the recovery following an earlier outbreak (Fig. 13.4b). Although theatmosphere warms temporarily after each outbreak, it cools on a longer time scaledue to the diminished heat import from the cooling ocean. The dotted line inFig. 13.4b represents the ocean temperature change that would result solely fromthe surface forcing. Its divergence from the full response indicates the importanceof coupling between the atmosphere and ocean. At equilibrium, the temperatureperturbation is linearly proportional to the forcing at TOA, but is only weaklydependent upon the surface forcing, in contrast to the immediate continentalresponse in Fig. 13.3b.

13 Impact of Dust Radiative Forcing upon Climate 335
The surface forcing has limited influence upon the equilibrium air temperaturebecause this forcing is balanced by surface radiative and turbulent fluxes that dependupon the contrast in temperature and moisture between the lower boundary andthe air just above. Consequently, the surface forcing by itself is not sufficientto simultaneously constrain the temperature of both the lower boundary and theoverlying air. An additional constraint is needed, relating the climate perturbationto any energy imbalance at TOA or the lateral boundary of the dust layer. Thismakes the climate perturbation by aerosols after the return to equilibrium moredifficult to anticipate than the initial response because the final perturbation is notdetermined solely by the local forcing, but by a convolution of the forcing overthe entire extent of the perturbed circulation. Regional adjustment occurs over theRossby radius of deformation, which is inversely related to the Coriolis parameter.This distance of adjustment is especially large in the Tropics, as demonstrated by theobserved tropic-wide response to warming of the eastern equatorial Pacific Oceanduring El Niño events (Yulaeva and Wallace 1994). This suggests by analogy that theentire Tropics adjust in concert to dust radiative forcing, even if the largest aerosolconcentration is restricted to the vicinity of the arid source regions. Temperatureadjustment far beyond the regional extent of aerosol forcing has been demonstratedin a number of models (Shindell et al. 2010).
The equilibrium surface temperature is controlled primarily by the TOA forcingif two conditions are satisfied. First, the lower troposphere must be sufficientlyhumid and opaque to thermal wavelengths that most OLR originates in the uppertroposphere. Then, the TOA forcing FT is compensated by an OLR anomaly ıOLR
that is related to an anomaly of the upper tropospheric emitting temperature ıTE
according to
aF FT D aR ıOLR D aR4�T 3E ıTE; (13.1)
where � is the Stefan-Boltzmann constant and TE is the unperturbed emittingtemperature. Here, aF and aR refer to the areal extent of the forcing and response,respectively. As noted above, aerosol forcing is usually restricted to an areadownwind of its source that is small compared to the extent of the response.
The second condition is that the column must be efficiently mixed by deepconvection so that the temperatures of the upper troposphere and surface are coupledby a moist adiabat. Then
ıhS D ıh�E; (13.2)
where h D CP T C gz C Lq is the moist static energy that is constant along amoist adiabat; ıhS and ıh�
E are the anomalous moist static energy at the surfaceand saturated value at the emitting level, respectively. (Cp is the specific heat of air,g is gravity, z is height, L is the latent heat of vaporization, and q is the specifichumidity.) If the height of the emitting level is unperturbed by dust, then ıh�
E DCP ıTE , neglecting changes in upper tropospheric moisture. In addition, ıhS DCP ıTS CL ıqS , where ıTS and ıqS are the anomalous surface air temperature and

336 R.L. Miller et al.
Table 13.1 Forcing and response of surface air temperature TS , precipitation P , and evaporationE (global and JJAS average) as a function of the shortwave absorptivity of the dust particles.The forcing is calculated using the dust distribution calculated by Miller et al. (2006). Particleoptical properties are taken either from the compilation of Sinyuk et al. (2003) or Patterson et al.(1977), where the latter assumes greater shortwave absorption. As a third sensitivity experiment,even greater absorption is prescribed by reducing the single scatter albedo $0 by a factor of 0.9compared to the case derived from Patterson et al. (1977)
Patterson et al. (1977)Sinyuk et al. (2003) Patterson et al. (1977) 0:9 � $0
Forcing (W m�2)FT (TOA) �0:39 0:39 1:35
FS (Surface) �1:13 �1:81 �2:68
Surface temperature response (K)ıTS �0:28 �0:07 0:30
Precipitation (and evaporation) response (mm day�1)ıP .D ıE/ �0:033 �0:026 �0:014
humidity, respectively. Thus, if relative humidity is constant (so that CP ıTS CLıqS
can be written as ˛CP ıTS ), then (13.2) implies
˛ıTS D ıTE: (13.3)
The parameter ˛ is related to the surface relative humidity, and can be generalizedto include the effects of feedbacks by upper tropospheric water vapor and the lapserate, for example. Both of the conditions leading to (13.1) and (13.2) are generallysatisfied within regions of tropical convection or the mid-latitude storm tracks,so that adjustment of the surface air temperature and humidity are related to thetemperature anomaly at the emitting level, where anomalous OLR compensates theTOA forcing.
Table 13.1 shows that on a global scale, the anomalous surface air temperaturecalculated by an ESM increases with TOA forcing, even though forcing at thesurface decreases. This is consistent with (13.1) and (13.2). As the prescribed par-ticle absorption of solar radiation increases, the TOA forcing increases. OLR mustincrease in compensation, raising the emitting temperature and the surface valuedespite increased dimming of the surface. Similar behavior has been demonstratedin a single-column model (Cess et al. 1985).
Figure 13.5 shows the regional response of surface air temperature and moiststatic energy to the forcing shown in Fig. 13.1. (This particular model has a relativelylarge climate sensitivity of 4.2 K for a doubling of CO2 that magnifies the climateresponse by about 50 % compared to the current CMIP5 model version: Schmidtet al. 2014.) An increase in TOA forcing is associated with a larger value ofmoist static energy at the surface, as expected from the combination of (13.1) and(13.2). (hS is divided by Cp in Fig. 13.5 to have units of temperature.) Despitethe increase of the global average surface air temperature with TOA forcing asshortwave absorption by the dust particles increases, the surface air cools in some

13 Impact of Dust Radiative Forcing upon Climate 337
Fig. 13.5 (Left) Anomalous surface air temperature ıTS and (right) moist static energy ıhS
(divided by Cp) in response to the forcing in Fig. 13.1. Extreme values of the color scale mayvary among panels
regions of large aerosol forcing, including the Sahel (Fig. 13.5b, c). This cooling isattributed to the increase of Sahel precipitation with particle absorption (Fig. 13.7)and not the increasing magnitude of the surface forcing and dimming of the surface.As precipitation increases, the surface becomes more humid. The contribution ofincreasing humidity to ıhS (not shown) exceeds the increase of ıhS required byFT , so that the near-surface air must cool (Fig. 13.5b, c). Similar compensation ofsurface temperature and humidity where dust increases precipitation is seen in theexperiments of Miller et al. (2004b), as well as the simple model of Miller and Tegen(1999).
Coupling of surface air temperature to the TOA forcing is seen in the ESMexperiments of Miller and Tegen (1998). In this model, the dust concentration islargest over the Arabian Sea during NH summer, due to the confluence of plumes

338 R.L. Miller et al.
a Mean
M
Import M(hS,c-hS,d )= Rd(zT) + Fm,h
Rd(zT)
Fm,h
hS,c
hS,d
b Perturbation
M<0
Change in ImportM(hS,c-hS,d) + M (hS,c-hS,d)>0
M<0 (hS,c-hS,d)>0;(TS,c-TS,d)>0 TS,d<0
Rd(zT)<0
hS,c
d
ddd
d
dd
d
hS,dhS,c hS,cd
d
d
Fig. 13.6 Schematic showing how negative radiative forcing by dust within the descending branchof a direct circulation can cause cooling beneath the dust layer if aerosol forcing slows the rate ofsubsidence and mass exchange M with the convecting region. The moist static energy contrastbetween the convecting and descending regions, hS;c � hS;d , is approximately proportional to thesurface temperature contrast TS;c � TS;d . Rd .zT / is the net downward radiation at the tropopauseand Fm;h is the dynamical export of moist static energy to mid-latitudes by extratropical eddies(For simplicity, Fm;h is assumed to be unperturbed by dust) (a) Mean. (b) Perturbation
from Africa and the Arabian Peninsula. Seasonally averaged dimming of the surfacebeneath the dust layer is as large as 55 W m�2, but the surface air temperature isnearly unchanged, consistent with the relatively small TOA forcing and frequentdeep convection calculated by the ESM.
Temperature Adjustment in Subsiding Regions
In regions of subsidence, mixing between the surface and emitting level is relativelyweak, and radiative forcing at TOA is a weaker influence upon the surfacetemperature. While temperature is relatively unchanged beneath the dust layer inthe ESM experiments of Miller and Tegen (1998), temperature is reduced at themargins of the layer, even though the forcing is smaller. In these marginal regions,deep convection is infrequent, and surface temperature is not directly coupled tothe emitting value higher in the column. Instead, this cooling is attributed to theweakening of the tropical overturning circulation by dust (Miller and Tegen 1999),illustrated schematically in Fig. 13.6 where the change in overturning strength isrepresented by ıM . The overturning slows so that reduced adiabatic warmingassociated with descent compensates the increased radiative heating within the dustlayer. (This compensation between the overturning strength and the atmosphericforcing assumes that changes to the stratification by dust are of secondary impor-tance to the anomalous adiabatic heating.) Because the TOA forcing is near zero,the export of energy from the precipitating region is unperturbed. This export isroughly proportional to the product of the overturning strength and the surfacetemperature contrast between the precipitating and subsiding regions (Miller andTegen 1999). To compensate the reduction of the subsidence rate (ıM < 0),the surface of the subsiding region must cool compared to the convecting region,

13 Impact of Dust Radiative Forcing upon Climate 339
as illustrated by Fig. 13.6. This mechanism accounts not only for the cooling onthe margins of the precipitating region but also the cooling over the Arabian Seaduring NH winter. During this season, dust concentrations are lower, but subsidenceoccurs following the migration of precipitation across the equator into the SouthernHemisphere (Miller and Tegen 1998): cooling results as a consequence of thereduced overturning in response to dust atmospheric forcing. This mechanismis also consistent with cooling over the subtropical Atlantic, where the dustplume extends downwind from North Africa (Fig. 13.5a–c). The dependence of thesurface temperature response upon the anomalous tropical overturning shows theimportance of the atmospheric forcing by dust, the sign of which varies amongcurrent models according to Fig. 13.2b, e.
Over the Sahara Desert, surface air temperature increases as the prescribedshortwave absorption by dust is increased (Fig. 13.5), despite further dimming ofthe surface (Fig. 13.1). During NH summer, a deep boundary layer that is wellmixed by dry convection is observed between the surface and the mid-troposphere(Carlson and Prospero 1972). The low humidity allows the ground to radiate directlyto space, and the conditions leading to (13.1) and (13.2) are rarely satisfied. In thisregion, the sign of the anomalous surface air temperature calculated by models is notconsistently related to the sign of the forcing (Table 13.2). For example, warmingis calculated by Yoshioka et al. (2007) and Yue et al. (2011), despite forcingwhose sign differs between the two models at both TOA and the surface. This isonly possible if the perturbation to lateral energy transport varies among models,demonstrating that this transport must be considered when attributing temperatureperturbations to dust forcing, especially in regions of weak vertical mixing.
13.3.2 Precipitation
The Global Anomaly
Aerosols alter precipitation by changing the regional distribution of diabaticheating along with surface evaporation that supplies moisture to the atmosphere.Evaporation is coupled to aerosol forcing through the surface energy balance, wheredimming beneath the aerosol layer is compensated by a reduction in the net flux ofheat from the surface into the atmosphere:
FS D ıRLW .0/ C ıLE C ıSE: (13.4)
Here, ıRLW .0/ is the anomalous net upward flux of longwave radiation, while ıLE
and ıSE are the anomalous turbulent fluxes of latent and sensible heat, respectively.Over most of the ocean, the net heat flux is dominated by the latent component,and dimming of the surface is primarily compensated by a reduction in evaporation(cf. Figure 12 from Perlwitz and Miller 2010). This is illustrated by the reductionof precipitation within the tropical Atlantic ITCZ (Fig. 13.7) that is associated with

340 R.L. Miller et al.
Table 13.2 Qualitative summary of dust radiative forcing and the response of surface airtemperature in the Sahara and precipitation in the Sahel. All averages are for NH summer (JJAor JJAS) unless noted. Figures used to describe the forcing and response in the cited article are alsolisted along with the identity of the experiment where there is more than one. All models calculateSST using a mixed-layer ocean model with fixed heat transport unless otherwise noted
Surface air temperature over the SaharaStudy FT FS Cited figure ıTS Cited figureMiller and Tegen (1998) C – 2a, 1a – 5a1
Miller et al. (2004b) – – 8 – Unpublished2
Yoshioka et al. (2007) – C 2c C 6b3
Yue et al. (2011) C – 2e,f C 4b6
This study C – 13.1b C 13.5b8
Precipitation within the West African and Atlantic ITCZStudy FT FS Cited figure ıP Cited figureMiller and Tegen (1998) – – 2a, 1a – 7a1
Miller et al. (2004b) – – 8 – 162
Yoshioka et al. (2007) – – 2c –/C 4b3
Solmon et al. (2008) –/C – 1a,b – 2b, 34
Perlwitz and Miller (2010) C 2f 5f5
Yue et al. (2011) C – 2e,f C 4h6
Solmon et al. (2012) –/C 7c – 6d7
This study C – 13.1b C 13.7b8
1Dust concentration is largest over the Arabian Sea in this model and unrealistically low over theSahara. Cooling occurs over most of Sahara, despite FT > 0. A weak precipitation anomalyextends offshore over the Atlantic toward the ITCZ
2Forcing is listed for the 1:0� $0 experiment whose shortwave absorption is taken from Pattersonet al. (1977). FT < 0 and FS < 0 within the subtropical Atlantic and precipitation is reduceddownwind within the Atlantic ITCZ. Only annual average precipitation is shown: the anomalyover the West African coast switches sign to positive as the solar absorption is increased by10 %. Dust cools the Sahara (unpublished), in part due to moistening of the surface air by theprecipitation anomaly
3Annual forcing from the SOM.SP experiment, JJAS response from the SOM.SP (precipitation)and SOM.SL (precipitation, temperature) experiments. Complicated precipitation response withreduction over the West Atlantic and increase along the Guinea coast. Warming over the Sahara,cooling over the Sahel
4Regional model, with prescribed SST. Precipitation is reduced within the Sahel, with an increaseover the Atlantic that is an artifact of the prescribed SST according to Solmon et al. (2012)
5Forcing is from the 1.0 � SSA experiment. Dust concentration peaks over the Arabian Sea, withcomparatively low values over the Sahara. The regional distribution of high cloud cover is usedas a proxy for the precipitation anomaly
6Annual forcing and response. Forcing from Yue et al. (2010). Response from MXLSST_FDexperiment. Warming over the Sahara, cooling over the Sahel. Precipitation is reduced over theAtlantic, with a smaller reduction over the western Sahel and coastal region
7Forcing is from the standard case, but response is for the experiment where SST is reducedin proportion to dust optical thickness. Precipitation is reduced within the Sahel, with a largerreduction over the Atlantic when the ocean is cooled in proportion to the dust load
8JJAS averages of forcing and response. The simulation with solar absorption taken from Pattersonet al. (1977) is tabulated here, but use of the absorption compiled by Sinyuk et al. (2003) resultsin nearly zero forcing at TOA, a correspondingly weak warming within the Sahara and virtuallyno rainfall anomaly within the Sahel

13 Impact of Dust Radiative Forcing upon Climate 341
Fig. 13.7 As in Fig. 13.5 butfor anomalous precipitationıP . Extreme values of thecolor scale may vary amongpanels
the reduction in upwind evaporation where the aerosol plume extends offshore fromWest Africa.
For each experiment in Table 13.1, global precipitation is reduced by dustradiative forcing, a decrease that has been noted previously (e.g., Coakley andCess 1985; Miller and Tegen 1998; Miller et al. 2004b; Liepert et al. 2004).However, the relation of global evaporation and precipitation to surface forcing

342 R.L. Miller et al.
is not straightforward. Table 13.1 shows that evaporation actually increases asincreasing particle absorption causes further dimming of the surface, a dependencecorroborated by a previous version of the climate model and dust distribution (Milleret al. 2004b).
Xian (2008) describes one mechanism by which evaporation can increase withshortwave absorption, noting that ocean evaporation depends upon forcing at TOAin addition to the surface value. The evaporative anomaly ıE can be written using abulk formula:
ıE D �CDju0j ı�q�.SST/ � qS
�
D �CDju0j
dq�dT
ˇˇˇSST
ıSST � rdq�dT
ˇˇˇTS
ıTS
!
D �CDju0j dq�dT
ˇˇˇSST
ı .SST � TS/C�CDju0j
dq�dT
ˇˇˇSST
� rdq�dT
ˇˇˇTS
!
ıTS ;
(13.5)
where � is the atmospheric density, CD is a drag coefficient, and u0 is the surfacewind speed, all of which we assume constant for purposes of discussion. Thequantities qS and q�.SST/ represent the surface specific humidity and the saturationspecific humidity at the sea surface temperature SST, respectively. Equation 13.5 isderived by expressing each specific humidity in terms of the unperturbed temper-ature and linearizing. Xian (2008) notes that TOA forcing influences evaporationthrough its effect upon the anomalous surface air temperature, the final term in(13.5). In convecting regions, ıTS is directly related to the TOA forcing accordingto (13.1) and (13.3), so that positive FT increases evaporation.
The sensible and longwave fluxes can be parameterized according to the differ-ence in temperature between the surface and near-surface air (a representation thatis conventional for the sensible flux but more approximate for longwave radiation).Then, from (13.5) it can be shown that
ı.LE/ D ı.LP / D �FT C �FS ; (13.6)
where ı.LP / is the global precipitation anomaly multiplied by L. Both � and � arepositive (with � � 0:5� for typical tropical values), so that evaporation is reducedby dimming of the surface (FS < 0) but increased by positive TOA forcing.
Equation (13.6) applies only over the ocean or else vegetated regions with abun-dant reservoirs of soil moisture, where the evaporative anomaly can be representedby (13.5). However, ESMs show that evaporation in arid regions like the Sahel canalso increase with shortwave absorption, given an increase in precipitation (Milleret al. 2004b). Soil moisture supplied by a precipitation anomaly allows the surfaceto respond to incident radiation with a greater proportion of evaporation. Thus,evaporation may increase beneath the aerosol layer, despite the reduction of the

13 Impact of Dust Radiative Forcing upon Climate 343
incident radiative flux by dust that reduces the total flux of energy back into theatmosphere.
The increase of evaporation with dimming in Table 13.1 remains a provocativeresult that has yet to be explained quantitatively. Nonetheless, (13.6) opens thepossibility that absorbing aerosols with sufficiently large FT can increase surfaceevaporation and precipitation. (In this case, dimming of the surface must becompensated by reduced longwave and sensible fluxes.) The more general pointis that the aerosol perturbation to the global hydrologic cycle and precipitation doesnot depend solely upon surface forcing but depends additionally upon forcing atTOA. Indeed, Ming et al. (2010) refer to the right side of (13.6) as “hydrologicforcing”.
The influence of aerosol forcing upon the hydrologic cycle is mediated throughthe surface energy balance (13.4). Models that prescribe SST as a lower boundarycondition lack this balance and fail to simulate the full influence of aerosolradiative forcing upon the hydrologic cycle. Models with prescribed SST generallyunderestimate the reduction in precipitation by dust forcing compared to companionexperiments with calculated SST (e.g., Miller and Tegen 1998; Yoshioka et al. 2007;Yue et al. 2011). Mixed-layer ocean models, where heat transport by ocean currentsis fixed (Miller et al. 1983), necessarily compensate the surface forcing with thevarious fluxes comprising the surface energy balance. Inclusion of an ocean generalcirculation model (OGCM) within an ESM allows the additional possibility ofcompensating surface dimming with anomalous ocean heat import. OGCMs allowfor the most general response to aerosol forcing, but they have been used in only afew cases (e.g., Ramanathan et al. 2005; Bollasina et al. 2011).
Regional Anomalies
Regional anomalies of precipitation forced by aerosols are also sensitive to theimplementation of a surface energy balance. Precipitation associated with the Asianmonsoon is increased by dust radiative forcing when SST is prescribed, but reducedwhen a surface energy constraint is added as part of a mixed-layer ocean model(Miller et al. 2004a).
Only on shorter time scales of a few weeks after the onset of aerosol radiativeforcing, before SST has time to adjust, can the neglect of a surface energy balancebe justified. Stephens et al. (2004) consider the initial effect of radiative heatingby a dust outbreak using a cloud-resolving model within a tropical ocean domain.Heating within the aerosol layer acts as an elevated “heat pump” (e.g., Schneider1983; Lau and Kim 2006), driving ascent along with low-level convergence ofmoisture and precipitation.
At equilibrium (that is achieved by the upper ocean after several months),the transport of energy by the atmospheric circulation must compensate the loss(or gain) of energy within the region of aerosol forcing, equal to the difference ofthe total energy flux at TOA and the surface. Initially, this gain corresponds to theatmospheric forcing FT � FS , but as the circulation adjusts, the net flux imbalance

344 R.L. Miller et al.
at the surface and TOA is altered. At the surface, the radiative and turbulent fluxesadjust until FS is fully compensated. Only if heat transport by the ocean circulationadjusts to the aerosol forcing can the net energy flux across the surface remainnonzero.
At TOA, however, an imbalance between the forcing and anomalous OLRmay persist even after the climate returns to equilibrium. Consider the exampleof negative forcing at TOA due to a layer of reflective aerosols. To balance thisreduction of insolation, OLR and temperature decrease, and because of dynamicaladjustment, this decrease generally extends beyond the forcing region. The netradiative anomaly at TOA is positive beyond the aerosol layer due to the decrease ofOLR. Conversely, within the region of aerosol forcing, the net radiative anomaly atTOA is negative because this anomaly must be zero when summed over the extentof the response, as expressed by (13.1). Thus, above the aerosol layer, the reductionof OLR cannot fully compensate the forcing. The mismatch between the regionalextent of the forcing and the equilibrium response creates a horizontal contrast inthe TOA energy flux that must be balanced by the atmospheric transport of energy.In our example, the continual net radiative loss at TOA above the aerosol layer isbalanced by anomalous energy import.
The coupling of TOA forcing and anomalous atmospheric energy transport canlead to regional anomalies of precipitation. Here, we discuss precipitation anomaliesover the Sahel and their relation to TOA forcing in this region (Figs. 13.1 and 13.7).Following an argument by Chou et al. (2005), we consider the anomalous moisturebudget for the convecting region:
ıPc D ıEc C ıM.qS;d � qT;c/ C M ı.qS;d � qT;c/; (13.7)
where ıPc and ıEc are the anomalous precipitation and evaporation within theconvecting region, respectively, and ıM is the circulation anomaly linking theconvecting region to the neighboring regions of subsidence. The quantity qS;d �qT;c
is the difference between the unperturbed specific humidity entering the convectingregion from the surface of the subsiding region (qS;d ) and the upper tropospherichumidity qT;c where the rising air detrains (Fig. 13.8a). Equation (13.7) says thatanomalous precipitation ıPc exceeds the local evaporative anomaly ıEc as a resultof two contributions to the anomalous moisture flux. The first is the product of theanomalous overturning ıM and the net inflow of unperturbed moisture .qS;d � qT;c/
into the column. The second is the unperturbed circulation M multiplied by theanomalous net inflow ı.qS;d � qT;c/.
Negative TOA forcing within a region of climatological convection must bebalanced by a decrease in energy export. Chou et al. (2005) assume that thisdecrease occurs due to weakening of the direct circulation (ıM < 0), neglectinga possible contribution by a changing contrast in moist static energy between theconvecting and subsiding regions. They also assume that the primary contributionto anomalous precipitation is by the anomalous moisture flux resulting from theweakened overturning (the penultimate term in Eq. 13.7). Thus, negative TOA
13 Impact of Dust Radiative Forcing upon Climate 345
a b
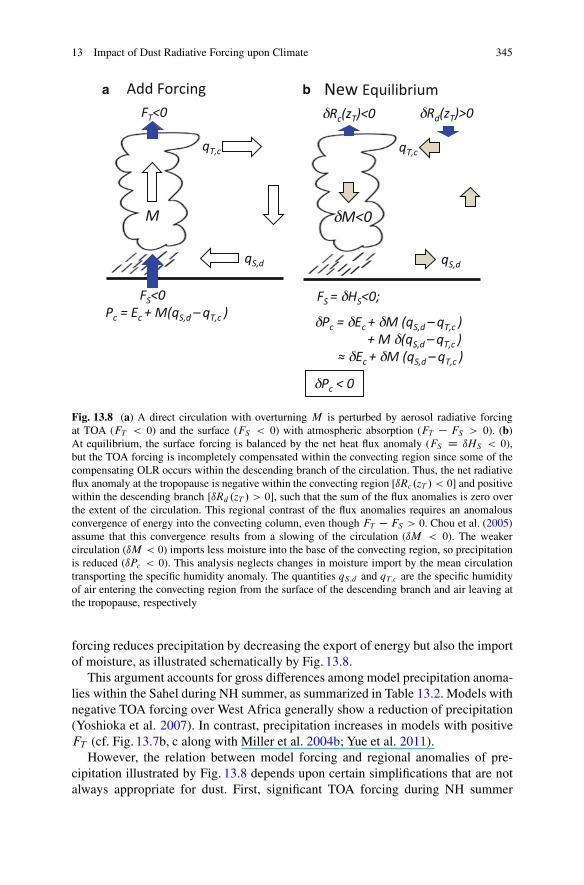
Fig. 13.8 (a) A direct circulation with overturning M is perturbed by aerosol radiative forcingat TOA (FT < 0) and the surface (FS < 0) with atmospheric absorption (FT � FS > 0). (b)At equilibrium, the surface forcing is balanced by the net heat flux anomaly (FS D ıHS < 0),but the TOA forcing is incompletely compensated within the convecting region since some of thecompensating OLR occurs within the descending branch of the circulation. Thus, the net radiativeflux anomaly at the tropopause is negative within the convecting region [ıRc.zT / < 0] and positivewithin the descending branch [ıRd .zT / > 0], such that the sum of the flux anomalies is zero overthe extent of the circulation. This regional contrast of the flux anomalies requires an anomalousconvergence of energy into the convecting column, even though FT � FS > 0. Chou et al. (2005)assume that this convergence results from a slowing of the circulation (ıM < 0). The weakercirculation (ıM < 0) imports less moisture into the base of the convecting region, so precipitationis reduced (ıPc < 0). This analysis neglects changes in moisture import by the mean circulationtransporting the specific humidity anomaly. The quantities qS;d and qT;c are the specific humidityof air entering the convecting region from the surface of the descending branch and air leaving atthe tropopause, respectively
forcing reduces precipitation by decreasing the export of energy but also the importof moisture, as illustrated schematically by Fig. 13.8.
This argument accounts for gross differences among model precipitation anoma-lies within the Sahel during NH summer, as summarized in Table 13.2. Models withnegative TOA forcing over West Africa generally show a reduction of precipitation(Yoshioka et al. 2007). In contrast, precipitation increases in models with positiveFT (cf. Fig. 13.7b, c along with Miller et al. 2004b; Yue et al. 2011).
However, the relation between model forcing and regional anomalies of pre-cipitation illustrated by Fig. 13.8 depends upon certain simplifications that are notalways appropriate for dust. First, significant TOA forcing during NH summer

346 R.L. Miller et al.
extends over the Sahara Desert, upwind of the precipitation anomaly; in otherseasons, the dust concentration and forcing are largest outside the region ofconvection. Thus, the overturning anomaly ıM is not solely related to the TOAforcing within the convecting region, although this case can be accommodated byincluding forcing within the subsidence region when calculating the anomalousenergy transport and overturning. Second, Fig. 13.8 assumes that anomalous energytransport occurs through adjustment of the overturning, but changes in the contrastof moist static energy between the convecting and subsiding regions can alsocontribute. In fact, the anomalous overturning is more closely related to atmosphericforcing FT � FS within the subsiding region, so long as changes to the stratificationby FT are of secondary importance, as discussed in Sect. 13.3.1 (cf. Miller andTegen 1998, 1999). (In this case, the regional contrast of moist static energyadjusts to allow the necessary anomaly of energy transport.) Third, the sensitivityof moisture import to the overturning anomaly requires that the inflow is humid andthat perturbations to humidity by dust are small, allowing the neglect of the lastterm in (13.7). Where the inflow is from arid regions that are dust sources (so thatqS;d is small), the moisture import will be relatively insensitive to changes in thecirculation strength. Finally, where the dust layer extends offshore and evaporationis reduced to compensate the surface forcing, moisture export from the subsidingregion may be sensitive to the anomalous humidity in addition to the anomalouscirculation strength, so that the last term in Eq. 13.7 is not negligible. In summary,the mechanism illustrated by Fig. 13.8 is consistent with the relation between TOAforcing and modeled Sahel precipitation in Table 13.2, but several assumptions needfurther consideration.
The coupling of TOA forcing and precipitation illustrated by Fig. 13.8 has threeconsequences. First, ascent and precipitation can increase where FT > 0 withina convecting region (Fig. 13.7b, c), despite strong negative forcing at the surfaceand intense heating within the aerosol layer. These latter conditions occasionallylead to claims of column “stabilization” by dust, but precipitation in fact increases;heating of the aerosol layer is nullified by adiabatic cooling associated with ascentrelated to the increased export of energy. This again illustrates that aerosol forcing isnot automatically balanced by a local temperature anomaly because the circulationallows the forcing to be balanced nonlocally. The second consequence, as shownby Chou et al. (2005), is that the anomalous export of energy from the region offorcing is driven by FT and not the aerosol forcing within the column FT � FS .That is, the “elevated heat pump” described by Lau and Kim (2006) drives ascentonly in the initial period, before there is significant compensation of the surfaceforcing. Full compensation occurs within a few weeks over land, but takes severalmonths over the ocean, where heat is stored over a deeper layer. Thus, the “heatpump” mechanism is not relevant for precipitation anomalies on interannual andlonger time scales. Again, the exception is where ocean heat transport adjusts inresponse to aerosol forcing, allowing the net surface energy flux to remain nonzeroin equilibrium. The third consequence is that negative forcing at TOA by reflectivedust particles is equally effective at driving precipitation anomalies, compared to

13 Impact of Dust Radiative Forcing upon Climate 347
positive TOA forcing by more absorbing minerals. A similar magnitude of theprecipitation response occurs despite much smaller atmospheric heating (i.e., aweaker “heat pump”) associated with reflective aerosols.
13.4 Feedback of Climate Anomalies upon the Dust Cycle
13.4.1 Surface Wind Speed and Dust Mobilization
The entrance of dust into the atmosphere is a sensitive function of surface windspeed (Chap. 5). The circulations raising dust are described in Chap. 6 and byKnippertz and Todd (2012). Here, we consider how dust perturbs the surface windthat feeds back upon dust mobilization.
Several studies have found that dust radiative forcing reduces the mobilizationon the order of 10 % compared to a model where the dust distribution is calculatedbut has no radiative effect (e.g., Perlwitz et al. 2001; Yue et al. 2011). Miller et al.(2004a) and Pérez et al. (2006) related the decrease in emission to a reduction ofeddy mixing within the boundary layer. Negative radiative forcing at the surfacereduces the flux of sensible heat from the ground that powers eddy mixing in thearid regions that are dust sources. These eddies normally accelerate the surface windeach morning by mixing down fast air that accelerated above the stable stratificationof the nocturnal boundary layer. The reduction of the surface wind speed by dustradiative forcing is largest at midmorning when the boundary layer deepens mostrapidly, following warming of the surface. This is the time of day when dustevents are most frequently initiated in North Africa (N’Tchayi Mbourou et al. 1997;Schepanski et al. 2009). Nocturnal warming of the surface by dust also contributesto the slowing of the surface winds the following morning by reducing stratificationand the nocturnal acceleration of the winds aloft. The dependence of wind speedupon surface forcing predicts that dust emission should increase in models withpositive forcing (Miller et al. 2004a). An increase in emission has been found byWoodage et al. (2010), although the precise mechanism has not been identified.
A few models calculate the intermittent increase of surface wind speed andmobilization by eddies whose amplitude is parameterized in terms of the surfaceflux of sensible heat (e.g., Lunt and Valdes 2002; Cakmur et al. 2004). A reductionof eddy wind speed by negative surface forcing has been shown to cause a reductionin dust emission that is comparable to the decrease by the explicitly resolvedmodel surface wind (Miller, unpublished results). Other studies have shown thatdust radiative forcing alters the regional distribution of surface pressure, increasingmobilization where the surface wind is augmented (Heinold et al. 2007; Ahn et al.2007).

348 R.L. Miller et al.
13.4.2 Vegetation and Dust Source Extent
The removal of vegetation exposes soil particles to a greater force by the wind,potentially increasing mobilization (Chap. 5). Conversely, increased vegetationwithin the Sahel during recent decades is correlated with the reduced occurrenceof dust storms (Cowie et al. 2013). By changing precipitation, dust radiative forcingalters the regional distribution of vegetation, feeding back upon the mobilization ofdust. The sign of this feedback and its quantitative importance remain unresolved.A positive feedback between dust radiative forcing and climate may contribute toobserved climate anomalies including desertification within the Sahel (Yoshiokaet al. 2007), the North American Dust Bowl during the 1930s (Koven 2006; Cooket al. 2008), and the multidecadal droughts within the Great Plains during theMedieval Climate Anomaly (Cook et al. 2013).
Devegetation is represented by several effects within models (Koven 2006). Thearea vulnerable to wind erosion is expanded, while surface roughness is decreased,reducing the wind stress that must be exceeded for soil mobilization (Chap. 5). Inaddition, the areal expansion of bare soil reduces transpiration of soil moistureinto the atmosphere, increasing the turbulent flux of sensible heat at the expenseof the latent heat flux. As noted above, the increased sensible heat flux increases thestrength of wind gusts, leading to greater mobilization.
Understanding the feedback between dust aerosols and vegetation introduces thechallenge of specifying the strength of a new dust source, defined as the mass ofdust mobilized at a given wind speed. Source strength depends upon the availabilityof easily eroded particles. Some models assume that newly exposed sources aremore prolific than existing sources because loosely bound soil particles that wereprotected by roots and leaves are now exposed to the force of the wind (e.g., Tegenet al. 1996). In contrast, existing sources may have been already stripped of theirmost easily erodible particles. In the absence of an increase to the strength ofnewly created sources, model dust loads seem unrealistically insensitive to largeexpansions of source extent related to the disappearance of vegetation (Yoshiokaet al. 2007). African dust arriving at Barbados increases fourfold between wetand dry decades. In contrast, Yoshioka et al. (2007) find that removal of Sahelvegetation associated with an equatorward expansion of the Sahara by 2ı latitude,meant to represent the probable change between a wet decade like the 1950s andthe comparatively dry 1990s, increases dust emission from North Africa by onlyabout one-third. This discrepancy with respect to observations suggests that themodel underestimates the initial strength of the new sources by assuming that theyare no stronger than the original sources. Inferring the strength of new sourcesfrom observations is complicated by concurrent changes to the wind thresholdfor mobilization. Some models assume that mechanical disturbance of the soil bycultivation reduces this threshold (e.g., Tegen et al. 2004). Other models raise thethreshold to account for the prevalence of cultivated sources in soils dominatedby clay, whose particles are subject to greater cohesion (Ginoux et al. 2012).

13 Impact of Dust Radiative Forcing upon Climate 349
Constraining the strength of newly created sources will require untangling the fullrange of changes to the mobilization process by devegetation.
The historical record indicates the presence of new dust sources during dryclimates like the Dust Bowl (e.g., Hansen and Libecap 2004). This drought waspreceded by a La Niña event in the equatorial eastern Pacific that typically reducesprecipitation during winter months over the southwestern United States. However,the Dust Bowl is unique among droughts in the historical record for its exaggeratedamplitude and persistence compared to the unexceptional ocean forcing as wellas the unusual northward displacement of the drought into the Great Plains. Thisis illustrated by contrasting the observed and SST-forced precipitation anomaliesin Fig. 13.9 (left and center columns, respectively), reproduced from Cook et al.(2009). One hypothesis is that the modest drought induced by La Niña witheredcrops that had recently replaced more resilient natural grasses. Devegetation led towind erosion and aerosol radiative forcing that amplified and sustained the droughtover the new sources created by cultivation (Koven 2006). This amplification issupported by model experiments that show a reduction in precipitation in thevicinity of the new dust sources (Koven 2006; Cook et al. 2008). To constrainthe strength of the new sources, Cook et al. (2008, 2009) used measurementsof downwind deposition (Hansen and Libecap 2004) and showed that the sourceexpansion brought the anomalies of temperature and precipitation into betteragreement with observations compared to the effect of equatorial Pacific SST byitself (Fig. 13.9, right column).
Models suggest that the drought of the Dust Bowl was exacerbated by humandisturbance, but natural “megadroughts” within the Great Plains of North Americahave been inferred from tree-ring measurements throughout the past millennium(Cook et al. 2007). During the Medieval Climate Anomaly (MCA), there is geologicevidence of expanding sand dunes within the Great Plains, implying increased dustmobilization (e.g., Jacobs and Mason 2007; Miao et al. 2007). Cook et al. (2013)show that new dust sources amplify the reduction of precipitation initiated by remoteforcing from the equatorial Pacific, increasing not only the magnitude of the droughtbut its persistence, consistent with the tree-ring record.
These studies show that new dust sources can significantly amplify and prolongprecipitation anomalies. What remains to be quantified is whether the regionalextent and strength of the new dust sources assumed by these studies are realistic.Models of vegetation and its response to climate anomalies are needed to investigatethe entire feedback loop. For the example of the MCA, a vegetation model isneeded to demonstrate that mild forcing from the equatorial Pacific can lead to theareal expansion of bare soil that is vulnerable to wind erosion. This requires thatvegetation models exhibit realistic sensitivity to climate perturbations. Some modelsshow large sensitivity. For example, anthropogenic climate change simulated by onemodel converts the Amazon into a desert that triples the global dust load (Woodwardet al. 2005). Vegetation models give source extent, but additional information aboutsource strength is needed, which depends upon soil mechanics and soil conservation

350 R.L. Miller et al.
CR
U 2
.1 T
emp
Ano
mal
y,°C
72°N
60°N
48°N
36°N
24°N
12°N
140°W
120°W
100°W
80°W
60°W
40°W
72°N
60°N
48°N
36°N
24°N
12°N
72°N
60°N
48°N
36°N
24°N
12°N
72°N
60°N
48°N
36°N
24°N
12°N
72°N
60°N
48°N
36°N
24°N
12°N
72°N
60°N
48°N
36°N
24°N
12°N
140°W
120°W
100°W
80°W
60°W
40°W
140°W
120°W
100°W
80°W
60°W
40°W
140°W
120°W
100°W
80°W
60°W
40°W
140°W
120°W
100°W
80°W
60°W
40°W
140°W
120°W
100°W
80°W
60°W
40°W
CR
U 2
.1 P
reci
p R
ate
Ano
mal
y, m
m d
ay−
1
SST
Onl
y
−1.2
−0.9
−0.6
−0.3
00.3
0.6
0.9
1.2
SST
Onl
ySST
+D
UST
+C
RO
P
−0.3
0.1
0.3
0.5
0.7
0.9
SST
+D
UST
+C
RO
P
−0.1
−0.5
−0.7
−0.9
Fig
.13.
9A
nom
alou
ste
mpe
ratu
re(K
)and
prec
ipit
atio
n(m
mpe
rday
)for
the
peri
od19
32–1
939,
rela
tive
to19
20–1
929.
Obs
erva
tion
s(l
eft)
are
from
the
Cli
mat
eR
esea
rch
Uni
t(C
RU
)ve
rsio
n2.
1da
tase
t.M
odel
aver
ages
are
from
five-
mem
ber
ense
mbl
es,f
orce
dby
(cen
ter)
SST
only
,and
(rig
ht)
SST
plus
expa
nded
bare
soil
and
dust
sour
ces
due
tocr
opre
mov
al(R
epro
duce
dfr
omC
ook
etal
.200
9)

13 Impact of Dust Radiative Forcing upon Climate 351
practices. These might be constrained with deposition inferred from geologicalsurveys. Only with both source extent and strength constrained can we quantifythe complete feedback loop between dust, climate, and vegetation.
13.5 Conclusion
Radiative forcing by dust aerosols changes surface temperature and rainfall alongwith variables like wind speed and vegetation that feed back upon the dust concen-tration. ESMs demonstrate that adjustment to the forcing occurs over the extent ofthe perturbed circulation. As a result, the temperature perturbation at any locationat equilibrium is not directly related to the local temperature tendency associatedwith the forcing. In regions of frequent vertical mixing by deep convection, theanomalous surface temperature is controlled primarily by the aerosol forcing atTOA rather than the surface. The strong coupling of surface air temperature to TOAforcing is implicitly recognized in the classic definition of climate sensitivity thatis the ratio of these two variables (e.g., Forster et al. 2007). Outside of convectingregions, the influence of surface forcing is similarly limited. Many models calculatewarming of the Sahara by dust, despite surface forcing of contrasting sign. The signof TOA forcing also varies inconsistently among these models, indicating that lateraltransports of energy need to be considered to interpret the temperature response.Surface temperature anomalies depend not only upon changes by dust to the energybudget but also changes to precipitation and humidity, as shown by the coolingwithin the Sahel as the TOA forcing becomes increasingly positive (Fig. 13.5).In general, transports of energy and moisture should be diagnosed along with theforcing to attribute the climate response calculated by ESMs.
Models generally predict a reduction of global precipitation by dust radiativeforcing. This has been interpreted in the literature as a simple consequence of thenegative surface forcing beneath the aerosol layer that leads to a compensatingreduction in surface evaporation. However, while precipitation is reduced for allthree prescriptions of particle shortwave absorption in Table 13.1, the reduction isnot proportional to dimming of the surface. The decrease of global precipitation(and evaporation) is smallest for the most absorbing particles, even though themagnitude of the surface forcing is largest. Xian (2008) demonstrates how theinfluence of positive TOA forcing upon surface air temperature and humidity canincrease surface evaporation and precipitation over the ocean. While the preciserelation between global precipitation and forcing needs further investigation, themore general point is that precipitation depends upon forcing at both TOA andthe surface (Ming et al. 2010).
Regional precipitation responds in a complicated way to dust radiative forcing.Dust generally reduces oceanic precipitation downwind of the aerosol layer, beneathwhich evaporation is reduced, as in the tropical Atlantic. Over the Sahel, however,the sign of the precipitation anomaly seems to follow the local TOA forcing(Table 13.2). Figure 13.7 shows that Sahel precipitation increases for positive TOAforcing, despite shortwave heating within the dust layer and reduced radiation

352 R.L. Miller et al.
incident upon the surface: temperature tendencies that would seemingly inhibitconvection by stabilizing the column. One resolution to this paradox is thatpositive TOA forcing increases the export of energy from the convecting region,resulting in anomalous convergence of moisture at the surface that makes the airconditionally unstable and likely to ascend (Chou et al. 2005). This argumentmakes certain assumptions that deserve further investigation. Most importantly, theclimate is assumed to respond to dust through a direct circulation. In the Tropics,this circulation type dominates the transport of energy and moisture. Relativelylittle attention has been devoted to how dust changes precipitation in the middlelatitudes. In general, extratropical cyclones have a complicated dependence uponthe time-averaged flow, and anticipating how they are modified by dust radiativeforcing is difficult. The precipitation response also depends upon the compensationof the surface forcing by evaporation as opposed to ocean heat transport. The latterhas been calculated in only a few studies (Ramanathan et al. 2005; Bollasina et al.2011).
While many studies emphasize the effect of dust forcing upon climatologicalprecipitation, there is recent interest regarding the effect of dust upon tropicalcyclones within the Atlantic, where dusty summers are associated with a reduc-tion in cyclone activity. There has been extensive work untangling the radiativeand microphysical effects of dust upon tropical cyclone development from otherenvironmental factors like the low humidity that accompanies dusty air, along withbroader climate variations that modulate both cyclones and dust. Understandingthe observed relation remains a topic of active research and importance, given thedestructive power of cyclones and their potential to amplify in the warming climate.
Several studies have shown how climate anomalies created by dust forcing feedback on the mobilization of additional soil particles. Surface wind speed respondsto forcing through either a perturbation to surface pressure or the sensible heatflux that controls mixing within the boundary layer. Dust changes the strengthof mixing that delivers momentum to the surface each morning from jets thatform above the nocturnal boundary layer. In addition, a reduction of precipitationby dust can diminish the extent of vegetation, leading to the mobilization ofadditional particles and amplification of droughts like the Dust Bowl. What remainsin characterizing this positive feedback is to model quantitatively the impactof the precipitation anomaly by dust upon vegetation. This in turn requires thedevelopment of dynamical vegetation models with realistic sensitivity.
The largest contribution to the uncertainty of forcing and the attendant climateresponse probably originates with the uncertain dust distribution. Estimates of theglobal dust aerosol mass by current models range between 20 and 35 Tg in mostcases (Textor et al. 2006). To reduce the uncertainty of forcing and its impactupon climate, we need a more confident estimate of the dust distribution. Theshortwave contribution to forcing is sensitive to the presence of absorbing mineralslike hematite, and routine measurements of mineral content will help to documentregional variations in the particle optical properties that are almost always neglectedby current ESMs. Forcing also varies among models due to environmental factorslike surface albedo. A more precise characterization of albedo remains a challenge

13 Impact of Dust Radiative Forcing upon Climate 353
because radiation from the surface is absorbed at many wavelengths by cloudsand aerosols before being measured by a satellite instrument. In the meantime, theforcing uncertainty and the resulting range of climate perturbations calculated byESMs remain a useful test of our understanding of the mechanisms relating dustradiative forcing to the climate response.
References
Ahn H-J, Park S-U, Chang L-S (2007) Effect of direct radiative forcing of Asian dust on themeteorological fields in East Asia during an Asian dust event period. J Appl Meteorol Climatol46:1655–1681. doi:10.1175/JAM2551.1
Bollasina MA, Ming Y, Ramaswamy V (2011) Anthropogenic aerosols and the weakening of theSouth Asian summer monsoon. Science 334:502–505. doi:10.1126/science.1204994
Cakmur R, Miller RL, Torres O (2004) Incorporating the effect of small-scale circulations upondust emission in an atmospheric general circulation model. J Geophys Res 109:D07201. doi:10.1029/2003JD4067
Carlson TN, Prospero JM (1972) The large-scale movement of Saharan air outbreaks over thenorthern equatorial Atlantic. J Appl Meteorol 11:283–297
Cess RD, Potter GL, Ghan SJ, Gates WL (1985) The climatic effects of large injections ofatmospheric smoke and dust: a study of climate feedback mechanisms with one- and three-dimensional climate models. J Geophys Res 90:12937–12950
Chou C, Neelin JD, Lohmann U, Feichter J (2005) Local and remote impacts of aerosol climateforcing on tropical precipitation. J Clim 18:4621–4636
Coakley JA, Cess RD (1985) Response of the NCAR community climate model to the radiativeforcing by the naturally occurring tropospheric aerosol. J Atmos Sci 42:1677–1692
Colarco PR, Toon OB, Torres O, Rasch PJ (2002) Determining the UV imaginary index ofrefraction of Saharan dust particles from total ozone mapping spectrometer data using athree-dimensional model of dust transport. J Geophys Res 107(D16):4312. doi:10.1029/2001JD000903
Cook ER, Seager R, Cane MA, Stahle DW (2007) North American drought: reconstructions,causes, and consequences. Earth Sci Rev 81:93–134. doi:10.1016/j.earscirev.2006.12.002
Cook BI, Miller RL, Seager R (2008) Dust and sea surface temperature forcing of the 1930s “dustbowl” drought. Geophys Res Lett 35:L08710. doi:10.1029/2008GL033486
Cook BI, Miller RL, Seager R (2009) Amplification of the North American ‘dust bowl’ droughtthrough human induced land degradation. Proc Natl Acad Sci USA 106(13):4997–5001.doi:10.1073/pnas.0810200106
Cook B, Seager R, Miller RL, Mason J (2013) Intensification of North American megadroughtsthrough surface and dust aerosol forcing. J Clim 26:4414–4430. doi:10.1175/JCLI-D-12-00022.1
Cowie SM, Knippertz P, Marsham JH (2013) Are vegetation-related roughness changes the causeof the recent decrease in dust emission from the Sahel? Geophys Res Lett 40:1868–1872.doi:10.1002/grl.50273
Dubovik O, Holben BN, Eck TF, Smirnov A, Kaufman YJ, King MD, Tanré D, Slutsker I (2002)Variability of absorption and optical properties of key aerosol types observed in worldwidelocations. J Atmos Sci 59:590–608
Forster P, Ramaswamy V, Artaxo P, Berntsen T, Betts R, Fahey D, Haywood J, Lean J, Lowe D,Myhre G, Nganga J, Prinn R, Raga G, Schulz M, Dorland RV (2007) Changes in atmosphericconstituents and in radiative forcing (chap. 2). In: Solomon S, Qin D, Manning M, Chen Z,Marquis M, Averyt K, Tignor M, Miller H (eds) Climate change 2007: the physical science

354 R.L. Miller et al.
basis. Contribution of working group I to the fourth assessment report of the intergovernmentalpanel on climate change. Cambridge University Press, Cambridge/New York
Ginoux P, Prospero JM, Gill TE, Hsu N, Zhao M (2012) Global scale attribution of anthropogenicand natural dust sources and their emission rates based on MODIS Deep Blue aerosol products.Rev Geophys 50:RG3005. doi:10.1029/2012RG000388
Grousset FE, Ginoux P, Bory A, Biscaye PE (2003) Case study of Chinese dust plume reachingthe French Alps. Geophys Res Lett 30:1277–1280. doi:10.1029/2002GL016833
Hansen ZK, Libecap GD (2004) Small farms, externalities, and the dust bowl of the 1930s. J PolEcon 112:665–694. doi:10.1086/383102
Hansen J, Sato M, Ruedy R (1997) Radiative forcing and climate response. J Geophys Res102:6831–6864
Hansen J, Sato M, Ruedy R, Nazarenko L, Lacis A, Schmidt GA, Russell G, Aleinov I, Bauer M,Bauer S, Bell N, Cairns B, Canuto V, Chandler M, Cheng Y, Del Genio A, Faluvegi G,Fleming E, Friend A, Hall T, Jackman C, Kelley M, Kiang N, Koch D, Lean J, Lerner J, Lo K,Menon S, Miller R, Minnis P, Novakov T, Oinas V, Perlwitz J, Perlwitz J, Rind D, Romanou D,Shindell D, Stone P, Sun S, Tausnev N, Thresher D, Wielicki B, Wong T, Yao M, Zhang S(2005) Efficacy of climate forcings. J Geophys Res 110:D18104. doi:19.1029/2005JD005776
Heinold B, Helmert J, Hellmuth O, Wolke R, Ansmann A, Marticorena B, Laurent B, Tegen I(2007) Regional modeling of Saharan dust events using LM-MUSCAT: model description andcase studies. J Geophys Res 112:D11204. doi:10.1029/2006JD007443
Jacobs PM, Mason JA (2007) Late quaternary climate change, loess sedimentation, and soilprofile development in the central great plains: a pedosedimentary model. Geol Soc Am Bull119:462475. doi:10.1130/B25868.1
Kavouras IG, Etyemezian V, DuBois DW, Xu J, Pitchford M (2009) Source reconciliation ofatmospheric dust causing visibility impairment in class I areas of the Western United States.J Geophys Res 114:D02308. doi:10.1029/2008JD009923
Knippertz P, Todd MC (2012) Mineral dust aerosols over the Sahara: meteorological controls onemission and transport and implications for modeling. Rev Geophys 50:RG1007. doi:10.1029/2011RG000362
Koven CD (2006) On the sources, composition, and climatic effects of mineral dust in theatmosphere. PhD thesis, University of California at Berkeley, Berkeley
Lau K-M, Kim K-M (2006) Observational relationships between aerosol and asian monsoonrainfall, and circulation. Geophys Res Lett 33:L21810. doi:10.1029/2006GL027546
Liao H, Seinfeld JH (1998) Radiative forcing by mineral dust aerosols: sensitivity to key variables.J Geophys Res 103:31637–31645
Liepert BG, Feichter J, Lohmann U, Roeckner E (2004) Can aerosols spin down the water cycle ina warmer and moister world? Geophys Res Lett 31:L06207. doi:10.1029/2003GL019060
Lunt DJ, Valdes PJ (2002) The modern dust cycle: comparison of model results with observationsand study of sensitivities. J Geophys Res 107(D23):4669. doi:10.1029/2002JD002316
Mahowald NM, Kloster S, Engelstaedter S, Moore JK, Mukhopadhyay S, McConnell JR,Albani S, Doney SC, Bhattacharya A, Curran MAJ, Flanner MG, Hoffman FM, LawrenceDM, Lindsay K, Mayewski PA, Neff J, Rothenberg D, Thomas E, Thornton PE, Zender CS(2010) Observed 20th century desert dust variability: impact on climate and biogeochemistry.Atmos Chem Phys 10:10875–10893. doi:10.5194/acp-10-10875-2010
Meehl G, Stocker T, Collins W, Friedlingstein P, Gaye A, Gregory J, Kitoh A, Knutti R, Murphy J,Noda A, Raper S, Watterson I, Weaver A, Zhao Z-C (2007) Global climate projections(chap. 10). In: Solomon S, Qin D, Manning M, Chen Z, Marquis M, Averyt K, Tignor M,Miller H (eds) Climate change 2007: the physical science basis. Contribution of working groupI to the fourth assessment report of the intergovernmental panel on climate change. CambridgeUniversity Press, Cambridge/New York
Miao X, Mason JA, Swinehart JB, Loope DB, Hanson PR, Goble RJ, Liu X (2007) A 10,000 yearrecord of dune activity, dust storms, and severe drought in the central great plains. Geology35:119–122. doi:10.1130/G23133A.1

13 Impact of Dust Radiative Forcing upon Climate 355
Miller RL (2012) Adjustment to radiative forcing in a simple coupled ocean-atmosphere model.J Clim 25:7802–7821. doi:10.1175/JCLI-D-11-00119.1
Miller RL, Tegen I (1998) Climate response to soil dust aerosols. J Clim 11:3247–3267Miller RL, Tegen I (1999) Radiative forcing of a tropical direct circulation by soil dust aerosols.
J Atmos Sci 56:2403–2433Miller JR, Russell GL, Tsang L-C (1983) Annual oceanic heat transports computed from an
atmospheric model. Dyn Atmos Oceans 7:95–109Miller RL, Perlwitz J, Tegen I (2004a) Modeling Arabian dust mobilization during the Asian
summer monsoon: the effect of prescribed versus calculated SST. Geophys Res Lett31(22):L22214. doi:10.1029/2004GL020669
Miller RL, Tegen I, Perlwitz J (2004b) Surface radiative forcing by soil dust aerosols and thehydrologic cycle. J Geophys Res 109:D04203. doi:10.1029/2003JD004085
Miller RL, Cakmur RV, Perlwitz J, Geogdzhayev IV, Ginoux P, Koch D, Kohfeld KE, Prigent C,Ruedy R, Schmidt GA, Tegen I (2006) Mineral dust aerosols in the NASA Goddard Institutefor Space Studies ModelE AGCM. J Geophys Res 111:D06208. doi:10.1029/2005JD005796
Miller RL, Slingo A, Barnard JC, Kassianov E (2009) Seasonal contrast in the surface energybalance of the Sahel. J Geophys Res 114:D00E05. doi:10.1029/2008JD010521
Ming Y, Ramaswamy V, Persad G (2010) Two opposing effects of absorbing aerosols on global-mean precipitation. Geophys Res Lett 37, L13701. doi:10.1029/2010GL042895
N’Tchayi Mbourou G, Bertrand J, Nicholson S (1997) The diurnal and seasonal cycles of wind-borne dust over Africa North of the equator. J Appl Meteorol 36:868–882
Patterson EM, Gillette DA, Stockton BH (1977) Complex index of refraction between 300 and700 nm for Saharan aerosols. J Geophys Res 82:3153–3160
Pérez C, Nickovic S, Pejanovic G, Baldasano JM, Özsoy E (2006) Interactive dust-radiationmodeling: a step to improve weather forecasts. J Geophys Res 111:D16206. doi:10.1029/2005JD006717
Perlwitz J, Miller R (2010) Cloud cover increase with increasing aerosol absorptivity—a coun-terexample to the conventional semi-direct aerosol effect. J Geophys Res 115:D08203. doi:10.1029/2009JD012637
Perlwitz J, Tegen I, Miller RL (2001) Interactive soil dust aerosol model in the GISS GCM. PartI: sensitivity of the soil dust cycle to radiative properties of soil dust aerosols. J Geophys Res106:18167–18192
Ramanathan V, Chung C, Kim D, Bettege T, Buja L, Kiehl JT, Washington WM, Fu Q, Sikka DR,Wild M (2005) Atmospheric brown clouds: impacts on South Asian climate and hydrologicalcycle. Proc Natl Acad Sci USA 5326–5333. doi:10.1073/pnas.0500656102
Randall D, Wood R, Bony S, Colman R, Fichefet T, Fyfe J, Kattsov V, Pitman A, ShuklaJ, Srinivasan J, Stouffer R, Sumi A, Taylor K (2007) Cilmate models and their evaluation(chap. 8). In: Solomon S, Qin D, Manning M, Chen Z, Marquis M, Averyt K, Tignor M, MillerH (eds) Climate change 2007: the physical science basis. Contribution of working group I tothe fourth assessment report of the intergovernmental panel on climate change. CambridgeUniversity Press, Cambridge/New York
Schepanski K, Tegen I, Todd MC, Heinold B, Bonisch G, Laurent B, Macke A (2009) Meteo-rological processes forcing Saharan dust emission inferred from msg-seviri observations ofsubdaily dust source activation and numerical models. J Geophys Res 114:D10201. doi:10.1029/2008JD010325
Schmidt GA, Ruedy R, Hansen JE, Aleinov I, Bell N, Bauer M, Bauer S, Cairns B, Cheng Y,DelGenio A, Faluvegi G, Friend AD, Hall TM, Hu Y, Kelley M, Kiang N, Koch D, Lacis AA,Lerner J, Lo KK, Miller RL, Nazarenko L, Oinas V, Perlwitz J, Perlwitz J, Rind D, Romanou A,Russell GL, Sato M, Shindell DT, Stone PH, Sun S, Tausnev N, Thresher D, Yao M-S (2006)Present day atmospheric simulations using GISS modelE: comparison to in-situ, satellite andreanalysis data. J Clim 19:153–192
Schmidt GA, Kelley M, Nazarenko L, Ruedy R, Russell GL, Aleinov I, Bauer M, Bauer S,Bhat MK, Bleck R, Canuto V, Chen Y, Cheng Y, Clune TL, DelGenio A, de Fainchtein R,Faluvegi G, Hansen JE, Healy RJ, Kiang NY, Koch D, Lacis AA, LeGrande AN, Lerner

356 R.L. Miller et al.
J, Lo KK, Marshall J, Mathews EE, Menon S, Miller RL, Oinas V, Oloso A, Perlwitz J,Puma MJ, Putman WM, Rind D, Romanou A, Sato M, Shindell DT, Sun S, Syed R, Tausnev N,Tsigaridis K, Unger N, Voulgarakis A, Yao M-S, Zhang J (2014) Configuration and assessmentof the GISS ModelE2 contributions to the CMIP5 archive. J Adv Model Earth Syst 6:141–184.doi:10.1002/2013MS000265
Schneider EK (1983) Martian dust storms: interpretive axially symmetric models. Icarus55:302–331
Schopf PS (1983) On equatorial waves and El Niño. II: effects of air-sea thermal coupling. J PhysOceanogr 13:1878–1893
Shindell D, Schulz M, Ming Y, Takemura T, Faluvegi G, Ramaswamy V (2010) Spatial scalesof climate response to inhomogeneous radiative forcing. JGR 115:D19110. doi:10.1029/2010JD014108
Sinyuk A, Torres O, Dubovik O (2003) Combined use of satellite and surface observations to inferthe imaginary part of the refractive index of Saharan dust. Geophys Res Lett 30. doi:10.1029/2002GL016189
Slingo A, Ackerman TP, Allan RP, Kassianov EI, McFarlane SA, Robinson GJ, Barnard JC, MillerMA, Harries JE, Russell JE, Dewitte S (2006) Observations of the impact of a major Saharandust storm on the atmospheric radiation balance. Geophys Res Lett 33:L24817. doi:10.1029/2006GL027869
Solmon F, Mallet M, Elguindi N, Giorgi F, Zakey A, Konare A (2008) Dust aerosol impact onregional precipitation over Western Africa, mechanisms and sensitivity to absorption properties.Geophys Res Lett 35:L24705. doi:10.1029/2008GL035900
Solmon F, Elguindi N, Mallet M (2012) Radiative and climatic effects of dust over West Africa, assimulated by a regional climate model. Clim Res. doi:10.3354/cr01039
Stephens GL, Wood NB, Pakula LA (2004) On the radiative effects of dust on tropical convection.Geophys Res Lett 31:L23112. doi:10.1029/2004GL021342
Swap R, Garstang M, Greco S, Talbot R, Kallberg P (1992) Saharan dust in the Amazon basin.Tellus 44B:133–149
Tegen I, Lacis AA (1996) Modeling of particle influence on the radiative properties of mineral dustaerosol. J Geophys Res 101:19237–19244
Tegen I, Lacis AA, Fung I (1996) The influence on climate forcing of mineral aerosols fromdisturbed soils. Nature 380:419–422
Tegen I, Werner M, Harrison SP, Kohfeld KE (2004) Relative importance of climate and land use indetermining present and future global soil dust emission. Geophys Res Lett 31:L05105. doi:10.1029/2003GL019216
Tegen I, Heinold B, Todd M, Helmert J, Washington R, Dubovik O (2006) Modelling soildust aerosol in the bodéelé depression during the BoDEx campaign. Atmos Chem Phys6:4345–4359
Textor C, Schulz M, Guibert S, Kinne S, Balkanski Y, Bauer S, Berntsen T, Berglen T, BoucherO, Chin M, Dentener F, Diehl T, Easter R, Feichter H, Fillmore D, Ghan S, Ginoux P, Gong S,Grini A, Hendricks J, Horowitz L, Huang P, Isaksen I, Iversen I, Kloster S, Koch D, Kirkevåg A,Kristjansson JE, Krol M, Lauer A, Lamarque JF, Liu X, Montanaro V, Myhre G, Penner J,Pitari G, Reddy S, Seland Ø, Stier P, Takemura T, Tie X (2006) Analysis and quantificationof the diversities of aerosol life cycles within aerocom. Atmos Chem Phys 6(7):1777–1813.doi:10.5194/acp-6-1777-2006
Volz FE (1973) Infrared optical constants of ammonium sulfate, Sahara dust, volcanic pumice andflyash. Appl Opt 12:564–568
Woodage MJ, Slingo A, Woodward S, Comer RE (2010) U.K. HiGEM: simulations of desert dustand biomass burning aerosols with a high-resolution atmospheric GCM. J Clim 23:1636–1659.doi:10.1175/2009JCLI2994.1
Woodward S, Roberts DL, Betts RA (2005) A simulation of the effect of climate changein-duced desertification on mineral dust aerosol. Geophys Res Lett 32:L18810. doi:10.1029/2005GL023482

13 Impact of Dust Radiative Forcing upon Climate 357
Xian P (2008) Seasonal migration of the ITCZ and implications for aerosol radiative impact. PhDthesis, Columbia University
Yoshioka M, Mahowald NM, Conley AJ, Collins WD, Fillmore DW, Zender CS, Coleman DB(2007) Impact of desert dust radiative forcing on Sahel precipitation: relative importance ofdust compared to sea surface temperature variations, vegetation changes, and greenhouse gaswarming. J Clim 20:1445–1467
Yue X, Wang H, Liao H, Fan K (2010) Simulation of dust aerosol radiative feedback using theGMOD: 2. Dust-climate interactions. J Geophys Res 115:D04201. doi:10.1029/2009JD012063
Yue X, Liao H, Wang HJ, Li SL, Tang JP (2011) Role of sea surface temperature responses insimulation of the climatic effect of mineral dust aerosol. Atmos Chem Phys 6049–6062. doi:10.5194/acp-11-6049-2011
Yulaeva E, Wallace JM (1994) The signature of ENSO in global temperature and precipitationfields derived from the microwave sounding unit. J Clim 7:1719–1736. doi:10.1175/1520-0442(1994)007<1719:TSOEIG>2.0.CO;2
Copyright © 2022 FDOKUMEN