Radiative energy partition and cloud radiative forcing at a Po valley site
23
Radiative energy partition and cloud radiative forcing at a Po valley site C. Galli a , M. Nardino a,b , V. Levizzani a , R. Rizzi c , T. Georgiadis b,d, * a ISAC-CNR, Institute of Atmospheric Sciences and Climate, via Gobetti 101, I-40129 Bologna, Italy b IBiMet-CNR, Institute for Biometeorology, via Gobetti 101, I-40129 Bologna, Italy c Department of Physics, University of Bologna, viale Berti Pichat 6/2, I-40127 Bologna, Italy d DESA, University of Sassari, via E. de Nicola, I-07100 Sassari, Italy Received 30 July 2003; received in revised form 7 January 2004; accepted 31 March 2004 Abstract Values of downward and upward flux densities of solar and terrestrial radiation were continuously recorded between 1 December 2001 and 30 November 2002 using a four-components radiometer at S. Pietro Capofiume (SPC) in northern Italy (44j39VN, 11j37VE, alt. 11 m a.m.s.l.), which is characterized by a weakly-reflective surface. The aim of the study was to investigate the effects of clouds on surface radiation balance (SRB); the cloud fraction (N) has been retrieved through the inverted form of the parameterization proposed by Kasten and Czeplak [Solar Energy 24 (1980) 177] and cloud types estimated following the methodology of Duchon and O’Malley [J. Appl. Meteorol. 38 (1999) 132]. The cloud radiative forcing (CRF) was evaluated through the Bintanja and Van den Broeke [Int. J. Climatol. 16 (1996) 1281] formula and then associated with cloud type. Experimental results showed that during the measuring period the net shortwave (Sw) balance always decreased with increasing N, whereas the net longwave (Lw) balance increased in all seasons. The net radiation available at the surface decreased with increasing N in all seasons except in winter, where no significant dependency was detected. The analysis of the cloud radiative forcing indicates that all seasons were characterized by a net cooling of the surface except winter, where clouds seem to have no effects on the surface warming or cooling. Taking into account the dependence on solar radiation cycle, an intercomparison between the retrieved cloud types seems to indicate that the effect of stratus was a slight cooling whereas that of cumulus clouds was a stronger cooling of the surface. On the contrary, cirrus clouds seem to have slight warming effect on the surface. The annual trends of mean monthly values of shortwave and longwave radiation balances confirmed that the measurement site is characterized by a temperate climate. Moreover, in spite of 0169-8095/$ - see front matter D 2004 Elsevier B.V. All rights reserved. doi:10.1016/j.atmosres.2004.03.022 * Corresponding author. IBiMet-CNR, Institute for Biometeorology, via Gobetti 101, I-40129 Bologna, Italy. Tel.: +39-51-639-9006; fax: +39-51-639-9024. E-mail addresses: [email protected] (C. Galli), [email protected] (M. Nardino), [email protected] (V. Levizzani), [email protected] (R. Rizzi), [email protected] (T. Georgiadis). www.elsevier.com/locate/atmos Atmospheric Research 72 (2004) 329 – 351
Transcript of Radiative energy partition and cloud radiative forcing at a Po valley site

www.elsevier.com/locate/atmos
Atmospheric Research 72 (2004) 329–351
Radiative energy partition and cloud radiative
forcing at a Po valley site
C. Gallia, M. Nardinoa,b, V. Levizzania, R. Rizzic, T. Georgiadisb,d,*
a ISAC-CNR, Institute of Atmospheric Sciences and Climate, via Gobetti 101, I-40129 Bologna, Italyb IBiMet-CNR, Institute for Biometeorology, via Gobetti 101, I-40129 Bologna, Italy
cDepartment of Physics, University of Bologna, viale Berti Pichat 6/2, I-40127 Bologna, ItalydDESA, University of Sassari, via E. de Nicola, I-07100 Sassari, Italy
Received 30 July 2003; received in revised form 7 January 2004; accepted 31 March 2004
Abstract
Values of downward and upward flux densities of solar and terrestrial radiation were continuously
recorded between 1 December 2001 and 30 November 2002 using a four-components radiometer at
S. Pietro Capofiume (SPC) in northern Italy (44j39VN, 11j37VE, alt. 11 m a.m.s.l.), which is
characterized by a weakly-reflective surface. The aim of the study was to investigate the effects of
clouds on surface radiation balance (SRB); the cloud fraction (N) has been retrieved through the
inverted form of the parameterization proposed by Kasten and Czeplak [Solar Energy 24 (1980) 177]
and cloud types estimated following the methodology of Duchon and O’Malley [J. Appl. Meteorol.
38 (1999) 132]. The cloud radiative forcing (CRF) was evaluated through the Bintanja and Van den
Broeke [Int. J. Climatol. 16 (1996) 1281] formula and then associated with cloud type. Experimental
results showed that during the measuring period the net shortwave (Sw) balance always decreased
with increasing N, whereas the net longwave (Lw) balance increased in all seasons. The net radiation
available at the surface decreased with increasing N in all seasons except in winter, where no
significant dependency was detected.
The analysis of the cloud radiative forcing indicates that all seasons were characterized by a net
cooling of the surface except winter, where clouds seem to have no effects on the surface warming or
cooling. Taking into account the dependence on solar radiation cycle, an intercomparison between
the retrieved cloud types seems to indicate that the effect of stratus was a slight cooling whereas that
of cumulus clouds was a stronger cooling of the surface. On the contrary, cirrus clouds seem to have
slight warming effect on the surface.
The annual trends of mean monthly values of shortwave and longwave radiation balances
confirmed that the measurement site is characterized by a temperate climate. Moreover, in spite of
0169-8095/$ - see front matter D 2004 Elsevier B.V. All rights reserved.
doi:10.1016/j.atmosres.2004.03.022
* Corresponding author. IBiMet-CNR, Institute for Biometeorology, via Gobetti 101, I-40129 Bologna, Italy.
Tel.: +39-51-639-9006; fax: +39-51-639-9024.
E-mail addresses: [email protected] (C. Galli), [email protected] (M. Nardino), [email protected]
(V. Levizzani), [email protected] (R. Rizzi), [email protected] (T. Georgiadis).
C. Galli et al. / Atmospheric Research 72 (2004) 329–351330
the cooling effect of clouds, a monthly radiative energy surplus is available all year long for surface–
atmosphere energy exchanges. The analysis is also instrumental for the detection of SRB variations.
D 2004 Elsevier B.V. All rights reserved.
Keywords: Global climate changes; Solar radiation; Atmospheric radiation; Surface radiation balance; Cloud
radiative forcing
1. Introduction
Climate changes as a multifaceted global problem are receiving growing attention
especially as regards to future impacts on the planet and mankind (IPCC, 2001). Due to the
chaotic nature of the atmospheric continuum, which inherently limits the skills of climate
variation predictions, we can only project climate changes in the future in terms of
scenarios. The main tools are represented by climate models (e.g., Collins and Senior,
2002) whose predictive accuracy of global warming scenarios through the increase of CO2
has not changed much during the last two decades. One of the main reasons for this fact is
the crude representation of cloud radiative properties in climate models (e.g., Webster and
Stephens, 1983; Cess et al., 1989; Senior and Mitchell, 1993; Haigh, 2002).
Clouds alone may account for more than 40% of the incoming and outgoing radiation
fluxes, let alone the latent heat flux, which might add an additional 24%, (e.g., Peixoto and
Oort, 1992). For this reason, clouds can be considered one of the main regulating factors of
the Earth’s climate; they exert a cooling effect by reflecting a portion of the incoming solar
radiation and a simultaneous warming effect by decreasing the Earth-emitted longwave
(Lw) radiation.
A way to weigh the effects of clouds on the surface–atmosphere system is the cloud
radiative forcing (CRF), defined as the difference between the radiation budget in all-sky
and clear-sky conditions. In recent years, several studies have attempted to quantify the
CRF at the top of the atmosphere (TOA) (Su et al., 2000; Inoue and Ackerman, 2002) and
at the Earth surface (Tarasova and Cavalcanti, 2002; Tian and Ramanathan, 2002; Dong
and Mace, 2003; Wang and Key, 2003).
Clouds have an important role in the vertical energy partition and consequently their
impact on the net radiation budget at TOA may not tell their total impact on the Earth
climate system. A particular value of the net outgoing radiation flux at TOA need not
represent a unique state of the column below (Stephens and Webster, 1981), a fact that
calls for a more thorough understanding of the role of clouds on the surface–atmosphere
radiative energy partition.
The methodologies used to retrieve the surface CRF are manifold (satellite radiances,
model-simulated values, empirical parameterizations, field observations), but regardless of
the measurement or modeling approach the magnitude and sign of CRF depends on
available solar energy, clouds and surface properties, i.e. cloud albedo and emissivity,
surface temperature and reflectivity, and also on cloud base height (Harrison et al., 1990;
Stuhlmann, 1995; Tian and Ramanathan, 2002).
Using a one-dimensional radiative convective model, Stephens and Webster (1981)
determined that high thin clouds at low and mid-latitudes in all seasons and all cloud types
C. Galli et al. / Atmospheric Research 72 (2004) 329–351 331
at high latitudes in winter tended to warm the surface relative to a clear sky; all other
clouds tended to cool the surface. The summer high-latitude effects were similar to the
low- and mid-latitude situation. Their model also showed that, for a given cloud type, a
critical surface albedo may exist at which the cloud turns from cooling to warming the
surface when the surface albedo increases.
These results seem to be confirmed by other studies that found a positive value of
surface CRF over highly reflective surfaces and/or in the presence of cirrus-like cloudiness
(Bintanja and Van den Broeke, 1996; Duda et al., 2001; Marty et al., 2002; Nardino and
Georgiadis, 2003). The positive CRF values may be ascribed to the multiple reflection of
solar radiation between the highly reflective surface and the cloud bottom that enhances
the net surface shortwave (Sw) flux, and/or to the low shortwave optical depth of cirrus-
like clouds compared to other cloud types (Hahn et al., 2001; Sassen and Comstock,
2001). Two of the above-mentioned studies (Bintanja and Van den Broeke, 1996; Nardino
and Georgiadis, 2003) also showed that the surface CRF is very sensitive to surface albedo
and cloud type because the CRF becomes negative in the presence of other cloud types
and/or melting ice.
In partial agreement with Stephens and Webster’s (1981) model results, Stuhlmann
(1995) suggested that low clouds tend to cool the surface, whereas high and middle clouds
cause a surface warming. On the contrary, Tian and Ramanathan (2002) found in the
tropical Pacific a negative surface CRF both for high (cirrus, cirrostratus and deep
convective clouds) and low (stratus, stratocumulus and cumulus) clouds, and a net cooling
effect of middle clouds.
The present measurements come from a radiometric station situated on a grass-covered
(weakly reflective) surface at a site in northern Italy and are representative of the Po Valley
region. This region is very important for the Italian and European primary production both
for the great economic value of its agricultural products and the wide extension of the
cultivated area. In fact, the seasonal analysis of surface radiation/energy parameters
contributes to a better understanding of the impacts on agriculture and generally on the
ecosystems since it aims at quantifying the overall cloud effects on surface energy
availability in all seasons separately. The surface energy budget (SEB) is governed by
several surface and atmospheric processes, whose time scales go from minutes to several
consecutive years. The SEB at time scales of days to years is intimately linked to the water,
carbon and nutrient balances of the surface and influences the ecosystem developments
(Pielke et al., 1998), especially the state of the vegetation above and below ground. Note thus
the importance of quantifying seasonal changes in the framework of global climate changes.
There are three main objectives in this paper. The first is to determine the relationships
between the cloud fraction (N) and the surface radiation balances, Sw, Lw and net. For this
purpose, the cloud fraction is retrieved through the Kasten and Czeplak (1980) parame-
terization and then related with each kind of radiation balance. The second is to obtain an
estimation of surface CRF and try to relate it with cloud type in order to establish if a
certain type of cloud causes a warming or a cooling of the Earth–atmosphere system. This
is derived by computing the CRF according to Bintanja and Van den Broeke (1996) and
estimating the cloud type through the methodology proposed by Duchon and O’Malley
(1999). The third is to give a climate classification of the measurement site, by means of
the hodograph method proposed by Smith et al. (2002).

C. Galli et al. / Atmospheric Research 72 (2004) 329–351332
The site and the experimental setup are described in Section 2, while the analysis
methods are detailed in Section 3. Sections 4 and 5 present the results and conclusions,
respectively.
2. Experimental setup
2.1. Site description
Measurements were collected at S. Pietro Capofiume (SPC), 44j39VN, 11j37VE, 11 m
a.s.l. The site is a typical rural location in the northeastern Emilia-Romagna region (Italy)
in the Po valley (Fig. 1). Fig. 2 shows the annual mean values of air temperature and
relative humidity (a), and yearly precipitation amounts (b) recorded in SPC from 1987 to
2001.
The instrumentation used for the campaign was installed in a wide flat, grass-covered
area, situated in the proximity of the Regional Meteorological Service (ARPA/SMR)
operative meteorological centre (OMC), a baseline station of The World Meteorological
Organization (WMO).
Fig. 1. Location of the S. Pietro Capofiume (SPC) measurement site.
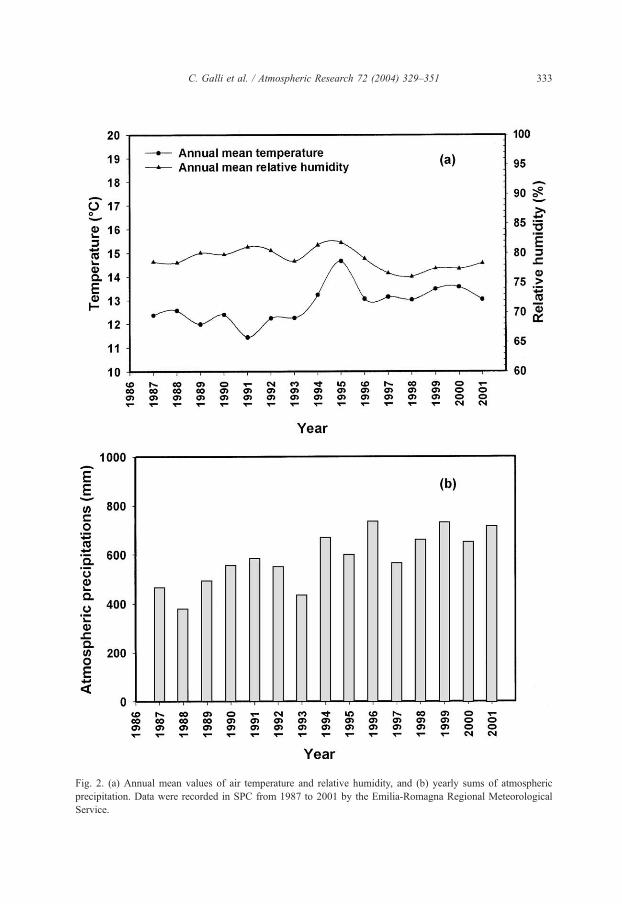
Fig. 2. (a) Annual mean values of air temperature and relative humidity, and (b) yearly sums of atmospheric
precipitation. Data were recorded in SPC from 1987 to 2001 by the Emilia-Romagna Regional Meteorological
Service.
C. Galli et al. / Atmospheric Research 72 (2004) 329–351 333

C. Galli et al. / Atmospheric Research 72 (2004) 329–351334
The importance of the site stems from its representativeness of meteoclimatic
conditions of Emilia-Romagna, which is very relevant from the agricultural point of
view. The influence of cloud cover is therefore twice as important since it affects both the
flux of radiation reaching the surface and the frequency and magnitude of precipitation
events.
Climatological studies of the region are available in the literature trying to find a trend
in the precipitation time series and detect changes in precipitation amounts (Tomozeiu et
al., 2000, 2002a). These studies revealed an increasing trend in summer precipitations for
the period 1922 to 1995 (Tomozeiu et al., 2000) and a decreasing one in winter between
1960 and 1995 (Tomozeiu et al., 2002a). Another recent study on mean regional maximum
and minimum temperatures from 1956 to 2000, whose results are only very preliminary,
seems to suggest a shift in the distribution of mean temperature towards higher values
(Tomozeiu et al., 2002b, in Italian).
2.2. Sensors
2.2.1. Radiometric station
The downwelling and upwelling surface fluxes were measured by means of a four-
component EKO radiometer, model MR-40. The radiometer measured separately the Sw
(0.3 to 3 Am) and Lw (3 to 50 Am) radiation components with two pyranometers and two
pyrgeometers, respectively. The field of view of the sensors is 180j and an estimated error
of 10% is attributed to daily sums. The radiometric station measured each component
every 15 s and all data were stored in a Campbell CR10 data logger that calculated the
mean values over a 10-min period. All radiation fluxes are expressed in W m� 2.
2.2.2. Meteorological station
The key meteorological parameters were measured by a standard meteorological
station: precipitation (tipping bucket rain gauge), air temperature (T-thermocouple),
relative humidity (solid state hygrometer), and incoming Sw radiation (Swin) at 3 m
height (thermopile pyranometer). Each parameter was measured every minute and a data-
logger calculated and stored the 20-min mean values. Precipitation is expressed in mm,
temperatures in jC and relative humidity in %.
2.2.3. Network camera
The monitoring of sky conditions was carried out by means of a network camera AXIS,
model 2100, mounted in an elevated position in order to obtain a hemispheric, obstacle-
free sky view. The camera was modified for remote control during the measurement
campaign. A gray filter was inserted between the fish-eye and the network camera lens
with the aim to avoid solar radiation reflection and the camera was mounted on a stout
mount (Fig. 3). The data acquisition system stored a sky image every 10 min.
2.3. Data set
From 1 December 2001 to 30 November 2002, more or less uninterrupted measure-
ments were taken of the four surface radiation components: Sw incoming (Swin), Sw
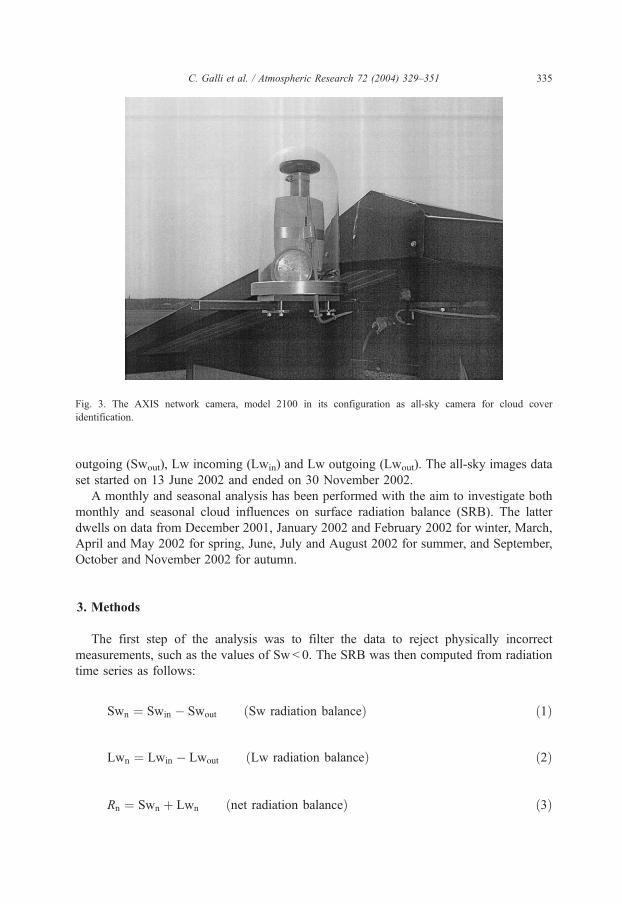
Fig. 3. The AXIS network camera, model 2100 in its configuration as all-sky camera for cloud cover
identification.
C. Galli et al. / Atmospheric Research 72 (2004) 329–351 335
outgoing (Swout), Lw incoming (Lwin) and Lw outgoing (Lwout). The all-sky images data
set started on 13 June 2002 and ended on 30 November 2002.
A monthly and seasonal analysis has been performed with the aim to investigate both
monthly and seasonal cloud influences on surface radiation balance (SRB). The latter
dwells on data from December 2001, January 2002 and February 2002 for winter, March,
April and May 2002 for spring, June, July and August 2002 for summer, and September,
October and November 2002 for autumn.
3. Methods
The first step of the analysis was to filter the data to reject physically incorrect
measurements, such as the values of Sw< 0. The SRB was then computed from radiation
time series as follows:
Swn ¼ Swin � Swout ðSw radiation balanceÞ ð1Þ
Lwn ¼ Lwin � Lwout ðLw radiation balanceÞ ð2Þ
Rn ¼ Swn þ Lwn ðnet radiation balanceÞ ð3Þ

C. Galli et al. / Atmospheric Research 72 (2004) 329–351336
The surface reflectivity for the solar wavelengths (albedo coefficient, a) was evaluatedthrough the ratio between the Sw radiation reflected by the surface and that incident on the
surface:
a ¼ Swout
Swin
ð4Þ
Because of possible directional response deviations of the sensors, a was computed
only for measurements corresponding to solar elevations angles (w) greater than 10j.The cloud fraction (N) was obtained using the parameterization proposed by Kasten and
Czeplak (1980) (hereafter KC, see Section 3.1) and is defined as the fraction of the sky
dome covered by any type of cloud. The cloud type estimation was done through the
methodology proposed by Duchon and O’Malley (1999) (hereafter DM, see Section 3.2)
and then related to the CRF. The Sw (SwCRF) and Lw (LwCRF) CRFs were estimated
according to Bintanja and Van den Broeke (1996) (hereafter BV, Section 3.3).
3.1. Estimation of cloud fraction
The KC formula to retrieve the cloud fraction is
SwinðNÞSwinð0Þ
¼ 1� b1N
8
� �b2
ð5Þ
in its inverted form
N ¼ 1
b11� SwinðNÞ
Swinð0Þ
� �� �1=b2ð6Þ
where b1 and b2 are site-dependent coefficients, N is the cloud fraction that varies between
0 for clear-sky and 1 for overcast conditions, Swin(N) the measured global radiation, and
Swin(0) the global radiation that would reach the surface in clear-sky conditions. The latter
parameter is very difficult to retrieve and several studies are available in the literature (e.g.,
Battles et al., 2000; Niemela et al., 2001). In the present study, Swin(0) was computed
through the determination of the monthly typical-clear-sky atmospheric transmittance,
which is a two-step process. First, for every month, all the completely clear-sky days are
singled out, and subsequently the mean value of all data corresponding to the same hour of
the day are computed. The identification of clear-sky days is possible by observing the
images of the network camera and/or the daily Swin time series.
The total effective atmospheric transmission (s) was evaluated for all Swin measure-
ments as follows:
s ¼ Swin
SwinðTOAÞð7Þ
where Swin(TOA) is the Sw flux incident at TOA. The typical-clear-sky total atmospheric
transmission (sclear ) is then obtained as the mean value of all data corresponding to the
same hour of all clear-sky days.

C. Galli et al. / Atmospheric Research 72 (2004) 329–351 337
The value of Swin(TOA) depends only on astronomical factors:
SwinðTOAÞ ¼ ScosðUÞ ð8Þ
where S is the solar constant that depends on the Sun–Earth distance, and U is the solar
zenith angle. In our computation, we considered S constant and equal to 1372 W m� 2.
Finally, the typical-clear-sky incoming Sw flux was obtained with the following
formula:
Swinð0Þ ¼ SwinðTOAÞsclear ð9Þ
Again, the computation of Swin(0), and consequently of N, was done only for w greater
than 10j.The parameterization coefficients b1 and b2 of Eqs. (5) and (6) were 0.75 and 3.4,
respectively, in the original formula, whereas for SPC they were computed from the
network camera images. The cloud fraction was estimated from the sky images through the
algorithm developed by Nardino et al. (2002) and then related to the daily mean values of
the ratio Swin(N)/Swin(0) (see Fig. 4). The SPC best fit parameters b1 and b2 take the
values 0.99F 0.06 and 1.3F 0.1, respectively.
The KC’s formula inversion (6) was verified in other studies in the past (Orsini et al.,
2002; Nardino and Georgiadis, 2003) with satisfactory results in polar sites. Moreover, the
direct observations of the network camera images confirmed the reliability of the
parameterization in Eq. (6), especially considering daily mean values of N.
3.2. Estimation of cloud type
Duchon and O’Malley (1999) developed a methodology for the classification of cloud
types based on incoming global radiation measurements only. The cloud types and sky
Fig. 4. Scatterplot between the ratio of observed and clear-sky solar irradiance and the cloud fraction estimated via
the network camera images.

C. Galli et al. / Atmospheric Research 72 (2004) 329–351338
conditions categorized in the study are: cumulus, cirrus, cirrus and cumulus, stratus, fog
and/or precipitation, and no clouds (clear sky). For the present application, the fog and/or
precipitation class is not used.
The first step of the DM methodology consists on scaling the clear-sky irradiance,
Swin(0), to the constant value of 1400 W m� 2 for each measurement value of each day,
obtaining a day-dependent set of scale factors. The second step is to multiply the observed
Sw irradiance, Swin, by the set of scale factors corresponding to the considered day. The third
step is to compute the mean and standard deviation of the scaled measured irradiance in a 21-
min moving window. The ratio of the running mean scaled irradiance to the scaled clear-sky
irradiance (R) and the running standard deviation of scaled observed irradiance (A) are thetwo parameters used in the cloud-type decision criteria. The window of 21 min is an em-
pirical choice and in this paper a 30-min moving windowwas selected to retrieve cloud type.
The running means were computed with the 1-min Swin time series instead of the 10-
min one. Table 1 shows the thresholds used for the classification.
3.3. Computation of CRF
SwCRF and LwCRF were quantified through the BV method:
SwCRF ¼ N tSwnðovÞ � SwnðclÞb ð10Þ
LwCRF ¼ N tLwnðovÞ � LwnðclÞb
where N is the monthly or seasonal (depending on the type of analysis) mean value of the
cloud fraction and Swn(cl), Swn(ov), Lwn(cl) and Lwn(ov) are Sw and Lw radiation balances
in clear-sky and overcast conditions, respectively. These terms were computed from linear
best-fit equations interpolating the dependences of Swn and Lwn on N. Because LwCRF is
normally >0, clouds warm the surface in the Lw region, whereas they cool the surface in
the Sw region (SwCRF < 0).
4. Results and discussion
4.1. Radiative characterization of the measurement site
Fig. 5 shows the daily mean values of the surface radiation components and the
radiative balances for the whole measurement period. Note in graph (a) the enhancement
Table 1
Cloud types and thresholds of the two parameters used in the cloud type classification
Cloud types R (W m� 2) R
Cirrus 10 <A<80 0.8 <R < 1.05
Cumulus 120 <A<800 0.5 <R < 1.15
Cumulus + cirrus 100 <A<740 0.45 <R < 0.95
Stratus 0 <A<100 0 <R < 0.4
Clear sky 0 <A<10 0.88 <R < 1.05

Fig. 5. SPC daily mean values of (a) surface radiation components, and (b) Sw and Lw balance and net radiation.
C. Galli et al. / Atmospheric Research 72 (2004) 329–351 339
of Swin in spring and summer months due to its dependence on the solar elevation angle
and a corresponding rise of Lwout values that originates from the increase in surface
temperature. Moreover, an increase in air temperature causes a weak shift towards higher
values for the Lwin series in proximity of the spring and summer months.
Sw and Lw radiation balances, shown in Fig. 5b, have opposite sign: Swn is positive
whereas Lwn is negative and in general assumes lower (absolute) values than Swn; this
implies a radiative gain in the shortwave part of the spectrum and a loss in the infrared (IR)
one, due to lower atmospheric temperature compared to surface temperature.

C. Galli et al. / Atmospheric Research 72 (2004) 329–351340
The sign and magnitude of Swn and Lwn determine the available energy for the
nonradiative components (latent and sensible heat) of the surface energy balance that is the
net radiation balance Rn (shown in Fig. 5b). Note that in general SPC is characterized by
positive daily mean values of Rn, which means a daily positive radiative availability for
surface–atmosphere energy exchanges. This availability is low in winter months,
increases in spring and summer and assumes negative values only when the cloud cover
causes a decrease in net Sw radiation that is not balanced by the correspondent
enhancement of Lwn.
Fig. 6 shows the daily mean values of the albedo and the total atmospheric transmissivity.
The albedo generally ranges between 0.1 and 0.2, the typical interval for the grass-covered
surfaces, except for a few days in December 2001 and January 2002 that have been
characterized by snowfall events. On the other hand, the values of s show a high variability
due to its strong dependence on cloud cover properties and varies roughly between 0 and 0.8.
4.2. The cloud fraction
Fig. 7a shows the daily mean values of N computed through Eq. (6) for the whole
measurement period. Note the high variability of the cloud fraction, which is typical of
mid-latitude sites.
For a better understanding of the seasonal features of N, the cloud fraction range has
been divided into five classes: the occurrence of data of every N class for every season is
shown in Fig. 7b.
The winter has been characterized by roughly 50% of ‘‘middle-low’’ + ‘‘middle’’ N
values followed by the same number of events (about 20%) in the classes ‘‘low’’ and
‘‘middle-high’’. Note also that the winter was the season with the highest number of data
in the class 0.8–1.0.
Spring N values were 32% ‘‘low’’ and 28% ‘‘middle’’ whereas in summer the highest
number of ‘‘low’’ cover events was reached, roughly 40%.
In autumn 2002, the N class ‘‘middle’’ contains the majority of cases, and the
percentage of high N values is only slightly lower with respect to winter.
4.3. The influence of cloud fraction on the SRB
Fig. 8 shows the seasonal dependences of the SRB components on N. The data have
been fitted with a first-order polynomial curve in order to quantify the variation between
overcast and clear conditions of the SRB components in terms of W m� 2.
In the first row of Fig. 8, the daily mean values of Swn are plotted against N for all
seasons. The Sw balance always decreases with the increase of N but the slopes of the
linear fits present a remarkable inter-seasonal variability. The steepest slope corresponds to
summer (� 229 W m� 2), followed by spring (� 195 W m� 2) and autumn (� 177 W
m� 2); the winter slope is an order of magnitude lower than those of the other seasons.
Since the surface albedo is almost constant during the year, the Sw balance depends
mainly on Swin, which in cloudy conditions is determined by cloud optical properties.
The second row of Fig. 8 shows the scatterplots of Lwn vs. N. Note that in all seasons
the Lw balance increases with increasing N, as opposed to what happens to the Sw

Fig. 6. SPC daily mean values of (a) surface albedo, and (b) total atmospheric transmissivity.
C. Galli et al. / Atmospheric Research 72 (2004) 329–351 341
balance, and that the inter-seasonal variability of the slopes is lower than in the case of the
Swn slopes. The increase of Lwn with increasing N is mainly due to the direct emission of
cloud in the IR region, which leads to an increase in Lwin. The fact that the slopes are
generally lower than in the Swn case is attributable to the dependence of cloud radiative
properties on liquid water path (LWP). An increase in LWP causes an increase both in
cloud albedo and cloud Lw emissivity, but above a certain value of LWP the emissivity
reaches unity, whereas the cloud albedo can further increase with LWP (Stephens and
Webster, 1981).

Fig. 7. (a) SPC daily mean values of cloud fraction N, and (b) seasonal data percentage of cloud fraction
classes.
C. Galli et al. / Atmospheric Research 72 (2004) 329–351342
The effect of N on the net radiation is shown in the third row of Fig. 8. In winter, the
cloud fraction effect is almost negligible, with a slope of � 8 W m� 2, whereas in all the
other seasons the surface radiative availability decreases with increasing N. The slopes
show a seasonal dependence that is due both to the combination of Sw and Lw cloud
radiative properties and available solar energy. From these graphs, the Sw radiative cooling
is seen predominating on the Lw radiative heating in all seasons except in winter, in which
Sw and Lw cloud radiative effects balance out.
Table 2 summarizes the seasonal features of the influence of cloud fraction
on the SRB components and the variances explained by the linear fits shown in
Fig. 8.
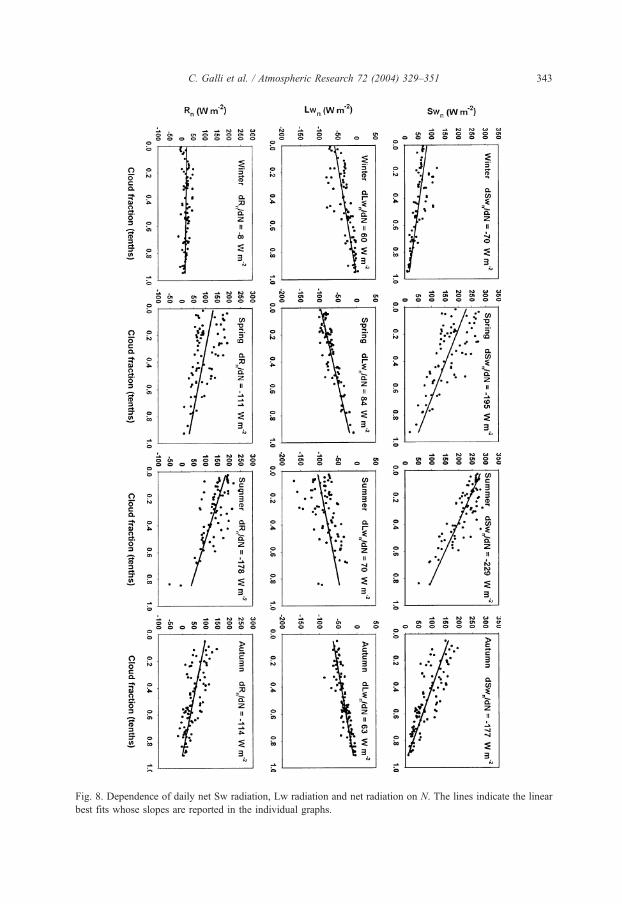
Fig. 8. Dependence of daily net Sw radiation, Lw radiation and net radiation on N. The lines indicate the linear
best fits whose slopes are reported in the individual graphs.
C. Galli et al. / Atmospheric Research 72 (2004) 329–351 343

Table 2
Seasonal variations of Swn, Lwn and net radiation as a function of N along with their variances
Season N dSwn/dN
(W m� 2)
r 2 dLwn/dN
(W m� 2)
r 2 dRn/dN
(W m� 2)
r 2
Winter 0.47 � 70F 8 0.52 60F 6 0.56 � 8F 6 0.01
Spring 0.37 � 195F 22 0.51 84F 5 0.78 � 111F 21 0.27
Summer 0.30 � 229F 16 0.72 70F 16 0.22 � 178F 21 0.51
Autumn 0.50 � 177F 13 0.68 63F 4 0.7 � 114F 12 0.51
C. Galli et al. / Atmospheric Research 72 (2004) 329–351344
4.4. Estimation of cloud type
Fig. 9 shows the monthly and seasonal cloud type classification based on the DM
methodology. From the monthly classification, the peak occurrence corresponds to cirrus
clouds in December, whereas in January and February the predominant cloud presence is
Fig. 9. (a) Monthly and (b) seasonal occurrence of cloud types.

C. Galli et al. / Atmospheric Research 72 (2004) 329–351 345
of stratiform clouds. The seasonal classification shows a predominance of stratus clouds,
but also a relevant number of cirrus cases.
March was characterized by the presence of cirrus, cumulus and cumulus + cirrus
whereas in April and May the cumulus clouds were the predominant cloud type. During
April and May also, the categories of stratus and cumulus + cirrus contain a relevant
number of cases. In the seasonal graph, the events are roughly equally distributed
between cirrus, cumulus and cirrus + cumulus classes. In the transition between winter
and spring, a decrease of stratus clouds was detected together with an increase of clear-sky
events.
Cirrus clouds were predominant in June, July and August but cumulus and cumu-
lus + cirrus are also relevant in July and August; this can also be inferred from the summer
classification. September, October and November show a decrease of cirrus clouds
occurrence and an increase in stratus cloud events that are the predominant cloud type
in the seasonal classification, together with the cumulus and the cumulus + cirrus classes.
4.5. Estimation of cloud radiative forcing
In Fig. 10, the monthly and seasonal scatterplots between Sw and Lw cloud radiative
forcing are reported (see Section 3.3 for the computation method). Note that the distance
of the symbols from the SwCRF=�LwCRF line represents the amount of the cooling or
warming (net CRF).
In December and January, the effect of clouds was roughly negligible whereas in
February clouds caused a slight cooling. On a seasonal point of view, in winter the net
CRF was nearly zero. Note also that the strong increase (in absolute value) in Sw and
LwCRF moving from December–January to February seems to indicate a change in cloud
radiative properties.
Spring was generally characterized by a negative net CRF as also indicated by the
single months, and an increase in absolute value of SwCRF is larger than LwCRF; this was
probably due to the increment of available solar radiation. The month with the greatest
cooling was May.
In summer, the effect of cloud was a net cooling of the surface, with a slight increase of
the cooling in August. The monthly differences in CRF concern mainly the Sw part of the
spectrum but they are smaller than in spring.
Among autumn months, September was characterized by the highest cooling. The
entity of the cooling decreases significantly moving from September to October and just a
little from October to November. The difference between September and October–
November is both in the Sw and in the Lw parts of the spectrum.
4.6. Discussion of the relationship between CRF and cloud type
Taking into account that the SwCRF has an annual/seasonal cycle, the monthly and
seasonal Sw cloud transmissivities (scloud) were computed in order to distinguish between
the effects of cloud type and solar insolation on CRF. Considering the linear fits reported
in Fig. 8, scloud have been computed as the ratio between Swn(ov) and Swn(cl) and the results
are reported in Fig. 11.

Fig. 10. (a) Monthly and (b) seasonal mean values of surface Sw and LwCRF.
C. Galli et al. / Atmospheric Research 72 (2004) 329–351346
Looking at Figs. 9 and 10, it can be seen that winter was characterized by the presence
of stratus and a net CRF near zero. Stratus clouds prevailed mainly in February (see
monthly graph in Fig. 9) where clouds slightly cooled the surface as shown in Fig. 10a and
had the lowest scloud value (see Fig. 11a). December was characterized by cirrus, a
negligible net CRF and a greater scloud with respect to February. January registered a
transition between the prevalent December cirrus cloud cover and stratus with a
correspondent net CRF value near zero. The increase of both SwCRF and LwCRF
between December and February is consistent with the change in cloud type, because
stratus are generally characterized by a lower Sw transmissivity and a higher LWC than
cirrus.

C. Galli et al. / Atmospheric Research 72 (2004) 329–351 347
In spring, the amount of stratus tended to decrease in favor mainly of cirrus, cumulus
and cirrus + cumulus; the net CRF indicated higher cooling. The change in SwCRF
between March and May can be mainly ascribed to an increase of available solar radiation,
but also to a slight change in Sw cloud properties, as shown in Fig. 11a, that displays a
decrease of scloud. In fact, during the transition between these two spring months, the
stratus occurrence increases while the cirrus one decreases (see Fig. 9a).
Among summer months, June was characterized by the highest number of cirrus, the
lowest total cooling effect, and the highest scloud. An intercomparison between June and
August seems to suggest that the increase in cumulus occurrence and the decrease in cirrus
one (Fig. 9a) caused a slight cooling effect (Fig. 10a) due mainly to the lower scloud of
cumulus than that of cirrus (see Fig. 11a). The seasonal effect of the predominance of
cirrus clouds (Fig. 9b) is an Sw cooling roughly equal and an Lw heating slightly lower
than that of spring. This result is consistent with the change in cloud type shown in Fig. 9b
that shows an increase in cirrus and a decrease in stratus occurrence in the transition
between spring and summer. The seasonal scloud values (Fig. 11b) confirm this hypothesis,
being the summer scloud greater than that of spring. Note also that the seasonal prevalence
of cirrus is consistent with a low cloud fraction as shown in Fig. 7b.
The transition between summer and autumn is characterized by a decrease of cirrus
presence and an increase in stratus one. Again the seasonal SwCRF shows an increase in
Fig. 11. (a) Monthly and (b) seasonal mean values of Sw cloud transmissivity.

C. Galli et al. / Atmospheric Research 72 (2004) 329–351348
absolute value caused by the strongly low value of autumn scloud. In the monthly graphs, it
can be noted a progressive increase of stratus occurrence, a decrease of both scloud and net
CRF and an increase of Lw heating. From the comparison of September with October–
November, differences in Sw and Lw radiative properties between cumulus and stratus
clouds are found, being cumulus characterized by a greater scloud and a lower LwCRF than
stratus.
An overall evaluation of these results seems to show that stratus clouds are character-
ized by a low net CRF, due to the balance between Sw and LwCRFs, while cumulus
clouds exert a stronger cooling effect.
In spite of the uncertainty of cloud type classification, the analysis points out that in
SPC during the period between 1 December 2001 and 30 November 2002 the effect of
cumulus clouds was a marked cooling of the surface whereas the effect of stratus was a
slight cooling. Cirrus clouds seem to have a slight warming effect that is not directly
visible, but can be inferred by the shift toward lower values of the net CRF (i.e. during
March and June months). This confirms previous studies, although carried out in Polar
sites, where a warming surface effect was observed during cirrus-like cloudiness events
(Nardino and Georgiadis, 2003; Stuhlmann, 1995; Stephens and Webster, 1981).
4.7. Climate classification and SRB hodograph
A climatic classification of the measurement site can be done following the method
proposed by Smith et al. (2002), based on the relationship between the SRB and the
region’s climate. The authors developed a set of parameters, such as mean net Lw flux and
Fig. 12. Annual trajectory of monthly mean values of Swn and �Lwn at the surface: December (black circle) and
November (black square).

C. Galli et al. / Atmospheric Research 72 (2004) 329–351 349
range of net Sw flux, which discriminate various climate classes on the basis of the surface
radiation.
According to the classification criteria of land regions, SPC falls in the temperate class
with annual mean Lwn (changed in sign) and Swn fluxes equal to 55 and 127 W m� 2,
respectively.
The yearly cycle of net Lw vs. Swn (SRB hodograph) for SPC is shown in Fig. 12. The
black circle corresponds to the month of December and the black square to November. The
points below the line Swn =�Lwn indicate a positive value of net radiation and negative
above the line.
Note that all points stay in the warming region of the graph. On a monthly mean, the
heat storage for land surfaces is small, so that the surplus is transferred to the atmosphere
as sensible or latent heat (Smith et al., 2002). The energetic availability is low in winter
months and increases in spring and summer, but it is always positive.
Finally, in spite of the cooling effect of clouds, SPC is always characterized by a
monthly energy surplus available for surface–atmosphere energetic exchanges.
5. Conclusions
The present study is based on 1 year of continuous measurements of the four surface
radiation components (Sw and Lw, incoming and outgoing radiation fluxes) at a mid-
latitude site of Northern Italy. The aim of the work was to investigate the effects of clouds
on surface radiation budget components using cloud fraction and cloud type to evaluate
cloud radiative forcing.
Results showed that in the period between 1 December 2001 and 30 November 2002
the net Sw balance always decreases and the net Lw balance always increases with
increasing cloud cover. The net radiation available at the surface decreases with increasing
N in all seasons except in winter, in which this dependence is negligible.
The analysis of the cloud radiative forcing indicates that all seasons were characterized
by a net cooling of the surface except winter, where clouds seem to have no effects on the
surface warming or cooling. Taking into account the dependence on solar radiation cycle,
an intercomparison between the retrieved cloud types seems to indicate that the effect of
stratus was a slight cooling whereas that of cumulus clouds was a stronger cooling of the
surface. On the contrary, cirrus clouds seem to have slight warming effect on the surface.
The annual trajectory of monthly mean values of Sw and Lw radiation balances showed
that the measurement site falls within the temperate class and that, in spite of the cooling
effect of clouds, SPC has an available monthly energy surplus during the year, which
enters the surface–atmosphere energy exchange mechanisms.
This kind of study can be very useful for the climatological monitoring of sites where
no observers are present and is relatively simple and straightforward since it is based on
the data collected by a simple four-components radiometer. The state-of-the-art radio-
meters are instruments characterized by good accuracy, minimum maintenance and
robustness, characteristics that recommend them also for extreme environmental con-
ditions. As regards to climate change issues, the simple observation of variations in the
slopes of the dependencies of SRBs on cloud fraction, the cloud type occurrence and/or the

C. Galli et al. / Atmospheric Research 72 (2004) 329–351350
Sw or LwCRF changes can be used as an early advice, because changes in cloud radiative
forcing reflect changes in surface temperature, surface albedo and cloud properties (Wang
and Key, 2003). The SRB hodograph is instrumental for the detection of SRB variations
since it allows for a direct comparison between cycles of consecutive years.
Acknowledgements
This work has been supported by Italian Space Agency (ASI) under the grant ‘‘Sinergia
GERB-SEVIRI nello studio del bilancio radiativo a scala regionale e locale’’.
Meteorological data from 1987 to 1991 were kindly supplied by the Emilia Romagna
Meteorological Service (ARPA-SMR, Bologna, Italy), whose personnel also contributed
essential data processing labor. Special thanks go to the CNR colleagues Ubaldo Bonafe,
Francescopiero Calzolari and Giuliano Trivellone for their invaluable help in solving
technical problems at the SPC site.
Finally, the authors wish to thank the two anonymous reviewers for their valuable
comments and suggestions.
References
Battles, F.J., Olmo, F.J., Tovar, J., Alados-Arboledas, L., 2000. Comparison of cloudless sky parameterizations of
solar irradiance at various Spanish midlatitude locations. Theor. Appl. Climatol. 66, 81–93.
Bintanja, R., Van den Broeke, M.R., 1996. The influence of clouds on the radiation budget of ice and snow
surfaces in Antartica and Greenland in summer. Int. J. Climatol. 16, 1281–1296.
Cess, R.D., Potter, G.L., Blanchet, J.P., Boer, G.J., Ghan, S.J., Kiehl, J.T., Le Treut, H., Li, Z.-X., Liang, X.-Z.,
Mitchell, J.F.B., Morcrette, J.-J., Randall, D.A., Riches, M.R., Roeckner, E., Schlese, U., Slingo, A., Taylor,
K.E., Washington, W.M., Wetherald, R.T., Yagai, I., 1989. Interpretation of cloud climate feedback as
produced by 14 atmospheric general circulation models. Science 245, 513–516.
Collins, M., Senior, C.A., 2002. Projections of future climate change. Weather 57, 283–287.
Dong, X., Mace, G.G., 2003. Arctic stratus cloud properties and radiative forcing derived from ground-based data
collected at Barrow, Alaska. J. Climate 16, 445–461.
Duchon, C.E., O’Malley, M.S., 1999. Estimating cloud type from pyranometer observations. J. Appl. Meteorol.
38, 132–141.
Duda, D.P., Minnis, P., Nguyen, L., 2001. Estimates of cloud radiative forcing in contrail clusters using GOES
imagery. J. Geophys. Res. 106, 4927–4937.
Hahn, C.J., Rossow, W.B., Warren, S.G., 2001. ISCCP cloud properties associated with standard cloud types
identified in individual surface observations. J. Climate 14, 11–28.
Haigh, J.D., 2002. Radiative forcing of climate change. Weather 57, 278–283.
Harrison, E.F., Minnis, P., Barkstrom, B.R., Ramanathan, V., Cess, R.D., Gibson, G.G., 1990. Seasonal var-
iation of cloud radiative forcing derived from the earth radiation budget experiment. J. Geophys. Res. 95,
18687–18703.
Inoue, T., Ackerman, S.A., 2002. Radiative effects of various cloud types as classified by the split window
technique over the eastern sub-tropical pacific derived from collocated ERBE and AVHRR data. J. Meteorol.
Soc. Jpn. 80, 1383–1394.
IPCC, 2001. Climate change 2001. The scientific basis. Third Assessment Report of the Intergovernmental Panel
on Climate Change (IPCC). Cambridge University Press, Cambridge.
Kasten, F., Czeplak, G., 1980. Solar and terrestrial radiation dependent on the amount and type of cloud. Sol.
Energy 24, 177–189.
Marty, Ch., Philipona, R., Frohlich, C., Ohmura, A., 2002. Altitude dependence of surface radiation fluxes and

C. Galli et al. / Atmospheric Research 72 (2004) 329–351 351
cloud forcing in the alps: results from the alpine surface radiation budget network. Theor. Appl. Climatol. 72,
137–155.
Nardino, M., Georgiadis, T., 2003. Cloud type and cloud cover effects on the surface radiative balance at several
polar sites. Theor. Appl. Climatol. 74, 203–215.
Nardino, M., Bonafe, U., Calzolari, F., Galli, C., Georgiadis, T., Levizzani, V., Rossi, F., 2002. A study on the
influence of cloud coverage on the surface radiation budget. National Conference, International Geosphere
Biosphere Programme (IGBP), Paestum (Salerno, Italy), 14–16 November.
Niemela, S., Raisanen, P., Savijarvi, H., 2001. Comparison of surface radiative flux parameterizations: Part II.
Shortwave radiation. Atmos. Res. 58, 141–154.
Orsini, A., Tomasi, C., Calzolari, F., Nardino, M., Cacciari, A., Georgiadis, T., 2002. Cloud cover classification
through simultaneous ground-based measurements of solar and infrared radiation. Atmos. Res. 61, 251–275.
Peixoto, J.P., Oort, A.H., 1992. Physics of climate. AIP Press and Springer Verlag, New York.
Pielke Sr., R.A., Avissar, R., Raupach, M., Dolman, J., Zeng, X., Denning, A.S. 1998. Interactions between the
atmosphere and terrestrial ecosystems: influence on weather and climate. Glob. Chang. Biol. 4, 461–475.
Sassen, K., Comstock, J.M., 2001. A midlatitude cirrus cloud climatology from the facility for atmospheric
remote sensing: Part III. Radiative properties. J. Atmos. Sci. 58, 2113–2127.
Senior, C.A., Mitchell, J.F.B., 1993. Carbon dioxide and climate: the impact of cloud parameterization. J. Climate
6, 393–418.
Smith, G.L., Wilber, A.C., Gupta, S.K., Stackhouse Jr., P.W. 2002. Surface radiation budget and climate clas-
sification. J. Climate 15, 1175–1188.
Stephens, G.L., Webster, P.J., 1981. Clouds and climate: sensitivity of simple systems. J. Atmos. Sci. 38,
235–247.
Stuhlmann, R., 1995. The impact of clouds on the radiative heating of the Earth surface–atmosphere system
determined from satellite data. Adv. Space Res. 16, 1037–1049.
Su, W., Mao, J., Ji, F., Qin, Y., 2000. Outgoing longwave radiation and cloud radiative forcing of the Tibetan
Plateau. J. Geophys. Res. 105, 14863–14872.
Tarasova, T.A., Cavalcanti, I.F.A., 2002. Monthly mean solar radiative fluxes and cloud forcing over South
America in the period of 1986–88: GCM results and satellite-derived data. J. Appl. Meteorol. 41, 863–871.
Tian, B., Ramanathan, V., 2002. Role of tropical clouds in surface and atmospheric energy budget. J. Climate 15,
296–305.
Tomozeiu, R., Busuioc, A., Marletto, V., Zinoni, F., Cacciamani, C., 2000. Detection of changes in the summer
precipitation time series of the region Emilia-Romagna, Italy. Theor. Appl. Climatol. 67, 193–200.
Tomozeiu, R., Lazzeri, M., Cacciamani, C., 2002a. Precipitation fluctuations during the winter season from 1960
to 1995 over Emilia-Romagna, Italy. Theor. Appl. Climatol. 72, 221–229.
Tomozeiu, R., Pavan, V., Cacciamani, C., di Lorenzo, M., 2002b. Cambiamenti termici in Emilia-Romagna.
ARPA Riv. 6, 58–59.
Wang, X., Key, J.R., 2003. Recent trends in arctic surface, cloud, and radiation properties from space. Science 299,
1725–1728.
Webster, P.J., Stephens, G.L., 1983. Cloud-radiation interaction and the climate problem. In: Houghton, J.T.
(Ed.), The Global Climate. Cambridge University Press, Cambridge, pp. 63–78.