Net radiative forcing due to changes in regional emissions of tropospheric ozone precursors
17
Net radiative forcing due to changes in regional emissions of tropospheric ozone precursors Vaishali Naik, 1 Denise Mauzerall, 1,3 Larry Horowitz, 2 M. Daniel Schwarzkopf, 2 V. Ramaswamy, 2 and Michael Oppenheimer 1,3 Received 22 February 2005; revised 15 September 2005; accepted 6 October 2005; published 24 December 2005. [1] The global distribution of tropospheric ozone (O 3 ) depends on the emission of precursors, chemistry, and transport. For small perturbations to emissions, the global radiative forcing resulting from changes in O 3 can be expressed as a sum of forcings from emission changes in different regions. Tropospheric O 3 is considered in present climate policies only through the inclusion of indirect effect of CH 4 on radiative forcing through its impact on O 3 concentrations. The short-lived O 3 precursors (NO x , CO, and NMHCs) are not directly included in the Kyoto Protocol or any similar climate mitigation agreement. In this study, we quantify the global radiative forcing resulting from a marginal reduction (10%) in anthropogenic emissions of NO x alone from nine geographic regions and a combined marginal reduction in NO x , CO, and NMHCs emissions from three regions. We simulate, using the global chemistry transport model MOZART-2, the change in the distribution of global O 3 resulting from these emission reductions. In addition to the short-term reduction in O 3 , these emission reductions also increase CH 4 concentrations (by decreasing OH); this increase in CH 4 in turn counteracts part of the initial reduction in O 3 concentrations. We calculate the global radiative forcing resulting from the regional emission reductions, accounting for changes in both O 3 and CH 4 . Our results show that changes in O 3 production and resulting distribution depend strongly on the geographical location of the reduction in precursor emissions. We find that the global O 3 distribution and radiative forcing are most sensitive to changes in precursor emissions from tropical regions and least sensitive to changes from midlatitude and high-latitude regions. Changes in CH 4 and O 3 concentrations resulting from NO x emission reductions alone produce offsetting changes in radiative forcing, leaving a small positive residual forcing (warming) for all regions. In contrast, for combined reductions of anthropogenic emissions of NO x , CO, and NMHCs, changes in O 3 and CH 4 concentrations result in a net negative radiative forcing (cooling). Thus we conclude that simultaneous reductions of CO, NMHCs, and NO x lead to a net reduction in radiative forcing due to resulting changes in tropospheric O 3 and CH 4 while reductions in NO x emissions alone do not. Citation: Naik, V., D. Mauzerall, L. Horowitz, M. D. Schwarzkopf, V. Ramaswamy, and M. Oppenheimer (2005), Net radiative forcing due to changes in regional emissions of tropospheric ozone precursors, J. Geophys. Res., 110, D24306, doi:10.1029/2005JD005908. 1. Introduction [2] The long-term objective of the United Nations Frame- work Convention on Climate Change (UNFCCC), stated in Article 2 of the accord, is to stabilize greenhouse gas concentrations in the atmosphere at a level that would prevent dangerous anthropogenic interference with the climate system. To achieve this goal, a multitude of policies and measures that cover relevant sources, sinks and reser- voirs of greenhouse gases need to be considered. The Kyoto Protocol to the UNFCCC, adopted in 1997, sets binding targets for the sum of emissions of carbon dioxide (CO 2 ), methane (CH 4 ), nitrous oxide (N 2 O), hydrofluorocarbons (HFCs), perfluorocarbons (PFCs), and sulfur hexafluoride (SF 6 ) weighted by the Global Warming Potentials (GWPs) of each gas using a 100 year time horizon. Because of their long lifetimes, these greenhouse gases are well mixed in the atmosphere, and their direct effects on the Earth’s radiative balance are well quantified and understood with a high level of precision [Ramaswamy et al., 2001]. Other human- influenced chemical species in the atmosphere are not well mixed but nevertheless contribute a significant radiative forcing either directly or through their effects on other JOURNAL OF GEOPHYSICAL RESEARCH, VOL. 110, D24306, doi:10.1029/2005JD005908, 2005 1 Woodrow Wilson School of Public and International Affairs, Princeton University, Princeton, New Jersey, USA. 2 Geophysical Fluid Dynamics Laboratory, NOAA, Princeton, New Jersey, USA. 3 Department of Geosciences, Princeton University, Princeton, New Jersey, USA. Copyright 2005 by the American Geophysical Union. 0148-0227/05/2005JD005908$09.00 D24306 1 of 14
-
Upload
independent -
Category
Documents
-
view
2 -
download
0
Transcript of Net radiative forcing due to changes in regional emissions of tropospheric ozone precursors

Net radiative forcing due to changes in regional emissions of
tropospheric ozone precursors
Vaishali Naik,1 Denise Mauzerall,1,3 Larry Horowitz,2 M. Daniel Schwarzkopf,2
V. Ramaswamy,2 and Michael Oppenheimer1,3
Received 22 February 2005; revised 15 September 2005; accepted 6 October 2005; published 24 December 2005.
[1] The global distribution of tropospheric ozone (O3) depends on the emission ofprecursors, chemistry, and transport. For small perturbations to emissions, the globalradiative forcing resulting from changes in O3 can be expressed as a sum of forcings fromemission changes in different regions. Tropospheric O3 is considered in present climatepolicies only through the inclusion of indirect effect of CH4 on radiative forcing throughits impact on O3 concentrations. The short-lived O3 precursors (NOx, CO, and NMHCs)are not directly included in the Kyoto Protocol or any similar climate mitigationagreement. In this study, we quantify the global radiative forcing resulting from a marginalreduction (10%) in anthropogenic emissions of NOx alone from nine geographic regionsand a combined marginal reduction in NOx, CO, and NMHCs emissions from threeregions. We simulate, using the global chemistry transport model MOZART-2, the changein the distribution of global O3 resulting from these emission reductions. In addition to theshort-term reduction in O3, these emission reductions also increase CH4 concentrations(by decreasing OH); this increase in CH4 in turn counteracts part of the initial reduction inO3 concentrations. We calculate the global radiative forcing resulting from the regionalemission reductions, accounting for changes in both O3 and CH4. Our results showthat changes in O3 production and resulting distribution depend strongly on thegeographical location of the reduction in precursor emissions. We find that the global O3
distribution and radiative forcing are most sensitive to changes in precursor emissionsfrom tropical regions and least sensitive to changes from midlatitude and high-latituderegions. Changes in CH4 and O3 concentrations resulting from NOx emission reductionsalone produce offsetting changes in radiative forcing, leaving a small positive residualforcing (warming) for all regions. In contrast, for combined reductions of anthropogenicemissions of NOx, CO, and NMHCs, changes in O3 and CH4 concentrations result ina net negative radiative forcing (cooling). Thus we conclude that simultaneous reductionsof CO, NMHCs, and NOx lead to a net reduction in radiative forcing due to resultingchanges in tropospheric O3 and CH4 while reductions in NOx emissions alone do not.
Citation: Naik, V., D. Mauzerall, L. Horowitz, M. D. Schwarzkopf, V. Ramaswamy, and M. Oppenheimer (2005), Net radiative
forcing due to changes in regional emissions of tropospheric ozone precursors, J. Geophys. Res., 110, D24306,
doi:10.1029/2005JD005908.
1. Introduction
[2] The long-term objective of the United Nations Frame-work Convention on Climate Change (UNFCCC), stated inArticle 2 of the accord, is to stabilize greenhouse gasconcentrations in the atmosphere at a level that wouldprevent dangerous anthropogenic interference with the
climate system. To achieve this goal, a multitude of policiesand measures that cover relevant sources, sinks and reser-voirs of greenhouse gases need to be considered. The KyotoProtocol to the UNFCCC, adopted in 1997, sets bindingtargets for the sum of emissions of carbon dioxide (CO2),methane (CH4), nitrous oxide (N2O), hydrofluorocarbons(HFCs), perfluorocarbons (PFCs), and sulfur hexafluoride(SF6) weighted by the Global Warming Potentials (GWPs)of each gas using a 100 year time horizon. Because of theirlong lifetimes, these greenhouse gases are well mixed in theatmosphere, and their direct effects on the Earth’s radiativebalance are well quantified and understood with a high levelof precision [Ramaswamy et al., 2001]. Other human-influenced chemical species in the atmosphere are not wellmixed but nevertheless contribute a significant radiativeforcing either directly or through their effects on other
JOURNAL OF GEOPHYSICAL RESEARCH, VOL. 110, D24306, doi:10.1029/2005JD005908, 2005
1Woodrow Wilson School of Public and International Affairs, PrincetonUniversity, Princeton, New Jersey, USA.
2Geophysical Fluid Dynamics Laboratory, NOAA, Princeton, NewJersey, USA.
3Department of Geosciences, Princeton University, Princeton, NewJersey, USA.
Copyright 2005 by the American Geophysical Union.0148-0227/05/2005JD005908$09.00
D24306 1 of 14
radiatively active species. Currently, no climate targets havebeen set for emissions of these species primarily because ofthe complexity in estimating their global distributions andtheir climate forcing. Tropospheric ozone (O3), a directgreenhouse gas and an air pollutant, is a key example. O3
is not directly emitted and its production depends non-linearly on the emissions of its precursors (CH4, nitrogenoxides (NOx), carbon monoxide (CO), and nonmethanehydrocarbons (NMHCs)), making it difficult to determinethe exact amount a country is responsible for producing. O3
and its short-lived precursors (NOx, CO, and NMHCs)modify the lifetime of CH4 by controlling the oxidativecapacity of the atmosphere through reactions that produceand consume hydroxyl radical (OH). NOx, CO and someNMHCs are regulated through national air quality programsand regionally under the Convention on Long-range Trans-boundary Air Pollution (LRTAP). The radiative effect of O3
is partly included in the GWP for CH4, however, O3 and itsshort-lived precursors are not directly regulated in a climatemitigation agreement.[3] Measurements and modeling studies have shown that
O3 concentrations have increased significantly since prein-dustrial times resulting in a radiative forcing similar to thatdue to the increase in CH4 concentration albeit with agreater uncertainty [Ramaswamy et al., 2001]. Approxi-mately 20% of the present CH4 radiative forcing sincepreindustrial times is attributed to enhanced levels of O3
associated with photochemical production from CH4. Theuncertainty in total O3 forcing is mostly due to uncertaintiesin the preindustrial O3 level and its present distributionrather than to factors related to radiative transfer as theradiative properties of O3 are understood as well as those ofCO2, CH4, N2O, and the CFCs [Berntsen et al., 2000;Gauss et al., 2003].[4] The radiative forcing due to a long-lived greenhouse
gas does not vary significantly (on a per molecule basis)with the location of its emissions. Therefore emissioninventories that identify the quantity of each long-livedgas emitted by a particular country are sufficient to assignresponsibility to that country for the forcing caused by itsemissions. This is, however, not the case for troposphericO3, a secondary pollutant that is formed photochemically inthe atmosphere. The lifetime of O3, ranging from days tomany weeks, is shorter than the mixing time of severalmonths in the troposphere, resulting in a nonuniformdistribution in space and time. The short lifetimes of O3
precursors and the nonlinear dependence of O3 productionon precursor concentrations, particularly NOx, add to thespatial and temporal variability in O3 and make it difficult toquantify each country’s contribution to the troposphericO3 burden. Furthermore, the radiative forcing due to O3
depends on its vertical distribution, with changes in O3
concentration near the tropopause resulting in the greatestradiative forcing efficiency on a per molecule basis [Wanget al., 1980; Lacis et al., 1990; Wang et al., 1993; Forsterand Shine, 1997]. Regional differences in chemical andmeteorological conditions have also been shown to causestrong variations in radiative forcing from O3 [Berntsen etal., 1996; Haywood et al., 1998; Fuglestvedt et al., 1999;Mickley et al., 1999; Wild et al., 2001; Berntsen et al.,2005a]. Attributing responsibility to specific countries forradiative forcing resulting from emissions of tropospheric
O3 precursors is thus not as straightforward as it is for thedirect emission of long-lived greenhouse gases, becausethe radiative forcing depends both on the location ofthe precursor emissions as well as on where the O3 isformed and transported. In addition, previous modelingstudies have shown that the climate sensitivity to a givenradiative forcing due to a change in O3 may not be the sameas for radiative forcing due to a change in CO2 [Hansen etal., 1997; Joshi et al., 2003].[5] Recent discussions have focused on whether non-CO2
greenhouse agents, including O3 and aerosols, should beincluded in a greenhouse control strategy for climate mit-igation benefits [Derwent et al., 2001; Holloway et al.,2003; Swart et al., 2004; Rypdal et al., 2005]. Hansen et al.[2000] have noted the importance of short-lived non-CO2
greenhouse species in slowing global warming and sug-gested focusing on air pollutants, especially aerosols andtropospheric O3, to gain dual benefits from air pollution andclimate change mitigation. Including O3 in a comprehensiveclimate treaty would require knowledge of the contributionof each country or region’s emissions to the global O3
concentration as well as the corresponding radiative forcing.Initial efforts have been undertaken to understand andquantify these contributions. For example, Fuglestvedt etal. [1999] investigated the response of O3 concentration andits radiative forcing due to a 20% reduction in anthropo-genic NOx emissions from a few selected geographicalregions. The study demonstrated that upper troposphericO3 concentrations and the resulting O3 radiative forcing aremore sensitive to NOx reductions in Southeast Asia than inmidlatitude and high-latitude regions including Europe,Scandinavia, and the USA. Berntsen et al. [2005a] analyzedthe impact of changes in emissions of NOx and COindividually from two regions – Europe and SoutheastAsia – and showed that the global O3 burden and itsradiative forcing are more sensitive to emission changesfrom Southeast Asia than from Europe. Some studies haveexamined the indirect effects of regional NOx emissions onCH4 through changes in the oxidative capacity of theatmosphere and show that the radiative forcings resultingfrom changes in O3 and CH4 nearly offset each other; thesign of the remaining net forcing, however, depends on theregion of precursor emission reduction [Fuglestvedt et al.,1999; Wild et al., 2001; Berntsen et al., 2005a].[6] Since emissions of O3 precursors from Asian
countries (East Asia, Southeast Asia, the Indian Subconti-nent) are rising and may continue to rise for several decades,and emissions from Africa and South America may increasein the future because of economic growth [Akimoto, 2003],we must carefully evaluate each continent/region’s contri-bution to tropospheric O3 distributions and resulting climateforcing before including O3 or any other short-lived speciesin a climate mitigation treaty. Improved air quality fromreduced tropospheric O3 and its precursor emissions willalso benefit human health and ecosystems in addition tomitigating climate change.[7] In this study, we investigate the sensitivity of global
O3 and CH4 burdens and forcings to marginal reductions inregional anthropogenic surface NOx emissions alone andNOx, CO, and NMHCs emissions together from majorgeographic regions. We first examine NOx emissions aloneas NOx is the primary limiting catalyst for O3 production
D24306 NAIK ET AL.: NET RADIATIVE FORCING DUE TO TROPOSPHERIC O3
2 of 14
D24306

[Lin et al., 1988], and it is possible to reduce NOx emissionsfrom anthropogenic sources without significantly affectingother precursors [Heinsohn and Kabel, 1999]. We alsoexamine marginal reductions in the combined emissionsof surface anthropogenic NOx, CO, and NMHCs, becausethis provides an estimate of the effect of controls on thesuite of O3 precursors. In a series of a three-dimensionalglobal chemical transport model (CTM) perturbation simu-lations we quantify the change in tropospheric O3 burden,first, due to a 10% reduction in surface anthropogenic NOx
emissions from Africa, Australia, East Asia, Europe, theFormer Soviet Union, the India subcontinent, North Amer-ica, South America, and Southeast Asia, and second, due toa combined 10% reduction in surface anthropogenic emis-sions of NOx, CO, and NMHCs from Europe, NorthAmerica and Southeast Asia. We select these three regionsto represent the distinct meteorological and chemical con-ditions associated with extratropical and tropical latitudesand the magnitude of emissions ranging from highest (NorthAmerica) to lowest (Southeast Asia). We estimate theradiative forcing due to the change in tropospheric O3
concentration resulting from each of the CTM perturbationsimulations using a radiative transfer model (RTM). We donot consider perturbations in anthropogenic emissions ofCH4, although CH4 is an O3 precursor. Instead we quantifythe increase in CH4 abundance and its radiative forcing as aresult of decreases in NOx, CO, and NMHCs emissions.[8] Our objective is to quantify the net effect on global
radiative forcing of a marginal reduction in anthropogenicemissions of O3 precursors from each region of the world.These radiative forcings would be useful to compare theclimate impact of O3 precursors with that of CO2 and wouldprovide policymakers with a basis for crediting countries forreducing their emissions of O3 precursors, therefore lessen-ing their impact on climate while simultaneously improvinglocal and regional air quality. Section 2 of this paperdescribes the global three-dimensional CTM, MOZART-2,and the global radiative transfer model. In section 3, wedescribe the model simulations performed for the analysis.Section 4 presents results from MOZART-2 and RTMcalculations. Uncertainties and policy implications of ourresults are discussed in section 5. Finally, we presentconclusions in section 6.
2. Model Description
2.1. MOZART-2
[9] We use the global three-dimensional chemical trans-port model, Model for Ozone and Related Tracers version2 (MOZART-2) [Horowitz et al., 2003], to simulate thechanges in tropospheric O3 concentration resulting from a10% reduction in continental anthropogenic emissions,either of NOx alone, or of combined NOx, CO andNMHCs. MOZART-2 simulates the distribution of 63chemical species from the surface to the lower strato-sphere (4 mb) with a horizontal resolution of 2.8� latitude� 2.8� longitude with 34 hybrid vertical levels, using atime step of 20 minutes for all chemical and transportprocesses. In this study, we drive MOZART-2 withmeteorological variables from the middle atmosphereversion of the Community Climate Model (MACCM3)archived every 3 hours. A full description and evaluation
of the version of MOZART-2 used here are given byHorowitz et al. [2003].[10] Built on the framework of the transport model
MATCH (Model of Atmospheric Transport and Chemistry[Rasch et al., 1997], MOZART-2 accounts for advection,convection, boundary layer transport, surface emissions,photochemistry, and wet and dry deposition. The flux-formsemi-Lagrangian advection scheme of Lin and Rood [1996]is used for tracer transport. Convective mass fluxes arerediagnosed using the Hack [1994] scheme for shallow andmidlevel convection and the Zhang and McFarlane [1995]scheme for deep convection. Studies have demonstrated thatchanges in ozone concentration near the tropopause result inthe greatest greenhouse forcing efficiency on a per moleculebasis [Wang et al., 1980; Lacis et al., 1990; Wang et al.,1993; Forster and Shine, 1997]. The vertical distribution ofozone and its precursors, particularly short-lived NOx spe-cies, is determined to a large extent by convective transportof surface pollutants from the boundary layer to the uppertroposphere on short (hourly) timescales. Therefore, toevaluate the sensitivity of global radiative forcing to re-gional air pollution, it is important to accurately representconvective transport. The combination of the Hack [1994]and Zhang and McFarlane [1995] schemes have beenshown to provide a realistic transport of trace species fromthe surface to the upper troposphere [Rasch et al., 2003].[11] In MOZART-2 the stratospheric concentration of
O3 is constrained above the local thermal tropopause(defined by a lapse rate of 2 K km�1) by relaxationtoward observed O3 climatologies [Randel et al., 1998;Logan, 1999]. Surface emissions of chemical species aretaken from the MOZART-2 emission inventory used byHorowitz et al. [2003] which is intended to represent theearly 1990s. Surface emissions of NOx include emissionsfrom fossil fuel burning and other industrial activities,biofuel combustion (including fuelwood burning), bio-mass burning, and biogenic emissions from vegetationand soils. NOx emissions from fossil fuel and biofuelcombustion are based on the Emission Database forGlobal Atmospheric Research (EDGAR) v2.0 inventory[Olivier et al., 1996]. The global total NOx emission is40.8 Tg N/yr with fossil fuel combustion and industrialactivities contributing 23.1 Tg N/yr and biofuel consump-tion resulting in 1.3 Tg N/yr. MOZART-2 also includesaircraft and lightning emissions of NOx accounting for0.67 Tg N/yr and 3.0 Tg N/yr, respectively. MOZART-2simulates the emissions and chemical losses of CH4;however, the adjustment timescale for CH4 is sufficientlylong (approximately 12 years) that CH4 does not reach anew steady state within the 2-year simulations conductedhere. CH4 concentrations are thus sensitive to the initialconditions used, which are from a previous simulation ofMOZART and agree reasonably with observations. Thelonger-term adjustment of CH4, dominated by the tropo-spheric ‘‘primary mode,’’ is treated in section 4.2.[12] MOZART-2 driven by MACCM3 climatology has
been extensively evaluated by comparing results withobservations from ozonesondes, aircraft, and surface-monitoring stations and has been shown to simulate theconcentrations of tropospheric O3 and its precursors rea-sonably well [Horowitz et al., 2003]. A realistic simulationof the distribution of NOx is particularly important for this
D24306 NAIK ET AL.: NET RADIATIVE FORCING DUE TO TROPOSPHERIC O3
3 of 14
D24306
study because of the nonlinear photochemistry. Comparisonof model-simulated vertical profiles of NOx concentrationswith observations from field aircraft campaigns show thatMOZART-2 simulates NOx very well at almost all locations,over a range of concentrations spanning several orders ofmagnitude [Horowitz et al., 2003].
2.2. GFDL Radiative Transfer Model
[13] Radiative forcing from simulated changes in ozoneconcentration due to a 10% reduction in regional anthropo-genic emissions of O3 precursors is calculated using theGeophysical Fluid Dynamics Laboratory (GFDL) globalthree-dimensional radiative transfer model (RTM). TheRTM is a component of the new global atmosphere (AM2)and land surface model (LM2) developed at the GFDL forclimate research [GFDL Global Atmospheric Model Devel-opment Team, 2004]. The RTM performs solar and terrestrialradiative transfer calculations. The solar radiative transferalgorithm follows the two-stream d-Eddington multiple bandparameterization of Freidenreich and Ramaswamy [1999].The solar spectrum ranges from0.2 to 4 mmand is divided into18 bands to account for the absorption by CO2, H2O, O2, andO3, molecular scattering, and scattering and absorption byaerosols and clouds. Results from the solar radiation codehave been tested against benchmark calculations using theHITRAN catalogue and the maximum error in the clear-skyheating rates is less than 10% [Freidenreich andRamaswamy,1999]. The terrestrial radiative algorithm is based on themodified version of the Simplified Exchange Approximation(SEA) method developed and evaluated by Schwarzkopf andRamaswamy [1999]. The terrestrial spectrum ranges from4.55 mm to 1 to account for the absorption and emission bymajor atmospheric gases, including H2O, CO2, N2O, O3,CH4, and the halocarbons CFC-11, CFC-12, CFC-113 andHCFC-22. Absorption by aerosols and clouds in the long-wave is also considered.[14] In previous studies, the RTM has been used to assess
the radiative forcing due to both well-mixed greenhousegases [Schwarzkopf and Ramaswamy, 1999] and short-lived forcing agents (O3 and aerosols) [Haywood andRamaswamy, 1998; Haywood et al., 1998]. In addition,Haywood et al. [1998] show that the radiative forcing due tohuman-induced changes in tropospheric O3 calculated usingthe off-line RTM and the full GCM are in reasonableagreement, suggesting that monthly mean climate variablesmay be used without introducing significant biases in thecalculated radiative forcings.
[15] In the present study, the RTMsimulations use archivedmeteorological fields including insolation, temperature, spe-cific humidity, cloud amount, and surface reflectance that aresimulated by AM2/LM2 for the early 1990s. The RTM is runfor each grid column of AM2/LM2, which has a horizontalresolution of 2.5� longitude � 2� latitude with 24 verticallevels from the surface to 3 mb. Random cloud overlap isassumed in the model. Concentrations of the well-mixedgreenhouse gases are set at values typical of the early1990s. The tropopause is assumed to vary linearly withlatitude from a pressure of 100 mb at the equator to 300 mbat the poles and is zonally invariant (‘‘linear tropopause’’).
3. Numerical Simulations
3.1. O3 Concentration Simulations
[16] We perform a ‘‘base case’’ simulation of MOZART-2with the standard emission inventory described earlier toobtain a reference chemical state. Similarly, we perform aseries of perturbation simulations described below thatprovide a quantitative estimate of the O3 changes resultingfrom potentially feasible reductions in regional emissions ofanthropogenic NOx or combined NOx, CO, and NMHCsemissions. All simulations are run for 25 months and resultsfor the last 12 months are used for analysis.[17] We perform MOZART-2 simulations in which sur-
face anthropogenic NOx emissions from each of the nineregions shown in Figure 1 are reduced by 10%. Similarly,we perform MOZART-2 simulations with combined anthro-pogenic emissions of NOx plus CO and NMHCs reduced by10% for Europe, North America and Southeast Asia.Because of computational constraints, we limit our analysisfor combined NOx, CO, and NMHC reductions to thesethree regions that represent the distinct meteorological andchemical conditions associated with extratropical and trop-ical latitudes. Previous modeling studies have suggested thata 10% perturbation in NOx emissions is small enough toavoid significant nonlinear chemical influence on O3 pro-duction and large enough to produce a measurable responsein O3 [Wild and Akimoto, 2001; Kunhikrishnan andLawrence, 2004]. The difference between the global O3
distributions in a perturbation simulation and the base caseindicates the effect of reductions in a region’s precursoremissions. Each region’s anthropogenic NOx emissions inthe base case is presented in column 2 of Table 1a andanthropogenic CO and NMHC emissions are presented incolumns 2 and 3 of Table 1b, respectively. The highest
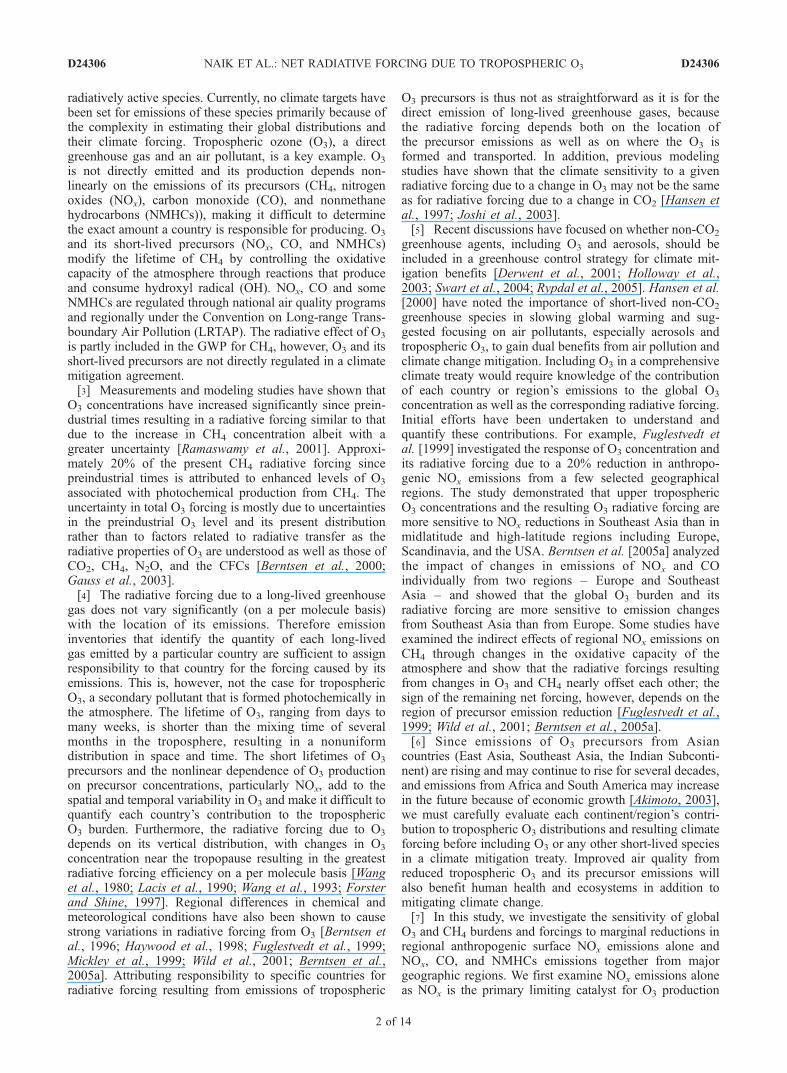
Figure 1. Map of the world showing nine regions where anthropogenic NOx emissions are reduced by10% for this study. See color version of this figure at back of this issue.
D24306 NAIK ET AL.: NET RADIATIVE FORCING DUE TO TROPOSPHERIC O3
4 of 14
D24306
anthropogenic NOx emissions are from North America(NA) while the lowest are from Australia (AU). Sinceemissions from each of these regions are reduced by 10%from the base emissions in the perturbation simulations, themagnitudes of reduction vary across the regions.
3.2. Radiative Flux Calculations
[18] Since MOZART-2 does not simulate O3 concentra-tion changes in the stratosphere, monthly mean troposphericO3 concentrations for the base and perturbed simulationsdescribed above are merged with the observed stratosphericO3 values for 1990 (data compiled from SAGE I + II andozonesondes by W. Randel (personal communication,2004)) and then interpolated to the RTM horizontal andvertical grid. The O3 concentrations are thus only allowed tovary below the linear tropopause and any changes that occurabove the linear tropopause are neglected in the RTM. Thebase and perturbed O3 distributions are used to performRTM simulations with meteorological fields from AM2/LM2 sampled for one day per month at midmonth torepresent monthly mean conditions. The monthly meannet irradiance (solar and terrestrial) at the tropopause iscalculated for the base and perturbed O3 distributions.‘‘Instantaneous’’ radiative forcings are calculated as thedifference in the net irradiance at the tropopause betweenthe perturbed case and the base case. ‘‘Instantaneous’’ hereimplies that we do not allow the stratospheric temperature toadjust to equilibrium after perturbing the surface-tropo-sphere energy budget to account for the changes in theinfrared emission from the stratosphere to the troposphere inthe radiative forcing [Intergovernmental Panel on ClimateChange (IPCC), 1995; Fuglestvedt et al., 2003]. For some
climate mechanisms, such as changes in stratosphericozone, the distinction between adjusted and instantaneousradiative forcing is crucial as they can be of opposite signs[Fuglestvedt et al., 2003]. For changes in tropospheric O3,Haywood et al. [1998] show that stratospheric adjustmentwill reduce the instantaneous radiative forcing by onlyabout 10%. Since any changes in O3 that occur above thelinear tropopause are neglected in our MOZART-2 andRTM simulations (see above), stratospheric adjustment islikely to make only a small difference in our results and isunlikely to change the sign of instantaneous radiativeforcing calculated here.
4. Results
4.1. Ozone Perturbations Resulting From RegionalEmission Reductions
4.1.1. Effect of Anthropogenic NOx Emission Reduction[19] Reduced emissions of NOx, the limiting catalyst in
O3 production in the free troposphere and the marineboundary layer, cause a reduction in O3 concentration inall but urban areas and high-NOx plumes. The magnitudeand spatial distribution of the O3 reduction, however, varieswith season, the region from which NOx emissions arereduced and the background levels of NOx, CO andNMHCs. The vertical distribution of the annual mean O3
reduction depends on the dynamical regime of the regionfrom which the emissions are reduced (Figure 2). NOx
reductions from tropical regions, including Southeast Asia,the Indian subcontinent, and East Asia result in pronouncedO3 reductions (75–150 pptv) in the middle to uppertroposphere that are largely confined to the latitude range
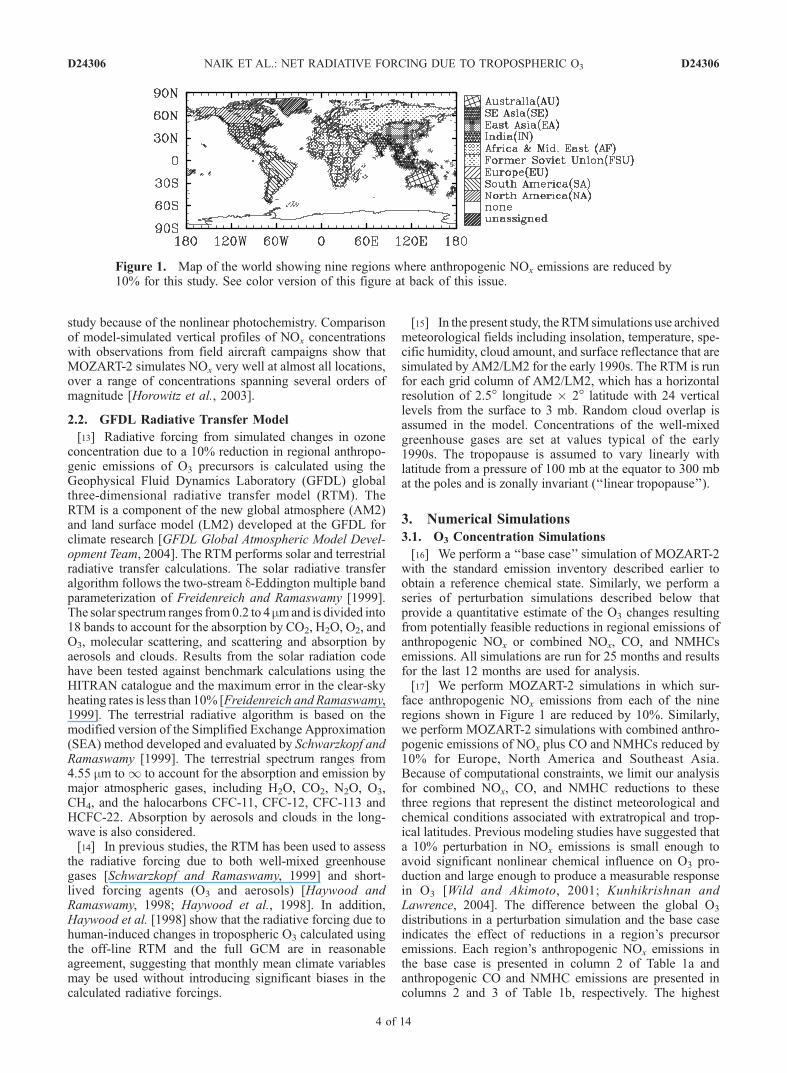
Table 1a. Global Reductions in O3 Burden and Sensitivity of O3 Reductions to Regional Reductions in Anthropogenic NOx Emissionsa
RegionAnthropogenic NOx,
Tg N yr�1Total NOx,Tg N yr�1
DO3, Tg yr�1
DtCH4,years
DCH4,ppb
DO3/DENOx,
Tg/Tg N yr�1DCH4/DENOx
,ppb/Tg N yr�1
Short-LivedMode
PrimaryMode Total
Africa and Middle East (AF) 2.0 8.6 �0.24 0.14 �0.10 0.013 3.25 0.51 �16.23Australia (AU) 0.4 1.1 �0.12 0.06 �0.06 0.006 1.44 1.49 �36.95East Asia (EA) 4.0 4.8 �0.25 0.12 �0.13 0.011 2.75 0.32 �6.90Europe (EU) 5.0 5.3 �0.09 0.07 �0.02 0.006 1.55 0.05 �3.22Former Soviet Union (FSU) 2.5 3.2 �0.07 0.05 �0.02 0.005 1.18 0.07 �4.79Indian Subcontinent (IN) 1.1 2.1 �0.19 0.08 �0.11 0.007 1.85 0.99 �16.04North America (NA) 8.0 9.5 �0.46 0.23 �0.23 0.021 5.41 0.29 �6.78South America (SA) 0.8 4.7 �0.27 0.13 �0.14 0.012 2.99 1.66 �36.00South East Asia (SE) 0.6 1.4 �0.30 0.13 �0.17 0.012 2.97 2.70 �45.65
aColumns 2 and 3 show base surface anthropogenic and total NOx emissions (Tg N yr�1) for each region, respectively. Columns 4 and 5 show thesimulated changes in global total O3 burden (Tg) associated with short-lived and primary modes (as described in section 4.2), respectively, resulting from a10% reduction in regional anthropogenic NOx emissions. Columns 7 and 8 show the estimated changes in CH4 lifetime and the steady state CH4
concentration. Changes in O3 and CH4 burden normalized with respect to the regional NOx emission reductions are shown in Columns 9 and 10,respectively.
Table 1b. Same as in Table 1a but for a Combined 10% Reduction in Regional Anthropogenic NOx, CO, and NMHC Emissionsa
RegionAnthropogenicCO, Tg yr�1
AnthropogenicNMHC, Tg C yr�1
DO3, Tg yr�1
DtCH4,years
DCH4,ppb
DO3/DENOx,
Tg/Tg N yr�1DCH4/DENOx
,ppb/Tg N yr�1
Short-LivedMode
PrimaryMode Total
Europe (EU) 69.3 3.5 �0.22 �0.01 �0.23 �0.001 �0.16 0.46 0.34North America (NA) 100.0 4.7 �0.65 0.12 �0.53 0.011 2.74 0.67 �3.43Southeast Asia (SE) 41.2 2.6 �0.42 0.09 �0.33 0.010 2.16 5.04 �33.15
aColumns 2 and 3 show base regional surface anthropogenic CO and NMHC emissions.
D24306 NAIK ET AL.: NET RADIATIVE FORCING DUE TO TROPOSPHERIC O3
5 of 14
D24306

of the source region. These tropical regions are characterizedby deep convective activity that results in rapid transport ofO3 and its precursors from the boundary layer to the uppertroposphere where ozone production efficiency is higher.Reductions in anthropogenic NOx emissions from Africa andSouth America also result in O3 decreases in the middletroposphere; however, the reductions are smaller and spreadout because these source regions do not have strong convec-tion so O3 and its precursors remain at lower altitude. NOx
reductions from midlatitude regions, including Australia,Europe, the Former Soviet Union and North America resultin the largest decreases in O3 in the midtroposphere (2–8 km)with perturbations extending poleward. The largest reduc-tions in O3 results from 10% reductions in NOx emissionsfrom North America because the absolute magnitude ofemissions from North America is the largest.[20] Figure 3 shows the change in the annually averaged
tropospheric O3 column due to 10% NOx emission reduc-tions for each of the nine regions. The tropospheric O3
column is calculated from the surface up to the modelvertical level at which O3 concentration equals 150 ppbvin the base simulation following Prather et al. [2001]. Shortlifetimes of O3 and its precursors and regional differences in
transport timescales result in significant spatial gradients inthe O3 perturbations. The largest column reductions occurlocally near the source of the emissions; however, the plumeof reduced O3 column extends zonally. For North Americaand East Asia, the regions of reduced O3 column extendacross the Atlantic and Pacific Ocean, respectively. Thehorizontal long-range transport of O3 and its precursorsfrom these regions has been shown to be efficient especiallyin spring and autumn when the boundary layer O3 produc-tion and vertical lifting are greater than in winter [Wild andAkimoto, 2001]. For Europe, Former Soviet Union andAustralia, the reduced O3 regions are less diffuse. Theperturbed O3 column shows a dipole over Europe, with asmall increase in O3 column over northwestern Europe but areduction over Eastern Europe. Small reductions in indus-trial NOx emissions from polluted areas of northwesternEurope result in less wintertime titration of O3 as shown byWild and Akimoto [2001] and cause O3 columns to increase(up to 5 � 10�2 DU). Locally, the peak O3 column decreasefrom emission reductions in South America, Southeast Asia,and the Indian subcontinent are similar to that from NorthAmerica (0.4–0.6 DU), although anthropogenic NOx emit-ted from these regions is less than half that emitted from
Figure 2. Simulated changes in zonal and annual average O3 mixing ratio (pptv) due to a 10% reductionin surface anthropogenic NOx emissions from each of the nine regions shown in Figure 1. Bold linesshow the 150 ppb O3 level from the base case simulation which is used a proxy for the tropopause height(see discussion in section 4.1.1).
D24306 NAIK ET AL.: NET RADIATIVE FORCING DUE TO TROPOSPHERIC O3
6 of 14
D24306

North America (Table 1a). High photochemical and con-vective activity throughout the year accompanied by rela-tively high VOC/NOx concentration ratios resulting in partfrom biomass burning lead to more efficient O3 productionin tropical than midlatitude regions. The changes in globalO3 burden range from �0.23 Tg for North America to�0.02 Tg each for Europe and Former Soviet Union (Table1a and Figure 4a). The sensitivity of global O3 burden to aregion’s NOx emissions, calculated as the normalizedchange in global O3 burden per unit change in NOx
emissions (DO3/DENOx), is highest for low NOx emittingtropical regions (Southeast Asia, South America and Aus-tralia) and lowest for high NOx emitting midlatitude andhigh-latitude regions with concentrated emissions (Europe,the Former Soviet Union; Figure 4b and Table 1a). Thesensitivity of global O3 change to NOx reduction fromSoutheast Asia is almost 9 times higher than that fromNorth America (Figure 4b). The sensitivities calculated forNOx emission reductions from the Indian subcontinent andEast Asia are lower than for other tropical regions becauseof higher background NOx emissions from these regions.[21] There are large differences in the seasonal cycle of
the O3 perturbations. The monthly variations in global O3
changes are shown for both the surface (Figure 5a) andupper troposphere (approximately 12 km; Figure 5b). Sur-face O3 is important for air quality issues while uppertroposphere O3 is important for climate forcing (seesection 4.3). The seasonal cycle in O3 perturbation is drivenby the seasonality in photochemistry and convective activ-ity with a maximum during summer (Figure 5a). In theNorthern Hemisphere, global surface O3 is reduced by 0.03to 0.07 ppb during summer months because of the 10% NOx
reductions from extratropical regions (North America,Europe, Former Soviet Union, and East Asia; Figure 5a).The summer peak is attributed to high photochemicalactivity and O3 production efficiency as shown in
Figure 4. Change in global and annual (a) tropospheric O3
burden and (b) normalized global O3 burden (DO3/DENOx)
due to a 10% reduction in surface anthropogenic NOx
emission from each of the nine regions. These valuesinclude contribution to O3 from the long-lived primarymode (see section 4.2.1).
Figure 3. Simulated changes in annual column tropospheric O3 (10�2 DU) due to a 10% reduction in
surface anthropogenic NOx emissions from each of the nine regions. See color version of this figure atback of this issue.
D24306 NAIK ET AL.: NET RADIATIVE FORCING DUE TO TROPOSPHERIC O3
7 of 14
D24306
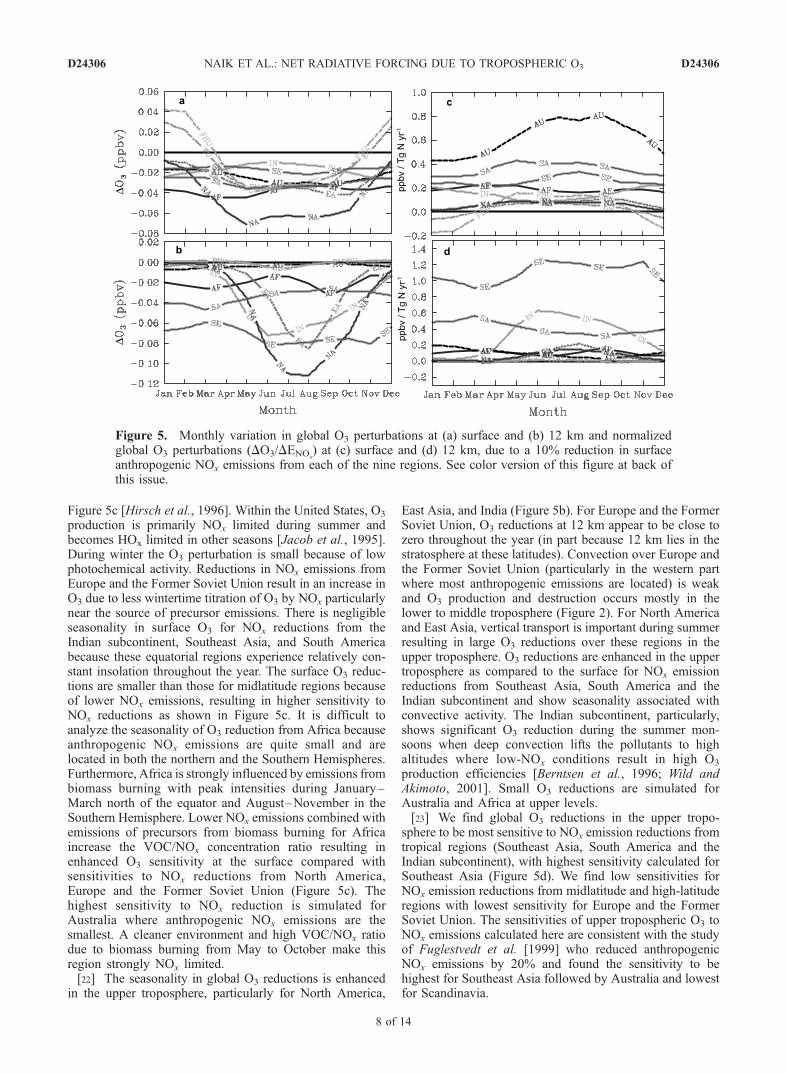
Figure 5c [Hirsch et al., 1996]. Within the United States, O3
production is primarily NOx limited during summer andbecomes HOx limited in other seasons [Jacob et al., 1995].During winter the O3 perturbation is small because of lowphotochemical activity. Reductions in NOx emissions fromEurope and the Former Soviet Union result in an increase inO3 due to less wintertime titration of O3 by NOx particularlynear the source of precursor emissions. There is negligibleseasonality in surface O3 for NOx reductions from theIndian subcontinent, Southeast Asia, and South Americabecause these equatorial regions experience relatively con-stant insolation throughout the year. The surface O3 reduc-tions are smaller than those for midlatitude regions becauseof lower NOx emissions, resulting in higher sensitivity toNOx reductions as shown in Figure 5c. It is difficult toanalyze the seasonality of O3 reduction from Africa becauseanthropogenic NOx emissions are quite small and arelocated in both the northern and the Southern Hemispheres.Furthermore, Africa is strongly influenced by emissions frombiomass burning with peak intensities during January–March north of the equator and August–November in theSouthern Hemisphere. Lower NOx emissions combined withemissions of precursors from biomass burning for Africaincrease the VOC/NOx concentration ratio resulting inenhanced O3 sensitivity at the surface compared withsensitivities to NOx reductions from North America,Europe and the Former Soviet Union (Figure 5c). Thehighest sensitivity to NOx reduction is simulated forAustralia where anthropogenic NOx emissions are thesmallest. A cleaner environment and high VOC/NOx ratiodue to biomass burning from May to October make thisregion strongly NOx limited.[22] The seasonality in global O3 reductions is enhanced
in the upper troposphere, particularly for North America,
East Asia, and India (Figure 5b). For Europe and the FormerSoviet Union, O3 reductions at 12 km appear to be close tozero throughout the year (in part because 12 km lies in thestratosphere at these latitudes). Convection over Europe andthe Former Soviet Union (particularly in the western partwhere most anthropogenic emissions are located) is weakand O3 production and destruction occurs mostly in thelower to middle troposphere (Figure 2). For North Americaand East Asia, vertical transport is important during summerresulting in large O3 reductions over these regions in theupper troposphere. O3 reductions are enhanced in the uppertroposphere as compared to the surface for NOx emissionreductions from Southeast Asia, South America and theIndian subcontinent and show seasonality associated withconvective activity. The Indian subcontinent, particularly,shows significant O3 reduction during the summer mon-soons when deep convection lifts the pollutants to highaltitudes where low-NOx conditions result in high O3
production efficiencies [Berntsen et al., 1996; Wild andAkimoto, 2001]. Small O3 reductions are simulated forAustralia and Africa at upper levels.[23] We find global O3 reductions in the upper tropo-
sphere to be most sensitive to NOx emission reductions fromtropical regions (Southeast Asia, South America and theIndian subcontinent), with highest sensitivity calculated forSoutheast Asia (Figure 5d). We find low sensitivities forNOx emission reductions from midlatitude and high-latituderegions with lowest sensitivity for Europe and the FormerSoviet Union. The sensitivities of upper tropospheric O3 toNOx emissions calculated here are consistent with the studyof Fuglestvedt et al. [1999] who reduced anthropogenicNOx emissions by 20% and found the sensitivity to behighest for Southeast Asia followed by Australia and lowestfor Scandinavia.
Figure 5. Monthly variation in global O3 perturbations at (a) surface and (b) 12 km and normalizedglobal O3 perturbations (DO3/DENOx
) at (c) surface and (d) 12 km, due to a 10% reduction in surfaceanthropogenic NOx emissions from each of the nine regions. See color version of this figure at back ofthis issue.
D24306 NAIK ET AL.: NET RADIATIVE FORCING DUE TO TROPOSPHERIC O3
8 of 14
D24306
4.1.2. Effect of Anthropogenic NOx, CO, and NMHCEmission Reduction[24] Annually averaged O3 columns are reduced as a
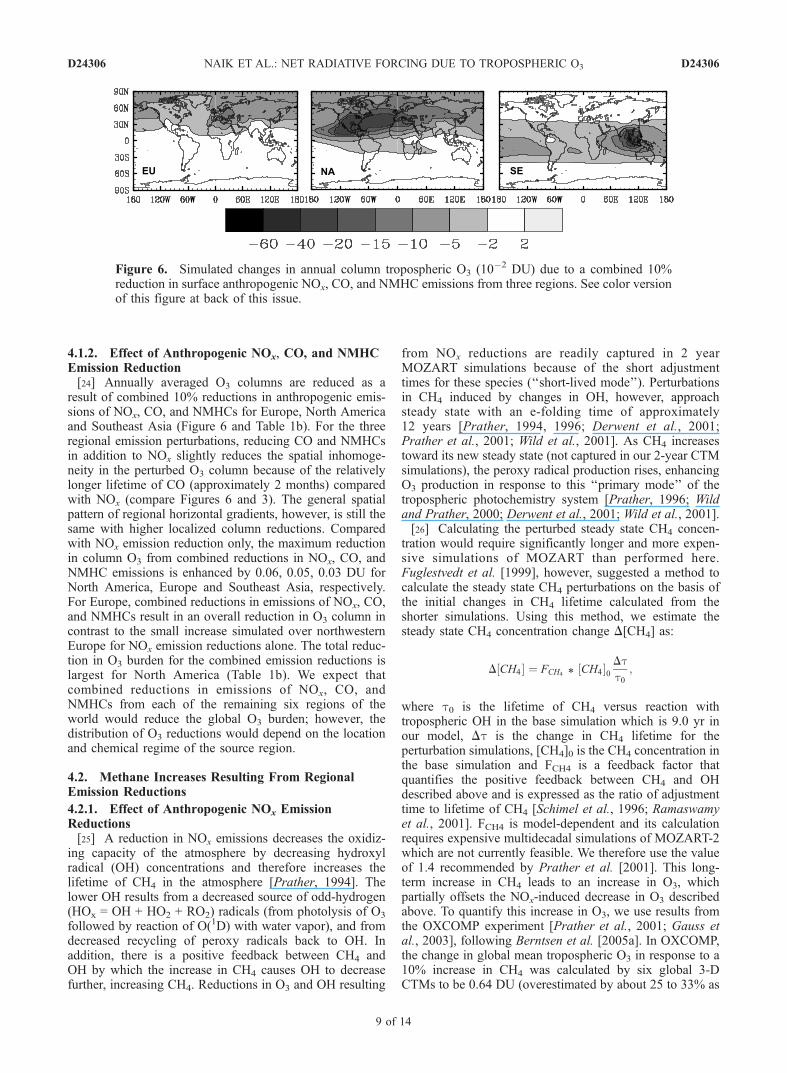
result of combined 10% reductions in anthropogenic emis-sions of NOx, CO, and NMHCs for Europe, North Americaand Southeast Asia (Figure 6 and Table 1b). For the threeregional emission perturbations, reducing CO and NMHCsin addition to NOx slightly reduces the spatial inhomoge-neity in the perturbed O3 column because of the relativelylonger lifetime of CO (approximately 2 months) comparedwith NOx (compare Figures 6 and 3). The general spatialpattern of regional horizontal gradients, however, is still thesame with higher localized column reductions. Comparedwith NOx emission reduction only, the maximum reductionin column O3 from combined reductions in NOx, CO, andNMHC emissions is enhanced by 0.06, 0.05, 0.03 DU forNorth America, Europe and Southeast Asia, respectively.For Europe, combined reductions in emissions of NOx, CO,and NMHCs result in an overall reduction in O3 column incontrast to the small increase simulated over northwesternEurope for NOx emission reductions alone. The total reduc-tion in O3 burden for the combined emission reductions islargest for North America (Table 1b). We expect thatcombined reductions in emissions of NOx, CO, andNMHCs from each of the remaining six regions of theworld would reduce the global O3 burden; however, thedistribution of O3 reductions would depend on the locationand chemical regime of the source region.
4.2. Methane Increases Resulting From RegionalEmission Reductions
4.2.1. Effect of Anthropogenic NOx EmissionReductions[25] A reduction in NOx emissions decreases the oxidiz-
ing capacity of the atmosphere by decreasing hydroxylradical (OH) concentrations and therefore increases thelifetime of CH4 in the atmosphere [Prather, 1994]. Thelower OH results from a decreased source of odd-hydrogen(HOx = OH + HO2 + RO2) radicals (from photolysis of O3
followed by reaction of O(1D) with water vapor), and fromdecreased recycling of peroxy radicals back to OH. Inaddition, there is a positive feedback between CH4 andOH by which the increase in CH4 causes OH to decreasefurther, increasing CH4. Reductions in O3 and OH resulting
from NOx reductions are readily captured in 2 yearMOZART simulations because of the short adjustmenttimes for these species (‘‘short-lived mode’’). Perturbationsin CH4 induced by changes in OH, however, approachsteady state with an e-folding time of approximately12 years [Prather, 1994, 1996; Derwent et al., 2001;Prather et al., 2001; Wild et al., 2001]. As CH4 increasestoward its new steady state (not captured in our 2-year CTMsimulations), the peroxy radical production rises, enhancingO3 production in response to this ‘‘primary mode’’ of thetropospheric photochemistry system [Prather, 1996; Wildand Prather, 2000; Derwent et al., 2001; Wild et al., 2001].[26] Calculating the perturbed steady state CH4 concen-
tration would require significantly longer and more expen-sive simulations of MOZART than performed here.Fuglestvedt et al. [1999], however, suggested a method tocalculate the steady state CH4 perturbations on the basis ofthe initial changes in CH4 lifetime calculated from theshorter simulations. Using this method, we estimate thesteady state CH4 concentration change D[CH4] as:
D CH4½ � ¼ FCH4 * CH4½ �0Dtt0
;
where t0 is the lifetime of CH4 versus reaction withtropospheric OH in the base simulation which is 9.0 yr inour model, Dt is the change in CH4 lifetime for theperturbation simulations, [CH4]0 is the CH4 concentration inthe base simulation and FCH4 is a feedback factor thatquantifies the positive feedback between CH4 and OHdescribed above and is expressed as the ratio of adjustmenttime to lifetime of CH4 [Schimel et al., 1996; Ramaswamyet al., 2001]. FCH4 is model-dependent and its calculationrequires expensive multidecadal simulations of MOZART-2which are not currently feasible. We therefore use the valueof 1.4 recommended by Prather et al. [2001]. This long-term increase in CH4 leads to an increase in O3, whichpartially offsets the NOx-induced decrease in O3 describedabove. To quantify this increase in O3, we use results fromthe OXCOMP experiment [Prather et al., 2001; Gauss etal., 2003], following Berntsen et al. [2005a]. In OXCOMP,the change in global mean tropospheric O3 in response to a10% increase in CH4 was calculated by six global 3-DCTMs to be 0.64 DU (overestimated by about 25 to 33% as
Figure 6. Simulated changes in annual column tropospheric O3 (10�2 DU) due to a combined 10%reduction in surface anthropogenic NOx, CO, and NMHC emissions from three regions. See color versionof this figure at back of this issue.
D24306 NAIK ET AL.: NET RADIATIVE FORCING DUE TO TROPOSPHERIC O3
9 of 14
D24306

it includes some contribution from O3 changes in the lowerstratosphere [Prather et al., 2001]). We use this average O3
response to estimate (DO3)primary, on the basis of the steadystate CH4 change D[CH4] as:
DO3ð Þprimary¼D CH4½ �CH4½ � � 0:64
0:1DU
[27] Columns 4 and 5 of Table 1a show the perturbationin O3 burden from the short-lived mode (immediate reduc-tion in O3 from NOx emissions reduction) and long-livedprimary mode (increase in O3 caused by an increase in CH4
at steady state), and the total change in O3 burden as a sumof the short-lived and primary modes is shown in column 6.As shown in columns 7 and 8 of Table 1a, there are regionaldifferences in the response of CH4 lifetime and its steadystate concentration to a 10% reduction in NOx emissions.We have estimated the global, annual mean change insteady state CH4 resulting from perturbed emissions; how-ever, this perturbation in CH4 has a spatially and temporallyvarying distribution as noted by previous studies [Wild andPrather, 2000; Derwent et al., 2001]. The largest increase inthe steady state concentration of CH4 is for NOx reductionsfrom North America and the smallest for the Former SovietUnion. The normalized CH4 changes per unit NOx emis-sions (column 10 of Table 1a) indicate that as for O3, CH4
change is most sensitive to changes in NOx emissions fromlow-NOx regions (Southeast Asia, South America andAustralia) and least sensitive to high-NOx regions (Europeand the Former Soviet Union). The least sensitive regionsare also characterized by low photochemical activity.4.2.2. Effect of Anthropogenic NOx, CO, and NMHCEmission Reductions[28] The long-lived primary mode changes in O3 and CH4
are diminished when regional CO and NMHCs emissionsare reduced in addition to NOx emissions (columns 5 and8 of Table 1b). Reaction with OH is the primary lossmechanism for CO and NMHCs in the atmosphere; hencereduced CO and NMHC emissions tend to increase OH,opposing the NOx-induced decrease in OH. For emissionreductions from Europe, CO and NMHC reductions offsetthe effect of NOx reductions, resulting in a change in sign(decreases) of the steady state CH4 concentration changeand the primary mode O3 change (decrease) compared withNOx reduction alone. For emission reductions from NorthAmerica and Southeast Asia, a net increase in CH4 remainsresulting in an increase in the primary mode O3, although,only by about half as much as the increase from NOx
emission reductions alone.
4.3. Radiative Forcing Due to Perturbed Ozone andMethane
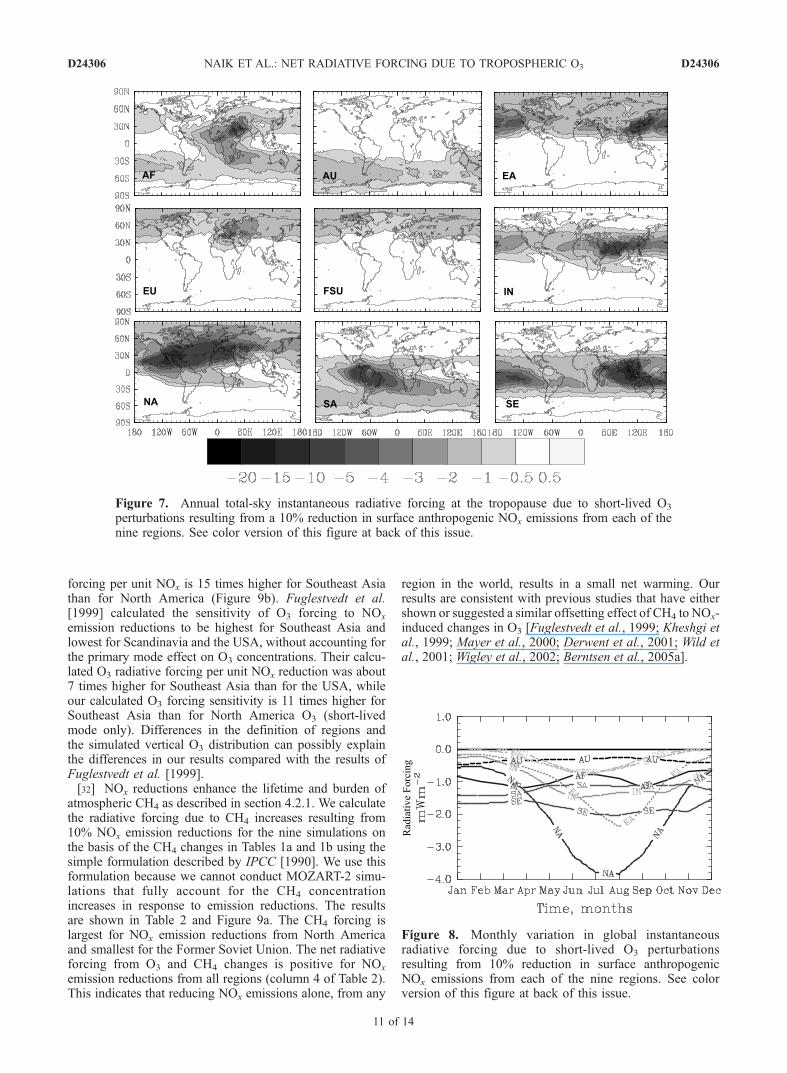
4.3.1. Effect of Regional Anthropogenic NOx EmissionReductions[29] The annual instantaneous total-sky radiative forcing
due to short-lived O3 changes for the simulations withreduced NOx emissions is shown in Figure 7. The spatialpattern of the forcings mostly reflects the distribution ofannual O3 column change simulated for each region(Figure 3), but the horizontal gradients in the forcings arestronger than in the O3 column changes. The region ofmaximum forcing reduction for each simulation is located
near the source of NOx emissions and the region ofmaximum O3 reduction. There is a systematic shift in themaximum radiative forcing reductions toward lower lati-tudes because of the larger contrast between surface andupper tropospheric temperatures, in the tropics versus at thepoles [Haywood et al., 1998]. The reduced forcing extendsto other regions following the plume of O3 reductions. Forexample, the forcing from North America extends across theAtlantic into Europe and northern Africa. Emission reduc-tions from most regions induce forcing reductions in bothhemispheres except for reductions from the Former SovietUnion, Europe, and Australia for which reduced forcingoccurs only in their respective hemispheres. Locally, max-imum negative radiative forcing from Southeast Asia, SouthAmerica and the Indian subcontinent is similar to that fromNorth America. Significant O3 reductions occur near thetropopause for emission reductions from these tropicalregions (Figure 2) where O3 is most radiatively effectiveleading to large forcings from these regions. The dipolepattern simulated for the O3 column for emission reductionsfrom Europe is not replicated for the radiative forcingreduction, possibly because the O3 column change isdetermined by increases in the boundary layer while radi-ative forcing is influenced by changes occurring near thetropopause.[30] Figure 8 shows the monthly variation in the global
average O3 radiative forcing from regional NOx emissionreductions. The seasonal cycle in the simulated radiativeforcings is due to the monthly variation in the verticaldistribution of O3 perturbations and can be explained bythe seasonality in the global O3 reduction in the uppertroposphere (Figure 5b). Seasonally uniform O3 changes inthe upper troposphere resulting from NOx emission reduc-tions from tropical regions (Southeast Asia, South America,and Africa) result in nearly constant yearly forcings whileemission reductions from high-latitude and midlatituderegions (North America, Europe, the Former Soviet Union)result in peak negative radiative forcings during summermonths consistent with maximum upper tropospheric O3
perturbations simulated during summer. Emission reduc-tions from the Indian subcontinent and East Asia also resultin peak radiative forcing reductions during summer associ-ated with O3 reductions in the upper troposphere resultingfrom strong convective activity.[31] The global annual radiative forcings due to O3 and
CH4 changes are summarized in Figure 9a and Table 2, andthe normalized forcing per unit NOx (DFO3/DENOx
) is shownin Figure 9b. The radiative forcing for O3 in Table 2includes contribution from the short-lived (described above)and long-lived primary modes. We calculate the primarymode O3 forcing for each perturbation by first calculatingthe global average O3 forcing per Dobson unit, on the basisof the short-lived mode changes averaged over all emissionreduction regions (0.045Wm�2/DU). This forcing efficiencyis then scaled by the primary mode O3 column changeestimated for each emission reduction region. Our calculatedaverage short-lived mode O3 forcing per Dobson unit changelies within the range of 0.033 to 0.056 Wm�2/DU given byRamaswamy et al. [2001]. The strongest global O3 radiativeforcing from NOx emission reductions is for Southeast Asia(�1.24 mWm�2), with the weakest for Europe and theFormer Soviet Union (�0.03 mWm�2). The O3 radiative
D24306 NAIK ET AL.: NET RADIATIVE FORCING DUE TO TROPOSPHERIC O3
10 of 14
D24306
forcing per unit NOx is 15 times higher for Southeast Asiathan for North America (Figure 9b). Fuglestvedt et al.[1999] calculated the sensitivity of O3 forcing to NOx
emission reductions to be highest for Southeast Asia andlowest for Scandinavia and the USA, without accounting forthe primary mode effect on O3 concentrations. Their calcu-lated O3 radiative forcing per unit NOx reduction was about7 times higher for Southeast Asia than for the USA, whileour calculated O3 forcing sensitivity is 11 times higher forSoutheast Asia than for North America O3 (short-livedmode only). Differences in the definition of regions andthe simulated vertical O3 distribution can possibly explainthe differences in our results compared with the results ofFuglestvedt et al. [1999].[32] NOx reductions enhance the lifetime and burden of
atmospheric CH4 as described in section 4.2.1. We calculatethe radiative forcing due to CH4 increases resulting from10% NOx emission reductions for the nine simulations onthe basis of the CH4 changes in Tables 1a and 1b using thesimple formulation described by IPCC [1990]. We use thisformulation because we cannot conduct MOZART-2 simu-lations that fully account for the CH4 concentrationincreases in response to emission reductions. The resultsare shown in Table 2 and Figure 9a. The CH4 forcing islargest for NOx emission reductions from North Americaand smallest for the Former Soviet Union. The net radiativeforcing from O3 and CH4 changes is positive for NOx
emission reductions from all regions (column 4 of Table 2).This indicates that reducing NOx emissions alone, from any
region in the world, results in a small net warming. Ourresults are consistent with previous studies that have eithershown or suggested a similar offsetting effect of CH4 to NOx-induced changes in O3 [Fuglestvedt et al., 1999; Kheshgi etal., 1999; Mayer et al., 2000; Derwent et al., 2001; Wild etal., 2001; Wigley et al., 2002; Berntsen et al., 2005a].
Figure 8. Monthly variation in global instantaneousradiative forcing due to short-lived O3 perturbationsresulting from 10% reduction in surface anthropogenicNOx emissions from each of the nine regions. See colorversion of this figure at back of this issue.
Figure 7. Annual total-sky instantaneous radiative forcing at the tropopause due to short-lived O3
perturbations resulting from a 10% reduction in surface anthropogenic NOx emissions from each of thenine regions. See color version of this figure at back of this issue.
D24306 NAIK ET AL.: NET RADIATIVE FORCING DUE TO TROPOSPHERIC O3
11 of 14
D24306
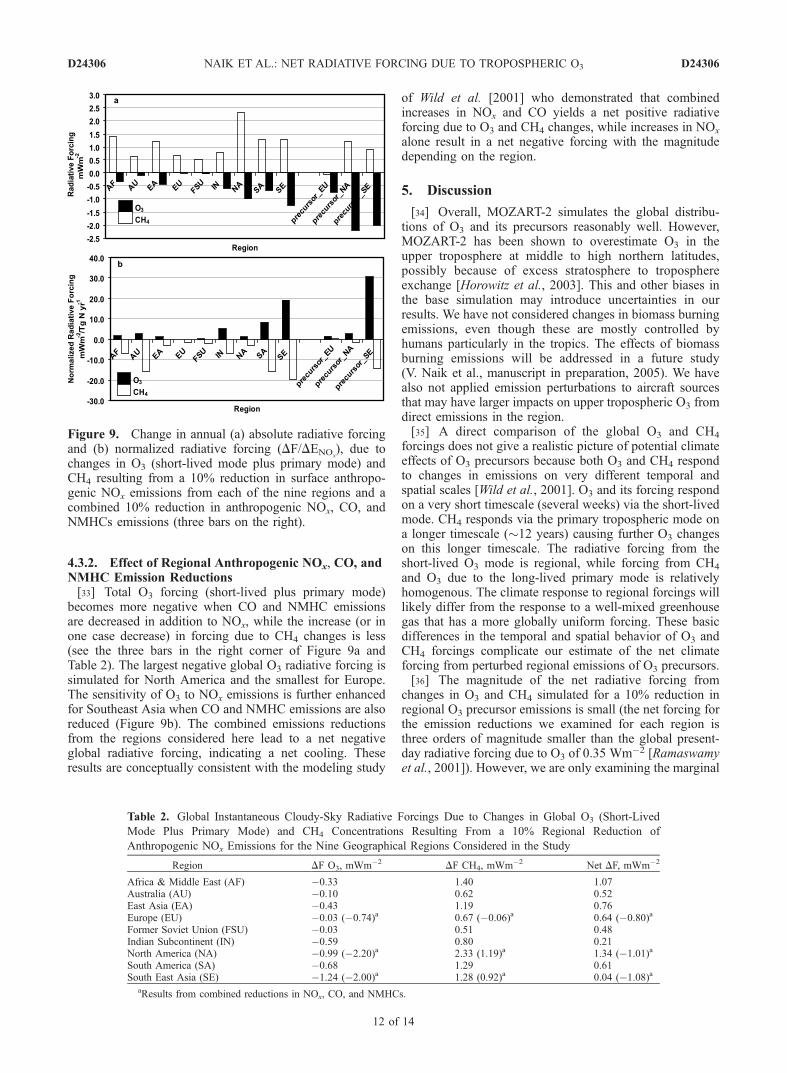
4.3.2. Effect of Regional Anthropogenic NOx, CO, andNMHC Emission Reductions[33] Total O3 forcing (short-lived plus primary mode)
becomes more negative when CO and NMHC emissionsare decreased in addition to NOx, while the increase (or inone case decrease) in forcing due to CH4 changes is less(see the three bars in the right corner of Figure 9a andTable 2). The largest negative global O3 radiative forcing issimulated for North America and the smallest for Europe.The sensitivity of O3 to NOx emissions is further enhancedfor Southeast Asia when CO and NMHC emissions are alsoreduced (Figure 9b). The combined emissions reductionsfrom the regions considered here lead to a net negativeglobal radiative forcing, indicating a net cooling. Theseresults are conceptually consistent with the modeling study
of Wild et al. [2001] who demonstrated that combinedincreases in NOx and CO yields a net positive radiativeforcing due to O3 and CH4 changes, while increases in NOx
alone result in a net negative forcing with the magnitudedepending on the region.
5. Discussion
[34] Overall, MOZART-2 simulates the global distribu-tions of O3 and its precursors reasonably well. However,MOZART-2 has been shown to overestimate O3 in theupper troposphere at middle to high northern latitudes,possibly because of excess stratosphere to troposphereexchange [Horowitz et al., 2003]. This and other biases inthe base simulation may introduce uncertainties in ourresults. We have not considered changes in biomass burningemissions, even though these are mostly controlled byhumans particularly in the tropics. The effects of biomassburning emissions will be addressed in a future study(V. Naik et al., manuscript in preparation, 2005). We havealso not applied emission perturbations to aircraft sourcesthat may have larger impacts on upper tropospheric O3 fromdirect emissions in the region.[35] A direct comparison of the global O3 and CH4
forcings does not give a realistic picture of potential climateeffects of O3 precursors because both O3 and CH4 respondto changes in emissions on very different temporal andspatial scales [Wild et al., 2001]. O3 and its forcing respondon a very short timescale (several weeks) via the short-livedmode. CH4 responds via the primary tropospheric mode ona longer timescale (12 years) causing further O3 changeson this longer timescale. The radiative forcing from theshort-lived O3 mode is regional, while forcing from CH4
and O3 due to the long-lived primary mode is relativelyhomogenous. The climate response to regional forcings willlikely differ from the response to a well-mixed greenhousegas that has a more globally uniform forcing. These basicdifferences in the temporal and spatial behavior of O3 andCH4 forcings complicate our estimate of the net climateforcing from perturbed regional emissions of O3 precursors.[36] The magnitude of the net radiative forcing from
changes in O3 and CH4 simulated for a 10% reduction inregional O3 precursor emissions is small (the net forcing forthe emission reductions we examined for each region isthree orders of magnitude smaller than the global present-day radiative forcing due to O3 of 0.35 Wm�2 [Ramaswamyet al., 2001]). However, we are only examining the marginal
Figure 9. Change in annual (a) absolute radiative forcingand (b) normalized radiative forcing (DF/DENOx
), due tochanges in O3 (short-lived mode plus primary mode) andCH4 resulting from a 10% reduction in surface anthropo-genic NOx emissions from each of the nine regions and acombined 10% reduction in anthropogenic NOx, CO, andNMHCs emissions (three bars on the right).
Table 2. Global Instantaneous Cloudy-Sky Radiative Forcings Due to Changes in Global O3 (Short-Lived
Mode Plus Primary Mode) and CH4 Concentrations Resulting From a 10% Regional Reduction of
Anthropogenic NOx Emissions for the Nine Geographical Regions Considered in the Study
Region DF O3, mWm�2DF CH4, mWm�2 Net DF, mWm�2
Africa & Middle East (AF) �0.33 1.40 1.07Australia (AU) �0.10 0.62 0.52East Asia (EA) �0.43 1.19 0.76Europe (EU) �0.03 (�0.74)a 0.67 (�0.06)a 0.64 (�0.80)a
Former Soviet Union (FSU) �0.03 0.51 0.48Indian Subcontinent (IN) �0.59 0.80 0.21North America (NA) �0.99 (�2.20)a 2.33 (1.19)a 1.34 (�1.01)a
South America (SA) �0.68 1.29 0.61South East Asia (SE) �1.24 (�2.00)a 1.28 (0.92)a 0.04 (�1.08)a
aResults from combined reductions in NOx, CO, and NMHCs.
D24306 NAIK ET AL.: NET RADIATIVE FORCING DUE TO TROPOSPHERIC O3
12 of 14
D24306
effect of a small reduction (10%) in the anthropogenicemissions from individual continents – each reductionconsidered is less than 2% of the total global anthropogenicemissions of O3 precursors. This unsurprisingly results insmall perturbations in O3 and CH4 burdens and forcings.For comparison, reductions in aggregate anthropogenic CO2
equivalent emissions of the long-lived greenhouse gasesagreed under the Kyoto Protocol are only 5% below 1990levels for developed countries resulting in a relatively smalldecrease in radiative forcing. For a 10% reduction inEuropean emissions of CO2 and air pollutants, Berntsen etal. [2005b] calculated the net climate forcing due to O3
reductions to be approximately an order of magnitudesmaller than that due to CO2 reductions.
6. Conclusions
[37] In this study, we quantified the global change intropospheric O3 and CH4 burdens and the associated radi-ative forcing resulting from regional emissions of O3
precursors (NOx, CO, and NMHCs). We evaluated theresponse of O3 and CH4 to reduced anthropogenic NOx
emissions alone for nine geographical regions individuallyand to a combined reduction in anthropogenic emissions ofNOx, CO and NMHCs from three regions, using chemicaltransport model simulations. We show that O3 and CH4
forcings are most sensitive to emission changes fromtropical regions (Southeast Asia) and least sensitive toemission changes from midlatitude and high-latituderegions (Europe and North America). The range of normal-ized forcings found in our analysis suggests that controlstrategies that reduce emissions of O3 precursors fromtropical regions in particular can have a significant impacton the net climate forcing from O3 and CH4. We find thatfrom all regions of the world, reductions in NOx emissionsalone result in a positive forcing from increased CH4 thatdominates over the small negative forcing from decreasedO3 for each region, implying a net warming. Combinedreductions in anthropogenic NOx, CO, and NMHC emis-sions result in a stronger negative forcing from decreasedO3 and a weaker positive forcing from CH4, producing a netnegative forcing (cooling).[38] The analysis presented here may prove useful in
incorporating tropospheric O3 and its precursors in a futureclimate treaty to gain climate change benefits. Since we findthat NOx emission reductions alone are insufficient toproduce a net negative radiative forcing, it may thereforebe useful to assess the cost effectiveness and politicalfeasibility of including the basket of O3 precursors in afuture climate agreement. Consideration of a climate treatyseeking to obtain cobenefits from reducing radiative forcingand mitigating air pollution could benefit from furtherstudies pertinent to crediting simultaneous reductions ofregional emissions of NOx, CO, and NMHCs, or possiblyfrom CO and NMHCs alone.
[39] Acknowledgments. V. Naik was supported by the CarbonMitigation Initiative (CMI) of the Princeton Environmental Institute atPrinceton University (http://www.princeton.edu/cmi) which is sponsoredby BP and Ford. We thank Michael Prather for helpful discussions andJan Fuglestvedt, Terje Berntsen and an anonymous reviewer for valuablecomments on an earlier version of the manuscript. The Geophysical FluidDynamics Laboratory provided necessary computational resources.
ReferencesAkimoto, H. (2003), Global air quality and pollution, Science, 302, 1716–1719.
Berntsen, T. K., I. S. A. Isaksen, W.-C. Wang, and X.-Z. Liang (1996),Impacts of increased anthropogenic emissions in Asia on troposphericozone and climate, Tellus, Ser. B, 48, 13–32.
Berntsen, T. K., G. Myhre, F. Stordal, and I. S. A. Isaksen (2000), Timeevolution of tropospheric ozone and its radiative forcing, J. Geophys.Res., 105, 8915–8930.
Berntsen, T. K., J. S. Fuglestvedt, M. M. Joshi, K. P. Shine, N. Stuber,M. Ponater, R. Sausen, D. A. Hauglustaine, and L. Li (2005a), Climateresponse to regional emissions of ozone precursors: Sensitivities andwarming potentials, Tellus, Ser. B, 57, 283–304.
Berntsen, T. K., J. S. Fuglestvedt, G. Myhre, F. Stordal, and T. F. Berglen(2005b), Abatement of greenhouse gases: Does location matter?, Clim.Change, in press.
Derwent, R. G., W. J. Collins, C. E. Johnson, and D. S. Stevenson (2001),Transient behavior of tropospheric O3 precursors in a global 3-D CTMand their indirect greenhouse effects, Clim. Change, 49, 463–487.
Forster, P. M. de F., and K. P. Shine (1997), Radiative forcing and tem-perature trends from stratospheric ozone changes, J. Geophys. Res., 102,10,481–10,857.
Freidenreich, S. M., and V. Ramaswamy (1999), A new multiple-band solarradiative parameterization for general circulation models, J. Geophys.Res., 104, 31,389–31,409.
Fuglestvedt, J. S., T. K. Berntsen, I. S. A. Isaksen, H. Mao, X.-Z. Liang,and W.-C. Wang (1999), Climatic forcing of nitrogen oxides through thechanges in tropospheric ozone and methane; global 3D model studies,Atmos. Environ., 33, 961–977.
Fuglestvedt, J. S., T. K. Berntsen, O. Godal, R. Sausen, K. P. Shine, andT. Skodvin (2003), Metrics of climate change: Assessing radiative forcingand emission indices, Clim. Change, 58, 267–331.
Gauss, M., et al. (2003), Radiative forcing in the 21st century due to ozonechanges in the troposphere and the lower stratosphere, J. Geophys. Res.,108(D9), 4292, doi:10.1029/2002JD002624.
GFDL Global Atmospheric Model Development Team (2004), The newGFDL global atmosphere and land model (AM2/LM2): Evaluation withprescribed SST simulations, J. Clim., 17, 4641–4673.
Hack, J. J. (1994), Parameterization of moist convection in the NCARcommunity climate model (CCM2), J. Geophys. Res., 99, 5551–5568.
Hansen, J., M. Sato, and R. Ruedy (1997), Radiative forcing and climateresponse, J. Geophys. Res., 102, 6831–6864.
Hansen, J., M. Sato, R. Ruedy, A. Lacis, and V. Oinas (2000), Globalwarming in the twenty-first century: An alternative scenario, Proc. Natl.Acad. Sci., 97, 9875–9880, doi:10.1073/pnas.170278997.
Haywood, J. M., and V. Ramaswamy (1998), Global sensitivity studies ofthe direct radiative forcing due to anthropogenic sulfate and black carbonaerosols, J. Geophys. Res., 103, 6043–6058.
Haywood, J. M., M. D. Schwarzkopf, and V. Ramaswamy (1998), Esti-mates of radiative forcing due to modeled increases in troposphericozone, J. Geophys. Res., 103, 16,999–17,007.
Heinsohn, R. J., and R. L. Kabel (1999), Sources and Control of AirPollution, 680 pp., Prentice-Hall, Upper Saddle River, N. J.
Hirsch, A. I., J. W. Munger, D. J. Jacob, L. W. Horowitz, and A. H.Goldstein (1996), Seasonal variation of the ozone production efficiencyper unit NOx at Harvard Forest, Massachusetts, J. Geophys. Res., 101,12,659–12,666.
Holloway, T., A. Fiore, and M. G. Hastings (2003), Intercontinental trans-port of air pollution: Will emerging science lead to a new hemispherictreaty?, Environ. Sci. Technol, 37, 4535–4542.
Horowitz, L. J., et al. (2003), A global simulation of tropospheric ozone andrelated tracers: description and evaluation of MOZART, version 2,J. Geophys. Res., 108(D24), 4784, doi:10.1029/2002JD002853.
Intergovernmental Panel on Climate Change (IPCC) (1990), ClimateChange 1990: The Intergovernmental Panel on Climate Change Scien-tific Assessment, edited by J. T. Houghton et al., Cambridge Univ. Press,New York.
IPCC (1995), Climate Change 1994: Radiative Forcing of Climate Changeand an Evaluation of the IPCC IS92 Emission Scenarios, edited by J. T.Houghton et al., Cambridge Univ. Press, New York.
Jacob, D. J., L. W. Horowitz, J. W. Munger, B. G. Heikes, R. R. Dickerson,R. S. Artz, and W. C. Keene (1995), Seasonal transition from NOx- tohydrocarbon-limited conditions for ozone production over the easternUnited States in September, J. Geophys. Res., 100, 9315–9324.
Joshi, M., K. Shine, M. Ponater, N. Stuber, R. Sausen, and L. Li (2003), Acomparison of climate response of different radiative forcings in threegeneral circulation models: Towards an improved metric climate change,Clim Dyn., 20, 843–854.
Kheshgi, H. S., A. K. Jain, V. R. Kotamarthi, and D. J. Wuebbles (1999),Future atmospheric methane concentrations in the context of the stabili-
D24306 NAIK ET AL.: NET RADIATIVE FORCING DUE TO TROPOSPHERIC O3
13 of 14
D24306
zation of greenhouse gas concentrations, J. Geophys. Res., 104, 19,183–19,190.
Kunhikrishnan, T., and M. G. Lawrence (2004), Sensitivity of NOx over theIndian Ocean to emissions from the surrounding continents and nonlinea-rities in atmospheric chemistry response, Geophys. Res. Lett., 31,L15109, doi:10.1029/2004GL020210.
Lacis, A. A., D. J. Wuebbles, and J. A. Logan (1990), Radiative forcing ofclimate by changes in the vertical distribution of ozone, J. Geophys. Res.,95, 9971–9981.
Lin, S.-J., and R. B. Rood (1996), Multidimensional flux-form semi-Lagrangian transport schemes, Mon. Weather Rev., 124, 2046–2070.
Lin, X., M. Trainer, and S. C. Liu (1988), On the non-linearity of thetroposheric ozone production, J. Geophys. Res., 93, 15,879–15,888.
Logan, J. A. (1999), An analysis of ozonesonde data for the troposphere:Recommendations for testing 3-D models and development of a griddedclimatology for tropospheric ozone, J. Geophys. Res., 104, 16,115–16,149.
Mayer, M., C. Wang, M. Webster, and R. G. Prinn (2000), Linking local airpollution to global chemistry and climate, J. Geophys. Res., 105,22,869–22,896.
Mickley, L. J., P. P. Murti, D. J. Jacob, J. A. Logan, D. M. Koch, andD. Rind (1999), Radiative forcing from tropospheric ozone calculated witha unified chemistry-climate model, J. Geophys. Res., 104, 30,153–30,172.
Olivier, J. G. J., A. F. Bouwman, C. W. M. v. d. Maas, J. J. M. Berdowski,C. Veldt, J. P. J. Bloos, A. J. H. Visschedijk, P. Y. J. Zandveld, and J. L.Haverlag (1996), Description of EDGAR version 2.0: A set of globalemission inventories of greenhouse gases and ozone-depleting substancesfor all anthropogenic and most natural sources on a per country basesand on a 1 � 1 degree grid, Natl. Inst. of Public Health, Bilthoven,Netherlands.
Prather, M. J. (1994), Lifetimes and eigenstates in atmospheric chemistry,Geophys. Res. Lett., 21, 801–804.
Prather, M. J. (1996), Timescales in atmospheric chemistry: Theory, GWPsfor CH4 and CO, and runaway growth, Geophys. Res. Lett., 23, 2597–2600.
Prather, M., et al. (2001), Atmospheric chemistry and greenhouse gases, inClimate Change 2001: The Scientific Basis, edited by J. T. Houghton etal., pp. 239–287, Cambridge Univ. Press, New York.
Ramaswamy, V., et al. (2001), Radiative forcing of climate change, inClimate Change 2001: The Scientific Basis, edited by J. T. Houghtonet al., pp. 349–416, Cambridge Univ. Press, New York.
Randel, W. J., F. Wu, J. M. Russell III, A. Roche, and J. Waters (1998),Seasonal cycles and QBO variations in stratospheric CH4 and H2O ob-served in UARS HALOE data, J. Atmos. Sci., 55, 163–185.
Rasch, P. J., N. Mahowald, and B. Eaton (1997), Representations of trans-port, convection, and the hydrologic cycle in chemical transport models:
Implications for the modeling of short-lived and soluble species, J. Geo-phys. Res., 102, 28,127–28,138.
Rasch, P., D. Zurovac-Jevtic, K. Emanuel, and M. Lawrence (2003), Con-sistent representation of convective processes for chemistry and climatemodels, Geophys. Res. Abstr., 5, 12440.
Rypdal, K., T. Berntsen, J. S. Fuglestvedt, K. Aunan, A. Torvanger,F. Stordal, J. M. Pacyna, and L. P. Nygaard (2005), Tropospheric ozoneand aerosols in climate agreements: Scientific and political challenges,Environ. Sci. Policy, 8, 29–43.
Schimel, D., et al. (1996), Radiative forcing of climate change, in ClimateChange 1995: The Science of Climate Change, edited by J. T. Houghtonet al., pp. 65–137, Cambridge Univ. Press, New York.
Schwarzkopf, M. D., and V. Ramaswamy (1999), Radiative effects of CH4,N2O, halocarbons and the foreign-broadened H2O continuum: A GCMexperiment, J. Geophys. Res., 104, 9467–9488.
Swart, R., M. Amann, and F. Raes (2004), A good climate for clean air:linkages between climate change and air pollution, Clim. Change, 66,263–269.
Wang, W. C., J. P. Pinto, and Y. L. Yung (1980), Climatic effects due tohalogenated compounds in the Earth’s atmosphere, J. Atmos. Sci., 37,333–338.
Wang, W.-C., Y. Z. Zhuang, and R. D. Bojkov (1993), Climatic implicationsof observed changes in ozone vertical distribution in the middle and highlatitudes of the NorthernHemisphere,Geophys. Res. Lett., 20, 1567–1570.
Wigley, T. M. L., S. J. Smith, and M. J. Prather (2002), Radiative forcingdue to reactive gas emissions, J. Clim., 15, 2690–2696.
Wild, O., and H. Akimoto (2001), Intercontinental transport of ozone andits precursors in a three-dimensional global CTM, J. Geophys. Res., 106,27,729–27,744.
Wild, O., and M. J. Prather (2000), Excitation of the primary troposphericchemical mode in a global three-dimensional model, J. Geophys. Res.,105, 24,647–24,660.
Wild, O., M. J. Prather, and H. Akimoto (2001), Indirect long-term globalradiative cooling from NOx emissions, Geophys. Res. Lett., 28, 1719–1722.
Zhang, G. J., and N. A. McFarlane (1995), Sensitivity of climate simula-tions to the parameterization of cumulus convection in the Canadianclimate centre general circulation model, Atmos. Ocean, 33, 407–446.
�����������������������L. Horowitz, V. Ramaswamy, and M. D. Schwarzkopf, Geophysical Fluid
Dynamics Laboratory, NOAA, Princeton, NJ 08544, USA.D. Mauzerall, V. Naik, and M. Oppenheimer, Woodrow Wilson School of
Public and International Affairs, Princeton University, Princeton, NJ 08544,USA. ([email protected])
D24306 NAIK ET AL.: NET RADIATIVE FORCING DUE TO TROPOSPHERIC O3
14 of 14
D24306
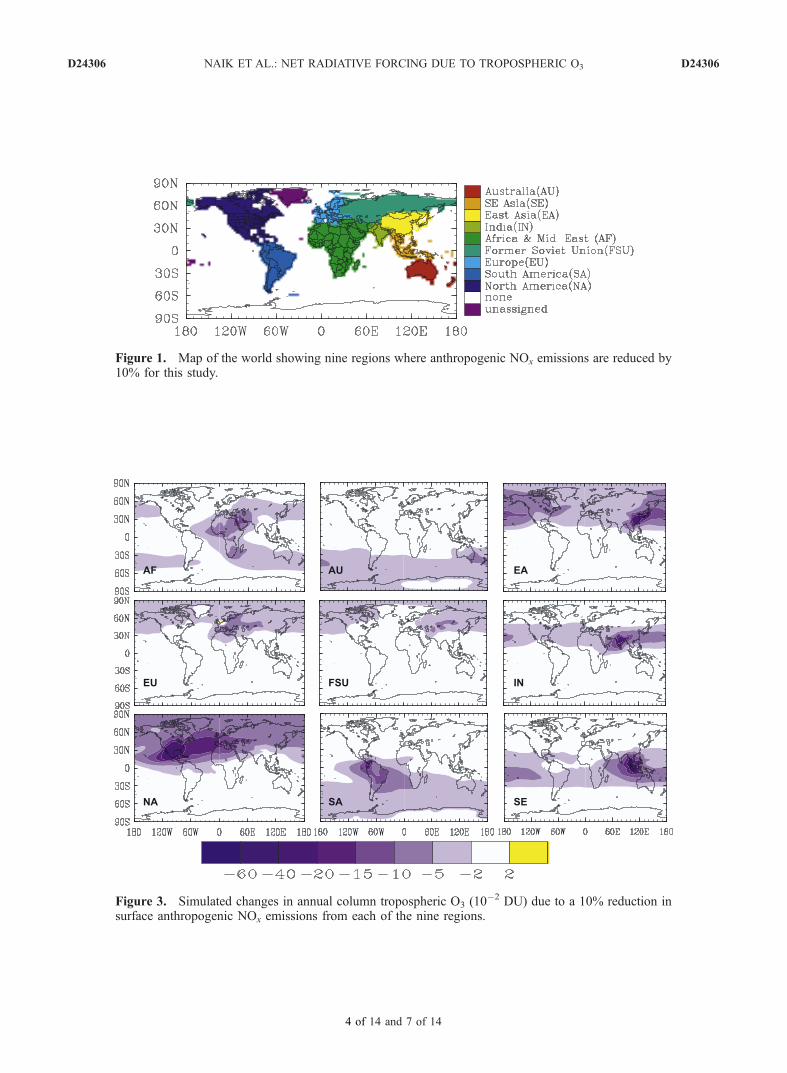
Figure 1. Map of the world showing nine regions where anthropogenic NOx emissions are reduced by10% for this study.
Figure 3. Simulated changes in annual column tropospheric O3 (10�2 DU) due to a 10% reduction in
surface anthropogenic NOx emissions from each of the nine regions.
D24306 NAIK ET AL.: NET RADIATIVE FORCING DUE TO TROPOSPHERIC O3 D24306
4 of 14 and 7 of 14
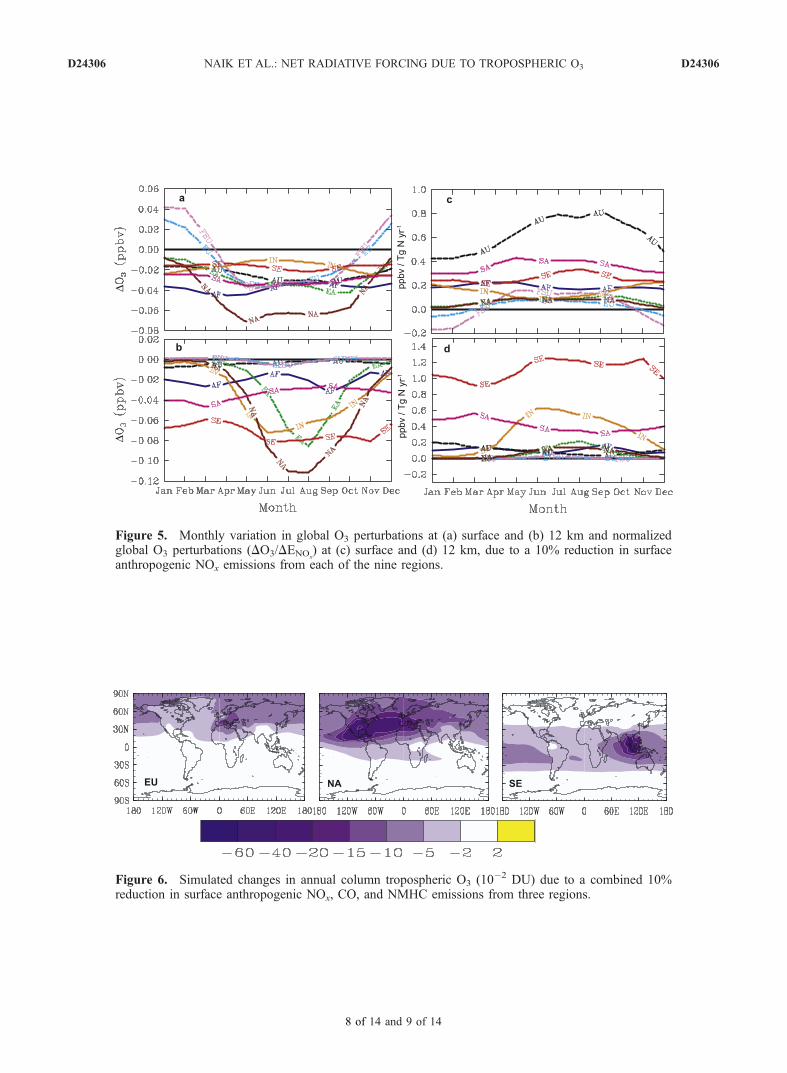
Figure 5. Monthly variation in global O3 perturbations at (a) surface and (b) 12 km and normalizedglobal O3 perturbations (DO3/DENOx
) at (c) surface and (d) 12 km, due to a 10% reduction in surfaceanthropogenic NOx emissions from each of the nine regions.
Figure 6. Simulated changes in annual column tropospheric O3 (10�2 DU) due to a combined 10%reduction in surface anthropogenic NOx, CO, and NMHC emissions from three regions.
D24306 NAIK ET AL.: NET RADIATIVE FORCING DUE TO TROPOSPHERIC O3 D24306
8 of 14 and 9 of 14
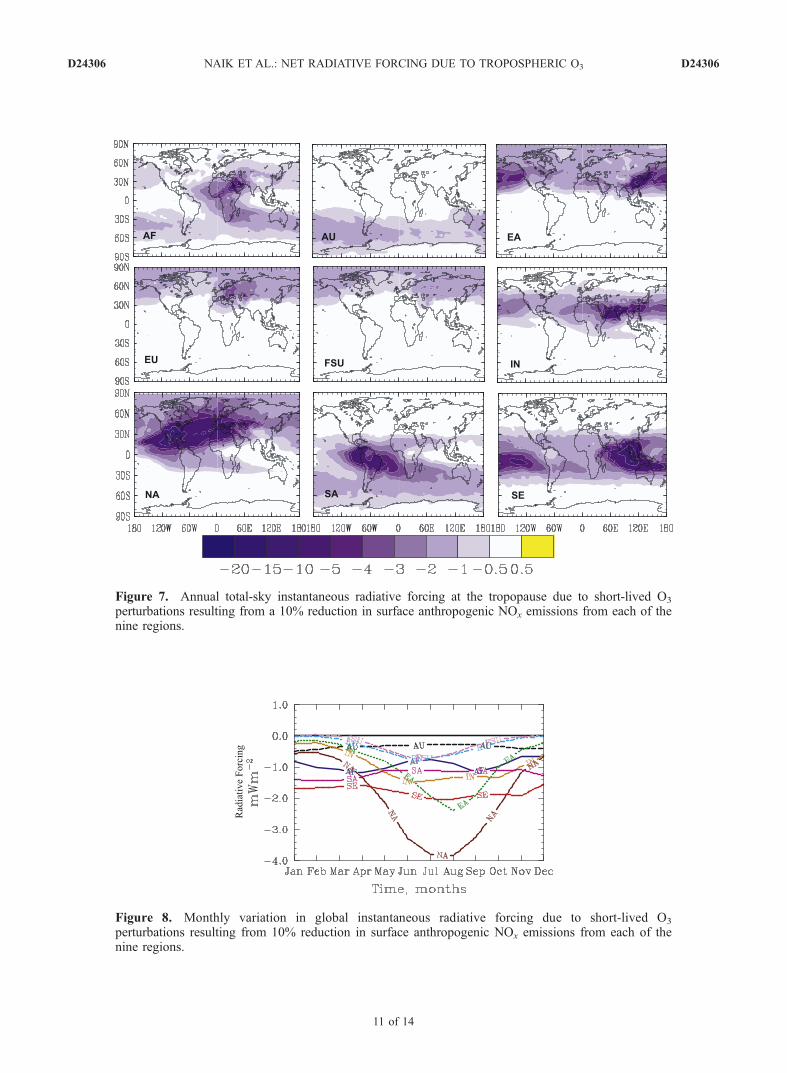
Figure 7. Annual total-sky instantaneous radiative forcing at the tropopause due to short-lived O3
perturbations resulting from a 10% reduction in surface anthropogenic NOx emissions from each of thenine regions.
Figure 8. Monthly variation in global instantaneous radiative forcing due to short-lived O3
perturbations resulting from 10% reduction in surface anthropogenic NOx emissions from each of thenine regions.
D24306 NAIK ET AL.: NET RADIATIVE FORCING DUE TO TROPOSPHERIC O3 D24306
11 of 14