Radiative forcing due to changes in ozone and methane caused by the transport sector
8
Radiative forcing due to changes in ozone and methane caused by the transport sector G. Myhre a, b, * , K.P. Shine c , G. Rädel c , M. Gauss b, k , I.S.A. Isaksen a, b , Q. Tang d , M.J. Prather d , J.E. Williams e , P. van Velthoven e , O. Dessens f , B. Koffi g , S. Szopa g , P. Hoor h , V. Grewe i , J. Borken-Kleefeld j,1 , T.K. Berntsen a, b , J.S. Fuglestvedt a a Center for International Climate and Environmental Research-Oslo (CICERO), Oslo, Norway b Department of Geosciences, University of Oslo, Norway c Department of Meteorology, University of Reading, Reading, UK d Earth System Science Dept., UC Irvine, CA, USA e Chemistry-Climate Division, Royal Netherlands Meteorological Institute, The Netherlands f Centre for Atmospheric Science, Dept. of Chemistry, Cambridge, UK g Laboratoire des Sciences du Climat et de l’Environnement (LSCE-IPSL), Gif-sur-Yvette, France h Institute for Atmospheric Physics, University Mainz, Germany i Deutsches Zentrum für Luft- und Raumfahrt, Institut für Physik der Atmosphäre, Oberpfaffenhofen, Germany j Formerly: Deutsches Zentrum für Luft- und Raumfahrt, Verkehrsstudien, Berlin, Germany k Norwegian Meteorological Institute, Oslo, Norway article info Article history: Received 19 May 2010 Received in revised form 27 September 2010 Accepted 4 October 2010 Keywords: Radiative forcing GWP GTP Shipping Aviation Road transport abstract The year 2000 radiative forcing (RF) due to changes in O 3 and CH 4 (and the CH 4 -induced stratospheric water vapour) as a result of emissions of short-lived gases (oxides of nitrogen (NO x ), carbon monoxide and non-methane hydrocarbons) from three transport sectors (ROAD, maritime SHIPping and AIRcraft) are calculated using results from five global atmospheric chemistry models. Using results from these models plus other published data, we quantify the uncertainties. The RF due to short-term O 3 changes (i.e. as an immediate response to the emissions without allowing for the long-term CH 4 changes) is positive and highest for ROAD transport (31 mW m 2 ) compared to SHIP (24 mW m 2 ) and AIR (17 mW m 2 ) sectors in four of the models. All five models calculate negative RF from the CH 4 pertur- bations, with a larger impact from the SHIP sector than for ROAD and AIR. The net RF of O 3 and CH 4 combined (i.e. including the impact of CH 4 on ozone and stratospheric water vapour) is positive for ROAD (þ16(13) (one standard deviation) mW m 2 ) and AIR (þ6(5) mW m 2 ) traffic sectors and is negative for SHIP (18(10) mW m 2 ) sector in all five models. Global Warming Potentials (GWP) and Global Temperature change Potentials (GTP) are presented for AIR NO x emissions; there is a wide spread in the results from the 5 chemistry models, and it is shown that differences in the methane response relative to the O 3 response drive much of the spread. Ó 2010 Elsevier Ltd. All rights reserved. 1. Introduction The climate impact of the transport sector occurs through emissions of CO 2 , aerosols (and their precursors), water vapour, and species that affect ozone and the oxidative state of the atmosphere such as NO x , CO and non-methane hydrocarbons (NHMC), with direct emissions of CH 4 being negligible for these sectors. This paper examines the impact of this latter class of oxidant emissions from three transport sub-sectors e land transport (ROAD), mari- time shipping (SHIP) and aviation (AIR). We calculate the radiative forcing (RF) by considering both short-term and long-term changes in atmospheric composition. The estimated RF due to all emissions is positive for ROAD and AIR, but negative for SHIP (Fuglestvedt et al., 2008). This switch for SHIP is partly due to the strong direct and indirect aerosol effect from SHIP (Balkanski et al., 2010; Fuglestvedt et al., 2008) but also a result of the high NO x emissions which reduce the CH 4 lifetime. This coupling in the atmospheric * Corresponding author. Center for International Climate and Environmental Research-Oslo (CICERO), Oslo, Norway. E-mail address: [email protected] (G. Myhre). 1 Now at: International Institute for Applied Systems Analysis, Laxenburg, Austria. Contents lists available at ScienceDirect Atmospheric Environment journal homepage: www.elsevier.com/locate/atmosenv 1352-2310/$ e see front matter Ó 2010 Elsevier Ltd. All rights reserved. doi:10.1016/j.atmosenv.2010.10.001 Atmospheric Environment 45 (2011) 387e394
Transcript of Radiative forcing due to changes in ozone and methane caused by the transport sector
lable at ScienceDirect
Atmospheric Environment 45 (2011) 387e394
Contents lists avai
Atmospheric Environment
journal homepage: www.elsevier .com/locate/atmosenv
Radiative forcing due to changes in ozone and methane causedby the transport sector
G. Myhre a,b,*, K.P. Shine c, G. Rädel c, M. Gauss b,k, I.S.A. Isaksen a,b, Q. Tang d, M.J. Prather d,J.E. Williams e, P. van Velthoven e, O. Dessens f, B. Koffi g, S. Szopa g, P. Hoor h,V. Grewe i, J. Borken-Kleefeld j,1, T.K. Berntsen a,b, J.S. Fuglestvedt a
aCenter for International Climate and Environmental Research-Oslo (CICERO), Oslo, NorwaybDepartment of Geosciences, University of Oslo, NorwaycDepartment of Meteorology, University of Reading, Reading, UKd Earth System Science Dept., UC Irvine, CA, USAeChemistry-Climate Division, Royal Netherlands Meteorological Institute, The NetherlandsfCentre for Atmospheric Science, Dept. of Chemistry, Cambridge, UKg Laboratoire des Sciences du Climat et de l’Environnement (LSCE-IPSL), Gif-sur-Yvette, Franceh Institute for Atmospheric Physics, University Mainz, GermanyiDeutsches Zentrum für Luft- und Raumfahrt, Institut für Physik der Atmosphäre, Oberpfaffenhofen, Germanyj Formerly: Deutsches Zentrum für Luft- und Raumfahrt, Verkehrsstudien, Berlin, GermanykNorwegian Meteorological Institute, Oslo, Norway
a r t i c l e i n f o
Article history:Received 19 May 2010Received in revised form27 September 2010Accepted 4 October 2010
Keywords:Radiative forcingGWPGTPShippingAviationRoad transport
* Corresponding author. Center for InternationalResearch-Oslo (CICERO), Oslo, Norway.
E-mail address: [email protected] (G. M1 Now at: International Institute for Applied Sy
Austria.
1352-2310/$ e see front matter � 2010 Elsevier Ltd.doi:10.1016/j.atmosenv.2010.10.001
a b s t r a c t
The year 2000 radiative forcing (RF) due to changes in O3 and CH4 (and the CH4-induced stratosphericwater vapour) as a result of emissions of short-lived gases (oxides of nitrogen (NOx), carbon monoxideand non-methane hydrocarbons) from three transport sectors (ROAD, maritime SHIPping and AIRcraft)are calculated using results from five global atmospheric chemistry models. Using results from thesemodels plus other published data, we quantify the uncertainties. The RF due to short-term O3 changes(i.e. as an immediate response to the emissions without allowing for the long-term CH4 changes) ispositive and highest for ROAD transport (31 mW m�2) compared to SHIP (24 mW m�2) and AIR(17 mW m�2) sectors in four of the models. All five models calculate negative RF from the CH4 pertur-bations, with a larger impact from the SHIP sector than for ROAD and AIR. The net RF of O3 and CH4
combined (i.e. including the impact of CH4 on ozone and stratospheric water vapour) is positive for ROAD(þ16(�13) (one standard deviation) mW m�2) and AIR (þ6(�5) mW m�2) traffic sectors and is negativefor SHIP (�18(�10) mW m�2) sector in all five models. Global Warming Potentials (GWP) and GlobalTemperature change Potentials (GTP) are presented for AIR NOx emissions; there is a wide spread in theresults from the 5 chemistry models, and it is shown that differences in the methane response relative tothe O3 response drive much of the spread.
� 2010 Elsevier Ltd. All rights reserved.
1. Introduction
The climate impact of the transport sector occurs throughemissions of CO2, aerosols (and their precursors), water vapour, andspecies that affect ozone and the oxidative state of the atmosphere
Climate and Environmental
yhre).stems Analysis, Laxenburg,
All rights reserved.
such as NOx, CO and non-methane hydrocarbons (NHMC), withdirect emissions of CH4 being negligible for these sectors. Thispaper examines the impact of this latter class of oxidant emissionsfrom three transport sub-sectors e land transport (ROAD), mari-time shipping (SHIP) and aviation (AIR). We calculate the radiativeforcing (RF) by considering both short-term and long-term changesin atmospheric composition. The estimated RF due to all emissionsis positive for ROAD and AIR, but negative for SHIP (Fuglestvedtet al., 2008). This switch for SHIP is partly due to the strongdirect and indirect aerosol effect from SHIP (Balkanski et al., 2010;Fuglestvedt et al., 2008) but also a result of the high NOx emissionswhich reduce the CH4 lifetime. This coupling in the atmospheric

G. Myhre et al. / Atmospheric Environment 45 (2011) 387e394388
chemistry between NOx, CH4, and O3 is well established(Fuglestvedt et al., 1999; Lelieveld et al., 1998; Naik et al., 2005;Shindell et al., 2005, 2009; Wild and Prather, 2000). Emissions ofthe short-lived trace gas species NOx, non-methane hydrocarbons(NMHC), and CO lead to production of tropospheric O3, and wedenote this as the short-term O3 RF. The reduction in CH4 also leadsto additional changes in O3, but due to the long lifetime of CH4compared to the other O3 precursors, this change in O3 occurs ona longer time-scale than the short-term O3 RF (Prather, 1994; Wildet al., 2001). We denote the change in O3 from CH4 changes as theCH4-induced O3 change.
The RF fromO3 changes since pre-industrial time is estimated tobe 0.35 W m�2 (Forster et al., 2007; Gauss et al., 2006) and thetransport sectors have been estimated to contribute as much asa third of this value (Fuglestvedt et al., 2008). In terms of RF, thereduction in the CH4 lifetime from NOx emissions acts on a globalscale in opposition to the positive RF due to O3 production fromNOx, leading to a smaller net effect of NOx (Forster et al., 2007;Shindell et al., 2005; Wild et al., 2001).
Sector-specific analyses of RF are important, particularly whenmitigation measures are being considered because each sector’simpact is unique. This is especially relevant for the transport sectorswhere the emissions are introduced into quite different environ-ments e road emissions are predominantly released into thepolluted boundary layer, ship emissions are mostly released intothe clean maritime boundary layer, and aircraft emissions aremostly released into the upper troposphere and lower stratosphere.Using several global atmospheric chemistry models and radiativetransfer schemes, we quantify the RF resulting from changes in O3and the CH4 lifetime due to emissions of NOx, CO and NMHCs fromthe different transport sectors. We focus on the sign of the net RFand its uncertainty for the three transport sectors. The results canbe used, together with calculations of the forcing due to otheremissions (e.g. CO2 and black carbon) from the transport sector, toassess and quantify the overall climate impact of each sector(e.g. Skeie et al., 2009).
This paper presents results from the European Union projectQUANTIFY (Quantifying the Climate Impact of Global and EuropeanEmission Systems). Hoor et al. (2009) reported an analysis ofpreliminary QUANTIFY simulations, focusing on the behaviour ofthe different chemical models; they also included a brief discussionof the RF from the different transport sectors. The simulationsreported here use the final revised QUANTIFY emission inventories,which were developed during the course of the project (Uherek etal., 2010). We concentrate on a more detailed analysis of theresulting RF and its associated uncertainty and on the computationof climate emissions metrics (Global Warming Potential (GWP) andGlobal Temperature change Potential (GTP)) for aviation NOxemissions. An estimate of current climate importance of the accu-mulated emissions from the transport sector up to year 2000 can be
Table 1A short description of the CTMs and CCM used in this study. A more detailed overview o
Model acronym Institution Short description
Oslo CTM2 University of Oslo, Norway CTM driven by ECMWF metin T42 horizontal resolution
TM4 KNMI, The Netherlands CTM driven by ECMWF metwith a 2� � 3� horizontal re
p-TOMCAT University of Cambridge, UK CTM driven by ECMWF metin T21 horizontal resolution
LMDz-INCA LSCE, Gif sur Yvette, France CCM nudged to meteorologifrom ECMWF with a horizonof 3.75� � 2.5� and 19 vertic
UCI University of California, Irvine, USA CTM driven by ECMWF metin T42 horizontal resolution
made using RF. To assess the future importance of current emis-sions and for considerations for mitigation purposes, forwardlooking emission metrics such as the GWP and the GTP metrics aremore useful as they account for the persistence of atmosphericperturbations and thus the integrated impacts (Fuglestvedt et al.,2010).
2. Methods and models
Five global chemistry models consisting of four ChemistryTransport Models (CTMs) and one Climate Chemistry Model (CCM)have been used to simulate changes in O3 and OH due to precursoremissions (NOx, CO, and NMHC) from the different transportsectors with year 2000 emissions (see Table 1 for model descrip-tions). Each model ran with fixed CH4 abundances and thenadopted a spin-up period of a year in order to attain chemicalsteady state with respect to O3. The imbalance in the CH4 budget isdiagnosed; this allows the calculation of the change in CH4 abun-dance that would have occurred over decades if the emissions wereheld constant. The QUANTIFY methodology (see Hoor et al., 2009and Grewe et al., 2010 for details) is to include all natural andanthropogenic emissions and then to compute the impact of anindividual transport sector by reducing each respective sector’semissions by 5%, so as to ensure that perturbations act on anatmosphere close to present-day composition (Grewe et al., 2010).The 5% results are scaled by a factor 20 to represent the total changeattributable to the transport sectors. The difference betweena 20� 5% reduction and a complete 100% reduction are discussed inSection 3.1. Fig. 1 compares the improved emissions used in thisstudy compared to those of Fuglestvedt et al. (2008) and Hoor et al.(2009). ROAD emissions of NOx, NMHC and CO are highest inFuglestvedt et al. (2008), whereas the new QUANTIFY NOx emis-sions for AIR are greater than those in Fuglestvedt et al. (2008) andHoor et al. (2009). Only Fuglestvedt et al. (2008) included CO andNMHC emissions for the AIR sector, but these emissions arenegligible in terms of global anthropogenic sources. Note the muchhigher ratio of NOx to CO2 in SHIP and AIR emissions compared toROAD emissions. The gridded emission data can be downloadedfrom www.ip-quantify.eu.
The RF calculations for the O3 changes from the chemical modelsare performed using two sets of radiative transfer models,University of Oslo (UiO) and University of Reading (UoR). Exceptwhere stated, the simulations here use the UiO schemes, whichconsist of a broad-band scheme for thermal infrared radiation anda scheme using the multi-stream DISORT code for shortwaveradiation (Myhre et al., 2000). UoR have performed O3 RF calcula-tions using the O3 changes for each sector averaged over 4 ofthe global chemistry models (Oslo CTM2, TM4, LMDz-INCA andp-TOMCAT; the UCI results are a recent addition) using the Edwards
f the models is given in Hoor et al. (2009).
Reference
eorologyand 60 vertical layers
(Berglen et al., 2004; Gauss et al., 2006;Isaksen et al., 2005)
eorologysolution and 34 vertical layers
(van Noije et al., 2006; Williams et al., 2009;Williams et al., 2010)
eorologyand 31 vertical layers
(O’Connor et al., 2005)
cal datatal resolutional layers
(Folberth et al., 2006; Hauglustaine et al., 2004)
eorologyand 37 vertical layers
(Hsu et al., 2005; Wild et al., 2003)

Fig. 1. Emissions (year 2000) of O3 precursors (NOx, CO, and NHMC) (given inTg (N) yr�1, Tg (C) yr�1, and Tg (C) yr�1, respectively) for two previous studies(Fuglestvedt et al., 2008; Hoor et al., 2009) and in this study for ROAD (top), SHIP(middle) and AIR (bottom). For comparison, the CO2 emissions (as CO2) in year 2000are 4200 Tg, 622 Tg and 677 Tg for ROAD, SHIP, and AIR; respectively.
G. Myhre et al. / Atmospheric Environment 45 (2011) 387e394 389
and Slingo (1996) two-stream radiation code, with 6 bands in theshortwave and 8 bands in the longwave.
The methodology for calculating the forcing due to CH4 changesfollows the simple approach described by Berntsen et al. (2005) andused in Hoor et al. (2009), with two important extensions. Thechemistry models do not explicitly calculate the change in CH4concentrations and in any case the simulations are not long enoughfor the CH4 to come into equilibrium with the changed OH field.Instead, the change in OH is used to estimate the fractional change
in CH4 lifetime. This is then multiplied by the present-dayconcentration of methane and a model-average feedback factor of1.4 (Prather et al., 2001), to account for the impact of changes in CH4concentration on its own lifetime, to yield the fractional change inCH4 concentration for steady-state conditions (Fuglestvedt et al.,1999). The QUANTIFY study did not directly calculate this feed-back factor, nor the increase in tropospheric O3 per change in CH4,so we resort to the published, model-average values here.
The RF is calculated assuming a specific CH4 RF of0.37 mW m�2ppbv�1, which assumes a background concentrationof 1740 ppb. The CH4-induced O3 RF is then computed, followingBerntsen et al. (2005) and using results from Prather et al. (2001),whereby a 10% increase in CH4 leads to a 0.64 DU increase in O3, andthis O3 has a specific RF of 42 mW m�2 DU�1(Ramaswamy et al.,2001); this RF factor is more applicable to the global-scale changein tropospheric O3 resulting from the methane change, than it is tothe more regional short-term ozone change resulting from trans-port sector emissions.
The first extension to the Hoor et al. (2009) methodology is toaccount for the impact of CH4 changes on stratospheric watervapour. Based on Myhre et al. (2007), we take the stratosphericwater vapour RF to be 0.15 times that of the CH4 RF. The secondextension to the Hoor et al. (2009) methodology is to relax theassumption that the CH4 concentration in 2000 is in steady statewith that year’s change in OH. The actual degree of imbalancedepends on the history of change in OH, which is not accounted forin the chemical model calculations which used year 2000 emis-sions. The degree of imbalance will be greatest for AIR, for whichthe emissions have been growing most rapidly in recent years, andleast for ROAD. The method and assumptions about the historicalemissions are described in Grewe and Stenke (2008). The factor tocorrect this transient response in year 2000 is taken to be 0.85 forROAD, 0.8 for SHIP and 0.65 for AIR. These factors are then appliedto the CH4 RF, the CH4-induced O3 RF and the stratospheric watervapour RF from each of the CTMs. These corrections to theinstantaneous year 2000 RF are a result of the historical emissionsand do not apply to the calculation of GWP and GTP for AIR inSection 4.
Other consequences of the O3 precursor emissions have beenidentified but are not considered here. For example, changes in O3and OH may alter the sulphate burden (e.g. Unger et al., 2006;Shindell et al., 2009) and surface O3 interaction with vegetationmay impact the carbon cycle (Sitch et al., 2007). NOx emissionshave a small direct RF due to the absorption of solar radiation byNO2 (Kvalevåg and Myhre, 2007) and formation of nitrate aerosolsfrom the NOx enhances the overall aerosol negative RF (Forsteret al., 2007). This paper focuses on the primary, well-establishedimpacts of the ozone-precursor emissions on O3 and CH4 and theirconsequential effects.
3. Results
3.1. Short-term O3
Table 2 compares the global and annual mean total column O3change (in DU) for the five global chemistry models and the threetransport sectors for the QUANTIFY preliminary emissions (Hooret al., 2009) and QUANTIFY final emissions used here. The largestchanges in the O3 column between the simulations using thepreliminary and final emissions are seen for ROAD and AIR. Inaddition to changes in the emissions inventories, there have alsobeen model improvements and updates by many of the modellinggroups over the two-year period in which the QUANTIFY emissionswere updated. p-TOMCAT is the only model with a reduction inthe O3 column change for all three transport sectors between
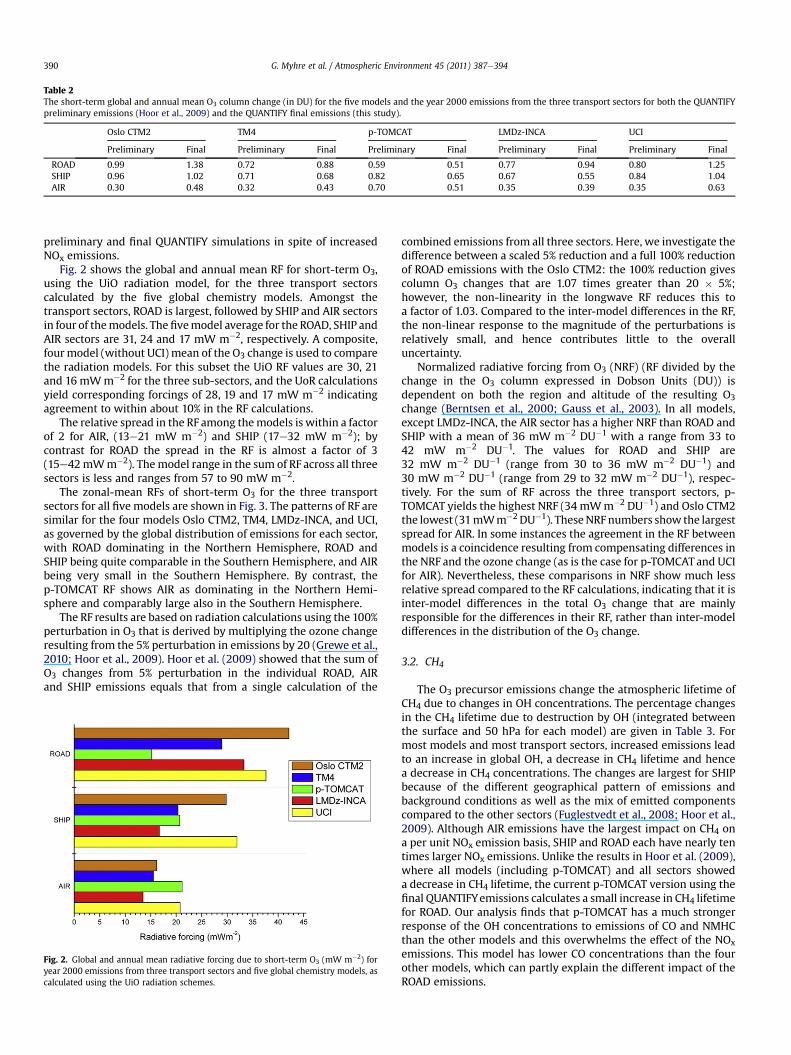
Table 2The short-term global and annual mean O3 column change (in DU) for the five models and the year 2000 emissions from the three transport sectors for both the QUANTIFYpreliminary emissions (Hoor et al., 2009) and the QUANTIFY final emissions (this study).
Oslo CTM2 TM4 p-TOMCAT LMDz-INCA UCI
Preliminary Final Preliminary Final Preliminary Final Preliminary Final Preliminary Final
ROAD 0.99 1.38 0.72 0.88 0.59 0.51 0.77 0.94 0.80 1.25SHIP 0.96 1.02 0.71 0.68 0.82 0.65 0.67 0.55 0.84 1.04AIR 0.30 0.48 0.32 0.43 0.70 0.51 0.35 0.39 0.35 0.63
G. Myhre et al. / Atmospheric Environment 45 (2011) 387e394390
preliminary and final QUANTIFY simulations in spite of increasedNOx emissions.
Fig. 2 shows the global and annual mean RF for short-term O3,using the UiO radiation model, for the three transport sectorscalculated by the five global chemistry models. Amongst thetransport sectors, ROAD is largest, followed by SHIP and AIR sectorsin four of themodels. The fivemodel average for the ROAD, SHIP andAIR sectors are 31, 24 and 17 mW m�2, respectively. A composite,four model (without UCI) mean of the O3 change is used to comparethe radiation models. For this subset the UiO RF values are 30, 21and 16 mWm�2 for the three sub-sectors, and the UoR calculationsyield corresponding forcings of 28, 19 and 17 mW m�2 indicatingagreement to within about 10% in the RF calculations.
The relative spread in the RF among themodels is within a factorof 2 for AIR, (13e21 mW m�2) and SHIP (17e32 mW m�2); bycontrast for ROAD the spread in the RF is almost a factor of 3(15e42mWm�2). Themodel range in the sum of RF across all threesectors is less and ranges from 57 to 90 mW m�2.
The zonal-mean RFs of short-term O3 for the three transportsectors for all five models are shown in Fig. 3. The patterns of RF aresimilar for the four models Oslo CTM2, TM4, LMDz-INCA, and UCI,as governed by the global distribution of emissions for each sector,with ROAD dominating in the Northern Hemisphere, ROAD andSHIP being quite comparable in the Southern Hemisphere, and AIRbeing very small in the Southern Hemisphere. By contrast, thep-TOMCAT RF shows AIR as dominating in the Northern Hemi-sphere and comparably large also in the Southern Hemisphere.
The RF results are based on radiation calculations using the 100%perturbation in O3 that is derived by multiplying the ozone changeresulting from the 5% perturbation in emissions by 20 (Grewe et al.,2010; Hoor et al., 2009). Hoor et al. (2009) showed that the sum ofO3 changes from 5% perturbation in the individual ROAD, AIRand SHIP emissions equals that from a single calculation of the
Fig. 2. Global and annual mean radiative forcing due to short-term O3 (mW m�2) foryear 2000 emissions from three transport sectors and five global chemistry models, ascalculated using the UiO radiation schemes.
combined emissions from all three sectors. Here, we investigate thedifference between a scaled 5% reduction and a full 100% reductionof ROAD emissions with the Oslo CTM2: the 100% reduction givescolumn O3 changes that are 1.07 times greater than 20 � 5%;however, the non-linearity in the longwave RF reduces this toa factor of 1.03. Compared to the inter-model differences in the RF,the non-linear response to the magnitude of the perturbations isrelatively small, and hence contributes little to the overalluncertainty.
Normalized radiative forcing from O3 (NRF) (RF divided by thechange in the O3 column expressed in Dobson Units (DU)) isdependent on both the region and altitude of the resulting O3change (Berntsen et al., 2000; Gauss et al., 2003). In all models,except LMDz-INCA, the AIR sector has a higher NRF than ROAD andSHIP with a mean of 36 mW m�2 DU�1 with a range from 33 to42 mW m�2 DU�1. The values for ROAD and SHIP are32 mW m�2 DU�1 (range from 30 to 36 mW m�2 DU�1) and30 mW m�2 DU�1 (range from 29 to 32 mW m�2 DU�1), respec-tively. For the sum of RF across the three transport sectors, p-TOMCAT yields the highest NRF (34 mWm�2 DU�1) and Oslo CTM2the lowest (31mWm�2 DU�1). TheseNRF numbers show the largestspread for AIR. In some instances the agreement in the RF betweenmodels is a coincidence resulting from compensating differences inthe NRF and the ozone change (as is the case for p-TOMCATand UCIfor AIR). Nevertheless, these comparisons in NRF show much lessrelative spread compared to the RF calculations, indicating that it isinter-model differences in the total O3 change that are mainlyresponsible for the differences in their RF, rather than inter-modeldifferences in the distribution of the O3 change.
3.2. CH4
The O3 precursor emissions change the atmospheric lifetime ofCH4 due to changes in OH concentrations. The percentage changesin the CH4 lifetime due to destruction by OH (integrated betweenthe surface and 50 hPa for each model) are given in Table 3. Formost models and most transport sectors, increased emissions leadto an increase in global OH, a decrease in CH4 lifetime and hencea decrease in CH4 concentrations. The changes are largest for SHIPbecause of the different geographical pattern of emissions andbackground conditions as well as the mix of emitted componentscompared to the other sectors (Fuglestvedt et al., 2008; Hoor et al.,2009). Although AIR emissions have the largest impact on CH4 ona per unit NOx emission basis, SHIP and ROAD each have nearly tentimes larger NOx emissions. Unlike the results in Hoor et al. (2009),where all models (including p-TOMCAT) and all sectors showeda decrease in CH4 lifetime, the current p-TOMCAT version using thefinal QUANTIFYemissions calculates a small increase in CH4 lifetimefor ROAD. Our analysis finds that p-TOMCAT has a much strongerresponse of the OH concentrations to emissions of CO and NMHCthan the other models and this overwhelms the effect of the NOxemissions. This model has lower CO concentrations than the fourother models, which can partly explain the different impact of theROAD emissions.

Fig. 3. Zonal and annual mean radiative forcing (mW m�2) from short-term O3 for five global chemistry models. Each panel shows results for year 2000 emissions from threetransport sectors.
G. Myhre et al. / Atmospheric Environment 45 (2011) 387e394 391
The resulting RF for year 2000 due to CH4 change from thetransport sector (including the transient effect but not the CH4-induced changes in O3 and stratospheric water vapour) is shown inFig. 4. This CH4 RF is larger for SHIP than ROAD and AIR. The inter-model difference in the CH4 RF is rather small for SHIP, witha spread of only 8 mW m�2 for an average RF of �27 mW m�2. ForAIR, all models show a negative RF, with a mean of �7.3 mW m�2
and a relatively higher spread of 4.4 mW m�2. The ROAD RF fromCH4 varies little among four global models, �12 to �14 mW m�2,but p-TOMCAT gives þ1 mW m�2, reducing the magnitude of themean RF for ROAD for the CH4 lifetime to �10 mW m�2.
3.3. RF due to short-term O3 and CH4 changes combined
The net RF of short-term O3 and long-term CH4 combined (andnow including the CH4 impacts on O3 and stratospheric water
Table 3CH4 lifetimes (yr) due to destruction by OH (between the surface and 50 hPa) for thebase case and the relative changes due to year 2000 emissions from three transportsectors e the values are derived from a 5% change in emissions for each sector andthen multiplied by 20. The feedback effect of changes in CH4 on its own lifetime isnot included in this Table.
Oslo CTM2 TM4 p-TOMCAT LMDz-INCA UCI
Base (years) 8.29 8.59 9.38 9.02 7.81Road % �1.77 �1.62 0.12 �1.54 �1.78Ship % �3.74 �4.14 �3.45 �3.14 �4.24Air % �0.81 �1.22 �1.55 �1.04 �1.57
vapour) are shown in Fig. 5. All five models have a positive net RFfor ROAD and AIR and a negative RF for SHIP. For ROAD, the netforcing varies from 9.3 to 21 mWm�2, with a mean of 16 mW m�2.For SHIP, the range is �12 to �25 mW m�2 with a meanof �18 mW m�2. Although the general agreement in Fig. 5 is quiteencouraging in terms of absolute RF, the degree of agreement is less
Fig. 4. Global and annual mean radiative forcing for the year 2000 due to CH4 changes(mW m�2) accounting for the time-history of the emissions (see text for details) forthree transport sectors and five global chemistry models.
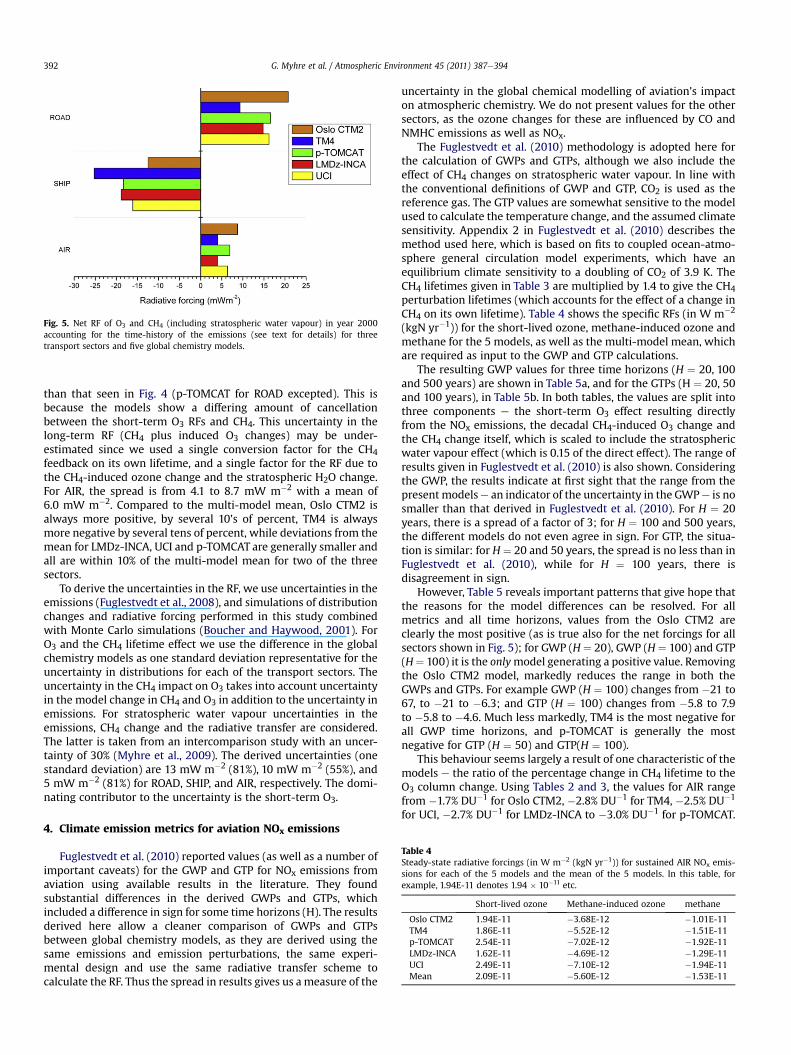
Fig. 5. Net RF of O3 and CH4 (including stratospheric water vapour) in year 2000accounting for the time-history of the emissions (see text for details) for threetransport sectors and five global chemistry models.
Table 4Steady-state radiative forcings (in W m�2 (kgN yr�1)) for sustained AIR NOx emis-sions for each of the 5 models and the mean of the 5 models. In this table, forexample, 1.94E-11 denotes 1.94 � 10�11 etc.
Short-lived ozone Methane-induced ozone methane
Oslo CTM2 1.94E-11 �3.68E-12 �1.01E-11TM4 1.86E-11 �5.52E-12 �1.51E-11p-TOMCAT 2.54E-11 �7.02E-12 �1.92E-11LMDz-INCA 1.62E-11 �4.69E-12 �1.29E-11UCI 2.49E-11 �7.10E-12 �1.94E-11Mean 2.09E-11 �5.60E-12 �1.53E-11
G. Myhre et al. / Atmospheric Environment 45 (2011) 387e394392
than that seen in Fig. 4 (p-TOMCAT for ROAD excepted). This isbecause the models show a differing amount of cancellationbetween the short-term O3 RFs and CH4. This uncertainty in thelong-term RF (CH4 plus induced O3 changes) may be under-estimated since we used a single conversion factor for the CH4feedback on its own lifetime, and a single factor for the RF due tothe CH4-induced ozone change and the stratospheric H2O change.For AIR, the spread is from 4.1 to 8.7 mW m�2 with a mean of6.0 mW m�2. Compared to the multi-model mean, Oslo CTM2 isalways more positive, by several 10’s of percent, TM4 is alwaysmore negative by several tens of percent, while deviations from themean for LMDz-INCA, UCI and p-TOMCAT are generally smaller andall are within 10% of the multi-model mean for two of the threesectors.
To derive the uncertainties in the RF, we use uncertainties in theemissions (Fuglestvedt et al., 2008), and simulations of distributionchanges and radiative forcing performed in this study combinedwith Monte Carlo simulations (Boucher and Haywood, 2001). ForO3 and the CH4 lifetime effect we use the difference in the globalchemistry models as one standard deviation representative for theuncertainty in distributions for each of the transport sectors. Theuncertainty in the CH4 impact on O3 takes into account uncertaintyin the model change in CH4 and O3 in addition to the uncertainty inemissions. For stratospheric water vapour uncertainties in theemissions, CH4 change and the radiative transfer are considered.The latter is taken from an intercomparison study with an uncer-tainty of 30% (Myhre et al., 2009). The derived uncertainties (onestandard deviation) are 13 mW m�2 (81%), 10 mW m�2 (55%), and5 mW m�2 (81%) for ROAD, SHIP, and AIR, respectively. The domi-nating contributor to the uncertainty is the short-term O3.
4. Climate emission metrics for aviation NOx emissions
Fuglestvedt et al. (2010) reported values (as well as a number ofimportant caveats) for the GWP and GTP for NOx emissions fromaviation using available results in the literature. They foundsubstantial differences in the derived GWPs and GTPs, whichincluded a difference in sign for some time horizons (H). The resultsderived here allow a cleaner comparison of GWPs and GTPsbetween global chemistry models, as they are derived using thesame emissions and emission perturbations, the same experi-mental design and use the same radiative transfer scheme tocalculate the RF. Thus the spread in results gives us a measure of the
uncertainty in the global chemical modelling of aviation’s impacton atmospheric chemistry. We do not present values for the othersectors, as the ozone changes for these are influenced by CO andNMHC emissions as well as NOx.
The Fuglestvedt et al. (2010) methodology is adopted here forthe calculation of GWPs and GTPs, although we also include theeffect of CH4 changes on stratospheric water vapour. In line withthe conventional definitions of GWP and GTP, CO2 is used as thereference gas. The GTP values are somewhat sensitive to the modelused to calculate the temperature change, and the assumed climatesensitivity. Appendix 2 in Fuglestvedt et al. (2010) describes themethod used here, which is based on fits to coupled ocean-atmo-sphere general circulation model experiments, which have anequilibrium climate sensitivity to a doubling of CO2 of 3.9 K. TheCH4 lifetimes given in Table 3 are multiplied by 1.4 to give the CH4perturbation lifetimes (which accounts for the effect of a change inCH4 on its own lifetime). Table 4 shows the specific RFs (in W m�2
(kgN yr�1)) for the short-lived ozone, methane-induced ozone andmethane for the 5 models, as well as the multi-model mean, whichare required as input to the GWP and GTP calculations.
The resulting GWP values for three time horizons (H ¼ 20, 100and 500 years) are shown in Table 5a, and for the GTPs (H ¼ 20, 50and 100 years), in Table 5b. In both tables, the values are split intothree components e the short-term O3 effect resulting directlyfrom the NOx emissions, the decadal CH4-induced O3 change andthe CH4 change itself, which is scaled to include the stratosphericwater vapour effect (which is 0.15 of the direct effect). The range ofresults given in Fuglestvedt et al. (2010) is also shown. Consideringthe GWP, the results indicate at first sight that the range from thepresent modelse an indicator of the uncertainty in the GWPe is nosmaller than that derived in Fuglestvedt et al. (2010). For H ¼ 20years, there is a spread of a factor of 3; for H ¼ 100 and 500 years,the different models do not even agree in sign. For GTP, the situa-tion is similar: for H ¼ 20 and 50 years, the spread is no less than inFuglestvedt et al. (2010), while for H ¼ 100 years, there isdisagreement in sign.
However, Table 5 reveals important patterns that give hope thatthe reasons for the model differences can be resolved. For allmetrics and all time horizons, values from the Oslo CTM2 areclearly the most positive (as is true also for the net forcings for allsectors shown in Fig. 5); for GWP (H ¼ 20), GWP (H ¼ 100) and GTP(H¼ 100) it is the onlymodel generating a positive value. Removingthe Oslo CTM2 model, markedly reduces the range in both theGWPs and GTPs. For example GWP (H ¼ 100) changes from �21 to67, to �21 to �6.3; and GTP (H ¼ 100) changes from �5.8 to 7.9to �5.8 to �4.6. Much less markedly, TM4 is the most negative forall GWP time horizons, and p-TOMCAT is generally the mostnegative for GTP (H ¼ 50) and GTP(H ¼ 100).
This behaviour seems largely a result of one characteristic of themodels e the ratio of the percentage change in CH4 lifetime to theO3 column change. Using Tables 2 and 3, the values for AIR rangefrom �1.7% DU�1 for Oslo CTM2, �2.8% DU�1 for TM4, �2.5% DU�1
for UCI, �2.7% DU�1 for LMDz-INCA to �3.0% DU�1 for p-TOMCAT.

Table 5Global Warming Potentials (GWP) and Global Temperature change Potentials (GTP) for year 2000 AIR NOx emissions (a) GWP values for one-year pulse emissions of NOx fora 20, 100 and 500 year time horizons and (b) GTP values for 20, 50 and 100 years. The first three numbers show the individual contributions from the short-lived O3, the CH4-induced O3 and the CH4 (which includes stratospheric water vapour changes), respectively; the net GWP and GTP are shown in bold. The mean values use the multi-modelmeans of the specific forcings (Table 4) and lifetimes (Table 3). All numbers are rounded, so that the net values may not be the sum of numbers as they are presented here. Allvalues are on a per kg N basis and are relative to CO2. The GTP values are specific to a given value of climate sensitivity e see text for details.
(a) GWP H ¼ 20 H ¼ 100 H ¼ 500
Oslo CTM2 785 � 115 � 333 ¼ 338 223 � 41 � 116 ¼ 67 68 � 12 � 5 ¼ 20TM4 753 � 170 � 490 ¼ 92 214 � 61 � 174 ¼ �21 65 � 19 � 53 ¼ �6.3p-TOMCAT 1028 � 209 � 601 ¼ 218 292 � 78 � 221 ¼ �6.3 89 � 24 � 67 ¼ �2.0LMDz-INCA 656 � 142 � 411 ¼ 103 186 � 52 � 148 ¼ �14 57 � 16 � 45 ¼ �4.2UCI 1008 � 226 � 654 ¼ 128 287 � 78 � 223 ¼ �15 87 � 24 � 68 ¼ �4.5Mean 846 � 173 � 496 ¼ 177 241 � 62 � 176 ¼ 2.7 73 � 19 � 54 ¼ 0.8Range of net 92 to 338 �21 to 67 �6.3 to 20Fuglestvedt et al. (2010) range of net 120 to 470 �2.1 to 71 �0.7 to 22
(b) GTP H ¼ 20 H ¼ 50 H ¼ 100
Oslo CTM2 248 � 271 � 97 ¼ �121 39 � 55 � 20 ¼ �37 32 � 18 � 6.2 ¼ 7.9TM4 238 � 406 � 145 ¼ �313 37 � 87 � 31 ¼ �81 30 � 27 � 9.4 ¼ �5.6p-TOMCAT 324 � 510 � 183 ¼ �369 51 � 122 � 44 ¼ �115 41 � 35 � 12.3 ¼ �5.8LMDz-INCA 206 � 343 � 123 ¼ �259 32 � 78 � 28 ¼ �74 26 � 23 � 8.1 ¼ �4.7UCI 318 � 526 � 188 ¼ �396 50 � 100 � 36 ¼ �86 41 � 34 � 11.7 ¼ �4.6Mean 267 � 412 � 147 ¼ �292 42 � 88 � 32 ¼ �79 34 � 27 � 9.5 ¼ �4.1Range of net �396 to �121 �115 to �37 �5.8 to 7.9Fuglestvedt et al. (2010) range of net �590 to �200 �210 to �59 �9.5 to 7.6
G. Myhre et al. / Atmospheric Environment 45 (2011) 387e394 393
Hence, for the Oslo CTM2 model the compensating effect of thenegative forcing due to CH4 and its resulting effect on stratosphericwater vapour and O3 is smaller than for the other models. Thedifferences in CH4 lifetime between the models (Table 4) have onlya small influence on the range of results.
If the reason why the models differ in ratio of CH4 change to O3change can be understood, there is hope for a marked reduction inthe inter-model range in the estimated net RF from transport and inmetrics such as the GWP and GTP. However, as is clear in Table 5,evenwhen models agree in the net value of a metric, the individualcomponents contributing to this net value can be quite different efor example, UCI and p-LMDz-INCA agree well in the net for bothmetrics and most time horizons, but disagree significantly for thethree components; this effect is traceable to the larger change in O3in UCI compared to LMDz-INCA (see Table 2).
5. Conclusions
We have investigated the RF for the year 2000 due to changes inO3 and CH4 caused by the transport sector, using five globalchemistry models and two radiationmodels. We find the differencebetween ROAD, SHIP and AIR to be robust across all models. For theyear 2000, this study reduces the CH4 and CH4-induced O3 impactsto account for the slower response of CH4 perturbations to changesin OH. It also includes the effect of CH4 changes on stratosphericwater vapour. The results are also used to present values of GWPand GTP for AIR NOx emissions which are based on a range of globalchemistry models adopting the same experimental design.
Fuglestvedt et al. (2008) found, based on one global chemistrytransport model and one radiative transfer model, a year 2000 RFfor the combined effect of O3 and CH4 amounting to 42 mW m�2
for ROAD, �11 mW m�2 for SHIP and 12 mW m�2 for AIR, based ona different set of emissions (see Fig. 1). The multi-model meansobtained here are 16 mW m�2, �18 mW m�2 and 6.0 mW m�2
respectively. The ROAD and AIR are significantly smaller in thepresent analysis than in (Fuglestvedt et al., 2008), while SHIP issignificantly more negative. Various factors explain the differ-ences. First, the emissions are different. As a consequence, a lowerozone production (at least for ROAD with lower CO and NHMCemissions) and hence less net positive radiative forcing is
calculated. Second, the secondary consequences of methanechanges included here (i.e. responses in O3 and stratospheric H2O)increase the negative radiative forcings. Third, the Oslo CTM2,which was used in the Fuglestvedt et al. (2008) study is seen hereto produce results at the upper end of the spectrum, comparedwith the multi-model mean. All three factors act together to lowerthe calculated radiative forcing from the transport sectorscompared to the values in Fuglestvedt et al. (2008). The RF for thecombined effect of O3 and CH4 can be compared to the RF due toCO2 which has previously been estimated to be 150 mW m�2,35 mW m�2, 21 mW m�2 for ROAD, SHIP, and AIR, respectively(Fuglestvedt et al., 2008).
The results reported here with the QUANTIFY inventories can becompared with the previous Hoor et al. (2009) results usingpreliminary QUANTIFY inventories, where the multi-model meanswere 7.3 mW m�2, �26 mW m�2 and 2.9 mW m�2 for ROAD, SHIPand AIR, respectively. For SHIP and AIR part of the difference is dueto account being taken here of the lack of steady state of the CH4field with the changed OH field, which reduces the size of the CH4offset to the positive short-term O3 forcing. The factor of more thantwo change for ROADhas a number of identified reasons (emissions,model updates, andmethod for CH4 RF calculations); the short-termO3 forcing is only changed by about 10% while the offset resultingfrom the changedOHfield is nowsmaller. Based on themuch higheremissions of CO andNMHC in Fuglestvedt et al. (2008) it is expectedthat the O3 RF for ROAD was higher in that study compared to Hooret al. (2009) and this study (see Fig. 1). On robustness and uncer-tainties for road transport, the O3 RF is highly dependent on thebackground NOx emissions used in the model, including those frompower generation, agriculture, lightning and biomass burning.
The inter-model absolute differences are smaller when thecombined effects of O3 and CH4 RFs are calculated than they are forthe, short-term O3 RF alone. Nevertheless, the combined O3 andCH4 RF from individual models can deviate by many tens of percentfrom the multi-model mean. One significant factor in these differ-ences, and the difference in the aviation climate emission metrics,is the ratio of the percentage change in CH4 lifetime to the columnO3 change. If the underlying reasons for this ratio could be under-stood, there is the possibility of markedly decreasing the inter-model differences.
G. Myhre et al. / Atmospheric Environment 45 (2011) 387e394394
The RF resulting from the effect of transport-related emissionson ozone and methane reported here must be combined withestimates of the transport-related RF from aerosols and CO2(e.g. Balkanski et al., 2010) to improve understanding of the overallimpact of the transport sector on climate.
Acknowledgements
The QUANTIFY project is funded by the European Union withinthe 6th Framework Programme under contract 003893 and theNorwegian Research Council. The reviewers are thanked for theirhelpful comments.
References
Balkanski, Y., Myhre, G., Gauss, M., Rädel, G., Highwood, E.J., et al., 2010. Directradiative effect of aerosols emitted by transport: from road, shipping andaviation. Atmos. Chem. Phys. 10, 4477e4489.
Berglen, T.F., Berntsen, T.K., Isaksen, I.S.A., Sundet, J.K., 2004. A global model of thecoupled sulfur/oxidant chemistry in the troposphere: the sulfur cycle. J. Geo-phys. Res. 109 (D19), D19310. doi:10.1029/2003JD003948.
Berntsen, T.K., Fuglestvedt, J.S., Joshi, M.M., Shine, K.P., Stuber, N., et al., 2005.Response of climate to regional emissions of ozone precursors: sensitivities andwarming potentials. Tellus 57 (4), 283e304.
Berntsen, T.K., Myhre, G., Stordal, F., Isaksen, I.S.A., 2000. Time evolution of tropo-spheric ozone and its radiative forcing. J. Geophys. Res. 105 (D7), 8915e8930.
Boucher, O., Haywood, J., 2001. On summing the components of radiative forcing ofclimate change. Clim. Dynam. 18 (3e4), 297e302.
Edwards, J.M., Slingo, A., 1996. Studies with a flexible new radiation code. I: Choosinga configuration for a large-scale model. Q.J.R. Meteorol.Soc. 122, 689e719.
Folberth, G.A., Hauglustaine, D.A., Lathiere, J., Brocheton, F., 2006. Interactivechemistry in the Laboratoire de Meteorologie Dynamique general circulationmodel: model description and impact analysis of biogenic hydrocarbons ontropospheric chemistry. Atmos. Chem. Phys. 6, 2273e2319.
Forster, P., Ramaswamy, V., Artaxo, P., Berntsen, T., Betts, R., et al., 2007. Changes inatmospheric constituents and in radiative forcing. In: Solomon, S., Qin, D.,Manning, M., Chen, Z., Marquis, M., et al. (Eds.), Climate Change 2007: ThePhysical Science Basis. Contribution of Working Group I to the Fourth Assess-ment Report of the Intergovernmental Panel on Climate Change. CambridgeUniversity Press, United Kingdom and New York, NY, USA.
Fuglestvedt, J., Berntsen, T., Myhre, G., Rypdal, K., Skeie, R.B., 2008. Climate forcingfrom the transport sectors. Proc. Natl. Acad. Sci. U S A 105 (2), 454e458.
Fuglestvedt, J.S., Berntsen, T.K., Isaksen, I.S.A., Mao, H.T., Liang, X.Z., et al., 1999.Climatic forcing of nitrogen oxides through changes in tropospheric ozone andmethane; global 3D model studies. Atmos. Environ. 33 (6), 961e977.
Fuglestvedt, J.S., Shine, K.P., Cook, J., Berntsen, T., Lee, D.S., et al., 2010. Assessment oftransport impacts on climate and ozone: metrics. Atmos. Environ. 44,4648e4677. doi:10.1016/j.atmosenv.2009.04.044.
Gauss, M., Myhre, G., Isaksen, I.S.A., Grewe, V., Pitari, G., et al., 2006. Radiativeforcing since preindustrial times due to ozone change in the troposphere andthe lower stratosphere. Atmos. Chem. Phys. 6, 575e599.
Gauss, M., Myhre, G., Pitari, G., Prather, M.J., Isaksen, I.S.A., et al., 2003. Radiativeforcing in the 21st century due to ozone changes in the troposphere and thelower stratosphere. J. Geophys. Res. 108 (D9), 4292.
Grewe, V., Stenke, A., 2008. AirClim: an efficient tool for climate evaluation ofaircraft technology. Atmos. Chem. Phys. 8 (16), 4621e4639.
Grewe, V., Tsati, E., Hoor, P., 2010. On the attribution of contributions of atmospherictrace gases to emissions in atmospheric model applications. Geosci. Model Dev.3, 487e499.
Hauglustaine, D.A., Hourdin, F., Jourdain, L., Filiberti, M.A., Walters, S., et al., 2004.Interactive chemistry in the Laboratoire de Meteorologie Dynamique generalcirculation model: description and background tropospheric chemistry evalu-ation. J. Geophys. Res. 109 (D4), D04314.
Hoor, P., Borken-Kleefeld, J., Caro, D., Dessens, O., Endresen, O., et al., 2009. Theimpact of traffic emissions on atmospheric ozone and OH: results fromQUANTIFY. Atmos. Chem. Phys. 9 (9), 3113e3136.
Hsu, J., Prather, M.J., Wild, O., 2005. Diagnosing the stratosphere-to-troposphereflux of ozone in a chemistry transport model. J. Geophys. Res. 110 (D19),D19305.
Isaksen, I.S.A., Zerefos, C., Kourtidis, K., Meleti, C., Dalsoren, S.B., et al., 2005.Tropospheric ozone changes at unpolluted and semipolluted regions inducedby stratospheric ozone changes. J. Geophys. Res. 110 (D2), D02302.
Kvalevåg, M.M., Myhre, G., 2007. Human impact on direct and diffuse solar radia-tion during the industrial era. J. Clim. 20 (19), 4874e4883.
Lelieveld, J., Crutzen, P.J., Dentener, F.J., 1998. Changing concentration, lifetime andclimate forcing of atmospheric methane. Tellus 50 (2), 128e150.
Myhre, G., Karlsdottir, S., Isaksen, I.S.A., Stordal, F., 2000. Radiative forcing due tochanges in tropospheric ozone in the period 1980 to 1996. J. Geophys. Res. 105(D23), 28935e28942.
Myhre, G., Kvalevag, M., Radel, G., Cook, J., Shine, K.P., et al., 2009. Intercomparisonof radiative forcing calculations of stratospheric water vapour and contrails.Meteorol. Z. 18 (6), 585e596.
Myhre, G., Nilsen, J.S., Gulstad, L., Shine, K.P., Rognerud, B., et al., 2007. Radiativeforcing due to stratospheric water vapour from CH4 oxidation. Geophys. Res.Lett. 34 (1), L01807.
Naik, V., Mauzerall, D., Horowitz, L., Schwarzkopf, M.D., Ramaswamy, V., et al., 2005.Net radiative forcing due to changes in regional emissions of troposphericozone precursors. J. Geophys. Res. 110 (D24), D24306.
O’Connor, F., Carver, G., Savage, N., Pyle, J., Methven, J., et al., 2005. Comparison andvisualisation of high-resolution transport modelling with aircraft measure-ments. Atmos. Sci. Lett. 6, 164e170. doi:10.1002/asl.111.
Prather, M., Ehhalt, D., Dentener, F., Derwent, R., Dlugokencky, E., et al., 2001.Atmospheric chemistry and greenhouse gases. e. a.. In: Houghton, J.T. (Ed.),Climate Change 2001: The Scientific Basis, Contribution of Working Group I tothe Third Assessment Report of the Intergovernmental Panel on ClimateChange. Cambridge University Press, Cambridge, United Kingdom and NewYork, NY, USA, pp. 239e287.
Prather, M.J., 1994. Lifetimes and eigenstates in atmospheric chemistry. Geophys.Res. Lett. 21 (9), 801e804.
Ramaswamy, V., Boucher, O., Haigh, J., Hauglustaine, D., Haywood, J., et al., 2001.Radiative forcing of climate change. In: Houghton, J.T., et al. (Eds.), ClimateChange 2001: The Scientific Basis, Contribution of Working Group I to the ThirdAssessment Report of the Intergovernmental Panel on Climate Change. Cam-bridge University Press, Cambridge, United Kingdom and New York, NY, USA,pp. 349e416.
Shindell, D.T., Faluvegi, G., Bell, N., Schmidt, G.A., 2005. An emissions-based view ofclimate forcing by methane and tropospheric ozone. Geophys. Res. Lett. 32 (4),L04803.
Shindell, D.T., Faluvegi, G., Koch, D.M., Schmidt, G.A., Unger, N., et al., 2009.Improved attribution of climate forcing to emissions. Science 326 (5953),716e718.
Sitch, S., Cox, P.M., Collins, W.J., Huntingford, C., 2007. Indirect radiative forcing ofclimate change through ozone effects on the land-carbon sink. Nature 448(7155), 791e794.
Skeie, R.B., Fuglestvedt, J., Berntsen, T., Lund, M.T., Myhre, G., et al., 2009. Globaltemperature change from the transport sectors: historical development andfuture scenarios. Atmos. Environ. 43 (39), 6260e6270.
Uherek, E., Halenka, T., Borken-Kleefeld, J., Balkanski, Y., Berntsen, T., et al., 2010.Transport impacts on atmosphere and climate: land transport. Atmos. Environ.44, 4772e4816.
Unger, N., Shindell, D.T., Koch, D.M., Amann, M., Cofala, J., et al., 2006. Influences ofman-made emissions and climate changes on tropospheric ozone, methane,and sulfate at 2030 from a broad range of possible futures. J. Geophys. Res. 111(D12), D12313.
van Noije, T.P.C., Eskes, H.J., Dentener, F.J., Stevenson, D.S., Ellingsen, K., et al., 2006.Multi-model ensemble simulations of tropospheric NO2 compared with GOMEretrievals for the year 2000. Atmos. Chem. Phys. 6, 2943e2979.
Wild, O., Prather, M.J., 2000. Excitation of the primary tropospheric chemical modein a global three-dimensional model. J. Geophys. Res. 105 (D20), 24647e24660.
Wild, O., Prather, M.J., Akimoto, H., 2001. Indirect long-term global radiative coolingfrom NOx emissions. Geophys. Res. Lett. 28 (9), 1719e1722.
Wild, O., Sundet, J.K., Prather, M.J., Isaksen, I.S.A., Akimoto, H., et al., 2003. Chemicaltransport model ozone simulations for spring 2001 over the western Pacific:comparisons with TRACE-P lidar, ozonesondes, and Total Ozone MappingSpectrometer columns. J. Geophys. Res. 108 (D21), 8826.
Williams, J.E., Scheele, M.P., van Velthoven, P.F.J., Cammas, J.P., Thouret, V., et al.,2009. The influence of biogenic emissions from Africa on tropical troposphericozone during 2006: a global modeling study. Atmos. Chem. Phys. 9 (15),5729e5749.
Williams, J.E., Scheele, M.P., van Velthoven, P.F.J., Thouret, V., Saunois, M., et al.,2010. The influence of biomass burning on tropospheric composition over thetropical Atlantic Ocean and Equatorial Africa during the West African monsoonin 2006. Atmos. Chem. Phys. Discuss. 10, 7507e7552.