Aerosol distributions and radiative forcing over the Asian Pacific region simulated by Spectral...
10
Aerosol distributions and radiative forcing over the Asian Pacific region simulated by Spectral Radiation-Transport Model for Aerosol Species (SPRINTARS) Toshihiko Takemura, 1 Teruyuki Nakajima, 2 Akiko Higurashi, 3 Sachio Ohta, 4 and Nobuo Sugimoto 3 Received 25 November 2002; revised 20 February 2003; accepted 24 March 2003; published 6 August 2003. [1] A three-dimensional aerosol transport-radiation model coupled with a general circulation model, Spectral Radiation-Transport Model for Aerosol Species (SPRINTARS), simulates atmospheric aerosol distributions and optical properties. The simulated results are compared with aerosol sampling and optical observations from ground, aircraft, and satellite acquired by intensive observation campaigns over east Asia in spring 2001. Temporal variations of the aerosol concentrations, optical thickness, and A ˚ ngstro ¨m exponent are in good agreement between the simulation and observations. The midrange values of the A ˚ ngstro ¨m exponent, even at the Asian dust storm events over the outflow regions, suggest that the contribution of the anthropogenic aerosol, such as carbonaceous and sulfate, to the total optical thickness is of an order comparable to that of the Asian dust. The radiative forcing by the aerosol direct and indirect effects is also calculated. The negative direct radiative forcing is simulated to be over 10 W m 2 at the tropopause in the air mass during the large-scale dust storm, to which both anthropogenic aerosols and Asian dust contribute almost equivalently. The direct radiative forcing, however, largely depends on the cloud water content and the vertical profiles of aerosol and cloud. The simulation shows that not only sulfate and sea salt aerosols but also black carbon and soil dust aerosols, which absorb solar and thermal radiation, make strong negative radiative forcing by the direct effect at the surface, which may exceed the positive forcing by anthropogenic greenhouse gases over the east Asian region. INDEX TERMS: 0305 Atmospheric Composition and Structure: Aerosols and particles (0345, 4801); 0365 Atmospheric Composition and Structure: Troposphere—composition and chemistry; 0368 Atmospheric Composition and Structure: Troposphere—constituent transport and chemistry; 3359 Meteorology and Atmospheric Dynamics: Radiative processes; KEYWORDS: aerosol, global model, radiative forcing, ACE-Asia, APEX, dust Citation: Takemura, T., T. Nakajima, A. Higurashi, S. Ohta, and N. Sugimoto, Aerosol distributions and radiative forcing over the Asian Pacific region simulated by Spectral Radiation-Transport Model for Aerosol Species (SPRINTARS), J. Geophys. Res., 108(D23), 8659, doi:10.1029/2002JD003210, 2003. 1. Introduction [2] Atmospheric aerosols have a harmful influence on the respiration system of man and animals so that the emission control of aerosols originating from industrial activities is being enforced mainly in developed nations. For instance, sulfate aerosols and sulfur dioxide in the atmosphere, which are one of the main origins of acid rain, tend to decrease by the introduction of low-sulfur fuel and desulfurizers. In Asian countries, however, the emission of anthropogenic aerosols and their precursor gases is predicted to continue increasing for the next several decades with the recent rapid growth of the economy and population [Intergovernmental Panel on Climate Change (IPCC), 2000]. The scale and frequency of Asian dust storms in springtime have also rapidly increased since 2000, which made visibility and the atmospheric environment worse in northern China, Korea, and Japan. The Asian dust storms were detected by satellite retrievals from the Total Ozone Mapping Spectrom- eter (TOMS) and the Sea-viewing Wide Field-of-view Sensor (SeaWiFS); it was found that the huge dust storms reached North America by crossing the North Pacific Ocean [Takemura et al., 2002a; Thulasiraman et al., 2002]. [3] The variation of spatial distributions of aerosol par- ticles also causes a change in the earth’s radiation budget through two effects. One is a direct effect in which aerosol particles scatter and absorb the solar and thermal radiation. The other is an indirect effect in which they alter the microphysical and optical properties of cloud droplets acting JOURNAL OF GEOPHYSICAL RESEARCH, VOL. 108, NO. D23, 8659, doi:10.1029/2002JD003210, 2003 1 Research Institute for Applied Mechanics, Kyushu University, Fukuoka, Japan. 2 Center for Climate System Research, University of Tokyo, Tokyo, Japan. 3 National Institute for Environmental Studies, Tsukuba, Japan. 4 Graduate School of Engineering, Hokkaido University, Sapporo, Japan. Copyright 2003 by the American Geophysical Union. 0148-0227/03/2002JD003210$09.00 ACE 27 - 1
Transcript of Aerosol distributions and radiative forcing over the Asian Pacific region simulated by Spectral...

Aerosol distributions and radiative forcing over the Asian Pacific
region simulated by Spectral Radiation-Transport Model
for Aerosol Species (SPRINTARS)
Toshihiko Takemura,1 Teruyuki Nakajima,2 Akiko Higurashi,3 Sachio Ohta,4
and Nobuo Sugimoto3
Received 25 November 2002; revised 20 February 2003; accepted 24 March 2003; published 6 August 2003.
[1] A three-dimensional aerosol transport-radiation model coupled with a generalcirculation model, Spectral Radiation-Transport Model for Aerosol Species(SPRINTARS), simulates atmospheric aerosol distributions and optical properties. Thesimulated results are compared with aerosol sampling and optical observations fromground, aircraft, and satellite acquired by intensive observation campaigns over east Asiain spring 2001. Temporal variations of the aerosol concentrations, optical thickness, andAngstrom exponent are in good agreement between the simulation and observations.The midrange values of the Angstrom exponent, even at the Asian dust storm events overthe outflow regions, suggest that the contribution of the anthropogenic aerosol, such ascarbonaceous and sulfate, to the total optical thickness is of an order comparable to that ofthe Asian dust. The radiative forcing by the aerosol direct and indirect effects is alsocalculated. The negative direct radiative forcing is simulated to be over �10 W m�2 at thetropopause in the air mass during the large-scale dust storm, to which both anthropogenicaerosols and Asian dust contribute almost equivalently. The direct radiative forcing,however, largely depends on the cloud water content and the vertical profiles of aerosoland cloud. The simulation shows that not only sulfate and sea salt aerosols but also blackcarbon and soil dust aerosols, which absorb solar and thermal radiation, make strongnegative radiative forcing by the direct effect at the surface, which may exceed the positiveforcing by anthropogenic greenhouse gases over the east Asian region. INDEX TERMS:
0305 Atmospheric Composition and Structure: Aerosols and particles (0345, 4801); 0365 Atmospheric
Composition and Structure: Troposphere—composition and chemistry; 0368 Atmospheric Composition and
Structure: Troposphere—constituent transport and chemistry; 3359 Meteorology and Atmospheric Dynamics:
Radiative processes; KEYWORDS: aerosol, global model, radiative forcing, ACE-Asia, APEX, dust
Citation: Takemura, T., T. Nakajima, A. Higurashi, S. Ohta, and N. Sugimoto, Aerosol distributions and radiative forcing over the
Asian Pacific region simulated by Spectral Radiation-Transport Model for Aerosol Species (SPRINTARS), J. Geophys. Res.,
108(D23), 8659, doi:10.1029/2002JD003210, 2003.
1. Introduction
[2] Atmospheric aerosols have a harmful influence on therespiration system of man and animals so that the emissioncontrol of aerosols originating from industrial activities isbeing enforced mainly in developed nations. For instance,sulfate aerosols and sulfur dioxide in the atmosphere, whichare one of the main origins of acid rain, tend to decrease bythe introduction of low-sulfur fuel and desulfurizers. InAsian countries, however, the emission of anthropogenic
aerosols and their precursor gases is predicted to continueincreasing for the next several decades with the recent rapidgrowth of the economy and population [IntergovernmentalPanel on Climate Change (IPCC), 2000]. The scale andfrequency of Asian dust storms in springtime have alsorapidly increased since 2000, which made visibility andthe atmospheric environment worse in northern China,Korea, and Japan. The Asian dust storms were detected bysatellite retrievals from the Total Ozone Mapping Spectrom-eter (TOMS) and the Sea-viewing Wide Field-of-viewSensor (SeaWiFS); it was found that the huge dust stormsreached North America by crossing the North Pacific Ocean[Takemura et al., 2002a; Thulasiraman et al., 2002].[3] The variation of spatial distributions of aerosol par-
ticles also causes a change in the earth’s radiation budgetthrough two effects. One is a direct effect in which aerosolparticles scatter and absorb the solar and thermal radiation.The other is an indirect effect in which they alter themicrophysical and optical properties of cloud droplets acting
JOURNAL OF GEOPHYSICAL RESEARCH, VOL. 108, NO. D23, 8659, doi:10.1029/2002JD003210, 2003
1Research Institute for Applied Mechanics, Kyushu University,Fukuoka, Japan.
2Center for Climate System Research, University of Tokyo, Tokyo,Japan.
3National Institute for Environmental Studies, Tsukuba, Japan.4Graduate School of Engineering, Hokkaido University, Sapporo,
Japan.
Copyright 2003 by the American Geophysical Union.0148-0227/03/2002JD003210$09.00
ACE 27 - 1
as cloud condensation nuclei (CCN). Twomey [1974] indi-cated that an increase in aerosol particles causes an increasein the cloud droplet number concentration and a decrease inthe cloud droplet size for a fixed liquid water content,leading to a high cloud albedo (the first indirect effect).Albrecht [1989] indicated that a reduction of the clouddroplet size results in an increase of the liquid water contentby a decrease of precipitation efficiency (the second indirecteffect). The confidence level of the aerosol radiative forcingestimated by the Intergovernmental Panel on ClimateChange [IPCC, 2001] is, however, much lower than thoseof the greenhouse gases and ozone. The global meanradiative forcing due to anthropogenic aerosols was estimatedto be �0.5 W m�2 with an uncertainty factor of 2 for thedirect effect and 0 to �2.0 W m�2 without a plausible valuefor the first indirect effect by IPCC [2001]. The secondindirect effect could not even be evaluated. One of thereasons for the uncertainty is in the difficulty of modelingfor simulating global aerosol distributions because of thecomplex characteristics of aerosol particles such as variousorigins, short lifetime, complex chemical components, andvarious size distributions. In recent studies distributions of allthe main tropospheric aerosol species have been simulatedmore precisely with the global models by comparing aerosolmass concentrations and optical properties with manyground-based and satellite observations [Chin et al., 2002;Takemura et al., 2002b]. In the Asian region, however,aerosol observations have been insufficient for validatingaerosol models and understanding the aerosol effects on theclimate system. The Asian atmospheric environment hasbeen worsened rapidly by Asian dust and anthropogenicgases and aerosols in recent years.[4] To break the insufficiency of the observational fre-
quency and network on Asian atmospheric aerosols, twoprojects have been organized: APEX (Asian AtmosphericParticulate Environmental Change Studies) and ACE-Asia(Asian Pacific Regional Aerosol Characterization Experi-ment). APEX is a Japanese project to operate from 1999 to2004; its purpose is to understand cloud-aerosol interactionand the change of the radiative budget by aerosols andclouds (T. Nakajima et al., Significance of direct andindirect radiative forcings of aerosols in the east ChinaSea region, submitted to Journal of Geophysical Research,2003, hereinafter referred to as Nakajima et al., submittedmanuscript, 2003). Intensive observation campaigns usingground-based, airborne, shipboard, and satellite instrumentswere carried out in December 2000 (APEX-E1) and April2001 (APEX-E2) around Amami-Oshima (129.7�E,28.4�N). ACE-Asia was an international intensive observa-tion project carried out off the coast of China, Japan, andKorea from March to May 2001 [Huebert et al., 2003]. Inthis study the three-dimensional distributions of aerosolmass concentrations and optical properties were simulatedby the global aerosol model, SPRINTARS (Spectral Radi-ation-Transport Model for Aerosol Species), and comparedwith various observed data acquired by APEX and ACE-Asia in order to confirm the accuracy of the simulation andto analyze observed results over the east Asian region.Since SPRINTARS can simultaneously calculate both thedirect and indirect aerosol radiative forcings, they arediscussed for the Asian region. The model description isgiven in section 2. Section 3 shows the monthly mean
characteristics of the Asian dust and anthropogenic aerosoldistributions in December 2000 (APEX-E1) and April2001 (APEX-E2/ACE-Asia) simulated by SPRINTARS.The simulated aerosol mass concentrations and opticalproperties are also compared with the ground-based filtersamplings and optical observations by satellite, aircraft, andlidar. In section 5 the aerosol radiative forcing calculated bySPRINTARS is discussed. Our conclusions are presented insection 6.
2. Model Description
[5] The three-dimensional global aerosol climate model,SPRINTARS, has been developed at the Center for ClimateSystem Research (CCSR), University of Tokyo. The modelsimultaneously treats the main tropospheric aerosols, that is,carbonaceous (organic carbon (OC) and black carbon (BC)),sulfate, soil dust, and sea salt, and the precursor gases ofsulfate, that is, sulfur dioxide (SO2) and dimethylsulfide(DMS). The aerosol transport processes include emission,advection, diffusion, sulfur chemistry, wet deposition, drydeposition, and gravitational settling. The model is drivenby the atmospheric general circulation model (AGCM) ofCCSR in common with the National Institute for Environ-mental Studies (NIES), Japan [Numaguti et al., 1995]; theradiation scheme in CCSR/NIES AGCM [Nakajima et al.,2000] is extended to the radiative process related withaerosol particles for SPRINTARS. The horizontal resolutionof the triangular truncation is set at T42 (approximately 2.8�by 2.8� in latitude and longitude) and the vertical resolutionat 11 layers (sigma level based on the surface pressure at0.995, 0.980, 0.950, 0.900, 0.815, 0.679, 0.513, 0.348,0.203, 0.092, and 0.021). The present study uses theNational Centers for Environmental Prediction (NECP)/National Center for Atmospheric Research (NCAR) every6-hour reanalysis data for nudging the wind, temperature,and specific humidity during the specific period. Thedetailed explanations for SPRINTARS are described byTakemura et al. [2000] for the aerosols transport processesand by Takemura et al. [2002b] for the revised transportprocesses and the radiative process.[6] A few emission data for carbonaceous and SO2 are
renewed for the 2000/2001 simulation. The anthropogenicSO2 emission flux is based on the Special Report onEmissions Scenarios (SRES) [IPCC, 2000]. It is divided intofour regions of the world (OECD; eastern Europe and theformer Soviet Union; Asia; Africa, Middle East, and LatinAmerica); then the gridded emission pattern within eachregion follows the Global Emissions Inventory Activities(GEIA) database for SO2 [Benkovitz et al., 1996]. Thecarbonaceous aerosol emission fluxes are based on SRESfor fossil fuel, biomass burning, and biofuel origins, but theyare not included directly in the SRES data set. Therefore thecarbonaceous aerosol emission inventory is made fromthe SRES CO2 emission, which is then scaled and griddedby the GEIA database for fossil fuel and biomass burningsources [Cooke and Wilson, 1996] and the original data forbiofuel sources [Takemura et al., 2000]. The simulation alsoincludes the SO2 emission from the large-scale continuouseruption of Miyakejima Island (139.5�E, 34.1�N) with tem-poral variation, which is important for calculating the appro-priate aerosol distribution in east Asia from 2000 to 2002.
ACE 27 - 2 TAKEMURA ET AL.: AEROSOLS OVER THE ASIAN PACIFIC REGION

[7] The present study considers both the first and secondaerosol indirect effects only for stratus cloud. The clouddroplet number concentration Nc is diagnosed referring tothe observation by Martin et al. [1994]:
Nc ¼eNaNm
eNa þ Nm
; ð1Þ
where Na is the aerosol number concentration excluding soildust aerosols, and e and Nm are constants. The role of soildust aerosols in CCN is poorly understood so that they areexcluded from Na in equation (1), though they may act asCCN if other hydrophilic aerosols are internally mixed withthem. The Berry’s parameterization is adapted to theprecipitation rate P, which depends not only on cloud watermixing ratio l, but also on Nc [Berry, 1967]:
P ¼ � dl
dt¼ arl2
bþ gNc
rl
; ð2Þ
where t is time, r is the air density, and a, b, and g areconstants. If the function of the cloud droplet sizedistribution is fixed, its effective radius reff is decided asfollows:
reff ¼ k3
4prw
rlNc
� �13
; ð3Þ
where rw is the water density and k is an empirical constant.The indirect radiative forcing in this study is defied as thedifference of the radiative budget between the simulationsgiven the standard aerosol emission data set and thenonanthropogenic emission from east Asia.
3. Results and Discussion
3.1. Simulated Distributions of Asian Aerosols
[8] Figure 1 shows the monthly mean distributions of theoptical thickness at 0.55 mm for soil dust aerosols andcarbonaceous plus sulfate aerosols in December 2000 andApril 2001 simulated by SPRINTARS. The Asian dustevents are rarely observed in winter due to the high-pressuresystem over the source regions, which is consistent withonly a small amount of dust emission from the Takla MakanDesert in December 2000 in the simulation. Anthropogenicaerosols originating from the east Asian continent andadditionally from southeast Asia by biomass burning aretransported to the east. The optical thickness of carbonaceousplus sulfate aerosols is over 0.5 around the source region.Therefore the observational data acquired by APEX-E1 isuseful for analyzing anthropogenic aerosols without mixingof the Asian dust in east Asia. The simulation alsoindicates that the sulfate aerosol formed from the volcanicSO2 of the Miyakejima Island is a large contributor to airturbidity.[9] In the spring, on the other hand, the dust events
frequently occur because the developing cyclone passes
Figure 1. Monthly mean distributions of the optical thickness at 0.55 mm for (a) soil dust aerosols and(b) carbonaceous plus sulfate aerosols in December 2000 and April 2001 simulated by SPRINTARS.
TAKEMURA ET AL.: AEROSOLS OVER THE ASIAN PACIFIC REGION ACE 27 - 3

through desert areas every several days. The simulationsuggests that the Gobi Desert is also a main dust source,where is east of the Takla Makan Desert, so that the Asiandust is easily transported to Korea, Japan, and the NorthPacific. The large-scale Asian dust storm early in April 2001was simulated to reach the west coast of North Americacrossing by the North Pacific Ocean by SPRINTARS, ofwhich the temporal and spatial patterns are closely similar tothe aerosol index retrieved from the TOMS observation[Takemura et al., 2002a]. Anthropogenic aerosols are trans-ported more northward in spring than in winter becausecyclones often move to the east between 40� to 60�N, whilethe northwest wind is predominant in winter. Takemura et al.[2002a] indicated that a large amount of anthropogenicaerosols was transported to the North Pacific mixing withsoil dust aerosols during the large-scale Asian dust stormearly in April 2001, which was attributed to the developedcyclone. Figure 1b also shows that the optical thickness ofanthropogenic aerosols reduces near the source region andthat they diffuse further in spring than in winter. This is dueto not only frequent passages of cyclones but also theinstability of the atmosphere.
3.2. Comparisons With Observations
[10] There is a large volume of observational data regard-ing the aerosol mass and optical characteristics in the springof 2001 acquired during APEX-E2 and ACE-Asia. Figure 2shows comparisons between the simulated total aerosol
mass concentration and the particle matter concentrationbelow the 10-mm diameter (PM10) observed by the AcidDeposition and Oxidant Research Center (ADORC). Largeparticles, such as soil dust and sea salt aerosols, are maincontributors to the PM10 concentration, so that the highPM10 concentration suggests the arrival of Asian dust ineast Asia. The simulation represents the observed temporalvariation well over the coast of the Japan Sea (Figure 2a).The dust storms arrived in early and the latter half of March,mid-April, and mid-May with the eastward migration ofdeveloped cyclones. At Okinawa Island, southwest ofJapan, the high PM10 concentrations were observed duringthe same periods as the Japan Sea side (Figure 2b). Thissuggests that the aerosol concentration was high along thecold front, which was clearly shown by Takemura et al.[2002a]. The simulated total aerosol concentration is, how-ever, underestimated because of the weak southward flow ofAsian dust in Figure 2b, although the temporal variation isin reasonable agreement with the observation. It is also aninteresting point that both the observation and simulationshow much larger temporal variations of aerosol concen-trations at Hedo than Sado because the location is near theeast Asian continent that has various natural and anthropo-genic aerosol sources.[11] Figure 3 shows a time series of the simulated BC and
SO42� concentrations in comparison with the observation at
Amami-Oshima acquired by APEX-E2 in April 2001. It isimpossible to detect either of them from the PM10 or total
Figure 2. Comparison of the simulated total aerosol mass concentration (solid line) with the observedPM10 concentration (dashed line) in mg m�3 from March to May 2001 at (a) Sado (38.0�N, 138.4�E) and(b) Hedo (26.8�N, 128.2�E).
Figure 3. Comparison of the simulated mass concentration (solid line) with the observation (dashedline) for (a) BC and (b) SO4
2� in mg m�3 in April 2001 at Amami-Oshima (28.4�N, 129.7�E).
ACE 27 - 4 TAKEMURA ET AL.: AEROSOLS OVER THE ASIAN PACIFIC REGION
aerosol concentrations, such as Figure 2, because the ratioof their mass concentrations to total aerosols is much lowerthan that of soil dust aerosols due to their small particle size.Both the BC and SO4
2� concentrations are in good agree-ment between the simulation and observation. The temporalvariation is closely similar to that of the total aerosolconcentration shown in Figure 2b. The high BC andSO4
2� concentrations in mid-April according to the hightotal aerosol concentration suggest the arrival of the air massincluding both anthropogenic aerosols and Asian dust overJapan although their source regions are quite different.[12] It is important to compare the simulated aerosol
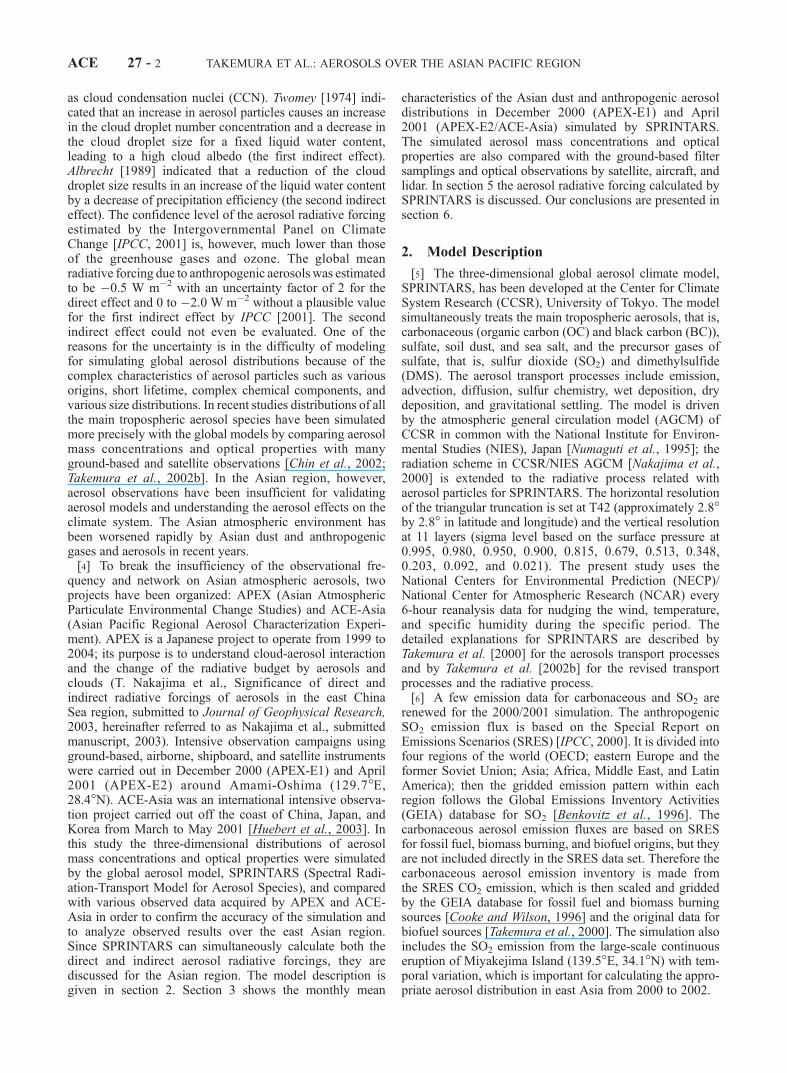
optical properties with observations from satellite, ground,and aircraft because they directly relate to the estimation ofthe aerosol direct radiative forcing. In Figure 4, the regionaldaily mean values of the simulated aerosol optical thicknessand Angstrom exponent are compared with the SeaWiFSretrieval in spring 2001 [Higurashi and Nakajima, 2002].The Angstrom exponent is an aerosol size index which isdefined as the log-slope exponent of the spectral opticalthickness between two wavelengths. The observation byAerosol Robotic Network (AERONET) indicates the repre-sentative values of the Angstrom exponent to be from 1.2 to
2.5 in urban areas and from 0.1 to 0.9 in desert areas[Dubovik et al., 2002]. The simulated optical thickness isshown for each aerosol component. The temporal variationsof the simulation and observation are in reasonable agree-ment for both the optical thickness and Angstrom exponent,although the regional mean values of the SeaWiFS aerosoloptical thickness tend to be greater than the simulatedvalues because the SeaWiFS data can be retrieved onlyunder clear-sky conditions and because it is difficult to pickup the pixel data only under clear-sky conditions from thesimulated results. The difference between the simulated andSeaWiFS Angstrom exponents over the east China Seamight occur not only by the simulated weak southwardoutflow of Asian dust as shown in Figure 2b but also by thepeculiar ocean color due to the Asian dust outflow from therivers. The mean biases of the simulated optical thickness tothe SeaWiFS one are 35, 28, 28, and 29% over Yellow Sea,east China Sea, Japan Sea, and northwest Pacific Ocean,respectively. The mean standard deviations of the biases ofthe Angstrom exponent between them are 0.22, 0.20, 0.17,0.15, respectively. The agreement between the simulatedand observed Angstrom exponent around 10 April when thelarge-scale Asian dust storm happened suggests that the
Figure 4. Time series of the simulated optical thickness for each aerosol component (column),simulated Angstrom exponent (red line), SeaWiFS optical thickness (black line with dot), and SeaWiFSAngstrom exponent (black line with square) from 21 March to 31 May 2001 over the (a) Yellow Sea(35�–41�N, 117�–127�E), (b) east China Sea (25�–35�N, 119�–130�E), (c) Japan Sea (35�–50�N,127�–142�E), and (d) northwest Pacific Ocean (35�–50�N, 142�–160�E). Error bars in the SeaWiFSretrieval show the standard deviation in each target area.
TAKEMURA ET AL.: AEROSOLS OVER THE ASIAN PACIFIC REGION ACE 27 - 5

ratio of the optical thickness of anthropogenic aerosols tothat of soil dust aerosols is simulated well by SPRINTARS,which is clearly shown by the comparisons over the JapanSea and northwest Pacific Ocean (Figures 4c and 4d). Thesimulation indicates that the contribution of anthropogenicaerosols to the total optical thickness is the same order ofmagnitude or grater than that of dust particles even duringthe dust events in the outflow regions.[13] It is necessary to properly calculate not only the
horizontal distribution but also the vertical profiles becausethe aerosol direct radiative forcing depends much on therelative altitude between aerosol and cloud layers, whichwill be discussed in the next section. Figure 5 shows thetime series of the simulated vertical profiles of the aerosolextinction coefficient with the lidar observation at Beijing,China, several hundreds kilometer away from the GobiDesert [Shimizu et al., 2003]. The simulation reproduceswell the high extinction coefficient in mid-March, earlyApril, the end of April to early May, and in mid-May, all ofwhich show the Asian dust events, though the lidar datacannot be sometimes retrieved due to vast dust loadings.Aerosol particles usually concentrate below 1.5 km, whilethe extinction coefficient is high also above 1.5 km duringthe arrival of the large-scale Asian dust storms.[14] The vertical profiles of aerosol optical properties
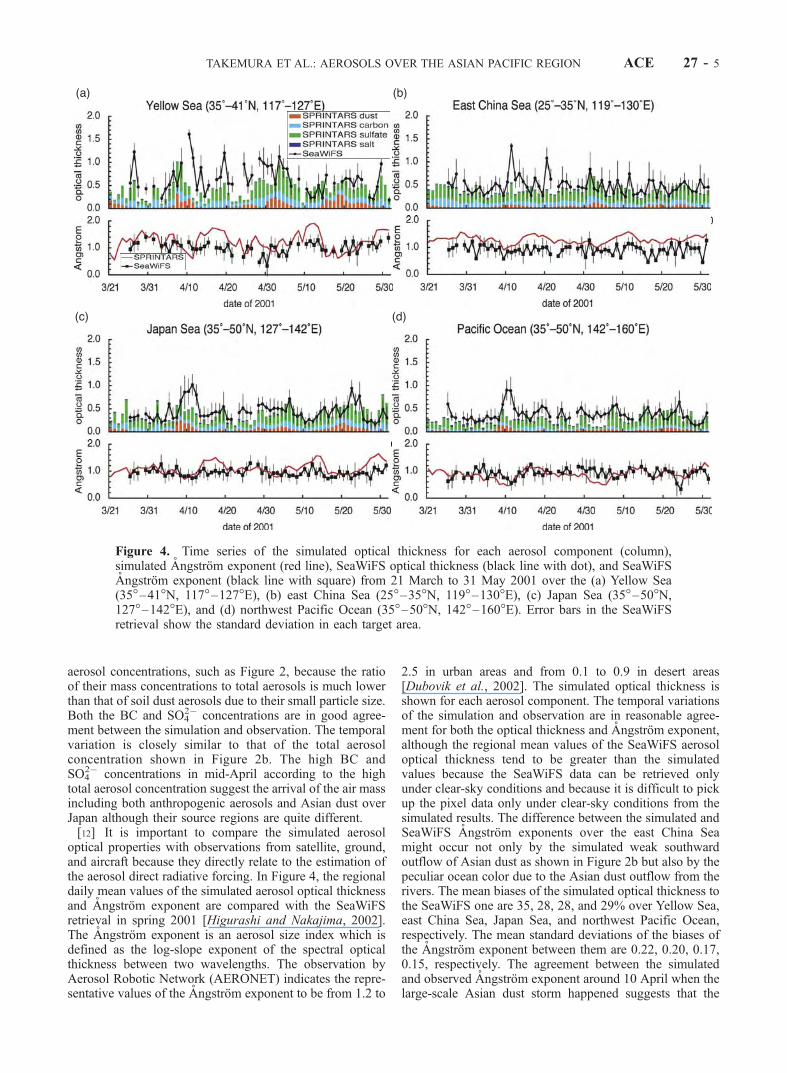
were also measured by the C-130 flights in ACE-Asia[Anderson et al., 2003]. Figure 6 shows the comparisonof the simulated aerosol extinction, Angstrom exponent, andsingle scattering albedo with the two characteristic C-130
observations. To analyze the Angstrom exponent makesdistinction between soil dust and anthropogenic aerosolspossible as indicated in Figure 4. In Figure 6a, the obser-vational result shows that anthropogenic aerosols are prom-inent below 2 km as suggested by the large Angstromexponent value, while the main contributor to the extinctionis found to be soil dust aerosols above 2 km. On the otherhand, the observed Angstrom exponent is rather homoge-neous in Figure 6b. These characteristics of the verticalprofiles are represented well by SPRINTARS.
4. Direct and Indirect Radiative Forcings
[15] In the previous section, it was shown thatSPRINTARS reproduces the aerosol concentration, opticalthickness, and Angstrom exponent in the Asian region indetail in spite of the coarse grid of the global model. Thesimulated aerosol radiative forcing is then discussed toconsider the effect of aerosol particles on the climatesystem. Figures 7a to 7e show the daily mean distributionsof the simulated aerosol optical properties on 10 April 2001.The optical thickness is large along the cold front over theJapan Sea due to the transportation of the large-scale Asiandust storm; the outflow of anthropogenic carbonaceous andsulfate aerosols from the southern coastal region of Chinaalso causes serious air pollution. The Angstrom exponent iscalculated to be small over the northern Chinese region ascaused by Asian dust, while it is large over southeast Asiadue to biomass burning mainly by agricultural activities. Ittakes intermediate values around 1.0 off the east Asiancontinent because Asian dust and anthropogenic aerosolsare intermingled as discussed in the previous section. Thesimulated single scattering albedo is above 0.9 over almostall regions, except for southeast Asia and India because ofthe relatively high BC emission. The imaginary part of therefractive index of soil dust aerosols is revised to 0.002 atthe visible wavelength in this study from 0.008 which isbased on the old World Meteorological Organization rec-ommendation [World Climate Research, 1983] because thesimulated single scattering albedo by the previous versionof SPRINTARS is much lower than the retrieved data fromthe AERONET [Takemura et al., 2002b]. This revisionresults in good agreement between the simulated andobserved single scattering albedo even in the dust layer asshown in Figure 6a.[16] The simulated direct radiative forcing under a clear-
sky condition shows strong negative forcing over the largeoptical thickness region, while it is positive north of 50�Ndue to the high surface albedo at the tropopause (Figure 7d).The daily mean value of the direct radiative forcing iscalculated in excess of �10 W m�2 along the coast of theeast Asian continent. The contribution of anthropogenicaerosols to this large negative direct radiative forcing is30 to 70% in the simulation. Under the whole-sky condi-tion, which includes overcast areas, the direct radiativeforcing is also positive over a part of the Pacific Ocean(Figure 7e). It is supposed that this is caused by absorbingstrongly the multiple-scattered radiation of Asian dust andBC enhanced by the presence of low clouds. Figure 7fshows the simulated vertical distributions of the soil dustconcentration and cloud water content along 152�E. Itindicates that the Asian dust transport at an altitude between
Figure 5. Time series of the vertical profiles of theaerosol extinction coefficient (a) simulated by SPRINTARSand (b) retrieved from the lidar observation in km�1 fromMarch to May 2001 at Beijing, China.
ACE 27 - 6 TAKEMURA ET AL.: AEROSOLS OVER THE ASIAN PACIFIC REGION
1 and 3 km and the low-level clouds below 1 km makestrong positive forcing above the middle troposphere be-tween 40�N and 50�N. The importance of the relativealtitude of aerosol and cloud layers for aerosol directradiative forcing was pointed out for the general condition[Haywood and Ramaswamy, 1998; Liao and Seinfeld, 1998;Takemura et al., 2002b].[17] Table 1 shows monthly regional mean values of the
direct radiative forcing for each aerosol component from90�E to 152�E and from 15�N to 52�N in April 2001. Asmentioned above, it is much different under clear- andwhole-sky conditions, especially for carbonaceous aerosolswhich have negative and positive forcings at the tropopause,
respectively. It is characteristic of soil dust aerosols to take alarge positive forcing at longwave radiation, so that thenegative forcing at shortwave radiation is largely cancelled.The sulfate negative forcing at the tropopause is about threetimes as large as that of the global mean estimated by IPCC[2001] and Takemura et al. [2002b], which indicates thatanthropogenic aerosols severely affect the radiation budgetover east Asia. The simulation also shows that the differ-ence of the radiative forcings between the tropopause andsurface is large for aerosol particles absorbing the radiation,such as carbonaceous and soil dust aerosols. It is difficult toestimate an uncertainty of the simulated direct radiativeforcing because it is related with a lot of aerosol optical
Figure 6. Comparison of the vertical profiles between the simulated (line) and C-130 flight (dot)aerosol scattering coefficient in km�1 (upper figure), Angstrom exponent (middle figure), and singlescattering albedo (bottom figure) over the (a) western Japan on 23 April and (b) southwestern Japan on30 April 2001. The shown data are 2-hour mean values for the simulation and 1-minute mean for theobservation. Both the simulated and observed extinction coefficient and single scattering albedo are at0.55 mm.
TAKEMURA ET AL.: AEROSOLS OVER THE ASIAN PACIFIC REGION ACE 27 - 7

parameters with wavelength dependence. If it must beestimated, it is about 30% in consideration of the biasbetween the simulated and observed aerosol optical thick-ness in Figure 4.[18] The cloud-aerosol interaction is calculated using
equations (1) to (3) derived from a quasi-empirical relation-ship. It is supposed that the interaction effectively occurs
over the east Asian region because of large concentrationsboth of aerosol particles and cloud droplets [Nakajima et al.,2001]. Figure 8a shows the simulated cloud effective radiusat a sigma level of 0.9, that is, an altitude about 1 km on amonthly average in April 2001. It takes small values between8 and 12 mm over eastern China, Korea, and Japan where theoutflow of anthropogenic aerosols is strong. This is consist-
Figure 7. Daily mean distributions on 10 April 2001 of the simulated aerosol (a) optical thickness at0.55 mm, (b) Angstrom exponent, (c) single scattering albedo at 0.55 mm, direct radiative forcing underthe (d) clear-sky condition and (e) whole-sky condition at the tropopause in W m�2, and (f ) verticaldistributions of the soil dust mass concentration in mg m�3 (color) and cloud water content in mg m�3
(gray) along 152�E. The white line in Figure 7e shows 152�E.
ACE 27 - 8 TAKEMURA ET AL.: AEROSOLS OVER THE ASIAN PACIFIC REGION
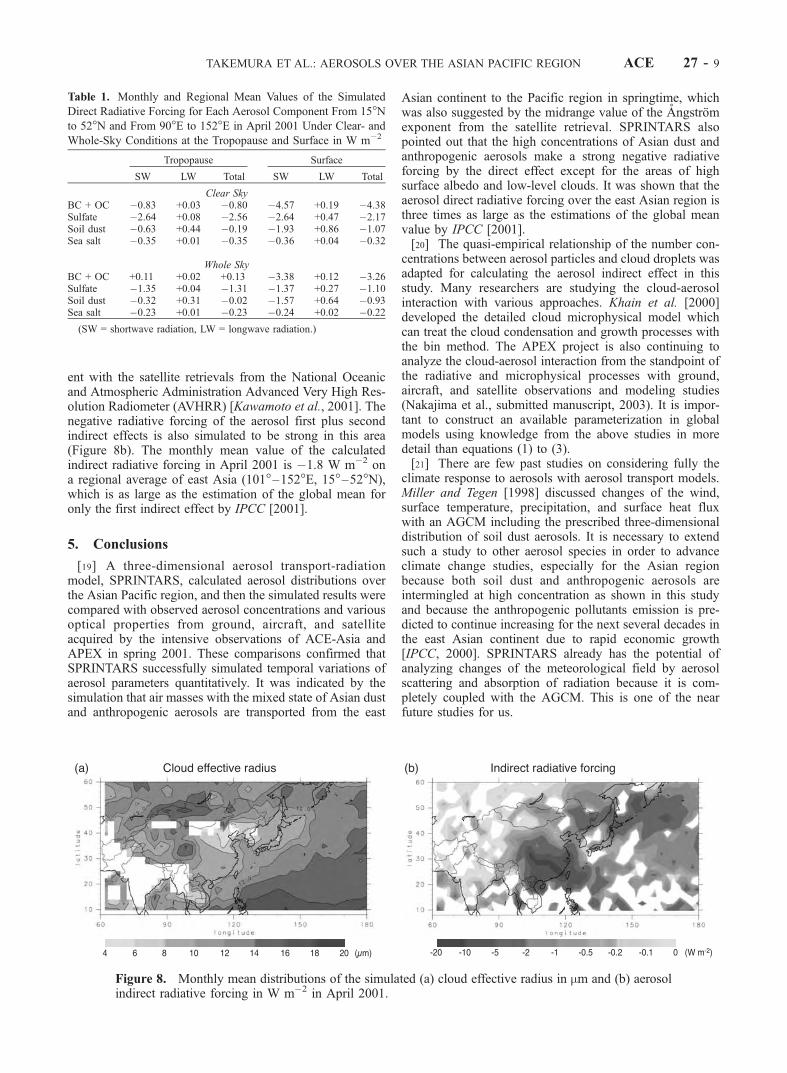
ent with the satellite retrievals from the National Oceanicand Atmospheric Administration Advanced Very High Res-olution Radiometer (AVHRR) [Kawamoto et al., 2001]. Thenegative radiative forcing of the aerosol first plus secondindirect effects is also simulated to be strong in this area(Figure 8b). The monthly mean value of the calculatedindirect radiative forcing in April 2001 is �1.8 W m�2 ona regional average of east Asia (101�–152�E, 15�–52�N),which is as large as the estimation of the global mean foronly the first indirect effect by IPCC [2001].
5. Conclusions
[19] A three-dimensional aerosol transport-radiationmodel, SPRINTARS, calculated aerosol distributions overthe Asian Pacific region, and then the simulated results werecompared with observed aerosol concentrations and variousoptical properties from ground, aircraft, and satelliteacquired by the intensive observations of ACE-Asia andAPEX in spring 2001. These comparisons confirmed thatSPRINTARS successfully simulated temporal variations ofaerosol parameters quantitatively. It was indicated by thesimulation that air masses with the mixed state of Asian dustand anthropogenic aerosols are transported from the east
Asian continent to the Pacific region in springtime, whichwas also suggested by the midrange value of the Angstromexponent from the satellite retrieval. SPRINTARS alsopointed out that the high concentrations of Asian dust andanthropogenic aerosols make a strong negative radiativeforcing by the direct effect except for the areas of highsurface albedo and low-level clouds. It was shown that theaerosol direct radiative forcing over the east Asian region isthree times as large as the estimations of the global meanvalue by IPCC [2001].[20] The quasi-empirical relationship of the number con-
centrations between aerosol particles and cloud droplets wasadapted for calculating the aerosol indirect effect in thisstudy. Many researchers are studying the cloud-aerosolinteraction with various approaches. Khain et al. [2000]developed the detailed cloud microphysical model whichcan treat the cloud condensation and growth processes withthe bin method. The APEX project is also continuing toanalyze the cloud-aerosol interaction from the standpoint ofthe radiative and microphysical processes with ground,aircraft, and satellite observations and modeling studies(Nakajima et al., submitted manuscript, 2003). It is impor-tant to construct an available parameterization in globalmodels using knowledge from the above studies in moredetail than equations (1) to (3).[21] There are few past studies on considering fully the
climate response to aerosols with aerosol transport models.Miller and Tegen [1998] discussed changes of the wind,surface temperature, precipitation, and surface heat fluxwith an AGCM including the prescribed three-dimensionaldistribution of soil dust aerosols. It is necessary to extendsuch a study to other aerosol species in order to advanceclimate change studies, especially for the Asian regionbecause both soil dust and anthropogenic aerosols areintermingled at high concentration as shown in this studyand because the anthropogenic pollutants emission is pre-dicted to continue increasing for the next several decades inthe east Asian continent due to rapid economic growth[IPCC, 2000]. SPRINTARS already has the potential ofanalyzing changes of the meteorological field by aerosolscattering and absorption of radiation because it is com-pletely coupled with the AGCM. This is one of the nearfuture studies for us.
Table 1. Monthly and Regional Mean Values of the Simulated
Direct Radiative Forcing for Each Aerosol Component From 15�Nto 52�N and From 90�E to 152�E in April 2001 Under Clear- and
Whole-Sky Conditions at the Tropopause and Surface in W m�2
Tropopause Surface
SW LW Total SW LW Total
Clear SkyBC + OC �0.83 +0.03 �0.80 �4.57 +0.19 �4.38Sulfate �2.64 +0.08 �2.56 �2.64 +0.47 �2.17Soil dust �0.63 +0.44 �0.19 �1.93 +0.86 �1.07Sea salt �0.35 +0.01 �0.35 �0.36 +0.04 �0.32
Whole SkyBC + OC +0.11 +0.02 +0.13 �3.38 +0.12 �3.26Sulfate �1.35 +0.04 �1.31 �1.37 +0.27 �1.10Soil dust �0.32 +0.31 �0.02 �1.57 +0.64 �0.93Sea salt �0.23 +0.01 �0.23 �0.24 +0.02 �0.22
(SW = shortwave radiation, LW = longwave radiation.)
Figure 8. Monthly mean distributions of the simulated (a) cloud effective radius in mm and (b) aerosolindirect radiative forcing in W m�2 in April 2001.
TAKEMURA ET AL.: AEROSOLS OVER THE ASIAN PACIFIC REGION ACE 27 - 9

[22] Acknowledgments. We thank the contributors to the develop-ment of the CCSR/NIES AGCM, A. Numaguti of Hokkaido University,who passed away in 2001, and K. Suzuki of the University of Tokyo for anidea of the parameterization of the cloud-aerosol interaction, the ADORCfor providing the measured PM10 data, and T. L. Anderson and S. J.Masonis for analyzing data acquired from C-130 flights. This study is partlysupported by the APEX project of the Core Research for EvaluationalScience and Technology of the Japan Science and Technology Corporation.
ReferencesAlbrecht, B. A., Aerosols, cloud microphysics, and fractional cloudiness,Science, 245, 1227–1230, 1989.
Anderson, T., S. J. Masonis, D. S. Covert, N. Ahlquist, S. Howell, A. D.Clarke, and C. McNaughton, Variability of aerosol optical propertiesderived from in situ aircraft measurements during ACE-Asia, J. Geophys.Res., 108, doi:10.1029/2002JD003247, in press, 2003.
Benkovitz, C. M., M. T. Scholtz, J. Pacyna, L. Tarrason, J. Dignon, E. C.Voldner, P. A. Spiro, J. A. Logan, and T. E. Graedel, Global griddedinventories of anthropogenic emissions of sulfur and nitrogen, J. Geophys.Res., 101, 29,239–29,253, 1996.
Berry, E. X., Cloud droplet growth by collection, J. Atmos. Sci., 24, 688–701, 1967.
Chin, M., P. Ginoux, S. Kinne, O. Torres, B. N. Holben, B. N. Dunkan,R. V. Martin, J. A. Logan, A. Higurashi, and T. Nakajima, Troposphericaerosol optical thickness from the GOCART model and comparisons withsatellite and sun photometer measurements, J. Atmos. Sci., 59, 461–483,2002.
Cooke, W. F., and J. J. N. Wilson, A global black carbon aerosol model,J. Geophys. Res., 101, 19,395–19,409, 1996.
Dubovik, O., B. N. Holben, T. F. Eck, A. Smirnov, Y. J. Kaufman, M. D.King, D. Tanre, and I. Slutsker, Variability of absorption and opticalproperties of key aerosol types observed in worldwide locations, J. Atmos.Sci., 59, 590–608, 2002.
Haywood, J. M., and V. Ramaswamy, Global sensitivity studies of thedirect radiative forcing due to anthropogenic sulfate and black carbonaerosols, J. Geophys. Res., 103, 6043–6058, 1998.
Higurashi, A., and T. Nakajima, Detection of aerosol types over the eastChina Sea near Japan from four-channel satellite data, Geophys. Res.Lett., 29(17), 1836, doi:10.1029/2002GL015357, 2002.
Huebert, B., T. Bates, P. Russell, G. Shi, Y. J. Kim, and K. Kawamura, Anoverview of ACE-Asia: Strategies for quantifying the relationships be-tween Asian aerosols and their climatic impacts, J. Geophys. Res., 108,doi:10.1029/2003JD003550, in press, 2003.
Intergovernmental Panel on Climate Change (IPCC), Special Reports onEmissions Scenarios, edited by N. Nakicenovic and R. Swart, 612 pp.,Cambridge Univ. Press, New York, 2000.
Intergovernmental Panel on Climate Change (IPCC), Climate Change2001: The Scientific Basis, edited by J. T. Houghton et al., 896 pp.,Cambridge Univ. Press, New York, 2001.
Kawamoto, K., T. Nakajima, and T. Y. Nakajima, A global determination ofcloud microphysics with AVHRR remote sensing, J. Clim., 14, 2054–2068, 2001.
Khain, A. P., M. Ovtchinnikov, M. Pinsky, A. Pokrovsky, and H. Krugliak,Note on the state-of-the-art numerical modeling of cloud microphysics,Atmos. Res., 55, 159–224, 2000.
Liao, H., and J. H. Seinfeld, Effects of clouds on direct aerosol radiativeforcing of climate, J. Geophys. Res., 103, 3781–3788, 1998.
Martin, G. M., D. W. Johnson, and A. Spice, The measurement and param-eterization of effective radius of droplets in warm stratocumulus clouds,J. Atmos. Sci., 51, 1823–1842, 1994.
Miller, R. L., and I. Tegen, Climate response to soil dust aerosols, J. Clim.,11, 3247–3267, 1998.
Nakajima, T., M. Tsukamoto, Y. Tsushima, A. Numaguti, and T. Kimura,Modeling of the radiative process in an atmospheric general circulationmodel, Appl. Opt., 39, 4869–4878, 2000.
Nakajima, T., A. Higurashi, K. Kawamoto, and J. E. Penner, A possiblecorrelation between satellite-derived cloud and aerosol microphysicalparameter, Geophys. Res. Lett., 28, 1171–1174, 2001.
Numaguti, A., M. Takahashi, T. Nakajima, and A. Sumi, Development ofan atmospheric general circulation model, in Climate System Dynamicsand Modeling, edited by T. Matsuno, pp. 1–27, Cent. for Clim. Sys.Res., Univ. of Tokyo, Tokyo, 1995.
Shimizu, A., N. Sugimoto, I. Matsui, K. Arao, I. Uno, T. Murayama,N. Kagawa, K. Aoki, A. Uchiyama, and A. Yamazaki, Continuous ob-servations of Asian dust and other aerosols by polarization lidars in Chinaand Japan during ACE-Asia, J. Geophys. Res., 108, doi:10.1029/2002JD003253, in press, 2003.
Takemura, T., H. Okamoto, Y. Maruyama, A. Numaguti, A. Higurashi, andT. Nakajima, Global three-dimensional simulation of aerosol opticalthickness distribution of various origins, J. Geophys. Res., 105,17,853–17,873, 2000.
Takemura, T., I. Uno, T. Nakajima, A. Higurashi, and I. Sano, Modelingstudy of long-range transport of Asian dust and anthropogenic aerosolsfrom east Asia, Geophys. Res. Lett., 29(24), 2158, doi:10.1029/2002GL016251, 2002a.
Takemura, T., T. Nakajima, O. Dubovik, B. N. Holben, and S. Kinne,Single scattering albedo and radiative forcing of various aerosol specieswith a global three-dimensional model, J. Clim., 15, 333–352, 2002b.
Thulasiraman, S., N. T. O’Neill, A. Royer, B. N. Holben, D. L. Westphal,and L. J. B. McArthur, Sunphotometric observations of the 2001 Asiandust storm over Canada and U.S., Geophys. Res., Lett., 29(8),doi:10.1029/2001GL014188, 2002.
Twomey, S., Pollution and the planetary albedo, Atmos. Environ., 8, 1251–1256, 1974.
World Climate Research, Report of the Experts Meeting on Aerosols andTheir Climatic Effects, Rep. WCP-55, edited by A. Deepak and H. E.Gerber, 107 pp., World Meteorol. Org., Geneva, 1983.
�����������������������A. Higurashi and N. Sugimoto, National Institute for Environmental
Studies, 16-2 Onogawa, Tsukuba, Ibaraki 305-8506, Japan. ([email protected]; [email protected])T. Nakajima, Center for Climate System Research, University of
Tokyo, 4-6-1 Komaba, Meguro-ku, Tokyo 153-8904, Japan. ([email protected])S. Ohta, Graduate School of Engineering, Hokkaido University, Kita 13
Nishi 8, Kita-ku, Sapporo 060-8628, Japan. ([email protected])T. Takemura, Research Institute for Applied Mechanics, Kyushu
University, 6-1 Kasuga-koen, Kasuga, Fukuoka 816-8580, Japan. ([email protected])
ACE 27 - 10 TAKEMURA ET AL.: AEROSOLS OVER THE ASIAN PACIFIC REGION