Accounting for particle non-sphericity in modeling of mineral dust radiative properties in the...
22
Accounting for particle non-sphericity in modeling of mineral dust radiative properties in the thermal infrared M. Legrand n , O. Dubovik, T. Lapyonok, Y. Derimian Laboratoire d'Optique Atmosphérique, University of Lille 1, 59655 Villeneuve d'Ascq, France article info Article history: Received 6 November 2013 Received in revised form 6 July 2014 Accepted 10 July 2014 Available online 7 August 2014 Keywords: Mineral dust Thermal infrared Particle shape T-matrix simulation Mie simulation Resonance peaks abstract Spectral radiative parameters (extinction optical depth, single scattering albedo, asym- metry factor) of spheroids of mineral dust composed of quartz and clays have been simulated at wavelengths between 7.0 and 10.2 mm using a T-matrix code. In spectral intervals with high values of complex index of refraction and for large particles, the parameters cannot be fully calculated with the code. Practically, the calculations are stopped at a truncation radius over which the particles contribution cannot thus be taken into account. To deal with this issue, we have developed and applied an accurate corrective technique of T-matrix Size Truncation Compensation (TSTC). For a mineral dust described by its AERONET standard aspect ratio (AR) distribution, the full error margin when applying the TSTC is within 0.3% (or 70.15%), whatever the radiative parameter and the wavelength considered, for quartz (the most difficult case). Large AR values limit also the possibilities of calculation with the code. The TSTC has been able to complete the calculations of the T-matrix code for a modified AERONET AR distribution with a maximum AR of 4.7 instead of 3 for the standard distribution. Comparison between the simulated properties of spheroids and of spheres of same volume confirms, in agreement with the literature, that significant differences are observed in the vicinity of the mineral resonant peaks (λ ca. 8.3–8.7 mm for quartz, ca. 9.3–9.5 mm for clays) and that they are due to absorption by the small particles. This is a favorable circumstance for the TSTC, which is concerned with the contribution of the largest particles. This technique of numerical calculation improves the accuracy of the simulated radiative parameters of mineral dust, which must lead to a progress in view of applications such as remote sensing or determination of energy balance of dust in the thermal infrared (TIR), incompletely investigated so far. & 2014 Elsevier Ltd. All rights reserved. 1. Introduction A mineral dust layer in the atmosphere constitutes a barrier limiting (i) the downward propagation of solar radiation to Earth surface and (ii) the upward propagation of terrestrial radiation, emitted primarily by Earth surface, to space. Through this double direct radiative effect, mineral dust appears as a significant potential contributor to the change of the energy balance of the planet. It scatters a fraction of solar radiation to space (parasol effect) and a fraction of terrestrial radiation emitted by the surface – leading in addition to a heating of the surface and of the lower atmosphere (reinforcing the greenhouse effect from gases, exactly like cloud cover). Thus it is of the Contents lists available at ScienceDirect journal homepage: www.elsevier.com/locate/jqsrt Journal of Quantitative Spectroscopy & Radiative Transfer http://dx.doi.org/10.1016/j.jqsrt.2014.07.014 0022-4073/& 2014 Elsevier Ltd. All rights reserved. n Corresponding author. Tel.: þ33 320436646. E-mail addresses: [email protected] (M. Legrand), [email protected] (O. Dubovik), [email protected] (T. Lapyonok), [email protected] (Y. Derimian). Journal of Quantitative Spectroscopy & Radiative Transfer 149 (2014) 219–240
-
Upload
univ-lille1 -
Category
Documents
-
view
0 -
download
0
Transcript of Accounting for particle non-sphericity in modeling of mineral dust radiative properties in the...
Contents lists available at ScienceDirect
Journal of Quantitative Spectroscopy &Radiative Transfer
Journal of Quantitative Spectroscopy & Radiative Transfer 149 (2014) 219–240
http://d0022-40
n CorrE-m
oleg.dubtatsianayevgeny
journal homepage: www.elsevier.com/locate/jqsrt
Accounting for particle non-sphericity in modeling of mineraldust radiative properties in the thermal infrared
M. Legrand n, O. Dubovik, T. Lapyonok, Y. DerimianLaboratoire d'Optique Atmosphérique, University of Lille 1, 59655 Villeneuve d'Ascq, France
a r t i c l e i n f o
Article history:Received 6 November 2013Received in revised form6 July 2014Accepted 10 July 2014Available online 7 August 2014
Keywords:Mineral dustThermal infraredParticle shapeT-matrix simulationMie simulationResonance peaks
x.doi.org/10.1016/j.jqsrt.2014.07.01473/& 2014 Elsevier Ltd. All rights reserved.
esponding author. Tel.: þ33 320436646.ail addresses: [email protected] ([email protected] (O. Dubovik),[email protected] (T. Lapyonok),[email protected] (Y. Derimian).
a b s t r a c t
Spectral radiative parameters (extinction optical depth, single scattering albedo, asym-metry factor) of spheroids of mineral dust composed of quartz and clays have beensimulated at wavelengths between 7.0 and 10.2 mm using a T-matrix code. In spectralintervals with high values of complex index of refraction and for large particles, theparameters cannot be fully calculated with the code. Practically, the calculations arestopped at a truncation radius over which the particles contribution cannot thus be takeninto account. To deal with this issue, we have developed and applied an accuratecorrective technique of T-matrix Size Truncation Compensation (TSTC). For a mineraldust described by its AERONET standard aspect ratio (AR) distribution, the full errormargin when applying the TSTC is within 0.3% (or 70.15%), whatever the radiativeparameter and the wavelength considered, for quartz (the most difficult case). Large ARvalues limit also the possibilities of calculation with the code. The TSTC has been able tocomplete the calculations of the T-matrix code for a modified AERONET AR distributionwith a maximum AR of 4.7 instead of 3 for the standard distribution. Comparison betweenthe simulated properties of spheroids and of spheres of same volume confirms, inagreement with the literature, that significant differences are observed in the vicinity ofthe mineral resonant peaks (λ ca. 8.3–8.7 mm for quartz, ca. 9.3–9.5 mm for clays) and thatthey are due to absorption by the small particles. This is a favorable circumstance for theTSTC, which is concerned with the contribution of the largest particles. This technique ofnumerical calculation improves the accuracy of the simulated radiative parameters ofmineral dust, which must lead to a progress in view of applications such as remotesensing or determination of energy balance of dust in the thermal infrared (TIR),incompletely investigated so far.
& 2014 Elsevier Ltd. All rights reserved.
1. Introduction
A mineral dust layer in the atmosphere constitutes abarrier limiting (i) the downward propagation of solar
. Legrand),
radiation to Earth surface and (ii) the upward propagationof terrestrial radiation, emitted primarily by Earth surface,to space. Through this double direct radiative effect,mineral dust appears as a significant potential contributorto the change of the energy balance of the planet. Itscatters a fraction of solar radiation to space (parasoleffect) and a fraction of terrestrial radiation emitted bythe surface – leading in addition to a heating of the surfaceand of the lower atmosphere (reinforcing the greenhouseeffect from gases, exactly like cloud cover). Thus it is of the
M. Legrand et al. / Journal of Quantitative Spectroscopy & Radiative Transfer 149 (2014) 219–240220
highest interest to study the optical properties of mineraldust, not only for its impact on solar radiation as regularlyemphasized in the scientific literature, but also on terres-trial radiation in the thermal infrared (TIR) spectrum(wavelengths from 3 to 20 mm), especially in the 10-mmatmospheric window where radiative transfer from theplanet to space can take place efficiently.
Mineral dust is (with sea salt aerosol), one of the mostabundant and widespread components of the global aero-sol system. Its global production ranges between 1000 and3000 Tg yr�1 [1]. The present study is focused on theanalysis of the desert dust – a subcategory of mineral dustrepresenting most of it (however, in this paper both termsare interchangeable in most cases; frequently, using “dust”is sufficient). Desert dust is a mixture of particles ofvariable complexity, having different sizes and shapes,constituted of various minerals, generally crystalline, ori-ginated in erodible desert soils.
These soils are classified according to their size textureas clay (grains smaller than 2 mm according to the USDAclassification), silt (grains between 2 mm and 50 mm) andsand (grains larger than 50 mm). These three basic soiltextures are then used to describe the actual soils asmixtures between them in variable fractions.
The erodible desert soils are also characterized by theirmineral composition in relation with the local geologicalfeatures at the surface and the origin of the sedimentstransported by wind and water. A consequence is that desertdust composition varies with geographical location of thesource where it is originating (see [2] and [3] on themineralogical signature of the African sources). Differentminerals do not appear in the same size ranges of the dustparticles, corresponding to the fact that clay, silt and sandgrains have not the samemineral composition [4]. The sourcescomposed of these erodible soils are activated through winddeflation by processes of grains creeping and saltation,aggregates sandblasting and final dust particles emission [5],leading to granulometric fractionation. As the soil size texturedepends on the mineral composition, a mineralogical fractio-nation occurs in association to the granulometric fractionationthrough the processes resulting in dust emission.
The surface wind speed makes an impact not only onthe dust amount uplifted in the atmosphere, but also onthe particle size distribution and composition. It has beenshown theoretically that a stronger surface wind providesa larger kinetic energy to the grains in saltation leading toemission of smaller particles through the sandblastingprocess and increasing the clay fraction [6]. This has beenverified in field experiments, confirming and explainingthe presence of a sub-micron mode for dust (between 0.5and 0.1 mm) [7]. On the other hand, it has been proposedby Thomas and Gautier [8], that the larger quartz fractionobserved in dust storms when compared with backgrounddust in a same region (using a compilation of the litera-ture, especially from [9]) would be due to a higherefficiency of the strong dust storm winds to mobilize theheavier and more massive quartz particles in the surfacesoil (compared with the clay particles). These reportedeffects of the surface wind speed are apparently contra-dictory, but they could be explained by the fact that thelarge quartz amount lifted by strong winds of a dust storm
is observed only for fresh dust insofar as the wind decayleads to a quick settling of the large quartz particles.
Further evolutions of the size distribution and of themineral composition during dust transport arise from (i)gravity settling [10], (ii) chemical reactions with atmo-spheric components, (iii) coalescence with other aerosolspecies, (iv) the interactions with water (vapor, liquid, ice).
The ensemble of mineral species present in a dustsample (see [11] for a description), determine the radiativeproperties of this dust as a combination of the radiativeproperties of each constituent mineral. The phylosilicates(kaolinite, illite, montmorillonite, chlorite, palygorskite)proceed from clay soil. The main other minerals are silica(quartz crystal or amorphous), calcium carbonate (calcitecrystal or amorphous), calcium sulfate (gypsum crystal oramorphous), iron oxides (hematite, goethite), aluminumsilicates (crystals of alkali and plagioclase feldspars), pro-ceeding principally from silt soil and to a lesser extentfrom clay and fine sand.
The radiative properties of dust are to a large extentdefined through the complex refractive index spectra ofthe constitutive mineral species. In comparison with thesolar spectra, in the TIR these spectra depend strongly onthe minerals of concern and they are usually highlyvariable with the wavelength for each mineral. This isthe case as well for the resulting radiative properties ofthese minerals (compare between solar and TIR refractiveindices, or extinction coefficients, in [12]). Particularly,extinction and absorption spectra of these minerals showresonances as peaks, frequently located at wavelengths inthe 10-mm atmospheric window, which can be used for theidentification of each mineral.
The analyses of dust composition in the laboratory arecarried out on dust samples deposited on filters. Thewavelength dispersive X-ray fluorescence and theparticle-induced X-ray emission are techniques directlyapplicable to the dust samples, leading to the quantitativeelemental composition of each sample [13]. But the rela-tion between elemental and mineral compositions isusually complicated, especially for dust samples contain-ing many minerals, making the mineral analysis approx-imate and possibly incomplete. However, such elementalanalysis can be applied to individual particles by means ofelectron microscopy [14–17]. Such approach is then help-ful to identify and measure the amount of certain minerals.For example, a Ca/S ratio close to 1 for a high S contentindicates the presence of calcium sulfate in the particle,involving primarily gypsum presence and subsidiarilyamorphous sulfate arising from the atmospheric reactionof calcium carbonate with sulfur dioxide or sulfuric acid(the method cannot discriminate between crystalline andamorphous states of the mineral). Another example is theuse of the Si/Al ratio to determine whether a phylosilicateparticle would chiefly contain illite (ratio greater than 2) orkaolinite (ratio close to 1) [17]. The limitation of theparticle numbers processed by use of the electron micro-scopy (order of 102 to 103) has been recently resolved byautomated recognition procedures enabling to considermuch larger numbers (order of 104 to 105) [18,19].
Another approach is the direct identification and quan-titative analysis of the crystalline minerals constituting the
M. Legrand et al. / Journal of Quantitative Spectroscopy & Radiative Transfer 149 (2014) 219–240 221
dust sample by X-ray diffraction [20]. This method impliesa preparation of dust samples with a minimum dust loadof 800 mg, needing a high-volume sampling and a rela-tively long exposure time [1]. The crystalline minerals areidentified and their mass fraction determined from thetotal surface of their diffraction lines in an X-ray spectro-gram. The mass fractions are then relative to the total massof the identified minerals in the sample, excluding theamorphous fraction and the undetected species. Thevariations of the crystal structure (defects) and of theelemental composition of the crystals (especially withthe phylosilicates) constitute a fundamental limit to theaccuracy of this method.
One can distinguish between particles of pure minerals(they can be monocrystalline, polycrystalline or evenaggregates) and particles composed of several differentmineral species associated into aggregates, coated parti-cles, particles with inclusions or coalesced fragments ofone or several mineral species. Falkovich et al. [14]analyzed hundreds of individual dust particles collectedin Israel during a severe event originating in the Mediter-ranean basin in March 1998. Using electron microscopy, X-ray dispersion and X-ray diffraction, they observed thatthe dust particles were mostly aggregates of differentminerals with variable elemental compositions; the frac-tion of particles of pure minerals being about 10%.
A collection of pure minerals particles is an externalmixture, while a collection of composite minerals particlesis an internal mixture. Actual desert dust is a combinationof external and internal mixtures. External and internalmixtures having the same mineral composition havedifferent radiative properties (e.g. [21], see theirFig. 14.3). The determination of the radiative propertiesof a composite particle is obtained as the complex refrac-tive index of an effective homogeneous medium. Thecorresponding effective complex refractive index is thenrelated to the complex refractive indices of the constitutiveminerals. This problem has many different approximatesolutions [22] that depend on the assumptions made asregards how the constitutive minerals are structured inthe particle. The most utilized solutions for this effectiverefractive index are [12] as follow: (i) the rule of the sum ofthe constituent refractive indices (supposed to be close)weighted with their volume fraction, (ii) the Maxwell–Garnett approximation (in case of a mineral with inclu-sions), (iii) the Bruggeman approximation (for “homoge-neous” aggregates), and (iv) the Looyenga approximation(for large porous aggregates with small inclusions [23]).
During a dust storm originating in NW Africa, TIR dustoptical depth spectra have been measured from 8 to 13 mmat M'bour, Senegal, in March 2006, by means of a Fouriertransform infrared spectrometer (FTIR) oriented in direc-tion of the Sun [24]. The photometer of the AERONETstation [25] installed at M'bour (close to Dakar; PI D.Tanré), measured simultaneously the dust VIS–NIR opticaldepth, and the corresponding particle size distribution wasretrieved from AERONET. These authors have then tenta-tively simulated their measurements of TIR dust opticaldepth, in the absence of the dust mineralogy (only withthe literature help) [8]. As a result the simulated andmeasured TIR dust optical depth spectra were found
consistent (within the measurements error bars). Thesources of error for this simulation are, in decreasingimportance: the major minerals identification and theiramount, the particles shape, the particle structure descrip-tion (external/internal mixture and the internal mixturetype(s) to be considered). The final best fit is obtained forsimulation of a dust with around 25% of internal mixture(with 50% Bruggeman type and 50% Looyenga type) ([8],see Fig. 11). Discussing their results, Thomas and Gautierindicate that different fractions of internal mixture couldhave been retrieved as well through slight changes on themineralogy and/or the size, which means that the particlesinternal structure could hardly be put in evidence byresolving the inverse problem (because its effect is withinthe experimental uncertainties). It is worth noting alsothat they could simulate a consistent dust optical depthwith only external mixture (see their Fig. 10), hardly lessaccurate around the (quartz) resonance than the best fit.
The size of optically effective particles of desert dustranges typically from tenths to hundreds of micrometers.The techniques of size measurement in situ (ground-basedand airborne) use a variety of particle sizers – still referredto as particle counters because they count the particlesand sort them in size bins, leading to particle number andparticulate volume size distributions (PNSD/PVSD). Theseinstruments perform measurements based on differentphysical principles, in order to cover the large size range[1]. The optical sizer measures light scattered by a particle,in some direction between forward and sideward, anddetermines the (equivalent) radius of a sphere scatteringthe same amount of radiation. Biases can arise from (i) thecomplex refractive indices difference between the dustparticle and a sphere of reference and (ii) the particle non-sphericity [26]. At radii larger than 1 mm, the resolution islimited. The mobility particle sizer measures the mobilityof charged dust particles. It does not have the biases of theoptical counter – but its size range is limited to the sub-micron region. The aerodynamic particle sizer measuresthe particle velocity in an accelerated airflow and deter-mines the (equivalent) radius of a sphere of unit densityhaving the same velocity in the same flow. Biases can stemfrom the shape and density of the dust particle and fromthe particle collection efficiency of the air inlet. The rangeof validity of these instruments extends from 0.3 to 10 mmin radius.
The transmission and scanning electron microscopeswhose interest have previously been emphasized for thecomposition and structure description of the individualparticles, are used to determine 2-D projection areas andthe resulting equivalent radii of particles on samplesobtained by filtration or impaction [27]. The methodapplies to the full size range of dust particles; its majoruncertainty arises from the necessary assumption to bemade about the particle third dimension (thickness).
The shape of desert dust particles is primarily deter-mined by transmission and scanning electron microscopy.The detailed shapes shown by microscope images areextremely diverse, often highly irregular as in aggregates(e.g. see [15,17,19,28]), as a result of the previouslydescribed processes of dust generation (especially thewind deflation and sandblasting). The shape description
M. Legrand et al. / Journal of Quantitative Spectroscopy & Radiative Transfer 149 (2014) 219–240222
consists generally in a 2-D particle outline fitted to anellipse characterized by its aspect ratio (AR). Therefore,this analysis suggests as an approximation, that the dustparticles can be modeled as spheroids. It is important tonote that for “flat” particles, the thickness could be muchsmaller than the width (smallest 2-D dimension), so that a3-D AR can be defined for the particle, which could bemuch larger than the 2-D AR from the microscope. The 2-DAR values obtained by the microscope range from 1.4 to 5,with a small fraction of particles having values larger than3 – note that there are no particles with 2-D AR below 1.4,so there are neither spheres nor quasi spheres in desertdust. Median 2-D AR values vary between 1.5 and 2 [17–19]. The 2-D AR values are influenced by the mineralcomposition as regards the crystal morphology (medianvalues between 1.44 for halite and 1.92 for sulfates,according to [19]). The 2-D AR depends also on the particlesize, with a moderate increase for the smallest and for thelargest particles. A minimum median value of 1.6 for aradius of 1.5 mm and a maximum median value of 2.0 for aradius of 0.2 mm, are reported by Chou et al. [17].
Experimental studies about the validity of Mie theory tosimulate the extinction of non-spherical particles of mineraldust components have shown a general agreement, com-paring the Mie simulations with the measurements, outsideof the spectral regions of resonant absorption lines, locatedin the TIR [28,29]. However these authors report from FTIRextinction spectra measured in the laboratory for mineralspecies usually found in dust, that significant differences areobserved in the close vicinity of the resonant absorptionlines. According to Hudson et al. who used fine sub-micronparticles of phylosilicates (illite, kaolinite, montmorillonite)for their experiment, the simulated Mie absorption peaks ofthe studied minerals (near 9.5 mm) are blue shifted andtheir intensities are not in agreement with the measure-ments. Using then for simulations the shape-dependentanalytic expressions for absorption peaks of small ellipsoids,disks and needles in the Rayleigh approximation [21],and assuming particles with isotropic orientations, theyobtained a better agreement with their measurementsthan using the Mie calculations. In further developmentsusing a T-matrix code, [30] could reach satisfactory agree-ment between the shapes of simulated peaks of extinc-tion and the measurements on condition that high ARvalues be introduced (up to 10 for kaolinite, between 10and 20 for illite and montmorillonite), while the particle2-D AR measured using electron microscopy in the experi-ment, had values below 3 (consistently with the typicalvalues found in the literature, obtained according to thistechnique).
It is also possible to determine the main characteristicsof a desert dust layer according to a radically differentapproach, based on remote sensing, using the temporal,directional and spectral measurements of direct (fromSun) and scattered (from sky) solar radiation with amultispectral photometer. Aerosol optical depths of extinc-tion at the wavelengths of the instrument channels arefirst derived, using the measurements of direct solarradiation. It is then possible with the measurements ofscattered solar radiation, applying a simple model for theaerosol particles, to retrieve the aerosol single scattering
albedos and complex refractive indices at the instrumentwavelengths, and the PVSD in the vertical atmosphericcolumn. This method has been applied to the globalphotometric network AERONET, first with a model ofhomogeneous spheres, by application of a code from[31]. Then, on the improved assumption of homogeneousspheroids isotropically oriented, a new retrieval has beenobtained with the help of a T-matrix code [32], giving riseto an AERONET Version 2 of retrieved data in which theaerosol model is a mixture of homogeneous polydispersespheres and spheroids isotropically oriented [33,34].According to this approach, the fraction of sphericalparticles is a parameter included into a set of the retrievedparameters. One can find the detailed description of thisapproach in [35], where the retrieval strategy is appliedalso to satellites.
The typical AERONET retrieved PVSD are shown for themain types of tropospheric aerosol in [36] (examples fordesert dust can be found in the AERONET database atwebsite http://aeronet.gsfc.nasa.gov/ by selecting stationsin arid or semi-arid areas such as Sahel or Arabian Penin-sula). They are bimodal with a fine mode of sub-micronparticles with a modal radius around 0.1 mm and a coarsemode of micron-to-super-micron particles with a modalradius of a few microns. The coarse mode is predominant asto its contribution to the particulate volume.
The present study is dedicated to the particular questionof the effect of particle shape on the radiative properties ofmineral dust in the TIR. In this prospect, we simulate thespectrally radiative parameters in the atmospheric 10-mmwindow, focusing on a mineral dust of spheroidal particles,using a T-matrix code. The radiative parameters of thecorresponding dust constituted of spherical particles havingthe same volumes, are systematically calculated using a codeof Mie for comparison. For this methodological purpose, wehave defined a simple model of dust composed of some ofthe most abundant minerals combined in an externalmixture, considered relevant to provide realistic values ofdust radiative properties. We have applied an AERONETPVSD, Version 2, corresponding to desert dust. In exactterms, we have applied this single PVSD and the ARdistribution from AERONET to all the mineral componentsof the dust. The complex refractive indices of each (crystal-line) mineral component in the TIR have been found in theliterature. One of the main challenges of this study relateswith the adverse instabilities of the T-matrix code, prevent-ing the full calculation of the dust radiative parameters invarious spectral intervals, depending on the particles radii,aspect ratios and complex refractive indices. This difficultyhas been counteracted by an accurate corrective method thatwe refer to as the T-matrix Size Truncation Compensation(TSTC). The results of these simulations corrected with theTSTC has been used to put in evidence and to describe theeffects of non-sphericity, appearing in the vicinity of theresonant peaks of the minerals considered. They have beenanalyzed and compared with results from the literature toassess the relevance of the corrective method. A change ofthe AERONET particle AR distribution into a modified-AERONET (Version 2) AR distribution is suggested to improveagreement with measured AR results from the literature. Itseffect on the extinction dust optical depth has been studied.

0
0.02
0.04
0.06
0.08
0.1
0111.0
fract
ion
f(ε)
– d
n/dl
n(ε)
axis ratio – ε
Oblate Prolate
0
0.1
0.2
0.3
0.01 0.1 1 10 100
dV/d
lnr
(μm
3 /μm
2 )
r (μm)
Fine mode
Coarse mode
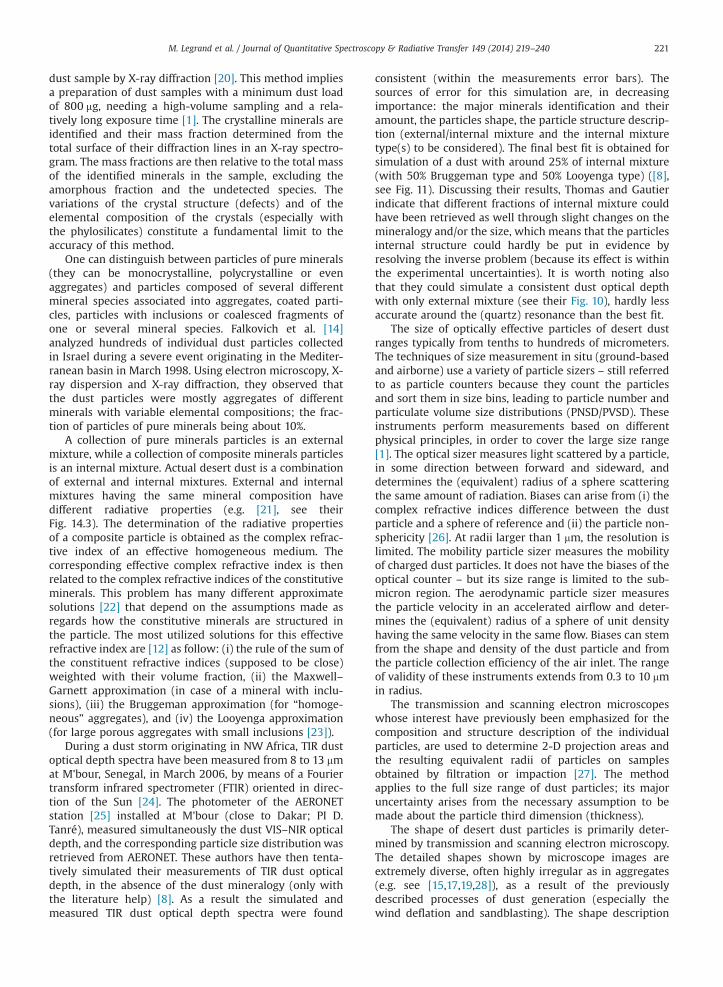
Fig. 1. Particle size (a) and axis ratio (b) distributions of mineral dustderived from AERONET photometric measurements of the period 1998–2000, at the station of Solar Village, Saudi Arabia (PI: B.N. Holben).
M. Legrand et al. / Journal of Quantitative Spectroscopy & Radiative Transfer 149 (2014) 219–240 223
2. Data and method
2.1. Dust physical and mineral descriptions
2.1.1. Microphysical propertiesIn order to model radiative properties of desert dust,
the non-sphericity of the mineral particles can be takeninto account conveniently, by describing the particles asspheroids generated by the 1801 revolution of an ellipseabout its major axis (prolate spheroids) or about its minoraxis (oblate spheroids). They are characterized by theiraxis ratio ε, larger or smaller than 1 for prolate or oblatespheroids, respectively. The axis ratio of a spheroid issimply related to the AR of the real particle it represents:for a prolate spheroid, ε is the AR and for an oblatespheroid ε is the AR reciprocal (with the usual definitionof AR as the ratio of the longer to the shorter axis lengths).Although the spheroidal shape is very simple with regardto the diverse and complex shapes of the real particles, asrevealed by the microscope, it constitutes a significantprogress in their representation, in comparison with thesphere [33,37]. An AR distribution of spheroids is used byAERONET, to model the particles shape. It is fixed as thebest fit of full scattering matrices of mineral dust, mea-sured in laboratory by Volten [38]. Detailed optical proper-ties, including PVSD of desert aerosols determined at 22radii between 0.05 mm and 15.0 mm are currently retrieved,using the AERONET AR distribution, and available on thedatabase of AERONET (Version 2). The PVSD AERONETVersion 2 (mixture of spheres and spheroids) can becompared with the PVSD derived under the previousassumption of aerosol as a polydisperse mixture of homo-geneous spheres [31], provided as part of AERONET Ver-sion 1 retrieval. These two retrievals show noticeabledifferences. The fine mode is significantly affected by theassumption of spheres or spheroids ([32], see Fig. 3; [33],see Fig. 14). Specifically, if the aerosol is assumed as amixture of spheres, the retrieval tends strongly to over-estimate the concentration of fine particles in order tomimic the phase function of irregular particles that issignificantly flatter for larger scattering angles than thephase function of spheres. The coarse mode of the PVSDsretrieved under these different assumptions shows onlyminor changes, reflecting the fact that scattering in aureole(which is most sensitive to presence of coarse particles) isnot significantly affected by the shape of scattering parti-cles [32,33].
In this paper we study the effect of the particles shapeon radiation in the TIR. A focus of the paper is to assess thefrequently used assumption that there are only weakdifferences between scattering of spherical and non-spherical particles in the TIR. Such assumption is basedon the general tendency of the weak dependence ofscattering on the shape for particles with a size signifi-cantly smaller than the wavelength [21,39] and the factthat the sizes of tropospheric dust particles (modal radii ofPVSD is generally below �4 μm, [36]) are mostly smallerthan the infrared wavelengths. However, Bohren and Huff-man [21] showed that absorption depends on particleshape and becomes the predominant process for verysmall particles, a fact confirmed experimentally [28,29].
The analysis will be done using a mixture of polydisperserandomly oriented spheroids as a model for the non-sphericaldesert dust aerosol, similarly as it is implemented in AERONETretrievals [33]. We will use a PVSD AERONET Version 2derived for spheroids, from the measurements at the AERO-NET station of Solar Village, Saudi Arabia, inside the aridArabian Peninsula. Fig. 1a displays the PVSD dV/d ln r, with rfor the equivalent particle radius and V for the particulatevolume in a vertical atmospheric column. Fig. 1b displays theAERONET axis ratio distribution f(ε) describing the fraction ofparticles number dn/d ln(ε) with an axis ratio ε. The axis ratiodistribution is symmetrical for prolate (ε41) and oblate(εo1) spheroids, so that f(ε)¼ f(1/ε) – the AR distribution isthe same for prolate and oblate spheroids. There are no
M. Legrand et al. / Journal of Quantitative Spectroscopy & Radiative Transfer 149 (2014) 219–240224
prolate spheroids for ε below 1.44 and over 3.0. In thefollowing sections we will compare the radiative effects ofthe particle non-sphericity in the TIR by implementing thecalculations using the same PVSD (Fig. 1a) for spheroids(Fig. 1b) and for spheres, and the same mineral composition.Hereafter in this study, the equivalent radius of a spheroid isthe radius of a sphere having same volume and same mass.
2.1.2. Mineralogical composition and optical propertiesClaquin et al. [40] established maps of relative abundance
of minerals in the soils of the arid regions of the world. Thesemaps show a fair homogeneity of the various mineralscontents in most of the main deserts of Africa, Arabia, andSW and central Asia (see their Plate 1). They provide thefollowing minerals classified according to their decreasingabundance: (i) for clays (fine grains, size below 2 mm): illite,kaolinite, smectite, and (ii) for silts (medium grains, size from2 mm to 50 mm): quartz, feldspar, hematite. We then definethe dust model for this study as a mixture of the mostabundant of these ubiquitous minerals: illite and kaolinite(often referred to as clays hereafter) and quartz.
The study of dust made up with these minerals con-stituting the soils, will be carried out in the spectralinterval [7.0,10.2 mm] containing their resonant peaks.
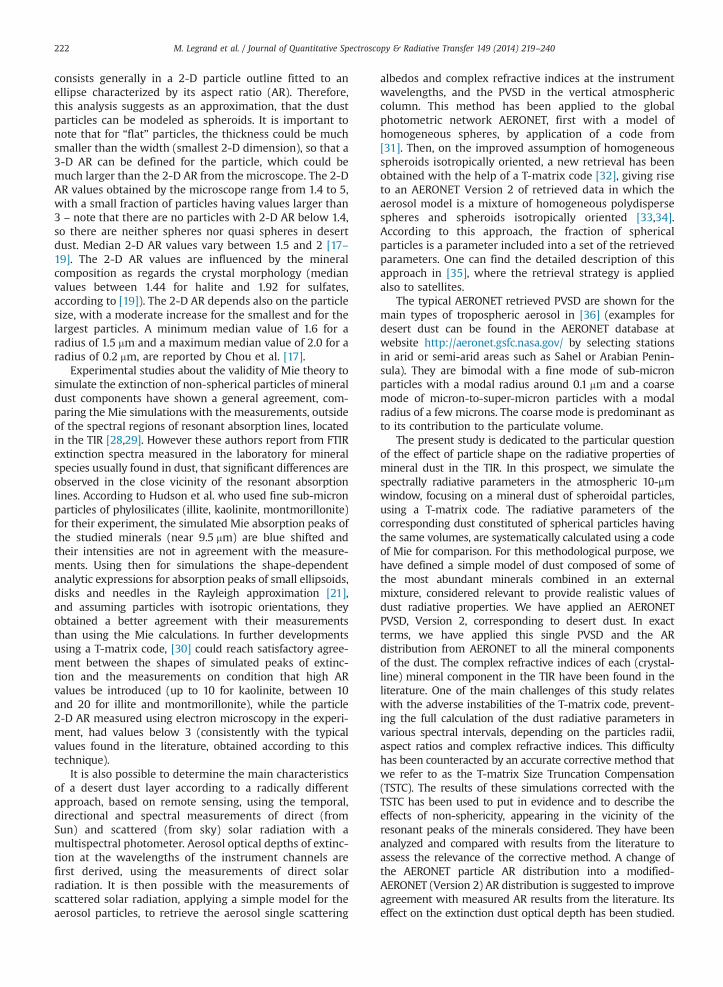
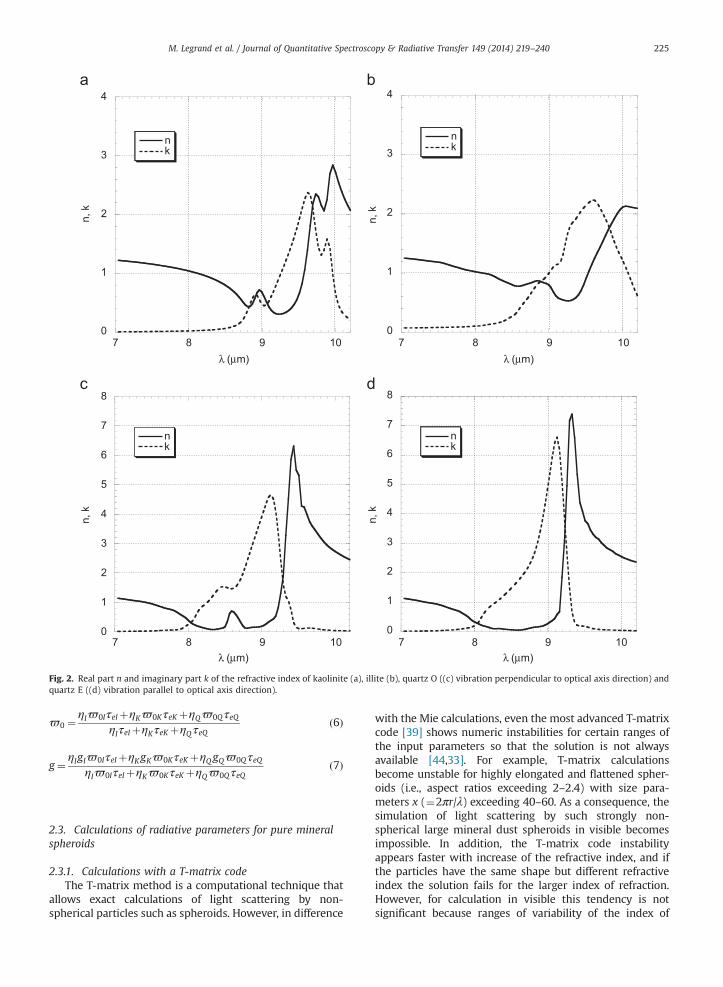
The corresponding optical properties of these crystallizedminerals are determined by their bulk complex refractiveindex (nþ ik). Illite and kaolinite are considered as isotropicminerals, described by simple complex indices (nIþ ikI) and(nKþ ikK). Quartz in crystallized form is a uniaxial crystaldescribed by two complex indices: the index for ordinary(O) propagation, for electric vibrations normal to the opticalaxis (nQ?þ ikQ?) and the index of extraordinary (E) propaga-tion, for vibrations parallel to the optical axis (nQJþ ikQJ).
Fig. 2 shows the real part n and imaginary part k of thebulk complex indices measured between 7.0 mm and10.2 mm for crystal minerals including kaolinite [41], illite[42], quartz O and E [43]. To be noted is the aspect of thespectral variations of the refraction indices, with peaks ofk, spectrally associated to sharp increases of n, at wave-lengths around 9.5 mm for illite and kaolinite and around9 mm for quartz (for both rays O and E).
2.2. Radiative properties of an external mixture of mineralspheroids
Usually, aerosol is optically described using the volumecoefficients of scattering, absorption and extinction –
indicated everywhere below by the respective subscriptss, a, e – and the single scattering albedoϖ0, plus the phasefunction from which the asymmetry factor g can bederived. In this study, the aforementioned volume coeffi-cients are integrated over the vertical atmospheric column,giving rise to the aerosol optical depths of scattering,absorption and extinction. The optical depth of extinctionτe, the single scattering albedo ϖ0, and the asymmetryfactor g (derived from the phase function for the aerosolcontained in the vertical column), have been used todescribe the radiative properties of dust in this study.
Dust is a homogeneous diluted medium assumed asmade up with pure mineral spheroids isotropically oriented,constituting incoherent scatterers. The natural ambient TIR
radiation is unpolarized. The incoherent scattering of radia-tion by the dust particles leads to additive contributions: τeis the sum of the individual contributions of the particles(defined by their cross sections of extinction) in the verticalcolumn.
In the case of quartz, an anisotropic uniaxial crystallinemedium, the calculations (using incident natural radiation)will be carried out separately using the complex index forordinary (resp. extraordinary) propagation for the electricvibration polarized normally (resp. parallel) to the optical axis.They result in the respective radiative parameters X? and XJ,noted alternatively XO and XE (X¼τe,ϖ0, g). For a collection ofquartz spheres, small compared to the wavelength andrandomly oriented, the average particle cross section ofextinction is given by Eq. (1) [21]. For a collection of smallisotropic spheroids randomly oriented, the axial symmetry ofthe spheroids leads to an average cross section also of theform of Eq. (1), but with σ? (resp. σJ) for electric vibrationsperpendicular (resp. parallel) to the spheroids symmetry axis,depending on the spheroids semi-axes [21]. Considering acollection of small spheroids of quartz, having random orien-tations of their optical axes and of their geometrical axes withno correlation between the two symmetries, we assume thatthe particle average cross sections are again related accordingto Eq. (1)
σ ¼ 23 σ? þσ J ð1Þ
holding for scattering, absorption and extinction. In addition,we will extend the use of Eq. (1) to the larger particles (see in[21] comments on this question in Section 8.2).
It should be kept in mind that in Eq. (1) σ? is also σO(for ordinary quartz), and that σJ is σE (for extraordinaryquartz). In the following, we will process the properties forquartz spheroids as if they constitute a mixture of 2/3 and1/3 of quartz O and E.
Eq. (1) leads to corresponding equations for opticaldepths. For example we obtain for extinction
τe ¼ 13 ð2τe? þτe J Þ ð2Þ
Using the definition of the single scattering albedo, weobtain
ϖ0 ¼2ϖ0? τe? þϖ0 J τe J
2τe? þτe Jð3Þ
Using the definition of the asymmetry factor, we obtain
g ¼ 2g?ϖ0? τe? þg Jϖ0 J τe J2ϖ0? τe? þϖ0 J τe J
ð4Þ
Now, it is possible to define “dusts” constituted withparticles of pure illite, kaolinite or quartz either sphericalor spheroidal, characterized by the properties displayed inFigs. 1 and 2. If the particles are spheres, we calculate theirradiative parameters (τe, ϖ0, g) by means of a code of Mie.If the particles are spheroids randomly oriented, we calcu-late their radiative parameters by means of a T-matrixcode [39]. Then, the previously defined “dusts” of puremineral species being characterized by their respectivevolume fractions ηI, ηK and ηQ, the radiative parameters ofthe external mixture are then linear functions of XI, XK, XQ,ηI, ηK, ηQ (X¼τe, ϖ0, g)
τe ¼ ηIτeIþηKτeK þηQτeQ ð5Þ
0
1
2
3
4
7 8 9 10
n, k
0
1
2
3
4
7 8 9 10
n, k
0
1
2
3
4
5
6
7
8
7 8 9 10
n, k
0
1
2
3
4
5
6
7
8
7 8 9 10
n, k
λ (μm) λ (μm)
λ (μm) λ (μm)
nk
nk
nk
nk
Fig. 2. Real part n and imaginary part k of the refractive index of kaolinite (a), illite (b), quartz O ((c) vibration perpendicular to optical axis direction) andquartz E ((d) vibration parallel to optical axis direction).
M. Legrand et al. / Journal of Quantitative Spectroscopy & Radiative Transfer 149 (2014) 219–240 225
ϖ0 ¼ηIϖ0IτeIþηKϖ0KτeK þηQϖ0QτeQ
ηIτeIþηKτeKþηQτeQð6Þ
g¼ ηIgIϖ0IτeIþηKgKϖ0KτeKþηQgQϖ0QτeQηIϖ0IτeIþηKϖ0KτeK þηQϖ0QτeQ
ð7Þ
2.3. Calculations of radiative parameters for pure mineralspheroids
2.3.1. Calculations with a T-matrix codeThe T-matrix method is a computational technique that
allows exact calculations of light scattering by non-spherical particles such as spheroids. However, in difference
with the Mie calculations, even the most advanced T-matrixcode [39] shows numeric instabilities for certain ranges ofthe input parameters so that the solution is not alwaysavailable [44,33]. For example, T-matrix calculationsbecome unstable for highly elongated and flattened spher-oids (i.e., aspect ratios exceeding 2–2.4) with size para-meters x (¼2πr/λ) exceeding 40–60. As a consequence, thesimulation of light scattering by such strongly non-spherical large mineral dust spheroids in visible becomesimpossible. In addition, the T-matrix code instabilityappears faster with increase of the refractive index, and ifthe particles have the same shape but different refractiveindex the solution fails for the larger index of refraction.However, for calculation in visible this tendency is notsignificant because ranges of variability of the index of
M. Legrand et al. / Journal of Quantitative Spectroscopy & Radiative Transfer 149 (2014) 219–240226
refraction are rather limited. In contrast, as will be shownlater, this phenomenon is the main cause of difficulties forcalculating scattering by spheroids in TIR because in thisspectral range the materials composing aerosols may havevery high values of the index of refraction (especiallyquartz, see Fig. 2).
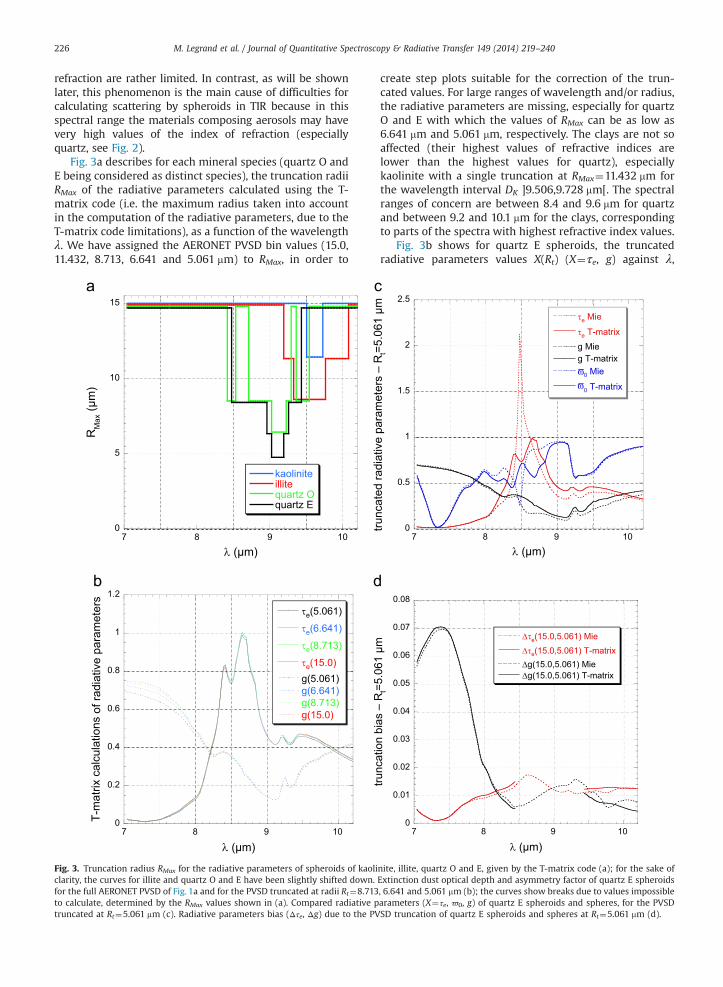
Fig. 3a describes for each mineral species (quartz O andE being considered as distinct species), the truncation radiiRMax of the radiative parameters calculated using the T-matrix code (i.e. the maximum radius taken into accountin the computation of the radiative parameters, due to theT-matrix code limitations), as a function of the wavelengthλ. We have assigned the AERONET PVSD bin values (15.0,11.432, 8.713, 6.641 and 5.061 mm) to RMax, in order to
0
5
10
15
7 8 9 10
kaoliniteillitequartz Oquartz E
RM
ax (μ
m)
λ (μm)
0
0.2
0.4
0.6
0.8
1
1.2
7 8 9 10
τe(5.061)
τe(6.641)
τe(8.713)
τe(15.0)g(5.061)g(6.641)g(8.713)g(15.0)
T-m
atrix
cal
cula
tions
of r
adia
tive
para
met
ers
λ (μm)
Fig. 3. Truncation radius RMax for the radiative parameters of spheroids of kaoliclarity, the curves for illite and quartz O and E have been slightly shifted down.for the full AERONET PVSD of Fig. 1a and for the PVSD truncated at radii Rt¼8.713to calculate, determined by the RMax values shown in (a). Compared radiative ptruncated at Rt¼5.061 mm (c). Radiative parameters bias (Δτe, Δg) due to the PV
create step plots suitable for the correction of the trun-cated values. For large ranges of wavelength and/or radius,the radiative parameters are missing, especially for quartzO and E with which the values of RMax can be as low as6.641 mm and 5.061 mm, respectively. The clays are not soaffected (their highest values of refractive indices arelower than the highest values for quartz), especiallykaolinite with a single truncation at RMax¼11.432 mm forthe wavelength interval DK ]9.506,9.728 mm[. The spectralranges of concern are between 8.4 and 9.6 mm for quartzand between 9.2 and 10.1 mm for the clays, correspondingto parts of the spectra with highest refractive index values.
Fig. 3b shows for quartz E spheroids, the truncatedradiative parameters values X(Rt) (X¼τe, g) against λ,
0
0.5
1
1.5
2
2.5
7 8 9 10
τe Mie
τe T-matrixg Mieg T-matrix
0 Mie
0 T-matrixtru
ncat
ed ra
diat
ive
para
met
ers
– R
t=5.
061
μm
λ (μm)
0
0.01
0.02
0.03
0.04
0.05
0.06
0.07
0.08
7 8 9 10
∆τe(15.0,5.061) Mie∆τe(15.0,5.061) T-matrix∆g(15.0,5.061) Mie∆g(15.0,5.061) T-matrix
trunc
atio
n bi
as –
Rt=
5.06
1 μm
λ (μm)
nite, illite, quartz O and E, given by the T-matrix code (a); for the sake ofExtinction dust optical depth and asymmetry factor of quartz E spheroids, 6.641 and 5.061 mm (b); the curves show breaks due to values impossiblearameters (X¼τe, ϖ0, g) of quartz E spheroids and spheres, for the PVSDSD truncation of quartz E spheroids and spheres at Rt¼5.061 mm (d).
Table 1Maxima of XM and XT, of their truncation biases |ΔXM| and |ΔXT| beyondRt¼5.061 mm, and of the differences between these truncation biases forspheroids and for spheres |ΔXM�ΔXT| (X¼τe, g). Case of quartz E, λA[7.4,8.45 mm][[9.43,10.20 mm].
τeM(15.0) τeT(15.0) gM(15.0) gT(15.0)1.20 0.834 0.755 0.749
|ΔτeM| |ΔτeT| |ΔgM| |ΔgT|0.0135 0.0150 0.0695 0.0704
|ΔτeT�ΔτeM| |ΔgT�ΔgM|0.00185 0.00354
M. Legrand et al. / Journal of Quantitative Spectroscopy & Radiative Transfer 149 (2014) 219–240 227
calculated using the T-matrix code for particles radiivarying between RMin¼0.05 mm and Rt¼15.0, 8.713, 6.641and 5.061 mm. The breaks of these curves correspond tothe T-matrix code truncations, shown in Fig. 3a for quartzE. The essential feature revealed by these curves, is theweak difference between consecutive truncated values,both for τe and g, making difficult to discriminate them(except for g at wavelengths between 7 and 8 mm). Thisfeature holds also for ϖ0 and for the parameters of theother studied species (not presented here). So, the correc-tion to apply to a truncated parameter as to obtain the fullparameter (without truncation) will be weak, even for thelargest truncation of the PVSD (at 5.061 mm). This is afavorable circumstance, which should allow the derivationof the full parameters easily and with a large accuracy.
Fig. 3c represents the truncated radiative parametersvalues X(Rt) (X¼τe, ϖ0, g; Rt¼5.061 mm) for spheres andfor spheroids of quartz E, against λ. The curves (i) contain nobreak and (ii) are suitable to outline satisfactorily the fullparameters, since the differences between the full para-meters and the truncated parameters are weak. We can thencompare in this figure the couple of curves of each truncatedparameter for spheres and for spheroids, practically as if theywere replaced by the full parameters. The most strikingdifference between spheres and spheroids curves is on τewith a sharp peak (τe¼2.14, λ¼8.475 mm) for the spheres, tocompare with two moderate peaks located around thereof(τe¼0.82, λ¼8.417 mm; τe¼0.99, λ¼8.651 mm) for the spher-oids. It is noteworthy that these extinction peaks are notclose to the peaks of k (λ ca. 9.1 mm, in Fig. 2). Between8.44 mm and 8.62 mm, τe for spheres exceeds the spheroidsvalues up to 186%. Around this narrow region, we can definea broader spectral range between 8.1 mm and 10.0 mmwhereτe due to spheroids exceeds on the contrary τe for spheres;the difference is however more limited (between 5% and30%). Below 8.1 mm and beyond 10.0 mm the difference on τebetween spheres and spheroids tends to vanish. The mostnotable differences between the effects of spheres andspheroids on ϖ0 are again around the region of the peaksof τe, but they are reversed (peaks of τe coinciding withreversed peaks of ϖ0). The differences are still large: ϖ0 forspheres is 62% below the value for spheroids at the wave-length of the central peak of τe for spheres (λ¼8.475 mm),and on the contrary it can be in excess of up to 55% between8 and 9 mm. Outside this interval, the values of ϖ0 are veryclose for spheres and spheroids. The differences between theeffects of spheres and spheroids on g are significant forvalues of λ above 8.4 mm, g being in excess between 5% and45%, for spheroids.
The curves in Fig. 3d show the biases due to truncationat Rt¼5.061 mm defined as
ΔXð15:0;RtÞ ¼ Xð15:0Þ–XðRtÞ; ðX ¼ τe; g;Rt ¼ 5:061 mmÞ; ð8Þfor spheres and for spheroids of quartz E. Breaks areshown where X(15.0) could not been calculated for spher-oids. These functions of bias are just to be added to thetruncated functions X (5.061), to obtain the full functions X(15.0). Everywhere they are defined, the functions ΔX(15.0,5.061) for spheres and for spheroids of quartz E areclose together (this result can be generalized to all theradiative parameters of the studied mineral species, not
presented here). This result reveals that the particles withradii larger than 5 mm, whether spheres or spheroids, havesimilar radiative effects. In comparison of the large differ-ences between spheres and spheroids effects around theresonance peak of extinction for spheres at 8.475 mm(Fig. 3c), Δτe (and Δg) does not exhibit any significantlydivergent trends between spheres and spheroids (Fig. 3d).This means that for the smaller particles (i.e. with radiibelow 5 mm), the radiative effect depends on the shape,while this is practically not the case for the larger particles(with radii above 5 mm).
In summary, the above analysis shows that, (i) thecontribution of the particles of dust larger than Rt (Rt beingas low as 5.061 mm) is small and (ii) the differencebetween these small contributions from spheres and fromspheroids is still smaller (because the difference betweenradiative effects of large spheres and large spheroids isweak), including the region of the resonance peak(Fig. 3d). Using τe and g values in the case of quartz E,these results are illustrated in Table 1 containing themaxima for XM, XT, |ΔXM|, |ΔXT| and |ΔXT�ΔXM|, (X¼τe,g) – the subscripts M and T referring to Mie and T-matrixcalculations, respectively. The maximum values are of theorder of unity for X, 10�2 for |ΔX| and 10�3 for |ΔXT�ΔXM|.These orders of magnitude for Rt¼5.061 mm (and with theused PVSD) are general for the studied minerals (if Rt45.061 mm, |ΔX| and |ΔXT�ΔXM| would be still smaller).Thus, in order to provide the most accurate calculationsof the spheroid mixture properties, these characteristicscalculated using the larger spheres could be used to assessthe missing contribution of the corresponding largerspheroids in the values obtained by T-matrix calculationsfor truncated PVSD.
2.3.2. Completing T-matrix calculations performed fortruncated PVSD
Hereafter we describe the method to complete theT-matrix calculations of the radiative parameters forspheroids, when the T-matrix code does not converge forthe full range of considered sizes. First, we describe thesimple case of kaolinite, well suited to illustrate themethod. Then, we will briefly describe how the methodcan be adapted to the more complicated case of quartz E.
For kaolinite, the radiative parameters for spheroids arefully calculated by the T-matrix code taking into account allparticle radii between 0.05 mm and 15.0 mm, at all (110)wavelengths between 7.0 mm and 10.2 mm, except in thespectral interval DK where they are truncated at the radius
M. Legrand et al. / Journal of Quantitative Spectroscopy & Radiative Transfer 149 (2014) 219–240228
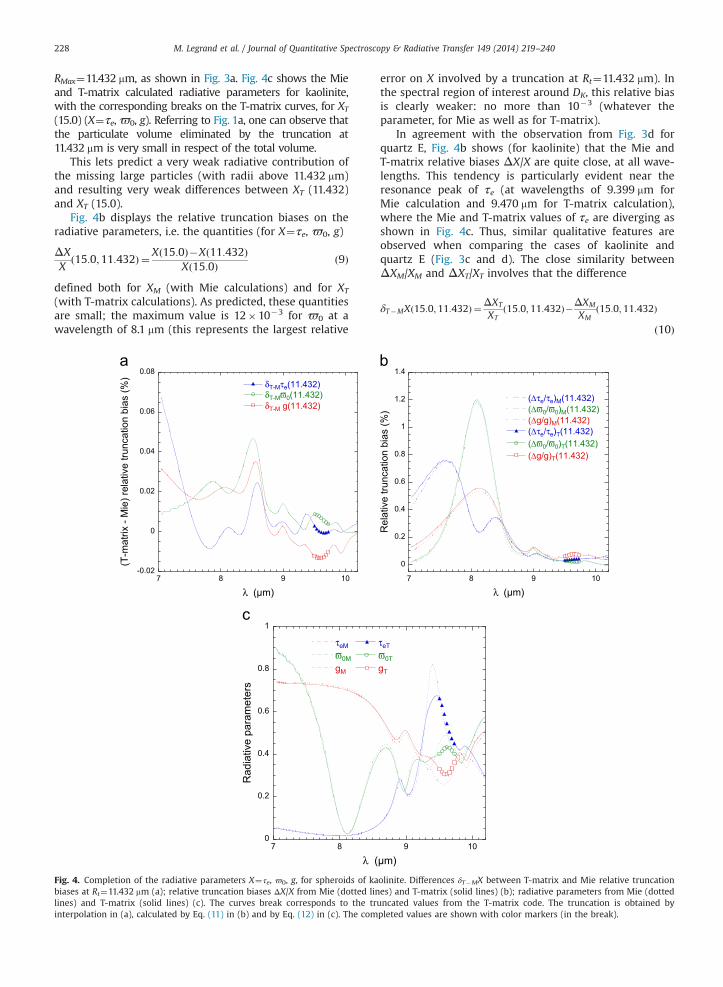
RMax¼11.432 mm, as shown in Fig. 3a. Fig. 4c shows the Mieand T-matrix calculated radiative parameters for kaolinite,with the corresponding breaks on the T-matrix curves, for XT(15.0) (X¼τe,ϖ0, g). Referring to Fig. 1a, one can observe thatthe particulate volume eliminated by the truncation at11.432 mm is very small in respect of the total volume.
This lets predict a very weak radiative contribution ofthe missing large particles (with radii above 11.432 mm)and resulting very weak differences between XT (11.432)and XT (15.0).
Fig. 4b displays the relative truncation biases on theradiative parameters, i.e. the quantities (for X¼τe, ϖ0, g)
ΔXX
ð15:0;11:432Þ ¼ Xð15:0Þ�Xð11:432ÞXð15:0Þ ð9Þ
defined both for XM (with Mie calculations) and for XT
(with T-matrix calculations). As predicted, these quantitiesare small; the maximum value is 12�10�3 for ϖ0 at awavelength of 8.1 mm (this represents the largest relative
Fig. 4. Completion of the radiative parameters X¼τe, ϖ0, g, for spheroids of kabiases at Rt¼11.432 mm (a); relative truncation biases ΔX/X from Mie (dotted linlines) and T-matrix (solid lines) (c). The curves break corresponds to the trinterpolation in (a), calculated by Eq. (11) in (b) and by Eq. (12) in (c). The com
error on X involved by a truncation at Rt¼11.432 mm). Inthe spectral region of interest around DK, this relative biasis clearly weaker: no more than 10�3 (whatever theparameter, for Mie as well as for T-matrix).
In agreement with the observation from Fig. 3d forquartz E, Fig. 4b shows (for kaolinite) that the Mie andT-matrix relative biases ΔX/X are quite close, at all wave-lengths. This tendency is particularly evident near theresonance peak of τe (at wavelengths of 9.399 mm forMie calculation and 9.470 mm for T-matrix calculation),where the Mie and T-matrix values of τe are diverging asshown in Fig. 4c. Thus, similar qualitative features areobserved when comparing the cases of kaolinite andquartz E (Fig. 3c and d). The close similarity betweenΔXM/XM and ΔXT/XT involves that the difference
δT�MXð15:0;11:432Þ ¼ΔXT
XTð15:0;11:432Þ�ΔXM
XMð15:0;11:432Þ
ð10Þ
olinite. Differences δT�MX between T-matrix and Mie relative truncationes) and T-matrix (solid lines) (b); radiative parameters from Mie (dotteduncated values from the T-matrix code. The truncation is obtained bypleted values are shown with color markers (in the break).
M. Legrand et al. / Journal of Quantitative Spectroscopy & Radiative Transfer 149 (2014) 219–240 229
is still smaller than the terms ΔX/X. Fig. 4a confirms thevery small values of this quantity, with a maximum valuearound 7�10�4 for τe at a wavelength of 7.0 mm. In thespectral range DK, the values of δT�MX vary between�15�10�5 for g to þ10�4 for ϖ0.
So, we interpolate the functions δT�MX characterizedby very small values, selecting a cubic spline in order todetermine the (5) missing points for kaolinite in DK. The
eðXT ð15:0Þ; λÞ ¼XT ð11:432; λÞ
½ðXMð11:432; λÞ=XMð15:0; λÞÞ�δT�MXð15:0;11:432; λÞ�2eðδT�MX; λÞ ð14Þ
markers in Fig. 4a fill the break of DK at the 5 wavelengthsit contains, for the curves representing δT�MX(15.0,11.432);(X¼τe,ϖ0, g). Finally, the interpolated values of δT�MX areintroduced into the expressions of ΔX/X and of X from T-matrix in order to calculate the corresponding missingvalues of these quantities for spheroids in DK. The expres-sions used for these calculations are
ΔXT
XT
� �Spl
ð15:0;11:432Þ ¼ΔXM
XMð15:0;11:432ÞþδSplT�MXð15:0;11:432Þ
ð11Þ
XSplT 15:0ð Þ ¼ XT ð11:432Þ
ðXMð11:432Þ=XMð15:0ÞÞ−δSplT−MXð15:0;11:432Þð12Þ
with the superscript Spl indicating the quantities calcu-lated through the cubic spline interpolation. These valuesare displayed with the markers plotted in Fig. 4b and c, inthe spectral range DK. The case of quartz E is opposite tokaolinite, in so far as the PVSD truncations from theT-matrix calculations are the most important among thestudied minerals (Fig. 3a) with the following breaks(values in µm): for Rt¼6.641 mm, ]8.993, 9.191[ (DQE
(6.641)); for Rt¼8.713 mm, ]8.929, 9.259[ (DQE(8.713)); forRt¼15.0 mm, ]8.475, 9.506[ (DQE(15.0)). When the trunca-tion is realized at several radius values, the operationspreviously described for the calculation of XT (15.0) in theexample of kaolinite, have to be repeated. For quartz E, thefirst step consists in starting with the truncated values XT
(5.061), XT (6.641), XM (5.061) and XM (6.641) to determine
δSplT�MX ð6:641;5:061Þ, ðΔXT=XT ÞSpl ð6:641;5:061Þ, and
XSplT ð6:641Þ, which fills DQE(6.641). This step is then
repeated a first time using XSplT ð6:641Þ, XT (8.713), XM
(6.641) and XM(8.713) in order to obtain XSplT ð8:713Þ, which
fills DQE(8.713). Then it is repeated a second time, which
provides finally XSplT ð15:0Þ, filling DQE(15.0). In the follow-
ing, we will refer to this method as the TSTC.
2.3.3. Accuracy of the methodIt is also necessary to estimate the error on the X values
introduced by the cubic spline interpolation onδT�MXð15:0;11:432Þ, starting with the case of kaolinite.As there is no expression to represent the cubic splinecurves, we estimate the error on δT�MXð15:0;11:432Þ in DK
by calculating δSplT�MXð15:0;11:432Þ at the wavelengths for
which δT�MXð15:0;11:432Þ is known (i.e. outside DK). Thenthe exact error on δT�MXð15:0;11:432Þ at λ is defined as
eðδT−MX; λÞ ¼ δSplT−MXð15:0;11:432; λÞ−δT−MXð15:0;11:432; λÞð13Þ
hence, the resulting exact error on XT(15.0) is derived fromEq. (12)
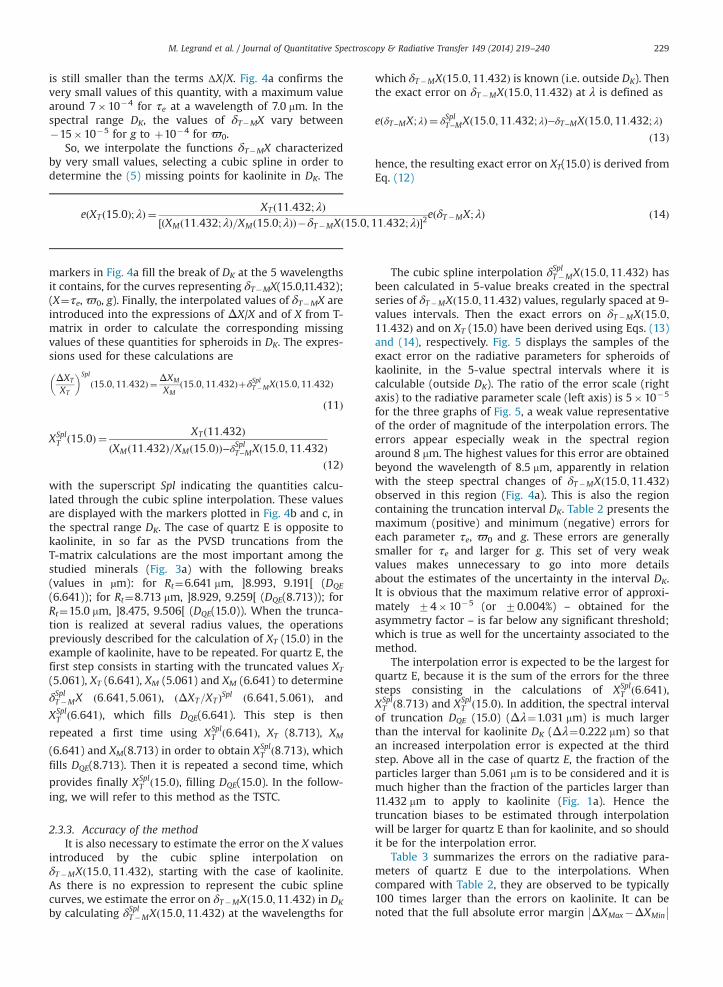
The cubic spline interpolation δSplT�MXð15:0;11:432Þ hasbeen calculated in 5-value breaks created in the spectralseries of δT�MXð15:0;11:432Þ values, regularly spaced at 9-values intervals. Then the exact errors on δT�MXð15:0;11:432Þ and on XT (15.0) have been derived using Eqs. (13)and (14), respectively. Fig. 5 displays the samples of theexact error on the radiative parameters for spheroids ofkaolinite, in the 5-value spectral intervals where it iscalculable (outside DK). The ratio of the error scale (rightaxis) to the radiative parameter scale (left axis) is 5�10�5
for the three graphs of Fig. 5, a weak value representativeof the order of magnitude of the interpolation errors. Theerrors appear especially weak in the spectral regionaround 8 mm. The highest values for this error are obtainedbeyond the wavelength of 8.5 mm, apparently in relationwith the steep spectral changes of δT�MXð15:0;11:432Þobserved in this region (Fig. 4a). This is also the regioncontaining the truncation interval DK. Table 2 presents themaximum (positive) and minimum (negative) errors foreach parameter τe, ϖ0 and g. These errors are generallysmaller for τe and larger for g. This set of very weakvalues makes unnecessary to go into more detailsabout the estimates of the uncertainty in the interval DK.It is obvious that the maximum relative error of approxi-mately 74�10�5 (or 70.004%) – obtained for theasymmetry factor – is far below any significant threshold;which is true as well for the uncertainty associated to themethod.
The interpolation error is expected to be the largest forquartz E, because it is the sum of the errors for the threesteps consisting in the calculations of XSpl
T ð6:641Þ,XSplT ð8:713Þ and XSpl
T ð15:0Þ. In addition, the spectral intervalof truncation DQE (15.0) (Δλ¼1.031 mm) is much largerthan the interval for kaolinite DK (Δλ¼0.222 mm) so thatan increased interpolation error is expected at the thirdstep. Above all in the case of quartz E, the fraction of theparticles larger than 5.061 mm is to be considered and it ismuch higher than the fraction of the particles larger than11.432 mm to apply to kaolinite (Fig. 1a). Hence thetruncation biases to be estimated through interpolationwill be larger for quartz E than for kaolinite, and so shouldit be for the interpolation error.
Table 3 summarizes the errors on the radiative para-meters of quartz E due to the interpolations. Whencompared with Table 2, they are observed to be typically100 times larger than the errors on kaolinite. It can benoted that the full absolute error margin ΔXMax�ΔXMin
�� ��

Fig. 5. Sampled exact absolute errors on the radiative parameters forkaolinite spheroids simulated through 5-value breaks realized in the radiativeparameter XT (15.0), then estimated through a cubic spline interpolation onδT�MX(15.0,11.432). Illustrations from top to bottom, for τe, ϖ0, g.
M. Legrand et al. / Journal of Quantitative Spectroscopy & Radiative Transfer 149 (2014) 219–240230
is approximately 2�10�3 (or 71�10�3) for all theradiative parameters, and that the corresponding fullrelative error margin is approximately 0.3% (or 70.15%).These values can be considered as the uncertainty on theparameters X determined using the TSTC method.
3. Results
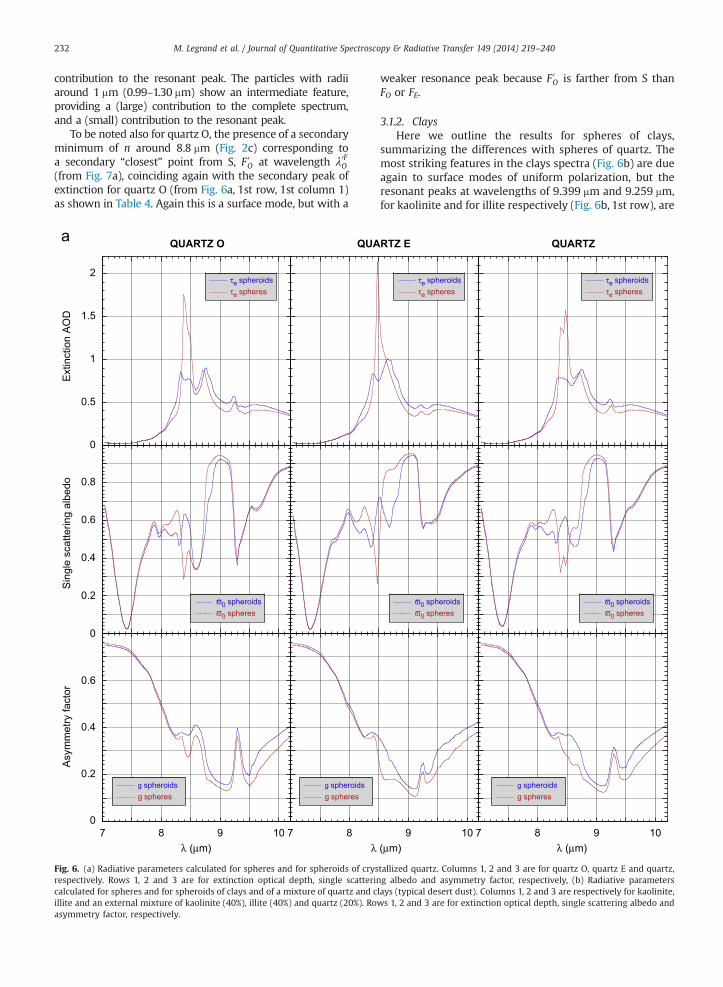
In this section we present the spectral graphs of theradiative parameters calculated with the T-matrix codeand the TSTC method for spheroids of pure crystallizedminerals: quartz (Fig. 6a), clays (kaolinite, illite) and anexample of external mixture of quartz and clays (Fig. 6b).Spectra of the radiative parameters can thus be comparedfor the different mineral species studied and for their(external) mixture. These spectra of spheroids can also becompared with the corresponding spectra of spherescalculated with a code of Mie.
Quartz radiative parameters are a combination of theparameters of quartz O and quartz E, defined throughEqs. (2)–(4). The radiative parameters of the external mixtureare derived from the parameters of kaolinite, illite and quartz,using Eqs. (5)–(7). The mixture composition (in particulatevolume percentages) is 80% of clays with a kaolinite-to-illiteratio of 1, and 20% of quartz. This composition in which theclays are prevalent can be considered “typical” of desert dust,but it can be highly variable for real desert dust and forexample 83% or 6% of quartz could be observed as well (seeTable 2 in [12]) – let alone the presence of other minerals suchas calcite, gypsum and the feldspars.
We will emphasize the discussion about the results ofextinction optical depth τe, focusing especially on theconditions for which significant differences are observedbetween spheres and spheroids. We will show that theseresults are consistent with the theoretical and experimen-tal results yielded by the literature. Finally, we will studythe effect of the presence of spheroids with large AR,which have been identified in mineral dust by electronmicroscopy.
3.1. Results for spheres
3.1.1. QuartzWe first recall some features of the Mie theory. Accord-
ing to this theory, the scattering and absorption crosssections for a sphere with radius a are expressed as powersseries expansions of x¼ 2πNa=λ, λ being the wavelength invacuum and N the complex refractive index of the sur-rounding medium. If the surrounding medium is air, N isreplaced with 1
x¼ 2πaλ
ð15Þ
For a very small particle compared to the wavelength,x⪡1, only the first terms (lower powers of x) of the seriesare numerically significant. This gives rise to the followingefficiencies for scattering and for absorption – ratios of thecorresponding optical cross sections to the geometricalsection πa2 – [21]
Qsffi83x4
m2�1m2þ2
��������2
ð16Þ
Qaffi4x Imm2�1m2þ2
� �ð17Þ
m being the relative complex index, ratio of the complexindices N1 of the particle to N of the surrounding medium
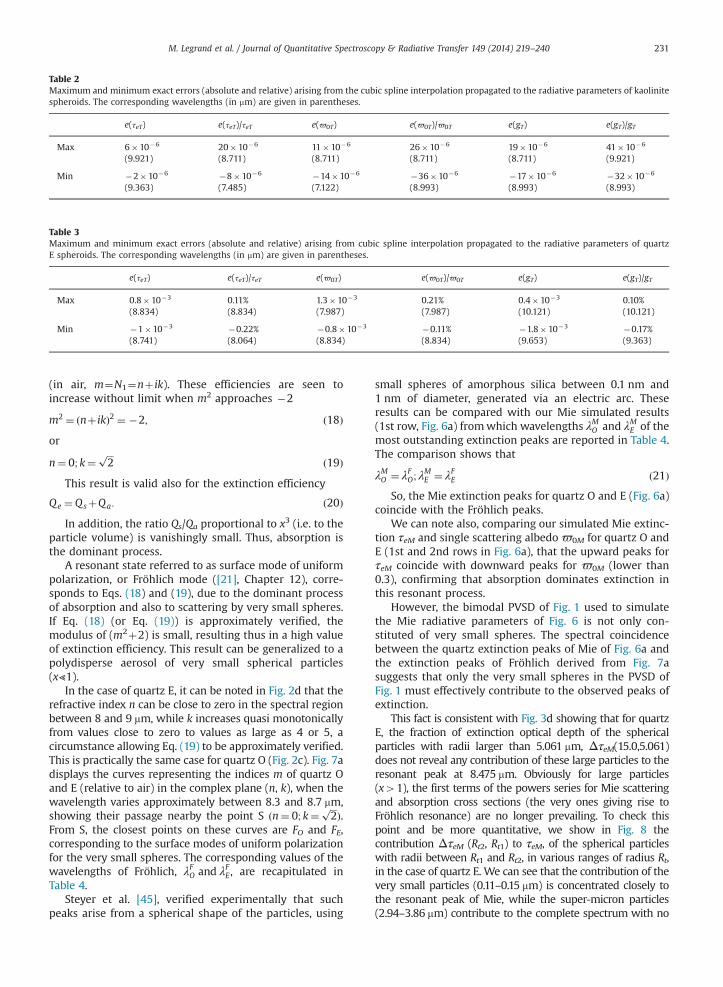
Table 2Maximum and minimum exact errors (absolute and relative) arising from the cubic spline interpolation propagated to the radiative parameters of kaolinitespheroids. The corresponding wavelengths (in mm) are given in parentheses.
e(τeT) e(τeT)/τeT e(ϖ0T) e(ϖ0T)/ϖ0T e(gT) e(gT)/gT
Max 6�10�6 20�10�6 11�10�6 26�10�6 19�10�6 41�10�6
(9.921) (8.711) (8.711) (8.711) (8.711) (9.921)
Min �2�10�6 �8�10�6 �14�10�6 �36�10�6 �17�10�6 �32�10�6
(9.363) (7.485) (7.122) (8.993) (8.993) (8.993)
Table 3Maximum and minimum exact errors (absolute and relative) arising from cubic spline interpolation propagated to the radiative parameters of quartzE spheroids. The corresponding wavelengths (in mm) are given in parentheses.
e(τeT) e(τeT)/τeT e(ϖ0T) e(ϖ0T)/ϖ0T e(gT) e(gT)/gT
Max 0.8�10�3 0.11% 1.3�10�3 0.21% 0.4�10�3 0.10%(8.834) (8.834) (7.987) (7.987) (10.121) (10.121)
Min �1�10�3 �0.22% �0.8�10�3 �0.11% �1.8�10�3 �0.17%(8.741) (8.064) (8.834) (8.834) (9.653) (9.363)
M. Legrand et al. / Journal of Quantitative Spectroscopy & Radiative Transfer 149 (2014) 219–240 231
(in air, m¼N1¼nþ ik). These efficiencies are seen toincrease without limit when m2 approaches �2
m2 ¼ ðnþ ikÞ2 ¼ �2; ð18Þor
n¼ 0; k¼ffiffiffi2
pð19Þ
This result is valid also for the extinction efficiency
Qe ¼QsþQa: ð20ÞIn addition, the ratio Qs/Qa proportional to x3 (i.e. to the
particle volume) is vanishingly small. Thus, absorption isthe dominant process.
A resonant state referred to as surface mode of uniformpolarization, or Fröhlich mode ([21], Chapter 12), corre-sponds to Eqs. (18) and (19), due to the dominant processof absorption and also to scattering by very small spheres.If Eq. (18) (or Eq. (19)) is approximately verified, themodulus of (m2þ2) is small, resulting thus in a high valueof extinction efficiency. This result can be generalized to apolydisperse aerosol of very small spherical particles(x⪡1).
In the case of quartz E, it can be noted in Fig. 2d that therefractive index n can be close to zero in the spectral regionbetween 8 and 9 mm, while k increases quasi monotonicallyfrom values close to zero to values as large as 4 or 5, acircumstance allowing Eq. (19) to be approximately verified.This is practically the same case for quartz O (Fig. 2c). Fig. 7adisplays the curves representing the indices m of quartz Oand E (relative to air) in the complex plane (n, k), when thewavelength varies approximately between 8.3 and 8.7 mm,showing their passage nearby the point S ðn¼ 0; k¼
ffiffiffi2
pÞ.
From S, the closest points on these curves are FO and FE,corresponding to the surface modes of uniform polarizationfor the very small spheres. The corresponding values of thewavelengths of Fröhlich, λFO and λFE , are recapitulated inTable 4.
Steyer et al. [45], verified experimentally that suchpeaks arise from a spherical shape of the particles, using
small spheres of amorphous silica between 0.1 nm and1 nm of diameter, generated via an electric arc. Theseresults can be compared with our Mie simulated results(1st row, Fig. 6a) fromwhich wavelengths λMO and λME of themost outstanding extinction peaks are reported in Table 4.The comparison shows that
λMO ¼ λFO; λME ¼ λFE ð21Þ
So, the Mie extinction peaks for quartz O and E (Fig. 6a)coincide with the Fröhlich peaks.
We can note also, comparing our simulated Mie extinc-tion τeM and single scattering albedoϖ0M for quartz O andE (1st and 2nd rows in Fig. 6a), that the upward peaks forτeM coincide with downward peaks for ϖ0M (lower than0.3), confirming that absorption dominates extinction inthis resonant process.
However, the bimodal PVSD of Fig. 1 used to simulatethe Mie radiative parameters of Fig. 6 is not only con-stituted of very small spheres. The spectral coincidencebetween the quartz extinction peaks of Mie of Fig. 6a andthe extinction peaks of Fröhlich derived from Fig. 7asuggests that only the very small spheres in the PVSD ofFig. 1 must effectively contribute to the observed peaks ofextinction.
This fact is consistent with Fig. 3d showing that for quartzE, the fraction of extinction optical depth of the sphericalparticles with radii larger than 5.061 mm, ΔτeM(15.0,5.061)does not reveal any contribution of these large particles to theresonant peak at 8.475 mm. Obviously for large particles(x41), the first terms of the powers series for Mie scatteringand absorption cross sections (the very ones giving rise toFröhlich resonance) are no longer prevailing. To check thispoint and be more quantitative, we show in Fig. 8 thecontribution ΔτeM (Rt2, Rt1) to τeM, of the spherical particleswith radii between Rt1 and Rt2, in various ranges of radius Rt,in the case of quartz E. We can see that the contribution of thevery small particles (0.11–0.15 mm) is concentrated closely tothe resonant peak of Mie, while the super-micron particles(2.94–3.86 mm) contribute to the complete spectrum with no
M. Legrand et al. / Journal of Quantitative Spectroscopy & Radiative Transfer 149 (2014) 219–240232
contribution to the resonant peak. The particles with radiiaround 1 mm (0.99–1.30 mm) show an intermediate feature,providing a (large) contribution to the complete spectrum,and a (small) contribution to the resonant peak.
To be noted also for quartz O, the presence of a secondaryminimum of n around 8.8 mm (Fig. 2c) corresponding toa secondary “closest” point from S, F 0O at wavelength λ0FO(from Fig. 7a), coinciding again with the secondary peak ofextinction for quartz O (from Fig. 6a, 1st row, 1st column 1)as shown in Table 4. Again this is a surface mode, but with a
0
0.5
1
1.5
2
QUARTZ O
τe spheroidsτe spheres
Ext
inct
ion
AO
D
QUA
0
0.2
0.4
0.6
0.8
Sin
gle
scat
terin
g al
bedo
0
0.2
0.4
0.6
7 8 9 10
Asy
mm
etry
fact
or
7 8λ (μm) λ
ϖ0 spheroidsϖ0 spheres
g spheroidsg spheres
g spheroidsg spheres
Fig. 6. (a) Radiative parameters calculated for spheres and for spheroids of crysrespectively. Rows 1, 2 and 3 are for extinction optical depth, single scatterincalculated for spheres and for spheroids of clays and of a mixture of quartz and cillite and an external mixture of kaolinite (40%), illite (40%) and quartz (20%). Roasymmetry factor, respectively.
weaker resonance peak because F 0O is farther from S thanFO or FE.
3.1.2. ClaysHere we outline the results for spheres of clays,
summarizing the differences with spheres of quartz. Themost striking features in the clays spectra (Fig. 6b) are dueagain to surface modes of uniform polarization, but theresonant peaks at wavelengths of 9.399 mm and 9.259 mm,for kaolinite and for illite respectively (Fig. 6b, 1st row), are
RTZ E QUARTZ
9 10 7 8 9 10 (μm) λ (μm)
τe spheroidsτe spheres
τe spheroidsτe spheres
ϖ0 spheroidsϖ0 spheres
ϖ0 spheroidsϖ0 spheres
g spheroidsg spheres
tallized quartz. Columns 1, 2 and 3 are for quartz O, quartz E and quartz,g albedo and asymmetry factor, respectively, (b) Radiative parameterslays (typical desert dust). Columns 1, 2 and 3 are respectively for kaolinite,ws 1, 2 and 3 are for extinction optical depth, single scattering albedo and

0
0.5
1
1.5
2τe spheroidsτe spheres
Ext
inct
ion
AO
D
0
0.2
0.4
0.6
0.8
Sin
gle
scat
terin
g al
bedo
0
0.2
0.4
0.6
7 8 9 10
Asy
mm
etry
fact
or
7 8 9 10 7 8 9 10λ (μm) λ (μm) λ (μm)
τe spheroidsτe spheres
τe spheroidsτe spheres
ϖ0 spheroidsϖ0 spheres
ϖ0 spheroidsϖ0 spheres
g spheroidsg spheres
g spheroidsg spheres
g spheroidsg spheres
ϖ0 spheroidsϖ0 spheres
KAOLINITE ILLITE EXTERNAL MIXTURE
Fig. 6. (continued)
M. Legrand et al. / Journal of Quantitative Spectroscopy & Radiative Transfer 149 (2014) 219–240 233
not so strong as those for quartz. Fig. 7b shows the curvesrepresenting the complex indices m(n, k) of kaolinite andillite in the complex plane when the wavelength variesbetween 9.25 and 9.5 mm for kaolinite and between 9.0and 9.4 mm for illite. In comparison with quartz O and E,the minimum distances between S and the curves arelarger for kaolinite and (particularly) for illite. Thesedifferences are due to the real refractive indices, largerfor kaolinite than for quartz O and E and still larger forillite. This is why the resonance is weaker and smootherfor kaolinite and especially for illite than for quartz.
In Fig. 7b, the closest points from S, FK for kaolinite andFI for illite corresponding to the Fröhlich mode for small
particles, are marked on these curves, and the correspond-ing wavelengths values are λFK ¼ 9:363 mm and λFI ¼9:225 mm. They are slightly shorter than the wavelengthsλMK ¼ 9:399 mm and λMI ¼ 9:259 mm of the peaks of extinc-tion of Mie from Fig. 6b, calculated for the bimodal PVSD ofFig. 1a (wavelengths are recapitulated in Table 4). So itappears that, contrary to the case of quartz previouslystudied, not only the very small particles of clays effec-tively define the spectral location of the peaks of extinc-tion in Fig. 6b. A noticeable effect of larger (but still small,with xo1) clay particles may appear, simply because ofthe much weaker resonance associated to the very smallparticles. Then, more terms have to be kept in the series
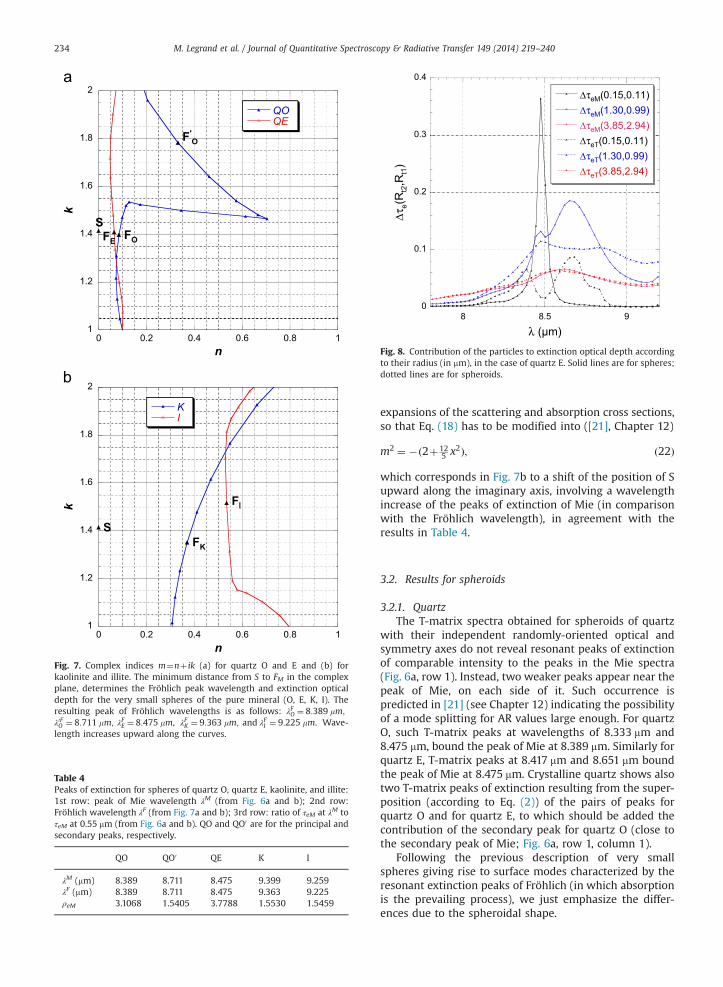
Table 4Peaks of extinction for spheres of quartz O, quartz E, kaolinite, and illite:1st row: peak of Mie wavelength λM (from Fig. 6a and b); 2nd row:Fröhlich wavelength λF (from Fig. 7a and b); 3rd row: ratio of τeM at λM toτeM at 0.55 mm (from Fig. 6a and b). QO and QO0 are for the principal andsecondary peaks, respectively.
QO QO0 QE K I
λM (mm) 8.389 8.711 8.475 9.399 9.259λF (mm) 8.389 8.711 8.475 9.363 9.225ρeM 3.1068 1.5405 3.7788 1.5530 1.5459
Fig. 8. Contribution of the particles to extinction optical depth accordingto their radius (in mm), in the case of quartz E. Solid lines are for spheres;dotted lines are for spheroids.
Fig. 7. Complex indices m¼nþ ik (a) for quartz O and E and (b) forkaolinite and illite. The minimum distance from S to FM in the complexplane, determines the Fröhlich peak wavelength and extinction opticaldepth for the very small spheres of the pure mineral (O, E, K, I). Theresulting peak of Fröhlich wavelengths is as follows: λFO ¼ 8:389 mm;
λ0FO ¼ 8:711 mm; λFE ¼ 8:475 mm, λFK ¼ 9:363 mm; and λFI ¼ 9:225 mm. Wave-length increases upward along the curves.
M. Legrand et al. / Journal of Quantitative Spectroscopy & Radiative Transfer 149 (2014) 219–240234
expansions of the scattering and absorption cross sections,so that Eq. (18) has to be modified into ([21], Chapter 12)
m2 ¼ �ð2þ125 x2Þ; ð22Þ
which corresponds in Fig. 7b to a shift of the position of Supward along the imaginary axis, involving a wavelengthincrease of the peaks of extinction of Mie (in comparisonwith the Fröhlich wavelength), in agreement with theresults in Table 4.
3.2. Results for spheroids
3.2.1. QuartzThe T-matrix spectra obtained for spheroids of quartz
with their independent randomly-oriented optical andsymmetry axes do not reveal resonant peaks of extinctionof comparable intensity to the peaks in the Mie spectra(Fig. 6a, row 1). Instead, two weaker peaks appear near thepeak of Mie, on each side of it. Such occurrence ispredicted in [21] (see Chapter 12) indicating the possibilityof a mode splitting for AR values large enough. For quartzO, such T-matrix peaks at wavelengths of 8.333 mm and8.475 mm, bound the peak of Mie at 8.389 mm. Similarly forquartz E, T-matrix peaks at 8.417 mm and 8.651 mm boundthe peak of Mie at 8.475 mm. Crystalline quartz shows alsotwo T-matrix peaks of extinction resulting from the super-position (according to Eq. (2)) of the pairs of peaks forquartz O and for quartz E, to which should be added thecontribution of the secondary peak for quartz O (close tothe secondary peak of Mie; Fig. 6a, row 1, column 1).
Following the previous description of very smallspheres giving rise to surface modes characterized by theresonant extinction peaks of Fröhlich (in which absorptionis the prevailing process), we just emphasize the differ-ences due to the spheroidal shape.
M. Legrand et al. / Journal of Quantitative Spectroscopy & Radiative Transfer 149 (2014) 219–240 235
For a very small spheroid compared to the wavelength(x⪡1), Eq. (18) for a sphere is replaced by ([21], Chapter 12)
m2 ¼ 1� 1Lp; ðp¼ a; bÞ ð23Þ
where parameters a and b are the major and minor semi-axes of the spheroid-generating ellipse and Lp are geometricparameters with values between 0 and 1 (for definitions,see [21], Chapter 5). In case of an axis ratio of 1, Eq. (23)becomes a single equation in which it can be shownthat La¼Lb¼1/3, which verifies the equivalence betweenEqs. (23) and (18) for the sphere. Eq. (23) – as Eq. (18) –
provides negative values for m2, resulting in pure imaginaryvalues of m (points on the imaginary axis in the complexplane). So, the point S for a sphere is replaced for a spheroidby points Sa and Sb on the imaginary axis. If a4b, thenLao1/3oLb, so that the points Sa and Sb are locatedrespectively above and below S (the distance between themvanishes when the axis ratio ε approaches 1). Along eachcurve representing the complex index for quartz O and E,the closest points to Sa and to Sb are found at wavelengthsrespectively larger and smaller than Fröhlich wavelength.This fact explains the observed split of the extinction peakfor spheres into two peaks for spheroids (Fig. 6a, row 1,columns 1 and 2). It should be stressed too that thelocations of Sa and Sb are dependent on ε, so that consider-ing the axis ratio distribution of spheroids of Fig. 1b (used inthe T-matrix calculations) will result in two clusters ofpoints such as Sa and Sb along the imaginary axis of Fig. 7a,above and below S. This difference with the single point Sfor (very small) spheres explains why the T-matrix peaks ofextinction in Fig. 6a are smoother (less sharp and wider)than the Mie peaks. Fig. 8 shows that radiative effects of thespheroids and of the spheres according to their size (withsame equivalent radius) are analogous. The contribution ofthe very small spheroids (0.11–0.15 mm) coincides spectrallywith the two resonant T-matrix peaks, which expresses aspectral difference with the single sharp peak of the verysmall spheres. The super-micron particles (2.94–3.86 mm)contribute to the complete spectrum with no contributionto the resonant peak and their effect is close to the effect ofthe super-micron spheres. The spheroids with radii around1 mm (0.99–1.30 mm) show an intermediate feature, provid-ing a large contribution to the complete spectrum, but wecan see that their effect is widely different from the sphereseffect.
A consequence to keep in mind is that the super-micron particles bring no contribution to the extinctionpeaks and provide close contributions to extinction spec-tra whatever their shape (spheres or spheroids).
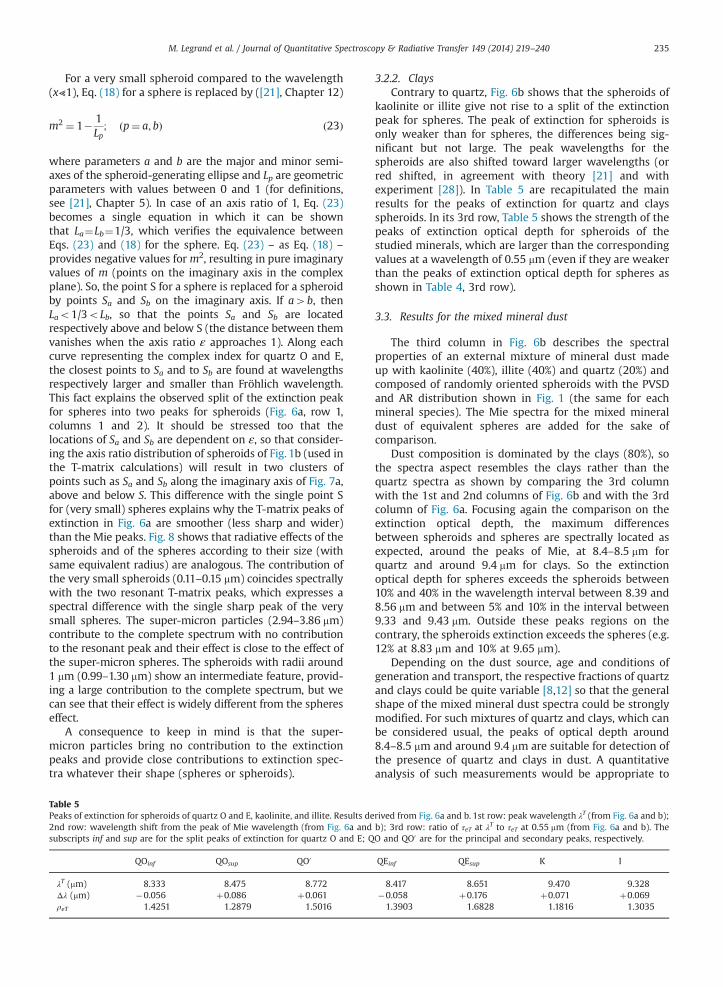
Table 5Peaks of extinction for spheroids of quartz O and E, kaolinite, and illite. Results de2nd row: wavelength shift from the peak of Mie wavelength (from Fig. 6a andsubscripts inf and sup are for the split peaks of extinction for quartz O and E; Q
QOinf QOsup QO0
λT (mm) 8.333 8.475 8.772Δλ (mm) �0.056 þ0.086 þ0.061ρeT 1.4251 1.2879 1.5016
3.2.2. ClaysContrary to quartz, Fig. 6b shows that the spheroids of
kaolinite or illite give not rise to a split of the extinctionpeak for spheres. The peak of extinction for spheroids isonly weaker than for spheres, the differences being sig-nificant but not large. The peak wavelengths for thespheroids are also shifted toward larger wavelengths (orred shifted, in agreement with theory [21] and withexperiment [28]). In Table 5 are recapitulated the mainresults for the peaks of extinction for quartz and claysspheroids. In its 3rd row, Table 5 shows the strength of thepeaks of extinction optical depth for spheroids of thestudied minerals, which are larger than the correspondingvalues at a wavelength of 0.55 mm (even if they are weakerthan the peaks of extinction optical depth for spheres asshown in Table 4, 3rd row).
3.3. Results for the mixed mineral dust
The third column in Fig. 6b describes the spectralproperties of an external mixture of mineral dust madeup with kaolinite (40%), illite (40%) and quartz (20%) andcomposed of randomly oriented spheroids with the PVSDand AR distribution shown in Fig. 1 (the same for eachmineral species). The Mie spectra for the mixed mineraldust of equivalent spheres are added for the sake ofcomparison.
Dust composition is dominated by the clays (80%), sothe spectra aspect resembles the clays rather than thequartz spectra as shown by comparing the 3rd columnwith the 1st and 2nd columns of Fig. 6b and with the 3rdcolumn of Fig. 6a. Focusing again the comparison on theextinction optical depth, the maximum differencesbetween spheroids and spheres are spectrally located asexpected, around the peaks of Mie, at 8.4–8.5 mm forquartz and around 9.4 mm for clays. So the extinctionoptical depth for spheres exceeds the spheroids between10% and 40% in the wavelength interval between 8.39 and8.56 mm and between 5% and 10% in the interval between9.33 and 9.43 mm. Outside these peaks regions on thecontrary, the spheroids extinction exceeds the spheres (e.g.12% at 8.83 mm and 10% at 9.65 mm).
Depending on the dust source, age and conditions ofgeneration and transport, the respective fractions of quartzand clays could be quite variable [8,12] so that the generalshape of the mixed mineral dust spectra could be stronglymodified. For such mixtures of quartz and clays, which canbe considered usual, the peaks of optical depth around8.4–8.5 mm and around 9.4 mm are suitable for detection ofthe presence of quartz and clays in dust. A quantitativeanalysis of such measurements would be appropriate to
rived from Fig. 6a and b. 1st row: peak wavelength λT (from Fig. 6a and b);b); 3rd row: ratio of τeT at λT to τeT at 0.55 mm (from Fig. 6a and b). TheO and QO0 are for the principal and secondary peaks, respectively.
QEinf QEsup K I
8.417 8.651 9.470 9.328�0.058 þ0.176 þ0.071 þ0.0691.3903 1.6828 1.1816 1.3035
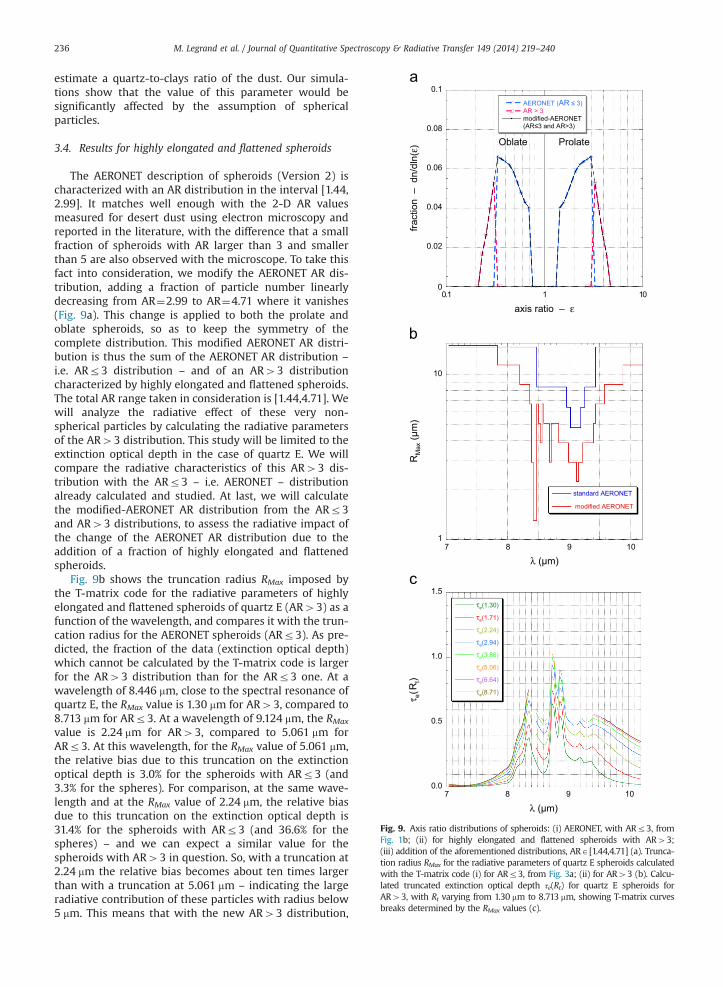
0
0.02
0.04
0.06
0.08
0.1
0111.0
AERONET (AR ≤ 3)AR > 3 modified-AERONET(AR≤3 and AR>3)
fract
ion
– d
n/dl
n(ε)
axis ratio – ε
Oblate Prolate
1
10
7 8 9 10
standard AERONET
modified AERONET
RM
ax (μ
m)
λ (μm)
0.0
0.5
1.0
1.5
7 8 9 10
τ (1.30)
τ (1.71)
τ (2.24)
τ (2.94)
τ (3.86)
τ (5.06)
τ (6.64)
τ (8.71)
τ e(R
t)
λ (μm)
Fig. 9. Axis ratio distributions of spheroids: (i) AERONET, with ARr3, fromFig. 1b; (ii) for highly elongated and flattened spheroids with AR43;(iii) addition of the aforementioned distributions, ARA[1.44,4.71] (a). Trunca-tion radius RMax for the radiative parameters of quartz E spheroids calculatedwith the T-matrix code (i) for ARr3, from Fig. 3a; (ii) for AR43 (b). Calcu-lated truncated extinction optical depth τe(Rt) for quartz E spheroids forAR43, with Rt varying from 1.30 mm to 8.713 mm, showing T-matrix curvesbreaks determined by the RMax values (c).
M. Legrand et al. / Journal of Quantitative Spectroscopy & Radiative Transfer 149 (2014) 219–240236
estimate a quartz-to-clays ratio of the dust. Our simula-tions show that the value of this parameter would besignificantly affected by the assumption of sphericalparticles.
3.4. Results for highly elongated and flattened spheroids
The AERONET description of spheroids (Version 2) ischaracterized with an AR distribution in the interval [1.44,2.99]. It matches well enough with the 2-D AR valuesmeasured for desert dust using electron microscopy andreported in the literature, with the difference that a smallfraction of spheroids with AR larger than 3 and smallerthan 5 are also observed with the microscope. To take thisfact into consideration, we modify the AERONET AR dis-tribution, adding a fraction of particle number linearlydecreasing from AR¼2.99 to AR¼4.71 where it vanishes(Fig. 9a). This change is applied to both the prolate andoblate spheroids, so as to keep the symmetry of thecomplete distribution. This modified AERONET AR distri-bution is thus the sum of the AERONET AR distribution –
i.e. ARr3 distribution – and of an AR43 distributioncharacterized by highly elongated and flattened spheroids.The total AR range taken in consideration is [1.44,4.71]. Wewill analyze the radiative effect of these very non-spherical particles by calculating the radiative parametersof the AR43 distribution. This study will be limited to theextinction optical depth in the case of quartz E. We willcompare the radiative characteristics of this AR43 dis-tribution with the ARr3 – i.e. AERONET – distributionalready calculated and studied. At last, we will calculatethe modified-AERONET AR distribution from the ARr3and AR43 distributions, to assess the radiative impact ofthe change of the AERONET AR distribution due to theaddition of a fraction of highly elongated and flattenedspheroids.
Fig. 9b shows the truncation radius RMax imposed bythe T-matrix code for the radiative parameters of highlyelongated and flattened spheroids of quartz E (AR43) as afunction of the wavelength, and compares it with the trun-cation radius for the AERONET spheroids (ARr3). As pre-dicted, the fraction of the data (extinction optical depth)which cannot be calculated by the T-matrix code is largerfor the AR43 distribution than for the ARr3 one. At awavelength of 8.446 mm, close to the spectral resonance ofquartz E, the RMax value is 1.30 mm for AR43, compared to8.713 mm for ARr3. At a wavelength of 9.124 mm, the RMax
value is 2.24 mm for AR43, compared to 5.061 mm forARr3. At this wavelength, for the RMax value of 5.061 mm,the relative bias due to this truncation on the extinctionoptical depth is 3.0% for the spheroids with ARr3 (and3.3% for the spheres). For comparison, at the same wave-length and at the RMax value of 2.24 mm, the relative biasdue to this truncation on the extinction optical depth is31.4% for the spheroids with ARr3 (and 36.6% for thespheres) – and we can expect a similar value for thespheroids with AR43 in question. So, with a truncation at2.24 mm the relative bias becomes about ten times largerthan with a truncation at 5.061 mm – indicating the largeradiative contribution of these particles with radius below5 mm. This means that with the new AR43 distribution,
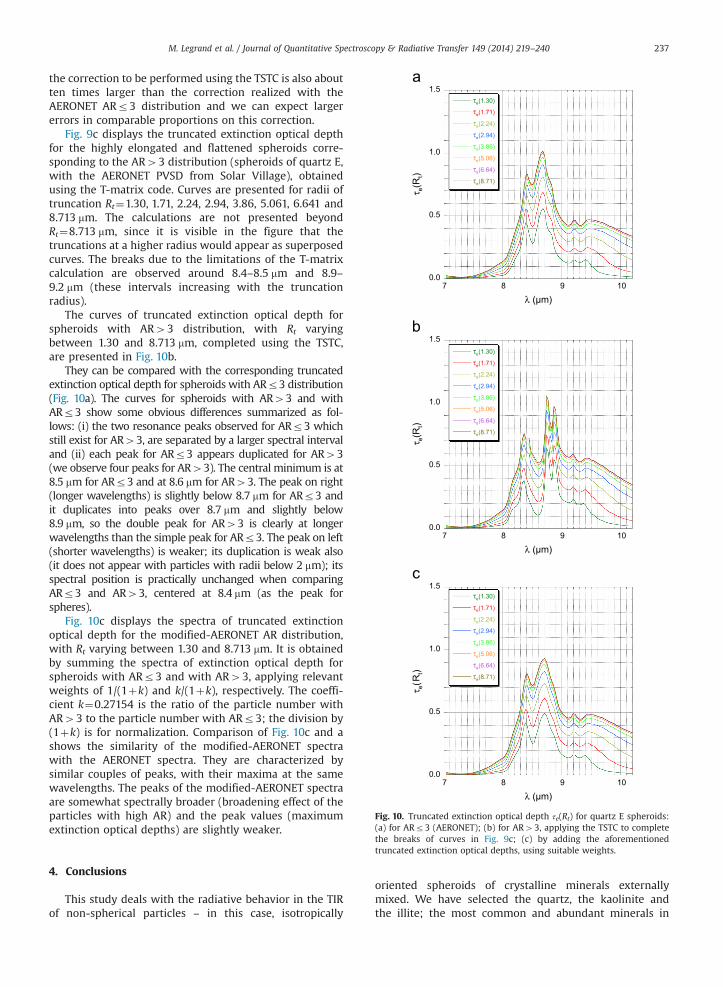
0.0
0.5
1.0
1.5
7 8 9 10
τ (1.30)
τ (1.71)
τ (2.24)
τ (2.94)
τ (3.86)
τ (5.06)
τ (6.64)
τ (8.71)
τ e(R
t)
λ (μm)
0.0
0.5
1.0
1.5
7 8 9 10
τ (1.30)
τ (1.71)
τ (2.24)
τ (2.94)
τ (3.86)
τ (5.06)
τ (6.64)
τ (8.71)
τ e(R
t)
λ (μm)
0.0
0.5
1.0
1.5
7 8 9 10
τ (1.30)
τ (1.71)
τ (2.24)
τ (2.94)
τ (3.86)
τ (5.06)
τ (6.64)
τ (8.71)
τ e(R
t)
λ (μm)
Fig. 10. Truncated extinction optical depth τe(Rt) for quartz E spheroids:(a) for ARr3 (AERONET); (b) for AR43, applying the TSTC to complete
M. Legrand et al. / Journal of Quantitative Spectroscopy & Radiative Transfer 149 (2014) 219–240 237
the correction to be performed using the TSTC is also aboutten times larger than the correction realized with theAERONET ARr3 distribution and we can expect largererrors in comparable proportions on this correction.
Fig. 9c displays the truncated extinction optical depthfor the highly elongated and flattened spheroids corre-sponding to the AR43 distribution (spheroids of quartz E,with the AERONET PVSD from Solar Village), obtainedusing the T-matrix code. Curves are presented for radii oftruncation Rt¼1.30, 1.71, 2.24, 2.94, 3.86, 5.061, 6.641 and8.713 mm. The calculations are not presented beyondRt¼8.713 mm, since it is visible in the figure that thetruncations at a higher radius would appear as superposedcurves. The breaks due to the limitations of the T-matrixcalculation are observed around 8.4–8.5 mm and 8.9–9.2 mm (these intervals increasing with the truncationradius).
The curves of truncated extinction optical depth forspheroids with AR43 distribution, with Rt varyingbetween 1.30 and 8.713 mm, completed using the TSTC,are presented in Fig. 10b.
They can be compared with the corresponding truncatedextinction optical depth for spheroids with ARr3 distribution(Fig. 10a). The curves for spheroids with AR43 and withARr3 show some obvious differences summarized as fol-lows: (i) the two resonance peaks observed for ARr3 whichstill exist for AR43, are separated by a larger spectral intervaland (ii) each peak for ARr3 appears duplicated for AR43(we observe four peaks for AR43). The central minimum is at8.5 mm for ARr3 and at 8.6 mm for AR43. The peak on right(longer wavelengths) is slightly below 8.7 mm for ARr3 andit duplicates into peaks over 8.7 mm and slightly below8.9 mm, so the double peak for AR43 is clearly at longerwavelengths than the simple peak for ARr3. The peak on left(shorter wavelengths) is weaker; its duplication is weak also(it does not appear with particles with radii below 2 mm); itsspectral position is practically unchanged when comparingARr3 and AR43, centered at 8.4 mm (as the peak forspheres).
Fig. 10c displays the spectra of truncated extinctionoptical depth for the modified-AERONET AR distribution,with Rt varying between 1.30 and 8.713 mm. It is obtainedby summing the spectra of extinction optical depth forspheroids with ARr3 and with AR43, applying relevantweights of 1/(1þk) and k/(1þk), respectively. The coeffi-cient k¼0.27154 is the ratio of the particle number withAR43 to the particle number with ARr3; the division by(1þk) is for normalization. Comparison of Fig. 10c and ashows the similarity of the modified-AERONET spectrawith the AERONET spectra. They are characterized bysimilar couples of peaks, with their maxima at the samewavelengths. The peaks of the modified-AERONET spectraare somewhat spectrally broader (broadening effect of theparticles with high AR) and the peak values (maximumextinction optical depths) are slightly weaker.
the breaks of curves in Fig. 9c; (c) by adding the aforementionedtruncated extinction optical depths, using suitable weights.
4. Conclusions
This study deals with the radiative behavior in the TIRof non-spherical particles – in this case, isotropically
oriented spheroids of crystalline minerals externallymixed. We have selected the quartz, the kaolinite andthe illite; the most common and abundant minerals in
M. Legrand et al. / Journal of Quantitative Spectroscopy & Radiative Transfer 149 (2014) 219–240238
desert dust (at least in northern Africa, Arabian Peninsulaand SW and central Asia). We have completed the dustspecifications, using a distribution of spheroids (size andAR) from AERONET database (Version 2) and the complexindices of refraction in the spectral range [7.0,10.2 mm] forthe aforementioned minerals. We have simulated theradiative parameters (extinction optical depth, single scat-tering albedo, asymmetry factor) of this dust, using aT-matrix code. The corresponding radiative parametersfor equivalent spheres (having the same volume as thespheroids) have been systematically simulated, to estimatequantitatively the relevance of using or not Mie calcula-tions for such non-spherical particles.
For large particles and large values of the mineral complexindices, we observe occurrence of cases for which the valuesof the parameters cannot be fully calculated. Then, a partialvalue ignoring the particles of equivalent radius larger than aradius of truncation RMax (o15 mm) is provided by the T-matrix code. For the particle volume size and aspect ratiodistributions of dust at the station of Solar Village, fromAERONET (Version 2), the lowest truncation radius is observedfor quartz E at 5.061 mm. The missing contribution of the largeparticles can be accurately compensated thanks to the follow-ing favorable features: (i) it is weak, even for the lowestobserved truncation radii (ca. 3% maximum for the extinctionoptical depth for quartz E truncated at RMax¼5.061 mm); (ii) ithardly depends on the particle shape. Contrary to this case,the large differences between the T-matrix and Mie spectraobserved around the resonance peaks, are due to “fine”particles with radii smaller than the lowest truncation radiusmet (namely the sub-micron particles and the particlesca. 1 mm radius, corresponding to the fine mode plus the fineend of the coarse mode of the PVSD for Solar Village, Fig. 1).Hence, if the T-matrix code fails to fully calculate a radiativeparameter (X), the missing contribution due the largestparticles can be estimated through the Mie correspondingcontribution, because the so-called T-matrix and Mie relativetruncation biases for the large particles (defined in Eq. (9)) areclose and they behave spectrally similarly. This approachreferred to as T-matrix Size Truncation Compensation (TSTC)is described in details in Section 2.3.2. The accuracy of themethod is optimized by interpolating spectrally the differenceδT�MX (defined in Eq. (10)) between the relative truncatedparticles biases from T-matrix and from Mie calculationsðΔX=XÞT and ðΔX=XÞM , respectively, in the spectral regionswhere ðΔX=XÞT is unknown. The maximum relative error ofthe method is obtained with quartz E; it does not exceed70.15% for any of the simulated parameters (X¼τe,ϖ0, g) forany wavelength. The truncation by the T-matrix code isincreased by the addition of particles with large values ofthe AR (RMax is lower). This has been put in evidence byincreasing the maximum AR value of 3 of the AERONET(Version 2) AR distribution to 4.7 (consistently with observedAR values by means of microscope determination). The newlowest RMax value is 1.30 mm (again for quartz E), in whichcase the missing contribution of the larger particles is stronglyenhanced (ca. 30% for the extinction optical depth of quartz E)and the previously stated ((i) and (ii)) favorable conditions arenot so well fulfilled.
The TIR simulated spectra of τe,ϖ0 and g are presentedfor quartz and the constitutive quartz O and E, for clays:
kaolinite and illite, for the AERONET (Version 2) PVSD fromSolar Village (Arabian Peninsula) and the standard spher-oids AR distribution (ARr3). They can be compared to thecorresponding spectra of spheres, obtained by replacing T-matrix by Mie calculations, and systematically reported inthe figures of this paper. The largest differences betweenthe T-matrix and Mie results are located in the regions ofthe resonance peaks, which can be accurately determined.This accuracy is important, because the peaks of extinction(and absorption) are likely to play a key part in TIR remotesensing of the mineral species of dust, both for identifica-tion of these species in dust and for quantitative estimatessuch as the quartz-to-clays ratio. In relation with this pointof view, it should also be emphasized that the strength ofthe TIR peaks of extinction, confirmed by their ratio toextinction optical depth at 0.55 mm larger than 1 (asshown in Table 5), is a favorable circumstance for dustremote sensing in the TIR. The main differences due to thenon-sphericity are (i) the split of the single resonance peakof extinction for spheres of quartz into two peaks forspheroids and (ii) the red shift of the peak of extinction forspheroids of clays (kaolinite, illite). In the case of quartz E,the extension of the standard AERONET AR distributionlimited to highest AR values of 3, up to AR values close to5, results in a modified-AERONET AR distribution whoseextinction optical depth is not very different of thestandard distribution. The limited fraction of particles withAR higher than 3 is the first reason for these rather similarspectra (so this result can be generalized to otherminerals).
Finally, the interest of the resonance peaks for theirapplications in remote sensing leads to some suggestions,beyond the general necessity to avoid Mie theory. Thepredominant effect of the “fine” mineral particles in theextinction and absorption peak optical depths, suggests tocarefully examine and revisit if necessary, their size dis-tribution, shape and composition. Current experimentalresults indicate that the AR is not very different betweenthese “fine” particles and the complete size distribution[17], but the studies are scarce. Indeed, the properties ofthese small particles are not yet so well known; even thequestion of their existence in mineral dust was speculativefew years ago [1]. Their shape is important (not only AR forspheroids, but perhaps also non spheroidal shapes),because the peak wavelength and absorption optical depthof “fine” particles are shape-dependent [21,28]. The resultsfrom Kleiber et al. [30] showing a strong discrepancybetween 2-D AR measurements (values below 3) frommicroscopy and much higher values (10–20) used to simu-late satisfactorily the absorption peaks of sub-micron par-ticles of clays, suggest to investigate carefully what is thereal shape of the “fine” particles of clays generated in thedesert. Mono-crystals of clays are described as plates, with athickness much smaller than the two other dimensions,which is not taken into account in the classical 2-D micro-scopy and could explain the discrepancy. Following thishypothesis, a (much) larger 3-D AR value should replace the2-D value, representing very flat oblate spheroids (or evendisks, i.e. very flat cylinders), valid only for the “fine”fraction of the clays. This is not the case for the “coarse”fraction, constituted of aggregates, with very different
M. Legrand et al. / Journal of Quantitative Spectroscopy & Radiative Transfer 149 (2014) 219–240 239
shapes – whose radiative shape effect is anyway weak. Forthe description of the resonance peaks, not only the shape,but also the mineral composition is important, not only thefractions of pure mineral of the external mixture used inthis study, but also the characterization of “fine” compositeparticles constituting an internal mixture able to affectnoticeably the peak optical depth. Even though internalmixture has not been considered in this study, it can benoted that the T-matrix code and the TSTC can be applied aswell to an internal mixture, using its effective complexrefractive index.
Acknowledgments
This study stemmed from a project on remote sensingof desert dust in the thermal infrared during the AMMAcampaign in 2006, which has been co-sponsored by thePNTS (INSU, France) and by the TOSCA (CNES, France). Thefirst author has greatly appreciated helpful discussions andsuggestions with Alexander B. Kostinski from the MichiganTechnological University, Houghton, USA, and with OlivierPujol from the LOA, University of Lille, France. We thanktwo anonymous reviewers who helped to improve themanuscript, either with encouraging positive apprecia-tions, or with advisable comments.
References
[1] Formenti P, Schütz L, Balkanski Y, Desboeufs K, Ebert M, Kandler K, et al.Recent progress in understanding physical and chemical properties odAfrican and Asian mineral dust. Atmos Chem Phys 2011;11:8231–56.
[2] Caquineau S, Gaudichet A, Gomes L, Legrand M. Mineralogy of Saharandust transported over northwestern tropical Atlantic Ocean in relationto sources regions. J Geophys Res 2002;107:4251. http://dx.doi.org/10.1029/2000jd000247.
[3] Moreno T, Querol X, Castillo S, Alastuey A, Cuevas E, Hermann L, et al.Geochemical variations in aeolian mineral particles from the Sahara-Sahel Dust Corridor. Chemosphere 2006;65:261–70. http://dx.doi.org/10.1016/j.chemosphere.2006.02.052.
[4] Claquin T, Schulz M, Balkanski Y. Modeling the mineralogy ofatmospheric dust sources. J. Geophys. Res. 1999;104:22243–56.
[5] Nickling WG. Aeolian sediment transport and deposition. In: Pye K,editor. Sediment transport and depositional processes. BlackwellScientific; 1994. p. 292–349.
[6] Alfaro SC, Gomes L. Modeling mineral aerosol production by winderosion: emission intensities and aerosol size distributions insources areas. J Geophys Res 2001;106:18075–84. http://dx.doi.org/10.1029/2000jd900339.
[7] Sow M, Alfaro SC, Rajot JL, Marticorena B. Size resolved dust emissionfluxes measured in Niger during 3 dust storms of the AMMAexperiment. Atmos Chem Phys 2009;9:3881–91. http://dx.doi.org/10.5194/acp-9-3881-2009.
[8] Thomas M, Gautier C. Investigation of the March 2006 African duststorm using ground-based column-integrated high spectral resolu-tion infrared (8–13 mm) and visible aerosol optical thickness mea-surements: 2 mineral aerosol mixture analyses. J Geophys Res2009;114. http://dx.doi.org/10.1029/2008JD1931.
[9] Kandler K, Schütz L, Deutscher C, Ebert M, Hofmann H, Jäckel S, et al.Size distribution, mass concentration, chemical and mineralogicalcomposition and derived optical parameters of the boundary layeraerosol at Tindouf, Morocco, during SAMUN 2006. Tellus B 2009;61:32–50. http://dx.doi.org/10.1111/j.1600-0889.2008.00385.x.
[10] Glaccum RA, Prospero JM. Saharan aerosols over the tropical NorthAtlantic – mineralogy. Mar Geol 1980;37:295–321.
[11] Pye K. Aeolian dust and dust deposition. London: Academic Press;1987. (334 pp).
[12] Sokolik IN, Toon OB. Incorporation of mineralogical composition intomodels of the radiative properties of mineral aerosol from UV to IRwavelengths. J Geophys Res 1999;104:9423–44.
[13] Formenti P, Rajot JL, Desboeufs K, Caquineau S, Chevaillier S, Nava S,et al. Regional variability of the composition of mineral dust fromwestern Africa: results from the AMMA SOP0/DABEX and DODOfield campaigns. J Geophys Res 2008:D00C13. http://dx.doi.org/10.1029/2008JD009903.
[14] Falkovich AH, Ganor E, Levin Z, Formenti P, Rudich Y. Chemical andmineralogical analysis of individual mineral dust particles. J GeophysRes 2001;106:18029–36.
[15] Gao Y, Anderson JR. Characteristics of Chinese aerosols deter-mined by individual-particle analysis. J Geophys Res 2001;106:18037–45.
[16] Petit RH, Legrand M, Jankowiak I, Molinié J, Asselin de Beauville C,Marion G, et al. Transport of Saharan dust over the CarribeanIslands: study of an event. J Geophys Res 2005;110:D18S09. http://dx.doi.org/10.1029/2004JD004748.
[17] Chou C, Formenti P, Maille M, Ausset P, Helas G, Harrison M, et al.Size distribution, shape, and composition of mineral dust aerosolscollected during the African Monsoon Multiplidisciplinary AnalysisSpecial Observation Period 0: Dust and Biomass‐Burning Experi-ment field campaign in Niger, January 2006. J Geophys Res2008;113:D00C10. http://dx.doi.org/10.1029/2008JD009897.
[18] Reid EA, Reid JS, Meier MM, Dunlap MR, Cliff SS, Broumas A, et al.Characterization of African dust transported to Puerto Rico byindividual particle and size segregated bulk analysis. J Geophys Res2003;108:8591. http://dx.doi.org/10.1029/2002jd002935.
[19] Kandler K, Benker N, Bundke U, Cuevas E, Ebert M, Knippertz P, et al.Chemical composition and complex refractive index of Saharanmineral dust at Izaña, Tenerife (Spain) derived by electron micro-scopy. Atmos Environ 2007;41:8058–74.
[20] Caquineau S. Les sources des aérosols sahariens transportés au-dessus de l’Atlantique tropical Nord: localisation et caractéristiquesminéralogiques, (Thesis). 1997, University Paris, 12, 530 pp.
[21] Bohren CF, Huffman DR. Absorption and Scattering of Light by SmallParticles. Weinheim: WILEY-VCH Verlag GmbH & Co. KGaA;2004, 530 pp.
[22] Kolokolova L, Gustafson BAF. Scattering by inhomogeneousparticles: microwave analog experiments and comparison toeffective medium theory. J Quant Spectros Radiat Transf 2001;70:611–25.
[23] Voshchinnikov NV, Videen G, Henning T. Effective medium theoriesfor irregular fluffy structures: aggregation of small particles. ApplOpt 2007;46:4065–72.
[24] Thomas M, Gautier C, Ricchiazzi P. Investigations of the March 2006African dust storm using ground-based column-integrated high-spectral resolution infrared (8–13 mm) and visible optical thicknessmeasurements: 1. Measurements procedures and results. J GeophysRes 2009;114:D11202. http://dx.doi.org/10.1029/2008JD010928.
[25] Holben BN, Eck TF, Slutsker I, Tanre D, Buis JP, Setzer A, et al.AERONET – a federated instrument network and data archive foraerosol characterization. Remote Sens Environ 1998;66(1):1–16.
[26] Osborne SR, Johnson BT, Haywood JM, Baran AJ, Harrison MAJ, McCon-nell CL. Physical and optical properties of mineral dust aerosol during theDust and Biomass‐burning Experiment. J Geophys Res 2008;113:D00C03. http://dx.doi.org/10.1029/2007JD009551.
[27] Baron PA, Willeke K. Aerosol measurements: principles, techniquesand applications. 2nd ed.New York: John Wiley and Sons; 2001.
[28] Hudson PK, Gibson ER, Young MA, Kleiber PD, Grassian VH. Coupledinfrared extinction and size distribution measurements for severalclay components of mineral dust aerosol. J Geophys Res 2008;113:D01201. http://dx.doi.org/10.1029/2007JD008791.
[29] Mogili PK, Yang KH, Young MA, Kleiber PD, Grassian VH. Environ-mental aerosol chambers studies of extinction spectra of mineral dustaerosol components: broadband IR-UV extinction spectra. J GeophysRes 2007;112:D21204. http://dx.doi.org/10.1029/2007JD008890.
[30] Kleiber PD, Grassian VH, Young MA, Hudson Paula K. T-matrixstudies of aerosol particle shape effects on IR resonance spectralline profiles and comparison with an experiment. J Geophys Res2009;114:D21209. http://dx.doi.org/10.1029/2009JD012710.
[31] Dubovik O, King MD. A flexible inversion algorithm for retrieval ofaerosol optical properties from sun and sky radiance measurements.J Geophys Res 2000;105:20673–96.
[32] Dubovik O, Holben BN, Lapyonok T, Sinyuk A, Mishchenko MI, Yang P,et al. Non-spherical aerosol retrieval method employing light scatteringby spheroids. Geophys Res Lett 2002;29:1415. http://dx.doi.org/10.1029/2001GL014506.
[33] Dubovik O, Sinyuk A, Lapyonok T, Holben BN, Mishchenko M, YangP, et al. Application of spheroid models to account for aerosolparticle nonsphericity in remote sensing of desert dust. J GeophysRes 2006;111:D11208. http://dx.doi.org/10.1029/2009JD012710.
M. Legrand et al. / Journal of Quantitative Spectroscopy & Radiative Transfer 149 (2014) 219–240240
[34] Holben BN, Eck TF, Slutsker I, Smirnov A, Sinyuk A, Schafer J, et al.AERONET's version 2.0 quality assurance criteria. In: Tsay SC,Nakajima T, Singh RP, Sridharan R, editors. Remote Sensing of theAtmosphere and Clouds. Proceedings of SPIE, vol. 6408, 64080Q –
0277-786X/06/$15; 2006. doi:10.1117/12.706524.[35] Dubovik O, Herman M, Holdak A, Lapyonok T, Tanré D, Deuzé JL,
et al. Statistically optimized inversion algorithm for enhancedretrieval of aerosol properties from spectral multi-angle polari-metric satellite observations. Atmos Meas Tech 2011;4:975–1018.
[36] Dubovik O, Holben B, Eck TF, Smirnov A, Kaufman YF, King MD, et al.Variability of absorption and optical properties of key aerosol typesobserved in worldwide locations. J Atmos Sci 2002;59:590–608.
[37] MishchenkoMI, Travis LW, Kahn RA,West RA. Modeling phase functionsfor dustlike tropospheric aerosols using a shape mixture of randomlyoriented polydisperse spheroids. J Geophys Res 1997;102:16831–47.
[38] Volten H, Munoz O, Rol E, de Haan JF, Vassen W, Hovenier JW, et al.Scattering matrices of mineral aerosol particles at 441.6 nm and632.8 nm. J Geophys Res 2001;106:17375–401.
[39] Mishchenko MI, Travis LD, Lacis AA. Scattering, Absorption, andEmission of Light by Small Particles. New York: Cambridge Uni-versity Press; 2002, 445 pp.
[40] Claquin T, Schulz M. Modeling the mineralogy of atmospheric dustsources. J Geophys Res 1999;104(D18):22243–56.
[41] Roush T, Pollack J, Orenberg J. Derivation of mid-infrared (5–25 mm)optical constants of some silicates and palagonite. Icarus 1991;94:191–208.
[42] Querry MR. Optical constants of minerals and other materials fromthe millimeter to the UV. Rep. CRDEC-CR-88009. Aberdeen (MD): USArmy; 1987.
[43] Peterson JT, Weinman JA. Optical properties of quartz dust particlesin infrared wavelengths. J Geophys Res 1969;28:6947–52.
[44] Veihelmann B, Volten H, van der Zande WJ. Light reflected by anatmosphere containing irregular dust aerosol. Geophys Res Lett2004;31:L04113. http://dx.doi.org/10.1029/2003GL018229.
[45] Steyer TR, Day KL, Huffman DR. Infrared absorption by smallamorphous quartz spheres. Appl Opt 1974;13:1586–90.