Elemental composition of PM 2.5 aerosols in Queens, New York: Solubility and temporal trends
15
This article was originally published in a journal published by Elsevier, and the attached copy is provided by Elsevier for the author’s benefit and for the benefit of the author’s institution, for non-commercial research and educational use including without limitation use in instruction at your institution, sending it to specific colleagues that you know, and providing a copy to your institution’s administrator. All other uses, reproduction and distribution, including without limitation commercial reprints, selling or licensing copies or access, or posting on open internet sites, your personal or institution’s website or repository, are prohibited. For exceptions, permission may be sought for such use through Elsevier’s permissions site at: http://www.elsevier.com/locate/permissionusematerial
-
Upload
independent -
Category
Documents
-
view
0 -
download
0
Transcript of Elemental composition of PM 2.5 aerosols in Queens, New York: Solubility and temporal trends

This article was originally published in a journal published byElsevier, and the attached copy is provided by Elsevier for the
author’s benefit and for the benefit of the author’s institution, fornon-commercial research and educational use including without
limitation use in instruction at your institution, sending it to specificcolleagues that you know, and providing a copy to your institution’s
administrator.
All other uses, reproduction and distribution, including withoutlimitation commercial reprints, selling or licensing copies or access,
or posting on open internet sites, your personal or institution’swebsite or repository, are prohibited. For exceptions, permission
may be sought for such use through Elsevier’s permissions site at:
http://www.elsevier.com/locate/permissionusematerial

Autho
r's
pers
onal
co
py
Atmospheric Environment 40 (2006) S238–S251
Elemental composition of PM2.5 aerosols in Queens, New York:Solubility and temporal trends
Sumizah Qureshib, Vincent A. Dutkiewicza,b,�, Adil R. Khana, Kamal Swamia,Karl X. Yanga, Liaquat Husaina,b, James J. Schwabc, Kenneth L. Demerjianc
aNew York State Department of Health, Wadsworth Center, Empire State Plaza, Albany, NY 12201-0509, USAbDepartment of Environmental Health Sciences, State University of New York at Albany, Albany, NY 12201-0509, USA
cAtmospheric Sciences Research Center, State University of New York, Albany, NY, USA
Received 30 July 2005; received in revised form 6 December 2005; accepted 15 December 2005
Abstract
As a part of the PM2.5 Technology Assessment and Characterization Study-New York (PMTACS-NY), concentrations
of sulfate and 15 trace elements were determined in daily PM2.5 samples collected from July 2001 to September 2002 at a
site in urban Queens, NY. The elements were Mg, Al, Ca, V, Cr, Mn, Fe, Co, Ni, Zn, As, Se, Cd, Sb, and Pb. Over the first
12 months these elemental concentrations were measured in both a water extract and in a total acid digestate so that the
solubility of the aerosols bearing the above trace elements could be evaluated. This is important as elements with high
solubility can be more readily bio-activated in the lungs and thus may be potentially more harmful to humans. An
overview of the elemental composition of PM2.5 aerosols at the Queens, NY site over the 15-month period is presented.
This includes a comparison of seasonal changes in aerosol composition and solubility at the sites along with an evaluation
of the impacts on aerosol composition of the collapse of the World Trade Center Towers in Manhattan on 9/11/2001 and
the smoke from Quebec wildfires in early July 2002.
r 2006 Elsevier Ltd. All rights reserved.
Keywords: Particulate matter; Sulfate; Trace elements; PM2.5; Urban aerosols; Solubility; World Trade Center collapse; Wildfire smoke
1. Introduction
The Particulate Matter Technology Assessmentand Characterization Study-New York (PMTACS-NY) was designed to provide enhanced measure-ment data on the chemical and physical composi-tion of particulate matter (PM) and its associated
precursors and to characterize the PM/co-pollutantcomplex and its related sources and sinks. PM withdiameters from nanometers to tens of micrometerscan remain buoyant in the atmosphere for days andthus can be transported over long distances from theoriginal source. Those particles with diameterso2.5 mm (PM2.5) are particularly important becausesuch aerosols can readily enter the lungs where theymay activate a pathological response. There are nowmany health-effect studies that have found signifi-cant links between increased morbidity and mortal-ity due to respiratory and cardiac stress and ambient
ARTICLE IN PRESS
www.elsevier.com/locate/atmosenv
1352-2310/$ - see front matter r 2006 Elsevier Ltd. All rights reserved.
doi:10.1016/j.atmosenv.2005.12.070
�Corresponding author. Department of Health, Wadsworth
Center, New York State, Empire State Plaza, Albany, NY 12201-
0509, USA. Tel.: +1 518 474 7999; fax: +1 518 473 2895.
E-mail address: [email protected] (V.A. Dutkiewicz).
Autho
r's
pers
onal
co
py
PM2.5 concentrations (e.g., Dockery et al., 1993;Dockery and Pope, 1994; Gwynn et al., 2000;McDonnell et al., 2000; Pope et al., 2002).
As a part of the PMTACS-NY project, 24-hPM2.5 filters were continuously collected at foururban and rural sites in New York State: the roof ofPublic School-219 in Queens, NY (PS219), the roofof intermediate school 52 in The Bronx (IS52),Pinnacle State Park (PSP) near Addison in Steubencounty, and Whiteface Mountain lodge (WFML),in the Adirondack Park region. The PS219 site is ina densely populated urban area directly adjacent toQueens College (QCOL) where the PMTACS-NYconsortium of researchers held several samplingintensives during summer 2001 and winter 2004 inwhich a wide variety of state-of-the-art on- and off-line techniques for physical and chemical aerosolanalysis were employed along with established filter-based techniques and real-time measurements ofimportant precursor gases (Drewnick et al., 2003,2004a, b; Hogrefe et al., 2004). The field-samplingprogram began in July of 2001 with the summerintensive at QCOL. Daily aerosol sampling at threeof the daily sites, PS219, PSP, and WFML alsobegan at this time and continued through late 2004.Daily sampling at IS52 began in January of 2002.Filters from all four sites were analyzed for sulfateby ion chromatography (IC) and through Septem-ber 2002 the samples from PS219, PSP, and WFMLwere also analyzed for selected trace metals byinductively coupled plasma mass spectroscopy(ICP-MS). Additional discussion of these filterresults through June 2002 may be found in thePh.D. Thesis of Qureshi (2004).
The solubility of an aerosol-borne trace metal isdependent on its source of origin (chemical form),the size of aerosol particle that bears it and the pHof the sample (Desboeufs et al., 2001; Ebert andBaechmann, 1998; Colin et al., 1990). Studies haveshown that trace elements borne on crustal aerosolsare less soluble than those on marine or anthro-pogenic aerosols (Giusti et al., 1993 and referencestherein). Because elements with high solubility canbe more readily bio-activated in the lungs and thusmay be potentially more harmful for humans,samples collected through June 2002 had ICP-MSanalysis run on a water extraction aliquot prior tothe total digestion so that the solubility in theaerosols could be evaluated.
In an earlier paper, the methods employed tocollect daily aerosol samples at the New YorkSupersite sites were presented along with results of
one year of daily sulfate measurements from thethree primary sites (Dutkiewicz et al., 2004). The 6-htrace-element data from the 2001 summer intensivewere combined with fine-particle mass and concen-trations of nitrate, ammonium, chloride, organiccarbon, sodium and potassium measured by othergroups, to provide a robust database for positivematrix factor analysis (Li et al., 2004). Six sourceswere resolved from the data set. Secondary sulfatewas the major component of fine particle matter(64.6%). The other five factors/sources were sec-ondary nitrate, motor vehicles, road dust, airbornesea salt, and oil-fired power plants. In the presentpaper the elemental composition of daily PM2.5
aerosols over 15 months at the PS219 is reported.This includes a comparison of seasonal changes inaerosol composition and solubility and the impactof two unique events on aerosol composition; theWorld Trade Center Towers collapse in Manhattanon 9/11/2001 and Quebec wildfire smoke thatcovered the Northeast in early July 2002. In acompanion paper in this issue the sulfate and inter-elemental variations at Queens are explored andused to evaluate the primary sources (Dutkiewicz etal., 2005a). A second companion paper present fielddata to validate the 42 lmin�1 sampler used tocollect 6-h PM2.5 samples during the Queens Collegeintensives and discusses the time of day patternsthat were measured (Dutkiewicz et al., 2005b).
2. Methods
2.1. Sampling and analysis
Sampling methods and site descriptions havebeen presented elsewhere (Qureshi 2004, Dutkiewiczet al., 2004). Briefly, the daily filter samples werecollected with Rupprecht & Patashnick Model1400a particle mass analyzers with ACCU samplerattachments (daily samples). The flow rate throughthe Zefluor Teflon filter (Pall Corporation) was13.7 lmin�1. All concentrations reported here arecorrected to 25 1C and 1 atm of pressure.
For ICP-MS analysis, the trace elements must bedissolved in aqueous medium. If the atmosphericform of an element is highly soluble, the waterextraction procedures used for major ions determi-nation is adequate. However, to measure the totalconcentrations of most elements, some digestionprocess must break down the PM matrix. For allsamples collected at PS219, PSP, and WFML
ARTICLE IN PRESSS. Qureshi et al. / Atmospheric Environment 40 (2006) S238–S251 S239

Autho
r's
pers
onal
co
py
through June 2002, both a water-extracted and atotal digested concentration were determined.
Briefly, the entire Zefluor filter was placed in 7mlof distilled water in a polypropylene tube and ultra-sonicated at 70 1C for 90min. We have found that aslong as care is taken to have the exposed side of thefilter facing the water, a complete water extraction ispossible without any surfactant using the methoddiscussed above. After thorough mixing of thesample on a vortex mixer, 1ml was removed foranalysis of major anions by IC. The remainingsolution was stabilized against trace metal loss byaddition of nitric acid (Baker Ultrex II) to a finalconcentration of 0.15%. At a later date a second1ml aliquot was removed to analyze for water-soluble trace elements by ICP-MS. Between ana-lyses, samples were stored sealed at 4 1C. The totaldigestion was carried out by the addition of 2mlnitric acid, 4ml hydrogen peroxide and 0.5mlhydrofluoric acid to the remaining 5ml of solutionplus the filter, and the resulting mixture wasmicrowave-digested. The digested samples alongwith several washings were transferred to 50mlpolypropylene tubes and the volume in each wasmade up to 25ml. Further details of the totaldigestion procedure can be found elsewhere (Swamiet al., 2001; Qureshi, 2004). Samples and fieldblanks were digested in batches of 20 samples alongwith two analytical blank filters and two qualitycontrol (QC) samples. The recoveries for allelements except Cr averaged 85% or better. WhileCr recovery averaged 47%, levels in the QC wereonly twice the minimum reporting level (MRL), soresults are highly uncertain. The analytical blankswere Zefluor filters taken directly from the manu-factures package to the extraction vessels in thelaboratory. These blanks are in addition to the fieldblanks that were accessioned along with regularfilter samples.
2.2. Sulfate analysis
A 1-ml aliquot from the water extraction was usedfor SO4 analysis by IC. A discussion of the methodshas been given elsewhere (Khwaja et al., 1999;Dutkiewicz et al., 2004). The MRL is blank-limitedat 0.1mg l�1. This represents an airborne equivalentconcentration of 0.04 mgm�3 for the 24-h ACCUsamples. Uncertainty of the SO4 analysis based onlong-term precision and accuracy tests is 7% whenconcentrations are at least several time the MRL.The expression, 0.33*MRL+0.07*C, where C is the
measured concentration, can be used to express theuncertainty over all concentration ranges.
2.3. ICP-MS analysis
An HP model 4500 ICP-MS with pneumaticnebulization was used to determine concentrationsof Mg, Al, Ca, V, Cr, Mn, Fe, Co, Ni, Zn, As, Se,Cd, Sb, and Pb. The basic operating procedurefollowed was that of US EPA Method 200.8.Further details can be found in Qureshi (2004)including a detailed discussion of QC and blanks.Briefly, each result was based on three integrations.For each of the elements analyzed, the ICP-MS candetect a signal at below blank levels. Thus, the valueof the digestion blanks and the reproducibility ofthese blanks are the limiting factors of the analysis.Only measurements that are above an MRLevaluated as 3 times the standard deviation of thedigestion blanks are reported. The air equivalentMRL was obtained by multiplying the aqueousMRL by the aqueous volume and dividing by themean volume of air sampled. Aqueous and equiva-lent airborne MRLs for the water-extracted andtotal digested ACCU samples along with results ofthe water extraction/solubility determinations canbe found in Qureshi (2004). The MRLs for 24-hACCU samples (total air volume ¼ 19.7m3) areshown in Fig. 1 for selected species.
Based on duplicate precision, calibration accu-racy, digestion precision, air volume uncertainty,and the uncertainty added due to the removal ofsoluble fractions for IC and soluble metals, un-certainties varied from 0.09 to 0.11 for the totaldigestion measurements and from 0.08 to 0.1 for thesoluble-fraction measurements. As the standarddeviation of the recoveries of the Urban PMreference standard for total digestion measurementsvaried from 3% to 10%, with a mean of 6%(N ¼ 92), the uncertainty ranges given above arevery reasonable. The above errors apply to allelements, except for total Cr, Mn, Fe, Co, and Nideterminations in 2002. As discussed by Qureshi(2004), the Zefluor filter lots utilized during 2002were significantly contaminated with these elements.The source of the contamination appeared to besome form of chromium steel alloy. Although thelevel of contamination was highly variable fromfilter to filter, the relative concentrations of thesefive elements were very consistent. To circumventthe need to discard these results for these elements,we applied a special blank correction based on Cr
ARTICLE IN PRESSS. Qureshi et al. / Atmospheric Environment 40 (2006) S238–S251S240

Autho
r's
pers
onal
co
py
ARTICLE IN PRESS
0
10
20
30
40
50
60
PM
2.5
mas
s (u
g m
-3)
7/7/2002
0
5
10
15
vana
dium
(ng
m-3
)
MRL
0
100
200
300
400
500
600
iron
(ng
m-3
)
MRL
1030
0
1
2
3
coba
lt (n
g m
-3)
MRL
2001/07/28 2002/02/13 2002/05/24 2002/09/010
20
40
60
nick
el (
ng m
-3)
MRL
420
2001/11/05
9/11/2001
summer intensive
Fig. 1. Time series of daily concentrations of PM2.5 mass and concentrations of V, Fe, Co and Ni in PM2.5 aerosols collected at PS219 in
Queens, NY during July 2001–September 2002. Dashed horizontal lines are the minimum reporting levels (MRL) for ICP-MS
measurements on total digestates, as explained in the text. The heavy horizontal lines are quarterly means while vertical lines mark 11
September 2001 when the World Trade Center collapsed, and 6 July 2002 when site was impacted by smoke from Quebec wildfires. The
hatched rectangle indicates the period for the summer intensive held adjacent to PS219 on the Queens College Campus.
S. Qureshi et al. / Atmospheric Environment 40 (2006) S238–S251 S241

Autho
r's
pers
onal
co
py
and the element/Cr ratios. Accordingly, Cr concen-trations are not available for 2002, and the relativeerror for each of the other four elements is increasedto 0.15.
2.4. Supporting measurements from other groups
The New York Department of EnvironmentalConservation (NYSDEC) as a part of the USEPAPM2.5 STN program collects three sets of PM2.5
filters every 3 days at the three Supersite sites (http://www.dec.state.ny.us/website/dar/baqs/pm25mon.html). A discussion of the sites and measurements,including blanks and MRL values, was given bySchwab et al. (2004) along with a comparison todata from the IMPROVE network. Sulfur dioxideconcentration is the mean of hourly measurementsrecorded with a pulsed fluorescence analyzer (Ther-mo-Environmental) run by the NYSDEC (RussTwaddell, pers. comm.) and daily PM2.5 mass valueswere taken from the same NYSDEC Web site listedabove. These masses are based on the standardUSEPA reference method and have been expressedat 25 1C and 1 atm.
3. Results and discussion
3.1. Trends in daily trace element concentrations
(July 2001– September 2002)
The elements Mg, Al, Ca, Mn, and Fe areexpected to have a large component from airbornesoil, since their enrichment factors (relative to Al)averaged between 1 and 4 (Qureshi, 2004). For Al,Ca, Cr, and Cd there were a very limited number ofdata points above the MRL so trends for theseelements are not discussed further. Time series ofthe daily measurements for mass and other selectedelements are shown in Figs. 1 and 2. Included arethose elements having strong seasonal trends orperiods with very high concentrations, namely, Fe,Co, Ni, Zn, Sb, and Pb as well as important sourcemarker elements, namely, V, As, and Se. These plotsare overlaid with the quarterly mean concentra-tions. To minimize the high bias to the mean thatwould result from a large number of MRL results,the MRL results were multiplied by 0.5 for thesemeans. Three periods with significant aerosol eventsare highlighted: the 2001 summer intensive, thecollapse of the World Trade Center in Manhattanon 9/11/2001, and the period in early July 2002when the Northeast was impacted by smoke from a
large area of wildfires in Quebec. Results from thelatter two events will be discussed later in this paper.
Total mass in Fig. 1 is highest in summer.However, while the mean summer sulfate concen-trations are approximately twice as high as those inwinter (Dutkiewicz et al., 2004), the total mass isonly 20% higher. Winter 2001 sulfate concentrationaveraged 2.4 mgm�3 lower than the mean of the2001 and 2002 summers. This difference is sufficientto account for the difference in the winter andsummer total mass. In the Northeast, space heatingis important during fall and winter. The majorenergy sources of space heating are electricity,heating oil, and natural gas. In addition many largebuilding complexes burn ] 6 residual oil for hotwater and space heating. The lack of any significanttotal mass increase in winter suggests that spaceheating is not a major source of aerosol mass.Concentrations of elemental and organic carbonmeasured every third day at the NYSDEC’s STNsite in Queens bears out this conclusion as totalcarbonaceous aerosol averaged 4.34 mgm�3 in thesummer of 2001, compared to 4.28 mgm�3 in thewinter of 2001. The mean for the summer of 2002was 6.73 mgm�3 but this includes a large impactfrom the Quebec wildfires that occurred in earlyJuly. Total mass in Fig. 1 varies near the means formost days with only occasional short excursionsabove 30 mgm�3. During the 15 months shown therewere only 27 days when total mass exceeded30 mgm�3. Sulfate and elemental concentrationswere measured on 24 of these days. Five of thesedays occurred during July–September 2001, com-pared to 10 during the same period in 2002;however, 4 of these days in 2002 occurred aroundthe time of the Quebec wildfires, while noneoccurred immediately following 9/11/2001. The falland winter quarters combined had 7 high days andthe remaining 5 occurred during the spring quarter.With the exception of the 4 wildfire days, allremaining high-mass days during spring and sum-mer had sulfate concentration of at least 12 mgm�3.The highest sulfate concentration, 20 mgm�3, wasmeasured on July 18 and 19, 2002. The 7 fall andwinter highs were non-sulfate events. Based onbackward-in-time air trajectories (HYSPLIT, 1997)the air masses on all the high-mass days spent atleast part of their time in the high SO2 emissionregion around western PA and the Ohio RiverValley. If we are to effectively control PM2.5 inurban areas we need to be able to distinguishbetween local and transported PM contributions.
ARTICLE IN PRESSS. Qureshi et al. / Atmospheric Environment 40 (2006) S238–S251S242

Autho
r's
pers
onal
co
py
The lowest mean concentrations for most ele-ments in Figs. 1 and 2 occurred during the spring(2002) quarter. For example, average Se concentra-tions were between 0.9 and 1.1 ngm�3 for the
summer, fall, and winter quarters, but only aver-aged 0.72 ngm�3 during spring 2002. The very lowmedian value, 0.17 ngm�3, at this time indicatesthat a large proportion of MRL values were
ARTICLE IN PRESS
0
50
100
150
200
zinc
(ng
m-3
)
MRL
1030
0.0
0.5
1.0
1.5
2.0
arse
nic
(ng
m-3
)
MRL
0
2
4
6
sele
nium
(ng
m-3
)
MRL
0
5
10
15
antim
ony
(ng
m-3
)
MRL
2001/07/28 2001/11/05 2002/02/13 2002/05/24 2002/09/010
10
20
30
40
lead
(ng
m-3
)
MRL
117
18.7 11/05/2001
Fig. 2. Same as Fig. 1 except for Zn, As, Se, Sb, and Pb.
S. Qureshi et al. / Atmospheric Environment 40 (2006) S238–S251 S243

Autho
r's
pers
onal
co
py
recorded. Increased aerosol scavenging by precipi-tation and possibly fog are probably the majorreasons for the low concentrations.
Cobalt, nickel and zinc, showed the mostdramatic seasonal variations. The medians forJanuary–March 2002 were larger by a factor of3.3, 4.6, and 3.2 times, respectively, than thecorresponding medians for July–September 2001.Concentrations were also elevated for these ele-ments during October–December (Fig. 1). All threeof these elements had a large proportion of MRLresults during summer, but not during fall andwinter. These months represent the period whenspace heating is highest in the Northeast. During thecold half of the year Co and Ni were highlycorrelated (r ¼ 0:93); Ni and Zn also showedmoderately high correlation (r ¼ 0:80). Emissionsfrom heating oil are the most probable primarysource for the elevated Co and Ni. Interestingly,however, there is no significant seasonal trend for Vconcentrations, even though V is often used as amarker element for oil fired power plants. In fact,during the cold season, the correlation of V and Nionly yielded r ¼ 0:69. Zn on the other hand isconsidered to have many numerous and variedsources including motor vehicles, iron and steelworks, and trash incinerators. There were also twoperiods with very high Zn concentrations post 9/11.In fact, Zn concentration on 10/2 was around1000 ngm�3, while Ni was also very high at around400 ngm�3. Several days when Zn and Ni were alsohighly elevated at PSP had comparable Ni/Znratios. The source is unknown, however, the Cualloy leaded nickel brass, which is commonly used incasting brass hardware and valves, has a compar-able Ni/Zn ratio. There are also other nickel silveralloys that have comparable Ni/Zn ratios. A moredetailed discussion of elemental correlations andsources can be found in the companion paper(Dutkiewicz et al., 2005a).
V, As, and Se are common marker elements usedfor oil-fired power plant combustion, Canadianmetal smelters, and coal combustion, respectively.Of these three elements, V consistently showed thehighest concentrations at PS219, as periods whenconcentrations increased to 410 ngm�3 were com-mon. For Se and As many days had concentrationsbelow 1 ngm�3; however, the maximum concentra-tion for Se was 6 ngm�3 as compared to just above2.0 ngm�3 for As. Over the first three quarters themean V concentrations did not vary greatly, but it ismarkedly lower in the spring and summer quarters
of 2002. While there were some gaps in the samplingduring both periods, V concentrations from theNYSDEC STN samples at Queens followed thetrends in Fig. 1, although averaging about 12%higher. The quarterly trend for As was similar tothat for V; over the first three quarters, Asconcentrations averaged 0.66, 0.67, and 0.72 ngm�3,respectively, but the means decreased to 0.48 and0.55 ngm�3, respectively, during the spring andsummer quarters of 2002. Se concentrations aver-aged around 1.1 ngm�3 during all but the spring2002 quarter, when concentrations for most dayswere othe MRL.
Sb and Pb at P219 were generally around1 ngm�3 or less; however, these elements showed afew excursions or bursts with noticeably higherconcentrations including shortly after 9/11/2001. Onaverage, Pb concentrations are also elevated duringthe cold relative to the warmer months; the medianfor January–March was 27% higher than that forJuly–September 2001. This trend, however, is smallcompared to that for Co, Ni, and Zn. Very high Pbconcentrations (�40 ngm�3) were also measured on27 January 2002 and 10 July 2002.
3.2. Trace-element solubility
What is referred to in this study as ‘‘water-soluble’’ concentrations is technically a very diluteacid leaching, since the samples were preserved in0.15% HNO3 after the 1-ml aliquot was removedfor sulfate analysis. Because the determination ofaerosol solubility is quite limited, and because nostandard has been established at this time, this is areasonable assumption. Use of the dilute nitric acidinstead of DI water for solubility extractions alsoremoves any variability that can arise due tochanges in the pH of the aerosols and the presenceof strong alkali buffers (Morcelli et al., 2003;Desboeufs et al., 2001; Ebert and Baechmann,1998; Colin et al., 1990).
When sufficient data was available, the meansolubility of the aerosols bearing specific tracemetals was determined from the slope of a linearregression fit to a scatter plot of concentrationsmeasured in the water extract against the totaldigestate (referred to here as a solubility scatterplot). The linear regression using a zero interceptwill obviously place more weight on the higherconcentration values that have the lowest uncer-tainties; the standard error in the slope along withthe regression coefficient also provide a good
ARTICLE IN PRESSS. Qureshi et al. / Atmospheric Environment 40 (2006) S238–S251S244

Autho
r's
pers
onal
co
py
measure of the quality and variability of thesolubility for each element. Mean solubility forPM2.5 aerosols bearing all 15 elements are summar-ized in Table 1. Aerosols bearing Zn had the highestmean solubility at 90% followed closely by thosebearing V and Pb, at 88%, Mg at 86%, and Mn,and As at 84%. The next group, Co, Sb, and Se, allhave mean solubility around 70%, while the meansolubility of Ni and Fe is slightly lower at 64% and62%, respectively. The remaining elements, Al, Ca,Cr, and Cd had only a limited number of sampleswith concentrations above the MRL and the rangeswere limited; thus regression analysis would behighly uncertain. Accordingly, only simple meansare reported in Table 1 for these four elements as ageneral indicator of the data. All of these elementsexcept Ca have mean solubility at around 10%. Themean solubility for Ca bearing aerosols is morecomparable to that for Fe at 47%.
Because aerosols bearing the various trace ele-ments can originate from many sources, particularlyin an urban environment, and because the processesgenerating the aerosols may alter the chemical formof a species, aerosol solubility may be highlyvariable from sample to sample. Surprisingly, thelinear fits for the solubility scatter plots for most ofthe elements given in Table 1 have high regressioncoefficients, indicating that their solubilities arehighly constant. As an example, Fig. 3 shows thesolubility scatter plots for Zn-bearing aerosolsseparately for 2001 and 2002 data. Data from the
6-h samples collected at QCOL are included in the2001 data set. We noted earlier that Zn showed asignificant seasonal trend in its mean concentration.Differences in the sources of trace elements mightalso change its chemical form and thus alter thesolubility in ambient aerosols. The mean solubilityfor Zn-bearing aerosols for the 2001 and 2002 datasets differed by only 5.3%. Mean solubility anduncertainty were 9271.6% and 8771.1%, respec-tively. The regression coefficients (r2) for the 2001
ARTICLE IN PRESS
Table 1
Solubility of PM2.5 aerosols bearing selected elements at PS219 (July 2001–June 2002)
Element Mean solubility Methoda Regression coef. (r2) Number Range Max/MRL)
Zn 9071.3 R 0.93 174 7
V 8870.8 R 0.95 332 24
Pb 8871.0 R 0.94 309 34
Mg 8871.2 R 0.89 239 31
Mn 8471.0 R 0.91 254 12
As 8471.0 R 0.88 236 5
Co 7371.2 R 0.90 156 7
Sb 7170.8 R 0.91 298 54
Se 7070.8 R 0.93 260 18
Ni 6470.9 R 0.86 192 8
Fe 6271.1 R 0.70 242 10
Ca 47714 M NA 12 3
Cd 1277 M NA 5 12
Al 1178 M NA 13 15
Cr 574 M NA 6 13
M ¼ simple mean due to limited data42�MRL: 7 is the standard deviation.
NA ¼ not applicable.aR ¼ mean based on regression slope of linear regression: 7 is the standard error.
0 50 100 150 2000
50
100
150
200
Wat
er e
xtra
ctio
n
20012002
PM2.5 Zn concentration (ng m-3)
Total digestion
Fig. 3. Scatter plot between daily concentrations of Zn at PS219,
July 2001–June 2002 measured in the water extraction against
concentrations measured after a total digestion as explained in
the text. The dashed line shows the best-fit linear regression for
the 2001 data only. Regression coefficients are summarized in
Table 1.
S. Qureshi et al. / Atmospheric Environment 40 (2006) S238–S251 S245

Autho
r's
pers
onal
co
py
and 2002 data sets both equal 0.93 even though therange of the 2002 data is only around half that in2001. Considering the fact that most of the Zn datafalls within 3 times the MRL, the lack of scatter isremarkable. It indicates that the aerosols bearing Znare highly soluble, and that there is little mixingwith any low-solubility species. The consistency inthe solubility for the 2001 and the 2002 data setstaken separately confirms the lack of any significantbias in the soluble determinations for the 2002 data.It also suggests that there is no seasonal change inthe solubility of Zn-bearing aerosols at this site.This was confirmed with time-series plot that arenot shown for space considerations.
High solubility was also obtained for V, Pb andMg. V-bearing aerosols have a mean solubility 88%.As the regression coefficient was ¼ 0.93 the datawere highly linear with little scatter (data not shownfor space consideration). For Mg there is a relativelyhigh MRL for both the soluble- and total-concen-tration measurements due to high blank variability.The solubility plot for all data yields a meansolubility of 86% with a regression coefficient of0.89. The lower regression coefficient relative to theother elements is, no doubt, due to higher un-certainty. Within uncertainties no distinct seasonal
trends in solubility were noted. As an example, thetime-trend plot for V solubility in aerosols at PS219is shown in Fig. 4. The solubility is only plotted fordays when the concentrations was 42� the MRL.The solubility varied from around 50% to 110%.The polynomial fit to the data indicates highersolubility during August–September. The 10-dayrunning average trend line shows 3 distinct periodsduring this time with nearly 100% solubility. Thepolynomial curve has its lowest value during Marchand April and the running average trend also showslower solubility at this time, as no distinct highs orlows are obvious. While the data in Fig. 4 suggestthat there may be more than one primary chemicalform for V at this urban site the overall seasonalvariation is mostly within experimental uncertain-ties so no definitive conclusion can be drawn.
In contrast, Fe has a mean solubility of only 62%and it is likely to be strongly affected by aerosolsfrom crustal sources that generally have low solu-bility. While there is only a 3.2% difference betweenthe 2001 and 2002 data sets, the regression coeffi-cient is 0.70 indicating more scatter in the solubilitythan for the other elements. Varying components ofcrustal Fe could account for the greater variabilitybut the high filter blanks encountered for Fe in 2002
ARTICLE IN PRESS
2001/06/30
2001/07/30
2001/08/29
2001/09/28
2001/10/28
2001/11/27
2001/12/27
2002/01/26
2002/02/25
2002/03/27
2002/04/26
2002/05/26
2002/06/250.0
0.5
1.0
Sol
ubili
ty
Vanadium1.5
Fig. 4. Time series showing solubility of V-bearing aerosols collected at Queens, NY when total concentration was 41.4 ngm�3. Vertical
bars are the combined uncertainties for soluble and total-concentrations measurements. The fine line is the ten-point running mean added
to enumerate any short-term trends while the dark curve is best-fit fourth-order polynomial added to enumerate any longer term trends.
The dashed horizontal line is the annual mean solubility.
S. Qureshi et al. / Atmospheric Environment 40 (2006) S238–S251S246

Autho
r's
pers
onal
co
py
contributed to high uncertainties so the time-trenddata are not shown here and no definitive conclu-sions can be drawn. A longer running data set and alower MRL and uncertainty are needed.
3.3. Possible chemical composition
As crustal aerosols are less soluble than marine oranthropogenic aerosols, trace metals of low solubi-lity could be strongly impacted from terrestrialsources. It is assumed that the trace metals thatresult from high-temperature combustion aremostly present in the form of oxides (Schroeder etal., 1987). For each of the three highly solubleelements Mg, V, and Mn, there is only a single oxidethat is soluble, namely MgO, V2O5 and Mn2O7,respectively; and these are probably the form inwhich these elements exist in PM2.5 aerosols. Theoxides of As and Se are soluble but the oxides of Znand Pb are insoluble. Metallic oxides may undergosulphation, and possibly nitration, as the aerosolages (Schroeder et al., 1987). The nitrates of Zn andPb are soluble as is ZnSO4; however, PbSO4 isinsoluble. Pb, Zn, and Cd when resulting from re-entrained road dust have been seen to be stronglyassociated with carbonates (Schroeder et al., 1987).Carbonates of these three elements are insoluble.One of the possible sources of Pb, Zn, Sb and Cd inPM is incineration. Trace elements from incineratoremissions can be found in the form of chlorides(Schroeder et al., 1987). The oxides of Pb and Znare insoluble; however, their chlorides are soluble.Pb and Zn are highly soluble at PS219 and may bepresent as chlorides. According to our data Cd-bearing aerosols at PS219 have low solubility, 12%.The oxide of Cd is insoluble and its chloride issoluble. The oxides and chloride of Sb are soluble.For Co, Fe and Ni, their oxides are insolublewhereas their nitrates and sulfates are soluble.
3.4. Impact from collapse of WTC on PM2.5
compositions at queens
On 9/11/2001 two commercial aircrafts under thecontrol of terrorists crashed into the two towers ofthe World Trade Center in Manhattan, New York(WTC), causing the cataclysmic collapse of bothtowers. On this day winds over Manhattan werefrom the north-northwest, blowing the smoke cloudsouthward over Brooklyn and out to sea. Inaddition to the initial rubble cloud, smoldering firesburned at the sites for several weeks, as crews
initially looked for survivors and later cleared thedebris from the site. The PS219 site is some 25 kmnortheast of the WTC. As continuous daily aerosolsamples were collected at PS219, any impact onPM2.5 aerosols at this site from the WTC collapseand subsequent debris smoldering should be evidentin the data. Subsequent to the 9/11 event severalevents with episodic high concentrations of certaintrace metals, including Pb are evident in Fig. 2.Based on surface winds, smoke from the WTC areashould directly impact PS219 on 9/13, 9/18, 9/25–27, 10/2–3, however, on 9/25 it rained and totalmass was only 7.2 mgm�3 and all trace metalconcentrations were at or near the MRL. Mass,sulfate, and trace-element concentrations for theremaining 6 days are summarized in Table 2 alongwith solubility for those elements that had totaldigestion concentration at least 3 times the MRL.On 9/13, highly elevated concentrations of Cd, Pb,Sb, and Zn were measured. This was the first daypost-9/11 when there was a strong westerly air flow.For each of these elements concentrations were 2–10times more than the pre-9/11 means. Cahill et al.(2004) indicated that there was a visible plumemoving over a broad area north-northwest to south-southwest during the day on 9/12 and moved southover the ocean that evening. They also indicatedthat rain occurring on 9/14 helped to extinguishsurface fires and wet the massive dust deposits. On9/18 there were marginally elevated Cd and Sbconcentrations and high concentrations of Fe. Fe,however, was not elevated on 9/13, but it was aboveaverage on 10/2 and 10/3. For the month following9/11 Fe concentration averaged slightly below thepre-9/11 mean, so any impact was minimal. On 10/2concentrations of Mn, Fe, Co, Ni, Zn, Sb, and Pbwere significantly elevated above their pre-9/11mean values. Zn and Ni concentrations wereespecially high as there combined mass was almost1.5 mgm�3. Total mass on this day was 18.0 mgm�3
with the 15 measured elements accounting foraround 10% of this mass. On average, thesemeasured elements normally account for only1–2% of the total mass. The post-9/11 means inTable 2 are lower than the pre-9/11 means for allelements except Sb and Pb. At 8.7 ngm�3 the post-9/11 Pb concentration was 1.9 times higher than thepre-9/11 level. Overall, we conclude that the 9/11WTC collapse had negligible impact on the con-centrations of these 15 elements in PM2.5 aerosolspresent in Queens during the month following thecollapse.
ARTICLE IN PRESSS. Qureshi et al. / Atmospheric Environment 40 (2006) S238–S251 S247

Autho
r's
pers
onal
co
pyTable 2 also summarized aerosol solubility for
the measured trace elements on the days impactedwith air from the WTC. On average the solubility inTable 2 for all elements are higher than the means inTable 1. For Mg, V, Mn, Fe, Ni, Zn, Cd, and Pb, thesolubility were essentially 1.0, but only the solubilityfor Fe, Ni and Cd bearing aerosols are significantlyhigher than the means in Table 1. Cahill et al. (2004)indicated that the smoldering debris pile at the WTCcontinued to burn below-ground through mid-December, and that conditions were similar to theburning of municipal wastes. Thus, volatilized traceelements were likely to be attached to chloridesrather than oxygen. All three of the above elementshave soluble chlorides that could account for thehigher solubility of these elements post-9/11. Un-fortunately, there was only one day on which wecould evaluate solubility for Cd and Ni and there wasonly two days with sufficiently high Fe concentra-tions. While there is evidence in Table 2 that aerosolspost-9/11 at PS219 had increased solubility, it isdifficult to accurately evaluate just how much thesolubility was impacted with such limited data.
3.5. Impact from Quebec wildfire smoke
On 7/6–8, 2002, much of the East Coast of the USwas affected by smoke from a series of wildfires in
Quebec, Canada. From 7/6–7/9, PM2.5 mass atPS219 was very high (Table 3). The highest massoccurred on 7/7 (76 mgm�3). A set of every-3-daySTN sample was fortunately collected on this day.The total masses were equivalent and there was highconcentration of carbonaceous species. Organiccarbon was 36 mgm�3, and elemental carbon was1.4; these values support the strong influence fromsmoke on this day. Backward air trajectories for 7/6through 7/8, as well as satellite images, clearly tracethe air on these days back through Quebec to thevicinity of the wildfire activity. By the evening of the7/8 the winds at Queens had shifted to a morewesterly pattern. On July 9, the winds at Queenswere westerly and southwesterly suggesting acurtailment of the impact from the wildfire smoke;however, the trajectories and TOMS absorbingaerosol index scans (ftp://toms.gsfc.nasa.gov/pub/eptoms/images/aerosol/Y2002/IM_aersl_ept_20020709.png) indicate that there was still a link toair from the wildfire region impacting the New YorkMetropolitan area on the 7/9. Sulfate concentra-tions on 7/6 and 7 (Table 3) were o2 mgm�3, andessentially only the concentration of As wassignificantly elevated relative to the mean. The highorganic carbon recorded in the STN samples on 7/7is consistent with a significant impact from thesmoke. The usual elemental tracer for vegetative
ARTICLE IN PRESS
Table 2
Mass and concentrations of sulfate and selected trace elements (ngm�3) at PS219 for selected days following the World Trade Center
collapsea
Species 9/13 9/18 9/27 10/2 10/3 Pre- 9/11b Post-9/11b
Conc. Sol (%) Conc. Sol (%) Conc. Sol. (%) Conc. Sol (%) Conc. Sol (%) Mean71sigma Mean Relative to pre-9/11
Massc 17 9.0 18.0 28.0 15.778.8 11.9 0.8
SO4c 5.1 2.8 2.8 5.2 8.3 5.674.6 3.4 0.6
Mg 36 84 25 112 13 nd 38 100 39 92 35735 22 0.6
V 6.4 89 7.9 116 3.0 104 9.6 113 10.5 99 5.573.3 4.2 0.8
Mn 3.3 Nd 2.9 nd 3.3 nd 12.6 112 7.3 88 3.072.4 3.1 1.0
Fe 127 Nd 206 90 133 nd 370 101 318 77 134792 122 0.9
Co o0.5 Nd 0.57 nd o0.5 nd 1.4 82 0.63 nd o0.7d o0.5 d
Ni o4.8 nd 8.3 nd o4.8 nd 422 118 9.9 nd o8.0d o6 d
Zn 217 99 39 nd 47 nd 1028 121 62 105 o25d o32 d
As 0.93 nd 0.85 nd 0.56 nd 1.0 nd 1.6 97 0.7470.4 0.66 0.9
Se 2.4 77 1.4 69 2.5 66 1.1 77 3.0 82 1.170.9 1.0 0.9
Cd 2.0 97 o0.3 nd o0.3 nd o0.3 nd o0.3 nd o0.45d o0.4 d
Sb 12.3 57 5.5 94 1.4 81 3.0 80 3.0 78 1.571.2 1.9 1.3
Pb 117 99 12.6 113 7.5 106 10.5 110 13.9 096 4.572 8.7 1.9
nd ¼ not determined as the total concentration was o3�MRL.
Bold ¼42� pre-911 mean.aOnly days post-9/11 when surface air trajectories indicated transport to Queens and at least one metal had concentrations 4twice the
pre-911 value.bpre-9/11 ¼ 7/1–9/10/2001 while post-9/11 ¼ 9/11–10/11/2001cConcentrations in mgm�3.dMore than 50% of measurements wereoMRL.
S. Qureshi et al. / Atmospheric Environment 40 (2006) S238–S251S248
Autho
r's
pers
onal
co
pyburning is K, which, unfortunately, we could notaccurately determine due to highly variable blanks.While elevated As concentration is consistent withair impacted by the smelter region of Canada,1.3 ngm�3 is within the range of concentrationsotherwise measured at this site. On 7/8 theconcentration of As remained around 1.3 ngm�3
but sulfate, Fe, Ni, Zn, Se, Sb, and Pb concentra-tions increased above the seasonal means. Theincreased Se along with sulfate is consistent withan increased impact from coal burning. Weconclude that the wildfire smoke did not signifi-cantly impacted any of the fifteen elements mea-sured in PM2.5 aerosols.
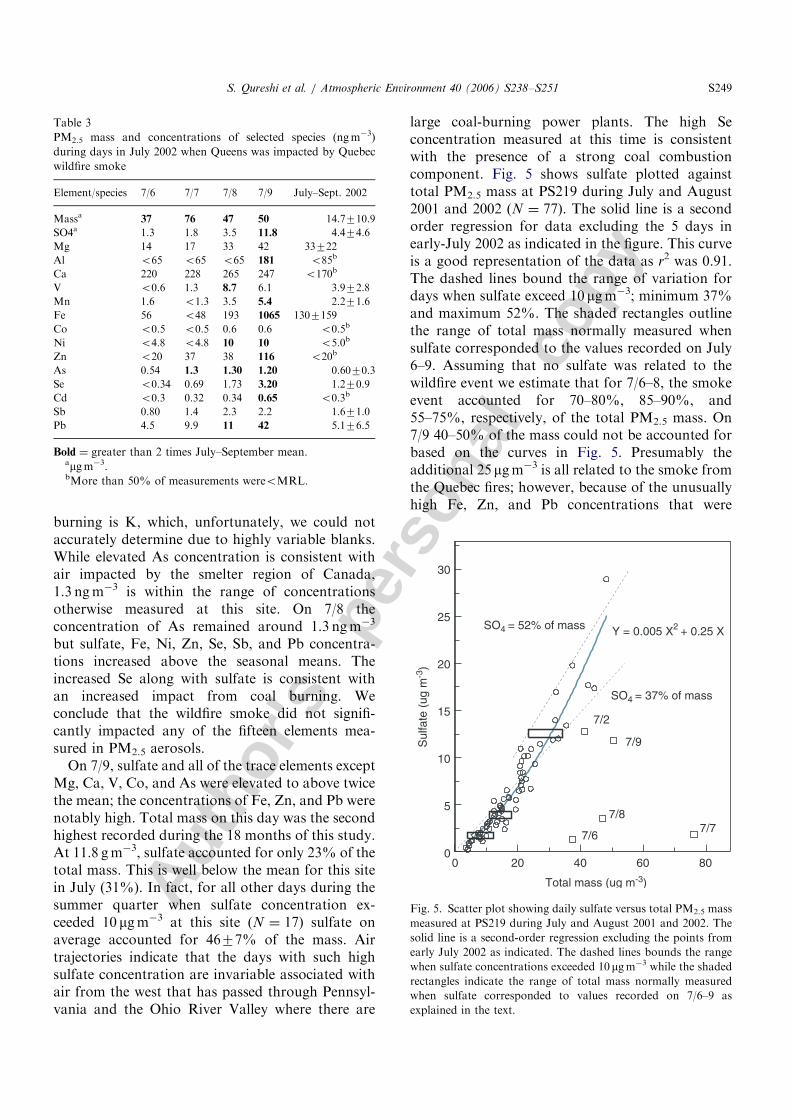
On 7/9, sulfate and all of the trace elements exceptMg, Ca, V, Co, and As were elevated to above twicethe mean; the concentrations of Fe, Zn, and Pb werenotably high. Total mass on this day was the secondhighest recorded during the 18 months of this study.At 11.8 gm�3, sulfate accounted for only 23% of thetotal mass. This is well below the mean for this sitein July (31%). In fact, for all other days during thesummer quarter when sulfate concentration ex-ceeded 10 mgm�3 at this site (N ¼ 17) sulfate onaverage accounted for 4677% of the mass. Airtrajectories indicate that the days with such highsulfate concentration are invariable associated withair from the west that has passed through Pennsyl-vania and the Ohio River Valley where there are
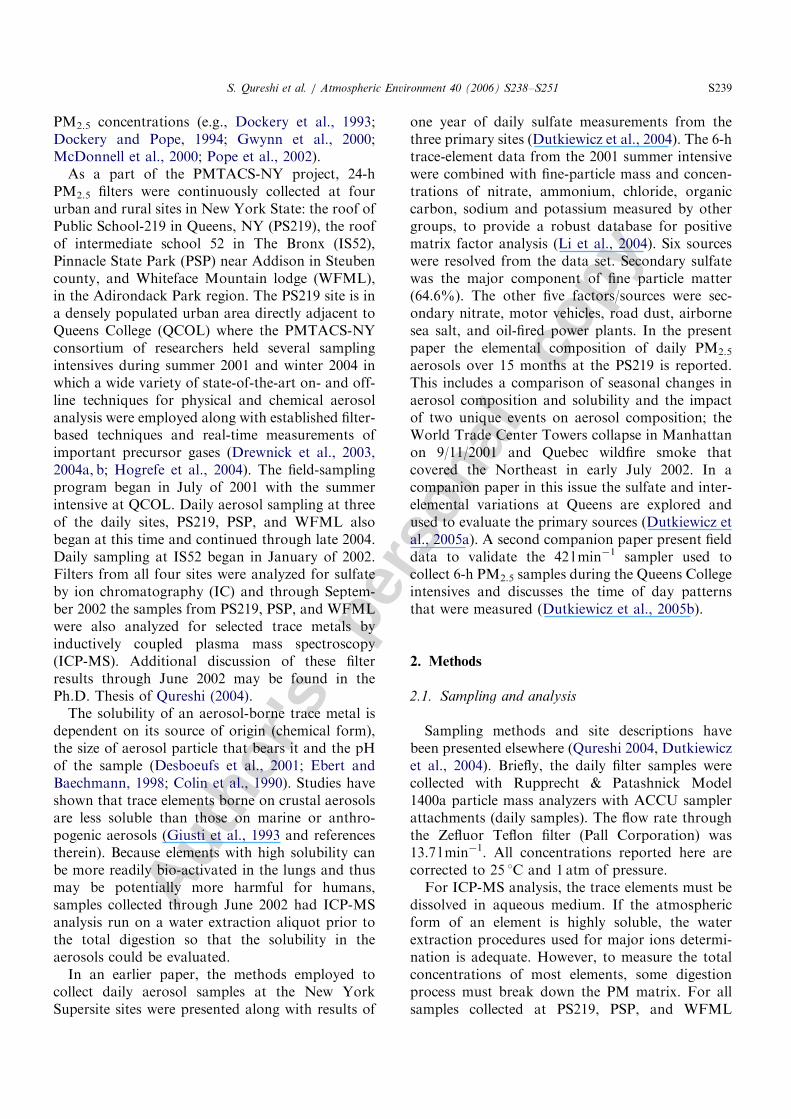
large coal-burning power plants. The high Seconcentration measured at this time is consistentwith the presence of a strong coal combustioncomponent. Fig. 5 shows sulfate plotted againsttotal PM2.5 mass at PS219 during July and August2001 and 2002 (N ¼ 77). The solid line is a secondorder regression for data excluding the 5 days inearly-July 2002 as indicated in the figure. This curveis a good representation of the data as r2 was 0.91.The dashed lines bound the range of variation fordays when sulfate exceed 10 mgm�3; minimum 37%and maximum 52%. The shaded rectangles outlinethe range of total mass normally measured whensulfate corresponded to the values recorded on July6–9. Assuming that no sulfate was related to thewildfire event we estimate that for 7/6–8, the smokeevent accounted for 70–80%, 85–90%, and55–75%, respectively, of the total PM2.5 mass. On7/9 40–50% of the mass could not be accounted forbased on the curves in Fig. 5. Presumably theadditional 25 mgm�3 is all related to the smoke fromthe Quebec fires; however, because of the unusuallyhigh Fe, Zn, and Pb concentrations that were
ARTICLE IN PRESS
Table 3
PM2.5 mass and concentrations of selected species (ngm�3)
during days in July 2002 when Queens was impacted by Quebec
wildfire smoke
Element/species 7/6 7/7 7/8 7/9 July–Sept. 2002
Massa 37 76 47 50 14.7710.9
SO4a 1.3 1.8 3.5 11.8 4.474.6
Mg 14 17 33 42 33722
Al o65 o65 o65 181 o85b
Ca 220 228 265 247 o170b
V o0.6 1.3 8.7 6.1 3.972.8
Mn 1.6 o1.3 3.5 5.4 2.271.6
Fe 56 o48 193 1065 1307159
Co o0.5 o0.5 0.6 0.6 o0.5b
Ni o4.8 o4.8 10 10 o5.0b
Zn o20 37 38 116 o20b
As 0.54 1.3 1.30 1.20 0.6070.3
Se o0.34 0.69 1.73 3.20 1.270.9
Cd o0.3 0.32 0.34 0.65 o0.3b
Sb 0.80 1.4 2.3 2.2 1.671.0
Pb 4.5 9.9 11 42 5.176.5
Bold ¼ greater than 2 times July–September mean.amgm�3.bMore than 50% of measurements wereoMRL.
0 20 40 60 800
5
10
15
20
25
30
Sul
fate
(ug
m-3
)
SO4 = 52% of mass
7/9
7/8
7/67/7
Total mass (ug m-3)
Y = 0.005 X2 + 0.25 X
SO4 = 37% of mass
7/2
Fig. 5. Scatter plot showing daily sulfate versus total PM2.5 mass
measured at PS219 during July and August 2001 and 2002. The
solid line is a second-order regression excluding the points from
early July 2002 as indicated. The dashed lines bounds the range
when sulfate concentrations exceeded 10 mgm�3 while the shadedrectangles indicate the range of total mass normally measured
when sulfate corresponded to values recorded on 7/6–9 as
explained in the text.
S. Qureshi et al. / Atmospheric Environment 40 (2006) S238–S251 S249

Autho
r's
pers
onal
co
py
recorded at this time some other source of PM2.5
mass cannot be completely ruled out. This eventclearly indicates how confounding tracing atmo-spheric pollutant sources can be in an urban setting.
4. Summary
The elemental composition of PM2.5 aerosolscollected daily at PS219 in Queens, NY betweenJuly 2001 and September 2002 is reported. Sulfatewas measured by IC and 15 elements were measuredby ICP-MS both in a dilute acid extract and after arigorous total digestion. Quarterly statistics weresummarized along with daily time trend plots forselected elements. The elements Co, Ni, Zn, and Pbhad the strongest seasonal trend; their cold (Octo-ber–March)/warm (April–September) concentrationratios were 1.7, 2.1, 1.5, and 1.6, respectively. Theelements V, As, and Se had moderate trends withratio of 1.2–1.4; however, the differences for theseelements may just be due to unusually lowconcentrations in the spring quarter. The remainingelements showed no clear seasonal trends.
By comparing concentrations measured after avery dilute acid extract to total concentrations, weevaluated the solubility’s of the aerosols bearing the15 elements. The solubility at Queens surprisinglyshowed little day-to-day variation and the elementscould be divided into three general groups. Thehigh-solubility elements, solubility 470%, wereMg, V, Mn, Co, Zn, As, Se, Sb, and Pb. Of theseonly V and Se showed some potential for seasonal/short-term trends that implies that varied chemicalforms may be present. Because of their highsolubility and relatively small range of variance,the concentrations of these elements in urbanaerosols could be accurately determined with adilute acid extraction and a correction for theinsoluble fraction. The second group, with solubilitybetween 45% and 65%, included Ca-, Fe-, and Ni-bearing aerosols. Of these elements, Ni had the mostconstant solubility, while the solubility for Ca andFe occasionally showed excursions of 10–30%. Thelast group had low solubility, �10%. This groupcontained Al, Cr, and Cd. These elements areprimarily soil-derived and their concentrations wereoften below the MRL at PS219.
Although Pb, Sb, Zn, and Cd exhibited bursts ofhigh concentration following the collapse of theWorld Trade Center on 9/11/2001, only the meanfor Pb showed any significant increase over the nextmonth (factor of 2.2; 10 ngm�3). The PM2.5 mass at
PS219 was significantly impacted from the Quebecwild fires during 7/6–9, 2002. The smoke contrib-uted between 40% and 90% of the mass during thisperiod; however, none of the 15 elements measuredcould be linked to the smoke.
Acknowledgments
This work was supported in part by the New YorkState Energy Research and Development Authority(NYSERDA), contract ]4918ERTERES99, the USEnvironmental Protection Agency (EPA) coopera-tive agreement ]R828060010 and New York StateDepartment of Environmental Conservation (NYSDEC), contract ]C004210. Although the researchdescribed in this article has been funded in part bythe US Environmental Protection Agency, it has notbeen subjected to the Agency’s required peer andpolicy review and therefore does not necessaryreflect the views of the Agency and no officialendorsement should be inferred. The authors alsowish to thank the NYSDEC site operators at PS219for collecting and shipping the filters.
References
Cahill, T.A., Cliff, S.S., Perry, K.D., Jimenez-Cruz, M., Branch,
G., Grant, P., Ueda, D., Schackelford, J.F., Dunlap, M.,
Meier, M., Kelly, P.B., Riddle, S., Selco, J., Leifer, R., 2004.
Analysis of aerosols from the World Trade Center Collapse
site, New York, October 2 to October 30, 2001. Aerosol
Science and Technology 38, 165–183.
Colin, J.L., Jaffrezo, J.L., Gros, J.M., 1990. Solubility of major
species in precipitation: factors of variation. Atmospheric
Environment 24A, 537–544.
Desboeufs, K.V., Losno, R., Colin, J.L., 2001. Factors influen-
cing aerosol solubility during cloud processes. Atmospheric
Environment 35, 3529–3537.
Dockery, D.W., Pope III, C.A., 1994. Acute respiratory effects of
particulate air pollution. Annual Review of Public Health 15,
107–132.
Dockery, D.W., Pope III, C.A., Xu, X., Spengler, J.D., Ware,
J.H., Martha, E., Fay, M.E., Ferris Jr., B.G., Speitzer, F.E.,
1993. An association between air pollution and mortality in
six US cities. New England Journal of Medicine 329,
1753–1759.
Drewnick, F., Schwab, J.J., Hogrefe, O., Peters, S., Diamond, D.,
Weber, R., Demerjian, K.L., 2003. Intercomparison and
evaluation of four semi-continuous PM2.5 sulfate instruments.
Atmospheric Environment 37, 3335–3350.
Drewnick, F., Schwab, J.J., Jayne, J.T., Canagaratna, M.,
Worsnop, D.R., Demerjian, K.L., 2004a. Measurement of
ambient aerosol composition during the PMTACS-NY 2001
using as aerosol mass spectrometer. Part I: mass concentra-
tions. Aerosol Science and Technology 38 (S1), 92–103.
ARTICLE IN PRESSS. Qureshi et al. / Atmospheric Environment 40 (2006) S238–S251S250

Autho
r's
pers
onal
co
py
Drewnick, F., Jayne, .T., Canagaratna, M., Worsnop, D.R.,
Demerjian, K.L., 2004b. Measurement of ambient aerosol
composition during the PMTACS-NY 2001 using as aerosol
mass spectromoter. Part II: chemically speciated mass
distributions. Aerosol Sci and Technol, 38 (S1), 104–117.
Dutkiewicz, V.A., Qureshi, S., Khan, A., Ferraro, V., Schwab,
J.J., Demerjian, K.L., Husain, L., 2004. Sources of fine
particulate sulfate in New York. Atmospheric Environment
38, 3179–3189.
Dutkiewicz, V.A., Qureshi, S., Husain, L., Schwab, J.J.,
Demerjian, K.L., 2005a. Elemental composition of PM2.5
aerosols in Queens, New York: Evaluation of sources of Fine-
Particle Mass. Atmospheric Environment, this issue
doi:10.1016/j.atmosenv.2006.06.002.
Dutkiewicz, V.A., Qureshi, S., Husain, L., Schwab, J.J.,
Demerjian, K.L., 2005b. Field test data for 42 liters per
minute PM2.5 aerosol sampler used to collect 6-h samples
during the PMTACS-NY intensives at Queens College,
Queens, NY. Atmospheric Environment, this issue
doi:10.1016/j.atmosenv.2005.12.068.
Ebert, P., Baechmann, K., 1998. Solubility of lead in precipita-
tion as a function of raindrop size. Atmospheric Environment
32, 767–771.
Giusti, L., Yang, Y.-L., Hewitt, C.N., Hamilton-Taylor, J.,
Davison, W., 1993. The solubility and partitioning of atmo-
spherically derived trace metals in artificial and natural
waters: a review. Atmospheric Environment 27A (10),
1567–1578.
Gwynn, C.R., Burnett, R.T., Thurston, G.D., 2000. A time-series
analysis of acidic particulate matter and daily mortality and
morbidity in the Buffalo, New York, region. Environmental
Health Perspectives 108, 125–133.
Hogrefe, O., Schwab, J.J., Drewnick, F., Rhodes, J.K., Lala,
G.G., Felton, H.D., Rattigan, O.V., Husain, L., Dutkiewicz,
V.A., 2004. Semi-continious PM2.5 sulfate and nitrate
measurements at an urban and a rural location in New York:
PMTACS-NY summer 2001 and 2002 campaigns. Journal of
Air and Waste Management Association 54, 1040–1060.
HYSPLIT (Hybrid Single-Particle Langrangian Integrated Tra-
jectory) Model, 1997. Web address:/http://www.arl.noaa.gov/
ready/hysplit4.htmlS, NOAA Air Resources Laboratory,
Silver Spring, MD.
Khwaja, H.A., Khan, A.R., Qureshi, S., 1999. Ion chromato-
graphic determination of anions in environmental samples.
International Journal of Environmental Analytical Chemistry
75, 285–297.
Li, Z., Hopke, P.P., Husain, L., Qureshi, S., Dutkiewicz, V.A.,
Schwab, J.J., Drewnick, F., Demerjian, K.L., 2004. Sources
of fine particulate composition in New York City. Atmo-
spheric Environment 38, 6521–6529.
McDonnell, W.F., Nishino-Ishikawa, N., Petersen, F.F., Chen,
L.H., Abbey, D.E., 2000. Relationships of mortality with the
fine and coarse fractions of long-term ambient PM10
concentrations in nonsmokers. Journal of Exposure Analysis
and Environmental Epidemiology 10 (5), 427–436.
Morcelli, L., Olivieri, P., Brusoni, B., Passarini, F., 2003. Soluble
and insoluble fractions of heavy metals in wet and dry deposi-
tion in Bologna, Italy. Environmental Pollution 124, 457–469.
Pope, C.A., Burnett, R.T., Thun, M.J., Calle, E.E., Krewski, D.,
Ito, K., Thurston, G.D., 2002. Lung cancer, cardiopulmonary
mortality, and long-term exposure to fine particulate air
pollution. Journal of American Medical Association 287 (9),
1132–1141.
Qureshi, S., 2004. Characterization of chemical composition and
sources of PM2.5 aerosols. Ph.D. Dissertation, State Uni-
versity of New York at Albany, School of Public Health,
Department of Environmental Health Sciences.
Schroeder, W.H., Dodson, M., Kane, D.M., Johnson, N.D.,
1987. Toxic trace elements associated with airborne particu-
late matter: a review. Journal of Air Pollution Control
Association 37, 1267–1285.
Schwab, J.J., Felton, H.D., Demerjian, K.L., 2004. Aerosol
chemical composition in New York state from integrated filter
samples: urban/rural and seasonal contrasts. Journal of
Geophysical Research 109, D16S05.
Swami, K., Judd, C.D., Orsini, J., Yang, K., Husain, L., 2001.
Microwave assisted digestion of atmospheric aerosol samples
followed by inductively coupled plasma mass spectroscopy
determination of trace elements. Foresnius Journal of
Analytical Chemistry 369, 63–70.
ARTICLE IN PRESSS. Qureshi et al. / Atmospheric Environment 40 (2006) S238–S251 S251