Lecture # 4: Biochemical Classes and Elemental Considerations- II
42
Lecture # 4: Biochemical Classes and Elemental Considerations- II
-
Upload
khangminh22 -
Category
Documents
-
view
4 -
download
0
Transcript of Lecture # 4: Biochemical Classes and Elemental Considerations- II

Lecture # 4: Biochemical Classes and Elemental Considerations- II

Reprise: Ways to examine / interpret Atomic ratios
1) Single dimension: or place on a continuum of “end-members”
HumicsBacteria
Plankton
(C/N)a0 10 20 30 40
Ocean DOM
Ocean POM Ocean Seds

Ene
rgy
Pote
ntia
l(r
educ
tion)
Nutrient Potential
Degree of degredation
H/C
N/C
0 0.15 0.3
1.0
2.0
2) Multi-dimension: or “Property-Property Plots”

PART II: More focus on Basic Biochemical Classes
In general: each “compound class” has fairly distinct compositions: on structural, and thus also elemental scale.
This composition typically arises because of-1) major functional groups (is related to function in a cell)

Recall: Major Biota compositionsTerres tria l Marine
PlantLitte r
Biota
Soil
Humus
Biota
DOC
Sedimentary OC
ILKRESVR
Terrestrial:•Cellulose•Lignin(proteins, carbos, some lipids)
Marine:•Proteins• Carbos* Some lipids

1. Carbohydrates: are the most abundant class of biochemicalon Earth (~1/3 mass of plankton and ~1/2- 3/4 mass of vascular plant tissues (woods are ~75 wt % polysaccharides).
• Oxygen – Rich: O:C ~ 0.83• H-C = medium. H:C ~ 1.67• Relatively Few or No Hetero-Atoms-
• N poor: N/C ~ 0 ( expressed as N/C as more common C/N = undefined)
1. CarbosHH
OHOH
2
D-Fructose
CH OH
2CH OH
HHO
OC
Overall: ~ C6H10O5
C OHHC OHH
C OHHC OHH
C OHHC OHH

1. . Largely storage and protective compounds
Lipids I:Fatty Acids
C=OO
1) Largely storage and protective compounds
• Super H-C- Rich! H:C ~ 1.6• Oxygen – Poor: O:C ~ 0.1• Also Relatively Few or No Hetero-Atoms-
• N poor: N/C = 0
Overall: ~ C10H20O
C HHC HH
C HHC HH
C HHC HH

1. Proteins: Major functional (enzymes) and structural component of cells.
* By weight, 50% or more of marine plankton biomass (smaller cells, ie prokaryotes= even more…)
2. Amino Acids have great structural and chemical diversity, as do specific proteins (especially structural ones). However, as a bulk compound class, total “protein” has a very similar overall composition from widely diverse source types.
• H-C: poorest H:C ~ 1.54• Oxygen – medium: O:C ~ 0.38• N-RICH!: C/N ~ 4-5 (N/C ~ 0.27)
Proteins

Lignins (and Tannins) -
O
O
CH
HC
H COH2
O
HC
HC
2HOCH
CH
HOCH
OCH HC
HCOH
OCH
CH
CH
3H CO
O
HOCH 2
HOCH 2
OH
H CO3
HCOH
HO
H CO33
O3OCH
3OCH
OH
HC
HC
H C2
CH
CH
CH 2
O
O
CH
CH
HC=O
O CH
HCOH
H COH2
HC
HCOH
H COH2
HOH C C C=O2H
H O
O
OH3
HC
C=O
HOCH 2
OCH
O
H CO33
H CO3
H CO3
O
HC
C=O
HOCH 2
O
CH
HCOH
HOCH 2
H CO3H COH COOH
CH
HCOH
H CO3
HC
HCOH
HOCH 2
H CO3H CO2
Schematic structural for spruce lignin (Adler, 1977)
O
O
3
3
3OCH
3OCH
3OCH

1. Lignins: Major Structural Polymer for terrestrial biomass. Made up of Poly-Phenols- as such, very significant aromaticity ( fewer H-C), as well as C-O.
• Relative to other classes, Poor in just about everything…• H-C: poorest H:C ~ 1.2 (recall 1:1 = totally aromatic) • Oxygen – Poorest: O:C ~ 0.3• No Heteroatoms: N/C = 0
Lignin ( Major terrestrial OC component)
Overall: ~ C10H12O3

What about Humics (“Geomolecules?”)
NB: this “molecule” does not exist!!

What are Humics (Geomolecules)?
1. Humics are an “operational definition”
In terms of a structural class, or material such as “humics”- it means that there is no one actual structure, or even strictly speaking not even a “family” of structures (like amino acids, for example).
usually due to either complexity or analytical problems- it something defined instead by a set of properties or “operations.”

Humics / Geomolecules?
Because of this, can VARY a lot- depending on 1) what environment it came from 2) how collected.
However: still can make decent generalities: Hallmarks: increasing condensation (= incr. In aromaticity) loss of heteroatoms (loss of functionality)

Humics / Geomolecules?
RESULT: Even “poorer” than lignins in some ratios! • H-C: Poor- poorest. 1 to < 1.• Oxygen – similar to lignin, or less: O:C ~ 0.3• Hetero-atoms: poor, but not zero.
C/N greatly depends on source. C/N ~ 30- 50 + ( N/C = 0.03- 0.02)

Elemental Ratios : OVERVIEW
Biopolymer Crude Formulas H/C O/C N/C
Protein (see Reuter and Perdue) 1.54 0.38 0.27 Polysaccharide C6H10O5 1.67 0.83 0
Lipid C10H20O 2.00 0.10 0 Lignin C10H12O3 1.20 0.30 0 Tannin C15H12O6 0.80 0.40 0
…Will be on web, I promise

PART III: Using Elemental Ratios in real samples
1) Basic diagnostic function: Given a sample of unknown OM in a given environmental compartment. What is it?
* C/N most commonly used, however ALL major elemental ratios can be used.
1) Given a sample of unknown OM in a given environmental compartment. What is it?
* C/N most commonly used, however ALL major elemental ratios can be used.
#1: Sources ( Basic diagnostic Function)

Recall our ocean example:
HumicsBacteria
Plankton
(C/N)a0 10 20 30 40
Ocean DOM
Ocean POM Ocean Seds
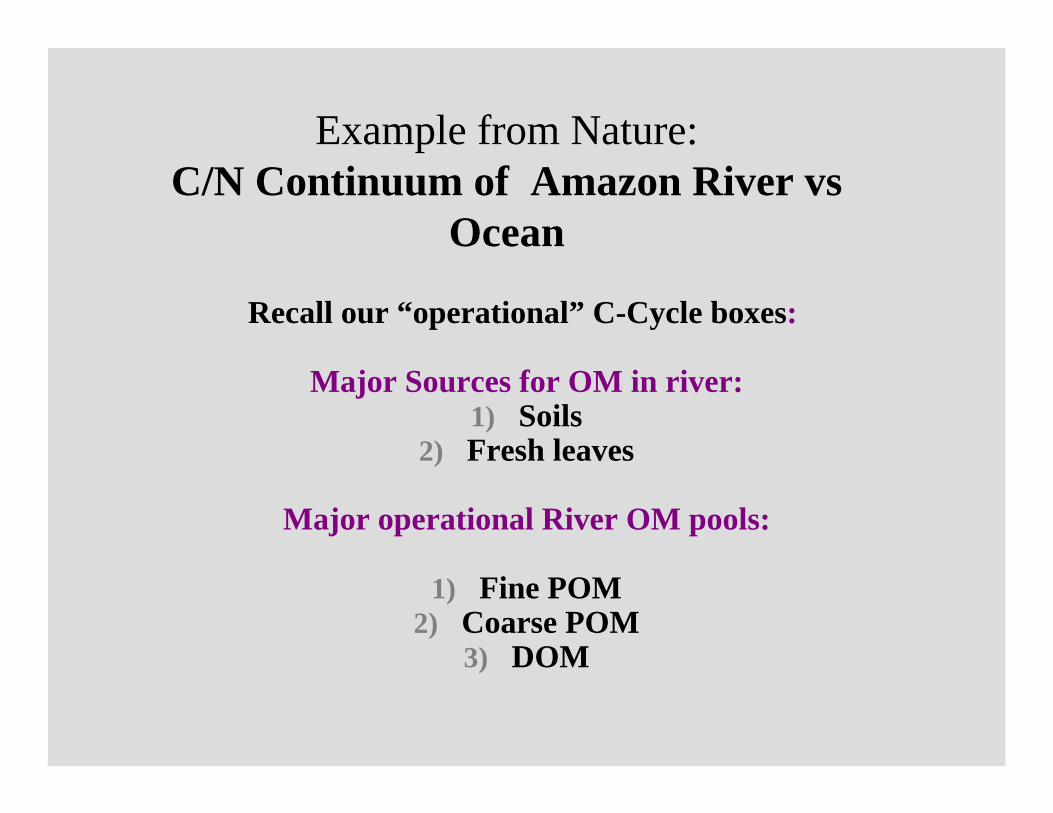
Example from Nature:C/N Continuum of Amazon River vs
Ocean
Recall our “operational” C-Cycle boxes:
Major Sources for OM in river:1) Soils
2) Fresh leaves
Major operational River OM pools:
1) Fine POM2) Coarse POM
3) DOM

SOIL
RIVER
POC-LARGE
POC-small
DOC
humics
Operational OM boxes in river:

Questions: what are linkages?
SOIL
RIVER
POC-LARGE
POC-small
DOC
humics
Operational OM boxes in river:?? ?? ??
??

C/N Continuum: Amazon River vs Ocean
Amazon DOMMainstem
RioNegro DOM
50 – 60 !
AmazonSoil OM
AmazonFine POM
Amazoncoarse POM
FreshLeaves (source!)
Marine HumicsBacteria
Plankton
0 10 20 30 40
Ocean DOM
Ocean POM
Ocean Seds
Oce
an)
Am
azon
Bas
in

Observations?
Amazon DOMMainstem
Amazon DOMMainstem
RioNegro DOM
50 – 60 !
RioNegro DOM
50 – 60 !
AmazonSoil OMAmazonSoil OM
AmazonFine POMAmazon
Fine POMAmazon
coarse POMAmazon
coarse POM
FreshLeaves (source!)
FreshLeaves (source!)
Marine HumicsBacteria
Plankton
0 10 20 30 40
Ocean DOM
Ocean POM
Ocean Seds Marine HumicsBacteria
Plankton
0 10 20 30 40
Ocean DOM
Ocean POM
Ocean Seds
Oce
an)
Am
azon
Bas
in
1. Overall: Amazon C reservoirs very different than ocean counterparts• POM composition very different based on size- opposite
trend as ocean (direct soil/bacterial link to fines?) • DOM much more degraded? Or just different composition? • Different river environments have can have extremely
different organics?

Question to Ponder: if you were to start constructing a C-cycle box model (of
Amazon to Ocean) based on these values,
How strong (or definitive) would the information you have be?

#2) Elemental Ratios to track Transformations
A)Biological (Degredative) Transformations
A)Abiotic Transformations
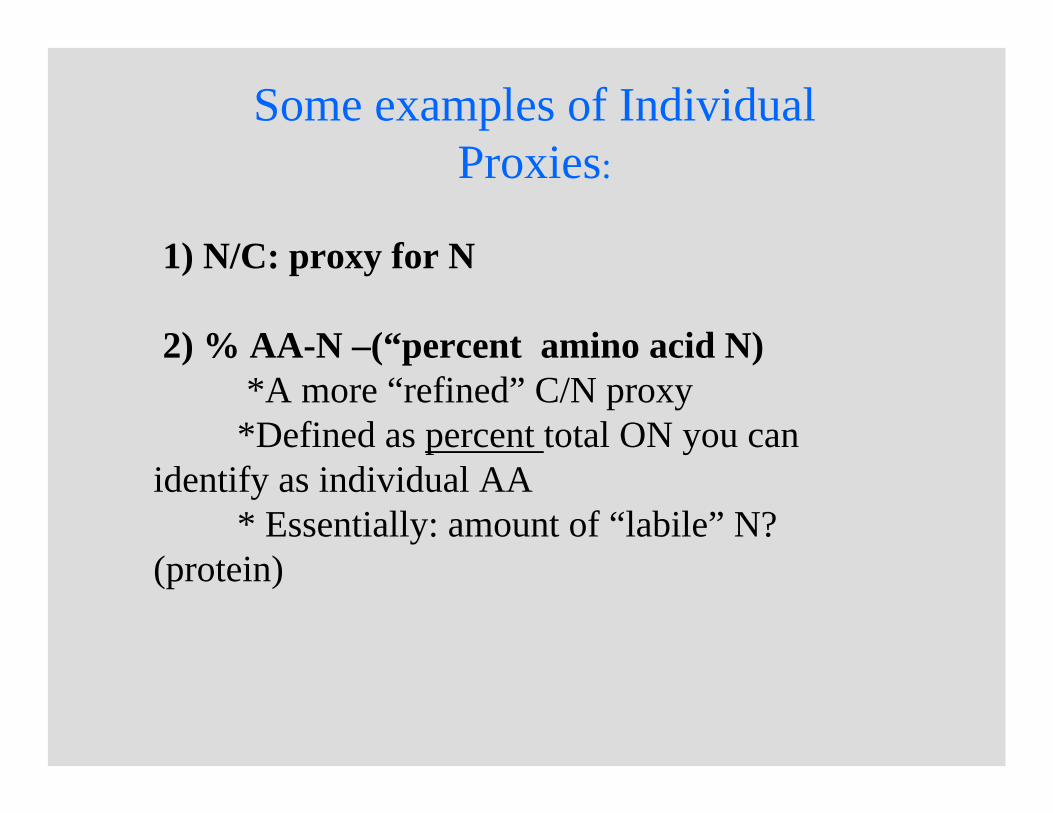
Some examples of Individual Proxies:
1) N/C: proxy for N
2) % AA-N –(“percent amino acid N)*A more “refined” C/N proxy
*Defined as percent total ON you can identify as individual AA
* Essentially: amount of “labile” N? (protein)

N:C predicts bacterial use of complex humics

UDOM•Major biochemical sources on “bio” plot- vs. ‘std’ humics
Sediment Trap
Coast Surf Sed.
Coast Deep Sed.
Reduced Turbidite
Oxidized Turbidite
0 10 20 30 40 50 60
%Amino Acid -N as a Diagenetic Indicator30 70
C/N proxy = % AA-N

Use of 2D- Plots to track Transformations

“Tie Lines” and EndMembers
Ener
gy P
oten
tial (
redu
ctio
n)
0 0.10 0.20 0.300
0.20.40.60.81.01.21.41.61.82.02.2
N/C
H/C
Lipid
Polysaccharide Protein
Lignin
Tannin
End-Members
Tie-Line
Tie Line: represents continuum along which anything composed of only the two end-members MUST be found

0 0.10 0.20 0.300
0.20.40.60.81.01.21.41.61.82.02.2
N/C
H/C
Lipid
Polysaccharide Protein
Lignin
Tannin
Major biochemical sources on “bio” plot- vs. ‘std’humics
Ener
gy P
oten
tial (
redu
ctio
n)
Nutrient Potential Degree of degredation
Humics

0 0.10 0.20 0.300
0.20.40.60.81.01.21.41.61.82.02.2
N/C
H/C
Lipid
Polysaccharide Protein
Lignin
Tannin
Question: would transformations be the same for biotic & abitiotic changes?
Ener
gy P
oten
tial (
redu
ctio
n)
Nutrient Potential Degree of degradation
Leaf Humus
Marine biota

0 0.10 0.20 0.300
0.20.40.60.81.01.21.41.61.82.02.2
N/C
H/C
Lipid
Polysaccharide Protein
Lignin
Tannin
“Envelope” of mixing: what if something falls outside?
Ener
gy P
oten
tial (
redu
ctio
n)
Nutrient Potential Degree of degredation
Leaf Humus
Humics

Geomolecules: Van Krevlyn- type PlotsEn
ergy
Pot
entia
l (re
duct
ion)
Maturity (A
rmom
aticity)

Ancient History: OM in rocks.. En
ergy
Pot
entia
l (re
duct
ion)
Maturity (A
rmom
aticity)

A Final Note:reprise of practical issues with C:H, C:O
1) C/N most commonly used, b/c 1: lots of information, but ALSO relatively easy to measure.
Why? You measure N0x Not much N contamination.
2) BUT for H and O, you measure H2OContamination?
Gigantic sources: 1) Air. (Ever try to get MS line clear of water signal?)2) worse: many materials are Hydroscopic. ever try to get
something really dry? Both clays and many biochemicals absorb water to “beat the band”.

Oceanographic Spin: Closer look at Redfield Ratio
Bulk OM: Unlike on Land, We Know ~ what it starts at!
Ratios relative to Redfield: 1. Tell you about its degradation history. 2.Tells you about likely reactivity.
Hold implications regarding geochemical fate: . (concomitant use of other elements.)
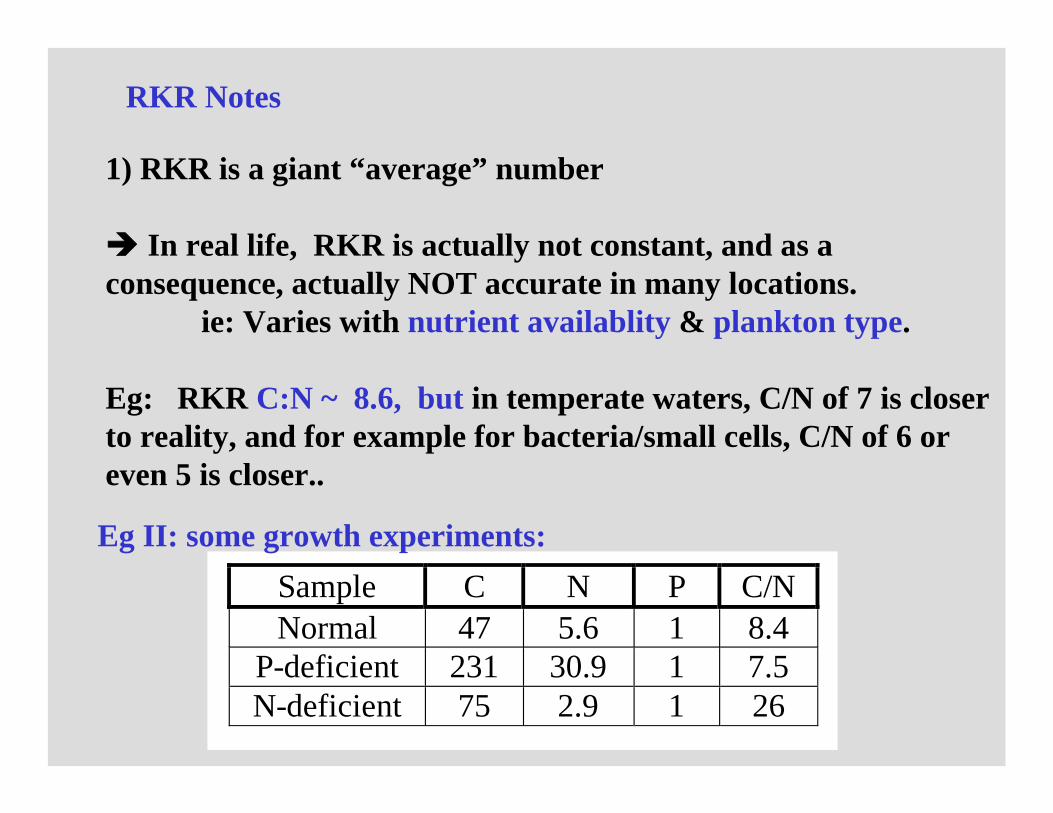
RKR Notes
1) RKR is a giant “average” number
In real life, RKR is actually not constant, and as a consequence, actually NOT accurate in many locations.
ie: Varies with nutrient availablity & plankton type.
Eg: RKR C:N ~ 8.6, but in temperate waters, C/N of 7 is closer to reality, and for example for bacteria/small cells, C/N of 6 or even 5 is closer..
Sample C N P C/N Normal 47 5.6 1 8.4
P-deficient 231 30.9 1 7.5 N-deficient 75 2.9 1 26
Eg II: some growth experiments:

Location # Stations P N CO2 (O2-2N)* -O2 CaCO3 RKR ~ 1 16 106 106 138 ~
Atlantic 119 1 17.0± 0.4 96 ± 6 138 ± 9 171 ± 8 10 ± 4 Indian 43 1 14.9 ± 0.4 119 ± 5 142 ± 5 172 ± 5 17 ± 4
Atlan+Indian 162 1 16.3 ± 1.1 103 ± 14 140 ± 8 172 ± 7 12 ± 5 *oxidation of N is assumed to take 2 O2
RR is based on “bulk” OM techniques. But is it right?
Recall statements about P –controlling OM? Do such ratios hold in real world?
A reality check on stoichiometries: theoretical and actual mean stiochiometries for material remineralization from different oceans ( Geosecs data, Takahashi et al., J GRes. 90, 6907-6924, 1985):
NOTE: Consistently more O2 (~175 moles) is actually required to respire sinking planktonic remains than is calculated from the RKR ratio (138 moles O2)!!
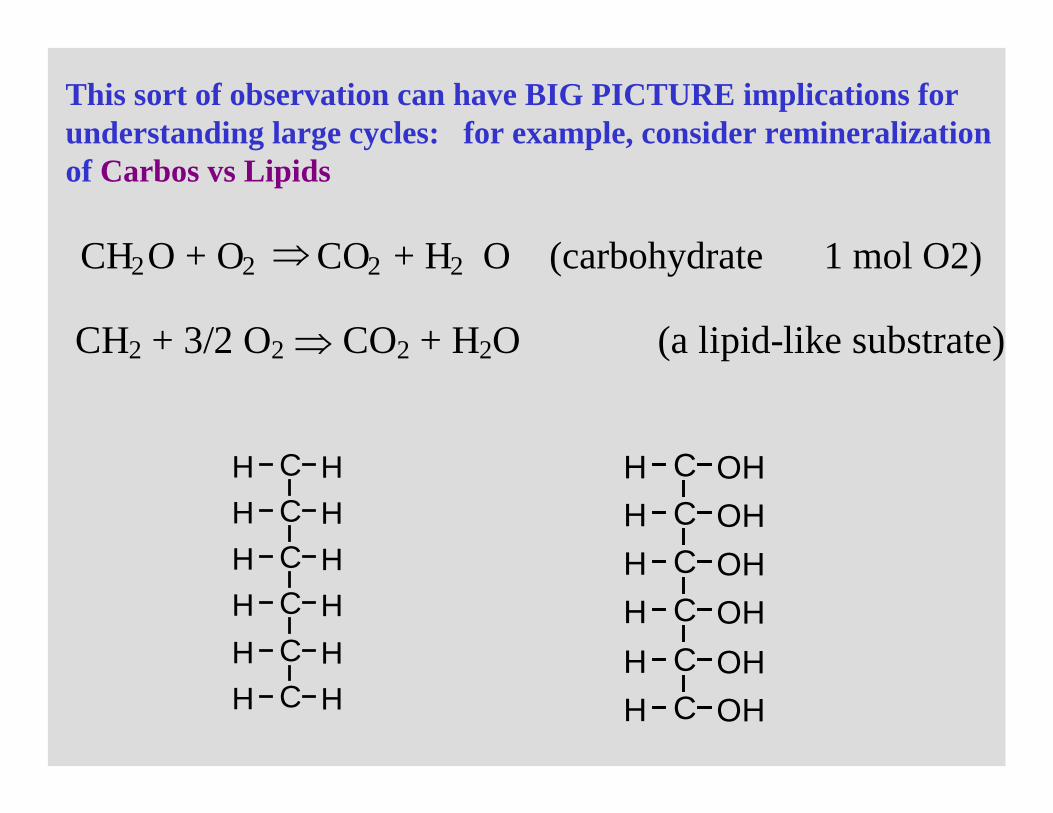
This sort of observation can have BIG PICTURE implications for understanding large cycles: for example, consider remineralization of Carbos vs Lipids
CH2 + 3/2 O2 CO2 + H2O (a lipid-like substrate)
C HHC HH
C HHC HH
C HHC HH
CH2O + O2 CO2 + H2 O (carbohydrate 1 mol O2)
C OHHC OHH
C OHHC OHH
C OHHC OHH
These kinds of observations suggests that actual overall biochemical composition of plankton may not be as well known as we think..
Could affect large C cycle models.

END