Characteristics of atmospheric turbulence in the surface layer over Antarctica
11
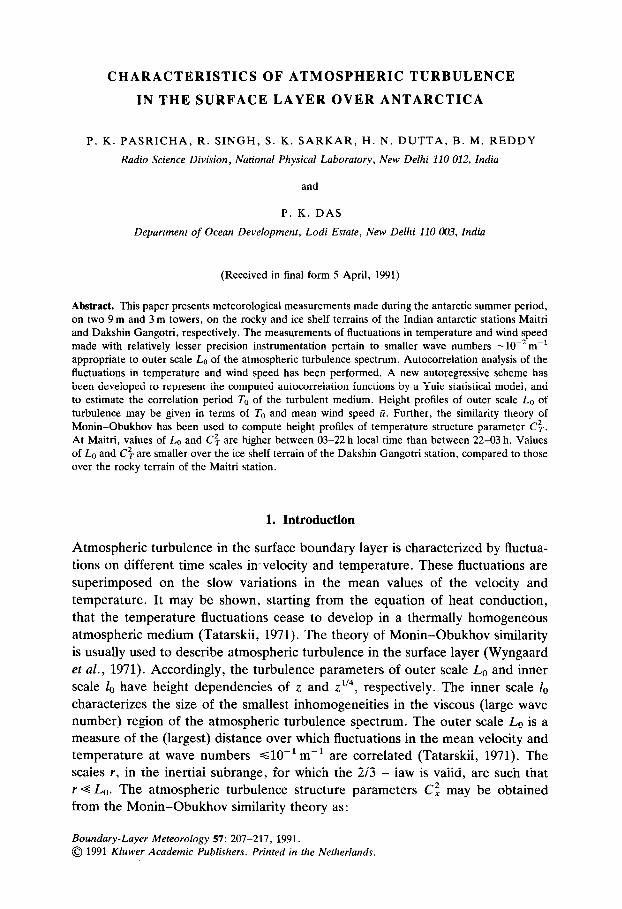
CHARACTERISTICS OF ATMOSPHERIC TURBULENCE IN THE SURFACE LAYER OVER ANTARCTICA P. K. PASRICHA, R. SINGH, S. K. SARKAR, H. N. DUTTA, B. M. REDDY Radio Science Division, National Physical Laboratory, New Delhi 110 012, India and P. K. DAS Department of Ocean Development, Lodi Estate, New Delhi 110 003, India (Received in final form 5 April, 1991) Abstract. This paper presents meteorological measurements made during the antarctic summer period, on two 9 m and 3 m towers, on the rocky and ice shelf terrains of the Indian antarctic stations Maitri and Dakshin Gangotri, respectively. The measurements of fluctuations in temperature and wind speed made with relatively lesser precision instrumentation pertain to smaller wave numbers -10e2 m-l appropriate to outer scale Lo of the atmospheric turbulence spectrum. Autocorrelation analysis of the fluctuations in temperature and wind speed has been performed. A new autoregressive scheme has been developed to represent the computed autocorrelation functions by a Yule statistical model, and to estimate the correlation period To of the turbulent medium. Height profiles of outer scale Lo of turbulence may be given in terms of To and mean wind speed U. Further, the similarity theory of Monin-Obukhov has been used to compute height profiles of temperature structure parameter C’,. At Maitri, values of Lo and C’, are higher between 03-22 h local time than between 22-03 h. Values of Lo and C: are smaller over the ice shelf terrain of the Dakshin Gangotri station, compared to those over the rocky terrain of the Maitri station. 1. Introduction Atmospheric turbulence in the surface boundary layer is characterized by fluctua- tions on different time scales in-velocity and temperature. These fluctuations are superimposed on the slow variations in the mean values of the velocity and temperature. It may be shown, starting from the equation of heat conduction, that the temperature fluctuations cease to develop in a thermally homogeneous atmospheric medium (Tatarskii, 1971). The theory of Monin-Obukhov similarity is usually used to describe atmospheric turbulence in the surface layer (Wyngaard et al., 1971). Accordingly, the turbulence parameters of outer scale Lo and inner scale lo have height dependencies of z and z~‘~, respectively. The inner scale l,, characterizes the size of the smallest inhomogeneities in the viscous (large wave number) region of the atmospheric turbulence spectrum. The outer scale L,, is a measure of the (largest) distance over which fluctuations in the mean velocity and temperature at wave numbers ~10~1 m-’ are correlated (Tatarskii, 1971). The scales I, in the inertial subrange, for which the 2/3 - law is valid, are such that r G Lo. The atmospheric turbulence structure parameters C; may be obtained from the Monin-Obukhov similarity theory as: Boundary-Layer Meteorology 57: 207-217, 1991. 0 1991 Kluwer Academic Publishers. Printed in the Netherlands.
-
Upload
independent -
Category
Documents
-
view
1 -
download
0
Transcript of Characteristics of atmospheric turbulence in the surface layer over Antarctica
CHARACTERISTICS OF ATMOSPHERIC TURBULENCE
IN THE SURFACE LAYER OVER ANTARCTICA
P. K. PASRICHA, R. SINGH, S. K. SARKAR, H. N. DUTTA, B. M. REDDY
Radio Science Division, National Physical Laboratory, New Delhi 110 012, India
and
P. K. DAS
Department of Ocean Development, Lodi Estate, New Delhi 110 003, India
(Received in final form 5 April, 1991)
Abstract. This paper presents meteorological measurements made during the antarctic summer period, on two 9 m and 3 m towers, on the rocky and ice shelf terrains of the Indian antarctic stations Maitri and Dakshin Gangotri, respectively. The measurements of fluctuations in temperature and wind speed made with relatively lesser precision instrumentation pertain to smaller wave numbers -10e2 m-l appropriate to outer scale Lo of the atmospheric turbulence spectrum. Autocorrelation analysis of the fluctuations in temperature and wind speed has been performed. A new autoregressive scheme has been developed to represent the computed autocorrelation functions by a Yule statistical model, and to estimate the correlation period To of the turbulent medium. Height profiles of outer scale Lo of turbulence may be given in terms of To and mean wind speed U. Further, the similarity theory of Monin-Obukhov has been used to compute height profiles of temperature structure parameter C’,. At Maitri, values of Lo and C’, are higher between 03-22 h local time than between 22-03 h. Values of Lo and C: are smaller over the ice shelf terrain of the Dakshin Gangotri station, compared to those over the rocky terrain of the Maitri station.
1. Introduction
Atmospheric turbulence in the surface boundary layer is characterized by fluctua- tions on different time scales in-velocity and temperature. These fluctuations are superimposed on the slow variations in the mean values of the velocity and temperature. It may be shown, starting from the equation of heat conduction, that the temperature fluctuations cease to develop in a thermally homogeneous atmospheric medium (Tatarskii, 1971). The theory of Monin-Obukhov similarity is usually used to describe atmospheric turbulence in the surface layer (Wyngaard et al., 1971). Accordingly, the turbulence parameters of outer scale Lo and inner scale lo have height dependencies of z and z~‘~, respectively. The inner scale l,, characterizes the size of the smallest inhomogeneities in the viscous (large wave number) region of the atmospheric turbulence spectrum. The outer scale L,, is a measure of the (largest) distance over which fluctuations in the mean velocity and temperature at wave numbers ~10~1 m-’ are correlated (Tatarskii, 1971). The scales I, in the inertial subrange, for which the 2/3 - law is valid, are such that r G Lo. The atmospheric turbulence structure parameters C; may be obtained from the Monin-Obukhov similarity theory as:
Boundary-Layer Meteorology 57: 207-217, 1991. 0 1991 Kluwer Academic Publishers. Printed in the Netherlands.
208 P. K. PASRICHA ET AL,
c: = x~z-2’3gx(zlL) ) (1) where z is the height, X* the appropriate scaling parameter (which may also be given in terms of Lo), g, the dimensionless stability dependence, L the Monin- Obukhov stability length, and X represents velocity or temperature (or humidity). The values of X* may be obtained from measurements of surface fluxes or gradi- ents of the meteorological parameters.
Relatively crude measurement techniques, such as with thermocouples and cup anemometers, could be used to compute the outer scale of atmospheric turbulence Lo. Precision measurement techniques such as with thermistors and ultrasonic anemometers-thermometers with small time constants are suitable for turbulence measurements in the inertial and viscous ranges (Tatarskii, 1971). Taylor’s “froz- en” hypothesis, which is strictly applicable in the inertial and viscous ranges, may also be applied to the velocity and temperature parameters at smaller wave num- bers outside the inertial subrange. Accordingly, the temporal frequency f in the observed spectrum of the temporal fluctuations in temperature and velocity is transformed to the wave number k of the turbulence spectrum through the relation
where ZI (a5 m s-l) is the mean wind speed. The “frozen” field hypothesis has been experimentally shown to be applicable at larger wave numbers k b low3 m-l or temporal frequencies f B lop3 Hz in the surface layer (Tatarskii, 1971). Thus, the time constant of the measuring instruments (-f-l) needs to be s ld s.
A limited amount of information on the characteristics of atmospheric turbu- lence in the surface layer over Antarctica has been specifically studied during the antarctic (southern) winter. Strong atmospheric stability conditions, with tempera- ture gradients -1 “Cm-1 may exist near the Earth’s surface during the antarctic winter. The intensity of turbulence in terms of the structure parameter C”, (or Cg) very much decreases with increased atmospheric stability (given by L). Preci- sion measurements are therefore needed to measure atmospheric turbulence (fluc- tuations) in the “stably stratified boundary layer” (King, 1990). The power spectra of the fluctuations in temperature (or vertical, w-component of velocity), in the inertial subrange, show a characteristic spectral shape: a maximum in spectral intensity followed by a power-law slope to the high wave number region (Kaimal et al., 1972). The spectral intensity may be given in terms of the structure parameter C”, (or C”,). The spectral slope determines the size distribution of the inhomo- geneities in the temperature (or w-component of velocity) turbulence spectrum. The power spectra of the fluctuations in other components of the wind velocity, as well as of the mean wind speed z?, reveal a spectral shape which is neither Gaussian nor of the power-law type. Also, the power spectra of the fluctuations in different meteorological parameters at wave numbers corresponding to the outer scale Lo do not show the most familiar type of spectral shapes.
CHARACTERISTICS OF ATMOSPHERIC TURBULENCE 209
This paper presents some evaluation of the turbulence characteristics in the mean wind speed ii and temperature T at the Indian antarctic stations Maitri and Dakshin Gangotri during the antarctic summer period of January-February, 1990. The fluctuations in the meteorological parameters were measured at 15 cm, 1, 3 and 9 m and at the 15 cm, 1 and 3 m levels at the rocky and ice shelf terrains of the stations Maitri and Dakshin Gangotri, respectively. The measurements were made with lesser precision instrumentation (potentiometers and cup anem- ometers). A sampling period of 10 s, found suitable to measure the fluctuations in the meteorological parameters, implies that the turbulence characteristics so computed pertain to the smaller wave numbers outside the inertial subrange. Autocorrelation functions for a selected set of samples of the fluctuations in the mean wind speed ii and temperature T have been computed. A new Yule autoregressive scheme has been developed, to apply to these autocorrelation functions, to compute the correlation period T,, between “independent estimates” in the fluctuation data. A Yule statistical model had been applied earlier to the problem of detection of weak - Doppler signals with a mesosphere - stratosphere - troposphere (MST) radar (Pasricha et al., 1989). In conjunction with the “frozen” hypothesis, it is possible to estimate the outer scale Lo of the inhomogeneities at the smaller wave number region of the turbulence spectrum. The Monin-Obukhov similarity theory is used to estimate the structure parameter C’,. The turbulence characteristics have been evaluated under various atmospheric conditions, given by the Monin-Obukhov stability parameter L.
2. Estimation of the Correlation Period of the Turbulent Medium through a Yule Autoregressive Scheme
Consider a random temporal sequence t(t) of the fluctuations in a meteorological parameter, with a mean p and variance equal to u2. If it is averaged over a period T, the new sequence [(ct) has the same mean p and a reduced variance (+$. The variance of the time-averaged sequence [(<t) is given by (Jones, 1975)
T 2 0 u$=ff -) T
where To is the correlation period (in some units). The significance of To is that the individual sample points spaced To apart may be treated as uncorrelated. For To = 1, adjacent sample points are independent of one another. This is the well- known result for independent data, where ar/a varies as T-l”. Thus a mean p may be obtained by simply averaging sample points To apart. The characteristic time To is a measure of the “persistence” in an autocorrelated time series. For instance, the correlation period To for a mathematically convenient (but an inade- quate) Gaussian description of the turbulence spectrum, with an autocorrelation function P(T) - exp( - 7 2/T g) may be shown to be
210 P. K. PASRICHA ET AL.
where 7. is the l/e-decorrelation width. The autocorrelation function of the sequence s(t), for a Yule statistical model,
is given by (Kendall and Stuart, 1966)
pk = pk sin(ke + 0 sin 5 ’
where k is an integer and the parameters p, 8 and 5 are given in terms of the values of the autocorrelation function at the first and second lags p1 and p2, respectively. Various parameters are defined as
(yl = _ Pl(l - pz) 1-p: ’
m - P: ff2= -~ 1 I 1-p: ’
p=G,
a1 cos e= - ~
2v& ’
1+P2tant? tanl=- l-p2 *
The correlation period To for a Yule model is given by
+
(4)
(5)
(6)
(7)
(8)
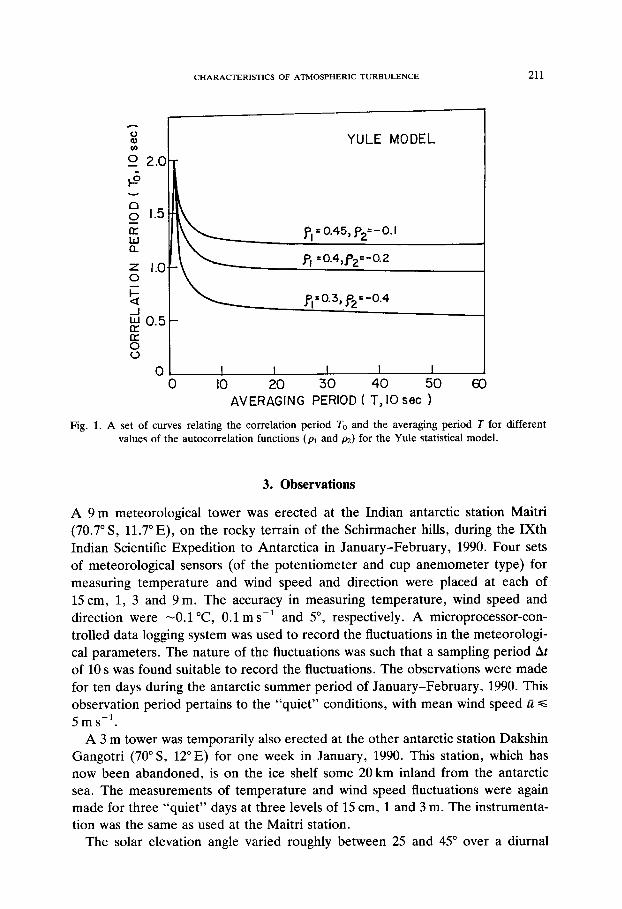
where T is a sufficiently large averaging period. A set of curves of To versus T for different combinations of the values of p1 and pz are given in Figure 1.
In the present study, it is assumed that a Yule model represents the statistical properties of the fluctuations in the mean wind speed a and temperature T at smaller wave numbers. Autocorrelation analysis of the fluctuations in fi and T is performed, and the correlation period of the turbulent medium To is evaluated using expression (9). The outer scale Lo, using the observed mean wind speed ~2, is given by Lo = iiTo. Such an estimate of Lo is valid for low wind speeds ~2 6 5 m s-l.
CHARACTERISTICS OF ATMOSPHERIC TURBULENCE 211
Fig. 1. A
t-ii YULE MODEL an
III\\ p,=o.45,p,=-0.1 I
01 I I I I I 1 0 IO 20 30 40 50 60
AVERAGING PERIOD ( T,IO set )
set of curves relating the correlation period TO and the averaging period T for values of the autocorrelation functions (pl and m) for the Yule statistical model.
different
3. Observations
A 9 m meteorological tower was erected at the Indian antarctic station Maitri (70.7” S, 11.7” E), on the rocky terrain of the Schirmacher hills, during the IXth Indian Scientific Expedition to Antarctica in January-February, 1990. Four sets of meteorological sensors (of the potentiometer and cup anemometer type) for measuring temperature and wind speed and direction were placed at each of 15 cm, 1, 3 and 9 m. The accuracy in measuring temperature, wind speed and direction were -0.1 “C, 0.1 m s-l and 5”, respectively. A microprocessor-con- trolled data logging system was used to record the fluctuations in the meteorologi- cal parameters. The nature of the fluctuations was such that a sampling period At of 10 s was found suitable to record the fluctuations. The observations were made for ten days during the antarctic summer period of January-February, 1990. This observation period pertains to the “quiet” conditions, with mean wind speed a d 5 m s-l.
A 3 m tower was temporarily also erected at the other antarctic station Dakshin Gangotri (70” S, 12”E) for one week in January, 1990. This station, which has now been abandoned, is on the ice shelf some 20 km inland from the antarctic sea. The measurements of temperature and wind speed fluctuations were again made for three “quiet” days at three levels of 15 cm, 1 and 3 m. The instrumenta- tion was the same as used at the Maitri station.
The solar elevation angle varied roughly between 25 and 45” over a diurnal
212 P. K. PASRICHA ET AL.
cycle during the observation period. The observations were made on cloudless days. Representative values of wind direction (azimuth) at the Maitri station were 60” (NE) and 160” (SE) during the (local) day and night periods, respectively. The wind direction at the Dakshin Gangotri station was approximately 160” (SE) throughout the day. The Maitri station lies upwind (azimuth) of the prevailing air motion (on the mesoscale) with respect to the Dakshin Gangotri station. The roughness length (on the microscale) has typical values of 0.0001 and 0.05 m over the smooth snow and rocky terrains of the Dakshin Gangotri and Maitri stations, respectively.
Samples of fluctuations in the meteorological parameters of about 20 min dur- ation were selected around local noon and midnight. [There was, of course no “night” during the period of observations.] Linear de-trending over a number of portions in the samples was performed to remove mean values of temperature (wind speed). Autocorrelation functions of 128 sample points were computed, using an inverse FFT algorithm. A visual inspection was made to ascertain whether a particular autocorrelation function looked like the Yule type or not. If it did not, the sample period At was increased by omitting the intermediate sample points of the 10 s measurements made. The spatial frequencies in the fluctuations analysed vary in the range of lop3 to low2 m-l, and correspond to small wave numbers appropriate to outer scale of turbulence.
The values of the autocorrelation function at lag 1 (pr) and lag 2 (p2) were used in expression (9) to compute the correlation period T,,. However, when the lag 1 (pl) value of the autocorrelation function was negative, the values of the autocor- relation function at lag 0 (po = 1) and p1 were linearly interpolated to re-obtain p1 = po + (old p1 - po)/2 and pz = old p1 at a sampling period of At/2.
4. Evaluation of the Correlation Period and the Turbulence Characteristics
The observations on the fluctuations in temperature and wind speed made at the Maitri and Dakshin Gangotri stations (during the antarctic summer period) correspond to varied atmospheric stability conditions. At Dakshin Gangotri, there were observed fluctuations in wind speed alone. There were no simultaneous fluctuations in the temperature parameter for the observed fluctuation frequencies -lo-’ Hz. At Dakshin Gangotri, the temperature difference between the surface and 3 m had a value of about -0.3 “C and +l “C for the periods 0300-1800 h and 1800-0300 h, respectively. The non-development of the temperature fluctuations over the ice shelf in the former period is due to turbulent mixing in the surface layer with a constant mean temperature throughout it. In the latter period, the temperature inversion probably suppressed the temperature fluctuations. At Mai- tri, temperature gradients --3.5 “C/9 m and - -0.5 “C/9 m existed during the periods 0300-2200 h and 2200-0300 h, respectively. Over the rocky terrain of the Maitri station, temperature fluctuations in the surface layer also occurred in the latter period.
CHARACTERISTICS OF ATMOSPHERIC TURBULENCE 213
i-
)-
2
,-
6
6-
4-
2-
o-
2-
0
YULE MODEL----
l (01
DAKSHIN GAMOTRI IZOOhlLT
WIND SPEED
\
lb1 MYTRl 13cOh(LT 1
TEMPERATURE
4
-10
1234567 LAGIXZO%sl
--I
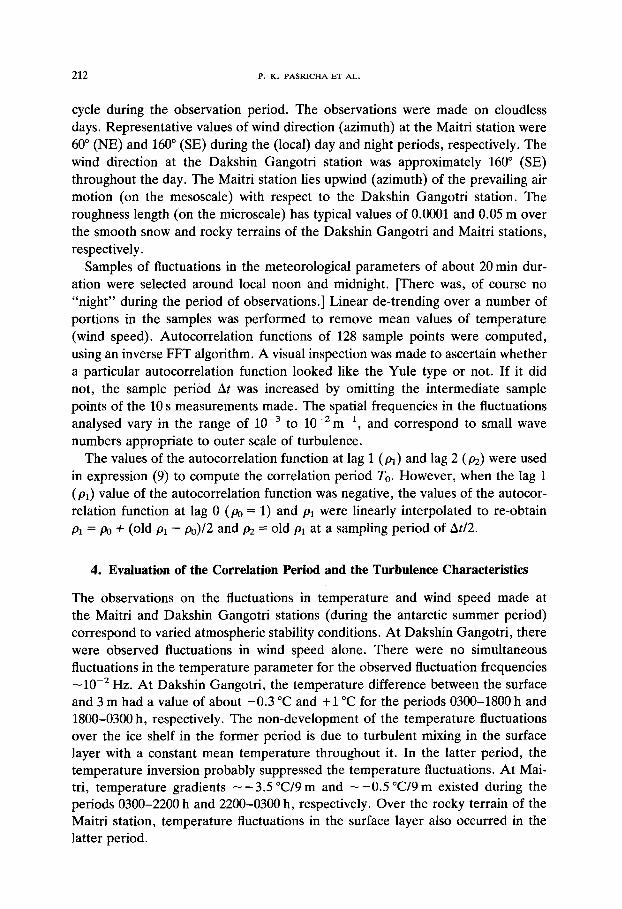
I Fig. 2. Representative autocorrelation functions of the fluctuations observed at 15 cm for (a) wind speed at Dakshin Gangotri, (b) temperature at Maitri, and (c) wind speed at Maitri. The dotted curves
are the Yule model curves fitted to the observed data.
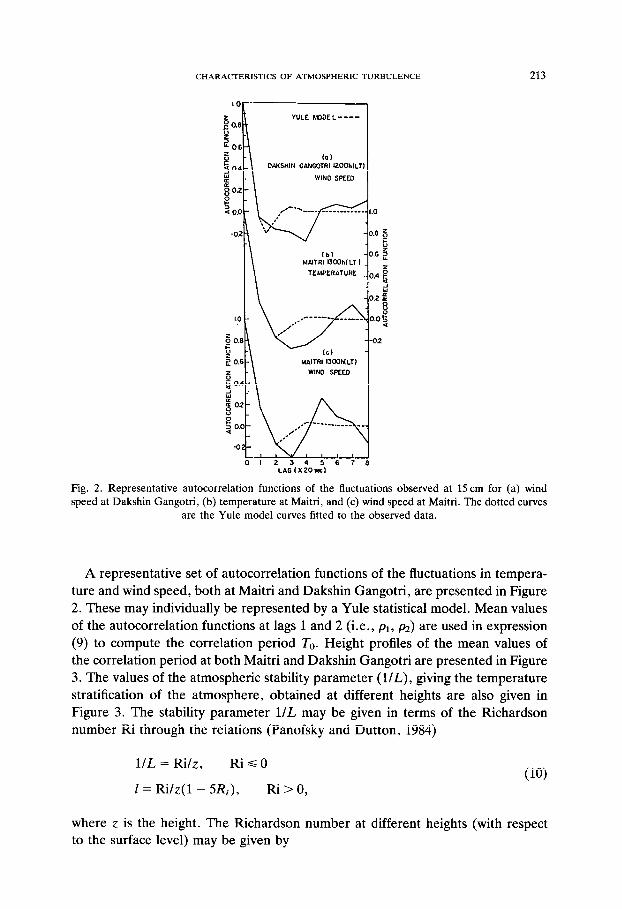
A representative set of autocorrelation functions of the fluctuations in tempera- ture and wind speed, both at Maitri and Dakshin Gangotri, are presented in Figure 2. These may individually be represented by a Yule statistical model. Mean values of the autocorrelation functions at lags 1 and 2 (i.e., pl, pz) are used in expression (9) to compute the correlation period To. Height profiles of the mean values of the correlation period at both Maitri and Dakshin Gangotri are presented in Figure 3. The values of the atmospheric stability parameter (l/L), giving the temperature stratification of the atmosphere, obtained at different heights are also given in Figure 3. The stability parameter l/L may be given in terms of the Richardson number Ri through the relations (Panofsky and Dutton, 1984)
l/L = Rilz, Ri c 0
1= Ri/z(l - 5R,), Ri > 0, (10)
where z is the height. The Richardson number at different heights (with respect to the surface level) may be given by
214 P. K. PASRICHA ET AL.
22-03h A-A CI
03-18h w 18-03h H
DAKSHIN GANGOTRI
CORRELATION PERIOD 1 MC J
Fig. 3. Estimates of the mean values of the correlation period To, obtained from the autocorrelation analyses of the fluctuations in wind speed and temperature and the use of the Yule statistical model, at Maitri and Dakshin Gangotri. The values in parentheses are those of the stability parameter l/L, where L is the Monin-Obukhov stability length. The dotted lines represent mean values of the
correlation period at different times.
ATAz Ri=p-
Au2 ’ (11)
where /I = g/T, g is the acceleration due to gravity, T the mean temperature, and AT and Au the temperature and wind speed changes across the height level AZ. The value of the parameter p for the antarctic summer period may be taken as = 0.035 m sK2 deg-‘. In general, positive and negative values of both Ri and L signify stable and unstable atmospheric thermal stratification, respectively.
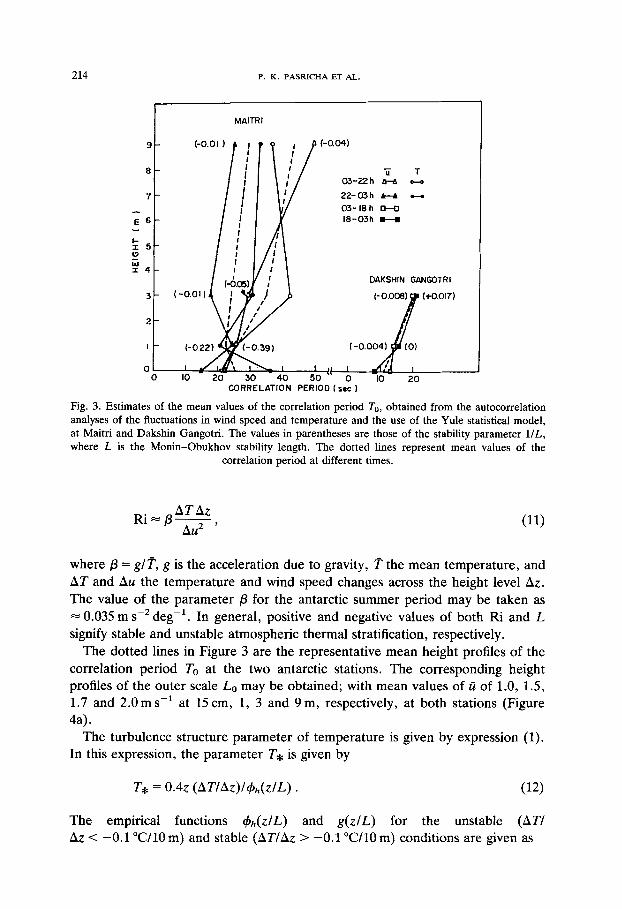
The dotted lines in Figure 3 are the representative mean height profiles of the correlation period To at the two antarctic stations. The corresponding height profiles of the outer scale L,, may be obtained; with mean values of ti of 1.0, 1.5, 1.7 and 2.0 m s-’ at 15 cm, 1, 3 and 9 m, respectively, at both stations (Figure 4a).
The turbulence structure parameter of temperature is given by expression (1). In this expression, the parameter T* is given by
T* = 0.42 (ATIAz)I~,,(zIL) . (12)
The empirical functions &(zIL) and g(zlL) for the unstable (AT/ AZ < -0.1 “C/10 m) and stable (AT/AZ > -0.1 “C/10 m) conditions are given as
CHARACTERISTICS OF ATMOSPHERIC TURBULENCE
(a) MAITRI
22-03h 03-22h
(b) MAITRI
22-03h 03-22h
I i i
DAKSHIN i ~NGOTRI i
(-,3-18,, \ 18-03 h
/ /
/ / ‘\
/ \
01 I 1 I I I>&! ,,,I ,111 I IIII1111l I (II ,111 I ,,,I
0 20 40 60 80 162 5 IO 5 IO0
CT? de; -I?~ ) 5 IO’ 5
OUTER SCALE( Lo ,m)
215
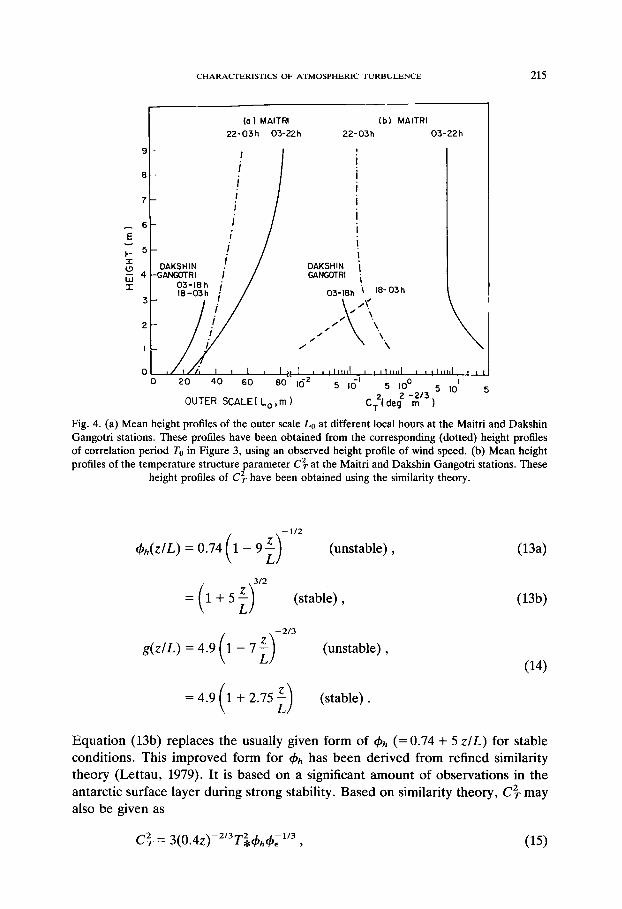
Fig. 4. (a) Mean height profiles of the outer scale LO at different local hours at the Maitri and Dakshin Gangotri stations. These profiles have been obtained from the corresponding (dotted) height profiles of correlation period Tc in Figure 3, using an observed height profile of wind speed. (b) Mean height profiles of the temperature structure parameter C”, at the Maitri and Dakshin Gangotri stations. These
height profiles of C”, have been obtained using the similarity theory.
(unstable) , (134
(stable) , W)
-213
(unstable) , (14)
= 4.9(1 + 2.75:) (stable).
Equation (13b) replaces the usually given form of & (= 0.74 + 5 z/L) for stable conditions. This improved form for &, has been derived from refined similarity theory (Lettau, 1979). It is based on a significant amount of observations in the antarctic surface layer during strong stability. Based on similarity theory, C’, may also be given as
216 P. I‘. PASRICHA ET AL.
where 4c is the normalized dissipation function. It is given by the empirical expressions
&=1-f (unstable)
= [l + 2.5(z/L)“.6]3’2 (stable) .
The factor (0.4~)~~‘~ in expression (15) may be written in terms of the outer scale Lo as (Lola)-“. Here the (height-dependent) constant a is found to have values from about 100 to 20 at the levels of 1 to 9 m, based on the present set of antarctic observations. The values of C’, obtained with expressions (1) and (15) are approxi- mately the same (Panofsky and Dutton, 1984). Height profiles of C”, at different times, obtained with expression (l), both at Maitri and Dakshin Gangotri stations, are presented in Figure 4(b). The values of C’, at Maitri are almost two orders- of-magnitude higher in the 03-22 h period than in the 22-03 h period. At Dakshin Gangotri, the value of C”, at 3 m is higher in the 18-03 h period than in the 03- 18 h period due to the presence of temperature inversions in the former case. The value of C”, of lo-* (deg* m-“) at 1 m is only presented to indicate that almost no temperature gradient is observed at that level. The decrease in the values of C’, with height observed close to the surface of the Earth over Antarctica is similar to that observed in the stable boundary layer over the mainland (Cuijpers and Kohsiek, 1989).
5. Conclusions
This paper presents measurements on the fluctuations in temperature and wind speed with relatively lesser precision instrumentation made over the rocky and ice shelf terrains of the Indian antarctic stations Maitri and Dakshin Gangotri, respectively. The measurements were made at four levels on a 9 m tower and at three levels on a 3 m tower at Maitri and Dakshin Gangotri, respectively. The initial set of measurements made pertain to the “quiet” conditions (winds speed =S 5 m-‘) during the antarctic summer period of January-February, 1990. Autocor- relation analysis of the fluctuations at smaller wave numbers -lo-* m-l appropri- ate to the outer scale of turbulence has been performed. These autocorrelation functions cannot be represented by the conventional power-law or Gaussian shapes. A new autoregressive scheme has been developed to compute the corre- lation period To of the turbulent medium. The physical parameter of the outer scale Lo of atmospheric turbulence in the surface layer is later deduced. Further, the similarity theory has been used to compute height profiles of the temperature structure parameter C’, at different times. The Monin-Obukhov stability length L, implying thermal stability, has been used to compute C”, under varied atmo- spheric stability conditions. The values of the structure parameter C’, at the rocky terrain of Maitri are higher by almost two orders-of-magntiude in the 03-22 h
CHARACTERISTICS OF ATMOSPHERIC TURBULENCE 217
period compared to the 22-03 h period. The values of C’, over the ice shelf terrain of Dakshin Gangotri are similar to those obtained for the 22-03 h period at the Maitri station. Future work includes a similar analysis of measurements of the fluctuations in the meteorological parameters made during the antarctic winter period. The tower measurements near the Earth’s surface at Maitri will subse- quently be made in the inertial subrange with precision instrumentation, and the turbulence characteristics obtained using similarity theory.
Acknowledgments
The meteorological tower measurements at Antarctica reported in this paper were made by two of the authors (P.K.P. and R.S.) during the IXth Indian Scientific Expedition to Antarctica in 1989-90. They acknowledge Rasik Ravindra, leader of the expedition, and the whole team for the support in putting up the tower at Maitri and Dakshin Gangotri. The present study is dedicated to the memory of four of the team-mates, namely, Arun Bedi, Vinod Srivastva, Bansi Sharma and Navin Joshi, who lost their lives in a tragic accident during the expedition. The authors are grateful to Dr. J. C. King of the British Antarctic Survey for his helpful comments on an earlier version of the paper.
References
Cuijpers, J. W. M. and Kohsiek, W.: 1989, ‘Vertical Profiles of the Structure Parameter of Temperature in the Stable, Nocturnal Boundary Layer’, Boundary-Layer Meteorol. 47, 111-129.
Jones, R. H.: 1975, ‘Estimating the Variance of Time-Averages’, J. Appl. Meteorol. 14, 159-163. Kaimal, J. C., Wyngaard, J. C., Izumi, Y., and CotC, 0. R.: 1972, ‘Spectral Characteristics of Surface-
Layer Turbulence’, Q. J. R. Meteorol. Sot. 98, 563-589. Kendall, M. G. and Stuart, A.: 1966, The Advanced Theory ofSturls?ics, Vol. 3, Charles Griffin and
Co., Ltd., London, pp. 418-419. King, J. C.: 1990, ‘Some Measurements of Turbulence over an Antarctic Ice Shelf’, Q. J. R. Meteorol.
Sot. 116, 379-400. Lettau, H. H.: 1979, ‘Wind and Temperature Profile Prediction for Diabatic Surface Layers Including
Strong Inversion Cases’, Boundary-Layer Meteorol. 17, 443-464. Panofsky, H. A. and Dutton, J. A.: 1984, Atmospheric Turbulence, John Wiley & Sons, pp. 182-186
and 375-379. Pasricha, P. K., Jain, A. R., and Reddy, B. M.: 1989, ‘On the Optimum Smoothing of MST Radar
Signals, Handbook for MAP’, Vol. 28, August 1989, Eds. C. H. Liu and Belva Edwards, SCOSTEP Secretariat, University of Illinois, Illinois, USA.
Tatarskii, V. I.: 1971, The Effects of the Turbulent Artmosphere on Wave Propaation, National Technical Information Service, Springfield, USA, Ch. 1.
Wyngaard, J. C., Izumi, Y., and Collins, S. A., Jr.: 1971, ‘Behavior of Refractive Index-Structure Parameter near the Ground’, J. Op. Sot. Am. 61, 1646-1650.