Cunctipotence: Elemental Female Potency, in Trivia (online journal)
Upload
independentCategory
view
1download
0
1 23
Journal of Radioanalytical andNuclear ChemistryAn International Journal Dealing withAll Aspects and Applications of NuclearChemistry ISSN 0236-5731 J Radioanal Nucl ChemDOI 10.1007/s10967-013-2851-x
Neutron activation analysis on sedimentsfrom Victoria Land, Antarctica: multi-elemental characterization of potentialatmospheric dust sources
G. Baccolo, C. Baroni, M. Clemenza,B. Delmonte, V. Maggi, A. Motta,M. Nastasi, E. Previtali & M. C. Salvatore

1 23
Your article is protected by copyright and
all rights are held exclusively by Akadémiai
Kiadó, Budapest, Hungary. This e-offprint is
for personal use only and shall not be self-
archived in electronic repositories. If you wish
to self-archive your article, please use the
accepted manuscript version for posting on
your own website. You may further deposit
the accepted manuscript version in any
repository, provided it is only made publicly
available 12 months after official publication
or later and provided acknowledgement is
given to the original source of publication
and a link is inserted to the published article
on Springer's website. The link must be
accompanied by the following text: "The final
publication is available at link.springer.com”.
Neutron activation analysis on sediments from Victoria Land,Antarctica: multi-elemental characterization of potentialatmospheric dust sources
G. Baccolo • C. Baroni • M. Clemenza •
B. Delmonte • V. Maggi • A. Motta •
M. Nastasi • E. Previtali • M. C. Salvatore
Received: 11 September 2013
� Akademiai Kiado, Budapest, Hungary 2013
Abstract The elemental composition of 40 samples of
mineral sediments collected in Victoria Land, Antarctica,
in correspondence of ice-free sites, is presented. Concen-
tration of 36 elements was determined by instrumental
neutron activation analysis, INAA. The selection of 6
standard reference materials and the development of a
specific analytical procedure allowed to reduce measure-
ments uncertainties and to verify the reproducibility of the
results. The decision to analyze sediment samples from
Victoria Land ice-free areas is related to recent investiga-
tions regarding mineral dust content in the TALos Dome
ICE core (159�110E; 72�490S, East Antarctica, Victoria
Land), in which a coarse local fraction of dust was rec-
ognized. The characterization of Antarctic potential source
areas of atmospheric mineral dust is the first step to identify
the active sources of dust for the Talos Dome area and to
reconstruct the atmospheric pathways followed by air
masses in this region during different climatic periods.
Principal components analysis was used to identify ele-
ments and samples correlations; attention was paid spe-
cially to rare earth elements (REE) and incompatible/
compatible elements (ICE) in respect to iron, which proved
to be the most discriminating elemental groups. The ana-
lysis of REE and ICE concentration profiles supported
evidences of chemical weathering in ice-free areas of
Victoria Land, whereas cold and dry climate conditions of
the Talos Dome area and in general of East Antarctica.
Keywords INAA � Gamma spectrometry �Antartica � Ice core � Atmospheric dust sources �Multivariate analysis � PCA � REE � ICE
Introduction
Atmospheric mineral dust and climate are deeply linked:
climate changes modify production, transport and deposi-
tional processes of dust on different timescales, but dust
itself affects the climate, both directly and indirectly [1].
Climate archives, such as ice cores from polar regions,
revealed that Aeolian dust is a key proxy for past climate
variability [2]. Physical and chemical properties of mineral
aerosol in ice cores provide information about past atmo-
spheric circulation and paleo-environmental conditions at
the sources [3–5]. In this context one of the most important
scientific goal, concerns dust origin and source tracking,
which is essentially carried out by comparing the geo-
chemical, mineralogical and microphysical properties of
available material at the source areas with dust particles
entrapped in the cores [6].
This work stems from the need to track dust sources at
Talos Dome (159�110E; 72�490S), where a 250 kyr-old ice
core was drilled in the framework of the TALos Dome ICE
G. Baccolo � B. Delmonte � V. Maggi
Dipartimento di Scienze, Ambiente e Territorio e Scienze della
Terra, University of Milano-Bicocca, Milan, Italy
G. Baccolo � M. Clemenza (&) � V. Maggi � A. Motta �M. Nastasi � E. Previtali
INFN, Sezione di Milano-Bicocca, Milan, Italy
e-mail: [email protected]
C. Baroni � M. C. Salvatore
Dipartimento di Scienze della Terra, University of Pisa, Pisa,
Italy
C. Baroni
CNR, Istituto di Geoscienze e Georisorse, Pisa, Italy
M. Clemenza � A. Motta � M. Nastasi � E. Previtali
Dipartimento di Fisica, University of Milano-Bicocca, Milan,
Italy
123
J Radioanal Nucl Chem
DOI 10.1007/s10967-013-2851-x
Author's personal copy
(TALDICE) core drilling project [7]. Isotopic [8], magnetic
[9], microphysical and meteorological [10, 11] evidences
point towards a contribution of proximal high-altitude dust
sources of Victoria Land, that is likely mixed with dust
originating from the remote areas of the Southern Hemi-
sphere and with volcanic material probably remobilized
from different volcanic sources [11].
In order to characterize the elemental composition of
Antarctic PSA samples the elemental composition of 40
‘‘bulk’’ (Ø \ 1 mm) sediment samples from Victoria Land
was determined, opting for INAA technique because it
allows the determination of several elements in parallel,
ranging from the major elements to trace ones. Among the
different techniques usually adopted for multi-elemental
characterizations, as ICP-MS (inductively coupled plasma
mass spectrometry, [12]), PIXE or XRF (particle induced
X-ray emission, X-ray fluorescence, [13]), INAA requires a
reasonably reduced amount of sediment (\250 mg) for the
detection of several elements with very different concen-
trations without any sample dissolution or dilution. Due to
these important features INAA is one of the most common
techniques for the determination of the elemental compo-
sition in geological samples [14–18].
Samples description
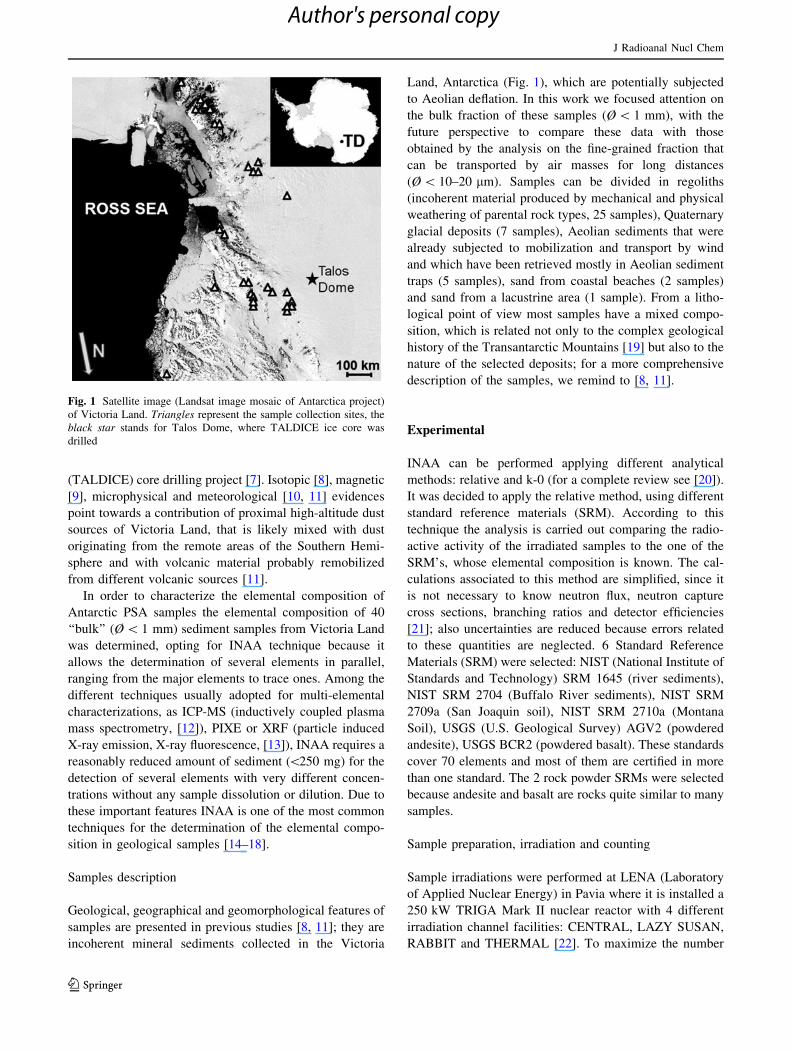
Geological, geographical and geomorphological features of
samples are presented in previous studies [8, 11]; they are
incoherent mineral sediments collected in the Victoria
Land, Antarctica (Fig. 1), which are potentially subjected
to Aeolian deflation. In this work we focused attention on
the bulk fraction of these samples (Ø \ 1 mm), with the
future perspective to compare these data with those
obtained by the analysis on the fine-grained fraction that
can be transported by air masses for long distances
(Ø \ 10–20 lm). Samples can be divided in regoliths
(incoherent material produced by mechanical and physical
weathering of parental rock types, 25 samples), Quaternary
glacial deposits (7 samples), Aeolian sediments that were
already subjected to mobilization and transport by wind
and which have been retrieved mostly in Aeolian sediment
traps (5 samples), sand from coastal beaches (2 samples)
and sand from a lacustrine area (1 sample). From a litho-
logical point of view most samples have a mixed compo-
sition, which is related not only to the complex geological
history of the Transantarctic Mountains [19] but also to the
nature of the selected deposits; for a more comprehensive
description of the samples, we remind to [8, 11].
Experimental
INAA can be performed applying different analytical
methods: relative and k-0 (for a complete review see [20]).
It was decided to apply the relative method, using different
standard reference materials (SRM). According to this
technique the analysis is carried out comparing the radio-
active activity of the irradiated samples to the one of the
SRM’s, whose elemental composition is known. The cal-
culations associated to this method are simplified, since it
is not necessary to know neutron flux, neutron capture
cross sections, branching ratios and detector efficiencies
[21]; also uncertainties are reduced because errors related
to these quantities are neglected. 6 Standard Reference
Materials (SRM) were selected: NIST (National Institute of
Standards and Technology) SRM 1645 (river sediments),
NIST SRM 2704 (Buffalo River sediments), NIST SRM
2709a (San Joaquin soil), NIST SRM 2710a (Montana
Soil), USGS (U.S. Geological Survey) AGV2 (powdered
andesite), USGS BCR2 (powdered basalt). These standards
cover 70 elements and most of them are certified in more
than one standard. The 2 rock powder SRMs were selected
because andesite and basalt are rocks quite similar to many
samples.
Sample preparation, irradiation and counting
Sample irradiations were performed at LENA (Laboratory
of Applied Nuclear Energy) in Pavia where it is installed a
250 kW TRIGA Mark II nuclear reactor with 4 different
irradiation channel facilities: CENTRAL, LAZY SUSAN,
RABBIT and THERMAL [22]. To maximize the number
Fig. 1 Satellite image (Landsat image mosaic of Antarctica project)
of Victoria Land. Triangles represent the sample collection sites, the
black star stands for Talos Dome, where TALDICE ice core was
drilled
J Radioanal Nucl Chem
123
Author's personal copy
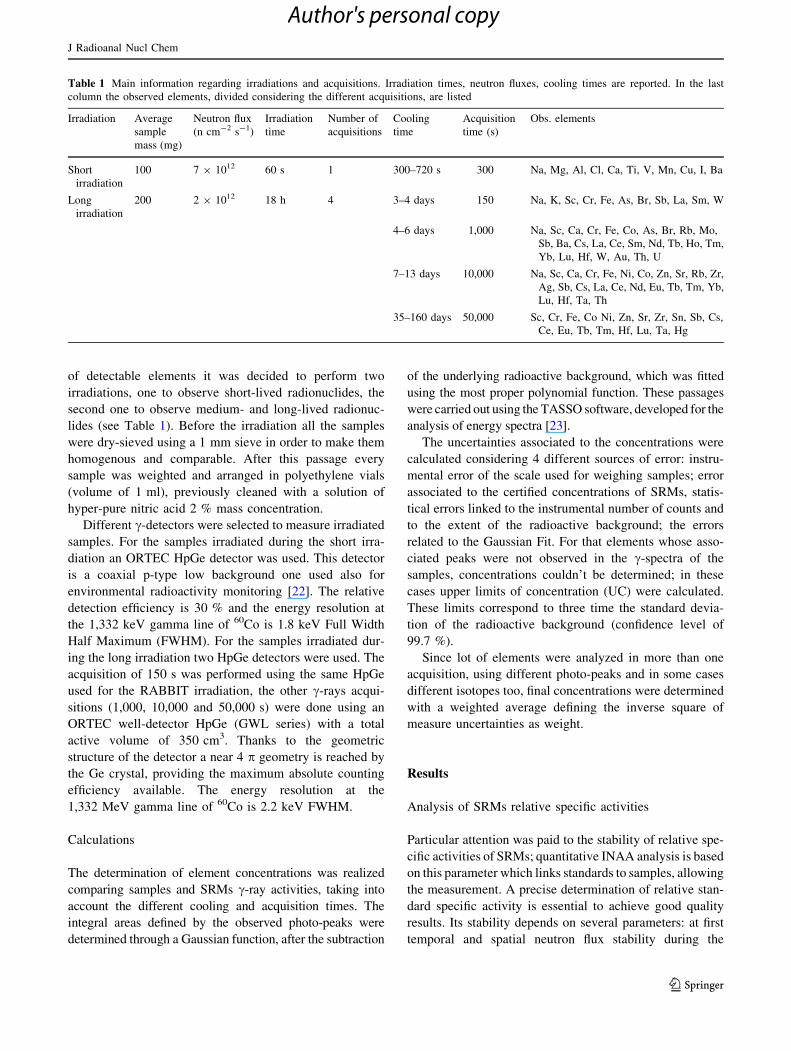
of detectable elements it was decided to perform two
irradiations, one to observe short-lived radionuclides, the
second one to observe medium- and long-lived radionuc-
lides (see Table 1). Before the irradiation all the samples
were dry-sieved using a 1 mm sieve in order to make them
homogenous and comparable. After this passage every
sample was weighted and arranged in polyethylene vials
(volume of 1 ml), previously cleaned with a solution of
hyper-pure nitric acid 2 % mass concentration.
Different c-detectors were selected to measure irradiated
samples. For the samples irradiated during the short irra-
diation an ORTEC HpGe detector was used. This detector
is a coaxial p-type low background one used also for
environmental radioactivity monitoring [22]. The relative
detection efficiency is 30 % and the energy resolution at
the 1,332 keV gamma line of 60Co is 1.8 keV Full Width
Half Maximum (FWHM). For the samples irradiated dur-
ing the long irradiation two HpGe detectors were used. The
acquisition of 150 s was performed using the same HpGe
used for the RABBIT irradiation, the other c-rays acqui-
sitions (1,000, 10,000 and 50,000 s) were done using an
ORTEC well-detector HpGe (GWL series) with a total
active volume of 350 cm3. Thanks to the geometric
structure of the detector a near 4 p geometry is reached by
the Ge crystal, providing the maximum absolute counting
efficiency available. The energy resolution at the
1,332 MeV gamma line of 60Co is 2.2 keV FWHM.
Calculations
The determination of element concentrations was realized
comparing samples and SRMs c-ray activities, taking into
account the different cooling and acquisition times. The
integral areas defined by the observed photo-peaks were
determined through a Gaussian function, after the subtraction
of the underlying radioactive background, which was fitted
using the most proper polynomial function. These passages
were carried out using the TASSO software, developed for the
analysis of energy spectra [23].
The uncertainties associated to the concentrations were
calculated considering 4 different sources of error: instru-
mental error of the scale used for weighing samples; error
associated to the certified concentrations of SRMs, statis-
tical errors linked to the instrumental number of counts and
to the extent of the radioactive background; the errors
related to the Gaussian Fit. For that elements whose asso-
ciated peaks were not observed in the c-spectra of the
samples, concentrations couldn’t be determined; in these
cases upper limits of concentration (UC) were calculated.
These limits correspond to three time the standard devia-
tion of the radioactive background (confidence level of
99.7 %).
Since lot of elements were analyzed in more than one
acquisition, using different photo-peaks and in some cases
different isotopes too, final concentrations were determined
with a weighted average defining the inverse square of
measure uncertainties as weight.
Results
Analysis of SRMs relative specific activities
Particular attention was paid to the stability of relative spe-
cific activities of SRMs; quantitative INAA analysis is based
on this parameter which links standards to samples, allowing
the measurement. A precise determination of relative stan-
dard specific activity is essential to achieve good quality
results. Its stability depends on several parameters: at first
temporal and spatial neutron flux stability during the
Table 1 Main information regarding irradiations and acquisitions. Irradiation times, neutron fluxes, cooling times are reported. In the last
column the observed elements, divided considering the different acquisitions, are listed
Irradiation Average
sample
mass (mg)
Neutron flux
(n cm-2 s-1)
Irradiation
time
Number of
acquisitions
Cooling
time
Acquisition
time (s)
Obs. elements
Short
irradiation
100 7 9 1012 60 s 1 300–720 s 300 Na, Mg, Al, Cl, Ca, Ti, V, Mn, Cu, I, Ba
Long
irradiation
200 2 9 1012 18 h 4 3–4 days 150 Na, K, Sc, Cr, Fe, As, Br, Sb, La, Sm, W
4–6 days 1,000 Na, Sc, Ca, Cr, Fe, Co, As, Br, Rb, Mo,
Sb, Ba, Cs, La, Ce, Sm, Nd, Tb, Ho, Tm,
Yb, Lu, Hf, W, Au, Th, U
7–13 days 10,000 Na, Sc, Ca, Cr, Fe, Ni, Co, Zn, Sr, Rb, Zr,
Ag, Sb, Cs, La, Ce, Nd, Eu, Tb, Tm, Yb,
Lu, Hf, Ta, Th
35–160 days 50,000 Sc, Cr, Fe, Co Ni, Zn, Sr, Zr, Sn, Sb, Cs,
Ce, Eu, Tb, Tm, Hf, Lu, Ta, Hg
J Radioanal Nucl Chem
123
Author's personal copy
irradiation, but also other ones like the sample position in
respect to the detector, sample shape and self-adsorption of
neutrons. Using different SRMs it was possible to monitor all
these parameters and to determine if measurements were
performed under the same conditions, assessing measure-
ments reproducibility. Comparing the relative specific
activities obtained from different standards and from dif-
ferent aliquots of the same SRM it was possible to verify this
point. Standard deviations associated to the relative specific
activities were always lower than 20 % for all the considered
c-energies.
The use of several SRMs was useful not only to monitor
measurements reproducibility, but also to reduce mea-
surements uncertainties. Using more than one SRM it is
possible to calculate the weighted average relative specific
activities. This allowed to reduce the errors associated to
the count rate fluctuations by a factor up to 5.
Elements observation and quantification
Gamma rays analysis allowed the observation of 11 ele-
ments for short-irradiated aliquots and 37 elements for
long-irradiated ones; since 3 elements were recognized in
both aliquots, a total of 45 elements were observed. For a
complete list of the observed elements see Table 1.
Quantification of these elements wasn’t successful for all
of them, some elements were discarded because they were
observed in only few samples (in less than 50 % of the
total). The rejected elements are: Cl, Cu, Br, Mo, Ag, I, Ho,
W, Au; all the remaining 36 elements were quantified.
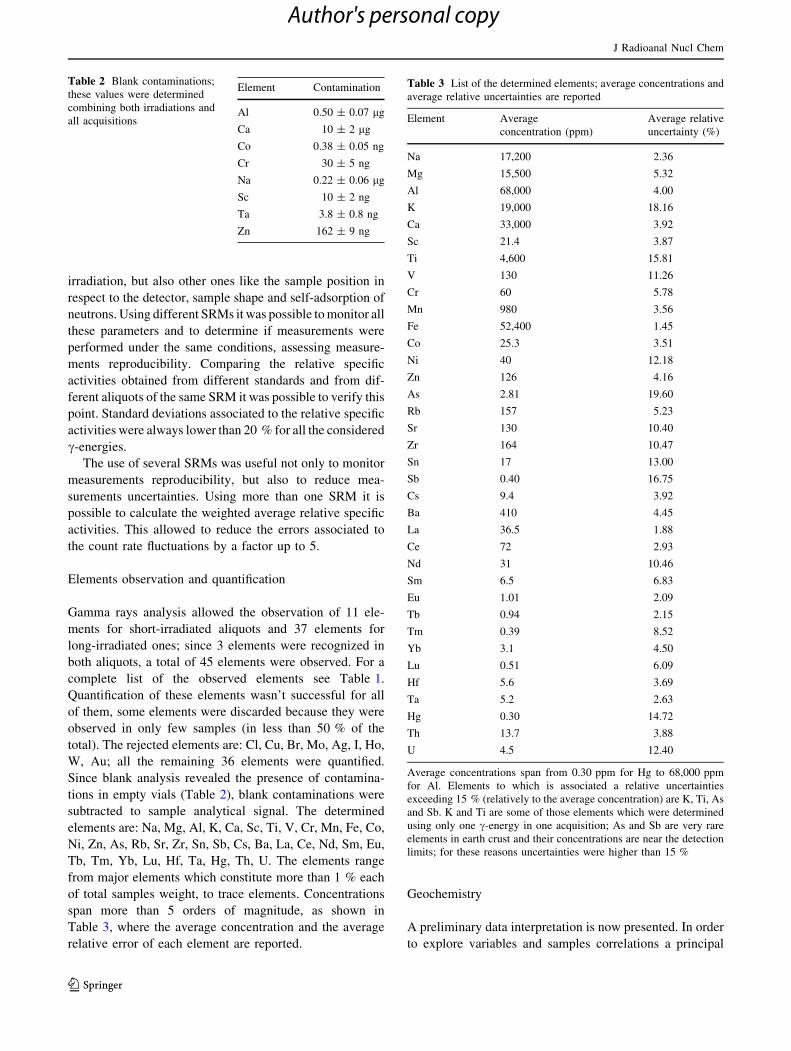
Since blank analysis revealed the presence of contamina-
tions in empty vials (Table 2), blank contaminations were
subtracted to sample analytical signal. The determined
elements are: Na, Mg, Al, K, Ca, Sc, Ti, V, Cr, Mn, Fe, Co,
Ni, Zn, As, Rb, Sr, Zr, Sn, Sb, Cs, Ba, La, Ce, Nd, Sm, Eu,
Tb, Tm, Yb, Lu, Hf, Ta, Hg, Th, U. The elements range
from major elements which constitute more than 1 % each
of total samples weight, to trace elements. Concentrations
span more than 5 orders of magnitude, as shown in
Table 3, where the average concentration and the average
relative error of each element are reported.
Geochemistry
A preliminary data interpretation is now presented. In order
to explore variables and samples correlations a principal
Table 2 Blank contaminations;
these values were determined
combining both irradiations and
all acquisitions
Element Contamination
Al 0.50 ± 0.07 lg
Ca 10 ± 2 lg
Co 0.38 ± 0.05 ng
Cr 30 ± 5 ng
Na 0.22 ± 0.06 lg
Sc 10 ± 2 ng
Ta 3.8 ± 0.8 ng
Zn 162 ± 9 ng
Table 3 List of the determined elements; average concentrations and
average relative uncertainties are reported
Element Average
concentration (ppm)
Average relative
uncertainty (%)
Na 17,200 2.36
Mg 15,500 5.32
Al 68,000 4.00
K 19,000 18.16
Ca 33,000 3.92
Sc 21.4 3.87
Ti 4,600 15.81
V 130 11.26
Cr 60 5.78
Mn 980 3.56
Fe 52,400 1.45
Co 25.3 3.51
Ni 40 12.18
Zn 126 4.16
As 2.81 19.60
Rb 157 5.23
Sr 130 10.40
Zr 164 10.47
Sn 17 13.00
Sb 0.40 16.75
Cs 9.4 3.92
Ba 410 4.45
La 36.5 1.88
Ce 72 2.93
Nd 31 10.46
Sm 6.5 6.83
Eu 1.01 2.09
Tb 0.94 2.15
Tm 0.39 8.52
Yb 3.1 4.50
Lu 0.51 6.09
Hf 5.6 3.69
Ta 5.2 2.63
Hg 0.30 14.72
Th 13.7 3.88
U 4.5 12.40
Average concentrations span from 0.30 ppm for Hg to 68,000 ppm
for Al. Elements to which is associated a relative uncertainties
exceeding 15 % (relatively to the average concentration) are K, Ti, As
and Sb. K and Ti are some of those elements which were determined
using only one c-energy in one acquisition; As and Sb are very rare
elements in earth crust and their concentrations are near the detection
limits; for these reasons uncertainties were higher than 15 %
J Radioanal Nucl Chem
123
Author's personal copy
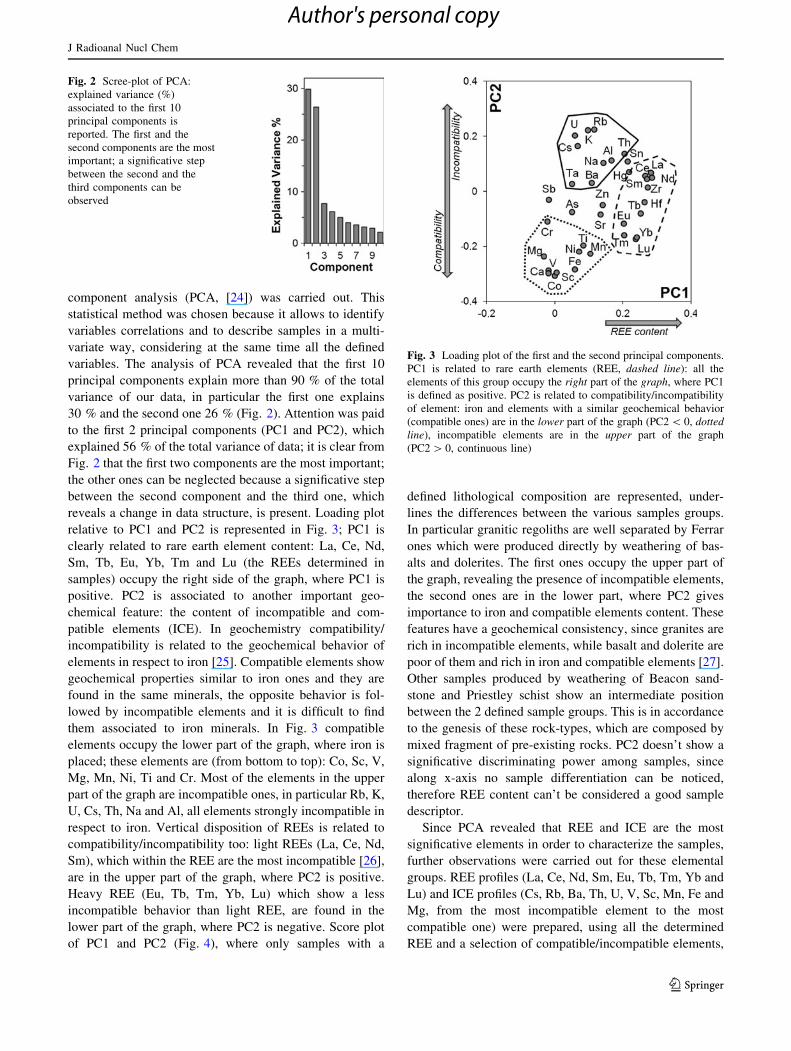
component analysis (PCA, [24]) was carried out. This
statistical method was chosen because it allows to identify
variables correlations and to describe samples in a multi-
variate way, considering at the same time all the defined
variables. The analysis of PCA revealed that the first 10
principal components explain more than 90 % of the total
variance of our data, in particular the first one explains
30 % and the second one 26 % (Fig. 2). Attention was paid
to the first 2 principal components (PC1 and PC2), which
explained 56 % of the total variance of data; it is clear from
Fig. 2 that the first two components are the most important;
the other ones can be neglected because a significative step
between the second component and the third one, which
reveals a change in data structure, is present. Loading plot
relative to PC1 and PC2 is represented in Fig. 3; PC1 is
clearly related to rare earth element content: La, Ce, Nd,
Sm, Tb, Eu, Yb, Tm and Lu (the REEs determined in
samples) occupy the right side of the graph, where PC1 is
positive. PC2 is associated to another important geo-
chemical feature: the content of incompatible and com-
patible elements (ICE). In geochemistry compatibility/
incompatibility is related to the geochemical behavior of
elements in respect to iron [25]. Compatible elements show
geochemical properties similar to iron ones and they are
found in the same minerals, the opposite behavior is fol-
lowed by incompatible elements and it is difficult to find
them associated to iron minerals. In Fig. 3 compatible
elements occupy the lower part of the graph, where iron is
placed; these elements are (from bottom to top): Co, Sc, V,
Mg, Mn, Ni, Ti and Cr. Most of the elements in the upper
part of the graph are incompatible ones, in particular Rb, K,
U, Cs, Th, Na and Al, all elements strongly incompatible in
respect to iron. Vertical disposition of REEs is related to
compatibility/incompatibility too: light REEs (La, Ce, Nd,
Sm), which within the REE are the most incompatible [26],
are in the upper part of the graph, where PC2 is positive.
Heavy REE (Eu, Tb, Tm, Yb, Lu) which show a less
incompatible behavior than light REE, are found in the
lower part of the graph, where PC2 is negative. Score plot
of PC1 and PC2 (Fig. 4), where only samples with a
defined lithological composition are represented, under-
lines the differences between the various samples groups.
In particular granitic regoliths are well separated by Ferrar
ones which were produced directly by weathering of bas-
alts and dolerites. The first ones occupy the upper part of
the graph, revealing the presence of incompatible elements,
the second ones are in the lower part, where PC2 gives
importance to iron and compatible elements content. These
features have a geochemical consistency, since granites are
rich in incompatible elements, while basalt and dolerite are
poor of them and rich in iron and compatible elements [27].
Other samples produced by weathering of Beacon sand-
stone and Priestley schist show an intermediate position
between the 2 defined sample groups. This is in accordance
to the genesis of these rock-types, which are composed by
mixed fragment of pre-existing rocks. PC2 doesn’t show a
significative discriminating power among samples, since
along x-axis no sample differentiation can be noticed,
therefore REE content can’t be considered a good sample
descriptor.
Since PCA revealed that REE and ICE are the most
significative elements in order to characterize the samples,
further observations were carried out for these elemental
groups. REE profiles (La, Ce, Nd, Sm, Eu, Tb, Tm, Yb and
Lu) and ICE profiles (Cs, Rb, Ba, Th, U, V, Sc, Mn, Fe and
Mg, from the most incompatible element to the most
compatible one) were prepared, using all the determined
REE and a selection of compatible/incompatible elements,
Fig. 2 Scree-plot of PCA:
explained variance (%)
associated to the first 10
principal components is
reported. The first and the
second components are the most
important; a significative step
between the second and the
third components can be
observed
Fig. 3 Loading plot of the first and the second principal components.
PC1 is related to rare earth elements (REE, dashed line): all the
elements of this group occupy the right part of the graph, where PC1
is defined as positive. PC2 is related to compatibility/incompatibility
of element: iron and elements with a similar geochemical behavior
(compatible ones) are in the lower part of the graph (PC2 \ 0, dotted
line), incompatible elements are in the upper part of the graph
(PC2 [ 0, continuous line)
J Radioanal Nucl Chem
123
Author's personal copy

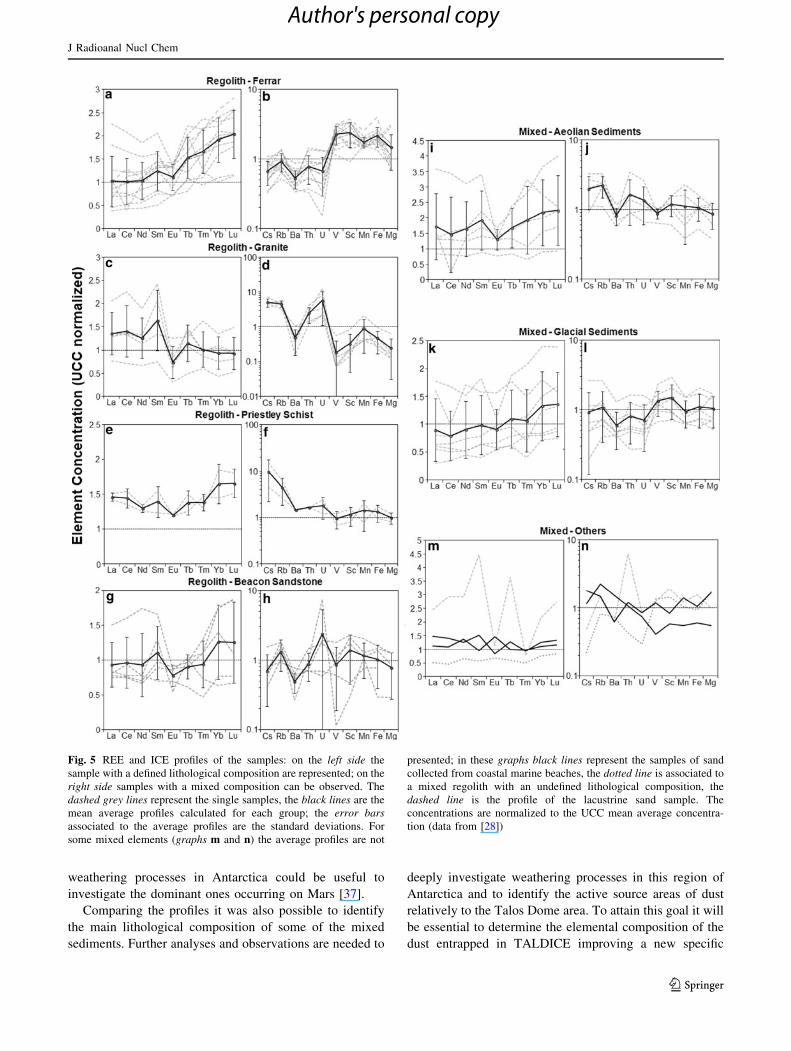
considering the results of PCA; all concentrations were
normalized to the upper continental crust mean average
concentrations (UCC, data from [28]). In Fig. 5 are pre-
sented the profiles of the samples. Ferrar-regoliths and
granite-regoliths show opposite behaviors (graphs a, b, c, d
Fig. 5): Ferrar regoliths are enriched in heavy REE and
compatible elements, granite-regoliths show high concen-
trations of light REE and incompatible elements, with the
exception of Ba, which is highly depleted if compared to
the other incompatible elements. These features are in
accordance with the geochemistry of granite and mafic
rocks like the Ferrar ones. Comparing the profiles of the
glacial sediments (graphs k, l Fig. 5) to the ones of Ferrar-
regoliths some similarities can be recognized: both show an
enrichment in the heavy REE and in compatible elements
and a depletion in light REE and in incompatible elements.
Probably this reflects the composition of the glacial sedi-
ments, which is dominated by the presence of Ferrar rocks
fragments. The identification of the main lithology in the
composition of the Aeolian sediments (graph i, j Fig. 5)
can’t be carried out: the profiles are highly enriched in
heavy REE (as the Ferrar-regoliths) and in incompatible
elements (as the granite-regoliths). The irregular patterns
characterizing these samples could be associated to a well-
mixed composition, in accordance with their genesis. The 2
Priestley Schist-regoliths (graphs e, f Fig. 5) are generally
enriched in REE and in very incompatible elements (Cs
and Rb), while significative features and evident patterns
can’t be found observing the Beacon sandstone-regoliths
profiles (graphs g, h, Fig. 5). The two sands from coastal
marine beaches and the mixed regolith doesn’t exhibit
significative variations in relation to the UCC mean con-
centrations, while this is the case of the lacustrine sand
(graphs m, n, Fig. 5).
Some of the features recognized in the profiles can be
associated to chemical weathering processes: Priestley
Schist-regoliths and Aeolian sediments show an enrich-
ment of REE in respect to the UCC and an Eu negative
anomaly. These features could be related to the mobiliza-
tion of the most mobile elements, which increase the rel-
ative abundance of REE in respect to the other elements
[29, 30]; also the Eu anomaly could be explained by
chemical processes affecting the samples [29]. Also the Ba
negative anomaly which is observed in the Beacon sand-
stone-regoliths and in the Aeolian sediments could be an
indication of chemical weathering [31].
Conclusions
Elemental composition, determined through INAA, of 40
samples of incoherent sediments (Ø \ 1 mm) collected
from ice-free areas of Victoria Land (Antarctica) is pre-
sented. The determined elements range from major ele-
ments (Al, Fe, Ca, K, Na, Mg, Ti and Mn) to trace
elements, including 9 of the 15 lanthanides. INAA proved
to be one of the most powerful analytical technique for the
determination of element concentrations in geological
samples, allowing at the same time the determination of
elements whose concentrations ranges from 10-1 to
105 ppm.
The combined use of PCA and concentrations profiles
allowed to recognize patterns, relationships and differences
among the samples. In order to characterize and divide the
samples, REE and ICE proved to be the most significative
elemental groups. A first geochemical characterization
focused the attention to these groups; it revealed some
evidences for chemical weathering, specially related to the
REE content. This is an important point since it is generally
presumed that chemical weathering is not significative in
cold and dry climate, as the Antarctic one, although pro-
ducts of chemical weathering are well documented both in
soils in the Victoria Land [32–34] and in ancient glacial
deposits [35]. Our geochemical evidences, which reveal an
active and recent chemical alteration in the Victoria Land,
confirm the incomplete and immature weathering processes
at work in the Dry Valleys region, despite the extremely
cold and dry climate [36]. Environmental and climatic
condition of East Antarctica can be considered analog to
Martian ones, for this reason the investigation of
Fig. 4 Score plot of the first 2 principal components. Not all samples
are represented, the ones reported are those whose lithological
composition is known. Triangles represent granitic regoliths; squares
represent regoliths produced by weathering of Ferrar rocks; circles
represent regoliths produced by weathering of Beacon sandstone;
crosses represent regoliths produced by weathering of Priestley schist.
Two fields are showed: the one defined by granitic regoliths (upper
part of the graph) and the one defined by Ferrar samples (lower part
of the graph). The 2 fields are well separated along PC2, which is
related to geochemical compatibility/incompatibility of elements;
they are not discerned by PC1
J Radioanal Nucl Chem
123
Author's personal copy
weathering processes in Antarctica could be useful to
investigate the dominant ones occurring on Mars [37].
Comparing the profiles it was also possible to identify
the main lithological composition of some of the mixed
sediments. Further analyses and observations are needed to
deeply investigate weathering processes in this region of
Antarctica and to identify the active source areas of dust
relatively to the Talos Dome area. To attain this goal it will
be essential to determine the elemental composition of the
dust entrapped in TALDICE improving a new specific
Fig. 5 REE and ICE profiles of the samples: on the left side the
sample with a defined lithological composition are represented; on the
right side samples with a mixed composition can be observed. The
dashed grey lines represent the single samples, the black lines are the
mean average profiles calculated for each group; the error bars
associated to the average profiles are the standard deviations. For
some mixed elements (graphs m and n) the average profiles are not
presented; in these graphs black lines represent the samples of sand
collected from coastal marine beaches, the dotted line is associated to
a mixed regolith with an undefined lithological composition, the
dashed line is the profile of the lacustrine sand sample. The
concentrations are normalized to the UCC mean average concentra-
tion (data from [28])
J Radioanal Nucl Chem
123
Author's personal copy

analytical procedure. Another important point which
should be investigated is the elemental grain-size depen-
dent fractionation: this work was concerned on bulk sedi-
ments (Ø \ 1 mm); it would be interesting to determine
the composition of the finer fraction of the sediments
(Ø \ 10–20 lm), which is the one actually deflated and
transported by the wind to the Talos Dome area.
Acknowledgments Our sincere thanks to the Staff of the Labora-
tory of Nuclear Applied Energy (LENA) of the University of Pavia.
References
1. Maher BA, Prospero JM, Mackie D, Gaiero D, Hesse PP, Bal-
kanski Y (2010) Global connections between aeolian dust, cli-
mate and ocean biogeochemistry at the present day and at the last
glacial maximum. Earth Sci Rev 99:61–97
2. Lambert F, Delmonte B, Petit JR, Bigler M, Kaufmann PR,
Hutterli MA, Stocker TF, Ruth U, Steffensen JP, Maggi V (2008)
Dust-climate couplings over the past 800.000 years from the
EPICA Dome C ice core. Nature 452:616–619
3. Petit JR, Jouzel RaynaudD, Barkov NI, Barnola JM, Basile I,
Bender M, Chappellaz J, Davis M, Delaygue G, Delmotte V,
Kotlyakov VM, Legrand M, Lipenkov VY, Lorius C, Pepin L,
Ritz C, Saltzman E, Stievenard M (1999) Climate and atmo-
spheric history of the past 420,000 years from the Vostok ice
core, Antarctica. Nature 399:429–436
4. EPICA community members (2004) Eight glacial cycles from an
Antarctic ice core. Nature 429:623–628
5. Yung YL, Lee T, Wang CH, Shieh YT (1996) Dust: a diagnostic
of the hydrologic cycle during the last glacial maximum. Science
271:962–963
6. Grousset FE, Biscaye PE (2005) Tracing dust sources and
transport patterns using Sr, Nd and Pb isotopes. Chem Geol
222:149–167
7. Frezzotti M, Bitelli G, De Michelis P, Deponti A, Forieri A,
Gandolfi S, Maggi V, Mancini F, Remy F, Tabacco I, Urbini S,
Vittuari L, Zirizzotti A (2004) Geophysical survey at Talos
Dome, East Antarctica: the search for a new deep-drilling site.
Ann Glaciol 39:423–432
8. Delmonte B, Baroni C, Andersson PS, Shoberg H, Hansson M,
Aciego S, Petit JR, Albani S, Mazzola C, Maggi V, Frezzotti M
(2010) Aeolian dust in the Talos Dome ice core (East Antarctica,
Pacific/Ross Sea sector): Victoria Land versus remote sources
over the last two climatic cycle. J Quat Sci 25:1327–1337
9. Lanci L, Delmonte B (2013) Magnetic properties of aerosol dust
in peripheral and inner Antarctic ice cores as a proxy for dust
provenance. Global Planet Change. doi:http://dx.doi.org/10.1016/
j.gloplacha.2013.05.003
10. Albani S, Delmonte B, Maggi V, Baroni C, Petit JR, Stenni B,
Mazzola C, Frezzotti M (2012) Interpreting last glacial to
Holocene dust changes at Talos Dome (East Antarctica): impli-
cations for atmospheric variations from regional to hemispheric
scales. Clim Past 8:741–750
11. Delmonte B, Baroni C, Andersson PS, Narcisi B, Salvatore MC,
Petit JR, Scarchilli C, Frezzotti M, Albani S, Maggi V (2013)
Modern and Holocene aeolian dust variability from Talos Dome
(Northern Victoria Land) to the interior of the Antarctic ice sheet.
Quat Sci Rev 64:76–89
12. Jenner GA, Longerich HP, Jackson SE, Fryer BJ (1990) ICP-
MS—a powerful tool for high-precision trace-element analysis in
Earth sciences: evidence from analysis of selected U.S.G.S. ref-
erence samples. Chem Geol 83:133–148
13. Benyaich F, Makhtari A, Torrisi L, Foti G (1997) PIXE and XRF
comparison for applications to sediment analysis. Nucl Instrum
Meth B 132:481–488
14. Madaro M, Moauro A (1987) Trace element determination in
rocks and sediments by neutron activation analysis. J Radioanal
Nucl Ch 114:337–343
15. Mahaney WC, Hancock RGV, Stalker AM (1994) Geochemical
and physical analysis of the bedrock formations and lowest tills at
the Wellsch Valley Site, Saskatchewan, Canada. J Radioanal
Nucl Ch 180:5–13
16. Lara LBLS, Fernandes EAN, Oliveira H, Bacchi MA, Ferraz ESB
(1997) Amazon estuary—assessment of trace elements in seabed
sediments. J Radioanal Nucl Ch 216:279–284
17. Joron JL, Treuil M, Raimbault L (1997) Activation analysis as a
geochemical tool: statement of its capabilities for geochemical
trace element studies. J Radioanal Nucl Ch 216:23–229
18. Randle K, Al-Jundi J (2001) Instrumental neutron activation
analysis (INAA) of estuarine sediments. J Radioanal Nucl Ch
249:361–367
19. Faure G, Mensing TM (2011) The Transantarctic Mountains:
rocks, ice, meteorites and water. Springer, London
20. Greenberg RR, Bode P, De Nadai Fernades EA (2011) Neutron
activation analysis: a primary method of measurement. Spectro-
chim Acta B 66:193–241
21. Nadkarni RA, Morrison GH (1978) Use of standard reference
materials as multielement irradiation standards in neutron acti-
vation analysis. J Radioanal Nucl Ch 43:347–369
22. Borio di Tigliole A, Cammi A, Clemenza M, Memoli V, Patta-
vina L, Previtali E (2010) Benchmark evaluation of reactor
critical parameters and neutron fluxes distributions at zero power
for the TRIGA Mark II reactor of the University of Pavia using
the Monte Carlo code MCNP. Prog Nucl Energy 52:494–502
23. Clemenza M, Fiorini E, Previtali E, Sala E (2012) Measurement
of airborne 131I, 134Cs and 137Cs due to the Fukushima reactor
incident in Milan (Italy). J Environ Radioactiv 114:113–118
24. Abdi H, Williams LJ (2010) Principal component analysis.
Comput Stat 2:433–459
25. Faure G (1998) Principles and applications of geochemistry.
Prentice Hall, New Jersey
26. Henderson P (1984) Rare earth element geochemistry. Elsevier,
Amsterdam
27. Taylor SR, McLennan SM (1985) The continental crust: its com-
position and evolution. Blackwell Scientific Publications, Oxford
28. Rudnick RL, Gao S (2003) The composition of the continental
crust. In: Rudnick RL (ed) The Crust, vol 3. Elsevier-Pergamon,
Oxford, pp 1–64
29. Condie KC, Dengate J, Cullers RL (1995) Behavior of rare earth
elements in a paleoweathering profile on granodiorite in the Front
Range, Colorado, USA. Geochim Cosmochim Acta 59:279–294
30. Nesbitt HW, Markcovicz G (1997) Weathering of granodioritic
crust, long-term storage of elements in weathering profiles, and
petrogenesis of siliciclastic sediments. Geochim Cosmochim
Acta 61:1653–1670
31. Price RG, Gray CM, Wilson RE, Frey FA, Taylor SR (1991) The
effects of weathering on rare-earth element, Y and Ba abundances
in Tertiary basalts from southeastern Australia. Chem Geol
93:245–265
32. Campbell IB, Claridge CGC (1987) Antarctica: soils, weathering
processes and environment. Elsevier, Amsterdam
33. Ugolini FC, Bockheim JG (2008) Antarctic soils and soil for-
mation in a changing environment: a review. Geoderma 144:1–8
34. Bockheim JG (2013) Soil formation in the Transantarctic
Mountains from the Middle Paleozoic to the Antropochene.
Palaeogeogr Palaeocl 381–382:10–98
J Radioanal Nucl Chem
123
Author's personal copy

35. Baroni C, Fasano F, Giorgetti G, Salvatore MC, Ribecai C (2008)
The Ricker Hills Tillite provides evidence of Oligocene warm-
based glaciation in Victoria Land, Antarctica. Glob Planet Chang
60:457–470
36. Salvatore MR, Mustard JF, Head JW, Cooper RF, Marchant DR,
Wyatt MB (2013) Development of alteration rinds by oxidative
weathering processes in Beacon Valley, Antarctica, and impli-
cations for Mars. Geochim Cosmochim Ac 115:137–161
37. Marchant DR, Head WH (2007) Antarctic dry valleys: micro-
climate zonation, variable geomorphic processes, and implica-
tions for assessing climate change on Mars. Icarus 192:187–222
J Radioanal Nucl Chem
123
Author's personal copy
Copyright © 2022 FDOKUMEN