Ecap Consolidation and Heat Treatment of Blended Elemental ...
Archaeometry
46
,
1 (2004) 85–101. Printed in Great Britain
© University of Oxford, 2004
Blackwell Publishing LtdOxford, UKARCHArchaeometry0003-813X© University of Oxford, 2004February 20044611000Original Articles
Post-depositional elemental alterations in potteryA. Schwedt, H. Mommsen and N. Zacharias
POST-DEPOSITIONAL ELEMENTAL ALTERATIONSIN POTTERY: NEUTRON ACTIVATION ANALYSES
OF SURFACE AND CORE SAMPLES
*
A. SCHWEDT, H. MOMMSEN and N. ZACHARIAS†
Helmholtz-Institut für Strahlen- und Kernphysik, Universität Bonn, Nussallee 14–16, D-53115 Bonn, Germany
From 38 sherds with ‘corroded’ surfaces, two samples per sherd were examined usingNeutron Activation Analysis, one from the surface and one from the core of each sherd, inorder to analyse post-depositional alterations of minor and trace elements. The most strikingeffect was that a leaching of Ca could be found at the surface. Another group of elements thatis severely affected are the alkali metals, with Cs and Rb showing the strongest changes. A thirdconspicuous group of elements are the Rare Earth Elements. Finally, the effect of such alterationson a statistical data evaluation to classify pottery according to provenance is investigated.
KEYWORDS:
POST-DEPOSITIONAL ALTERATION, POTTERY, NEUTRONACTIVATION ANALYSIS, COMPOSITIONAL DATA, TRACE ELEMENTS,ALKALI METALS, RARE EARTH ELEMENTS, STATISTICAL GROUPING
INTRODUCTION
The question of whether the chemical composition of ancient pottery is preserved during itsburial in the soil is of major interest for the archaeometric field of provenancing, as knowledgeabout post-depositional alteration mechanisms may help to avoid misassignments when classify-ing chemical data. Such alteration processes have been investigated in the past, basically by threedifferent approaches.
The most common approach has been that of comparative studies. Samples are analysedwhich, for archaeological reasons, are regarded as the products of a single workshop. If differencesin the composition are observed, these are considered to be the results of alteration processes.
Examples of this approach are provided by, for example, Picon (1976, 1991), Franklin andHancock (1980), Lemoine
et al.
(1981), Rottländer (1981, 1989), Buxeda (1999) and Buxeda
et al.
(2001). The dependency on the archaeological hypothesis, however, makes this approachrisky—even if the assumption of a common origin is true, the potter might have changed hisrecipe for the production of the clay paste in the course of time, which would result in differ-ent ‘chemical fingerprints’ within the same workshop. Thus an observed deviation within thedata sets need not necessarily be evidence for post-depositional alteration of the sherd.
Another approach has been made by simulation experiments. Laboratory test samples ofknown compositions are treated with different solutions under varying experimental condi-tions for up to several years. If, finally, the treated samples deviate in composition from theinitial samples, these changes are also thought to be possible in natural alteration processes.Examples of this approach can be found in, for example, Hedges and McLellan (1976),Segebade and Lutz (1980) or Tubb
et al.
(1980). The uncertainty of this approach, however, is
* Received 10 July 2002; accepted 11 November 2002.† Present address: Institute of Materials Science, N.C.S.R. Demokritos, Aghia Paraskevi, 15310 Attiki, Greece.
86
A. Schwedt, H. Mommsen and N. Zacharias
the unanswered question of whether the conditions of a comparatively short-lived experimentcan be compared to the actual situation of being buried for hundreds, or perhaps thousands, ofyears in natural soils.
An approach that avoids the problems mentioned above, and that is used in this paper, isthat of profile or surface-core measurements. Several samples are taken from an ancient sherdthat actually
was
buried in a natural soil for several thousand years. As the complete sherd canbe assumed to have been produced from one well-homogenized paste, the initial compositionsof all of the samples were identical. If the samples closer to the surface of the sherd now showa different composition compared to the samples from the core, this difference is direct evid-ence for alteration during the period of burial.
Besides these advantages, profile measurements also bear new possible risks. First, sherdsmay have been washed after the excavation, sometimes with slightly acidic solutions. Accord-ing to Schneider
et al.
(1991, fig. 4a) and Schneider (private communication), however, thiswashing has a negligible effect on the sherd. On the other hand, the sherd might have beencovered with a slip. Both problems can be avoided by removing the topmost part of the surfacebefore the analysis.
Another possible cause of concentration gradients within a sherd could be a migration ofelements within the sherd during the firing. However, a second series of profile measurements(to be published) also comprised sherds that had been fired at different temperatures. Nogradient is evident in the measured elements, and so this possibility can be excluded.
In general, profile measurements have rarely been reported in the literature, and in most suchcases only major elements have been measured. Examples of this approach can be found in,for example, Picon (1976, 1991), Dufournier (1979), Tubb
et al.
(1980), Lemoine
et al.
(1981)and Freestone
et al.
(1985).
SAMPLES AND ANALYTICAL TECHNIQUES
The idea behind this work was conceived during a sampling campaign in Greece, in 1995.Whenever a sherd was found to look corroded—that is, to have a soft or brittle surface—twosamples were taken using a pointed corundum drill: one from a part close to the surface, afterremoval of the topmost part of the sherd with a corundum scraper (see above); and a secondone from the core of the sherd, drilling at the same spot but deeper into the sherd.
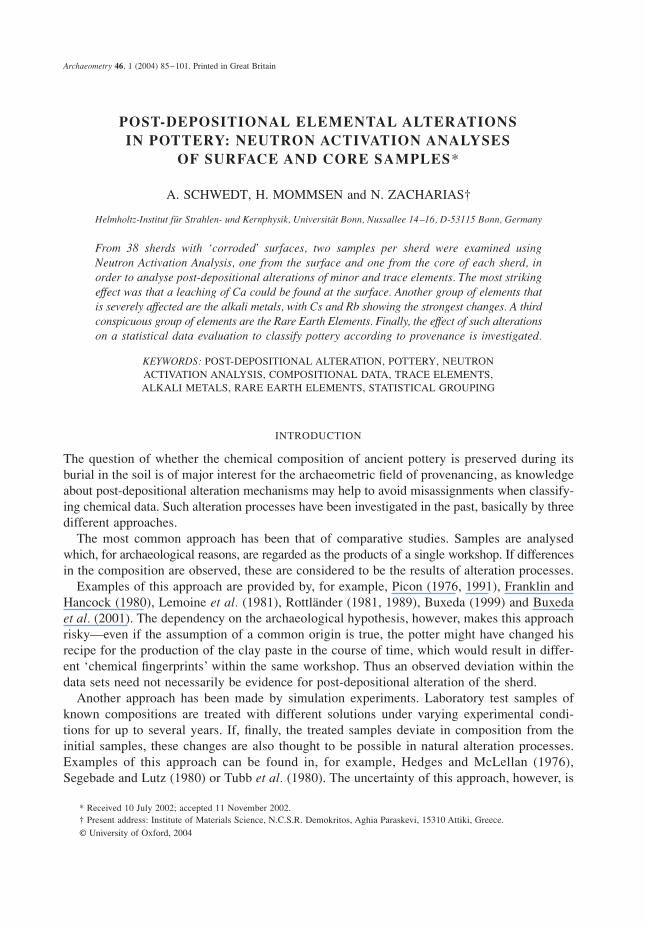
A total of 38 sherds from 17 different sites were sampled in this way. Most of the sherds arefragments of Mycenean vessels found on the Peloponnese (cf., Fig. 1). Additionally, one sherdfrom Rhodes, one from mainland Greece, one from Aegina and four from medieval or post-medieval sites in Germany have been included in the study.
All of the samples were analysed using Neutron Activation Analysis (NAA; for the experi-mental specifications, see Mommsen
et al.
1991). Usually, both the surface sample and thecore sample were irradiated in the same ‘run’ to avoid batch differences between possibly dif-ferent irradiation conditions. The results are given in the Appendix. If enough powder was leftafter the NAA, X-ray diffractometry (XRD) was performed, using a Philips PW 1130 diffrac-tometer and Cu–K
α
radiation (
λ
=
1.541838 Å) in the range of 6–50
°
2
θ
.
DATA TREATMENT
It is evident that the selection of samples described above comprises products from many dif-ferent workshops; in other words, the samples are members of many different chemical

Post-depositional elemental alterations in pottery
87
groups. Thus the obtained concentrations
c
can only be used to compare the surface sample andthe corresponding core sample. To go one step further, and to find trends of alteration withinthe complete data set, only the degree of alteration expressed as the change in the relative(weight-)concentration between the surface sample and the core sample, (
c
Surface
– c
Core
)/
c
Core
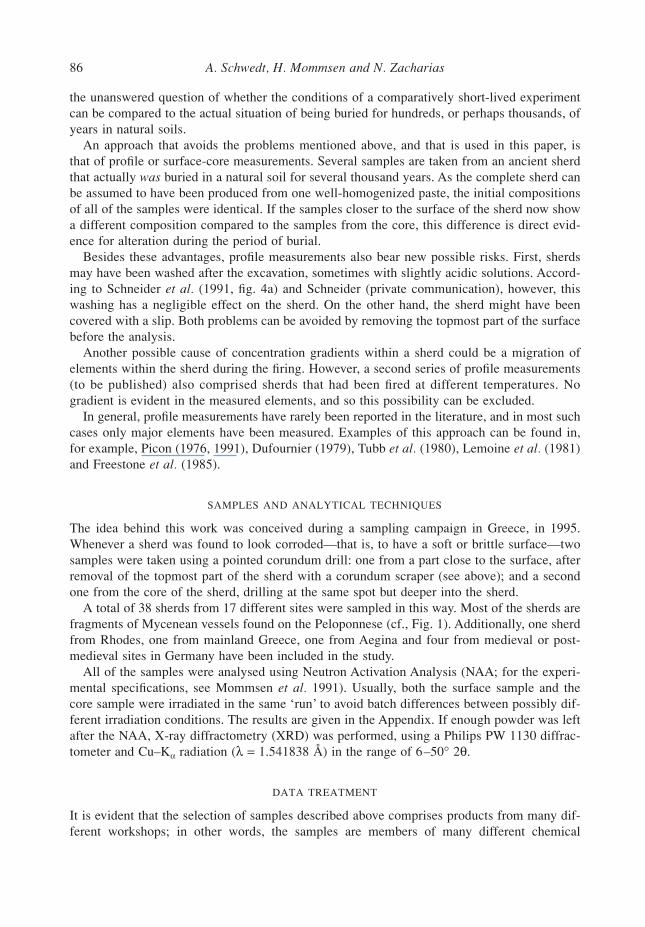
,can be used. Some examples of typical results of this comparison between the surface sampleand the core sample are given in Fig. 2. The relative change is plotted for every element. Theerrors result from counting statistics via error propagation.
Ialy 95 (Fig. 2, top) represents the case in which no significant changes in the elemental pat-tern could be found between the surface sample and the core sample. Although Ni, Ti and Zrgive values that are far from zero, their statistical error is so large that zero is no more distant
Figure 1 A map of the sites in Greece where the sampled sherds were found: Golemi (Pole), Chalandritsa (Chal), Agia Triada/Elis (TriaE), Palaeokastro (Palt), Agios Konstantinos (AgKo), Aegina Kolonna (AegiK), Pellana (Pell), Melathria Skoura (Mela), Epidavros Limera (EpiL), Chalkias/Messenia (ChalM), Diodia (Diod) and Kaplani (Kapl). Samples outside the area of the map have been found in Ialysos, Rhodes (Ialy), and in Germanyat Siegburg (Sieg) and Pingsdorf (Ping), both in the Rhineland area, at Hohenleipisch, Brandenburg (Hhlp), andin Zittau, Saxony (Zitt).

88
A. Schwedt, H. Mommsen and N. Zacharias
than twice the statistical error. These three elements and Ca can be measured in Bonn onlywith large errors, because a change in the core of the Geesthacht reactor has recently reducedthe flux of fast neutrons, which were necessary for interaction with these elements via nuclearreactions.
Another case is represented by Diod 1 (Fig. 2, centre). Here, nearly all of the measured ele-ments show increased concentrations at the surface: only the concentration of Ca is about 38%lower in the surface sample (2.9%) than in the core sample (4.7%). The uniform increase ofthe other concentrations has been estimated over an average quotient of seven well-measuredelements (Ce, La, Sc, Sm, Ta, Th and Yb). These are about 11% higher at the surface than in
Figure 2 Examples of results from the comparison between the surface sample and the core sample (cf., text). Top, a sherd without changes (Ialy 95); centre, the leaching of a major element and its effect on trace element concentrations (Diod 1); bottom, a sherd with various changes (Palt 6).
Post-depositional elemental alterations in pottery
89
the core sample (solid line). If we now assume that Ca was initially homogeneously distributedwithin the sherd, and that the lower concentration at the surface is the result of a leachingprocess, this would automatically result in a uniform increase of all of the other elements: theleaching of Ca reduces the total amount of material in the sample. Thus the percentage of anelement with an unchanged absolute amount would be increased just by the reduction of thetotal amount (the ‘constant sum problem’; cf., Rollinson 1993, 37ff.). If we further assumethat the Ca is not leached only as Ca, but as CaCO
3
, we can calculate the effect of this leachingon the other concentrations to be about 5% (dashed line). Thus, also considering the errors, thediagram for Diod 1 can be explained by leaching of calcite as the major process, while the othermeasured elements remain more or less unchanged.
The results for the vast majority of cases, however, can be represented by Palt 6 (Fig. 2,bottom). Again, the solid line marks the average increase, but the elements scatter to quite someextent around this value. In the surface sample, many elements have changed in various ways.
TRENDS IN THE WHOLE DATA SET
In order to find general trends, the behaviour of the whole data set was examined statistically.The results for elements with a special kind of behaviour are presented here.
Ca
The majority of the samples (29 out of 38) show lower Ca concentrations at the surface (cf.,Fig. 3, left). As mentioned above, in recent times it has only been possible to measure Ca witha large statistical error. However, the data for the sherds with reduced Ca at the surface wererecorded before the change in the reactor and so their statistical errors are small, whereas forthe samples with higher Ca concentrations at the surface the errors are large. In the right-handpart of Fig. 3, the relative change divided by its error is plotted. The values of the relativechange are, at a maximum, twice the statistical error above zero, but go down to 21 times thestatistical error below zero. Thus, in spite of the Ca measurements with partly large errors, thedecreased concentrations at the surfaces of the majority of the samples have to be consideredas real.
Connected with a change in Ca is also one case in which enough powder was left to performXRD on both the surface sample and the core sample. The diffractograms for samples Palt 30and Palt 30s after background correction are shown in Fig. 4. In the core sample (black line)calcite (CaCO
3
) can be found, whereas in the surface sample (grey line) almost no calcite isleft. This corresponds to the chemical data for Ca, with about 15% in the core sample and 4%in the surface sample. Thus, the chemical data show that Ca is leached out at the surface, andthe diffractogram points to the calcite being the affected mineral. As the number of sampleswith reduced Ca values suggests, Ca—and especially calcite—tend to be affected by post-depositional alterations. However, not all of the samples with reduced Ca concentrations atthe surface exhibit calcite peaks in the diffractogram, so calcite does not seem to be the only Camineral affected by leaching.
As mentioned above, changes in Ca or other major components of the sherd affect all otherconcentrations as well (as the short-lived isotopes of Si, Al and Mg cannot be measured usingNAA in Bonn, we cannot say anything about these elements). Thus, before we look at minoror trace elements, the values of the relative change have to be recalculated to correct such indir-ect changes in the concentrations. Therefore, the concentrations of the surface sample are

90
A. Schwedt, H. Mommsen and N. Zacharias
fitted to that of the core sample by an average enrichment factor
f
, which is again calculatedon the basis of Ce, La, Sc, Sm, Ta, Th and Yb. The recalculated relative change is then givenby (
f ·c
Surface
– c
Core
)/
c
Core
. The factor
f
shifts the baseline in diagrams such as Fig. 2 to the centreof the cloud of data points represented by the solid lines. Its use corresponds to comparingconcentration ratios instead of the initial concentrations.
Figure 3 A histogram of the values of relative change for Ca, calculated from the raw data (left), and a histogram of the values of relative change normalized to their errors (right).
Figure 4 A comparison of the background-corrected diffractograms for samples Palt 30 and Palt 30s. The black diffractogram is that of the core sample and the grey one that of the surface sample. The positions of the calcite peaks are marked ‘C’. It can clearly be seen that the calcite found in the core sample has disappeared in the surface sample.

Post-depositional elemental alterations in pottery
91
Alkali elements
The most striking differences between the surface and core samples could be found in thealkali metals. In Fig. 5, all possible correlation plots of alkali elements measured using NAAare given. In all of the diagrams, a major group of more or less unchanged samples can beobserved, as can a second group with strongly reduced concentrations of at least one of thealkali metals at the surface. The strongest differences can be found for Cs in many samples.The concentration values of Cs are reduced by up to 68% at the surface. The change in Rb iscorrelated to that in Cs; however, for most of the samples the reduction in Rb is not as largeas that in Cs. This might be explained in terms of differences in the ionic radius or in electro-negativity between the Cs
+
and the Rb
+
ions. The other alkali elements do not necessarily follow
Figure 5 Changes in the measured alkali metals within the data set. All plotted data are the values of relative change after data correction.

92
A. Schwedt, H. Mommsen and N. Zacharias
Cs and Rb. In particular, as can be seen in the K–Cs and the Na–Cs diagrams, the sampleswith the strongest reduction in Cs show almost no change in Na and K. The changes in Naseem to be partly anticorrelated to changes in the other alkalines: if Na is reduced strongly, theother alkalines are reduced not so strongly in many of the changed samples, and vice versa. Intotal, 18 of the 38 samples are reduced in one or more of the alkali metals at the surface.
In order to consider other parameters that could have an influence on this behaviour, the firststep was to look at the locations of the find sites of the samples. The altered samples werefound at 9 of the 17 sites. If, on the other hand, we had more than one sample per site, usuallynot all of the samples were affected. Therefore, the behaviour is not specific for single sites.
In the past, alteration effects have mostly been reported for calcareous pottery. However, asFig. 6 shows, the change in Cs can be found in non-calcareous samples as well as in sampleswith a very high Ca content.
As a final parameter, the firing temperature of the sherds was estimated, if possible, fromthe X-ray diffractograms. As in none of the cases was sufficient powder left to carry outrefiring experiments, the estimation is only very rough. However, of the 11 samples with Cs andRb reduced by over 20% at the surface, eight show quartz, plagioclase and pyroxene mineralshaving the most intense peaks in the diffractogram. Thus, according to the refiring experimentsreported by Maggetti (1981) or Buxeda
et al.
(2002), a firing temperature of over 850
°
C canbe assumed for these samples. This temperature makes a weathering process of a glassy phasepossible, as already proposed by Picon (1976) for an observed leaching of K, or by Buxeda
et al.
(2002) for deviations in K and Rb.On the contrary, among the samples with a Na reduction at the surface, some pieces exhibit
intense peaks of calcite and illite muscovite, which suggests that a change in Na is also possiblein low-fired ceramics.
Figure 6 A plot of the relative changes in Cs between the core sample and the surface sample (after data correction) against the Ca concentration in the core sample.
Post-depositional elemental alterations in pottery
93
Rare Earth Elements and others
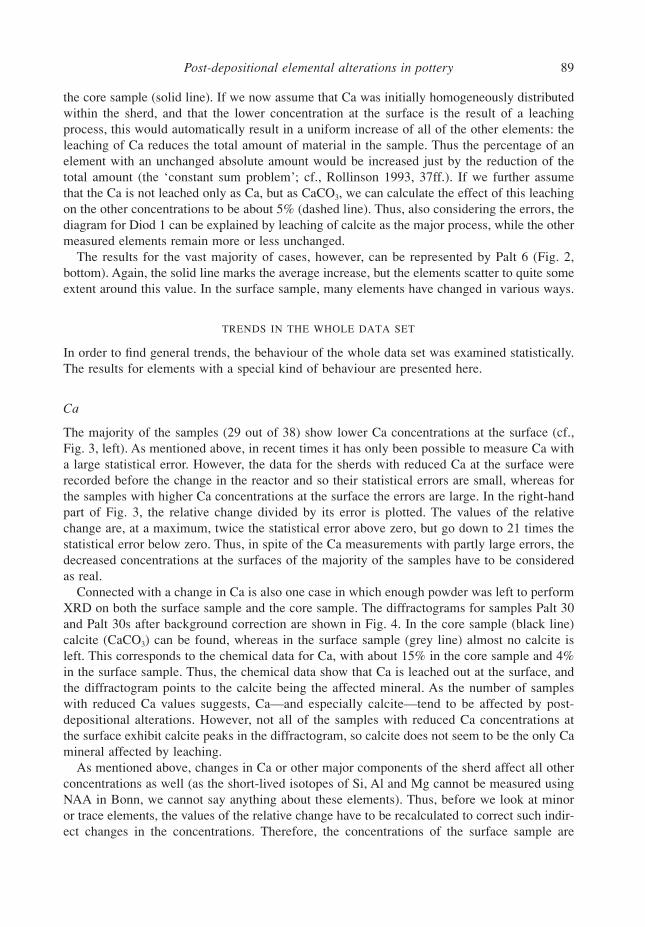
Another kind of behaviour—not yet reported, to the best of our knowledge—can be foundamong the Rare Earth Elements (REE), in connection with Hf and Ta (cf., Fig. 7). In theEu–Sm and La–Sm diagrams, the data points form much more compact clouds than in the caseof the alkali metals; however, the ‘point of no change’ (0, 0) in both diagrams is found in theupper right-hand corner of this cloud, rather than in the centre. The relative changes of Sm, Euand La are correlated to a certain degree.
The opposite effect can be seen in the Hf–Sm and Ta–Sm diagrams. Here, the relative changesare anticorrelated and the point (0, 0) is found in the lower right-hand corner of the clouds.
Among the other measured REE, Tb is more or less correlated with Sm, Eu and Ta, whereasCe and Yb give values that scatter symmetrically around zero.
Figure 7 Relative changes in Eu, La, Sm, Hf and Ta (all data after data correction).

94
A. Schwedt, H. Mommsen and N. Zacharias
Whether these changes are as strong as indicated depends partly on the selection of ele-ments used for the data correction that determines the position of the corrected baseline in dia-grams such as Fig. 2 and, hence, the position of the (0,0) point. If the contributions of the REEare not considered in this correction, the observed changes between the surface and the corewill be stronger for the REE, and smaller for Ta and Hf. On the contrary, if Ta is neglected,the new baseline will be closer to the values for the REE, resulting in larger deviations for Taand Hf. In general, however, it can be seen that the values of the relative change are larger forTa and Hf than for the REE. This means either that the REE are reduced at the surface (moststrongly for Sm, Eu, La and Tb) or that Ta and Hf are enriched—or, most probably, both, sincethe correction also depends on the well-measured elements Sc, Th and Yb.
For the other elements measured, no clear tendencies or correlations could be found. Thevalues of the relative change for As, Ba, Ce, Lu, Nd, Sb, Sc, U and Zr scatter more or lesssymmetrically around zero, whereas the distributions of some metals (Co, Cr, Fe, Th, W andZn) tend to higher concentrations at the surface. The interpretation of this tendency, however,is uncertain, as it depends on the degree of data correction.
THE INFLUENCE ON THE STATISTICAL GROUPING
The grouping procedure in Bonn follows a multivariate filter method, based on a modifiedMahalanobis distance as a similarity measure between the composition of a sherd and a givengroup (for details, see Beier and Mommsen 1994). Besides correlations, this distance considersthe statistical errors of the individual samples and the spreads (the root of the mean-squareddeviation) of the reference group, and is able to handle missing elemental values. In addition,possible dilutions or enrichments are considered by a best relative fit of the samples to thegroup mean values of the reference group, which corresponds to the use of concentration ratiosduring formation of the groups. A sample is considered as belonging to the reference group ifits distance is smaller than a cut-off value, which is normally chosen to correspond to a 95%confidence level. Usually, in Bonn, 26 elements are considered during the statistical grouping(and also for the fit): these are Ce, Co, Cr, Cs, Eu, Fe, Ga, Hf, K, La, Lu, Nd, Ni, Rb, Sb, Sc, Sm,Ta, Tb, Th, Ti, U, Yb, W, Zn and Zr. The elements As, Ba, Ca and Na are normally neglected,as they are generally found to have high spreads within pottery groups: this can be due, forexample, to different firing temperatures (As), different amount of temper (Ca, Na) or post-burial alterations (Ba, Ca), or they may already be inhomogeneous in the exploited clay bed.
In order to study the influence of the changes described above on the assignment to groups,a grouping was simulated taking the concentrations of the core samples as the reference group,with either the given statistical error or 5% as a minimal value for the spread. The data for thesurface samples were filtered against these ‘reference groups’.
In total, only 12 of the surface samples fulfil the normal grouping criterion (AegiK 43s, 55sand 91s; AgKo 10s; Chal 18s; Diod 1s; Hhlp 44s; Ialy 95s; Mela 2s and 7s; Ping 86s; and Zitt19s). Two further samples would be assigned as ‘associated’ (ChalM 1s and Sieg 101s); inother words, two elements have to be neglected to fulfil the criterion. The remaining 24 wouldbe classified as ‘singles’ or ‘chemical loners’, among which are the following:• The 11 samples with strongly reduced Cs and Rb concentrations at the surface (Chal 11s;
ChalM 7s; Epil 25s, 27s, 42s and 44s; Kapl 4s; Palt 23s and 30s; and Pell 5s and 14s). Csand Rb also give the largest contributions to the distance in these cases.
• Another eight samples in which Sm and mostly also Eu and La give the highest contributionto the distance (AegiK 42s; ChalM 5s and 10s; Palt 6s, 28s and 46s; Pole 17s; and TriaE 6).
Post-depositional elemental alterations in pottery
95
Ta and Hf, as well as the metals mentioned in the last paragraph (Co, Cr, Fe, Th, W, and Zn),only very seldom appear in the sequence of the most contributing elements. So the bestrelative fit over the usual 26 elements shifts the surface concentrations more towards thecore concentrations of those elements, resulting in stronger deviations for the REE than withthe reduced set of elements used for data correction in the preceding paragraphs.
• The remaining five surface samples: these show no regularity in the sequence of elementscontributing to the distance.
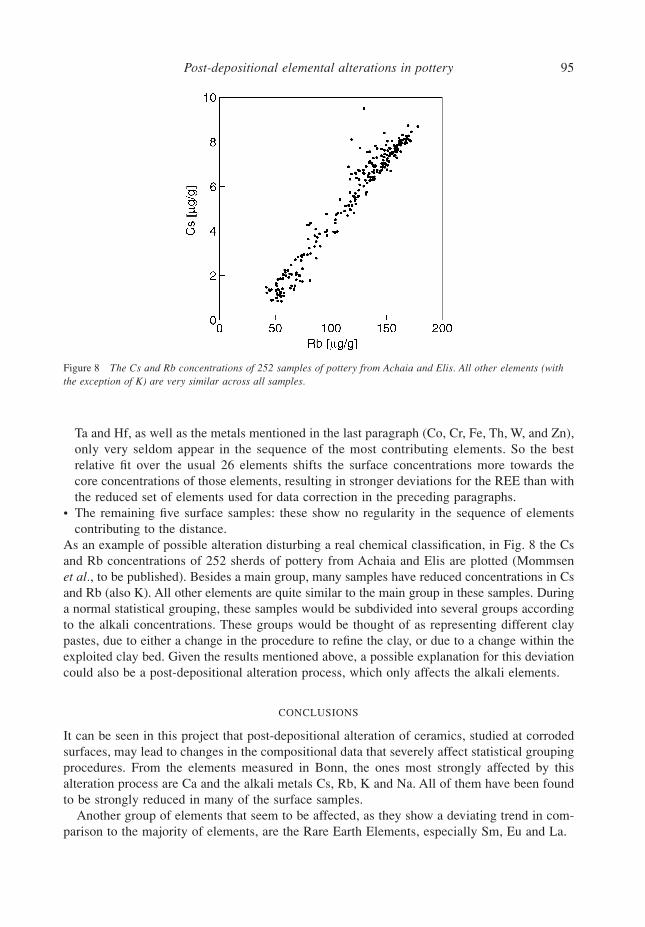
As an example of possible alteration disturbing a real chemical classification, in Fig. 8 the Csand Rb concentrations of 252 sherds of pottery from Achaia and Elis are plotted (Mommsen
et al.
, to be published). Besides a main group, many samples have reduced concentrations in Csand Rb (also K). All other elements are quite similar to the main group in these samples. Duringa normal statistical grouping, these samples would be subdivided into several groups accordingto the alkali concentrations. These groups would be thought of as representing different claypastes, due to either a change in the procedure to refine the clay, or due to a change within theexploited clay bed. Given the results mentioned above, a possible explanation for this deviationcould also be a post-depositional alteration process, which only affects the alkali elements.
CONCLUSIONS
It can be seen in this project that post-depositional alteration of ceramics, studied at corrodedsurfaces, may lead to changes in the compositional data that severely affect statistical groupingprocedures. From the elements measured in Bonn, the ones most strongly affected by thisalteration process are Ca and the alkali metals Cs, Rb, K and Na. All of them have been foundto be strongly reduced in many of the surface samples.
Another group of elements that seem to be affected, as they show a deviating trend in com-parison to the majority of elements, are the Rare Earth Elements, especially Sm, Eu and La.
Figure 8 The Cs and Rb concentrations of 252 samples of pottery from Achaia and Elis. All other elements (with the exception of K) are very similar across all samples.

96
A. Schwedt, H. Mommsen and N. Zacharias
However, it must be stressed that the samples described in this paper represent the patho-logical cases, that are and should be sorted out in any chemical classification of ancient pottery.Nevertheless, the observed effects might be one possible explanation as to why usually about10% of singles occur in the statistical grouping of compositional data.
ACKNOWLEDGEMENTS
The authors wish to thank the staff of the reactor FRG-1 at the GKSS Geesthacht for theirqualified performance of the neutron irradiations. We are also indebted to the Bundesmin-isterium für Bildung und Forschung (BMBF, the German federal ministry for educationand research) for the funding of the travel costs to Greece to sample the sherds (contractno. 03PO9BON).
REFERENCES
Beier, T., and Mommsen, H., 1994, Modified Mahalanobis filters for grouping pottery by chemical composition,
Archaeometry
,
36
, 287–306.Buxeda i Garrigós, J., 1999, Alteration and contamination of archaeological ceramics: the perturbation problem,
Journalof Archaeological Science
,
26
, 295–313.Buxeda i Garrigós, J., Kilikoglou, V., and Day, P. M., 2001, Chemical and mineralogical alteration of ceramics from a
Late Bronze Age kiln at Commos, Crete: the effect on the formation of a reference group,
Archaeometry
,
43
, 349–72.Buxeda i Garrigós, J., Mommsen, H., and Tsolakidou, A., 2002, Alteration of Na, K and Rb concentrations in
Mycenaean pottery and a proposed explanation using X-ray diffraction,
Archaeometry
,
44
, 187–98.Dufournier, D., 1979, Deux exemples de contamination des céramiques anciennes par leur milieu de conservation,
Figlina
,
4
, 69–83.Franklin, U. M., and Hancock, R., 1980, The influence of post-burial conditions on trace element composition of
ancient sherds,
Revue d’Archéométrie
,
III
, 111–19.Freestone, I. C., Meeks, N. D., and Middleton, A. P., 1985, Retention of phosphate in buried ceramics: an electron
microbeam approach,
Archaeometry
,
27
, 161–77.Hedges, R. E. M., and McLellan, M., 1976, On the cation exchange capacity of fired clays and its effect on the
chemical and radiometric analysis of pottery,
Archaeometry
,
18
, 203–7.Lemoine, C., Meille, E., Poupet, P., Barrandon, J. N., and Borderie, B., 1981, Étude des quelques altérations de
composition chimique de céramiques en milieu marin et terrestre,
Revue d’Archéométrie
, Suppl. S, 349–60.Maggetti, M., 1981, Composition of Roman pottery from Lousonna (Switzerland), in
Scientific studies in ancientceramics
(ed. M. J. Hughes), 33–49, British Museum Occasional Paper 19, London.Mommsen, H., Kreuser, A., Lewandowski, E., and Weber, J., 1991, Provenancing of pottery: a status report on neutron
activation analysis and classification, in
Neutron activation and plasma emission spectrometric analysis in archaeo-logy
(eds. M. J. Hughes, M. R. Cowell and D. R. Hook), 57–65, British Museum Occasional Paper 82, London.Picon, M., 1976, Remarques préliminaires sur deux types d’altération de la composition chimique des céramiques au
cours du temps,
Figlina
,
1
, 159–66.Picon, M., 1991, Quelques observations complémentaires sur les altérations de composition des céramiques au cours
du temps: cas de quelques alcalins et alcalino-terreux,
Revue d’Archéométrie
,
15
, 117–22.Rollinson, H. R., 1993,
Using geochemical data: evaluation, presentation, interpretation
, Prentice Hall, Harlow.Rottländer, R. C. A., 1981, Über die Veränderungen von Elementkonzentrationen in keramischen Scherben während
der Bodenlagerung (Teil I),
Sprechsaal
,
114
, 742–5.Rottländer, R. C. A., 1989,
Verwitterungserscheinungen an Keramik
, Archaeologica Venatoria, Tübingen.Schneider, G., Knoll, H., Gallis, K., and Demoule, J.-P., 1991, Transition entre les cultures néolithiques de Sesklo
et Dimini: recherches minéralogiques, chimiques et technologiques sur les céramiques et les argiles,
Bulletin deCorrespondance Hellénique
,
CXV
, 1–64.Segebade, C., and Lutz, G. J., 1980, Photon activation analysis of ancient Roman pottery, in
Proceedings of the 16thInternational Symposium on Archaeometry and Archaeological Prospection
(eds. E. A. Slater and I. O. Tate), 20–49, Edinburgh.
Tubb, A., Parker, A. J., and Nickless, G., 1980, The analysis of Romano-British pottery by atomic absorption spec-trophotometry,
Archaeometry
,
22
, 153–71.
Post-depositional elemental alterations in pottery
97
AP
PE
ND
IX
Tabl
e A
A t
able
of
the
raw
dat
a. C
once
ntra
tion
s an
d av
erag
e m
easu
rem
ent
erro
rs a
re g
iven
in
ppm
(
=
µ
g g
–1
) un
less
ind
icat
ed o
ther
wis
e. ‘
s’ d
enot
es t
he s
urfa
ce s
ampl
e;‘–
’ mar
ks v
alue
s m
issi
ng d
ue t
o ex
peri
men
tal
erro
rs.
Bec
ause
of
lack
of
spac
e, o
nly
the
aver
age
expe
rim
enta
l er
rors
are
giv
en
Sam
ple
As
Ba
Ca
(%)
Ce
Co
Cr
Cs
Eu
Fe (
%)
Ga
Hf
K (
%)
La
Lu
Na
(%)
Aeg
ik 4
2 9.
6132
811
.344
.622
.233
65.
010.
874.
077.
823.
921.
8820
.30.
320.
89A
egik
42s
23.3
654
5.84
61.8
24.0
494
6.28
1.05
5.83
9.50
6.50
2.16
22.9
0.53
0.87
Aeg
ik 4
3 7.
2721
914
.345
.117
.229
84.
530.
913.
8211
.53.
911.
9321
.40.
260.
98A
egik
43s
8.19
305
9.23
46.1
18.7
292
4.39
0.94
3.85
9.08
3.68
2.01
21.0
0.34
1.03
Aeg
ik 5
5 10
.931
912
.548
.323
.737
85.
890.
974.
2815
.04.
111.
9021
.90.
341.
03A
egik
55s
26.1
236
4.96
75.3
31.5
507
9.62
1.23
6.15
20.1
5.64
2.23
34.3
0.53
1.08
Aeg
ik 7
6 8.
9329
29.
0440
.120
.734
64.
470.
893.
8011
.93.
701.
9320
.30.
311.
11A
egiK
76s
16.2
213
5.23
78.3
19.5
438
14.1
1.20
5.95
18.3
7.36
3.15
40.0
0.68
1.27
Aeg
ik 7
9 7.
9228
210
.638
.515
.735
04.
930.
823.
4115
.63.
332.
0219
.70.
301.
11A
egiK
79s
19.4
330
5.30
86.6
19.8
414
6.71
1.25
5.69
13.4
6.56
2.44
30.3
0.75
1.32
Aeg
ik 8
9 8.
3326
010
.334
.217
.137
94.
220.
713.
4114
.92.
971.
8916
.70.
280.
98A
egik
89s
10.2
173
5.71
45.9
21.4
403
4.96
0.89
4.45
10.5
4.41
2.35
20.4
0.40
1.10
Aeg
ik 9
1 6.
3636
68.
8640
.715
.930
54.
950.
783.
4317
.63.
371.
8919
.10.
300.
86A
egik
91s
12.7
904
5.79
56.2
20.9
373
6.07
0.88
4.82
21.8
5.76
2.48
20.7
0.38
1.08
AgK
o 10
8.
0472
92.
3081
.327
.718
55.
851.
775.
1424
.95.
961.
6744
.20.
520.
49A
gKo
10s
7.48
895
4.78
83.2
27.1
188
5.19
1.77
5.01
24.3
5.93
1.70
48.8
0.46
0.51
Cha
l 11
0.69
515
6.65
68.3
44.3
208
1.86
1.41
5.02
17.2
4.50
1.42
32.1
0.41
0.47
Cha
l 11
s 7.
6465
85.
4165
.345
.327
91.
001.
165.
3023
.35.
311.
3227
.10.
520.
37C
hal
18
6.75
544
2.49
71.2
26.8
255
4.81
1.10
5.91
31.7
4.71
2.14
30.5
0.53
0.92
Cha
l 18
s 3.
5040
71.
8072
.628
.331
14.
891.
026.
2918
.95.
132.
1930
.50.
490.
96C
halM
1
7.32
313
5.13
74.8
32.7
225
0.75
1.46
5.79
22.2
4.67
0.95
37.4
0.49
0.30
Cha
lM 1
s 7.
3517
85.
2274
.635
.329
80.
901.
576.
9119
.75.
611.
1936
.30.
530.
34C
halM
5
8.58
253
4.09
75.2
25.5
317
1.38
1.44
5.45
15.8
5.53
1.19
38.1
0.49
0.50
Cha
lM 5
s 8.
1320
210
.872
.629
.935
81.
761.
296.
0322
.06.
611.
3134
.90.
510.
47C
halM
7
6.06
278
3.55
73.5
41.8
390
4.80
1.59
5.52
25.0
6.51
1.78
38.2
0.55
0.45
Cha
lM 7
s 4.
4617
73.
0073
.845
.742
62.
761.
416.
2428
.07.
041.
3440
.90.
510.
38C
halM
10
7.42
326
4.66
77.0
32.2
245
1.52
1.43
5.88
18.7
4.99
1.35
37.0
0.49
0.43
Cha
lM 1
0s4.
1520
56.
7669
.737
.429
31.
981.
126.
5325
.26.
091.
6232
.20.
560.
49D
iod
1 9.
8625
64.
7470
.522
.726
32.
471.
424.
7815
.34.
821.
3534
.70.
480.
33D
iod
1s
10.2
308
2.94
76.6
26.0
316
2.58
1.49
5.62
13.6
5.78
1.51
36.6
0.56
0.38
98 A. Schwedt, H. Mommsen and N. Zacharias
Epi
l 25
13
.142
77.
0561
.423
.920
84.
391.
215.
0814
.24.
111.
8430
.40.
410.
48E
pil
25s
13.9
569
6.62
63.8
35.0
245
2.41
1.22
5.93
22.4
5.00
1.32
31.0
0.45
0.46
Epi
l 27
6.
2652
65.
8285
.626
.420
86.
111.
454.
4624
.45.
442.
4340
.50.
490.
56E
pil
27s
5.74
409
4.46
91.7
33.2
261
4.01
1.43
5.30
26.6
6.69
2.05
42.1
0.57
0.46
Epi
l 42
14
.153
56.
5077
.322
.522
85.
461.
494.
6114
.66.
012.
1641
.50.
480.
52E
pil
42s
12.4
481
5.56
82.8
30.3
292
3.31
1.45
5.38
25.9
6.97
1.87
42.1
0.52
0.52
Epi
l 44
12
.064
212
.291
.122
.718
87.
821.
675.
2220
.75.
291.
0951
.50.
531.
36E
pil
44s
16.2
700
10.5
98.3
32.1
214
4.89
1.84
5.82
25.5
5.95
1.06
51.5
0.57
0.97
Hhl
p 44
7.
0550
70.
5056
.95.
9971
.610
.30.
751.
3223
.46.
931.
7629
.50.
360.
19H
hlp
44s
7.29
380
0.46
56.7
5.88
68.7
10.5
0.72
1.40
23.8
6.98
1.80
29.9
0.34
0.21
Ialy
95
8.53
469
5.25
78.6
19.6
122
10.8
1.21
5.59
30.9
4.62
2.08
37.4
0.44
0.19
Ialy
95s
9.
7047
65.
3678
.019
.812
010
.81.
165.
6028
.44.
692.
0636
.50.
460.
18K
apl
4 11
.833
47.
9563
.217
.624
52.
371.
284.
558.
554.
051.
0930
.70.
350.
36K
apl
4s
10.5
189
5.82
64.2
19.7
304
0.83
1.43
5.19
19.4
5.09
1.25
29.6
0.43
0.38
Mel
a 2
5.16
458
7.91
77.0
25.4
215
5.34
1.39
4.13
29.0
5.15
2.34
37.3
0.48
0.53
Mel
a 2s
5.
3642
24.
5872
.425
.921
35.
601.
304.
1531
.15.
152.
3634
.30.
460.
52M
ela
7 4.
4331
83.
4590
.521
.819
65.
341.
604.
1116
.66.
202.
3543
.70.
490.
84M
ela
7s
4.32
345
3.20
88.9
23.8
203
5.54
1.49
4.20
9.22
6.63
2.27
40.6
0.50
0.85
Palt
23
4.20
302
5.23
59.5
24.6
256
5.52
1.24
5.26
21.0
3.77
1.94
28.0
0.43
0.56
Palt
23s
3.
6433
73.
0056
.825
.830
64.
060.
925.
4420
.04.
511.
8026
.50.
390.
49Pa
lt 2
8 10
.433
26.
8059
.029
.622
65.
331.
154.
8413
.63.
221.
7629
.60.
410.
47Pa
lt 2
8s
4.94
416
5.27
55.0
26.5
271
5.75
0.97
5.11
10.5
3.81
2.06
24.8
0.41
0.55
Palt
30
8.81
309
15.0
55.3
23.6
210
4.50
1.20
4.47
12.6
2.84
1.45
28.0
0.34
0.38
Palt
30s
7.
0846
53.
8453
.429
.330
51.
821.
055.
7022
.14.
191.
5924
.30.
410.
38Pa
lt 4
2 8.
9930
01.
6967
.417
.516
14.
501.
264.
1512
.05.
541.
3033
.10.
440.
51Pa
lt 4
2s
4.98
200
1.42
66.7
18.8
171
3.59
1.00
4.41
15.2
6.16
1.23
32.3
0.42
0.50
Palt
46
1.74
374
2.78
66.6
29.3
274
2.94
1.25
5.97
15.9
4.34
1.77
29.3
0.44
0.55
Palt
46s
2.
9144
43.
6657
.530
.433
02.
720.
956.
1319
.04.
551.
8225
.60.
440.
53Pa
lt 5
4 4.
3033
25.
0657
.127
.928
22.
721.
015.
4419
.74.
961.
7723
.60.
440.
75Pa
lt 5
4s
4.41
366
2.82
56.3
28.9
301
2.41
0.83
5.32
26.7
5.58
1.95
22.7
0.41
0.79
Palt
6
6.59
330
7.72
78.3
28.9
348
2.09
1.68
5.07
13.4
4.58
1.44
40.4
0.46
0.32
Palt
6s
6.34
265
1.21
105
37.7
415
2.18
1.63
5.85
17.6
6.45
1.72
41.4
0.63
0.22
Pel
l 5
8.35
572
5.71
93.8
33.2
194
7.08
1.69
5.14
19.1
5.53
2.50
47.3
0.50
0.48
Pel
l 5s
13
.757
23.
6711
642
.630
03.
671.
797.
96 –
8.
582.
1656
.30.
670.
40
Sam
ple
As
Ba
Ca
(%)
Ce
Co
Cr
Cs
Eu
Fe (
%)
Ga
Hf
K (
%)
La
Lu
Na
(%)
Tabl
e A
cont
inue
d

Post-depositional elemental alterations in pottery 99P
ell
14
10.9
876
0.73
134
26.0
143
8.01
1.87
4.99
25.0
8.59
2.42
56.7
0.61
0.70
Pel
l 14
s 8.
5455
60.
5912
731
.319
14.
061.
866.
4122
.211
.02.
0061
.10.
710.
63P
ing
86
16.8
485
0.88
89.5
5.24
146
16.9
1.47
1.67
27.9
5.13
1.85
44.5
0.38
0.13
Pin
g 86
s 20
.252
10.
9195
.75.
4114
818
.81.
561.
9129
.14.
962.
0647
.90.
430.
18P
ole
17
8.34
469
5.59
47.5
72.3
869
4.95
0.92
7.28
14.8
3.33
1.52
21.8
0.38
0.48
Pol
e 17
s 7.
3941
73.
4440
.983
.710
545.
500.
648.
6617
.23.
761.
4717
.20.
390.
50S
ieg
101
2.06
681
0.48
149
7.30
177
15.0
1.70
1.49
39.9
8.10
1.13
81.4
0.46
0.21
Sie
g 10
1s0.
9866
60.
6117
67.
6919
917
.21.
941.
8549
.18.
871.
0698
.30.
540.
19T
riaE
6
3.47
424
6.08
71.9
31.3
308
1.20
1.40
5.95
22.7
4.39
1.89
33.2
0.51
0.72
Tri
aE 6
s 3.
3536
25.
0056
.733
.534
40.
951.
006.
4919
.54.
911.
8326
.20.
470.
68Z
itt
19
4.36
615
0.54
122
5.23
87.4
20.4
1.65
1.05
41.5
9.13
2.64
62.7
0.61
0.16
Zit
t 19
s 9.
0665
10.
8314
66.
9998
.723
.41.
861.
2045
.69.
652.
8774
.20.
720.
12A
vera
ge m
easu
rem
ent
erro
r0.
1169
0.94
0.87
0.18
1.9
0.12
0.03
40.
023
2.6
0.1
0.03
50.
097
0.02
60.
005
In %
1.
316
201.
10.
70.
71.
82.
60.
512
1.8
1.9
0.3
5.5
0.8
Sam
ple
Nd
Ni
Rb
SbSc
SmTa
Tb
Th
Ti (
%)
UW
Yb
Zn
Zr
Aeg
ik 4
2 15
.826
570
.10.
6415
.13.
020.
570.
527.
310.
421.
441.
292.
1889
.035
.5A
egik
42s
17.3
344
64.8
0.71
18.3
2.89
0.90
0.70
11.2
0.76
2.34
2.87
3.17
95.5
117
Aeg
ik 4
3 14
.426
862
.10.
5714
.82.
910.
640.
637.
300.
691.
221.
212.
1582
.735
.3A
egik
43s
20.1
241
66.9
0.58
14.8
2.94
0.58
0.71
7.30
0.48
1.52
1.53
2.15
84.3
34.8
Aeg
ik 5
5 23
.131
576
.00.
7216
.73.
160.
710.
678.
150.
231.
611.
482.
2981
.537
.0A
egik
55s
33.5
469
94.6
1.07
21.2
3.82
1.15
0.87
11.7
0.51
2.28
3.07
3.13
117
78.5
Aeg
ik 7
6 18
.529
967
.40.
5414
.33.
360.
590.
526.
510.
301.
811.
352.
1110
418
3A
egiK
76s
18.3
260
132
1.99
22.5
3.54
1.31
1.06
13.3
0.62
2.92
2.76
4.54
228
214
Aeg
ik 7
9 19
.429
166
.90.
6513
.23.
140.
560.
556.
110.
291.
871.
312.
0186
.017
9A
egiK
79s
19.0
272
68.5
1.79
21.1
3.67
1.29
1.13
12.4
0.85
2.44
2.31
4.88
171
132
Aeg
ik 8
9 13
.634
858
.60.
4712
.72.
880.
480.
535.
520.
301.
641.
141.
7572
.814
1A
egik
89s
19.3
331
62.5
0.75
15.4
3.02
0.84
0.67
8.46
0.73
1.82
1.33
2.54
110
49.2
Aeg
ik 9
1 19
.629
766
.30.
4713
.63.
110.
610.
546.
890.
321.
631.
211.
9783
.415
0A
egik
91s
59.9
346
70.7
1.23
18.4
2.72
1.07
1.03
10.5
1.43
2.19
1.45
2.74
134
160
AgK
o 10
31
.822
495
.21.
2120
.76.
251.
191.
2014
.30.
662.
152.
513.
7012
841
.4A
gKo
10s
32.1
209
104
0.94
20.7
6.32
1.14
1.23
14.1
0.56
2.48
2.53
4.03
152
47.3
Cha
l 11
29
.126
256
.90.
6018
.55.
740.
900.
8911
.40.
381.
992.
123.
2211
223
1C
hal
11s
30.0
277
40.3
0.46
19.1
5.72
1.04
0.67
12.4
0.45
2.35
5.09
2.93
165
265
Sam
ple
As
Ba
Ca
(%)
Ce
Co
Cr
Cs
Eu
Fe (
%)
Ga
Hf
K (
%)
La
Lu
Na
(%)

100 A. Schwedt, H. Mommsen and N. Zacharias
Cha
l 18
31
.623
110
90.
5120
.35.
401.
020.
8013
.30.
502.
372.
672.
9111
524
8C
hal
18s
23.5
274
108
0.61
21.4
4.87
1.11
0.74
13.8
0.58
2.60
2.54
3.21
185
235
Cha
lM 1
31
.524
125
.30.
5922
.16.
561.
000.
9512
.90.
692.
151.
923.
3513
022
1C
halM
1s
29.1
298
34.0
0.76
25.2
7.10
1.23
0.95
15.7
0.95
1.96
2.32
3.72
110
230
Cha
lM 5
30
.826
537
.60.
5819
.26.
381.
040.
8612
.40.
632.
421.
583.
4111
629
0C
halM
5s
28.3
304
42.0
0.72
20.3
5.20
1.24
0.75
13.9
0.99
2.39
2.48
3.44
149
307
Cha
lM 7
29
.832
592
.30.
9319
.57.
080.
980.
9612
.00.
402.
042.
373.
7312
329
3C
halM
7s
36.6
370
63.4
1.04
18.7
6.85
1.12
0.85
13.8
0.42
2.03
2.21
3.47
147
309
Cha
lM 1
0 27
.424
147
.40.
5822
.06.
331.
020.
8713
.50.
662.
312.
563.
2510
627
0C
halM
10s
26.5
280
57.2
0.58
23.4
4.85
1.31
0.73
15.4
0.68
2.93
2.70
3.52
120
276
Dio
d 1
30.0
220
56.9
1.35
16.7
5.53
0.96
0.95
11.4
0.45
2.09
1.80
3.21
80.6
175
Dio
d 1s
33
.123
859
.51.
5118
.15.
501.
280.
9613
.30.
522.
252.
263.
6993
.824
6E
pil
25
27.3
175
86.2
0.44
19.1
4.54
0.79
0.70
10.9
0.54
2.38
2.43
2.70
83.2
180
Epi
l 25
s 25
.128
155
.50.
4519
.94.
800.
970.
7213
.00.
482.
812.
883.
0210
519
9E
pil
27
35.9
190
126
1.04
20.6
6.60
1.21
0.86
14.8
0.52
3.40
2.31
3.30
113
197
Epi
l 27
s 39
.423
193
.51.
0820
.36.
331.
500.
8817
.30.
593.
962.
543.
7613
817
3E
pil
42
32.6
181
119
0.82
19.0
5.96
1.12
0.92
12.9
0.45
3.60
2.24
3.26
79.2
166
Epi
l 42
s 28
.619
981
.10.
8719
.05.
771.
360.
9515
.10.
453.
532.
463.
5210
529
6E
pil
44
35.7
195
106
1.32
22.9
7.61
1.29
1.07
15.4
0.75
3.88
1.65
3.75
75.7
196
Epi
l 44
s 36
.022
869
.21.
0424
.88.
301.
411.
1317
.80.
424.
251.
763.
9790
.618
7H
hlp
44
20.9
29.1
120
0.97
11.2
3.56
1.57
0.58
9.75
0.42
3.07
3.31
2.71
56.3
271
Hhl
p 44
s 14
.184
.712
21.
1811
.23.
311.
520.
679.
650.
713.
213.
352.
4160
.931
1Ia
ly 9
5 29
.676
.817
30.
8819
.45.
381.
210.
7414
.80.
613.
722.
472.
9586
.312
9Ia
ly 9
5s
25.9
133
174
0.87
19.2
5.05
1.19
0.66
14.7
0.59
3.54
2.15
2.93
90.5
51.4
Kap
l 4
25.8
208
46.4
1.60
16.4
5.18
0.81
0.86
10.3
0.55
2.51
1.42
2.93
63.8
37.3
Kap
l 4s
21
.625
330
.71.
8618
.14.
681.
060.
9013
.60.
581.
981.
983.
3067
.141
.6M
ela
2 27
.517
811
50.
7719
.05.
121.
100.
8312
.70.
422.
942.
163.
1511
026
1M
ela
2s
25.4
201
117
1.00
18.5
4.70
1.06
0.74
12.5
0.64
3.23
2.19
2.97
105
254
Mel
a 7
40.1
123
114
0.87
21.3
7.18
1.29
0.90
13.7
0.53
2.78
2.74
3.43
108
242
Sam
ple
Nd
Ni
Rb
SbSc
SmTa
Tb
Th
Ti (
%)
UW
Yb
Zn
Zr
Tabl
e A
cont
inue
d
Post-depositional elemental alterations in pottery 101M
ela
7s
39.6
110
118
0.95
21.6
5.97
1.31
0.86
13.1
0.55
2.74
2.24
3.39
106
232
Palt
23
23.3
233
105
0.55
21.8
4.17
0.85
0.75
11.5
0.36
2.08
2.45
2.82
80.0
42.0
Palt
23s
21
.529
471
.80.
5022
.63.
851.
050.
5612
.60.
752.
832.
552.
8281
.440
.9Pa
lt 2
8 25
.422
110
50.
6119
.44.
850.
680.
6910
.00.
382.
232.
052.
5692
.415
7Pa
lt 2
8s
23.5
232
113
0.44
20.9
3.50
0.84
0.55
10.6
0.39
2.16
2.44
2.65
82.2
163
Palt
30
20.3
192
78.3
0.64
18.1
4.49
0.62
0.80
8.86
0.67
2.06
1.41
2.46
84.4
38.3
Palt
30s
20
.131
146
.20.
7321
.93.
890.
950.
5511
.40.
872.
732.
002.
7186
.741
.4Pa
lt 4
2 29
.211
275
.80.
9015
.74.
780.
900.
8411
.70.
411.
932.
433.
1367
.622
1Pa
lt 4
2s
23.2
135
57.7
0.96
14.7
3.90
1.07
0.62
11.5
0.46
2.44
2.15
2.95
77.9
240
Palt
46
25.4
288
78.3
0.52
21.6
4.91
0.89
0.79
12.7
0.71
2.38
2.38
3.04
103
41.4
Palt
46s
20
.231
275
.00.
5021
.53.
461.
020.
6010
.10.
572.
192.
432.
8810
442
.0Pa
lt 5
4 21
.120
267
.80.
5820
.93.
720.
870.
7511
.20.
611.
901.
892.
7694
.540
.8Pa
lt 5
4s
16.9
244
67.3
0.62
18.1
3.06
1.16
0.61
10.1
0.72
1.68
2.27
2.72
98.8
39.0
Palt
6
36.4
265
66.2
0.69
23.4
7.15
0.99
1.12
12.9
0.63
2.91
2.22
3.81
98.7
42.2
Palt
6s
30.7
374
68.9
0.70
25.9
5.92
1.43
1.13
16.2
0.76
2.93
3.07
4.39
118
62.8
Pel
l 5
45.3
193
149
1.22
22.1
7.54
1.30
1.02
15.3
0.45
3.26
2.14
3.49
119
233
Pel
l 5s
47
.823
699
.91.
7326
.18.
041.
961.
0521
.60.
654.
484.
664.
7416
835
4P
ell
14
54.1
85.1
156
1.91
24.2
9.03
1.85
1.16
19.5
0.62
4.61
2.83
4.25
165
380
Pel
l 14
s 58
.511
797
.32.
2020
.59.
032.
491.
1824
.90.
854.
814.
775.
1340
944
7P
ing
86
37.1
31.8
122
1.52
17.9
6.67
1.31
0.87
14.1
0.49
3.89
2.29
2.79
75.6
221
Pin
g 86
s 38
.645
.313
31.
0019
.67.
111.
410.
8315
.30.
524.
312.
513.
0267
.821
4P
ole
17
15.5
1133
83.8
0.51
21.8
4.02
0.71
0.50
8.17
0.36
1.32
1.93
2.25
111
128
Pol
e 17
s 17
.114
5981
.80.
5022
.03.
060.
870.
468.
630.
541.
482.
142.
2313
210
8S
ieg
101
44.0
65.6
76.0
5.14
21.4
7.71
1.89
0.92
22.5
0.69
5.14
2.74
3.50
45.0
393
Sie
g 10
1s54
.569
.570
.02.
0924
.59.
002.
121.
0725
.60.
755.
543.
063.
9141
.733
1T
riaE
6
32.4
252
55.0
0.41
22.2
5.55
0.98
0.76
12.7
0.47
1.82
2.16
3.19
108
115
Tri
aE 6
s 22
.431
653
.50.
5023
.63.
861.
120.
5312
.90.
531.
982.
342.
8814
115
2Z
itt
19
44.1
93.3
201
2.09
17.1
9.23
3.27
1.28
28.7
0.53
10.1
6.16
4.73
103
380
Zit
t 19
s 57
.886
.923
02.
7119
.511
.03.
771.
5133
.60.
6712
.06.
775.
5213
036
7
Ave
rage
mea
sure
men
t er
ror
3.8
253.
40.
088
0.03
10.
053
0.04
80.
065
0.1
0.07
90.
190.
170.
062
3.1
34In
%
1310
3.6
8.1
0.2
0.9
3.6
7.5
0.7
155.
56.
11.
92.
917
Sam
ple
Nd
Ni
Rb
SbSc
SmTa
Tb
Th
Ti (
%)
UW
Yb
Zn
Zr
Copyright © 2022 FDOKUMEN