catalytic pyrolysis of plastic waste to liquid fuel using - Moi ...
125
CATALYTIC PYROLYSIS OF PLASTIC WASTE TO LIQUID FUEL USING LOCAL CLAY CATALYST BY MIBEI CHEPCHIRCHIR ZEDDY A Thesis Submitted in Partial Fulfillment of the Requirements for The Degree of Master of Science in Energy Studies (Renewable Energy) Moi University 2021
-
Upload
khangminh22 -
Category
Documents
-
view
1 -
download
0
Transcript of catalytic pyrolysis of plastic waste to liquid fuel using - Moi ...

CATALYTIC PYROLYSIS OF PLASTIC WASTE TO LIQUID FUEL USING
LOCAL CLAY CATALYST
BY
MIBEI CHEPCHIRCHIR ZEDDY
A Thesis Submitted in Partial Fulfillment of the Requirements for The Degree of
Master of Science in Energy Studies (Renewable Energy)
Moi University
2021

ii
DECLARATION
Declaration by Candidate
This thesis is my original work and has not been presented for a degree in any other
University. No part of this thesis may be reproduced without the prior written
permission of the author and/ or Moi University.
Sign:__________________________ Date: 15th November, 2021
Mibei Chepchirchir Zeddy:
TEC/PGMP/13/18
Declaration by Supervisors
This thesis has been submitted for examination with our approval as University
Supervisors.
Sign:_____________________________ Date: 15th November, 2021
Dr. Stephen M. Talai; Moi University, Eldoret, Kenya
Sign:_____________________________ Date: 15th November, 2021
Prof. Anil Kumar; Moi University, Eldoret, Kenya

iii
DEDICATION
I dedicate this thesis to my family, my husband, Mr. Meshack Malakwen, and our
children Ivy, Faith and Joy.

iv
ABSTRACT
Plastics are non-biodegradable and safe disposal of this waste poses environmental
challenge all over the world. One thermochemical disposal method is pyrolysis that
produces clean liquid fuel. Catalytic pyrolysis is superior to thermal pyrolysis as it uses
lower temperatures, hence, less energy. Imported conventional catalysts increase the
production cost of the liquid fuel but local clay catalyst used in this research is a cheaper
substitute. Therefore, the main objective in this study was to produce liquid fuel from
plastic waste, using indigenous clay as a catalyst through catalytic pyrolysis. The liquid
fuel can be used as an alternative source of energy in diesel engines as transport fuel,
in turbines for electricity generation and as heating source in boilers and furnaces. The
clay from Kisumu county was characterized through X-Ray Fluorescence spectrometer
(XRFS) and X-Ray Diffractometer (XRD). Reaction setup consisted of a round bottom
flask reactor through which plastic feed and catalyst were heated in a temperature
controlled furnace. Vapour product was condensed using a liebig type water condenser
to give pyrolysis liquid product. Solid char was recovered from flask at the end of
reaction. Central composite design (CCD) and Response surface methodology (RSM)
in Design expert software were used to study the effect of pyrolysis operating variables
on the liquid fuel yield and also to identify conditions for optimal yield. Analysis of oil
was done using Gas chromatography- Mass spectroscopy (GCMS). Results show that
clay has composition of silica and alumina at 64.5wt% and 16.3wt% respectively
indicating high acidity of the clay, being requirement for a good pyrolysis catalyst. For
High density polyethylene and Polypropylene, the highest liquid yield of 87.23wt.%
and 60.36wt.% respectively was at 300 ℃ and catalyst concentration of 10wt.%. GC-
MS analysis showed that the oil from HDPE, PP and PS comprised of complex mixtures
of organic compounds with aromatic, aliphatic and naphthenes as major components.
The liquid fuel properties for HDPE, PP and PS were found to meet the ASTM D975
requirement for a liquid fuel. Indigenous clay was establised to be a suitable catalyst
for catalytic pyrolysis of plastic waste, with a potential to replace imported catalysts,
since high yields of liquid fuel were obtained at lower reaction temperatures of 300-
450 ℃, as compared to 600 ℃ required for thermal pyrolysis. In conclusion waste
plastics can be used to generate alternative fuel for industrial use. Further studies on
modification of surface and structure of clay are suggested to enhance its catalytic
perfomance in the pyrolysis process for a better fuel yield.

v
TABLE OF CONTENTS
DECLARATION ........................................................................................................... ii
DEDICATION .............................................................................................................. iii
ABSTRACT .................................................................................................................. iv
TABLE OF CONTENTS ............................................................................................... v
LIST OF TABLES ...................................................................................................... viii
LIST OF FIGURES ....................................................................................................... x
NOMENCLATURE ..................................................................................................... xi
ACRONYMS ............................................................................................................... xii
ACKNOWLEDGEMENTS ........................................................................................ xiii
CHAPTER 1: INTRODUCTION ............................................................................... 1
1.1 Background Information .......................................................................................... 1
1.2 Different Types of Plastics....................................................................................... 1
1.3 Plastic Waste and Disposal ...................................................................................... 4
1.4 Problem Statement ................................................................................................... 6
1.5 Justification .............................................................................................................. 7
1.6 Research Objectives ................................................................................................. 8
CHAPTER 2: LITERATURE REVIEW ................................................................ 10
2.1 Introduction ............................................................................................................ 10
2.2 Classification of Plastics ........................................................................................ 10
2.3 Material Properties of plastics ............................................................................... 12
2.3.1 Formation and structure .................................................................................. 12
2.3.2 Thermal Properties of plastics ......................................................................... 15
2.3.3 Thermal decomposition of plastics ................................................................. 18
2.3.4 TGA Analysis of plastic wastes ...................................................................... 18
2.4 Pyrolysis ................................................................................................................. 18
2.4.1 Pyrolysis operating parameters ....................................................................... 20
2.4.2 Products of pyrolysis process .......................................................................... 22
2.4.3 Thermal pyrolysis ............................................................................................ 23
2.4.4 Catalytic Pyrolysis........................................................................................... 24
2.5 Reaction Mechanism for Plastic pyrolysis ............................................................. 25
2.5.1 Catalytic mechanism of Polyethylene ............................................................. 25
2.5.2 Thermal decomposition of polystyrene ........................................................... 28

vi
2.6 Thermal and Catalytic Pyrolysis of Plastic Waste ................................................. 31
2.7 Catalytic Pyrolysis Using Natural and Synthetic Zeolite Catalysts ....................... 33
2.8 Pyrolysis of different types of Plastics................................................................... 35
2.9 Definition of Clay and Clay Minerals .................................................................... 39
2.10 Occurrence of the Clay Minerals ......................................................................... 40
2.11 Structure and Composition of Clay Mineral ........................................................ 41
2.12 Clay as a Catalyst ................................................................................................. 43
2.13 Chemical Analysis of Kano Plains Clay .............................................................. 45
CHAPTER 3: METHODOLOGY ........................................................................... 46
3.1 Materials/ Equipment ............................................................................................. 46
3.2 Catalyst Characterization ....................................................................................... 46
3.2.1 Collection of clay sample ................................................................................ 47
3.2.2 Clay sample Preparation.................................................................................. 48
3.2.3 X-Ray Fluorescence Spectrophotometer (XRFS) Analysis ............................ 48
3.2.4 X-Ray Diffraction (XRD) Analysis ................................................................ 49
3.3 Design of catalytic pyrolysis experiment ............................................................... 49
3.4 Experimental Setup ................................................................................................ 52
3.4.1 Waste plastic Sample Preparation ................................................................... 52
3.4.2 Preparation of catalyst ..................................................................................... 52
3.4.3 Experimental procedure .................................................................................. 52
3.5 Analysis of Plastic Waste Liquid Oil ..................................................................... 54
3.5.1 GC-MS analysis for Liquid oil composition ................................................... 54
3.6 Determination of Fuel properties ........................................................................... 55
CHAPTER 4: RESULTS AND DISCUSSIONS ..................................................... 57
4.1 Introduction ............................................................................................................ 57
4.2 Material characterization ....................................................................................... 57
4.2.1 XRF characterization....................................................................................... 57
4.2.2 XRD characterization ...................................................................................... 59
4.3 Optimization Studies .............................................................................................. 63
4.3.1 Experimental design for HDPE ....................................................................... 63
4.3.2 Experimental design for Polypropylene waste plastics ................................... 67
4.3.3 Experimental design for Polystyrene waste plastics ....................................... 70
4.4 Optimization using Response Surface Methodology ............................................. 73
4.4.1 High density Polyethylene .............................................................................. 74

vii
4.4.2 Polypropylene waste plastics .......................................................................... 74
4.4.3 Polystyrene waste plastics ............................................................................... 75
4.5 Analysis of the hydrocarbon composition in liquid fuel ........................................ 76
4.5.1 Composition of liquid oils derived from the pyrolysis of waste plastics ........ 76
4.5.2 Hydrocarbon composition for High density polyethylene pyrolytic oil ......... 76
4.5.3 Hydrocarbon composition for Polypropylene pyrolytic oil ............................ 79
4.5.4 Hydrocarbon composition for Polystyrene pyrolytic oil ................................. 82
4.6 Pyrolytic Liquid Fuel Properties ............................................................................ 86
CHAPTER 5: CONCLUSION AND RECOMMENDATIONS ............................ 89
5.1 Conclusion ............................................................................................................. 89
5.2 Recommendations .................................................................................................. 90
REFERENCES ........................................................................................................... 91
APPENDICES .......................................................................................................... 101
Appendix 1: Photographs of raw materials used and experimental layout ............ 101
Appendix 1a: Waste plastics (PP, HDPE and PS) ................................................. 101
Appendix 1b: Preparation of raw materials (PS, and clay soil) ............................. 101
Appendix 1c: Chemical Engineering Lab .............................................................. 102
Appendix 1d: Experimental setup for pyrolysis process ........................................ 103
Appendix 1e: Pyrolytic oil for HDPE, PP and PS.................................................. 103
Appendix 1f: Char (By product of pyrolysis process) ........................................... 104
Appendix 2: GC-MS data ....................................................................................... 105
Appendix 2a: Molecular composition of pyrolytic oil from HDPE waste plastics 105
Appendix 2b: Molecular composition of pyrolytic oil from PP waste plastics ..... 107
Appendix 2c: Molecular composition of pyrolytic oil from PS waste plastics ...... 109

viii
LIST OF TABLES
Table 1.1: SPI codes for different types of plastics and their names .......................... 2
Table 1.2: Global consumption of individual plastics ................................................ 5
Table 1.3: Global production of plastics from 2010 to 2019 (in million metric tons)
................................................................................................................. 8
Table 2.1: Examples of common plastics and their monomers ................................ 14
Table 2.2: Phase transition temperatures for thermoplastic resins ........................... 17
Table 2.3: Characteristics of conventional diesel oil ................................................ 19
Table 2.4: Product distribution in plastic pyrolysis (% wt of feed) ......................... 22
Table 2.5: Comparison of HDPE pyrolytic oil and conventional fuel properties .... 37
Table 3.1: Independent variables and their levels in CCD. ...................................... 51
Table 3.2: Experimental runs from Design Expert software .................................... 52
Table 4.1: X-Ray Fluorescence Analysis Result ...................................................... 58
Table 4.2(a): Peak list ............................................................................................... 60
Table 4.2(b): Peak list ............................................................................................... 61
Table 4.4: Thermal pyrolysis of different types of plastic waste .............................. 63
Table 4.5: CCD matrix with Liquid oil yield for HDPE waste plastics .................... 65
Table 4.6: Sequential model sum of squares ............................................................. 65
Table 4.7: ANOVA for Quadratic model .................................................................. 66
Table 4.8: Coefficients for the quadratic model ....................................................... 67
Table 4.9: CCD matrix with experimental liquid oil yield from PP waste plastics .. 68
Table 4.10: Sequential model sum of squares ........................................................... 68
Table 4.11: ANOVA for Response Surface Quadratic model .................................. 69
Table 4.12: Coefficients for the full quadratic model ............................................... 70
Table 4.13: CCD matrix with experimental liquid oil yield from PS waste plastics 71
Table 4.14: Sequential model sum of squares ........................................................... 72
Table 4.15: ANOVA for Quadratic model ................................................................ 72
Table 4.16: Coefficients for the model ..................................................................... 73
Table 4.17: A summary of information obtained from GC-MS showing retention time,
retention index, Area %, molecular weights, chemical formula and names
based on compared NIST entries for HDPE pyrolytic oil. .................... 79

ix
Table 4.18: A summary of information obtained from GC-MS showing retention time,
retention index, Area %, molecular weights, chemical formula and names
based on compared NIST entries for PP pyrolytic oil. .......................... 81
Table 4.19: A summary of information obtained from GC-MS showing retention time,
retention index, Area %, molecular weights, chemical formula and names
based on compared NIST entries for PS pyrolytic oil. .......................... 83
Table 4.20: Liquid oil composition from the pyrolysis of waste plastics ................. 86
Table 4.21: Properties of liquid fuel produced from different types of waste plastics
and petroleum diesel. ............................................................................. 87

x
LIST OF FIGURES
Figure 2.1: Principle structure of linear (A), with side chains (B) and crosslinked
macromolecules (C and D). Chain structure (A) and (B) are
thermoplastic types, structures with low crosslinking (C) elastomers and
with strong crosslinking thermosets (D) . ............................................ 11
Figure 2.2: Process for plastic generation ................................................................ 13
Figure 2.3: Potential energy for rotation of ethylene molecules around the carbon-
linking axis . ......................................................................................... 15
Figure 2.4: Conformation types of macromolecules . ............................................... 15
Figure 2.5 Comparison of thermal and catalytic pyrolysis ....................................... 25
Figure 2.6: Silica tetrahedral layers ......................................................................... 42
Figure 2.7: Alumina-octahedron layer ...................................................................... 42
Figure 3.1: Soil survey maps for Kano plains, Kenya .............................................. 47
Figure 3.2: Plastic waste pyrolysis set-up ................................................................. 54
Figure 4.1(a): XRD analysis of clay ......................................................................... 60
Figure 4.1(b): XRD analysis of clay ......................................................................... 61
Figure 4.1(c): XRD analysis of clay ......................................................................... 62
Figure 4.1(d): XRD analysis of clay ......................................................................... 62
Figure 4.2: RSM plot for effect of catalyst concentration and Temperature on Yield
for HDPE liquid oil .............................................................................. 74
Figure 4.3: RSM plot for effect of catalyst concentration and Temperature on Yield
for PP liquid oil .................................................................................... 75
Figure 4.4: RSM plot for effect of catalyst concentration and Temperature on Yield
for PS liquid oil .................................................................................... 75
Figure 4.5: Qualitative analysis report of HDPE liquid oil from GC-MS ................ 78
Figure 4.6: Qualitative analysis report for Polypropylene from GC-MS ................. 80
Figure 4.7: Qualitative analysis report of Polystyrene plastics from GC-MS .......... 82

xi
NOMENCLATURE
AAS Atomic Absorption Spectrometer
CCD Central composite design
DOE Design of experiments
GC-MS Gas Chromatography- Mass spectroscopy
HDPE High Density Polyethylene
HCL Hydrogen chloride
HHV High heating values
LCA Life cycle assessment
LDPE Low Density Polyethylene
MSW Municipal solid waste
NEMA National Environmental Management Authority
PE Polyethylene
PP Polypropylene
PS Polystyrene
PSW Plastic Solid waste
PVC Polyvinyl Chloride
PET Polyethylene Terephthalate
RSM Response surface model
SPI Society of Plastic Industry
XRD X- ray Diffractometer
XRF X-Ray Fluorescence spectrometer

xii
ACRONYMS
m/z mass to charge ratio
$ Dollar
α denotes the distance from the center of the design space to a star point

xiii
ACKNOWLEDGEMENTS
I appreciate the World Bank through Africa Center of Excellence II in Phytochemicals,
Textile and Renewable Energy (ACEII PTRE) for the full academic scholarship they
awarded to me for my studies at Moi University.
I appreciate my supervisors, Prof. Anil Kumar and Dr. Stephen Talai for their
professional guidance in reviewing the thesis with valuable comments. You provided
me with extensive knowledge and guidance which enabled the completion of this
research.
My gratitude goes to the academic and technical staff at the Chemical and Process
Engineering Laboratory of Moi University, Mr. Paul Lagat, Mr. Alex Koech and Mr.
Vincent Bitok for the support I received from them.
I acknowledge the assistance from Mr. Gerald Njiru and Mr Nyamongo of Geothermal
Development Company (GDC) – Nakuru, Beatrice Wanjiru from Lab Works East
Africa Limited and Dorcas Muigai from Kenya Institute of Research and Development
Institute (KIRDI). I will be forever grateful for your time, support and working
tirelessly in your respective Laboratories.
I also acknowledge my husband for his tremendous support, my children for being
patient with me as I went through my studies. You are the source of my inspiration.
I also wish to acknowledge my parents, the late Samson Mibei and Mrs. Mary Mibei
who are my mentors and motivators, my brothers (Dr. Korir and Wilbert) and sisters
(Juddy and Abigael) who have been an encouragement to me.
Above all I give special thanks to God almighty for his favor and divine protection, his
mercies and strength in this academic journey.

1
CHAPTER 1: INTRODUCTION
1.1 Background Information
Most modern plastics are derived from natural materials such as oil, coal, and natural
gas. The starting point for the production process is distillation of the raw material in
petrochemical refineries into fractions. The heavy fractions give lubrication oils and
heavy oils used for heating fuels while the lighter fractions produce gas, petrol, paraffin,
and naphtha. The chemical building blocks for making plastics is mainly from naphtha
(Plastiquarian, 2015).
Naphtha undergoes a cracking process in which complex organic chemical compounds
are separated into smaller molecules, dependent on their molecular weight. These
smaller molecules include ethylene, propylene, butene and other hydrocarbons. The
compounds produced through the cracking process are then further refined to produce
the base plastic materials (Plastiquarian, 2015).
1.2 Different Types of Plastics
The Society of the Plastics Industry (SPI) established a classification system in 1988 to
allow consumers and recyclers to identify different types of plastic (ryedale , 2014).
Manufacturers place an SPI code, or number, on each plastic product, usually moulded
into the bottom. This guide provides a basic outline of the different plastic types
associated with each code number (Shafferina, 2016). Table 1.1 shows the SPI codes
of different types of plastics and their names.
Many common household items such as carpet fiber, medicine jars, beverage bottles,
mineral water bottles, fruit juice containers, clothing and rope are made of PET plastic.
This PET plastics are preferred because they are lightweight, pressure-resistant and
suitable for large-capacity (Cepeliogullar and Putun, 2013).

2
Table 1.1: SPI codes for different types of plastics and their names
SPI CODE STRUCTURE NAME
Polyethylene Terephthalate
High Density Polyethylene
Poly Vinyl Chloride
Low Density Polyethylene
Polypropylene
Polystyrene
Miscellaneous types of
plastics
HDPE is characterized by a long linear polymer chain with high degree of crystallinity
and low branching which leads to high strength properties. HDPE is widely used in
manufacturing of milk bottles, detergent bottles, oil containers, toys and more. The
various applications contribute about 17.6% in plastic waste category which is the third
largest plastic type found in municipal solid waste (MSW) (Michael, 2010).
Polyvinyl Chloride uses include wire and cable insulation, pipes, plumbing pipes,
window frames, boots, medical devices, blood bags, automotive interiors, packaging,
credit cards, synthetic leather etc. PVC is manufactured from the mixture of 57%

3
chlorine (derived from industrial grade salt) and 43% carbon (derived from
hydrocarbon feedstock such as ethylene from oil or natural gas), hence making PVC
harmful if ingested (British Plastics Federation, 2015).
LDPE has more branching that results in weaker intermolecular force, thus lower tensile
strength, and hardness. However, LDPE has better ductility than HDPE since the side
branching causes the structure to be less crystalline and easy to be molded. As a result
of its high resistance to water, LDPE is used as wrapping foils for packaging, cling
films, plastic bags, trash bags etc. LDPE items are widely used globally and its waste
has accumulated to high and toxic levels. As a result, according to Michael, (2010) it
is the second largest plastic waste in MSW after PP. It is durable and flexible.
Polypropylene being a saturated polymer has a linear hydrocarbon chain, it is strong
and can usually withstand higher temperatures. PP contributes about 24.3% in plastic
wastes category which are the largest number of plastics found in MSW (Michael,
2010). The diverse applications include flowerpot, lunch boxes, office folders, car
bumpers, pails, carpets, furniture, storage boxes, margarine containers, yoghurt pots,
syrup bottles, prescription bottles and plastic bottle caps.
Polystyrene is made of styrene monomers obtained from the liquid petrochemical. The
structure consists of a long hydrocarbon chain with phenyl group attached to every other
carbon atom. Naturally PS is colorless although it can be colored by colorants. It is heat
resistant and it offers reasonable strength, durability and lightness making the polymer
desirable to be used in variety of sectors such as in food packaging (disposable coffee
cups, plastic cutlery, plastic food boxes), electronics, packaging foam, construction,
toys and medical appliances. The wide range of applications signifies the large amount
of waste from PS in MSW accumulated each year.

4
Miscellaneous types of plastic (Polycarbonate and Polylactide are included in this
category). Code 7 is used to designate miscellaneous types of plastic not defined by the
other six codes. Polycarbonate (PC) is used in baby bottles, compact discs and medical
storage containers.
1.3 Plastic Waste and Disposal
The global production of plastics was reported to be 299 million tons in the year 2013
and an increase of 4% has been reported over the year 2014 reaching a production rate
of 311 million tons (Wi, 2015). Plastics are vital in our daily lives. There is increased
dependency on them that is justified by their light weight, versatility and low production
cost relative to other classical materials such as concrete, wood and metal. Therefore,
they are considered to be key material in numerous sectors including engineering
applications, medical, construction, automotive, leisure, aerospace, packaging,
electronics, food etc. The increased demand for plastic materials now and even in future
has proved plastic revolution taking place in different sectors. Population explosion and
economic growth have also led to increased demand on plastic materials and their
feedstock chemicals used in their production. This on the other hand has made the
demand for plastics grow more rapidly over the last two decades. Table 1.2 shows the
global consumption of individual plastics.
As far as individual plastics are concerned, polyolefins account for 53% of the total
consumption.
In Kenya’s capital city of Nairobi, an estimated 2,400 tons of solid waste is generated
daily, 20% of which is in plastic form (The world bank, 2020).

5
Table 1.2: Global consumption of individual plastics
Type of plastic Consumption %
Polythene (PE) 33.5
Polypropylene (PP) 19.5
Polyvinylchloride (PVC) 16.5
Polystyrene (PS) 8.5
Polyethylene terephthalate (PET) and
polyurethane (PU) 5.5
Styrene copolymers (ABS, SAN, etc.) 3.5
Blends, alloys, high performance and specialty
plastics, thermosetting plastics, and so forth 13
The increase in demand for plastics can only lead to the accumulation of plastic solid
waste (PSW) which takes up a large share of the municipal solid waste (MSW) sector
in developed and developing countries alike. The disposal and decomposition of
plastics has been an issue which has caused a number of researches to be carried out in
this regard. Currently the disposal methods employed are:
1. Land filling: scarcity of land, generation of explosive greenhouse gases (such
as methane) and poor biodegradability of commonly used packaging polymers
make landfilling an unattractive option for plastic waste disposal.
2. Mechanical recycling: This is reprocessing of the used plastics to form new
similar products, where mechanical (physical) means of treatment are used to
re-extrude process and convert PSW typically blended with virgin polymers
aiming at reducing overall cost. It is not cost effective as it requires high energy
for cleaning, sorting, transportation and processing to make a serviceable
product.

6
3. Biological recycling: This is by enabling micro-organisms in the environment
to metabolize the molecular structure of plastic films to produce an inert humus-
like material that is less harmful to the environment. However, there are a
number of difficulties over the use of degradable plastics. First, appropriate
conditions are necessary for the degradation of such plastics, such as presence
of light for the photodegradable plastics. Second, greenhouse gases such as
methane is released when plastics degrade anaerobically (Panda et al., 2010).
4. Thermal and chemical recycling: where a chemical alteration in the polymer
structure is performed via chemical, thermo-chemical means, or where PSW is
utilized as a monomer feedstock in industrial recycling loops.
5. Energy recovery: This entails recovery of steam, heat and electricity from waste
through combustion.
The conversion of plastics to valuable energy is possible as they are derived from
petrochemical source, essentially having high calorific value. Hence, pyrolysis is one
of the routes to waste minimization that has been gaining interest recently.
1.4 Problem Statement
Due to increased littering in most parts of Kenya, a lot of concern has developed
between scientists and philosophers about the plastic waste and currently it is an
ongoing debate. Among the factors that have led to increase in amounts of waste in
most parts of the world is rapid urbanization. This has posed a challenge in waste
disposal particularly plastics because the time period for which the plastic remains in
use is very small. The problem is more acute in developing countries such as Kenya.
At present there is a large number of plastic wastes, particularly plastic bags, detergent
containers, used yoghurt cups, packaging materials and plastic bottles, which are seen

7
littered all over in Kenya. This has led to environmental degradation, especially in
major cities and towns.
Despite the ban on plastic bags in Kenya in 2017, there are still other plastic waste from
food packaging materials, drinking water bottles, disposable juice cups and disposable
plates. The National Environment Management Authority (NEMA) of Kenya indicates
that 50 million bottles are used in Kenya annually, creating monumental environmental
challenge (Capital business, 2018).
Plastic is a major pollutant being composed of toxic chemicals and most importantly a
non-biodegradable substance, plastic disposal leads to air and water pollution. It also
mixes with food posing a negative impact on the environment, humans, and animals.
Thermal and catalytic pyrolysis has previously been of focus hence this research is an
experimental analysis of a cheaper local clay catalyst to produce liquid fuel from waste
plastics. Clays are hydrated silicates of Al, Fe, or Mg, both crystalline and amorphous
composed mainly of silica, alumina and water (Murray, 2004). All clays are hydrous
aluminosilicates with a phyllosilicate structure and with very small grain size of less
than 4 μm. The minerals carry excess negative charge owing to internal substitution of
Si+4 by lower valent cations and thereby increase internal chemical reactivity in ion
exchange. Kenyan clay soil contain silica and alumina which makes it an appropriate
catalyst in fast pyrolysis of plastic waste.
1.5 Justification
Plastics are not biodegradable and safe disposal of waste is an environmental challenge
all over the world. One thermochemical disposal method of plastic waste is of pyrolysis
which produces clean liquid fuel. Pyrolysis of plastic waste to liquid fuel is one way of
creating job opportunity to the unemployed Kenyans. Catalytic pyrolysis is superior to

8
thermal pyrolysis as it uses lower temperatures and hence less energy. The use of locally
available clay reduces the overall cost of production.
Total global production of plastics has been on a steady rise over the last 10 years. Table
1.3 shows global production of plastics from 2010 to 2019 in million metric tons.
Table 1.3: Global production of plastics from 2010 to 2019 (in million metric tons)
(Garside, 2020)
YEAR Metric tons (million)
2019 368
2018 359
2017 348
2016 335
2015 322
2014 311
2013 299
2012 288
2011 279
2010 270
The liquid fuel can be used as an alternative source of energy in diesel engines as
transport fuel, in turbines for electricity generation and as heating source in boilers and
furnaces. This research is important in waste management and alternative energy
generation.
1.6 Research Objectives
Main Objective
To produce liquid fuel for use in diesel engines, industrial furnaces and boilers from
plastic waste through catalytic pyrolysis using local clay as a catalyst.

9
Specific Objectives
i. To characterize indigenous clay catalyst
ii. To determine the effect of pyrolysis operating variables (catalyst concentration
and reaction temperature) on liquid fuel yield.
iii. To characterize the liquid product for hydrocarbon components.
iv. To determine the liquid oil for fuel characteristic properties.
10
CHAPTER 2: LITERATURE REVIEW
2.1 Introduction
Pyrolysis is a tertiary recycling technique in which organic polymers are converted into
liquid oil, char and gases at high temperatures via thermal decomposition (Chen et al.,
2014; Ouda et al., 2016; Anjum et al., 2016). It is the process of thermally degrading
long chain polymer molecules into smaller, less complex molecules through heat and
pressure. The process requires intense heat with shorter duration and in absence of
oxygen. The three major products that are produced during pyrolysis are valuable for
industries especially production and refineries. Pyrolysis has been chosen by many
researchers since the process is able to produce high amount of liquid oil up to 80 wt.%
at moderate temperature around 500 ℃. In addition, pyrolysis is also very flexible since
the process parameters can be manipulated to optimize the product yield based on
preferences. The liquid oil produced contain diesel oil, gasoline and light fuel oil. The
pyrolysis of plastic wastes produces a whole spectrum of hydrocarbons including
paraffins, olefins, iso-alkanes and aromatics.
Pyrolysis is a promising technology for converting plastic waste into liquid oil and other
value-added products such as char and gases. It is mostly used compared to other
thermal technologies such as plasma arc gasification and incineration with a lower
annual capital cost (US $17–25 per ton) and net operational cost (US $2–3 per ton
products) (Ouda et al., 2016).
2.2 Classification of Plastics
Based on the chemical structure and the order of crosslinking between the
macromolecules, plastics can be categorized as thermosets, elastomers and
thermoplastics, (Frank and Biederbick, 1984) as shown in Figure 2.1.

11
Thermosetting polymers are converted into their final form by heat and once set cannot
be softened by further heating. Examples of thermosetting plastics are melamine
formaldehyde which is used in the manufacture of Formica and polyester resins which
are used in kitchen work surfaces and glass reinforced plastics work respectively.
Through moderate heating, thermoplastics are softened and become fused (plastic). On
cooling they harden again. This process can be repeated many times without radically
altering the thermoplastic properties. Examples of thermoplastics are acrylic and
styrene.
Elastomers are of soft elasticity and usually cannot be melted.
Thermoplastics (Linear or with
branches macromolecule chains)
Elastomers (Far knit
crosslinking)
Thermosets (Narrow knit
crosslinking)
Figure 2.1: Principle structure of linear (A), with side chains (B) and crosslinked
macromolecules (C and D). Chain structure (A) and (B) are thermoplastic
types, structures with low crosslinking (C) elastomers and with strong
crosslinking thermosets (D) (Frank & Biederbick, 1984).

12
Processing of plastics comprises a variety of operations involving flow and shaping of
polymer melts into finished articles. For thermoplastic resins the most common
processing operations are extrusion and molding. In extrusion, after melting solid
plastic resin it is shaped in a continuous part of a defined cross-section. This is done
through screw conveying. The melt is forced to flow through a die. Die forming is used
in different activities such as pipe and tubing, wire, film, cable coating and in sheets.
Non-continuous processes are involved in molding such as compression molding,
injection molding, rotational molding and blow molding in which three-dimensional
parts are made in a closed mold. Most of the molded products are solid, hollow, or
surfed. Other thermoplastics operations include casting calendaring and
thermoforming. In distinction to thermoplastics, thermosetting resins use low viscosity
components which, through chemical reaction, produce the solid part in the mold. There
are different processing methods for thermoset systems such as injection molding,
transfer molding and compression molding. Pultrusion, open mold processing, reaction
injection molding and resin transfer molding are some of the specialized techniques
made for fiber reinforced thermosets.
2.3 Material Properties of plastics
2.3.1 Formation and structure
The basic structure of plastic polymers is given by macromolecular chains, formulated
from monomer units by chemical reactions. Typical reactions for chain assembling are
polyaddition (continuous or stepwise) and condensation polymerization
(polycondensation) (Frank and Biederbick, 1984). Figure 2.2 shows the process for
plastic generation.
1. Polyaddition as chain reaction: This is the process of chemical combination
of a large number of monomer molecules, whereby the monomers are combined

13
to a chain either by orientation of the double bond or by ring splitting. No by
products will be separated and no hydrogen atoms will be moved within the
chain during the reaction. The process is started by energy consumption through
heat or radiation or by use of catalysts.
Figure 2.2: Process for plastic generation (Frank and Biederbick, 1984)
2. Polyaddition as step reaction: This is the process of combination of monomer
units without a reaction of double bonds or separation of low molecular
compounds. Hydrogen atoms can change position during the process.
3. Polycondensation: This is the generation of plastics by buildup of
polyfunctional compounds. Typical small molecules like water or ammonia can
be set free during the reaction. The reaction can occur as a step reaction.
The monomer units are organic carbon-based molecules. Carbon and hydrogen atoms
are the main components while elements like oxygen, nitrogen, sulfur, fluorine or

14
chlorine can be contained in the monomer unit. The type of elements, their proportion
and placing in the monomer molecule gives the basis for generating different plastics
as shown in Table 2.1.
Table 2.1: Examples of common plastics and their monomers
Monomer Polymer
Ethylene CH2 = CH2 Polyethylene (PE)
Propylene
CH(CH3) =
CH2
Polypropylene (PP)
Vinyl chloride
CH2-
CH(Cl)
Polyvinylchloride
(PVC)
Tetraflorethylene CF2 = CF2
Polytetraflorethylene
(PTFE) - (CF2 = CF2)n-
The coupling between the atoms of a macromolecular chain happens by primary
valence bonding (Kauffman, 1988). The main chain comprises of carbon atoms joined
together by either single or double bond. The electron configuration of carbon atoms
gives the link between the carbon atoms which occur at a certain angle, for example,
for single bonding at an angle of 109.5 ℃. Atoms like hydrogen which are linked to the
carbon atoms, hinder the free rotation of the carbon atoms around the linking axis. The
‘cis’- link of carbon atoms have the highest bonding energy while the ‘trans’-link has
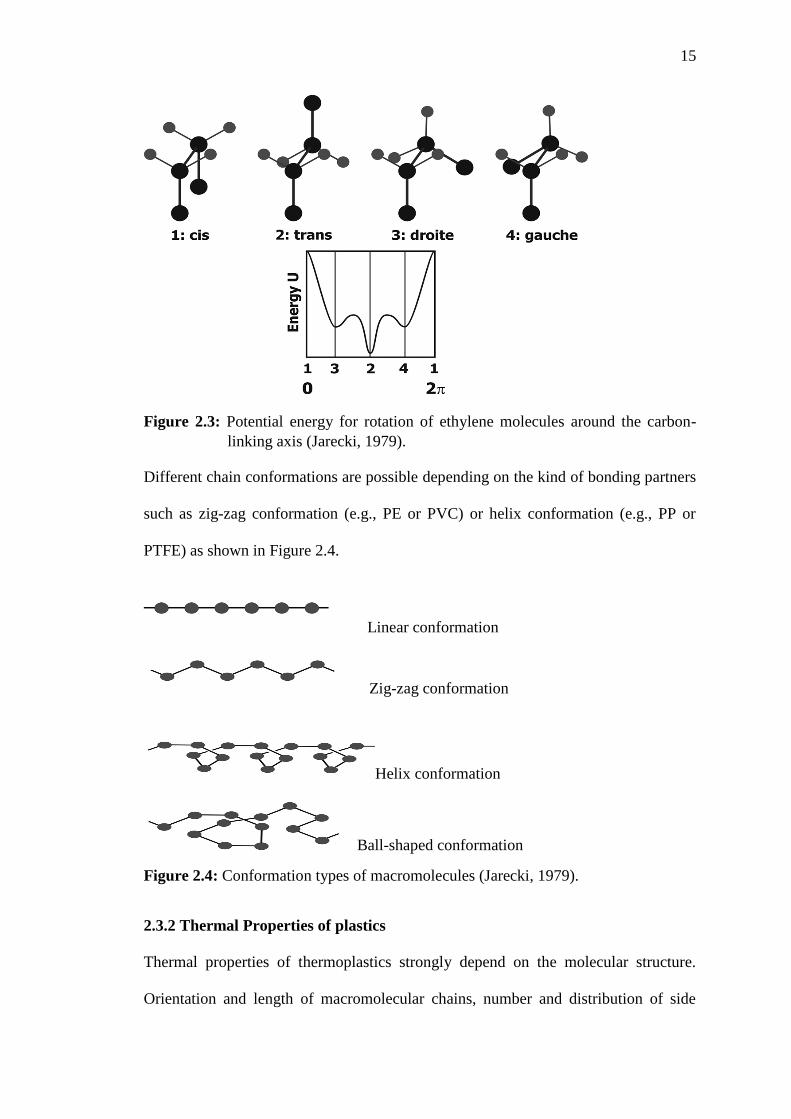
the lowest (Jarecki, 1979). Figure 2.3 shows the potential energy for rotation of ethylene
molecules around the carbon-linking axis.
15
Figure 2.3: Potential energy for rotation of ethylene molecules around the carbon-
linking axis (Jarecki, 1979).
Different chain conformations are possible depending on the kind of bonding partners
such as zig-zag conformation (e.g., PE or PVC) or helix conformation (e.g., PP or
PTFE) as shown in Figure 2.4.
Linear conformation
Zig-zag conformation
Helix conformation
Ball-shaped conformation
Figure 2.4: Conformation types of macromolecules (Jarecki, 1979).
2.3.2 Thermal Properties of plastics
Thermal properties of thermoplastics strongly depend on the molecular structure.
Orientation and length of macromolecular chains, number and distribution of side

16
chains, crystalline structure or level of molecular links influence the thermal properties
(Jarecki, 1979). The phase transitions of thermoplastic resins are glass transition,
crystallites melting and thermal degradation of macromolecular chains. Physical
properties like specific volume, heat capacity, heat conduction or thermal conduction,
characterize the material behaviour regarding thermal energy absorption and transport,
this therefore show a distinctive dependence of the material temperature and vary
particularly in the ranges of phase transitions. Depending on the physical and chemical
structure of thermoplastic resin, the following phase transitions will occur on increasing
material temperature (Jarecki, 1979).
1. Glass transition (Tg)
Below the glass temperature (Tg) the mobility of the molecules (Browns macro-
mobility) is strongly curbed by intermolecular interaction. There are no position change
processes, only restricted thermal induced movements of chain segments or side chains.
At the glass temperature Browns micro-mobility of chain segments and side chains
starts to occur and the plastic becomes softer but is still mechanically stable. Before the
molecules reach the glass temperature second order relaxation processes are possible.
The single-molecule segments obtain a restricted mobility.
2. Flow temperature (Tf)
When the temperature is increased the hindering influence of intermolecular interaction
decreases. On attaining the flow temperature (Tf) complete macromolecular chains can
slip against each other (Browns macro-mobility). The amorphous structures of the
plastic become softer and begins to melt. There is no chemical degradation of the
macromolecules of the plastic at this state.

17
3. Crystallite melting temperature (Tm)
The semi crystallite thermoplastics on reaching the crystallite melting temperature, the
forces responsible for crystallite forming will break and the crystallites begin to melt.
The entire thermoplastic is plasticized because the temperature range of crystallite
melting exceeds the flow temperature of the amorphous state. The resin can be
solidified by cooling as long as there is no thermal degradation in the molten phase.
Depending on duration and speed of cooling crystallite phases will be generated. The
size and distribution of the crystallites can differ from the original status.
4. Thermal decomposition (Td)
When the decomposition temperature is exceeded in the molten phase of thermoplastics
and thermoplastic elastomers, the macromolecules start to decompose caused by
intensive thermal oscillations. Separation of monomer units, oxidation or chemical
conversion into reaction products are possible reactions. The resin will be irreversibly
chemically modified. The decomposition products will be separated as gaseous phase
or will remain as components in the residual material. The start of decomposition is
dependent on the intensity of the thermal input. Table 2.2 gives a summary of phase
transition temperatures of typical thermoplastic resins.
Table 2.2: Phase transition temperatures for thermoplastic resins (Jarecki, 1979)
Resin Glass temp Tg (℃) Flow temp Tf (℃) Crystallite melt
temp Tm (℃)
Decomposition
temp Td (℃)
HDPE -95 210-270 130 – 146 360 – 390
PS 97 160 180 – 200 318 – 348
PP -18 230 160 – 208 336 – 366

18
2.3.3 Thermal decomposition of plastics
Phase-transition temperature are dependent on the molecular structure of the plastic.
Limited mobility of the molecule chains, for example, by loop forming, long side chains
or high molecular weight cause an increased phase-transition temperature.
2.3.4 TGA Analysis of plastic wastes
TGA analysis of the plastic has been carried out to determine optimum conditions for
thermal decomposition under controlled conditions. The thermal degradation of PP
starts at the lowest temperature of around 240 ℃ and shows a single step decomposition
with maximum decomposition at around 425 ℃. PP half carbon chain consists of
tertiary carbons which favor carbocation process during the thermal degradation which
may lead to its degradation at a lower temperature (Jung et al., 2010).
PS also shows single stage decomposition that starts at 330 ℃ and attains maximum
decomposition at around 470 ℃. PS degradation follows both end-chain and random
chain scission mechanisms which enhance its degradation process (Lee et al., 2012).
PE showed two-stage degradation, the first stage started at around 270 ℃ and the second
thermal degradation started at temperature of around 400 ℃. PE plastics requires high
temperature to degrade as compared to PVC and PS (Wu et al., 2014). PE consists of
long chain and follows the random chain scission mechanism during its thermal
degradation, which requires relatively higher temperature (Lee et al., 2012).
2.4 Pyrolysis
In the present study the characteristics of pyrolysis liquid oil was analyzed and
compared with conventional diesel and gasoline. Table 2.3 shows the characteristics of
conventional diesel oil. The fuel properties such as viscosity, density, pour point,
freezing point, flash point and HHV are important for analyzing the quality of fuel. The

19
kinematic viscosity of fuel dictates the spray pattern and atomization of injected fuel in
a combustion chamber. The higher viscosities of fuel results in poor atomization,
leading to poor engine start-up and performance. Furthermore, highly viscous fuels
have reduced flow ability, especially during winters, which adversely affects the fuel
injector function and causes problems in engine start up and running (Miandad et al.,
2016). HHV is an important characteristic of any petroleum product, especially when
considered for energy production. High HHV means high energy contents that result in
achieving the required target energy with less amount of fuel.
Table 2.3: Characteristics of conventional diesel oil
Parameters Units Conventional Diesel Reference
Dynamic Viscosity mm2/s 2.0-5.0 Syamsiro et al. (2014)
Kinematic Viscosity cSt 2.0-5.0 Syamsiro et al., 2014
Density @ 15 ℃ g/cm3 0.815-0.870 Syamsiro et al., 2014
Pour Point ℃ 6 Ahmad et al. (2015)
Flash Point ℃ 52 Syamsiro et al., 2014
HHV MJ/Kg 43.06 Syamsiro et al., 2014
The liquid oil produced can be used in multiple applications such as furnaces, boilers,
turbines and diesel engines without the needs of upgrading or treatment. The gaseous
pyrolysis by product has substantial calorific value and can be reused to provide the
energy requirement for the pyrolysis plant. Pyrolysis process is much easier and flexible
than recycling method since it does not need an intense sorting process, thus less labor
intensive.

20
In gasoline production aromatics, naphthene and isoalkanes are highly desirable,
whereas olefins and n-paraffins are less desired. Accordingly, it is desirable that the
pyrolytic conversion of plastic wastes produces more aromatics, naphthene and iso-
alkanes with carbon number in the range C5–C8.
2.4.1 Pyrolysis operating parameters
It should be noted that the product yield and quality heavily depend on a number of
operating parameters. The main parameters include temperature, residence time,
feedstock composition, choice of catalyst, particle size, type of reactors, pressure,
heating rate and type of fluidizing gas with its flow rate. The optimum operating
conditions are obtained after the study because they affect the quality of pyrolytic oil.
1. Temperature
Temperature is the most important factor affecting the quality and quantity of pyrolysis
products. Temperature affects the cracking reactions that alter the yield of gases and
liquid oil. There is little effect on the amount of produced char (Lopez et al., 2011c).
At low temperature long chain hydrocarbons are produced, while an increase in
temperature results in short carbon chain compounds due to the cracking of C-C bonds.
Aromatic compounds are produced at higher temperatures due to triggering of
secondary process reactions.
2. Retention time and feedstock composition
Retention time has shown little effect on the quality of pyrolysis, the same yield of
liquid oil has been observed at 30 min and 120 min retention times (Lopez et al., 2011).
The aromatic compounds present in liquid oil were similar at different retention time
with the same temperature (Lee and Shin, 2007). The feedstock composition affects the
yield of pyrolysis products, PE and PP types of plastics require higher temperatures for

21
their complete degradation as compared to PS plastic, due to their complex structure
(Miskolczi et al., 2009).
3. Use of catalyst
Catalysts improve the quality of pyrolysis products and also reduce the process
temperature and retention time. Fe2O3 (Sarker and Rashid, 2013), Ca (OH)2 (Sarker et
al., 2011a,b), FCC (Lee, 2009), natural zeolite (Syamsiro et al., 2014) and synthetic
zeolite (Lopez et al., 2011) are different catalysts used in the process of catalytic
pyrolysis. A range of other catalysts have been utilized, including Red Mud (Lopez et
al., 2011a), ZSM-5 (Lopez et al., 2011a), HZSM-5 (Hernandez et al., 2007), Y-zeolite
(Lee, 2012), in catalytic pyrolysis to improve the quality of liquid oil (Wang and Wang,
2011). Catalysts increase the rate of cracking reactions that lead to increase in the yield
of gases and reduction in the yield of liquid oil (Syamsiro et al., 2014). The catalysts
improve the quality of liquid oil, some of the larger carbon chain compounds are
adsorbed into the catalysts or broken down further into small carbon chain compounds.
The catalysts increase the lighter fractions in the liquid oil such as gasoline (Lerici et
al., 2015), and decrease the overall process energy-inputs (Lopez et al., 2011a). For
instance, the use of ZSM-5 catalyst decreased the impurities such as solid residue,
sulphur, nitrogen, and phosphorous in the produced liquid oil (Miskolczi et al., 2009).
The catalysts characteristics that affect the catalytic activity of the catalysts are BET
surface area, pore size, pore volume and acidity. It is also reported that the use of
catalysts with a high BET surface area allows more contact between reactants and the
catalyst surface, resulting in an increased rate of cracking reaction to produce more
gases than liquid oil (Syamsiro et al., 2014).

22
2.4.2 Products of pyrolysis process
1. Liquid oil and its applications
Liquid oil from pyrolysis of plastics can be used as an alternative source of energy
(Rehan et al., 2016b). Lopez et al. (2011) and Williams, (2006) reported that the
pyrolysis process can convert 78–84% plastic by weight into liquid oil. Table 2.4 shows
the product distribution in plastic pyrolysis.
Table 2.4: Product distribution in plastic pyrolysis (% wt of feed) (Kaminsky, 1992)
Feed Pyrolysis
temperature (℃)
Gas Oil Residue Other
PE 760 55.8 42.4 1.8 -
PP 740 49.6 48.8 1.6 -
PS 581 9.9 24.6 0.6 64.9(styrene)
PE/PP/PS 750 52.0 46.6 1.4 -
In thermal pyrolysis, temperatures above 700 ℃ are required for polymer cracking
whereas in catalytic pyrolysis the temperature can be lowered to 300- 400 ℃.
2. Char and its applications
Char is a by-product of the pyrolysis process. It is the unburnt plastic left over in the
reactor. The remaining char has fixed carbon, volatile matter, moisture content and a
small amount of ash. Production of char is very low in quantity (1–1.3 g from 1 kg
plastic) in comparison to other process products such as liquid oil and gases (Lopez et
al., 2009; Williams, 2006). Jindaporn and Lertsatitthanakorn (2014) prepared a
briquette after crushing the HDPE char into powder. The produced briquette (1 kg) was
used to heat 1 litre of water (from room temperature to boiling temperature) within 13
min. The char has the potential to be used in various environmental and energy

23
applications such as heavy metal adsorption from the municipal and industrial
wastewater and toxic gases (Heras et al., 2014). Bernando, (2011) upgraded the char
from co-pyrolysis of PE, PS and PP waste with biomass and waste tires. The activated
char was used for the adsorption of methylene blue dye that showed a significant
adsorption of dye (3.59–22.2 mg/g). Moreover, char can be used as a feedstock for
activated carbon or source of energy for boilers (Fernandez et al., 2011).
3. Gases and its potential applications
The main gases produced from pyrolysis are methane, hydrogen, propane, propene,
ethane, ethene and butane (Williams and Williams, 1998). However, PET produced
additional gas components of carbon dioxide and carbon monoxide while hydrogen
chloride was also produced by PVC. The gas produced in pyrolysis process also has
significant calorific value. Pyrolysis of Poly-vinyl chloride produces Chlorine gas
(Chen et al., 2014) which is hazardous, this is the reason PVC plastic is not commonly
used in pyrolysis. Miskolczi et al,. (2009) reported that gases produced from pyrolysis
of agriculture plastic waste have 45.9 and 46.6 MJ/kg HHV. In addition, gases produced
from PP and PE pyrolysis have HHV of 50 and 42 MJ/kg respectively (Jung et al.,
2010). The gases produced from pyrolysis can be used for heating in boilers or in gas
turbine for generation of electricity without any flue gas treatment (Fernandez et al.,
2011). On the basis of their composition, 1-butene and isoprene can be recovered
through condensation and can be used in tires production (Frigo et al., 2014). While,
propene and ethane after separation from other gases, can be used as chemical
feedstocks to produce polyolefins (Sharuddin et al., 2016).
2.4.3 Thermal pyrolysis
A comprehensive study of the mechanism of plastic pyrolysis has been presented
(Cullis and Hirschler, 1981). Mechanisms of plastic pyrolysis:

24
(a) End-chain scission or depolymerization- the polymer is broken up from the end
groups yielding the corresponding monomer.
(b) Random chain scission- the polymer is broken up randomly into fragments of
uneven length.
(c) Chain stripping- elimination of reactive substitutes or side groups on the
polymer chain, leading to the evolution of a cracking product and a charring
polymer.
(d) Cross linking- formation of a chain network, this often occurs for thermosetting
polymers when heated.
2.4.4 Catalytic Pyrolysis
Catalyst speeds up chemical reaction but remains unchanged towards the end of the
process. When catalyst is used, the activation energy of the process is lowered down,
thus speeds up the rate of reaction. Therefore, catalyst reduces the optimum temperature
required and this is very crucial since the pyrolysis process requires high energy (highly
endothermic) that hinders its commercial application (Miandad et al., 2016). The usage
of catalyst may help in saving energy as heat is one of the most expensive costs in
industry. Besides that, catalyst has been used by many researchers for product
upgrading to improve the hydrocarbon distribution in order to obtain pyrolysis liquid
that has similar properties to the conventional fuel such as gasoline and diesel. Figure
2.5 shows comparison between thermal and catalytic pyrolysis.

25
Figure 2.5 Comparison of thermal and catalytic pyrolysis (Miandad, 2016)
The initial stage of catalytic pyrolysis, thermal cracking occurs on the external surface
of a catalyst. The internal porous structure of the catalyst act as channels for selective
movement and breakdown of larger compounds into smaller ones (Lee, 2009). Because
of the small pores of the catalyst gases are mainly produced inside the pores and wax
production is due to external cracking on the external site of the catalyst (Liu, 2000;
Mastral et al., 2006). Degradation of high olefin molecules occur in the outer surface
of the catalyst, further degradation and product selectivity take place in the internal
pores of the catalyst.
2.5 Reaction Mechanism for Plastic pyrolysis
2.5.1 Catalytic mechanism of Polyethylene
The mechanism of the process which involves the formation of carbenium ion
(isomerization, random chain scission and β cleavage, hydrogen transfer,
oligomerization/alkylation, aromatization) is influenced by the strength, density and
distribution of the acid sites of the catalyst. These determines the products obtained in
the pyrolysis reactions (Serrano, 2005).

26
The catalytic decomposition of the HDPE occurs following the carbonium ion
mechanism. The initial step occurs either by abstraction of the hydride ion (for Lewis
acid sites) or by addition of a proton (the Bronsted acid sites) in the C-C bonds of
polyethylene molecules or by thermal decomposition of polyolefins. Successive
scission of the main chain occurs to produce fragments having lower molecular weights
than that of polyethylene, the resulting fragments are cracked in subsequent steps (Park,
1999). The acid sites on the catalyst surface are responsible for the initiation of the
carbocation mechanism, which induces the degradation of HDPE. The acid sites
originate from the load imbalance AlO4- incorporated in the structure of the clay
catalyst. The content of AlO4- determines the number of acid sites in the catalyst while
topological factors related to its crystalline or amorphous structure influence the
strength of these acidic sites (Aguado, 2007).
The catalytic effects of catalysts in oil cracking are due to their acidic properties and is
explained by carbonium ion theory (Gates et al., 1979). The catalytic mechanism
involves the following:
Initiation- Initiation may occur on some defect sites of the polymer chains. For
instance, an olefinic linkage could be converted into an on-chain carbonium ion by
proton addition:
–CH2CH2CH_CHCH2CH2– + HX –CH2CH2 + CH=CHCH2CH2 + X-
(2.1)
Then the polymer chain may be broken up through ß-scission:
–CH2CH2C+HCH2–CH2CH2– –CH2CH2CH=CH2 + C+ H2CH2– (2.2)
Initiation may also take place through random hydride ion abstraction by low molecular
weight carbonium ions (R+)
-CH2CH2CH2CH2CH2CH2- + R+ -CH2CH2+CHCH2CH2CH2- + RH (2.3)

27
The newly formed on- chain carbonium ion then undergoes ß-scission as in equation
2.2
Depropagation- The molecular weight of the main polymer chains is reduced through
successive attacks by acidic sites or other carbonium ions and chain cleavage, yielding
an oligomer fraction (approximately C30-C80). Further cleavage of the oligomer fraction
by direct ß-scission of chain end carbonium ion leads to gas formation and a liquid
fraction (approximately C10-C25).
Isomerization -The carbonium ion undergoes rearrangement by hydrogen- or carbon-
atom shifts leading to a double bond isomerization of an olefin:
CH2=CH-CH2-CH2-CH3 H+ CH3=CH-CH2-CH2-CH3 -H+ CH3-CH=CH-CH2-CH3
(2.4)
Other important isomerization reactions are methyl-group shift and isomerization of
saturated hydrocarbons.
Aromatization- Some carbonium ion intermediates undergo cyclization reactions. The
hydride ion abstraction first takes place on an olefin at a position several carbons
removed from the double bond, the result is the formation of an olefinic carbonium ion:
R1+ + R2CH -CH-CH2CH2CH2CH2CH3 R1H + R2CH -
CHCH2CH2CH2C+HCH3 (2.5)
This carbonium ion undergoes intramolecular attack on the double bond:
(2.6)
These reactions provide a route to cyclization and formation of aromatics.

28
2.5.2 Thermal decomposition of polystyrene
Polystyrene decomposes to produce free radicals R1 and R2 by random chain-breaking
(equation 2.7).
(2.7)
The large free radicals continue to decompose to form styrene monomer and other
radical R3 and R4 which have shorter carbon chain (equations 2.8 and 2.9).
(2.8)
(2.9)
1,5- hydrogen transfer reaction occurs in the free radical R2. The hydrogen radical
produced by the breaking of main chain C-H bond combines with 1 carbon radical to
form R5 (equation 2.10).
(2.10)
R5 decompose to generate the styrene trimer and radical R6 (equation 2.11).

29
(2.11)
R5 produces the styrene dimer through the scission, combination and dehydrogenation
process (reactions 2.12 to 2.15). R5 decomposes to form radical R7 and polymer R8
which contain the terminal double bond (equation 2.12).
(2.12)
R7 undergoes scission and subsequent 1,3- hydrogen transfer reaction to obtain benzyl
R9 and styrene monomer (equation 2.13)
(2.13)
The addition reaction between benzyl R9 and polymer R8 form radical R10 (equation
2.14), which generates the styrene dimer by the scission and dehydrogenation reaction
(equation 2.15).
(2.14)
(2.15)

30
There are some small molecular species with low content such as toluene, diphenyl
methane, 1-2-diphenyl propane and allyl benzene which are formed beside the main
products during the decomposition process. These products are generated by the
reaction among benzyl, hydrogen radical and other free radicals.
(2.16)
The reaction between benzyl R9 and hydrogen radical gives toluene (equation 2.16).
(2.17)
Combination of two benzyl R9 radicals generate diphenyl ethane (equation 2.17). The
reaction between benzyl and the radical formed by chain scission gives diphenyl
propane (equation 2.18).
(2.18)
The radical R11 formed by the scission of polymer R8 react with hydrogen radical to
produce allyl benzene (equations 2.19 and 2.20).
(2.19)

31
(2.20)
2.6 Thermal and Catalytic Pyrolysis of Plastic Waste
Miandad et al., (2016) evaluated the factors affecting pyrolysis process such as the
temperature, retention time, feedstock composition and the use of catalyst in detail.
Pyrolysis can be carried out via thermal or catalytic routes. However, there are certain
limitations with the conventional thermal pyrolysis, where the whole process is
temperature-dependent (Sadaf et al., 2015; Tahir et al., 2015). The liquid oil from
thermal pyrolysis may contain impurities and residues (Borsodi et al., 2011). The
thermal pyrolysis of different types of plastic has been carried out extensively in the
past, including PE (Murata et al., 2004; Cha et al., 2002), PP (Dolezal et al., 2001; Kim
and Kim, 2004) and PS plastics (Faravelli et al., 2001; Cha et al., 2002). Moreover,
only few studies have focused on PVC, PET, polymethyl methacrylate and
polyurethane pyrolysis (Kaminsky et al., 2004a; Miskolczi et al., 2004). Thermal
pyrolysis of PS was easily carried out in comparison to HDPE, LDPE and PP pyrolysis
(Uddin et al., 1997), as the PE (HDPE and LDPE) and PP require higher temperatures
for degradation (Miskolczi et al., 2009). PE is converted into wax instead of liquid oil.
This applies in absence of a catalyst (Lee, 2012). The liquid oil produced by thermal
pyrolysis is composed of large carbon link compounds (Lopez et al., 2011c) and has
low quality due to low octane number, presence of high solid residues (Kim and Kim,
2004; Seth and Sarker, 2004) and impurities such as nitrogen, phosphorous sulphur and
chlorine (Miskolczi et al., 2009). Thermal pyrolysis of PE type plastics such as HDPE
and LDPE along with PP are difficult to conduct due to their crossed chain hydrocarbon
structures (Achilias et al., 2007).

32
A range of catalysts have been utilized, including Red Mud (Lopez et al., 2011a), FCC
(Lee, 2009), ZSM-5 (Lopez et al., 2011a), HZSM-5 (Hernandez et al., 2007), Y-zeolite
(Lee, 2012), Fe2O3 (Sarker and Rashid, 2013), Al2O3, Ca(OH)2 (Sarker et al., 2011a,b)
and natural zeolite (Syamsiro et al., 2014), in catalytic pyrolysis to improve the quality
of liquid oil (Wang and Wang, 2011). The catalysts increase the lighter fractions in the
liquid oil such as gasoline (Lerici et al., 2015), and decrease the overall process energy-
inputs (Lopez et al., 2011a). For instance, the use of ZSM-5 catalyst decreased the
impurities such as solid residue, sulphur, nitrogen and phosphorous in the produced
liquid oil (Miskolczi et al., 2009). It is also reported that the use of catalysts with a high
BET surface area allows more contact between reactants and the catalyst surface,
resulting in an increased rate of cracking reaction to produce more gases than liquid oil
(Syamsiro et al., 2014). The conversion rate was increased at low temperature in
catalytic conditions in comparison to thermal pyrolysis (Ding et al., 1997; Park et al.,
1999; Lee, 2001). Catalytic pyrolysis has the potential to convert 70-80% of plastic
waste into liquid oil that has similar characteristics to conventional diesel fuel; such as
the high heating value (HHV) of 38–45.86 MJ/kg, a density of 0.77–0.84 g/cm3, a
viscosity of 1.74 –2.5 mm2/s, a kinematic viscosity of 1.1–2.27 cSt, a pour point of (−9)
to (−67) ℃, a boiling point of 68–352 ℃, and a flash point of 26.1–48 ℃. Thus, the
liquid oil obtained from catalytic pyrolysis being of higher quality is useful in different
energy-related applications including transport fuel, electricity generation and heating
source. By-products obtained from the process like char is used as an adsorbent material
in removal of heavy metals, polluted air, pollutants and odour from waste water. Gases
produced are used as energy carriers.
Although catalytic pyrolysis is more advantageous, still it has some limitations such as
catalyst costs, increased parasitic energy demand and less reuse of catalyst. Scientists

33
have recommended a number of solutions to avert these problems including catalyst
regeneration, exploration of cheaper catalysts, overall process optimization etc. This
research solves the limitation of catalyst cost by exploring a cheaper clay catalyst.
2.7 Catalytic Pyrolysis Using Natural and Synthetic Zeolite Catalysts
Catalytic pyrolysis of various plastic wastes in the presence of natural and synthetic
zeolite catalysts was examined using a small pilot scale reactor. The catalytic pyrolysis
of polyethylene (PE), polypropylene (PP), polystyrene (PS) and their mixtures in
different ratios was commissioned (Miandad et al., 2017). The prepared sample of
feedstock was put into the heating reactor/chamber for pyrolysis. In each experiment,
the feedstock was heated to 450 ℃ with the heating rate of 10 ℃ per min and retention
time of 75 min. The catalytic pyrolysis of mixed plastic wastes in different ratios was
conducted with both natural and synthetic zeolite catalysts separately. At the end of
each experiment, the obtained yield was calculated by measuring the fractions of liquid,
gases and char on a weight basis. The obtained liquid oil was further characterized to
determine the effect of feedstock composition in the presence of natural and synthetic
zeolite catalysts. PS plastic waste resulted in the highest liquid oil yield of 54% using
natural zeolite and 50% using synthetic zeolite catalysts. Mixing of PS with other
plastic wastes showed reduced liquid oil yields as compared to single PS feedstock in
all the cases, except for slightly higher oil yields obtained in PS/PE/PP and
PS/PE/PP/PET samples with synthetic zeolite catalyst. The mixtures of PE and PP
yielded higher liquid oil as compared to single PE or PP feedstocks. In mixed plastic
wastes, the highest liquid oil yield of 60% was obtained from PS/PE/PP with the ratios
of 50/25/25% sample with synthetic zeolite, and the lowest yield of 18% was from
PP/PE (50/50%) sample with natural zeolite catalysts. The highest gases (69.2%) and

34
char (25.5%) yields were from PP/PE (50/50%) and PS/PE (50/50%) with natural
zeolite catalyst.
The GC–MS analysis revealed that the pyrolysis liquid oils from all samples mainly
consisted of aromatic hydrocarbons with a few aliphatic hydrocarbon compounds. The
types and amounts of different compounds present in liquid oils vary with some
common compounds such as styrene, ethylbenzene, benzene, azulene, naphthalene, and
toluene. The FT-IR data also confirmed that liquid oil contained mostly aromatic
compounds with some alkanes, alkenes and small amounts of phenol group. The
produced liquid oils have high heating values (HHV) of 40.2–45 MJ/kg, which are
similar to conventional diesel. The liquid oil has potential to be used as an alternative
source of energy or fuel production.
Considering the economic optimization of the process, natural zeolite was used as a
cheaper catalyst due to its availability along rivers for various plastic waste catalytic
pyrolysis in this study. The natural zeolite catalyst’s low BET surface area, microporous
structure and low acidity affect its catalytic activities. According to Miandad et al.,
(2016) modification of the surface and structure of natural zeolite is needed to enhance
its catalytic activities in the pyrolysis process. The modification of natural zeolite could
be carried out by acid leaching, thermal treatment and wet impregnation, as the next
step via physical or chemical treatments in order to increase its catalytic performance.
For instance, Sriningsih et al., (2014) carried out doping of Ni, Ni-Mo, Co and Co-Mo
metals on natural zeolite and observed that doping increased the catalytic properties of
natural zeolite. Life cycle assessments (LCA) studies (Rathore et al., 2016) of different
plastic waste types, catalytic process and products are vital for understanding the
economic, technical and environmental aspects of catalytic pyrolysis and its upscaling
and commercialization. For example, Wang et al,. (2015) investigated the LCA of

35
pyrolysis process and concluded that pyrolysis is one of the optimum practices for
plastic waste management among the waste disposal techniques. The study showed the
potential of Saudi Arabian natural zeolite as an alternative promising cheap catalyst in
pyrolysis technology. The Saudi Arabian zeolite had low acidity and microporous
structure which enhanced its catalytic properties, this is also determined in this research
for Kisumu county clay
2.8 Pyrolysis of different types of Plastics
Different types of plastics have different compositions that are normally reported in
terms of their proximate analysis. Proximate analysis is a measure of the chemical
properties of the plastic compound based on four particular elements which are
moisture content, fixed carbon, volatile matter and ash content (Kreith, 1998). Volatile
matter and ash content are the major factors that influence the liquid oil yield in
pyrolysis process. High volatile matter favours the liquid oil production while high ash
content decreases the amount of liquid oil, consequently increase the gaseous yield and
char formation (Abnisa and Wan, 2014).
Cepeliogullar and Putun, (2013) have explored the potential of PET in pyrolysis process
to produce liquid oil using fixed-bed reactor at 500 ℃. The heating rate was 10 ℃/min
and nitrogen gas was used as the sweeping gas in this experiment. It was observed that
the liquid oil yield was lesser than the gaseous product. The liquid oil obtained was 23.1
wt.% while the gaseous product was 76.9 wt. % with no solid residue left. The low
liquid yield could be explained by the relatively low volatile content of PET around
86.83% in comparison with other plastics in which the volatile contents were all above
90%. Half of the oil composition contained benzoic acid which was around 49.93%
based on the gas chromatography– mass spectroscopy (GC–MS) analysis. The acidic
characteristic in pyrolysis oil was unfavourable due to its corrosiveness that deteriorated

36
the fuel quality (Cepeliogullar and Putun, 2013). Besides that, benzoic acid was a
general sublime that could clog piping and heat exchanger, thus need a serious attention
if running in industrial scale (Wan, 2015 and Shioya et al., 2005).
Fakhrhoseini and Dastanian, (2013) reported liquid yield of 39.89 wt.%, gaseous was
52.13 wt.% and solid residue was 8.98 wt.% on PET pyrolysis. Therefore, it can be
concluded that the liquid oil production from the PET pyrolysis obtained in the ranges
of 23–40 wt.% while gaseous yield in the ranges of 52–77 wt.%. Based on these results,
PET might be the most suitable plastic to be used in pyrolysis if gaseous product
became a preference, for instance to provide energy supply to heat up the reactor at the
desired temperature.
Ahmad et al., (2014) explored the catalytic pyrolysis study of HDPE using micro steel
reactor. The pyrolysis temperatures were within 300– 400 ℃ at heating rate of 5–10
℃/min. Nitrogen gas was used as the fluidizing medium. From the experiment, they
found that the highest total conversion happened to be at 350 ℃ with liquid oil being
the dominant product yield (80.88 wt.%). The solid residue was very high at 300 ℃
(33.05 wt.%) but the amount was reducing to 0.54 wt.% at the highest temperature of
400 ℃.
Kumar and Singh, (2011) did the thermal pyrolysis study of HDPE using semi-batch
reactor at higher temperature range of 400–550 ℃. It was observed that the highest
liquid yield (79.08 wt.%) and gaseous product (24.75 wt.%) obtained at temperature of
550 ℃ while wax started to dominate in product fraction at higher temperature of 500–
550 ℃. The dark brownish oil obtained from the pyrolysis had no visible residue and
the boiling point was from 82 ℃ to 352 ℃. This suggested the mixture of different oil
component such as gasoline, kerosene and diesel in the oil that matched the properties

37
of conventional fuel as shown in Table 2.5. Besides, the sulphur content in the HDPE
pyrolytic oil was very low (0.019%) that made it cleaner to the environment.
Table 2.5: Comparison of HDPE pyrolytic oil and conventional fuel properties
(Shafferina, 2016)
Type of oil Boiling point ℃ CV (MJ/kg)
Gasoline 40–200 43.4–46.5
Kerosene 150–300 43.0–46.2
Diesel 150–390 42.8–45.8
HDPE pyrolytic oil 82- 352 42.9
Marcilla et al., (2009) have also studied the HDPE pyrolysis at 550 ℃ using batch
reactor. The liquid oil yield was 84.7 wt.% and gaseous product around 16.3 wt.%. The
above results showed higher liquid oil was obtained at high temperature. Further
increase in temperature decreased the production of liquid oil and increased the gaseous
products. This was because the process already surpasses the maximum thermal
degradation threshold. According to Mastral et al., (2007) while investigating HDPE
pyrolysis in a fluidized bed reactor at 650 ℃, he observed gaseous production was about
31.5 wt.% and liquid oil production was about 68.5 wt.%. This shows that the liquid
was cracked to gaseous when further heated up at temperature above 550 ℃.
Miranda et al., (1998) conducted the pyrolysis of PVC in a batch reactor at temperature
range of 225–520 ℃ and heating rate of 10 ℃/min. The experiment was done under
vacuum and total pressure of 2 kPa was applied. Liquid oil obtained varied from 0.45
wt.% to 12.79 wt.% as the temperature increased. Tar accumulation was even higher
than the liquid oil obtained and the amount kept increasing up to 19.6 wt.%. Toxic and
corrosive Hydrogen chloride (HCl) was found to be the main product obtained from the
experiment with the highest yield of 58.2 wt.%.

38
PVC was not preferable for pyrolysis as the production of liquid oil was minimal. Also,
the reaction is very toxic to the environment as it releases harmful products (e.g., HCl
and chlorinated compounds such as chlorobenzene in the pyrolysis liquid). In order to
reduce chlorine amount in liquid oil, dichlorination process of PVC was done. This
process could be achieved through several methods such as stepwise pyrolysis, catalytic
pyrolysis and pyrolysis with adsorbents added to the PVC sample (Lopez et al., 2011).
Hence, the pyrolysis of PVC required an additional cost when an extra dichlorination
step was needed which was one of the disadvantages to the industry.
In a study conducted by Ahmad et al., (2014) on PP pyrolysis within 250–400 ℃ using
micro steel reactor, they summarized that the highest liquid oil was achieved at
temperature of 300 ℃ around 69.82 wt.% with total conversion of 98.66%. The increase
in temperature to 400 ℃ only reduced the total product conversion to 94.3% and
increased solid residue from 1.34 to 5.7 wt.%. This indicates that coke formation started
to dominate at higher temperature.
However, Sakata et al., (1999) have explored the PP pyrolysis at higher temperature of
380 ℃. They found higher liquid yield of 80.1 wt.%, 6.6 wt.% gaseous and 13.3 wt.%
solid residue left. On the other hand, Fakhrhoseini and Dastanian, (2013) obtained
higher liquid yield about 82.12 wt.% when performed PP pyrolysis at 500 ℃.
Nevertheless, further increase in temperature more than 500 ℃ only reduced the liquid
yield collected. This was proven by Demirbas, (2004) who carried out the PP pyrolysis
at extreme temperature of 740 ℃ in a batch reactor which resulted in 48.8 wt.% liquid
yield, 49.6 wt.% gaseous and 1.6 wt.% char.
Onwudili et al., (2009) investigated the pyrolysis of PS in a batch pressurized autoclave
reactor at 300–500 ℃ for one-hour duration. The heating rate used was 10 ℃/min and

39
the experimental pressure given was 0.31 MPa up to 1.6 MPa. From the experiment,
they found that the PS pyrolysis produced a very high liquid oil yield around 97.0 wt.%
at optimum temperature of 430 ℃. The maximum amount of gas produced was only
2.5 wt.%.
Liu et al., (1999) reported high yield of liquid oil (98.7 wt.% at 600 ℃) product in the
pyrolysis of PS using fluidized bed reactor at temperature range of 450–700 ℃.
Nevertheless, the amount of liquid oil produced was also considered high at lower
temperature of 450 ℃ which was around 97.6 wt.% and it differed by only 1.1 wt.%. In
the case when energy saving was the priority, lower temperature was preferable as it
could reduce the energy cost incurred. Based on the study done by Demirbas, (2004),
the liquid oil reduced to 89.5 wt.% when the PS pyrolysis was running at 581 ℃ in a
batch reactor. Therefore, the PS pyrolysis was not recommended to run at temperature
more than 500 ℃ to optimize the liquid oil production. It can be concluded from the
various researches that, for thermal pyrolysis the temperature requirement is higher for
optimum liquid oil production.
2.9 Definition of Clay and Clay Minerals
Clay is defined differently by people in different disciplines and workers based on its
use, the nature of operations involved in its use and the purpose of the definition
(Grimshaw, 1971). Some definitions on such bases are; “Clay is plastic when wet”
(Grim, 1962), “Clay is any fine-grained natural earthy argillaceous material” (Grim,
1968). “Clay is any material whose particles are finer than 4μ” (Moore, 1989). Clay
implies an earthy, fine-grained material which develops plasticity when mixed with
limited amount of water (Mason, 1968). A concise definition by the American Ceramic
Society is, “Clay is a fine-grained rock which, when suitably crushed and pulverized,
becomes plastic when wet, leather-hard when dried and on firing is converted to a

40
permanent rock-like mass (Lawrence, 1982). Clay is composed mainly of silica,
alumina and water, frequently with appreciable quantities of iron, alkalis and alkaline
earths (Ralph, 1968). Clay mineral is defined as a stony or earthy mineral aggregate
consisting essentially of hydrous silicates of alumina, plastic when sufficiently
pulverized and wetted, rigid when dry, and vitreous when fired at a sufficiently high
temperature (Murray, 2004). They are essentially hydrous aluminous sheet silicates that
are fine-grained with variable composition and water content (Hans and Andrei, 2004).
They are crystalline in nature with layer silicates formed by condensation of sheets of
linked Si (OH)4 tetrahedra with those of linked M2-3(OH)6 octahedra, as the basic
structure (M is either a divalent or trivalent cation) (Theng, 1974). The grains are plate-
shaped and slide over each other’s surface thereby contributing to the smooth feel. They
contain impurities that contribute to plasticity, melt and color (Zakin, 2001).
2.10 Occurrence of the Clay Minerals
Clay minerals may be formed from weathering process, diagenesis, metamorphism or
hydrothermal process (Grimshaw, 1972; Weaver and Pollard, 1973). The nature of the
formation process significantly affects the crystallinity and purity of clay and its
associated minerals. Clays that are deposited and found at the site of formation are
called primary clays while those formed and eroded to a different site after formation
are called secondary clays (Theng, 1979). Clay mineral deposits occur either as a
relatively pure concentration of the mineral or a mixture of clay minerals. The four
major mineral groups with different chemical and mineral composition, physical
structures, and crystal orientations include kaolin, smectites (or montmorillonites),
illites, and palygorskite-sepiolite groups which occur in relatively pure concentrations
(Hans and Andrei, 2004). Other mineral groups are chlorites and vermiculites which
occur as mixtures with non-clay minerals such as shales (Murray, 2004).

41
Kaolin is one of the widely used clay materials for a large number of applications such
as in ceramics, paper coating, paper filling, paint extender, rubber filler, cracking
catalyst for cements, oil refinery and water treatment (Belver et al., 2002; Caulcante et
al., 2005; Vaga, 2007; Salawudeen, 2007), cracking catalyst in the petroleum industry,
use in water and oil-based paints, pencil heads, carrier of fertilizers, desiccants, and
insecticides, among others (Murray, 2004). The percentage uses of kaolin in some of
the technological industries are: paper filling and coating 45%; refractories and ceramic
31%, fiberglass 6%; cement 6%, rubber and plastic 5%, paint 3%, others 4% (Murray,
2002).
Kaolinite is the major mineral component of kaolin, which may usually contain quartz
and mica and also less frequently feldspar, illite, montmorillonite, anastase, haematite,
bauxite, zircon, rutile, kyanite, silliminate, graphite, attapulgite and halloysites.
Kaolinite is a clay mineral with chemical composition Al2Si2O5(OH)4 (Belver et al.,
2002; Vaga, 2007). It is a layered silicate mineral comprising of one tetrahedral sheet
linked through oxygen atoms to one octahedral sheet of alumina (Deer et al., 1992).
Kaolin is used as raw material to make zeolites and Al silicates for use as catalysts in
refining of petroleum (Murray, 1994). Halloysites are used for manufacture of
petroleum cracking catalyst (Murray, 2004).
2.11 Structure and Composition of Clay Mineral
The basic phyllosilicate structure is the presence of SiO4 tetrahedral linked by sharing
of three of the four oxygens to form sheets of pseudohexagonal network (Mason, 1968).
Clay minerals are sheet structures basically composed of fine grains of silica-
tetrahedral layers and alumina octahedron layers. Figure 2.6 and 2.7 show silica
tetrahedral layers and alumina octahedral layers.
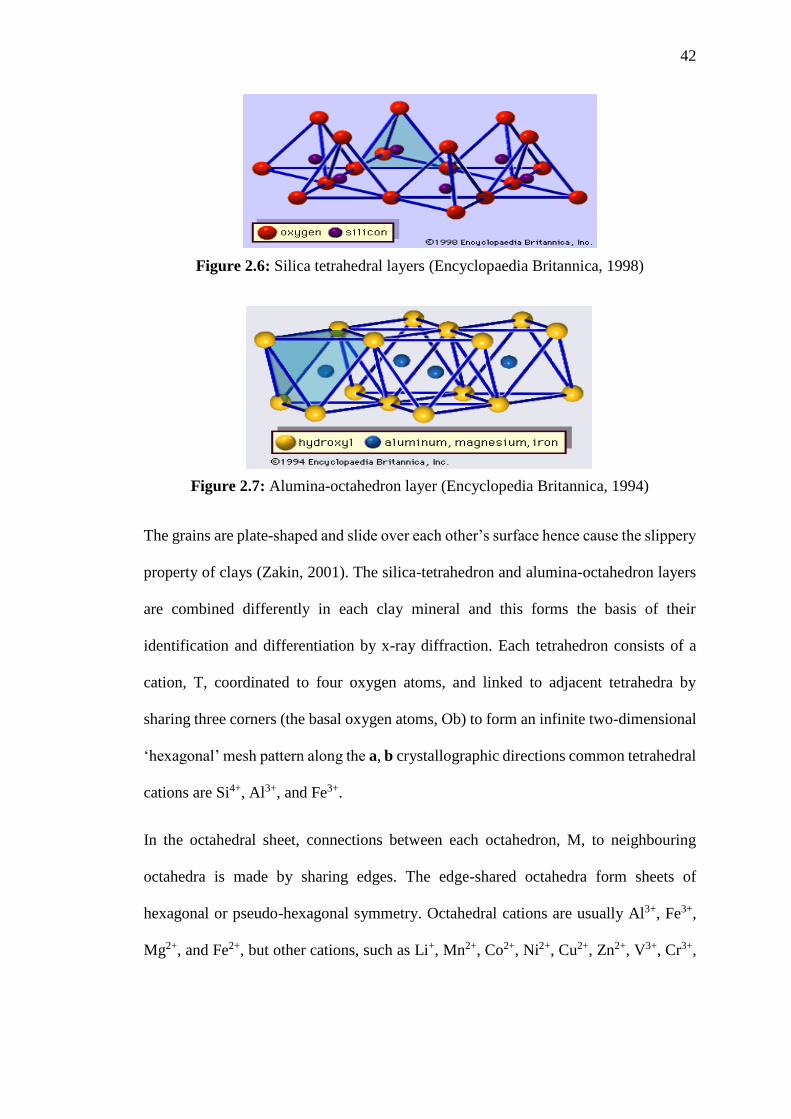
42
Figure 2.6: Silica tetrahedral layers (Encyclopaedia Britannica, 1998)
Figure 2.7: Alumina-octahedron layer (Encyclopedia Britannica, 1994)
The grains are plate-shaped and slide over each other’s surface hence cause the slippery
property of clays (Zakin, 2001). The silica-tetrahedron and alumina-octahedron layers
are combined differently in each clay mineral and this forms the basis of their
identification and differentiation by x-ray diffraction. Each tetrahedron consists of a
cation, T, coordinated to four oxygen atoms, and linked to adjacent tetrahedra by
sharing three corners (the basal oxygen atoms, Ob) to form an infinite two-dimensional
‘hexagonal’ mesh pattern along the a, b crystallographic directions common tetrahedral
cations are Si4+, Al3+, and Fe3+.
In the octahedral sheet, connections between each octahedron, M, to neighbouring
octahedra is made by sharing edges. The edge-shared octahedra form sheets of
hexagonal or pseudo-hexagonal symmetry. Octahedral cations are usually Al3+, Fe3+,
Mg2+, and Fe2+, but other cations, such as Li+, Mn2+, Co2+, Ni2+, Cu2+, Zn2+, V3+, Cr3+,

43
and Ti4+ are identified. Octahedra show two different topologies related to (OH)
position, i.e., the cis- and the trans-orientation
2.12 Clay as a Catalyst
Clays have very fine particles that yield very large-specific surface areas that are
physically adsorptive and chemically surface-active. Many clay minerals carry excess
negative electric charge owing to internal substitution of Si+4 by lower valent cations
and thereby increase internal chemical reactivity in chemical combination and ion
exchange. These characteristics contribute to the properties of clays which are of
technical applications (Murray, 2004).
Clays are in general constituted essentially by minerals that are hydrous silicates of
aluminum and/or magnesium, with significant amounts of iron, nickel, chromium and
other cations in the crystalline structure as an isomorphic substitution (Murray, 2007).
The peculiar crystalline structure of some clay minerals generates a capacity of
reversible exchange with organic or inorganic cations and metal-organic (Murray,
2007). The exchange of specific cations can generate active centers in the clay minerals,
making them catalysts, which can then be used for a large number of chemical reactions
in industries.
The properties of clays, that make them useful as catalysts are
(a) The crystalline structure.
(b) The modification of the original crystalline structure in a controlled way.
(c) The anisometric morphology and small sizes of the particles quite adapted for
use in catalysis.
(d) the change of its basal spacing by acid treatment and subsequent modification.
The classes of clay minerals include smectites (montmorillonite, saponite), mica (illite),
kaolinite, serpentine, pylophyllite (talc), vermiculite and sepiolite (Shichi and Takagi,

44
2000). Clays have adsorption capabilities which result from a net negative charge on
the structure of minerals and sorption properties attributed to their high surface area and
high porosity (Alkan et al., 2004).
Atomic lattices of most clay minerals consist of two basic structural units, one
consisting of closely packed oxygens and hydroxyls in which aluminium, iron and
magnesium atoms are embedded in an octahedral combination so that they are
equidistant from six oxygens or hydroxyls. The second unit is built of silica
tetrahedrons arranged to form a hexagonal network that is repeated indefinitely to form
a sheet of composition, Si4O6(OH)4 hydrated aluminium silicates with very fine particle
size, usually <2mm (Ralph, 1968). A layered structure is formed by the tetrahedral
sheet(s) linked to octahedral sheet through sharing of apical oxygens. The tetrahedra
contain mainly Si (IV) as the central atom, while the octahedral sites are occupied
mostly by Al (III), Fe (III) or Mg (II).
Clay minerals are sheet structures basically composed of fine grains of silica-
tetrahedral layers and alumina octahedron layers. The basic phyllosilicate structure is
the presence of SiO4 tetrahedral linked by sharing of three of the four oxygens to form
sheets of pseudo-hexagonal network (Mason, 1968).
The grains are plate-shaped and slide over each other’s surface hence cause the slippery
property of clays (Zakin, 2001). The alumina tetrahedron has a negative charge of -1,
the aluminium has a valence of +3, which is less than the valence of +4 silicon. This
charge is balanced by cations of alkali metals or alkaline earth metals (Na+, K+, Ca+2 or
Mg+2) present inside the porous clay structure by means of cation exchange. When these
cations are exchanged for protons, clay acid sites are formed. This exchange allows
modification of original properties of the clay. The acidity of the clay can be the

45
Bronsted acid type, proton donors or Lewis acid type, pair of electron acceptor (Manos
G. , 2006).
2.13 Chemical Analysis of Kano Plains Clay
In this research, clay from Kano plains was used as a catalyst. According to Oswago,
(2016) the major elements present in clays of Kano Plains, expressed in oxide form, are
silica (SiO2), Alumina (Al2O3), Iron (iii) oxide (Fe2O3) and water, H2O. The other
elements present in appreciable levels are potassium oxide, K2O, sodium oxide, Na2O
titanium oxide, TiO2 and calcium oxide, CaO, while those present in trace amounts are
magnesium oxide, MgO and Manganese oxide, MnO. The clay was found to have
appreciable amount of silica (50-56%) and alumina (12-17%) being requirements for a
good pyrolysis catalyst.
Deductions from literature survey
According to the literature survey studied above the following gaps were identified in
both thermal and catalytic pyrolysis of plastic waste:
• High cost of conventional catalysts
• Less reuse of catalyst after the pyrolysis process
• High energy demand for pyrolysis process
• Chemical and physical treatments of natural zeolite to increase catalytic activity.
• Oil from PET plastics contained corrosive benzoic acid
• HDPE oil had wax content
• Liquid Oil from PVC contained toxic and corrosive HCl

46
CHAPTER 3: METHODOLOGY
3.1 Materials/ Equipment
Specifications of apparatus and instruments include: Pulverizer (Retsch model No. Rs
200, at 1200rpm), Electronic weighing balance (Kernpu), Atomic Absorption
Spectrophotometer (Shimadzu model No. AA 7000), X-ray diffractometer (Rigaku
Miniflex 11) and X-ray fluorescence (Rigaku model No. ZSX primus 11). The current
and voltage settings for analysis of the elements are done automatically by the ZSX
software upon selection of the sample. Other equipment’s are the Pelleting machine,
Bomb calorimeter (Coshwania), Gas Chromatography - Mass spectrometer (GCMS QP
2010 SE) and Centrifuge (Hettich zentrifugen, at 2000 rpm). Round bottomed flasks,
Liebig condenser, Oil collection flasks, Electric brick furnace with Thermocouple for
temperature control, Rubber Tubing, Stands, Rubber corks, Density bottle,
Thermometer and Viscometer.
Waste plastics: The plastics were collected locally from Nandi Hills town dumpsite as
used detergent bottles (High density Polyethylene), used yoghurt cups (Polypropylene)
and used packaging materials (Polystyrene). Manufacturers place an SPI code, or
number, on each plastic product, usually moulded into the bottom. This guide provided
the basic outline for the different types of plastic associated with each code number.
Catalyst: The clay soil from Kisumu county was used to pyrolyze the plastic wastes.
The clay soil occur naturally along River Oren near Awasi town.
3.2 Catalyst Characterization
Characterization of the clay catalyst involved study of chemical composition,
concentration of specific metal elements and crystallographic structure of the clay.

47
3.2.1 Collection of clay sample
Awasi town is located in Kano plains of Kisumu county at the junction between
Kisumu-Kericho road. Figure 3.1 shows the soil map of Kano plains.
Figure 3.1: Soil survey maps for Kano plains, Kenya (Oswago, 2016)

48
The map reveal that the soils are majorly clay of different depths mixed sparingly with
loams and a few areas with sandy soils. This is supported by the physical clay
characteristics such as poor drainage which lead to flooding due to inability to absorb
water leading to surface run-off, hardening and cracking of the soils during dry seasons
and plasticity when wet. The clay soil was collected from the river banks of River Oren
near Oren market in Awasi. The ground was cleared of vegetation and any organic
matter. The soil was dug to approximately 60 cm to eliminate much of the organic
matter and obtain the clay soil. About 5 Kg of clay soil was collected and kept in a clean
container. The sample was dried in the sun for 7 days and then mixed thoroughly.
3.2.2 Clay sample Preparation
The collected clay soil was transferred into clean glass beakers, dried in the oven at 120
℃ for 3 hours and then cooled in a desiccator. Dried clay sample was fed into a
container and put inside the pulverizer for 2 minutes for grinding. Clay was ground into
fine powder of size 400 µm suitable for use in XRD and XRF laboratory analysis
(Norton, 1974, Richerson, 1992).
3.2.3 X-Ray Fluorescence Spectrophotometer (XRFS) Analysis
XRF analysis was used to determine the percentage composition of the elements in
oxide form. Oven dried clay powder was accurately weighed in an electronic weighing
balance and transferred into a clean dry porcelain crucible. Starch powder weighing 2g
was added to the sample. The mixture was then ground and uniformly mixed into a fine
powder using the pulverizer and then transferred into the pellet binder. Clay-starch
mixture was placed into a compressor and compressed 175 KN to form clay pellets
which were labelled and analyzed for mineral composition.

49
Clay pellets were fed into the sample holders in the XRF spectrometer and “EZ
analysis” mode was selected from default program in the ZSX software, the element of
choice was also selected. ZSX software had default calibrations for a given element to
be analyzed and the analysis proceeded automatically upon the press of a button. The
percentage composition of the element in oxide form was displayed on the screen. This
procedure was repeated for the other elements on test and the results recorded.
3.2.4 X-Ray Diffraction (XRD) Analysis
XRD analysis was performed to determine the crystalline structure of the clay samples.
Dried clay powder was fed into the cavity of the glass-walled sample holder of the
spectrometer. Each sample holder had a capacity that held about 0.35 g of powdered
sample after which the sample surface was flattened and compressed. Any extra sample
remaining on the glass plate portion of the glass sample plate was wiped off using a
clean paper soaked with alcohol.
The door on the front side of the XRD was opened and the glass sample plate mounted
onto the designated position of the standard sample holder. After closing the door, the
door knob was turned in clockwise direction to lock the door. X-ray diffractometer is
then set to rotate the sample holder through angle θ while the detector rotates through
2 θ. X-rays of Cu αk wavelength 1.54056 x 10⁻¹⁰ m will be selected and used to scan
the samples. Scans are taken between 2 θ of 10o and 2 θ of 45o. X-ray diffractometer
produces signals on a screen and the names and formulae of the minerals are printed.
3.3 Design of catalytic pyrolysis experiment
In an experiment, one or more process variables (or factors) are changed in order to
observe the effect the changes have on one or more response variables. The statistical
design of experiments (DOE) is an efficient procedure for planning experiments so that
50
the data obtained can be analysed to yield sound, valid, reliable and objective
conclusions.
In this experiment Response surface design was applied, this is important in
optimization of the experiments. Central composite design (CCD) contains an
imbedded factorial or fractional factorial design with centre points that is augmented
with a group of `star points’ or ‘axial points' that allow estimation of curvature. If the
distance from the centre of the design space to a factorial point is ±1 unit for each factor,
the distance from the centre of the design space to a star point is ±α with | α | > 1. The
precise value depends on certain properties desired for the design and on the number of
factors involved. A central composite design always contains twice as many star points
as there are factors in the design. The star points represent new extreme values (low and
high) for each factor in the design. To maintain rotatability, the value of α depends on
the number of experimental runs in the factorial portion of the central composite design:
α = [number of factorial runs]1/4. For full factorial α =[2k]1/4
where k – number of variables
In this experiment Design Expert software was used as it offers comparative tests,
screening, characterization, optimization, robust parameter design, mixture designs and
combined designs. The software determines the main effects of each factor as well as
the interactions between factors by varying the values of all factors in parallel. A
response surface model (RSM) was used to map out a design space using a relatively
small number of experiments. RSM provides an estimate for the value of responses for
every possible combination of the factors by varying the values of all factors in parallel
making it possible to comprehend a multi-dimensional surface with non-linear shapes.
The optimization feature was used to calculate the optimum operating parameters for

51
the process (Robert, 2010). Factors affecting the liquid oil yield are temperature,
catalyst amount and time of residence. Retention time has shown little effect on the
quality of pyrolysis, the same yield of liquid oil has been observed at 30 min and 120
min retention times (Lopez et al., 2011). The aromatic compounds present in liquid oil
were similar at different retention time with the same temperature (Lee and Shin, 2007).
Based on the above the independent variables chosen in this study were temperature
and catalyst amount. The temperature range chosen was 158.58 ℃ – 441.42 ℃ and
catalyst amount range was 2.93 wt.% - 17.07 wt.%, this was determined from literature
review. Table 3.1 shows the independent variables and their levels in CCD.
Table 3.1: Independent variables and their levels in CCD.
Independent variables Codes Variable levels
-α =1.41421 -1 0 1 +α =1.41421
Temperature (0C) A 158.58 200 300 400 441.42
Catalyst amount (wt.%) B 2.93 5 10 15 17.07
A total of 13 experiments, including 5 replications at the center point were conducted.
Replicates at the center point give pure error. Experimental runs from design expert
software are shown in Table 3.2.

52
Table 3.2: Experimental runs from Design Expert software
Std Run Factor 1 A:
Temp ℃
Factor 2 B:
catalyst wt.%
response 1
Yield (mass %)
11 1 300 10
5 2 158.58 10
13 3 300 10
3 4 200 15
2 5 400 5
1 6 200 5
8 7 300 17.07
10 8 300 10
12 9 300 10
9 10 300 10
4 11 400 15
7 12 300 2.93
6 13 441.42 10
3.4 Experimental Setup
3.4.1 Waste plastic Sample Preparation
Waste Plastics were washed using tap water to remove dirt that was on the surface of
the plastics. They were then sun dried to remove moisture that could interfere with
pyrolysis process. The plastics were then chopped by a knife to the required particle
size range of 5-8 mm, this is the average size for higher production of liquid oil. Smaller
particle size results in higher gas yield. The feedstock was then ready for pyrolysis.
3.4.2 Preparation of catalyst
Clay soil was dried in an oven at 105 ℃ for 1 hour. The dried clay catalyst was crushed
using a pulverizer. Powdered clay was sieved using 400 µm sieve to get a homogeneous
fine powder.
3.4.3 Experimental procedure
The pyrolysis set up consisted of electric coil furnace, electric sensor connected to
temperature control box, a round bottomed glass flask with arm, Liebig condenser,

53
water and sample collection flask. Chopped plastics were mixed with the catalyst and
put into the round bottomed flask for catalytic pyrolysis. In each experiment, 50 g of
the HDPE feedstock was mixed with varying concentration of catalysts (2.93wt% -
17.07wt%) and heated by electric coil furnace in a reaction flask to a specific
temperature (range of 158.58 ℃ - 441.42 ℃ ). Pyrolysis products were separated
through condensation whereby the Liebig condenser was used to cool and condense the
gases from the glass reactor, the vapors coming out after melting of the waste were
passed through Liebig condenser and the liquid oil obtained was collected in a sample
collection flask. The condensable gases produced liquid oil upon cooling while
uncondensed gases produced during the experiment were left to escape to the
atmosphere. At the end of each experiment, the mass of gas (non-condensable) was
obtained by subtracting the mass of liquid oil and char from the total mass.
𝑚𝑔 = 𝑚𝑡 − 𝑚𝑙 − 𝑚𝑐 …………………………………………………….Equation 3.1
𝑚𝑔 – mass of gas, g
𝑚𝑡– total mass of plastic feedstock and catalyst, g
𝑚𝑙– mass of liquid oil, g
𝑚𝑐– mass of char, g
The procedure was repeated for the other plastic types PP and PS at different
temperature levels (158.58 ℃ – 441.42 ℃) and amount of catalyst (2.93wt% -
17.07wt%) as shown in table 3.2. Figure 3.2 show the experimental set up of the
experiment. Batch reactor was used in the pyrolysis process because the reactor is better
for producing small amounts of products while still in testing phase.

54
Figure 3.2: Plastic waste pyrolysis set-up
3.5 Analysis of Plastic Waste Liquid Oil
Liquid oil produced by the catalytic pyrolysis of various plastic wastes was
characterized by using Gas chromatography coupled with mass spectrophotometry
(GC–MS) following the standard ASTM methods (Apha, 1998). Gas chromatography-
mass spectrometry (GC-MS) of the produced liquid oil sample was carried out to find
out its chemical composition.
3.5.1 GC-MS analysis for Liquid oil composition
The GC-MS (QP 2010 SE) used had the column specification as BPX5, 30m; 0.25 mm
ID; 0.25 µm and the oven program was set at 50 ℃ for 1 minute; heating rate of 10
0C/minute to 250 ℃ for 25 minutes this is important to optimize the separation of the
analyte. Helium was used as the carrier gas with a flow rate of 1 ml/minute, injection
temperature of 200 ℃ and the injection mode was split, ratio 1:10. The split injection
was applied at 250 ℃. The ion source and transfer line temperatures were 200 ℃ and
250 ℃, respectively. Interface temperature was 250 ℃, solvent cut-time of 2.5 minutes

55
and a scan range between 50 – 600 m/z. The NIST 2014 library of standards was used
to identify the molecules in the samples.
3.6 Determination of Fuel properties
The liquid fuel from plastic waste must meet certain quality specifications for it to be
used as a fuel. In the United States, the fuel must meet the American Society for Testing
and Materials (ASTM) requirements for petrol-diesel fuel standards ASTM D 975 and
the standard in Europe is EN 590. Liquid oil was subjected to tests to ascertain the
following fuel properties: calorific value, density, viscosity, flash point and freezing
point.
1. Calorific value
Calorific value of fuel was determined using a Bomb Calorimeter. Bomb Calorimeter
was used to assess the high heating value (HHV) of produced liquid oils by following
the ASTM D 240 methods (Miandad et al., 2016b). The crucible of the calorimeter was
filled with the 100ml of fuel and then ignited. This heats the surrounding water, and the
initial and final temperatures were recorded using a thermometer. The calorific value
was then determined using the heat balance. Heat given by the fuel is equal to the heat
gained by the water.
𝑚𝑓𝑥 𝐶𝑣 = 𝑚𝑤 𝑥 𝐶 𝑥 ∆𝑇 ........................................................................ Equation 3.2
where: mf - Mass of fuel, g
Cv - Calorific value, KJ/kg
mw - Mass of water, g
C - Specific heat of water, j/kg K
ΔT - Change in temperature, ℃

56
2. Density
Density and specific gravity of liquid oil samples was determined using density bottle.
3. Viscosity
Viscosity is very crucial in petroleum industry since it determines how easy the oil can
flow from the reservoir to the well during extraction process and also plays a crucial
role in fuel injection process (Ahmad et al., 2014). Kinematic viscosity was measured
by noting the time it takes oil to travel through the orifice of a capillary under the force
of gravity using capillary U-tube viscometer.
4. Flash point
This is the lowest temperature that the vapors of a material will ignite when exposed to
an ignition source. Flash point was determined experimentally by Flash point apparatus
(Pensky Marten) which works by heating the liquid in a container and then introducing
a small flame just above the liquid surface. 150 ml of the oil was placed in the Flash
point apparatus, the sample was heated and gently stirred. The flame was introduced
after every 2 ℃ rise, upto a temperature at which there is a flash or ignition is recorded
as the flash point.
5. Freezing point
This is the lowest temperature at which the fuel remains free of solid hydrocarbon
crystals that can restrict the flow of fuel through filters in the fuel system of an engine.
The freezing point was determined using the freezing point apparatus. 50 ml of oil was
put in a slightly slanted ice bag and placed in an orbital shaker, the temperature at which
the oil solidified was recorded as the freezing point.

57
CHAPTER 4: RESULTS AND DISCUSSIONS
4.1 Introduction
The experimental results and discussions are outlined in this chapter. It is divided into
four sections as per the research objectives. The first section is the results of elemental
characterization of the River Oren clay catalyst. The second section is the results of
laboratory experiments to study the effect of pyrolysis operating variables. The third
section presents analysis of the pyrolysis fuel using GC-MS and the last section are the
results for testing the pyrolysis oil for fuel characteristic properties.
4.2 Material characterization
XRF was used to determine the mineral composition of the clay and the results
presented in oxide percentage. XRD was used to determine the mineral analysis, name,
formula and crystallographic structure of the clay while AAS determined the
concentration of specific metal elements in the clay.
4.2.1 XRF characterization
Clays from Kisumu County, Oren river was observed to have Silica (64.5%), alumina
(16.3%) and Iron II oxide (9.3%) as the major elements. Other elements present are:
Potassium oxide, Sodium Oxide, Titanium Oxide, Calcium Oxide, Magnesium Oxide
and Manganese Oxide. Comparison is attributed to analysis of clay from Kano plains
done by Oswago, 2016 (Silica 65.92% and alumina 19.55%). From the results, it was
established that the clay has high composition of silica and alumina 64.5wt% and
16.3wt%, respectively and a SiO2/Al2O3 ratio of 3.96, being requirements for a good
pyrolysis catalyst. Table 4.1 gives the percentage composition of elements from XRF
analysis.

58
Table 4.1: X-Ray Fluorescence Analysis Result
Component Result (mass %)
Na2O 1.9592
MgO 0.5597
Al2O3 16.3294
SiO2 64.4654
P2O5 0.0721
SO3 0.1052
Cl 0.0775
K2O 4.3336
CaO 1.1729
TiO2 0.7714
MnO 0.4677
Fe2O3 9.2879
ZnO 0.0304
Ga2O3 0.0068
As2O3 0.0023
Rb2O 0.0205
SrO 0.0167
Y2O3 0.0123
ZrO2 0.1526
Nb2O5 0.0508
BaO 0.0674
CeO2 0.0382
Silica-alumina catalysts are amorphous catalysts having Lewis-acid sites as electron
acceptors and Bronsted acid sites with ionizable hydrogen atoms. The acidity of the
catalysts is determined by using mole ratio of SiO2/Al2O3. Acidity of the catalysts
affects the clay’s reactivity, production yield and composition of liquid oil from
pyrolysis of plastics Uddin, (1997). Artetxe et al., (2013) proved that the ratio
SiO2/Al2O3 of zeolite catalyst highly affected the product fraction yield in pyrolysis

59
process. Low ratio of SiO2/Al2O3 indicated the high acidity of the catalyst. Miandad et
al., (2017) reported a SiO2/Al2O3 ratio of 5.1 for Saudi Arabian natural zeolite and 9.2
for synthetic zeolite and the liquid oil production was 54% and 50% respectively.
Sakata et al., (1996) also carried out the pyrolysis of HDPE by using three different
types of silica alumina catalysts SA-1, SA-2, and ZSM-5. The obtained results indicated
that SA-2 catalyst with lower acidity produced maximum quantity of liquid oil (74.3
wt.%), while ZSM-5 with higher acidity produced lower quantity of liquid oil (49.8
wt.%).
4.2.2 XRD characterization
The XRD analysis was performed on clay catalyst samples and results are presented in
Figure 4.1(a), (b), (c) and (d). The major minerals are Anorthoclase KAlSi3O8, Albite
Na(AlSi3O8), Quartz SiO2 and Mordenite (Ca,Na2,K2)Al2Si10O24.7H2O. The XRD
pattern of the clay shows crystalline peaks at D(ang) = 3.758, 3.343 and 3.251 which
revealed the presence of Anorthoclase. The crystalline peaks corresponding to position
D(ang) = 3.696 and 3.207 showed that Albite mineral is available in the sample. The
crystalline peak of quartz at D(ang) = 3.308 and 2.267. The crystalline peak at position
D(ang) = 3.174 showed the presence of mordenite. The results agree with those reported
on clay from Oren river showing crystalline structure (Nizami, 2016b). The results
establish that the clay mineral is composed of tetrahedra of silica and alumina as
structural components and are linked through oxygen atoms. Each oxygen atom is
shared by two silicon or aluminium atoms, thus giving rise to a three-dimensional
microporous structure (Manos G. , 2006). The crystalline microporous structure favor
hydrogen transfer reactions and thereby make the catalyst suitable for high conversions
at relatively low temperatures between 300 to 400 ℃ (Park, 1999). The silica-
tetrahedron and alumina-octahedron layers are combined differently in each clay

60
mineral and this forms the basis of their identification and differentiation by X-ray
diffraction. Figure 4.1 (a), (b), (c) and (d) shows XRD analysis of clay. Table 4.2 (a)
and (b) shows the crystalline peak list.
Figure 4.1(a): XRD analysis of clay
Table 4.2(a): Peak list
No. 2-theta
(deg) D (ang.) Height (cps)
FWHM
(deg)
Int. I
(cps
deg)
Int. W
(deg)
Asym.
Factor
1 13.6253 6.49353 18.634 0.709403 26.807 1.438610 1.28816
2 23.66(5) 3.758(8) 53(9) 1.5(3) 165(14) 3.1(8) 5(5)
3 26.6436 3.34295 40.8965 0.709403 58.8341 1.438610 1.28816
4 27.41(2) 3.251(3) 111(14) 0.71(7) 130(9) 1.2(2) 1.2(4)
5 34.92(7) 2.567(5) 47(9) 0.60(10) 43(7) 0.9(3) 1.3(6)
2-theta (deg)
Inte
nsity (
cp
s)
10 20 30 40 50
0
100
200
An
ort
ho
cla
se
, A
l K
0.1
5 N
a0
.85
O8
Si3
, (0
2 0
), 6
.47
50
, 13
.66
43
An
ort
ho
cla
se
, A
l K
0.1
5 N
a0
.85
O8
Si3
, (1
1 0
), 6
.46
73
, 13
.68
08
An
ort
ho
cla
se
, A
l K
0.1
5 N
a0
.85
O8
Si3
, (0
0 1
), 6
.41
25
, 13
.79
83
An
ort
ho
cla
se
, A
l K
0.1
5 N
a0
.85
O8
Si3
, (1
1 -
1),
5.7
85
2,
15
.30
30
An
ort
ho
cla
se
, A
l K
0.1
5 N
a0
.85
O8
Si3
, (0
2 1
), 4
.55
63
, 19
.46
63
An
ort
ho
cla
se
, A
l K
0.1
5 N
a0
.85
O8
Si3
, (2
0 -
1),
4.1
02
9,
21
.64
21
An
ort
ho
cla
se
, A
l K
0.1
5 N
a0
.85
O8
Si3
, (1
1 1
), 3
.87
56
, 22
.92
79A
no
rth
ocla
se
, A
l K
0.1
5 N
a0
.85
O8
Si3
, (1
3 0
), 3
.73
69
, 23
.79
13
An
ort
ho
cla
se
, A
l K
0.1
5 N
a0
.85
O8
Si3
, (2
0 0
), 3
.73
24
, 23
.82
03
An
ort
ho
cla
se
, A
l K
0.1
5 N
a0
.85
O8
Si3
, (1
3 -
1),
3.5
90
2,
24
.77
83
An
ort
ho
cla
se
, A
l K
0.1
5 N
a0
.85
O8
Si3
, (2
2 -
1),
3.4
65
7,
25
.68
35
An
ort
ho
cla
se
, A
l K
0.1
5 N
a0
.85
O8
Si3
, (1
1 -
2),
3.4
40
4,
25
.87
59
An
ort
ho
cla
se
, A
l K
0.1
5 N
a0
.85
O8
Si3
, (0
4 0
), 3
.23
75
, 27
.52
80A
no
rth
ocla
se
, A
l K
0.1
5 N
a0
.85
O8
Si3
, (2
2 0
), 3
.23
36
, 27
.56
17
An
ort
ho
cla
se
, A
l K
0.1
5 N
a0
.85
O8
Si3
, (2
0 -
2),
3.2
33
1,
27
.56
61
An
ort
ho
cla
se
, A
l K
0.1
5 N
a0
.85
O8
Si3
, (0
0 2
), 3
.20
62
, 27
.80
19
An
ort
ho
cla
se
, A
l K
0.1
5 N
a0
.85
O8
Si3
, (1
3 1
), 2
.95
81
, 30
.18
70A
no
rth
ocla
se
, A
l K
0.1
5 N
a0
.85
O8
Si3
, (2
2 -
2),
2.8
92
6,
30
.88
79
An
ort
ho
cla
se
, A
l K
0.1
5 N
a0
.85
O8
Si3
, (0
4 1
), 2
.89
01
, 30
.91
54
An
ort
ho
cla
se
, A
l K
0.1
5 N
a0
.85
O8
Si3
, (0
2 2
), 2
.87
33
, 31
.10
06
An
ort
ho
cla
se
, A
l K
0.1
5 N
a0
.85
O8
Si3
, (1
3 -
2),
2.7
50
4,
32
.52
75
An
ort
ho
cla
se
, A
l K
0.1
5 N
a0
.85
O8
Si3
, (2
0 1
), 2
.74
41
, 32
.60
44
An
ort
ho
cla
se
, A
l K
0.1
5 N
a0
.85
O8
Si3
, (3
1 -
1),
2.7
04
2,
33
.09
94
An
ort
ho
cla
se
, A
l K
0.1
5 N
a0
.85
O8
Si3
, (3
1 -
2),
2.5
42
8,
35
.26
71
An
ort
ho
cla
se
, A
l K
0.1
5 N
a0
.85
O8
Si3
, (2
4 -
1),
2.5
41
6,
35
.28
48
An
ort
ho
cla
se
, A
l K
0.1
5 N
a0
.85
O8
Si3
, (2
2 1
), 2
.52
66
, 35
.50
08
An
ort
ho
cla
se
, A
l K
0.1
5 N
a0
.85
O8
Si3
, (1
1 2
), 2
.51
67
, 35
.64
47
An
ort
ho
cla
se
, A
l K
0.1
5 N
a0
.85
O8
Si3
, (1
5 0
), 2
.44
69
, 36
.69
71
An
ort
ho
cla
se
, A
l K
0.1
5 N
a0
.85
O8
Si3
, (2
4 0
), 2
.44
57
, 36
.71
66A
no
rth
ocla
se
, A
l K
0.1
5 N
a0
.85
O8
Si3
, (3
1 0
), 2
.44
36
, 36
.74
92
An
ort
ho
cla
se
, A
l K
0.1
5 N
a0
.85
O8
Si3
, (1
5 -
1),
2.4
04
3,
37
.37
10
An
ort
ho
cla
se
, A
l K
0.1
5 N
a0
.85
O8
Si3
, (2
0 -
3),
2.3
53
3,
38
.21
16A
no
rth
ocla
se
, A
l K
0.1
5 N
a0
.85
O8
Si3
, (3
3 -
1),
2.3
28
4,
38
.63
70
An
ort
ho
cla
se
, A
l K
0.1
5 N
a0
.85
O8
Si3
, (1
1 -
3),
2.3
08
0,
38
.99
31
An
ort
ho
cla
se
, A
l K
0.1
5 N
a0
.85
O8
Si3
, (2
4 -
2),
2.2
87
7,
39
.35
22
An
ort
ho
cla
se
, A
l K
0.1
5 N
a0
.85
O8
Si3
, (0
4 2
), 2
.27
81
, 39
.52
47
An
ort
ho
cla
se
, A
l K
0.1
5 N
a0
.85
O8
Si3
, (3
3 -
2),
2.2
23
0,
40
.54
79
An
ort
ho
cla
se
, A
l K
0.1
5 N
a0
.85
O8
Si3
, (2
2 -
3),
2.2
11
8,
40
.76
20
An
ort
ho
cla
se
, A
l K
0.1
5 N
a0
.85
O8
Si3
, (1
3 2
), 2
.20
55
, 40
.88
38
An
ort
ho
cla
se
, A
l K
0.1
5 N
a0
.85
O8
Si3
, (1
5 1
), 2
.18
38
, 41
.30
78A
no
rth
ocla
se
, A
l K
0.1
5 N
a0
.85
O8
Si3
, (0
6 0
), 2
.15
83
, 41
.81
80
An
ort
ho
cla
se
, A
l K
0.1
5 N
a0
.85
O8
Si3
, (3
3 0
), 2
.15
58
, 41
.87
06
An
ort
ho
cla
se
, A
l K
0.1
5 N
a0
.85
O8
Si3
, (0
0 3
), 2
.13
75
, 42
.24
54A
no
rth
ocla
se
, A
l K
0.1
5 N
a0
.85
O8
Si3
, (3
1 -
3),
2.1
26
2,
42
.48
13
An
ort
ho
cla
se
, A
l K
0.1
5 N
a0
.85
O8
Si3
, (1
5 -
2),
2.0
96
1,
43
.12
04
An
ort
ho
cla
se
, A
l K
0.1
5 N
a0
.85
O8
Si3
, (2
4 1
), 2
.09
33
, 43
.18
10
An
ort
ho
cla
se
, A
l K
0.1
5 N
a0
.85
O8
Si3
, (1
3 -
3),
2.0
60
9,
43
.89
48
An
ort
ho
cla
se
, A
l K
0.1
5 N
a0
.85
O8
Si3
, (4
0 -
2),
2.0
51
4,
44
.10
85
An
ort
ho
cla
se
, A
l K
0.1
5 N
a0
.85
O8
Si3
, (4
0 -
1),
2.0
49
5,
44
.15
13
An
ort
ho
cla
se
, A
l K
0.1
5 N
a0
.85
O8
Si3
, (0
6 1
), 2
.04
56
, 44
.24
13
An
ort
ho
cla
se
, A
l K
0.1
5 N
a0
.85
O8
Si3
, (2
0 2
), 2
.03
09
, 44
.57
87
An
ort
ho
cla
se
, A
l K
0.1
5 N
a0
.85
O8
Si3
, (0
2 3
), 2
.02
98
, 44
.60
47
An
ort
ho
cla
se
, A
l K
0.1
5 N
a0
.85
O8
Si3
, (3
1 1
), 2
.01
28
, 45
.00
20
An
ort
ho
cla
se
, A
l K
0.1
5 N
a0
.85
O8
Si3
, (4
2 -
2),
1.9
55
6,
46
.39
21
An
ort
ho
cla
se
, A
l K
0.1
5 N
a0
.85
O8
Si3
, (4
2 -
1),
1.9
54
0,
46
.43
32
An
ort
ho
cla
se
, A
l K
0.1
5 N
a0
.85
O8
Si3
, (2
2 2
), 1
.93
78
, 46
.84
43
An
ort
ho
cla
se
, A
l K
0.1
5 N
a0
.85
O8
Si3
, (3
3 -
3),
1.9
28
4,
47
.08
67
An
ort
ho
cla
se
, A
l K
0.1
5 N
a0
.85
O8
Si3
, (2
6 -
1),
1.9
10
2,
47
.56
35
An
ort
ho
cla
se
, A
l K
0.1
5 N
a0
.85
O8
Si3
, (2
4 -
3),
1.9
03
6,
47
.73
84
An
ort
ho
cla
se
, A
l K
0.1
5 N
a0
.85
O8
Si3
, (3
5 -
1),
1.8
90
3,
48
.09
46
An
ort
ho
cla
se
, A
l K
0.1
5 N
a0
.85
O8
Si3
, (4
0 -
3),
1.8
70
5,
48
.63
72
An
ort
ho
cla
se
, A
l K
0.1
5 N
a0
.85
O8
Si3
, (2
6 0
), 1
.86
84
, 48
.69
37
An
ort
ho
cla
se
, A
l K
0.1
5 N
a0
.85
O8
Si3
, (4
0 0
), 1
.86
62
, 48
.75
60
An
ort
ho
cla
se
, A
l K
0.1
5 N
a0
.85
O8
Si3
, (3
3 1
), 1
.84
26
, 49
.42
26
An
ort
ho
cla
se
, A
l K
0.1
5 N
a0
.85
O8
Si3
, (0
2 0
), 6
.47
50
, 13
.66
43
An
ort
ho
cla
se
, A
l K
0.1
5 N
a0
.85
O8
Si3
, (1
1 0
), 6
.46
73
, 13
.68
08
An
ort
ho
cla
se
, A
l K
0.1
5 N
a0
.85
O8
Si3
, (0
0 1
), 6
.41
25
, 13
.79
83
An
ort
ho
cla
se
, A
l K
0.1
5 N
a0
.85
O8
Si3
, (1
1 -
1),
5.7
85
2,
15
.30
30
An
ort
ho
cla
se
, A
l K
0.1
5 N
a0
.85
O8
Si3
, (0
2 1
), 4
.55
63
, 19
.46
63
An
ort
ho
cla
se
, A
l K
0.1
5 N
a0
.85
O8
Si3
, (2
0 -
1),
4.1
02
9,
21
.64
21
An
ort
ho
cla
se
, A
l K
0.1
5 N
a0
.85
O8
Si3
, (1
1 1
), 3
.87
56
, 22
.92
79A
no
rth
ocla
se
, A
l K
0.1
5 N
a0
.85
O8
Si3
, (1
3 0
), 3
.73
69
, 23
.79
13
An
ort
ho
cla
se
, A
l K
0.1
5 N
a0
.85
O8
Si3
, (2
0 0
), 3
.73
24
, 23
.82
03
An
ort
ho
cla
se
, A
l K
0.1
5 N
a0
.85
O8
Si3
, (1
3 -
1),
3.5
90
2,
24
.77
83
An
ort
ho
cla
se
, A
l K
0.1
5 N
a0
.85
O8
Si3
, (2
2 -
1),
3.4
65
7,
25
.68
35
An
ort
ho
cla
se
, A
l K
0.1
5 N
a0
.85
O8
Si3
, (1
1 -
2),
3.4
40
4,
25
.87
59
An
ort
ho
cla
se
, A
l K
0.1
5 N
a0
.85
O8
Si3
, (0
4 0
), 3
.23
75
, 27
.52
80A
no
rth
ocla
se
, A
l K
0.1
5 N
a0
.85
O8
Si3
, (2
2 0
), 3
.23
36
, 27
.56
17
An
ort
ho
cla
se
, A
l K
0.1
5 N
a0
.85
O8
Si3
, (2
0 -
2),
3.2
33
1,
27
.56
61
An
ort
ho
cla
se
, A
l K
0.1
5 N
a0
.85
O8
Si3
, (0
0 2
), 3
.20
62
, 27
.80
19
An
ort
ho
cla
se
, A
l K
0.1
5 N
a0
.85
O8
Si3
, (1
3 1
), 2
.95
81
, 30
.18
70A
no
rth
ocla
se
, A
l K
0.1
5 N
a0
.85
O8
Si3
, (2
2 -
2),
2.8
92
6,
30
.88
79
An
ort
ho
cla
se
, A
l K
0.1
5 N
a0
.85
O8
Si3
, (0
4 1
), 2
.89
01
, 30
.91
54
An
ort
ho
cla
se
, A
l K
0.1
5 N
a0
.85
O8
Si3
, (0
2 2
), 2
.87
33
, 31
.10
06
An
ort
ho
cla
se
, A
l K
0.1
5 N
a0
.85
O8
Si3
, (1
3 -
2),
2.7
50
4,
32
.52
75
An
ort
ho
cla
se
, A
l K
0.1
5 N
a0
.85
O8
Si3
, (2
0 1
), 2
.74
41
, 32
.60
44
An
ort
ho
cla
se
, A
l K
0.1
5 N
a0
.85
O8
Si3
, (3
1 -
1),
2.7
04
2,
33
.09
94
An
ort
ho
cla
se
, A
l K
0.1
5 N
a0
.85
O8
Si3
, (3
1 -
2),
2.5
42
8,
35
.26
71
An
ort
ho
cla
se
, A
l K
0.1
5 N
a0
.85
O8
Si3
, (2
4 -
1),
2.5
41
6,
35
.28
48
An
ort
ho
cla
se
, A
l K
0.1
5 N
a0
.85
O8
Si3
, (2
2 1
), 2
.52
66
, 35
.50
08
An
ort
ho
cla
se
, A
l K
0.1
5 N
a0
.85
O8
Si3
, (1
1 2
), 2
.51
67
, 35
.64
47
An
ort
ho
cla
se
, A
l K
0.1
5 N
a0
.85
O8
Si3
, (1
5 0
), 2
.44
69
, 36
.69
71
An
ort
ho
cla
se
, A
l K
0.1
5 N
a0
.85
O8
Si3
, (2
4 0
), 2
.44
57
, 36
.71
66A
no
rth
ocla
se
, A
l K
0.1
5 N
a0
.85
O8
Si3
, (3
1 0
), 2
.44
36
, 36
.74
92
An
ort
ho
cla
se
, A
l K
0.1
5 N
a0
.85
O8
Si3
, (1
5 -
1),
2.4
04
3,
37
.37
10
An
ort
ho
cla
se
, A
l K
0.1
5 N
a0
.85
O8
Si3
, (2
0 -
3),
2.3
53
3,
38
.21
16A
no
rth
ocla
se
, A
l K
0.1
5 N
a0
.85
O8
Si3
, (3
3 -
1),
2.3
28
4,
38
.63
70
An
ort
ho
cla
se
, A
l K
0.1
5 N
a0
.85
O8
Si3
, (1
1 -
3),
2.3
08
0,
38
.99
31
An
ort
ho
cla
se
, A
l K
0.1
5 N
a0
.85
O8
Si3
, (2
4 -
2),
2.2
87
7,
39
.35
22
An
ort
ho
cla
se
, A
l K
0.1
5 N
a0
.85
O8
Si3
, (0
4 2
), 2
.27
81
, 39
.52
47
An
ort
ho
cla
se
, A
l K
0.1
5 N
a0
.85
O8
Si3
, (3
3 -
2),
2.2
23
0,
40
.54
79
An
ort
ho
cla
se
, A
l K
0.1
5 N
a0
.85
O8
Si3
, (2
2 -
3),
2.2
11
8,
40
.76
20
An
ort
ho
cla
se
, A
l K
0.1
5 N
a0
.85
O8
Si3
, (1
3 2
), 2
.20
55
, 40
.88
38
An
ort
ho
cla
se
, A
l K
0.1
5 N
a0
.85
O8
Si3
, (1
5 1
), 2
.18
38
, 41
.30
78A
no
rth
ocla
se
, A
l K
0.1
5 N
a0
.85
O8
Si3
, (0
6 0
), 2
.15
83
, 41
.81
80
An
ort
ho
cla
se
, A
l K
0.1
5 N
a0
.85
O8
Si3
, (3
3 0
), 2
.15
58
, 41
.87
06
An
ort
ho
cla
se
, A
l K
0.1
5 N
a0
.85
O8
Si3
, (0
0 3
), 2
.13
75
, 42
.24
54A
no
rth
ocla
se
, A
l K
0.1
5 N
a0
.85
O8
Si3
, (3
1 -
3),
2.1
26
2,
42
.48
13
An
ort
ho
cla
se
, A
l K
0.1
5 N
a0
.85
O8
Si3
, (1
5 -
2),
2.0
96
1,
43
.12
04
An
ort
ho
cla
se
, A
l K
0.1
5 N
a0
.85
O8
Si3
, (2
4 1
), 2
.09
33
, 43
.18
10
An
ort
ho
cla
se
, A
l K
0.1
5 N
a0
.85
O8
Si3
, (1
3 -
3),
2.0
60
9,
43
.89
48
An
ort
ho
cla
se
, A
l K
0.1
5 N
a0
.85
O8
Si3
, (4
0 -
2),
2.0
51
4,
44
.10
85
An
ort
ho
cla
se
, A
l K
0.1
5 N
a0
.85
O8
Si3
, (4
0 -
1),
2.0
49
5,
44
.15
13
An
ort
ho
cla
se
, A
l K
0.1
5 N
a0
.85
O8
Si3
, (0
6 1
), 2
.04
56
, 44
.24
13
An
ort
ho
cla
se
, A
l K
0.1
5 N
a0
.85
O8
Si3
, (2
0 2
), 2
.03
09
, 44
.57
87
An
ort
ho
cla
se
, A
l K
0.1
5 N
a0
.85
O8
Si3
, (0
2 3
), 2
.02
98
, 44
.60
47
An
ort
ho
cla
se
, A
l K
0.1
5 N
a0
.85
O8
Si3
, (3
1 1
), 2
.01
28
, 45
.00
20
An
ort
ho
cla
se
, A
l K
0.1
5 N
a0
.85
O8
Si3
, (4
2 -
2),
1.9
55
6,
46
.39
21
An
ort
ho
cla
se
, A
l K
0.1
5 N
a0
.85
O8
Si3
, (4
2 -
1),
1.9
54
0,
46
.43
32
An
ort
ho
cla
se
, A
l K
0.1
5 N
a0
.85
O8
Si3
, (2
2 2
), 1
.93
78
, 46
.84
43
An
ort
ho
cla
se
, A
l K
0.1
5 N
a0
.85
O8
Si3
, (3
3 -
3),
1.9
28
4,
47
.08
67
An
ort
ho
cla
se
, A
l K
0.1
5 N
a0
.85
O8
Si3
, (2
6 -
1),
1.9
10
2,
47
.56
35
An
ort
ho
cla
se
, A
l K
0.1
5 N
a0
.85
O8
Si3
, (2
4 -
3),
1.9
03
6,
47
.73
84
An
ort
ho
cla
se
, A
l K
0.1
5 N
a0
.85
O8
Si3
, (3
5 -
1),
1.8
90
3,
48
.09
46
An
ort
ho
cla
se
, A
l K
0.1
5 N
a0
.85
O8
Si3
, (4
0 -
3),
1.8
70
5,
48
.63
72
An
ort
ho
cla
se
, A
l K
0.1
5 N
a0
.85
O8
Si3
, (2
6 0
), 1
.86
84
, 48
.69
37
An
ort
ho
cla
se
, A
l K
0.1
5 N
a0
.85
O8
Si3
, (4
0 0
), 1
.86
62
, 48
.75
60
An
ort
ho
cla
se
, A
l K
0.1
5 N
a0
.85
O8
Si3
, (3
3 1
), 1
.84
26
, 49
.42
26

61
Figure 4.1(b): XRD analysis of clay
Table 4.2(b): Peak list
No. 2-theta
(deg)
d(ang.) Height
(cps)
FWHM
(deg)
Int. I
(cps deg)
Int. W
(deg)
Asym.
Factor
1 8.9348
3
9.8890
8
17.230
1
0.1 4.05162 0.235148 1
2 20.134
4
4.4065
6
30.857
8
0.1 7.25615 0.235148 1
3 24.059
1
3.6958
9
54.354
9
0.1 12.7815 0.235148 1
4 27.792
3
3.2073
3
132.65
2
0.1 31.1929 0.235148 1
5 37.460
3
2.3988 25.531
6
0.1 6.00372 0.235148 1
6 42.055 2.1467
3
22.454 0.1 5.28002 0.235148 1
7 47.032
6
1.9304
8
13.236
1
0.1 3.11245 0.235148 1
2-theta (deg)
Inte
nsity (
cps)
10 20 30 40 50
-100
0
100
200
300
Alb
ite
, A
l N
a O
8 S
i3,
(0 2
0),
6.4
25
2,
13
.77
09A
lbite
, A
l N
a O
8 S
i3,
(0 0
1),
6.4
00
5,
13
.82
43A
lbite
, A
l N
a O
8 S
i3,
(1 -
1 0
), 6
.25
85
, 1
4.1
39
5A
lbite
, A
l N
a O
8 S
i3,
(1 1
0),
6.2
55
6,
14
.14
61A
lbite
, A
l N
a O
8 S
i3,
(1 1
-1
), 5
.91
64
, 1
4.9
61
5A
lbite
, A
l N
a O
8 S
i3,
(1 -
1 -
1),
5.6
15
5,
15
.76
83
Alb
ite
, A
l N
a O
8 S
i3,
(0 2
-1
), 4
.68
99
, 1
8.9
06
7
Alb
ite
, A
l N
a O
8 S
i3,
(0 2
1),
4.3
93
7,
20
.19
40
Alb
ite
, A
l N
a O
8 S
i3,
(2 0
-1
), 3
.99
26
, 2
2.2
47
2A
lbite
, A
l N
a O
8 S
i3,
(1 -
1 1
), 3
.83
01
, 2
3.2
04
3A
lbite
, A
l N
a O
8 S
i3,
(1 1
1),
3.7
43
4,
23
.74
90A
lbite
, A
l N
a O
8 S
i3,
(1 3
-1
), 3
.67
93
, 2
4.1
69
1A
lbite
, A
l N
a O
8 S
i3,
(1 -
3 0
), 3
.67
73
, 2
4.1
82
8A
lbite
, A
l N
a O
8 S
i3,
(1 3
0),
3.6
75
5,
24
.19
46A
lbite
, A
l N
a O
8 S
i3,
(2 0
0),
3.5
81
8,
24
.83
73A
lbite
, A
l N
a O
8 S
i3,
(1 1
-2
), 3
.52
67
, 2
5.2
32
0A
lbite
, A
l N
a O
8 S
i3,
(1 -
3 -
1),
3.4
64
7,
25
.69
06A
lbite
, A
l N
a O
8 S
i3,
(2 2
-1
), 3
.45
38
, 2
5.7
73
8A
lbite
, A
l N
a O
8 S
i3,
(1 -
1 -
2),
3.3
95
9,
26
.22
07
Alb
ite
, A
l N
a O
8 S
i3,
(2 -
2 -
1),
3.3
32
0,
26
.73
31A
lbite
, A
l N
a O
8 S
i3,
(2 0
-2
), 3
.22
18
, 2
7.6
64
7A
lbite
, A
l N
a O
8 S
i3,
(0 4
0),
3.2
12
6,
27
.74
58
Alb
ite
, A
l N
a O
8 S
i3,
(0 0
2),
3.2
00
2,
27
.85
51A
lbite
, A
l N
a O
8 S
i3,
(2 -
2 0
), 3
.12
93
, 2
8.5
00
1A
lbite
, A
l N
a O
8 S
i3,
(2 2
0),
3.1
27
8,
28
.51
36
Alb
ite
, A
l N
a O
8 S
i3,
(1 -
3 1
), 2
.96
93
, 3
0.0
71
1A
lbite
, A
l N
a O
8 S
i3,
(2 2
-2
), 2
.95
82
, 3
0.1
86
0A
lbite
, A
l N
a O
8 S
i3,
(0 4
-1
), 2
.94
93
, 3
0.2
79
8A
lbite
, A
l N
a O
8 S
i3,
(0 2
-2
), 2
.94
21
, 3
0.3
55
6A
lbite
, A
l N
a O
8 S
i3,
(1 3
-2
), 2
.85
67
, 3
1.2
85
5A
lbite
, A
l N
a O
8 S
i3,
(1 3
1),
2.8
51
3,
31
.34
59
Alb
ite
, A
l N
a O
8 S
i3,
(2 -
2 -
2),
2.8
07
7,
31
.84
56A
lbite
, A
l N
a O
8 S
i3,
(0 4
1),
2.7
99
0,
31
.94
72
Alb
ite
, A
l N
a O
8 S
i3,
(0 2
2),
2.7
92
9,
32
.01
94
Alb
ite
, A
l N
a O
8 S
i3,
(1 -
3 -
2),
2.6
58
7,
33
.68
30A
lbite
, A
l N
a O
8 S
i3,
(2 0
1),
2.6
53
9,
33
.74
52
Alb
ite
, A
l N
a O
8 S
i3,
(3 1
-1
), 2
.62
74
, 3
4.0
95
8A
lbite
, A
l N
a O
8 S
i3,
(3 -
1 -
1),
2.5
99
8,
34
.46
96A
lbite
, A
l N
a O
8 S
i3,
(2 4
-1
), 2
.55
34
, 3
5.1
16
2A
lbite
, A
l N
a O
8 S
i3,
(3 1
-2
), 2
.52
32
, 3
5.5
49
5A
lbite
, A
l N
a O
8 S
i3,
(1 -
1 2
), 2
.50
29
, 3
5.8
48
0A
lbite
, A
l N
a O
8 S
i3,
(2 -
2 1
), 2
.47
70
, 3
6.2
36
2A
lbite
, A
l N
a O
8 S
i3,
(3 -
1 -
2),
2.4
74
4,
36
.27
57A
lbite
, A
l N
a O
8 S
i3,
(2 -
4 -
1),
2.4
55
4,
36
.56
56
Alb
ite
, A
l N
a O
8 S
i3,
(1 1
2),
2.4
54
5,
36
.57
99A
lbite
, A
l N
a O
8 S
i3,
(1 5
-1
), 2
.44
25
, 3
6.7
65
3A
lbite
, A
l N
a O
8 S
i3,
(2 2
1),
2.4
29
5,
36
.96
95
Alb
ite
, A
l N
a O
8 S
i3,
(1 -
5 0
), 2
.41
95
, 3
7.1
27
6A
lbite
, A
l N
a O
8 S
i3,
(1 5
0),
2.4
18
7,
37
.14
10
Alb
ite
, A
l N
a O
8 S
i3,
(2 -
4 0
), 2
.39
22
, 3
7.5
67
2A
lbite
, A
l N
a O
8 S
i3,
(2 4
0),
2.3
90
9,
37
.58
84
Alb
ite
, A
l N
a O
8 S
i3,
(2 0
-3
), 2
.36
52
, 3
8.0
13
4A
lbite
, A
l N
a O
8 S
i3,
(2 4
-2
), 2
.35
28
, 3
8.2
21
4A
lbite
, A
l N
a O
8 S
i3,
(1 1
-3
), 2
.35
01
, 3
8.2
66
0A
lbite
, A
l N
a O
8 S
i3,
(3 -
1 0
), 2
.34
79
, 3
8.3
03
3A
lbite
, A
l N
a O
8 S
i3,
(3 1
0),
2.3
47
5,
38
.31
11
Alb
ite
, A
l N
a O
8 S
i3,
(0 4
-2
), 2
.34
49
, 3
8.3
54
1A
lbite
, A
l N
a O
8 S
i3,
(1 -
5 -
1),
2.3
35
5,
38
.51
56A
lbite
, A
l N
a O
8 S
i3,
(3 3
-1
), 2
.29
29
, 3
9.2
59
5A
lbite
, A
l N
a O
8 S
i3,
(1 -
1 -
3),
2.2
90
9,
39
.29
51A
lbite
, A
l N
a O
8 S
i3,
(2 2
-3
), 2
.27
31
, 3
9.6
15
3A
lbite
, A
l N
a O
8 S
i3,
(3 3
-2
), 2
.24
03
, 4
0.2
21
1A
lbite
, A
l N
a O
8 S
i3,
(3 -
3 -
1),
2.2
38
9,
40
.24
73A
lbite
, A
l N
a O
8 S
i3,
(1 -
3 2
), 2
.22
65
, 4
0.4
80
1A
lbite
, A
l N
a O
8 S
i3,
(2 -
4 -
2),
2.2
04
3,
40
.90
67A
lbite
, A
l N
a O
8 S
i3,
(1 -
5 1
), 2
.19
73
, 4
1.0
43
3A
lbite
, A
l N
a O
8 S
i3,
(0 4
2),
2.1
96
8,
41
.05
17
Alb
ite
, A
l N
a O
8 S
i3,
(2 -
2 -
3),
2.1
69
6,
41
.59
11A
lbite
, A
l N
a O
8 S
i3,
(1 5
-2
), 2
.16
62
, 4
1.6
60
0A
lbite
, A
l N
a O
8 S
i3,
(0 6
0),
2.1
41
7,
42
.15
78
Alb
ite
, A
l N
a O
8 S
i3,
(3 -
3 -
2),
2.1
41
6,
42
.16
15A
lbite
, A
l N
a O
8 S
i3,
(3 1
-3
), 2
.14
13
, 4
2.1
67
1A
lbite
, A
l N
a O
8 S
i3,
(0 0
3),
2.1
33
5,
42
.32
84A
lbite
, A
l N
a O
8 S
i3,
(1 3
-3
), 2
.13
19
, 4
2.3
61
8A
lbite
, A
l N
a O
8 S
i3,
(1 3
2),
2.1
28
2,
42
.43
94A
lbite
, A
l N
a O
8 S
i3,
(1 5
1),
2.1
17
2,
42
.66
94A
lbite
, A
l N
a O
8 S
i3,
(3 -
1 -
3),
2.0
96
4,
43
.11
39
Alb
ite
, A
l N
a O
8 S
i3,
(3 -
3 0
), 2
.08
62
, 4
3.3
36
4A
lbite
, A
l N
a O
8 S
i3,
(3 3
0),
2.0
85
2,
43
.35
76A
lbite
, A
l N
a O
8 S
i3,
(2 -
4 1
), 2
.07
42
, 4
3.6
00
3A
lbite
, A
l N
a O
8 S
i3,
(0 6
-1
), 2
.07
21
, 4
3.6
46
7A
lbite
, A
l N
a O
8 S
i3,
(0 2
-3
), 2
.06
54
, 4
3.7
94
2
Alb
ite
, A
l N
a O
8 S
i3,
(1 -
5 -
2),
2.0
21
6,
44
.79
35A
lbite
, A
l N
a O
8 S
i3,
(2 4
1),
2.0
19
1,
44
.85
40A
lbite
, A
l N
a O
8 S
i3,
(1 -
3 -
3),
2.0
06
2,
45
.15
78
Alb
ite
, A
l N
a O
8 S
i3,
(4 0
-2
), 1
.99
63
, 4
5.3
93
3A
lbite
, A
l N
a O
8 S
i3,
(0 6
1),
1.9
92
4,
45
.48
83
Alb
ite
, A
l N
a O
8 S
i3,
(0 2
3),
1.9
86
5,
45
.63
11A
lbite
, A
l N
a O
8 S
i3,
(2 0
2),
1.9
80
9,
45
.76
58A
lbite
, A
l N
a O
8 S
i3,
(2 4
-3
), 1
.97
36
, 4
5.9
46
4A
lbite
, A
l N
a O
8 S
i3,
(4 0
-1
), 1
.97
28
, 4
5.9
65
3A
lbite
, A
l N
a O
8 S
i3,
(3 3
-3
), 1
.97
21
, 4
5.9
81
2A
lbite
, A
l N
a O
8 S
i3,
(3 -
1 1
), 1
.94
75
, 4
6.5
97
4A
lbite
, A
l N
a O
8 S
i3,
(3 1
1),
1.9
35
6,
46
.89
97
Alb
ite
, A
l N
a O
8 S
i3,
(4 2
-2
), 1
.92
84
, 4
7.0
86
1A
lbite
, A
l N
a O
8 S
i3,
(2 6
-1
), 1
.91
96
, 4
7.3
15
0A
lbite
, A
l N
a O
8 S
i3,
(2 -
2 2
), 1
.91
50
, 4
7.4
35
2A
lbite
, A
l N
a O
8 S
i3,
(4 2
-1
), 1
.89
63
, 4
7.9
33
2A
lbite
, A
l N
a O
8 S
i3,
(4 -
2 -
2),
1.8
85
2,
48
.23
43A
lbite
, A
l N
a O
8 S
i3,
(3 5
-1
), 1
.87
65
, 4
8.4
72
1A
lbite
, A
l N
a O
8 S
i3,
(4 -
2 -
1),
1.8
75
7,
48
.49
37A
lbite
, A
l N
a O
8 S
i3,
(3 -
3 -
3),
1.8
71
8,
48
.59
98
Alb
ite
, A
l N
a O
8 S
i3,
(2 2
2),
1.8
71
7,
48
.60
29
Alb
ite
, A
l N
a O
8 S
i3,
(3 5
-2
), 1
.85
73
, 4
9.0
03
4A
lbite
, A
l N
a O
8 S
i3,
(2 -
6 -
1),
1.8
56
6,
49
.02
35A
lbite
, A
l N
a O
8 S
i3,
(1 -
5 2
), 1
.84
98
, 4
9.2
16
7A
lbite
, A
l N
a O
8 S
i3,
(4 0
-3
), 1
.84
51
, 4
9.3
49
4A
lbite
, A
l N
a O
8 S
i3,
(2 -
4 -
3),
1.8
42
5,
49
.42
48A
lbite
, A
l N
a O
8 S
i3,
(2 6
-2
), 1
.83
97
, 4
9.5
06
2
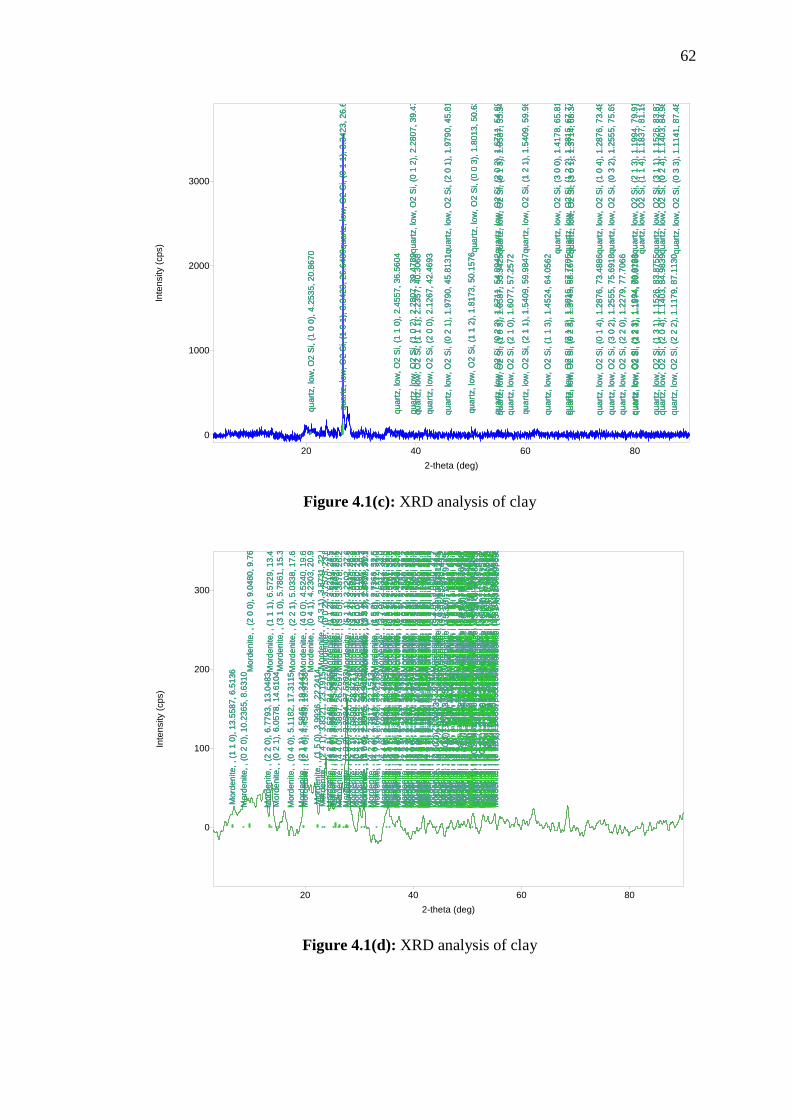
62
Figure 4.1(c): XRD analysis of clay
Figure 4.1(d): XRD analysis of clay
2-theta (deg)
Inte
nsity (
cps)
20 40 60 80
0
1000
2000
3000
qu
art
z,
low
, O
2 S
i, (
1 0
0),
4.2
53
5,
20
.86
70
qu
art
z,
low
, O
2 S
i, (
1 0
1),
3.3
42
3,
26
.64
89q
ua
rtz,
low
, O
2 S
i, (
0 1
1),
3.3
42
3,
26
.64
89
qu
art
z,
low
, O
2 S
i, (
1 1
0),
2.4
55
7,
36
.56
04
qu
art
z,
low
, O
2 S
i, (
1 0
2),
2.2
80
7,
39
.47
89q
ua
rtz,
low
, O
2 S
i, (
0 1
2),
2.2
80
7,
39
.47
89
qu
art
z,
low
, O
2 S
i, (
1 1
1),
2.2
35
7,
40
.30
68
qu
art
z,
low
, O
2 S
i, (
2 0
0),
2.1
26
7,
42
.46
93
qu
art
z,
low
, O
2 S
i, (
0 2
1),
1.9
79
0,
45
.81
31q
ua
rtz,
low
, O
2 S
i, (
2 0
1),
1.9
79
0,
45
.81
31
qu
art
z,
low
, O
2 S
i, (
1 1
2),
1.8
17
3,
50
.15
76q
ua
rtz,
low
, O
2 S
i, (
0 0
3),
1.8
01
3,
50
.63
49
qu
art
z,
low
, O
2 S
i, (
0 2
2),
1.6
71
1,
54
.89
42q
ua
rtz,
low
, O
2 S
i, (
2 0
2),
1.6
71
1,
54
.89
42
qu
art
z,
low
, O
2 S
i, (
1 0
3),
1.6
58
7,
55
.34
25q
ua
rtz,
low
, O
2 S
i, (
0 1
3),
1.6
58
7,
55
.34
25
qu
art
z,
low
, O
2 S
i, (
2 1
0),
1.6
07
7,
57
.25
72
qu
art
z,
low
, O
2 S
i, (
2 1
1),
1.5
40
9,
59
.98
47q
ua
rtz,
low
, O
2 S
i, (
1 2
1),
1.5
40
9,
59
.98
47
qu
art
z,
low
, O
2 S
i, (
1 1
3),
1.4
52
4,
64
.05
62q
ua
rtz,
low
, O
2 S
i, (
3 0
0),
1.4
17
8,
65
.81
47
qu
art
z,
low
, O
2 S
i, (
2 1
2),
1.3
81
6,
67
.77
05q
ua
rtz,
low
, O
2 S
i, (
1 2
2),
1.3
81
6,
67
.77
05q
ua
rtz,
low
, O
2 S
i, (
2 0
3),
1.3
74
5,
68
.16
72
qu
art
z,
low
, O
2 S
i, (
0 2
3),
1.3
74
5,
68
.16
72q
ua
rtz,
low
, O
2 S
i, (
3 0
1),
1.3
71
4,
68
.34
29q
ua
rtz,
low
, O
2 S
i, (
0 3
1),
1.3
71
4,
68
.34
29
qu
art
z,
low
, O
2 S
i, (
0 1
4),
1.2
87
6,
73
.48
86q
ua
rtz,
low
, O
2 S
i, (
1 0
4),
1.2
87
6,
73
.48
86
qu
art
z,
low
, O
2 S
i, (
3 0
2),
1.2
55
5,
75
.69
18q
ua
rtz,
low
, O
2 S
i, (
0 3
2),
1.2
55
5,
75
.69
18
qu
art
z,
low
, O
2 S
i, (
2 2
0),
1.2
27
9,
77
.70
66
qu
art
z,
low
, O
2 S
i, (
1 2
3),
1.1
99
4,
79
.91
38q
ua
rtz,
low
, O
2 S
i, (
2 1
3),
1.1
99
4,
79
.91
38
qu
art
z,
low
, O
2 S
i, (
2 2
1),
1.1
97
4,
80
.07
96q
ua
rtz,
low
, O
2 S
i, (
1 1
4),
1.1
83
7,
81
.19
77q
ua
rtz,
low
, O
2 S
i, (
3 1
0),
1.1
79
7,
81
.52
79
qu
art
z,
low
, O
2 S
i, (
1 3
1),
1.1
52
6,
83
.87
55q
ua
rtz,
low
, O
2 S
i, (
3 1
1),
1.1
52
6,
83
.87
55
qu
art
z,
low
, O
2 S
i, (
2 0
4),
1.1
40
3,
84
.98
39q
ua
rtz,
low
, O
2 S
i, (
0 2
4),
1.1
40
3,
84
.98
39
qu
art
z,
low
, O
2 S
i, (
2 2
2),
1.1
17
9,
87
.11
30q
ua
rtz,
low
, O
2 S
i, (
0 3
3),
1.1
14
1,
87
.48
11q
ua
rtz,
low
, O
2 S
i, (
3 0
3),
1.1
14
1,
87
.48
11
qu
art
z,
low
, O
2 S
i, (
1 0
0),
4.2
53
5,
20
.86
70
qu
art
z,
low
, O
2 S
i, (
1 0
1),
3.3
42
3,
26
.64
89q
ua
rtz,
low
, O
2 S
i, (
0 1
1),
3.3
42
3,
26
.64
89
qu
art
z,
low
, O
2 S
i, (
1 1
0),
2.4
55
7,
36
.56
04
qu
art
z,
low
, O
2 S
i, (
1 0
2),
2.2
80
7,
39
.47
89q
ua
rtz,
low
, O
2 S
i, (
0 1
2),
2.2
80
7,
39
.47
89
qu
art
z,
low
, O
2 S
i, (
1 1
1),
2.2
35
7,
40
.30
68
qu
art
z,
low
, O
2 S
i, (
2 0
0),
2.1
26
7,
42
.46
93
qu
art
z,
low
, O
2 S
i, (
0 2
1),
1.9
79
0,
45
.81
31q
ua
rtz,
low
, O
2 S
i, (
2 0
1),
1.9
79
0,
45
.81
31
qu
art
z,
low
, O
2 S
i, (
1 1
2),
1.8
17
3,
50
.15
76q
ua
rtz,
low
, O
2 S
i, (
0 0
3),
1.8
01
3,
50
.63
49
qu
art
z,
low
, O
2 S
i, (
0 2
2),
1.6
71
1,
54
.89
42q
ua
rtz,
low
, O
2 S
i, (
2 0
2),
1.6
71
1,
54
.89
42
qu
art
z,
low
, O
2 S
i, (
1 0
3),
1.6
58
7,
55
.34
25q
ua
rtz,
low
, O
2 S
i, (
0 1
3),
1.6
58
7,
55
.34
25
qu
art
z,
low
, O
2 S
i, (
2 1
0),
1.6
07
7,
57
.25
72
qu
art
z,
low
, O
2 S
i, (
2 1
1),
1.5
40
9,
59
.98
47q
ua
rtz,
low
, O
2 S
i, (
1 2
1),
1.5
40
9,
59
.98
47
qu
art
z,
low
, O
2 S
i, (
1 1
3),
1.4
52
4,
64
.05
62q
ua
rtz,
low
, O
2 S
i, (
3 0
0),
1.4
17
8,
65
.81
47
qu
art
z,
low
, O
2 S
i, (
2 1
2),
1.3
81
6,
67
.77
05q
ua
rtz,
low
, O
2 S
i, (
1 2
2),
1.3
81
6,
67
.77
05q
ua
rtz,
low
, O
2 S
i, (
2 0
3),
1.3
74
5,
68
.16
72
qu
art
z,
low
, O
2 S
i, (
0 2
3),
1.3
74
5,
68
.16
72q
ua
rtz,
low
, O
2 S
i, (
3 0
1),
1.3
71
4,
68
.34
29q
ua
rtz,
low
, O
2 S
i, (
0 3
1),
1.3
71
4,
68
.34
29
qu
art
z,
low
, O
2 S
i, (
0 1
4),
1.2
87
6,
73
.48
86q
ua
rtz,
low
, O
2 S
i, (
1 0
4),
1.2
87
6,
73
.48
86
qu
art
z,
low
, O
2 S
i, (
3 0
2),
1.2
55
5,
75
.69
18q
ua
rtz,
low
, O
2 S
i, (
0 3
2),
1.2
55
5,
75
.69
18
qu
art
z,
low
, O
2 S
i, (
2 2
0),
1.2
27
9,
77
.70
66
qu
art
z,
low
, O
2 S
i, (
1 2
3),
1.1
99
4,
79
.91
38q
ua
rtz,
low
, O
2 S
i, (
2 1
3),
1.1
99
4,
79
.91
38
qu
art
z,
low
, O
2 S
i, (
2 2
1),
1.1
97
4,
80
.07
96q
ua
rtz,
low
, O
2 S
i, (
1 1
4),
1.1
83
7,
81
.19
77q
ua
rtz,
low
, O
2 S
i, (
3 1
0),
1.1
79
7,
81
.52
79
qu
art
z,
low
, O
2 S
i, (
1 3
1),
1.1
52
6,
83
.87
55q
ua
rtz,
low
, O
2 S
i, (
3 1
1),
1.1
52
6,
83
.87
55
qu
art
z,
low
, O
2 S
i, (
2 0
4),
1.1
40
3,
84
.98
39q
ua
rtz,
low
, O
2 S
i, (
0 2
4),
1.1
40
3,
84
.98
39
qu
art
z,
low
, O
2 S
i, (
2 2
2),
1.1
17
9,
87
.11
30q
ua
rtz,
low
, O
2 S
i, (
0 3
3),
1.1
14
1,
87
.48
11q
ua
rtz,
low
, O
2 S
i, (
3 0
3),
1.1
14
1,
87
.48
11
2-theta (deg)
Inte
nsity (
cp
s)
20 40 60 80
0
100
200
300
Mo
rde
nite
, ,
(1 1
0),
13
.55
87
, 6
.51
36
Mo
rde
nite
, ,
(0 2
0),
10
.23
65
, 8
.63
10M
ord
en
ite
, ,
(2 0
0),
9.0
48
0,
9.7
67
3
Mo
rde
nite
, ,
(2 2
0),
6.7
79
3,
13
.04
83M
ord
en
ite
, ,
(1 1
1),
6.5
72
9,
13
.45
99M
ord
en
ite
, ,
(1 3
0),
6.3
85
4,
13
.85
72
Mo
rde
nite
, ,
(0 2
1),
6.0
57
8,
14
.61
04M
ord
en
ite
, ,
(3 1
0),
5.7
86
1,
15
.30
06
Mo
rde
nite
, ,
(0 4
0),
5.1
18
2,
17
.31
15M
ord
en
ite
, ,
(2 2
1),
5.0
33
8,
17
.60
43M
ord
en
ite
, ,
(1 3
1),
4.8
66
0,
18
.21
62
Mo
rde
nite
, ,
(3 1
1),
4.5
84
6,
19
.34
47M
ord
en
ite
, ,
(4 0
0),
4.5
24
0,
19
.60
65M
ord
en
ite
, ,
(3 3
0),
4.5
19
6,
19
.62
60
Mo
rde
nite
, ,
(2 4
0),
4.4
54
9,
19
.91
38M
ord
en
ite
, ,
(0 4
1),
4.2
30
3,
20
.98
26M
ord
en
ite
, ,
(4 2
0),
4.1
37
9,
21
.45
66
Mo
rde
nite
, ,
(1 5
0),
3.9
93
6,
22
.24
14M
ord
en
ite
, ,
(3 3
1),
3.8
73
1,
22
.94
30
Mo
rde
nite
, ,
(2 4
1),
3.8
32
1,
23
.19
15M
ord
en
ite
, ,
(0 0
2),
3.7
57
5,
23
.65
88
Mo
rde
nite
, ,
(4 2
1),
3.6
24
8,
24
.53
85M
ord
en
ite
, ,
(1 1
2),
3.6
21
0,
24
.56
41
Mo
rde
nite
, ,
(5 1
0),
3.5
63
9,
24
.96
39M
ord
en
ite
, ,
(0 2
2),
3.5
27
4,
25
.22
69
Mo
rde
nite
, ,
(1 5
1),
3.5
26
6,
25
.23
26M
ord
en
ite
, ,
(2 0
2),
3.4
70
2,
25
.64
98M
ord
en
ite
, ,
(0 6
0),
3.4
12
2,
26
.09
34
Mo
rde
nite
, ,
(4 4
0),
3.3
89
7,
26
.26
97M
ord
en
ite
, ,
(3 5
0),
3.3
87
8,
26
.28
44M
ord
en
ite
, ,
(2 2
2),
3.2
86
5,
27
.11
02
Mo
rde
nite
, ,
(1 3
2),
3.2
38
4,
27
.52
03M
ord
en
ite
, ,
(5 1
1),
3.2
20
2,
27
.67
93M
ord
en
ite
, ,
(5 3
0),
3.1
97
4,
27
.88
05
Mo
rde
nite
, ,
(2 6
0),
3.1
92
7,
27
.92
24M
ord
en
ite
, ,
(3 1
2),
3.1
51
3,
28
.29
65M
ord
en
ite
, ,
(0 6
1),
3.1
06
9,
28
.70
96
Mo
rde
nite
, ,
(4 4
1),
3.0
89
9,
28
.87
11M
ord
en
ite
, ,
(3 5
1),
3.0
88
5,
28
.88
46
Mo
rde
nite
, ,
(0 4
2),
3.0
28
9,
29
.46
54M
ord
en
ite
, ,
(6 0
0),
3.0
16
0,
29
.59
44
Mo
rde
nite
, ,
(5 3
1),
2.9
42
2,
30
.35
48M
ord
en
ite
, ,
(2 6
1),
2.9
38
5,
30
.39
35M
ord
en
ite
, ,
(6 2
0),
2.8
93
0,
30
.88
28
Mo
rde
nite
, ,
(4 0
2),
2.8
90
5,
30
.91
05M
ord
en
ite
, ,
(3 3
2),
2.8
89
4,
30
.92
32
Mo
rde
nite
, ,
(1 7
0),
2.8
87
2,
30
.94
64M
ord
en
ite
, ,
(2 4
2),
2.8
72
2,
31
.11
21
Mo
rde
nite
, ,
(4 2
2),
2.7
81
7,
32
.15
13M
ord
en
ite
, ,
(1 5
2),
2.7
36
6,
32
.69
60
Mo
rde
nite
, ,
(4 6
0),
2.7
24
2,
32
.84
96M
ord
en
ite
, ,
(5 5
0),
2.7
11
7,
33
.00
47M
ord
en
ite
, ,
(6 2
1),
2.6
99
9,
33
.15
37
Mo
rde
nite
, ,
(1 7
1),
2.6
95
2,
33
.21
33M
ord
en
ite
, ,
(3 7
0),
2.6
31
7,
34
.03
88
Mo
rde
nite
, ,
(6 4
0),
2.5
98
4,
34
.48
80M
ord
en
ite
, ,
(5 1
2),
2.5
85
8,
34
.66
16
Mo
rde
nite
, ,
(7 1
0),
2.5
64
8,
34
.95
49M
ord
en
ite
, ,
(4 6
1),
2.5
61
1,
35
.00
67M
ord
en
ite
, ,
(0 8
0),
2.5
59
1,
35
.03
46
Mo
rde
nite
, ,
(5 5
1),
2.5
50
8,
35
.15
34M
ord
en
ite
, ,
(0 6
2),
2.5
26
1,
35
.50
85
Mo
rde
nite
, ,
(4 4
2),
2.5
16
9,
35
.64
22M
ord
en
ite
, ,
(3 5
2),
2.5
16
1,
35
.65
34
Mo
rde
nite
, ,
(3 7
1),
2.4
83
8,
36
.13
34M
ord
en
ite
, ,
(1 1
3),
2.4
63
3,
36
.44
42M
ord
en
ite
, ,
(2 8
0),
2.4
62
5,
36
.45
63
Mo
rde
nite
, ,
(6 4
1),
2.4
55
8,
36
.56
01M
ord
en
ite
, ,
(5 3
2),
2.4
35
1,
36
.88
17
Mo
rde
nite
, ,
(0 2
3),
2.4
33
2,
36
.91
13M
ord
en
ite
, ,
(2 6
2),
2.4
33
0,
36
.91
43
Mo
rde
nite
, ,
(7 1
1),
2.4
27
3,
37
.00
42M
ord
en
ite
, ,
(0 8
1),
2.4
22
5,
37
.08
01
Mo
rde
nite
, ,
(7 3
0),
2.4
17
5,
37
.15
98M
ord
en
ite
, ,
(6 0
2),
2.3
52
0,
38
.23
35
Mo
rde
nite
, ,
(2 2
3),
2.3
49
7,
38
.27
28M
ord
en
ite
, ,
(2 8
1),
2.3
40
1,
38
.43
65
Mo
rde
nite
, ,
(1 3
3),
2.3
32
0,
38
.57
56M
ord
en
ite
, ,
(7 3
1),
2.3
01
4,
39
.10
95
Mo
rde
nite
, ,
(3 1
3),
2.2
98
8,
39
.15
46M
ord
en
ite
, ,
(6 2
2),
2.2
92
3,
39
.27
01
Mo
rde
nite
, ,
(1 7
2),
2.2
89
4,
39
.32
17M
ord
en
ite
, ,
(5 7
0),
2.2
74
8,
39
.58
52
Mo
rde
nite
, ,
(8 0
0),
2.2
62
0,
39
.81
84M
ord
en
ite
, ,
(6 6
0),
2.2
59
8,
39
.85
92
Mo
rde
nite
, ,
(1 9
0),
2.2
57
0,
39
.91
01M
ord
en
ite
, ,
(0 4
3),
2.2
50
0,
40
.04
03M
ord
en
ite
, ,
(4 8
0),
2.2
27
4,
40
.46
30
Mo
rde
nite
, ,
(8 2
0),
2.2
08
7,
40
.82
12M
ord
en
ite
, ,
(4 6
2),
2.2
05
5,
40
.88
29
Mo
rde
nite
, ,
(5 5
2),
2.1
98
9,
41
.01
15M
ord
en
ite
, ,
(3 3
3),
2.1
91
0,
41
.16
68
Mo
rde
nite
, ,
(7 5
0),
2.1
85
9,
41
.26
61M
ord
en
ite
, ,
(2 4
3),
2.1
83
5,
41
.31
45
Mo
rde
nite
, ,
(5 7
1),
2.1
77
2,
41
.43
86M
ord
en
ite
, ,
(6 6
1),
2.1
64
1,
41
.70
25
Mo
rde
nite
, ,
(1 9
1),
2.1
61
6,
41
.75
15M
ord
en
ite
, ,
(3 7
2),
2.1
55
6,
41
.87
44
Mo
rde
nite
, ,
(4 2
3),
2.1
42
9,
42
.13
34M
ord
en
ite
, ,
(6 4
2),
2.1
37
2,
42
.25
19
Mo
rde
nite
, ,
(4 8
1),
2.1
35
6,
42
.28
46M
ord
en
ite
, ,
(3 9
0),
2.1
28
5,
42
.43
35
Mo
rde
nite
, ,
(1 5
3),
2.1
22
1,
42
.56
69M
ord
en
ite
, ,
(8 2
1),
2.1
19
1,
42
.63
02
Mo
rde
nite
, ,
(7 1
2),
2.1
18
3,
42
.64
59M
ord
en
ite
, ,
(0 8
2),
2.1
15
2,
42
.71
33
Mo
rde
nite
, ,
(7 5
1),
2.0
98
9,
43
.05
97M
ord
en
ite
, ,
(8 4
0),
2.0
69
0,
43
.71
56
Mo
rde
nite
, ,
(2 8
2),
2.0
59
6,
43
.92
39M
ord
en
ite
, ,
(5 1
3),
2.0
49
4,
44
.15
44M
ord
en
ite
, ,
(3 9
1),
2.0
47
9,
44
.18
86
Mo
rde
nite
, ,
(0 1
0 0
), 2
.04
73
, 4
4.2
02
2M
ord
en
ite
, ,
(7 3
2),
2.0
33
1,
44
.52
82
Mo
rde
nite
, ,
(0 6
3),
2.0
19
3,
44
.84
89M
ord
en
ite
, ,
(4 4
3),
2.0
14
6,
44
.95
91
Mo
rde
nite
, ,
(3 5
3),
2.0
14
2,
44
.96
83M
ord
en
ite
, ,
(9 1
0),
2.0
01
0,
45
.28
01M
ord
en
ite
, ,
(2 1
0 0
), 1
.99
68
, 4
5.3
81
1M
ord
en
ite
, ,
(8 4
1),
1.9
94
7,
45
.43
11
Mo
rde
nite
, ,
(0 1
0 1
), 1
.97
53
, 4
5.9
03
3M
ord
en
ite
, ,
(5 3
3),
1.9
71
9,
45
.98
75
Mo
rde
nite
, ,
(2 6
3),
1.9
70
8,
46
.01
47M
ord
en
ite
, ,
(6 8
0),
1.9
51
3,
46
.50
05
Mo
rde
nite
, ,
(5 7
2),
1.9
46
0,
46
.63
61M
ord
en
ite
, ,
(8 0
2),
1.9
37
9,
46
.84
07
Mo
rde
nite
, ,
(7 7
0),
1.9
37
0,
46
.86
60M
ord
en
ite
, ,
(6 6
2),
1.9
36
5,
46
.87
65
Mo
rde
nite
, ,
(1 9
2),
1.9
34
8,
46
.92
12M
ord
en
ite
, ,
(9 1
1),
1.9
33
7,
46
.95
05M
ord
en
ite
, ,
(2 1
0 1
), 1
.92
99
, 4
7.0
48
7M
ord
en
ite
, ,
(9 3
0),
1.9
28
7,
47
.07
88M
ord
en
ite
, ,
(5 9
0),
1.9
25
9,
47
.15
00M
ord
en
ite
, ,
(4 8
2),
1.9
16
1,
47
.40
78
Mo
rde
nite
, ,
(8 2
2),
1.9
04
1,
47
.72
39M
ord
en
ite
, ,
(6 2
3),
1.8
93
7,
48
.00
16M
ord
en
ite
, ,
(1 7
3),
1.8
92
1,
48
.04
55
Mo
rde
nite
, ,
(7 5
2),
1.8
89
5,
48
.11
74M
ord
en
ite
, ,
(6 8
1),
1.8
88
7,
48
.13
82
Mo
rde
nite
, ,
(8 6
0),
1.8
85
4,
48
.22
90M
ord
en
ite
, ,
(0 0
4),
1.8
78
7,
48
.40
92
Mo
rde
nite
, ,
(7 7
1),
1.8
75
7,
48
.49
43M
ord
en
ite
, ,
(9 3
1),
1.8
68
2,
48
.70
16M
ord
en
ite
, ,
(5 9
1),
1.8
65
7,
48
.77
11
Mo
rde
nite
, ,
(4 1
0 0
), 1
.86
52
, 4
8.7
83
8M
ord
en
ite
, ,
(1 1
4),
1.8
61
0,
48
.90
19
Mo
rde
nite
, ,
(3 9
2),
1.8
52
0,
49
.15
52
Mo
rde
nite
, ,
(1 1
1 0
), 1
.85
14
, 4
9.1
70
9M
ord
en
ite
, ,
(0 2
4),
1.8
47
9,
49
.27
11
Mo
rde
nite
, ,
(4 6
3),
1.8
43
9,
49
.38
39M
ord
en
ite
, ,
(5 5
3),
1.8
40
1,
49
.49
48
Mo
rde
nite
, ,
(2 0
4),
1.8
39
5,
49
.51
04M
ord
en
ite
, ,
(8 6
1),
1.8
28
7,
49
.82
36
Mo
rde
nite
, ,
(3 7
3),
1.8
14
4,
50
.24
18M
ord
en
ite
, ,
(8 4
2),
1.8
12
4,
50
.30
28
Mo
rde
nite
, ,
(2 2
4),
1.8
10
5,
50
.35
82
Mo
rde
nite
, ,
(4 1
0 1
), 1
.81
03
, 5
0.3
65
3M
ord
en
ite
, ,
(10
0 0
), 1
.80
96
, 5
0.3
85
4M
ord
en
ite
, ,
(9 5
0),
1.8
04
8,
50
.52
85M
ord
en
ite
, ,
(6 4
3),
1.8
03
4,
50
.57
00
Mo
rde
nite
, ,
(1 3
4),
1.8
02
4,
50
.60
22
Mo
rde
nite
, ,
(0 1
0 2
), 1
.79
78
, 5
0.7
40
4M
ord
en
ite
, ,
(1 1
1 1
), 1
.79
77
, 5
0.7
43
5M
ord
en
ite
, ,
(7 1
3),
1.7
92
1,
50
.91
34M
ord
en
ite
, ,
(0 8
3),
1.7
90
1,
50
.97
23
Mo
rde
nite
, ,
(3 1
4),
1.7
86
9,
51
.07
07
Mo
rde
nite
, ,
(10
2 0
), 1
.78
20
, 5
1.2
22
6M
ord
en
ite
, ,
(3 1
1 0
), 1
.77
84
, 5
1.3
31
4M
ord
en
ite
, ,
(9 1
2),
1.7
66
2,
51
.71
36M
ord
en
ite
, ,
(0 4
4),
1.7
63
7,
51
.79
28M
ord
en
ite
, ,
(2 1
0 2
), 1
.76
33
, 5
1.8
05
0M
ord
en
ite
, ,
(2 8
3),
1.7
56
1,
52
.03
35M
ord
en
ite
, ,
(9 5
1),
1.7
54
9,
52
.07
12
Mo
rde
nite
, ,
(7 3
3),
1.7
39
5,
52
.56
62M
ord
en
ite
, ,
(4 0
4),
1.7
35
1,
52
.71
18
Mo
rde
nite
, ,
(3 3
4),
1.7
34
8,
52
.72
00
Mo
rde
nite
, ,
(10
2 1
), 1
.73
39
, 5
2.7
50
7M
ord
en
ite
, ,
(6 8
2),
1.7
31
7,
52
.82
15
Mo
rde
nite
, ,
(2 4
4),
1.7
31
1,
52
.84
22
Mo
rde
nite
, ,
(3 1
1 1
), 1
.73
06
, 5
2.8
57
3M
ord
en
ite
, ,
(7 7
2),
1.7
21
7,
53
.15
46
Mo
rde
nite
, ,
(9 3
2),
1.7
15
9,
53
.34
87M
ord
en
ite
, ,
(5 9
2),
1.7
13
9,
53
.41
38
Mo
rde
nite
, ,
(4 2
4),
1.7
10
7,
53
.52
30M
ord
en
ite
, ,
(7 9
0),
1.7
07
8,
53
.62
20M
ord
en
ite
, ,
(10
4 0
), 1
.70
61
, 5
3.6
78
0M
ord
en
ite
, ,
(0 1
2 0
), 1
.70
61
, 5
3.6
78
8M
ord
en
ite
, ,
(1 5
4),
1.7
00
0,
53
.88
54
Mo
rde
nite
, ,
(8 8
0),
1.6
94
8,
54
.06
39
Mo
rde
nite
, ,
(6 1
0 0
), 1
.69
39
, 5
4.0
96
1M
ord
en
ite
, ,
(8 6
2),
1.6
85
1,
54
.40
11
Mo
rde
nite
, ,
(5 7
3),
1.6
84
0,
54
.43
90M
ord
en
ite
, ,
(6 6
3),
1.6
77
9,
54
.65
40
Mo
rde
nite
, ,
(1 9
3),
1.6
76
8,
54
.69
40
Mo
rde
nite
, ,
(2 1
2 0
), 1
.67
65
, 5
4.7
02
9M
ord
en
ite
, ,
(4 1
0 2
), 1
.67
07
, 5
4.9
10
6M
ord
en
ite
, ,
(7 9
1),
1.6
65
3,
55
.10
34M
ord
en
ite
, ,
(4 8
3),
1.6
64
6,
55
.13
01M
ord
en
ite
, ,
(10
4 1
), 1
.66
38
, 5
5.1
58
4M
ord
en
ite
, ,
(0 1
2 1
), 1
.66
37
, 5
5.1
59
1M
ord
en
ite
, ,
(5 1
4),
1.6
62
0,
55
.22
33
Mo
rde
nite
, ,
(1 1
0),
13
.55
87
, 6
.51
36
Mo
rde
nite
, ,
(0 2
0),
10
.23
65
, 8
.63
10M
ord
en
ite
, ,
(2 0
0),
9.0
48
0,
9.7
67
3
Mo
rde
nite
, ,
(2 2
0),
6.7
79
3,
13
.04
83M
ord
en
ite
, ,
(1 1
1),
6.5
72
9,
13
.45
99M
ord
en
ite
, ,
(1 3
0),
6.3
85
4,
13
.85
72
Mo
rde
nite
, ,
(0 2
1),
6.0
57
8,
14
.61
04M
ord
en
ite
, ,
(3 1
0),
5.7
86
1,
15
.30
06
Mo
rde
nite
, ,
(0 4
0),
5.1
18
2,
17
.31
15M
ord
en
ite
, ,
(2 2
1),
5.0
33
8,
17
.60
43M
ord
en
ite
, ,
(1 3
1),
4.8
66
0,
18
.21
62
Mo
rde
nite
, ,
(3 1
1),
4.5
84
6,
19
.34
47M
ord
en
ite
, ,
(4 0
0),
4.5
24
0,
19
.60
65M
ord
en
ite
, ,
(3 3
0),
4.5
19
6,
19
.62
60
Mo
rde
nite
, ,
(2 4
0),
4.4
54
9,
19
.91
38M
ord
en
ite
, ,
(0 4
1),
4.2
30
3,
20
.98
26M
ord
en
ite
, ,
(4 2
0),
4.1
37
9,
21
.45
66
Mo
rde
nite
, ,
(1 5
0),
3.9
93
6,
22
.24
14M
ord
en
ite
, ,
(3 3
1),
3.8
73
1,
22
.94
30
Mo
rde
nite
, ,
(2 4
1),
3.8
32
1,
23
.19
15M
ord
en
ite
, ,
(0 0
2),
3.7
57
5,
23
.65
88
Mo
rde
nite
, ,
(4 2
1),
3.6
24
8,
24
.53
85M
ord
en
ite
, ,
(1 1
2),
3.6
21
0,
24
.56
41
Mo
rde
nite
, ,
(5 1
0),
3.5
63
9,
24
.96
39M
ord
en
ite
, ,
(0 2
2),
3.5
27
4,
25
.22
69
Mo
rde
nite
, ,
(1 5
1),
3.5
26
6,
25
.23
26M
ord
en
ite
, ,
(2 0
2),
3.4
70
2,
25
.64
98M
ord
en
ite
, ,
(0 6
0),
3.4
12
2,
26
.09
34
Mo
rde
nite
, ,
(4 4
0),
3.3
89
7,
26
.26
97M
ord
en
ite
, ,
(3 5
0),
3.3
87
8,
26
.28
44M
ord
en
ite
, ,
(2 2
2),
3.2
86
5,
27
.11
02
Mo
rde
nite
, ,
(1 3
2),
3.2
38
4,
27
.52
03M
ord
en
ite
, ,
(5 1
1),
3.2
20
2,
27
.67
93M
ord
en
ite
, ,
(5 3
0),
3.1
97
4,
27
.88
05
Mo
rde
nite
, ,
(2 6
0),
3.1
92
7,
27
.92
24M
ord
en
ite
, ,
(3 1
2),
3.1
51
3,
28
.29
65M
ord
en
ite
, ,
(0 6
1),
3.1
06
9,
28
.70
96
Mo
rde
nite
, ,
(4 4
1),
3.0
89
9,
28
.87
11M
ord
en
ite
, ,
(3 5
1),
3.0
88
5,
28
.88
46
Mo
rde
nite
, ,
(0 4
2),
3.0
28
9,
29
.46
54M
ord
en
ite
, ,
(6 0
0),
3.0
16
0,
29
.59
44
Mo
rde
nite
, ,
(5 3
1),
2.9
42
2,
30
.35
48M
ord
en
ite
, ,
(2 6
1),
2.9
38
5,
30
.39
35M
ord
en
ite
, ,
(6 2
0),
2.8
93
0,
30
.88
28
Mo
rde
nite
, ,
(4 0
2),
2.8
90
5,
30
.91
05M
ord
en
ite
, ,
(3 3
2),
2.8
89
4,
30
.92
32
Mo
rde
nite
, ,
(1 7
0),
2.8
87
2,
30
.94
64M
ord
en
ite
, ,
(2 4
2),
2.8
72
2,
31
.11
21
Mo
rde
nite
, ,
(4 2
2),
2.7
81
7,
32
.15
13M
ord
en
ite
, ,
(1 5
2),
2.7
36
6,
32
.69
60
Mo
rde
nite
, ,
(4 6
0),
2.7
24
2,
32
.84
96M
ord
en
ite
, ,
(5 5
0),
2.7
11
7,
33
.00
47M
ord
en
ite
, ,
(6 2
1),
2.6
99
9,
33
.15
37
Mo
rde
nite
, ,
(1 7
1),
2.6
95
2,
33
.21
33M
ord
en
ite
, ,
(3 7
0),
2.6
31
7,
34
.03
88
Mo
rde
nite
, ,
(6 4
0),
2.5
98
4,
34
.48
80M
ord
en
ite
, ,
(5 1
2),
2.5
85
8,
34
.66
16
Mo
rde
nite
, ,
(7 1
0),
2.5
64
8,
34
.95
49M
ord
en
ite
, ,
(4 6
1),
2.5
61
1,
35
.00
67M
ord
en
ite
, ,
(0 8
0),
2.5
59
1,
35
.03
46
Mo
rde
nite
, ,
(5 5
1),
2.5
50
8,
35
.15
34M
ord
en
ite
, ,
(0 6
2),
2.5
26
1,
35
.50
85
Mo
rde
nite
, ,
(4 4
2),
2.5
16
9,
35
.64
22M
ord
en
ite
, ,
(3 5
2),
2.5
16
1,
35
.65
34
Mo
rde
nite
, ,
(3 7
1),
2.4
83
8,
36
.13
34M
ord
en
ite
, ,
(1 1
3),
2.4
63
3,
36
.44
42M
ord
en
ite
, ,
(2 8
0),
2.4
62
5,
36
.45
63
Mo
rde
nite
, ,
(6 4
1),
2.4
55
8,
36
.56
01M
ord
en
ite
, ,
(5 3
2),
2.4
35
1,
36
.88
17
Mo
rde
nite
, ,
(0 2
3),
2.4
33
2,
36
.91
13M
ord
en
ite
, ,
(2 6
2),
2.4
33
0,
36
.91
43
Mo
rde
nite
, ,
(7 1
1),
2.4
27
3,
37
.00
42M
ord
en
ite
, ,
(0 8
1),
2.4
22
5,
37
.08
01
Mo
rde
nite
, ,
(7 3
0),
2.4
17
5,
37
.15
98M
ord
en
ite
, ,
(6 0
2),
2.3
52
0,
38
.23
35
Mo
rde
nite
, ,
(2 2
3),
2.3
49
7,
38
.27
28M
ord
en
ite
, ,
(2 8
1),
2.3
40
1,
38
.43
65
Mo
rde
nite
, ,
(1 3
3),
2.3
32
0,
38
.57
56M
ord
en
ite
, ,
(7 3
1),
2.3
01
4,
39
.10
95
Mo
rde
nite
, ,
(3 1
3),
2.2
98
8,
39
.15
46M
ord
en
ite
, ,
(6 2
2),
2.2
92
3,
39
.27
01
Mo
rde
nite
, ,
(1 7
2),
2.2
89
4,
39
.32
17M
ord
en
ite
, ,
(5 7
0),
2.2
74
8,
39
.58
52
Mo
rde
nite
, ,
(8 0
0),
2.2
62
0,
39
.81
84M
ord
en
ite
, ,
(6 6
0),
2.2
59
8,
39
.85
92
Mo
rde
nite
, ,
(1 9
0),
2.2
57
0,
39
.91
01M
ord
en
ite
, ,
(0 4
3),
2.2
50
0,
40
.04
03M
ord
en
ite
, ,
(4 8
0),
2.2
27
4,
40
.46
30
Mo
rde
nite
, ,
(8 2
0),
2.2
08
7,
40
.82
12M
ord
en
ite
, ,
(4 6
2),
2.2
05
5,
40
.88
29
Mo
rde
nite
, ,
(5 5
2),
2.1
98
9,
41
.01
15M
ord
en
ite
, ,
(3 3
3),
2.1
91
0,
41
.16
68
Mo
rde
nite
, ,
(7 5
0),
2.1
85
9,
41
.26
61M
ord
en
ite
, ,
(2 4
3),
2.1
83
5,
41
.31
45
Mo
rde
nite
, ,
(5 7
1),
2.1
77
2,
41
.43
86M
ord
en
ite
, ,
(6 6
1),
2.1
64
1,
41
.70
25
Mo
rde
nite
, ,
(1 9
1),
2.1
61
6,
41
.75
15M
ord
en
ite
, ,
(3 7
2),
2.1
55
6,
41
.87
44
Mo
rde
nite
, ,
(4 2
3),
2.1
42
9,
42
.13
34M
ord
en
ite
, ,
(6 4
2),
2.1
37
2,
42
.25
19
Mo
rde
nite
, ,
(4 8
1),
2.1
35
6,
42
.28
46M
ord
en
ite
, ,
(3 9
0),
2.1
28
5,
42
.43
35
Mo
rde
nite
, ,
(1 5
3),
2.1
22
1,
42
.56
69M
ord
en
ite
, ,
(8 2
1),
2.1
19
1,
42
.63
02
Mo
rde
nite
, ,
(7 1
2),
2.1
18
3,
42
.64
59M
ord
en
ite
, ,
(0 8
2),
2.1
15
2,
42
.71
33
Mo
rde
nite
, ,
(7 5
1),
2.0
98
9,
43
.05
97M
ord
en
ite
, ,
(8 4
0),
2.0
69
0,
43
.71
56
Mo
rde
nite
, ,
(2 8
2),
2.0
59
6,
43
.92
39M
ord
en
ite
, ,
(5 1
3),
2.0
49
4,
44
.15
44M
ord
en
ite
, ,
(3 9
1),
2.0
47
9,
44
.18
86
Mo
rde
nite
, ,
(0 1
0 0
), 2
.04
73
, 4
4.2
02
2M
ord
en
ite
, ,
(7 3
2),
2.0
33
1,
44
.52
82
Mo
rde
nite
, ,
(0 6
3),
2.0
19
3,
44
.84
89M
ord
en
ite
, ,
(4 4
3),
2.0
14
6,
44
.95
91
Mo
rde
nite
, ,
(3 5
3),
2.0
14
2,
44
.96
83M
ord
en
ite
, ,
(9 1
0),
2.0
01
0,
45
.28
01M
ord
en
ite
, ,
(2 1
0 0
), 1
.99
68
, 4
5.3
81
1M
ord
en
ite
, ,
(8 4
1),
1.9
94
7,
45
.43
11
Mo
rde
nite
, ,
(0 1
0 1
), 1
.97
53
, 4
5.9
03
3M
ord
en
ite
, ,
(5 3
3),
1.9
71
9,
45
.98
75
Mo
rde
nite
, ,
(2 6
3),
1.9
70
8,
46
.01
47M
ord
en
ite
, ,
(6 8
0),
1.9
51
3,
46
.50
05
Mo
rde
nite
, ,
(5 7
2),
1.9
46
0,
46
.63
61M
ord
en
ite
, ,
(8 0
2),
1.9
37
9,
46
.84
07
Mo
rde
nite
, ,
(7 7
0),
1.9
37
0,
46
.86
60M
ord
en
ite
, ,
(6 6
2),
1.9
36
5,
46
.87
65
Mo
rde
nite
, ,
(1 9
2),
1.9
34
8,
46
.92
12M
ord
en
ite
, ,
(9 1
1),
1.9
33
7,
46
.95
05M
ord
en
ite
, ,
(2 1
0 1
), 1
.92
99
, 4
7.0
48
7M
ord
en
ite
, ,
(9 3
0),
1.9
28
7,
47
.07
88M
ord
en
ite
, ,
(5 9
0),
1.9
25
9,
47
.15
00M
ord
en
ite
, ,
(4 8
2),
1.9
16
1,
47
.40
78
Mo
rde
nite
, ,
(8 2
2),
1.9
04
1,
47
.72
39M
ord
en
ite
, ,
(6 2
3),
1.8
93
7,
48
.00
16M
ord
en
ite
, ,
(1 7
3),
1.8
92
1,
48
.04
55
Mo
rde
nite
, ,
(7 5
2),
1.8
89
5,
48
.11
74M
ord
en
ite
, ,
(6 8
1),
1.8
88
7,
48
.13
82
Mo
rde
nite
, ,
(8 6
0),
1.8
85
4,
48
.22
90M
ord
en
ite
, ,
(0 0
4),
1.8
78
7,
48
.40
92
Mo
rde
nite
, ,
(7 7
1),
1.8
75
7,
48
.49
43M
ord
en
ite
, ,
(9 3
1),
1.8
68
2,
48
.70
16M
ord
en
ite
, ,
(5 9
1),
1.8
65
7,
48
.77
11
Mo
rde
nite
, ,
(4 1
0 0
), 1
.86
52
, 4
8.7
83
8M
ord
en
ite
, ,
(1 1
4),
1.8
61
0,
48
.90
19
Mo
rde
nite
, ,
(3 9
2),
1.8
52
0,
49
.15
52
Mo
rde
nite
, ,
(1 1
1 0
), 1
.85
14
, 4
9.1
70
9M
ord
en
ite
, ,
(0 2
4),
1.8
47
9,
49
.27
11
Mo
rde
nite
, ,
(4 6
3),
1.8
43
9,
49
.38
39M
ord
en
ite
, ,
(5 5
3),
1.8
40
1,
49
.49
48
Mo
rde
nite
, ,
(2 0
4),
1.8
39
5,
49
.51
04M
ord
en
ite
, ,
(8 6
1),
1.8
28
7,
49
.82
36
Mo
rde
nite
, ,
(3 7
3),
1.8
14
4,
50
.24
18M
ord
en
ite
, ,
(8 4
2),
1.8
12
4,
50
.30
28
Mo
rde
nite
, ,
(2 2
4),
1.8
10
5,
50
.35
82
Mo
rde
nite
, ,
(4 1
0 1
), 1
.81
03
, 5
0.3
65
3M
ord
en
ite
, ,
(10
0 0
), 1
.80
96
, 5
0.3
85
4M
ord
en
ite
, ,
(9 5
0),
1.8
04
8,
50
.52
85M
ord
en
ite
, ,
(6 4
3),
1.8
03
4,
50
.57
00
Mo
rde
nite
, ,
(1 3
4),
1.8
02
4,
50
.60
22
Mo
rde
nite
, ,
(0 1
0 2
), 1
.79
78
, 5
0.7
40
4M
ord
en
ite
, ,
(1 1
1 1
), 1
.79
77
, 5
0.7
43
5M
ord
en
ite
, ,
(7 1
3),
1.7
92
1,
50
.91
34M
ord
en
ite
, ,
(0 8
3),
1.7
90
1,
50
.97
23
Mo
rde
nite
, ,
(3 1
4),
1.7
86
9,
51
.07
07
Mo
rde
nite
, ,
(10
2 0
), 1
.78
20
, 5
1.2
22
6M
ord
en
ite
, ,
(3 1
1 0
), 1
.77
84
, 5
1.3
31
4M
ord
en
ite
, ,
(9 1
2),
1.7
66
2,
51
.71
36M
ord
en
ite
, ,
(0 4
4),
1.7
63
7,
51
.79
28M
ord
en
ite
, ,
(2 1
0 2
), 1
.76
33
, 5
1.8
05
0M
ord
en
ite
, ,
(2 8
3),
1.7
56
1,
52
.03
35M
ord
en
ite
, ,
(9 5
1),
1.7
54
9,
52
.07
12
Mo
rde
nite
, ,
(7 3
3),
1.7
39
5,
52
.56
62M
ord
en
ite
, ,
(4 0
4),
1.7
35
1,
52
.71
18
Mo
rde
nite
, ,
(3 3
4),
1.7
34
8,
52
.72
00
Mo
rde
nite
, ,
(10
2 1
), 1
.73
39
, 5
2.7
50
7M
ord
en
ite
, ,
(6 8
2),
1.7
31
7,
52
.82
15
Mo
rde
nite
, ,
(2 4
4),
1.7
31
1,
52
.84
22
Mo
rde
nite
, ,
(3 1
1 1
), 1
.73
06
, 5
2.8
57
3M
ord
en
ite
, ,
(7 7
2),
1.7
21
7,
53
.15
46
Mo
rde
nite
, ,
(9 3
2),
1.7
15
9,
53
.34
87M
ord
en
ite
, ,
(5 9
2),
1.7
13
9,
53
.41
38
Mo
rde
nite
, ,
(4 2
4),
1.7
10
7,
53
.52
30M
ord
en
ite
, ,
(7 9
0),
1.7
07
8,
53
.62
20M
ord
en
ite
, ,
(10
4 0
), 1
.70
61
, 5
3.6
78
0M
ord
en
ite
, ,
(0 1
2 0
), 1
.70
61
, 5
3.6
78
8M
ord
en
ite
, ,
(1 5
4),
1.7
00
0,
53
.88
54
Mo
rde
nite
, ,
(8 8
0),
1.6
94
8,
54
.06
39
Mo
rde
nite
, ,
(6 1
0 0
), 1
.69
39
, 5
4.0
96
1M
ord
en
ite
, ,
(8 6
2),
1.6
85
1,
54
.40
11
Mo
rde
nite
, ,
(5 7
3),
1.6
84
0,
54
.43
90M
ord
en
ite
, ,
(6 6
3),
1.6
77
9,
54
.65
40
Mo
rde
nite
, ,
(1 9
3),
1.6
76
8,
54
.69
40
Mo
rde
nite
, ,
(2 1
2 0
), 1
.67
65
, 5
4.7
02
9M
ord
en
ite
, ,
(4 1
0 2
), 1
.67
07
, 5
4.9
10
6M
ord
en
ite
, ,
(7 9
1),
1.6
65
3,
55
.10
34M
ord
en
ite
, ,
(4 8
3),
1.6
64
6,
55
.13
01M
ord
en
ite
, ,
(10
4 1
), 1
.66
38
, 5
5.1
58
4M
ord
en
ite
, ,
(0 1
2 1
), 1
.66
37
, 5
5.1
59
1M
ord
en
ite
, ,
(5 1
4),
1.6
62
0,
55
.22
33

63
4.3 Optimization Studies
The second objective was to study the pyrolysis operating variables that is the catalyst
concentration and reaction temperature on liquid oil yield. Optimization studies
involved analyzing the process variables for maximum yield. Experimental data were
fitted into the correlation, which was then plotted in surface and contour plots that
depict the optimum conditions. The waste plastics identified for this research were High
density polyethylene, polypropylene and polystyrene. The temperature requirement for
thermal pyrolysis is higher for optimum liquid oil production. Table 4.4 is a summary
of thermal pyrolysis done by researchers.
Table 4.4: Thermal pyrolysis of different types of plastic waste
Type of Plastic Temperature,
℃
Liquid yield, (mass%)
Researcher
HDPE 550 ℃ 79.08 Marcilla et al., 2009
HDPE 650 ℃ 68.5 Mastral et al., 2007
PP 500 ℃ 82.12 Fakhrhoseini, 2013
PP 740 ℃ 48.8 Dermibas, 2004
PS 600 ℃ 98.7 Liu et al, 1999
PS 581 ℃ 89.5 Dermibas, 2004
4.3.1 Experimental design for HDPE
The pyrolysis temperatures varied from 158.6 ℃ to 441.2℃; and catalyst amount
ranged from 2.93 wt.% to 17.07 wt.%. HDPE consists of long chain and follows the
random chain scission mechanism during its thermal degradation, this requires
relatively higher temperature it is for this reason that at temperatures below 200 ℃,
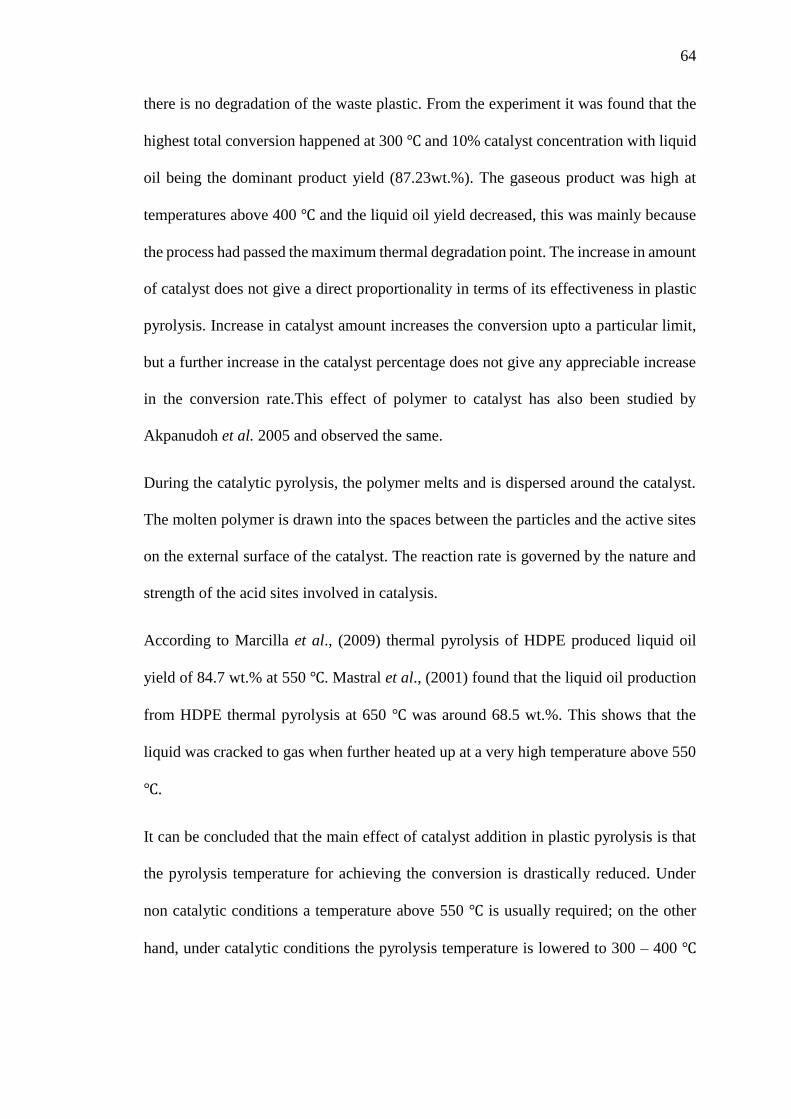
64
there is no degradation of the waste plastic. From the experiment it was found that the
highest total conversion happened at 300 ℃ and 10% catalyst concentration with liquid
oil being the dominant product yield (87.23wt.%). The gaseous product was high at
temperatures above 400 ℃ and the liquid oil yield decreased, this was mainly because
the process had passed the maximum thermal degradation point. The increase in amount
of catalyst does not give a direct proportionality in terms of its effectiveness in plastic
pyrolysis. Increase in catalyst amount increases the conversion upto a particular limit,
but a further increase in the catalyst percentage does not give any appreciable increase
in the conversion rate.This effect of polymer to catalyst has also been studied by
Akpanudoh et al. 2005 and observed the same.
During the catalytic pyrolysis, the polymer melts and is dispersed around the catalyst.
The molten polymer is drawn into the spaces between the particles and the active sites
on the external surface of the catalyst. The reaction rate is governed by the nature and
strength of the acid sites involved in catalysis.
According to Marcilla et al., (2009) thermal pyrolysis of HDPE produced liquid oil
yield of 84.7 wt.% at 550 ℃. Mastral et al., (2001) found that the liquid oil production
from HDPE thermal pyrolysis at 650 ℃ was around 68.5 wt.%. This shows that the
liquid was cracked to gas when further heated up at a very high temperature above 550
℃.
It can be concluded that the main effect of catalyst addition in plastic pyrolysis is that
the pyrolysis temperature for achieving the conversion is drastically reduced. Under
non catalytic conditions a temperature above 550 ℃ is usually required; on the other
hand, under catalytic conditions the pyrolysis temperature is lowered to 300 – 400 ℃

65
as observed in this study. Table 4.5 gives the details of 13 experiments in terms of actual
levels as per CCD, and experimental and predicted liquid oil yields.
Table 4.5: CCD matrix with Liquid oil yield for HDPE waste plastics
Runs Temp (℃) Catalyst
amount (wt%)
Liquid Yield
(mass%)
Predicted
Yield
Char
(mass %)
Gas
(mass%)
1 300 2.93 47.56 47.73 16.55 35.89
2 200 5 19.23 19.19 61.20 19.57
3 300 17.07 50.12 50.14 10.23 39.65
4 441.42 10 21.48 21.73 8.84 69.68
5 300 10 87.01 87.13 11.28 1.71
6 300 10 87.27 87.13 11.27 1.45
7 400 5 38.06 37.81 9.37 52.57
8 300 10 87.09 87.13 11.30 1.61
9 200 15 22.54 22.61 55.45 22.01
10 158.58 10 0 -2.18 98.54 1.46
11 400 15 37.96 37.81 10.02 52.02
12 300 10 87.27 87.13 11.26 1.47
13 300 10 87.02 87.13 11.40 1.58
Data in Table 4.5 were tested for fit for a linear, two-factor interaction, quadratic and
cubic polynomials.
Yield = 87.13 + 8.45 A + 0.8538 B - 0.8525 AB - 39.68 A2 - 19.10 B2 .......Equation 4.1
Table 4.6 shows sequential model sum of squares.
Table 4.6: Sequential model sum of squares
Source Sum of Squares df Mean Square F-value p-value
Mean vs Total 34581.30 1 34581.30
Linear vs Mean 577.48 2 288.74 0.2445 0.7876
2FI vs Linear 2.91 1 2.91 0.0022 0.9635
Quadratic vs 2FI 11805.28 2 5902.64 1.625E+05 < 0.0001 Suggested
Cubic vs Quadratic 0.1167 2 0.0583 2.12 0.2154 Aliased
Residual 0.1376 5 0.0275
Total 46967.22 13 3612.86
Based on the F-value (1.625E +05) and p-value (0.0001), Quadratic model was
suggested. Cubic was aliased.

66
Table 4.7 gives the Analysis of Variance (ANOVA)
Table 4.7: ANOVA for Quadratic model
Source Sum of
Squares Df
Mean
Square F-value p-value
Model 12385.67 5 2477.13 68199.92 < 0.0001 Significant
A-Temperature 571.65 1 571.65 15738.55 < 0.0001
B-Catalyst
amount 5.83 1 5.83 160.56 < 0.0001
AB 2.91 1 2.91 80.04 < 0.0001
A² 10407.48 1 10407.48 2.865E+05 < 0.0001
B² 2537.58 1 2537.58 69864.01 < 0.0001
Residual 0.2543 7 0.0363
Lack of Fit 0.1870 3 0.0623 3.71 0.1191 not
significant
Pure Error 0.0673 4 0.0168
Cor Total 12385.92 12
Std. Dev. 0.1906 R² 1.0000
Mean 51.58 Adjusted R² 1.0000
C.V. % 0.3695 Predicted R² 0.9999
Adequate Precision 689.8064
The Model F-value of 68199.92 implies the model is significant. There is only a 0.01%
chance that an F-value this large could occur due to noise.
P-values less than 0.0500 indicate model terms are significant. In this case A, B, AB,
A², B² are significant model terms. Values greater than 0.1000 indicate the model terms
are not significant.
The Lack of Fit F-value of 3.71 implies the Lack of Fit is not significant relative to the
pure error. There is a 11.91% chance that a Lack of Fit F-value this large could occur
due to noise. The lack of Fit was insignificant hence the model did fit.
The Predicted R² of 0.9999 was in reasonable agreement with the Adjusted R² of
1.0000; i.e. the difference is less than 0.2. Adequate Precision measures the signal to

67
noise ratio. A ratio greater than 4 is desirable. The ratio of 689.806 indicates an adequate
signal. This model can be used to predict Yield as a function of variables A and B.
Table 4.8 gives the values of coefficients for the model.
Table 4.8: Coefficients for the quadratic model
Factor Coefficient
Estimate df
Standard
Error
95% CI
Low
95% CI
High VIF
Intercept 87.13 1 0.0852 86.93 87.33
A-Temperature 8.45 1 0.0674 8.29 8.61 1.0000
B-Catalyst
amount 0.8538 1 0.0674 0.6945 1.01 1.0000
AB -0.8525 1 0.0953 -1.08 -0.6272 1.0000
A² -38.68 1 0.0723 -38.85 -38.51 1.02
B² -19.10 1 0.0723 -19.27 -18.93 1.02
All the terms were significant hence the model was:
𝑌𝑖𝑒𝑙𝑑 = 87.13 + 8.45𝐴 + 0.8538𝐵 − 0.8525𝐴𝐵 − 39.68𝐴2 − 19.10𝐵2.........Equation 4.2
Predicted Liquid oil yields obtained from equation 4.1 is given in Table 4.5. Equation
4.2 can also be used for response surface plots.
4.3.2 Experimental design for Polypropylene waste plastics
The pyrolysis temperatures varied from 158.6 ℃ to 441.2 ℃ ; and catalyst mass %
ranged from 2.93 wt.% to 17.07 wt.%. From this study, it was found that the highest
total conversion happened at 300 ℃ with liquid oil being the dominant product yield
(60.36 wt.%). The thermal degradation of Polypropylene waste plastics starts at around
240 ℃. The increase in temperature to 400 ℃ reduced the product conversion and
increased the gaseous product. Demirbas, (2004) carried out the PP thermal pyrolysis
at extreme temperature of 740 ℃ in a batch reactor which resulted in 48.8 wt.% liquid
yield. Ahmad et al., (2014) on PP catalytic pyrolysis summarized that the highest liquid
oil was achieved at temperature of 300 ℃ around 69.82 wt.% which is comparable to
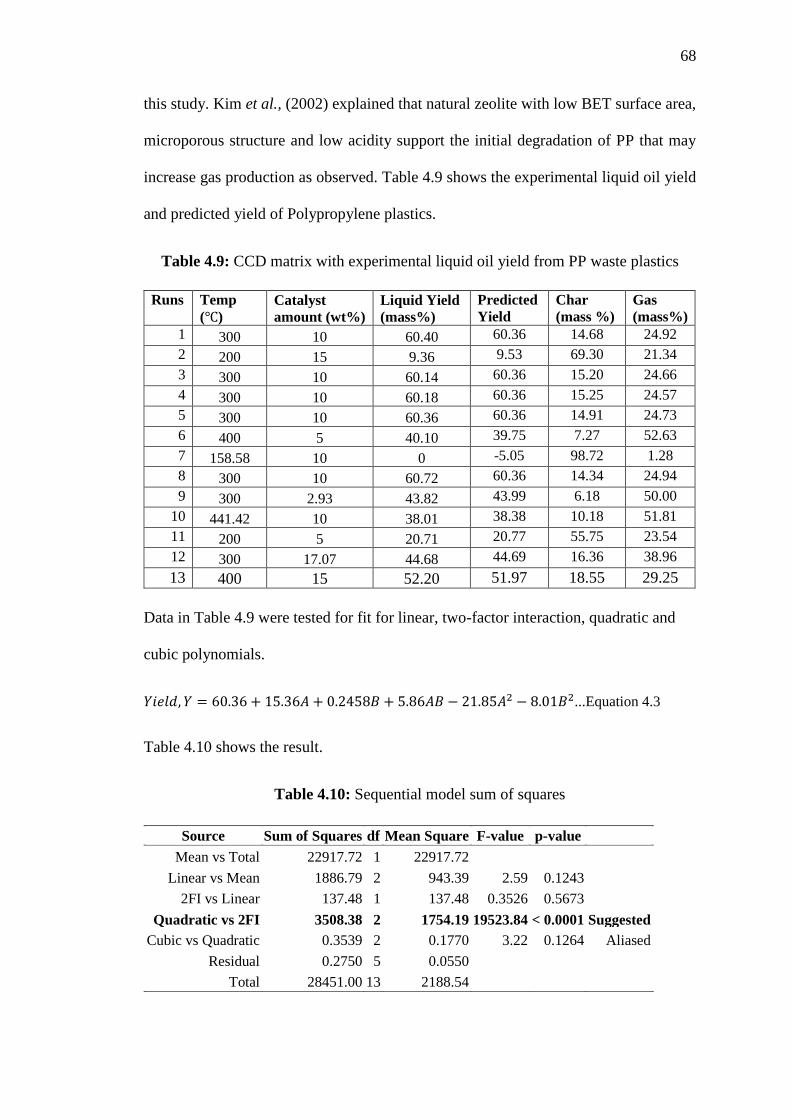
68
this study. Kim et al., (2002) explained that natural zeolite with low BET surface area,
microporous structure and low acidity support the initial degradation of PP that may
increase gas production as observed. Table 4.9 shows the experimental liquid oil yield
and predicted yield of Polypropylene plastics.
Table 4.9: CCD matrix with experimental liquid oil yield from PP waste plastics
Runs Temp
(℃)
Catalyst
amount (wt%)
Liquid Yield
(mass%)
Predicted
Yield
Char
(mass %)
Gas
(mass%)
1 300 10 60.40 60.36 14.68 24.92
2 200 15 9.36 9.53 69.30 21.34
3 300 10 60.14 60.36 15.20 24.66
4 300 10 60.18 60.36 15.25 24.57
5 300 10 60.36 60.36 14.91 24.73
6 400 5 40.10 39.75 7.27 52.63
7 158.58 10 0 -5.05 98.72 1.28
8 300 10 60.72 60.36 14.34 24.94
9 300 2.93 43.82 43.99 6.18 50.00
10 441.42 10 38.01 38.38 10.18 51.81
11 200 5 20.71 20.77 55.75 23.54
12 300 17.07 44.68 44.69 16.36 38.96
13 400 15 52.20 51.97 18.55 29.25
Data in Table 4.9 were tested for fit for linear, two-factor interaction, quadratic and
cubic polynomials.
𝑌𝑖𝑒𝑙𝑑, 𝑌 = 60.36 + 15.36𝐴 + 0.2458𝐵 + 5.86𝐴𝐵 − 21.85𝐴2 − 8.01𝐵2...Equation 4.3
Table 4.10 shows the result.
Table 4.10: Sequential model sum of squares
Source Sum of Squares df Mean Square F-value p-value
Mean vs Total 22917.72 1 22917.72
Linear vs Mean 1886.79 2 943.39 2.59 0.1243
2FI vs Linear 137.48 1 137.48 0.3526 0.5673
Quadratic vs 2FI 3508.38 2 1754.19 19523.84 < 0.0001 Suggested
Cubic vs Quadratic 0.3539 2 0.1770 3.22 0.1264 Aliased
Residual 0.2750 5 0.0550
Total 28451.00 13 2188.54

69
Based on the F-value (19523.84) and p-value (0.0001), quadratic model was suggested,
and Cubic was aliased. Table 4.11 gives Analysis of Variance (ANOVA).
Table 4.11: ANOVA for Response Surface Quadratic model
Source Sum of
Squares Df
Mean
Square F-value p-value
Model 5532.65 5 1106.53 12315.48 < 0.0001 Significant
A-Temperature 1886.31 1 1886.31 20994.25 < 0.0001
B-Catalyst
amount 0.4833 1 0.4833 5.38 0.0535
AB 137.48 1 137.48 1530.08 < 0.0001
A² 3319.87 1 3319.87 36949.55 < 0.0001
B² 446.40 1 446.40 4968.36 < 0.0001
Residual 0.6289 7 0.0898
Lack of Fit 0.4169 3 0.1390 2.62 0.1873 not
significant
Pure Error 0.2120 4 0.0530
Cor Total 5533.28 12
Std. Dev. 0.2997 R² 0.9999
Mean 41.99 Adjusted R² 0.9998
C.V. % 0.7139 Predicted R² 0.9994
Adeq Precision 321.1920
The Model F-value of 12315.48 implies the model is significant. There is only a 0.01%
chance that an F-value this large could occur due to noise.
P-values less than 0.0500 indicate model terms are significant. In this case A, AB, A²,
B² are significant model terms. Values greater than 0.1000 indicate the model terms are
not significant. The Lack of Fit F-value of 2.62 implies the Lack of Fit is not significant
relative to the pure error. There is a 18.73% chance that a Lack of Fit F-value this large
could occur due to noise. Non-significant lack of fit is good.

70
The Predicted R² of 0.9994 is in reasonable agreement with the Adjusted R² of 0.9998;
i.e. the difference is less than 0.2. Adequate Precision measures the signal to noise ratio.
A ratio greater than 4 is desirable. Your ratio of 321.192 indicates an adequate signal.
This model can be used to predict Yield as a function of the variables A and B. Table
4.12 gives the values of coefficients for the model.
Table 4.12: Coefficients for the full quadratic model
Factor Coefficient
Estimate df
Standard
Error
95% CI
Low
95% CI
High VIF
Intercept 60.36 1 0.1341 60.04 60.68
A-Temperature 15.36 1 0.1060 15.10 15.61 1.0000
B-Catalyst
amount 0.2458 1 0.1060 -0.0048 0.4964 1.0000
AB 5.86 1 0.1499 5.51 6.22 1.0000
A² -21.85 1 0.1136 -22.11 -21.58 1.02
B² -8.01 1 0.1136 -8.28 -7.74 1.02
All the terms were significant hence the model was:
𝑌𝑖𝑒𝑙𝑑, 𝑌 = 60.36 + 15.36𝐴 + 0.2458𝐵 + 5.86𝐴𝐵 − 21.85𝐴2 − 8.01𝐵2......... Equation 4.4
The predicted liquid oil yields obtained from Eqn 4.4 is given in Table 4.9. Eqn 4.4 can
also be used for response surface plots.
4.3.3 Experimental design for Polystyrene waste plastics
The pyrolysis temperature varied from 350 – 550 ℃; and catalyst mass ranged from
2.93 wt% to 17.07 wt%. From the experiment it was found that the highest total
conversion happened at 450 ℃ with liquid oil being the dominant product yield (93.20
wt.%). Increasing the temperature further reduced the production of liquid oil and
increased the gaseous product. PS plastic waste produced the highest amounts of liquid
oil as compared to all other types of plastic waste in this study. Polystyrene degradation
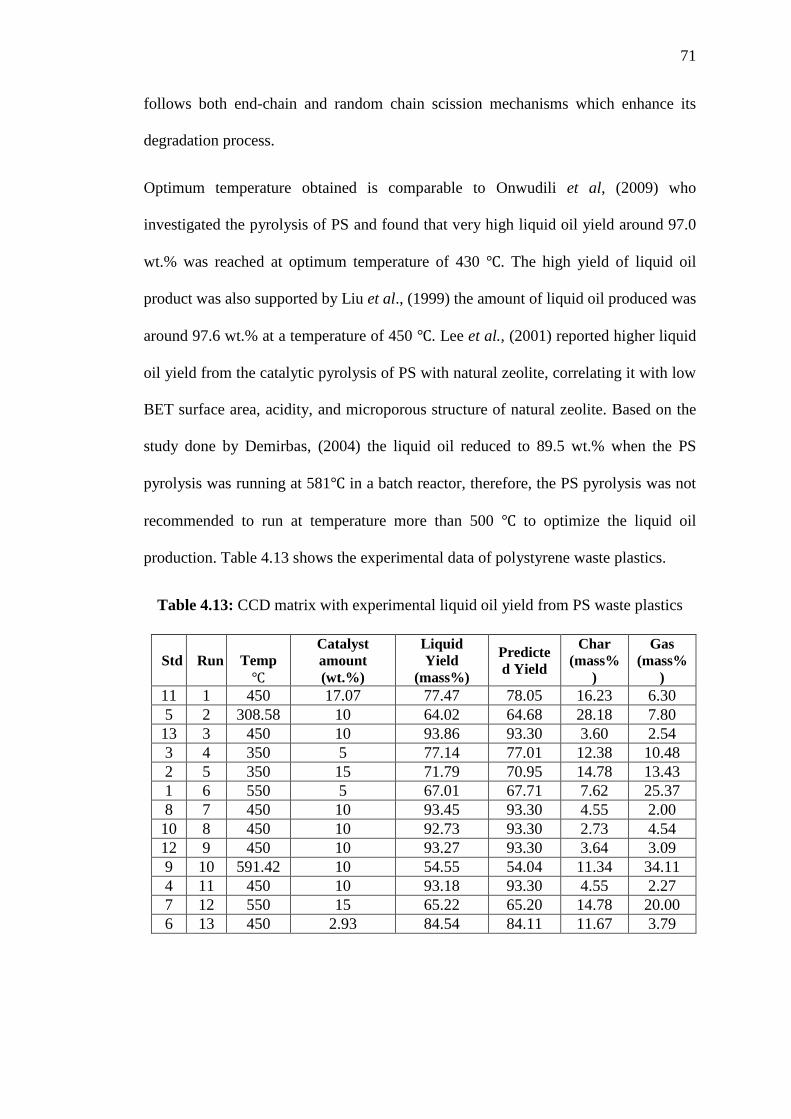
71
follows both end-chain and random chain scission mechanisms which enhance its
degradation process.
Optimum temperature obtained is comparable to Onwudili et al, (2009) who
investigated the pyrolysis of PS and found that very high liquid oil yield around 97.0
wt.% was reached at optimum temperature of 430 ℃. The high yield of liquid oil
product was also supported by Liu et al., (1999) the amount of liquid oil produced was
around 97.6 wt.% at a temperature of 450 ℃. Lee et al., (2001) reported higher liquid
oil yield from the catalytic pyrolysis of PS with natural zeolite, correlating it with low
BET surface area, acidity, and microporous structure of natural zeolite. Based on the
study done by Demirbas, (2004) the liquid oil reduced to 89.5 wt.% when the PS
pyrolysis was running at 581℃ in a batch reactor, therefore, the PS pyrolysis was not
recommended to run at temperature more than 500 ℃ to optimize the liquid oil
production. Table 4.13 shows the experimental data of polystyrene waste plastics.
Table 4.13: CCD matrix with experimental liquid oil yield from PS waste plastics
Std Run
Temp
℃
Catalyst
amount
(wt.%)
Liquid
Yield
(mass%)
Predicte
d Yield
Char
(mass%
)
Gas
(mass%
)
11 1 450 17.07 77.47 78.05 16.23 6.30
5 2 308.58 10 64.02 64.68 28.18 7.80
13 3 450 10 93.86 93.30 3.60 2.54
3 4 350 5 77.14 77.01 12.38 10.48
2 5 350 15 71.79 70.95 14.78 13.43
1 6 550 5 67.01 67.71 7.62 25.37
8 7 450 10 93.45 93.30 4.55 2.00
10 8 450 10 92.73 93.30 2.73 4.54
12 9 450 10 93.27 93.30 3.64 3.09
9 10 591.42 10 54.55 54.04 11.34 34.11
4 11 450 10 93.18 93.30 4.55 2.27
7 12 550 15 65.22 65.20 14.78 20.00
6 13 450 2.93 84.54 84.11 11.67 3.79

72
Data in table 4.13 were tested for fit for a linear, two-factor interaction, quadratic and
cubic polynomials,
𝑌𝑖𝑒𝑙𝑑, 𝑌 = 93.30 − 3.76𝐴 − 2.14𝐵 + 0.89𝐴𝐵 − 16.97𝐴2 − 6.11𝐵2..........Equation 4.5
Table 4.14 gives the result.
Table 4.14: Sequential model sum of squares
Source Sum of Squares Df Mean Square F-value p-value
Mean vs Total 81327.46 1 81327.46
Linear vs Mean 149.91 2 74.96 0.3540 0.7103
2FI vs Linear 3.17 1 3.17 0.0135 0.9101
Quadratic vs 2FI 2110.86 2 1055.43 2377.82 < 0.0001 Suggested
Cubic vs Quadratic 2.39 2 1.19 8.31 0.0257 Aliased
Residual 0.7183 5 0.1437
Total 83594.51 13 6430.35
Based on the F-value (2377.82) and p-value (0.0001), Quadratic model was suggested
and Cubic was aliased. Table 4.15 gives Analysis of Variance (ANOVA).
Table 4.15: ANOVA for Quadratic model
Source Sum of
Squares Df
Mean
Square F-value p-value
Model 2263.94 5 452.79 1020.10 < 0.0001 Significant
A-Temperature 113.20 1 113.20 255.02 < 0.0001
B-Catalyst amount 36.72 1 36.72 82.72 < 0.0001
AB 3.17 1 3.17 7.14 0.0319
A² 2003.40 1 2003.40 4513.54 < 0.0001
B² 259.72 1 259.72 585.14 < 0.0001
Residual 3.11 7 0.4439
Lack of Fit 2.43 3 0.8103 4.79 0.0821 not
significant
Pure Error 0.6763 4 0.1691
Cor Total 2267.05 12
Std. Dev. 0.6662 R² 0.9986
Mean 79.09 Adjusted R² 0.9977
C.V. % 0.8423 Predicted R² 0.9919
Adequate
Precision 86.7406

73
The Model F-value of 1020.10 implies the model is significant. There is only a 0.01%
chance that an F-value this large could occur due to noise. P-values less than 0.0500
indicate model terms are significant. In this case A, B, AB, A², B² are significant model
terms. Values greater than 0.1000 indicate the model terms are not significant. The Lack
of Fit F-value of 4.79 implies there is a 8.21% chance that a Lack of Fit F-value this
large could occur due to noise. The Predicted R² of 0.9919 is in reasonable agreement
with the Adjusted R² of 0.9977; i.e. the difference is less than 0.2. Adequate Precision
measures the signal to noise ratio. A ratio greater than 4 is desirable. The ratio of 86.741
indicates an adequate signal. This model can be used to predict Yield as a function of
variables A and B. Table 4.16 gives the values of coefficients for the model.
Table 4.16: Coefficients for the model
Factor Coefficient
Estimate Df
Standard
Error
95% CI
Low
95% CI
High VIF
Intercept 93.30 1 0.2979 92.59 94.00
A-Temperature -3.76 1 0.2355 -4.32 -3.20 1.0000
B-Catalyst
amount -2.14 1 0.2355 -2.70 -1.59 1.0000
AB 0.8900 1 0.3331 0.1023 1.68 1.0000
A² -16.97 1 0.2526 -17.57 -16.37 1.02
B² -6.11 1 0.2526 -6.71 -5.51 1.02
All the terms were significant, hence the model was:
𝑌𝑖𝑒𝑙𝑑, 𝑌 = 93.30 − 3.76𝐴 − 2.14𝐵 + 0.89𝐴𝐵 − 16.97𝐴2 − 6.11𝐵2..........Equation 4.6
Predicted liquid oil yields obtained from Eqn 4.6 is given in Table 4.13. Equation 4.6
can be used for response surface plots.
4.4 Optimization using Response Surface Methodology
Design expert software was used to determine the optimum conditions for HDPE, PP
and PS waste plastics.

74
4.4.1 High density Polyethylene
Figure 4.2 gives a plot for Yield as a function of Temperature and Catalyst amount. The
optima lies close to a temperature of 300 ℃ and Catalyst concentration of 10 wt.%. The
observations made in RSM plots (Figure 4.2, 4.3 and 4.4 ) confirm that the experimental
values were in agreement with the predicted values (Tables 4.5, 4.9 and 4.13).
Figure 4.2: RSM plot for effect of catalyst concentration and Temperature on Yield
for HDPE liquid oil
4.4.2 Polypropylene waste plastics
Figure 4.3 gives a plot for Yield as a function of Temperature and Catalyst
concentration. The optima lies close to a temperature of 300 ℃ and catalyst
concentration of 10 wt.
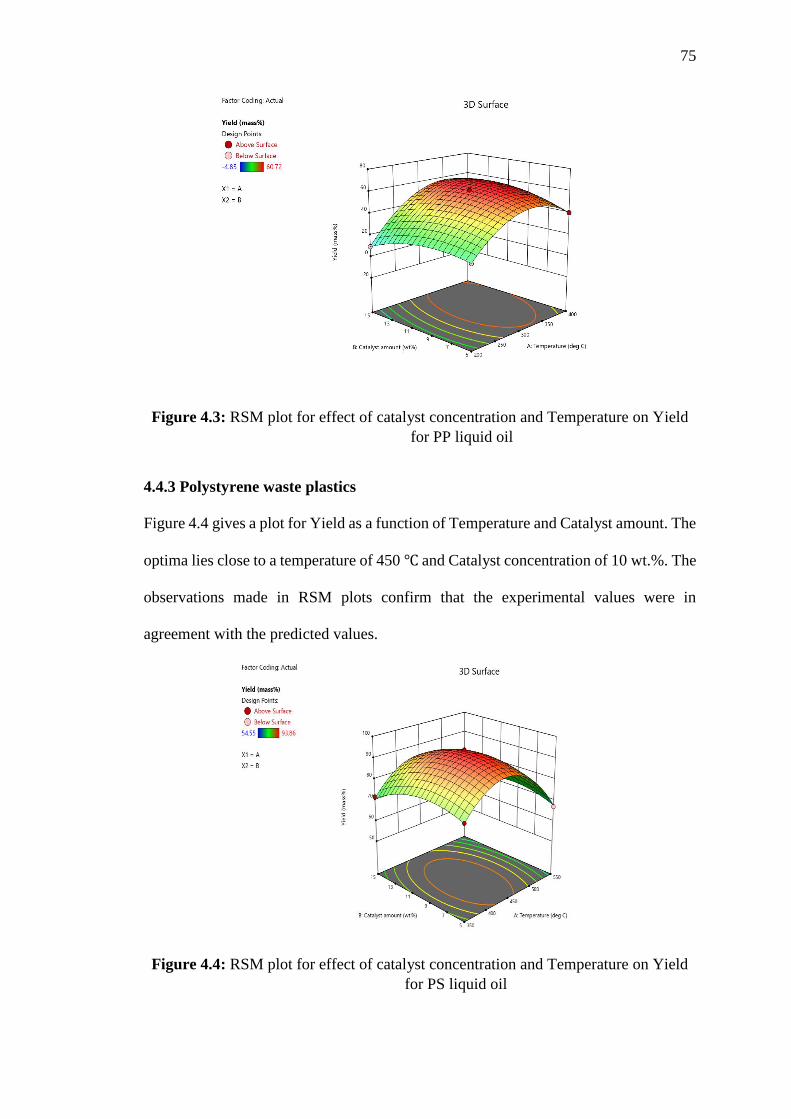
75
Figure 4.3: RSM plot for effect of catalyst concentration and Temperature on Yield
for PP liquid oil
4.4.3 Polystyrene waste plastics
Figure 4.4 gives a plot for Yield as a function of Temperature and Catalyst amount. The
optima lies close to a temperature of 450 ℃ and Catalyst concentration of 10 wt.%. The
observations made in RSM plots confirm that the experimental values were in
agreement with the predicted values.
Figure 4.4: RSM plot for effect of catalyst concentration and Temperature on Yield
for PS liquid oil

76
4.5 Analysis of the hydrocarbon composition in liquid fuel
4.5.1 Composition of liquid oils derived from the pyrolysis of waste plastics
The produced liquid oil by catalytic pyrolysis of different plastic wastes in the presence
of natural clay catalyst showed different compounds as shown in Figures 4.5, 4.6 and
4.7. The GC-MS analysis revealed that the pyrolysis liquid oils from all plastic types
mainly consisted of aromatic hydrocarbons, phenol group and aliphatic hydrocarbon
compounds. The types and amounts of different compounds present in the liquid fuel
varied with common compounds like toluene, benzene, styrene, ethylbenzene and
naphthalene.
In gasoline production aromatics, naphthene and isoalkanes are highly desirable,
whereas olefins and n-paraffins are less desired. Accordingly, it is desirable that the
pyrolytic conversion of plastic wastes produces more aromatics, naphthene and iso-
alkanes with carbon number in the range C5–C8.
4.5.2 Hydrocarbon composition for High density polyethylene pyrolytic oil
The study found that molecular composition of HDPE derived liquid oil showed high
composition of n-Pentadecanol, 1-Tetradecene and 2,4-Dimethyl-1-heptene. This
shows the presence of alcohols, alkenes and alkyl halides in the pyrolytic oil. During
the catalytic pyrolysis there are two possible mechanisms for the degradation of HDPE;
carbenium ion mechanism due to the attack of the proton or hybrid ion abstraction
through Lewis acid sites (Rizzarelli et al., 2016). According to De Stefanis et al., (2013)
the catalytic degradation of HDPE involves the carbenium ion mechanism by proton
addition (Bronsted acid sites) to C-C bonds or hybrid ion abstraction by Lewis acid sites
to the HDPE molecules. When the degradation has started, it further proceeds step by
step into light hydrocarbon molecules. The higher molecules are degraded on the
external surface of the catalyst, while microporous catalyst hinders their entrance that

77
results in the formation of high carbon chain compounds and char deposition (Lopez et
al., 2011). Figure 4.5 shows the qualitative test report from GC-MS for HDPE liquid
oil. Table 4.17 shows the molecular composition of the liquid oil.

78
Figure 4.5: Qualitative analysis report of HDPE liquid oil from GC-MS

79
Table 4.17: A summary of information obtained from GC-MS showing retention time,
retention index, Area %, molecular weights, chemical formula and names
based on compared NIST entries for HDPE pyrolytic oil.
Peak
number
Retention
time
Retention
index Area
%
Molecular
weight
Chemical
formula Structure Name
43 15.775 1755 3.02 228 C15H32O n-
Pentadecanol
37 13.099 1403 2.89 196 C14H28 1-Tetradecene
14 4.286 819 2.74 126 C9H18
2,4-Dimethyl-
1-heptene
32 11.637 1304 2.73 182 C13H26
1-Tridecene
33 11.739 1413 2.67 198 C14H30 Tetradecane
29 10.085 1204 2.63 168 C12H24 1-Dodecene
44 15.853 1711 2.55 240 C17H36 Heptadecane
59 22.487 2109 2.54
296 C21H44 Heneicosane
26 8.453 1105 2.51 154 C11H22 1-Undecene
22 6.756 1005 2.41 140 C10H20 1-Decene
01 2.55 707 2.25 98 C7H14
1-Heptene
41 14.562 1512 2.24 212 C15H32 Pentadecane
52 19.269 2153 2.13
284 C19H40O
n-
Nonadecanol-
1
4.5.3 Hydrocarbon composition for Polypropylene pyrolytic oil
PP plastic waste liquid oil showed high composition of 1,3,5,7-Cyclooctatetraene,
Benzene, 1,3-dimethyl-, alpha-Methyl styrene and Toluene. Abbas-Abadi et al,. (2014)
carried out catalytic pyrolysis of PP and reported the production of aliphatic, paraffin,
aromatic and naphthenes compounds which were comparable to the present study . The
use of acid catalyst increased the production of poly-aromatic compounds that may be

80
produced through aromatization, oligomerization and deoxygenation occuring on the
active acidic sites of the catalyst. Ramli et al., (2011) reported that the use of catalysts
with Brownsted acid sites increased the cracking process of polymers which leads to
the production of shorter chains hydrocarbons. Figure 4.6 shows the qualitative test
analysis report for PP pyrolytic oil from GC-MS. Table 4.18 shows the laboratory Test
report of Molecular composition for PP pyrolytic oil
Figure 4.6: Qualitative analysis report for Polypropylene from GC-MS

81
Table 4.18: A summary of information obtained from GC-MS showing retention time,
retention index, Area %, molecular weights, chemical formula and names
based on compared NIST entries for PP pyrolytic oil.
Peak
number
Retention
time
Retention
index
Area
%
Molecular
weight
Chemical
formula Structure Name
5 5.392 888 38.69 104 C8H8
1,3,5,7-
Cyclooctatet
raene
4 4.781 907 13.59 106 C8H10
Benzene,
1,3-
dimethyl-
9 6.821 960 11.56 118 C9H10
.alpha.-
Methylstyre
ne
1 3.437 794 7.7 92 C7H8
Toluene
15 16.993 1665 6.78 196 C15H16
Benzene,
1,1'-(1,3-
propanediyl
)bis-
30 27.248 1836 4.13 266 C14H18O5
1,2-
Propanediol,
3-
benzyloxy-
1,2-diacetyl-
21 17.77 1799 3.71 207 C15H13N
1,2-
Diphenyl-1-
isocyanoeth
ane
6 5.761 1006 2.71 120 C9H12
Benzene, 1-
ethyl-2-
methyl-
22 18.005 1629 1.5 194 C15H14
1,2-
Diphenylcy
clopropane
17 17.268 1701 1.2 210 C16H18
Benzene,
1,1'-(1-
methyl-1,3-
propanediyl
)bis-
29 20.875 1918 0.8 204 C16H12
Naphthalene
, 2-phenyl-
31 29.969 2249 0.58 274 C21H22
1-Propene,
3-(2-
cyclopenten
yl)-2-
methyl-1,1-
diphenyl-
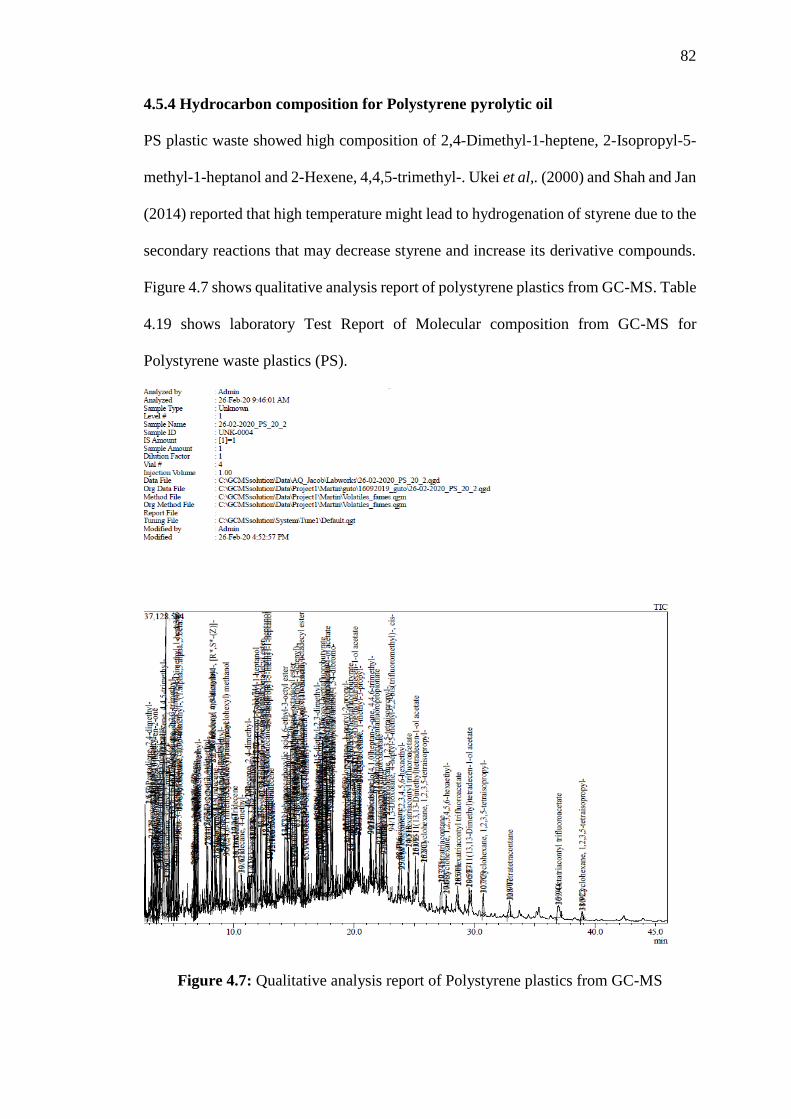
82
4.5.4 Hydrocarbon composition for Polystyrene pyrolytic oil
PS plastic waste showed high composition of 2,4-Dimethyl-1-heptene, 2-Isopropyl-5-
methyl-1-heptanol and 2-Hexene, 4,4,5-trimethyl-. Ukei et al,. (2000) and Shah and Jan
(2014) reported that high temperature might lead to hydrogenation of styrene due to the
secondary reactions that may decrease styrene and increase its derivative compounds.
Figure 4.7 shows qualitative analysis report of polystyrene plastics from GC-MS. Table
4.19 shows laboratory Test Report of Molecular composition from GC-MS for
Polystyrene waste plastics (PS).
Figure 4.7: Qualitative analysis report of Polystyrene plastics from GC-MS

83
Table 4.19: A summary of information obtained from GC-MS showing retention time,
retention index, Area %, molecular weights, chemical formula and names
based on compared NIST entries for PS pyrolytic oil.
Peak
number
Retention
time
Retention
index
Area
%
Molecular
weight
Chemical
fromula Structure Name
11 4.365 819 7.69 126 C9H18
2,4-Dimethyl-
1-heptene
43 11.744 1165 3.53 172 C11H24O
2-Isopropyl-5-
methyl-1-
heptanol
10 4.140 775 2.99 126 C9H18
2-Hexene,
4,4,5-
trimethyl-
28 8.169 1483 2.14 226 C14H26O2
Isodecyl
methacrylate
71 17.346 2330 2.13 522 C26H45F7
O2
Docosyl
heptafluorobu
tyrate
74 17.678 2309 1.94 408 C23H43F3
O2
Heneicosyl
trifluoroacetat
e
16 5.081 939 1.88 140 C10H20
3-Octene, 2,2-
dimethyl-
56 14.720 0 1.85 666 C26H37F15
O2
Pentadecafluo
rooctanoic
acid,
octadecyl
ester
83 19.673 2131 1.64 494 C24H41F7
O2
Eicosyl
heptafluorobu
tyrate
42 11.578 1135 1.61 168 C12H24
2-Decene,
2,4-dimethyl-
62 15.646 1577 1.59 212 C14H28O
10-Dodecen-
1-ol, 7,11-
dimethyl-
29 8.239 1193 1.54 182 C13H26
2-Undecene,
4,5-dimethyl-,
[R*,S*-(Z)]-
From the study it can be concluded that HDPE pyrolytic oil contained phenols (n-
pentadecanol and n-nonadecanol) and aliphatic compounds. The aliphatic compounds
are saturated (tetradecane and heptadecane), unsaturated (1-tetradecene and 1-
dodecene) and cyclic (2,4-dimethyl-1-heptene). Similar results were reported by Jung
et al., (2010), HDPE pyrolysis liquid oil contained primarily high concentrations of
aliphatic and monoaromatic compounds, this is also observed in this study. This

84
indicates the complexity of the HDPE structure to degrade during thermal degradation
process. Manos et al., (2000) reported that catalytic degradation of PE with Y-zeolite
produced more gasoline range compounds, mainly the isoparaffins with high octane
numbers. Catalytic degradation of HDPE and LDPE with the FCC catalyst produced
gasoline range hydrocarbons (C7-C15) with the main components of iso-alkenes or iso-
alkanes (Achilias et al., 2007)
PP plastic waste liquid oil showed high composition of 1,3,5,7-Cyclooctatetraene,
Benzene, 1,3-dimethyl-, alpha-Methyl styrene, Toluene, Benzene, 1,1'-(1,3-
propanediyl)bis-,and 1,2-Propanediol, 3-benzyloxy-1,2-diacetyl-. The most abundant
compound was 1,3,5,7-Cyclooctatetraene which is an unsaturated cyclic compound,
other molecules comprised of aromatic hydrocarbons (benzene and Toluene). Single
aromatic ring compounds like benzene,1,3-dimethyl and alpha methylstyrene found in
the PP pyrolytic oil was also observed by Kaminsky, 1992. Abbas-Abadi et al. (2014)
carried out catalytic pyrolysis of PP and reported the production of aliphatic, paraffin,
aromatic and naphthene compounds which were comparable to the present study. The
use of acid catalyst increased the production of poly-aromatic compounds that may be
produced through aromatization, oligomerization and deoxygenation occuring on the
active acidic sites of the catalyst. Mastral et al., (2006) reported the formation of
branched hydrocarbons with aromatics from PP pyrolytic oil. The high catalytic activity
enables the degradation of heavy hydrocarbons into lower hydrocarbons. Ramli et al.,
(2011) reported that the use of catalysts with Brownsted acid sites increased the
cracking process of polymers which leads to the production of shorter chains
hydrocarbons. PP pyrolytic oil also contained paraffins which are known to release
extra energy for combustion than other hydrocarbon groups such as olefins and
naphthenes (Shafferina, 2016).

85
Catalytic pyrolysis of PS plastic waste produced complex liquid oil composition as
confirmed by GC-MS analysis. PS plastic waste showed high composition of 2,4-
Dimethyl-1-heptene, 2-Isopropyl-5-methyl-1-heptanol and 2-Hexene, 4,4,5-trimethyl-.
The pyrolytic oil from PS contained cyclic aliphatic and phenols as the major
hydrocarbon compounds. Aguado, (2003) and Artetxe, (2015) carried out pyrolytic
pyrolysis of PP with various types of catalysts and reported that aromatic hydrocarbons
and cyclic aliphatics are the primary compounds found in the produced liquid oil, which
is in agreement with the current study. Siddiqui and Redhwi (2009) and Sarker and
Rashid (2013) also reported presence of aromatic compounds in the liquid oil produced
by PS plastic waste. Ukei et al. (2000) and Shah and Jan (2014) reported that high
temperature lead to hydrogenation of styrene due to the secondary reactions that
decrease styrene and increase its derivative compounds. Table 4.20 shows the main oil
composition from the pyrolysis of waste plastics.

86
Table 4.20: Liquid oil composition from the pyrolysis of waste plastics
HDPE PP PS
n-
Pentadecanol 1,3,5,7-Cyclooctatetraene 2,4-Dimethyl-1-heptene
1-Tetradecene Benzene, 1,3-dimethyl- 2-Isopropyl-5-methyl-1-heptanol
2,4-Dimethyl-
1-heptene . alpha. -Methylstyrene 2-Hexene, 4,4,5-trimethyl-
1-Tridecene Toluene Isodecyl methacrylate
Tetradecane Benzene, 1,1'-(1,3-
propanediyl)bis- Docosyl heptafluorobutyrate
1-Dodecene 1,2-Propanediol, 3-benzyloxy-1,2-
diacetyl- Heneicosyl trifluoroacetate
Heptadecane 1,2-Diphenyl-1-isocyanoethane 3-Octene, 2,2-dimethyl-
Heneicosane Benzene, 1-ethyl-2-methyl- Pentadecafluorooctanoic acid,
octadecyl ester
1-Undecene 1,2-Diphenylcyclopropane Eicosyl heptafluorobutyrate
1-Decene Benzene, 1,1'-(1-methyl-1,3-
propanediyl) bis- 2-Decene, 2,4-dimethyl-
1-Heptene Benzene, 1,1'-(3-methyl-1-
propene-1,3-diyl) bis- 10-Dodecen-1-ol, 7,11-dimethyl-
Pentadecane Benzene, 1,1'-(1-ethenyl-1,3-
propanediyl) bis-
2-Undecene, 4,5-dimethyl-, [R*,S*-
(Z)]-
n-
Nonadecanol-
1
Naphthalene, 2-phenyl- Cyclohexane, 1,3,5-trimethyl-,
(1.alpha.,3. alpha.,5.beta.)-
Dodecane 1-Propene, 3-(2-cyclopentenyl)-2-
methyl-1,1-diphenyl- 2,4-Heptadiene, 2,6-dimethyl-
Undecane Benzene, cyclopropyl- 1-Heptadecene
1-Nonene Dibenzo[a,e]cyclooctene E-11(13,13-Dimethyl)tetradecen-1-
ol acetate
Hexatriaconta
ne Benzene, 1,1'-(1,4-butanediyl)bis- 1,7-Octadiene, 2,3,3-trimethyl-
Octane Benzene, propyl- Styrene
4.6 Pyrolytic Liquid Fuel Properties
The liquid fuel from waste plastics was tested for fuel characteristic properties, namely;
density, kinematic viscosity, calorific value, flash point and freezing point these are
important for analyzing the quality of fuel by following the ASTM D 240 methods.
Table 4.21 shows the experimental results of the fuel properties for different waste
plastics and petroleum diesel.

87
Table 4.21: Properties of liquid fuel produced from different types of waste plastics
and petroleum diesel.
Fuel property HDPE PP PS DIESEL
Density at 20 ℃
(kg/m3)
753.2 748.7 887.9 815-870
Kinematic viscosity at 25
℃ (cSt)
12.68 11.19 9.56 2.0-5.0
Calorific value (MJ/kg) 33.150 33.338 30.769 46.67
Flash point (℃) Above 24.0 Above 24.0 Above 24.0 52
Freezing point (℃) -20 -19 -15 -9.5
The HHV found for pyrolysis liquid oil was 30.769- 33.338 MJ/Kg which is slightly
lower than HHV of 43.06 MJ/Kg for petroleum diesel (Kamal, 2015). The density is
another important characteristic of any fuel. The density of pyrolysis liquid oils were
found to be in the range of 753.2- 887.9 Kg/m3 which is comparable to 815- 870 Kg/m3
for diesel (Syamsiro, 2014). The kinematic viscosity of fuel is very important
characteristic as it dictates the spray pattern and atomization of injected fuel in a
combustion chamber. The higher viscosities of fuel results in poor atomization, leading
to poor engine start-up and performance. Furthermore, highly viscous fuels have
reduced flow ability, especially during winters, which adversely affects the fuel injector
function and causes problems in engine start up and running (Miandad et al., 2016).
The kinematic viscosities of pyrolysis liquid oil found in this study were in the range
of 9.56 – 12.68 cSt at 25 ℃ which is higher than the standard range of 2.0– 5.0 cSt at
40 ℃ for conventional diesel (Syamsiro, 2014). Kinematic viscosity increases with
decrease in temperature, this explains the high viscosity obtained for the pyrolytic fuel
at 25 ℃. The flash point of pyrolysis oils were found to be above 24 ℃ which is lower

88
than 52 ℃ for diesel, the pyrolysis oil is volatile. This is probably due to high aromatic
contents and volatility of pyrolysis liquid oils. The quality of the fuel is also determined
by its cold flow properties which dictate the lowest temperature at which the fuel
injected system works on its full potential. The freezing points for the pyrolysis liquid
oils were found to range from -15 ℃ - -20 ℃. This is beneficial for operation in areas
where very low temperatures occur during winter.

89
CHAPTER 5: CONCLUSION AND RECOMMENDATIONS
5.1 Conclusion
A petroleum-based fuel was produced using three types of waste plastics through
catalytic pyrolysis, namely: High density Polyethylene, Polypropylene and
Polystyrene.
Indigenous clay was found to have potential to be used for pyrolysis of plastic wastes,
since high yields of liquid fuel were obtained at lower reaction temperatures of 300-
450 ℃, as compared to 600 ℃ required for thermal pyrolysis. In addition, the clay has
high composition of silica and alumina at 64.5 wt% and 16.3 wt% respectively and
SiO2/Al2O3 ratio of 3.96, being requirements for a good pyrolysis catalyst. This will
reduce the energy requirement considerably, overall process optimization and improve
the fuel quality by having more aromatics, naphthene and isoalkanes. The optimum
conditions for the plastic waste were found, based on the liquid oil yield. The chemical
composition and properties of the liquid oil have been analyzed. The liquid oil produced
by all types of plastic wastes using clay catalyst, mainly consisted of aromatic
hydrocarbons such as styrene, benzene, naphthalene and toluene with a few aliphatic
hydrocarbon compounds and phenol group as confirmed by GC-MS analysis. Liquid
oils produced from all plastic wastes using clay catalysts had HHV ranging from
30.769- 33.338 MJ/Kg which is comparable to conventional diesel. The liquid oil may
be used in multiple applications such as in diesel engines, in turbines to generate
electricity or for combustion in furnaces and boilers. The liquid oil from catalytic
pyrolysis is of higher quality and can be used in several energy-related applications
such as electricity generation, transport fuel and heating source. The gaseous products
can be used to reheat the raw material to reduce the cost of production.
90
5.2 Recommendations
Based on the findings, this study recommends;
i. Further characterization of clay (BET surface area and porosity)
ii. Modification of surface and structure of clay to enhance its catalytic activities
in the pyrolysis process. Modification can be done by doping of other elements,
acid leaching, thermal treatment and wet impregnation.
iii. Further studies using mixed plastics for any synergetic effect on oil production.
iv. Post treatment of liquid oil through distillation and refining or blending with
conventional diesel is required so as to use the oil as a transport fuel due to the
presence of high aromatic compounds.

91
REFERENCES
Abbas-Abadi, M., Haghighi, M., Yeganeh, H., & McDonald, A. (2014). Evaluation of
pyrolysis process parameters on polypropylene degradation products. Journal
Analytical and Applied Pyrolysis, 109, 272-277.
Abnisa, F., & Wan, D. W. (2014). A review on co-pyrolysis of biomass: an optional
technique to obtain a high-grade pyrolysis oil. Energy Conversion Management,
71-85.
Achilias, D. R. (2007). Chemical recycling of plastic wastes made from polyethylene
(LDPE and HDPE) and polypropylene (PP). Journal of Hazardous Materials
149, 536-542.
Aguado, J. S. (2007). Catalytic activity of zeolitic and mesostructured catalysts in the
cracking of pure and waste polyolefins. Journal of Analytical and Applied
Pyrolysis, 78(1), 153-161.
Aguado, R. G. (2003). Kinetics of polystyrene pyrolysis in a conical spouted bed
reactor. Chemical Engineering Journal 92, 91-99.
Ahmad, I. K. (2015). Pyrolysis study of polypropylene and polyethylene into premium
oil products. International Journal for Green Energy, 663-671.
Ahmad, I., Khan, M., Khan, H., Ishaq, M., Tariq, R., Gul, K., & al, e. (2014). Pyrolysis
study of polypropylene and polyethylene into premium oil products.
International Journal for Green Energy, 12, 663-671.
Akpanudoh, N. S. (2005). Catalytic degradation of plastic waste to liquid fuel over
commercial cracking catalysts: effect of polymer to catalyst ratio/acidity
content. Journal of Molecular Catalysis A, vol. 235, 67-73.
Alkan, M., Demirbas, Ö., Celikc, S., & Dogan, M. J. (2004). Journal of Hazardous
Materials, 135.
APHA, A. P. (1998). Standard methods for the examination of water and wastewater
(20th ed.). Washington D.C, USA.
Artetxe, M. L. (2015). Styrene recovery from polystyrene by flash pyrolysis in a conical
spouted bed reactor. Waste Management 45, 126-133.
Artetxe, M., Lopez, G., Amutio, M., Elordi, G., Bilbao, J., & Olazar, M. (2013).
Cracking of high density polyethylene pyrolysis waxeson HZSM-5 catalysts of
different acidity. Industrial Engineering Chemistry, Res.52, 10637-10645.
Belver, C. M. (2002). Chemistry of Materials. 14, 2033-2043.
Berger, T. A. (1996). Chromatographia. 42, 63-71.

92
Bernando, M. (2011). Physico-chemical characterization of chars produced in the
copyrolysis of wastes and possible routes of valorization. In C. Engineering,
Chemical Engineering (pp. 27-36). portugal: Universidade Nova de Lisboa,.
Borsodi, N. M. (2011). Hydrocarbons obtained by pyrolysis of contaminated waste
plastics. 45th International Petroleum Conference, June 13, 2011, Bratislava,
Slovak Republic. .
Brindley, G. W. (1981). Crystal Structures of Clay Minerals and Their X-Ray
Identification. Mineralogical Society, 217-219.
British Plastics Federation. (2015). Polyvinyl chloride (PVC). London.
Buekens A.G., H. H. (1998). Catalytic plastics cracking for recovery of gasoline-range
hydrocarbons from municipal plastic wastes. Resources, Conservation and
Recycling, 6-10.
Capital business. (2018, January). Retrieved from Capital businee website:
https://www.capitalfm.co.ke/business/2018/01/
Caulcante, A. T. (2005). Brazilian Journal of Chemical Engineering . 22, 2682-2865.
Çepeliog˘ullar Ö, P. A. (2013). Thermal and kinetic behaviors of biomass and plastic
wastes in co-pyrolysis. Energy Conversion Management, 263-270.
Cepeliogullar, O., & Putun, A. (2013). Utilization of two different types of plastic
wastes from daily and industrial life. ICOEST Cappadocia, 1-13.
Cha, W. K. (2002). Study of polystyrene degradation using continuous distribution
kinetics in a bubbling reactor. Korean Journal of Chemical Engineering 19 (2),,
239-245.
Chen, D. Y. (2014). Pyrolysis technologies for municipal solid waste: a review. Waste
Management 34, 2466-2486.
cipet. (2020, 04 24). cipet.gov. Retrieved from cipet.gov website:
http://cipet.gov.in/plastics statics.html.
Cullis CF, H. M. (1981). The Combustion of Organic Polymers. Oxford: Clarendon
Press.
De Stefanis, A. C. (2013). Catalytic pyrolysis of polyethylene: a comparison between
pillared and restructured clays. Journal of Analytical and Applied Pyrolysis 104,
479-484.
Deer, W. H. (1992). An introduction to Rock Forming Minerals. Harlow longman.
Degnan, J. (2000). Applications of zeolites in petroleum refining. Top Catalysts, 13,
349-356.

93
Demirbas, A. (2004). Pyrolysis of municipal plastic wastes for recovery of gasoline
range hydrocarbons. Journal of Analytical and Applied Pyrolysis, 72, 97-102.
Ding, W. L. (1997). Thermal and catalytic degradation of high density polyethylene
and commingled post-consumer plastic waste. Fuel Process Technology 51 (1–
2), 47–62, 45.
Dolezal, Z. P. (2001). The effects of controlled aging and blending of low- and high-
density polyethylenes, polypropylene and polystyrene on their thermal
degradation studied by pyrolysis gas hromatography. Journal of Analytical and
Applied Pyrolysis 57 (2), 177.
Fabio LM, F. L. (2009). Chemical characterization of clay SRM by X-ray flourescence.
ciencias Exatas technologicas, 145-150.
Fakhrhoseini, S. D. (2013). Predicting pyrolysis products of PE, PP, and PET using
NRTL activity coefficient model. Hindawi Publishing Corporation, 1-5.
Faravelli, T. P. (2001). Thermal degradation of polystyrene. Journal of Analytical and
Applied Pyrolysis 60 (1), 103-121.
Fernandez, Y. A. (2011). Microwave Heating Applied to Pyrolysis. spain: InTech.
Frank, A., & Biederbick, K. (1984). Kunststoff kompendium,. Vogel-Buchverlag.
Frigo, S. S. (2014). Liquid fuel production from waste tire pyrolysis and its utilisation
in a Diesel engine. Fuel process Technology 116, 399-408.
Garside, M. (2020, Dec 11). statista. Retrieved from statista website:
www.statista.com/statistics/282732/global-production-of-plastics-since-1950/
Gates, B., Katzer, J., & Schuit, G. (1979). Chemistry of Catalytic Processes. New York:
McGraw-Hill.
Gray M., N. B. (2013). Characterization of swelling clay as a component of the
Engineered Barrier system for Geological repositories. Vienna International
Centre: MTCD publications.
Grim, R. (1962). Applied Clay Mineralogy. McGraw-Hill Book Co., Inc.: New York.
Grim, R. (1968). Clay Mineralogy. New York: McGraw-Hill Book Co., Inc.
Grimshaw, R. (1971). The Chemistry and Physics of Clays. London: Ernest Benn
Limited.
Hans, R. W. (2004). Minerals, their Constitution and Origin. Cambridge, U.K.:
Cambridge University press.
Heras, F. J.-C.-M. (2014). Activation of waste tire char by cyclic liquid-phase
oxidation. Fuel Process Technology 127, 157-162.

94
Hernandez, M., Gomez, A., Garcıa, A., Agullo, J., & Marcilla, A. (2007). Effect of the
temperature in the nature and extension of the primary and secondary reactions
in the thermal and HZSM-5 catalytic pyrolysis of HDPE. Applied Catalysis A,
Gen. 317, 183-194.
Horng JL, C. L. (2004). A model for predicting the flash point of ternary flammable
solutions of liquid. Combustion Flame, 308-319.
Jarecki, L. (1979). Thermodynamics of deformation of an isolated polymer chain.
Colloidal Polymer Science, 257, 711-719.
Jindaporn, J. L. (2014). Characterization and utilization of char derived from fast
pyrolysis of plastic wastes. Process Engineering 69, 1437-1432.
Jung, S., Cho, M., Kang, B., & Kim, J. (2010). Pyrolysis of a fraction of waste
polypropylene and polyethylene for the recovery of BTX aromatics using a
fluidized bed reactor. Fuel Processing Technology, 91, 277-284.
Kalghatgi, G. (2001). Fuel anti-knock quality. Chester: Shell Global Solutions.
Kamal, D. Z. (2015). Green product of liquid fuel from plastic waste by pyrolysis.
Journal of Energy Power Engineering 9, 40-44.
Kaminsky, W. (1992). Pyrolysis of polymers. (G. Andrews, & P. Subramanian, Eds.)
Emerging Technologies in Plastics Recycling, 513, 60-70.
Kaminsky, W. P. (2004a). Feedstock recycling of polymers by pyrolysis in a fluidized
bed. Polymer Degradation Stability 85 (3), 1045-1050.
Kauffman, H. (1988). Grundlagen Der Organischen Chemie. Birkhauser verlag: Basel.
Khandpur, R. (2007). Handbook of Analytical Instruments. USA: McGraw-Hill
Companies Inc.
Kim, J. Y. (2002). Catalytic recycling of the mixture of polypropylene and polystyrene.
Polymer Degradation Stability 76, 61-67.
Kim, S. K. (2004). Pyrolysis characteristics of polystyrene and polypropylene in a
stirred batch reactor. Chemical Engineering Journal 98 (1–2), 53-60.
Kreith, F. (1998). The CRC handbook of mechanical engineering. 2nd ed. Inc: CRC
Press.
Kumar, S., & Singh, R. (2011). Recovery of hydrocarbon liquid from waste high
density polyethylene by thermal pyrolysis. Brazilian Journal for Chemical
Engineering, 28, 659-667.

95
Kyong, H. N. (2002). Comparison of plastic types for catalytic degradation of waste
plastics into liquid product with spent FCC catalyst. Polymer Degradation
Stability, 78, 539-544.
Lawrence, W. G. (1982). Ceramic Science for the Potter, 2nd ed. Radnor,
Pennysylvakia: Childon Book Company.
Lee M. (2018, February 1). Standard media. Retrieved from Standard media website:
https://www.standardmedia.co.ke/kenya/article/2001268040/
Lee, K. (2009). Thermal and catalytic degradation of pyrolytic oil from pyrolysis of
municipal plastic wastes. Journal of Analytical and Applied Pyrolysis, 85, 372-
379.
Lee, K. (2012). Effects of the types of zeolites on catalytic upgrading of pyrolysis wax
oil. Journal of Analytical and Applied Pyrolysis, 94, 209-214.
Lee, K., & Shin, D. (2007). Characteristics of liquid product from the pyrolysis of waste
plastic mixture at low and high temperatures: influence of lapse time of reaction.
Waste Management, 27, 168-176.
Lee, S. Y. (2001). Catalytic degradation of polystyrene over natural clinoptilolite
zeolite. Polymer Degradation Stability 74, 297-305.
Lerici, L. R. (2015). Chemical catalyzed recycling of polymers: catalytic conversion of
PE, PP and PS into fuels and chemicals over H-Y. Process Material Science 8,
297-303.
Liu, Y., Qian, J., & Wang, J. (1999). Pyrolysis of polystyrene waste in a fluidized-bed
reactor to obtain styrene monomer and gasoline fraction. Fuel Process
Technology, 63, 45-55.
López A, d. M. (2011). Dechlorination of fuels in pyrolysis of PVC containing plastic
wastes. Fuel Process Technology, 92, 253-260.
Lopez, A. D. (2011). Deactivation and regeneration of ZSM-5 zeolite in catalytic
pyrolysis of plastic wastes. Waste Management 31, 1852-1858.
Lopez, A. M. (2011a). Catalytic pyrolysis of plastic wastes with two different types of
catalytic: ZSM-5 zeolite and Red Mud. Applied Catalysis B: Environment 104,
211-219c.
Lopez, A., Marco, D. I., Caballero, B., Laresgoiti, M., Adrados, A., & Torres, A.
(2011). Pyrolysis of municipal plastic waste II: influence of raw material
composition under catalytic conditions. Waste Management, 31, 1973-1983.

96
Lopez, A., Marco, I., Caballero, B., Laresgoiti, M., & Adrados, A. (2011). Influence of
time and temperature on pyrolysis of plastic wastes in a semi-batch reactor.
Chemical Engineering Journal, 173, 62-71.
Magee, J. M. (1993). Fluid Catalytic Cracking. Science and Technology, 76.
Manos, G. (2006). Catalytic degradation of plastic waste to fuel over microporus
materials. In &. W. J. Scheirs, Feedstock recycling and pyrolysis of waste
plastics (pp. 193-208). Hoboken: John Wiley & Sons.
Manos, G. G. (2000). Catalytic degradation of high-density polyethylene on an
ultrastable-Y Zeolite. Nature of initial polymer reactions, pattern of formation
of gas and liquid products, and temperature effects. Industrial Engineering
Chemistry Res.39, 1203-1208.
Marcilla, A., Beltrán, M., & Navarro, R. (2009). Thermal and catalytic pyrolysis of
polyethylene over HZSM5 and HUSY zeolites in a batch reactor under dynamic
conditions. Application Catalyst B Environment, 86, 78-76.
Mastral, F., Esperanza, E., Garcia, P., & Juste, M. (2001). Pyrolysis of high-density
polyethylene in a fluidized bed reactor. Influence of the temperature and
residence time. Journal for Analysis and Applied Pyrolysis, 63, 1-15.
Mastral, J. B. (2006). Catalytic degradation of high density polyethylene over
nanocrystalline HZSM-5 Zeolite. Polymer Degradation Stability 91, 3330-
3338.
Mendham, J., Denney, R., Barnes, J., Thomas, M., & Sivasankar, B. (1989). Textbook
of Quantitative Inorganic Analysis including Elementary Instrumental Analysis
5th Ed. New York: Longman Group Limited.
Miandad R., B. M. (2016). Catalytic Pyrolysis of plastic waste: A review. Process
Safety and Environmental Protection, 822-838.
Miandad, R. B. (2017a). Effect of plastic waste types on pyrolysis liquid oil.
International Biodeterioration and Biodegradation 119, 239-252.
Miandad, R. N. (2016b). Influence of temperature and reaction time on the conversion
of polystyrene waste to pyrolysis liquid oil. Waste Management, 250–259.
Michael, P. (2010). Plastic waste total in MSW. Society of the Plastic Industry, 101-
104.
Miranda, R., Jin, Y., Roy, C., & Vasile, C. (1998). Vacuum pyrolysis of PVC kinetic
study. Polymer Degradation Stability , 64, 127-144.
Miskolczi, N. B. (2004). Thermal degradation of municipal plastic waste for production
of fuel-like hydrocarbons. Polymer Degradation Stability 86, 357-366.

97
Miskolczi, N., Angyal, A., Bartha, L., & Valkai, I. (2009). Fuel by pyrolysis of waste
plastics from agricultural and packaging sectors in a pilot scale reactor. Fuel
Processing Technology, 90, 1032-1040.
Moore D.M., R. R. (1989). X-ray Diffraction and the Identification and Analysis of
Clay Minerals. New York, USA: Oxford University Press.
Murata, K. H. (2002). Basic study on a continuous flow reactor for thermal degradation
of polymers. Journal of Analytical and Applied Pyrolysis 65, 71-90.
Murata, K. S. (2004). Effect of pressure on thermal degradation of polyethylene.
Journal of Analytical and Applied Pyrolysis 71 (2),, 569.
Murray, H. H. (2004). Encyclopaedia of Chemical Technology. England: John Willey
and Sons.
Murray, H. H. (2007,). Applied clay mineralogy. Elsevier B.V., 1-2.
Nizami, A. O.-M. (2016b). The potential of Saudi Arabian natural zeolites in energy
recovery technologies. Renewable Sustainable Energy 108, 162-171.
Norton, H. F. (1974). Elements of Ceramics. Addison: Wesley publishing company.
Onwudili, J., Insura, N., & Williams, P. (2009). Composition of products from the
pyrolysis of polyethylene and polystyrene in a closed batch reactor: effects of
temperature and residence time. Journal of Analytical and Applied Pyrolysis,
86, 293-303.
Oswago, M. O. (2016). Chemical and mineral analysis of raw and acid-treated clays
from kano plains,kisumu county, Kenya. Nairobi: Kenyatta University.
Ouda, O. R.-W. (2016). Waste to energy potential: a case study of Saudi Arabia.
Renewable Sustainable Energy , 328-340.
Panda A. K., R. K. (2010). Thermolysis of waste plastics to liquid fuel: a suitable
method for plastic waste management andmanufacture of value added products:
a world prospective. Renewable and Sustainable Energy Reviews, 233–248.
Park, D. W. (1999). Catalytic degradation of polyethylene over solid acid catalysts.
Polymer Degradation & Stability, 193-198.
Plastiquarian. (2015, June 1). Retrieved from Plastiquarian website:
http://plastiquarian.com/wp-content/uploads/2015/06/plasticbook.pdf
Raja A, M. A. (2011). Conversion of plastic wastes into fuels. Journal of Material
Science and Engineering, 86-89.
Ralph, E. G. (1968). Clay Mineralogy. New York: McGraw Hill Book Co.

98
Ramli, M. O. (2011). Cross-link network of polydimethylsiloxane via addition and
condensation (RTV) mechanisms. Part I:Synthesis and thermal properties.
Polymer Degradation Stability 96, 2064-2070.
Rathore, D., Nizami, A., Pant, D., & Singh, A. (2016). Key issues in estimating
energyand greenhouse gas savings of biofuels: challenges and perspectives. Bio
fuel Res, 380-393.
Rehan, M. N. (2016a). Pyrolytic liquid fuel: a source of renewable electricity. Energy
Sources, 2598–2603.
Richerson, D. W. (1992). Modern Ceramic Engineering, 2nd ed. New York: Marcel
Dekker Inc.
Rizzarelli, P. R. (2016). Determination of polyethylene in biodegradable polymer
blends and in compostable carrier bags by Py-GC/MS and TGA. Journal of
Analytical and Applied Pyrolysis 117, 72-81.
Robert, T. (2010). Using Design of Experiments to Optimize Chiral Separation.
Pharma QbD.
ryedale . (2014, February 2). Retrieved from ryedale government uk website:
https://www.ryedale.gov.uk/attachments/article/690/Different_plastic_polyme
r_types.pdf
Sadaf, Y. N. (2015, 01 01). Waste-to-energy and recycling value for developing
integrated solid waste management plan in Lahore. Retrieved from dx.doi
website: http://dx.doi.org/10.1080/1556249.2015.105295.
Sakata, Y. U. (1996). Thermaldegradation of polyethylene mixed with poly(vinyl
chloride)and poly(ethyleneterephthalate). Polymer Degradation and Stability ,
53 (1), 111-117.
Sakata, Y., Uddin, M., & Muto, A. (1999). Degradation of polyethylene and
polypropylene into fuel oil by using solid acid and non-solid acid catalysts.
Journal of Analytical and Applied Pyrolysis, 51, 135-155.
Salawudeen, T. D. (2007). Journal of Engineering and Applied Sciences. 2, 1677-1680.
Saptoadi, H. P. (2015). Utilization of plastics waste oil as partial substitute for kerosene
in pressurized cookstoves . International Journal of Environmental Science
Development, 363-371.
Sarker, M., & Rashid, M. (2013). Waste plastics mixture of polystyrene and
polypropylene into light grade fuel using Fe2O3 catalyst. International Journal
Renewable Energy Technology, Res. 2(1), 17-28.

99
Sarker, M., Kabir, A., Rashid, M., Molla, M., & Mohammad, A. (2011a). Waste
polyethylene terephthalate (PETE-1) conversion into liquid fuel. Journal for
Fundamentals of Renewable Energy Applications, 1-5.
Sarker, M., Rashid, M., Molla, M., & Rahman, M. (2011b). Waste polystyrene (PS-6)
plastic conversion into liquid hydrocarbon fuel by using HZSM-5 catalyst with
thermal degradation process. International Revision Chemical Engineering, 5.
Serrano, D. P. (2005). Influence of nanocrystalline HZSM-5 external surface on the
catalytic cracking of polyolefins. Journal of Analytical and Applied Pyrolysis,
353-360.
Shafferina D. A. S., F. A. (2016). A review on pyrolysis of plastic wastes. Energy
Conversion and Management, 308-326.
Shah, J. J. (2014). Conversion of waste polystyrene through catalytic degradation into
valuable products. Korean Jornal of Chemical Engineering 31, 1389-1398.
Sharuddin, S., Abnisa, F., Daud, W., & Aroua, M. (2016). A review on pyrolysis of
plastic wastes. Energy Conversion Management, 115, 308-326.
Shioya, M., Kawanishi, T., Shiratori, N., Wakao, H., Sugiyama, E., Ibe, H., & al, e.
(2005). Development of waste plastics liquefaction technology, feedstock
recycling in Japan. (M. Muller-Hagedorn, & H. Bockhorn, Eds.) Feedstock
recycling of plastics, 19-42.
Siddiqui, M. R. (2009). Pyrolysis of mixed plastics for the recovery of useful products.
Fuel Processing Technology 90, 545-552.
Sperling, M. B. (1999). Atomic Absorption Spectrometry. Weinheim: Wiley-VCH.
Sriningsih, W. S. (2014). Fuel production from LDPE plastic waste over natural zeolite
supported Ni, Ni-Mo, Co and Co-Mo metals. Procedia Environmental Science
20, 215-224.
Syamsiro, M., Saptoadi, H., Norsujianto, T., Noviasri, C. S., Alimuddin, Z., &
Yoshikawa, K. (2014). Fuel oil production from Municipal plastic wastes in
sequential pyrolysis and catalytic reforming reactors. Energy Processes, 47,
180-188.
Tahir, M. S. (2015). Producing methane enriched biogas using solvent absorption
method. Chemical Engineering Transact 45, 1309-1304.
The world bank. (2020, March 11). Retrieved from The world bank website:
https://www.worldbank.org
Theng, B. K. (1974). The Chemistry of Clay-Organic Reactions. London,: Adam Hilger
Ltd.

100
Uddin M. A., K. K. (1997). Thermal and catalytic degradation of structurally different
types of polyethylene into fuel oil. Polymer Degradation and Stability, 37-44.
Ukei, H. H. (2000). Catalytic degradation of polystyrene into styrene and a design of
recyclable polystyrene with dispersed catalyst. Catalysts Today 62, 67-75.
Vaga, G. (2007). Effect of Acid Treatment on Physicochemical Properties of Kaolin
Clay. Epitoanyag, 59, 4-8.
Van Der Gaast SJ., C. M. (1986). Curved smectite in soils from volcanic ash in Kenya
and Tanzania: A low-angle X-ray powder difraction study. Clays and clay
minerals, 665-671.
Wan, H. M. (2015). Waste plastics into fuel oil? Institute of Science in Society, 15-19.
Wang, C., Wang, H., Fu, J., & Liu, Y. (2015). Flotation separation of waste plastics for
recycling-a review. Waste Management, 28-38.
Wang, J. W. (2011). Catalytic pyrolysis of municipal plastic waste to fuel with nickel-
loaded silica-alumina atalysts. Energy Sources. Part A 33, 1940-1948.
Wedad, Q., Anwar, N., Aseela, S., & A. A. (2017). Gas Chromatography: Principles,
Advantages and Applications in Food Analysis. International Journal of
Agriculture Innovations and Research, 1-10.
Wilson, M. J. (1996). Clay Mineralogy: Spectroscopic and Chemical Determination
Methods. London: Chapman and Hill.
Wu, J., Chen, T., Luo, X., Han, D., Wang, Z., & Wu, J. (2014). TG/FTIR analysis on
copyrolysis behavior of PE, PVC and PS. Waste Management, 676-682.
Xue, Y. J. (2017). Effect of catalyst contact mode and gas atmosphere during catalytic
pyrolysis of waste plastics. Energy Conversion Management. 142, 441-451.
Zakin, R. (2001). Ceramics, Mastering the Craft, 2nd ed. USA: Krause publications.

101
APPENDICES
Appendix 1: Photographs of raw materials used and experimental layout
Appendix 1a: Waste plastics (PP, HDPE and PS)
Appendix 1b: Preparation of raw materials (PS, and clay soil)

102
Appendix 1c: Chemical Engineering Lab

103
Appendix 1d: Experimental setup for pyrolysis process
Appendix 1e: Pyrolytic oil for HDPE, PP and PS

104
Appendix 1f: Char (By product of pyrolysis process)

105
Appendix 2: GC-MS data
Appendix 2a: Molecular composition of pyrolytic oil from HDPE waste plastics
Retention
time Area Area % Height Height % Name
15.775 50929783 3.02 17375024 2.63 n-Pentadecanol
13.099 48729182 2.89 16872775 2.56 1-Tetradecene
14.475 48194192 2.86 16907915 2.56 n-Pentadecanol
4.286 46124192 2.74 16031127 2.43 2,4-Dimethyl-1-heptene
11.637 45943988 2.73 15939598 2.41 1-Tridecene
11.739 44927479 2.67 14546320 2.2 Tetradecane
10.085 44260017 2.63 15925613 2.41 1-Dodecene
15.853 43032034 2.55 16864842 2.55 Heptadecane
22.487 42774964 2.54 14987539 2.27 Heneicosane
8.453 42307839 2.51 16436592 2.49 1-Undecene
17.003 42161158 2.5 16283191 2.47 n-Pentadecanol
18.235 42159846 2.5 16333143 2.47 Heneicosane
21.387 41908739 2.49 15926929 2.41 Heneicosane
18.167 41046193 2.44 15776831 2.39 n-Pentadecanol
20.378 41071520 2.44 15937047 2.41 Heneicosane
19.334 40818695 2.42 15763380 2.39 Heneicosane
6.756 40572567 2.41 15758073 2.39 1-Decene
17.075 39967919 2.37 16029588 2.43 Heptadecane
2.55 37836475 2.25 19315396 2.93 1-Heptene
14.562 37792115 2.24 15461539 2.34 Pentadecane
13.19 37491218 2.22 15222122 2.31 Tetradecane
19.269 35957089 2.13 14566185 2.21 n-Nonadecanol-1
10.196 34679739 2.06 13946060 2.11 Dodecane
8.571 33465959 1.99 13238162 2.01 Undecane
5.077 33332599 1.98 14436453 2.19 1-Nonene
29.744 32574701 1.93 4898060 0.74 Hexatriacontane
3.703 30411067 1.8 12183432 1.85 Octane
5.199 29900598 1.77 11780896 1.78 Nonane
23.772 29412483 1.75 10884972 1.65 Heneicosane
6.879 27081607 1.61 11669556 1.77 Undecane
20.317 27090300 1.61 11648731 1.76 1-Octadecanol, methyl ether
3.602 26978901 1.6 14170014 2.15 1-Octene
25.329 24677266 1.46 8585749 1.3 Tetracosane
32.926 24421292 1.45 3237982 0.49 Hexatriacontane
4.116 22981161 1.36 13080934 1.98 2-Hexene, 4,4,5-trimethyl-
2.61 21826179 1.3 14087006 2.13 Heptane
21.325 21292756 1.26 8849150 1.34 1-Heneicosanol
37.061 17673403 1.05 1823482 0.28 Hexatriacontane
4.933 15863455 0.94 3112257 0.47 Cyclononene
15.677 15503279 0.92 4023080 0.61 1,19-Eicosadiene

106
4.419 15345850 0.91 2803400 0.42 1-Propylcyclopentene
22.421 14721724 0.87 5762809 0.87 1-Octadecanol, methyl ether
3.425 14043841 0.83 9450906 1.43 Cyclohexene, 1-methyl-
11.955 13324899 0.79 7852781 1.19 Pentadecafluorooctanoic
acid, tridecyl ester
3.078 12984204 0.77 3697565 0.56 Cyclopentanepropanol, 2-
methylene-
27.272 12386673 0.74 4904247 0.74 Eicosane
11.807 12288492 0.73 4319826 0.65 1-Tridecene
11.507 12052237 0.72 2986366 0.45 8-Dodecen-1-ol, (Z)-
6.966 11926911 0.71 5414597 0.82 2-Hexadecene, 2,6,10,14-
tetramethyl-
3.277 11517271 0.68 6717264 1.02 Heptane, 4-methyl-
4.819 11224138 0.67 5715710 0.87 Cyclohexane, (1-
methylethylidene)-
2.646 11062051 0.66 6586770 1 Cyclopropanecarboxylic
acid, cyclohexylmethyl ester
3.172 10946908 0.65 5630479 0.85 1-Methyl-2-
trifluoroacetoxycyclohexane
42.419 10994953 0.65 961130 0.15 Hexatriacontane
5.284 10619355 0.63 5848842 0.89 Bicyclo[2.1.1]hexan-2-ol, 2-
ethenyl-
2.918 10124875 0.6 6645176 1.01 Cyclohexane, methyl-
4.607 9580187 0.57 4779752 0.72
Cyclohexane, 1,3,5-
trimethyl-,
(1.alpha.,3.alpha.,5.beta.)-
3.529 9465128 0.56 2656247 0.4 1-Heptene, 2-methyl-
15.9 9497032 0.56 5727857 0.87 E-15-Heptadecenal
18.275 9298397 0.55 6137072 0.93 E-15-Heptadecenal
12.977 8850737 0.53 2832536 0.43 cis-9-Tetradecen-1-ol
2.676 8338122 0.49 7734296 1.17 2-Heptene, (E)-
16.915 8064169 0.48 2962915 0.45 1,15-Hexadecadiene
14.37 7987496 0.47 3571747 0.54 11-Hexadecen-1-ol, (Z)-
8.135 7461939 0.44 4664541 0.71 Isodecyl methacrylate
8.647 5854951 0.35 3873027 0.59 5-Undecene

107
Appendix 2b: Molecular composition of pyrolytic oil from PP waste plastics
Retention
time
Area Area
%
Height Height % Name
5.392 275146072 38.69 41656725 20.82 1,3,5,7-Cyclooctatetraene
4.781 96716539 13.59 27763054 13.87 Benzene, 1,3-dimethyl-
6.821 82248064 11.56 27999951 13.99 .alpha.-Methylstyrene
3.437 54765495 7.7 23520565 11.75 Toluene
16.993 48268310 6.78 17318614 8.65 Benzene, 1,1'-(1,3-
propanediyl)bis-
27.248 29371647 4.13 5989311 2.99 1,2-Propanediol, 3-
benzyloxy-1,2-diacetyl-
17.77 26410977 3.71 8431773 4.21 1,2-Diphenyl-1-
isocyanoethane
5.761 19270827 2.71 12088015 6.04 Benzene, 1-ethyl-2-methyl-
18.005 10648178 1.5 4526749 2.26 1,2-Diphenylcyclopropane
17.268 8564822 1.2 3320438 1.66 Benzene, 1,1'-(1-methyl-1,3-
propanediyl)bis-
18.699 6689835 0.94 2781013 1.39 Benzene, 1,1'-(3-methyl-1-
propene-1,3-diyl)bis-
18.421 6323162 0.89 1829142 0.91 Benzene, 1,1'-(3-methyl-1-
propene-1,3-diyl)bis-
7.585 6230135 0.88 3691622 1.84 Benzene, 1,1'-(1-ethenyl-1,3-
propanediyl)bis-
20.875 5704901 0.8 2255445 1.13 Naphthalene, 2-phenyl-
17.175 5461335 0.77 2270116 1.13 Benzene, 1,1'-(3-methyl-1-
propene-1,3-diyl)bis-
29.969 4148410 0.58 749644 0.37 1-Propene, 3-(2-
cyclopentenyl)-2-methyl-1,1-
diphenyl-
17.333 2847364 0.4 1317694 0.66 EMDP
6.149 2557143 0.36 1575976 0.79 Benzene, cyclopropyl-
19.544 2453572 0.34 1148584 0.57 Dibenzo[a,e]cyclooctene
17.541 1936619 0.27 947219 0.47 EMDP
18.186 1756249 0.25 956210 0.48 Benzene, 1,1'-(1,4-
butanediyl)bis-
6.263 1731572 0.24 1196346 0.6 Benzene, propyl-
12.674 1723758 0.24 978651 0.49 Benzenebutanenitrile
18.999 1549307 0.22 784642 0.39 Benzene, 1,1'-(1-butene-1,4-
diyl)bis-, (Z)-
17.406 1522209 0.21 769509 0.38 1-Propene, 3-(2-
cyclopentenyl)-2-methyl-1,1-
diphenyl-
15.288 1410078 0.2 768325 0.38 Bibenzyl
18.547 1449659 0.2 627294 0.31 1H-Indene, 2-methyl-3-
phenyl-
14.066 1192963 0.17 664315 0.33 Diphenylmethane

108
4.322 1139689 0.16 805995 0.4 Cyclohexene, 4-ethenyl-
15.634 1148901 0.16 624101 0.31 Benzene, 1,1'-(1-methyl-1,2-
ethanediyl)bis-
4.261 1084282 0.15 854979 0.43 2,4-Dimethyl-1-heptene

109
Appendix 2c: Molecular composition of pyrolytic oil from PS waste plastics
Retention
time Area
Area
% Height
Height
% Name
4.365 195380364 7.69 36105115 3.65 2,4-Dimethyl-1-heptene
11.744 89979551 3.53 23816548 2.42 2-Isopropyl-5-methyl-1-
heptanol
4.14 76302956 2.99 18774714 1.91 2-Hexene, 4,4,5-trimethyl-
11.995 65443721 2.57 20882733 2.12 2-Isopropyl-5-methyl-1-
heptanol
8.169 54662161 2.14 18990330 1.93 Isodecyl methacrylate
17.346 54354018 2.13 18426035 1.87 Docosyl heptafluorobutyrate
17.678 49558886 1.94 16165352 1.64 Heneicosyl trifluoroacetate
5.081 47997787 1.88 17573828 1.78 3-Octene, 2,2-dimethyl-
11.852 47856128 1.88 16922875 1.72 2-Isopropyl-5-methyl-1-
heptanol
14.72 47196179 1.85 17801453 1.81 Pentadecafluorooctanoic acid,
octadecyl ester
19.673 41910483 1.64 14896237 1.51 Eicosyl heptafluorobutyrate
11.578 41153543 1.61 7737596 0.79 2-Decene, 2,4-dimethyl-
15.646 40463888 1.59 15189900 1.54 10-Dodecen-1-ol, 7,11-
dimethyl-
8.239 39166285 1.54 17363441 1.76 2-Undecene, 4,5-dimethyl-,
[R*,S*-(Z)]-
18.193 33769453 1.32 15369351 1.56 Tetrapentacontane, 1,54-
dibromo-
4.632 32614212 1.28 16747569 1.7 Cyclohexane, 1,3,5-trimethyl-,
(1.alpha.,3.alpha.,5.beta.)-
4.957 31739070 1.24 11314802 1.15 2,4-Heptadiene, 2,6-dimethyl-
18.157 31497869 1.24 11251472 1.14 1-Heptadecene
17.765 31424016 1.23 13458082 1.37
E-11(13,13-
Dimethyl)tetradecen-1-ol
acetate
4.837 30872438 1.21 15141849 1.54 1,7-Octadiene, 2,3,3-
trimethyl-
5.293 30386898 1.19 12848367 1.3 Styrene
20.452 30295146 1.19 12055263 1.22 Cyclooctane, 1-methyl-3-
propyl-
3.286 27956698 1.1 13472898 1.37 Heptane, 4-methyl-
9.337 27997621 1.1 13074106 1.33 (2,4,6-Trimethylcyclohexyl)
methanol
15.188 27945075 1.1 12206679 1.24 Cyclopropanol, 1-(3,7-
dimethyl-1-octenyl)-
12.332 27871846 1.09 12699407 1.29 Pentadecafluorooctanoic acid,
octadecyl ester
21.829 27510007 1.08 10054363 1.02 Dotriacontyl
pentafluoropropionate
12.743 26407124 1.04 13794490 1.4 Cyclododecanemethanol
19.259 26536101 1.04 10499032 1.07 Cyclopentane, 1-pentyl-2-
propyl-

110
6.743 26289706 1.03 12355031 1.25 1-Undecene
15.067 26386048 1.03 11845224 1.2 1-Dodecanol, 2-hexyl-
22.233 25833234 1.01 10054324 1.02
1,3-Dioxolane, 4-heptyl-5-
methyl-2,2-
bis(trifluoromethyl)-, cis-
6.964 25297383 0.99 11047524 1.12 Decane, 4-methyl-
20.052 25325550 0.99 11798050 1.2
E-11(13,13-
Dimethyl)tetradecen-1-ol
acetate
14.45 24634933 0.97 9727430 0.99 n-Pentadecanol
2.65 24409310 0.96 13306721 1.35 1,3-Pentadiene, 2,4-dimethyl-
18.029 23441248 0.92 9676941 0.98 Dotriacontyl
pentafluoropropionate
3.693 22969279 0.9 6446420 0.65 Cyclohexanol, 2,4-dimethyl-
15.751 22339618 0.88 10345480 1.05 n-Heptadecanol-1
8.916 22196754 0.87 10641868 1.08 1-Heptanol, 2,4-diethyl-
11.419 22033592 0.86 3113985 0.32 Cyclohexanone, 3,3,5-
trimethyl-
11.194 21213465 0.83 10898965 1.11 2-Decene, 2,4-dimethyl-
16.98 21198379 0.83 8885455 0.9 n-Pentadecanol
8.435 20937117 0.82 10429918 1.06 1-Undecene
3.175 19849513 0.78 9292769 0.94 2-Heptene, 4-methyl-, (E)-
14.835 19549782 0.77 9266373 0.94 Pentadecafluorooctanoic acid,
octadecyl ester
16.894 19169769 0.75 8538901 0.87 Cyclohexane, 1,5-diethyl-2,3-
dimethyl-
27.245 19054044 0.75 3081645 0.31 Tetratriacontane
7.761 18980786 0.74 9114729 0.93 2-Decene, 2,4-dimethyl-
7.036 18329990 0.72 10603876 1.08 Nonane, 2,6-dimethyl-
23.746 18450631 0.72 4542026 0.46 Heneicosane
17.439 18118137 0.71 6106280 0.62 Hexatriacontyl trifluoroacetate
36.944 18174601 0.71 1471083 0.15 Octatriacontyl trifluoroacetate
13.074 17671656 0.69 9203881 0.93 1-Tetradecene
3.53 16996438 0.67 7322283 0.74 1-Heptene, 2-methyl-
10.061 17175560 0.67 8777325 0.89 1-Tridecene
22.703 16929851 0.66 7980988 0.81 Cyclohexane, 1,2,3,5-
tetraisopropyl-
5.409 15937815 0.63 8847447 0.9 cis-3-Hexenyl heptine
carbonate
15.821 15950048 0.63 7729602 0.78 Heptadecane, 2,6,10,15-
tetramethyl-
24.518 15955258 0.63 5825005 0.59 Hexatriacontyl trifluoroacetate
3.426 15919532 0.62 7740000 0.79
7-
Methylenebicyclo[3.2.0]hept-
3-en-2-one
5.195 15801847 0.62 6023376 0.61 Nonane
7.841 15930278 0.62 7435355 0.75 3-Decene, 2,2-dimethyl-, (E)-

111
12.654 15839412 0.62 7525499 0.76 1-Heptanol, 2,4-diethyl-
4.46 15642952 0.61 4351949 0.44 1,3-Hexadiene, 3-ethyl-2-
methyl-, (Z)-
10.168 15436957 0.61 6134881 0.62 Dodecane
15.248 14980222 0.59 8237905 0.84 1-Dodecanol, 2-hexyl-
12.235 14805430 0.58 8541483 0.87 Bicyclo[3.1.1]heptan-2-one,
6,6-dimethyl-
32.907 14230288 0.56 1841473 0.19 Tetratetracontane
14.534 13912223 0.55 6685568 0.68 Pentadecane
25.801 13544098 0.53 4571658 0.46 Cyclohexane, 1,2,3,5-
tetraisopropyl-
17.047 13082273 0.51 6332051 0.64 Heptadecane
22.092 12985786 0.51 5398049 0.55 Hexatriacontyl trifluoroacetate
6.694 12801986 0.5 5974049 0.61 2-Decene, 4-methyl-, (Z)-
17.816 12850400 0.5 7457686 0.76 1-Dodecanol, 2-hexyl-
6.789 12392354 0.49 6075937 0.62 2-Decene, 4-methyl-, (Z)-
9.025 12544789 0.49 6394985 0.65 2-Undecanethiol, 2-methyl-
10.621 12127556 0.48 4290275 0.44 Tridecane, 4-methyl-
19.306 12363268 0.48 6796708 0.69 Heneicosane
30.709 12202309 0.48 2514027 0.26 Cyclohexane, 1,2,3,5-
tetraisopropyl-
14.223 11974942 0.47 6813490 0.69 Cyclobutanecarboxylic acid,
6-ethyl-3-octyl ester
22.417 12040698 0.47 3701675 0.38 Methyl tetracosyl ether
19.944 11851521 0.46 5717897 0.58 1-Dodecanol, 2-octyl-
8.55 11530681 0.45 5488880 0.56 Undecane
25.095 11535957 0.45 4461766 0.45
E-11(13,13-
Dimethyl)tetradecen-1-ol
acetate
3.595 11136942 0.44 6542898 0.66 1-Octene
3.817 10993172 0.43 5280292 0.54 1-Hexene, 3,3,5-trimethyl-
6.859 11074888 0.43 6352781 0.64 Octane, 3,5-dimethyl-
13.16 10985765 0.43 6014289 0.61 Tetradecane
21.414 11079924 0.43 6224904 0.63 7-Oxabicyclo[4.1.0]heptan-2-
one, 4,4,6-trimethyl-
20.359 10693961 0.42 5796980 0.59 Heneicosane
8.809 10384592 0.41 6370324 0.65 1,7-Octadiene, 2,3,3-
trimethyl-
17.095 10507522 0.41 5405954 0.55 Cyclohexane, 1-ethyl-2-
propyl-
9.375 10274834 0.4 5955286 0.6 (2,4,6-Trimethylcyclohexyl)
methanol
17.535 9937778 0.39 3745103 0.38 Triacontyl heptafluorobutyrate
12.977 9574773 0.38 4973301 0.5 1,22-Docosanediol
20.307 9564803 0.38 4861711 0.49 1-Octadecanol, methyl ether
21.36 9358810 0.37 5306131 0.54 Heneicosane
17.189 9185012 0.36 4546400 0.46 2-Cyclohexylnonadecane

112
22.466 9136988 0.36 4502340 0.46 Heneicosane
29.537 9192370 0.36 2245990 0.23
E-11(13,13-
Dimethyl)tetradecen-1-ol
acetate
3.923 8862408 0.35 5275354 0.54 Cyclopentane, 1,1,3,4-
tetramethyl-, cis-
15.97 8953793 0.35 5109184 0.52 10-Dodecen-1-ol, 7,11-
dimethyl-
14.929 8745898 0.34 3654674 0.37 Pentadecafluorooctanoic acid,
octadecyl ester
19.447 8644885 0.34 4969104 0.5 11-Dodecen-2-one, 7,7-
dimethyl-
19.75 8508857 0.33 4502647 0.46 1-Dodecanol, 2-octyl-
23.918 7807929 0.31 3270111 0.33 Cyclohexane, 1,2,3,4,5,6-
hexaethyl-
28.601 7476879 0.29 2146080 0.22 Hexatriacontyl trifluoroacetate
38.922 6976320 0.27 939741 0.1 Cyclohexane, 1,2,3,5-
tetraisopropyl-
27.636 5598454 0.22 1678222 0.17 Cyclohexane, 1,2,3,4,5,6-
hexaethyl-