Carbonaceous species and physicochemical characteristics of PM10 in coal mine fire area—a case...
9
Carbonaceous species and physicochemical characteristics of PM 10 in coal mine fire area—a case study Debananda Roy 1 & Sneha Gautam 2 & Pradyumn Singh 2 & Gurdeep Singh 3 & Bidus Kanti Das 2 & Aditya Kumar Patra 2 Received: 29 April 2015 /Accepted: 7 June 2015 # Springer Science+Business Media Dordrecht 2015 Abstract When exposed to air, coal catches fire due to self- oxidation. Coal mine fire is one of the major sources of partic- ulate matter (PM) emissions in coal mining areas. Coal mine is widespread in India with Jharia Coalfield having a number of coal seams and coal dumps under fire. The understanding of magnitude and character of particulate matter emitted from coal mine fire areas is important in order to understand its health impacts, about which not many studies have been carried out. The paper presents findings of a study aimed to characterize physical and chemical properties of airborne respirable particle (PM 10 ) in the fire-affected area at Jharia Coalfield, India. The study was carried out for a period of 8 months from October 2011 to June 2012. The mean concentrations of PM 10 were 338.0, 369.0, and 357.0 μgm −3 during summer, winter, and post-monsoon, respectively. Scanning electron microscopy (SEM) showed the presence of rounded, spherical, and oval formed particulate in ambient air that is characteristics of com- bustion sources. Dominance of irregular-shaped particulate in all samples indicated road dust as the source. Abundance of fine PM (<4 mm) indicated burning process to be the source. For the Bqualitative analysis,^ techniques like Fourier trans- form infrared (FTIR) spectroscopy, gas chromatography–mass spectrometry (GC-MS), and inductively coupled plasma optical emission spectrometry (ICP-OES) were used. Chemical analysis shows the presence of elements like Fe, Al, Cu, Si, Na, Cr, Mn, Zn, Cd, Ni, K, and Pb. Anionic con- centrations of SO 4 2− , NO 3 − ,Cl − ,F − , and PO 4 2− were analyzed using ion chromatography. Carbonaceous aerosol analysis re- sults indicated that concentrations of carbonaceous species were 19.51 μ gm − 3 for organic carbon (OC) and 238.0 μgm −3 for elemental carbon (EC) in PM 10 samples. Keywords Mine fire . PM 10 . Jharia Coalfield . Physical-chemical characteristics . Carbonaceous species Introduction From past few decades, the concern about air pollution exclu- sively with reference to particulate matter (PM) is receiving importance worldwide (Tsiouri et al. 2015; Lippmann 2012). The elevated concentration of PM in mine air results from dispersion of PM from mining operations (Gautam and Patra 2015). Prabha et al. (2006)) reported that large-scale mecha- nized opencast coal mining generates vast quantity of airborne dust which may cause safety and health hazards due to poor visibility, failure of equipment, multiplied maintenance cost, and lowering of labor productivity. It has also been reported that coal mining particulates are respirable in nature and haz- ardous to human health (Ghose and Majee 2007). Long-term exposure to increased PM concentrations might result in a marked reduction in life expectancy due to increase of cardio-pulmonary disease and lung cancer (Park et al. 2013; WHO 2005). However, limited studies are available on physico-chemical composition of PM 10 that is responsible for adverse health effects. The sources of PM emission in opencast coal mines include blasting and drilling operations, transportation of coal and overburden on haul roads, coal * Debananda Roy [email protected] 1 Department of Environmental Science & Engineering, Marwadi Education Foundation’ s Group of Institutions, Rajkot (GTU), Gujarat, India 2 Department of Mining Engineering, Indian Institute of Technology Kharagpur, Kharagpur 721302, India 3 Department of Environmental Science & Engineering, Indian School of Mines, Dhanbad, Jharkhand, India Air Qual Atmos Health DOI 10.1007/s11869-015-0355-2
Transcript of Carbonaceous species and physicochemical characteristics of PM10 in coal mine fire area—a case...

Carbonaceous species and physicochemical characteristicsof PM10 in coal mine fire area—a case study
Debananda Roy1 & Sneha Gautam2& Pradyumn Singh2
& Gurdeep Singh3&
Bidus Kanti Das2 & Aditya Kumar Patra2
Received: 29 April 2015 /Accepted: 7 June 2015# Springer Science+Business Media Dordrecht 2015
Abstract When exposed to air, coal catches fire due to self-oxidation. Coal mine fire is one of the major sources of partic-ulate matter (PM) emissions in coal mining areas. Coal mine iswidespread in India with Jharia Coalfield having a number ofcoal seams and coal dumps under fire. The understanding ofmagnitude and character of particulate matter emitted from coalmine fire areas is important in order to understand its healthimpacts, about which not many studies have been carried out.The paper presents findings of a study aimed to characterizephysical and chemical properties of airborne respirable particle(PM10) in the fire-affected area at Jharia Coalfield, India. Thestudy was carried out for a period of 8 months from October2011 to June 2012. The mean concentrations of PM10 were338.0, 369.0, and 357.0 μg m−3 during summer, winter, andpost-monsoon, respectively. Scanning electron microscopy(SEM) showed the presence of rounded, spherical, and ovalformed particulate in ambient air that is characteristics of com-bustion sources. Dominance of irregular-shaped particulate inall samples indicated road dust as the source. Abundance offine PM (<4 mm) indicated burning process to be the source.For the Bqualitative analysis,^ techniques like Fourier trans-form infrared (FTIR) spectroscopy, gas chromatography–massspectrometry (GC-MS), and inductively coupled plasma
optical emission spectrometry (ICP-OES) were used.Chemical analysis shows the presence of elements like Fe,Al, Cu, Si, Na, Cr, Mn, Zn, Cd, Ni, K, and Pb. Anionic con-centrations of SO4
2−, NO3−,Cl−, F−, and PO4
2− were analyzedusing ion chromatography. Carbonaceous aerosol analysis re-sults indicated that concentrations of carbonaceous specieswere 19.51 μg m−3 for organic carbon (OC) and238.0 μg m−3 for elemental carbon (EC) in PM10 samples.
Keywords Mine fire . PM10. Jharia Coalfield .
Physical-chemical characteristics . Carbonaceous species
Introduction
From past few decades, the concern about air pollution exclu-sively with reference to particulate matter (PM) is receivingimportance worldwide (Tsiouri et al. 2015; Lippmann 2012).The elevated concentration of PM in mine air results fromdispersion of PM from mining operations (Gautam and Patra2015). Prabha et al. (2006)) reported that large-scale mecha-nized opencast coal mining generates vast quantity of airbornedust which may cause safety and health hazards due to poorvisibility, failure of equipment, multiplied maintenance cost,and lowering of labor productivity. It has also been reportedthat coal mining particulates are respirable in nature and haz-ardous to human health (Ghose and Majee 2007). Long-termexposure to increased PM concentrations might result in amarked reduction in life expectancy due to increase ofcardio-pulmonary disease and lung cancer (Park et al. 2013;WHO 2005). However, limited studies are available onphysico-chemical composition of PM10 that is responsiblefor adverse health effects. The sources of PM emission inopencast coal mines include blasting and drilling operations,transportation of coal and overburden on haul roads, coal
* Debananda [email protected]
1 Department of Environmental Science & Engineering, MarwadiEducation Foundation’s Group of Institutions, Rajkot(GTU), Gujarat, India
2 Department of Mining Engineering, Indian Institute of TechnologyKharagpur, Kharagpur 721302, India
3 Department of Environmental Science & Engineering, Indian Schoolof Mines, Dhanbad, Jharkhand, India
Air Qual Atmos HealthDOI 10.1007/s11869-015-0355-2

handling plant operation, loading and transport of over-burden and coal by shovel-dumper combination, crushing,conveying, and handling of overburden by draglines, andvehicular emission from unpaved roads (Zhang et al.2013). In addition to the above mentioned sources, coalmine fire has been found to be one of the major sources ofPM emission (Pandey et al. 2014). Along with the gas-eous pollutants like CO, CO2, and SO2 that are released tothe atmosphere from the coal mine fire, a huge amount ofPM is also emitted from the mine fire areas. The increasedPM level in air in mine fire locality is the prime concernof the inhabitants residing at close proximity to the minefire area. The particles of concern to human health are therespirable particles (also referred to as PM10, particulatematter having equivalent diameter less than 10 μm) thatcan enter human lungs through the respiratory system andtherefore potentially be the cause of respiratory diseases(Martinelli et al. 2013; Pipal et al. 2014). Most of themine fire originates from coal mines, particularly opencastmines (Li-ding 1999). Fire occurs whenever coal is ex-posed to air. The problem of coal mine fires has beenreported from nearly all parts of the globe wherever coalis mined. However, the character and magnitude of theproblem differ from country to country. In India, coalmine fires widely occur in the Jharia, Raniganj, Ib-Godawari-Wardha Valley, Margherita (Assam), Singreni,Talcher, and Ramgarh-Karanpura-Bokaro coalfields. Aconsiderable amount of PM, mainly PM10, was found in
the fire-affected area in the Jharia Coalfield. Combustionof coal is also a major source for particles, and the livemine fires in the Jharia Coalfield play a key role in for-mation of particulates.
The paper presents the findings of a study on physico-chemical characterization of PM10 originated from the minefire area of Jharia Coalfield in India. As Lodhna Thana (A-12)is badly affected by the mine fire and it is surrounded by theBastacolla and Lodhna colliery area, a significant amount ofPM contribution may be attributed to the mine fire (Pandeyet al. 2014).
Material and methods
Study area
The Jharia Coalfield (JCF) is one of the most important coal-fields in India fulfilling the coking coal requirement of thecountry. Mines belonging to the coalfields are located inDhanbad and Bokaro district in Jharkhand state of India, po-sitioned between latitude 23° 38′ N and 23° 48′ N and longi-tude 86° 11′ E and 86° 27′ E. It is about 260 km northwest ofKolkata, the nearest major city in the eastern part of India.This is often the foremost exploited coalfield because of avail-able metallurgical grade coal reserves. The Common peopleof this area are in a threat of fire and subsidence due to thecentury-old mine workings in this coalfield (Ghose andMajee
Fig. 1 Lodhna Thana (A-12): location map with mine fire locations and wind rose diagram of the study area
Air Qual Atmos Health

2007). Forty-one collieries, 70 locations, and a 8.90-km2 areaare badly affected by the mine fire and subsidence (MasterPlan BCCL 2008). The study was conducted around LodhnaThana which is surrounded by Bastacolla and Lodhna collieryof JCF (Fig. 1), which is severely affected by the mine fire.Previous studies also have reported high level of respirablePM in the air in this area (Sinha et al. 2012).
Sampling and analysis
Sampling protocol
Particulate sampling was carried out at Lodhna Thana(A-12) from October 2011 to June 2012 in three distinctseasons, i.e., winter (December–March), summer (April–June), and post-monsoon (October–November). A total 54samples (18 from each season) were collected from themonitoring site. Monitoring stations were selected as perthe siting criteria IS: 5182 Part XIV with special consid-eration of meteorological data and sources of pollution,apart from security, accessibility, and availability of elec-tricity. Air quality monitoring has been carried out follow-ing standard methodologies and protocols as per CentralPollution Control Board (CPCB)/National Ambient AirQuality Standard (NAAQS), India norms. PM10 sampleswere collected for 24 h on glass fiber filters (8×10 in.
using respirable dust samplers (RDS; Envirotech ModelAPM 460, India) with a flow rate of 1.1–1.2 m3 min−1
as per IS: 5182 PART XXIII for sampling/collection ofPM10. The sampler was set up at a place about 6 m abovethe ground. Filter papers were equilibrated in desiccatorscontaining silica gel for 24 h before and after samplecollection and weighed on pre-calibrated electronic bal-ance (Denver Instruments, Model TB-215D) before andafter the sampling to know the weight of the collectedPM. The PM10 mass concentration was calculated by di-viding the weight of collected dust with volume of airsampled.
Morphology and chemical composition
Physical characterization of PM10 samples was performedusing electron scanning microscopy (SEM, JEOL ModelJSM-6390LV, Japan) for determination of morphology ofairborne particles. Approximately one fourth of filter pa-pers were cut and coated with platinum to prepare the sam-ples for SEM analysis. Three images of one sample weretaken at a magnification of ×3000, ×5000, and×10,000.Techniques like X-ray diffraction (XRD) patterns, induc-tively coupled plasma optical emission spectrometry (ICP-OES), gas chromatography–mass spectrometry (GC-MS),ion chromatography, elemental carbon/organic carbon(EC/OC) analyzer, and Fourier transform infrared (FTIR)spectroscopy were also used for the further analysis ofPM10 samples. XRD patterns of PM10 samples were takenat room temperature in a wide range of Bragg angle 2θ(15°≤2θ≤100°) with scanning speed of 1° per minuteusing Rigaku X-Ray difractometer (Miniflex, Japan). Theoperating condition involved the use of CuKα radiation at34 kV, 24 mA, and Ni filter (Das et al. 2012). Trace ele-ment analysis of PM10 samples was performed using thePerkinElmer® Optima™ 7300 DV ICP-OES instrument(PerkinElmer, Inc., Shelton, CT, USA). For that, after
0
100
200
300
400
Post-monsoon Summer Winter NAAQS, 2009
Con
cent
ratio
n (µ
g m
-3) Number of
Samples (n) = 54
Fig. 2 Seasonal average concentration of PM10 in Lodhna Thana (A-12)
Fig. 3 Morphologies of PM10 atLodhna Thana (A-12) site duringthe entire study period
Air Qual Atmos Health
gravimetric analysis of EPM2000 filter papers, a known portionof the exposed filter paper (1/4) sample was digested with 2:1 (v/v) HNO3/HClO4 mixture in the fume hood chamber extractedfor trace metals (APHA 1977) which were directly introducedinto the ICP-OES.GC-MS (Agilent 7890A)was used to analyzethe total concentration of polycyclic aromatic hydrocarbons(PAHs). Major anions were determined in aqueous extracts byion chromatograph (Model: DIONEX-ICS-3000, USA), andratios of elemental carbon and organic carbon (EC/OC) wereanalyzed using EC/OC analyzer (Model: DRI 2001A, USA).Fourier transform infrared (FTIR) spectroscopy technique(8400S, Shimadzu Corp, Japan) was adapted for identificationand characterization of inorganic and organic compounds.
Results and discussion
PM mass concentration
PM10 concentrations during study period are summarized inFig. 2. Arithmetic average concentration of PM10 was foundto be 354.6 μg m−3, for the whole study period. The averagelevel of PM10 was lowest during summer, i.e., 338.0 μg m−3.PM10 level during winter was highest, i.e., 369.0 μg m−3,while the values during post-monsoon season lies in betweenwinters and summers. The concentration of PM10 during post-
monsoon season (i.e., 357.0 μg m−3) was very close to theaverage highest level during winters. The concentrations ofPM10 at Lodhna Thana (A-12) during three distinct seasons,i.e., summer, winter, and post-monsoon, were respectively3.3, 3.6, and 3.5 times higher than NAAQS (100 μg m–3)(CPCB 2009) guidelines of India. Very small difference inthe concentration of PM10 during summer and winter seasonmay be attributed to the fact that particles remain airbornethrough nonlinear processes for days to weeks. The elevatedconcentration of PM10 during winter can also be attributed tolow temperature and low wind speed, which cause the lowermixing height and poor dispersion conditions. During summerseason, PM10 concentration is lower than during winter due toenhanced dispersion caused by vertical mixing of air underunstable atmospheric conditions (Pandey et al. 2014). PM10 isformed due to mechanical disruption, evaporation of sprays,and resuspension of dusts (Cole and Zapert 1995) near coalmining areas; hence, proportions of coarse particles were highin the coal mining region.
Characterization of PM
Physical characteristics
Physical properties of PM10 play an important part to identifythe source. Microscopic analysis of PM collected at Lodhna
6%
12%
15%
16%
13%
12% 9%
8%
5%4%
51%
<1µm 1-2µm 2-3µm 3-4µm 4-5µm 5-6µm 6-7µm 7-8µm 8-9µm 9-10µm
Other
Fig. 4 Percentage massdistribution pattern of PM10 inLodhna Thana (A-12)
Pb1%
Ni0%
Cu9% Mn
2%Fe38%
Zn4%
Al31% Cd
0% Cr2%
Si10%
Na3%
K0%
Other12%
Fig. 5 Percentage distribution ofelements in PM10 at LodhnaThana (A-12)
Air Qual Atmos Health
Thana (A-12) was made by SEM during different seasons(Fig. 3). SEM images are typical in that they show a PM10
sample consisting of combustion particles and mineral grains,with mineral grains more abundant on the filters. The mineralparticles typically range in size from 2 to 10 μm. Most of themineral particles appear to consist of single minerals, althoughsome composite particles consisting of two or more mineralswere recognized. Mineral particles commonly have soot par-ticles adhering to their surfaces. The range of mineral types isdemonstrated by the varying morphologies and characteristicsseen, including stacked platy crystals, concoidal fracture, andclean crystal faces. The combustion particles (soot) were com-posed of bunches of microscopic spheres (Jones et al. 2002).Dust particles are not spherical, and seldom even nearly spher-ical. The shape of dust particles varies from compact androunded to thin flakes, fibers, and angular as well as aggre-gates (Pachauri et al. 2013). SEM images show some promi-nent blistering effects on the surface of the particles and at-tachment of small-sized thin particles on the surface of big-sized particles, which strongly indicates the effect of mine fire.It was also observed that the percentage mass distributionpattern of PM10 was 3–4 μm>2–3 μm>4–5 μm>5–6 μm>1–2 μm. Around 49 % PM was less than 4 μm (Fig. 4). Asmentioned in the literature (Pitts and Pitts 2000), very fineparticles are generated from high combustion processes.Combustion process is one of the major contributors of fine
PM, and therefore, mine fire can be one of the probablesources in this area (Ghose and Majee 2007). Irregular shapeof the particle with adhered smaller particles on the surfacewith size of 0.785 to 7.50 nm indicates vehicular source ofPM10 (Pipal and Satsangi 2015).
Chemical characteristics
Elemental analysis Elemental analysis of PM10 samples re-veals that 88 % of the total elemental concentration is contrib-uted by Fe-, Al-, Cu-, and Si-rich particles. The remainingcontributions were from Na-, Cr-, Mn-, Zn-, Cd-, Ni-, K-,and Pb-rich particles, which follow the trend Fe>Al>>Si>Cu>Na>Cr>Mn>Zn>Pb>Cd>Ni>K (Fig. 5). This trendindicates the presence of soot and tarball particles. Soot parti-cles are characterized by small aggregate of spherulities in theform of chains and large aggregated clusters (Kocbach et al.2005). These are the typical particle type originating fromfossil fuel combustion (Pipal et al. 2011). The variations ofindividual elemental concentration of PM10 are summarizedin Table 1. The most abundant group found in this size isassociation of Fe, Cu, Al, and Si with minor amount of Pb,K, and Zn indicating the probable sources of coal burning (Xieet al. 2004). Si-rich particles correspond to Si-Al oxides ofspheroidal morphology in PM which may be generated bysome high-temperature processes like coal mine fire (Pipal
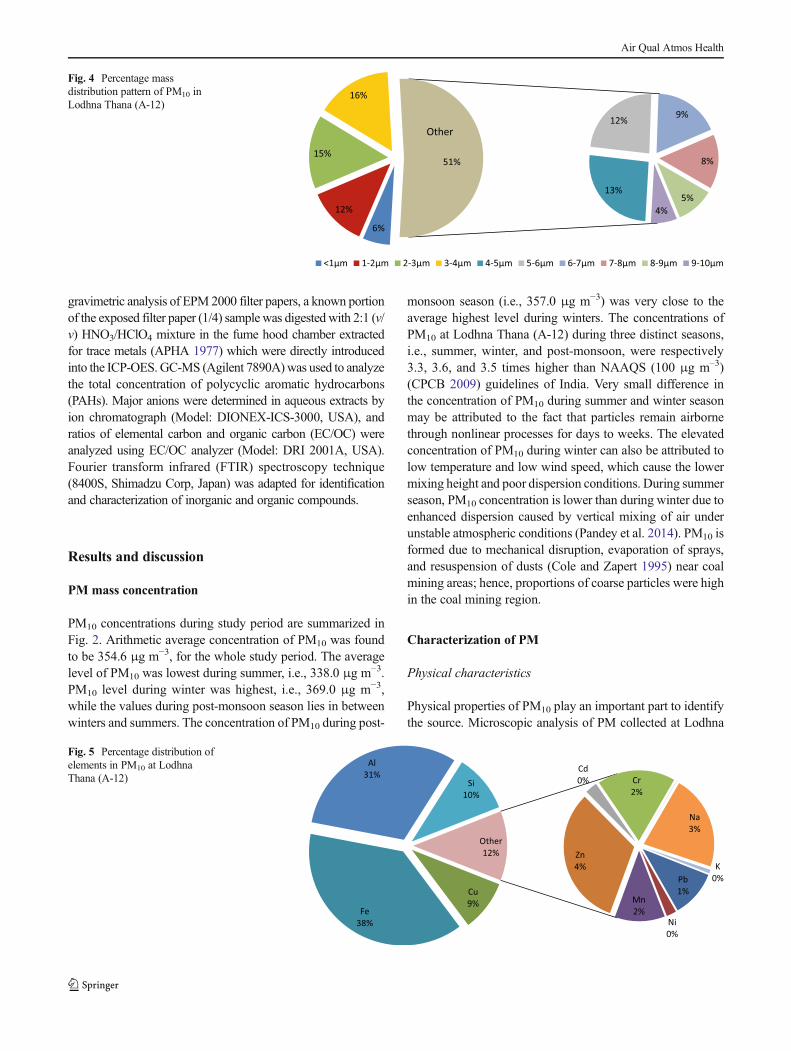
Table 1 Element-wise concentration of PM10 particles at Lodhna Thana (A-12) in μg m−3
Elements Ionic species
Number of samples (n)=54
Fe Al Si Cu Na Cr Mn Zn Pb Cd Ni K SO42− NO3
− Cl− PO42− F−
Avg 8.34 6.74 2.05 1.58 0.51 0.39 0.25 0.84 0.19 0.07 0.06 0.02 3.47 0.55 0.56 0.16 0.12
SD 0.23 0.11 0.34 0.27 0.05 0.01 0.01 0.04 0.03 – – – 1.90 0.14 0.16 0.01 0.05
Med 5.43 3.52 0.91 0.67 0.27 0.14 0.12 0.41 0.07 0.03 0.03 0.01 1.78 0.23 0.28 0.06 0.07
Max 9.45 7.80 2.10 2.04 0.59 0.44 0.30 0.91 0.27 0.11 0.09 0.04 4.18 0.67 0.64 0.24 0.21
Min 3.42 1.23 0.43 0.27 0.12 0.03 0.01 0.17 0.01 0.01 0.01 0.01 0.91 0.12 0.09 0.02 0.03
Range 6.03 6.57 1.67 1.77 0.47 0.41 0.29 0.74 0.26 0.10 0.08 0.03 3.27 0.55 0.55 0.22 0.18
Avg average, SD standard deviation, Med median, Max maximum, Min minimum, Range (Max–Min)
SO42-71%
NO3-11%
PO42-3%
F-3%Cl-
12%
Other6%
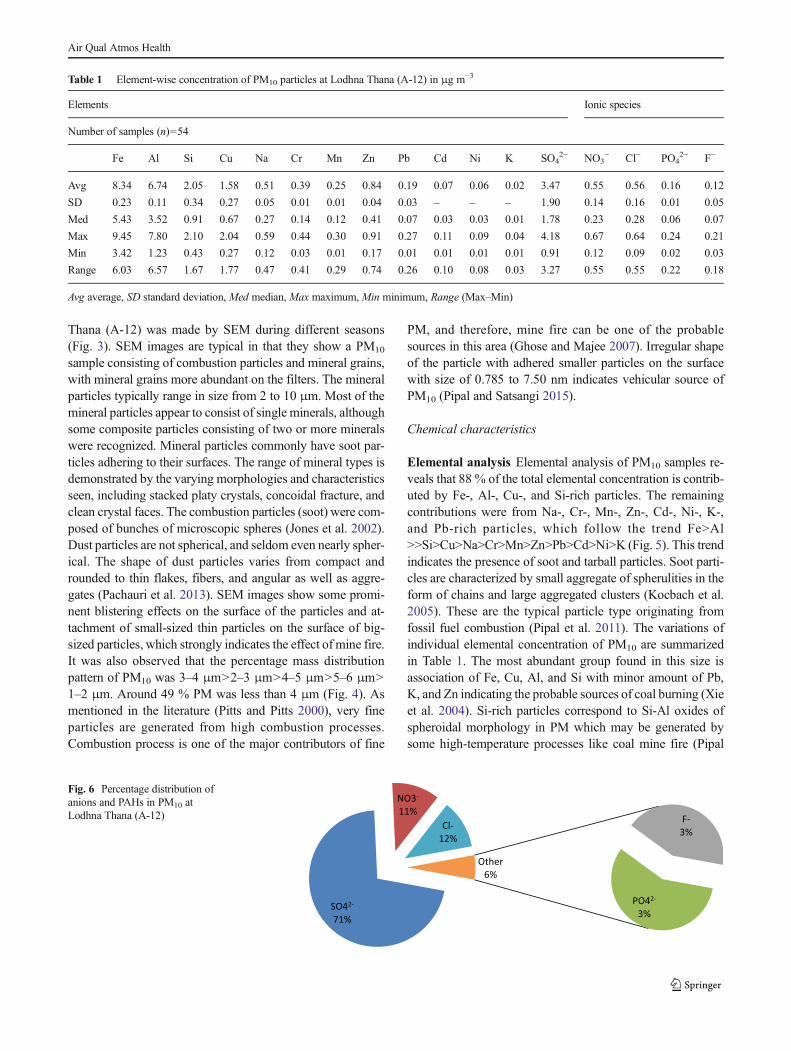
Fig. 6 Percentage distribution ofanions and PAHs in PM10 atLodhna Thana (A-12)
Air Qual Atmos Health

et al. 2014). The concentration of Cr and Mn were 0.39 and0.25 μg m−3. Cr is an important solid waste pollutant (Boraiet al. 2002). Mn and Cr can be attributed to nearby industries.Mn along with Zn and Ni is emitted from ferrous and non-ferrous metal casting and chemical industries (Ragosta et al.2006) while Cr is emitted from chrome and Ni plating unitsand mechanical works like mining. Concentration of Cd wasfound minimum (0.07 μg m−3) during the study period.Vehicular emissions, automobile lubricants, wear and tear oftires, and construction activities are the possible sources of Cdin ambient air (Khillare and Sarkar 2012). Various productslike batteries and toys contain Cd and are more common inhousehold garbage. So the burning of this garbage in the studyarea may be a source of Cd. Previous study suggested that Cdwas found relatively enriched in Jharia street dust (Rout et al.2012), i.e., resuspension of street dust may account for thehigher concentra t ion of Cd in Jhar ia Coalf ie ld .Concentration of Ni was found to be 0.51 μg m−3 probablydue to its nearest position from the coal mines. Apart from themining activities, vehicular movements also contribute Ni inthe atmosphere. Si-Na particles could be the mixture of seasalt and mineral dust. Mineral particles have irregular shapes,and they are mainly derived from natural sources such as soil
dust, resuspension of dust from road, and some other anthro-pogenic activities such as mining and vehicles (Li et al. 2010).The mean concentration of Pb in PM10 at Lodhna Thana(A-12) was 0.19 μg m−3. Coal burning activities, mine fire,and wind-blown top soil may be the sources of Pb in studyarea (Tripathy et al. 2009). Additionally, the content of majorelements varies according to coal chemistry. The relativelyhigh contents of Al, Si, Fe, Cu, Na, and K indicate the char-acteristic composition and mineralogy of fly ash: aluminosil-icate glass (amorphous component) and high temperaturecrystalline phases such as mullite, quartz, and magnetite,which can be attributed to coal mine fire (Querol et al.1996). PAH analysis of PM10 sample using GC-MS showsthe PAH concentration of the study area to be 2.45±0.82 μg m−3. The concentrations of the heavy metals of thePM10 measured during the experiment were well below thepermissible limit of NAAQS standard 2009.
Anionic constituents Figure 6 shows the proportion of thesulfate, nitrate, phosphate, and chloride anions in PM10 sam-ples. Sulfate consisted of 71% of the total measured anions forPM10. The concentration of the main anions measured in thisstudy was 3.47±1.90, 0.55±0.14, 0.56±0.16, 0.16±0.01, and
Table 2 Average mass concentrations of PM10, carbonaceous species (OC, EC), OM, and TCA (μg m−3)
Location Period Number of samples (n) OC EC OC/EC OMa TCA TCA/PM10
Lodhna Thana (A-12) Oct. 2011 to June 2012 30 19.51 238.0 0.08 40.97 278.97 0.78
OC organic carbon, EC elemental carbon, OM organic matter, TCA total carbonaceous aerosol, PM particulate mattera Organic carbon (OC) to organic matter (OM) conversion factor of 2.1 was used to calculate the OM concentration
Fig. 7 FTIR spectra of PM10 in Lodhna Thana (A-12)
Air Qual Atmos Health

0.12±0.05 μg m−3 for the PM10-bound SO42−, NO3
−, Cl−,PO4
2−, and F−, respectively. Emission levels of SO42− concen-
tration were very high with respect to NO3−, PO4
2−, F−, andCl− indicating that the main source of particulate pollution iscoal burning and the emission is neither from vehicle nor fromnatural crude oil (Hystad et al. 2015). Absolute measuredvalues presented above reinforce the conclusion that the sam-pling site seems to be affected from the operation of the coalmines and coal mine fire, when one considers the ionic spe-cies only.
Carbonaceous species The carbonaceous species in PM10
samples consisted of 19.51±5.21 μg m−3 organic carbon(OC) and 238.0±17.52 μg m−3 elemental carbon (EC).Table 2 presents the average concentration of OC and ECalong with total carbonaceous aerosol (TCA) during the studyperiod. TCA was calculated by the sum of EC and organicmatter (OM). OM was estimated by multiplying the amountof OC by 1.6 (for urban) and 2.1 (for non-urban) (TCA=2.1×OC+EC) (Rengarajan et al. 2007). The mean OM concentra-tion was found to be 40.97 μg m−3, while an average of TCA
Table 3 Standard frequencies ofFTIR (Lambert et al. 1998) Functional groups/group wave number Vibrations/substitution Standard frequencies (cm−1)
O−H or N−H Silanol SiO−H Stretch 3200–3700
Methyl groups bonded to benzene Rings CH3 symmetric stretch 2925±5
CH3 bend overtone 2865±5
Alkynes C≡C stretch 2260–2190
Aldehyde Saturated C=O stretch 1730±10
Aromatic C=O stretch 1710–1685
Carboxylates Asymmetric CO2 stretch 1650–1540
Symmetric CO2 stretch 1450–1360
Sulfonate/sulfate Asymmetric SO2 stretch 1430–1330/1450–1350
Inorganic sulfates S−O stretch 1140–1080
Sulfoxide S=O stretch 1070–1030
Inorganic sulfates S−O stretch 1140–1080
Inorganic sulfates S−O bend 680–610
Phosphates PO4−3 stretch 1100–1000 (broad & strong)
Inorganic carbonates C−O stretch 1510–1410
Out of plane C−O 880–876
C−N(CH3)2 Stretch ~1505
Silica Si−O−Si asymmetric stretch 1200–1000
Inorganic phosphates PO4−3 bend 600–500
Silica Si−O−Si bend ~450
20 30 40 50
Cu2+2
O( SO4
)
FeS2
FeSO4
CuFeSO
4
CuSO4.CuO
ZnO
Ni3S4
S
FeS2
NiS2
FeS
Inte
nsity (
a. u.)
2 theta (degree)
Fig. 8 X-ray diffractogram of PM10 in Lodhna Thana (A-12)
Air Qual Atmos Health

was 278.97 μg m−3. This indicates that PM10 at sampling siteis augmented with carbonaceous species. Higher contributionof TCA may be attributed to greater emission sources of car-bonaceous aerosols like coal mines and coal mine fires. TheEC/OC ratios were also calculated which are used to under-stand the emission and conversion of carbonaceous species.An EC/OC ratio was found to be 12.19 for PM10 particles. Thehigh observed EC/OC ratio suggests high value of EC in studyarea that reflects the presence of high combustion process likecoal burning (coal mine fire) (Pipal and Satsangi 2015).
Spectral analysis Representative FTIR spectra of PM10 sam-ple is shown in Fig. 7. All the assigned bands and their refer-ences are listed in Table 3. Specific organic molecules couldnot be confirmed; however, organic functional groups likecarbonyls, and organic nitrates were assigned. Dominantpeaks of the frequency levels 1020, 1430–1455, 2360–2336,and 3448 cm−1 were observed in the samples. This frequencydata are reflecting the presence of S–O, CO2, SO2, C≡C, andSiO–H bond stretch. The sharp and prominent peaks wererecognized with the help of standard for silanol SiO–H stretchfrequency. Presence of S–O, CO2, SO2, and C≡C bondstretching clearly indicated the presence of mine fire nearbythe study area (Shaka and Saliba 2004). The selected sampleswere also analyzed through X-ray diffraction technique.Diffractrogram pattern was recorded at room temperatureand 2θ value with respect to intensity. X-ray diffractrogrampattern is shown in Fig. 8. Well-resolved X-ray peaks withtheir positions are given in Table 4. The presence of FeS2,CuO, and FeSO4 compounds were reflected by the X-raydiffractogram pattern of the study area (Senthilkumar 2014).There is a clear indication of effects of mine fire on particulateemission due to presence of SO4
2− and S2− ions (Berry 1974).
Implications on health
The results show that emissions from the mine fire in studyarea consists of PM10 about three to four times that of thepermissible limit under NAAQS, India. Physical characteriza-tion of particles shows that majority of it are very fine withhalf of it being smaller than 4 μm. Inhalation of these particlestherefore can lead to respiratory diseases as they can easilyenter the lungs through the respiratory system (Park et al.
2013; Lippmann 2012). Inhalation of particle with high car-bon content can lead to black lung disease (Janssen et al.2012). In order to protect the persons residing close to themine fire area who are inhaling these particles, they must berelocated from the mine fire area. The Bharat Coking CoalLimited (BCCL), a subsidiary of Coal India Limited, has al-ready prepared a master plan for rehabilitation of the familiesresiding in mine fire areas, although the execution of it isgoing very slow (BCCL 2008). While control of fire in coalseams is the most appropriate technical option, until the timethe fire in coal seams is contained, relocation of the mine-fire-affected families to a safer location should be given priority.
Conclusions
The characterization of PM10 from mine fire areas was one ofthe first systematic studies in the mine-fire-affected areas ofIndia. The chemical and morphological characteristics of PMwere analyzed to determine carbonaceous particle composi-tion and morphologies and to identify the possible sources ofPM10 emission. The results show that average PM10 concen-trations were 369.0, 338.0, and 357.0 μg m−3 during winter,summer, and post-monsoon season, respectively. Blisteringeffects on the surface of the particle and attachment ofsmall-sized particle to big-sized particle suggested that thePM was generated from mine fire (Yousefli 2011).Elemental analysis of PM showing Si-Al oxides of spheroidalmorphology also indicated the coal mine fire as a possiblesource. Evidence of S–O, CO2, SO2, and C≡C bondstretching obtained from the spectral analysis also indicatedmine fire as a possible source of PM10. PM10 X-raydiffractogram suggests that PM10 in Lodhna area consistedof PM generated due to mine fire. Abundance of EC, as ob-served from high EC/OC ratio (12.19), suggested the PMorigin to be from burning process, i.e., mine fire. The personsresiding near the mine fire area should be relocated so thatthey are not exposed to the enhanced PM10 concentration.
Acknowledgments The authors would like to express their specialgratitude to Indian School of Mines, Dhanbad (India), for providing allnecessary facilities and conducting field work required for this work.
References
APHA (1977) Standard methods for the examination of water and waste-water. American Public Health Association
Berry IG (1974) Selected powder diffraction data for mineralogy, jointcommittee on powder diffraction standards, & American society fortesting and materials. Swanthmore, Pennsylvaina
Bharat Coking Coal limited (BCCL): Master Plan for dealing with fire,subsidence and rehabilitation in the leasehold of BCCL. CentralMine Planning & Design Institute Ltd Regional Institute – 2Dhanbad (2008). Accessed 25 February 2015
Table 4 Well-resolved X-ray peaks with their positions for differentmonitoring stations
Code Station Compound/minerals Intensity (I) 2θ (in °)
A-12 Lodna Thana S 560 30°
FeS2 510 29°
FeSO4 500 45°
CuSO4 455 38°
Air Qual Atmos Health
Borai EH, El-Sofany EA, Abdel-Halim AS (2002) Speciation ofhexavalent Chromium in atmospheric particulate samples by selec-tive extraction and ion chromatographic determination. Trends AnalChem 21:741–745
Cole CF, Zapert JG (1995) Air Quality Dispersion Model Validation atThree Stone Quarries. National Stone Association, Washington,D.C. 14884
CPCB (2009) National Ambient Air Quality Standards (NAAQS).Central Pollution Control Board, India
Das BK, Mandal SM, Bhattacharya J (2012) Understanding of the bio-chemical events in a chemo-bioreactor during continuous acid minedrainage treatment. Environ Earth Sci 66:607–614
Gautam S, Patra AK (2015) Dispersion of particulate matter generated athigher depths in opencast mines. Environ Techol Innov 3:11–27
Ghose MK, Majee SR (2007) Characteristics of hazardous airborne dustaround an indian surface coal mining area. Environ Monit Assess130:17–25
Hystad P, Paul JV, Mark SG, Crouse DL, Johnson K (2015) CanadianCancer Registries Epidemiology Research Group: Exposure totraffic-related air pollution and the risk of developing breast canceramong women in eight Canadian provinces: a case–control study.Environ Int 74:240–248
Janssen NA, Gerlofs-Nijland ME, Lanki T, Salonen RO, Cassee F, HoekG, Fischer P, Brunekreef B, Krzyzanowski M (2012) Health effectsof black carbon. World Health Organization, Copenhagen
Jones T, Blackmore P, Leach M, Berube K, Sexton K, Richards R (2002)Characterisation of airborne particles collected within and proximalto an opencast coalmine: South Wales, U.K. Environ. Monit Assess75:293–312
Khillare PS, Sarkar S (2012) Airborne inhalable metals in residentialareas of Delhi, India: distribution, source apportionment and healthrisks. Atmos Pollut Res 3:46–54
Kocbach A, Johansen BV, Schwartz PE, Namork E (2005) Analyticalelectron microscopy of combustion particles: a comparison of vehi-cle exhaust and wood smoke. Sci Tot Environ 346:231–243
Li W, Shao L, Wang Z, Shen R, Yang S, Tang U (2010) Size, composi-tion, and mixing state of individual aerosol particles in a south Chinacoastal city. J Environ Sci 22(4):561–569
Li-ding C (1999) Environmental problems in a coal mining area affectedby coal fires –A case study in Ruqigou Coalfield, Ningxia, China. JEnviron Sci 11(1):23–32
Lippmann M (2012) Particulate matter (PM) air pollution and health:regulatory and policy implications. Air Qual Atmos Health 5:237–241
Martinelli N, Olivieri O, Girelli D (2013) Air particulate matter and car-diovascular disease: a narrative review. Eur J Intern Med 24(4):295–302
Pachauri T, Singla V, Satsangi A, Lakhani A, MaharajKumari K (2013)SEM-EDX Characterization of Individual Coarse Particles in Agra,India. Aerosol Air Qual Res 13(2):523–536
Pandey B, Agrawal M, Singh S (2014) Assessment of air pollutionaround coal mining area: emphasizing on spatial distributions, sea-sonal variations and heavy metals, using cluster and principal com-ponent analysis. Atmos Pollut Res 5:79–86
Park M, Luo S, Kwon J, Stock TH, Delclos G, Kim H, Yun-Chul H(2013) Effects of air pollution on asthma hospitalization rates indifferent age groups in metropolitan cities of Korea. Air QualAtmos Health 6:543–551
Pipal AS, Satsangi GP (2015) Study of carbonaceous species, morphol-ogy and sources of fine (PM2.5) and coarse (PM10) particles alongwith their climatic nature in India. Atmos Res 154:103–115
Pipal AS, Kulshrestha A, Taneja A (2011) Characterization and morpho-logical analysis of airborne PM2.5 and PM10 in Agra located inNorth Central India. Atmos Environ 45:3621–3630
Pipal AS, Jan R, Satsangi PG, Tiwari S, Taneja A (2014) Study of surfacemorphology, elemental composition and origin of atmospheric aero-sols (PM2.5 and PM10) over Agra, India. Aerosol Air Qual Res 14:1685–1700
Pitts BJF, Pitts Jr. JN (2000) Chemistry of the Upper and LowerAtmosphere. In: Finlayson-Pitts BJ, Pitts JN (eds) AcademicPress, San Diego. ISBN 9780122570605, http://dx.doi.org/10.1016/B978-012257060-5/50000-9
Prabha J, Singh G, Sinha IN (2006) Emission factor equation for haulroads: the Indian perspective. Ind J Air Pollut Control 1:37–43
Querol X, Alastuey A, Lopez-Soler A, Mantilla E, Plana F (1996)Mineralogy of atmospheric particles around a large coal- fire powerstation. Atmos Environ 30:3557–3571
Ragosta M, Caggiano R, D’Emilio M, Sabia S, Trippetta S, Macchiato M(2006) PM10 and heavy metal measurements in an industrial area ofsouthern Italy. Atmos Res 81:304–319
Rengarajan R, Sarin MM, Sudheer AK (2007) Carbonaceous and inor-ganic species in atmospheric aerosols during wintertime over urbanand high-altitude sites in North India. J GeophysRes 112, D21307.doi:10.1029/2006JD008150
Rout TK, Masto RE, Ram LC (2012) Assessment of human health risksfrom heavy metals in outdoor dust samples in a coal mining area.Environ Geochem Health. doi:10.1007/s10653-012-9499-2
Senthilkumar R (2014) Characterization ofminerals in air dust particles inthe state of Tamilnadu, India through FTIR, XRD and SEManalysis.Infrared Phys Technol 67:30–41
Shaka H, Saliba NA (2004) Concentration measurements and chemicalcomposition of p M10–2.5 and PM2.5 at a coastal site in Beirut,Lebanon. Atmos Environ 38:523–531
Sinha S, Roy D, Singh G (2012) Assessment and impact of air pollutionin Patherdih Coal Washery, Jharia coalfield, Eastern India. Ind MinEng 53(1):22–30
Tripathy DP, Panigrahi DC, Singh G (2009) Determination of soil pollu-tion index and soil infiltration rates in some non-fire and fire areas ofJharia coalfield.IXth International mine ventilation congress NewDelhi, India 10–13
Tsiouri V, Kakosimos KE, Kumar P (2015) Concentrations, sources andexposure risks associated with particulate matter in the Middle EastArea—a review. Air QualAtmos Health 8:67–80
World Health Organization (WHO) (2005) WHO Air Quality GuidelinesGlobal Update, World Health Organization, Geneva, 496 http://www.euro.who.int/__data/assets/pdf_file/0005/78638/E90038.pdf.Accessed 24 Feb 2015
Xie RK, Seip HM, Leinum JR, Winje T, Xiao JS (2004) Chemical char-acterization of individual particles (PM10) from ambient air inGuiyang city, China. Sci Total Environ 343:261–272
Yousefli S (2011) Analyzing the causes of blistering in sintered iron parts:a case study in the Iran powder metallurgy complex. Powder MetallProgress 1:149–152
Zhang X, Chen W, Ma C, Zhan S (2013) Modeling particulate matteremissions during mineral loading process under weak wind simula-tion. Sci Tot Environ 449:168–173
Air Qual Atmos Health