Carbon Xerogel Catalyst for NO Oxidation
19
Catalysts 2012, 2, 447-465; doi:10.3390/catal2040447 catalysts ISSN 2073-4344 www.mdpi.com/journal/catalysts Article Carbon Xerogel Catalyst for NO Oxidation Juliana P. S. Sousa, Manuel F. R. Pereira and José L. Figueiredo * Laboratory of Catalysis and Materials (LCM), Associate Laboratory LSRE/LCM, Chemical Engineering Department, Faculty of Engineering, University of Porto,4200-465 Porto, Portugal; E-Mails: [email protected] (J.P.S.S.); [email protected] (M.F.R.P.) * Author to whom correspondence should be addressed; E-Mail: [email protected]. Received: 20 July 2012; in revised form: 28 September 2012 / Accepted: 9 October 2012 / Published: 17 October 2012 Abstract: Carbon xerogels were prepared by the polycondensation of resorcinol and formaldehyde using three different solution pH values and the gels were carbonized at three different temperatures. Results show that it is possible to tailor the pore texture of carbon xerogels by adjusting the pH of the initial solution and the carbonization temperature. Materials with different textural properties were obtained and used as catalysts for NO oxidation at room temperature. The NO conversions obtained with carbon xerogels were quite high, showing that carbon xerogels are efficient catalysts for NO oxidation. A maximum of 98% conversion for NO was obtained at initial concentration of NO of 1000 ppm and 10% of O 2 . The highest NO conversions were obtained with the samples presenting the highest surface areas. The temperature of reaction has a strong influence on NO oxidation: the conversion of NO decreases with the increase of reaction temperature. Keywords: carbon xerogels; textural properties; surface chemistry; NO oxidation; catalytic activity 1. Introduction The emission of nitrogen oxides in fuel combustion from stationary sources—primarily from power stations, industrial heaters and cogeneration plants [1]—represents a major environmental problem. NOx is blamed for the formation of ozone in the troposphere [2], the production of acid rains and respiratory problems to mankind [3–5]. Combustion modification and selective catalytic reduction (SCR) methods are probably the most widely used techniques for the control of NOx emissions [1,6]. Increasingly stricter environmental OPEN ACCESS
-
Upload
independent -
Category
Documents
-
view
1 -
download
0
Transcript of Carbon Xerogel Catalyst for NO Oxidation

Catalysts 2012, 2, 447-465; doi:10.3390/catal2040447
catalysts ISSN 2073-4344
www.mdpi.com/journal/catalysts Article
Carbon Xerogel Catalyst for NO Oxidation
Juliana P. S. Sousa, Manuel F. R. Pereira and José L. Figueiredo *
Laboratory of Catalysis and Materials (LCM), Associate Laboratory LSRE/LCM, Chemical
Engineering Department, Faculty of Engineering, University of Porto,4200-465 Porto, Portugal;
E-Mails: [email protected] (J.P.S.S.); [email protected] (M.F.R.P.)
* Author to whom correspondence should be addressed; E-Mail: [email protected].
Received: 20 July 2012; in revised form: 28 September 2012 / Accepted: 9 October 2012 / Published: 17 October 2012
Abstract: Carbon xerogels were prepared by the polycondensation of resorcinol and
formaldehyde using three different solution pH values and the gels were carbonized at
three different temperatures. Results show that it is possible to tailor the pore texture of
carbon xerogels by adjusting the pH of the initial solution and the carbonization
temperature. Materials with different textural properties were obtained and used as
catalysts for NO oxidation at room temperature. The NO conversions obtained with carbon
xerogels were quite high, showing that carbon xerogels are efficient catalysts for NO
oxidation. A maximum of 98% conversion for NO was obtained at initial concentration of
NO of 1000 ppm and 10% of O2. The highest NO conversions were obtained with the samples
presenting the highest surface areas. The temperature of reaction has a strong influence on NO
oxidation: the conversion of NO decreases with the increase of reaction temperature.
Keywords: carbon xerogels; textural properties; surface chemistry; NO oxidation;
catalytic activity
1. Introduction
The emission of nitrogen oxides in fuel combustion from stationary sources—primarily from power
stations, industrial heaters and cogeneration plants [1]—represents a major environmental problem.
NOx is blamed for the formation of ozone in the troposphere [2], the production of acid rains and
respiratory problems to mankind [3–5].
Combustion modification and selective catalytic reduction (SCR) methods are probably the most
widely used techniques for the control of NOx emissions [1,6]. Increasingly stricter environmental
OPEN ACCESS
Catalysts 2012, 2 448
regulations concerning the emission of nitrogen oxides (NOx) have forced the development of more
efficient technologies to reduce the discharge of this pollutant by industrial facilities.
NO oxidation into NO2 attracts some interest because it can function in air at room temperature and
the NO2 produced is captured by water as nitric acid. Activated carbons and activated carbon fibers
have been recognized as effective catalysts for this reaction [7–12] as well as for SO2 oxidation and
NO-NH3 reaction [13]. However, carbon materials in the form of monoliths or membranes are required
for more advanced applications. This has led to a growing interest in polymer derived porous carbons,
such as carbon xerogels [14].
Carbon xerogels possess excellent characteristics such as high surface area (400–1200 m2 g−1), high
porosity, controllable pore size, high density (0.6–0.8 g cm−3), high conductivity and can be prepared
in the desired form (monoliths, thin film or powder) [15–17].
The textural and structural properties of carbon xerogels can be controlled according to the
synthesis and processing conditions (e.g., pH of preparation, drying conditions and carbonization
temperature); thus, the main advantage of carbon xerogels is the possibility for tailoring their
properties to fit specific applications [18–23]. For this reason, carbon xerogels are used in a wide range
of applications, including catalysis [24,25], adsorption [26,27] and energy storage [28–30].
In the present work, carbon xerogels were synthesized by the conventional sol-gel approach using
formaldehyde and resorcinol at three different pH values and were carbonized at three different
temperatures, leading to carbon xerogels with different textural properties.
The carbon materials prepared were subjected to subsequent oxidation treatments (oxidation in gas
phase with 5% of oxygen and oxidation in liquid phase with nitric acid) and a treatment with nitrogen
precursor (urea). The influence of the textural and chemical properties of carbon xerogels on NO
removal efficiency will be evaluated.
2. Experimental Section
2.1. Preparation of Carbon Xerogels
Carbon xerogels were prepared as follows: 40 mL of distilled water were added to 25 g of
resorcinol under stirring. When the resorcinol was dissolved, a few drops of NaOH 2 M were added in
order to bring the pH to 5.3, 6.0 and 6.9. Then, 34 mL of formaldehyde were added under stirring and
the pH was adjusted to 5.3, 6.0 and 6.9 by adding a few drops of HCl 0.1 M. The gelation was
accomplished in a water bath at 85 °C for three days. The gel was crushed and dried in an oven during
4 days (1st day at 60 °C, 2nd day at 80 °C, 3rd day at 100 °C and 4th day at 120 °C). The dried gel was
carbonized under nitrogen flow (100 cm3 min−1) at 500 °C (700 °C and 900 °C) in a tubular furnace.
The carbonization protocol comprised the following sequential steps, all at the same heating rate of
2 °C min−1: (1) up to 200 °C and hold for 2 h; (2) up to 300 °C and hold for 1 h; (3) up to 500 °C
(700 °C and 900 °C) and hold for 2 h [21]. The materials prepared were designated as CX followed by
the respective pH and carbonization temperature.
Catalysts 2012, 2 449
2.2. Chemical Modification of Carbon Xerogels
The treatments outlined below were carried out in order to obtain materials with different surface
chemistries. All these treatments were performed on the carbon xerogels that presented the highest
surface area in each range of pH.
2.2.1. Oxidation in Liquid Phase with HNO3 5 M
The oxidation with nitric acid was performed using a Soxhlet extraction apparatus. Thus, 200 cm3
of 5 M nitric acid solution was introduced into a 250 cm3 Pyrex round-bottom flask and heated to
boiling temperature with a heating mantle. The Soxhlet (250 cm3) with 2 g of carbon xerogels was
connected to boiling temperature flask and to the condenser. The reflux was stopped after 6 h. The
sample was washed with distilled water to neutral pH and dried in an air convection oven at 110 °C for
24 h. These materials were designated as CX followed by the respective pH, carbonization temperature
and HNO3.
2.2.2. Oxidation in Gas Phase with 5% O2
About 3 g of sample was placed in the oven and heated at 10 °C min−1 until 500 °C, passing only a
N2 flow (75 cm3 min−1). When this temperature was reached, 25 cm3 min−1 of air was added. After
3 h the sample was cooled down in an inert atmosphere. These materials were designated as CX
followed by the respective pH, carbonization temperature and O2.
2.2.3. Treatment with Urea
A 2 g of sample was impregnated with urea solution (1M) by stirring it for 24 h. Then it was heated
in nitrogen flow by raising the temperature at 10 °C min−1 to 600 °C for 1 h. The samples obtained by
this treatment were designated as CX followed by the respective pH, carbonization temperature and U.
2.3. Catalyst Characterization
2.3.1. Textural Characterization
The textural characterization of the samples was based on the nitrogen adsorption isotherms at
−196 °C, which were determined using a Quantachorome Nova 4200e instrument. The specific volume
of micropores (Vmicro) and the specific area of mesopores (Smeso) were calculated by the t-method, using
the appropriate standard isotherm. The specific surface area of carbon xerogels was calculated by the
BET method (SBET).
2.3.2. Chemical Characterization
Temperature programmed desorption (TPD) was performed in an AMI-200 Catalyst
Characterization Instrument (Altamira Instruments), equipped with a quadrupole mass spectrometer
(Dymaxion, Ametek). The catalyst sample was placed in a U-shaped quartz tube inside an electrical

Catalysts 2012, 2 450
furnace and heated at 5 °C min−1 up to 1100 °C using a constant flow rate of helium (25 cm3 min−1).
The masses monitored for all samples were: 2 (H2), 18 (H2O), 28 (CO) and 44 (CO2) [31].
To determine the point of zero charge of the samples (pHpzc), 20 cm3 of NaCl 0.01 M were placed
in closed vessels and the pH was adjusted to values between 2 and 12, by adding 0.1 M solutions of
NaOH or HCl. Then, 0.05 g of sample was added to each vessel. The suspensions were kept under
stirring at room temperature for 48 h and then the final pH was recorded. The pHpzc of each sample
was determined by the intersection of the curve pHfinal vs pHinitial with the line pHfinal = pHinitial. Blank
experiments were carried out, and the pHinitial used in each case was that corresponding to the pHfinal of
the blank test [32].
The chemical composition (C, H, N, S and O) of the carbon xerogels was analysed using an EA
1108 Elemental Analyser (Carlo Erba instruments).
Thermal analysis (TG) was performed on the xerogel samples in order to obtain information about
the loss of water and carbonaceous residues involved in the carbonization step. Thermal analyses were
done in a Netzsch STA 409 PC Luxx instrument.
2.4. Oxidation of NO
Reaction of NO with O2 on carbon xerogels was carried out in a fixed bed U-shaped flow type
reactor. The sample weight, catalyst size, the flow rate, the O2 concentration, the NO concentration in
He and the reaction temperature were 0.2 g, 0.2–0.3 mm, 100 cm3 min−1, 2–20%, 1000 ppm and
25–150 °C, respectively.
The concentrations of NO and NO2 at the outlet of the reactor were measured continuously by a
NOx analyser (Model 42i-HL Thermo Scientific).
3. Results and Discussion
3.1. Catalyst Characterization
3.1.1. Textural Characterization
Figure 1 shows the nitrogen adsorption isotherms of carbon xerogels. It is noticeable that the textural
properties of carbon xerogels were affected by the synthesis pH and by the carbonization temperature.
The isotherms are typical of materials with micro and mesoporosity, except in the case of xerogels
synthesized at pH = 6.9, which show very little or no microporosity. When the pH is high,
polymerization is retarded and the formation of a cross-linked network is prevented [33,34], leading to
a weak pore structure that cannot withstand carbonization at the higher temperatures (700 and 900 °C),
resulting in the collapse of the nanostructure.
The isotherms of the materials prepared at pH = 5.3, independently of the carbonization temperature,
exhibit a large increase in the amount of nitrogen adsorbed at relative pressures above 0.9, indicating
the presence of very large pores.
Table 1 collects the textural properties of the materials prepared.

Catalysts 2012, 2 451
Figure 1. Nitrogen adsorption isotherms at −196 °C of carbon xerogels prepared at
different pHs (5.3, 6.0 and 6.9) and carbonized at different temperatures (500 °C, 700 °C
and 900 °C).

Catalysts 2012, 2 452
Table 1. Textural properties of carbon xerogels.
Sample SBET [m2 g-1] Vmicro [cm3 g-1] Smeso [m
2 g-1]
CX-5.3-500 °C 583 0.14 230
CX-5.3-700 °C 707 0.20 226
CX-5.3-700 °C-HNO3 634 0.18 184
CX-5.3-700 °C-O2 628 0.23 136
CX-5.3-700 °C-U 714 0.19 266
CX-5.3-900 °C 661 0.19 189
CX-6-500 °C 367 0.07 156
CX-6-700 °C 625 0.19 167
CX-6-700 °C-HNO3 677 0.17 277
CX-6-700 °C-O2 1049 0.29 342
CX-6-700 °C-U 708 0.19 246
CX-6-900 °C 567 0.07 380
CX-6.9-500 °C 486 0.10 174
CX-6.9-500°C-HNO3 641 0.05 514
CX-6.9-500 °C-O2 618 0.08 236
CX-6.9-500 °C-U 526 0.10 200
CX-6.9-700 °C 149 0.01 110
CX-6.9-900 °C 87 0 87
In the case of carbon xerogels prepared at pH = 5.3 and pH = 6.0, the maximum BET surface area
and micropore volume correspond to the materials carbonized at 700 °C. The largest mesopore surface
area corresponds to sample CX-6-900 °C.
These results confirm that it is possible to control the texture of the carbon xerogels by adjusting the
pH of the initial solution and the carbonization temperature.
The effect of pH on the surface area and micropore volume of carbon xerogels carbonized at 700 °C
is shown in Figure 2.
Figure 2. Effect of the initial pH of the solution of resorcinol and formaldehyde on the
surface area and micropore volume of the xerogels carbonized at 700 °C.
5 6 7100
200
300
400
500
600
700
800
pH
SB
ET
[m2 g
-1]
0.00
0.05
0.10
0.15
0.20
Vm
icro [cm3 g
-1]

Catalysts 2012, 2 453
It is clear that the micropore volume and the surface area of carbon xerogels are very low at high
pH. When the pH decreases from 6.9 to 6.0, there is a large increase of micropore volume and surface
area. With further decrease to pH = 5.3, there is not much change in the textural properties.
The effect of pH on the porosity of carbon xerogels can be explained by the polymerization
mechanism between resorcinol and formaldehyde, as described in the literature [34].
The subsequent treatments performed on the carbon xerogels were intended to modify their surface
chemical properties, but additional changes in the textural properties also occur [31]. In general, the
BET surface area increases upon treatment with nitric acid and with oxygen in the gas phase. The
development of the porosity of the materials probably occurs by the widening of existing pores and/or
creation of new pores by selective gasification of structural components, or by the opening of some of
the previously inaccessible pores.
3.1.2. Thermal Analysis (TG)
Figure 3 shows the TG curves for the organic xerogels (RF) synthesized at different pHs. All the
TG curves have a common behavior; the different initial pH values do not lead to any major difference.
Two peaks of mass loss were detected during the carbonization process: one at 200 °C and another
at 300 °C. The first peak probably corresponds to the extraction of the remaining solvent and/or the
elimination of H2O formed by the condensation of –OH groups [34]. The second peak is observed
when the remaining hydrogen and oxygen atoms included in the polymer network are eliminated as
CO2, CH4 or other organic molecules [34].
Figure 3. Thermal Analysis (TG) curves of organic xerogels.

Catalysts 2012, 2 454
3.1.3. Elemental Analysis
The results of elemental analysis of the original and modified carbon xerogels are shown in Table 2.
Table 2. Elemental analysis of the original and modified carbon xerogels.
Sample N [wt.%] C [wt.%] H [wt.%] O [wt.%]
CX-5.3-500 °C - 79.9 2.5 17.6
CX-5.3-700 °C - 92.4 1.1 6.5
CX-5.3-700 °C-HNO3 0.3 89.5 1.2 9.0
CX-5.3-700 °C-O2 - 90.8 1.3 7.9
CX-5.3-700 °C-U 0.4 94.5 1.6 3.5
CX-5.3-900 °C - 95.0 0.4 4.6
CX-6-500 °C - 83.9 3.1 13.0
CX-6-700 °C - 90.2 2.8 7.0
CX-6-700 °C-HNO3 0.4 87.2 0.4 12.0
CX-6-700 °C-O2 - 82.7 1.3 16.0
CX-6-700 °C-U 0.7 91.2 0.3 7.8
CX-6-900 °C - 94.9 0.5 4.6
CX-6.9-500 °C - 82.6 2.4 15.0
CX-6.9-500 °C-HNO3 0.2 80.9 0.9 18.0
CX-6.9-500 °C-O2 - 77.7 3.3 19.0
CX-6.9-500 °C-U 0.3 89.6 1.5 8.6
CX-6.9-700 °C - 98.5 1.4 0.10
CX-6.9-900 °C - 98.9 1.0 0.10
The process of pyrolysis, development of the surface area and generation of new pores, leads to an
increase in the content of carbon, and a significant decrease in the content of hydrogen and oxygen.
The oxidative treatments with nitric acid in liquid phase and with 5% of oxygen in gas phase
introduce a large amount of oxygen groups on the surface of carbon xerogels. For example, sample
CX-6-700°C has 7% of oxygen and after the treatment in the gas phase presents 16% of oxygen.
The treatment with nitric acid, in addition to introducing large amounts of oxygen groups in the
carbon xerogels, also introduces some nitrogen groups. Larger amounts of nitrogen groups are
introduced by the treatment with urea. The incorporation of nitrogen from urea occurs by
derivatization, predominantly of the carboxylic oxygen species, and in general leads to a decrease of
the oxygen content.
3.1.4. TPD and pHpzc
The total amount of the various oxygen surface groups present on the carbon xerogels (carboxylic
acids, carboxylic anhydrides, lactones, phenols and carbonyls or quinones) can be determined by the
TPD spectra, since these groups are decomposed into CO and/or CO2 upon heating.
The total amounts of CO and CO2 released are presented in Table 3.
The ratio of CO/CO2 released, included in Table 3, can be regarded as a measure of the surface
acidity and basicity. Low values of the ratio correspond to strong surface acidity while high values of

Catalysts 2012, 2 455
this parameter correspond to strong surface basicity [31]. The samples treated with HNO3 show the
lowest CO/CO2 ratio, indicating that the surface chemistry of these samples is acidic in character, since
this treatment introduces large amounts of acid groups (carboxylic acids) onto the surface of carbon
materials. This result is consistent with the lowest values of pHpzc exhibited by these samples.
All the other materials showed neutral or basic properties (pHpzc ~ 6.9–8.1) independently of the pH
used in their preparation.
The carbon xerogels carbonized at 500 °C present large amounts of surface oxygenated groups,
which are partially explained by the relatively low temperature used during their preparation. Most of
the CO and CO2 released above 500 °C is still the result of the xerogel matrix carbonization. The
amount of oxygen-containing surface groups decreases as the carbonization temperature increases.
Table 3. Amounts of CO and CO2 obtained from the TPD spectra and pHpzc values of carbon xerogels.
Sample pHpzc CO [μmol g-1] CO2 [μmol g-1] CO/CO2
CX-5.3-500 °C 7.0 2989.2 548.4 5.5
CX-5.3-700 °C 7.6 865.3 550.8 1.6
CX-5.3-700 °C-HNO3 6.2 907.6 1714.4 0.5
CX-5.3-700 °C-O2 7.1 3178.7 317.5 10.0
CX-5.3-700 °C-U 7.6 1003.6 122.6 8.2
CX-5.3-900°C 8.1 231.6 464.4 0.5
CX-6-500 °C 6.9 1137.6 912.0 1.2
CX-6-700 °C 6.9 614.4 446.4 1.4
CX-6-700 °C-HNO3 6.2 1640.4 3465.6 0.5
CX-6-700 °C-O2 7.2 2944.6 805.0 3.7
CX-6-700 °C-U 7.5 1843.2 653.5 2.8
CX-6-900 °C 6.9 583.2 184.3 3.2
CX-6.9-500 °C 7.0 1226.0 444.0 2.8
CX-6.9-500 °C-HNO3 6.5 1353.6 5373.9 0.3
CX-6.9-500 °C-O2 7.5 1482.0 376.2 3.9
CX-6.9-500 °C-U 7.5 1791.3 482.3 3.7
CX-6.9-700 °C 7.3 855.8 421.3 2.0
CX-6.9-900 °C 7.3 720.6 311.5 2.3
In general, the samples treated with urea have higher values of pHpzc than the samples treated with
oxygen. This is due to the introduction of nitrogen groups, which increase the basicity of the carbon
materials, namely pyridine and pyrrole groups which are Lewis bases.
3.2. Catalytic Tests
3.2.1. Influence of O2 Concentration on NO Oxidation
Figure 4 shows the influence of O2 concentration on NO conversion at 25 °C.
Catalysts 2012, 2 456
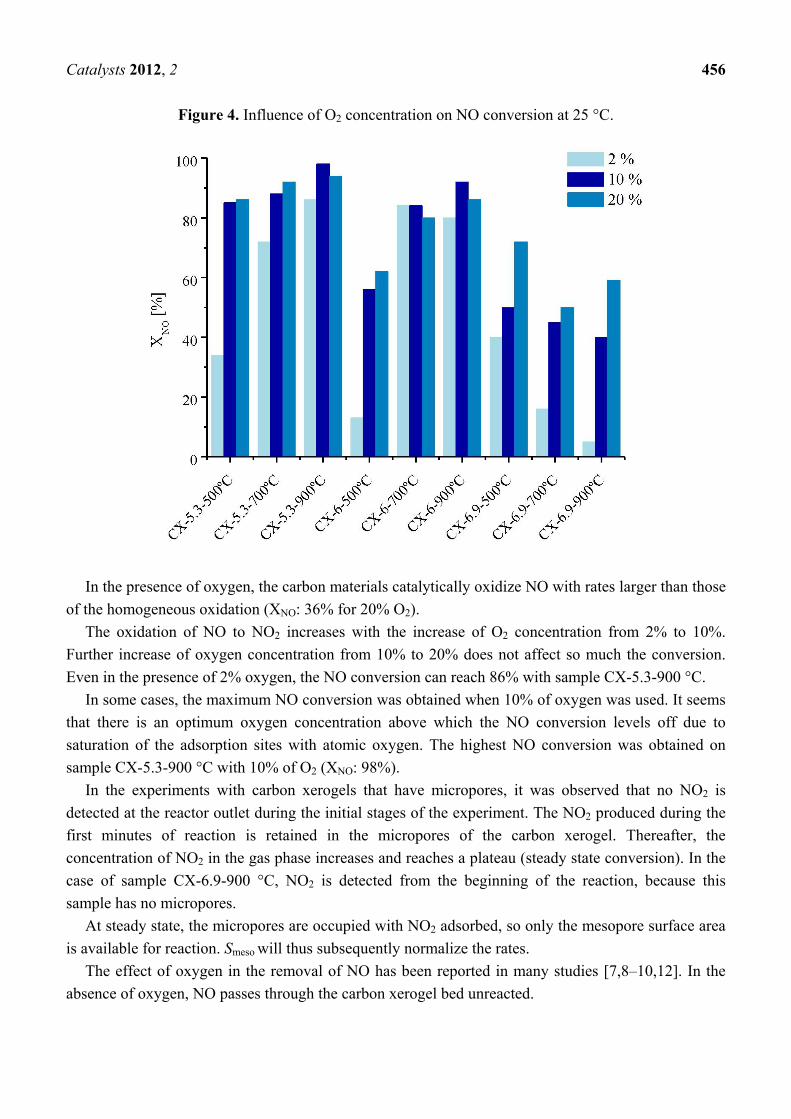
Figure 4. Influence of O2 concentration on NO conversion at 25 °C.
In the presence of oxygen, the carbon materials catalytically oxidize NO with rates larger than those
of the homogeneous oxidation (XNO: 36% for 20% O2).
The oxidation of NO to NO2 increases with the increase of O2 concentration from 2% to 10%.
Further increase of oxygen concentration from 10% to 20% does not affect so much the conversion.
Even in the presence of 2% oxygen, the NO conversion can reach 86% with sample CX-5.3-900 °C.
In some cases, the maximum NO conversion was obtained when 10% of oxygen was used. It seems
that there is an optimum oxygen concentration above which the NO conversion levels off due to
saturation of the adsorption sites with atomic oxygen. The highest NO conversion was obtained on
sample CX-5.3-900 °C with 10% of O2 (XNO: 98%).
In the experiments with carbon xerogels that have micropores, it was observed that no NO2 is
detected at the reactor outlet during the initial stages of the experiment. The NO2 produced during the
first minutes of reaction is retained in the micropores of the carbon xerogel. Thereafter, the
concentration of NO2 in the gas phase increases and reaches a plateau (steady state conversion). In the
case of sample CX-6.9-900 °C, NO2 is detected from the beginning of the reaction, because this
sample has no micropores.
At steady state, the micropores are occupied with NO2 adsorbed, so only the mesopore surface area
is available for reaction. Smeso will thus subsequently normalize the rates.
The effect of oxygen in the removal of NO has been reported in many studies [7,8–10,12]. In the
absence of oxygen, NO passes through the carbon xerogel bed unreacted.
Catalysts 2012, 2 457
There is virtually no NO adsorption when oxygen is absent, indicating that oxygen is needed for the
process. These observations suggest that NO2, rather than NO, is the adsorbed molecule, possibly
because of its higher polarity.
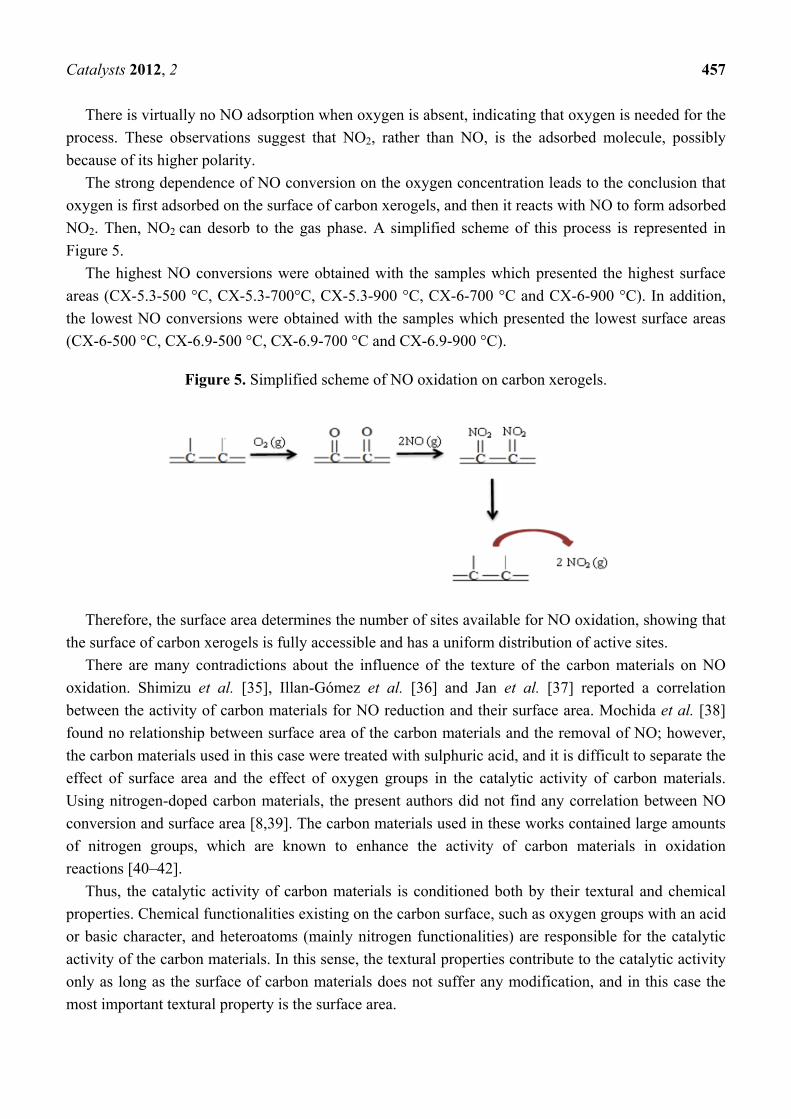
The strong dependence of NO conversion on the oxygen concentration leads to the conclusion that
oxygen is first adsorbed on the surface of carbon xerogels, and then it reacts with NO to form adsorbed
NO2. Then, NO2 can desorb to the gas phase. A simplified scheme of this process is represented in
Figure 5. The highest NO conversions were obtained with the samples which presented the highest surface
areas (CX-5.3-500 °C, CX-5.3-700°C, CX-5.3-900 °C, CX-6-700 °C and CX-6-900 °C). In addition,
the lowest NO conversions were obtained with the samples which presented the lowest surface areas
(CX-6-500 °C, CX-6.9-500 °C, CX-6.9-700 °C and CX-6.9-900 °C).
Figure 5. Simplified scheme of NO oxidation on carbon xerogels.
Therefore, the surface area determines the number of sites available for NO oxidation, showing that
the surface of carbon xerogels is fully accessible and has a uniform distribution of active sites.
There are many contradictions about the influence of the texture of the carbon materials on NO
oxidation. Shimizu et al. [35], Illan-Gómez et al. [36] and Jan et al. [37] reported a correlation
between the activity of carbon materials for NO reduction and their surface area. Mochida et al. [38]
found no relationship between surface area of the carbon materials and the removal of NO; however,
the carbon materials used in this case were treated with sulphuric acid, and it is difficult to separate the
effect of surface area and the effect of oxygen groups in the catalytic activity of carbon materials.
Using nitrogen-doped carbon materials, the present authors did not find any correlation between NO
conversion and surface area [8,39]. The carbon materials used in these works contained large amounts
of nitrogen groups, which are known to enhance the activity of carbon materials in oxidation
reactions [40–42].
Thus, the catalytic activity of carbon materials is conditioned both by their textural and chemical
properties. Chemical functionalities existing on the carbon surface, such as oxygen groups with an acid
or basic character, and heteroatoms (mainly nitrogen functionalities) are responsible for the catalytic
activity of the carbon materials. In this sense, the textural properties contribute to the catalytic activity
only as long as the surface of carbon materials does not suffer any modification, and in this case the
most important textural property is the surface area.

Catalysts 2012, 2 458
Therefore, the surface area of the carbon xerogels is a key factor in determining their activity for
NO oxidation.
3.2.2. Influence of Surface Chemistry of the Carbon Xerogels on NO Oxidation
In each range of pH, the carbon xerogels that presented the highest surface area were subjected to
three different treatments (oxidation with 5% of oxygen in gas phase, oxidation with nitric acid 5 M in
liquid phase and treatment with a 1 M urea solution at room temperature).
In the previous section, it was noted that the increase of oxygen concentration in the gas phase
increases NO conversion. The treatments with nitric acid in liquid phase and with oxygen in gas phase
were intended to introduce oxygen groups on the surface of the carbon xerogels and to evaluate their
effect on the catalytic activity for NO oxidation. The oxygen groups introduced by these treatments are
different. The treatment with nitric acid introduces mainly carboxylic acid groups, while the treatment
with oxygen in gas phase introduces mainly phenol and carbonyl/quinone surface groups.
The role of nitrogen in catalysis is usually linked to its basicity and ability to activate oxygen via
formation of O2− superoxide, which has tremendous effects on oxidation reactions [40–42].
This section is also intended to evaluate the effect of nitrogen groups introduced by post-treatment
and to compare with N-doped carbon xerogels (where nitrogen is incorporated during the
synthesis) [39]. Treatment with a urea solution at room temperature was performed in order to
introduce nitrogen groups on the surface of the carbon xerogels. According to the literature [42–44],
such treatment should introduce amide groups on the surface. Upon heating to 600 °C, these are
converted into more stable nitrogen groups, such as pyridine and pyrrole [45].
The NO conversions obtained with the original materials and with the materials chemically
modified are shown in Table 4.
Table 4. NO conversion with the original and modified carbon xerogels. NO: 1000 ppm,
O2: 20% and Temp: 25 °C.
Treatments
Original -HNO3 -U -O2
Sample XNO [%]
CX-5.3-700 °C 92 85 92 86
CX-6-700 °C 80 88 93 87
CX-6.9-500 °C 72 72 66 64
Since these treatments also modified the textural properties of the carbon xerogels, Figure 6 shows
the rate of NO converted per unit of (mesopore) surface area as a function of the amount of nitrogen,
for the urea treated samples.
Although there are only three data points, there is a clear relationship between the rate of NO
conversion and the amount of nitrogen. This is in agreement with our previous report [39], where the
presence of nitrogen groups on carbon xerogels was shown to enhance the oxidation of NO to NO2.
To assess the influence of surface oxygen groups on NO oxidation, the rate of NO converted per
unit surface area was plotted as a function of the oxygen content (Figure 7).

Catalysts 2012, 2 459
Figure 6. Rate of NO converted vs. the amount of nitrogen present in the carbon xerogels
treated with urea.
0.3 0.4 0.5 0.6 0.70.000054
0.000056
0.000058
0.000060
0.000062
0.000064F
NO/S
mes
o [m
ol m
in-1 m
-2]
N [wt. %]
r = 1
Figure 7. Rate of NO converted vs. the amount of oxygen present in the original and
modified carbon xerogels (CX-5.3-700 °C, CX-5.3-700 °C-O2, CX-5.3-700 °C-HNO3,
CX-6-700 °C, CX-6-700 °C-O2, CX-6-700 °C-HNO3, CX-6.9-500 °C, CX-6.9-500 °C-O2,
CX-6.9-500 °C-HNO3).
6 8 10 12 14 16 18 20
0.00002
0.00004
0.00006
0.00008
0.00010
0.00012
r = 0.8047
FN
O/S
mes
o [m
ol m
in-1 m
-2]
O2 [wt. %]
It appears that the oxidative treatment of carbon xerogels, which produced a carbon surface largely
covered by oxygen groups (Table 3), inhibits the oxidation of NO at low temperatures. The oxygen
complexes formed during the treatments with nitric acid and with oxygen in gas phase are not active
sites for the NO oxidation. These oxygen groups are stable under the reaction conditions, and so they
occupy active centers of the carbon xerogels, decreasing the activity for NO oxidation.

Catalysts 2012, 2 460
The treatment with nitric acid introduces small amounts of nitrogen, but not in the form of pyrrole
or pyridine (as does the urea treatment). On the other hand, it introduces very large amounts of oxygen
groups, especially carboxylic acids. Therefore, the inhibitive effect of the oxygen groups offsets any
beneficial effect that might be due to the presence of nitrogen.
3.2.3. Influence of CO and CO2 on NO Oxidation
In the context of the practical application of this process for the abatement of NOx in flue gases of
combustion systems, it is important to know the influence of other compounds such as CO and CO2.
The experiments were conducted with 1000 ppm NO, 20% O2, 4% CO (CO2) and at room temperature
over samples CX-5.3-900 °C and CX-6-900 °C.
The NO conversions obtained over these samples in the presence of CO or CO2 are equal to those
obtained when the reaction was realized only with NO and O2, so it may be concluded that the
presence of CO (or CO2) does not affect NO oxidation. It appears that CO and CO2 do not compete
with oxygen for the catalyst active sites.
3.2.4. Stability of the Sample CX-5.3-900 °C for NO Oxidation
The stability of a catalyst is an important aspect in the global evaluation of its performance. So, an
experiment was carried out during one week with the purpose of evaluating the stability of carbon
xerogels as catalysts for NO oxidation. The reaction was carried out with 1000 ppm of NO and 10% of
oxygen over the most efficient catalyst (CX-5.3-900 °C). The results are shown in Figure 8. The
steady-state conversion is reached after 26 h of reaction (XNO: 98%), and does not change thereafter.
Figure 8. Evolution of profiles of NO and NO2 during one week of reaction with sample
CX-5.3-900 °C.
0 2000 4000 6000 8000 100000.0
0.2
0.4
0.6
0.8
1.0
C/C
0
Time [min]
NO2
NO

Catalysts 2012, 2 461
3.2.5. Influence of Reaction Temperature on NO Oxidation
The dependence of the NO conversion on the reaction temperature was studied with sample
CX-5.3-900 °C. The experiments were carried out with 1000 ppm of NO, 10% of O2 and in the
temperature range 25–150 °C. Figure 9 shows the profiles of NO oxidation at different reaction
temperatures.
Figure 9. Evolution of profiles of NO (a) and NO2 (b) at different reaction temperatures.
A conversion of 98% was obtained at 25 °C, but decreased to 86% at 50 °C, to 77% at 100 °C, and
to 53% at 150 °C. Thus, reaction at room temperature was found to be favorable for the maximum
oxidation of NO.
The carbon surface can act as a catalyst for oxidation of NO to NO2, which then may remain
adsorbed. Inspection of Figure 9 shows that no NO2 is detected at the outlet during 523 min, at 25 °C.
The NO2 produced is completely retained on the carbon xerogel in this period. By increasing the
reaction temperature, the induction time of NO2 (time interval during which the NO2 produced is
retained) is shortened, because the adsorption of NO2 decreases. So, at room temperature there are two
phenomena, reaction and adsorption, but the latter becomes negligible at higher reaction temperatures.

Catalysts 2012, 2 462
4. Conclusions
A range of carbon xerogels with different textural properties was prepared. The textural properties
of the carbon xerogels depend on the pH of preparation and carbonization temperature. The removal of
NO by catalytic oxidation of NO to NO2 on carbon xerogels is feasible at low temperatures. NO
conversion increases with the oxygen concentration in the gas phase. The highest NO conversions
were obtained with the samples that presented the highest surface areas. In a steady state, the
micropores are occupied with NO2 adsorbed, so only the mesopore surface area is available for reaction.
The oxidative treatments had a negative effect on the performance of the carbon xerogels in NO
oxidation, while the treatment with urea enhanced the catalyst activity.
The temperature of reaction has a strong influence on NO oxidation: the conversion of NO
decreases with the increase of reaction temperature.
Acknowledgement
This work was financially supported by Fundação para a Ciência e a Tecnologia (FCT) and FEDER
through Program COMPETE (FCT Pest-C/EQB/LA0020/2011) and research fellowship
SFRH/BD/45720 /2008 (JPSS).
Conflict of Interest
The authors declare no conflict of interest.
References
1. Forzatti, P. Present status and perpectives in de-NOx SCR catalysis. Appl. Catal. A 2001, 222,
221–236.
2. Pârvulescu, V.I.; Grange, P.; Delmon, B. Catalytic removal of NO. Catal. Today 1998, 46,
233–316.
3. Gómez-García, M.A.; Pitchon, V.; Kiennemann, A. Pollution by nitrogen oxides: an approach to
NOx abatement by using sorbing catalytic materials. Environ. Int. 2005, 31, 445–467.
4. Skalska, K.; Miller, J.S.; Ledakowicz, S. Trends in NOx abatement: A review. Sci. Total Environ.
2010, 408, 3976–3989.
5. Barman, S.; Philip, L. Integrated System for the Treatment of Oxides of Nitrogen from Flue Gases.
Environ. Sci. Tech. 2006, 40, 1035–1041.
6. Zawadzki, J.; Wiśniewski, M. Adsorption and decomposition of NO on carbon and carbon-supported
catalysts. Carbon 2002, 40, 119–124.
7. Mochida, I.; Kisamori, S.; Hironaka, M.; Kawano, S.; Matsumura, Y.; Yoshikawa, M. Oxidation
of NO into NO2 over Active Carbon Fibers. Energy Fuels 1994, 8, 1341–1344.
8. Sousa, J.P.S.; Pereira, M.F.R.; Figueiredo, J.L. Catalytic oxidation of NO to NO2 on N-doped
activated carbons. Catal. Today 2011, 176, 383–387.
9. Zhang, W.J.; Rabiei, S.; Bagreev, A.; Zhuang, M.S.; Rasouli, F. Study of NO adsorption on
activated carbons. Appl. Catal. B 2008, 83, 63–71.

Catalysts 2012, 2 463
10. Wang, M.-X.; Huang, Z.-H.; Shimohara, T.; Kang, F.; Liang, K. NO removal by electrospun
porous carbon nanofibers at room temperature. Chem. Eng. J. 2011, 170, 505–511.
11. Stanmore, B.R.; Tschamber, V.; Brilhac, J.F. Oxidation of carbon by NOx, with particular
reference to NO2 and N2O. Fuel 2008, 87, 131–146.
12. Klose, W.; Rincón, S. Adsorption and reaction of NO on activated carbon in the presence of
oxygen and water vapour. Fuel 2007, 86, 203–209.
13. Teng, H.; Hsu, Y.-F.; Tu, Y.-T. Reduction of NO with NH3 over carbon catalysts—the influence
of carbon surface structures and the global kinetics. Appl. Catal. B 1999, 20, 145–154.
14. Mahata, N.; Silva, A.R.; Pereira, M.F.R.; Freire, C.; Castro, B.; Figueiredo, J.L. Anchoring of a
[Mn(salen)Cl] complex onto mesoporous carbon xerogels. J. Colloid Interf. Sci. 2007, 311,
152–158.
15. Samant, P.V.; Gonçalves, F.; Freitas, M.M.A.; Pereira, M.F.R.; Figueiredo, J.L. Surface
activation of a polymer based carbon. Carbon 2004, 42, 1321–1325.
16. Job, N.; Sabatier, F.; Pirard, J.-P.; Crine, M.; Léonard, A. Towards the production of carbon
xerogel monoliths by optimizing convective drying conditions. Carbon 2006, 44, 2534–2542.
17. Maldonado-Hódar, F.J.; Moreno-Castilla, C.; Rivera-Utrilla, J. Synthesis, pore texture and surface
acid–base character of TiO2/carbon composite xerogels and aerogels and their carbonized
derivatives. Appl. Catal. A 2000, 203, 151–159.
18. ElKhatat, A.M.; Al-Muhtaseb, S.A. Advances in Tailoring Resorcinol-Formaldehyde Organic and
Carbon Gels. Adv. Mater. 2011, 23, 2887–2903.
19. Al-Muhtaseb, S.A.; Ritter, J.A. Preparation and Properties of Resorcinol–Formaldehyde Organic
and Carbon Gels. Adv. Mater. 2003, 15, 101–114.
20. Job, N.; Théry, A.; René, P.; Marien, J.; Kocon, J.L.; Rouzaud, J.-N.; Béguin, F.; Pirard, J.-P.
Carbon aerogels, cryogels and xerogels: Influence of the drying method on the textural properties
of porous carbon materials. Carbon 2005, 43, 2481–2494.
21. Job, N.; Pirard, R.; Marien, J.; Pirard, J.-P. Porous carbon xerogels with texture tailored by pH
control during sol–gel process. Carbon 2004, 42, 619–628.
22. Léonard, A.; Job, N.; Blacher, S.; Pirard, J.-P.; Crine, M.; Jomaa, W. Suitability of convective air
drying for the production of porous resorcinol–formaldehyde and carbon xerogels. Carbon 2005,
43, 1808–1811.
23. Zubizarreta, L.; Arenillas, A.; Pirard, J.-P.; Pis, J.J.; Job, N. Tailoring the textural properties of
activated carbon xerogels by chemical activation with KOH. Micropor. Mesopor. Mat. 2008, 115,
480–490.
24. Job, N.; Heinrichs, B.; Ferauche, F.; Noville, F.; Marien, J.; Pirard, J.-P. Hydrodechlorination of
1,2-dichloroethane on Pd–Ag catalysts supported on tailored texture carbon xerogels. Catal.
Today 2005, 102–103, 234–241.
25. Job, N.; Heinrichs, B.; Lambert, S.; Pirard, J.-P.; Colomer, J.-F.; Vertruyen, B.; Marien, J. Carbon
xerogels as catalyst supports: Study of mass transfer. AIChE J. 2006, 52, 2663-2676.
26. Jayne, D.; Zhang, Y.; Haji, S.; Erkey, C. Dynamics of removal of organosulfur compounds from
diesel by adsorption on carbon aerogels for fuel cell applications. Int. J. Hydrog. Energy 2005, 30,
1287–1293.

Catalysts 2012, 2 464
27. Kang, K.Y.; Lee, B.I.; Lee, J.S. Hydrogen adsorption on nitrogen-doped carbon xerogels. Carbon
2009, 47, 1171–1180.
28. Frackowiak, E.; Béguin, F. Carbon materials for the electrochemical storage of energy in
capacitors. Carbon 2001, 39, 937–950.
29. Fang, B.; Binder, L. A modified activated carbon aerogel for high-energy storage in electric
double layer capacitors. J. Power Sources 2006, 163, 616–622.
30. Job, N.; Marie, J.; Lambert, S.; Berthon-Fabry, S.; Achard, P. Carbon xerogels as catalyst
supports for PEM fuel cell cathode. Energy Convers. Manag. 2008, 49, 2461–2470.
31. Figueiredo, J.L.; Pereira, M.F.R.; Freitas, M.M.A.; Órfão, J.J.M. Modification of the surface
chemistry of activated carbons. Carbon 1999, 37, 1379–1389.
32. Faria, P.C.C.; Órfão, J.J.M.; Pereira, M.F.R. Adsorption of anionic and cationic dyes on activated
carbons with different surface chemistries. Water Res. 2004, 38, 2043–2052.
33. Alegre, C.; Gálvez, M.E.; Sebastián, D.; Moliner, R.; Lázaro, M.J. Influence of Synthesis pH on
Textural Properties of Carbon Xerogels as Supports for Pt/CXs Catalysts for Direct Methanol
Fuel Cells. Int. J. Electrochem. 2012, doi:10.1155/2012/267893.
34. Lin, C.; Ritter, J.A. Effect of synthesis pH on the structure of carbon xerogels. Carbon 1997, 35,
1271–1278.
35. Shimizu, T.; Sazawa, Y.; Adschiri, T.; Furusawa, T. Conversion of char-bound nitrogen to nitric
oxide during combustion. Fuel 1992, 71, 361–365.
36. Illan-Goméz, M.J.; Linares-Solano, A.; de Lecea, C.S.M.; Calo, J.M. Nitrogen oxide (NO)
reduction by activated carbons. 1. The role of carbon porosity and surface area. Energy Fuels
1993, 7, 146–154.
37. Jan, E.J. Formation and reduction of nitrogen oxides in fluidized-bed combustion. Fuel 1994, 73,
1398–1415.
38. Mochida, I.; Ogaki, M.; Fujitsu, H.; Komatsubara, Y.; Ida, S. Reduction of nitric oxide with
activated PAN fibres. Fuel 1985, 64, 1054–1057.
39. Sousa, J.P.S.; Pereira, M.F.R.; Figueiredo, J.L. NO oxidation over nitrogen doped carbon xerogels.
Appl. Catal. B 2012, 125, 398–408.
40. Boehm, H.P. Catalytic Properties of Nitrogen-Containing Carbons. In Carbon Materials for
Catalysis; Serp, P., Figueiredo, J.L., Eds.; John Wiley & Sons: Hoboken, NJ, USA, 2009; Chapter 7.
41. Stöhr, B.; Boehm, H.P.; Schlögl, R. Enhancement of the catalytic activity of activated carbons in
oxidation reactions by thermal treatment with ammonia or hydrogen cyanide and observation of a
superoxide species as a possible intermediate. Carbon 1991, 29, 707–720.
42. Seredych, M.; Hulicova-Jurcakova, D.; Lu, G.Q.; Bandosz, T.J. Surface functional groups of
carbons and the effects of their chemical character, density and accessibility to ions on
electrochemical performance. Carbon 2008, 46, 1475–1488.
43. Mangun, C.L.; Benak, K.R.; Economy, J.; Foster, K.L. Surface chemistry, pore sizes and
adsorption properties of activated carbon fibers and precursors treated with ammonia. Carbon
2001, 39, 1809–1820.
44. Pels, J.R.; Kapteijn, F.; Moulijn, J.A.; Zhu, Q.; Thomas, K.M. Evolution of nitrogen
functionalities in carbonaceous materials during pyrolysis. Carbon 1995, 33, 1641–1653.

Catalysts 2012, 2 465
45. Arrigo, R.; Hävecker, M.; Wrabetz, S.; Blume, R.; Lerch, M.; McGregor, J.; Parrot, E.P.J.;
Zeitler, J.A.; Gladden, L.F.; Knop-Gericke, A.; et al. Tuning the Acid/Base Properties of
Nanocarbons by Functionalization via Amination. J. Am. Chem. Soc. 2010, 33, 9616–9630.
© 2012 by the authors; licensee MDPI, Basel, Switzerland. This article is an open access article
distributed under the terms and conditions of the Creative Commons Attribution license
(http://creativecommons.org/licenses/by/3.0/).