Sensitivity of styrene oxidation reaction to the catalyst structure of silver nanoparticles
8
Sensitivity of styrene oxidation reaction to the catalyst structure of silver nanoparticles R.J. Chimenta ˜o a , I. Kirm a , F. Medina a, * , X. Rodrı ´guez a , Y. Cesteros b , P. Salagre b , J.E. Sueiras a , J.L.G. Fierro c a Departament d’Enginyeria Quı ´mica, Universitat Rovira i Virgili, 43007 Tarragona, Spain b Departament de Quı ´mica Inorga ´nica, Universitat Rovira i Virgili, 43005 Tarragona, Spain c Instituto de Catalisis y Petroleoquimica, CSIC, Cantoblanco, 28049 Madrid, Spain Available online 16 March 2005 Abstract This study shows how different morphologies of silver nanoparticles affect the selective oxidation of styrene in the gas phase using oxygen as oxidant. Silver nanoparticles (nanowires and nanopolyhedra), prepared using the polyol process, were supported on a-Al 2 O 3 . For comparison, a conventional catalyst obtained by wet impregnation was also prepared. Phenyla- cetaldehyde (Phe) and styrene oxide (SO) were the main products for nanoparticles catalysts. The promotion effect on the catalytic activity of potassium and cesium on the silver nanowires catalysts was also studied. At 573 K, the styrene conversion and selectivity to styrene oxide with the silver nanowires catalyst were 57.6 and 42.5%, respectively. Silver nanopolyhedra catalyst showed 57.5% conversion and 30.8% selectivity to styrene oxide. The promotion by cesium played an important role in improving the epoxidation of styrene. The samples were structurally characterized using X-ray diffraction (XRD), ultraviolet– visible spectroscopy (UV–vis), scanning electron microscopy (SEM) and transmission electron microscopy (TEM). X-ray photoelectron spectroscopy (XPS) and temperature programmed reduction (TPR) were applied to characterize the oxygen species detected (O b ,O g ) on the silver surface. # 2005 Elsevier B.V. All rights reserved. Keywords: Silver nanoparticles; Nanowires; Nanopolyhedra; Styrene; Selective oxidation 1. Introduction Metal nanoparticles have attracted considerable attention because of their novel physical properties and their potential applications in areas, such as catalysis [1]. Metal nanoparticles with shape control can have structures and properties significantly different from those conventional materials [2]. Recently, silver nanoparticles have been synthesized by reducing silver nitrate with ethylene glycol in the presence of poly(vinyl pyrrolidone) (PVP) via a polyol process [3–7]. It is well known that the activity and www.elsevier.com/locate/apsusc Applied Surface Science 252 (2005) 793–800 * Corresponding author. Tel.: +34 9775 59787; fax: +34 9775 59667. E-mail address: [email protected] (F. Medina). 0169-4332/$ – see front matter # 2005 Elsevier B.V. All rights reserved. doi:10.1016/j.apsusc.2005.02.064
Transcript of Sensitivity of styrene oxidation reaction to the catalyst structure of silver nanoparticles

www.elsevier.com/locate/apsusc
Applied Surface Science 252 (2005) 793–800
Sensitivity of styrene oxidation reaction to
the catalyst structure of silver nanoparticles
R.J. Chimentao a, I. Kirm a, F. Medina a,*, X. Rodrıguez a,Y. Cesteros b, P. Salagre b, J.E. Sueiras a, J.L.G. Fierro c
a Departament d’Enginyeria Quımica, Universitat Rovira i Virgili, 43007 Tarragona, Spainb Departament de Quımica Inorganica, Universitat Rovira i Virgili, 43005 Tarragona, Spain
c Instituto de Catalisis y Petroleoquimica, CSIC, Cantoblanco, 28049 Madrid, Spain
Available online 16 March 2005
Abstract
This study shows how different morphologies of silver nanoparticles affect the selective oxidation of styrene in the gas phase
using oxygen as oxidant. Silver nanoparticles (nanowires and nanopolyhedra), prepared using the polyol process, were
supported on a-Al2O3. For comparison, a conventional catalyst obtained by wet impregnation was also prepared. Phenyla-
cetaldehyde (Phe) and styrene oxide (SO) were the main products for nanoparticles catalysts. The promotion effect on the
catalytic activity of potassium and cesium on the silver nanowires catalysts was also studied. At 573 K, the styrene conversion
and selectivity to styrene oxide with the silver nanowires catalyst were 57.6 and 42.5%, respectively. Silver nanopolyhedra
catalyst showed 57.5% conversion and 30.8% selectivity to styrene oxide. The promotion by cesium played an important role in
improving the epoxidation of styrene. The samples were structurally characterized using X-ray diffraction (XRD), ultraviolet–
visible spectroscopy (UV–vis), scanning electron microscopy (SEM) and transmission electron microscopy (TEM). X-ray
photoelectron spectroscopy (XPS) and temperature programmed reduction (TPR) were applied to characterize the oxygen
species detected (Ob, Og) on the silver surface.
# 2005 Elsevier B.V. All rights reserved.
Keywords: Silver nanoparticles; Nanowires; Nanopolyhedra; Styrene; Selective oxidation
1. Introduction
Metal nanoparticles have attracted considerable
attention because of their novel physical properties
* Corresponding author. Tel.: +34 9775 59787;
fax: +34 9775 59667.
E-mail address: [email protected] (F. Medina).
0169-4332/$ – see front matter # 2005 Elsevier B.V. All rights reserved
doi:10.1016/j.apsusc.2005.02.064
and their potential applications in areas, such as
catalysis [1]. Metal nanoparticles with shape control
can have structures and properties significantly
different from those conventional materials [2].
Recently, silver nanoparticles have been synthesized
by reducing silver nitrate with ethylene glycol in the
presence of poly(vinyl pyrrolidone) (PVP) via a polyol
process [3–7]. It is well known that the activity and
.

R.J. Chimentao et al. / Applied Surface Science 252 (2005) 793–800794
selectivity of the catalysts are strongly dependent on
their size, shape and surface structure, as well as on
their bulk and surface composition [8]. The shape-
controlled synthesis of metal nanoparticles can open
new opportunities for heterogeneous catalysis. This
approach may help to understand the effect of crystal
planes on chemical reactivity [9]. Oriented nanopar-
ticles could also be expanded to industrial application
to obtain many useful chemicals. In these regards,
catalysts obtained from silver nanoparticles seem to be
particularly interesting for studying the selective
oxidation of olefins with oxygen as oxidant because
it has been demonstrated that silver is a selective
catalyst for olefins epoxidation [10].
This study investigates how different morphologies
of silver nanoparticles and supports, such as a-Al2O3
and MgO affect the selective oxidation of styrene in
the gas phase using oxygen as oxidant. Besides, the
promotion effect of Cs and K on the catalytic activity
was investigated. The effect of the molar ratio
O2:styrene on the catalytic performance was also
studied. The samples were structurally characterized
using X-ray diffraction (XRD), temperature-pro-
grammed reduction (TPR), scanning electron micro-
scopy (SEM), transmission electron microscopy
(TEM), X-ray photoelectron spectroscopy (XPS)
and ultraviolet–visible (UV–vis) absorption spectro-
scopy with the aim to correlate the morphological
dependence of metal particles with their catalytic
behaviour.
2. Experimental
2.1. Preparation of the catalysts
The catalysts were prepared by two procedures.
First, wetness impregnation method was used to
impregnate a-Al2O3 and MgO supports with an
appropriate amount of an aqueous solution of silver
nitrate to obtain 15 and 40 wt% of silver, respectively.
The impregnated supports were dried in an oven at
393 K for 24 h and reduced in H2 at 623 K for 3 h
before the characterization and the activity tests. In the
second procedure, the silver nanoparticles were
synthesized via polyol process. All chemicals were
used without further purification. In a typical synthesis
of silver nanoparticles [4,5], 30 ml ethylene glycol
solution of AgNO3 (0.25 M, Aldrich) and 30 ml
ethylene glycol solution of PVP (0.375 M in repeating
unit weight-average molecular weight = 40,000,
Aldrich) were simultaneously added in 50 ml ethylene
glycol at 433 K under vigorous stirring. The reaction
mixture was then refluxed for 45 min at this
temperature. The nanoparticles obtained were diluted
with acetone (about 10 times by volume) and
separated from ethylene glycol by centrifugation at
4000 rpm for 20 min. Silver nanoparticles were also
prepared using a PVP/AgNO3 molar ratio of 3. The
silver nanoparticles (11 wt%) were dispersed on a-
Al2O3 with an acetone solution. The silver nanopar-
ticles catalysts were also dried in an oven at 393 K for
24 h and reduced in H2 at 623 K for 3 h before the
characterization and the activity tests.
2.2. Catalyst characterization
X-ray diffraction was performed on a Siemens
D5000 diffractometer using nickel filtered Cu Ka
radiation (l = 1.54056 A). For crystal phase identifi-
cation, the 2u range of scan was between 308 and 1208at a scan rate of 48 min�1 with a 0.058 data interval.
The UV–vis spectra of the silver nanoparticles were
recorded at ambient temperature using a HP8542
spectrophotometer by scanning wavelengths between
300 and 820 nm. The growth of silver nanoparticles
during the polyol process was monitored by sampling
small portions of the reaction mixture at various
reaction times (15, 20, 25, 30, 35 and 40 min) and
analyzed by UV–vis spectroscopy and TEM (JEOL
JEM-2000EX II transmission electron) operated at
80 kV. The morphologies of the catalysts were
observed by SEM with a JEOL JSM-35C scanning
microscope operated at an acceleration voltage of
15 kV. Temperature-programmed reduction (TPR)
experiments were performed in a TPDRO 1100
(Thermo Finnigan) equipped with TCD and mass
detectors. The samples were treated in O2 for 1 h at
different temperatures between 523 and 623 K before
TPR analysis. The TPR of silver catalysts was carried
out using 5% H2 in Ar flow as reducing agent, the gas
flow rate was 20 ml/min and the weight of sample was
1.0 g. The temperature was raised from 323 K up to
1073 K at a rate of b = 20 K/min. The XPS spectra
were acquired in a VG Escalab 200R electron
spectrometer equipped with a hemispherical electron

R.J. Chimentao et al. / Applied Surface Science 252 (2005) 793–800 795
analyzer, operating in a constant pass energy mode
and a non-monochromatic Mg Ka (hn = 1253.6 eV,
1 eV = 1.603 � 10�19 J). X-ray source operated at
10 mA and 12 kV. The background pressure in the
analysis chamber was kept below 7 � 10�19 mbar
during data acquisition. The binding energy (BE C
1s = 284.9 eV) of adventitious C1 was used as
reference. A Shirley background subtraction was
applied and Gaussian–Lorentzian product functions
were used to approximate the line shapes of the fitting
components.
2.3. Catalytic activity
The catalytic activity was carried out at steady-state
conditions using a stainless steel tubular down flow
reactor (10 mm internal diameter and 20 cm long)
with a temperature control system. The reactor was
filled with the catalyst (1.0 g), which had been
previously ground and sieved in the range of 75–
100 mesh. A mixture of O2–Ar was fed to the reactor
by independent mass flow controllers, using a total
flow rate between 100 and 300 ml/min. The styrene
was introduced into the reactor by a high-pressure
metering pump in a flow-rate range of 0.08–0.5 ml/h.
The reaction temperatures were in the range of 523–
623 K. The products of the reaction were rapidly
cooled and analyzed using a Shimadzu GC 2010 gas-
chromatograph equipped with an Ultra 2 capillary
column and a flame ionization detector (FID). The
presence of combustion products was determined by
on-line TCD and mass spectrometer.
Fig. 1. Growth of silver nanowires monitored by TEM (a–d) and time evolu
polyol process (e).
3. Results and discussion
3.1. Synthesis and characterization of silver
nanoparticles
Previous studies showed that the morphologies of
the silver nanoparticles prepared by the polyol process
were found to depend heavily on the experimental
conditions, such as the molar ratio between PVP and
AgNO3 [11]. Different morphologies of silver
nanoparticles, such as nanowires (NW) and nanopo-
lyhedra (NP) can be obtained at PVP/AgNO3 molar
ratios of 1.5 and 3, respectively.
During the synthesis of silver nanowires, the
mixture solution changed from clear to a yellowish
color, red brown and finally to gray. Once the solutions
of AgNO3 and PVP had been introduced to the
reaction system, the bright yellow color gradually
appeared indicating the formation of silver nanopar-
ticles through the reduction of AgNO3 by ethylene
glycol. The growth of silver nanowires was monitored
by sampling aliquots from the refluxing solution at
different periods of time and analyzed by TEM. Fig. 1
indicates the evolution of the morphologies of the
silver nanoparticles as the reaction mixture was kept in
reflux. The initial particles (yellow solution) had sizes
at around 8–50 nm (Fig. 1a). As the reaction
proceeded the silver particles contact each other to
form a chain like network (Fig. 1b and c) and some
larger nanoparticles (brown red solution) started to
appear. The growth of silver nanowires was also
monitored by ultraviolet visible spectroscopy (UV–
tion of UV–vis spectra during the formation of silver nanowires in the

R.J. Chimentao et al. / Applied Surface Science 252 (2005) 793–800796
vis). Fig. 1e shows the UV–vis spectra of the silver
nanoparticles at different times under refluxing condi-
tion. The spectrum of the solution at 15 min (yellow
solution) shows a small plasmon band close to 410 nm,
which represents the formation of silver nanoparticles
by the reduction of Ag+ ions [12]. The appearance of the
plasmon band is caused by 4d ! 5s, p interband
transitions [13]. The absorption band of the silver
nanoparticles shifts to larger wavelengths with the
refluxing time. The nanoparticles obtained at 40 min
(gray solution) displayed a broad peak at around
430 nm. However, the peak at 410 nm probably still
remained even after the solution had been heated for
45 min or longer. This observation is supported because
the final product of our synthesis was a mixture of silver
nanowires and nanopolyhedra as is shown by TEM in
Fig. 1d. These nanowires were easily separated from the
nanopolyhedra through centrifugation obtaining a pure
sample of silver nanowires.
The X-ray diffraction of the nanowires and
nanopolyhedra synthesized using the polyol process
suggested that silver existed purely in the face-
centered cubic (fcc) structure (Fig. 2). The diffraction
did not suggest the presence of possible impurities,
such as Ag2O and AgNO3. The peaks detected for the
silver nanoparticles were assigned to diffraction from
the (1 1 1), (2 0 0), (2 2 0), (3 1 1), (2 2 2), (4 0 0),
(3 1 1) and (4 2 0) planes of fcc silver, respectively.
The lattice constants calculated by XRD for the
nanowires and nanopolyhedra were 4.0839 and
4.0872 A, respectively, which are very close to the
report data (a = 4.0862 A, Joint Committee on Powder
Diffraction Standards file 04-0783). The ratio of
intensity between (1 1 1) and (2 0 0) peaks has values
Fig. 2. XRD pattern of silver nanowires (lower pattern) and nano-
polyhedra (upper pattern).
of 4.5 and 2.5 for nanowires and nanopolyhedra,
respectively. For the nanowires, this ratio is higher
than standard file (JCPDS) (4.5 versus 2.5) indicating
that the nanowires show preferred orientation in
(1 1 1) facets. Nanowires and nanopolyhedra tend to
grow as bicrystals twinned along the (1 1 1) planes,
showing (1 1 1) crystal faces at their surface [14].
3.2. Catalyst characterization
Fig. 3a and b shows the SEM images of the 11 wt%
silver nanowires (NW) and 11 wt% silver nanopoly-
hedra (NP) supported on a-Al2O3, respectively. The
nanowires have a mean diameter of 150 nm. When the
molar ratio between PVP/AgNO3 was increased from
1.5 to 3, nanopolyhedra was the major product. The
SEM image of the 40% Ag/MgO catalyst (Fig. 3c)
prepared by wetness impregnation shows the presence
of silver nanowires together with other silver particles
having irregular shapes with diameters between 100
and 500 nm. Irregularly shaped particles with dia-
meters between 200 and 1000 nm (Fig. 3d) were also
observed for the 15% Ag/a-Al2O3 catalyst prepared
by wetness impregnation.
Fig. 4 shows the TPR profiles of Cs (0.5 wt%
refereed to silver) promoted silver nanowires (11%
Ag(NW–0.5% Cs)/a-Al2O3) (A), 11% Ag(NW)/a-Al2O3
(B) and 15% Ag/a-Al2O3 (C), catalysts after treatment
in O2 flow for 1 h at 623 K. The profiles show two
broad peaks for the NW catalysts at around 633 K
Fig. 3. SEM images of silver catalysts.
R.J. Chimentao et al. / Applied Surface Science 252 (2005) 793–800 797
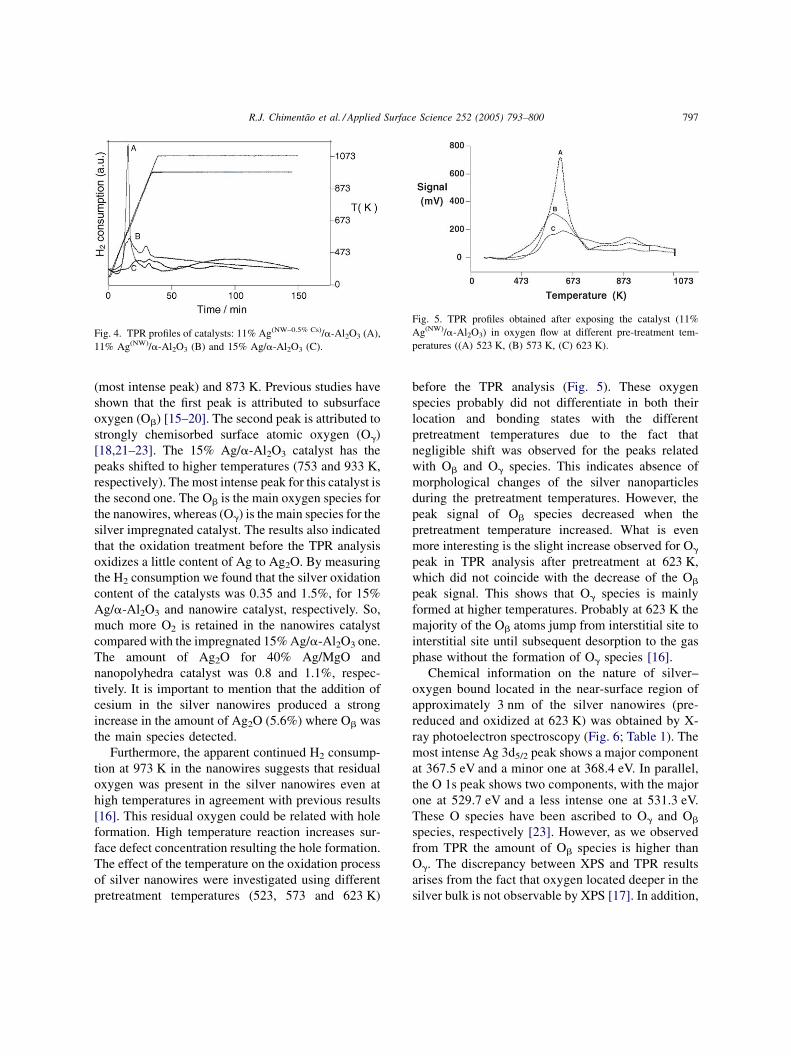
Fig. 4. TPR profiles of catalysts: 11% Ag(NW–0.5% Cs)/a-Al2O3 (A),
11% Ag(NW)/a-Al2O3 (B) and 15% Ag/a-Al2O3 (C).
Fig. 5. TPR profiles obtained after exposing the catalyst (11%
Ag(NW)/a-Al2O3) in oxygen flow at different pre-treatment tem-
peratures ((A) 523 K, (B) 573 K, (C) 623 K).
(most intense peak) and 873 K. Previous studies have
shown that the first peak is attributed to subsurface
oxygen (Ob) [15–20]. The second peak is attributed to
strongly chemisorbed surface atomic oxygen (Og)
[18,21–23]. The 15% Ag/a-Al2O3 catalyst has the
peaks shifted to higher temperatures (753 and 933 K,
respectively). The most intense peak for this catalyst is
the second one. The Ob is the main oxygen species for
the nanowires, whereas (Og) is the main species for the
silver impregnated catalyst. The results also indicated
that the oxidation treatment before the TPR analysis
oxidizes a little content of Ag to Ag2O. By measuring
the H2 consumption we found that the silver oxidation
content of the catalysts was 0.35 and 1.5%, for 15%
Ag/a-Al2O3 and nanowire catalyst, respectively. So,
much more O2 is retained in the nanowires catalyst
compared with the impregnated 15% Ag/a-Al2O3 one.
The amount of Ag2O for 40% Ag/MgO and
nanopolyhedra catalyst was 0.8 and 1.1%, respec-
tively. It is important to mention that the addition of
cesium in the silver nanowires produced a strong
increase in the amount of Ag2O (5.6%) where Ob was
the main species detected.
Furthermore, the apparent continued H2 consump-
tion at 973 K in the nanowires suggests that residual
oxygen was present in the silver nanowires even at
high temperatures in agreement with previous results
[16]. This residual oxygen could be related with hole
formation. High temperature reaction increases sur-
face defect concentration resulting the hole formation.
The effect of the temperature on the oxidation process
of silver nanowires were investigated using different
pretreatment temperatures (523, 573 and 623 K)
before the TPR analysis (Fig. 5). These oxygen
species probably did not differentiate in both their
location and bonding states with the different
pretreatment temperatures due to the fact that
negligible shift was observed for the peaks related
with Ob and Og species. This indicates absence of
morphological changes of the silver nanoparticles
during the pretreatment temperatures. However, the
peak signal of Ob species decreased when the
pretreatment temperature increased. What is even
more interesting is the slight increase observed for Og
peak in TPR analysis after pretreatment at 623 K,
which did not coincide with the decrease of the Ob
peak signal. This shows that Og species is mainly
formed at higher temperatures. Probably at 623 K the
majority of the Ob atoms jump from interstitial site to
interstitial site until subsequent desorption to the gas
phase without the formation of Og species [16].
Chemical information on the nature of silver–
oxygen bound located in the near-surface region of
approximately 3 nm of the silver nanowires (pre-
reduced and oxidized at 623 K) was obtained by X-
ray photoelectron spectroscopy (Fig. 6; Table 1). The
most intense Ag 3d5/2 peak shows a major component
at 367.5 eV and a minor one at 368.4 eV. In parallel,
the O 1s peak shows two components, with the major
one at 529.7 eV and a less intense one at 531.3 eV.
These O species have been ascribed to Og and Ob
species, respectively [23]. However, as we observed
from TPR the amount of Ob species is higher than
Og. The discrepancy between XPS and TPR results
arises from the fact that oxygen located deeper in the
silver bulk is not observable by XPS [17]. In addition,

R.J. Chimentao et al. / Applied Surface Science 252 (2005) 793–800798
Fig. 6. Ag 3d core-level spectra of Ag nanowires pre-reduced and
oxidized at 623 K.
Table 1
Binding energies (eV) of core-levels and surface atomic ratios of
silver nanowires
Catalyst
(NW)
Ag 3d5/2 O 1s Al 2p O/Ag
atomic
ratio
Pre-reduced Ag 367.5 (80) 529.7 (67) – 0.51
368.4 (20) 531.3 (33) –
Oxidized Ag 367.5 (72) 529.7 (70) – 0.60
368.4 (28) 531.3 (30) –
Table 2
Results for the selective oxidation of styrenea
Catalyst X (%) Selectivity (%)
Phe SO
15% Ag/a-Al2O3 4.9 53.2 15.6
11% Ag(NW)/a-Al2O3 57.6 57.5 42.5
11% Ag(NW)/a-Al2O3b 66.7 79.5 20.5
11% Ag(NW)/a-Al2O3b,c 93.2 82.7 17.3
11% Ag(NW)/a-Al2O3b,d 96.4 94.5 5.5
11% Ag(NW)/a-Al2O3e,g 41.0 20.5 79.5
11% Ag(NW)/a-Al2O3f,g 85.8 27.8 72.2
11% Ag(NP)/a-Al2O3 57.5 69.2 30.8
40% Ag(NW)/MgO 77.1 82.9 17.1
NW, nanowires; NP, nanopolyhedra; X, conversion of styrene.a Feed: 50 O2:1 styrene (mol%), reaction temperature at 573 K.b 400 ppm of KOH referred to Ag.c 65 O2:1 styrene (mol%).d 100 O2:1 styrene (mol%).e 503 K.f 533 K.g 500 ppm of Cs referred to Ag.
surface O/Ag ratios were determined after perform-
ing a Shirley background subtraction to the O 1s and
Ag 3d5/2 peaks. The O/Ag atomic ratios derived for
type Og species virtually coincides with the
stoichiometry of Ag2O and is slightly increased
(0.60) upon in situ oxidation at 623 K. This finding
suggests that near-surface silver atoms retain a
strongly chemisorbed oxygen species.
3.3. Catalytic activity
The selective oxidation of styrene at 573 K
(Table 2) at steady-state, over silver catalysts shows
phenylacetaldehyde (Phe) and styrene oxide (SO) as
the main products. The direct combustion route of
styrene was negligible for silver nanowires and
nanopolyhedra even at near total conversion. How-
ever, the 15% Ag/a-Al2O3 catalyst shows around
30% of total combustion products at this tempera-
ture, even at lower conversion (around 5%). Styrene
conversion of 57.6% with a styrene oxide selectivity
of 42.5% was obtained for 11% Ag(NW)/a-Al2O3
catalyst. The silver nanowires supported on MgO
give styrene conversion of about 77.1% and a SO
selectivity of about 17.1%. The conversion increases
when silver nanowires was promoted with KOH.
However, the promotion of KOH decreased the
formation of epoxide favoring the formation of
phenylacetaldehyde. A conversion hi-gher than 95%
with total selectivity to phenylacetaldehyde and
R.J. Chimentao et al. / Applied Surface Science 252 (2005) 793–800 799
styrene oxide was obtained using the nanowires
catalyst promoted with KOH. Besides, for silver
nanowires catalyst promoted with KOH, the increase
in the O2:styrene molar ratio also improves the
conversion (>95%) favouring the formation of
phenylacetaldehyde at expenses of SO. The promo-
tion of the silver nanowires catalyst with Cs
increased the selectivity to styrene oxide. The
cesium promoted catalyst showed 85.8% of conver-
sion and 72.2% of selectivity to styrene oxide at
533 K.
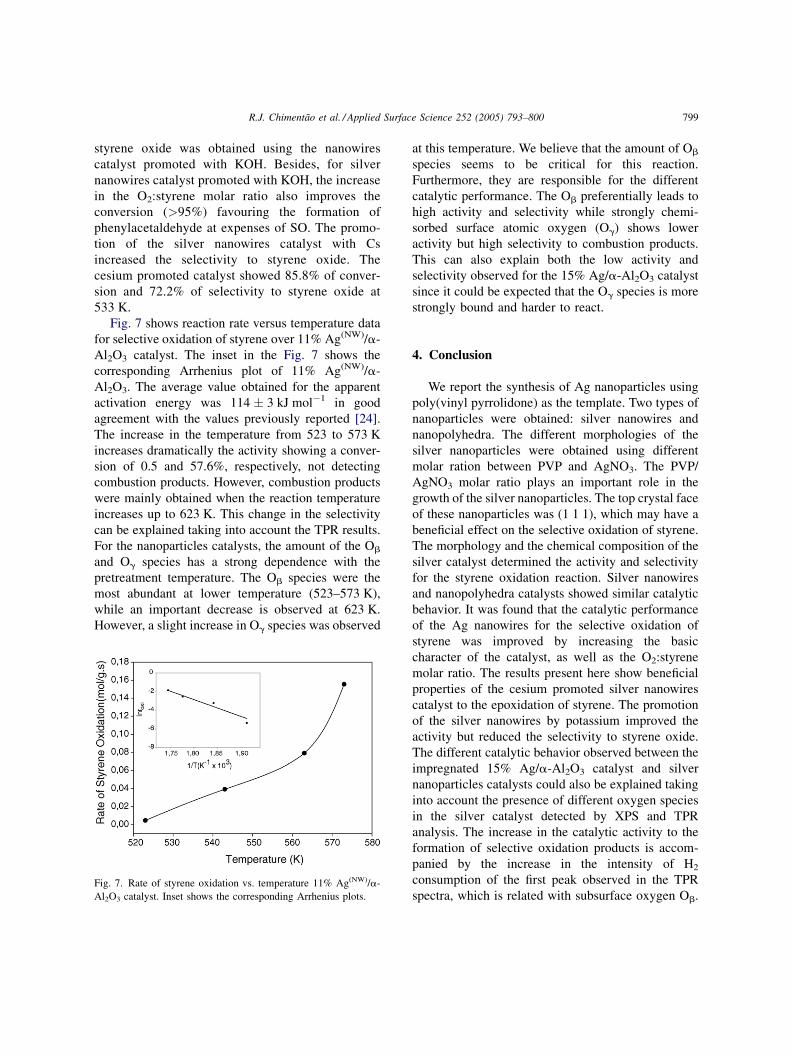
Fig. 7 shows reaction rate versus temperature data
for selective oxidation of styrene over 11% Ag(NW)/a-
Al2O3 catalyst. The inset in the Fig. 7 shows the
corresponding Arrhenius plot of 11% Ag(NW)/a-
Al2O3. The average value obtained for the apparent
activation energy was 114 � 3 kJ mol�1 in good
agreement with the values previously reported [24].
The increase in the temperature from 523 to 573 K
increases dramatically the activity showing a conver-
sion of 0.5 and 57.6%, respectively, not detecting
combustion products. However, combustion products
were mainly obtained when the reaction temperature
increases up to 623 K. This change in the selectivity
can be explained taking into account the TPR results.
For the nanoparticles catalysts, the amount of the Ob
and Og species has a strong dependence with the
pretreatment temperature. The Ob species were the
most abundant at lower temperature (523–573 K),
while an important decrease is observed at 623 K.
However, a slight increase in Og species was observed
Fig. 7. Rate of styrene oxidation vs. temperature 11% Ag(NW)/a-
Al2O3 catalyst. Inset shows the corresponding Arrhenius plots.
at this temperature. We believe that the amount of Ob
species seems to be critical for this reaction.
Furthermore, they are responsible for the different
catalytic performance. The Ob preferentially leads to
high activity and selectivity while strongly chemi-
sorbed surface atomic oxygen (Og) shows lower
activity but high selectivity to combustion products.
This can also explain both the low activity and
selectivity observed for the 15% Ag/a-Al2O3 catalyst
since it could be expected that the Og species is more
strongly bound and harder to react.
4. Conclusion
We report the synthesis of Ag nanoparticles using
poly(vinyl pyrrolidone) as the template. Two types of
nanoparticles were obtained: silver nanowires and
nanopolyhedra. The different morphologies of the
silver nanoparticles were obtained using different
molar ration between PVP and AgNO3. The PVP/
AgNO3 molar ratio plays an important role in the
growth of the silver nanoparticles. The top crystal face
of these nanoparticles was (1 1 1), which may have a
beneficial effect on the selective oxidation of styrene.
The morphology and the chemical composition of the
silver catalyst determined the activity and selectivity
for the styrene oxidation reaction. Silver nanowires
and nanopolyhedra catalysts showed similar catalytic
behavior. It was found that the catalytic performance
of the Ag nanowires for the selective oxidation of
styrene was improved by increasing the basic
character of the catalyst, as well as the O2:styrene
molar ratio. The results present here show beneficial
properties of the cesium promoted silver nanowires
catalyst to the epoxidation of styrene. The promotion
of the silver nanowires by potassium improved the
activity but reduced the selectivity to styrene oxide.
The different catalytic behavior observed between the
impregnated 15% Ag/a-Al2O3 catalyst and silver
nanoparticles catalysts could also be explained taking
into account the presence of different oxygen species
in the silver catalyst detected by XPS and TPR
analysis. The increase in the catalytic activity to the
formation of selective oxidation products is accom-
panied by the increase in the intensity of H2
consumption of the first peak observed in the TPR
spectra, which is related with subsurface oxygen Ob.

R.J. Chimentao et al. / Applied Surface Science 252 (2005) 793–800800
The nature of silver-oxygen bond arises from the
different silver morphologies leading different cata-
lytic behavior. The controlled shape of silver
nanoparticles seemed to have potential applications
for the selective oxidation of olefins.
Acknowledgements
This work was supported by the Ministerio de
Ciencia y Tecnologia of Spain REN2002-04464-CO2-
01, PETRI 95-0801.OP and Destilaciones Bordas
S.A.
References
[1] L.N. Lewis, Chem. Rev. 93 (1993) 2693.
[2] M.P. Mallin, C.J. Murphy, Nano Lett. 2 (2002) 1235.
[3] Y. Sun, B. Gates, B. Mayers, Y. Xia, Nano Lett. 2 (2002) 165.
[4] Y. Sun, Y. Xia, Science 298 (2002) 2176.
[5] C. B. Murray, S. Sun, US Patent 6,262,129 (2001).
[6] Y. Sun, Y. Yin, B.T. Mayers, T. Herricks, Y. Xia, Chem. Mater.
14 (2002) 4736.
[7] F. Fivet, J.P. Lagier, M. Figlarz, Mater. Res. Soc. Bull. 14
(1989) 29.
[8] A.T. Bell, Science 299 (2003) 1688.
[9] M. Haruta, J. Nanopart. Res. 5 (2003) 3–4.
[10] Z.M. Hu, H. Nakai, H. Nakatsuji, Surf. Sci. 401 (1998) 371.
[11] R.J. Chimentao, I. Kirm, F. Medina, X. Rodrıguez, Y. Cesteros,
P. Salagre, J.E. Sueiras, Chem. Commun. (2004) 846–847.
[12] H.J. Han, S.M. Koo, J. Sol–Gel Sci. Technol. 26 (2003) 467.
[13] D. Meisel, J. Phys. Chem. B 102 (1998) 8364.
[14] B.D. Cullity, S.R. Stock, Elements of X-Ray Diffraction, third
ed. Prentice-Hall, Upper Saddle River, NJ, 2001,pp. 402–404.
[15] A. Nagy, G. Mestl, T. Rule, G. Weinberg, R. Schlogl, J. Catal.
179 (1998) 548.
[16] A.J. Nagy, G. Mestl, Appl. Catal. 188 (1999) 337.
[17] A.J. Nagy, G. Mestl, R. Schlogl, J. Catal. 188 (1998) 58.
[18] D. Herein, A. Nagy, H. Schubert, G. Weinberg, E. Kitzelmann,
R. Schlogl, Z. Phys. Chem. 197 (1996) 67.
[19] A.J. Nagy, G. Mestl, D. Herein, G. Weinberg, E. Kiltzelmann,
R. Schlogl, J. Catal. 182 (1999) 417.
[20] G.A. Somorjai, Introduction to Surface Chemistry and
Catalysis, Wiley, New York, 1994.
[21] X. Bao, M. Muhler, T. Scedel-Niedrig, R. Schlogl, Phys. Rev.
B 54 (1996) 2249.
[22] D. Kondarides, X.E. Verykios, J. Catal. 143 (1993) 481.
[23] G.I.N. Waterhouse, G.A. Bowmaker, J.B. Metson, Appl. Surf.
Sci. 214 (2003) 36.
[24] N. Macleod, J.M. Keel, R.M. Lambert, Catal. Lett. 86 (2003)
51.