Performance of Trickle Bed Reactor and Active Carbon in the Liquid Phase Oxidation of Phenol
27
I NTERNATIONAL J OURNAL OF C HEMICAL R EACTOR E NGINEERING Volume 8 2010 Article A76 Performance of Trickle Bed Reactor and Active Carbon in the Liquid Phase Oxidation of Phenol Nigus Gabbiye * Josep Font † Agusti Fortuny ‡ Christophe Bengoa ** Azael Fabregat †† Frank Stuber ‡‡ * Universitat Rovira i Virgili, nigus [email protected] † Universitat Rovira i Virgili, [email protected] ‡ Universitat Rovira i Virgili, [email protected] ** Universitat Rovira i Virgili, [email protected] †† Universitat Rovira i Virgili, [email protected] ‡‡ Universitat Rovira i Virgili, [email protected] ISSN 1542-6580 Copyright c 2010 The Berkeley Electronic Press. All rights reserved.
-
Upload
independent -
Category
Documents
-
view
0 -
download
0
Transcript of Performance of Trickle Bed Reactor and Active Carbon in the Liquid Phase Oxidation of Phenol

INTERNATIONAL JOURNAL OF CHEMICAL
REACTOR ENGINEERING
Volume 8 2010 Article A76
Performance of Trickle Bed Reactor andActive Carbon in the Liquid Phase
Oxidation of Phenol
Nigus Gabbiye∗ Josep Font† Agusti Fortuny‡
Christophe Bengoa∗∗ Azael Fabregat†† Frank Stuber‡‡
∗Universitat Rovira i Virgili, nigus [email protected]†Universitat Rovira i Virgili, [email protected]‡Universitat Rovira i Virgili, [email protected]∗∗Universitat Rovira i Virgili, [email protected]††Universitat Rovira i Virgili, [email protected]‡‡Universitat Rovira i Virgili, [email protected]
ISSN 1542-6580Copyright c©2010 The Berkeley Electronic Press. All rights reserved.

Performance of Trickle Bed Reactor and ActiveCarbon in the Liquid Phase Oxidation of Phenol∗
Nigus Gabbiye, Josep Font, Agusti Fortuny, Christophe Bengoa, Azael Fabregat,and Frank Stuber
Abstract
Application of trickle-bed reactor and active carbon catalyst to catalytic wet airoxidation of phenolic pollutants is explored over a wide range of operating condi-tions. The study focuses on the assessment of key engineering aspects such as re-actor start-up, gas-liquid flow directions and effects of temperature, pressure, phe-nol feed concentration and liquid flow rate on activity and stability performanceof unsupported active carbon. Moreover, for analyzing the potential integration ofCWAO as a pre-treatment in biological wastewater remediation, intermediate dis-tribution and biodegradability enhancement of treated effluents are obtained fromHPLC analysis and respirometry assays, respectively. Finally, since slow carbonburn-off is occurring at CWAO conditions, some promising options for improve-ment of catalyst stability are pointed out on both molecular (iron coating of activecarbon) and reactor (periodic reactor operation) scale.
KEYWORDS: trickle bed reactor, phenol, oxidation, active carbon, reactor start-up, up-flow mode, activity, stability, biodegradability
∗This work has been partly funded by the Spanish Ministry of Education and Science (researchgrant CTM2005-1873/TECNO). Several authors are members of the CREPI research group fundedby the Catalan Generalitat (Grup de Recerca Consolidat de la Generalitat de Catalunya, SGR05-00792). We are also indebted to Rovira i Virgili University for providing a PhD grant for one ofthe authors.

1. INTRODUCTION Industrial process waters frequently contain hazardous organic substances, which are toxic, inhibitory, or simply resistant to biological decomposition in WWTPs. In particular, phenol is considered as an important aromatic pollutant due to its utilization in diverse chemical processes. For example, the annual release of phenol waste was estimated to attain 2930 tons in USA (EPA, 2006) and 450 tons in Europe (EPER, 2004). Alternative methods for the efficient remediation of phenolic wastewater are thus required to preserve the aquatic environment. Over the last decade, several state of the art reviews have been published on the progress made in oxidative treatments such as wet air oxidation (Mishra et al., 1995; Levec and Pintar, 2007), supercritical water oxidation (Kritzer and Dinjuis, 2001) and advanced oxidation processes (Gogate and Bandit, 2004). It appears that integration of chemical pretreatment in existing biological treatment facilities is becoming very attractive. Chemical oxidation of aromatic pollutants greatly reduces their negative impact on the biological step, while the latter avoids the need for complete pollutant mineralization in the chemical oxidation step.
Among the chemical treatments investigated, catalytic wet air oxidation (CWAO) conducted in laboratory fixed bed reactor (FBR) was pointed out for the destruction of phenolic compounds at medium (0.5-10 g/L) pollutant concentrations (Mishra et al., 1995; Levec and Pintar, 1995; Suarez-Ojeda et al., 2005; Guo and Al-Dahhan, 2006; Levec and Pintar, 2007). Several noble metal and (mixed) metal oxide supported catalysts have been developed and successfully tested in the oxidation of phenolic compounds, carboxylic acids and some industrial effluents (Mishra et al., 1995; Levec and Pintar, 2007). However, these catalysts are too expensive for use in non-productive processes or may deactivate fast at operating conditions of CWAO (Qin et al., 2001; Arena et al., 2003, Hamoudi et al., 1998).
Alternatively, some commercial carbons (AC) have demonstrated a catalytic potential for removing non biodegradable phenolic compounds from wastewater at convenient temperatures and pressures (Tukac and Hanika, 1998; Suarez-Ojeda et al., 2005; Santos et al., 2006). In fact, the catalytic activities performed with the ACs were very similar to those observed for most of the supported catalysts (Tukac and Hanika, 1998; Fortuny et al., 1999; Stüber et al., 2001; Suwanprasop et al., 2005; Santos et al., 2006). It is also reported that homogeneous condensation reactions and burn off can occur during CWAO over ACs. On one hand, condensation products arising from oxidative coupling reactions are thought to irreversibly adsorb on the catalyst surface (Grant and King, 1990; Cooney and Xi, 1994) and block part of the active sites, thereby lowering the phenol removal rate. On the other hand, slow AC oxidation occurring at typical CWAO conditions can progressively reduce the amount of
1Gabbiye et al.: TBR for the CWAO of Phenol over Active Carbon
Published by The Berkeley Electronic Press, 2010
catalyst in the reactor leading to variable catalytic activity (Fortuny et al., 1999). The selection of adequate operating conditions and strategies is then becoming crucial for achieving optimal process efficiency in terms of catalytic activity and stability.
On reactor scale, the intrinsic performance of AC is affected by the operating conditions, establishing flow hydrodynamics and the way how phenol and oxygen are initially contacted with AC to reach steady state conditions of adsorption and reaction. Considerable efforts have been done in this direction (Tukac and Hanika, 1998; Fortuny et al., 1999; Stüber et al., 2001; Tukac et al., 2001; Suwanprasop et al., 2005; Stüber et al., 2005; Santos et al., 2006; Ayude et al., 2007; Quintanilla et al., 2008), however CWAO over AC in Trickle Bed Reactor is yet not mature for industrial application and a better global process understanding is desirable.
In this work, different start up procedures, hydrodynamic configurations and main operating variables (PO2, T, CPh,0, FL and FG) have been investigated using a commercial Merck carbon and laboratory Trickle Bed Reactor. An attempt is also made to correlate the enhancement of biodegradability of CWAO treated effluents with conversion or intermediate product distributions. Finally, strategies for stability improvements on molecular (iron coating) and reactor scale (periodic operation) are briefly highlighted as promising options for further optimization of CWAO processes.
2. EXPERIMENTAL 2.1. Materials. Analytical-grade phenol was purchased from Merck to prepare aqueous phenol solution with deionized water and high purity synthetic air was used as oxidant. A wood based activated carbon (Merck #102518) served as catalyst with ash content of 3.8%, BET specific surface area of 1156 m2/g, pore volume of 0.55 cm3/g and mean pore diameter of 1.4 nm. Phenol adsorption tests under oxic atmosphere gave a maximum capacity of 370 mg Ph/g AC at 20°C. Prior to TBR experiments, the 2.5 mm carbon particles were crushed and sieved to obtain the diameter fraction of 0.5 mm. Each sample was washed with deionized water to remove fines, dried at 105 °C overnight, and stored under inert atmosphere at room temperature.
2 International Journal of Chemical Reactor Engineering Vol. 8 [2010], Article A76
http://www.bepress.com/ijcre/vol8/A76

2.2. Experimental set-up. All standard experiments were conducted in a laboratory fixed bed reactor with cocurrent gas-liquid down or up flow. The fixed bed reactor consisted of a SS-316 tube (20 cm long, 1.1 cm I.D.) normally filled with 7-7.5 g of carbon and placed in an electrical oven to control reaction temperature (+1oC). The liquid was supplied to the reactor by a high-pressure metric pump (Eldex AA-100-S2, Napa, CA, USA) that can dispense between 10 and 150 mL/h from a 5 L liquid feed tank. High purity synthetic air or nitrogen was fed from a gas cylinder at the required operating pressure. The liquid and gas streams were mixed and passed through a 1 m long heating coil also placed in the oven to reach the reaction temperature. The gas-liquid mixture then entered the catalyst bed, which was retained between two metal grids. The exit solution was directed to sampling and liquid-gas separation facilities. A needle valve followed by a gas flow meter was mounted in the gas exit line of the gas-liquid separator to reduce pressure and measure the gas flow rate. A scheme of the entire laboratory equipment is illustrated in Figure 1.
Figure 1. Experimental set-up for continuous CWAO of phenol: (1) feed vessel, (2) high pressure liquid pump, (3) pulse dampener, (4) oven, (5) trickle bed reactor, (6) gas liquid separator, (7) sampling and (8) gas flow meter.
3Gabbiye et al.: TBR for the CWAO of Phenol over Active Carbon
Published by The Berkeley Electronic Press, 2010

2.3. Trickle Bed Reactor experiments. Different series of experiments as described below were conducted in a laboratory trickle bed reactor at operating conditions listed in table 1. In fact, Eftaxias et al (2006) already studied the effect of temperature and oxygen partial pressure on phenol and TOC removal over the same catalyst in order to obtain oxidation kinetics for the steady state modeling of the CWAO process. However, the catalyst used in this study showed a significantly lower activity (by 40% compared to standard one).
Repetition of these experiments was necessary to update the kinetic parameters of the previously developed kinetic expressions. The new kinetics will serve for the modeling of CWAO under gas flow and feed temperature modulation, a task, which is currently in progress in our research group in collaboration with a group from INTEMA of University of Mar de Plata (Argentine). Table 1. Operating conditions used in laboratory reactor.
Parameter Laboratory Reactor DR (cm) 1.1 LR (cm) 20 dP (mm) 0.5 єB 0.58 Wcat (g) 2.5-7.5 CPh,o (g/L) 0.5-10 PO2 (bar) 0.5-3.6 T (oC) 120-160 τ (h) 0.04 -0.5 FL (L/h) 0.015-0.15 uL (mm/s) 0.04-0.5 FG (NL/h) 5-20 uG (mm/s) 2.5-10 G-L flow up, down
2.3.1 Reactor Start-up. Four different reactor start-up procedures were tested to investigate the effect of initial saturation of activated carbon on its catalytic performance. In the standard procedure (140ºC reached after 30-40 min, 2 bar of oxygen partial pressure, liquid space time of 0.12 h, 5 g/L of phenol and 7.5 g of AC), air and aqueous phenol
4 International Journal of Chemical Reactor Engineering Vol. 8 [2010], Article A76
http://www.bepress.com/ijcre/vol8/A76

solution were simultaneously fed to the reactor to establish steady state of adsorption and reaction under oxic conditions.
In an attempt to reduce the saturation period of the catalyst bed, 7.5 g of AC were pre-saturated at room temperature in a gently stirred vessel filled with 200 mL of 8 g/L phenol solution in contact with air atmosphere. After 6 h, the catalyst was filtered, dried overnight at 105ºC and loaded into the reactor to run an oxidation experiment at standard conditions. Likewise, 7.5 g of fresh AC was contacted in-situ with high phenol concentration (10 g/L) and high liquid flow rate (100 mL/h) to accelerate AC saturation. On observing the phenol break through after 4 h of TOS, inlet phenol concentration and liquid flow rate were set back to its standard values of 5 g/L and 60 mL/h to proceed with the TBR experiment.
Finally, the influence of inert atmosphere on the AC performance was studied using N2 flow during saturation at standard conditions. On completing bed saturation (after 6 h of TOS), the N2 flow was changed to air flow to start the oxidation experiment. Each AC sample was collected at the end of the oxidation run to perform TGA and N2 adsorption-desorption test. 2.3.2. Hydrodynamic tests. Liquid space time was varied in the range of 0.03 to 0.13 h by either changing liquid flow rate (constant bed length) or the catalyst load (constant liquid flow rate). Further oxidation runs with diluted catalyst bed using inert material of same particle size have been performed. To assess the influence of catalyst wetting and mass transfer limitations, the catalyst bed was initially pre-wetted (for trickle flow) following the Levec method or operated in up-flow to provide conditions of complete external catalyst wetting. 2.3.3. Activity tests. For the activity tests, temperature, oxygen partial pressure, liquid flow rate and phenol inlet concentration were varied between 120oC-160oC, 0.5-3.6 bar, 30-100 mL/h and 0.5-10 g/L, respectively. On reaching first steady state of adsorption and reaction at 140ºC, 2 bar of oxygen pressure and a given space time, sequential variation of phenol inlet concentration (from 5 g/L to 2.5 g/L, 1 g/L, 0.5 g/L 10 g/L and back to 5 g/L) was performed with the same AC load. A similar (sequential) strategy was adopted in the experiments conducted at different temperature and oxygen partial pressures. For each experimental sequence fresh catalyst was used in order to minimize deactivation. A standard gas flow rate and particle diameter of 9 NL/h and 0.5 mm, respectively were chosen to eliminate
5Gabbiye et al.: TBR for the CWAO of Phenol over Active Carbon
Published by The Berkeley Electronic Press, 2010

external and internal mass transfer resistances in trickle flow regime (Stüber et al., 2001). 2.3.4. Stability tests. The stability of AC (or Fe/AC) was monitored during CWAO in terms of phenol conversion and carbon weight loss for both continuous TBR operation and periodic TBR operation at 160ºC and 2 bar of oxygen partial pressure. For iron impregnation, the active carbon was first thoroughly washed with nitric or sulfuric acid and then coated with iron by the ion-exchange method. The modified AC samples were subsequently immersed for 2 days in FeCl2 solution (at 2% wt. of Fe) in an orbital shaker and washed with distillated water and dried overnight at 105ºC. In a final step, the samples were carbonized in a horizontal furnace at a heating rate of 20ºC/min up to 1000ºC and cooled down to room temperature. The so prepared active carbon samples had a total iron content of 1.4 to 2% in weight.
Periodic TBR operation (modulation of gas feed flow and composition) was achieved by simple means of a timer controlled on-off three valve mounted in the junction of air and nitrogen feed lines (Ayude et al., 2007). In this way, periodic cycles of reaction and adsorption were imposed on TBR operation using air and nitrogen for composition modulation or air and no gas flow for on-off modulation. 2.4. Analytical methods. The liquid samples withdrawn during CWAO were all analyzed on phenol and oxidation intermediate products (hydrobenzoic acid (4–HBA), quinones, carboxylic acids) with a high performance liquid chromatography (HPLC). The separation of organic reaction products was achieved in a ProntoSIL C18 reverse phase column and an acidified mobile phase (pH=1.4) of variable composition (deionized water and HPLC grade methanol) fed to the column at 1 mL/min. The separated compounds were visualized as peaks using a UV detector at a wavelength of 254 nm and identified/quantified by means of prepared standard solution. The phenol calibration curve was regularly checked with a fresh standard solution to detect and eventually correct deviations in column performance. For TOC measurement, a TOC analyzer equipped with a non-dispersive infrared detector (NDIR) was employed. Prior to analysis, the sample was acidified with 2N HCl (pH = 2) to completely dissolve the inorganic carbon of the liquid sample. The experimental results were expressed as phenol and TOC conversion according to eq.1, where Cin and Cout denoting inlet and outlet phenol or TOC concentrations (g/L).
6 International Journal of Chemical Reactor Engineering Vol. 8 [2010], Article A76
http://www.bepress.com/ijcre/vol8/A76

in
outinXCCC −
= (1)
Some of the treated effluents were subjected to biodegradability tests
respirometry using a LFS respirometer. The biomass used (not adapted to metabolise phenol) was provided from a municipal biological WWTP near Tarragona and all tests were done with a pulse of 20 mgCOD/L of phenol feed solution or CWAO effluent at pH = 7.5 and 30ºC. More details can be found in Suarez-Ojeda et al. (2007). From respirometric tests, the oxygen uptake rate (OUR) and the oxygen consumption (OC) in the liquid phase can be calculated following a standard protocol (Spanjers et al., 1998). The fraction of the readily biodegradable CODRB is obtained using the heterotrophic yield coefficient (YH), which represents the fraction of the substrate employed for production of new biomass:
HRB 1
OCCODY−
= (2)
and:
100 x
CODCOD
%CODadded
RBRB = (3)
It should be mentioned that the total biodegradable CODTB is the sum of the readily and slowly biodegradable COD fractions, according to the bi-substrate model originally proposed by Dold et al. (1980). However, the determination of total CODTB requires a combination of several techniques and particularly, the assessment of the CODSB is extremely time-consuming. For this reason, the CODRB, which is available by fast respirometric experiments, was chosen as parameter to quantify the biodegradability of CWAO effluents.
Thermogravimetric analysis (TGA) was carried out on a Perkin-Elmer TGA 7 microbalance (accuracy of ±1 μg) equipped with an automatically programmed temperature controller. A sample of 21 mg was first heated from 100ºC up to 400ºC at a heating rate of 10ºC/min, hold at 400ºC for one hour to remove any strongly adsorbed compounds and then heated to 900oC at the same heating rate. The textural properties of AC (BET surface area and micropore volum) were determined on a 500 mg sample of AC by N2 physisorption-adsorption isotherm at 77 K using a micromeritics instrument model ASAP 2000 surface area analyzer.
7Gabbiye et al.: TBR for the CWAO of Phenol over Active Carbon
Published by The Berkeley Electronic Press, 2010

3. RESULTS AND DISCUSSION 3.1. Effect of start up procedures. The time-conversion profiles obtained with standard (air flow), anoxic (nitrogen flow), externally or fast in-situ saturation of the AC bed are plotted in Figures 2a and 2b. A particularity of CWAO over AC is the start-up period, during which adsorption and reaction evolutes to an apparent steady state. Figure 2a reveals that bed saturation with phenol (apparent 100% conversion) at standard conditions lasts about 10 h, but steady state of adsorption and reaction is only established after 20 h with a phenol conversion of 40-45%. Conducting experiments with external or fast in-situ bed saturation does not have the expected effect of reaching faster steady state (see Figure 2a). Moreover, a permanent decrease of phenol conversion to about 25-28% is observed for both saturation modes. Similar trends are reflected in Figure 2b, which compares the temporal evolution of phenol conversion achieved with standard or anoxic (nitrogen flow) bed saturation. Besides the noticeable but expected initial deviation in the profiles, the phenol conversion in the case of inert saturation also needs ca. 10 h more to attain steady state. Then, conversion undergoes a slight decline, but values are always 15% higher for oxic bed saturation. Similar results were reported in a related study using the same Fe/AC catalyst for the CWAO of phenol (Quintanilla et al., 2008). The way how the carbon particles are contacted with phenol seems to significantly alter the initial activity of the carbon, which evolutes to a stable but different steady state conversion. Best long-term performance is achieved for progressive (unforced) bed saturation in the presence of dissolved oxygen reflecting the importance of formation, adsorption and destruction of so called phenolic condensation products. AC enhances the formation of coupling products (Grant and King, 1990; Cooney and Xi, 1994), which irreversibly adsorb on its surface, thereby blocking active sites in meso pores and mainly the access to active sites located in micro pores. The amount of adsorbed condensation products formed and adsorbed will be high (and so the initial decrease of activity) at conditions of high concentration of phenol in the liquid phase (external and fast saturation) and absence of dissolved oxygen. On the other hand, if enough dissolved oxygen is available from the beginning, their formation and subsequent oxidation will certainly be balanced recovering partly the textural structure of the carbon surface.
8 International Journal of Chemical Reactor Engineering Vol. 8 [2010], Article A76
http://www.bepress.com/ijcre/vol8/A76

X phe
nol
0.0
0.2
0.4
0.6
0.8
1.0
time on stream (h)
0 10 20 30 40 50 60
X phe
nol
0.0
0.2
0.4
0.6
0.8
a
b
Figure 2. Time-phenol conversion profile for different AC saturation tested: a) (■) standard saturation, (∆) external saturation, (●) fast in situ saturation (switch after 6h); b) (□) saturation under nitrogen (switch alter 4h); T= 140ºC, PO2=2 bar, τ = 0.12 h, CPh,0 = 5 g/L, FG = 9 Nl/h , and Wcat,0 =7.5 g. Measurements of catalyst weight, TGA and surface area analysis were done on fresh and spent AC samples to indirectly support this hypothesis. and results obtained are given in table 2.
9Gabbiye et al.: TBR for the CWAO of Phenol over Active Carbon
Published by The Berkeley Electronic Press, 2010

Table 2. BET surface area, TGA weight loss and weight change of spent active carbon samples recovered after 50 h of CWAO conducted at T = 140oC, PO2 = 2 bar, τ = 0.12 h, FG = 9 Nl/h and Wcat,0 =7.5 g.
Carbon sample SBET (m2/g) ΔWTGA (%) ΔWCWAO (%) Fresh AC 1156 6 --- AC standard saturation 306 14 10 AC inert saturation 196 23 22 AC external saturation 80 23 22 AC in-situ saturation 70 25 28
From table 2 it can be concluded that the carbons (external and fast in-situ saturation) that suffered the strongest decrease of conversion showed a particularly high reduction of surface area from ca. 1200 m2/g to 70-80 m2/g and at the same time a high weight gain during CWAO and a high weight loss in TGA. This loss in surface area must be mainly attributed to initial though irreversible blockage of micro pores (by condensation products), which therefore can no longer participate in the oxidation of phenol after bed saturation. 3.2. Flow hydrodynamics. Gas-liquid flow irregularities and catalyst wetting in TBR can strongly impact on the reactor performance. The influence of eventual maldistribution in the trickling gas-liquid flow was indirectly checked by ranging the liquid space-times from 0.03 to 0.15 h as explained in section 2.3.
Figure 3 illustrates the performed results of phenol conversion versus liquid space time. It is seen that variable catalyst bed length and liquid flow rate or catalyst dilution resulted in very similar phenol conversion profiles suggesting the establishment of proper trickle flow regime in the range of liquid flow rate studied.
Also, initial pre-wetting of the catalyst particles following the method of Levec did not cause any appreciable differences in phenol conversions (not shown here) obtained with and without prewetting. It appears that the given LR/DR and DR/dp ratios of ca. 20 are high enough to allow for uniform development of gas-liquid trickling flow inside the catalytic bed of our laboratory reactor. Similarly, effects of axial dispersion should not be present since the criteria of Mears is always fulfilled even for the lowest liquid flow rates corresponding to lowest Bodenstein numbers and highest phenol conversion.
10 International Journal of Chemical Reactor Engineering Vol. 8 [2010], Article A76
http://www.bepress.com/ijcre/vol8/A76

liquid space time (h)0.00 0.03 0.06 0.09 0.12 0.15
X phen
ol
0.0
0.1
0.2
0.3
0.4
0.5
0.6
Figure 3. Phenol conversion versus liquid space time: (●) variable liquid flow rate, (▼) variable catalyst weight, (■) variable catalyst weight with dilution. T= 140ºC, PO2 =2 bar, CPh,0 = 5 g/L, FG = 9 Nl/h and Wcat,0 =7.5 g.
Catalyst wetting is a key variable for fixed bed reactor and its effect on reactor performance can be readily assessed by running the same experiment in down and upflow of gas-liquid flow. The latter provides completely wetted catalyst particles throughout bubble regime, whereas the former reflects the situation of varying partial wetting in trickle flow (estimated in our study to range between fw= 0.2-0.5 depending on the liquid flow rate employed). The criterion of species availability (γ) at reaction sites proposed by Khadilkar et al. (1996) was calculated at 160ºC and 2 bar of oxygen partial pressure. The high value (γ=17) diagnoses that the limiting reactant is oxygen in the gas phase and trickle bed flow would be preferred over upflow mode.
Figure 4 compares the upflow and downflow profiles of phenol conversion measured at 160ºC and 2 bar of oxygen pressure. As predicted by the γ criterion, downflow mode largely outperforms upflow mode. The former is certainly favored by direct gas-solid transfer that enhances the reaction rate contrary to the latter, where oxygen has to be provided throughout a liquid film that covers the catalysts particle originating thereby limitation of gas-liquid mass transfer of oxygen to the active sites.
11Gabbiye et al.: TBR for the CWAO of Phenol over Active Carbon
Published by The Berkeley Electronic Press, 2010
time on stream (h)0 25 50 75 100 125 150
X phen
ol
0
20
40
60
80
100
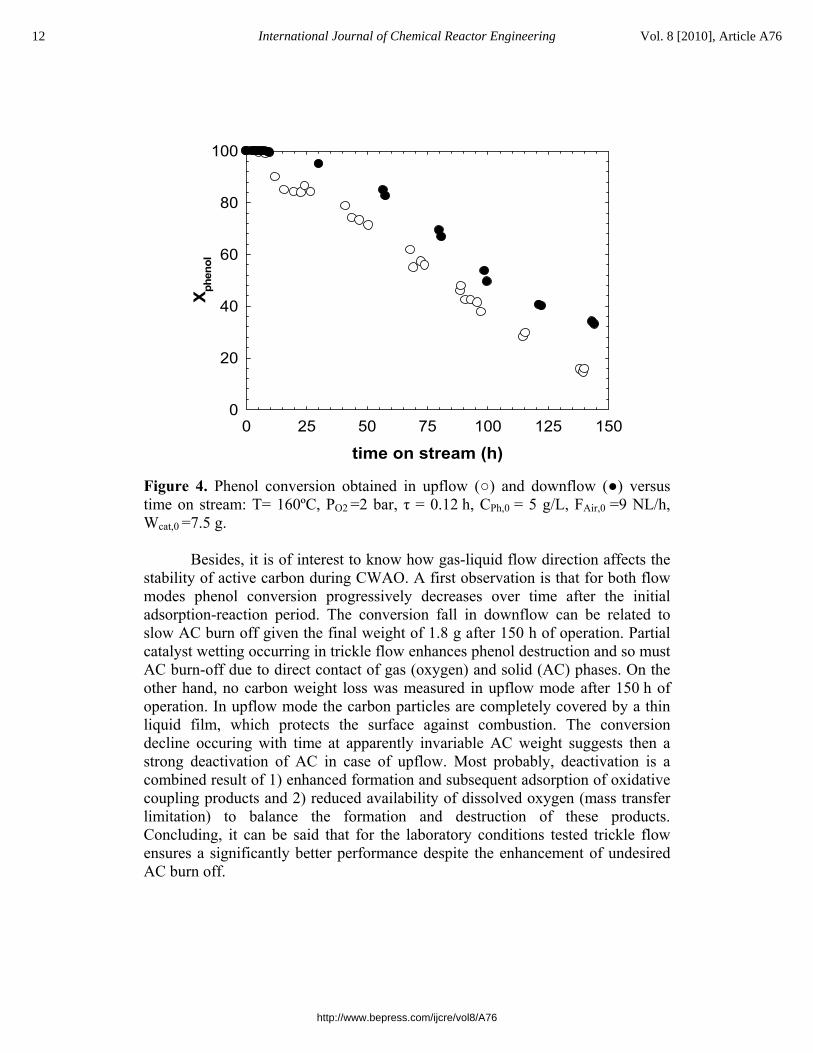
Figure 4. Phenol conversion obtained in upflow (○) and downflow (●) versus time on stream: T= 160ºC, PO2 =2 bar, τ = 0.12 h, CPh,0 = 5 g/L, FAir,0 =9 NL/h, Wcat,0 =7.5 g.
Besides, it is of interest to know how gas-liquid flow direction affects the
stability of active carbon during CWAO. A first observation is that for both flow modes phenol conversion progressively decreases over time after the initial adsorption-reaction period. The conversion fall in downflow can be related to slow AC burn off given the final weight of 1.8 g after 150 h of operation. Partial catalyst wetting occurring in trickle flow enhances phenol destruction and so must AC burn-off due to direct contact of gas (oxygen) and solid (AC) phases. On the other hand, no carbon weight loss was measured in upflow mode after 150 h of operation. In upflow mode the carbon particles are completely covered by a thin liquid film, which protects the surface against combustion. The conversion decline occuring with time at apparently invariable AC weight suggests then a strong deactivation of AC in case of upflow. Most probably, deactivation is a combined result of 1) enhanced formation and subsequent adsorption of oxidative coupling products and 2) reduced availability of dissolved oxygen (mass transfer limitation) to balance the formation and destruction of these products. Concluding, it can be said that for the laboratory conditions tested trickle flow ensures a significantly better performance despite the enhancement of undesired AC burn off.
12 International Journal of Chemical Reactor Engineering Vol. 8 [2010], Article A76
http://www.bepress.com/ijcre/vol8/A76
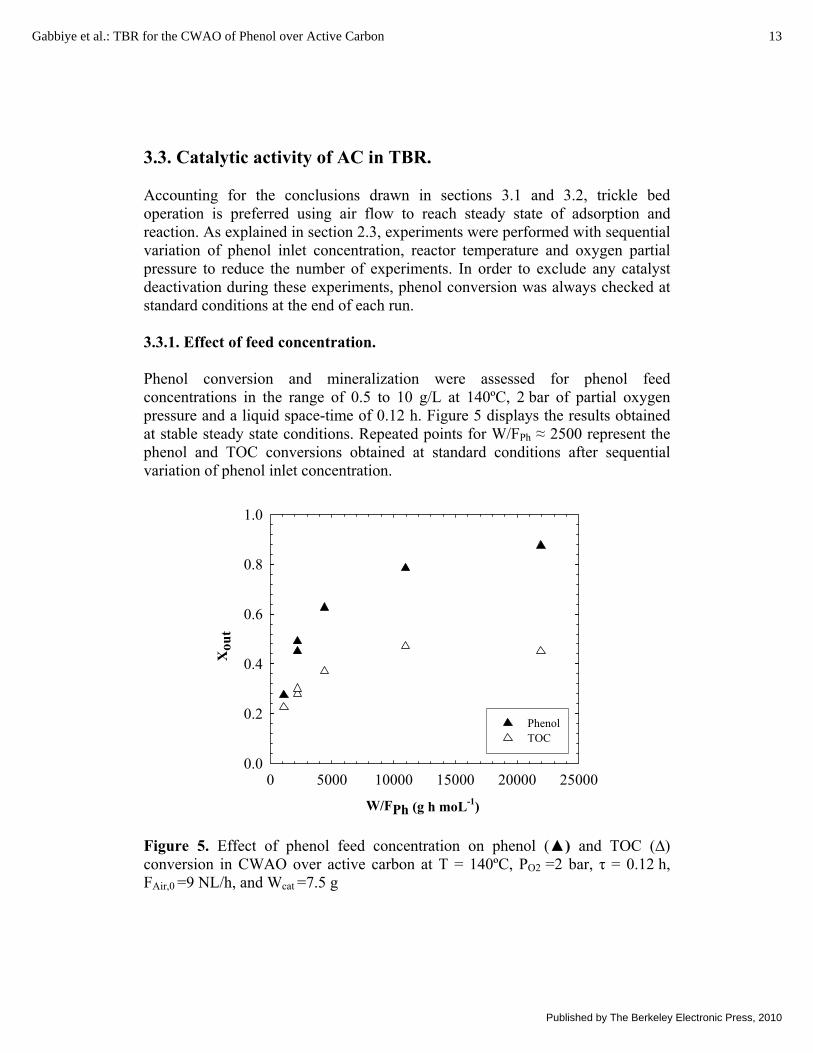
3.3. Catalytic activity of AC in TBR. Accounting for the conclusions drawn in sections 3.1 and 3.2, trickle bed operation is preferred using air flow to reach steady state of adsorption and reaction. As explained in section 2.3, experiments were performed with sequential variation of phenol inlet concentration, reactor temperature and oxygen partial pressure to reduce the number of experiments. In order to exclude any catalyst deactivation during these experiments, phenol conversion was always checked at standard conditions at the end of each run. 3.3.1. Effect of feed concentration. Phenol conversion and mineralization were assessed for phenol feed concentrations in the range of 0.5 to 10 g/L at 140ºC, 2 bar of partial oxygen pressure and a liquid space-time of 0.12 h. Figure 5 displays the results obtained at stable steady state conditions. Repeated points for W/FPh ≈ 2500 represent the phenol and TOC conversions obtained at standard conditions after sequential variation of phenol inlet concentration.
W/FPh (g h moL-1)
0 5000 10000 15000 20000 25000
Xou
t
0.0
0.2
0.4
0.6
0.8
1.0
PhenolTOC
Figure 5. Effect of phenol feed concentration on phenol (▲) and TOC (∆) conversion in CWAO over active carbon at T = 140ºC, PO2 =2 bar, τ = 0.12 h, FAir,0 =9 NL/h, and Wcat =7.5 g
13Gabbiye et al.: TBR for the CWAO of Phenol over Active Carbon
Published by The Berkeley Electronic Press, 2010

Figure 5 reveals a progressive increase of phenol and TOC conversion with increasing W/FPh (decreasing phenol inlet concentration). For example, over 80% and 50% of phenol and TOC are respectively eliminated at 0.5 g/L (highest W/FPh) compared to only 28% and 22% at 10 g/L (lowest W/FPh). This suggests that the oxidation of phenol does not follow a first order with respect to phenol concentration contrary to what has been mostly reported in literature (Eftaxias et al., 2006). Adsorption and reaction of phenol in adsorbed state (Langmuir–Hinshelwood surface reaction mechanism) were used to explain a non liner increase in reaction rates for higher phenol surface coverage (Santos et al., 2005). On the other hand, no relationship between adsorption capacity and activity was found for several carbons studied in the CWAO of phenol (Stüber et al., 2005). The role that may play active carbon in the oxidation of phenol is yet not clear, but AC can also adsorb and dissociate molecular oxygen on its surface, generating reactive free radicals that subsequently attack phenol molecules in the liquid phase close to the carbon surface. Further research on molecular level is required to better understand the catalytic actuation of carbon in the oxidation of phenol. 3.3.2. Effect of temperature and partial oxygen pressure. Phenol and TOC removal during CWAO were measured in the range of 120-160ºC and 6-21 bar of total pressure corresponding to 0.5-3.6 bar of oxygen partial pressure.
Figure 6 evidences the expected strong influence of temperature on phenol and TOC oxidation. Respectively 89% and 74% of phenol and TOC were eliminated at 160ºC against 17 and 10% at 120ºC. Destruction can be further extended to quasi complete elimination of phenol (X> 99%) and a maximum TOC removal of ca. 85% for space times of 0.3 to 0.35 h.
The observed sensibility to temperature indicates that reaction should proceed in the kinetic controlled regime with the “standard” Merck carbon. The reaction rates estimated at zero space time for different reactor temperatures allow thus calculating the activation energy for phenol oxidation. The new value of activation energy (obtained with a regression coefficient of R2=0.97) is ca. 60 kJ/mol, thus 15% smaller than the 70 kJ/mol reported in the earlier study of Eftaxias et al. (2006) with a less active Merck carbon.
14 International Journal of Chemical Reactor Engineering Vol. 8 [2010], Article A76
http://www.bepress.com/ijcre/vol8/A76
temperature (oC)120 130 140 150 160
X outle
t
0.0
0.2
0.4
0.6
0.8
1.0
PhenolTOC
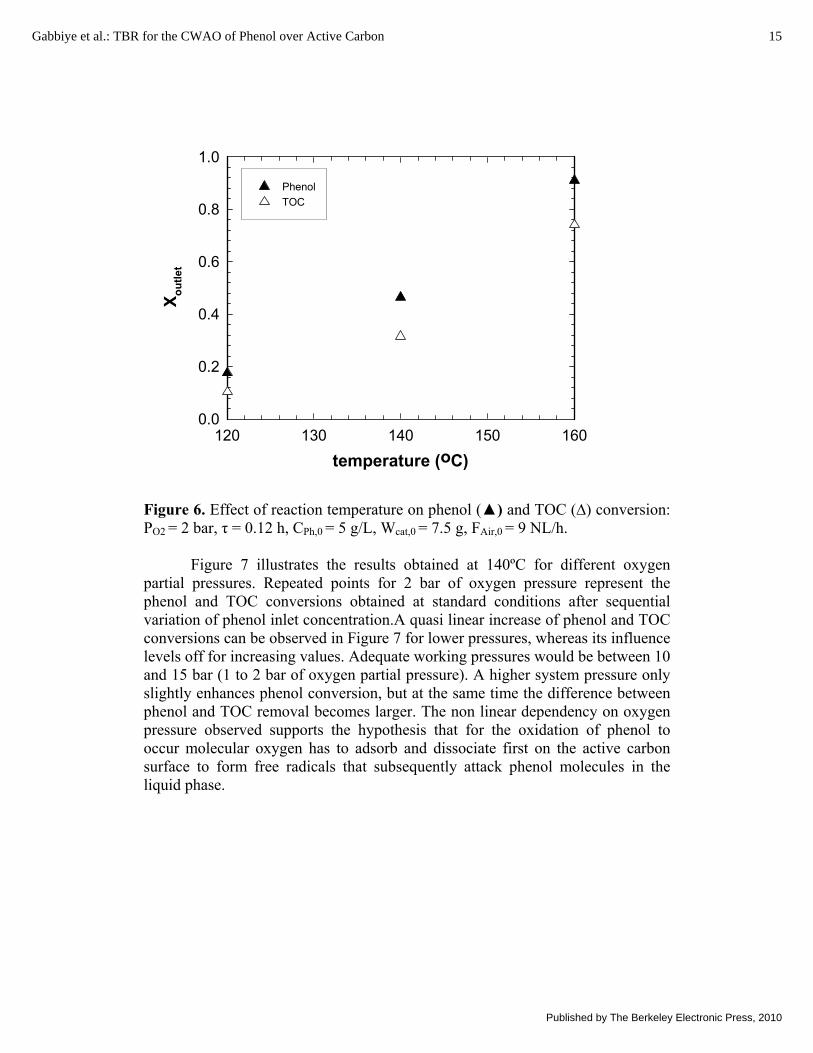
Figure 6. Effect of reaction temperature on phenol (▲) and TOC (∆) conversion: PO2 = 2 bar, τ = 0.12 h, CPh,0 = 5 g/L, Wcat,0 = 7.5 g, FAir,0 = 9 NL/h.
Figure 7 illustrates the results obtained at 140ºC for different oxygen
partial pressures. Repeated points for 2 bar of oxygen pressure represent the phenol and TOC conversions obtained at standard conditions after sequential variation of phenol inlet concentration.A quasi linear increase of phenol and TOC conversions can be observed in Figure 7 for lower pressures, whereas its influence levels off for increasing values. Adequate working pressures would be between 10 and 15 bar (1 to 2 bar of oxygen partial pressure). A higher system pressure only slightly enhances phenol conversion, but at the same time the difference between phenol and TOC removal becomes larger. The non linear dependency on oxygen pressure observed supports the hypothesis that for the oxidation of phenol to occur molecular oxygen has to adsorb and dissociate first on the active carbon surface to form free radicals that subsequently attack phenol molecules in the liquid phase.
15Gabbiye et al.: TBR for the CWAO of Phenol over Active Carbon
Published by The Berkeley Electronic Press, 2010

oxygen partial pressure (bar)0 1 2 3 4
Xou
t
0.0
0.1
0.2
0.3
0.4
0.5
0.6
PhenolTOC
Figure 7. Effect of oxygen partial pressure on phenol (▲) and TOC (∆) conversion: T = 140ºC, τ = 0.12 h, CPh,0 = 5 g/L and Wcat,0 =7.5 g.
Summarising the results, temperature and oxygen partial pressure can be considered as the key parameters in controlling the reaction rate of phenol CWAO over AC conducted in TBR. Maximum possible destruction capacity in downflow corresponds to phenol conversions beyond 99% and 80-85% of TOC removal at 160ºC, 2 bar of oxygen partial pressure and space times around 0.3 h. 3.3.3. Intermediate distribution and effluent biodegradability. Intermediate products detected during CWAO of 5 g/L phenol solutions over commercial Merck carbon are p-Hydrobenzoic acid (4-HBA), benzoquinones, traces of hydroquinone, catecol and oxalic acid as well as maleic, formic and acetic acid. The appearance of 4-HBA in CWAO of phenol over active carbon was reported by different authors, however the mechanism of its formation is yet not understood. Maximum amounts of aromatic intermediates (others than phenol) of 1 to 2 mmol/L are measured at phenol conversions around 60%. These aromatic compounds are not refractory and disappear when phenol conversion further increases to 99%.
With respect to carboxylic acids, a total quantity of 35 mmol/L can accumulate in the effluent, being responsible for the pH decrease from initially 6
16 International Journal of Chemical Reactor Engineering Vol. 8 [2010], Article A76
http://www.bepress.com/ijcre/vol8/A76

to 2.5 during CWAO of 5 g/L of phenol. The acidic environment of CWAO has to be accounted for in the selection of reactor materials requiring the use of acidity resistant stainless steel. Maleic, oxalic and formic acid are easily destroyed as the reaction proceeds to high phenol conversions, contrary to acetic acid, which is completely refractory to CWAO over AC and practically accounts for all of the remaining 15% of TOC.
If the final aim of CWAO is simply to pre-treat aqueous effluents, the biodegradability of the treated effluent becomes a key parameter for technical and economic consideration of combined processes. Complete phenol conversion and highest possible TOC removal are certainly convenient but not economically attractive conditions. Additional biodegradability assays of inlet and CWAO treated effluents are then becoming necessary if not imperative to quantify the reduction in biotoxicity achieved.
The calculated CODRB values, effluent compositions and conversions achieved in CWAO of 5 g/L phenol solution at 140-160ºC and 2-9 bar of oxygen pressure are listed in table 3. It was verified that the CODRB value of the inlet phenol solution was 0% meaning that phenol is completely non biodegradable. After CWAO treatment, CODRB increases to 4-36% depending on the CWAO conditions employed in the experiments. Best performance was observed for the effluent treated at 160ºC and 2 bar of oxygen pressure where the COD effluent composition presents at the same time lowest phenol and quinone-like percentages and highest carboxylic acids formation (see table 3).
Related respirometry tests (Suarez-Orejeda et al., 2007) demonstrated that carboxylic acids formed in CWAO can be classified as inert and readily biodegradable intermediates (formic and acetic acids), although some of them (oxalic, maleic, malonic acids and also 4-HBA) can exhibited slow biodegradation. Aromatic compounds such as phenol o-cresol, hydroquinone, p-benzoquinone and catechol are found at least resistant to biodegradation at lower concentration and show inhibitory (catechol, o-cresol) or toxic effects (hydroquinone and p-benzoquinone) at higher levels of pollutant concentrations.
17Gabbiye et al.: TBR for the CWAO of Phenol over Active Carbon
Published by The Berkeley Electronic Press, 2010

Table 3. Biodegradability (CODRB) and COD composition of some CWAO treated effluents.
Conditions
Conversion (%)
CODRB and COD effluent composition (%)
T,ºC PO2, bar XPh XTOC CODRB Acids Phen Quin Cond* N.I**
140
160
140
2
9
2
9
2***
45
58
78
62
64
21
32
62
52
51
4
7.7
36
15
7
13
15.4
35.4
21.6
9.5
70
63
42
40.8
61
3
12.3
7.7
27
12.5
1
4.6
5.4
4.6
---
12
6.1
10
5.7
16.6
*condensation products, **not identified products, ***with 20% of stoichiometric H2O2 amount.
For a rough prediction of biodegradability enhancement, it would be useful to correlate the obtained CODRB with a measurable process parameter (conversion, intermediate concentrations). Table 3 evidences that phenol, COD or TOC conversions are not convenient parameters and the only variable that can be proposed is the COD percentage of carboxylic acids present in the treated effluent.
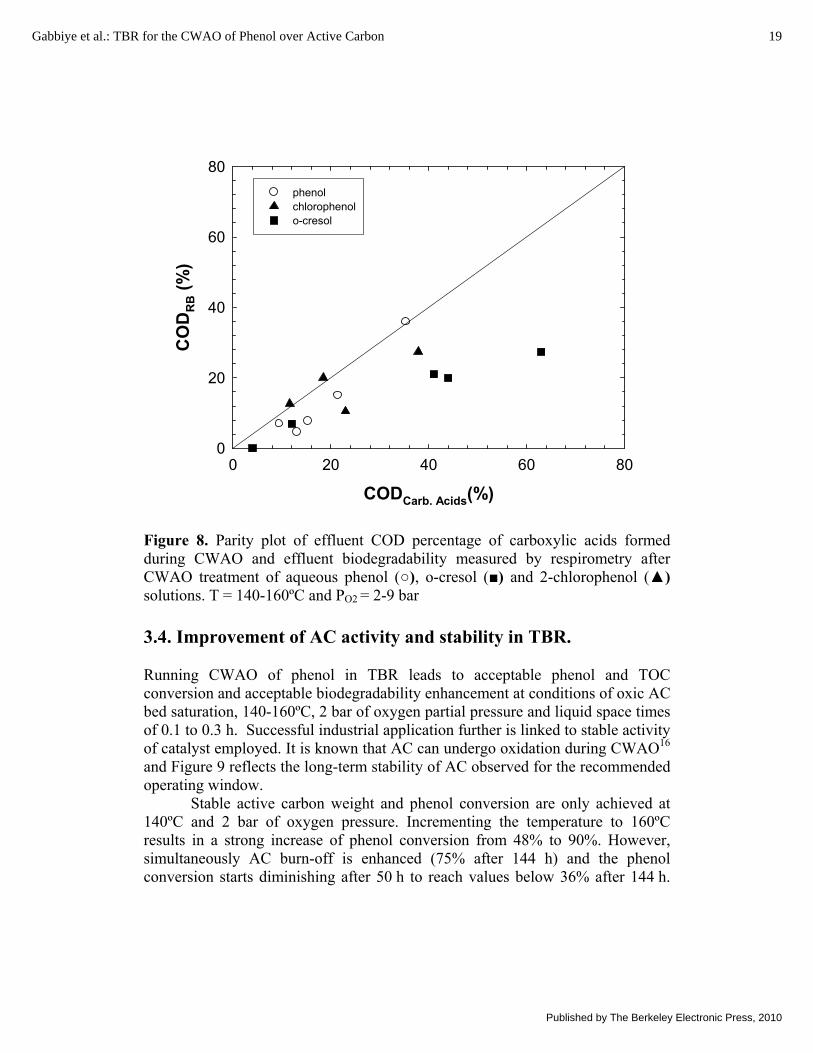
Figure 8 reflects a parity plot of CODRB versus COD percentage of carboxylic acids formed in CWAO of phenol (figure 8 is completed with data on o-cresol and 2-chlorophenol obtained in a related work). The plot suggests that the COD percentage of carboxylic acids that accumulates in the effluent can be taken as a rough measure of the highest possible biodegradability enhancement. For phenol and 2-chlorophenol the correspondence is acceptable whereas o-cresol shows a significant and systematic deviation. A better prediction is possible, if intermediate distribution and inhibitory or toxic effects of compounds are known. For example, the large underestimation for 2-chlorophenol observed at 160ºC and 9 bar of oxygen partial pressure (only 10 % of CODRB for 23% of CODacids) results from the formation of significant amounts of biotoxic hydroquinone and p-benzoquinone and non identified intermediates (24% of effluent COD) having HPLC retention times of quinone-like and aromatic compounds. In case of o-cresol, the deviation is caused by the proven inhibitory effect of the parent reactant itself and the important formation of quinone-like products and non identified intermediates.
Further biodegradability assessment of CWAO effluents issuing from deeper oxidation of intermediates are recommended to extend the validity range of the parity plot to higher COD percentage of carboxylic acids.
18 International Journal of Chemical Reactor Engineering Vol. 8 [2010], Article A76
http://www.bepress.com/ijcre/vol8/A76
CODCarb. Acids(%)0 20 40 60 80
CO
DR
B (%
)
0
20
40
60
80phenolchlorophenolo-cresol
Figure 8. Parity plot of effluent COD percentage of carboxylic acids formed during CWAO and effluent biodegradability measured by respirometry after CWAO treatment of aqueous phenol (○), o-cresol (■) and 2-chlorophenol (▲) solutions. T = 140-160ºC and PO2 = 2-9 bar 3.4. Improvement of AC activity and stability in TBR. Running CWAO of phenol in TBR leads to acceptable phenol and TOC conversion and acceptable biodegradability enhancement at conditions of oxic AC bed saturation, 140-160ºC, 2 bar of oxygen partial pressure and liquid space times of 0.1 to 0.3 h. Successful industrial application further is linked to stable activity of catalyst employed. It is known that AC can undergo oxidation during CWAO16 and Figure 9 reflects the long-term stability of AC observed for the recommended operating window.
Stable active carbon weight and phenol conversion are only achieved at 140ºC and 2 bar of oxygen pressure. Incrementing the temperature to 160ºC results in a strong increase of phenol conversion from 48% to 90%. However, simultaneously AC burn-off is enhanced (75% after 144 h) and the phenol conversion starts diminishing after 50 h to reach values below 36% after 144 h.
19Gabbiye et al.: TBR for the CWAO of Phenol over Active Carbon
Published by The Berkeley Electronic Press, 2010
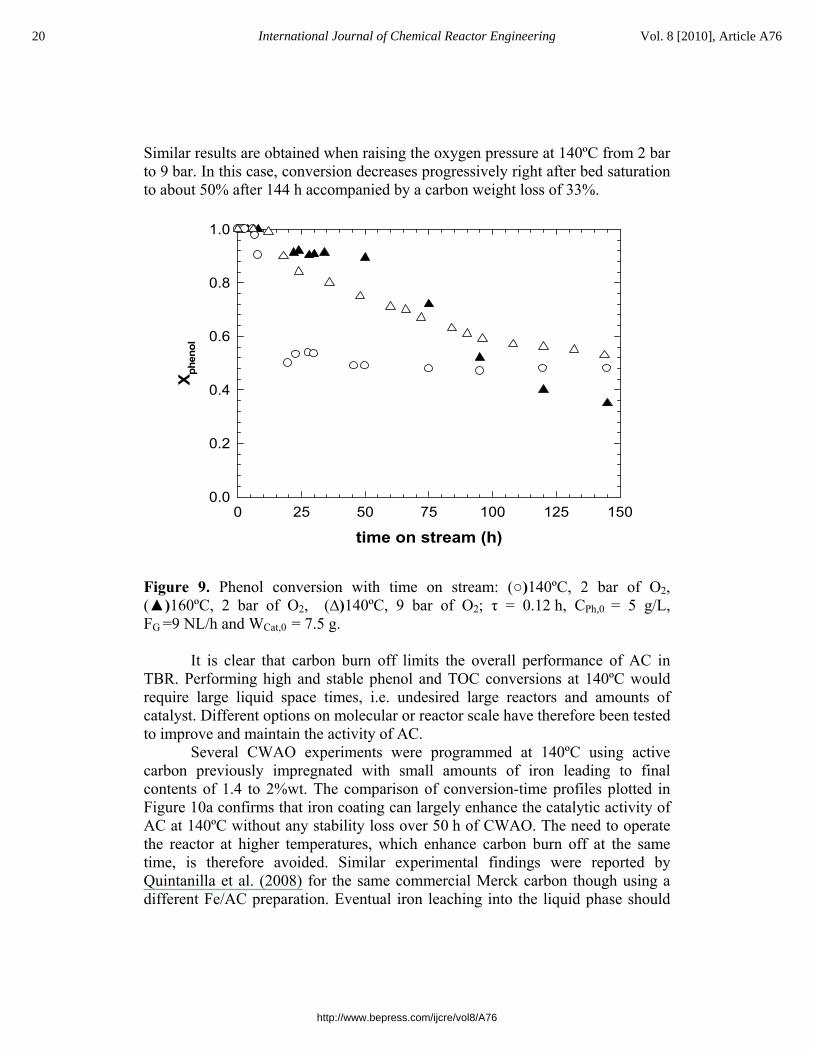
Similar results are obtained when raising the oxygen pressure at 140ºC from 2 bar to 9 bar. In this case, conversion decreases progressively right after bed saturation to about 50% after 144 h accompanied by a carbon weight loss of 33%.
time on stream (h)0 25 50 75 100 125 150
X phen
ol
0.0
0.2
0.4
0.6
0.8
1.0
Figure 9. Phenol conversion with time on stream: (○)140ºC, 2 bar of O2, (▲)160ºC, 2 bar of O2, (∆)140ºC, 9 bar of O2; τ = 0.12 h, CPh,0 = 5 g/L, FG =9 NL/h and WCat,0 = 7.5 g.
It is clear that carbon burn off limits the overall performance of AC in TBR. Performing high and stable phenol and TOC conversions at 140ºC would require large liquid space times, i.e. undesired large reactors and amounts of catalyst. Different options on molecular or reactor scale have therefore been tested to improve and maintain the activity of AC.
Several CWAO experiments were programmed at 140ºC using active carbon previously impregnated with small amounts of iron leading to final contents of 1.4 to 2%wt. The comparison of conversion-time profiles plotted in Figure 10a confirms that iron coating can largely enhance the catalytic activity of AC at 140ºC without any stability loss over 50 h of CWAO. The need to operate the reactor at higher temperatures, which enhance carbon burn off at the same time, is therefore avoided. Similar experimental findings were reported by Quintanilla et al. (2008) for the same commercial Merck carbon though using a different Fe/AC preparation. Eventual iron leaching into the liquid phase should
20 International Journal of Chemical Reactor Engineering Vol. 8 [2010], Article A76
http://www.bepress.com/ijcre/vol8/A76
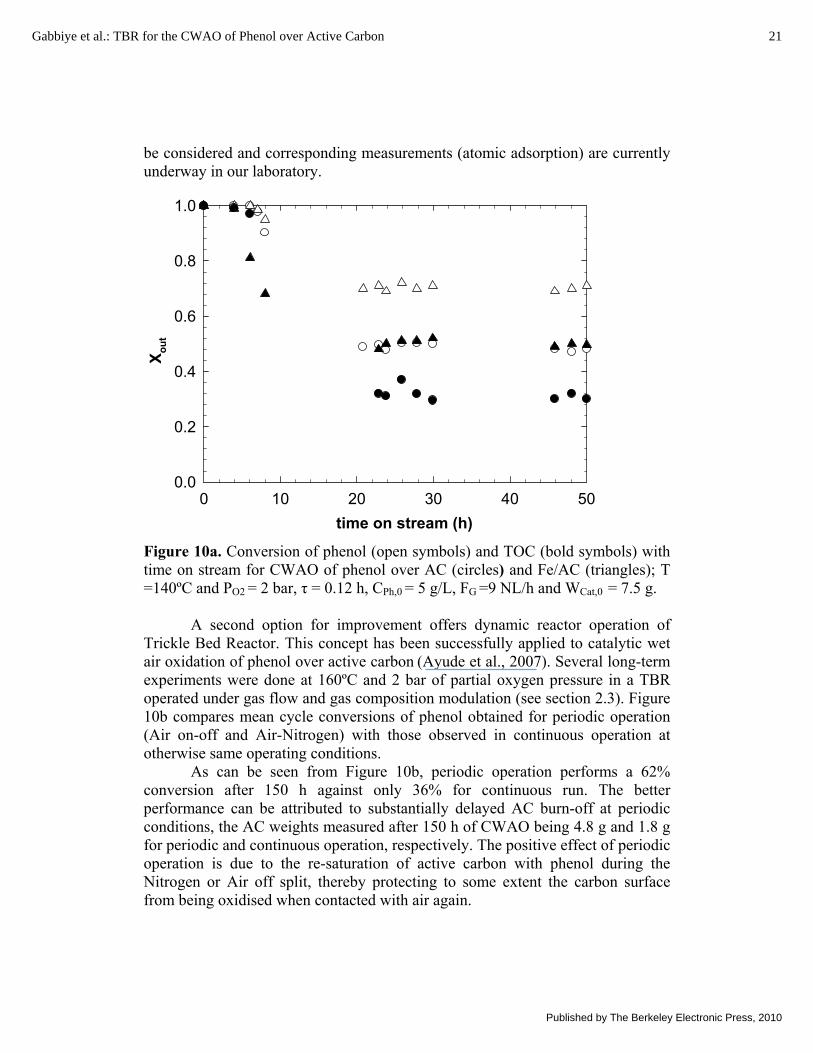
be considered and corresponding measurements (atomic adsorption) are currently underway in our laboratory.
time on stream (h)0 10 20 30 40 50
X out
0.0
0.2
0.4
0.6
0.8
1.0
Figure 10a. Conversion of phenol (open symbols) and TOC (bold symbols) with time on stream for CWAO of phenol over AC (circles) and Fe/AC (triangles); T =140ºC and PO2 = 2 bar, τ = 0.12 h, CPh,0 = 5 g/L, FG =9 NL/h and WCat,0 = 7.5 g.
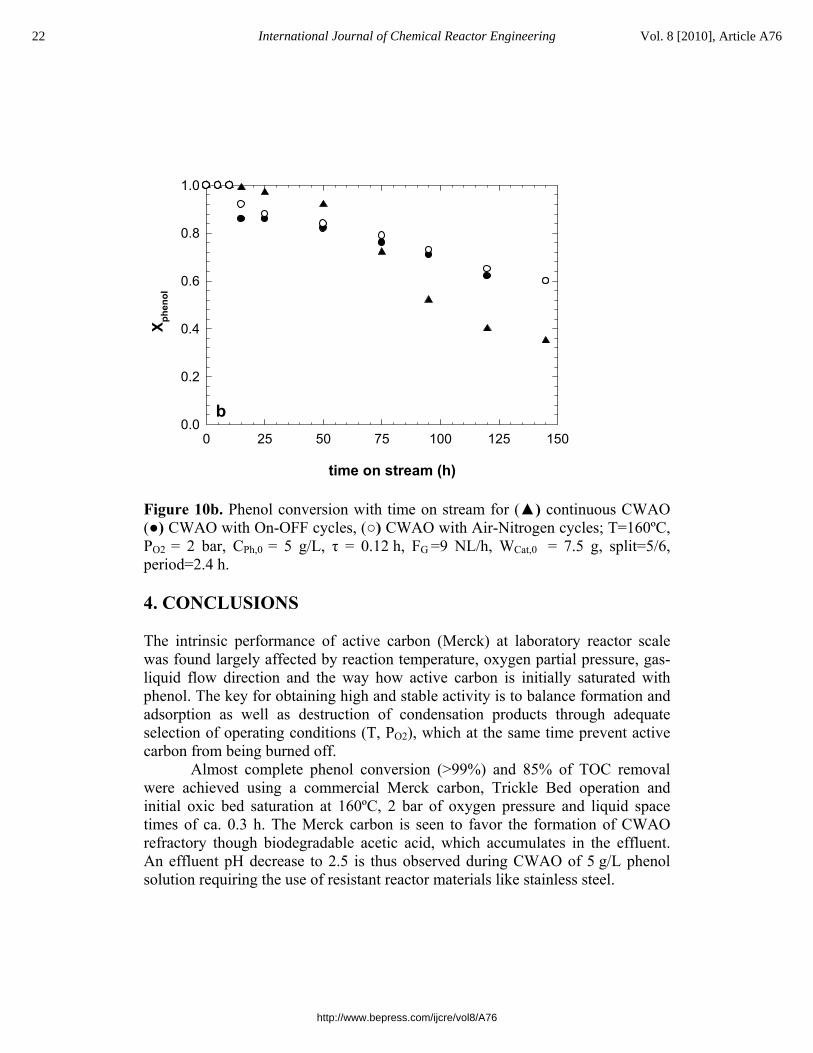
A second option for improvement offers dynamic reactor operation of Trickle Bed Reactor. This concept has been successfully applied to catalytic wet air oxidation of phenol over active carbon (Ayude et al., 2007). Several long-term experiments were done at 160ºC and 2 bar of partial oxygen pressure in a TBR operated under gas flow and gas composition modulation (see section 2.3). Figure 10b compares mean cycle conversions of phenol obtained for periodic operation (Air on-off and Air-Nitrogen) with those observed in continuous operation at otherwise same operating conditions.
As can be seen from Figure 10b, periodic operation performs a 62% conversion after 150 h against only 36% for continuous run. The better performance can be attributed to substantially delayed AC burn-off at periodic conditions, the AC weights measured after 150 h of CWAO being 4.8 g and 1.8 g for periodic and continuous operation, respectively. The positive effect of periodic operation is due to the re-saturation of active carbon with phenol during the Nitrogen or Air off split, thereby protecting to some extent the carbon surface from being oxidised when contacted with air again.
21Gabbiye et al.: TBR for the CWAO of Phenol over Active Carbon
Published by The Berkeley Electronic Press, 2010
time on stream (h)
0 25 50 75 100 125 150
X phen
ol
0.0
0.2
0.4
0.6
0.8
1.0
b
Figure 10b. Phenol conversion with time on stream for (▲) continuous CWAO (●) CWAO with On-OFF cycles, (○) CWAO with Air-Nitrogen cycles; T=160ºC, PO2 = 2 bar, CPh,0 = 5 g/L, τ = 0.12 h, FG =9 NL/h, WCat,0 = 7.5 g, split=5/6, period=2.4 h. 4. C The intrinsic performance of active carbon (Merck) at laboratory reactor scale was found largely affected by reaction temperature, oxygen partial pressure, gas-liquid flow direction and the way how active carbon is initially saturated with phenol. The key for obtaining high and stable activity is to balance formation and adsorption as well as destruction of condensation products through adequate selection of operating conditions (T, PO2), which at the same time prevent active carbon from being burned off.
Almost complete phenol conversion (>99%) and 85% of TOC removal were achieved using a commercial Merck carbon, Trickle Bed operation and initial oxic bed saturation at 160ºC, 2 bar of oxygen pressure and liquid space times of ca. 0.3 h. The Merck carbon is seen to favor the formation of CWAO refractory though biodegradable acetic acid, which accumulates in the effluent. An effluent pH decrease to 2.5 is thus observed during CWAO of 5 g/L phenol solution requiring the use of resistant reactor materials like stainless steel.
ONCLUSIONS
22 International Journal of Chemical Reactor Engineering Vol. 8 [2010], Article A76
http://www.bepress.com/ijcre/vol8/A76
However, a temperature of 160ºC resulted too severe to maintain activity. Burn-off of active carbon became influent at 2 bar of oxygen partial pressure and conversion decreased progressively after 50 h. Improvement of activity and stability can be readily performed with iron coating on active carbon and periodic operation. These options are currently investigated in detail in our laboratory.
In fact the degree of mineralization of organic compounds during CWAO (and the severity of operating conditions) depends on the final destination of the effluents. The most potential industrial application of active carbon and CWAO is in wastewater management as a pre-treatment of bio-toxic organic process waters. Integration of CWAO using active carbon in existing biological wastewater plants will avoid the need for high compound mineralization and undesired severe operating conditions of CWAO. Respirometry assays have shown that compound and TOC removals in the range of 50-60% in CWAO of phenol, o-cresol and 2-chlorophenol lead to an increase of effluent biodegradability of 25-35%. CWAO technology is still not mature in this aspect. Additional data of biodegradability of CWAO treated effluents and its biological decomposition in real wastewater plants are necessary, especially for real process waters, to establish required process severity and effluent mineralization degree to be achieved in CWAO.
REFERENCES Arena, F.; Giovenco, R.; Torre, T.; Venuto, A.; Parmaliana, A. Activity and
resistance to leaching of Cu-based catalysts in the wet oxidation of phenol. Applied Catalysis B: Environmental, 2003, 45, 51-62.
Ayude, A.; Rodríguez, T.; Font, J.; Fortuny, A.; Bengoa, C.; Fabregat, A; Stüber, F. Effect of gas feed flow and gas composition modulation on activated carbon performance in phenol wet air oxidation. Chemical Engineering Science, 2007, 62, 7351-7358.
Cooney, O.D.; Xi, Z. Activated carbon catalyzes reactions of phenolics during liquid-phase adsorption. AIChE Journal, 1994, 40, 361-364.
Dold, P.L.; Ekama, G.A.; Marais, G.v.R. A general model for the activated sludge process, Prog. Water Technol. 1980, 12, 47-77.
Eftaxias, A.; Font, J.; Fortuny, A.; Fabregat, A.; Stüber, F. Catalytic wet air oxidation of phenol over active carbon catalyst. Global kinetic modelling using simulated annealing. Appl. Cat. B: Environmental, 2006, 67, 12-23.
EPA. http://www.epa.gov. 2006.
EPER. http://eper.ec.europa.eu/eper/emissions_pollutants.asp. 2004.
23Gabbiye et al.: TBR for the CWAO of Phenol over Active Carbon
Published by The Berkeley Electronic Press, 2010
Fortuny, A.; Miró, C.; Font, J.; Fabregat, A. Three-phase reactor for environmental remediation: catalytic wet oxidation of phenol using active carbon. Catalysis Today, 1999, 48, 323-328.
Gogate; P. R.; Bandit, A.B. A review of imperative technologies for wastewater treatment I: oxidation technologies at ambient conditions. Advances in Environmental Research, 2004, 8, 501-551.
Grant, M.T.; King, C.J. Mechanism of irreversible adsorption of phenolic compounds by activated carbons. Ind. Eng. Chem. Res., 1990, 29, 264-271.
Guo, J.; Al-Dahhan, M. Activity and stability of iron-containing pillared clay catalysts for wet air oxidation of phenol. Applied Catalysis A: General, 2006, 299, 175-184.
Hamoudi, S.; Larachi, F.; Sayari, A. Wet Oxidation of Phenolic Solutions over Heterogeneous Catalysts: Degradation Profile and Catalyst Behavior. Journal of Catalysis 1998, 177, 247-258.
Khadilkar, M.R.; Wu, Y.; Al-Dahhan, M.H.; Dudukovic, M.P:, Colakyan, M. Comparison of trickle-bed and upflow reactor performance at high pressure: model predictions and experimental observations. Chem. Eng. Sci. 1996, 51, 2139.
Kritzer, P.; Dinjus, E. An assessment of supercritical water oxidation (SCWO): Existing problems, possible solutions and new reactor concepts. Chemical Engineering Journal, 2001, 83, 207-214.
Levec, J.; Pintar, A. Catalytic oxidation of aqueous solutions of organics. An effective method for removal of toxic pollutants from waste water. Catalysis Today, 1995, 24, 51-58.
Levec, J.; Pintar. A. Catalytic Wet-air oxidation processes: Review. Catalysis Today, 2007, 124, 172-184.
Mishra, S. V.; Mahajani, V. V.; Joshi, J. B. Wet Air Oxidation. Ind. Eng. Chem. Res., 1995, 34, 2-48.
Qin, J.; Zhang, Q.; Chuang, T.K. Catalytic wet oxidation of p-chlorophenol over supported noble metal catalysts. Applied Catalysis B: Environmental, 2001, 29, 115-123.
24 International Journal of Chemical Reactor Engineering Vol. 8 [2010], Article A76
http://www.bepress.com/ijcre/vol8/A76

Quintanilla, A.; Menéndez, N.; Tornero, J.; Casas, A. J.; Rodríguez, J. J. Surface modification of carbon-supported iron catalyst during the wet air oxidation of phenol: Influence on activity, selectivity and stability. Applied Catalysis B: Environmental, 2008, 81, 105-114.
Santos, A.; Yustos, P.; Gomis, S.; Ruiz, G.; Garcia-Ochoa, F. Generalized Kinetic Model for the Catalytic Wet Air Oxidation of Phenol Using Activated Carbon as the Catalyst. Ind. Eng. Chem. Res, 2005, 5 (62A).
Santos, A.; Yustos, P.; Quintanilla, A; Ruiz, G.; Garcia-Ochoa, F. Wet oxidation of phenol, cresols and nitrophenols catalyzed by activated carbon in acid and basic media. Applied Catalysis B: Environmental, 2006, 65, 269-281.
Spanjers, H.; Varolleghem, P.A.; Olsson, G.; Dold, P.L. Respirometry in Control of the Activated Sludge Processes: Principles, International Association on Water Quality, London, England, 1998.
Stüber, F.; Polaert, I.; Delmas, H.; Font, J.; Fortuny, A.; Fabregat, A. Catalytic wet air oxidation of phenol using active carbon: performance of discontinuous and continuous reactors. Journal of Chemical Technology and Biotechnology, 2001, 76, 743 - 751.
Stüber, F; Font, J.; Fortuny, A.; Bengoa, C.; Eftaxias, A; Fabregat, A. Carbon materials and catalytic wet air oxidation of organic pollutant in wastewater. Topics in Catalysis, 2005, 33, 1-50.
Suarez-Ojeda, M.E.; Guisasola, A.; Baeza, J.A.; Fabregat, A.; Stuber, F.; Fortuny, A.; Font, J.; Carrera, J. Integrated catalytic wet air oxidation and aerobic biological treatment in a WWTP of a high-strength o-cresol wastewater. Chemosphere, 2007, 66, 2096-2105.
Suarez-Ojeda, M.E.; Stüber, F.; Fortuny, A.; Fabregat, A.; Carrera, J.; Font, J. Catalytic wet air oxidation of substituted phenols using activated carbon as catalyst. Applied Catalysis B: Environmental, 2005, 58, 105–114.
Suwanprasop, S.; Eftaxias, A.; Stüber, F.; Polaert, I.; Julcour-Lebigue, C.; Delmas, H. Scale-up and Modeling of Fixed-Bed Reactors for Catalytic Phenol Oxidation over Adsorptive Active Carbon. Ind. Eng. Chem. Res, 2005, 44, 9513-9523.
Tukac, V.; Hanika, J. Catalytic Wet Oxidation of Substituted Phenols in Trickle Bed Reactor. J. Chem. Technol. Biotechnol, 1998, 71, 265-266.
Tukac, V.; Vokal, J.; Hanika, J. Mass transfer-limited wet oxidation of phenol. J. Chem. Technol. Biotechnol., 2001, 76, 506-510.
25Gabbiye et al.: TBR for the CWAO of Phenol over Active Carbon
Published by The Berkeley Electronic Press, 2010