
reactor technology development - Publications - International ...
455
XA9846665 _ IAEA-TECDOC-988 High temperature gas cooled reactor technology development Proceedings of a Technical Committee meeting held in Johannesburg, South Africa, 13-15 November 1996 INTERNATIONAL ATOMIC ENERGY AGENCY 29-17 December 1997
-
Upload
khangminh22 -
Category
Documents
-
view
0 -
download
0
Transcript of reactor technology development - Publications - International ...

XA9846665 _
IAEA-TECDOC-988
High temperature gas cooledreactor technology development
Proceedings of a Technical Committee meetingheld in Johannesburg, South Africa, 13-15 November 1996
INTERNATIONAL ATOMIC ENERGY AGENCY
29-17December 1997

The IAEA does not normally maintain stocks of reports in this series.However, microfiche copies of these reports can be obtained from
IN IS ClearinghouseInternational Atomic Energy AgencyWagramerstrasse 5P.O. Box 100A-1400 Vienna, Austria
Orders should be accompanied by prepayment of Austrian Schillings 100,in the form of a cheque or in the form of IAEA microfiche service couponswhich may be ordered separately from the IMS Clearinghouse.

The originating Section of this publication in the IAEA was:
Nuclear Power Technology Development SectionInternational Atomic Energy Agency
Wagramerstrasse 5P.O. Box 100
A-1400 Vienna, Austria
HIGH TEMPERATURE GAS COOLEDREACTOR TECHNOLOGY DEVELOPMENT
IAEA, VIENNA, 1997IAEA-TECDOC-988
ISSN 1011^289©IAEA, 1997
Printed by the IAEA in AustriaDecember 1997

FOREWORD
The successful introduction of an advanced nuclear power plant programme depends onmany key elements. It must be economically competitive with alternative sources of energy, itstechnical development must assure operational dependability, the support of society requires thatit be safe and environmentally acceptable, and it must meet the regulatory standards developedfor its use and application. These factors interrelate with each other, and the ability to satisfy theestablished goals and criteria of all of these requirements is mandatory if a country or a specificindustry is to proceed with a new, advanced nuclear power system. It was with the focus oncommercializing the high temperature gas cooled reactor (HTGR) that the IAEA's InternationalWorking Group on Gas Cooled Reactors recommended this Technical Committee Meeting(TCM) on HTGR Technology Development.
Over the past few years, many Member States have instituted a re-examination of theirnuclear power policies and programmes. It has become evident that the only realistic way tointroduce an advanced nuclear power programme in today's world is through international co-operation between countries. The sharing of expertise and technical facilities for the commondevelopment of the HTGR is the goal of the Member States comprising the IAEA's InternationalWorking Group on Gas Cooled Reactors.
This meeting brought together key representatives and experts on the HTGR from thenational organizations and industries often countries and the European Commission. The stateelectric utility of South Africa, Eskom, hosted this TCM in Johannesburg, from 13 to 15November 1996. This TCM provided the opportunity to review the status of HTGR design anddevelopment activities, and especially to identify international co-operation which could beutilized to bring about the commercialization of the HTGR.

EDITORIAL NOTE
In preparing this publication for press, staff of the IAEA have made up the pages from theoriginal manuscripts as submitted by the authors. The views expressed do not necessarily reflectthose of the IAEA, the governments of the nominating Member States or the nominatingorganizations.
Throughout the text names of Member States are retained as they were when the text wascompiled.
The use of particular designations of countries or territories does not imply any judgement bythe publisher, the IAEA, as to the legal status of such countries or territories, of their authoritiesand institutions or of the delimitation of their boundaries.
The mention of names of specific companies or products (whether or not indicated asregistered) does not imply any intention to infringe proprietary rights, nor should it be construedas an endorsement or recommendation on the part of the IAEA.
The authors are responsible for having obtained the necessary permission for the IAEA toreproduce, translate or use material from sources already protected by copyrights.

CONTENTS
Summary................................................................................................................................................ 1
Opening Address.................................................................................................................................... 7P Maduna
GAS COOLED REACTOR PROGRAMME DEVELOPMENT
Utility requirements for HTGRs .......................................................................................................... 13D.R. Nicholls
INCOGEN: Nuclear cogeneration m the Netherlands......................................................................... 19A I van Heek
Is there a chance for commercializing the HTGR in Indonesia?......................................................... 27B Arbie, YR Akhmad
The essential trends of HGR development in the Russian Federation................................................. 33Yu.P. Sukharev
Overview of HTGR utilization system developments at JAERI.......................................................... 47Y. Miyamoto, S Shiozawa, Y. Inagaki, K. Hada, R. Hino,K. Onuki, Y. Muto, T. Nishihara, S. Shimizu, K. Haga
International o-operation in developing the GT-MHR........................................................................ 59M.P. La Bar, W.A. Simon
Recent activities on the HTGR for its commercialization in the 21st century.................................... 73I. Minatsuki, S. Uchida, S. Nomura, S. Yamada
GAS COOLED REACTOR SAFETY AND MANAGEMENT
HTR-10 severe accident management.................................................................................................. 93Yuanhui Xu, Yuliang Sun
An introduction to our activities supporting HTGR developments in Japan...................................... 101S An, T. Hayashi, Y. Tsuchie
Management system and potential markets for a HTR-GT plant....................................................... 117G.A.K. Crommelin
Approach on a global HTGR R&D network....................................................................................... 131W. vanLensa
An overview of the licensing approach of the South African Nuclear Regulatory Authority ........... 139G.A. Clapisson, T.F. Hill, N.R. Henderson, N.H. Keenan, P.E Metcalf, A. Mysenkov
DEVELOPMENT OF THE PEBBLE BED MODULARREACTOR PLANT IN SOUTH AFRICA
Technical status of the Pebble Bed Modular Reactor (PBMR-SA) conceptual design...................... 155M. Fox
Licensing of the proposed PBMR-SA................................................................................................. 175GA. Clapisson, N.R. Henderson, T.F. Hill, N.H. Keenan, P.E. Metcalf, A. Mysenkov
PBMR phase I study: Seismic and structural design considerations —An overview of principles........................................................................................................ 185D.J.W. Wmm
Helium storage and control system for the PBMR............................................................................. 195E.G. Verkerk
Power conversion unit for the South African direct cycle HTGR...................................................... 205J.J. Liebenberg
Simulation of the Pebble Bed Modular Reactor natural air convectionpassive heat removal system..................................................................................................... 213M.L. Dams

Potential and limitations in maximizing the power output of aninherently safe modular pebble bed HTGR.............................................................................. 229W. Scherer, HJ. Rutten, K.A. Haas
OTTO-PAP: An alternative option to the PBMR fuelling philosophy............................................... 247E. Mulder, E. Teuchert
HTR PLANT SYSTEM AND COMPONENT DESIGN
Generator technology for HTGR power plants................................................................................... 265D. Lomba, D. Thiot
Development of an engineering simulator as a design tool for thePebble Bed Modular Reactor.................................................................................................... 279B. Kullmann, M.L. Dams
Studies on self-acting heat removal systems on the basis of partial boiling ofwater for steel pressure vessel cooling of modular HTRs........................................................ 293H. Barnert, J. Singh
Material and fabrication of the HTTR reactor pressure vessel........................................................... 305Y. Tachibana, K. Kunitomi, S. Shiozawa, T. Asami, S. Yamaguchi
STATUS OF GAS COOLED TEST REACTOR PROGRAMMES
HTR-10 engineering experiments....................................................................................................... 321YuanhuiXu, Meisheng Yao, JiguoLiu, Huizhong Zhuo, HuaiminJu
Characteristics of HTTR's startup physics tests................................................................................. 333N. Nojiri, M. Nakano, M. Takeuchi, P. Pohl, K. Yamashita
Study of a high temperature gas cooled reactor heat utilization plant................................................ 345A. Ide, H. Hayakawa, T. Yasuno, Y. Takenaka, S. Hayashi, T. Kobayashi,S. Maeda, M. Tonogouchi, M. Takeda, M. Horie, K. Honda, Y. Nakamura,M. Kaneko, T. Masuda, M. Ikehara,Y. Takase, M. Ishiwatari
Test programmes of HTTR for future generation HTGRs.................................................................. 359K. Kunitomi, Y. Tachibana, T. Takeda, A. Saikusa, S. Shiozawa
Present status of initial core fuel fabrication for the HTTR................................................................ 373N. Kitamura, K. Watarumi, K. Sato, K. Sawa, S. Shiozawa, T. Tanaka
TECHNICAL DEVELOPMENTS IN GAS COOLED REACTOR DESIGN
The EOR system in DURI: Comparison between conventional andnon-conventional systems......................................................................................................... 387A.N. Lasman, M.D. Isnaeni
Results of cost estimates for the exploitation of the Natuna gas field inIndonesia using the HTR: A new momentum for commercialization...................................... 391H. Barnert
Reactor physics calculations on the Dutch small HTR concept......................................................... 407J.C. Kuijper, J.B.M. deHaas, H.Th. Klippel, A. Hogenbirk,J. Oppe, C. Sciolla, R.C.L. van derStad, B.C. Zhang
OTHER PAPERS SUBMITTED
Preliminary study on the development of an in-service inspection technique forgraphite components in the HriK............................................................................................ 443M. Ishihara, S. Hanawa, T. Furusawa, J. Aihara, Y. Tachibana
Post-irradiation heating tests of ZrC coated fuel particles.................................................................. 453K. Minato, T. Ogawa, K. Fukuda, H. Sekino, I. Takahashi
List of Participants ..............................................................................................................................465

SUMMARY
The Technical Committee meeting (TCM) on High Temperature Gas Cooled Reactor(HTGR) Development was held in Johannesburg, South Africa, from 13 to 15 November 1996.The meeting was convened by the IAEA on the recommendation of its International WorkingGroup on Gas Cooled Reactors (IWGGCR), and was hosted by the state electric utility of SouthAfrica, Eskom. Approximately eighty participants and observers from ten countries (China,France, Germany, Indonesia, Japan, Netherlands, the Russian Federation, South Africa, theUnited Kingdom and the United States of America) and the European Commission attended theTCM. Thirty-two papers were presented covering a large range of topics including:- Summaries of HTGR national development and commercialization programmes,
Safety and Management,Development of the pebble bed modular reactor in South Africa,
- Status of HTGR test reactor programmes,HTGR plant component and system design development.
Significant activities are occurring in the advancement of HTGR development, particularlywith regard to the utilization of the gas cooled reactor to achieve high efficiency in the generationof electricity and in process heat applications. Technological advances in component design andprocesses such as heat exchangers, turbo machinery, reformers and magnetic bearings coupledwith the international capability to fabricate, test and procure these components provides anexcellent opportunity for achieving economic commercialization of the HTGR. Eskom is in theprocess of performing a technical and economic evaluation of a helium cooled pebble bedmodular reactor directly coupled to a gas turbine power conversion system for consideration inincreasing the capacity of their electrical system. In China and Japan, test reactors are currentlyunder construction which will have the capability of achieving core outlet temperatures of 950°Cfor the evaluation of nuclear powered heat process applications. This TCM provided the forumto share the recent international advances in HTGR technology, and to identify technical andeconomic development pathways where international co-operation will support and encouragecommercialization of this advanced nuclear power plant.
The TCM was opened by J. de Beer, Executive Director for Technology, Eskom, G.P.N.Venter, Director General of Minerals and Energy for South Africa, and L. Brey for the IAEA.J. de Beer provided an overview of the technical and economic evaluation of the HTGR currentlyin progress by Eskom. He stressed the factors influencing Eskom's interest in the HTGR as apossible future source of electrical generation and the long term trends in system growth whichtend to support this advanced nuclear power plant. G.P.N. Venter addressed the South Africangovernment's plan to uplift the economy, stressing the societal requirements of the nation.Abundant and inexpensive electricity is basic to South Africa's economic and social growth. Heemphasized the development and application of high technology as being the ultimate long termwealth creator in any country, and that it was the creation of a technology based future that wasimportant to the decision by South Africa to host this TCM. L. Brey spoke about the timelinessand importance of this meeting based on the current and anticipated HTGR related activities ofthe Member States comprising the IWGGCR. He indicated that the TCM was being convenedas an activity of the IAEA in the performance of its mission to foster the international exchangeof scientific and technical information in the peaceful application of atomic energy throughoutthe world.
The TCM provided the opportunity for the representatives of national organizations andindustry to address their individual HTGR related programmes and plans. Although the structureof the meeting was divided into individual sessions based on specific topics, there exists a stronginterrelationship between countries in the sharing of technical expertise, test facilities and in thedesign, fabrication and procurement of systems and components.
1

South Africa provided an excellent location for this TCM. In mid 1995, Eskom initiated adetailed economic and technical evaluation of the Pebble Bed Modular Reactor (PBMR-SA) asa potential candidate for future additions to its electric generation system. This utility, with aninstalled generation capacity of ~38,000 MW(e), is experiencing a number of significant changesin load growth. Eskom's electrical system is currently concentrated in the heavily industrialJohannesburg region with minimal electrical interties to neighboring countries and limitedtransmission capacity to the coastal regions of the country. This north central area of South Africais also the location of South Africa's large coal deposits which provide the fuel for about 90% ofthe utility's electrical generating capability. Recent societal changes which reflect an opening ofSouth African industry to the world market are causing a shift of the nation's new industrial plantto the coastal regions of the country. This, coupled with the need for future generating capacity,the lack of transmission capability and the wish to diversify its energy sources are the primaryreasons for this interest in the HTGR.
The requirements set by Eskom for the installation of new generation capacity include acapital and operation cost which must match (or improve upon) that being achieved by their largecoal stations. This currently represents a retail power cost to the customer of approximately twoUS cents per KW»h. Other requirements for the plant include an availability approaching 90%,location and plant size to match the load, public acceptance and environmental cleanliness.
Of paramount importance in the design and public acceptance of this advanced nuclearpower plant are the safety considerations and corresponding licensing requirements establishedfor its implementation. The South African Nuclear Regulatory Authority (CNS) is the responsiblegovernment agency in nuclear licensing and regulatory matters. The licensing process envisionedfor the PBMR-SA will be based on quantitative risk assessment to demonstrate compliance withfundamental safety criteria laid down by CNS. This is similar to the licensing process establishedfor the Koeberg Nuclear Power Station and other nuclear installations in South Africa. The designapproach utilized by Eskom is to establish conservative boundary limitations on the PBMR-SAto assure safety under all operational and transient conditions.
The conceptual design of PBMR-SA features a helium cooled pebble bed reactor with apower output of approximately 220 MW(th) coupled to a closed cycle gas turbine powerconversion system consisting of two turbo compressors, a turbo generator, a recuperator,precooler and an intercooler, all located within three steel pressure vessels The three turbomachines are equipped with magnetic bearings and the recuperator is of a fin plate design forcompactness. The overall net efficiency of this Brayton cycle system is expected to exceed 45%based on a reactor outlet helium temperature of 900°C and a maximum system pressure of 70 bar.
The South African engineering firm Integrators of Systems Technology (1ST) is performingthe detailed evaluation for Eskom with support from fifteen industry and national organizationsworldwide. Although the design of the PBMR-SA is quite simple with only the need for aminimum of support systems, major portions of the plant have been modelled in an engineeringsimulator to allow investigation of system and component interaction, to study the plant's powerresponse capabilities and to develop its control philosophy.
The PBMR-SA reactor basically builds on German designs utilizing the experience fromthe Thorium High Temperature Reactor and the AVR as well as the technical developmentsassociated with the 200 MW(th) HTR-MODUL and the 250 MW(th) HTR-100 plants. Theseplants utilize a steam cycle in contrast to the Eskom design for a direct cycle helium turbine.Although this modifies certain boundary conditions, the nuclear and thermal hydraulicinvestigations performed at the Kemforschungszentrum Jiilich GmbH (KFA) to determine theoptimum power of the core have reinforced the conservative design originally defined for theHTR-MODUL. The choice for a core design limited to 220 MW(th) with a diameter of 3.5 metersand the use of graphite constrictions for nuclear control and shutdown outside of the pebble bedprovides conservatism in maintaining the maximum accident fuel temperature to 1600°C. Also,the German designs have in the past used a multiple pass fuelling regime in their reactors. A
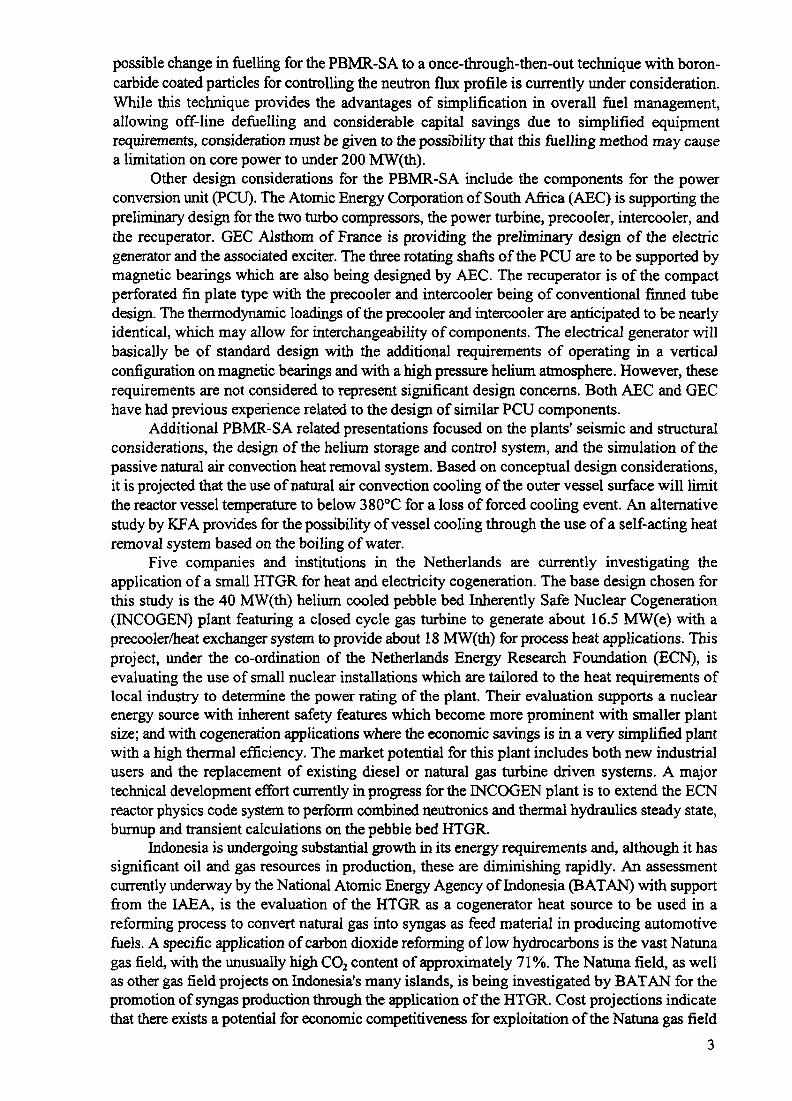
possible change in fuelling for the PBMR-SA to a once-through-then-out technique with boron-carbide coated particles for controlling the neutron flux profile is currently under consideration.While this technique provides the advantages of simplification in overall fuel management,allowing off-line defuelling and considerable capital savings due to simplified equipmentrequirements, consideration must be given to the possibility that this fuelling method may causea limitation on core power to under 200 MW(th).
Other design considerations for the PBMR-SA include the components for the powerconversion unit (PCU). The Atomic Energy Corporation of South Africa (AEC) is supporting thepreliminary design for the two turbo compressors, the power turbine, precooler, intercooler, andthe recuperator. GEC Alsthom of France is providing the preliminary design of the electricgenerator and the associated exciter. The three rotating shafts of the PCU are to be supported bymagnetic bearings which are also being designed by AEC. The recuperator is of the compactperforated fin plate type with the precooler and intercooler being of conventional finned tubedesign. The thermodynamic loadings of the precooler and intercooler are anticipated to be nearlyidentical, which may allow for interchangeability of components. The electrical generator willbasically be of standard design with the additional requirements of operating in a verticalconfiguration on magnetic bearings and with a high pressure helium atmosphere. However, theserequirements are not considered to represent significant design concerns. Both AEC and GEChave had previous experience related to the design of similar PCU components.
Additional PBMR-SA related presentations focused on the plants' seismic and structuralconsiderations, the design of the helium storage and control system, and the simulation of thepassive natural air convection heat removal system. Based on conceptual design considerations,it is projected that the use of natural air convection cooling of the outer vessel surface will limitthe reactor vessel temperature to below 380°C for a loss of forced cooling event. An alternativestudy by KFA provides for the possibility of vessel cooling through the use of a self-acting heatremoval system based on the boiling of water.
Five companies and institutions in the Netherlands are currently investigating theapplication of a small HTGR for heat and electricity cogeneration. The base design chosen forthis study is the 40 MW(th) helium cooled pebble bed Inherently Safe Nuclear Cogeneration(INCOGEN) plant featuring a closed cycle gas turbine to generate about 16.5 MW(e) with aprecooler/heat exchanger system to provide about 18 MW(th) for process heat applications. Thisproject, under the co-ordination of the Netherlands Energy Research Foundation (ECN), isevaluating the use of small nuclear installations which are tailored to the heat requirements oflocal industry to determine the power rating of the plant. Their evaluation supports a nuclearenergy source with inherent safety features which become more prominent with smaller plantsize; and with cogeneration applications where the economic savings is in a very simplified plantwith a high thermal efficiency. The market potential for this plant includes both new industrialusers and the replacement of existing diesel or natural gas turbine driven systems. A majortechnical development effort currently in progress for the INCOGEN plant is to extend the ECNreactor physics code system to perform combined neutronics and thermal hydraulics steady state,burnup and transient calculations on the pebble bed HTGR.
Indonesia is undergoing substantial growth in its energy requirements and, although it hassignificant oil and gas resources in production, these are diminishing rapidly. An assessmentcurrently underway by the National Atomic Energy Agency of Indonesia (BAT AN) with supportfrom the IAEA, is the evaluation of the HTGR as a cogenerator heat source to be used in areforming process to convert natural gas into syngas as feed material in producing automotivefuels. A specific application of carbon dioxide reforming of low hydrocarbons is the vast Natunagas field, with the unusually high CO2 content of approximately 71%. The Natuna field, as wellas other gas field projects on Indonesia's many islands, is being investigated by BAT AN for thepromotion of syngas production through the application of the HTGR. Cost projections indicatethat there exists a potential for economic competitiveness for exploitation of the Natuna gas field

through HTGR cogeneration (reforming plus electrolytic hydrogen) in the production of energyalcohol. This product is of high market value as a substitute for gasoline and diesel fuel. Anotherprocess under consideration for the HTGR is in the recovery of heavy oil. In many cases morethen 50% of the original oil remains after primary and secondary recovery processes have beencompleted. The feasibility of using the HTGR for recovery of this oil through the utilization ofsteam flooding has been the focus of a study for the Duri oil field. A recent reassessment of thisHTGR application to the Duri field has shown that a two-fold reduction in thermal powerrequirements can be achieved through a modification in the steam injection well pattern.
Construction of China's High Temperature Reactor (HTR-10) continues, with initialcriticality anticipated for 1999. This pebble bed reactor of 10 MW(th) will be utilized to test anddemonstrate the technology and safety features of the HTGR. Development of the HTGR byChina's Institute of Nuclear Energy Technology (INET) is being undertaken to evaluate a widerange of applications such as electricity generation, steam and district heat production, combinedsteam and gas turbine cycle operation, and as process heat generation for methane reforming. TheHTR-10 is the first HTGR to be licensed and constructed in China. The safety design criteriaimplemented for this plant includes a negative temperature coefficient for all operatingconditions, a maximum fuel temperature limit of 1600°C for all events, two independent anddiverse reactor shutdown systems, accident avoidance resulting from control rod ejection, amaximum equivalent diameter of 65 mm for the rupture of any primary coolant boundary line,separate pressure and heat resisting functions for the system structure, and a passive residual heatremoval system able to transfer decay heat from the reactor vessel at a rate which will maintainthe fuel and pressure vessel within design conditions. INET has undertaken a programme ofengineering experiments to verify the design characteristics and performance of the HTR-10components and systems. These include depressurization tests of the hot gas duct from operatingpressure, tests of the control rod drive mechanism, performance validation of the hot gas ductunder operating pressure and temperature conditions, two phase flow stability testing for the oncethrough steam generator and performance testing of the fuel handling system.
HTGR development in the USA currently centres around General Atomics (GA). Theprinciple focus of this activity has been in the design of the Gas Turbine-Modular Helium Reactor(GT-MHR). This plant features a 600 MW(th) helium cooled reactor with prismatic fuel elementsas the energy source coupled to a closed cycle gas turbine power conversion system (PCS). Thenet efficiency of the GT-MHR is 47.7% with an electrical output of 286 MW(e). The integrationof a HTGR into a closed Brayton cycle PCS has long been recognized as a highly efficient meansof producing electricity. Substantial progress in the development of this plant has occurredthrough the technological advances of components such as magnetic bearings and fin platerecuperators. In 1993, GA and MINATOM combined their efforts for the cooperativedevelopment of the GT-MHR for commercial deployment. This was subsequently expanded in1994 to include deployment of the GT-MHR for the disposition of weapons plutonium andincluded joint funding of conceptual design preparation. In early 1996, FRAMATOME joinedwith MINATOM and GA as a participant in this co-operative programme. This programmecurrently addresses US and Russian conditions for the GT-MHR including safety, regulatory,operational, economic, and performance requirements.
The Russian gas cooled reactor development programme includes a pebble bed modularHTGR with a thermal output of 200 MW(th) aimed at process heat applications and the abovementioned 600 MW(th) GT-MHR for electricity production. Ongoing and future research anddevelopment work in support of the GT-MHR includes fuel assembly and fabrication design forfuel particles, compacts, and blocks; tests of the reactor and power conversion system includingevaluation of the traveling seals to reduce helium leakage; and studies of vessel materialmechanical properties to 500°C and large scale vessel production techniques.
Japan provided a comprehensive overview of their HTGR research and developmentprogramme. The principle focus of this programme is completion of the High Temperature

Engineering Test Reactor (HTTR) at the Japan Atomic Energy Research Institute (JAERI) sitein Oarai, Japan. This 30 MW(th) helium cooled reactor will be utilized to establish and upgradethe technology for advanced HTGR development and to demonstrate the effectiveness of selectedhigh temperature heat utilization systems. Initial criticality of the HTTR is scheduled for October1997, with commencement of the startup physics test programme beginning with fuel loading(mid 1997) and continuing throughout 1998. This comprehensive programme will include physicstests associated with approach to criticality, testing of the preliminary annular core consisting of18 fuel columns and zero power tests of the full core of 30 fuel columns. Among these start-uptests will be measurements of control rod reactivity worth, scram reactivity, excess reactivity,neutron flux distribution and reactor noise analysis for both the annular and the full core. TheHTTR evaluation programme will then continue with rise-to-power tests to full power with a coreoutlet temperature of 950°C.
Demonstration of the effectiveness of selected high temperature heat utilization systemswill then begin with the testing of hydrogen production by natural gas steam reforming. TheHTTR steam reforming system is expected to demonstrate the ability of nuclear heat to achievehydrogen production at costs competitive with a fossil fired heat source. An out-of-pile testingprogram to confirm the safety, controllability and performance of this system will be performedprior to its actual evaluation with the HTTR. Other studies being performed by JAERI includethe design evaluation of gas turbine systems for the production of electricity and laboratory scaledevelopment of the thermochemical IS hydrogen production process. Selected future processesfor demonstration with the HTTR are anticipated to include these heat utilization systems.
Development, fabrication and testing programmes for specific HTTR components were alsoreviewed. The fuel assembly for this reactor is the pin-in-block type of hexagonal graphite blockwhich uses Triso coated fuel particles. To date, half of the initial HTTR fuel has been fabricatedwith a current fuel failure fraction of ~5 x 10~5 as measured by the bum and leach method. ThisTrisco coated fuel utilizes a silicon carbide (SiC) coating for mechanical strength and as a barrierto the diffusion of metallic fission products. Because of gradual lose of mechanical strength above1700°C, research into replacing the SiC coating with zirconium-carbide (ZrC) has shown that theZrC Triso fuel particles have better caesium retention, but provide a less effective barrier toruthenium than the Triso particles which incorporate the SiC layer. Also, the HTTR utilizesgraphite as the moderator and to provide strength to the reactor. This material is subjected to awide range of temperatures and high neutron fluence. Understanding the residual strain and/orstress accumulated in the graphite components is very important and is the subject of thedevelopment by JAERI of a non-destructive examination technique utilizing micro-indentationto estimate residual graphite strain.
Pressure tests on the HTTR primary and secondary cooling system were successfullyperformed in March 1996. This included the pressure testing of the reactor pressure vessel (RPV).The selection of 2 1/4 Cr-1 Mo steel for the fabrication of this critical component was determinedby its relatively high temperature, low neutron fluence environment. The technology incorporatedinto the design and fabrication of the HTTR RPV is expected to be readily applicable to futurecommercial HTGR vessel requirements.
Future deployment of the HTTR receives considerable interest from key industry, nationaland academic organizations from Japan. Without exception, these organizations look to theHTGR as a very important future energy source for process heat applications. The HTR HeatUtilization Core Group is considering the use of the HTGR in three fields: as a replacement forfossil fuels, in the production of clean fuels from fossil resources and in the production ofhydrogen from water as the ultimate clean energy carrier. An important aspect of the efforts underway by the Research Association on HTGR Plants is to make people aware of this safe andefficient nuclear power source so that the many benefits it can provide in meeting society's energyneeds of the future are clearly understood by the decision makers. Mitsubishi Heavy Industriesis investigating the feasibility of HTGR commercialization for the future. All of these TCM

contributors acknowledged the positive environmental aspects of the HTGR in helping to meetthe energy needs of the future.
Significant in the international co-operation for HTGR technology development is the offerby Japan and China for use of the HTTR and HTR-10 test reactors in a proposed new Co-ordinated Research programme (CRP) on Evaluation of HTGR Performance. Chief ScientificInvestigators will utilize these facilities for performance based tests and HTGR code and modelverification throughout startup, steady state and transient operational conditions. The areas to beevaluated in the HTTR and HTR-10 testing programmes include core physics, safetycharacteristics of the reactors, fission product release and transportation behaviour, thermalhydraulics, control response and high temperature component performance. This proposed CRPis in addition to a previously established CRP which is utilizing the HTTR for the investigationof high temperature heat utilization systems.
Development of the HTGR is of principal importance to the Member States comprising theIWGGCR. A major recommendation resulting from the 1996 International Working Groupmeeting is to proceed with the creation of a central function for the overall co-ordination ofnational research and technology development programmes, including establishment of a HTGRinformation and data archiving system and for the international advancement of this advancednuclear power source. This has led to the formation of the Global HTGR R&D Network(GHTRN). Although the general charter and details for the scope of the GHTRN are still underdevelopment, it has been determined by the IWGGCR that co-ordination of the HTGR R&Drelated resources of each country by a central c-oordination function is the most effective andefficient method available to support and advance the HTGR.
In summary, two areas of particular significance stand out for commercializing the HTGR.These included initial plant capital costs and the current state of plant system and componentdevelopment. It was acknowledged that the on-going economic evaluations for both the PBMR-SA and the GT-MHR programmes are estimating plant capital costs approaching US$1000/installed KW(e). The reasons provided for this low cost include a very simplified modularplant design, licensing requirements commensurate with the safety attributes of the HTGR, andcompetitive procurement of components on an international basis. Also acknowledged for thePBMR-SA is that the current international technology base allows for the design and constructionof a full scale prototype plant without the requirement for additional extended research anddevelopment.
This TCM provided the opportunity for sharing of recent international advances in HTGRtechnology. This included a review of the elements which collectively provide for the successfulintroduction of this advanced source of nuclear power. Major considerations for commercializingthe HTGR were explored including the state of technology development, economiccompetitiveness, environmental acceptance and safety, public acceptance and the regulatorystandards for its use and application.

OPENING ADDRESS
P. MadunaMinister of Minerals and Energy Affairs,
Government of South Africa,Pretoria, South Africa
Presented by G.P.N. Venter
I am very pleased and feel honoured to be here to address the opening remarks of the IAEATechnical Committee Meeting on "High Temperature Gas-cooled Reactor TechnologyDevelopment". It is an honour for South Africa to be the host country for the TCM. The historyof the High Temperature Reactor dates back to 1966, when a 15MW prototype reactor wascommissioned in Juelich, Germany. It is reported that our coal reserves will last for another 1 GO-120 years. Therefore we need to investigate all possible alternative power generation and supplyoptions that could be made available for South African in the medium to long term. This impliesthat our research efforts into energy supply should, in addition to the nuclear option, alsovigorously pursue interest in renewable energy sources such as the solar, wind, hydro and tidaloptions.
South Africa has been blessed with extensive natural resources which are vital to improving thewell-being of the citizens of this country. The need for electricity is basic to our economic andsocial growth.
We are a mixture of a developed and developing nation. A prime example of this is the electricitysupply industry.
At the distribution end of the industry, the biggest task is that of providing electricity to themajority of the population that has no main supply. In this area, the targets set down by theReconstruction and Development Program are being successfully met. I must give credit toEskom in this regard, as they are currently reportedly meeting their commitment of 300,000 newconnections per year.
The other end of the electricity supply industry, the power stations, are clearly part of thedeveloped economy. South Africa's power stations include Kendal, which at over 4000MW, isthe largest hard coal power station in the world; and Koeberg, the only nuclear power station onthe African continent. In total, the country has over 36000MW of installed plant, with Eskombeing the fourth largest utility in the world by this measure.
The government's macro-economic plan is aimed at uplifting the economy, and to ensure that thesocial and economic inequalities that exist are overcome. If this is to be done, it must be based,among other things on the development and application of high technology, as this is the ultimatelong term wealth creator in any country.
By any standards, the nuclear power industry requires one to tap some of the best technologicalideas known to humanity. In the past, South Africa has devoted enormous resources to thedevelopment of nuclear technology at the Atomic Energy Corporation. While the returns are stilldifficult to quantify and perception is that they have not been as good as could have been hopedfor, my department is currently looking at ways and means of improving performance in certain

areas. The area of high temperature reactors is one where past investments in nuclear technologymight yet bear fruit.
It is therefore in the light of South Africa's need for a technology-based future, and a technologybase developed in the nuclear and related fields, that one must consider South Africa hosting thismeeting.
In the modern world, the increasingly competitive global economy forces every country tocarefully assess its competitive advantages. In the case of South Africa, one of these is the lowestcost of electricity in the world. This low cost, of below 2 U.S. cents per kilowatt hour, is one ofthe driving forces behind a number of major projects, which are helping expand the economy. Itis an advantage that needs to be maintained into the future to allow industrialists the confidenceto make large, long-term fixed investments.
This current low cost of electricity in South Africa is due to the highly successful constructionprogram of coal stations in the 1970s and 1980s, and the reduction of costs. This buildingprogram was, in fact, somewhat over ambitious as it left the country with an overcapacity ofplant, It is only now, with several years of good growth, that this excess is being graduallyreduced. Eskom is therefore investigating a number of options for potential future generatingplant, with specific emphasis on competitive costing.
These investigations include further coal based plant, imports of hydroelectric power fromneighbouring countries, underground pumped storage systems, solar power stations, gas firedcombined cycle plants and nuclear power, as I have already mentioned.
It is pleasing to see that a long term vision is being increasingly taken over the electrical energyneeds of the country. It is only with detailed and thorough studies that the correct decisions canbe made when the time comes to invest in new plant. The economic targets for these technologiesare particularly tough, given the cost of power they have to match.
The nuclear studies originally considered stations similar to the existing nuclear plant at Koeberg,but given the condition of cost-competitiveness and the ongoing debate in the international arena,particularly in relation to environmental constraints, it was concluded that there is more potentialin high temperature gas-cooled reactors, based on proven German technology, at least at the levelof the prototype reactor.
This is not to say that South Africa has had anything but good service from the Koeberg powerstation near Cape Town over the last twelve years, and there is no reason to believe that it willnot continue until the end of its design life of forty years for reactors of this type, i.e. thepressurized water reactor, and other current generation designs, can be seen as the workhorsesof the nuclear industry.
I am told that it was while reviewing the potential of the high temperature gas-cooled reactor,particularly in terms of its inherent safety, that Eskom, in conjunction with local and overseasindustry, entered into the current investigations. In reviewing the targets that these studies areaiming to demonstrate, it is clear that they are quite demanding. If they are met, it will only bebecause of the hard work and dedication of all the scientists and engineers involved, both in SouthAfrica and overseas.

I should also mention that in terms of government policy, my department expects that mainstreaminvolvement of all of our scientists and engineers in these endeavours, and not only those fromthe white population group, will be a reality in the execution of these investigations. In otherwords, black economic empowerment must be vigorously pursued and encouraged throughprojects of this nature. As a country and as an economy, it behoves us to do everything in ourpower to ensure that blacks are brought into the centre of our economy where they will play rolesabove the realm of purveyors of cheap unskilled labour that were assigned to them in the past.
If an improvement can be made in the peaceful commercial performance of nuclear power, thepotential benefits would be significant, both in terms of the low cost of power and theimprovements in environmental emissions.
Finally, let me express my wish for the success of this technical committee meeting. It is mysincere hope that this meeting will result in a quality programme of international exchange and co-operation toward further analysis and evaluation of the HTGR as a possible energy source forfuture world electricity supply.
NEXT PAQE(S)••ft BLANK

GAS COOLED REACTOR PROGRAMME DEVELOPMENT
NEXT PAGE(S)left BLANK

XA9846666UTILITY REQUIREMENTS FOR HTGRs
D.R. NICHOLLSEskom,Johannesburg, South Africa
Abstract
Eskom, the state utility of South Africa, is currently evaluating the technical andeconomic feasibility of the helium cooled Pebble Bed Modular Reactor with a closed cyclegas turbine power conversion system for future power generating additions to its electricsystem. This paper provides an overview of the Eskom system including the needs of theutility for future generation capacity and the key performance requirements necessary forincorporation of this gas cooled reactor plant.
INTRODUCTION
Eskom, the South African state utility, is currently investigating the viability of HTGRs as partof its future generating mix. This paper explains the background to Eskom's investigation andkey requirements for any possible HTGR program.
SOUTH AFRICA'S ELECTRICITY SUPPLY INDUSTRY
Eskom generates over 95 % of the electricity in South Africa with peak sent out demand in1996 of 27 967 MW. Over 90% of this capacity is represented by large coal-fired stations(mainly 6 units of 600-700MW per station) fed by dedicated low cost coal mines. Eskom'scurrent cost of coal is approximately R33/ton (US$7.50). This has led to a very low averageretail power cost of approximately two US cents per kWh. This low cost structure has beenachieved by a successful construction program of these coal stations in the 1970s and 1980s.This program achieved low costs because of its scale, both in terms of the size of the stationsand the number of units ordered.
The program, in fact, proved to be over optimistic due to a fall in load growth from 8%/y to5%/y in the early 1980's and Eskom over built, achieving a 50% reserve margin in the late1980s and early 1990s. This led to the mothballing of some of the older coal stations(4513MW) and the delaying of the last station of the construction series, Majuba, at 4117MW,by eight years. With the growth of demand since that time this excess has been reduced andthe operating reserve margin (excluding mothballed stations) for the utility at the peak demandin 1996 was below 15%. The issue facing the utility is therefore whether the current growthin demand will continue and how, if it does, to construct power stations in line with ourcurrent cost structure. These issues relate to total installed capacity, lead time and cost. Thereare also other factors which are starting to impact the utility. They are as follows.
The South African industry is very heavily dependent on primary industry: this is reflected inthe load profile. Most of the extensive deep mining operations and heavy industry (steel,ferrochrome, aluminium etc.) operate on a 24 hour basis. The domestic market has,historically, been quite small as the black population had very limited access to electrical
13

supply. The result was that Eskom installed very limited load following plants. The only onesthat are used operationally are the two pumped storage schemes (1400MW) and limited hydro(600MW). As the drive to electrify the black townships continues (300 000 connections a yearby Eskom alone, plus 150 000 by other authorities) and the secondary manufacturing andservice industry grows, the need for load following plant is growing significantly.
In the apartheid era the South African industry became very inwardly focused. As themajority of the economically active population, and therefore customers, are close toJohannesburg the industry tended to be based close to this area, and away from the coast (onaverage 1000km away). The heavy industrial electrical load was therefore in this area and thiswas good for Eskom as the country's large coal deposits are in the same area. It is of note thatthe only non-coal base load station is the nuclear station (Koeberg 1800MW) near Cape Town,which is some 1400km from the next station (Tutuka, a 4000MW coal fired station). AsSouth Africa has opened itself up to the world market after the fall of apartheid the need tobase export orientated industrial plant near the coast has become apparent. Recent examplesinclude the Hillside Smelter in Richards Bay (850MW load) and the Saldanha Steel Mill nearCape Town (200MW). There are plans for several more such major plants. Thisconcentration of load on the coast will place severe demands on the Eskom transmissionsystem as well as increasing the problems of quality of supply.
UTILITY NEEDS
Given this scenario, what are the outline requirements for new capacity for Eskom? Thepresent analysis would indicate the following priorities:-
Cost
Lead Time
Load Following
Availability
Location
Environment
Fuel Diversity
The capital and operating cost must match (or improve on) thatachieved by large (4000MW+) coal stations.
The lead time must be as short as possible to avoid the type of over-capacity Eskom experienced at the end of the 1980s.
The station must be able to load follow to compensate for thelimitations on Eskom's current capacity.
This must be as high as possible. Eskom's current target for existingstations is 90% (7% planned outage and 3% forced).
The plant should be able to be located where the load is withoutimpacting the overall costs.
It is vital that any new plant must be environmentally (and publicly)acceptable.
Although not vital it would be valuable to increase Eskom's diversityof fuel supply (currently 92% coal).
14
KEY PERFORMANCE FOR PBMR
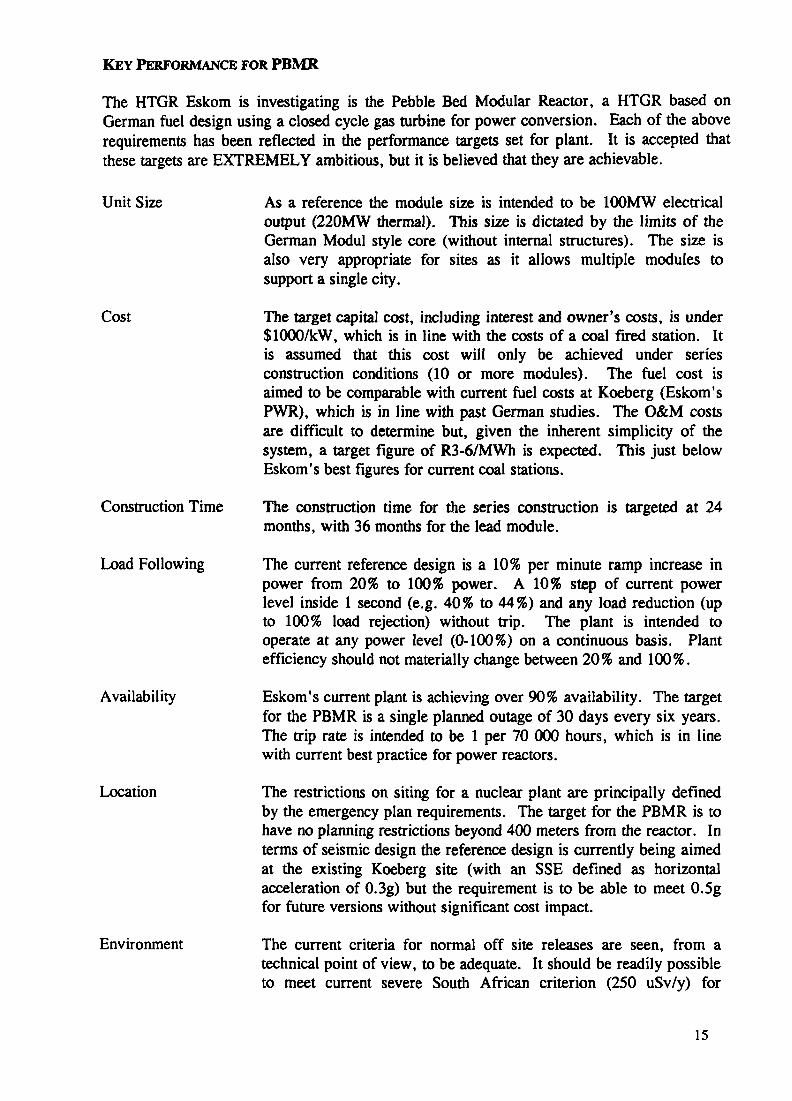
The HTGR Eskom is investigating is the Pebble Bed Modular Reactor, a HTGR based onGerman fuel design using a closed cycle gas turbine for power conversion. Each of the aboverequirements has been reflected in the performance targets set for plant. It is accepted thatthese targets are EXTREMELY ambitious, but it is believed that they are achievable.
Unit Size
Cost
Construction Time
Load Following
Availability
Location
Environment
As a reference the module size is intended to be 100MW electricaloutput (220MW thermal). This size is dictated by the limits of theGerman Modul style core (without internal structures). The size isalso very appropriate for sites as it allows multiple modules tosupport a single city.
The target capital cost, including interest and owner's costs, is under$1000/kW, which is in line with the costs of a coal fired station. Itis assumed that this cost will only be achieved under seriesconstruction conditions (10 or more modules). The fuel cost isaimed to be comparable with current fuel costs at Koeberg (Eskom'sPWR), which is in line with past German studies. The O&M costsare difficult to determine but, given the inherent simplicity of thesystem, a target figure of R3-6/MWh is expected. This just belowEskom's best figures for current coal stations.
The construction time for the series construction is targeted at 24months, with 36 months for the lead module.
The current reference design is a 10% per minute ramp increase inpower from 20% to 100% power. A 10% step of current powerlevel inside 1 second (e.g. 40% to 44%) and any load reduction (upto 100% load rejection) without trip. The plant is intended tooperate at any power level (0-100%) on a continuous basis. Plantefficiency should not materially change between 20% and 100%.
Eskom's current plant is achieving over 90% availability. The targetfor the PBMR is a single planned outage of 30 days every six years.The trip rate is intended to be 1 per 70 000 hours, which is in linewith current best practice for power reactors.
The restrictions on siting for a nuclear plant are principally definedby the emergency plan requirements. The target for the PBMR is tohave no planning restrictions beyond 400 meters from the reactor. Interms of seismic design the reference design is currently being aimedat the existing Koeberg site (with an SSE defined as horizontalacceleration of 0.3g) but the requirement is to be able to meet 0.5gfor future versions without significant cost impact.
The current criteria for normal off site releases are seen, from atechnical point of view, to be adequate. It should be readily possibleto meet current severe South African criterion (250 uSv/y) for
15

Environment (cont.) effluent releases during normal operation. The other relatedtechnical issue is that of waste, both process waste and spent fuel.The current strategy is to limit the processes which generate wasteand to provide adequate storage in the plant systems to store all thespent fuel generated during the operating lifetime of the plant and toprovide storage facilities until final disposal.
Fuel Diversity In Eskom's terms the use of nuclear fuel could be seen to beadvantageous as it diversifies away from the present heavy relianceof coal.
The item missing from this discussion is public acceptance. It is possible to build a stationwhich meets the technical (and licensing) requirements but which does not have publicacceptance. In many ways this has been the "Achilles Heel" of the current generation ofnuclear plant. Public concern is based on two perceived problems, disposal of waste andaccidents. The waste problem needs to be addressed in a wider context than a single designbut it is vital that it is seen to be resolvable. The issue of accidents also must be seen to havebeen solved. The classic question is "Can the nuclear plant have an accident which couldaffect the public?". The answer for all current generation is "Yes, but it is such a remotepossibility that........". The only part of this answer that is heard is the first word, the rest isonly limited mitigation! To be acceptable the answer must be "No". There must be nophysically credible event which can necessitate offsite action.
As can be seen, the current targets for the PBMR are based in the needs of the utility. Theyare seen as very tough but if they can be demonstrated to be achievable during the currentphase of investigation, the way may be open for further work on the project.
16
ANNEX A - ESKOM STATISTICS
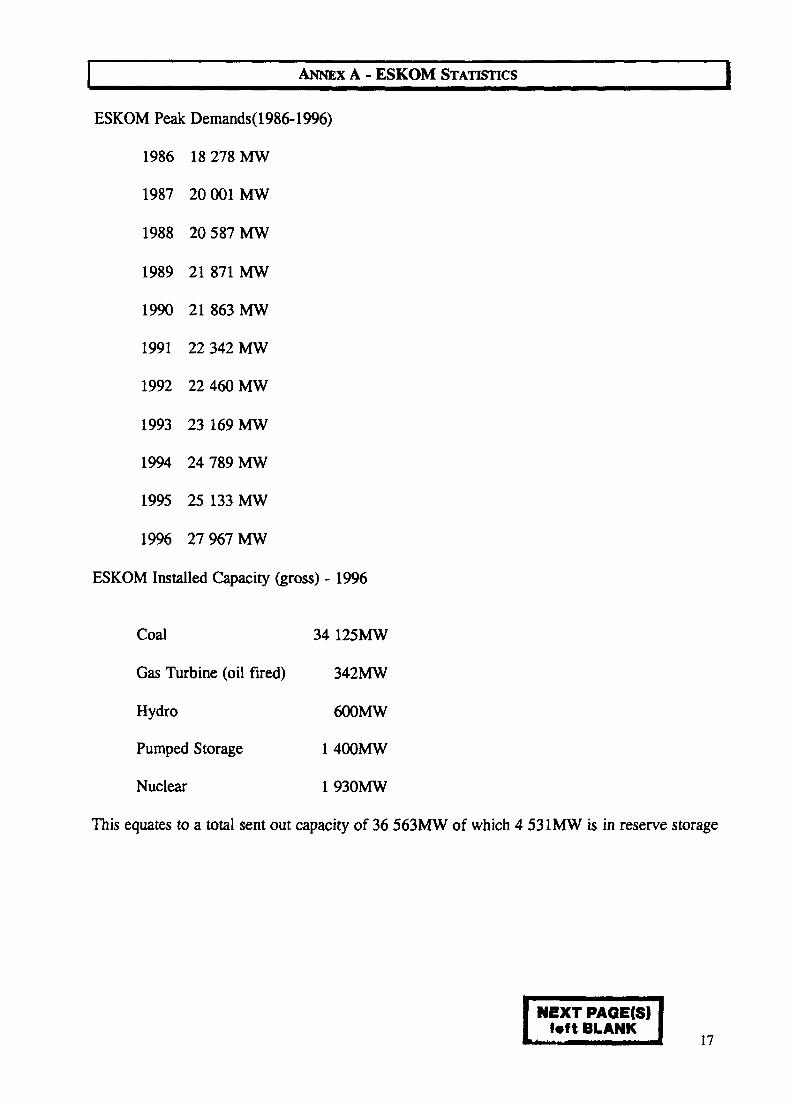
ESKOM Peak Demands( 1986-1996)
1986 18 278 MW
1987 20 001 MW
1988 20587MW
1989 21 871 MW
1990 21 863 MW
1991 22 342 MW
1992 22 460 MW
1993 23 169 MW
1994 24 789 MW
1995 25 133 MW
1996 27967MW
ESKOM Installed Capacity (gross) - 1996
Coal
Gas Turbine (oil fired)
Hydro
Pumped Storage
Nuclear
34 125MW
342MW
600MW
1400MW
1930MW
This equates to a total sent out capacity of 36 563MW of which 4 531MW is in reserve storage
INEXT PAQE(S)!«ft BLANK
17

XA9846667INCOGEN: NUCLEAR COGENERATION IN THE NETHERLANDS
A.I. VAN HEEKECN,Petten, Netherlands
Abstract
A small heat and power cogeneration plant with a pebble bed high temperature reactor(HTR) is discussed. Cogeneration could be a new market for nuclear power and the HTRcould be very suitable. The 40 MWth INCOGEN system is presented. Philosophy, layout,characteristics and performance are described. The lower power level, advancedcomponent technologies and inherent safety features are used to obtain a maximallysimplified system. Static and dynamic cycle analyses of the energy conversion system arediscussed, as well as the behaviour of the reactor cavity cooling system. Although the coststudy has not been finished yet, cost reduction trends are indicated.
1. Introduction
In Western Europe and the United States, the traditional market for nuclear power plants,large scale base load power generation, is stagnating and sometimes even shrinking. Ahealthy nuclear power industry has three branches of activities: plant construction,maintenance and decommissioning. If the size of the first activity is shrinking, othermarkets have to be found.
The market for autoproducers is growing fastly. In this branch a lot of power is generatedin combination with heat: cogeneration. This market is fully served with fossil fuels now,mainly natural gas. It is expected that the natural gas price will not remain as stable andlow as it is now. In principle, there should be a place for nuclear power on this market. Inthat case, three requirements should be fulfilled:1. repair of social support2. economic performance3. acceptable prototype investmentThe High Temperature Reactor can, if properly designed, serve as the nuclear heat sourcefor such a cogeneration plant.
From the beginning of 1996, a consortium of five companies and institutions are workingtogether on a cogeneration system with a pebble bed HTR of the peu-a-peu concept as aheat source. The name of the system is INCOGEN: Inherently safe Nuclear cogeneration.Sponsor is the Dutch Ministry of Economic Affairs, both through direct funding of ECN astheir "house institute" and through the Programme to Intensify Nuclear Knowledge (PINK).The five companies/institutions are listed in Table 1.
For a product like a cogeneration plant, it is necessary to get an idea of the requirementsof potential customers and the possibilities of the component manufacturing industry.Therefore in July 1996, an introduction day was organised on which the philosophy of thenuclear cogeneration was presented. The response was quite positive. About ninety peopleattended the meeting, and apart from a massive, for a nuclear project relatively positivepress and media coverage, about ten companies were interested to become more involvedin the project The newsletter INCOGEN Bulletin [1] gives a description of the event andit's follow-up.
19

Table 1. Companies and institutions participating in the INCOGEN project.
company/institution
Netherlands Energy Research Foundation(ECN), Petten
Stork NUCON, Amsterdam
KEMA, Arnhem
Interfaculty Reactor Institute (IRI), Delft
ROMAWA, Voorschoten
task
project coordination, reactor dynamics,shielding
plant layout, energy conversion
cycle optimisation, licensing
reactor statics, burnup calculations
market analysis, analysis of Dutch industrypotential
In this paper, philosophy, layout, characteristics and performance of the INCOGEN plant isdescribed. A description of the reactor physical behaviour van be found in the paper ofJ.C. Kuijper [2], and an analysis of the potential markets and the management system inthe paper of G.A.K. Crommelin [3].
2. Philosophy
Unlike for traditional nuclear power systems, the economy-of-scale philosophy cannot beapplied at cogeneration. Heat requirements of the local industry will determine the powerlevel, which in most cases will be no more than several tens of megawatts. Economicperformance therefore must be obtained by simplicity. Three forms of simplification can beidentified:1. power level: In comparison with older, larger pebble bed reactor designs, the low powerlevel only gives opportunities for simplification. An example is the defuelling machinery,which can be omitted. From a certain power level on, the vessel size could becomeunacceptably large. For a cogeneration plant, the peu-i-peu concept can be used instead ofthe recirculation (MEDUL) concept of the HTR Module [4].2. new or advanced technologies: because of advances hi fuel development (TRISO coatedparticles vs. BISO in THTR), and in gas turbine technology, application of the directBrayton cycle comes within the realm of possibility.3. inherent safety features: C. Goetzmann [5] gives a number of design guidelines forsmall reactors, amongst them: Use inherent safety features - that become more prominentwith smaller plant sizes - for lowering capital cost. Major cost drivers are nuclear gradecomponents, i.e. components with a nuclear safety function, Using inherent safety features,their number could be minimized. An example is the core behaviour at core heatupaccidents combined with stuck control rods. As is shown in the paper of J.C. Kuijper [2],the fuel never reaches temperatures where the coated particles are damaged, even not afterreaching recriticality.These features are used to attain a maximum of transparency. It should be possible toexplain to anybody, laypeople included, why e.g. an emergency core cooling system is notneeded. The core damage grace period is to be infinite, not some days or even a week. Toexclude any discussion about large radioactivity releases, the fission products are containedat their source by the fuel grain coatings, but also protected against attacks from outside bya silicon carbide coating around the fuel element.
20

It is expected, that with the use of these simplification opportunities, the disadvantage ofthe lack of economy-of-scale can be more than compensated.
3. Layout and characteristics
Although the parameters of the INCOGEN plant are not fixed yet, a first study has beenperformed to get an idea of main parameters and costs. By means of a market survey, afinal power level, to be expected between 20 and 200 MWth, will be determined. In thebase study the power level has been set to 40 MWth. Main parameters are listed in Table2.
Table 2. Main parameters of INCOGEN nuclear cogeneration plant.
Core thermal power (MWth)
Core outlet temperature (°C)
Core inlet temperature (°C)
Helium pressure (bar)
Net electric power generation (MWe)
Net heat cogeneration (MWth)
Net electric generation efficiency (%)
Net heat generation efficiency (%)
Net plant thermal efficiency (%)
40
800
494
23
16.5
18.0
41.2
44.9
86.1
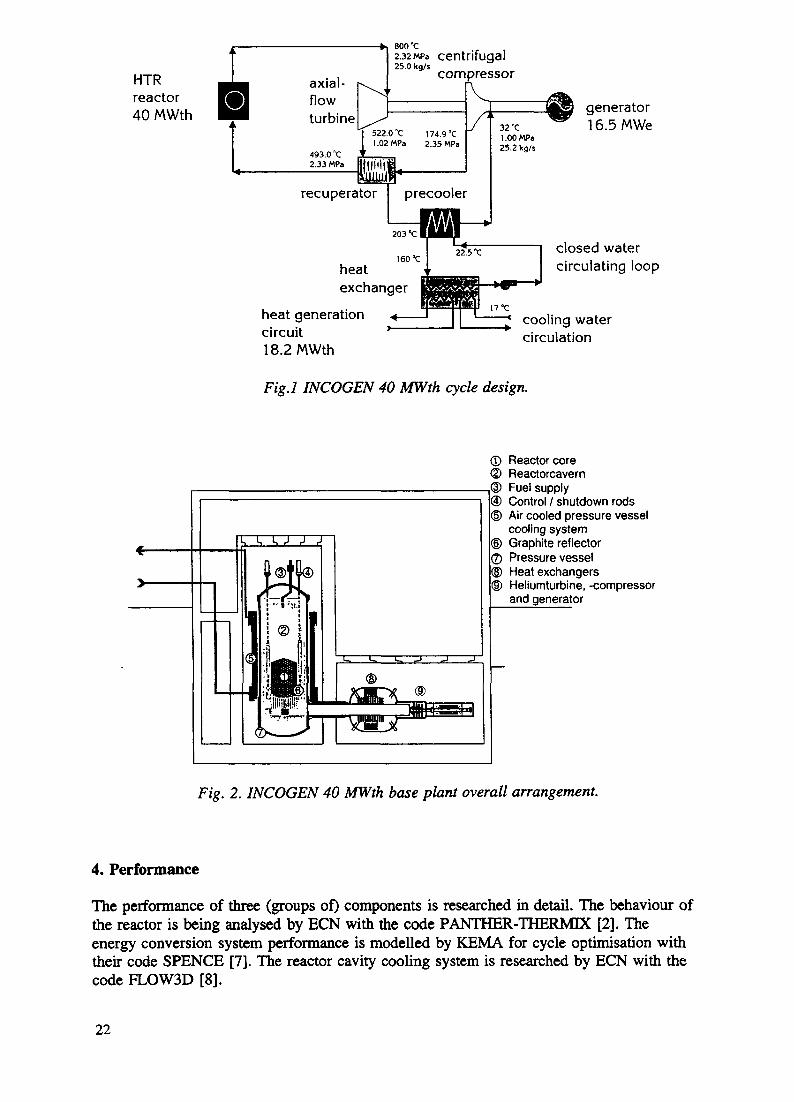
A drawing of the INCOGEN cycle design is shown hi Figure 1. The heat source of theplant is a 40 MWth helium cooled graphite moderated pebble bed HTR, called HR1. Thereactor is directly coupled to a helium turbine. After leaving the turbine the still 522°C hothelium enters a recuperator and a precooler consecutively. In the precooler a water circuitfor process heat applications is heated. After the precooler the helium enters a compressorthat is mounted on the same shaft as the turbine and the generator. Via the recuperator thehelium enters the reactor core again. The INCOGEN 40 MWth base plant overallarrangement is shown is Figure 2. Plant building layout is shown in Fig. 3.
The HR1-reactor has some novel safety features compared to other reactor concepts,mostly due to it's limited size. For example, after a total loss of coolant the fuel remainsfully intact, even if the reactor shutdown system fails and the reactor goes critical againafter a number of hours. More about this is explained in the paper of Kuijper et al. [2].The reactor is fuelled with the German type spherical fuel elements (pebbles), followingthe so-called Peu-a-peu fuelling concept [6]. Through continuously fuelling, the reactorcontains just a small amount of overreactivity. Only once every ten years the reactor isdefuelled completely. In the primary cell, a passive air-cooled afterheat removal system islocated.
21
HTRreactor40 MWth
• axial-H flow^ turbine
493.0 "C2.33 MPa
U ——————————————————— ____ .
^-si
T 5 2 2 .1 1.02
Htii'iiWM
recuperator
2.32 MPa cent25.0 kg/s com
0°C 1 74.9 "CMPa 2.35 MPa
!« ———precooler
iron
rifugalpressorV/'
—— *
32 X1 .00 MPa25.2 kg/s
generator16.5MWe
203 °C
160"Cheatexchanger
heat generationcircuit18.2 MWth
closed watercirculating loop
cooling watercirculation
Fig.l INCOGEN 40 MWth cycle design.
Reactor coreReactorcavern
® Fuel supply® Control / shutdown rods
Air cooled pressure vesselcooling system
© Graphite reflectorPressure vessel
® Heat exchangers® Heliumturbine, -compressor
and generator
Fig. 2. INCOGEN 40 MWth base plant overall arrangement.
4. Performance
The performance of three (groups of) components is researched in detail. The behaviour ofthe reactor is being analysed by ECN with the code PANTHER-THERMIX [2]. Theenergy conversion system performance is modelled by KEMA for cycle optimisation withtheir code SPENCE [7]. The reactor cavity cooling system is researched by ECN with thecode FLOW3D [8].
22

Fig. 3. INCOGEN 40 MWth building layout.
efficiency (%)50
45
40
35
30
— IGV control
•+• bypass flow control
* full sliding press, c
10 11 12 13 14 15 16
generator output (MWe)
Fig. 4. Efficiency at part load.
For the energy conversion system, both static and dynamic analyses have been performed.For example, the net efficiency appears to be fairly insensitive to the gas compressor inlettemperature. For part load operation, three methods of control have been analysed: 1. fullsliding pressure control, 2. reactor bypass control and 3. compressor inlet guide vanecontrol (IGV control). Fig. 4. shows the efficiency for part load operation for the threemodes of control. The most favourable type of operation is the full sliding pressurecontrol. The net efficiency increases slightly and the thermal transients are moderate at partload. A good alternative is the option Inlet Guide Vane control, allowing fixed operationalpressure at the compressor suction side. However, the life time of the cycle will bedecreased due to the high thermal transients at part load. Therefore it is necessary to level
23

off the primary inlet temperature of the recuperator. Very dramatic is the loss in netefficiency of the bypass control mode at part load. Although the buffering of helium isvery low at part load, the influence on the reactor is enormous.
Dynamic plant performance has been analysed as well. The effects of varying the heatcogeneration and the load following behaviour will be treated here. Fig. 5 shows the heatcogeneration response by decreasing the inlet temperature of the compressor. It can be seenthat the heat cogeneration decreases when the inlet temperature of the compressordecreases. The response of the reactor is very smooth. The load following behaviour ispresented in Fig. 6. Again it can be seen that the response of the reactor is very smooth.The load demand ramps are from 100-45-100% in five minutes.
The performance of a first design of reactor cavity cooling system (RCCS) has beenanalysed. For this, the RCCS of the American modular high temperature reactor design, theMHTGR [9], has been transferred and adapted to the INCOGEN system.Cold air from the environment flows through two cold ducts to the downcomer, which issituated against the cavity wall. At the bottom of the cavity, the air is distributed amongrectangular tubes. The air in the tubes is heated mainly by radiation from the vessel and
20
S-18
14
10
ao
48
o
"24
12
40 60 BO 100
Time (s]120 140
I ~ * neat generation — compressor mlM tamp. I
Fig. 5. Heat cogeneration response by decreasing the inlet temperature of the compressor.
45
£-40
I"
I"X 25
20
1,000
0 200 400 600 800 1,000 1,200 1,400
Time (si
• neat generation - - He - outlet temp. • He - inlet lamp.
Fig. 6. Load following behaviour.
24
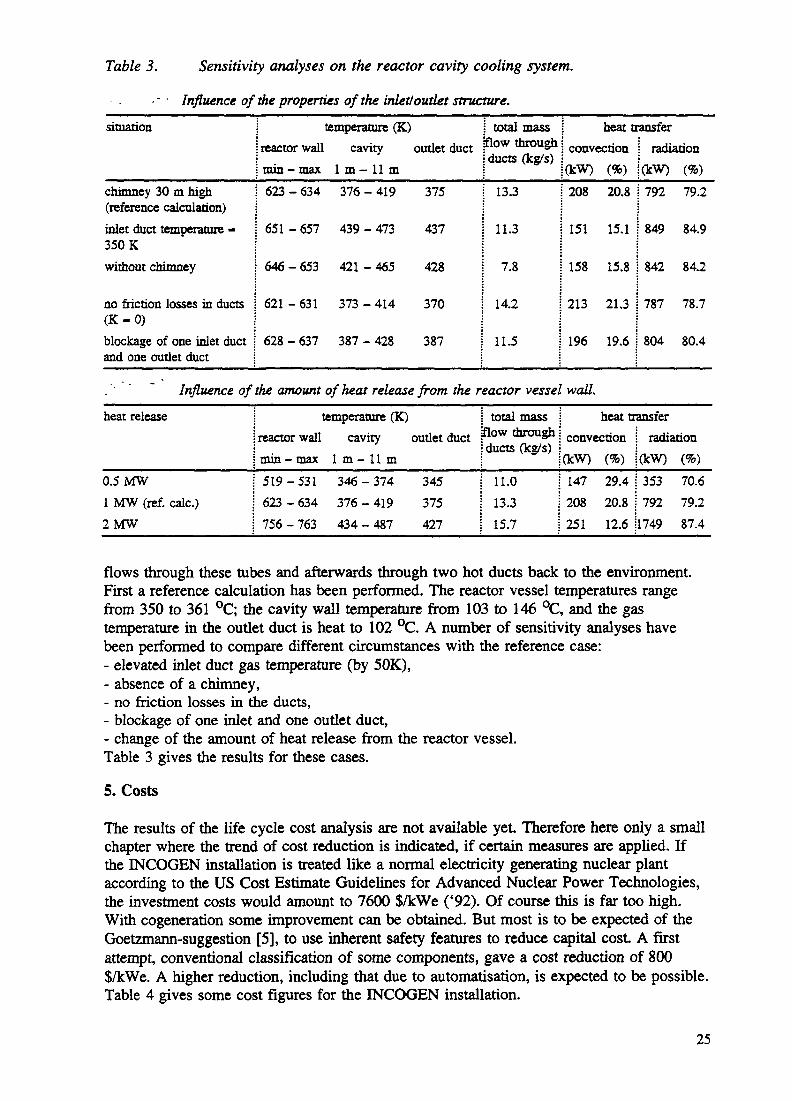
Table 3. Sensitivity analyses on the reactor cavity cooling system.
•' • Influence of the properties of the inlet/outlet structure.situation
chimney 30 m high(reference calculation)inlet duct temperature -350 Kwithout chimney
no friction losses in ducts(K-0)blockage of one inlet ductand one outlet duct
reactor wallmin — max
623 - 634
651 - 657
646-653
621 - 631
628 - 637
temperature (K)cavity
1 m- 11 m376 - 419
439 - 473
421 - 465
373 - 414
387 - 428
outlet duct
375
437
428
370
387
total Tna-t$flow throughducts (kg/s)
13.3
11.3
7.8
14.2
11.5
heat aconvection
(kW) (%)208 20.8
151 15,1
158 15.8
213 21.3
196 19.6
ansferradiation
(kW) (%)792 79.2
849 84.9
842 84.2
787 78.7
804 80.4
Influence of the amount of heat release from the reactor vessel wall.heat release
0.5 MW1 MW (ref. calc.)2MW
temperature (K)reactor wall cavity outlet ductmin-max 1m- l lm519-531 346-374 345623 - 634 376 - 419 375756 - 763 434 - 487 427
total massflow throughducts (kg/s)
11.013.315.7
heattrconvection
(kW) (%)147 29.4208 20.8251 12.6
ansferradiation
(kW) (%)353 70.6792 79.2
1749 87.4
flows through these tubes and afterwards through two hot ducts back to the environment.First a reference calculation has been performed. The reactor vessel temperatures rangefrom 350 to 361 °C; the cavity wall temperature from 103 to 146 °C, and the gastemperature in the outlet duct is heat to 102 °C. A number of sensitivity analyses havebeen performed to compare different circumstances with the reference case:- elevated inlet duct gas temperature (by 50K),- absence of a chimney,- no friction losses in the ducts,- blockage of one inlet and one outlet duct,- change of the amount of heat release from the reactor vessel.Table 3 gives the results for these cases.
5. Costs
The results of the life cycle cost analysis are not available yet. Therefore here only a smallchapter where the trend of cost reduction is indicated, if certain measures are applied. Ifthe INCOGEN installation is treated like a normal electricity generating nuclear plantaccording to the US Cost Estimate Guidelines for Advanced Nuclear Power Technologies,the investment costs would amount to 7600 $/kWe ('92). Of course this is far too high.With cogeneration some improvement can be obtained. But most is to be expected of theGoetzmann-suggestion [5], to use inherent safety features to reduce capital cost A firstattempt, conventional classification of some components, gave a cost reduction of 800$/kWe. A higher reduction, including that due to automatisation, is expected to be possible.Table 4 gives some cost figures for the INCOGEN installation.
25

Table 4. Investment costs of a 40 MWth INCOGEN plant.
Electricity only, prototype
Cogeneration, prototype
Cogeneration with some com-ponents conventionally classi-fied, prototype
Cogeneration with some com-ponents conventionally classi-fied, small series production
absolute invest-ment costs
125
125
110
80
investment costsper kWe ('92 US$)
7600
6000
5200
3700
6. Conclusion
A heat and power Cogeneration system with an HTR as a heat source would be verysuitable for the Cogeneration market. The for this market required power level gives theopportunity to use inherent safety features to reduce cost, to outweigh the economy-of-scale disadvantage. Advantages and disadvantages of different control methods areindicated. Reactor response with load following appears to be very smooth. Costs are stilltoo high but there is still room for further reduction.
References[1] INCOGEN Bulletin, ECN, nr. 1, 13 September 1996.
[2] J.C. Kuijper, J.B.M. de Haas, H.Th. Klippel, A. Hogenbirk, J. Oppe, C. Sciolla,Reactor physics calculations on the Dutch small HTR concept, this conference.
[3] G.A.K. Crommelin, Management system and potential markets for a HTR-GTplant, this conference.
[4] H. Reutler, G.H. Lohnert, Advantages of going modular in HTRs, NuclearEngineering and Design 78 (1984) 129-136.
[5] C. Goetzmann, Low specific capital cost: the design problem of small reactors,Nuclear Engineering and Design 109 (1988) 11-18.
[6] E. Teuchert, H. Gerwin, K.A. Haas, R. Schulten, Y. Sun, Features of passivecontrol of a small pebble bed HTR for gas turbine cycle, Eighth Proceedings ofThermal Hydraulics Division of the ANS, November 1992.
[7] INCOGEN Nuclear Cogeneration prefeasibility study, PINK partners, to bepublished.
[8] N.B. Siccama, CFD modeling of the HTR Reactor Cavity Cooling System, ECN-R--96-013, to be published.
[9] Bechtel International, Conceptual design summary report, Reference modular hightemperature gas cooled reactor plant, DOE-HTGR-87-092, San Fransisco, 1987.
26

IS THERE A CHANCE FOR COMMERCIALIZINGTHE HTGR IN INDONESIA?
B. ARBIE, Y.R. AKHMADNational Atomic Energy Agency,Serpong, Indonesia
Abstract
Indonesia is one of the developing countries in Asia-Pacific regions that activelyimproving or at least continuously maintain its economic growth. For this purpose, to fulfill adomestic energy demand is a vital role to achieve the goals of Indonesian development.Pertamma, the state-owned oil company, has recently called for a significant increase in domestic
gas consumption in a bid to delay Indonesia becoming a net oil importer. Therefore, there is goodchance for gas industry to increase their roles in generating electricity and producing automotivefuels. The latter is an interesting field of study to be correlated with the utilization of HTGRtechnology where the heat source could be used in the reforming process to convert natural gasinto syngas as feed material in producing automotive fuels. Since the end of 1995 NationalAtomic Energy Agency of Indonesia (BATAN) has made an effort to increase its role in thenational energy program and Batan is also able to involve in the Giant Natuna Project or the othernatural gas field projects to promote syngas production applying HTGR technology. A series ofmeeting with Pertamma and BPPT (the Agency for the Assessment and Application ofTechnology) had been performed to promote utilization of HTGR technology in the Natuna
Project In this paper governmental policy for natural gas production that may closely relate tosyngas production and preliminary study for production of syngas at the Natuna Project will bediscussed. It is concluded that to gain the possibility of the HTGR acceptance in the project ascenario for production and distribution should be arranged in orther to achieve the break evenpoint for automotive fuel price at about 10 USS/GJ (fuel price in 1996) in Indonesia.
INTRODUCTION
Indonesia is one of the developing countries in Asia-Pacific regions that activelyimproving or at least continuously maintain its economic growth. For this purpose, to fulfill adomestic energy demand is a vital role to achieve the goals of Indonesian development.Pertamma, the state-owned oil company, has recently called for a significant increase in domestic
gas consumption in a bid to delay Indonesia becoming a net oil importer0. Therefore, there is
27

good chance for gas industry to increase their roles in generating electricity and producingautomotive fuels. However, gas development for domestic consumption is complicated due to
the scattered locations of the gas reserves and scattered demand in Indonesia. Most of the gasresources are remote from the mam consumption areas, and therefore projects will require largeinvestment and long lead time.
It is realized that distribution of synthetic fuel to the consumer is easier than for naturalgas. Furthermore there substantial tendencies increase in supply-demand gap for oil fuel mainlydiesel fuel and gasoline in Indonesia as well as in the Asia-Pacific regions. The HTGR as a heatsource could be used in the reforming process to convert natural gas into syngas as feed materialin producing synthetic fuels. Therefore, it is important to assess the realizability of the HTR rolein developing the natural gas projects. In this paper governmental policy for natural gasproduction in Indonesia that may closely relate to syngas production and preliminary study forproduction of syngas at the Natuna Project will be discussed.
GOVERNMENTAL POLICY FOR NATURAL GAS PRODUCTION
In order to speed up the development process, the government of Indonesia is engageddirectly in economic activities, through state-owned enterprises operating in various sectors. Inthe petroleum sector, the government's involvement is based primarily on the constitutionalprovision that all natural resources belong to the state and that economic activities consideredessential to the country be controlled by the state. Pertamina, the state oil and gas enterprise, hasa monopoly over all aspecs of oil and natural gas production, and controls all exploration,production, refining, transportation and marketing of oil and gas in Indonesia. However in the
upstream activities the Minister may appoint other parties as contractors for the state enterprises,if required, for the execution of upstream operation which can not yet be executed by the stateenterprises.
The involvement of Pertamina in the key activities of the oil and gas industry, include:- Upstream exploration and development of oil and gas fields, through direct participation
or through establishment of production sharing contract with national or foreigncontractors,
- The operation of the major gas transmission and supply systems,- Equity participation in downstream oil gas development projects.
28

The different areas in which the private sector, domestic as well as foreign, has played asignificant role, include among others:
- Financing of major oil and gas projects; Pertamina has utilized foreign commercial
lending institutions, trading house and other sources to acquire capital for the projectsexpansion.
- Engineering and construction of major oil and gas projects; the development and
construction of the majority of the capital intensive projects has been contracted toprivate firms.
- International marketing and distribution of crude oil, oil products and natural gas; the
marketing, distribution and export oil and gas is carried out by Pertamina through itsaffiliate companies.
In the downstream petroleum activities, throgh the Presidential Decree no. 42/1989 and itsrelated Minister of Mines and Energy Decree no. 03/1993, the private sectors, foreign as well as
domestic, have the opportunity to invest in the refining and processing of oil and gasundertakings. In the future, the private participation will become increasingly important in thedevelopment of oil and gas industry hi Indonesia. New regulations have been introduced, in
particular, the April 1992 revisions of the Foreign Investment Law, which allow foreign firms tohave 100% equity in domestic projects, which either have a minimum paid up capital of US$ 50million or which are implemented in less developed and remote areas outside Java or within areasjointly developed with the neighbouring countries. More recently, the Government Regulation no.20 issued in May 1994 was intended to allow foreign companies to invest in almost all kind of
business activities in Indonesia, with few exception hi the very essensial infrastructure.Pertamina, recently cafled for an significant increase in domestic gas consumption in a bid
to delay Indonesia becoming a net oil importer. With the scenario of optimistic productionrelated to low and high consumption, Indonesia win become a net oil importer in 2010 and 2003
respectively (the present daily production is about 1.6 million barrels per day). Therefore, there
is good chance for gas industry to increase their roles in generating electricity and producingsintetic fuels. Noted that currently ofl and natural gas reserves (proven and potential) areestimated at 9.1 billion bbls of oil and 123.6 TSCF of gas2). However, gas development for
domestic consumption is complicated due to the scattered locations of the gas reserves andscattered demand in Indonesia. Most of the gas resources are remote from the main consumption
areas, and therefore projects will require large investment and long lead time.Distribution of synthetic fuels is easier than for natural gas using pipeline or LNG tankers.
Hence, this approach may reduce the problems of natural gas distribution. The high temperature
29
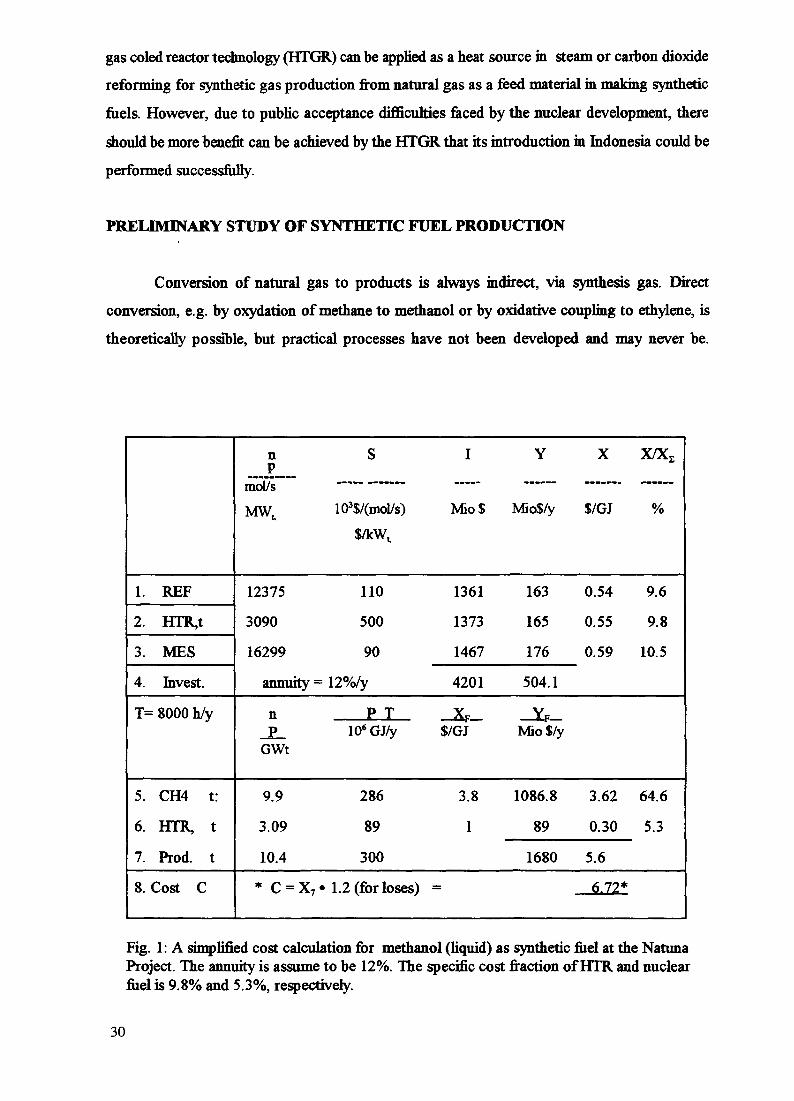
gas coled reactor technology (HTGR) can be applied as a heat source in steam or carbon dioxidereforming for synthetic gas production from natural gas as a feed material in making syntheticfuels. However, due to public acceptance difficulties faced by the nuclear development, thereshould be more benefit can be achieved by the HTGR that its introduction in Indonesia could beperformed successfully.
PRELIMINARY STUDY OF SYNTHETIC FUEL PRODUCTION
Conversion of natural gas to products is always indirect, via synthesis gas. Directconversion, e.g. by oxydation of methane to methanol or by oxidative coupling to ethylene, istheoretically possible, but practical processes have not been developed and may never be.
1.2.
3.
4.
REF
HTR,t
MES
Invest.
T= 8000 h/y
5.
6.
7.
8.
CH4 t:
HTR, t
Prod, t
Cost C
nP
mol/sMW,,
12375
3090
16299
annuity =
n_P_GWt
9.9
3.09
10.4
* C = X7»
s
103$/(mol/s)$/kW^
110
500
90
12%/y
P T106 GJ/y
286
89
300
1.2 (for loses)
I
Mio$
1361
1373
1467
4201
XF$/GJ
3.8
1
=
Y
Mio$/y
163
165
176
504.1
-&Mio$/y
1086.8
89
1680
X
$/GJ
0.54
0.55
0.59
3.62
0.30
5.6
6.72*
x/xz
%
9.6
9.8
10.5
64.6
5.3
Fig. 1: A simplified cost calculation for methanol (liquid) as synthetic fuel at the NatunaProject. The annuity is assume to be 12%. The specific cost fraction of HTR and nuclearfuel is 9.8% and 5.3%, respectively.
30

Technologies for large-scale production of synthetic diesel oil, gasoline and substitutes for theseproducts from synthesis gas are available today. High quality diesel and gasoline can be producedfrom synthesis gas by Fisher-Tropsch reactions. The technology has been used notably by SASOL
LIMITED in South Africa, and a major part of the transport fuels in that country is actually made
in Fischer-Tropsch plants on the basis of synthesis gas made from natural gas or coa!3).Since 1993/94 there is a gap about 20% or about 8 billion liters per year between supply
and demand of oil fuel mainly for diesel fuel and gasoline. It is estimated that in 2008/209 thefigure will reach at about 40% or 33 billion liters per year. The current price of gasoline inIndonesia is 9.6 USS/GJ (Rp. 700/liter). In this paper to simplify a case of study in applying the
HTGR it is assumed that production capacities of 8 billion liters per year of oil fuel or equivalentto 3.0xl08 GJ/year of synthetic fuel with energy price 9.6 USS/GJ using natural gas from Natunagas field as a raw gas should be achieved. It is also assumed that the composition of Natuna rawgas being fed to the plant is 75% of methane and 25% carbon dioxide which have energy price
of 3.8 USS/GJ. Assuming fed gas composition as above all of the CO2 in the fed gas could be
converted into the marketable product synthetic fuel Actually the CO2 content in the Natuna gasis about 70%, but then* content could be adjusted to about 25% and the excess carbon dioxide isreinjected or be treated by some other way.
A simplified method for calculation of cost estimation as proposed by Barnet4) has been
used in the present study. In the calculation it is assumed that the specific investment for HTR,reformer, and methanol synthesis plant are 500 US$/kWt, llOxlO3 US$/(mol/s), and 90xl(f
US$/(mol/s), respectively. Fuel price for the HTR is assumed 1USS/GJ. Based on hiscalculational prosedure (an assumption is that reaction turnovers are always 100%), to cover the
demand 3.0xl08 GJ/year the plant need a feed gas about 2.86xl08 GJ/year or 286 billion CF/yearmethane and 3090 MWt heat source from HTR which its operating time 8000 hours/year.
A simplified cost calculation for the synthetic fuel production is shown in Fig. 1. In the
final result of cost estimations an additional cost charges of 20%, C = 1.2 X, is used tocompensate an assumption that reaction turnovers are always 100%. Based on the result it is
clear there exists a potential of economical competitiveness for the exploitation of the gas of theNatuna Gas Field, in the production of synthetic fuel from the Natuna gas, making use of nuclear
energy in the form of high temperature heat from the High Temperature Reactor, HTR Theestimated cost inferred from the calculation is about 6.72 USS/GJ while the oil fuel price(gasoline) in Indonesia is 9.6 USS/GJ. We believe the production cost from the proposed
scenario could be reduced that lower than 6.72 USS/GJ by making much effort to optimize the
capital investment.The other reasons for existing economical competitiveness are that distribution
31

of methane to domestic market is tremendous problem and synthetic fuel is a readily marketable
product in the market of transportation as a subsitute dor gasolin and diesel with their relativelyhigh market values.
SUMMARY
The economical competitiveness for the exploitation of the gas of the Natuna Gas Field,Indonesia in the production of synthetic fuel applying nuclear energy in the form of hightemperature heat from the High Temperature Reactor, HTR has been discussed through thepresent paper. It is concluded that by making much effort there a chance for commercializing theHTR in Indonesia. Further study should be made to obtain the best estimated cost as soon aspossible.
REFERENCES
1. Subroto,: "Global Outlook for Natural Gas", Indonesian Conference on Natural Gas
for Petrochemicals, 26-27* June, Jakarta (1996).2. Supraptono, S.: "Governmental Policy for Natural Gas Production in
Indonesia",Conference on Natural Gas for Petrochemicals, 26-27* June, Jakarta (1996).3. Dybkjoer, Ib., and Hansen, J. S.:" Syngas Production Technology for Conversion of CO2
Rich Hydrocarbon Feedstocks", Conference on Natural Gas for Petrochemicals, 26-27*
June, Jakarta (1996).4 Barnert, H.: "Approach to Cost Estimation for the Exploitation of the Natuna Gas Field
in Indonesia, Using Nuclear Energy, in particular the HTR", Research Center Julich
GmbH, KFA; Institute for Safety Research and Reactor Technology Fed. Rep. OfGermany. ( A paper material for the meeting with Batan-Indonesia (1996).
32
THE ESSENTIAL TRENDS OF HGR DEVELOPMENT XA9846669IN THE RUSSIAN FEDERATION
Yu.P. SUKHAREVOKB Mechanical Engineering,Nizhny Novgorod,Russian Federation
Abstract
The up-to-day Russian consept of HTGR technology development is presented in paper. Atpresent it reduces to the following:
- the modular HTGR measured up to modern safety requirements with pebble bed core andspherical fuel elements of up to 200 MW thermal power have being developed for production ofprocess heat;
- for electricity production with maximal efficiency through gas turbine cycle the plant designwith modular HTGR containing prismatic block annular core has being carried out.
Conceptual design of GT-MHR reactor plant of 600 MW thermal, developing withGENERAL ATOMICS cooperation is the base of Russia activity in HTGR technology in currenttime.
The main characteristic properties of GT-MHR are presented in this paper. It is assumes thatreactor construction should be oriented as well to a core with weapon-grade plutonium as to a corewith lowenriched ( up to 20%) uranium to use in reactor plant for commercial electricity production.The design and construction cost evaluations for plant consisting of 4 modulars are shown, theschedule of demonstration reactor realization is presented as well. In paper the following key R&Dproblems, wich may be resolved by the best way on the base of international cooperation arepresented:
- works associated with refine of fuel fabrication technology and its irradiation examination upto deep bumup (up to 70% fima);
- running tests of the fabrication technology for graphite blocks of necessary dimentions;
- studies of vessel material mechanical properties under the temperature up to 500 °C andlarge-scale vessels production;
- tests of the core and reactor components in critical test facilities including studies of controlrods effectiveness and reactivity temperature effects, investigation of uniformity of helium mixing atthe core outlet and fuel col urns stability;
- tests of turbine system separate parts including electromagnetic bearings as well as combinedtests of full-scall turbine system in the test facility;
-tests of a "hot" gas line and traveling seals to reduce helium bypass leakage inside the powerconversion loop , et. so.
33
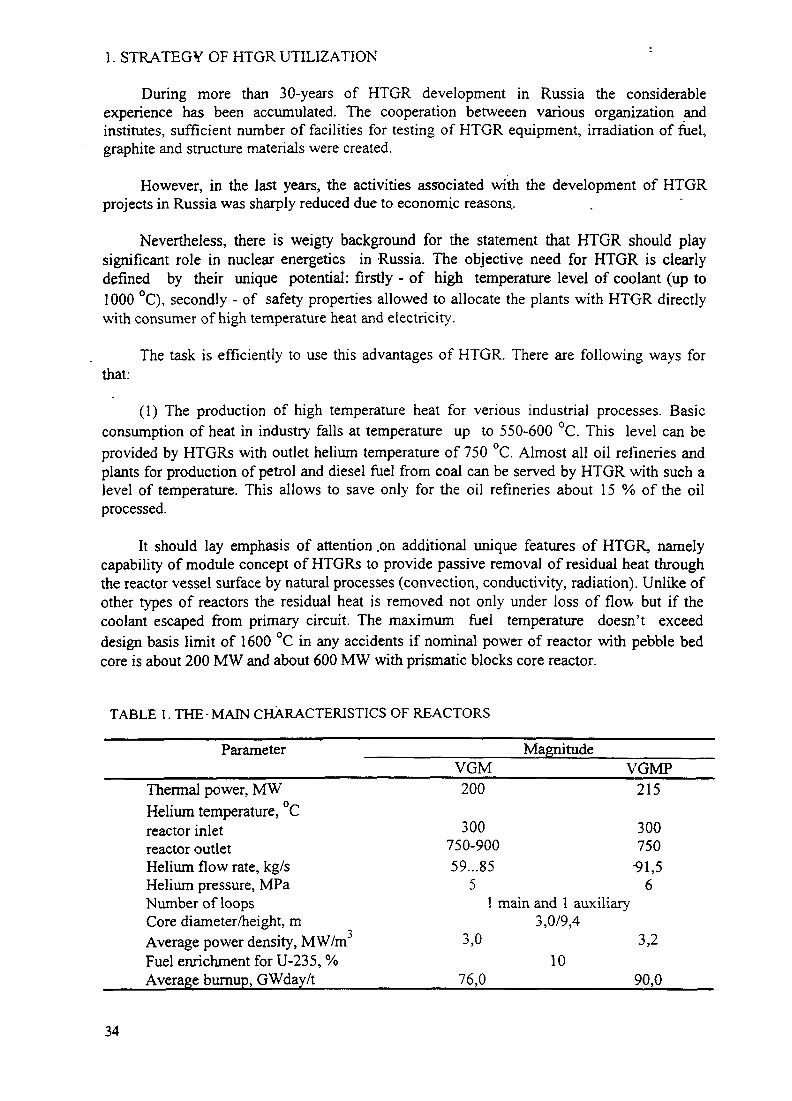
1. STRATEGY OF HTGR UTILIZATION
During more than 30-years of HTGR development in Russia the considerableexperience has been accumulated. The cooperation betweeen various organization andinstitutes, sufficient number of facilities for testing of HTGR equipment, irradiation of fuel,graphite and structure materials were created.
However, in the last years, the activities associated with the development of HTGRprojects in Russia was sharply reduced due to economic reasons..
Nevertheless, there is weigty background for the statement that HTGR should playsignificant role in nuclear energetics in Russia. The objective need for HTGR is clearlydefined by their unique potential: firstly - of high temperature level of coolant (up to1000 °C), secondly - of safety properties allowed to allocate the plants with HTGR directlywith consumer of high temperature heat and electricity.
The task is efficiently to use this advantages of HTGR. There are following ways forthat:
(1) The production of high temperature heat for verious industrial processes. Basicconsumption of heat in industry falls at temperature up to 550-600 C. This level can beprovided by HTGRs with outlet helium temperature of 750 °C. Almost all oil refineries andplants for production of petrol and diesel fuel from coal can be served by HTGR with such alevel of temperature. This allows to save only for the oil refineries about 15 % of the oilprocessed.
It should lay emphasis of attention .on additional unique features of HTGR, namelycapability of module concept of HTGRs to provide passive removal of residual heat throughthe reactor vessel surface by natural processes (convection, conductivity, radiation). Unlike ofother types of reactors the residual heat is removed not only under loss of flow but if thecoolant escaped from primary circuit. The maximum fuel temperature doesn't exceeddesign basis limit of 1600 °C in any accidents if nominal power of reactor with pebble bedcore is about 200 MW and about 600 MW with prismatic blocks core reactor.
TABLE 1. THE-MAIN CHARACTERISTICS OF REACTORS
Parameter MagnitudeVGM VGMP
Thermal power, MWHelium temperature, Creactor inletreactor outletHelium flow rate, kg/sHelium pressure, MPaNumber of loopsCore diameter/height, mAverage power density, MW/mFuel enrichment for U-235, %Average burnup, GWday/t
200
300750-90059...85
5
215
300750
-91,56
1 main and 1 auxiliary3,0/9,4
3,0 3,210
76,0____________90,0
34

L. _ _ J=—=L _
1 - reactor2 - pressure vessels unit3 - intermediate heat exchanger4 - steam generator5 - gas circulator6 - surfase cooling system
7 - fuel circulation system8 - small absorber balls system9 - helium purification system10- relief valve11- steam - turbine plant
FIG. 1 VGM reactor plant.
35

•^ Intermediate^_ circuit helium
L J L _ _ J1 - reactor core2 - vessels block3 - core protective housing4 - intermediate heat exchanger5 - main gas blower with a cut-off valve6 - relief valve7 - heljum purification system
8 - fuel circulation system9 - small absorber balls system10- fuel element discharge facility11-CPS rod drive12- loading volume of SABS
13- emergency cooldown system14-localized valve
FIG. 2. VGM-P schematic diagram
36

The possibility of core meltdown and its relocation in competely excluded taking intoaccount very high temperature of graphite sublimation.
VGM project [1] with pebble bed core reactor of 200 MW aimed at combinedproduction of process of heat and electricity. VGMP project [2] with reactor of 215 MWwas completely orientated towards production of heat and designed for a standard of oil-refinery plant with accounting of user's requirements.
Table 1 shows the main characteristics of these reactors. Fig. 1,2 show the schematicdiagrams of these reactor plants.
(2) The second way is use of HTGR's only for electricity production. It is to be notedhowever, that connection of HTGR with conventional steam-water cycle doesn't correspondto their capabilities and can't provide competitiveness of HTGRs with the other energysources. Realization of HTGR advantages should look for a combination of HTGRs with newtechnologies.
Usage of gas-turbine cycle in HTGR, which development was began recently allows toreach a net thermal conversion efficiency up to 48-50 %. This in combination with very deepbumup of fuel and unique level of safety opens the new prospects for HTGR as electricityproducer.
Thus, at present the strategy of HTGR utilization has formed, namely:
- for production of only process heat, using modular type of HTGR with thermal powerof about 200 MW and pebble bed core;
- for electricity production through gas turbine cycle using modular type of HTGR withthermal power of about 600 MW and a core formed from prismatic blocks.
This strategy is assumed to more completely demonstrate the advantages of this type ofreactors.
2. THE DESIGN OF HIGH TEMPERATURE HELIUM REACTOR WITH A GASTURBINE (GT-MHR)
HTGR has a unique ability on reaching overhigh fuel burnup (up to 800 GWday/t incomparison with 150 GWday/t in sodium reactors and 60 -70 GWday/t in VVER) and has aposibility of 90 % bumup of initial fission material. This capacity allows to use of HTGRs forinvolving of weapon grade plutonium (WGPu) to energy production with subsequentdisposition of spent fuel without additional reprocessing.
To realization of this unique property MINATOM (Russian Federation Ministry forAtomic Energy) and leading American firm General Atomics (GA) in February 1995 havewritten the agreement on joint development of HTGR with direct gas turbine cycle and beganto finance the conceptual desing of GT-MHR. FRAMATOM has recently joined thiscooperation program.
Russian GT-MHR desing is based on GA reactor concept [3]. GT-MHR plant is acoupling of passively safe modular reactor with helium coolant with up-to-date technology
37
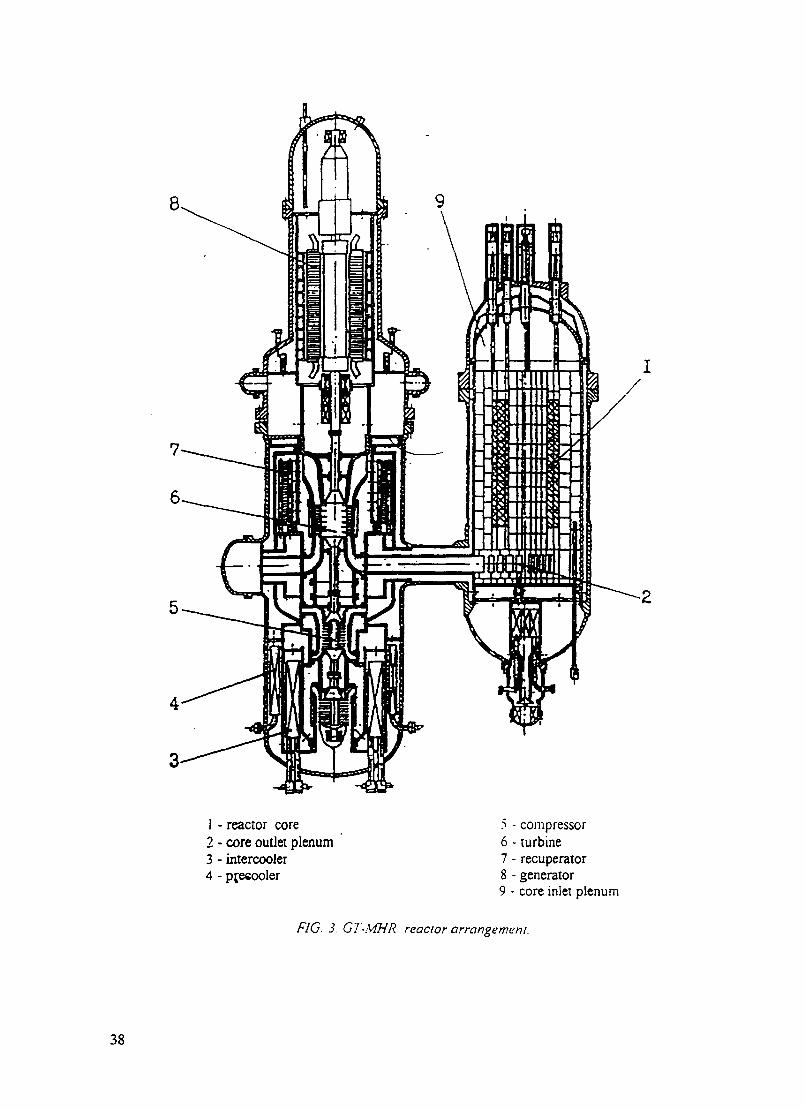
1 - reactor core2 - core outlet plenum3 - intercooler4 - pjesooler
.1 - compressor6 - turbine7 - recuperator8 - generator9 - core inlet plenum
FIG. 3. GT-MHR reactor arrangement.
38
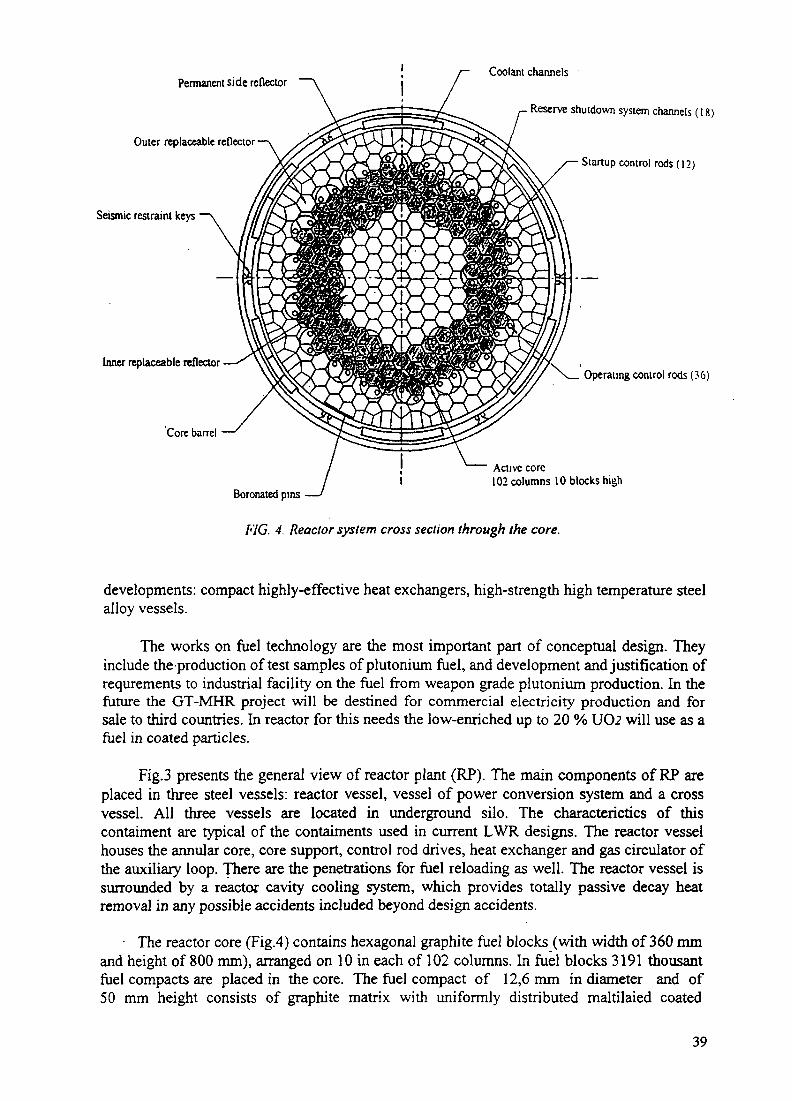
Permanent side reflector
Outer replaceable reflector
Coolant channels
Seismic restraint keys
Inner replaceable reflector
Core barrel
Reserve shutdown system channels ( 1 8 )
Startup control rods (12)
Operating control rods (36)
Active core102 columns 10 blocks high
Boronated pins
f''!C. 4. Reactor system cross section through the core.
developments: compact highly-effective heat exchangers, high-strength high temperature steelalloy vessels.
The works on fuel technology are the most important part of conceptual design. Theyinclude the production of test samples of plutonium fuel, and development and justification ofrequirements to industrial facility on the fuel from weapon grade plutonium production. In thefuture the GT-MHR project will be destined for commercial electricity production and forsale to third countries. In reactor for this needs the low-enriched up to 20 % UO2 will use as afuel in coated particles.
Fig.3 presents the general view of reactor plant (RP). The main components of RP areplaced in three steel vessels: reactor vessel, vessel of power conversion system and a crossvessel. All three vessels are located in underground silo. The characterictics of thiscontaiment are typical of the contaiments used in current LWR designs. The reactor vesselhouses the annular core, core support, control rod drives, heat exchanger and gas circulator ofthe auxiliary loop. There are the penetrations for fuel reloading as well. The reactor vessel issurrounded by a reactor cavity cooling system, which provides totally passive decay heatremoval in any possible accidents included beyond design accidents.
- The reactor core (Fig.4) contains hexagonal graphite fuel blocks (with width of 360 mmand height of 800 mm), arranged on 10 in each of 102 columns. In fuel blocks 3191 thousantfuel compacts are placed in the core. The fuel compact of 12,6 mm in diameter and of50 mm height consists of graphite matrix with uniformly distributed maltilaied coated
39

particles on the basis of pyrocarbon and silicon carbied (PyC-SiC-PyC). For reactor shutdownand control of reactivity there are two systems: control rods system and system containingsmall absorber balls.
A specific feature of the core is the using of the Er20J - based poisoning absorber,which is pressed together with the graphite forming cylinder rods similar to fuel compacts.Erbium in the reactor with weapon grade plutonium serves a double purpose: it not onlyprovides compensation of the initial reactivity excess, but it also ensures the negativetemperature coefficient of reactivity. It contains ~ 23 % Er-167, the only one of the knownpoisoning absorbers having a strongly pronounced resonance ( > 1000 bam ) near 0,5 ev. Thepresence of this element is essential for obtaining the negative temperature reactivitycoefficient when the temperature rises.
There is a graphite reflector inside and outside of the core. The layers of reflectoradjacent to the core can be replaced during reactor operation.
The vessel of power convertion system houses turbogenerator (turbine and compressorwith one stage of generator cooling) and heatexchanging equipments (recuperator, intercoolerand precooler). The generator is placed in separate box and strongly connected withturbocompressor through the coupling. The generator and compressor are rotaited directly byturbine.
The magnetic bearings (three radial and one rested) are used in turbogenerator. Safedmechanical bearings are provided as well.
The hot gas duct to supply of hot helium from reactor to turbine is arranged in a crossvessel. The schematic flow diagram of GT-MHR is shown in Fig.5.
The direct Brayton cycle in GT-MHR is being carried out in following way:
-the helium coolant is being twice pressed in compressor and in intercooler;
-prilimary of helium heating up (before reactor input) is taking place in recuperatorwhich uses of helium energy after turbine;
- in reactor helium is being heated up to 850 °C;
- the hot helium of high pressure then is being expanded in turbine which moves thecompressor and generator;
- the helium of low pressure goes to recuperator where the helium of high pressure(after compressor) is heated up to 490 °C and goes to the core input;
- the excess of heat is removed in precooler with return water circuit.
The main characteristics of GT-MHR for Pu consumption are shown in Table 2. Itshould be noticed that the GT-MHR has sufficient less impact on the environment (lessthermal release and less need in water).
40

\ Cooling tower
Heat exchanger of intermediate Circulator of returnwater circuit water circuit
A Av vCirculator of intermediatewater circuit
Lov\ pressure compressor
Precooler
FIG 5 Schematic flow diagram ofGT-MHR gas turbine cycle
41
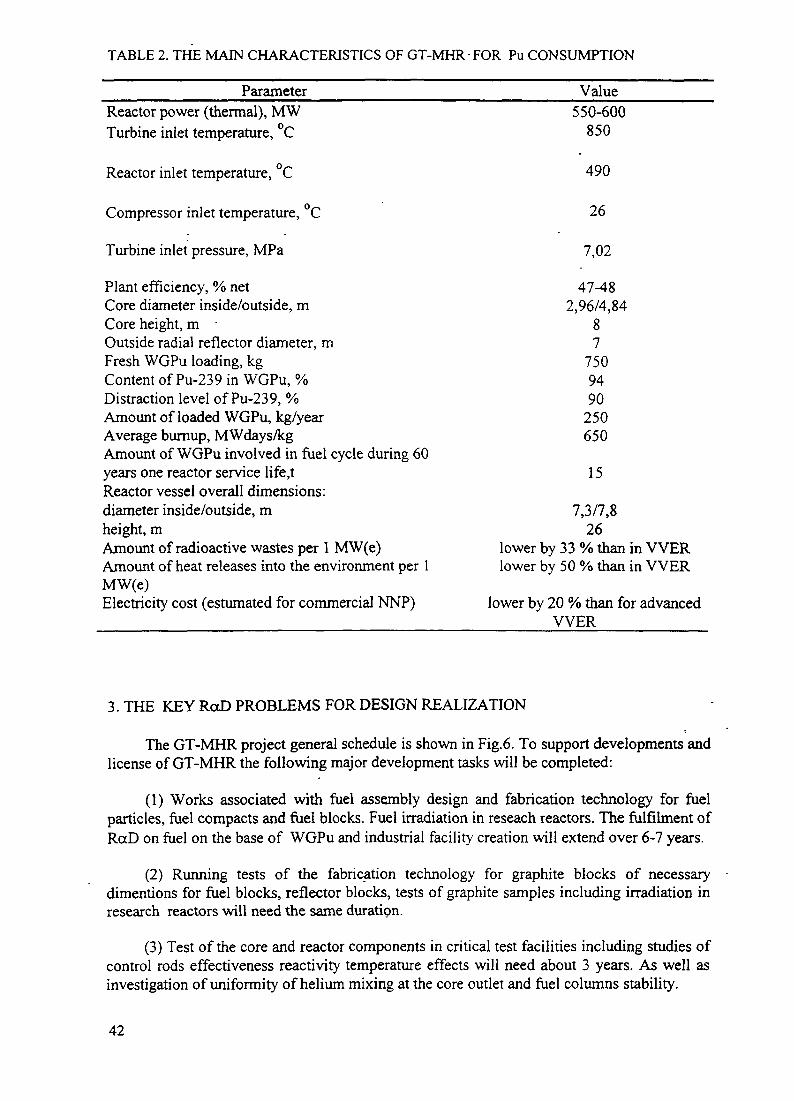
TABLE 2. THE MAIN CHARACTERISTICS OF GT-MHR-FOR Pu CONSUMPTION
___________Parameter_______________________Value_______Reactor power (thermal), MW 550-600Turbine inlet temperature, °C 850
Reactor inlet temperature, °C 490
Compressor inlet temperature, °C 26
Turbine inlet pressure, MPa 7,02
Plant efficiency, % net 47-48Core diameter inside/outside, m 2,96/4,84Core height, m 8Outside radial reflector diameter, m 7Fresh WGPu loading, kg 750Content of Pu-239 in WGPu, % 94Distraction level of Pu-239,% 90Amount of loaded WGPu, kg/year 250Average bumup, MWdays/kg 650Amount of WGPu involved in fuel cycle during 60years one reactor service life,t 15Reactor vessel overall dimensions:diameter inside/outside, m 7,3/7,8height, m 26Amount of radioactive wastes per 1 MW(e) lower by 33 % than in VVERAmount of heat releases into the environment per 1 lower by 50 % than in VVERMW(e)Electricity cost (estimated for commercial NNP) lower by 20 % than for advanced
VVER
3. THE KEY RoD PROBLEMS FOR DESIGN REALIZATION
The GT-MHR project general schedule is shown in Fig.6. To support developments andlicense of GT-MHR the following major development tasks will be completed:
(1) Works associated with fuel assembly design and fabrication technology for fuelparticles, fuel compacts and fuel blocks. Fuel irradiation in reseach reactors. The fulfilment ofRaD on fuel on the base of WGPu and industrial facility creation will extend over 6-7 years.
(2) Running tests of the fabrication technology for graphite blocks of necessarydimentions for fuel blocks, reflector blocks, tests of graphite samples including irradiation inresearch reactors will need the same duration.
(3) Test of the core and reactor components in critical test facilities including studies ofcontrol rods effectiveness reactivity temperature effects will need about 3 years. As well asinvestigation of uniformity of helium mixing at the core outlet and fuel columns stability.
42
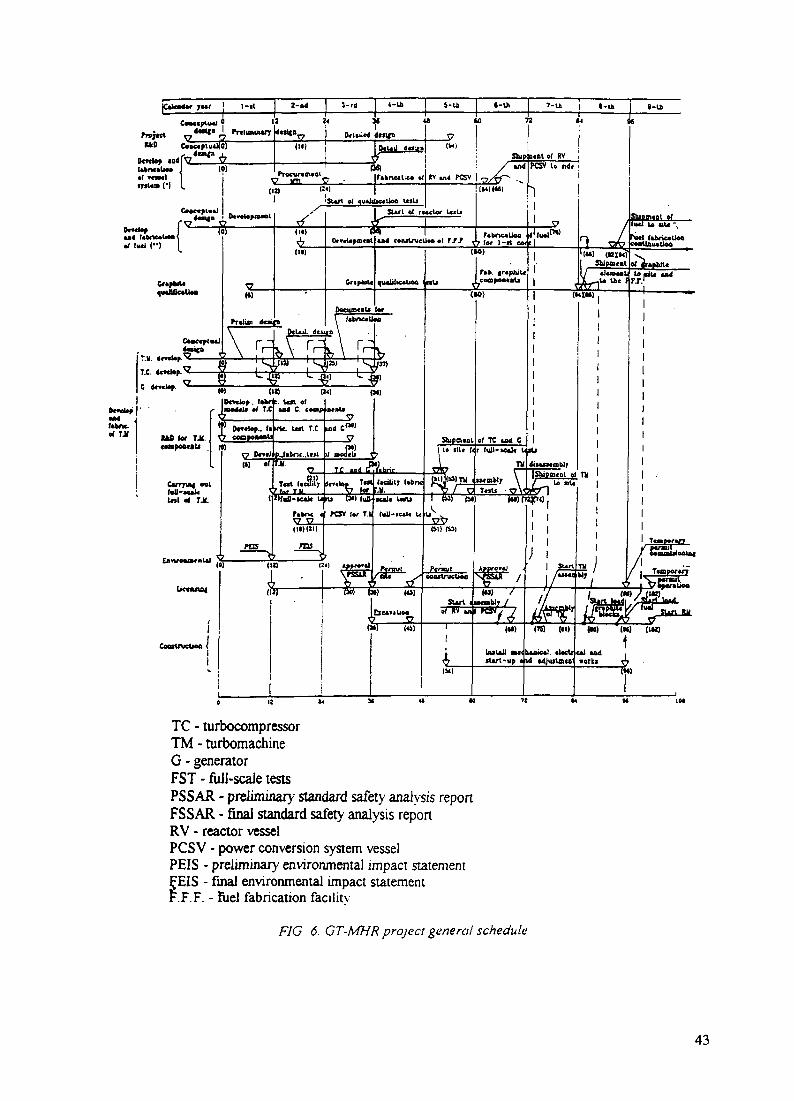
TC - turbocompressorTM - turbomachineG - generatorFST - full-scale testsPSSAR - preliminary standard safety analysis reportFSSAR - final standard safety analysis reportRV - reactor vesselPCSV - power conversion system vesselPEIS - preliminary environmental impact statement£EIS - final environmental impact statementF.F.F. - ruel fabrication facility
FIG. 6. GT-MHR project general schedule
43

MUM m ii minium mn m inn mn nm in
1 - reactor building2 - interim spent storage location3 - power module cooling auxilary
systems equipment4 - power supply equipment building5 - reactor service building6 - radioactive waste management building7 - personnel service building8 - operations center9 - remote shutdown building10- cask washdown bay11- fire pumphouse
12- helium storage structure13- parking14-NI warehouse
15- on-site spent fuel storage area16- parking17- dermneralized water tank18- auxilary boiler area
19- standby power system20- fuel oil storage tank21 - turbomachinery maintenance facility
22- switchyard23- cooling tower
FIG. 7. Plant arrangement
44

(4) Test of turbine system separate parts including magnetic bearings as well ascombined tests of a turbine system in the test facility including aerodynamic and thermal-mechanical tests of heat-exchanger equipment models and test of a "hot" gas line andtraveling seals to reduce helium bypass leakages inside the power conversion loop will extendthe duration of 4 years.
(5) Studies of vessel material mechanical properties under the temperature up to500 °C, licensing of technology and large-scale vessels production will need the duration of5-6 years.
Taking into account of up-to-day state of named above technologies in Russia, designdevelopment and necessary RaD fulfilment are planed during 4-5 years (without extendedirradiation test of fuel and fullscale tests of turbomachine). The named problems may beresolved by the best way on the base of international cooperation.
The cost estimations completed in this year are shown that the cost of designdevelopment and necessary RaD fulfilment consists of ~ US $275 M.
The general plant arrangement containing four reactor blocks is shown in Fig.7. Fordesign and construction of the first reactor block the duration of 8,5 years was taken, eachfollowing block will startup in every half year after the first unit. The expenditures for4 block reactor plant will consist of ~ US $960 M. Specific cost of electricity will be
/kW.h.
4. CONCLUSION
The strategy of HTGRs utilization in Russia up-to-day is following: the modularHTGR with pebble bed core with thermal power of 215 MW - for production of process heat;for electricity production with maximal efficiency through gas turbine cycle will use modularHTGR with prismatic block core. For this purpose a feasibility study of VGMP reactor hasbeen performed and conceptual design of GT-MHR is under way.
The conceptual design of GT-MHR with .gas-turbine cycle is the main trend of Russiaactivity in HTGR field. The leading organization of Russia : RRC Kurchatov Institute, SIALutch, ARSRIIM, OKBM, etc. are involved in this work.
To complete all RaD works in planned duration the all scientific and technical reasonsare having place. The problems associated with GT-MHR design could be solved mostlyeffective on the basis of international cooperation.
REFERENCES
[1] GREBENNIC, V.N., et al., "State of the Gas Cooled Reactor Investigation inRussia.Safety Concept and Basic Design Characteristics", Report for 1 1 IWG Meeting,IAEA-TC-389.95,(1993).
[2] GOLOVKO,V.F., et al., "State of HTGR Development in Russia", Report at IAEATCM on Design and Development of Gas-Cooled Reactor with Closed Cycle Gas-Turbines,Beijing, China, (30 October, 1995).
[3] SIMON, W., et al., "Desing Feature of the Gas Turbine Modular Helium Reactor(GT-MHR)", 4-th Annular Scientific and Technical Conference of the Nuclear Society,Nizhny Novgorod, Russia , (1993). ________
I NEXT PAQE(S) Itoft BLANK I 45
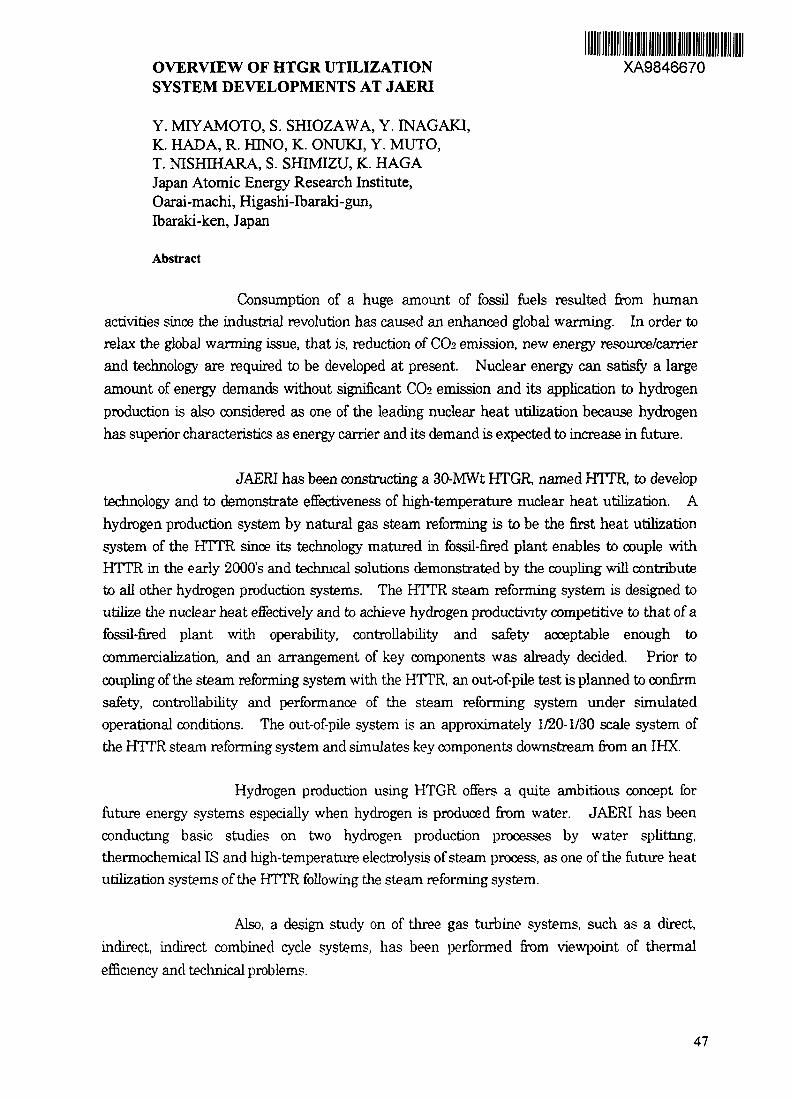
OVERVIEW OF HTGR UTILIZATION XA9846670SYSTEM DEVELOPMENTS AT JAERI
Y. MIYAMOTO, S. SHIOZAWA, Y. INAGAKI,K. HADA, R. HINO, K. ONUKI, Y. MUTO,T. NISHIHARA, S. SHIMIZU, K. HAGAJapan Atomic Energy Research Institute,Oarai-machi, Higashi-Ibaraki-gun,Ibaraki-ken, Japan
Abstract
Consumption of a huge amount of fossil fuels resulted from humanactivities since the industrial revolution has caused an enhanced global warming. In order torelax the global warming issue, that is, reduction of COs emission, new energy resource/carrierand technology are required to be developed at present. Nuclear energy can satisfy a largeamount of energy demands without significant C02 emission and its application to hydrogenproduction is also considered as one of the leading nuclear heat utilization because hydrogenhas superior characteristics as energy carrier and its demand is expected to increase in future.
JAERI has been constructing a 30-MWt HTGR, named HTTR, to developtechnology and to demonstrate effectiveness of high-temperature nuclear heat utilization. Ahydrogen production system by natural gas steam reforming is to be the first heat utilizationsystem of the HTTR since its technology matured in fossil-fired plant enables to couple withHTTR in the early 2000's and technical solutions demonstrated by the coupling will contributeto all other hydrogen production systems. The HTTR steam reforming system is designed toutilize the nuclear heat effectively and to achieve hydrogen productivity competitive to that of afossil-fired plant with operability, controllability and safety acceptable enough tocommercialization, and an arrangement of key components was already decided. Prior tocoupling of the steam reforming system with the HTTR, an out-of-pile test is planned to confirmsafety, controllability and performance of the steam reforming system under simulatedoperational conditions. The out-of-pile system is an approximately 1/20-1/30 scale system ofthe HTTR steam reforming system and simulates key components downstream from an IHX.
Hydrogen production using HTGR offers a quite ambitious concept forfuture energy systems especially when hydrogen is produced from water. JAERI has beenconducting basic studies on two hydrogen production processes by water splitting,thermochemical IS and high-temperature electrolysis of steam process, as one of the future heatutilization systems of the HTTR following the steam reforming system.
Also, a design study on of three gas turbine systems, such as a direct,indirect, indirect combined cycle systems, has been performed from viewpoint of thermalefficiency and technical problems.
47

1. Introduction
Consumption of a huge amount of fossil fuels resulted from humanactivities since the industrial revolution has caused an enhanced global warming. In order torelax the global warming issue, that is, reduction of C02 emission, new energy resource/carrierand technology are required to be developed at present. Nuclear energy can satisfy a largeamount of energy demands without significant C02 emission and its power generationtechnology by steam-turbine is said to be proven. The ratio of electricity to the secondaryenergy demands, however, is about 19% at present in Japan and is estimated to be only 23% inthe year 2010. Therefore, positive application of nuclear energy to nonelectric field is requiredto relax the global wanning issue. A hydrogen production system is considered as one of theleading nuclear heat utilization systems in nonelectric field because hydrogen has superiorcharacteristics as energy carrier and its demand is expected to increase in future.
A High-Temperature Gas-cooled Reactor (HTGR) provides a high-temperature nuclear heat with high thermal efficiency being applicable to both electric andnonelectric fields. Japan Atomic Energy Research Institute (JAERI) has been constructing a30-MWt HTGR with reactor outlet coolant temperature of 950=C, named HTTR (High-Temperature engineering Test Reactor), to develop technology and to demonstrate effectivenessof high-temperature nuclear heat utilization. The first criticality is scheduled in December1997, and reactor performance and safety demonstration tests will be carried out for severalyears[l]. After that, a high-temperature nuclear heat utilization system will be coupled withthe HTTR.
A hydrogen production system by natural gas steam reforming is to be thefirst heat utilization system of the HTTR since its technology matured in fossil-fired plantenables to couple with HTTR in the early 2000's and technical solutions demonstrated by thecoupling will contribute to all other hydrogen production system. At a preliminary designconducted from 1990 through 1995, a framework and key design of the HTTR steam reformingplant have been developed. Prior to coupling of the steam reforming system with the HTi'R,an out-of-pile test is planned to confirm safety, controllability and performance of the steamreforming system under simulated operational conditions. The out-of-pile system is anapproximately 1/20-1/30 scale system of the HTTR steam reforming system and simulate keycomponents downstream from an intermediate heat exchanger (IHX).
On the other hand, hydrogen production from water is considered as anideal method for hydrogen production using the HTGR because any C02 emission is notexpected from the system. JAERI has been conducting basic studies on two hydrogenproduction processes by water splitting as one of the future heat utilization systems of theHTTR following the steam reforming system. One is the iodine-sulfur (IS) process whichutilizes plural chemical reactions and works like a chemical engine to produce by absorbing hightemperature heat from the HTGR. Stable production of hydrogen and oxygen from water
48

were successfully demonstrated for 8 hours in dosed-cyde operation of a laboratory-scale testapparatus A study on materials suitable for corrosive process environments is under way forlarge-scale realization. The other is the high-temperature electrolysis of steam process whichutilize the inverse reaction of a solid oxide fuel cell Electrolysis cells in the course of fabricationof electrolysis tube and planar cells have been developed, and their performance tests have beenearned out.
Also, a design study on of three gas turbine systems, such as a direct,indirect, indirect combined cyde systems, has been performed from viewpoint of thermalefficiency and technical problems.
2. HTTR Hydrogen Production System by Natural Gas Steam Reforming
2.1 Design of HTTR steam reforming system
The HTTR steam reforming system is designed to utilize the nuclear heateffectively and to achieve hydrogen productivity competitive to that of a fossil-fired plant withoperability, controllability and safety acceptable enough to commercialization Figure 1 showsan arrangement of main components. The HTTR reactor supplies nudear heat of 30MW with950°C to parallel-loaded two heat exchangers in the reactor cooling loop, namely the IHX of10MW at the rated heat exchanging rate and a pressurized water cooler of the remaining20MW. The nudear heat of 10MW transferred from the IHX to the secondary helium loop isto be utilized for production of hydrogen. Due to heat loss along the secondary helium pipingfrom the IHX to a steam reformer (SR), the secondary helium temperature is reduced to 880°Cat the SR outlet, whereas the IHX outlet temperature is 905°C. Design specifications of theHTTR steam reforming system is shown in Table I. The key design concept was alreadydeveloped as follows[2]-
TABLE I Design specifications of the HTTR steam reforming hydrogen production system
PressureProcess-gas/Secondary-helturn
Temperatureinlet at steam reformerProcess-gas/Secondary-helium
Outlet at steam reformerProcess-gas/Secondary-helium
Hydrogen production rateSteam-carbon ratio
4.5/4 1 MPa
450/880 °C
600/600 °C3800 NmVh3.5
49
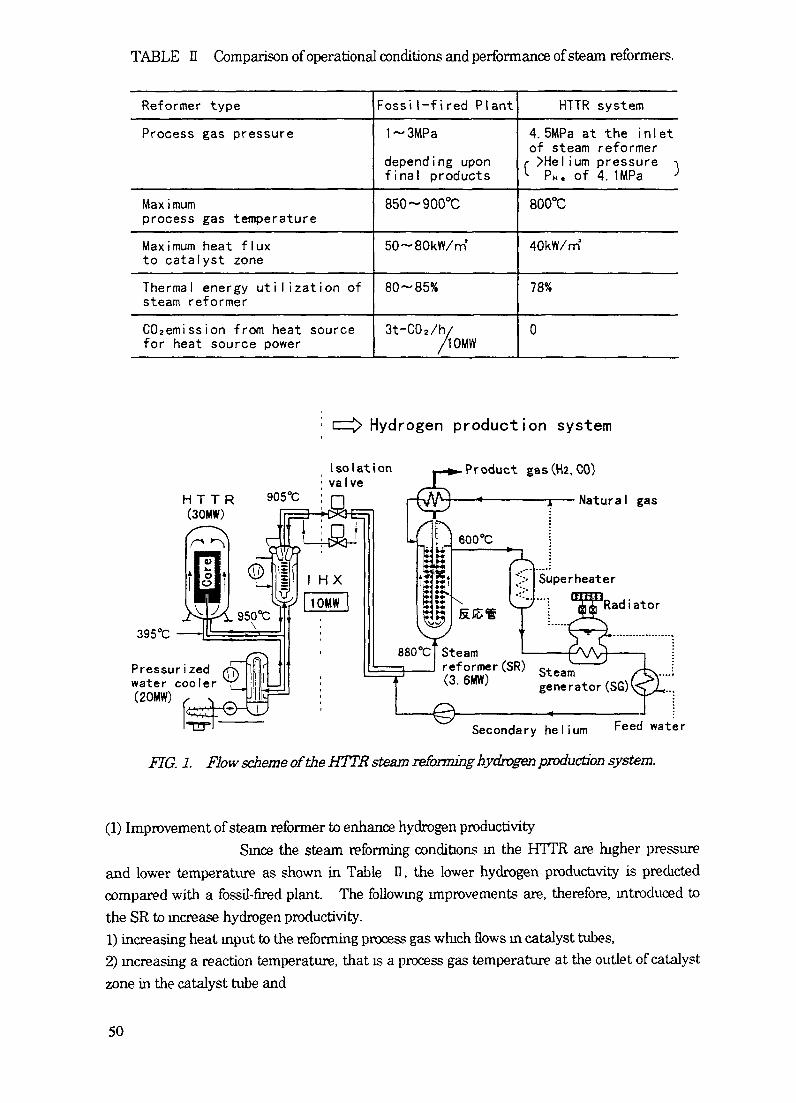
TABLE D Comparison of operational conditions and performance of steam reformers.
Reformer typeProcess gas pressure
Max i mumprocess gas temperatureMaximum heat fluxto catalyst zoneThermal energy utilization ofsteam reformerC02emission from heat sourcefor heat source power
Fossi l-f i red Plant1~3MPadepending uponfinal products850~900°C
50~80kW/rn
80-85%
3t-COa/h//10MW
HTTR system4. 5MPa at the i n 1 etof steam reformer
r >Helium pressure -\L PH. of 4. 1MPa J
800°C
40kW/rn
78%
0
Hydrogen production system
Isolationvalve
H T T R(30MW)
395°C
Pressurizedwater cooler(20MW)
Product gas(H2, CO)
Natural gas
*::• I Superheater
Radiator
reformer(SR) steam(3.6MW) generator(SG)
Secondary hel ium Feed water
FIG. 1. Flow scheme of the HTTR steam reforming hydrogen production system.
(1) Improvement of steam reformer to enhance hydrogen productivitySince the steam reforming conditions in the HTTR are higher pressure
and lower temperature as shown in Table n, the lower hydrogen productivity is predictedcompared with a fossil-fired plant. The following improvements are, therefore, introduced tothe SR to increase hydrogen productivity.1) increasing heat input to the reforming process gas which flows in catalyst tubes,2) increasing a reaction temperature, that is a process gas temperature at the outlet of catalystzone in the catalyst tube and
50

Reforming gas 450*0, 4 5Mpa
<=£> Reformed gas600'C
,—N Helium gas^ 600'C
Improvements of hydrogenproduction performance
Increasing heat input toreforming gas
•Thermal energyutilization of 78%
•Compact seamlesscatalyst tubes
1 Effective utilization of hot reformed gasBayonet type of catalyst tubes
2 Increasing helium temperature drop through reformerReformer outlet helium temperature 600'C
From helium 2 3-*3 6MW1From reformed gas 0 -1 2MW I 4 8MW m total
Increasing reactiontemperature
Helium side heat transfer enhancementOrifice baffle+wirenet
K ( Maximum reformed gas temperature 800'C^ I Maximum heat flux 40kW/mz
-— Catalyst
\V ^<4Vr^
Optimization of reforminggas composition
800*C
Helium gas 880'C, 4 1Mpa
1 Steam/Carbon=3 52 Excessive methane supply
(resulted in residual methane of 0 3MPa at outlet)
FIG. 2. Improvements of helium-heated steam reformer performance.
3) optimizing reforming gas composition so as to enhance the reforming rateSurvey of improved types of heat exchangers and an analytical study on enhancement ofhydrogen production rate lead to proposals shown in FIG 2 These improvements attain ahigh hydrogen productivity, that is, a thermal energy utilization of 78% is competitive to that ofa fissile-fired plant of 80-85% The technologies improved here are applicable also to otherHTGR-hydrogen production systems because a heat exchanger type of endothermic chemicalreactor is an essential technology
(2) Steam generator in the secondary helium loop for stable controllability and as a safetybarrier
A steam generator (SG) installed at downstream of the SR in thesecondary helium loop is found to provide the stable controllability for any disturbance at theSR due to a large capacity of heat sink In a thermal transient state that helium temperaturesat the SR outlet and then at the SG inlet go up by a malfunction in the reforming process gasline, a helium temperature at the SG outlet can be kept constant at the saturation temperatureof steam. Figure 3 shows analytical helium temperatures at inlet and outlet of the SR, SG andso on for the process gas feed rate of 0 to 100% of the rated flow rate. The helium temperaturechange is reduced from 280°C at SR outlet to only 5°C at SG outlet with change of the processgas feed rate. This result suggests the SG works as a thermal absorber and protects thereactor from thermal disturbance caused by the reforming system. Also, the SG is utilized to
51

Secondary helium loop
FIG. 3. Change of the secondary helium temperatures at steam reformer and steamgenerator for the process gas feed rate ofO to 100%.
Sofc Distance
c/v
l / v
n/o
FireBarrier
Secondary He Piping
Emergencyshut off valve
C/V Conioinmeni VesselR/D Reactor OuildmgI/V • Isolation ValveMIX Intermediate Heat ExchangerSR Steam ReformerSG Steam Generator
FIG. 4. Safety design concept against Gre and explosion.
avoid a reactor scram due to a malfunction or accident at the reforming system. The secondaryhelium is designed to be passively cooled by only the SG, using natural convection of steam andcondensed water between the SG and a radiator installed above the SG. This passive coolingsystem by the SG is now under design to meet safety requirements with reasonableconfiguration.
52

(3) Safely barrier against fire/explosionA functional or physical barrier is required to assure the safety of a
nuclear system and public. The HTTR-steam reforming system has a potential possibility oftwo-type fire/explosion, namely outside and inside of a reactor building (R/B). The safety designconcept is schematically illustrated in FIG. 4. Against the fire/explosion outside the R/B, it isreasonable to assure safety integrity of safety-related items against a potential fire/explosionbecause a low possibility of fire/explosion should be assumed. Against the fire/explosion insidethe R/B, however, it is the principle to take safety measures to prevent occurrence offire/explosion. The basic design concept is to limit the ingress of amount of explosive gas fromthe SR through the secondary helium loop within an allowable value. A combination ofisolation valves in a containment vessel and emergency shut-off valve in the process gas feedline is effective to restrict the amount of ingress gas.
2.2 Out-of-pile test
Prior to coupling of the steam reforming system with the HTTR, an out-of-pile test is required to confirm the safety, controllability and performance of the steamreforming system under the simulated operational conditions. The out-of-pile system is anapproximately 1/20-1/30 scale system of the HTTR steam reforming system and simulates keycomponents downstream from the IHX. The main objectives of the out-of-pile system are asfollows:1) design verification of performance of high temperature components, such as the SR, SG,isolation valve and so on, including hydrogen productivity,2) investigation of transient behavior of steam reforming system, and3) establishment of operation and control technologies so as not to give the reactor a significantdisturbance at steam reforming system trouble.
The design of the out-of-pile test system has been carried out since 1995, and its constructionwill start from 1997.
3. Study on Hydrogen Production by Water Splitting
Hydrogen production using a HTGR offers a quite ambitious concept forfuture energy systems especially when hydrogen is produced from water. JAERI has beenconducting basic studies on two hydrogen production processes by water splitting,thermochemical IS and high-temperature electrolysis of steam process, as one of the future heatutilization systems of the HTTR following the steam reforming system.
3.1 Thermochemical IS process
Thermochemical IS process utilizes plural chemical reactions and workslike a chemical engine to produce hydrogen by absorbing high temperature heat as shown inFIG. 5. Here, the sulfuric acid (HaSOt) decomposition reaction is an endothermic reaction, and
53
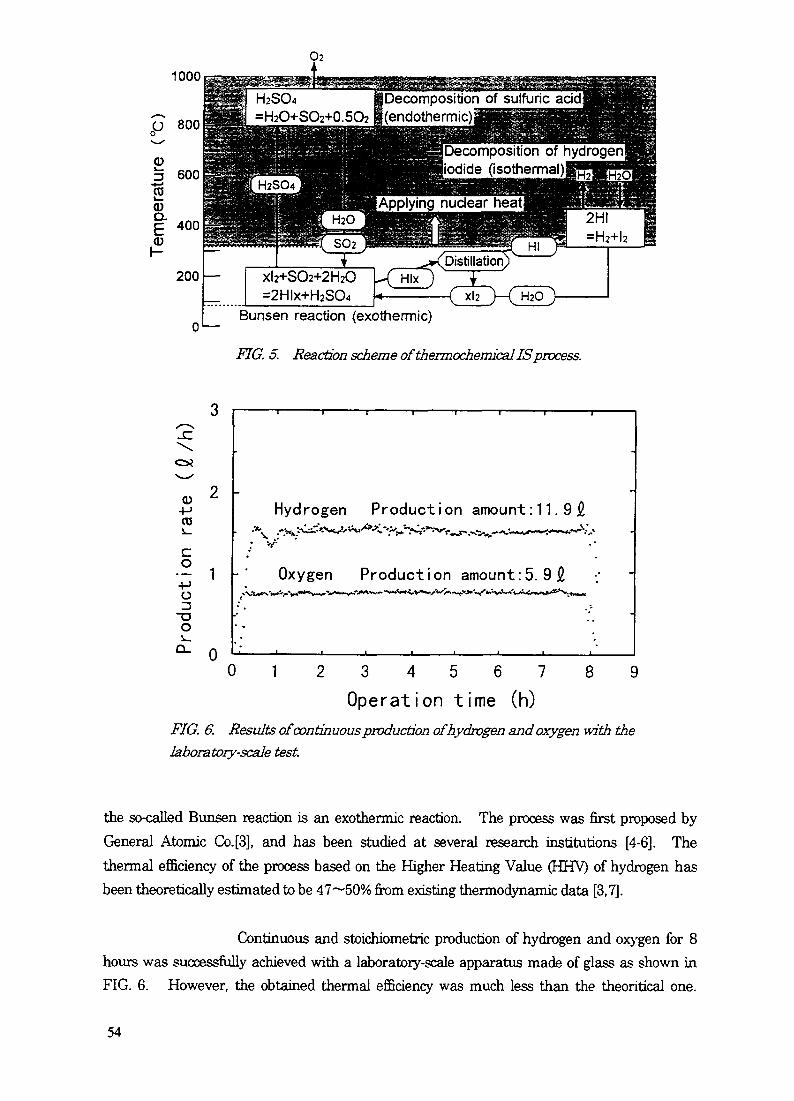
1000Decomposition of sulfuric acid(endothermic)
Decomposition of hydrogeniodide (isothermal)
Applying nuclear hea
xl2+SO2-f-2H20=2Hlx+H2SO4
o'— Bunsen reaction (exothermic)
FIG. 5. Reaction scheme of thermochemical IS process.
cu+->CO
c-- 1-t-Jo-ao
0
Hydrogen Production amount:11.9#„——:———-V.V
Oxygen Production amount:5. 9#
0 1 2 3 4 5 6 7 8 9
Operation time (h)FIG. 6. Results of continuous production of hydrogen and oxygen with thelaboratory-scale test.
the so-called Bunsen reaction is an exothermic reaction. The process was first proposed byGeneral Atomic Co. [3], and has been studied at several research institutions [4-6]. Thethermal efficiency of the process based on the Higher Heating Value (HHV) of hydrogen hasbeen theoretically estimated to be 47~50% from existing thermodynamic data [3,7].
Continuous and stoichiometric production of hydrogen and oxygen for 8hours was successfully achieved with a laboratory-scale apparatus made of glass as shown inFIG. 6. However, the obtained thermal efficiency was much less than the theoritical one.
54
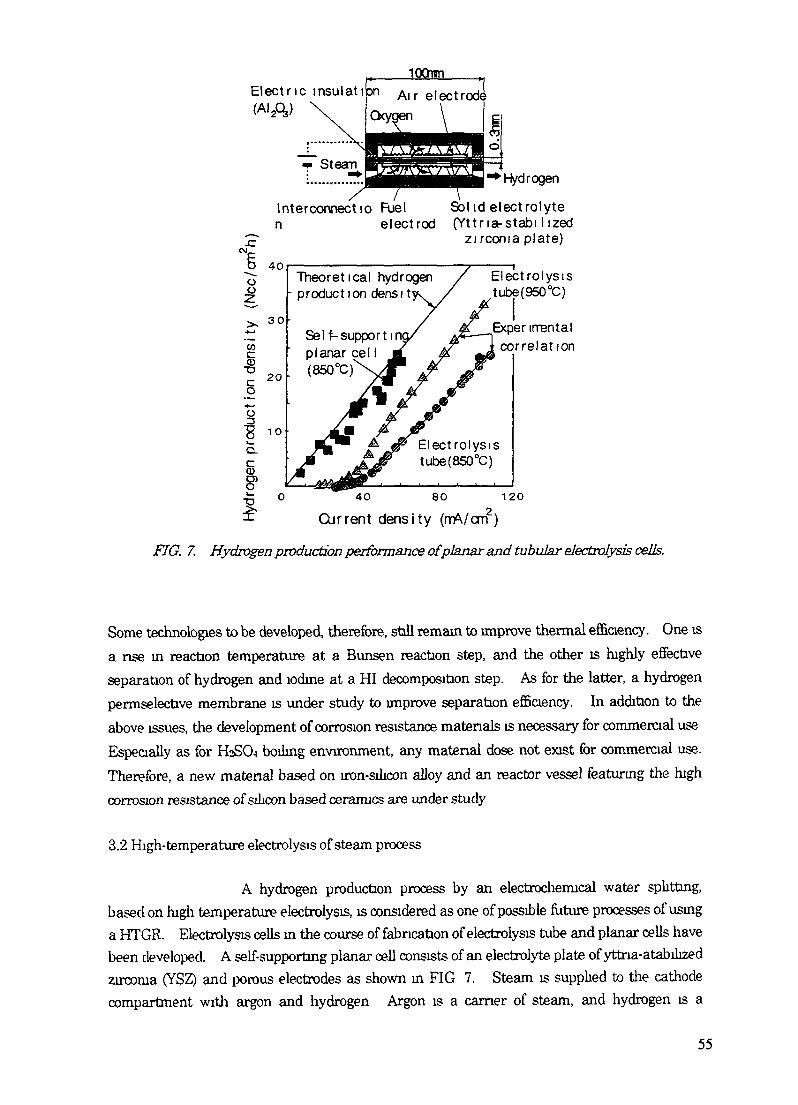
KXhinElectric insulati
Hydrogen
Interconnect 10 Fuel Sol id electrolyten electrod (Yttna-stabi I ized
zirconia plate)
oo
40
30
20
10Q.c
Theoretical hydrogen- production densi tj
Self-support iplanar eel(850°cf
Electrolysistube(950°C)
Experinrentalcorrelation
Electrolysistube(850 °C)
40 80 120
^ Current density (rrA/cm )
FIG. 7. Hydrogen production performance of planar and tubular electrolysis cells.
Some technologies to be developed therefore, stall remain to improve thermal efficiency. One isa nse in reaction temperature at a Bunsen reaction step, and the other is highly effectiveseparation of hydrogen and iodine at a HI decomposition step. As for the latter, a hydrogenpermselective membrane is under study to improve separation efficiency. In addition to theabove issues, the development of corrosion resistance materials is necessary for commercial useEspecially as for H2S04 boiling environment, any matenal dose not exist for commercial use.Therefore, a new matenal based on iron-silicon alloy and an reactor vessel featuring the highcorrosion resistance of silicon based ceramics are under study
3.2 High-temperature electrolysis of steam process
A hydrogen production process by an electrochemical water splitting,based on high temperature electrolysis, is considered as one of possible future processes of usinga HTGR. Electrolysis cells in the course of fabrication of electrolysis tube and planar cells havebeen developed. A self-supporting planar cell consists of an electrolyte plate of yttna-atabikzedzirconia (YSZ) and porous electrodes as shown in FIG 7. Steam is supplied to the cathodecompartment with argon and hydrogen Argon is a earner of steam, and hydrogen is a
55

o*^
oc0);«^ —O)
—>-.o
"oek—
01
J—
Jt
52
50
48
46
44
42
an
i i > i i
K
AA 0
WA o -
^ O
•O
^-
• Direct cyc le ( D C )0 o Indirect cycle (I DC)
A Indirect combinedcyc le ( I D C C )
i i i i i2 3 4Cose n u m b e r
FIG. 8. Thermal cycle efficiencies of the direct, indirect, indirect combined cycle gasturbine systems.
Item / YearI Hydrogen productionby steam reforming0 HTTR system2)0ut-of-pi le
test system
2 Hydorgen productionby water spl i tt ing1) Thermocnemical
IS process
electrolysis of steamprocess
3 Gas-turbine
.... -96 •
/ Design
97 '98 '99 '00 '01 "02 '03 '04 ••'08 09
safety analysis f' Construction f' Test
/ Design ,/ Construct ion / Test
/ Laboratoy-scale test // Deveopment of process and mater ials_/
/Test
Large-scale/ Out-of-test / pi le test
/ Des i gn
FIG. 9. Development schedule ofHTGR utilization systems at JAERI.
reduced gas to keep nickel of the cathode material from oxidation. Dry air is supplied to theanode compartment. Relationship between hydrogen production rate and applied voltage forplanar and tubular cells is also shown in FIG. 7. As for the planar cell, hydrogen was producedat rate of 2.3Nm3/h at an applied voltage of 2.8V. Then hydrogen production density was3.6Ndm3/m% and was 1.4 times larger than that of the tubular cell at 850°C. The tests ofelectrolysis cells will be finished in 1996 after hydrogen productivity data is accumulated.
56
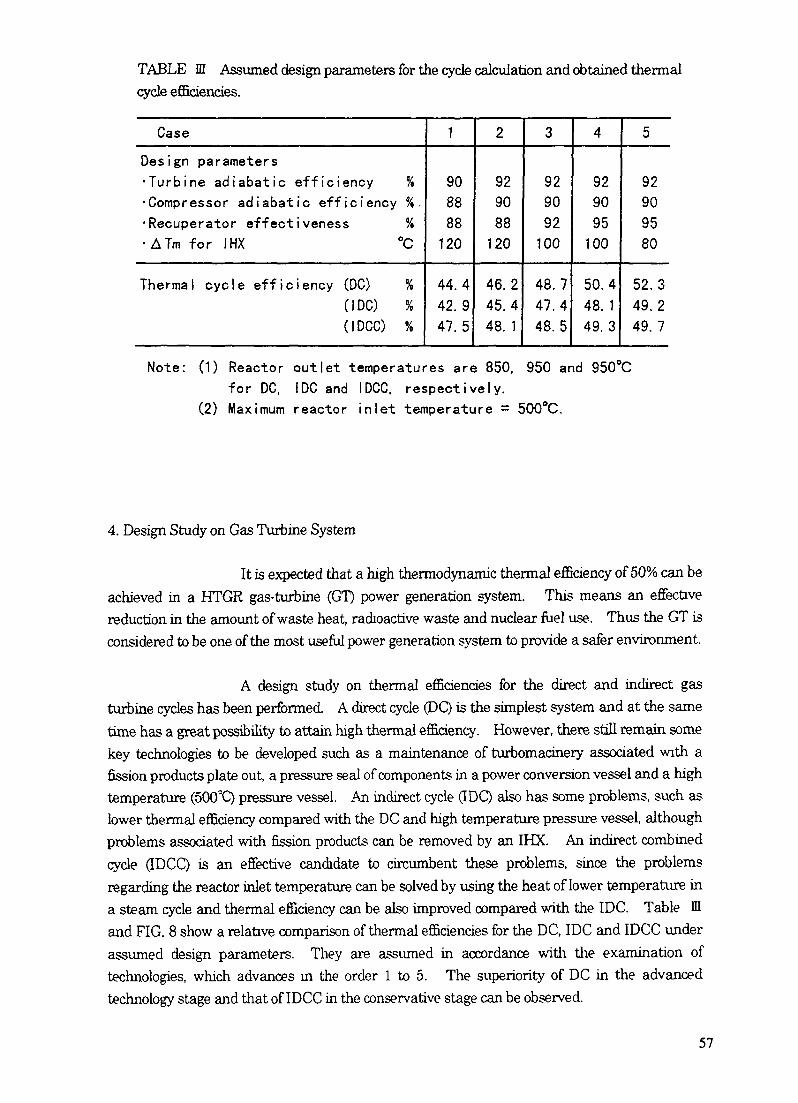
TABLE HI Assumed design parameters for the cycle calculation and obtained thermalcycle efficiencies.
CaseDesign parameters•Turbine adiabatic efficiency %•Compressor adiabatic efficiency %.•Recuperator effectiveness %• ATm for IHX °C
Thermal cycle efficiency (DC) %(IDC) %(IDCC) %
1
908888120
44.442.947.5
2
929088120
46.245.448. 1
3
929092100
48.747.448.5
4
929095100
50.448. 149.3
5
92909580
52.349.249.7
Note: (1) Reactor outlet temperatures are 850, 950 and 950°Cfor DC. IDC and IDCC, respectively.
(2) Maximum reactor inlet temperature = 500°C.
4. Design Study on Gas Turbine System
It is expected that a high thermodynamic thermal efficiency of 50% can beachieved in a HTGR gas-turbine (GT) power generation system. This means an effectivereduction in the amount of waste heat, radioactive waste and nuclear fuel use. Thus the GT isconsidered to be one of the most useful power generation system to provide a safer environment.
A design study on thermal efficiencies for the direct and indirect gasturbine cycles has been performed. A direct cycle (DC) is the simplest system and at the sametime has a great possibility to attain high thermal efficiency. However, there still remain somekey technologies to be developed such as a maintenance of turbomacinery associated with afission products plate out, a pressure seal of components in a power conversion vessel and a hightemperature (500°Q pressure vessel. An indirect cycle (IDC) also has some problems, such aslower thermal efficiency compared with the DC and high temperature pressure vessel, althoughproblems associated with fission products can be removed by an IHX. An indirect combinedcycle (IDCC) is an effective candidate to circumbent these problems, since the problemsregarding the reactor inlet temperature can be solved by using the heat of lower temperature ina steam cycle and thermal efficiency can be also improved compared with the IDC. Table ffland FIG. 8 show a relative comparison of thermal efficiencies for the DC, IDC and IDCC underassumed design parameters. They are assumed in accordance with the examination oftechnologies, which advances in the order 1 to 5. The superiority of DC in the advancedtechnology stage and that of IDCC in the conservative stage can be observed.
57

A future work in JAERI will be devoted in the field of an improvement ofreactor design and safety, and studies regarding the concepts of power conversion vessel,turbomachinery, recuperator. Furthermore, a trade-off study between IDC and IDCC will becarried out. In parallel to the design, material tests of a recuperator and turbine blade are alsoplanned.
5. Development Schedule
Figure 9 shows the development schedule of the HTGR utilizationsystems at JAERI. The out-of-pile test of the steam reforming system will be conducted from2000 to 2004, and the results will be reflected to design and safety review of the HTTR steamreforming system. The construction of the HTTR system will be planned to start from 2002,and be followed by the demonstration test till 2009. The thermochemical IS process is plannedas one of the future candidates of the HTTR following the steam reforming system. After alarge-scale test vising commercially available metal and ceramic materials, an out-of-pile test isscheduled from 2007. The design study on the gas turbine system will be carried out till 2000.
References
1. JAERI, Present status of HTGR research and development, (1996).2. Hada, K. et. al., The 3rd JAERI Symposium on HTGR Technologies, (1996).3. Norman, J. H. et al., GA-A16713, (1982).4. Onuki, K. et al., JAERI-Review 94-006, (1994).5. Berndhauser, C. and K. F. Knoche, Int. J. Hydrogen Energy, 19,239-244(1994).6. Ozturk, I. T. et al., Trans IChemE, 72, Part A, 241-250(1994).7. Engels, H., Proc. 6th World Hydrogen Energy Conf., Vol.2, Vienna, (1986).
58

INTERNATIONAL CO-OPERATION IN XA9846671DEVELOPING THE GT-MHR
M.P. LA BAR, W.A. SIMONGeneral Atomics,San Diego, California,United States of America
Abstract
High Temperature Gas-Cooled Reactor (HTGR) technology and its developmentduring the last 30 years has led to the design, construction, and operation of five graphite-moderated helium-cooled reactors with gas outlet temperatures up to 950°C and powerlevels up to 330 MWe. Design and licensing activities of even larger units (up to 1200 MWe)were well advanced in the U.S. when dropping electricity demand led to cancellation ofthese commercial units.
The experience from these early plants and related design and development activitiesprovided a solid technology base when gas-cooled reactor development shifted towardssmaller, passively safe designs. Although operating experience and past developments arestill applicable, the push for safer, highly efficient and economical units, and the need forspecial applications, has added new requirements that demand and justify further R&D andopens the door for broad international cooperation in the further development of basetechnologies for HTGR applications.
In the fall of 1995, driven by budget constraints and anti-nuclear sentiments, the USgovernment decided to discontinue financial support of the Gas Turbine-Modular HeliumReactor (GT-MHR). At that time, significant work was underway with participation ofseveral vendors with specialized expertise in various aspects of the GT-MHR. Fortunately,the US government provided for documenting the design and development status throughan orderly close-out program. Concurrent elimination of government restrictions opened thedoor for broader international cooperation.
Discussion between General Atomics and the Russian Ministry of Atomic Energy(MINATOM), in the summer of 1994, led to an agreement on a jointly funded design anddevelopment program for the GT-MHR. The program is initially focused on the burning ofweapons plutonium that becomes available from dismantled nuclear weapons. The long termgoal is to utilize the same design for commercial applications - using uranium fuel. Thisprogram took advantage of existing technologies and facilities in the US and Russia, butright from the beginning left the door open for broader international cooperation.Accordingly, in January 1996, FRAMATOME has joined the ongoing effort. Discussions areunderway with other international entities to join this program.
The program is proceeding well. Several Russian laboratories/design organizationsare participating with GA and FRAMATOME. Significant improvements in the powerconversion system design are a clear example of the benefit of the cooperative effort.
Further work needs to be done to confirm fuel and components prior to fulldeployment, etc., providing ample opportunities for international cooperation in many areas.
59

INTRODUCTION
The Gas Turbine - Modular Helium Reactor (GT-MHR) is an advanced HighTemperature Gas-cooled Reactor (HTGR) being developed in an international cooperativeprogram involving General Atomics (GA), the Russian Federation (RF) Ministry of AtomicEnergy (MINATOM), and FRAMATOME. The overall goal of the cooperative programis to first develop the GT-MHR for the disposition of surplus weapons plutonium in the RFand then to offer GT-MHR plants fueled with uranium to the international market forelectricity generation.
The first step in this cooperative program was an agreement between GA andMINATOM to complete the GT-MHR conceptual design. FRAMATOME subsequentlyjoined the conceptual design program. Other international organizations are actively beingpursued for participation in the conceptual design program and are expected to join shortly.
Very satisfactory process has been made to-date. Good technical work is beingperformed on the conceptual design, international interest in the program is growing, andUS restrictions imposed on GA regarding cooperation with RF on nuclear reactortechnology have been lifted. Prospects look good that the conceptual design results will bepositive and the program will move on into detail design and technology developmentactivities leading to prototype deployment. These activities will broaden the opportunitiesfor international participation.
Although the design work is proceeding on the basis of using weapons plutonium fuel,the project forms an excellent basis for worldwide commercial deployment of GT-MHRplants. A plutonium fueled plant will demonstrate the design and performance. Acommercial plant can then be deployed based on the prototype design but fueled withuranium without need for any significant design changes.
BACKGROUND
HTGRs are characterized by a graphite moderator, helium coolant and coatedparticle fuel. The graphite moderator and coated particle fuel provide an all ceramic corewhich allows for the generation of high temperature heat energy for electricity generationat high thermal conversion efficiencies and for process heat applications. Helium coolantis the best single phase, inert fluid available for transport of high temperature heat energyfrom the graphite core.
The five HTGR plants built and operated to-date have validated the basic HTGRdesign and performance characteristics. The key characteristics which these plants haveproven include:
The ability of coated particle fuel to reliably retain fission products to very hightemperatures (up to about 1600°C) and the production of coated particles incommercial quantities that meet the quality requirements necessary for hightemperature retention of fission products.
The inherent high heat capacity characteristics of HTGR graphite moderated reactorcores that provide long times for corrective measures to mitigate upset conditionswithout challenging safety limits.
60

ROD DRIVE/REFUELING PENETRATIONS
STEEL REACTORVESSEL
ANNULARREACTOR CORE
SHUTDOWNHEAT EXCHANGER
SHUTDOWNCIRCULATOR
MAINCIRCULATOR
STEAMGENERATORVESSEL
STEAMOUTLET
STEAMGENERATOR
FEEDWATERINLET
FIG. 1. 350 MWt Modular high temperature gas reactor
The advantages of helium as a nuclear reactor coolant. Safety issues are simplifiedby the coolant being single phase; corrosion products are eliminated by the coolantbeing inert.
The acceptability of two different fuel configurations, pebble and prismatic.
The adequacy of the technology data base for the design, analysis, construction, andoperation of HTGR reactors.
This HTGR technology data base was developed in the 1960s and 1970s in supportof the deployment of large central station power plants. A construction permit had beenissued in the US for the first of these plants. However, before large HTGR power plants
61

could be deployed in the US, the oil embargo in the mid 1970s occurred and extensiveenergy conservation measures were undertaken reducing the electricity demand growth rate.As a consequence, the need for new large central station power plants contracted.
All of the large HTGR plants on order in the US (10 units) were canceled, alongwith the cancellation of more than 100 LWR plants. The LWR plants under constructionwere delayed causing capital costs to escalate. Then, in 1979, the Three Mile Island accidentoccurred which led to wide spread public fear of nuclear power and costly backfits to theexisting LWR plants. The financial liabilities, the public's fear of nuclear, and the lack ofneed for new base load capacity combined to halt new nuclear plant orders in the US.
In the early 1980s, evaluations of the reasons for the dearth of new nuclear plantorders led to the conclusion that smaller, simpler nuclear power plants with inherent safetycharacteristics were needed for public acceptance. The Modular High Temperature GasReactor (MHTGR) was conceived to meet this need, Figure 1. The MHTGR employed asteam cycle power conversion system in common with the prior large HTGR plants.
The MHTGR design had unparalleled safety (meltdown proof), was considerablysimpler because of the absence of the need for complex safety systems (completely passivedecay heat removal system), and at 350 MWt/135 MWe per module was much smaller thanthe 1000+ MWe nuclear plant size common in that era. Furthermore, the design maintainedfuel temperatures below 1600°C using completely passive means to retain fission productswithin the coated particle fuel. This provided substantial additional simplifications; the needfor secondary containment was eliminated as were the needs for emergency plans forsheltering and evacuation of the public. There was, however, increased importance for thecoated particle fuel to meet high quality standards.
Economic evaluations indicated that a reference four module MHTGR plant using350 MWt/135 MWe modules had power generation cost projections which were non-competitive with equivalent sized coal and LWR plants. A larger MHTGR module designwas then developed rated at 450 MWt/175 MWe per module retaining the same safety andsimplification features. The reference four module plant using this module size hadprojected generation costs essentially equivalent to comparably sized coal plants and largeLWR plants. However, the technology for highly efficient combined cycle natural gas firedplants became the low cost new generation alternative. Being equivalent in cost to coal andLWR plants was judged to be an insufficient basis for committing the financial resourcesnecessary to design and construct a first MHTGR plant, and mature plants would not becompetitive with new, more efficient combined cycle plants.
The message to us was clear. To be competitive, the thermal efficiency of nuclearpower had to be markedly improved to compete with modern high efficiency fossil plants.HTGR technology has always held the promise for electricity generation at high thermalefficiency by means of a closed direct Brayton cycle and fortuitously, technologicaldevelopments during the past decade provided the key elements to realize this promise.These key elements are as follows:
The HTGR reactor size had been reduced in developing the passively safe moduledesign. At the same time, the size of industrial gas turbines had increased. Thetechnology was now available for a single turbomachine to accommodate the heatenergy from a single HTGR module.
62
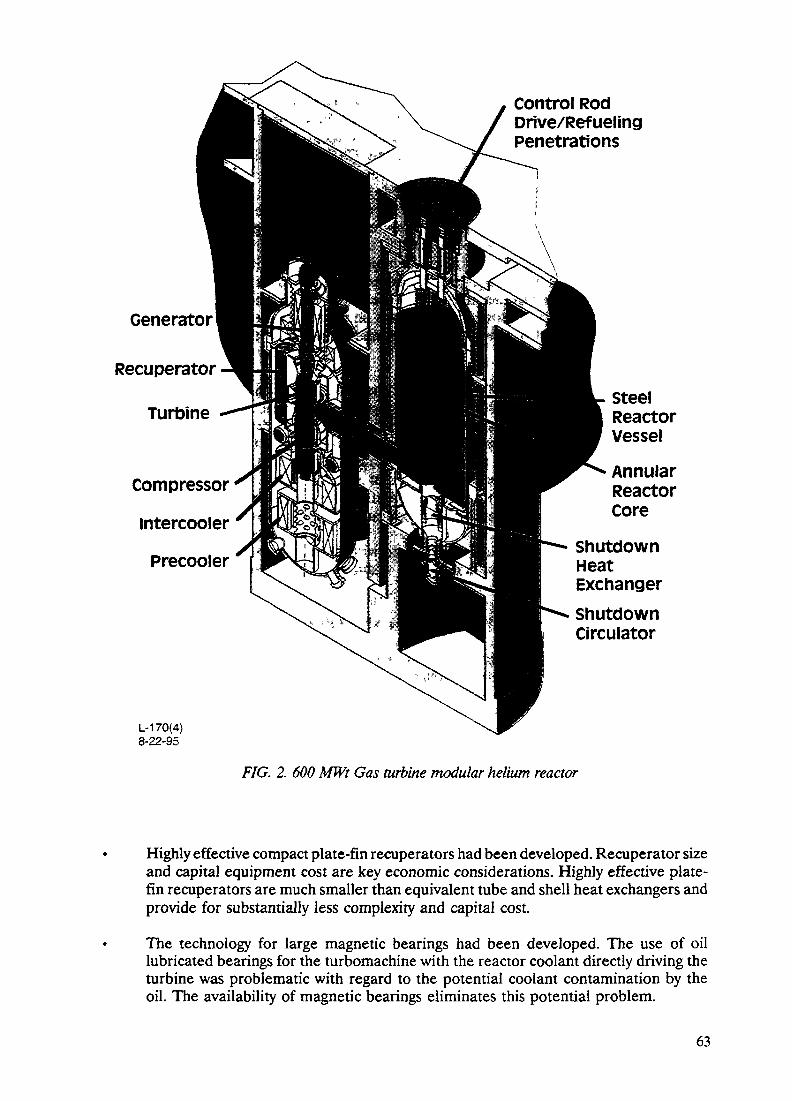
Control RodDrive/RefuelingPenetrations
Generator
Recuperator
Turbine
Compressor
intercooler
Precooler
L-170(4)8-22-95
SteelReactorvesselAnnularReactorcore
ShutdownHeatExchangerShutdownCirculator
FIG. 2. 600 MWt Gas turbine modular helium reactor
Highly effective compact plate-fin recuperators had been developed. Recuperator sizeand capital equipment cost are key economic considerations. Highly effective plate-fin recuperators are much smaller than equivalent tube and shell heat exchangers andprovide for substantially less complexity and capital cost.
The technology for large magnetic bearings had been developed. The use of oillubricated bearings for the turbomachine with the reactor coolant directly driving theturbine was problematic with regard to the potential coolant contamination by theoil. The availability of magnetic bearings eliminates this potential problem.
63
The product of integrating these technologies into a closed Brayton cycle powerconversion system coupled to a modular HTGR reactor is the Gas Turbine - ModularHelium Reactor (GT-MHR), Figure 2. The rated power of the GT-MHR was increased to600 MWt, from 450 MWt used in the prior MHTGR, based on further evaluations whichshowed the higher power level was acceptable without increasing the module vesseldiameter. With a net efficiency of 47.7%, a single GT-MHR module produces 286 MWe.
The GT-MHR was formally selected in 1993 as the reference concept fordevelopment by the US gas reactor program for commercial deployment. However, drivenby budget constraints and anti-nuclear sentiments, the US government decided todiscontinue financial support of the GT-MHR starting in the fall of 1995. At that time,significant work was underway with participation of several industrial companies andnational laboratories. Fortunately, the US government provided for documenting the designand development status through an orderly close out program. The documentation is nowessentially complete. US government restrictions on providing other countries access to thedocumentation were also eliminated which opens the door for broad internationalcooperation.
Concurrent with the 1993 selection of the GT-MHR as the reference concept fordevelopment in the US, GA and MINATOM signed a memorandum of understanding forcooperating on the development of the GT-MHR for commercial deployment. Subsequently,in early 1994, MINATOM proposed that the cooperative program focus on development ofthe GT-MHR for disposition of weapons plutonium. In the summer of 1994, GA andMINATOM agreed to initiate development of the GT-MHR for weapons plutoniumdisposition, and to jointly fund the preparation of the conceptual design, with the long termgoal of utilizing the same design fueled with uranium for commercial deployment.
In January 1996 FRAMATOME joined with GA and MINATOM as a participantin the cooperative program and is providing additional funding to support the GT-MHRconceptual design work in Russia.
GA/MINATOM COOPERATIVE PROGRAM AND PROGRESS
There are many technical, political, and economic advantages of the GT-MHRcooperative program. The technical advantages include the GT-MHR system advantages(melt-down proof safety, high generation efficiency, high plutonium destruction) and theprogram advantages realized from reciprocal technology transfer covering a broad spectrumof scientific, engineering, materials and manufacturing know-how. The political advantagesinclude fulfillment of joint plutonium destruction proliferation objectives, economic supportfor Russian institutes and industries, and development of an environmentally clean, pollutionfree energy source. The economic advantages include reduced development costs and anuclear plant design for commercial deployment having low electricity generation cost.
The GT-MHR cooperative program addresses both US and Russian requirementsincluding safety and regulatory requirements, performance and economic requirements, andoperational requirements. The requirements include top level design criteria and specificdesign codes and standards. This approach is being used to enhance the prospect that auranium fueled design can be readily deployed in markets throughout the world.
The GT-MHR conceptual design work is being directed by a joint steering committeecomposed of representatives from MINATOM, OKBM, KI, GA, and FRAMATOME. Thesteering committee provides oversight of project activities and establishes guidelines forconducting the work. It is responsible for establishing the overall direction and strategy ofthe program.
64

Unrestricted existing information on the US sponsored GT-MHR design has beenmade available to the program and this information is serving as a relatively mature startingpoint for the cooperative conceptual design effort. A major achievement to-date has beensignificantly improved power conversion component conceptual designs with majorcontributions from the OKBM designers, Figure 3. The current GT-MHR power conversionconfiguration now incorporates both US and Russian technology and is a cleardemonstration of the cooperative program advantages.
A goal of the current program is to evolve it into a broad based internationalcooperative program and efforts are underway to foster participation of other internationalindustrial organizations and/or governments. Several organizations in major nations withnuclear power capability have expressed interest in becoming involved with the program.Discussions are ongoing to determine appropriate terms and conditions under which theymight participate. A broad based international cooperative program reduces the up-frontfinancial burden on any one country and is considered by many international leaders to bethe best way available today to develop a modern nuclear power system for commercialdeployment in the world market.
Following completion of the conceptual design, scheduled for October 1997, thebroad based international cooperative program would be responsible for carrying out thedetailed design and development activities.
PLANNED GT-MHR DEVELOPMENT ACTIVITIES
The GT-MHR concept is based on taking advantage of existing technology to themaximum practical extent (e.g., the core is designed to use the same prismatic fuel provenin the Fort St. Vrain demonstration plant). No new technology has to be developed becausethe needed technologies have essentially been demonstrated elsewhere. The GT-MHRconcept does, however, incorporate new features for addressing new requirements whichrequire additional development. Principle among these features are passive decay heatremoval, plutonium fuel, and use of a closed Brayton cycle power conversion system. Thedevelopment activities planned for these new features are described here organized into thedevelopment tests for the reactor system and the development tests for the power conversionsystem.
GT-MHR Reactor System Development Tests
The development tests planned for the GT-MHR reactor system, Figure 4, includefuel tests, tests of the reactor cavity cooling system, and design verification tests of keyreactor sub-systems and components. These tests are briefly described in the following.
Fuel Tests are planned to qualify TRISO-coated phitonium particle fuel for GT-MHRperformance parameters and to provide data for validation of fuel performance modelsincluding fission gas release and plate-out. To supply fuel for these tests, current fuelmanufacturing equipment and procedures will be adapted for processing weapons-gradeplutonium into GT-MHR fuel.
Reactor Cavity Cooling System (RCCS) Tests are planned to provide design data and verifyintegrated performance. The tests include determining the effective conductivity of thegraphite core, buoyancy-induced fluid mixing in the enclosures along the core, andemissivities of metal surfaces including the RCCS panels, reactor vessel and metallic reactorinternals. Final verification of the RCCS design is planned by an integrated RCCS systemstest using a scale model of the reactor metallic internals and reactor vessel.
65

GENERATOR
PRECOOUR
FIG. 3. GT-MHR power conversion system incorporates US and RF technology
Design Verification Tests are planned to verify the design and performance of the of theprinciple reactor sub-systems and components which include the following:
The Reactor Internals and Hot DuctFuel Handling SystemNeutron Control SystemReactor Service EquipmentShutdown Cooling System
66

GT-MHR Power Conversion System Development Tests
The development tests planned for the Power Conversion System (PCS), Figure 5,include design verification tests of the key sub-systems and components and performancetesting of a full-scale integrated power conversion system using a fossil-fired heat source.These tests are briefly described in the following.
Design Verification Tests are planned to verify the design and performance of the of theprinciple PCS sub-systems and components which include the following:
Generator TestsTurbocompressor TestsMagnetic Bearing TestsSeals TestsRecuperator TestsPrecooler/Intercooler Tests
PCS Integrated Tests are planned using the first GT-MHR power conversion module and willbe performed in two phases using a fossil energy heat source:
Phase I, Steady State Simulation - This phase will be done in two steps: Step 1 willreproduce full helium temperatures distribution at part pressure, and Step 2 will befull helium pressures distribution at part temperature.
1/1S/B6
YEAR I 1996 I 1997 I 1996 I 1999 I 2000 I 2001 2002 2003 I 2004 I 2005 I
GT-MHR STANDARD PLANTENGINEERING DESIGN
REACTOfl SYSTEMTECHNOLOGY DEVELOPMENT
FUEL TESTS
FISSION PRODUCT TRANSPORT
REACTOR CORE TESTS
STRUCTURAL MATERIAL TESTS
SHUTDOWN COOUNG SYS
REACTOR CAV COOLING SYS
COMPONENT TESTS
INSTRUMENTATION & CONTROL
COMPLETECONCEPTUALDESIGN
V
COMPLETEPHELMNARYDESIGN
COMPLETEFINALDESIGN
COMPLETE COMPLETE TESTS COMPLETE COMTEST F6R PROTOTYPE FLEL COMFPLANS U3LOMATLS TESTS TEv v y ^
COMPL 'BEGWFtEL BEGIN FUEL COMPL FUEL COMPL PROOF
QUALIFICATION PROCESS PROOF QUALIFICATION ACCSIMUL TESTyTESTS TESTS y y PIE TEsrsy ypiE
COMPLETE COMPLETE COMPLETEOUT-OF-PILE IN-PILE INflEACTOfl LOOPyTESTS yTESTS yTESTS
COMPLETE1-H
yTESTS
COMPL REACTOR COMPLETE VESSEL,METALS I CEHAMCS HEATXCHNGR, IGRAPHTE
TESTS y yMATERML TESTS
COMPLETE COMPLQRC COMPLORCSHX TESTS 4SLSV COMPONENT PROTOTYPE
y yTEsts yTESTS
COMPLETE COMPL FCCSSEPARATE EFJRECTS INTEGRATED
yTESTS yTESTS fc|
COMPLREACTKW COMPLETE 'COMPLETEINTERNALS 4 HOT OUCT NCS TESTS FHS TESTS
yTESTS y V \
PLETEONENTTS OEUVER
•7 ^EOUIFVTTO
FHS&REACTORSERVICEEQUIP
SERVICE EOUP
COMPLETENSTRU 4 CONTROL
y TESTS
FIG. 4. GT-MHR reactor system summary development schedule

1/1*86
YEAR 1 1996 1997 1998 1999 2000 2001 2002 2003 2004 2005
GT-MHR STANDARD PLANTENGINEERING DESIGN
POWER CONVERSION SYS (PCS)TECHNOLOGY DEVELOPMENT
- GENERATOR TESTS
TURBOCOMPRESSOR TESTS
BEARING TESTS
SEAL TESTS
RECUPERATOR TESTS
PRE tINTERCOOLER TESTS
HANDLING EQUIPMENT TESTS
PCS INTEGRATED TESTFAdUTY AND COMPONENTS
COMPLETE COMPLETE COMPLETECONCEPTUAL PRELIMINARY FINALDESIGN DESIGN DESK3N
V V yCOMPLETE COMPLETE START PCS COMPLPCSPCS TEST COMPONENT INTEGRATED INTEGRATEDPLANS TESTS TEST TEST
V ^7 *\7 V V ?PEFFORMCOMPONENTTESTS (SEE BELOW) J
COMPLETEVTESTS
COMPLETE COMPLETE COMPLETEMATL TESTS FLOWO1ST flOTOR TESTS
f y TESTS y^
°CTiir» , |TESTS y 1
COMPLETE | COMPLETEe lCHSCALE ! FULL-SCALE
\7 TESTS y TESTS
COMPLETE COMPLETE COMPLETEFLOWOST MATLtSTRUC PERFORMANCE
COMPLETE COMPLETE COMPLETEHEAT TRANSFER M0RATION FRETTING
yTESTS yTESTS y » ISJ TESTS
COMPLHANOL p ----»•EOUPUT !
TESTSV
OROEHL6LEADMATLS
V^^^BCOMPONENISANOFACILrrY \
I
COMPLTEStFACANDPCS
7 ASSEMBLY
FIG. 5. GT-MHR power conversion system summary development schedule
Phase II, Key Transient Simulation - Two transients will be run for each plant dutycycle selected according to their severity in producing thermal and pressure loads onthe PCS components. One transient will stari from a steady state condition in whichthe helium temperatures distribution has been simulated at part pressure, and theother from a steady state condition in which the helium pressure distribution hasbeen simulated at part temperature.
COMMERCIALIZATION OF THE GT-MHR
In addition to design, development, and licensing activities, the overall program planfor development of the GT-MHR, Figure 6, includes the construction and operation of aprototype module. Performance testing of the prototype will demonstrate all of the GT-MHR systems and their operating characteristics in a fully prototypical plant.
The licensing activities will be pursued in parallel with the detail design anddevelopment activities and have the objective that the prototype plant satisfy US, RF, andother applicable international regulatory requirements. The intent is to address the licensingissues which will be directly applicable to follow-on commercial units.
Construction and operation of the prototype module, fueled with weapons plutonium,is the final preparatory step needed for commercialization. The design and developmentactivities, the licensing activities, and the construction and performance of the prototype
68

form the foundation for commercializing the technology. The manufacturing, construction,licensing, and operating experience obtained will provide a firm basis for the informationnecessary for establishing terms on the part of sellers for commercial offerings and forobtaining required financing on the part of buyers.
The participants in the international cooperative program for development of theGT-MHR will have direct access to the technology. Direct access to the technology willenable the participants, either individually or as partners, to become vendors of GT-MHRcommercial plants for the world electric generation market. There is a large marketprojected for new electric generation capacity in the next century and the projected cost andenvironmental benefits of the GT-MHR show it has high potential to be highly cost effectiveand capture a significant share of the world market.
Advanced discussions are now being held with additional potential participants. It isexpected that the participant membership will be finalized prior to the initiation of thedetail design and development activities planned after completion of the conceptual designin the fall of 1997.
YEAR I 1996 1997 1998 1999 2000 2001 2002 I 2003 I 2004 I 2005 I
GT-MHH STANDARD PLANTENGINEERING DESIGN
COMPLETECONCEPTUALDESIGN
V
COMPLETE
DESIGN
V
COMPLETEFINALDESIGN
REACTOR SYSTEMTECHNOLOGY DEVELOPMENT
POWER CONVERSION SYS (PCS)TECHNOLOGY DEVELOPMENT
PROTOTYPE PLANTSPECIFIC ENGINEERING
PROTOTYPE PLANTLICENSING
PROTOTYPE PLANTCONSTRUCTION
COMPLETETESTPLANSV
COMPLETE TESTSFOR PROTOTYPELG ID MAILS
V
COMPLETE COMPLETEFUEL COMPONENTTESTS TESTS DELIVERr? 0 0 EOUtPMTTO
COMPLETE COMPLETEPCS TEST COMPONENTPLANS TESTSV PERFORM COMPONENT TESTS V
SELECTSITE
V
ORDER LONG
STARTFHOTOTYPSENGNEERUJG
V
PREUMWAftrSAFETYREPORT
START PCS COMPLPCINTEGRATED MTEGRATI
TEST TEST^7 ^7 \
COMPLETEPHOTOTYPEENGINEERNG
FINALSAFETYREPORT
FIRST
SED
DELIVER7PCSTO
PROTOTVPE
OPERAUTH
^
LQ
V
BEGINLOAD OPERATIONSFUEL DEMONSTRATION
t V V
FIG. 6. GT-MHR international program summary schedule
69

CONCLUSIONS
The key conclusions regarding the GT-MHR background, international cooperativeprogram, development requirements, and commercialization considerations in this paper areas follows:
Substantial HTGR technology has been developed in support of the five HTGRplants that have been built and operated and in the programs carried out fordeveloping the technology for large central station power plants. The keycharacteristics of HTGR plants, which include coated particle fuel, graphitemoderator, and helium coolant, have been demonstrated.
Repercussions of the oil embargo in 1973 followed by the Three Mile Island accidentin 1979 combined to halt orders for large central station nuclear power plants in theUS due to the large financial liabilities, the public's fear of nuclear, and the lack ofneed for new base load capacity.
The MHTGR with a power rating of 350 MWt/135 MWe was conceived to meet theperceived need for smaller, simpler nuclear power plants with passive safetycharacteristics but was concluded to be non-competitive with equivalent sized coaland LWR plants. A larger MHTGR variant with a power rating of 450 MWt/175MWe was more competitive but was still not competitive with combined cycle plants.
To be competitive, the thermal efficiency of nuclear power has to be markedlyimproved to compete with modern high efficiency fossil plants. Technologicaldevelopments during the last decade on industrial gas turbines, magnetic bearingsand highly effective recuperators have made practical the coupling of a modularHTGR with a Brayton cycle power conversion system for the generation of electricitywith net thermal efficiencies approaching 50%. The GT-MHR is the product of thiscoupling.
Budget constraints and anti-nuclear sentiments have caused the US government todiscontinue financial support of the GT-MHR. Fortunately, the US governmentprovided for documenting the design and development status and eliminatingrestrictions on providing other countries access to the documentation.
GA and MINATOM have initiated a cooperative program for the development ofa conceptual design of the GT-MHR for weapons plutonium disposition with the longterm goal of utilizing the same design for commercial deployment using uranium fuel.FRAMATOME has subsequently joined the cooperative program.
The GT-MHR cooperative program has many technical, political, and economicadvantages including the benefits realized from reciprocal technology transfercovering a broad spectrum of scientific, engineering, materials and manufacturingknow-how. Design progress to-date clearly demonstrates the advantages of thereciprocal technology transfer.
A goal of the current program is to evolve it into a broad based internationalcooperative program and several international organizations have expressed interestin joining. A broad based international cooperative program is considered by manyinternational leaders to be the best way to develop a modern nuclear power systemfor commercial deployment.
70

No new technologies need to be developed for the GT-MHR. The GT-MHR conceptdoes, however, incorporate new features for addressing new requirements whichrequire additional development. Principle among these features are passive decayheat removal, plutonium fuel, and use of a Brayton cycle power conversion system.
Development tests required for the GT-MHR include fuel tests, tests of the reactorcavity cooling system, design verification tests of key systems and components andperformance testing of a full-scale integrated power conversion system using a fossil-fired heat source.
The GT-MHR deployment program includes construction and operation of aprototype module. Construction and operation of a prototype module is the final stepneeded for commercialization of the technology.
The participants in the GT-MHR international cooperative program will have directaccess to the technology which will enable them to become vendors of GT-MHRcommercial plants for the burgeoning world electric generation market.
NEXT PAGE(S)!•! t BLANK

YAQft4fifi72RECENT ACTIVITIES ON THE HTGR FOR ITS AASOHOO ^COMMERCIALIZATION IN THE 21st CENTURY
I. MINATSUKI, S. UCHIDA, S. NOMURA, S. YAMADAMitsubishi Heavy Industries Ltd,Tokyo,Japan
Abstract
Currently, the greatest concern about energy is the need to rapidly increasethe energy supply, while also conserving energy reserves and protecting theworldwide environment in the coming century. Furthermore, the direct use of thermalenergy from nuclear reactors is an effective way to widen the application of nuclearenergy. From this standpoint, Mitsubishi Heavy Industries (MHI) has been continuingthe various activities related to the High Temperature Gas Cooled Reactor (HTGR).At present, MHI is participating in the High Temperature Engineering Test Reactor(HTTR) project, which is under construction at Oarai promoted by the Japan AtomicEnergy Research Institute, as the primary fabricator. Moreover MHI has beenconducting research and development to investigate the feasibility of HTGRcommercialization in future.In this paper, the results of various studies are summarized to introduce our HTGRactivities.
First, a basic development scenario for the commercialization of the HTGR in 21stcentury was formulated. In this scenario, it was clarified the development oftechnologies for the reactor and for the application of nuclear heat can proceedindependently. This is apparently in contrast to the situation for other types ofreactor. The development scenario proposed here consists mainly of a three stageprocess leading to the commercialization of HTGR. In the first stage, an HTGR powerplant should be constructed to demonstrate the technologies and the economiccharacteristics of such a large-scale reactor. In the next stage, integration of theHTGR technologies and the nuclear heat utilization systems should be demonstratedby the construction of HTGRs which incorporate typical heat application systemssuch as a coal gasification system, an H2 production system and a gas turbine.
73

In the final stage before commercialization, several types of commercial HTGR plant
wil l be constructed and operated. Typically these plants will be modular, high
performance facilities, with primary energy resource production from H2, methanol,
coal gas, and a combination of various systems.
The following were selected as the main criteria for reviewing the feasibility of
the HTGR development scenario described above.
1) A design study of the HTGR plant concept and an investigation of its economic
characteristics.
The conceptual design studies of HTGR rated power from SOMWe to 600WWe have been
conducted. From the results of these studies, the following points have been
clarified.
® The construction of a modular type HTGR is feasible using technologies provenin the operation of HTTR.
(2) A large-sized HTGR, such as a GOOMWe plant, is feasible through theapplication of new technologies under development.
(3) The economic characteristics were investigated. A large sized HTGR has theadvantage of the cost improvement, and is expected to be competitive with theLWR.
2) A development study of the various nuclear heat application systems and theinvestigation of their main characteristics.The concept of cogeneration systems using a gas turbine, a methanol productionsystem and a coal gasification system have been developed and evaluated, from both atechnical and economic perspective. The important results are following.(T) The key technologies that enable a He gas turbine to achieve high efficiency
have been studied and an optimized system configuration has been proposed.(D It was recognized that a system combining He gas and a steam turbine was quite
promising for an advanced power plant.(D A conceptually new coal gasification system has been proposed and developed.
This system was combined with steam gasification and a partial oxidationprocess, which is expected to improve the coal conversion ratio.
74
(4) The concept of a methanol production plant consisting of coal gasification andSOSE (Solid Oxide Steam Electrolysis) has been developed, and compared withother methanol production systems consisting of steam gasification and steam
V
reforming. As a result, it was clarified that the both systems are promisingfrom the technical and economic view points .
(D A conceptual design study of a new electric storage plant integrated with theHTGR, the coal gasification plant, the SOSE, the methanol production plant,and the methanol power plant has been conducted. As a result, the feasibilityand cost advantage versus a pumped storage system were investigated.
1. IntroductionCurrently, the greatest concern about energy is the need to rapidly increase
the energy supply, while also conserving energy reserves and protecting theworldwide environment in the coming century. Furthermore, the direct use of thermalenergy from nuclear reactors is an effective way to widen the application of nuclearenergy.We believe the HTGR is most promising candidate to meet these various needs becauseof its diverse application of nuclear energy with high temperature output. From thisstandpoint, Ml has been conducting the various activities related to HTGRs.In particular, NHI is currently participating as primary fabricator in the HTTRproject under construction at Oarai by the Japan Atomic Energy Research Institute.Moreover MHI has been conducting research and development to investigate thefeasibility of HTGR commercialization in future.In this paper, the results of various studies are summarized to introduce our HTGRactivities .
2. A Scenario for HTGR Commercialization2.1 The role of the HTGRBased on the prospectus for energy conditions in 21st century, the followingexpectations of relevance to the HTGR were derived.
75
(1) Wider use of the nuclear energy making up for the shortage of fossil fuels(2) Wider application of coal energy instead of natural gas and petroleum energy(3) Higher safety potential for nuclear plantsThe HTGR can supply higher temperature energy than other nuclear power systems. By
fexploiting this characteristic, the HTGR can play a key role in the production ofhydrogen energy, which is expected as final destination of the search for a cleannew energy source; this could be accomplished through technology for reforming coalin combination nuclear energy of the HTGR. Therefore, we recognized that the HTGRshould be positioned as a mainstay of future energy supply systems.2.2 The Purpose of HTGR DevelopmentThe HTGR that will emerge in the next century should have the following distinctfeatures.(1) It should use nuclear resources effectively in consideration of a Pu recycling
plan.(2) It should be able to produce a huge amount of hydrogen, with a view to meeting
needs for into the future.For this purpose, the HTGR should be developed with the goals of a higher outputtemperature and a larger sized plant.
(3) It should have cost competitiveness with other types of power supply plant.Therefore, the cost reduction effort must always be considered in eachdevelopment stage of the HTGR.
(4) It should be equipped with innovative technologies that will meet the diverserequirements of 21st century.
2.3 The HTGR Commercialization Scenario proposed by MHI.The final target of HTGR development is focused on two systems: a hydrogenproduction HTGR and a coal gasification HTGR.(1) Development Approach
At present, an HTTR is under construction and we expect to apply most of thebasic technologies of the HTTR to the HTGR plant of next stage.
We believe operation of the reactor system in a demonstration plant will benecessary before construction of commercial HTGRs. This scenario differs from theapproach of FBR commercialization, in which a prototype reactor should beconstructed.
76

StepTarget
I (-2020)Establishment of the ReactorConcept of the HTGR
H (—2050)Demonstration of the NuclearHeat Application Systems byCoupling with the HTGRs
1 (2050—)Commercialization ofthe HTGR
HTGR plantConstruction Schedule
Research &Development Scheduleof HTGRTechnologies
Technologies for Nuclear Heat ApplicationSystems
Proposed Development Scenario for the HTGR
Generally, HTGR outlet power is limited by many restrictions, and therefore largescale explanation of technologies should not be necessary, as it is with the FBR.Fig-1 Shows the proposed approach for HTGR commercialization.This scenario consists of three stages. In the first stage, we should demonstratethe technologies of the reactor system in which a large sized core and highperformance fuels will be designed. The basic design concept of the demonstratedreactor system should be close to that of the commercial reactor system. Therefore,in the commercial stage, this design concept should prove to be cost competitivewith FBRs and LWRs . With this background we propose that the HTGR demonstrationplant should be an electric power plant using a conventional steam turbine systemfor the following reasons.Since many of the technologies have been developed in the HTTR, the constructiontime should not be lengthy.The total investment for the demonstration HTGR should be minimized and recoverableas soon as possible. It is presently expected that funding for the construction
77
will be supported by the nuclear power utilities, therefore, the economics of theconstruction cost will be considered to be the most important issue.We will improve the performance of the plant by coupling it with a gas turbinesystem in the next stage.In the second stage, several HTGR plants will be constructed to demonstrate thefeasibility of various nuclear heat application systems, which will be developedindependently. The typical nuclear heat application systems that should bedemonstrated in this stage are a hydrogen production system using SOSE (Solid OxideSteam Electrolysis) and a coal gasification system.In the third stage, the several types of commercial HTGR will be constructed,coupled with an optimized heat application system whose basic concepts will havebeen demonstrated in the previous stages. The candidates for the commercial HTGR area coal gasification HTGR and a gas turbine electric supply HTGR. H2 production willbe a key issue having a potential to change an energy utilizing condition in humansociety from a fossil fuel to a fo fuel in far future. The use of a coal energy willwiden because of a shortage of other fossil fuel like a petroleum and a LNG.However the coal fire releases a huge number of C02, the gasification technologywill expected to convert a clean energy. The gas turbine electric supply by HTGR isalso an essential technology due to it's safety characteristics, high efficiencyand economics.
3. HTGR plant conceptual design studyIn the HTGR development scenario, MHI proposes that an HTGR electric power supplyplant will be most advantageous kind of plant to demonstrate HTGR. One of thegreatest concerns about an HTGR plant is its economic characteristics; inparticular, the busbar cost should be competitive with that of the LWR. From aneconomic perspective, it is known that a large sized plant is advantageous. Toinvestigate the potential improvement of HTGR economics, a feasibility study wasconducted for an HTGR of twice the power module of earlier systems.To investigate the economic characteristics, a preliminary design for a very smallsized HTGR was also studied.
78

3.1 Large sized HTGR plant design study. [1](1) Reactor design
To determine the maximum reactor power that, given the limits of the decay heatremoval system, would result in acceptable fuel temperatures under accidentconditions, we studied the feasibility of a core with the following designconditions.1) Reactor vessel outer diameter is about 9.0 meter (maximum).2) ZrC used as the coated fuel material with superior capacity for holding
fission products.3) Peak fuel temperatures during accidents limited to below 1800°C-4) The control rod material uses a C/C composite.Fig-2 shows a cross section of reactor pressure vessel, and Fig-3 shows a crosssection of the core.Table. I shows the main specifications of the large sized HTGR plant.
(2) Plant designTo improve the economic performance, we studied the feasibility of a planthaving the following design conditions.1) Coolant outlet temperature of 850°c (maximum) to permit adoption of a gas
turbine cycle in the future2) A single cooling system per reactor3) Steam generator and reheater co-located within the same vessel and arranged
side-by-side. This means that this vessel is connected to the reactor vesselby a cross duct.
4) Steam turbine cycle for the generation of electric power.Fig-4 shows a flow diagram of this plant.
3.2 Features of a small sized HTGR plantClearly, a small sized HTGR plant has an economic disadvantage; however, it has thefollowing potential advantages as well.
• Further inherent safety characteristics• Long term burning• Eeay transportation with total plant system• Reduced total investment
79

Control rod drive mechanism
Cross duct nozzle
Fig.2. Reactor Pressure Vessel Fig. 3. Core Cross Section
Table. I. Specification of Large-sized HTGR1. Reactor
Thermal powerReactor vessel ODActive core configurationEffective active core diameterEffective active core heightAverage power density
2. Primary cooling systemCoolant outlet/inlet temperatureCoolant inlet pressureCoolant flow rate
3. FuelTypeU enrichmentAverage fuel bumup
4. Steam generatorHeat-transfer pipeOutside tube fluid
(inlet/outlet temp.)Inside tube fluid
(inlet/outlet temp.)Exchange calory
5. ReheaterHeat-transfer pipeOutside tube fluid
(inlet/outlet temp.)Inside tube fluid
(inlet/outlet temp.)Exchange calory
6. Steam TurbineTypePowerSteam condition
1150 MWt9.05mAnnular3.62m/6.17m9.52m6.3 MW/m3
850°C / 490°C72ata2214ton/h
UCO19.8%131000MWD/MTU
Helical coil type low-fin tubePrimary helium gas
(795°C / 490°C)Pressurized water (superheat steam)
(281°C/538<>C)975 MWt
Helical coil type low-fin tubePrimary helium gas
(850°C / 795°C)Superheat steam
(338°C / 538°C)175 MWt
Reheat extraction condensatre turbine536.6 MWe170 ata, 538°C / 40.6 ata, 538°C
80

7ii«i i70*a *>«•" POWER OUTPUT : 503MWSB50-C 538-C /' 5381C
STEAMREACTOR GENERATOR
1150MW1 REHEATER
72ata 194MWV490-C /~\
—— v .) ——HELIUM GASCIRCULATOR
F-ig.4.
700'C r
f («.. ! • EFFICIENCY : 43.7%
^J£ i~r /u?)366Mwt
• /^~^^»«..Y ' (^X-COND6NSER
1 ———— H "*1 —— —— 1 r~ —— !~l ' (T} CONDENSATE, -' 14MW< '- .- I V^ PUMPi-?..... ..:....£}.. ..........:... .1..:
FEEDWATER FEED ngACRATOR PE6DWATERHEATER PUMP HEATER
Flou) Diagram of the Large Sized HTGR
133t/h170 at
233t/h 620'C1 1 160 at i ——— 1 ——— |
HTGR
125MVft
ySteam ^ ,— N
—— (G) SOMWeGenerator L ^^ /
K400-C • ——— | ——— —— | —— | —— | -
210T
Flau Diagram of the Snail Sized HTGR
Therefore, this type of HTGR is expected to have large marketability in the Asian
area. [6] We sketched a plant concept to investigate its economics. Fig-5 shows a
flow diagram.
3.3 Comparison of economic characteristics
We estimated the unit power cost for three HTGR plants having different outlet
powers. Table, n shows the results of the relative cost comparison of these plants.
These results indicate that the large-sized HTGR plant has an attractive cost
potential and is cost competitive with LWRs: and that the small-sized HTGR plant is
expensive, but its cost is only 15% higher than that of the Modular HTGR (200MWe).
Table, n. Cost Comparison
(MWe)|MWI|
Total Caolal Cost
Unit Cost
Busbar Cost
Small SizM HTGR
SO MWt125 MWt
30
130
116
ModukxHTGR
200 MWa500 MWl
100
100
100
U/g« Sizxl HTGR
500 MWe1150 MWt
210
90
91
81
4. Conceptual design study of nuclear plant application systemsIn the commercialization scenario described in a Chapter 1, it is recognized thathydrogen is expected to be the ultimate energy source for human society. We have todevelop the diverse technologies required to meet needs in far future, especiallythrough the application of nuclear heat from the HTGR. This chapter summarizes theresults of studies on the technologies of the gas turbine, coal gasification andmethanol production as such application systems.The goals of these studies were as follows.(1) Investigation of the characteristics of the basic system(2) Improvement of the particular characteristics of the HTGR(3) Optimization of the nuclear heat application system(4) Creation of an innovative concept for this system
4.1 Study of the HTGR power plant [2]As the electric power system, we considered three different methods of generation:a gas turbine, a steam turbine and a combined system.In this study, we surveyed plant efficiency and the principal design parametersbased on the following conditions.Reactor power: 450MWtOutlet temperature: 850 °cFor the steam turbine system, the maximum plant efficiency was about 42%.For the gas turbine system, we obtained a maximum plant efficiency of 44% under thedesign parameters listed in Table!. Fig-6 shows how the plant efficiencies changein relation to the pressure ratio between inlet pressure into turbine and outletpressure from turbine. The combined cycle power plant was expected to produce themaximum efficiency among three systems. In this study, we optimized the powerdistribution between gas turbine and steam turbine, and studied the maximum plantefficiency of about 46%. Fig-7 shows the flow diagram of this combined cycle powerplant.
82
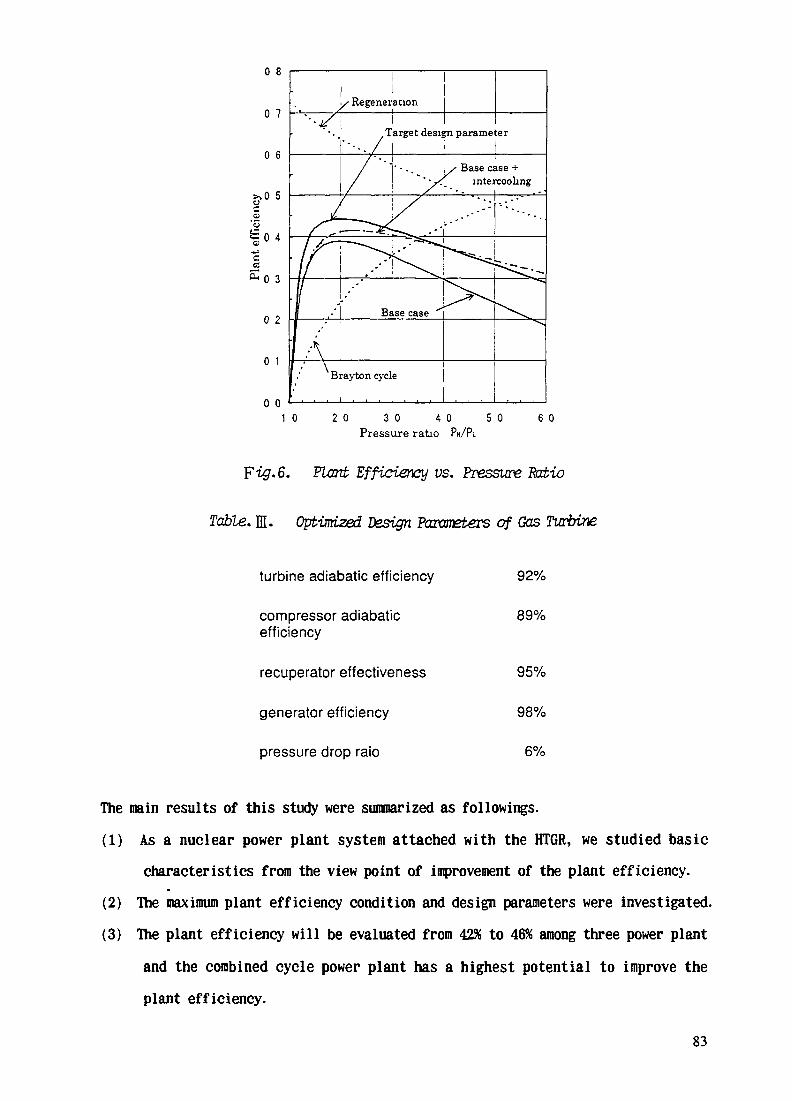
1 0 2 0 3 0 4 0 5 0 6 0Pressure ratio PM/PL
pig. 6. Plcati Efficiency vs. Pressure Patio
Table. 1. Optimized Design Paramzbers of Gas Turbine
turbine adiabatic efficiency
compressor adiabaticefficiency
recuperator effectiveness
generator efficiency
pressure drop raio
92%
89%
95%
98%
6%
The main results of this study were summarized as followings.(1) As a nuclear power plant system attached with the HIGH, we studied basic
characteristics from the view point of improvement of the plant efficiency.(2) The maximum plant efficiency condition and design parameters were investigated.(3) The plant efficiency will be evaluated from 42% to 46% among three power plant
and the combined cycle power plant has a highest potential to improve theplant efficiency.
83
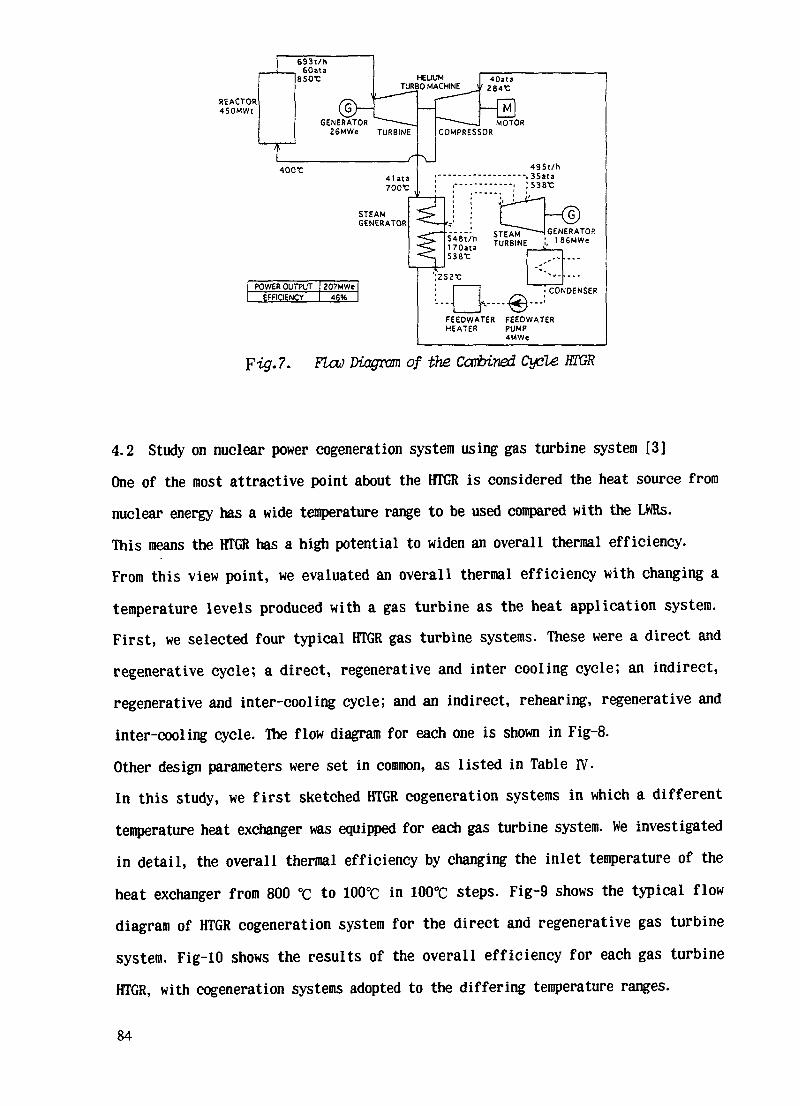
REACTOR450MWt
693t/hSOata
asor HEUUMTURBO MACHINE
GENERATOR ^~~-~—.26MWe TURBINE
41 at a700t
STEAMGENERATOR
40ata^ 284t:
COMPRESSOR
[MjMOTOR
POWER OUTPUTEFFICIENCY
207MWe46%
495t/h-, SSata15381:
STEAM~~—I GENERATOR
. CONDENSER
FEEDWATER FEEDWATERHEATER PUMP
4MWe
Pig. 7. Flau Diagram of the Combined Cycle HTGR
4.2 Study on nuclear power cogeneration system using gas turbine system [3]One of the most attractive point about the HTGR is considered the heat source fromnuclear energy has a wide temperature range to be used compared with the LWRs.This means the HTGR has a high potential to widen an overall thermal efficiency.From this view point, we evaluated an overall thermal efficiency with changing atemperature levels produced with a gas turbine as the heat application system.First, we selected four typical HTGR gas turbine systems. These were a direct andregenerative cycle; a direct, regenerative and inter cooling cycle; an indirect,regenerative and inter-cooling cycle; and an indirect, rehearing, regenerative andinter-cooling cycle. The flow diagram for each one is shown in Fig-8.Other design parameters were set in common, as listed in Table IV.In this study, we first sketched HTGR cogeneration systems in which a differenttemperature heat exchanger was equipped for each gas turbine system. We investigatedin detail, the overall thermal efficiency by changing the inlet temperature of theheat exchanger from 800 °C to 100°C in 100°C steps. Fig-9 shows the typical flowdiagram of HTGR cogeneration system for the direct and regenerative gas turbinesystem. Fig-10 shows the results of the overall efficiency for each gas turbineHTGR, with cogeneration systems adopted to the differing temperature ranges.
84

____Direct eye I e••C Regenerat ive cyc le :
106t/h
Cycle efficiency 40.7X ( Pressure ratio 2.38 )
____I n d i r ec t c y c l e __•< Regenerative and intercooling cycle
922Wi
BUT
Cycle efficiency 41.55! [ Pressure ratio 2.89 )< Regenerative and interceding cycle
69t*f w | | w | 1C
•< Regenerati ve reheating and intercool ing cycle >
36-C
»Ht
Cycle efficiency 45.2X ( Pressure ratio 2.77 ) Cycle efficiency 44.41 ( Pressure ratio 3.78 )
g. 8. Heat and Mass Balance Flea of 4 Types Cogeneratian System
HTGR450MW
Inter coolerHeat exchanger
for heat application
Turbine j, j, CompressorRecuperator [
HTGR450MW
inter cooler
Pre cooler Pre cooler
1^-1 Heat exchanger' ' for heat application
Base: Temperature range from 50°C to 10CTC
Recuperator
(2) Temperature range from 400°C to 700°C
Heat exchangerfor heat application , , ,
HTGR450MW
Inter cooler
Turbine II Compressor \~pr-Recuperator),/
Pre cooler
HTGR450MW
Turbine Inter cooler
Pre cooler
Heat exchanger' ' for heat application
(1) Temperature range from 700°C to 800°C (3) Temperature range from 100°C to 400°C
ig. 9. HTGR Cogeneration System
85
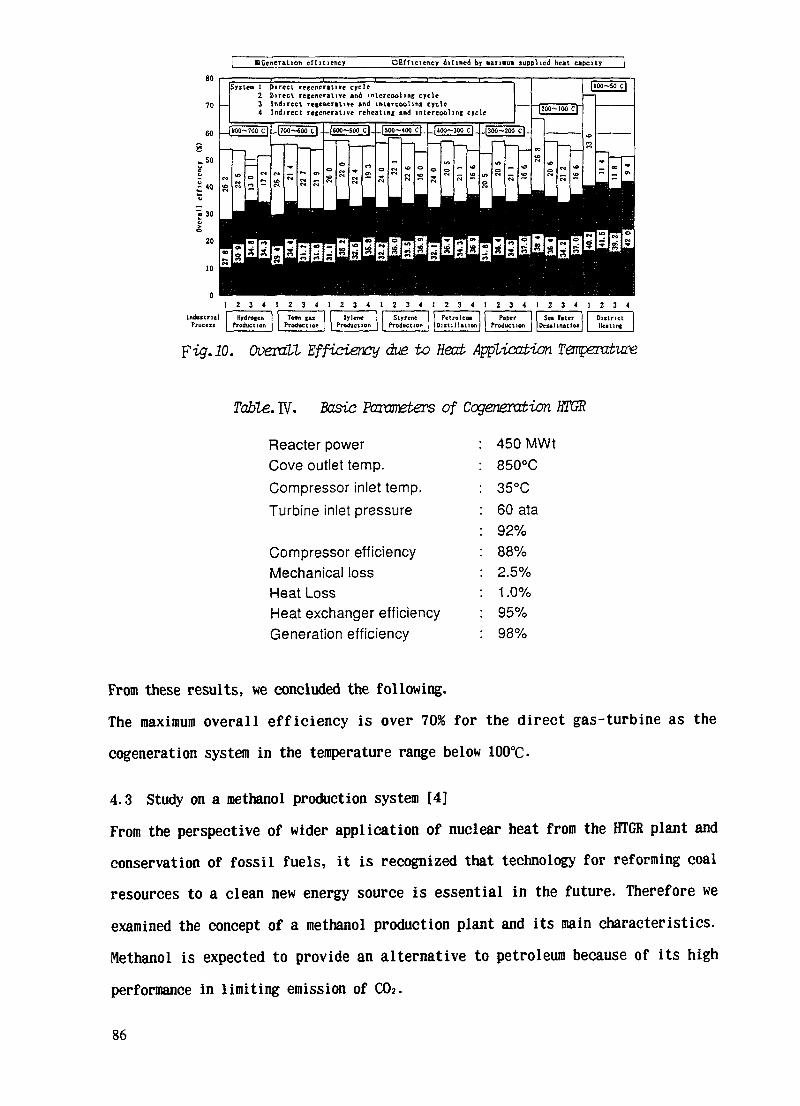
HCeneralion efficiency DEfficiency difined by •anatra supplied heat capcity
70
Systen I Direct regenerative cycle2 Direct regenerative and interceding cycle
— 3 Indirect regenerative and interceding cycle4 Indirect regenerative reheating and interceding cycle
- 40
i 30
1 2 3 4 1 2 3 4 1 2 3 4 1 2 3 4 1 2 3 4 1 2 3 4 1 2 3 4 1 2 3 4Industrial Hrdrofen Town fas Xylene Stvren* Pctroleua Paper I Set liter District
Process Production Production Production Production Distillation Production I Desalination licit me
pig. 10. Overall Efficiency due to Heat. Application Temperature
Table. Basic Paraneters of Cogenerakion HTGR
Reacter powerCove outlet temp.Compressor inlet temp.Turbine inlet pressure
Compressor efficiencyMechanical lossHeat LossHeat exchanger efficiencyGeneration efficiency
450 MWt850°C35°C60 ata92%88%2.5%1.0%95%98%
From these results, we concluded the following.The maximum overall efficiency is over 70% for the direct gas-turbine as thecogeneration system in the temperature range below 100°C-
4.3 Study on a methanol production system [4]From the perspective of wider application of nuclear heat from the HTGR plant andconservation of fossil fuels, it is recognized that technology for reforming coalresources to a clean new energy source is essential in the future. Therefore weexamined the concept of a methanol production plant and its main characteristics.Methanol is expected to provide an alternative to petroleum because of its highperformance in limiting emission of C02.
86

sa-c
SG At
SH
o>so Gas
Sepmlor
Purgt Gas Burr.tr
. 11. Flow Diagram of Methanol Production System
Table. V. Evaluation of Design Characteristics
^ - _Econoaical aspect(Methanol cost)
Env i rorwenta 1 aspect(CO, (Mission rate)
Utilization factor of energy(Hethanol conversion ratio)
(Utilization factor of nuclear heat)(Utilization factor of source carbon)(Utilization factor of total enerfy)(Utilization factor of waste heat)
Operation f lexibi 1 ity
Relative difficulty of development
Waste heat utilization
System (1)Partial oxidation
+SOSEA
«4 3/kf in 2025A
1 37kc C0,/k( MethanolB
135%17%95%4!%4%A
this systen can supplyelectricity by install melarte hydrocen tank
BUnder the development bypi lot plant
BThis systeei can be coupledto another process
Syste* (2)Steam tasif ication+Steam reforninc
B¥60 8/kt in 2025
B1 42k[ CO./ki Vethanol
B115%2S%92%67516%C
Capacity of electricityproduction is smal 1
CDevelopment of f luidized-bedreactor for stean eas if teat ionof coal is difficult
BThis system can be coupledto another process
A : Excel lent B : Good C : Not recommend
87
In this study, two promising methanol production systems were proposed and theirfeatures compared. First, we reviewed the methodology of coal gasification andhydrogen production and compared several candidates. Fig-11 shows the flow diagramof above two systems in combination with the HTGR. One candidate is composed of aCH* reformer and the steam gasification of coal and the other is composed of anSOSE and partial oxidation coal gasification. Table. V shows the results ofcomparing the two systems from several points view. We also investigated methanolproduction systems, their characteristics and the technical solution they required.
4.4 A new electric energy storage plant using an HTGR as the heat source formethanol production [5]
This total plant concept consists of an HTGR, chemical reactors and power systems.Fig-12 shows its schematic flow diagram. The HTGR supplies high temperature heat tothe SOSE, where hydrogen is produced from the steam and electric power at night.Hydrogen and coal introduced from a coal gasification system are combined in achemical reactor to produce methanol. After the electric power is converted tomethanol, the methanol is used as the fuel for the power plant. This can contributeto supplying additional electric power for to the peak load during the day.The items studied are as follows.1) Plant systems and component design2) HTGR-SOSE operability, including procedures for switching between day and night
operation3) Plant layout of the systems and main components4) Product cost evaluationThe results of this conceptual design study are as follows.1} The total plant system was designed with the capacities listed below.
HTGR plant rating: 450MWtMethanol production plant: 393tons/hMethanol storage capacity: 83500 nfMethanol-fired power plants: 2650MWt
88

--->(797MWeVl_^
(46%) Generated Output
12. HTGE SOSE El&etric Energy Storage System
Pumped StorageSystem
New ElectricalStorage System
0 20 40{0 /kwh)
Yig.13. Comparison of Products Cost
2) HTGR plant operation was determined as follows.Nighttime HTGR plant operation: 10 hours for H2 productionDaytime HTGR plant operation: 9 hours for electric generation
3) The results of cost evaluation estimates that the cost of electric regenerationis approximately 20% less than that of a pumped storage system. It even has acost advantage in hydrogen production at present marker prices due to its higherpurity. Fig-12 shows a comparison of regeneration cost estimation for theregeneration system in this study and a pumped storage system.
89

In conclusion, a new type of electricity storage system that adapts HTGR wasdeveloped, and its feasibility and cost advantages were clarified.
5. ConclusionIn this paper, we introduced part of the results of our studies on the HTGR, whichhave been conducted jointly with the Japan Atomic Energy Institute, Tokyo ElectricCompany Ltd., and General Atomic.We are now studying HTGR development with a long-term view toward itscommercialization. The greatest concern we are now facing is establishing aframework for the development plan of a post HTTR as a Japanese national project. Wemust make our best efforts to realize such a plan because we believe HTGR is one ofthe most promising ways to solve the energy problem while protecting the worldwideenvironment.
REFERENCES
[1] Minatsuki, I., et al., Feasibility Study on The Economical Improvement of ALarge-Sized HTGR Plant, The 4th JSME/ASME Joint International Conference on
•Nuclear Engineering Proceedings, New Orleans (1996)
[2] Noutomi, Y., et al., Study of High Temperature Gas-Cooled Reactor Power Plant,The 73rd JSME Symposium Proceedings, Fukuoka, pp.170-180 (1995)
[3] Yamada, S., et al., Nuclear Power Cogeneration System Using Gas Turbine Process,The 5th JSME Power Energy Technology Symposium Proceedings (1996)
[4] Yamada, S., et al., Methanol Production System Using Coal and Nuclear Heat, theAtomic Energy Society of Japan, Annual Meeting Proceedings H39 (1995)
[5] Minatsuki, I., et al., Conceptual Design Study on A New Electric Energy StoragePlant in which HTGR is Used as Heat Source for Methanol Production, The 4thJSME/ASME Joint International Conference on Nuclear Engineering Proceedings, NewOrleans (1996)
[6] Bechtel-MHI Joint Study Report (unpublished)
90

GAS COOLED REACTOR SAFETY AND MANAGEMENT
NEXTPAGE(S)left BLANK
HTR-10 SEVERE ACCIDENT MANAGEMENT XA9846673
YUANHUIXU, YULIANG SUNInstitute of Nuclear Energy Technology,Beijing, China
Abstract
The High Temperature Gas-cooled Reactor (HTR-10) is under construction at the Instituteof Nuclear Energy Technology site northwest of Beijing. This 10 MW thermal plantutilizes a pebble bed high temperature gas cooled reactor for a large range of applicationssuch as electricity generation, steam and district heat generation, gas turbine and steamturbine combined cycle and process heat for methane reforming. The HTR-10 is the firsthigh temperature gas cooled reactor to be licensed in China. This paper describes thesafety characteristics and design criteria for the HTR-10 as well as the accidentmanagement and analysis required for the licensing process.
1. INTRODUCTION
The 10MW High Temperature Gas-cooled Reactor (termed HTR-10) is apebble bed type high temperature gas-cooled reactor with 10MW thermalpower output for a wide range of possible application for e.g. electricity, steamand district heat generation, gas turbine and steam turbine combined cycle aswell as process heat generation for methane reforming. It is located on the siteof Institute of Nuclear Energy Technology of Tsinghua University (INET) in thenorthwest suburb of Beijing, about 40km away from the city. On the area ofINET, there already exist a swimming pool experimental reactor and a 5MWnuclear heating reactor. The HTR-10 is under construction and it is expected toreach critical in 1999.
The main basic design features of the HTR-10 are derived from the HTR-Module, Germany. Due to the relatively small size and corresponding smallpower output of the HTR-10 it has own design features from safety point ofview. In summarize it is much safer than the HTR-Module and therefore theauxiliary systems are more simple.
In this paper the HTR-10 safety design criteria and safety characteristicswere presented. The accident analysis were described and accidentmanagement as well as corresponding measures were introduced.
2. SAFETY DESIGN CRITERIA
The following safety design criteria for the HTR-10 were set up, taking intoaccount the inherent safety characteristics of a HTR-Modular and designrequirements as an experimental reactor.
• The reactivity temperature coefficient shall be negative at any operationcondition.
93
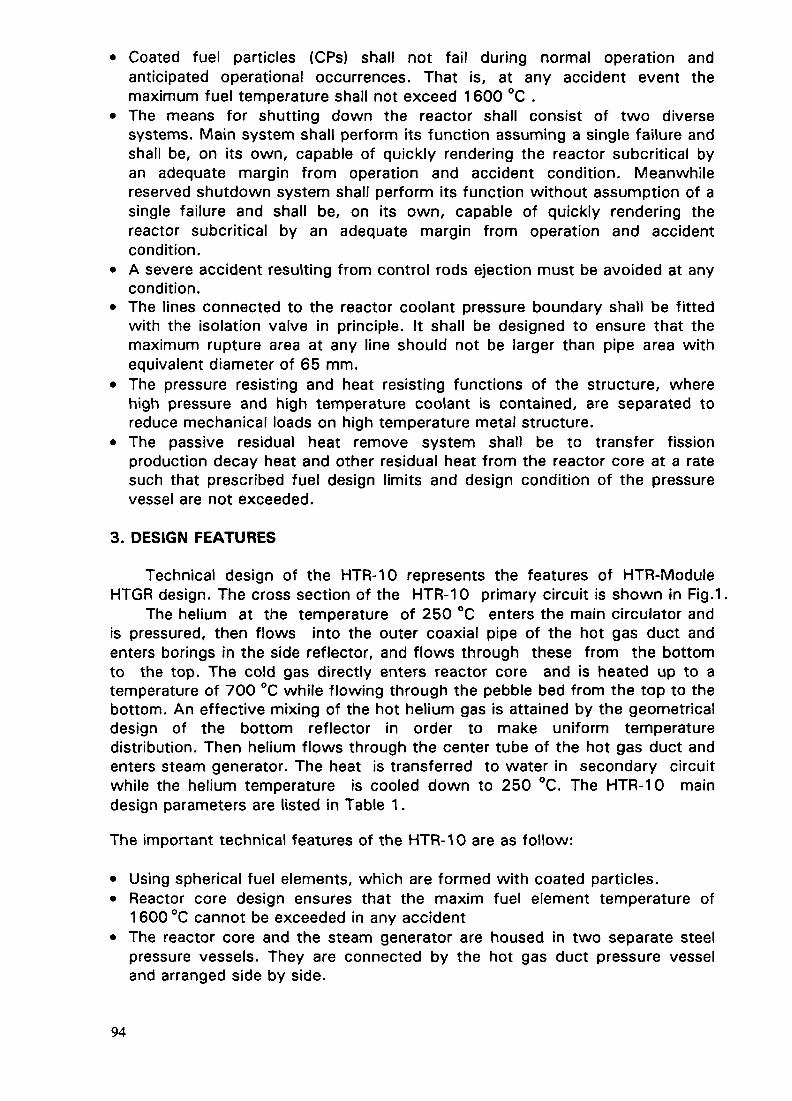
• Coated fuel particles (CPs) shall not fail during normal operation andanticipated operational occurrences. That is, at any accident event themaximum fuel temperature shall not exceed 1600 °C .
• The means for shutting down the reactor shall consist of two diversesystems. Main system shall perform its function assuming a single failure andshall be, on its own, capable of quickly rendering the reactor subcritical byan adequate margin from operation and accident condition. Meanwhilereserved shutdown system shall perform its function without assumption of asingle failure and shall be, on its own, capable of quickly rendering thereactor subcritical by an adequate margin from operation and accidentcondition.
• A severe accident resulting from control rods ejection must be avoided at anycondition.
• The lines connected to the reactor coolant pressure boundary shall be fittedwith the isolation valve in principle. It shall be designed to ensure that themaximum rupture area at any line should not be larger than pipe area withequivalent diameter of 65 mm.
• The pressure resisting and heat resisting functions of the structure, wherehigh pressure and high temperature coolant is contained, are separated toreduce mechanical loads on high temperature metal structure.
• The passive residual heat remove system shall be to transfer fissionproduction decay heat and other residual heat from the reactor core at a ratesuch that prescribed fuel design limits and design condition of the pressurevessel are not exceeded.
3. DESIGN FEATURES
Technical design of the HTR-10 represents the features of HTR-ModuleHTGR design. The cross section of the HTR-10 primary circuit is shown in Fig.1
The helium at the temperature of 250 °C enters the main circulator andis pressured, then flows into the outer coaxial pipe of the hot gas duct andenters borings in the side reflector, and flows through these from the bottomto the top. The cold gas directly enters reactor core and is heated up to atemperature of 700 °C while flowing through the pebble bed from the top to thebottom. An effective mixing of the hot helium gas is attained by the geometricaldesign of the bottom reflector in order to make uniform temperaturedistribution. Then helium flows through the center tube of the hot gas duct andenters steam generator. The heat is transferred to water in secondary circuitwhile the helium temperature is cooled down to 250 °C. The HTR-10 maindesign parameters are listed in Table 1.
The important technical features of the HTR-10 are as follow:
• Using spherical fuel elements, which are formed with coated particles.• Reactor core design ensures that the maxim fuel element temperature of
1600°C cannot be exceeded in any accident• The reactor core and the steam generator are housed in two separate steel
pressure vessels. They are connected by the hot gas duct pressure vesseland arranged side by side.
94

FIG 1. The Cross Section of the HTR-10 Primary Circuit
Table 1 HTR-10 Main Design Parameters
Reactor thermal powerActive core volumeAverage power densityPrimary helium pressureHelium inlet temperatureHelium outlet temperatureHelium mass flow rate
MWm3
MW/m3
MPa°C°Ckg/s
FuelU-235 enrichment of fresh fuel elements %Diameter of spherical fuel elements mmNumber of spherical fuel elementsRefueling mode
Average discharge burnup MWd/t
10523
250 / 300700 / 9004.3 / 3.2
U021760
27,000multi-pass,
continuously80,000
95

Active core cooling system is not required for residual heat removal in caseof accident. Residual heat can be dissipated by means of passive heattransfer mechanism to surrounding atmosphere.The reactor core is entirely constructed by graphite materials, no metalliccomponent are used in the region of the core.The two reactor shut down systems, i.e. the ten control rods and sevensmall absorber ball systems, are all positioned in the side reflector. They candrop into borings by means of gravity. In-core control rods are not needed.Spherical fuel elements go through the reactor core in a "multi-pass" pattern.Thus all fuel elements attain a relatively uniform burn-up distribution in thecore. Fuel pebbles are continuously discharged via a pneumatic pulse single-exit gate (or better called "reducer") which is placed inside the reactorpressure vesselThe integrated steam generator and intermediate heat exchanger (IHX) aredesigned. The steam generator is once through, modular small helical tubetype. The helium circulator is installed in the steam generator pressure vesseland positioned above the steam generator and the IHX.A ventilated primary cavity is designed as a confinement to restrict theradioactivity release into the environment, it has not the function of gas-tightand pressure-retaining containment.The digital reactor protection system is used in the HTR-10.Use of domestic standard turbine-generator unit in secondary circuit toprovide electrical power.
4. SAFETY CONSIDERATION
The basic safety features of the HTR-10 include the multi-barriers againstrelease of radioactivity and the reactor inherent safety.
4.1. Multi-barriers against release of radioactivity
• Integrity of fuel particle coatingsThe HTR-10 uses spherical fuel elements which are formed from many smallTRISO-coated fuel particles. The fuel particles are coated with two high -density layers of pyrocarbon and one layer of silicon carbide. The siliconcarbide layer is very dense so that no significant quantities of radioactivegaseous or metallic fission products can be released from intact fuel particleseven if their temperature is up to 1600 °C, but the maximum fuel temperatureis far below 1600°C under all normal operating and accident conditions.
• Integrity of the primary gas envelopeThe primary gas pressure envelope is the second barrier to the release ofradioactive substances. The primary gas envelope of the HTR-10 iscomposed of reactor pressure vessel, steam generator pressure vessel andhot gas duct pressure vessel. These pressure vessels will be cooled by coldhelium flow and kept in low operating temperature. The components of thepressure vessel unit are designed in such a way that the possibility ofthrough-wall cracks can be ruled out.
96

• Confinement function of primary cavity:The reactor pressure vessel, the steam generator pressure vessel and the hotgas duct pressure vessel are positioned inside primary cavity. When thepostulated event of unisolatable piping break happens, the radioactivitysubstances in the primary coolant and portion of the activity deposited onthe surface of the primary system are released into the primary closed cavity.Afterwards, primary gas which carries radioactivity will be exhausted into theenvironment pass-through the vent stack. Under normal operating condition,the sub-atmospheric pressure of primary cavity can prevent leakage ofradioactive gas into the reactor building.
4.2. Passive removal of reactor residual heatResidual heat after reactor shutdown can be removed from the core tosurrounding graphite structures and components and up to residual heatremoval system in the primary cavity through convection and radiation. Thereare no any active components in this system. Heat can be dissipated throughthe air coolers to final heat sink-atmosphere.
4.3. Negative reactivity temperature coefficientThe HTR-10 has negative reactivity temperature coefficient for both fuel andmoderator of about 8.8x10"5/K and during normal operation the fueltemperature is 700 K far from allowable maximum temperature. Thereforeabout 5x10"2 reactivity compensation can be provided by negative reactivitytemperature coefficient. It can offset reactivity increase at accidents of wateringress and control rods withdrawal.
5. ACCIDENT CLASSIFICATION CRITERIA
The spectrum of accident events are identified in accordance with theirbest-estimate frequency of occurrence and its consequence. In the HTR-10 theyare divided into five categories: normal operation states (category 1),anticipated operational occurrences (or middle frequency accidents- category2), rare accidents (category 3), limited accidents (category 4) and severeaccidents (category 5).
At rare accidents and limited accidents the reactor should be maintained atsubcritical condition even if the reactor could not operated in short period aswell as the capacity of residual heat remove should be kept and maximum fueltemperature should not exceed 1200°C. At rare accidents the exposure levelfor any individual outside the HTR-10 siting due to release of radioactivity shallbe less than 1 mSv for whole body dose and 10 mSv for thyroid dose. Atlimited accident the exposure level for any individual outside the HTR-10 sitingdue to release of radioactivity shall be less than 5 mSv for whole body doseand 50 mSv for thyroid dose.
At serious accidents the exposure level for any individual outside the HTR-10 siting due to release of radioactivity shall be the same as one at limitedaccidents. The difference is that at serious accidents reactor mechanical
97

integrity would not taken into consideration and only the exposure level for anyindividual outside the HTR-10 siting due to release of radioactivity areestimated.
6. DESIGN BASIS ACCIDENTS
The design basis accidents (DBA) are classified into several groups. Thereare: increase of heat removal capacity in primary circuit, decrease of heatremoval capacity in primary circuit, abnormality of reactivity and powerdistribution, rupture of primary pressure boundary tubes and anticipatedtransients without scram (ATWS). The analysis results for above mentionedaccidents are shown as follow:
At the accident of loss of the heat sink the maximum fuel temperature isabout 868 °C and the primary pressure change is very small. Therefore it is noneed to use additional measure except stopping the helium blower and insertingcontrol rods by the means of the reactor protection initiated by signals of theratio of primary flow to secondary flow, the helium inlet temperature raise andthe rate of neutron flux decrease.
During the accident of abnormal reactivity and power distribution it isassumed that the maximum reactivity increase with one control rod withdrawalis 1.83% at the rate of 1 cm/s within the moving internal of 2.2m. Themaximum power rate would be 2.7 times higher than normal power rate andthe maximum fuel temperature is 925 °C. It is still no need to take additionalmeasure.
At the accident of the rupture of primary boundary tube the tube rupture inthe fuel handling system with diameter of 65mm is the most severe accidentdue to appropriate design. With the signals of the ratio of primary flow tosecondary flow and primary pressure decrease rate the reactor should beshutdown and the helium blower should be stopped. However due to rapidrelease of the helium the reactor cavity pressure would be raised up 0.11MPawithin few seconds and the helium would be released into the surroundingenvironment. Low radioactivity of the helium at normal operation will not mucheffect the radioactivity level at the siting surrounding. In about three minutesthe primary pressure is equal to the reactor cavity pressure and the decay heatis mainly dispatched by heat conduction and radiation as the natural convectioneffect is very weak. Although the generated heat is higher than the heatremoved capacity at first few hours, the core temperature raise is very smalldue to large heat capacity, that is the maximum fuel temperature is about 874°C . It is much lower than safety limited temperature and the fuel failure wouldnot be occurred. Meanwhile it is assumed the natural convection flow would beestablished and total air in the reactor cavity would be reacted with the coregraphite. In this case the total amount of graphite corrosion is only 4.3 kg andthe maximum corrosion rate of the spherical ball surface is about 323 mol/m2.The coated particles are not exposed to air atmosphere and can keep theirintegrity.
98

7. BEYOND DESIGN BASIS ACCIDENTS
Beyond design basis accidents mainly include: long-term failure of thereactor cavity cooling system, simultaneous withdrawal of all control rods atpower operation and at reactor start-up, failure of the helium blower shut-down, simultaneous rupture of all steam generator tubes and rupture of the hotgas duct vessel.
For the accident analysis of failure of the helium blower shut-down it isassumed that the helium blower could not be stopped due to some reason sothat primary pressure and the temperature of components in the primary circlewould be raised. The primary pressure would be increased to 3.5 MPa in 76seconds and the helium would be released to the cavity, and then tosurrounding environment via the filter. It has no significant influence on thesurrounding. The temperature of the helium blower would be increased to about490 °C. As there is no heavy load on the blower material it will not influence onthe reactor safety. The temperature of the steam generator pressure vessel, thereactor pressure vessel and lower part of metallic internal would be raised toabout 272 °C , 386 °C and 298 °C, respectively. They are lower than thematerial allowance operating temperature.
At the accident of simultaneous rupture of all steam generator tubes thereactor protection system is put into operation by the signal of high humidity.The initial flow rates in the broken hot and cold legs are 3.4 kg/s and 3.47 kg/srespectively. Total 102 kg water is pored into the primary circle. The oxidizationcorrosion rate and pressure increase is very small and can be negligible.
The accident of rupture of the hot gas duct pressure vessel is the mostsevere accident. The reasonable and conservative assumptions are made. Thatis the integrity of the reactor core is not taken into consideration at the accidentanalysis and the accident duration is only three days as the managementmeasures are taken to terminate continuous air ingress into the reactor corewithin three days. Under above mentioned assumption at the accident ofrupture of the cross duct vessel the helium would be released to thesurrounding without flowing through the filter at beginning of the accident. Dueto low radioactivity at normal operation it will no significant influence on thesurrounding. Then the air will continually ingress into the rector core and reactwith the graphite. The total graphite corrosion amount is about 340kg. Thegraphite matrix corrosion amount is about 35% of the total graphite corrosion.Therefore about 0.75% of the coated particles are exposed and small amountradioactive material would be released to the surrounding. The exposure levelfor any individual outside the HTR-10 siting due to release of radioactivity is0.36mSv for whole body dose and 1.75mSv for thyroid dose. They are muchlower than specified dose limit. The fuel elements temperature is about 890 °C.
At the accident of ATWS initiated by depressurization and long-term failureof the reactor cavity cooling system the reactor can be automatically shut downby the means of the negative reactivity temperature coefficient. Thetemperature of fuel elements and the reactor pressure vessel are only 898 °Cand 250 °C, respectively.
99
8. CONCLUSION
Due to the HTR-10' inherent safety features except the severe accident nomanagement measures have to be taken. It is only in the case of hot gas ductpressure vessel failure that management measures are needed to terminatecontinuous air ingress into the reactor core.
REFERENCES
1. Yuanhui XU, Zhenya QIN, Zongxin WU Design of the 10 MW HighTemperature Gas-cooled Reactor Journal of Tsinghua University 1994 Vol. 34(ES2) p10-152. Preliminary Safety Analysis Report on the HTR-10 (in Chinese) INET3. Yuliang SUN, Yuanhui XU License Experience of the HTR-10 Presented atIAEA TCM on Design of High Temperature Reactor with Closed Gas TurbineCycle 30 October-3 November 1995, Beijing China
100

XA9846674AN INTRODUCTION TO OUR ACTIVITIES SUPPORTINGHTGR DEVELOPMENTS IN JAPAN
S. AN, T. HAYASHI, Y. TSUCHIETokai University,Tokyo,Japan
Abstract
On the view point the most important for the HTGR development promotion nowin Japan is to have people know about HTGR, the Research Association of HTGRPlants(RAHP) has paid the best efforts for making an appealing report for thepast two years .
The outline of the report is described with an introduction of some basicexperiments done on the passive decay heat removal as one of the activitiescarried out in a memmber of the association.
1. Introduction
RAHP, the only private organization studying the HTGR developments in Japan,consisting of universities, u t i l i t i e s and venders has been widely investigatingand watching the HTGR technologies as well as the commercialization aspectsin the world since 1985. THe association was reorganized recently in theframework of the comittees under the Institute of Applied Energy (IAE of Japan),but has kept same activities on the HTGR as before.On the understsnding of the technical advantages and the importance of intro-
ducing the HTGR into the energy world through the studies, and from the viewpoint that the most important at this stage now in Japan is to have peopleknow the HTGR, the association has paid best efforts for the past two yearsfor making an appealing report, especially expressed as concisely and plainlyas possible for the HTGR technologies and the meanings of its introduction.
The outline and intention to be used of the report is described below , withan introduction of some basic experiments on the passive decay heat removalwhich is one of the key issues of the system done in Tokai University, as anexample of activities of a memmber of the Association.
101

2. Report appealig HTGR support
2.1 Intention of the paperThe paper is made up under the subjects of ;0 that is HTGR ?0 fhy HTGR now ?0 How to be developed ?
In the opening page the intention of the paper is expressed. The paper isaimed for the support of the people by clearly showing our own understandingsthrough the studies on the HTGR not only for the people in the fields concernedbut also in the fields of the executives of beaurocracies, industries and uni-versities and also for the young people who w i l l be responsible in the nextgeneration.
The report consists of three chapters. In the 1st chapter are explained theterms used for the HTGR and the various concepts of the HTGRs such as fuel andcore or the power supply plants and heat supply plants,etc. In the 2nd chapter,the main part of the paper , is described the outline of the developments ofHTGR in which the merits and the attractive featurs of the HTGR are stressed.In the 3rd chapter are described the summary and proposals.
2.2 The outline of the HTGR developmentsIn the 2nd chapter, the main part of the this document, the outline of the
HTGR developments is described under the subtitles of ;0 Ihy HTGR now ?
the reason, backgroud, stand points, direction or needs0 that kinds of applications possible ?0 The sizes of the plants considered.0 What siting possible ?0 What schedules or milestones for the developments of the HTGRs desireble ?0 The technologies status obtained so far.
The present technology levels on the HTGRs obtainedso far both in Japan and foreign countries for thefurther developments of the HTGR in applications.
0 Ihat problems or subjects to be overcome ?
102

0 The economics of the HTGRs considered and possible ?0 The circumstances and situations in the HTGR developments.
AS for the first theme, "thy HTGR no? ?" , the paper appeals the reason why,stressing that ;(1) HTGR can utilize the nuclear energy in much larger scopes and at much
higher efficiencies. :0 fider utilizations of nuclear energy nore than electricity.
The HTGR can expand the nuclear energy use to the other energyregions, e.g., to the transportation energy by producing hydrogenor methanole.
0 Power Generation at much higer efficiency;o Steam turbine generation 40 %o Gas turbine generation 50 %o Possibility of heat utilization at much higher efficiency by cascade
using(2) HTGR can make the urban siting possible near to the place of the demands
by its inherent safety characteristics of the modular HTGRs. :0 The basic features of the modular HTGRs;
o The specific features of the coated particle fuelFP release free even to 1600t:Melt down free
o Helium gas coolingNo phase changeNo reactibity change in consequence
o Large graphite (ceramic) coreVery slow transients in accidents( by the huge heat capacity of the core )
No core meltdown0 Highly achieved inherent safety features in the accidents;
o Reacter shutdown featuresNot actively shutting down, but passively stopping itself
( by big negative temp, coeff. on the verylarge temp, rise allowance in the core )
103

o Decay heat removal features;Not actively cooling, but passively getting cold itselfThe core tenperture limitted below 1600X) at any cases
o Confinment of FPs;Through the above two inherent charactristies built in thecore, the FPs are all confined in the coated particle fuelsin the worst, highly hypothetical accidents.
As for the 2nd thene, "that kinds of applications possible ?" , the scopes tobe expected or desired are illustrated as shown in the figure 1.
Besides the above, in the rest of the articles are explained the uniquefeatures of the HTGR such as ;
o The f l e x i b i l i t y in plant constructions owing to the multi-module plant,selecting to construct the nodules by turns.
o And thus reducing the capital burden and avoiding the capital risks.o Imposing less burden to the operators with l i t t l e possibility to invite
vital accidents by mis-handling.o Actual and proven technologies through the long experiences of con-
structions and operations to the scale as large as the demonstrationreactor plants.
o Efficient utilization of the nuclear fuel by higher burn upo Flexibility of the fuel cycle so as to enable to use uranium, pluto-
nium and thorium in the same reactor core.o Unique capability of coated particle fuels for the efficient Plutonium
burning.
In the 3rd chapter, the paper concludes as the wordso that the HTGR can greately contribute to the energy and enbironmental
problems on the earth with its capability of the inherent safety, theunique ability in the thermal use of the nuclear energy by its hightemperature and the flexibility of the fuel cycle, etc.,
o and that the HTGR is of actual technologies with the long experiencesin constructions and operations even to the scale of the demonstrationreactor plants,
104
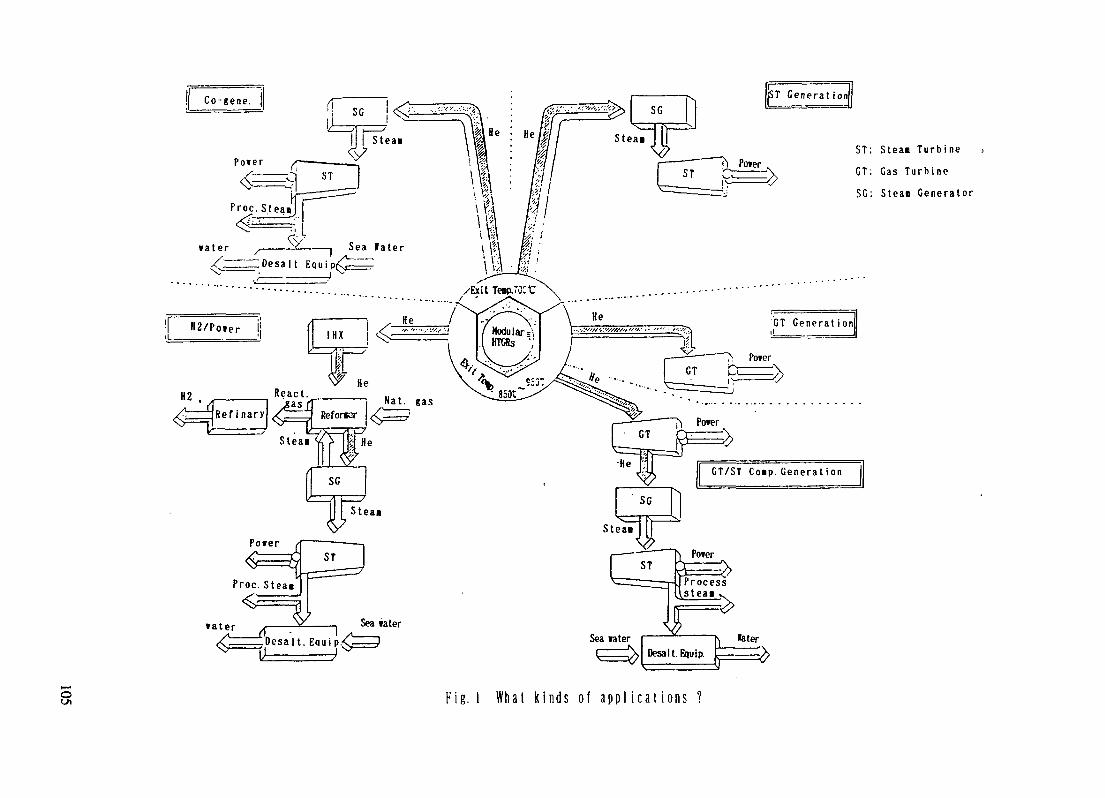
GT/ST COBD. G e n e r a t i o n
ST: Stean T u r b i n eGT; Gas T u r b i n eSG: Stean G e n e r a t o r
Fig. 1 W h a t k i n d s of a p p l i c a t i o n s ?

o and that it keeps the higher possibilities to itself by using togetherwith gas turbine systems,
o therefore, promoting the HTGR technology developments, making up theactual scenario to the stage of the practical use , incorporating the"HTGR development" into the national energy strategies and the actuallyconstructing a demonstration plants are desirable.
3. Basic experiments on the passive decay heat removal
3.1 The backgroundIn Tokai Universiity, we have carried out basic experiments on the passive
decay heat removal, one of the key issues of the modular HTGR, with subsidiesfrom three member companies of RAHP, in the form of joint study or consignedstudy.
fe have two themes on the experimental studies, one of which is the investi-gation of the air flow behaviors on the natural air draft strengthened by thethe chimny effects and another is the studies on the possibilities of theattractive applications of the separated heat pipe systems both for the passivedecay heat removal on the reactors.These studies have been done together with the objects for the graduate stud-
ies of the graduate students. Therefore the studies are very basic and done bythe small handmade devices mainly made by the students themselves, though, veryinteresting findings have been obtained so far. These results are thought tobe suggesitive on desiging the actual systems or on planning larger scaleexperiments for the actual systems.
le would like to invite the discussions on them by showing the experimentalresuls of these studies as below.
3.2 The abnormal flow phenomenon taking place on the natural air draftheat removal system experiments
Recently there has been a strong tendancy for advanced reactors to rely onthe passive heat removal by means of natural air draft strengthened by chimnyeffects for the ultimate purpose of rejecting decay heat to the environmentseen in the modular HTGR(MHTGR), modular LMR(PRISM) and advanced LIR(AP-600).
106
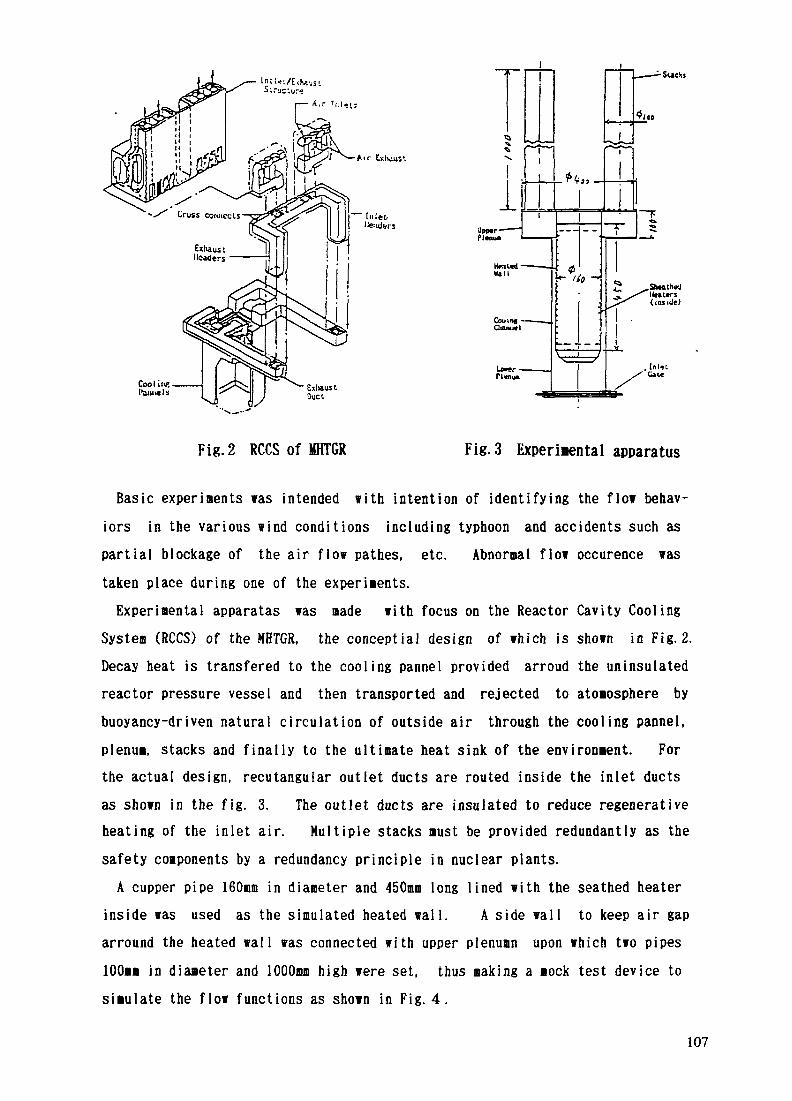
Stick]
Coo I i liftI'll me Is Exhaust
Ouct
Fig.2 RCCS of MHTGR Fig.3 Experimental apparatus
Basic experiments was intended with intention of identifying the flow behav-iors in the various wind conditions including typhoon and accidents such aspartial blockage of the air flow pathes, etc. Abnormal flow occurence wastaken place during one of the experiments.Experinental apparatas was made with focus on the Reactor Cavity Cooling
System (RCCS) of the MHTGR, the conceptial design of which is shown in Fig.2.Decay heat is transfered to the cooling panne 1 provided arroud the uninsulatedreactor pressure vessel and then transported and rejected to atomosphere bybuoyancy-driven natural circulation of outside air through the cooling pannel,plenum, stacks and finally to the ultimate heat sink of the environment. Forthe actual design, recutangular outlet ducts are routed inside the inlet ductsas shown in the fig. 3. The outlet ducts are insulated to reduce regenerativeheating of the inlet air. Multiple stacks must be provided redundantly as thesafety components by a redundancy principle in nuclear plants.
A cupper pipe 160mm in diameter and 450mm long lined with the seathed heaterinside was used as the simulated heated wall. A side wall to keep air gaparround the heated wall was connected with upper pienumn upon which two pipes100mm in diameter and 1000mm high were set, thus making a mock test device tosimulate the flow functions as shown in Fig. 4.
107

Photo.1 Normal flow(Both stacks discharging)
Photo.2 Abnormal flow(One stack discharging/another stack inhaling)
Photo.3 Returned to the normal flow(The flow returns to the normal flowwhen the flow resistaces are addedon the extis of the both stacks)
Fig.4 The air flow behviors at the exits of the stacks
108
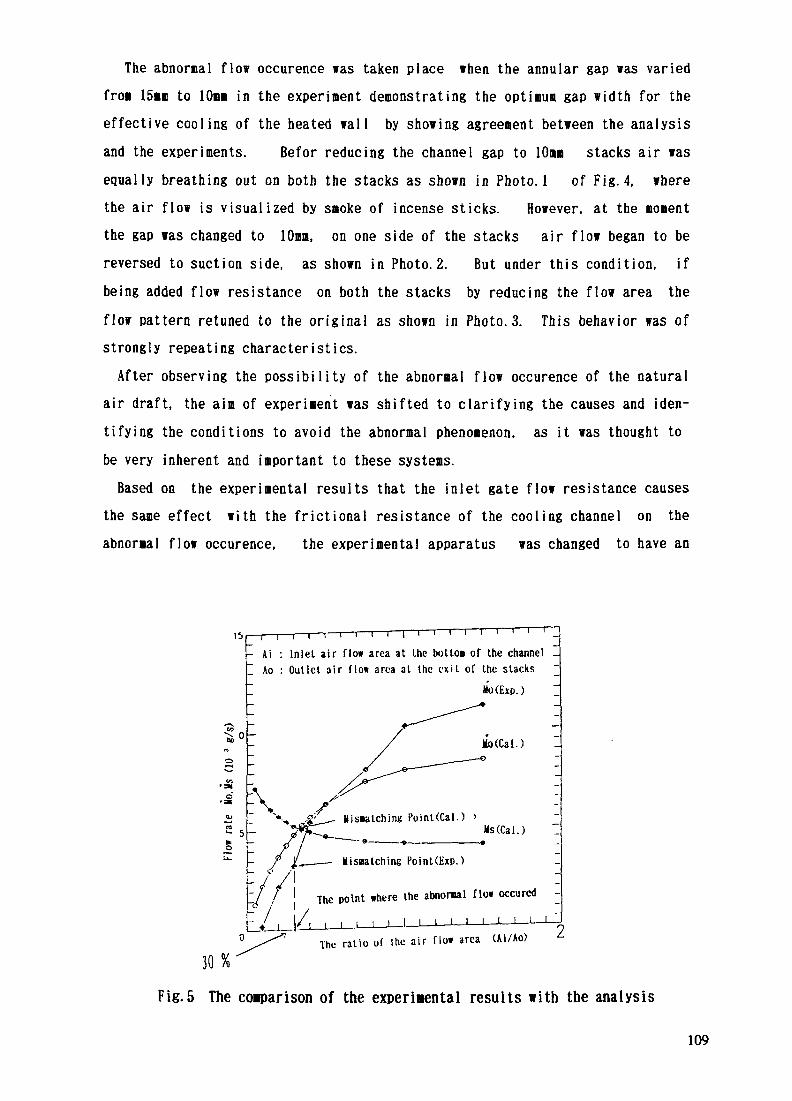
The abnornal flow occurence was taken place then the annular gap was variedfroi 15am to 10mm in the experiment demonstrating the optinun gap width for theeffective cooling of the heated wall by showing agreement between the analysisand the experiments. Befor reducing the channel gap to 10am stacks air wasequally breathing out on both the stacks as shown in Photo. 1 of Fig.4, wherethe air flow is visualized by smoke of incense sticks. However, at the momentthe gap was changed to 10mm, on one side of the stacks air flow began to bereversed to suction side, as shown in Photo.2. But under this condition, ifbeing added flow resistance on both the stacks by reducing the flow area theflow pattern retuned to the original as shown in Photo. 3. This behavior was ofstrongly repeating characteristics.After observing the possibility of the abnormal flow occurence of the natural
air draft, the aim of experiment was shifted to clarifying the causes and iden-tifying the conditions to avoid the abnormal phenomenon, as it was thought tobe very inherent and important to these systems.Based on the experimental results that the inlet gate flow resistance causes
the same effect with the frictional resistance of the cooling channel on theabnormal flow occurence, the experimental apparatus was changed to have an
BC
o
^ oo
- Ai : Inlet air flow area at the botlon of the channel _I Ao : Outlet air flow area at the exit of the stacks ~
Mo(Exp.)
Mo(Cal.)
i—r i—r
\ Kisnalching Point(Cal.) >MsCCal.)
Mi snatch ing Point(Exp.)
30%
The point where the abnomal flow occurcd/, , , , i i I I i i i i 1 1——I——L
The ratio of the air flow area Ui/Ao)
Fig.5 The comparison of the experimental results with the analysis
109

inlet gate to adjust the inlet flow resistance by changing the air intake areawith the gap fixed at 20min in width. The flow behaviors were exanined on thevarious combinations of the inlet flow resistance with the exit flow resistanceon the stacks. The abnormal flow occurence was taken place at the intake flowarea of about 30 % of the cooling channel flow area (Fig. 5), and was recoveredby adding sane measures of flow restriction on the stacks after the transient.
On comparisons of the experimental results with the analyses for the variouscombinations of the inlet and outlet flow resistances, it was concluded thatthe abnormal flow arised on the experimental apparatus when the conditions ofthe flow was as shown in Fig.5,
Mo < Mswhere Mo is the mass flow rate calculated for all the path through from theinlet gate to the exit of the stacks and Ms is the mass flow rate evaluatedfor the chimny effect caused by only the stacks.
In the subsequent experiments, however , on the experiments modified withfour stacks instead of two stacks, it was proved Eq.(1) are not always met.For that reson the heat leakages along the heated air paths are doubted, beingstudied now with some modifications on the the experimental apparatus.
( Conclusion )In applications of the natural air draft enhanced by chimny effect for the
passive decay heat removal systems, it is advisable for avoiding the abnormalflow phenomenon that1) The air flow resistance in the inlet side (up-streaa )to the heated section
should be as low as possible compared with the exit side (down-stream) ofthe stream
2) The heat leakages along the air flow paths are douted to have big relationswith the abnormal flow occurence .and so should be carefully considered.
3.3 Studies on the possibilities of the attractive applications ofthe separated heat pipe system for the passive decay heat removal systems
(Experimental purpose)Experiments on the separated heat pipe system enclosing non condensible gas,
conception of which originates from so called "variable conductance heat pipe "
110
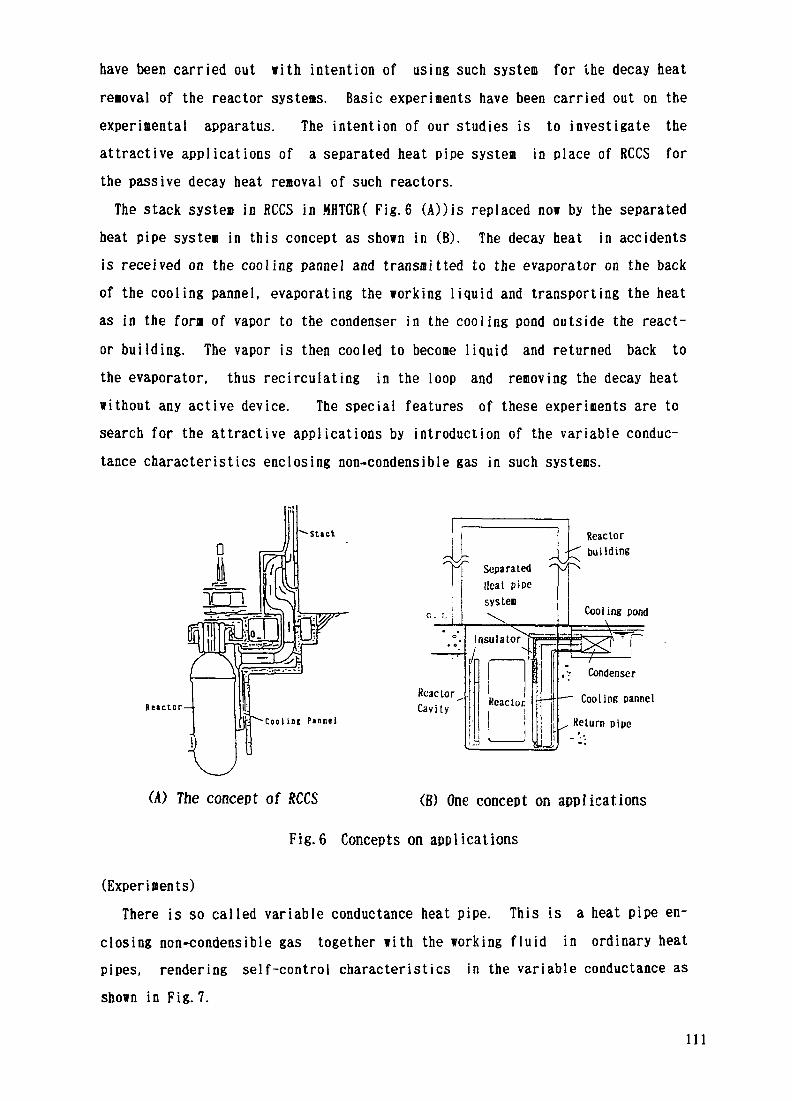
have been carried out with intention of using such system for the decay heatremoval of the reactor systems. Basic experiments have been carried out on theexperimental apparatus. The intention of our studies is to investigate theattractive applications of a separated heat pipe system in place of RCCS forthe passive decay heat removal of such reactors.The stack system in RCCS in MHTGR( Fig. 6 (A))is replaced now by the separated
heat pipe system in this concept as shown in (B). The decay heat in accidentsis received on the cooling pannel and transmitted to the evaporator on the backof the cooling pannel, evaporating the working liquid and transporting the heatas in the form of vapor to the condenser in the cooling pond outside the react-or building. The vapor is then cooled to become liquid and returned back tothe evaporator, thus recirculating in the loop and removing the decay heatwithout any active device. The special features of these experiments are tosearch for the attractive applications by introduction of the variable conduc-tance characteristics enclosing non-condensible gas in such systems.
Stack0
Reactor —
SeparatedHeat pipesysten
ReactorCavity
Coo)in! Pannel
InsulatorL
Reactor
Reactorbuilding
Cooling pond
, •• Condenser-— Cooling pannel,. Return pipe
(A) The concept of RCCS (B) One concept on applicationsFig.6 Concepts on applications
(Experiments)There is so called variable conductance heat pipe. This is a heat pipe en-
closing non-condensible gas together with the working fluid in ordinary heatpipes, rendering self-control characteristics in the variable conductance asshown in Fig. 7.
Ill
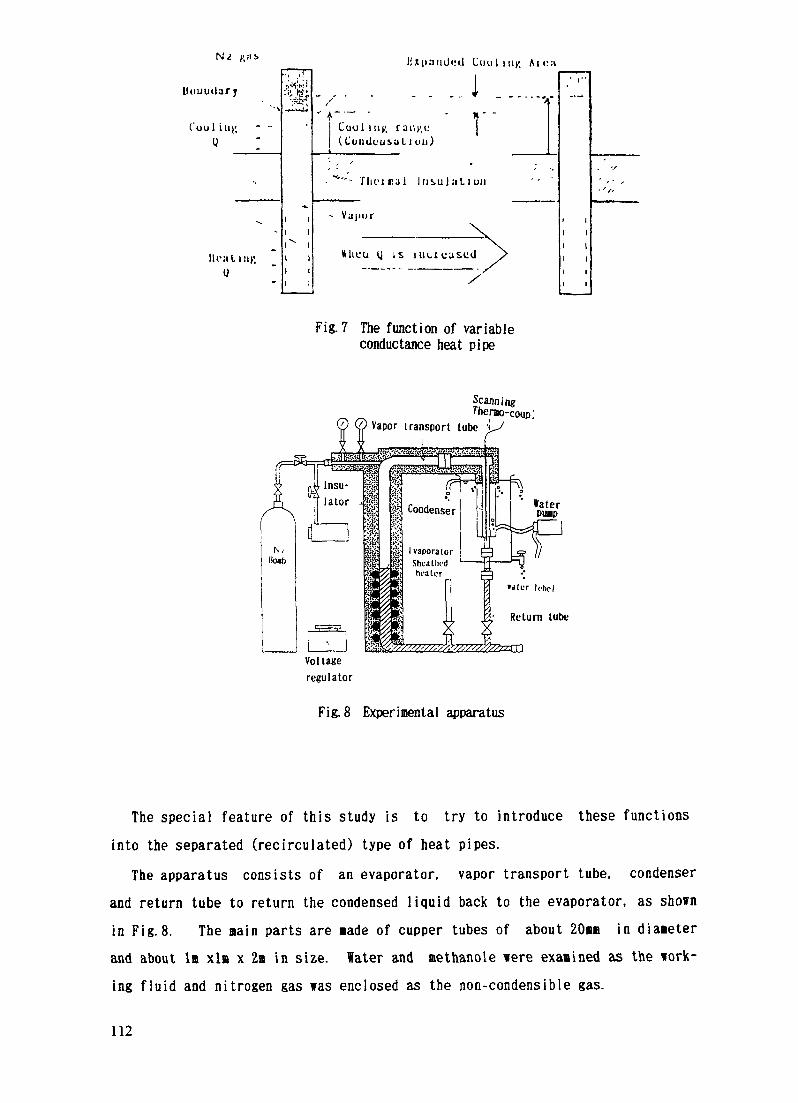
l ixpauijcd C A l <• :t
U u u u t l a r y
C u u l iuy,y
lU'Jll ill}'
. . . . ..Ik"~ ' - vLool iuy. raui'.c I(CouUuusul i uii)
I n s u l a t i o n
V a p o r
*heu y is
Fig. 7 The function of variableconductance heat pipe
Scanning
Voltageregulator
Fig.8 Experimental apparatus
The special feature of this study is to try to introduce these functionsinto the separated (recirculated) type of heat pipes.
The apparatus consists of an evaporator, vapor transport tube, condenserand return tube to return the condensed liquid back to the evaporator, as shownin Fig. 8. The main parts are Bade of cupper tubes of about 20nB in diameterand about la xl« x 2m in size. Hater and aethanole were examined as the work-ing fluid and nitrogen gas was enclosed as the non-condensible gas.
112
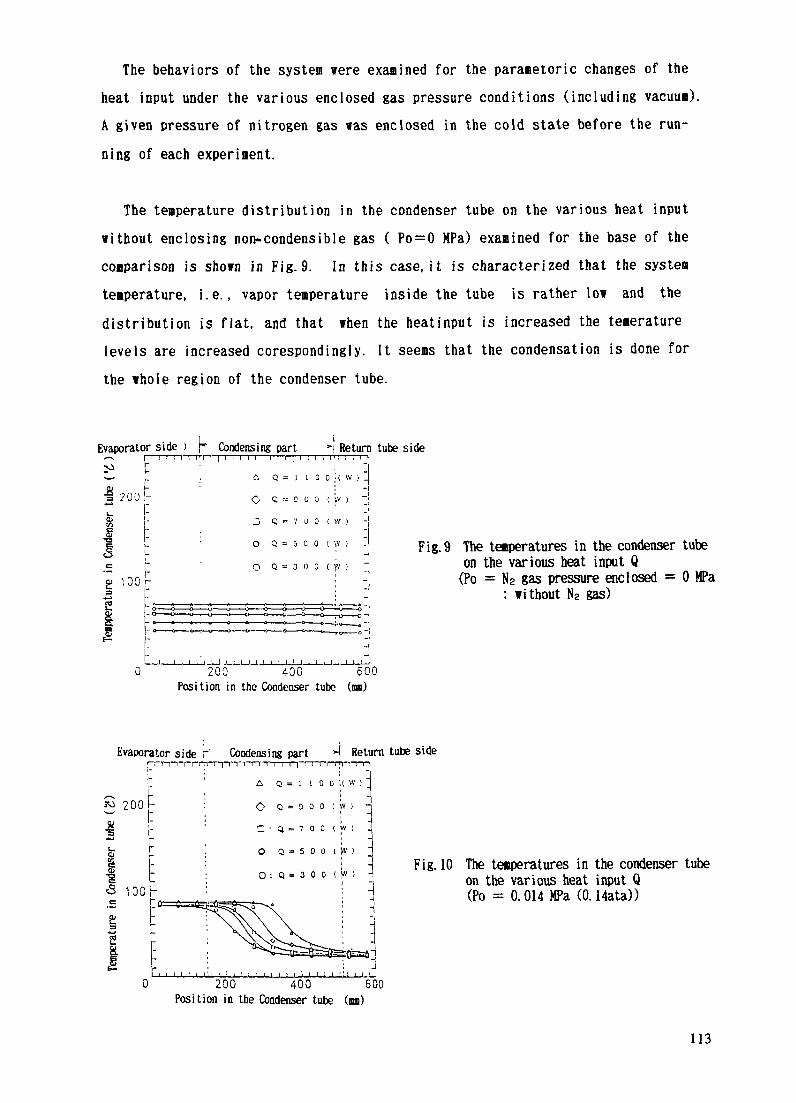
The behaviors of the system were examined for the parameteric changes of theheat input under the various enclosed gas pressure conditions (including vacuum).A given pressure of nitrogen gas was enclosed in the cold state before the run-ning of each expedient.
The temperature distribution in the condenser tube on the various heat inputwithout enclosing non-condensible gas ( Po = 0 MPa) examined for the base of thecomparison is shown in Fig. 9. In this case.it is characterized that the systemtemperature, i.e., vapor temperature inside the tube is rather low and thedistribution is flat, and that when the heatinput is increased the temeraturelevels are increased corespondingly. It seems that the condensation is done forthe whole region of the condenser tube.
Evaporator side ) p Condensing part __>l Return tube side--N i "i"i'; 'i~ri"iM" T~y~n i i i i rr'r™!1 rrrr-r'T'T'v i *^•i r ' i 'N—- v_ . ^ Q = i i o o •( w )* h :-e onn I-200! O Q - D o a ( ',v j _]
3 Q «• 7 0 0 ( W )
O Q = 5 0 0 ( W )
O Q = 3 o o ( y.' )
.
0 200 400 600Position in the Condenser tube (mm)
Fig. 9 The temperatures in the condenser tubeon the various heat input Q(Po = Wz gas pressure enclosed = 0 MPa
; without $z gas)
Return tube side111 i i i
200 400 500Position in the Condenser tube (OB)
Fig. 10 The temperatures in the condenser tubeon the various heat input Q(Po = 0.014 MPa (0.14ata))
113

However, if the the non condensible gas is initially enclosed, the situationis changed drastically as seen in Fig. 10, where nitrogen gas was initiallyenclosed by the pressure of 0.014 MPa(about 0.14 ata). The temperature of theEvaporator side, that is the system temperature, is farely increased while inthe Return tube side the temperature slops down. It seems that in the Returntube side the most part of the tube is filled with nitrogen gas and the conden-sation is limitted to the point of the overhanged in the tube, thus limittingthe heat discharge area by condensation to give the system temperature rise.If the heat input is increased the condensation area is increased by itself,thus refraining from the temperature rise and clearly showing the self controlfeatures.
200 -£
i100
200 '10Q~'LJ"J'J~'~600
Fig. 11 The temperatures in the condenser tubeon the various heat input Q(Po = 0. 2 MPa (2ata))
Position in the Condenser tube (mi)
200
E!
1- 100g
|J.= I . 11 (1 ., I :\
500 1000Heat input Q (I)
Fig 12 The atained system temperatureson the various enclosed N2 pressure Poto the various heat input Q
114
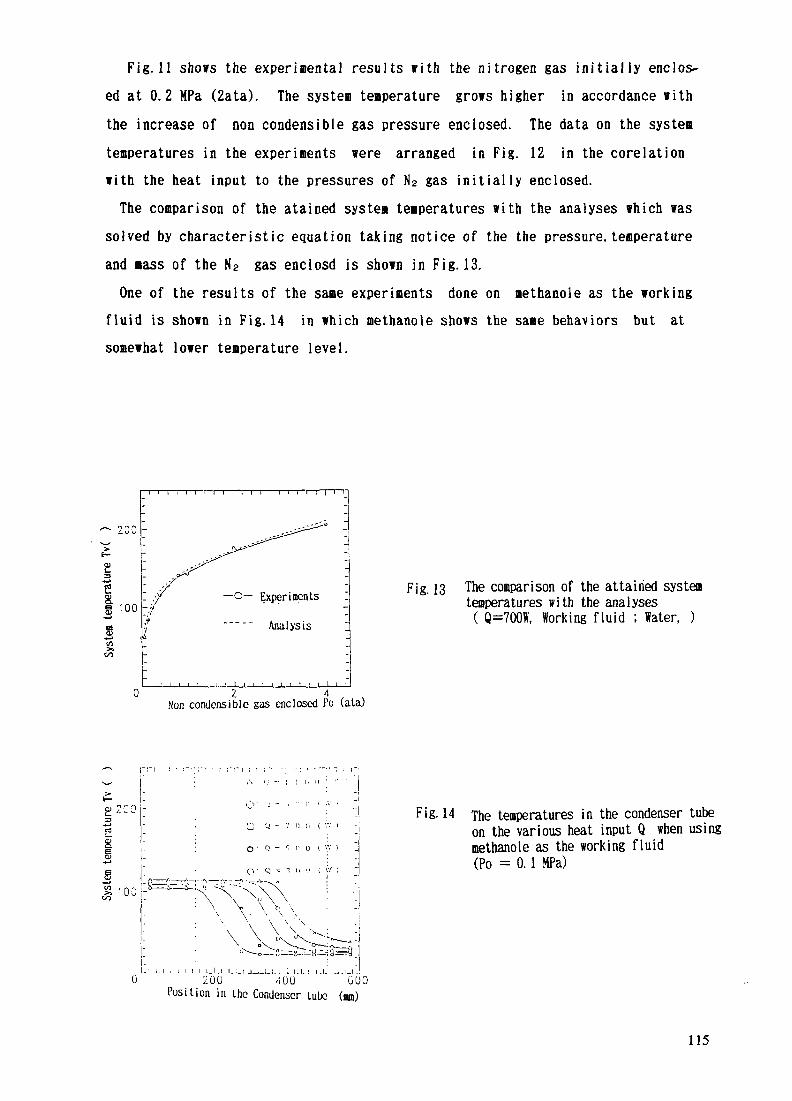
Fig.11 shows the experimental results with the nitrogen gas i n i t i a l l y enclos-ed at 0.2 MPa (2ata). The system temperature grows higher in accordance withthe increase of non condensible gas pressure enclosed. The data on the systemtemperatures in the experiments were arranged in Fig. 12 in the core 1 at ionwith the heat input to the pressures of N2 gas i n i t i a l l y enclosed.The comparison of the atained system temperatures with the analyses which was
solved by characteristic equation taking notice of the the pressure, temperatureand mass of the N2 gas enclosd is shown in Fig. 13.One of the results of the same experiments done on methanole as the working
fluid is shown in Fig. 14 in which methanole shows the same behaviors but atsomewhat lower temperature level.
200
100-o— Experiments
"~" Analysis
0 2 4Non condensible gas enclosed Po (ata)
Fig. 13 The comparison of the attained systemtemperatures with the analyses( Q=700Hf, Working fluid ; later, )
a> 200=3s£g§100
Ll_ I . I I _L_I._I I l_l .1 !_ !_! J_i_l_l 1 L 1 I I 1 -L I J !_l .0 200 '100 GOOPosition in Lhc Condenser lute (mm)
Fig. 14 The temperatures in the condenser tubeon the various heat input Q when usingmethanole as the working fluid(Po = 0.1 MPa)
115

( Conclusion )The basic experiments on the separated heat pipe system enclosing non con-
densible gas have been done with intention of searching for the attractiveapplications on the passive decay heat removal of the reactors. The results ofthe experiments show very clear features of self control characteristics whichsuggest the possibilities of the interesting applications for the passive decayheat removal in reactor system such as modular HTGRs. On both the experimentsand the analysis the mechanism of the system is now clarifid and on that standinteresting applications are expected, one of which is a possibility to designa fully passive decay heat removal system which can minimize the heat lossduring the normal operations with maintaining the sufficient heat removal rateduring accidents.
116

MANAGEMENT SYSTEM AND POTENTIAL XA9846675MARKETS FOR A HTR-GT PLANT
G.A.K. CROMMELINVoorschoten,Netherlands
Abstract
This article will discuss some aspects which could be helpful to execute a HTR-GT studysuccessfully:
1. The prefered type of organisation for such a study; in order to achieve a maximum of sup-port in society and industry, a minimum of through life costing and a maximum of through lifesupport.
2. The lead time needed for such studies i.e. the design, component testing, prototype testing,the required efficiency, the type of energy in quantity and quality, financial targets, controlability,maintainability and reliability.
3. The potential markets for the nuclear gasturbine driven energy plants in the low power ran-ge. Analyses of the markets will be explained from the user's point of view on why, when andhow, for what purpose, in which power range, as well as how many units per application would berequired.
Introduction.
From time to time examples are published of products that are carefully designed, tested andproduced with the involvement of scientists, designers and engineers and which turn out to be un-marketable and become a complete loss. One way to prevent this from happening is to invite po-tential users, producers and maintainers and inform them about your ideas and thoughts on design,marketing potential, production matters, financial targets and why you think it is needed. The nextstep is a difficult one for scientists, designers and engineers, but listen to these potential users,producers and maintainers, i.o.w listen to the market. This well-proven managementsystem is theonly way to prevent disappointment and to create a maximum of support in society, a minimum ofthrough life costing and a maximum of through life support i.o.w. the market for your product.In the Netherlands the support for nuclear energy generation is rather slim, so to start a study for anew nuclear product is a very tense action. We followed this cautious procedure carefully, alt-hough it is certainly a new and uneasy approach for many of us.
The installation we have in mind.
What did we have in mind? In short a suitable replacement for certain diesel-driven or gas-turbine-driven applications. An installation consisting of an inherently safe helium cooled pebble-bed reactor with a thermal power of less than 100 MW, directly coupled to a gasturbine in a clo-sed cycle system, only using well-proven technologies and management systems. See Appendix 0.Available for the replacement market around 2010.Available at a comparable price, based on through life costing and through life support.Suitable for the markets of :
Combined heat and power applicationsStand-alone heat generationStand-alone electricity generationShip propulsion
117
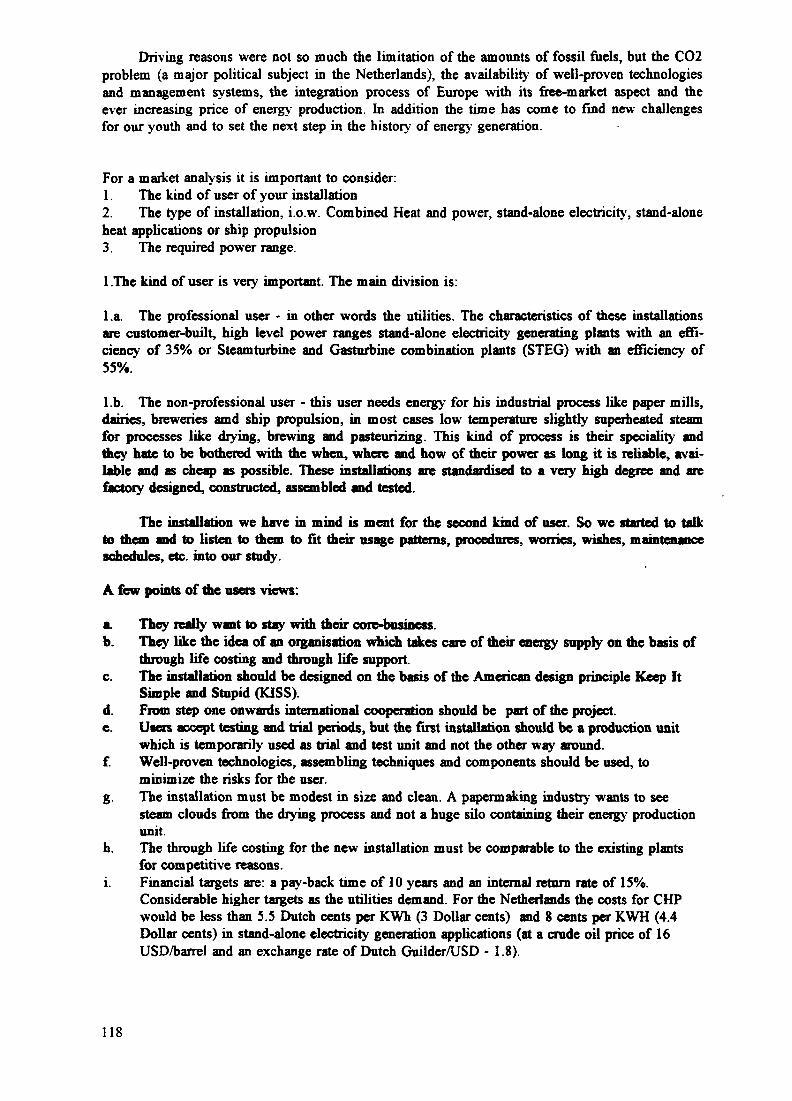
Driving reasons were not so much the limitation of the amounts of fossil fuels, but the C02problem (a major political subject in the Netherlands), the availability of well-proven technologiesand management systems, the integration process of Europe with its free-market aspect and theever increasing price of energy production. In addition the time has come to find new challengesfor our youth and to set the next step in the history of energy generation.
For a market analysis it is important to consider:1. The kind of user of your installation2. The type of installation, i.o.w. Combined Heat and power, stand-alone electricity, stand-aloneheat applications or ship propulsion3. The required power range.
l.The kind of user is very important. The main division is:
La. The professional user - in other words the utilities. The characteristics of these installationsare customer-built, high level power ranges stand-alone electricity generating plants with an effi-ciency of 35% or Steam turbine and Gasturbine combination plants (STEG) with an efficiency of55%.
l.b. The non-professional user - this user needs energy for his industrial process like paper mills,dairies, breweries amd ship propulsion, in most cases low temperature slightly superheated steamfor processes like drying, brewing and pasteurizing. This kind of process is their speciality andthey hate to be bothered with the when, where and how of their power as long it is reliable, avai-lable and as cheap as possible. These installations are standardised to a very high degree and arefactory designed, constructed, assembled and tested.
The installation we have in mind is ment for die second kind of user. So we started to talkto them and to listen to them to fit their usage patterns, procedures, worries, wishes, maintenanceschedules, etc. into our study.
A few points of the users views:
a. They really want to stay with their core-business.b. They like the idea of an organisation which takes care of their energy supply on the basis of
through life costing and through life support,c. The installation should be designed on die basis of die American design principle Keep It
Simple and Stupid (KISS).d. From step one onwards international cooperation should be part of the project,e. Users accept testing and trial periods, but the first installation should be a production unit
which is temporarily used as trial and test unit and not the other way around,f. Well-proven technologies, assembling techniques and components should be used, to
minimize the risks for the user,g. The installation must be modest in size and clean. A papermaking industry wants to see
steam clouds from the drying process and not a huge silo containing their energy productionunit,
h. The through life costing for the new installation must be comparable to the existing plantsfor competitive reasons,
i. Financial targets are: a pay-back time of 10 years and an internal return rate of 15%.Considerable higher targets as the utilities demand. For die Netherlands the costs for CHPwould be less than 5.5 Dutch cents per KWh (3 Dollar cents) and 8 cents per KWH (4.4Dollar cents) in stand-alone electricity generation applications (at a crude oil price of 16USD/barrel and an exchange rate of Dutch Guilder/USD - 1.8).
118
j. The energy generation process must be well controlable, depending on the demand and mustbe of constant quality. At the moment many users of CHP have additional firing in theexhaust boilers to control the quantity and quality of the steam for their industrial process .For this the nuclear installation is unsuitable, so a solution has to be found,
k. Prototype testing is very important as proof of safety. Its credibility increases considerably ifthe plant is constructed to serve as operational unit after the testing itself has beencompleted.
1. Although they do not refuse to believe the high availability factors you promise them, theydo not like too high a price and do like to stick to their existing procedures concerningmaintenance, redundancy and flexibility.
This last paragraph is an important one: an industry using a maximum of 60 MWheat prefers6 installations of 10 MWheat instead of 2 installations of 30 MWheat or one unit of 60 MWheat.It produces the required flexibility and redundancy. In practice the investment cost of a fossil fue-led Combined Heat and Power (CHP) installation is practically independant of the installed power,(see appendix)There seems to be no reason why this trend should not be applicable to nuclear installations ofcomparable power.
The procedure as described requires extra time, especially when the product, like our HTR-GT design, is a combination of well-proven technologies. This is logical, a lot of time is neededbefore people from different parts of the business community are comfortable with each other'sopinions and capabilities. Only then they are able to get some feeling about the why and how ofthe other participants and to extend their support into their industry and their part of society.
The growth of this kind of public opinion has to be supported by publications in newspapersand magazines, presentations at schools, colleges and universities, by visits to potential users, sup-pliers and maintainers, your presence at exhibitions and by the supply of regular information topoliticians and leading managers.
As was mentioned before, the support for nuclear technology is slim, the reasons why do notmatter anymore. Stop being afraid of publicity and public relations. Fight back and play bluff po-ker. The other side is just as clever as you are.
The efficiency of the plant must at least be comparable to that of the existing plants. Not somuch because of the fuel price, but because the potential owners have been fighting for high effi-ciency as a result of the ever increasing price of fuel and related taxes and it will frighten them tosuddenly leave this path. In addition the young people in the Netherlands are well aware of thefact that the energy waste will be high on the agenda for environmental reasons after the CO2 pro-blem has been brought under control.
Maintainability is another aspect on which you must listen to the customer. He likes an or-ganisation which takes care of the whole through life support, including cooperation between allusers, new production, training, control, new infrastructure, licency, maintenance, documentation,and scrapping; in other words the full logistic support. This is only possible if the installation ismade suitable for this design from day one onwards. There exists a management system which isable to do all this. This will be discussed in part two of this publication.
The Pooling system.
In this paragraph an aspect will be discussed, which is growing in importance; namely thatof the user's ideas on the management of their Co-generation plants. The pooling-system fits withtrends like "back to core business", "we will take care of you" and through life costing in combi-nation with through life support and shared costs.
119

The pooling system also seems to be a set of tools to make the owner costs of an INCOGEN istal-lation comparable to those of the existing fossil fuel fired CHP-plants.
The history.
The system was developped at the end of World War II by the Royal Airforce of Great Bri-tain. The aim was to improve in all aspects the world-wide exploitation of the Rolls Royce Merlinengines of the Spitfire. Since then it has further been developed and is now used by aircraft com-panies like KLM and British Airways. The propulsion engines are taken from the wing when nee-ded for repair, overhaul or modification and are replaced immediately by a spare one to keep theaircraft available as much as possible. KLM manages a pool of CF-6 General Electric Engines forKLM itself and a number of other aircraft companies. British Airways does the same for the RollsRoyce aero gasturbines. Similar systems are in operation by European Airforces, for example forthe Grumman F-16. A very special version is a pooling-system called "Memorandum of Under-standing for the logistic support of Rolls Royce marinized gasturbines". It manages (on Ol-OS-^S)a pool of 109 Olympus, 97 Tynes and 46 Spey gasturbines in use with the navies of Great Britain,France, Belgium and the Netherlands. The savings are considerable. For example to keep operati-onal all ships in the Royal Navy, using Tyne gasturbines for cruising, 22 Tynes should be availa-
11 We and 14 Tynes for die Royal Netherlands navy. By pooling die two navies 29 engines should* suffice. A saving of 7 engines. The same saving occurs with all the spares, tooling and the worklo-
ad of die repair and maintenance lines. From the military point of view one of the advantages ofdie pooling-system is its flexibility, which has been proven time and again in periods of war andcrisis control; most lately during die Falkland crisis and die war in die Persian Gulf.
Very recently die United States Department of Justice said it approved a plan by eight nu-clear utilities, to pool dteir equipment purchases, to share personnel and odier resources in a moveto cut costs. The reason this Department became involved is die Anti-Trust law in die United Sta-
This Pooling-organisation is called Utillities Services Alliance and manages 7 % and intendsto grow to 35 % of die US nuclear power production.
The aim.
The objective of a Pooling-system is to establish arrangements for die logistic support ofcommon equipment. The main advantage of a pooling-system is die economy of scale. In otherwords to increase die efficiency of die availability, die flexibility, die readiness, die new producti-on, overhaul and repair capacity with its tooling, dedicated personnel, documentation, spares etc.for a particular type of engine or equipment. This takes place through die pooling of all availableknow-how, experience and investments and will lead to a reduction in exploitation costs and thusto die cost of ownership by through life support of die technical installations concerned.
How does it work?
A Pooling-system is only applicable when there is a commonality of equipment. It can com-prise a whole installation like a stand-alone nuclear gasturbine installation employed to generateelectricity or it can be a part of a technical installation, such as similar control equipment on dif-ferent types of installations. In this article we will only consider the effect of a pooling-system ona nuclear gasturbine plant like the HTR-GT for the low power range. The owners of such a plantown, manage and share out the benefits and losses of a pool of spares, tooling, spare equipment,documentation, training facilities, test equipment en facilities, overhaul and repair shops and simi-lar investments with subcontractors, know-how to build, maintain and scrap equipment and expe-rience concerning the exploitation of the equipment.
120

The actual management is done by a dedicated team, which reports periodically to the sha-reholders, the owners and users of the plant.
The pool takes care of: new production in dedicated workshops, setting to work, remote con-trol, the planned maintenance in situe and on the overhaul line, the replacement of the fuel, thehandling of the nuclear waste, the analyses of defects and possible development, testing, imple-mentation and configuration control of modifications, the training of operators, safety personnel,maintainers, the subcontractors, the planned maintenance, the investment in spares, the rest life ofspares, tooling, overhaul, repair and maintenance equipment, documentation, construction, speciallegislation and generally applicable legislation.
Modular construction.
An important aspect in considering a pooling-system is the aspect of a modular construction.Modular built means that the total installation can be divided into units that are easy to manageand which can be replaced with spare units for repair, planned maintenance or overhaul.
So in a nuclear gasturbine installation the non-nuclear part can be and should be divided intoat least the following modules: recuperator, power control, engine health monitoring system, heli-um cleaning system, heat exchangers, auxilliary equipment and the gasturbine itself. This will leadto a minimum of stand-down time, one of the biggest problems of the existing nuclear installati-ons.
The maintenance time can be decreased even further by the joining together of combinationsof modules in a bigger replacement unit. For the shipping applications this seems advantageous,because of scheduled docking periods.
The modules have to be interchangeable; in other words the installations will have to have avery high degree of standardization, because otherwise special procedures, tools, spares and so onwould be required. This would increase the cost of ownership which is shared by all partners. So astringent configuration control is a necessity.
This is very important. Equipment which is customer designed, built, maintained etc. is verycommon in the existing nuclear world (applies to most (nuclear) power plants), but increases thecost of ownership drastically. So if nuclear energy generation is to be more widely applicable, thisexisting way of thinking and working has to be reconsidered.
In the nuclear part of the INCOGEN-installation the replacement of the fuel is the onlymaintenance action which can be done in the modular way. It is advisable to place the fuel, duringthe usage, in some kind of open "shopping basket" which will be taken out periodically and placedin a transport container and replaced by another "shopping basket". The HTR-fuel is very suitablefor such a timesaving and thus moneysaving treatment.
For the non-nuclear part the number of spare modules depends on the planned maintenanceof the modules themselves and the plant they belong to, the failure rate, the accepted time to re-place or to repair, etc., as discussed before. The minimum replacement time is most likely dictatedby the nuclear part of the installation which has to cool properly before the helium circuit can bemanaged and opened for the maintenance as described.
There is nothing new in using containerizing, modular constructions and palletization ofequipment. It is a well-known proven management technique. All gasturbines are modular of con-struction nowadays, all engineering plants have transport routes to replace and to transport heatexchangers, electromotors, generators, valves, control systems etc. for testing, maintenance, etc.,especially when the stop must be as short as possible to fit in with the industrial process. Whetherthe unit is called a container, a module or a pallet depends mostly on the size or the professionallanguage of the OEM and/or the owner.
121
Nvclear standards and norms.
Another tool to reduce the through life costing is the reconsideration of the existing nuclearnorms and standards. A lot of courage is needed for an operation like this. A comparable study hasbeen finished very recently by the Royal Netherlands Navy. The aim was to replace two very im-portant frigates within the shrinking defense budgets. It took 5 years and they considered very ca-refully but seriously the existing military norms and standards, international cooperation on R & Dand exploitation, modular building procedures to reduce building time, palleterizing of weapon andsensor systems, usage of aero-space technology where possible, using civil (a.o. ferries) experienceand by putting this question on every aspect "what will be the penalty if we do not apply the mili-tary norm or standard?" The result is shown in the graph in the appendix. The result was a biggership> win less crew, a bigger flexibility for future modifications to weapon and sensor systems,less R & D costs, no loss of employment, same speed and fuel costs, same through life costingand same through life support. See Appendix 1.
The market analysis for the Netherlands.
The first step was to study the existing market of fossil-fueled, gastnrbine driven plants intte Netherlands.
A prefered power range was established by analysing the total existing population of gastur-bine driven power plants for the markets as mentioned before. See appendix page 2-A
The next step was to take out the gasturbines used by electricity generating companies, deGasunie and oil companies. See appendix page 2-B.
Thereafter we had to establish the age of the existing plants.See appendix page 2-C.
The last step was to establish the shipping market.See appendix page 2-D.
During each step the philosophies of experienced users were taken into consideration.
The results of this market analysis are:
1. The 20 MWth installation is dominant as well for Co-generation as for ship propulsion.2. The total number for Co-generation is 75 units.3. There seems to be no market in this power range for stand-alone electricity generation or
heat generation in the Netherlands.4. The market for shipping (Dutch and Dutch Antillian flag) is 205 units.5. The replacement market will start to come into effect in about 2010.
Western Europe.
In Europe Co-generation, and thus nuclear CHP, has real possibilities for export, mainly be-cause of the positive effect on the production price in an industrial process. This is of special inte-rest to companies in countries with comparable salaries, because this gives the owner of a Co-ge-neration plant an advantage over his competitor. After all, separate generation of heat and electri-city is more expensive. In the open market this effect will be the main driving force behind theexport possibilities of Co-generation. Another positive force will be the lower burden on the envi-ronment as far as emissions of combustion gas and waste heat are concerned, as well as the highertotal efficiency of the Co-generation installations, although we are of the opinion that this issueplays a lesser role outside the Netherlands. The promotion efforts have not been very impressiveso far, but the Advisory Committee of the Ministry of Economic Affairs will start coordinating thepromotion efforts in 1997. When the realisation of any export could actually start, is difficult toestimate. There is, of course, a negative force in this process as well. In many countries the natio-nal power generating boards have and will try by all means to maintain their monopoly. This mo-nopoly can only be broken by pressure from governments as part of the open market policy.
122

The project bureau "Warmte/Kracht Koppeling" did a study on the export possibilities ofCHP (Combined Heat and Power) in Europe. An extract was published in the magazine "IPG -International Power Generation", issue September, page 38:
"The following are some recommendations for European and national government actions tounlock the potential for CHP, and given in descending order of importance:
Political will is needed to remove barriers and to provide a framework, giving clear oppor-tunities to those wishing to benefit from the development of high efficiency CHP systems.The efforts of the energy industries, in particular the electricity industry, to move from sup-pliers of energy to providers of energy services, including CHP, should be reinforced.Liberalisation in electricity markets can bring major opportunities for the development ofCHP through, for example, access to grid networks and the introduction of greater compe-tition in power generation.Under circumstances where the economical conditions are similar, priority should be givento CHP investment over a conventional plant.The intemationalisation of environmental costs in energy prices should be supported as amechanism for promoting CHP, while ensuring that industry and other energy users derivereal economic benefits from it.Member state governments and the EU as a whole should set ambitious but achievabletargets for CHP for 2005 and 2010.Wider efforts should be made to reinforce and develop CHP/DH networks at the urban level.
Such systems can be multi-fuel, offering significant economic flexibility."
The conclusions are mentioned here with the permission of the "Project bureau Warm-te/Kracht Koppeling".
Stand-alone electricity or heat production with an installation of 20MWth seems to be asmall market in Western Europe.
The possibilities in the market for shipping are comparable to the Dutch shipping market.
The market worldwide.
The possibilities for the export of a Nuclear Gasturbine Installation of 20 MWth around theworld do not differ widely from the possibilities in Europe, although the requirement for stand-alone electricity generation is much bigger. Diesel generators in the power range of 5 to 15 MWare in use on most islands around the world (such as Indonesia, the Phillipines, the Dutch Antilliesand the Seychelles) or in places were the investment in a distribution system is not very cost effec-tive or not feasable.
The market for the small HTR-GT is not only the replacement market for these diesel engi-nes but also occurs in areas where the supply of fossil fuel and/or the investment and maintenancecosts are a major factor in the cost of power generation and distribution. In other words, areaswith:1. a low population density, difficulty to maintain distribution systems and remote from a fossil
fuel supply.2. a high density of population and industry and remote from a fossil fuel supply or from the
sea or main rivers.
For die development of these markets priority should be given to areas where industry isvery much needed to create employment. In other words energy means employment, which leadsto economic growth.
Which application (stand-alone power generation, heat generation or co-generation) will bechosen, depends on die climate and/or die industrial process for which die installation is intended.
123

As mentioned before the number of diesel engines used for electricity generation in remoteand on islands is enormous. This is another huge potential market which should be develop-
ed.
The market for shipping.
The market for shipping has a very conservative and peculiar character. This has alwaysbeen the case and history teaches us that changes in the propulsion of ships have always beenemotional and have taken place in a relatively short time. This last aspect has mainly been causedby economic (smaller crews or better delivery schedules) or military reasons. So it is most likelythat history will repeat itself in this case. An additional negative force in this market is the reluc-tancy to accept nuclear driven ships in many harbours.
Conclusions.
Due to trends like "back to core business", future owners of an energy plant will increasinglylook for means to reduce costs of ownership in combination with guaranteed through life support.
The pooling-system satisfies these aspects to a great extent. For the design the tool of recon-sidering the existing nuclear norms and standards is absolutely necessary.
It should be pointed out that all the markets mentioned above, can best be opened by buil-ding a Nuclear Gasturbine Installation. This installation can prove and show time and time againthe inherent safety of the design to anybody. In this installation all the modem philosophies likemodular construction, containerizing where practical, remote control, easy to maintain, pooling-management system etc., are implemented, leading to an acceptable and understandable price.
The modular construction makes it possible to build and use the described HTR-GT installa-tions in even the most remote areas.
The HTR-GT fully satisfies the intentions to stop further climatic changes due to the CO2
emissions around the world.
124
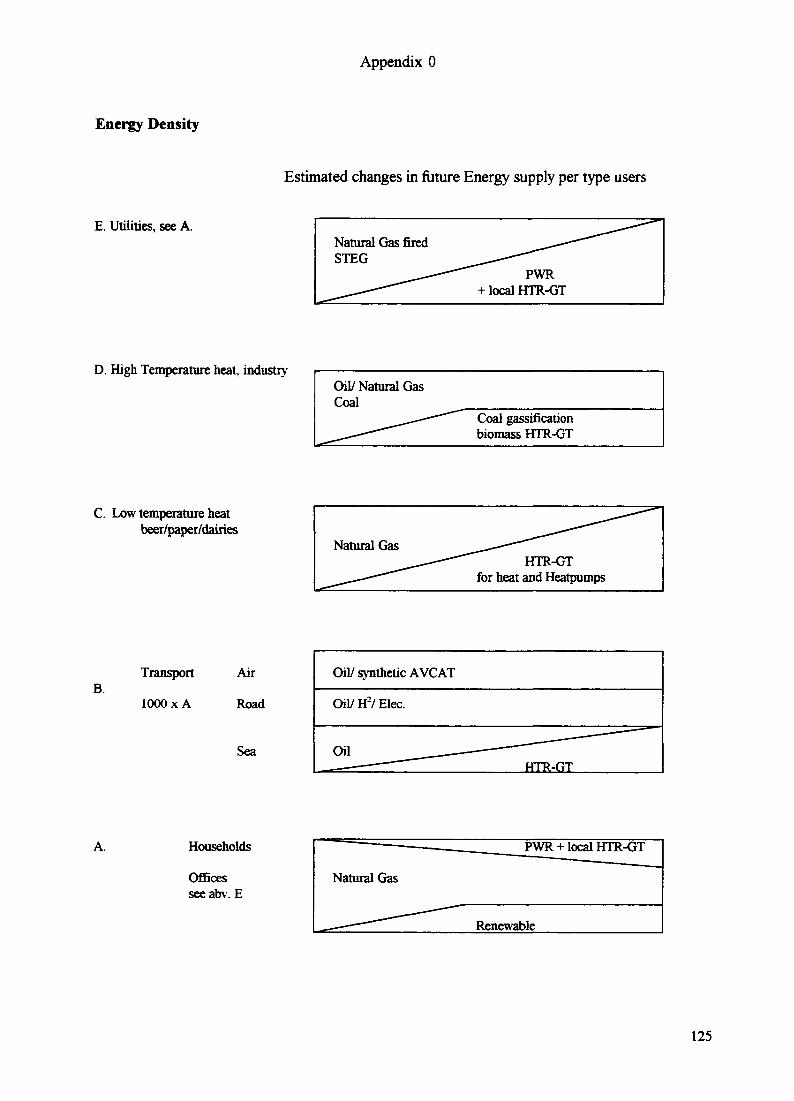
Appendix 0
Energy Density
Estimated changes in future Energy supply per type users
E. Utilities, see A.Natural Gas firedSTEG
PWR+ local HTR-GT
D. High Temperature heat, industryOil/ Natural GasCoal
Coal gassificationbiomass HTR-GT
C. Low temperature heatbeer/paper/dairies
Natural GasHTR-GT
for heat and Heatpumps
B.Transport
1000 x A
Air
Road
Sea
Oil/ synthetic AVCAT
Oil/ H2/ Elec.
Households
Officesseeabv. E
Natural Gas
Renewable
125

Appendix 1
Decrease of military norms and standards
126

Gasturbine population in the Netherlands
o o2 8MWth
D Combined cycle BSTEG unit D standalone electncity, heat or booster
121
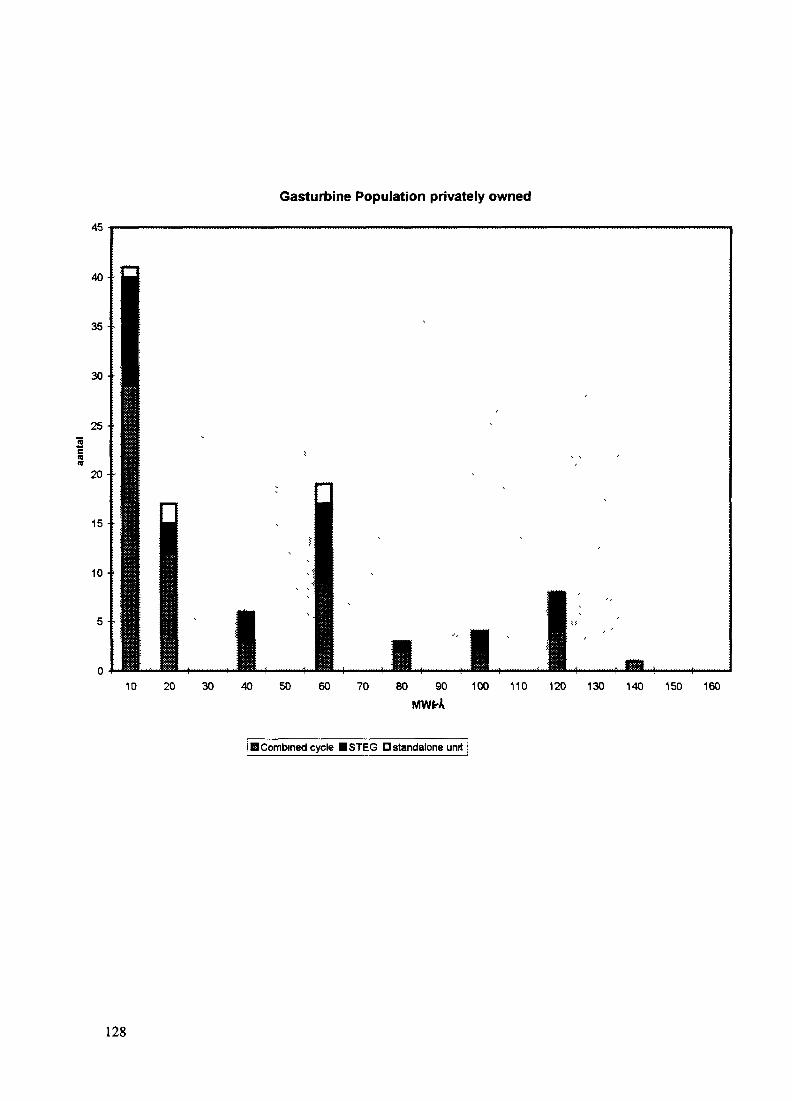
Gasturbine Population privately owned
10 20 30 40 50 60 70 80 90 100 110 120 130 140 150 160
i B Combined cycle BSTEG D standalone unit
128

Gasturbine population privately owned. Replacement market 40 years later.
10
years

•o3•oE.
5'
(DOr+O3"at3Q.
>sDl3
CO33-0)
i(DCD
APPROACH ON A GLOBAL HTGR R&D NETWORK XA9846676
W. VON LENSAKernforschungszentrum Jiilich GmbH,Jiilich, Germany
Abstract
The present situation of nuclear power in general and of the innovative nuclear reactor systems inparticular requires more comprehensive, coordinated R&D efforts on a broad international levelto respond to today's requirements with respect to public and economic acceptance as well as toglobalization trends and global environmental problems.
HTGR technology development has already reached a high degree of maturity that will be com-plemented by the operation of the two new test reactors in Japan and China, representing techno-logical milestones for the demonstration of HTGR safety characteristics and Nuclear Process Heatgeneration capabilities.
It is proposed by the IAEA 'International Working Group on Gas-Cooled Reactors' to establish a'Global HTGR R&D Network' on basic HTGR technology for the stable, long-term advancementof the specific HTGR features and as a basis for the future market introduction of this innovativereactor system.
The background and the motivation for this approach are illustrated, as well as first proposals onthe main objectives, the structure and the further procedures for the implementation of such amultinational working sharing R&D network. Modern telecooperation methods are foreseen as aninteractive tool for effective communication and collaboration on a global scale.
Introduction
Several industrial, national and international approaches to the market introduction of High-Temperature Gas-Cooled Reactors (HTGRs) have been undertaken in the past and are still goingon in different parts of the world with various time horizons and market sector targets. Up tonow, none of these stand-alone attempts have led to a commercial follow-up project, although thematurity of the HTGR technology has reached a considerable level and in spite of the importantknow-how that could be gained from operation of the test reactors (Peach Bottom, DRAGON,AYR) as well as from the demonstration reactors (Fort Saint Vrain, THTR) complemented bycomprehensive operation experience from other Gas-Cooled Reactors (GCRs).
This situation seems to be symptomatic of new nuclear reactor lines in particular as no innovativenuclear reactor system at all has overcome the threshold to commercial application in the last fewdecades anywhere on the globe. In the meantime it appears that also the introduced reactors haveto face stagnation, moratoriums and problems of economic and public acceptance in most indus-trialized countries, a far cry from the promising expectations of'pioneering times'.
Radical changes have been experienced in the structure of the nuclear industries in recent years,too. Former competing suppliers for the different national and international markets for nuclearpower plants have merged into international consortiums as 'global players'. And even the situa-tion of the utilities is going to change drastically mainly due to privatization and competition in theenlarged and interconnected electricity distribution networks.
131
Extremely low prices for fossil energy carriers combined with remarkable enhancements in theefficiencies of fossil-fired power plants generate additional economic pressure on existing and newnuclear power plants Together with time ranges being continuously extended for the reserves offossil energies, the 'classical' pro-nuclear argumentation based on anticipated price escalations andshortages of fossil energy carriers are being increasingly eroded in spite of growing awareness oftheir environmental impacts and their influence on climate change
The case for nuclear power has to be redefined within this 'changed world' in a realistic way, gen-erally and also separately for the different nuclear technologies An active response to the currentsituation and expected evolution is necessary and more appropriate than - passively - waiting forunfavourable developments in the energy market with, e.g, price jumps, shortages and the needfor drastic environmental regulations restricting the use of fossil energy carriers
Most of the important boundary conditions for the future of nuclear power are of a global natureor at least valid for many areas and countries in the world, because they are embedded in a moregeneral 'globalization' of problems as well as of economic relations and dependencies The latterwill be fostered by global information and (interdisciplinary) collaboration networks setting newhistorical milestones and chances for mankind
Against this more general background, today's obstacles and problems for nuclear power have tobe understood as challenges for further research and development (R&D) using all the potentialsof modern technology and the sound basis from R&D programmes and operational / manufactur-ing experience which is globally available for regaining economic and public acceptance
Globalization / internationalization of pre-competitive medium-/long-term R&D efforts, e g forinnovative nuclear reactor systems may also be an adequate response to the shrinking industrialinvolvement beyond short-term commercial projects and to the cuts in the national nuclear pro-grammes in many countries Besides that, such an approach will broaden the potential marketfrom the very beginning and stabilize the technology base for later use
The 'rules of the game' for real globalization of R&D in a work-sharing and complementary man-ner have not yet been established in general But it should be possible to create new collaborationstructures on a fair and collegia! base not only for distributing the efforts and development risksacross several 'shoulders', but also offering adequate benefits from the collaboration for all par-ticipants according to their contributions
The pooling of know-how and scientific / industrial capabilities on a broader international levelhas become easier than ever before by the effective use of recent telecooperation methods. Itseems to be essential to make extensive use of these new communication techniques in an interac-tive way to achieve 'living structures' that have the ability to grow into a pragmatic collaborationtool
Lessons from the Past
Especially in HTGR history there has been a confusing multiplicity of different technical concepts,projects and applications. This underlines, on the one hand, the impressive potential and flexibilityof this technology, but, on the other hand, valuable human and financial resources have beenwasted on this internal struggle for the best technical solution and thus also created a burden forthe reputation of HTGR technology
132

Passionate discussions on the differences and anticipated benefits of favoured technical or con-ceptional characteristics often concealed the overriding common elements, the common aims andthe common responsibility for the success of the development efforts.
It would be better for the future, first to reveal the common technical sources and the coherencesof the different approaches as a common, interconnecting technology base. Future projects canmake use of this and add the incremental, specific R&D and design work needed for a definiteconcept.
Sometimes HTGR projects have been propagated as alternatives to the existing nuclear reactortypes causing a lot of polarization and rejection within the nuclear community. It is more appro-priate to define HTGRs as complementary to the existing Nuclear Power Plants (NPPs) and theirevolutionary or more innovative derivatives with which HTGRs might establish future symbioses.
It should not be forgotten that the general safety philosophy of the HTGRs - rejected for a longtime by many proponents of active safety systems - has partially found its renaissance in manyadvanced NPP designs. And this is a very important contribution to the future of nuclear powerrepresenting a real success for HTGR development up to now. The former conflict between pas-sive and active safety systems has dissolved into a pragmatic coexistence of both safety ap-proaches.
Focusing R&D only on the requirements of a specific project often turned out to be a qualificationof'frozen' technologies impeding the development of innovative solutions due to fixed and ambi-tiously short timescales. Instead of this attitude there should be a balanced mix of on-going inno-vations and of short-term qualifications of practicable solutions to maintain enough flexibility toreact with innovative technologies to more stringent requirements concerning safety and economyas well as to actual chances for the market introduction. This view takes into account the fact thata nuclear reactor represents a combination of different technology elements/disciplines each hav-ing its own individual development potential following timescales that need not always fit the timelimits of specific projects although they might open up promising options for continuous innova-tion of the technology.
Bad experience was made in the total focusing of R&D and commercial efforts only on one proj-ect thereby coupling the fate of the whole technology to the success of a stand-alone project. Theestablishment in parallel of a more generic technology base programme with a long-term orienta-tion covering the essentials of the HTGR innovation potentials would help not only to conservevaluable know-how but also to supply necessary improvements for keeping pace with other tech-nologies. Such a technology base programme for HTGRs could have the same justification as e.g.R&D on fusion reactors, both offering safe, clean and reliable energy for different purposes as along-term option. But this approach needs a broader collaboration beyond purely national orcommercial programmes including all the partners within the HTGR community.
The aspects of 'spin-off and cross-fertilization might in future be even more important than in thepast, either to transfer HTGR technologies to other conventional and nuclear applications or toprofit from other developments outside the HTGR field. Why not use, for example, coated parti-cle technology for other reactor types as well or for the final disposal of problematic waste, takingall the benefits from an applied technique afterwards or in parallel for the HTGR? This wouldprovide an industrial background instead of an exotic atmosphere!
Possibly the most important lesson from the past is how to cope successfully with the problem offirst-of-a-kind (FODC) cost. Neither in the frame of national programmes nor in purely commercialattempts or in combinations of both, even with some bi- or international extensions, was it possi-
133
ble to proceed beyond the operation of test and demonstration reactors. The latter even beingsuch a financial burden for their utilities that both demonstration reactors (FSV, THTR) were shutdown before a long-term technology demonstration could be established for a commercial follow-up project. And this fate could not be excluded even for the smaller test reactors due to still verysignificant annual subsidies.
Broader structures are needed to divert the FOIK and the cost of pre-running R&D. Broaderscopes for the markets and economic incentives are needed to generate enough motivation forcommercial involvement. More stability is needed to provide more confidence for investors andpublic funds. Convincing R&D results are needed for the innovative systems complementing theuse of proven technology. Technological perspectives are needed to assure steady response tomore stringent safety and economic requirements in the future and to avoid technological dead-locks.
The Case for the HTGR
In the course of time, the main motivation arguments for HTGR development have shown somesignificant changes depending on the prevailing technical /political priorities, opinions, problems,economic assessments and perspectives of energy supply or availability of resources either fossilor nuclear.
Due to the flexibility of HTGR technology it was always possible to modify the HTGR conceptscorresponding to the shifts in the overall requirements, but this was often out of phase, reachingthe aim at the very moment when it disappeared, just as in the fable of the tortoise and the hare.
Today's requirements may be mainly governed by the aspects of
- public acceptance / coping with severe accidents- economics- waste handling- environmental protection / climate change, but- no anticipated energy resource availability problem for the time being.
The response to these aspects may be the key to the future of nuclear power and give additionaldrive, especially for the further development of HTGR technology.
The largest market for nuclear power is to be seen in those areas of the world that refused to buildNPPs in the last few decades either due to acceptability problems or due to high investments andlack of competitiveness with cheap fossil-fired plants. So, regaining public acceptance, while re-taining the economic goals, is an essentially commercial task opening a huge window outside thesaturated markets where nuclear power has already gained significant shares in energy generation.
The most convincing way to cope with severe accident scenarios might be to avoid them byphysical laws rather than to mitigate the consequences. It also should not be forgotten that theapplication of Nuclear Process Heat (NPH) in an industrial environment might only be acceptablefrom an industrial point of view if neither the high commercial investments nor the productionlines are endangered by accidents of the nuclear energy supply source. Industries and insurancesmight even ask for more stringent safety requirements than licensing authorities controlling com-pliance with legal standards to avoid catastrophic releases of radiotoxicity and relocations, also incase of hypothetical accidents.
134

Broadening the field of application for power plants by including heat utilization is in accordancewith the actual trend towards Combined Heat and Power (CHP) plants in the conventional energysupply area and is - by good reasons - very fashionable amongst environmentalists CHP maysignificantly enlarge the market for NPPs as well as their contribution to reduced noxious impactson the environment combined with improved economics. A specific 'claim1 for HTGRs can beassumed especially for high temperature ranges, gas turbine and process heat applications
Enhancing the thermal effectiveness and using CHP processes not only reduces power generationcost but also the relative waste production per unit of energy used This provides another argu-ment in favour of the HTGR, which might be a good candidate for burning of long-lived ra-diotoxic wastes and fissile materials, too
The concept of coated particles opens new options for an extremely high burn-up of such wastesavoiding further reprocessing in between The encapsulation of the fuel kernel enables the burnedfuel or wastes to be directly disposed, because this already represents an excellent barrier for finaldisposal beside its importance for the safety characteristics of the plant itself Thus, the technol-ogy of coated particles could represent a future alternative or complement to vitrification as wellas to the burning of MOX fuel in the present configuration, possibly having economic advantagesover multiple reprocessing and conditioning strategies
The market approach of standardizing modular reactors to power sizes that represent even adown-scaling compared to THTR and FSV keeps the technology within the frame of experienceBut this experience must be kept viable for commercial confidence in the new concepts'
Standardized modules also open up the potential of a quick learning curve and lower cost by theuse of proven conventional equipment and by series production that has not really been intro-duced in the nuclear field up to now on a broader scale comparable to the competing conventionalpower plants It is not only important to focus on 'revolutionary' technical concepts but also onrealizing new structures following general industrial trends
- A broadening of the market,- a consensual set of user/licensing requirements,- a fair and cost-effective sharing of the manufacturing efforts and- a broader collaboration in the R&D fieldon an international or global basis could represent important preconditions for the introduction ofthe HTGR as an innovative nuclear reactor system
Aspects of nuclear safety, environmental protection, long-term safety of waste disposal and af-fordable, reliable energy supply are really global aspects and challenges The HTGR has the abilityto respond to these requirements and it is an urgent task to find an appropriate and effective col-laborative strategy
The Need for a Global HTGR R&D Network (GHTRN)
In actual fact, there is a broad HTGR and GCR know-how basis available in different countries inthe world comparable or even superior to other innovative or evolutionary reactor developments,if it is be merged in a synergistic way on a global level Not only one new HTGR test reactor willstart operation within the next few years but also a second, both together offering an exceptionalR&D platform for the demonstration of HTGR characteristics under today's requirements of pub-lic acceptance and market conditions.
135
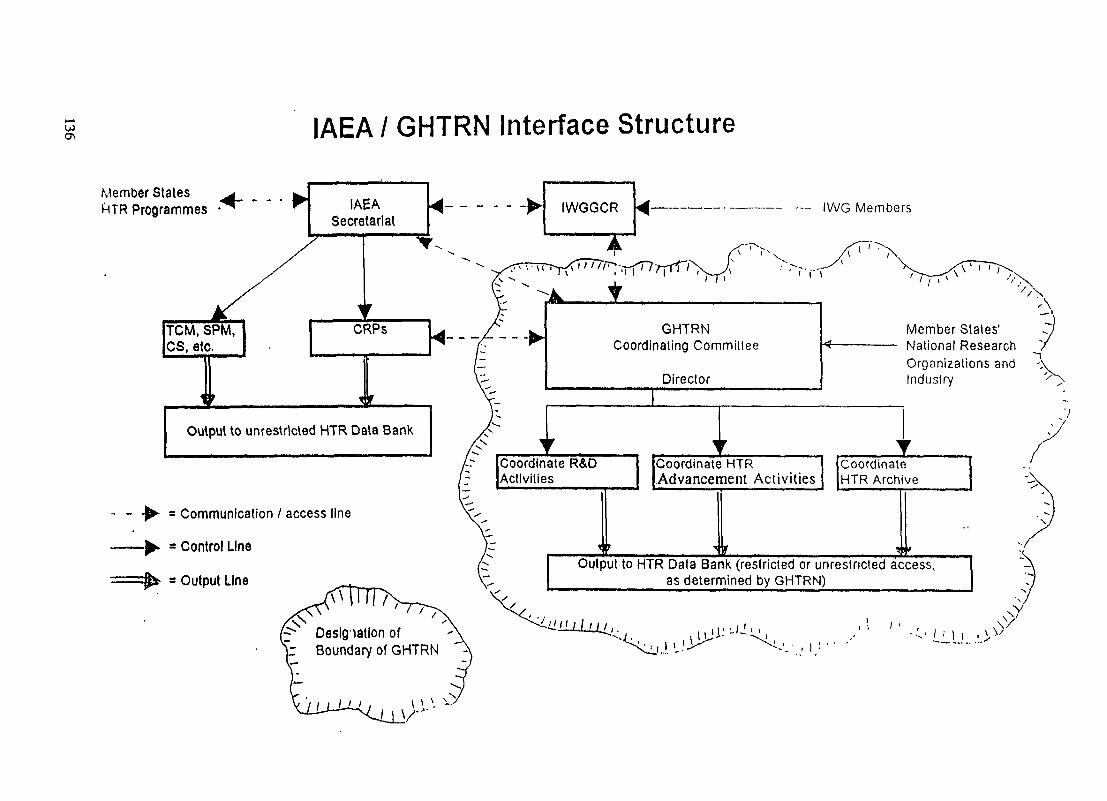
ON IAEA / GHTRN Interface Structure
Member StatesProgrammes • IAEA
Secretariat—.————...—.— .._ (WG Members
TCM, SPM,CS, etc.
CRPs
Output to unrestricted HTR Data Bank
GHTRNCoordinating Committee
Director1
< —————Member States'National ResearchOrganizations andIndustry
- - -j - = Communication / access line
——^ - Control Line1 "•"•$* * Output Line
Coordinate R&D Coordinate HTRActivities Advancement Activities
t r •< r
CoordinateHTR Archive
^ 9
Output to HTR Data Bank (restricted or unrestricted access,as determined by GHTRN)

Despite the small power sizes, these two reactors will provide a nearly full-scale demonstration ofthe passive safety philosophy of future HTGRs and for the first time high-temperature processheat will really be coupled out of a nuclear plant and will be combined with heat utilization sys-tems representing new milestones in the on-going history of nuclear technology!
But only the symbiosis of existing and coming know-how represents a convincing basis for futurecommercial applications of this technology. Reduced financial/political support for nuclear devel-opment programmes enforces a tighter and more effective collaboration of the reduced crews whoare still 'on board' globally sharing their know-how, infrastructures and facilities to achieve acommon aim.
First discussions - on a brainstorming basis - have been recently held as an outcome of the 13thIAEA International Working Group on Gas-Cooled Reactors (IWGGCR) and this discussion willbe continued to define a consensual approach to the general rules, purpose, scope, structures,contents and collaborative tools.
The first recommendations were to limit the scope to pre-competitive, joint R&D and project -independent basic technology aspects under the working title 'Global HTGR R&D Network(GHTRN)1 under the auspices of the IAEA for the peaceful uses of nuclear energy. Present andfuture commercial projects can make use of the accumulated know-how and infrastructure withinthe GHTRN under conditions still to be defined, but supportive of the market introduction ofHTGR technology.
It seemed to be appropriate to orientate the approach to the general structures and contracts ofthe 'International Thermonuclear Experimental Reactor (ITER)' Programme as it has a broad in-ternational partnership and also claims a long-term potential as an 'environmentally acceptableand economically competitive source of energy to be developed for the benefit of all humankind'.
On this basis, drafts for the General Charter of the GHTRN have already been formulated and thepurpose and overall programatic objectives defined:
- to establish a coherent global R&D approach on a work-sharing basis to make best use of exist-ing know-how, manpower, test facilities, test reactors, test object manufacturing capabilities etc.
- to provide a global information exchange, documentation and communication network onHTGR-related R&D
- to jointly review technological progress and to propose priorities as well as new R&D activiteson a common basis
- to acquire funding for joint R&D programmes by national / international governmental bodiesand private industries
- to serve as a stable, long-term R&D basis, independent of, and complementary to short-termHTGR projects and
- to generally promote the specific features and applications of HTGR technology worldwide
The IAEA is asked to play a strong role also in supporting the process of forming the GHTRNand to offer advice and provide infrastructures for different activities. Figure 1 illustrates prelimi-nary ideas on interactions between the IAEA and GHTRN.
137

First steps under the scope of the GHTRN could be, for example:
- to establish a worldwide overview of existing and on-going HTGR-related R&D and todefine common elements and work-sharing structures
- to perform joint test programmes and code validations using the existing test facilities andespecially the test reactors (HTTR and HTR 10) to complement operating experience withHTGRs
- to establish a systematic documentation of existing and future know-how also introducingmodern information techniques for ease of communication
- to create an information stock exchange as a pragmatic start-up and a know-how pool ongeneral HTGR technologies as well as proposals for communication with future commer-cial projects
It seems to be essential to apply recent telecooperation and archiving methods from the very be-ginning as these innovative tools are the driving force for globalization trends in general and ca-pable of handling more complex collaboration structures. They also enable an interactive growingprocess instead of a 'classical' centralized approach no one can afford any more. The HTGRshould also be present on the Internet to provide up-to-date information on progress to theHTGR community as well as to decision makers in politics and industries for generating additionalsupport and trust in the further development, benefits and chances of HTGR technology.
But the most important message of a 'Global HTGR R&D Network' on the common base tech-nology would be a signal to the world that the HTGR community is united in support of the fu-ture of this reactor type.
The report represents the author's personal opinion and need not necessarily coincide with theofficial governmental / institutional view in all aspects.
138

AN OVERVIEW OF THE LICENSING APPROACH OF THE XA9846677SOUTH AFRICAN NUCLEAR REGULATORY AUTHORITY
G.A. CLAPISSON, T.F. HILL, N.R. HENDERSON,N.H. KEENAN, P.E. METCALF, A. MYSENKOVCouncil for Nuclear Safety,Hennopsmeer,South Africa
Abstract
This paper describes the approach adopted by the South African NuclearRegulatory Authority , the Council for Nuclear Safety (CNS) in licensing nuclearinstallations in South Africa.
An introduction to the current South African legislation and the CNS philosophypertaining to the licensing of nuclear installations is discussed.
A typical process for granting a nuclear licence is then presented.
The risk assessment process, which is used to verify compliance with thefundamental safety standards and to establish licensing requirements for a specificnuclear installation, is discussed.
Based on the outcome of this assessment process, conditions of licence are setdown. The generic content of a nuclear licence and mechanisms to ensure ongoingcompliance with the risk criteria are presented.
The regulatory process discussed in this paper, based on such a fundamentalapproach, may be adapted to any type of nuclear installation taking into accountplant specific designs and characteristics.
1.0 CNS licensing philosophy
In terms of current national legislation, the Nuclear Energy Act No 131 of 1993,nuclear installations must be licensed by the national nuclear regulatory authority,the South African Council for Nuclear Safety (CNS). The legislation is broadempowering legislation, requiring licences to be subject to any conditions deemednecessary to ensure that the associated risk of nuclear damage remains consistentwith the criteria laid down by the CNS.
In the early 1970's when the Koeberg project was in the planning stage, theforerunner to the Council for Nuclear Safety established fundamental safetystandards [1] for the purpose of licensing Koeberg. The standards laid down wererisk based and the licensing approach adopted was to require that:
• the design basis of the plant should respect prevailing international normsand practices and,
139

• that a quantitative risk assessment should demonstrate compliance withthe CNS safety criteria.
As an example the design basis for the Koeberg nuclear power plant, was derivedfrom the international norms and practices applicable to a standard 900MwePressurised Light Water Reactor e.g US 10 CFR50 complemented by additionalFrench rules prevailing at the time.
The risks to the operators and members of the public posed by the installation,related to a range of identified initiating events and accident scenarios, wererequired to be assessed by way of a probabilistic risk assessment and to respectthe laid down criteria. The criteria were expressed in terms of individual risk andpopulation risk with a bias against more severe accidents. The assessment wasalso required to demonstrate on a deterministic basis that public and occupationalexposures arising from normal operations would be compliant with a dose limitationsystem employing dose limits of 250 jiSv and 50 mSv respectively and arequirement to maintain doses as low as reasonably achievable. In addition to therequirement to demonstrate compliance with the laid down safety criteria, theoperators are also obliged to establish and maintain a comprehensive emergencyplan.
A similar approach has been used in the licensing of the facilities of the AtomicEnergy Corporation.
The current applicable CNS nuclear safety criteria are documented in the CMSLicensing Document LD-1091 , which forms an integral part of the nuclear licencerequirements. A summary of the current CNS nuclear safety criteria is presented inTable!.
2.0 Typical CNS licensing process
The typical licensing process adopted by the CNS is indicated in Fig.1.
The first step triggering the licensing process is a formal application by a potentiallicensee, to the CNS, in accordance with the Nuclear Energy act.
Following the formal application by a potential licensee, a series of discussionstake place between all the relevant parties and the CNS to identify the range andtype of information necessary to ascertain the licensability of the activity. Thesediscussions typically take place at the conceptual/design phase to identify thedesign, construction and operational requirements in order to satisfy the CNS safetycriteria.
During this initial phase the potential licensee will be required to provide details insupport of the proposed nuclear activity to be undertaken. Likewise the CNS willprovide some appropriate licensing guidelines as indicated by A and B on Fig. 1.This will inter alia include the following:
1. the fundamental safety criteria
140

CONCEPTUAL/DESIGNPHASE
DOESACTIVITYREQUIRE
LICENSING1
POTENTIAL LICENSEE
NO FURTHER ACTION BY CNS
PROVIDE DETAILS IN SUPPORTOF PROPOSED NUCLEAR ACTIVITYTO BE UNDERTAKEN BY POTENTIALLICENSEE
PROVISION OF AP-PROPRIATE LICENSINGGUIDES BY CNS
*
•<-
SUBMISSION BY AP-PI ir ANT nf PROPOSED
SITE CRITERIADETAILS
<—
**"SXST
CNS IDENTIFIESTYPE AND RANGEOF INFORMATIONREQUIRED
FUNDAMENTALSAFETYSTANDARDS
BLICENSING PROGRAMME
SUBMISSION OF SAFETYASSESSMENT TO CNSBY LICENSEE
IDENTIFICATIONOF PROPOSEDLICENSING STAGES
QUANTITATIVE PROBABILISTICSTUDY BY LICENSEE(FREQUENCY/MAGNITUDE)
CONSTRUCTION/COMMISSIONING/OPERATION PHASE
CNS REQUIREMENTSIDENTIFIEDIDENTIFICATION OF
DETAILED INFORMATIONREQUIRED AT VARIOUSLICENSING STAGES
SUBMISSION OF DETAILED SAFETYASSESSMENT AT APPROPRIATESTAGE BY LICENSEE
_LMODIFICATIONSLICENCECHANGEREQUESTS. ETC
PROVIDE FURTHERDETAILS AS REQUIREDBY CNS
ISSUE LICENCE ORAPPROPRIATE STAGEVARIATION TO LICENCEOR CHANGE TO LICENCE
Figure 1 CNS licensing process
141

PROCESS DESCRIPTIONSOURCE TERM IDENTIFICATION/QUANTIFICATION
(LOCATION SPECIFIC)
IDENTIFICATION OFOPERATIONAL HAZARDS
DESCRIPTION OF ENGINEEREDPROTECTIVE FEATURES TOCONTROL NORMAL OPERATIONALHAZARD - DESIGN AND MODE OFOPERATION
IDENTIFICATION OFPOTENTIAL INITIATINGEVENTS
DESCRIPTION OF ENGINEERED SAFETYFEATURES TO MITIGATE INITIATINGEVENTS - DESIGN + MODE OF OPERATION
1ASSESSMENT OFNORMAL OPERATIONurSK
OPERATIONAL PROCEDURES
COMMISSIONING + QA 1ASSESSMENT OF RISKDUE TO ACCIDENTS
- PUBLIC• WORKER
- PUBLIC- WORKER
Figure 2 Risk Assessment Method
2. the identification of the type and range of infomiation required to assessthe risk to operators and members of the public under both accidentconditions and normal operations. Fig. 2 illustrates the method used toassess the risk.
Following the submission by the applicant of a proposed licensing programme,which identifies the various licensing stages, an intent document in the form of aPreliminary Safety Assessment Report (PSAR) will be submitted to the CNS. Thiswill, inter alia, include a quantitative probabilistic study.
The review of the PSAR and other supporting information will be used to ascertainwhether the activity is licensable. Typically this will mark the end of the conceptualphase and the start of the remaining licensing stages leading to eventualoperation.
For complex projects such as the licensing of the Koeberg Nuclear Power Plant, thelicensing process used by the CNS is a multi stage process. Typical primarylicensing stages are:
1. Nuclear installation siting2. Design of the installation3. Construction and commissioning4. Radioactive material/ nuclear fuel on site5. Start up/criticality (where applicable)6. Power raising (where applicable)7. Plants operations8. Decommissioning
142

Each stage of the process is supported by a safety assessment, including aquantitative risk assessment to demonstrate to the satisfaction of the CMS that therelevant CNS safety criteria are met.
3.0 Safety assessment philosophy
As indicated above a safety assessment is required for the approval of each stageof the agreed licensing programme. A typical safety assessment is based on threemajor elements which are closely interdependent:
1. Scientific and engineering principles2. Radiological protection principles3. A quantitative risk assessment
The type of information required at the various stages of the safety assessmentcovers a wide range of topics which inter alia include the following :
Site criteria detailsSeismic properties, weather statistics, demographic predictionsDesign drawings, specifications and supporting calculationsManufacturing/construction programmes and proceduresQuality assurance and control programmesCommissioning planOperating and maintenance procedure including accident managementTesting regimeOrganisational structures including staffing and trainingRadiological protection programme including waste managementEmergency planning programmePhysical security
3.1 Scientific and engineering principles
The licensing requirements, related to the engineering principles, are that thedesign basis and operating rules of the plant respect prevailing international normsand practices.
The basis for the engineering assessment is to respect the principle of defence-in-depth. Defence-in-depth is a concept which applies at all stages in the life of thefacility from design to decommissioning/dismantling. This principle consists ofrecognising technical, human or organisational failures and to guard against themby successive lines of defence.
There are several categories of lines of defence which can typically be divided asfollow:
• Prevention of failure• Monitoring or detection to anticipate/detect failure• Means of action or mitigation to mitigate consequences of failure
143

Likewise there are several lines of defence which are normally provided for eachcategory. Some typical examples are given below:
• Built in multiple barriers to limit the release of radioactive material into theenvironment
• Adequate safety margins in the design basis• Selection of adequate protection and safeguards systems• Diversity and redundancy of equipment• Choice of adequate materials and equipment• Adequate manufacturing requirements• Adequate rules for monitoring and detection• Adequate operating principles• Adequate organisational structures etc..
The relevant applicable measures, ensuring defence in depth, are defined andimplemented respecting acceptable rules, codes and standards based oninternational experience.
The number and properties of the barriers or lines of defence is commensurate withthe risk posed by the installation and also with the uncertainties associated with thedetermination of the risk.
3.2 Radiological protection principles
The safety assessment associated with any facility or practice is required toaddress four areas of risk which pertain to both the operator and members of thepublic under conditions of both normal operation and accidents. The principles ofradiation protection should be considered to be related to that part of theassessment which addresses normal operation. The two main principles ofradiation protection apply here having assumed that the practice has been justified.
• All exposures must remain below the annual dose limit• All exposures must be kept As Low As is Reasonably Achievable
(ALARA)
Notice should be taken of the reference to dose rather than risk in the assessmentfor normal operation where dose is regarded as a surrogate for risk. Furthermore,the circumstances under which this dose must be determined, must be limiting sothat operational flexibility is allowed and that it would be unlikely that the relevantlimits would be transgressed. In this way, the assumptions of the safety assessmentfor normal operation are deterministic as distinct from the probabilistic approachadopted for the assessment of risk due to accidents.
3.2.1 Dose Limitation To The Operator
In respect of dose limitation to the operator, it must be demonstrated that theannual individual dose limit for the operator of 50 mSv y*1 will not be exceeded. Noassessment can really predict what the annual exposure to any given operator willbe due to the uncertainty in how much time will be spent in each area and the
144

attendant uncertainty in doserate at any given time. Therefore, the assessmentmust demonstrate that a certain strategy of radiation protection provisions is inplace which encompasses both design and operation.
In terms of design, the facility is required to be segregated into zones of definedambient doserate, airborne and surface contamination on the basis of the locationof radioactive equipment, and limiting leakrates and source terms. Shielding andventilation assessments are conducted to identify the classification required for anygiven zone. Areas where the radiological hazard is subject to change are providedwith installed radiation monitoring to warn operators, and additional design featuresfor contamination control are implemented mainly on the basis of the need formaintenance and In Service Inspection.
The strategy of provisions which must be implemented operationally is known asthe operational radiation protection programme. This programme, must, in essence,be able to achieve certain fundamentals;
• The recognition and quantification of all potential and actual hazardsduring normal operation
• The prospective implementation of control measures to ensurecompliance with the dose limitation system
• The recognition and quantification of radiological hazards associated withabnormal situations and the implementation of appropriate radiologicalcontrols
The strategy of provisions which satisfies these principles will therefore identify andreview the magnitude of operator exposures on a continuous basis such as toensure compliance with the annual dose limit.
3.2.2 Dose Limitation To Members Of The Public
The limitation of dose to members of the public requires that the highest exposedmember of the public would not incur an annual dose in excess of 250 nSv y"1. Thetwo stage process of design assessment and operational control is implemented toensure compliance with the dose limit to members of the public.
In terms of the design stage, the annual liquid and gaseous effluent discharges arepredicted based upon the process of radioactive effluent and waste treatmentintended to be followed. From such an assessment, which traces the migration ofradioactivity from its point of origin, to point at which it will be discharged, allradionuclides and their associated discharge quantities can be identified usinglimiting assumptions which are chosen judiciously in order not to compromiseoperational flexibility. Dose conversion factors for all identified radionuclidesdischarged into both transport pathways can then be calculated by use of liquid andatmospheric dispersion codes, and the use of site-specific input data. The impact ofthe discharges can then be assessed at the design stage and compared to theannual dose limit to determine whether they are acceptable or whether modificationof the waste treatment systems or processes is required.
145

Once consolidated into an agreed figure for all radionuclides of concern, the controlof annual discharges of radionuclides themselves provide a surrogate for thecontrol of dose. The operational programme which is implemented in this regard isknown as the effluent management programme and is closely linked with the designassessment. Radiological effluent which originates from systems which arepotentially highly contaminated are discharged in batches only after radionuclide-specific analysis. Where the potential is lower, discharges are allowed on acontinuous basis and sampled, for confirmation, as a composite. In this way, doseto members of the public is also assessed and reviewed on a continuous basissuch as to ensure compliance with the annual dose limit.
3.3 Quantitative risk assessment principles
The acceptability of the design basis and general operating rules is evaluated bymean of a quantitative risk assessment, performed by the licensee, to verify thatthe proposed installation complies with the fundamental safety criteria of the CMS.
The philosophy adopted by the CNS is that a risk assessment is necessary tomaintain a clear perspective on the fundamental objectives of nuclear regulation,namely to protect the public and plant personnel from the risk of nuclear accidents,and a means of assessing the extent to which these objectives are being achieved.
TABLE 1. Fundamental safety standards of the CNS
ASSESSMENT TYPEPOPULATION
AVERAGE:
INDIVIDUAL-
PLANT PERSONNEL
AVERAGE:
INDIVIDUAL:
ACCIDENTS
PROBABILISTIC
10"* fatalities/person/annum (per site)
5 x 10"6 fatalities/annum
10'5 fatalities/annum
5 x 10's fatalities/annum
NORMALOPERATIONDETERMINISTIC
Controlled by limitation ofindividual risk
250 nSv/annum
Risk controlled by theoperational radiationprotection programme
146

For this reason the licensee of a nuclear installation is required to perform andmaintain a quantitative risk assessment, approved by the CNS, to demonstratecompliance with the fundamental risk criteria laid down by the CNS. These includethe probabilistic criteria given in table 1, and a bias against larger accidentsapplicable to risk to the public. These criteria are applicable to the licensed site,including all activities on the site and interactions between them.
Regulatory control on the development, updating and application of the PRA isexercised by means of the licensing document LD-1091 to ensure that the PRA ismaintained valid, reflects the current status of the plant, includes local andinternational experience feedback, and is used for decision-making on safetyrelated matters including plant safety improvements, risk management, limitationson urban development and emergency planning.
In addition to the use of risk criteria, safety indicators at different levels (such ascore damage frequency, containment failure probability etc) are used for decisionmaking in support of the principles of defence-in-depth and ALARA.As regards risk to the public, the principle stages of a risk assessment for a nuclearpower plant are illustrated in figure 3.
As the risk assessment is formally approved by the CNS and is effectivelycontrolled by the nuclear licence, it serves as a valuable framework for focusedtechnical discussions with the licensee on safety related matters.
Historically, numerous requirements have been imposed on licensees based on thefindings of the various plant-specific risk assessments. These include hardwaremodifications, procedural and management improvements. In addition, specificlicence conditions have been established or relaxed on the basis of a riskassessment. The risk approach to nuclear regulations in South Africa is presentedin more detail in [2].
4.0 The Nuclear Licence
Based on the outcome of the safety assessment, a nuclear licence is granted.Conditions of licence are generated to ensure compliance with the laid down safetycriteria.
According to the multi stage process, described in fig.1, a variation of a specific sitelicence will be issued at each stage following the review of the specific stage safetyassessment. Conditions of licence are then amended accordingly.
A typical licence for a fully operational nuclear power plant will include the followingconditions:
• a valid plant description and configuration to be maintained together with amodification control procedure;
• the maintenance of a valid and updated risk assessment;
147

oo
SafetyIndicators
Criteria/Goals
INPUT
PRE-CURSORS
OccurrenceData
INITEVENTS
~ 50 lEs
LEVEL 1EVENT TREE
—
•M^B
•••M
PDS
72 PDSs
PDSFREQU.
CMF
DerivedGoals
Fragility Data Ace. Procs.Component Reliability OTSHuman Factors Maint. Sched.External Data Outage PlanningTransient analysis
CONTAINMENTEVENT TREE
——
m^mm
i^^^m
BIN
18BINS
BINFREQU.
CCFP
DerivedGoals
Severe AccidentManagement GuidesHuman FactorsSevere Ace. Issues
fis^>&<IND. RISK 1 "*""***t'»te
OPER. RISK 1 ^N--
CNS Risk Criteria
Emergency PlanningUrban DevelopmentSiting of Facility
FIGURE 3. PRA stages, criteria and data

• establishment and compliance with operating technical specifications;
• normal operations, incident and accident procedures;
• an in-service inspection programme;
• a maintenance programme;
• an operational radiation protection programme;
• a waste management programme;
• an emergency plan;
• a routine and occurrence reporting programme;
• a quality management programme;
• reports, approvals
Changes to the issued and approved licence, or addition to an existing installation,must be requested by the licensee, for the approval of the CMS. This request mustbe supported by a safety assessment including a risk assessment, which is basedon the principles detailed above.
4.1 Compliance with risk criteria
Once the licence is issued it is necessary to ensure that the conditions of licenceare complied with. Although it is the responsibility of the licensee to ensure that thisis accomplished, the CMS generates an independent compliance inspectionprogramme which covers most of the licence conditions.
4.1.1 Licensees responsibilities
In conformance with the conditions of licence, a monitoring programme isimplemented by the licensee, and regularly assessed by the CMS, to verifycompliance with the risk criteria on an-on going basis. The major elements of thisprogramme are described below:
• Plant Operational Feedback
• In Service Inspection Programme (ISIP)
• Maintenance and Testing Programme
• Occurrence/Incident Reporting and Analysis including trending
149

* Hardware and Procedural Modifications
» Emergency Planning Exercises
* Quality Assurance Audits
* International Experience Feedback Analysis
4.1.2 CNS surveillance and compliance inspection programme:
Complementary to the licensee's monitoring programme, a comprehensiveindependent surveillance and compliance inspection programme is developed bythe CNS to verify compliance with the licence requirements and to identify anypotential safety concerns. Most licence conditions are subjected to the inspectionprogramme, which is implemented by the CNS staff. Some of the major topicscovered by this programme are :
• occurrences/incident assessment and trending• monitoring of selected safety related systems e.g ventilation, fuel handling
equipment, electrical power supplies, effluent discharge control systemsetc
• compliance with the installation operating technical specifications• operational radiological protection e.g occupational and public exposures,
environmental monitoring• emergency plans• maintenance and ISI activities• physical security• quality assurance audits• staff training• reactor plant operator examination and licensing
Complementary to this on going safety review, the CNS also requested theKoeberg nuclear power station to carry out a periodic safety review. The rationale,objectives and methodology of this periodic safety review are presented in detail in[3].
5.0 Conclusion
This overall licensing process has been successfully applied to the licensing ofcomplex projects such as the Koeberg nuclear power station, and also to othernuclear installations in South Africa e.g the Atomic Energy Corporation (AEC).
The CNS view is that this approach, which maintains a clear logical link betweenthe fundamental safety criteria and the plant specific design and characteristics,may be applied consistently to reactor designs other than light water reactors.
150

REFERENCES
[1] SIMPSON, D.M., et al.f Population Dose Evaluation and Standards for man andhis Environment (Proc. Symposium Vienna, 1974) IAEA-SM-184/31
[2] HILL, T.F , Risk Approach to Nuclear Regulations in South Africa presented atthe "Executive Meeting on Risk Based Regulations and Inspections" StockholmSweden , 12-14 August 1996.
[3] CLAPISSON, G.A., et al., Activities of the South African Regulatory Authority inthe Safety Review of Nuclear Power Plants presented at the InternationalSymposium on Reviewing the Safety of Existing Nuclear Power Plant (Vienna1996)IAEA-SM-342/68
NEXT PAGE(S)l»ft BLANK

DEVELOPMENT OF THE PEBBLE BED MODULARREACTOR PLANT IN SOUTH AFRICA
NEXT PAGE(S)toft BLANK

XA9846678TECHNICAL STATUS OF THE PEBBLE BED MODULARREACTOR (PBMR-SA) CONCEPTUAL DESIGN
M. FOXIntegrators of System Technology Ltd,Waterkloof, South Africa
Abstract
The reactor study is well underway seen from a broad spectrum of disciplines and technology.The objective power output with a high efficiency direct cycle power conversion unit remainspromising after compiling the first critical analysis of the core and the power conversion unit.The stability and controlability of the system are demonstrated by the engineering simulator.
The main system and components are basically specified for costing purposes. A first plantlayout has been completed demonstrating the positions of main components, personalmovement, installation methods for large components etc.
A cryptic report style presentation includes study opjectives, indicating guiding documents, givingan overwiew of design and analyses work done as well as a few sketches and diagram areincluded in this paper. Most of these sketches and diagrams are small replicas of large drawingsand are therefore not readable but can be used as references.
1. OBJECTIVE OF STUDY (CONCEPTUAL DESIGN)
The following technical and economical questions have to be answered before anyrecommendations can be made.
Technical Feasibility:
• Can we achieve a sufficiently high reactor power output within the required safety criteria?
• Is the Brayton Cycle with three separate shafts stable? (See attached .diagram (1))
• Can we fullfill the clients operational requirements (operating profiles)?
• Can we prove high system efficiency claimed for HTGRS worldwide?
• Is this reactor as safe as internationally claimed (Is it inherent-, passive- and catastrophyfree/safe, is it licensible)?
• Is the technology basis, internationally seen, to such a standard that basic research anddevelopment is not required and that a first-off full scale plant can be constructed directly asreference plant?
• Is modularization possible?
Economic Feasibility:
• Can we achieve the capital cost objectives for first-off, pre-production and production units?
• Is operational cost within the owners requirement specification?
• Is the owners investment protected by the said safety characteristics?
155

2. WORK PLANNING
The execution of work to meet the study objectives is basically captured in threediagrams, i.e.
The Acquisition Plan indicating: (See attached Figure 2)
0 The global plan (long term planning)
0 The prototype plant design and construction plan.
0 The detailed conceptual design (1996 study) activities including milestones,milestone documentation and design reviews. (See attached Figure 3)
MAIN POWER SYSTEM SCHEMATICFIG. 1
156

HQIES.
A) Global Plan.
£
B) PBMR Prototype
C) CONCEPTUAL DEStCM
PBMR ACQUISITION PLANFIG. 2
- 1ST Sy«<m • Cn« (T** tnlvqrator)• PCU *«rti pK^ef* lM4*r• Contral/«mMl<it<an CM* UtOwkal Ertq from 151
») Safely CtanffleaUan and DM*OO
KfprM*n(«tfv« of at Itafor pwVw krvoNW
• rmamiian of AMumptrtM
ot at Uofor partM ImvKvd
Concept Dw«• Lo>cvl• Crltkol
- U«U- Softly
n «f Dot* B««>* Coitlng PVm
41
H*er*»*ntatjv* ot a* llaj
• Accuracy 01 D*«>gn• Accuracy of Co*llna.
tf t«r toputo for Totiino Ceanomie f
• Mon KM,. Output ff«»drt• Final iff*** U> TKMM Eewtttnlc fteport• Cribcol Ai»a/H«m U«t
n of Futura Stud-ti (Cnbcal ATM*)
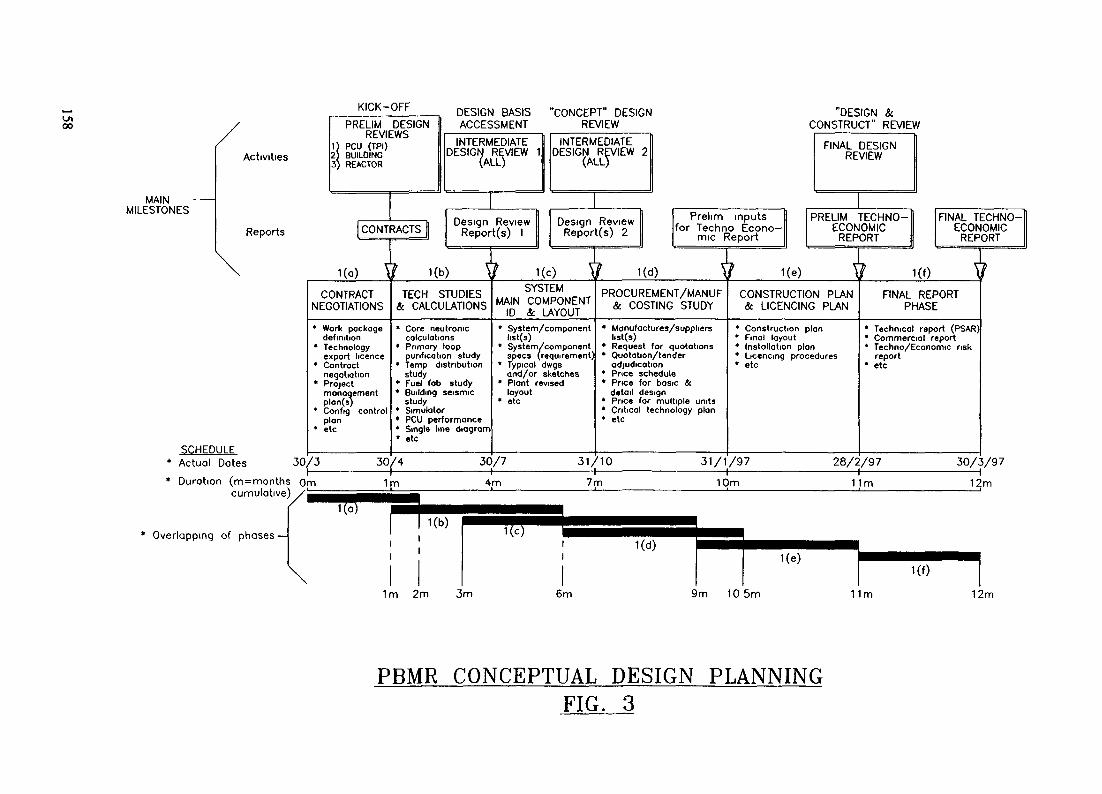
KICK-OFF
MAINMILESTONES
Activities
Reports
DESIGN BASIS "CONCEPT" DESIGN DESIGN &
SCHEDULEActual Dates
Duration (m=months Omcumulative) /•
Overlapping of phases —
PRELIM DESIGNREVIEWS
1) PCU (TPI)2) BUILDING3) REACTOR
CONTRACTS |
Ha) XCONTRACT
NEGOTIATIONS
* Work packagedefinition
* Technologyexport licence
* Contractnegotiation
* Projectmanagementplan(s)
* Config controlplan
* etc
30/3
r Kt
ACCESSMENTINTERMEDIATE
DESIGN REVIEW 1(ALL}
Design ReviewReport(s) 1
) {TECH STUDIES
& CALCULATIONS
* Core neutroniccalculations
* Primary looppurification study
* Temp distributionstudyFuel fob studyBuilding seismicstudySimulatorPCU performanceSingle Ime diagrametc
REVIEW
INTERMEDIATEDESIGN REVIEW
(ALL}
Design ReviewReport(s) 2
1 1(0 ISYSTEM
MAIN COMPONENTID & LAYOUT
* System/componentlist(s)
* System/componentspecs (requirement)
* Typical dwgsand/or sketches
* Plant revisedlayout
* etc
30/4 30/7
f 1
2
(d )
Prelim nputsfor Techno Econo-
mic Report
* ,<.,PROCUREMENT/MANUF
& COSTING STUDY
* Manufactures/suppliersl,st(s)Request for quotationsQuotation/tenderadjudicationPrice schedulePrice for basic &detail designPrice forCriticaletc
31/10
multiple unitstechnology plan
CONSTRUCT" REVIEW
FINAL DESIGNREVIEW
PRELIM TECHNO-ECONOMIC
PFPAPT
\
CONSTRUCTION PLAN& LICENCING PLAN
ConstructionFinal layout
plan
Installation planLicencing proceduresetc
31/1/97
FINAL TECHNO-ECONOMIC
r\L,r^\jr\
? KO VFINAL REPORT
PHASE
• Technical report (PSAR)* Commercial report• Techno/Economic risk
report* etc
28/2/97 30/3/97
1m 4m 7m 10m 11m 12m
1(b) 1(c)1(0)
KO
1m 2m 3m 6m 9m 105m 11m 12m
PBMR CONCEPTUAL DESIGN PLANNINGFIG. 3
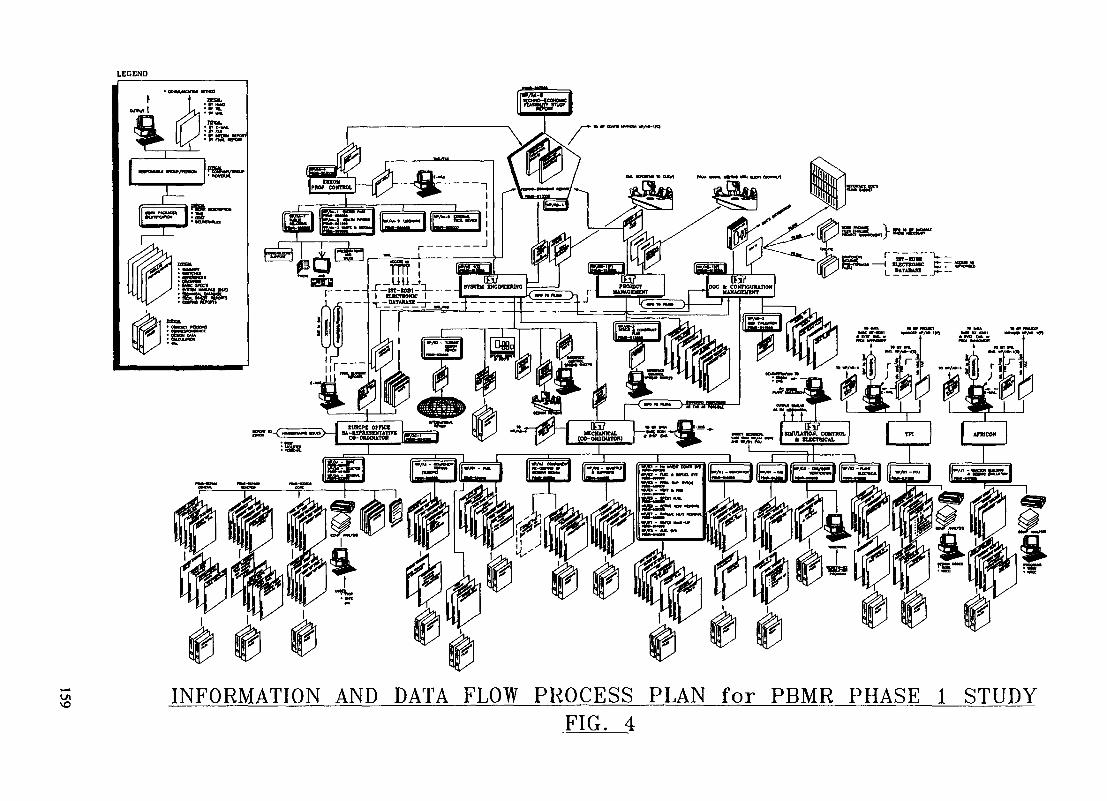
LEGEND
VO INFORMATION AND DATA FLOW PROCESS PLAN for PBMR PHASE 1 STUDYFIG. 4

The Information and Data Flow Process Plan indicating:(See attached Figure 4)
0 Flow of specialist data through the Systems Engineering and configurationmanagement to the Final Report.
0 The use of communication methods e.g. paper copies, E-Mail, and Internetfiles.
0 Day-to-day database and system design data (System Manuals).
0 Licensing and international design reviews, etc.
Work Breakdown Structure indicating:
0 The Architect Engineering responsibilities.0 Other work packages and responsible parties.
3. THE WORKING TEAM
Presently a wide range of engineering disciplines are involved (excluding majormanufacturing companies contribution):
Discipline
• Management, Promotion andMarketing
• Reactor Physics includes coredesign, shielding etc.
• Mechanical Systems & components
• Electrical and Control
• Fuel
• Simulation
• Special Materials Studies
• Reactor Building
• Safety and Licensing
• Documentation/Data Control
TOTAL
LOCAL
Full time
1
1
4
2
2
1
1
12
Part time
2
3
2
3
2
2
3
2
1
20
OVERSEAS CONSULTANTS
2
5
4
2
2
15
A total of 47 technical and management, plus 3 administrative people involved, of which alltechnical people have vast nuclear experience.
160
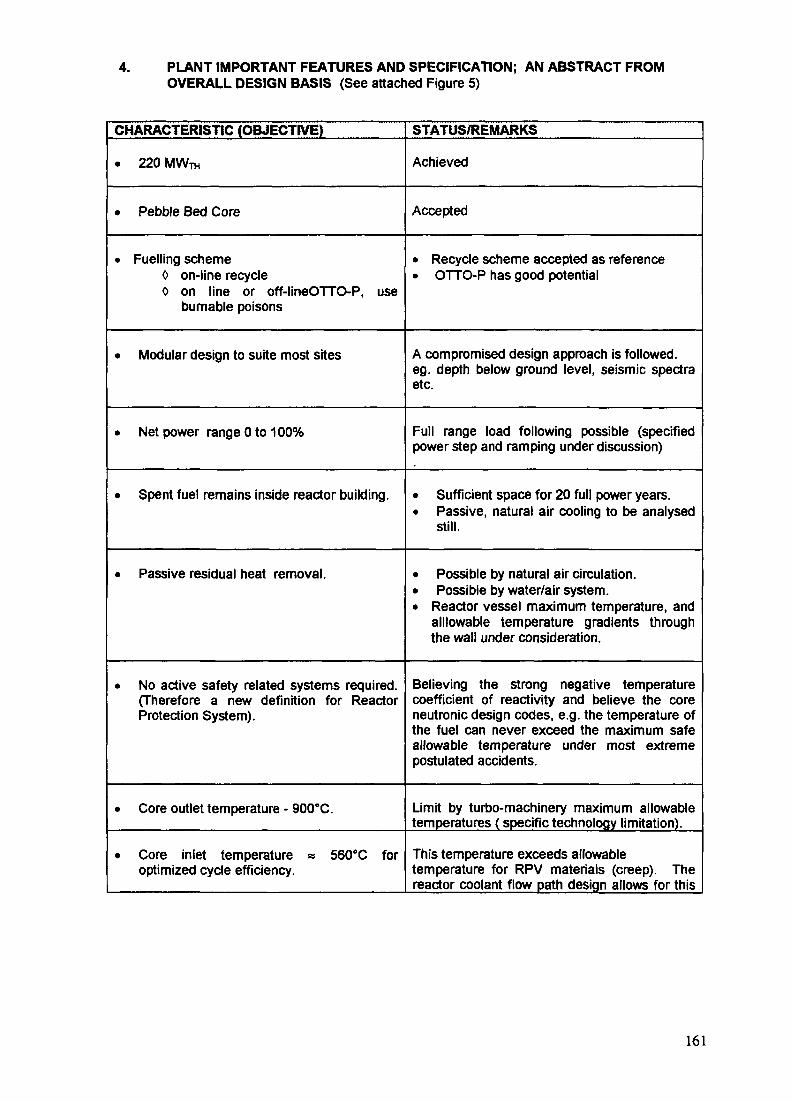
4. PLANT IMPORTANT FEATURES AND SPECIFICATION; AN ABSTRACT FROMOVERALL DESIGN BASIS (See attached Figure 5)
CHARACTERISTIC (OBJECTIVE) STATUS/REMARKS
• 220 MWTH Achieved
• Pebble Bed Core Accepted
Fuelling scheme0 on-line recycle0 on line or off-lineOTTO-P, use
burnable poisons
• Recycle scheme accepted as reference• OTTO-P has good potential
Modular design to suite most sites A compromised design approach is followed,eg. depth below ground level, seismic spectraetc.
Net power range 0 to 100% Full range load following possible (specifiedpower step and ramping under discussion)
Spent fuel remains inside reactor building. • Sufficient space for 20 full power years.• Passive, natural air cooling to be analysed
still.
• Passive residual heat removal. Possible by natural air circulation.Possible by water/air system.
Reactor vessel maximum temperature, andalllowable temperature gradients throughthe wall under consideration.
No active safety related systems required.(Therefore a new definition for ReactorProtection System).
Believing the strong negative temperaturecoefficient of reactivity and believe the coreneutronic design codes, e.g. the temperature ofthe fuel can never exceed the maximum safeallowable temperature under most extremepostulated accidents.
Core outlet temperature - 900°C. Limit by turbo-machinery maximum allowabletemperatures (specific technology limitation).
Core inlet temperature » 560"C foroptimized cycle efficiency.
This temperature exceeds allowabletemperature for RPV materials (creep). Thereactor coolant flow path design allows for this
161

high temperature return gas.
• Reactor vessel operatestemperature. (120°C)
at low Introduce recuperator bypass for coolingpurposes. This results in poor efficiency at lowinventory operation.
System maximum pressure = 70 bar Followed world trends. Cost vs. pressureoptimization is not done.
Minimum absolute pressure variation in theAlternator compartment.
Achieved by orientation of power turbine toensure minimum abs. pressure at shaftLabyrinth seal. This principle may changebecause of other considerations.
• All magnetic bearings. He cooledNo oil.Low maintenanceBehaviour under environmental conditionsto be investigated.
Water ingress into reactor impossible. Cooling water pressure always lower thanprimary loop helium pressure underoperational conditions.Total water inventory can be collected in theheat exchanger pressure housings.
Easy access to first turbine and generator. Housed in pressure containing housings (bells)which can be removed fairly easy. Couplingsto pipes under investigation, e.g. for ease ofremoval.
Design approach based on "many-off andcontinuous production.
Short construction time. Equipment grouped as modules, mounted onski's and factory tested.Civil construction after installation of equipmentshould be avoided.
• Installation and maintenance equipment tobe shared between units.
Capital cost for these equipment sharedbetween units.
Reactor building to be a low pressureconfinement
• A proper containment building is notrequired.____________ __
162

Break disks with large flow filters provided(Provide for blowdown accident)Building act as energy absorber foraeroplane crash. Penetration oflarger/faster aeroplane componentspossible. The reactor pit is the ultimatebarrier.
A gaseous waste system not required This topic is under discussion.
5. MAIN GUIDANCE DOCUMENTS
Apart from the Work breakdown structures, Hardware breakdown structures, time schedules etc.,the following technical documents were compiled:
TOPIC PURPOSE STATUS
Technical Description. Consolidation of 1995discussions.
Outdated.
Quality Assurance Plan for thePBMR-SA.
Acquisition, information anddata flow plans for theconceptual design study.
Active.
Overall plant Specificationand Interface ControlDocument.
Quick reference of the plantcharacteristics and changecontrol thereoff.
Active.
Index of Techno-EconomicFeasibility Study Report.Volume 1 - CommercialVolume 2 - Technical
Description
Done
Design bases for most of thesystems and maincomponents.
Input for conceptual design ofsystems and components.
Done
PLANT OVERALL PROCESS AND LAYOUT.
Overall process diagram has been developed.(See attached Figure 6)
The systems have been functionally grouped for example
a) Active Heat Removal includes all active heat removal functions.b) Main Power System includes all primary components needed for prime power
production (this includes the alternator).c) Helium Inventory Control System includes helium make-up, primary loop cleanup and
inventory control etc.).
163
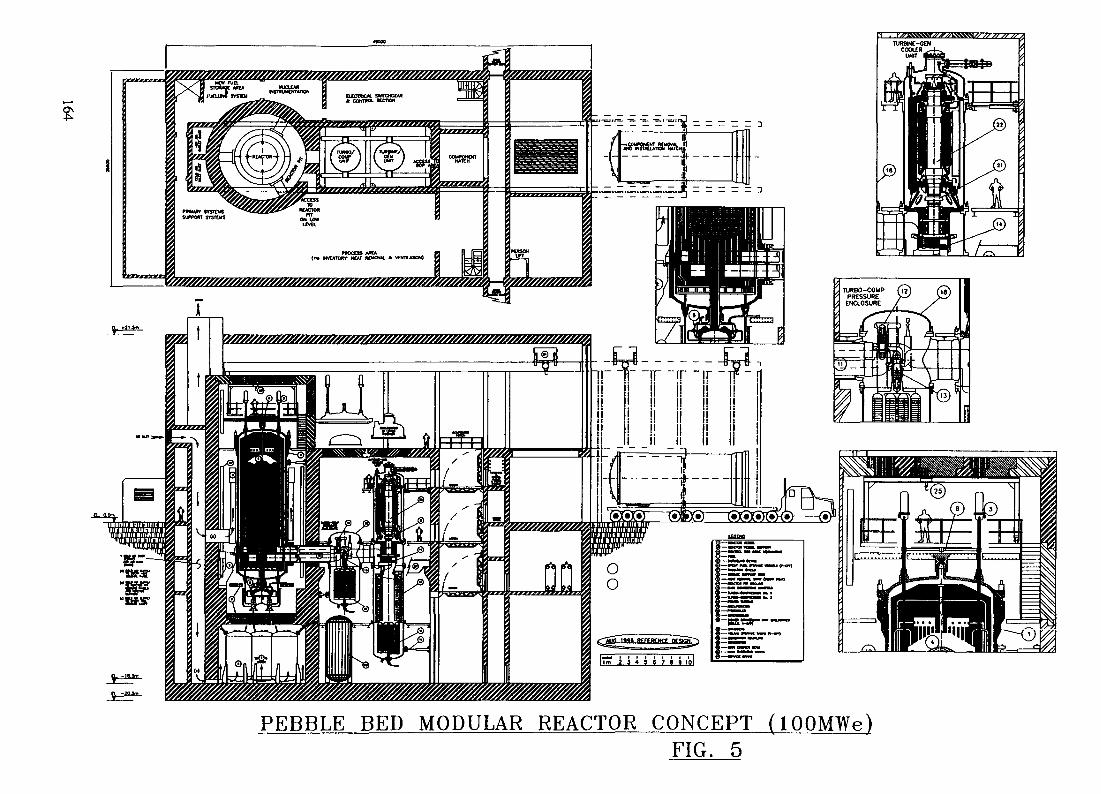
igggiiiigggiiiga^^ Y/////S/////////S.
YSSSSSSS/SSSSS/SSSSSSSSSSSSSSSSSSSSSSSSSSSSSSSSSSSSSSSSSSSSSSSSSSSSSS,TURBO-COUP
PRESSUREENCLOSURE
17m* 2 3 4 5 g 7 a 9 101
fl_ 0.0t
PEBBLE BED MODULAR REACTOR CONCEPT ( IQOMWe)FIG. 5

CHWCC3 TO THC PAEVKKJS ISSUt-• KCVCUNC Of F\JR. (SEE ZOMC 2 FUEUJNC SO4EHI)• MYUTPU SU»U£H SPENT FUa TWK9• JET PUMP M KM mssunc wwmoH• M* HJCCnON M GENERATOR COUPMmiEHT• REWTOR PRESSURE ZONE SEPMUDON
UPOAIED Hi MVCMORT COMTMOt TfSTEM
Ut PBMR - OVERALL SCHEMATIC DIAGRAMFIG. 6

o\ON
f/%0ZmM0%%&%0%l%Mf^^ g
PBMR-SA PEBBLE BED REACTOR VESSEL INSTALLATIONFIG. 7
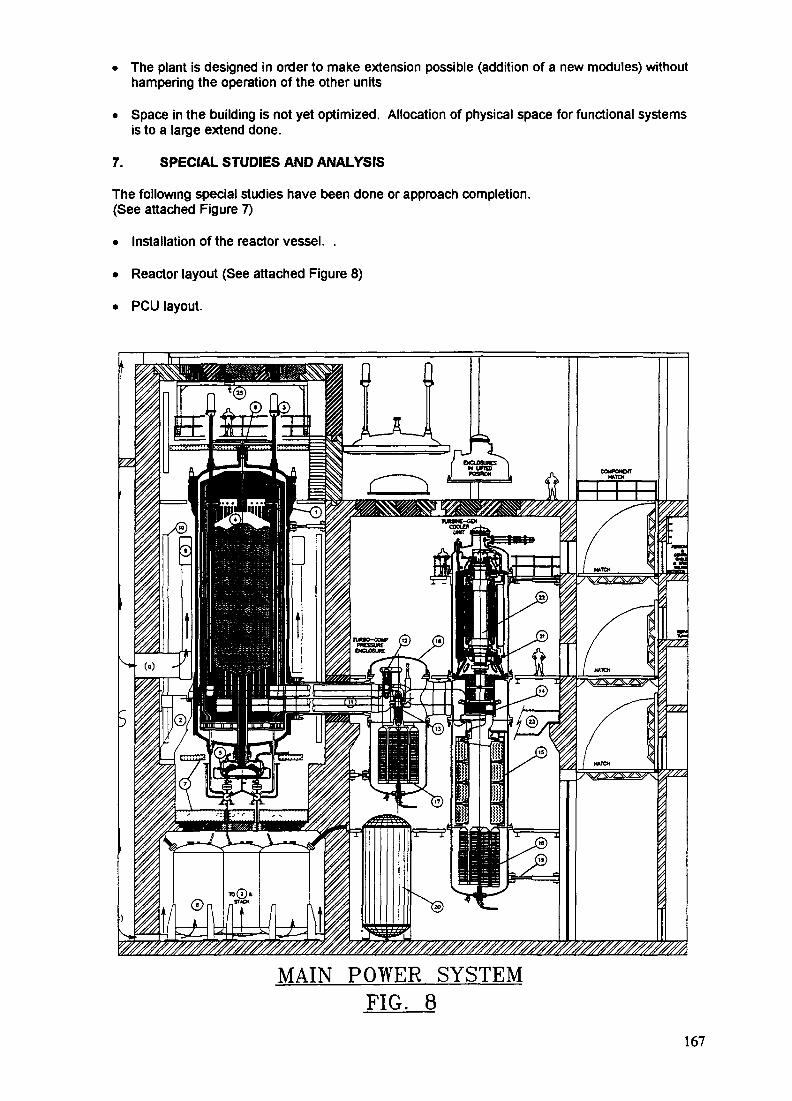
• The plant is designed in order to make extension possible (addition of a new modules) withouthampering the operation of the other units
• Space in the building is not yet optimized. Allocation of physical space for functional systemsis to a large extend done.
7. SPECIAL STUDIES AND ANALYSIS
The following special studies have been done or approach completion.(See attached Figure 7)
• Installation of the reactor vessel. .
• Reactor layout (See attached Figure 8)
• PCU layout.
MAIN POWER SYSTEMFIG. 8
167

COOLING WATERCONNECTION
EXITER UNITRADIAL SUPPORT
MAGNETIC BEARING
HEAT EXCHANGER
AXIAL/RADIAL.CATCHER BEARING
AXIALCATCHER BEARING'
POWER TURBINE../CONCEPTUAL LAYOUT~N
ACCESS COVER
SPECIAL COUPLING
DIODE COMPARTMENTELECTRICAL CABLESGENERATOR HOUSING COVERRADIAL CATCHER BEARINGTYP. ADJUSTABLE RADIALSUPPORT
TYP. SEISMIC SUPPORT BRACKET
PRESSURE HOUSING(CYLINDRICAL SECTION)
FLEXIBLE SUPPORTS
AXIAL BEARING PLATE
COUPL!REED PROTECTION
LABYRINTH SEAL POSITION
MANIFOLD
RECUPERATOR/HEATEXCHANGER HOUSING
GENERATOR CONCEPTUAL LAYOUTFIG. 9
• Connecting of PCU to reactor.
• Different helium inventory control system proposals.
• PCU system and component performances.
• Reactor core performance.
• Pressure and temperature equalization following a reactor trip.
• Electrical house power demand study.
• Passive heat removal analyses (including the chimney).
• Reactor vessel thermal stress sensitivity (sensitivity study)
• Reactor building and main power system seismic behaviour.
168

Adding of new Modele
Koeberg Site
Koeberg site Plan
Switch Yard(s) and Coupling to GridVO
KOEBERG SITE LAYOUT CONCEPTFIG. 10

• Fuel supply and manufacturing options study.
• Alternator layout, supporting, coupling and operational modes. (Requirement study).(See attached Figure 9)
• KOEBERG site layout (See attached Figure 10)
8. BRIEF OVERVIEW OF SOME OF THE INDIVIDUAL SYSTEMS
• Systems covered by other presentations during this TCM:
- The Reactor (core design)- The Power Conversion Unit (PCU)- Helium Inventory and control system- Passive heat removal.
• Some comments on Systems of interest:
- Active heat removal system.* The sea as ultimate heat sink
* Cooling tower for shutdown, startup and maintenance.
- The shutdown heat removal
* basically keeps the reactor vessel cool when Brayton Cycle notfunctioning
* Flow will be through the graphite reflector.
* Core will remain hot during operation of this system.
- The fuel and defueling systems
* An on-line operable system.
* This system is 100% redundant
* 2 zone core loading capability.
- Electrical system (See attached Figure 11)
* A 132 kV main bus with step down transformators to 11 KV, 3,3 KV and400V busses and switchgear.
* Electric demand is split into startup, shutdown and run categories.
* A 600 kVA diesel-generator will serve as startup and stand-by electricsupply source if grid is not available.
- Automation System Architecture (See attached Figure 12)
Minimum scope safety-related Reactor Protection System to ensure that the initialconditions preceding a possible accident are safe (e.g. reactor temperature and integralenergy - which has to be removed as decay heat).
The rest of the system is normal industrial automation equipment. Use is made of:
* programmable logic controllers* computer-based man-machine interface devices with an absolute minimum of
discrete control buttons / indications)
170
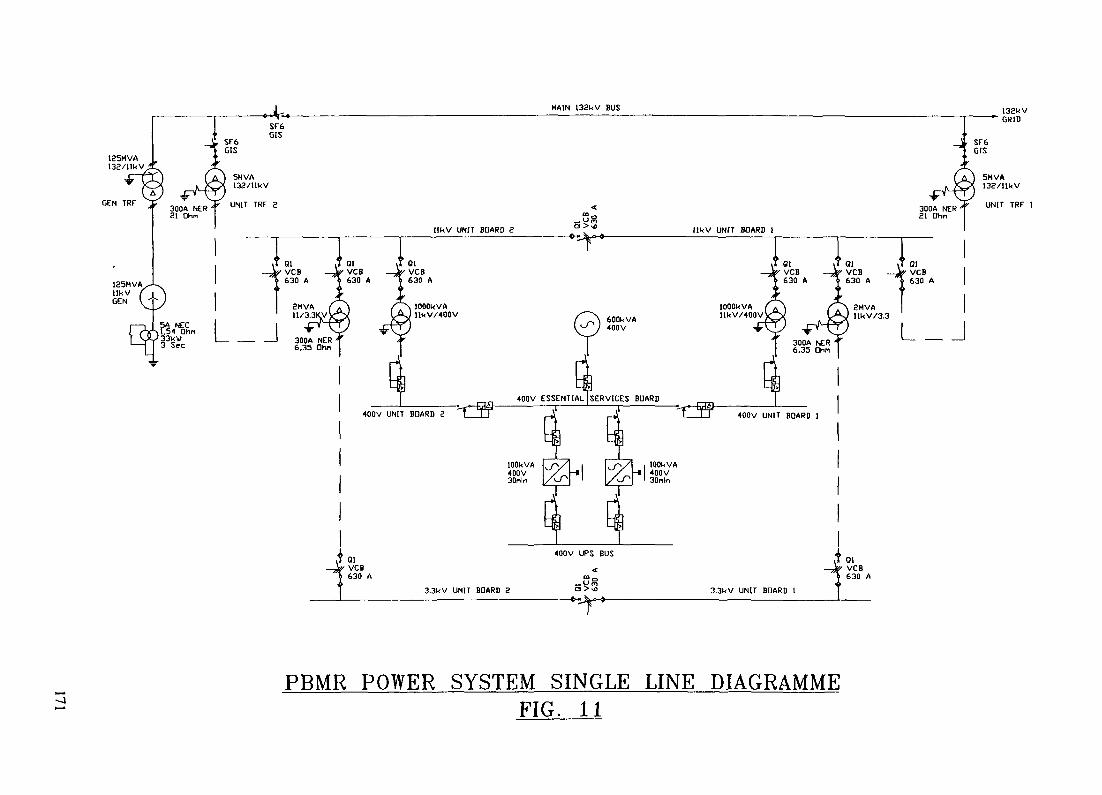
MAIN 132kV BUS 132kV
125MVAI1P/11UV •*
________ 1 —— ————— « r-« ———————————————————————————————————————————————————————————————————————————————————————————————————————————————SF6
| GIS-Jr SF6 -J^ GIS
' > ^
" GRID
. SF6GIS
"IJC/ilK vx-*^v -• — •-. x- — -V
^® ,0 fa^V ,0 ?3M2 kV
GENTRF^ ^^ ^^
laSMVA,-llkV f jGEN ^
r~^.
r 300ANERf UNIT TRF 3 < 300A NER ? " N I T T R F 121 Ohn ™o 21 Ohn
IlkV UNIT BOARD 2 ° * * IlkV UNIT BOARD 1_______ _____________ ______________ _______ _ ————————————————————————— , —————— *>-« gr,. n ft ——————————————————————————— __ ___________ . ______________ , _______________ _______
1 1 ^ i 1 i,T 01 .1 01 i ' Ql it 01 it QI it QI
—JK' VCB — JB- VCB _J^VCB —Jr VCB — J/P VCB — ,*>• VCB't 630 A "t 630 A i 630 A ^ 630 A ^ 630 A Hi 630 A
t If > 1 TJ{ A r *T jr 12MVA O\ /S lOOOkVA 1000UVA /V\ /N 8MVA
1 ll/3.3K)vV**y LAJ HkV/400V S~^. llkV/400VX^X \<£W HkV/3.3 'L?AsAL 1 ^^) xW M5o0o°vVA xW ^ P) i 1
33kW3 Sec 300A NER '
6,35 dhn
400V UNIT BOARD 2
400V ESSENTIAL SERVICES BOARD
IDOkVA400V30nin
lOOkVA400V30n!n
QI• VCB
630 A
400V UPS BUS
3.3KV UNIT BOARD 2
300A NER6,35 Qhn
400V UNIT BOARD 1
VCB630 A
3.3kV UNIT BOARD 1
PBMR POWER SYSTEM SINGLE LINE DIAGRAMMEFIG. 11

to. PLANT INFORMATION NETWORK
(Monaqement information)
AUTOMATION SYSTEM ARCHITECTUREFIG. 12

• Networking between controllers• redundancy of processors and networks as and where appropriate
Each reactor module has an independent automation system, situated in the plant area.Operator stations for all modules are in one common control centre. Provision is made forone plant supervisory station (but no technical support centre, no remote shutdownfacility).
Plant common automation equipment (with a degree of redundancy as and whereappropriate) may be:
• plant monitoring systems (environmental, seismic,...)• plant data server
9. COMPONENT SPECIFICATION AND COSTING
The following main components costing is at present under discussion, (tender inquiries out)
The reactor vessel.The graphite.The fuel.The alternator.The turbo machinery and heat exchangersThe buildingThe electrical equipment include the main transformers.The active heat removal pumps and heat exchangers.The ventilation system.
10. THE ENGINEERING SIMULATOR.
• Acceptable level of stability of the Brayton Cycle is demonstrated.
• Operating at different levels of power showing correlation with other methods of predictions.
• The behaviour of the turbo machinery is demonstrated during step and ramping of powerand helium inventory changes.
• The simulator already plays an important role in identification and simplification of a controlsystem.
(Detail of the simulator is presented in a separate paper).
11. CONCLUSION
• The simplicity of the proposed reactor still prevails.
• The inherent safety is captured in the fuel and plant configuration.
• A new licensing framework is possible.
• The direct cycle is a non-omissible option for future power generation.
• The technology base internationally available makes it possible to design and build a fullscaleprototype plant directly without extended research and development required.
173

• We foresee no technical and financial reason why the public cannot accept this power plantas an electric power production unit.
• Variations of the proposed concept are possible to suit potential clients requirements.
• It is one of the world's most fascinating new developments.
• Our study is basically on time as scheduled, and will be finished with great enthusiasm.
174
LICENSING OF THE PROPOSED PBMR-SA XA9846679
G.A. CLAPISSON, N.R. HENDERSON, T.F. HILL,N.H. KEENAN, P.E. METCALF, A. MYSENKOVCouncil for Nuclear Safety,Hennopsmeer, South Africa
Abstract
This paper describes the preliminary criteria, which are intended to be used by the South Africanregulatory authority (CNS), for licensing of the ESKOM proposed - South African hightemperature gas-cooled Pebble Bed Modular Reactor (PBMR-SA).The CNS intends to apply the existing CNS licensing approach together with some internationaldesign criteria used for advanced reactors as well as international experience gained from thesafety evaluation of the MHTGR, THTR, etc. A major requirement to this type of reactor is thatit should comply with the current CNS risk criteria and provide, as a minimum, the same degreeof protection to the operator, public and environment that is required for the current generationof nuclear reactors.
I. INTRODUCTION
The South African high temperature gas-cooled Pebble Bed Modular Reactor (PBMR-SA) proposed by Eskomfl] is now at a preliminary design stage. In this paper theCNS approach to the establishment of a licensing basis for this reactor design isdiscussed against the background of the regulatory approach applied in South Africaand fundamental safety standards laid down by the CNS[2] as well as an internationalapproach developed for the MHTGR[3] and other advanced reactors[4].The approach followed by the CNS as regards reactor regulation is that the licenseemust present a safety case for the plant which must include a credible design basisrespecting international norms and practices, and that the safety case includes aquantitative risk assessment demonstrating compliance with the fundamental safetycriteria laid down by the CNS [5], which include:
• The CNS risk criteria for risk to the public and plant personnel due to accidentconditions and normal operating events
• Defence-in-depth
• The ALARA principle
In view of the fact that the PBMR-SA is to a large extent a unique design, the designrules and design basis have to be largely developed by the South African licensee inconsultation with the CNS. This must be performed in accordance with thefundamental safety standards of the CNS and prevailing norms and standards.
175

II. EXPECTED DESIGN FEATURES
International experience indicates that high temperature gas-cooled modular reactorshave unique safety characteristics [6]. The most important being:• slow response to core heat-up events, because of the large heat capacity and lower
power density of the core;• the very high temperature that the fuel can sustain before the initiation of fission-
product release;• passive reactor shutdown with a modest temperature rise;• passive decay heat removal features;• high-integrity coated fuel particles, which function as the initial fission-product
barrier and primary reactor containment system;• minimum requirements for operator actions and the low sensitivity of the design
to operator error.All these contribute to the long time intervals necessary for the implementation ofcorrective actions.Therefore, the PBMR-SA design has the potential to eventually demonstrate a numberof favourable characteristics, in particular:
• the potential for only minor core damage and fission-product release over a widerange of severe challenges to the plant;
• the objective of reduced dependence on human actions and reduced vulnerability tohuman error;
• a long response time of the reactor under accident conditions, which providessufficient time for evaluation and corrective actions;
• the capability to demonstrate by test, the significant safety features and safeperformance of the plant over a wide range of events;
• the potential for the development and successful performance of high quality fueland passive safety characteristics.
As a result of these expected safety features, the following important differencesbetween the existing LWR and the PBMR-SA design could be expected hi thePBMR-SA design:• a shift in emphasis from mitigation features to highly reliable protection features;• reduced number of systems, components, and structures needed to be classified as
safety related;• Possible relaxation in the number of lines of defence or barriers.
III. DEVELOPMENT OF A LICENSING BASIS
The basic requirements introduced in chapter I will have to be applied to the PBMRconcept design to derive plant-specific safety requirements for the purposes ofestablishing an appropriate licensing basis. The basic objective is to underpin the riskrequirements with "deterministic" safety principles. This must be performed by thelicensee in consultation with the CNS in the following stages:
176

1. Identification of accident and operational events.
All scenarios which could result in exposure of the public or plant personnel to riskduring normal operation of the plant or as a result of an accident, either due to directexposure or release of radioactive material from the facility must be identified. In thisregard all sources of radioactive material, release mechanisms, release pathways,components, systems, plant processes, activities and events which could impactsignificantly on risk must be identified. The significance of such events willultimately be determined by comparison with the safety criteria of the CNS.
2. Establishment of a classification scheme for accidents andoperational events
It is proposed that a classification scheme for accident and operational events shouldbe developed to facilitate the development of deterministic design rules. This schemewould effectively serve as a surrogate for the CNS risk criteria, but would facilitatethe development of design rules by adherence to a number of principles outlinedbelow.
Criteria for public and operator exposure should be developed for each event categoryalong with appropriate frequency ranges with the following objectives:
• Adequate safety margins against the CNS criteria for public and operator risk mustbe assured, taking into consideration that the risk to the public from the presenceof the PBMR must be added to that of any other existing facilities at the site (e.g.the Koeberg PWR reactors at the Koeberg site).
• Although the proposed design should provide, as a minimum, the same degree ofprotection for the public and environment as required of the current generation ofnuclear reactors, an enhanced level of safety is expected.
• The classification scheme must be made as stable as possible (i.e. not subject tothe variabilities typical of quantitative risk assessments) by giving adequateattention to prevailing uncertainties. In view of the limited experience feedbackfrom reactors of this type, consideration of uncertainties are expected to play amayor role in establishing the licensing basis for the PBMR.
• The consequence analyses must be based on conservative assumptions (at least forevent categories I and II) with due consideration to uncertainties as discussedabove.
• In view of the advanced nature of the proposed design as a potential source ofenergy for the next 40-50 years, it is expected that the safety level for thesereactors must be shown to be better than the current generation of LWRS,particularly as regards accident prevention. The emphasis on accident preventionas opposed to accident mitigation could provide a basis for decisions regardingless defence-in-depth requirements than for the current generation of LWR's,
177

The classification scheme for a set of event categories proposed by ESKOM [1] andused for MHTGR[3] with some modifications may be considered at this stage. Thelist of events is given in tables 1-4.
Event Category I. Events in category I (EC-I) (table 1) are equivalent to the currentanticipated operational occurrence (AOO) class of events considered for LWRS. Thefrequency range for these events goes from a number per year down to approximately10~2 per reactor-year, which corresponds to the frequency of events that may beexpected to occur several times during the life of the plant.Events with frequencies exceeding 10"2 per annum may not lead to any significantdose to the public or plant personnel. This would encompass events in categories 1and 2 for LWRS, category l(for LWRS) referring to normal operating events (i.e.frequency > 1), while category 2(for LWRS) refers to transient conditions which areexpected to occur during the operating life of the plant (frequency between 1 and
Table 1. Event Category 1
Number EventEC-I-1EC-I-2EC-I-3EC-I-4EC-I-5
Main-loop transient with forced core coolingLoss of main and shutdown cooling loopsControl-rod-group withdrawal with control rod tripSmall heat-exchanger leakSmall primary-coolant leak
Table 2. Event Category II
Number EventEC-II-1 Loss of heat transport system (HTS) and shutdown cooling
system (SCS) coolingEC-II-2 HTS transient without control rod tripEC-II-3 Control-rod withdrawal without HTS coolingEC-II-4 Control-rod withdrawal without HTS and SCS coolingEC-II-5 EarthquakeEC-II-6 Moisture inleakageEC-II-7 Moisture inleakage without SCS coolingEC-II-8 Moisture inleakage with moisture-monitor failureEC-II-9 Moisture inleakage with heat-exchanger dump failureEC-II-10 Primary-coolant leakEC-II-11 Primary-coolant leak without HTS and SCS cooling
178

Event Category II. Events in category II (EC-II) (table 2) are equivalent to thecurrent Design Basis Accident (DBA) categories 3 and 4 for LWRS and would beselected in a manner consistent with that for selection of an LWR DBA envelope.Specifically, events in EC-II would:=> Be identified, using in-depth engineering assessment and judgement,
complemented by PRA methods, to include internal events in the frequency rangeof 10~2 to 10"4 per year, with the aim of ensuring that any event expected to occurover the lifetime of a population of reactors is included.
=> Include external events relevant to the reactor site.=> Be subject to single-failure criteria and other traditional conservatism, depending
on the assessed accident consequences, with no credit for non-safety-gradeequipment, etc.
Events in this category would require conservative analysis, as is currently done forLWRS.
Table 3. Event Category
Number EventEC-Ill-1 Moisture inleakage with delayed heat-exchanger isolation and without
forced coolingEC-III-2 Moisture inleakage with delayed isolationEC-III-3 Primary-coolant leak with neither forced cooling nor helium
purification system pumpdownEC-IH-4 Inadvertent withdrawal of all control rods, without reactor trip for 36
hours:(1) reactor system pressurised, with forced cooling available(2) reactor system pressurised, with reactor cavity cooling system
(RCCS) cooling only(3) reactor system depressurised, with RCCS cooling only
EC-in-5 Station blackout for 36 hours:(1) reactor system pressurised(2) reactor system depressurised
EC-HI-6 Loss of forced cooling plus RCCS cooling for 36 hours:(1) reactor system pressurised, RCCS 25 percent unblocked after 36
hours(2) reactor system depressurised, RCCS 25 percent unblocked after 36
hoursEC-HI-7 Rupture of justifiable number of heat exchanger tubes with failure to
isolate or dump heat exchanger:(1) reactor system depressurised, with forced-circulation cooling
maintained(2) reactor system depressurised, without forced-circulation cooling
EC-in-8 Rapid depressurisation. Double-ended guillotine break of crossductwith failure to trip (assume RCCS failed for 36 hours and 25 percentunblocked thereafter). Partial control-rod insertion after 36 hours.
EC-HI-9 Severe external events consistent with those imposed on light-waterreactors.
179
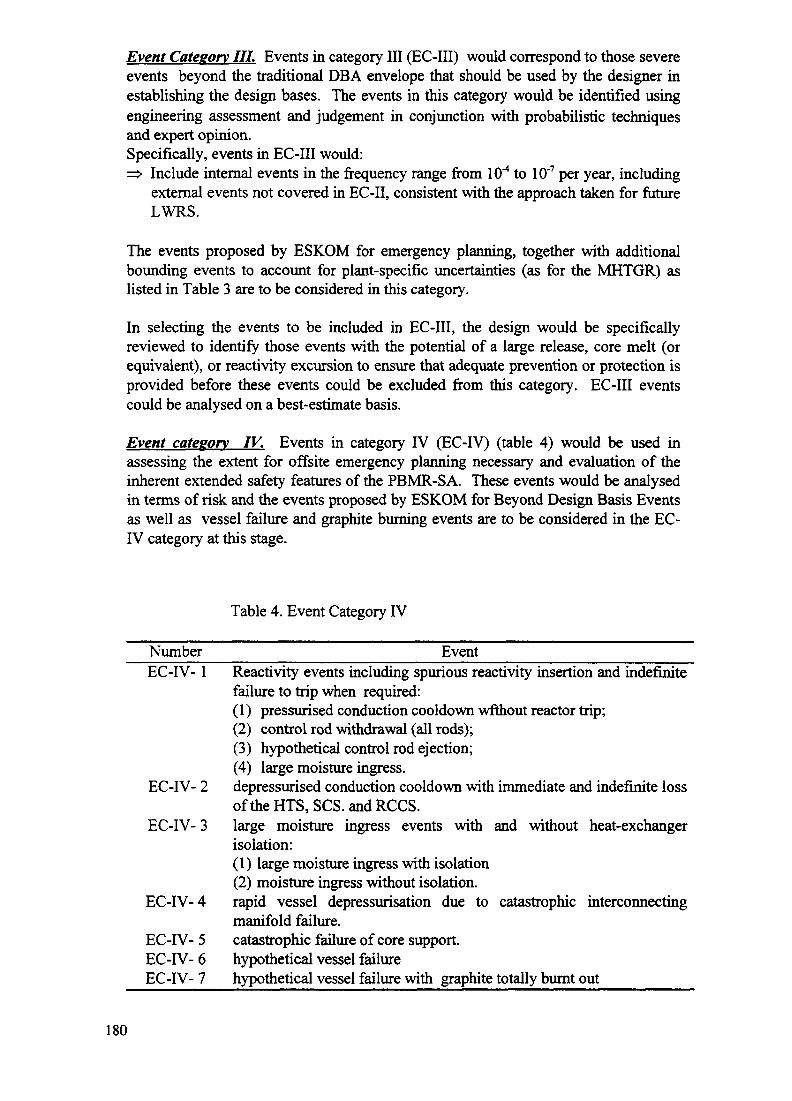
Event Category III. Events in category III (EC-III) would correspond to those severeevents beyond the traditional DBA envelope that should be used by the designer inestablishing the design bases. The events in this category would be identified usingengineering assessment and judgement in conjunction with probabilistic techniquesand expert opinion.Specifically, events hi EC-III would:=> Include internal events in the frequency range from 10"4 to 10'7 per year, including
external events not covered in EC-II, consistent with the approach taken for futureLWRS.
The events proposed by ESKOM for emergency planning, together with additionalbounding events to account for plant-specific uncertainties (as for the MHTGR) aslisted in Table 3 are to be considered in this category.
In selecting the events to be included in EC-III, the design would be specificallyreviewed to identify those events with the potential of a large release, core melt (orequivalent), or reactivity excursion to ensure that adequate prevention or protection isprovided before these events could be excluded from this category. EC-III eventscould be analysed on a best-estimate basis.
Event category IV. Events in category IV (EC-IV) (table 4) would be used inassessing the extent for offsite emergency planning necessary and evaluation of theinherent extended safety features of the PBMR-SA. These events would be analysedin terms of risk and the events proposed by ESKOM for Beyond Design Basis Eventsas well as vessel failure and graphite burning events are to be considered in the EC-IV category at this stage.
Table 4. Event Category IV
Number____________________Event__________________EC-IV-1 Reactivity events including spurious reactivity insertion and indefinite
failure to trip when required:(1) pressurised conduction cooldown wfthout reactor trip;(2) control rod withdrawal (all rods);(3) hypothetical control rod ejection;(4) large moisture ingress.
EC-IV- 2 depressurised conduction cooldown with immediate and indefinite lossof the HTS, SCS. and RCCS.
EC-IV- 3 large moisture ingress events with and without heat-exchangerisolation:(1) large moisture ingress with isolation(2) moisture ingress without isolation.
EC-IV- 4 rapid vessel depressurisation due to catastrophic interconnectingmanifold failure.
EC-IV- 5 catastrophic failure of core support.EC-IV- 6 hypothetical vessel failureEC-IV- 7 hypothetical vessel failure with graphite totally burnt out
180

Event Frequencies
Large uncertainties may exist in PRA results, especially in the lower frequencyranges. Therefore, in selecting and analysing the events, consideration must be givento the treatment of uncertainties. Accordingly, where the event categories include intheir definition a frequency value, this frequency value is intended to be a guidelineonly and is not to be considered a rigid limit for which compliance must be rigorouslydemonstrated.
If it is demonstrated that the PBMR-SA design posses the safety features anticipatedabove [6] and a negligible risk of the significant fission products release can bejustified, the classification scheme for a set of event categories could be changed toonly three categories, in particular:
• Events in category I - anticipated operational occurrence;• Events in category II - accidents with no release of fission products;• Events in category III - accidents with release of fission products.
3. Establishment of basic safety rules for design and operations
Basic safety rules for the design and operation of the plant should be established withthe objective of meeting the requirements arising from the classification of accidentand normal operating conditions described in previous section. These rules shouldform a link between the requirements arising from the above risk-based classificationand the detailed plant design basis. These rules should form the basis for licensingand deal with issues such as:
0 Requirements on the need for and integrity of the various barriers, e.g. fuel,reactor vessel and containment structure based on the event categories definedabove, covering inter alia:
• Mitigation of internal events (coolant leaks/core damage accidents)• Protection against external events (fire, flooding, air crash)
0 Requirements on protection systems, i.e.:• Need for and classification of diverse engineered safeguard systems• Levels of redundancy of the above systems• Availability requirements
0 Design requirements relating to radiological protection (e.g. waste treatment,shielding, ventilation, installed radiation monitoring)
0 Plant siting requirements.
It can be expected that the licensing requirements for the first unit will include anextended more comprehensive commissioning and testing programme, requiringpossible additional hardware, to verify and validate the design safety parameters.
As the first unit will most probably be situated on the Koeberg site, the interactionwith KNPS will therefore need to be addressed.
181

4. Establishment of a detailed design basis and general operating rules
Once the basic safety rules have been established in step 3, the detailed design basismust be established to ensure compliance with these rules as well as the CNS safetycriteria.
The design basis will have to be demonstrated to be credible and developed respectingacceptable international norms and practices.
Protection features identified thus far which must be accounted for in the design basismust include the following specific concerns:
• Protection of metal components from continued exposure at elevated temperaturesand from hot helium during postulated transients
• Prevention of uncontrolled access of air or moisture to hot graphite and fuelparticles.
In parallel with the development of the design basis, operating rules need to beestablished including inter alia:
• Operating technical specifications• In-service inspection programme• Maintenance and testing programmes• Radiation protection programme• Waste management programme• Occurrence reporting programme• Quality management programme• Emergency plan.
IV. CONCLUSION
The final determination of whether the plant is licensable is contingent on thefollowing:
1) Satisfactory completion of the preliminary design review;2) Satisfactory resolution of all safety issues, identified during the review process
and possible additional safety issues that may be raised at later stages during thereview process;
3) Satisfactory completion of the final design review by a competent independentreviewer;
4) Confomiance with applicable CNS rules, LDs and LGs current at the time of anyfuture licensing action;
5) Satisfactory completion of the final design and licensing review by the CNS;6) Satisfactory completion of research and development activities, including
successful design, construction, testing, and operation of the first unit beforedesign certification.
182

Acceptability of the PBMR-SA design by the CNS will be determined on theevaluation of both deterministic safety and PRA analysis.
The positions and conclusions on all matters discussed in this paper are preliminaryand are subject to change.
REFERENCES
[1] Architect-Engineering Study Report. Technical Description and Phase I StudyDefinition., Doc. No PBMR-00000-20/1, ESKOM/IST.[2] Clapisson G.A., Henderson N.R, Hill T.F., Keenan N.H., Metcalf P.E.,Mysenkov A., "An Overview of the Licensing Approach of the South African NuclearRegulatory Authority", Paper presented at this Technical meeting.[3] Draft Preapplication Safety Evaluation Report for the Modular High-Temperature Gas-Cooled Reactor, US NRC NUREG-1338, March 1989[4] IAEA, Development of safety principles for the design of future nuclear powerplants, IAEA-TECDOC-801,1995[5] LD-1091, "Requirements on Licensees of Nuclear Installations Regarding RiskAssessment and Compliance with the Safety Criteria", CNS, RSA.[6] Fortschritte in der Energietechnik: fuer eine wirtschaftliche, umweltschonendeund schadenbegrenzende Energieversorgung; Prof. Dr. Rudolf Schulten zum 70.Geburtstag / Forschungszentrum Juelich GmbH, Institut fuer Sicherheitsforschungund Reaktortechnic, 1993.
NEXT PAGE(S) I'«ftBLANK I ,83

PBMR PHASE 1 STUDY: SEISMIC AND STRUCTURAL DESIGNCONSIDERATIONS — AN OVERVIEW OF PRINCIPLES
D.J.W. WIUM """""""XA9846680"Africon,Pretoria, South Africa
Abstract
This paper briefly reviews the principles involved in the planning and design of theproposed facility to cater for seismic and structural loads. The conceptual layout isdiscussed, as well as the different load characteristics and scenarios. An outline is given ofa model used to estimate the seismic loads, whereafter the different analytical models arediscussed.
1. Background
This paper briefly reviews the structural and seismic design of the proposed facility. Thestructure serves the main role in supporting the sensitive equipment, protecting it from theexternal environment, internal and external missiles, and providing some rudimentaryprotection against the sudden uncontrolled release of radio-active material. The buildingwill need to be designed to provide the necessary protection, but also be adaptable todifferent environments and circumstances. The current prototype is being planned for theKoeberg site in the Western Cape (close to Cape Town), but the ultimate goal is to be ableto place such facilities at virtually any location in the world. In designing this prototype,the objective has therefore been set to ensure that it can be 'transported' to a wide range ofsites: of particular interest is the seismic input parameters.
The paper reviews the forces and conditions to which the building will be subjected. Theprinciples involved in planning the layout of the building are reviewed. Next thefundamental issues involved in estimating the seismic input parameters are reviewed, aswell as the principles to be used in performing the seismic analyses.
2. Design considerations
The concrete structure that will house the proposed system is being planned to fulfil amultiple range of functions. The different input requirements are outlined below.
2.1 Structural Requirements
2.1.1 Strength
The structure will be expected to fulfil the normal operating loads, as well as a number ofcritical (accident) conditions. Normal loads to be considered would include the following:
• the support of heavy equipment• slight under or over pressures during operational conditions
185
• construction loads (e.g. installation of the process equipment, etc)• normal heat loads during operational conditions
During accident conditions, it is anticipated that the following conditions would have to becatered for:
• protecting the process equipment from missiles, both internally generated (e.g.turbine blades, broken pipes, etc) and external missiles (e.g. aircraft)
• the protection against slight over-pressures during a potential accident, and• provide sufficient strength against seismic loads during earthquakes.
2.1.2 StiffnessThe sensitive nature of the equipment calls for a relatively stiff supporting structure toprevent relative movements between support points of the equipment. A key designparameter in planning the layout of the building has therefore been to ensure that thebuilding does not exhibit excessive relative displacements during dynamic loads, and thatpiping and equipment are not subjected to large differential movements of its supports.Research has shown that such relative displacements could seriously jeopardise thestructural integrity of the process equipment. Furthermore, resonance between thedifferent modes of the equipment and the building structure should be prevented, as thiscould seriously jeopardise the safety of these critical equipment.
However, the supporting soil of the site could furthermore impact on the dynamic loadsexperienced by the building. Experience and extensive research have shown thatsubstantial amplification of the seismic motions can be expected in the case where thefacility is situated on soft soil deposits. Care should therefore be taken to ensure that suchamplification does not occur. Special care would be required where such situations dooccur: it is usually advisable to prevent resonance between building and the supportingsoils.
2.2 Integrity
The second key objective of the building will be to ensure sufficient protection of theprocess equipment from the natural external environment. This entails the protectionsagainst the external corrosive sea air, as well as the potential damaging effect of the groundwater.
The prior matter will be addressed easily through high quality concrete construction.Similarly, the structure will be designed to withstand at least the minimum over pressurethat could be expected during the initial phases of a possible blow-down of the system:special pressure release gates will be provided to release any potential over-pressure assoon as possible. It is therefore not anticipated that the structure will tested for leaktightness, and not special effort will be put into creating an absolutely leak-tightenvironment.
The prototype plant will be situated on the Koeberg site, where the sand cover over theunderlying rock is approximately 20m thick. The water table is also quite high, being right
186

next to the sea. It can therefore be expected that substantial water proofing will have to beprovided. A cavity wall system is currently being investigated for this purpose.
2.3 Structural Layout
The primary structure is planned to consist of a number of heavy concrete walls and floorrequired to support the process equipment (see Figure 1). The large latter force will beresisted by the internal floors, while a vertical load carrying system is being devised toprovide for the support of the vessel, the heavy overhead crane, the numerous largepressurised gas containers, and the roof itself. Special care will be given to finding asolution which takes into account the dynamic response of the roof during seismic events.
Figure 1: Conceptual Layout of Building
A key role to be played by the structure is the protection against external missiles. It willbe designed to withstand the following two cases:
• Cessna 172 (which would not be allowed to penetrate the external wall), and• Phantom Fl, (which would not be allowed to penetrate the protective boundary
surrounding the process equipment.
This protective boundary is illustrated in Figure 2.
Figure 2: Protective Boundary Above ProcessEquipment
187

3. Seismic Design
3.1 Seismic Input Parameters
3.1.1 Properties of earthquake
Effects of Earthquakes
Earthquakes represent some of nature's most catastrophic events which could wreak havocin any community. Fortunately, the South African region is known for its seismic stability,and only a relatively small number of earthquakes occur. However, earthquakes do inducesignificant forces in buildings and other structures, and extensive damage could occur inbuildings if the necessary precautions are not taken. It is therefore necessary to takecognisance of these effects during the design stage.
An earthquake is manifested by a sudden, random, rapid movement of the ground whichcould have a duration of between 2 to 20 seconds. A typical recording of the groundmotion in the three directions are uncorrelated. The maximum horizontal accelerationmeasured during an event can reach 1 or 2g (where g is the gravitational acceleration of9.81 m/s2) but in most cases it is less than 0.5g. In frequency terms, the dominantfrequency of the motion generally lies in the range of 2 to 20 Hz (i.e., the ground vibratesat frequencies of between 2 and 20 Hz).
Classification of Earthquakes
Various scales are used to measure the degree of intensity of an earthquake. The two morecommonly used scales are the Richer magnitude scale, and the Modified Mercalli Intensityscale. The Richter scale is used most commonly where sufficient instrumentation isavailable to measure the motion of the earth. This scale is an open-ended scale, and largerevents can reach 8.5 on this scale. The largest event recorded to date in Southern Africanis the main shock of 29 September 1969 at Ceres, which registered 6.3 on the Richterscale. The Modified Mercalli Intensity scale is generally used in cases where noinstrumentation recorded the event, and where local evidence needs to be used to estimatethe severity of the event. The earthquake at Ceres was assigned an MMI value of 9, beingthe largest recorded in this region.
Earthquakes are induced by a range of different mechanisms in the upper layers of theearth crust. The major cause of earthquakes is the sudden release of energy when twoadjacent sections of the crust move with respect to each other. Such movement typicallyoccurs at the interplate boundaries of the earth. This results in a concentration ofearthquake epicentres along the American coastal belts, in the Philippines, and in someparts of the Mediterranean. Other causes include volcanism, and other effects which couldcause stress concentrations in the rock layers, such as an increase in load on the earth crustdue to the construction of dam, or the seasonal accumulation of water in some swampareas. However, these situations generally result in relatively small seismic events.
188

Effect of Distance
The epicentres of larger natural earthquakes are located at depths of between 25 and 40 kmbelow the surface. From there the energy is transferred as P (compressional), S (shear) andRaleigh waves through the earth to areas further away. The intensity of the observedground motion (and therefore the MMI observed at a particular position) attenuates withdistance from the epicentre. Although not strictly correct, this attenuation of intensity canbe represented by a logarithmic function expressed as:
log I = log I0+ a log R + c
where I0 is the intensity at the epicentre,
I is the intensity at distance R, and
a and c are constants.
Therefore, sites further afield from seismically active zones are affected less significantlythan those close by.
3.1.2 Seismicity in Southern Africa
Earthquakes have been recorded in the Southern African region since as early as 1620, buta scientific record of events has only been kept for the past 20 or 30 years (Fernandez 1970- 1986). Largely due to a lack of data, seismologists have not been able to construct a clearmodel of seismic activity in this country, and quite large error bounds are therefore bynecessity included in any codified guidelines. It can be expected that this may also be thecase in a number of other countries where these plants may in future be situated. A briefoutline of the methodologies used here is given to illustrate that the lack of seismicinformation should not preclude the development of some model of seismic behaviour ofthe region.
Active mining area Northern Provin Johannesburg
Koffiefontein i /
Ceres (1969) I
Koeberg
xr\
Figure 3: Points of Interest and Seismically Active Areas
189

From the available data it is clear that there seems to be higher concentration ofearthquakes in the Cape Town - Ceres area, where some of the larger events took place(see Figure 3). A number of larger earthquakes have also occurred in the Zululand area, aswell as in Lesotho and in Kofflefontein. A larger number of earthquakes (albeit small)occur in the northern region of Botswana, and in the vicinity of new large dams, such asthe Kariba dam. This data was used to develop the seismic hazard map used in the designcodes. Alternatively a probabilistic approach could be used to develop design spectra(Wium and Opperman, 1986).
A large concentration of earthquakes are also found in the major active gold mining areasof Transvaal and the Orange Free State. The epicentres of these events are typicallylocated at depths of between 2 and 3 km, and they generally have quite short duration.Due to their very shallow epicentres, they tend to attenuate very rapidly, resulting in onlylimited impact on constructed facilities.
3.2 Seismic Design Parameters
This section briefly summarises the methods used to develop the seismic risk model. Themethodology used in this work is based on the work of Cornell (1968), and on laterextensions implemented by Anderson and Trifunac (1978) and Lee and Trifunac (1985).Two numerical models were developed to represent the unique properties of the SouthernAfrican region. The various aspects involved in this procedure are briefly discussedbelow.
3.2.1 Seismicity
The occurrence of earthquakes in a given region can be represented by a model of theseismicity which describes the location of seismic events in the region, the frequency ofthese events, and their magnitude or intensity at the epicentre. Typically, the region can bedivided into a number of different seismic zones or features with which earthquakes can beassociated. The most obvious features are faults and point sources, but in many cases,earthquakes cannot be associated with any particular feature, and a region therefore has tobe treated as an area of distributed seismic activity. It is assumed that throughout each ofthese zones, there is an equal probability of an earthquake of a specific intensity ormagnitude occurring anywhere in such a zone.
This model is expressed in terms of the Modified Mercalli Intensity (MMI) at theepicentre. Although a model of magnitudes would be more apt, little or incompletemagnitude data exists on earthquakes in Southern Africa prior to the 1970's.Seismologists therefore have to rely on records of MMI values.
The Seismological Data Bank (consisting of a comprehensive list of all recordedearthquakes in Southern Africa from 1620 up to 1983) was obtained from the GeologicalSurvey of the Department of Mineral and Energy Affairs (Fernandez, 1985). All eventsafter 1900 were selectively grouped into seven seismic zones, and only those eventssubsequent to the turn of the century were retained. Fore- and after-shocks werejudiciously excluded from the list or earthquake.
190
However, a close inspection of the cumulative energy of the earthquakes shows that theavailable data on the seismic history of Southern Africa is not complete. Had this been thecase, the average trend of the cumulative energy would have been constant for the fullperiod from 1900. This certainly is not the case. Instead, in many regions this data is onlycomplete from the early to late nineteen fifties. This data can hardly be used to correctlyestimate the seismicity in a region.
On the other hand, it would seem as though the record of seismic events is not completefor the smaller events that occurred prior to the fifties, and that the list becomesprogressively more complete in the smaller events as the time goes on. For instance, itseems that in some areas all large events (those with an intensity greater than or equal to 8)may be complete from as early as 1652, being the period for which written records areavailable. These events are so large that they would have been recorded by the public hadthey occurred. On the other hand, smaller events (with intensities between 5 and 7) maybe complete from approximately 1900, while smaller events only seem to be completefrom 1950 or even later.
It was therefore decided that all available data be used to compile a more representativemodel of the seismicity of each region. This can be done by establishing the average rateof events of a particular intensity during that period for which the events of that intensity iscomplete, and by extrapolating these events over a longer period. It is suggested that thelongest available period be used as the basis for calculating the seismicity: in this case, itwould be for the period from 1652 to 1983, being the period during which the SouthernCape has been populated on a continuous basis. The number of events that occurredduring a shorter period should therefore be extrapolated to cover this full period.
All that remains to be done is to select that period for which the data of each intensity iscomplete. It was therefore decided that this can be regarded as that period during whichthe moving average of the annual number of events remain constant, or approximately so.These through I were used to estimate the applicable periods of complete data for eachseismic region. Three alternative methods were used to establish the list of earthquakes.
3.2.2 Attenuation
The seismicity model discussed above expresses the probability distribution of events atthe epicentre. However, the effect of such an earthquake rapidly diminishes with distance.This phenomenon is represented by an attenuation model. Various expressions have beensuggested to represent the attenuation of earthquake waves due to the distance between theepicentre and the site (Howell, B.F. (Jr.) and Schultz, T.R., 1975). Isoseismal maps can beused to derive a suitable expression for Southern Africa. Typically, the intensity at a site(I) is expressed as a function of the intensity at the epicentre, the epicentral distance (R)and the focal depth (h).
3.2.3 Engineering manifestations of earthquakes
In the design of a structure, it is necessary to predict its response by using engineeringinput parameters, such as the peak ground acceleration, or the response spectrum for thedesign earthquake. MMI values cannot be used for this purpose.
191
No strong motion records are available of any significant natural earthquakes in SouthernAfrica. Functionals expressing the peak acceleration, response and Fourier amplitudespectra as functions of the site intensity have been proposed, and are based on a largenumber of world-wide earthquakes (Anderson and Trifunac, 1979; Cornell, Banon andShakal, 1975; Trifunac and Brady, 1975). These correlations represent the relationshipbetween two site parameters (e.g. MMI and peak acceleration), and are not significantlyinfluenced by the geological characteristics of the region. This data can therefore betransferred from one seismic area to the next, and can be used to develop seismic inputparameters for sites in Southern Africa.
3.2.4 Final model
The above expressions and functionals were obtained from observed data, and inherentlyexhibit a certain degree of scatter. Therefore, they need to be treated as probabilitydistributions. Using this data, it is possible to derive a probabilistic model of the responseat a given site by considering the seismicity of all seismic sources in the vicinity, byattenuating the effect to the site, by converting the MMI value to the response variable ofinterest, and then by integrating these functions for all seismic sources to obtain, forexample, the response spectrum values at a range of frequencies. The response spectraobtained from these models can easily be used to generate the design time histories byusing other methods for generating artificial earthquakes that are compatible with thedesign response spectra (Gasparini and Vanmarcke, 1976).
It is beyond the scope of this paper to further discuss the details, but the methods are morefully explained in the work of Cornell (1968), and Anderson and Trifuncac. Models forthe seismicity and attenuating effects have been developed for the Southern African region,and are discussed in the following sections.
3.3 Seismic Design Principles
It was pointed out above that the dynamic interaction between the structure and thesupporting soil needs to be taken into account. A complex model is being developed forthis purpose: in this particular site, it can be expected that the dynamic interaction betweenthe horizontally layered sand and the structure could be quite substantial. Care will betaken to ensure that a resonant situation is not created. At other sites, special care will beneeded to prevent such interaction. Where possible, a more rigid site should be selected,as that would obviate the use of special soil improvement techniques (e.g. piling, largefoundation mats, etc)
Should the site characteristics require it, it may be necessary adapt the structural layout inone of the following ways:
• modify the structural layout to change its dynamic behaviour• consider alternative support positions for equipment (which should at all costs
not be done)• use more flexible support elements
This may require some additional attention when designing the plant for a subsequentproject.
192
3.4 Design Philosophy
The general philosophy being followed in this project is to provide a design that wouldwithstand a certain level of seismic excitation for at least 0.5g: the current design level is0.3g, but it is anticipated that the target will be achieved without serious designrepercussions. This will allow the design to be used on a wide range of sites throughoutthe world, without having to be requalified.
3.5 Seismic Analyses
A dynamic analysis model of the system and the structure will be compiled, which willrepresent the dynamic properties of the various components. However, in order tooptimise the structural layout, and to provide meaningful input to the designers of theprocess equipment, a phased approach is being followed in modelling the systems. In thedevelopment, four levels of models are will be developed. These are the following:
• 2 Planning models (100 - 200 elements), one consisting of individual models forthe building and process equipment, and one consisting of a combined model forboth systems
• Design model (500 - 3000 elements)• Licensing model (3000 - 10 000 elements)
The different types of analyses to be performed are outlined below.
3.5.1 Response Spectrum Analysis
A decoupled 3-D dynamic analysis of the primary loop will be performed. In this analysis,a floor response spectrum will be generated for the operating level of the concrete structureusing the dynamic properties of the concrete structure. In this decoupled analysis of theconcrete structure, the primary loop will be modelled as lumped masses to reflect theinteraction effect between the primary loop and the internal concrete structure.
In the second analysis, the complete piping system, and the concrete structure will beconsidered. The primary loop will be once again connected to the internal structure asdiscussed above. The basemat will be represented by a six degree of freedom model whichwill allow complete freedom to rotate and displace, but which assumed that the basematitself will be rigid, thereby representing the soil-structure interaction
A computer program (SSICAL) has been developed in-house for the purpose of calculatingthe dynamic soil-structure interaction. It is based on the Substructure Theorem, andencompasses a model synthesis in the frequency domain. This technique recognises thefact that the natural frequencies and model shapes of a structure with a fixed base areeasily obtainable, while the soil is characterised by frequency-dependent stiffnessfunctions.
An equivalent (frequency dependent) dynamic stiffness matrix can be compiled whichrepresents the dynamic properties of the structures and the soil. For this, it is necessary to
193

calculate the mode shapes of the structure on fixed base (i.e., ignoring all soil-structureinteraction). The study will consist of the following steps:
• develop models for the structures, and calculate the modes and frequencies on arigid base;
• generate the time histories, and calculate the Fourier transfers of each;• calculate the dynamic stiffness of the combined model, and then calculate the
response at each frequency;• calculate the inverse Fourier transfers for each record to obtain time histories for
the displacement and rotation of the base; and• evaluate the response of the structures and pipes, using the time histories and
prescribed displacements.
5.5.2 Combined Model
Since the concrete structure supports the primary loop, and as the primary loop will bequite heavy compared with the internal concrete structure itself, the primary loop modelwill be incorporated in the internal concrete structure model to form a combined model sothat the interaction of these two substructures could be accounted for.
The coupling of the primary loop and the concrete structure will be achieved by means ofsub-structuring and the use of generalised constraints equations for constraining thesupports of the primary loop to their respective support locations in the internal structure.In this analysis, the primary loop will be considered as the higher level substructure andthe internal concrete structure as the lower. The support locations were selected nodes inthe internal structure, and were constrained to the six degrees-of-freedom of the beamelement modelled in the centre of the structure. Since the structure will be supported on arigid base, no interaction could occur between the internal and containment structures. Thelatter structures were therefore excluded from this analysis.
3.5.3 Licensing Model
This model will consist of a very detailed set of components in which the different keyelements will be assessed. Detailed stress calculation will be performed, as will theaccelerations be calculated for sensitive equipment.
4. Summary
This paper briefly reviews the scope of work being undertaken to address the seismicanalysis and structural design of the proposed new facility. It is pointed out that methodsare available for compiling seismic histories for the facility, even in the absence ofcomprehensive seismic histories.
The importance of the seismic and structural inputs have been highlighted, and theimportance is stressed regarding the role of the structure in providing appropriate support,stiffness and protection to the equipment. It is clear that these issues will be of significantimportance during the licensing applications, and appropriate attention needs to be given tothe matters.
194

HELIUM STORAGE AND CONTROL SYSTEM FOR THE PBMR
E.G. VERKERKIntegrators of System Technology Ltd, XA9846681Waterkloof, South Africa
Abstract
The power conversion unit will convert the heat energy in the reactor core to electricalpower. The direct-closed cycle recuperated Brayton Cycle employed for this conceptconsists of a primary helium cycle with helium powered turbo compressors and a powerturbine. The helium is actively cooled with water before the compression stages. Arecuperator is used to preheat the helium before entering the core. The start of the directcycle is initiated by a mass flow from the helium inventory and control system via a jetpump. When the PBMR is connected to the grid, changes in power demand can befollowed by changing the helium flow and pressure inside the primary loop. Small rapidadjustments can be performed without changing the helium inventory of the primary loop.The stator blade settings on the turbines and compressors are adjustable and it is possible tobypass reactor and turbine. This temporarily reduces the efficiency at which the powerconversion unit is operating. Larger or long term adjustments require storage or addition ofhelium in order to maintain a sufficient level of efficiency in the power conversion unit.The helium will be temporarily stored in high pressure tanks. After a rise in power demandit will be injected back into the system. Some possibilities how to store the helium arepresented in this paper. The change of helium inventory will cause transients in the primaryhelium loop in order to acquire the desired power level. At this stage, it seems that thechange of helium inventory does not strongly effect the stability of the power conversionunit.
1. Introduction.
The primary cycle used for the heat-transfer process is shown hi figure 1. It is the Rankinecycle, but when used with a single-phase, gaseous working fluid instead of a condensingworking fluid, it is termed the Brayton cycle. It is called the direct Brayton cycle if theworking fluid does not transfer its heat to a secondary (steam)cycle, but instead is used topower the turbine of the generator system directly. Two helium powered turbo compressorsare used to maintain the required pressure hi the system. In order to improve efficiency acounterflow heat exchanger, known as a regenerator or recuperator, is introduced whichtransfers heat from the gas flow into the first compressor towards the gas flow into thereactor. A further increase hi efficiency is obtained by active cooling of the gas with waterbefore each of the two compressors with a pre- and intercooler. A more detailed analysis ofthe power conversion unit is given by Liebenberg [1], The initial filling of the primarycycle is performed by injecting clean helium from high pressure supply bottles into thesystem through a jet pump. This will start the circulation of the helium in the primary cycleand will cause the turbines of the compressors to start rotating and to build up the requiredpressure ratio. When the system is filled up to the point at which the pressure becomessufficient to sustain the operation of the power turbine of the generator system, the plant issaid to be operating at base load. In order to meet an increasing demand hi power output,helium is further injected from the storage tank system until the required or nominal powerlevel is reached. The variations hi demanded power level between base load and nominaloperation can be followed by changing the helium flow hi the primary cycle. Rapid control
195
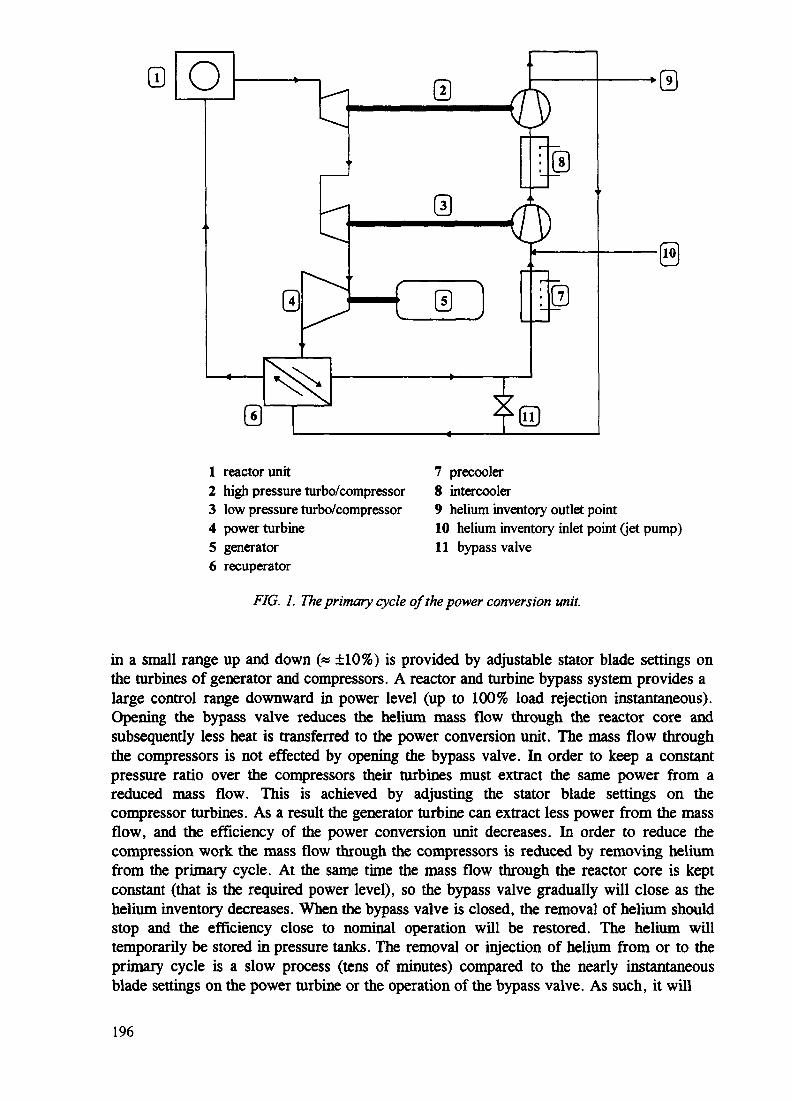
1 reactor unit2 high pressure turbo/compressor3 low pressure turbo/compressor4 power turbine5 generator6 recuperator
7 precooler8 intercooler9 helium inventory outlet point10 helium inventory inlet point (jet pump)11 bypass valve
FIG. 1. The primary cycle of the power conversion unit.
in a small range up and down (« ±10%) is provided by adjustable stator blade settings onthe turbines of generator and compressors. A reactor and turbine bypass system provides alarge control range downward in power level (up to 100% load rejection instantaneous).Opening the bypass valve reduces the helium mass flow through the reactor core andsubsequently less heat is transferred to the power conversion unit. The mass flow throughthe compressors is not effected by opening the bypass valve. In order to keep a constantpressure ratio over the compressors then: turbines must extract the same power from areduced mass flow. This is achieved by adjusting the stator blade settings on thecompressor turbines. As a result the generator turbine can extract less power from the massflow, and the efficiency of the power conversion unit decreases. In order to reduce thecompression work the mass flow through the compressors is reduced by removing heliumfrom the primary cycle. At the same time the mass flow through the reactor core is keptconstant (that is the required power level), so the bypass valve gradually will close as thehelium inventory decreases. When the bypass valve is closed, the removal of helium shouldstop and the efficiency close to nominal operation will be restored. The helium willtemporarily be stored in pressure tanks. The removal or injection of helium from or to theprimary cycle is a slow process (tens of minutes) compared to the nearly instantaneousblade settings on the power turbine or the operation of the bypass valve. As such, it will
196

only be used for longer term adjustments. In the following section the application ofinventory compressors (powered by helium turbine or electrically) will be considered inorder to reduce storage tank size and number, and a simple model will be discussed for thecalculations. In section 3 four different configurations will be presented, section 4 willdiscuss the time behavior, and in section 5 a preliminary conclusion will be drawn as towhich design is most appropriate.
2. Modeling the helium inventory system.
It is possible to design a storage system without extra inventory compressors. The systemcompressors will perform the work required to store the helium in pressure tanks. At thehigh pressure point in the primary cycle, i.e., after the second compressor, helium willflow out of the system into the storage tanks due to the pressure difference between systemand tank. The helium will flow back into the system at the lowest pressure point hi theprimary cycle (before the first compressor) due to the pressure difference between tank andsystem. For such a storage system the following relations can be derived:
f = d-g , (1)
where f is the factor by which the pressure of the helium in the system increases afteroutflow of helium from a storage tank, and d-g the factor by which the pressure of thehelium in the system decreases when helium flows out of the system into the storage tank.In order to prevent waiting for the pressures in tank and system to settle down to anequilibrium (the last part takes the longest tune) and in order to prevent minor oscillationsin mass flow direction that probably will occur around equilibrium, the mass flow fromsystem to tank will be stopped when the ratio of tank pressure divided by system pressureequals g. The value of g will be close to 1, for instance 0.97. For the pressure ratio afterinjection back into the system a similar factor g' is defined, the ratio of system pressuredivided by tank pressure. This factor g' is only important for the volume of the storagetank. If Kj is the pressure ratio maintained by the system compressors, and d (f) the factorby which the pressure in the storage tanks (the system) increases, then can be written:
*,=/•* (2)
The number of stages n (= number of pressure tanks or pressure zones) required toincrease the system pressure from a pressure at base load p0 to a final pressure at nominalpower pf (p0 and pf measured in same pressure point) is given by:
(3)
From equations (1), (2) and (3) follows n according to Kj, g, and p0 , which are designparameters for the system. When n is determined, f can be chosen from equation (3). Thisfactor influences the storage tank size according to the helium mass in the system before
s i) and after (n^ 2) injection from the storage tank:
= in, 2- in, ,= in, ,(/-!) (4)Ps,2 ms,2
197

with ps t and ps 2 the pressures related to m^ and m^ . A similar relation holds for thestorage tank:
-1) (5)v,2
v v 2 - v l v ]Pv,1 f ' S
with pv a (pv,2) the helium density in the tank before (after) injection into the system. Withs = A/?v • Fv follows for the volume of 1 tank:
The model can describe an isothermal or an adiabatic process, the difference will beexpressed in the densities pV)1 and pv 2 •
It can be shown that the volumes of all n tanks will be equal by substituting pv>1 = f2Ps,i (with Ps.i the density hi the primary loop at injection point before injection) inequation (6) and by defining Vs' = nx, j/ps j , with Vs' the effective system volume thatcan be calculated from the average system pressure and temperature at given inventorymass:
(7)l '
If inventory turbo compressors are added to this system (figure 2) with a combinedpressure ratio of K; (depending on mass flow) then K,. has to be substituted by Kj-K; in theprevious equations and the storage tank size becomes VV/K; .
3. Configurations of storage system.
Although it is an advantage to control the helium inventory without using extra inventorycompressors for storage, it requires very large tank sizes. For the PBMR-SA four tanks,each at different pressure and around 200 m3, are required to store the helium whenreducing power output down to base load. This operation is reasonably fast: within 15minutes all tanks are filled. Emptying the tanks might take longer due to a temperaturedrop in the tank because of the adiabatic expansion of the helium into the system. Thepressure will drop with the temperature and the tank can not be emptied to the extentneeded. Injecting warm helium from the primary cycle into the tank, or actively healing ofthe tank might be a solution. Introducing extra inventory compressors to fill the tanksreduces the number of pressure tanks and their size, and influences the speed at which thestorage system operates. Figure 2 shows these options. Turbo compressors will hardlyeffect the speed, being capable of handling large volume flows, but are limited to a certainpressure ratio they can achieve. Positive displacement (reciprocating) compressors are ableto pressurize the tanks up to larger pressure differences, but will slow down the storageprocess.
In order to combine the advantage of not using extra inventory compressors in thestorage system and reducing the tank size, a compromise can be found hi installing twotanks: one tank is the original highest pressure tank operated without additional
198
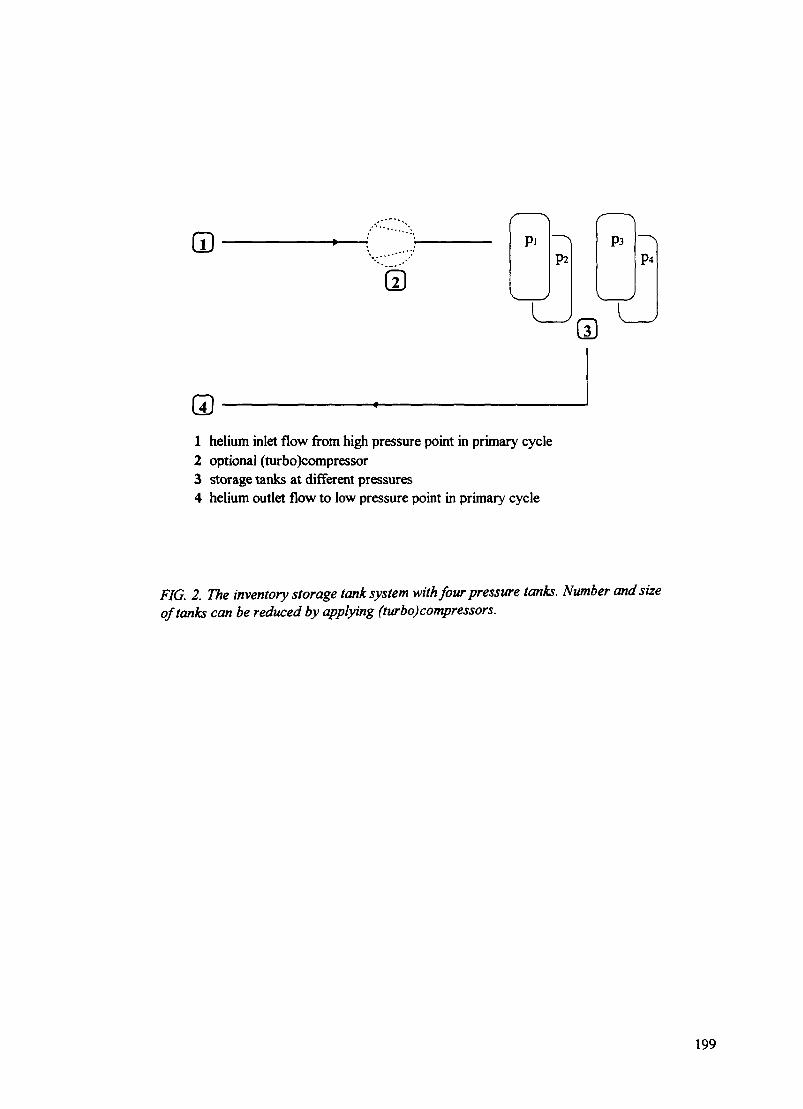
PiP2
P3P4
1 helium inlet flow from high pressure point in primary cycle2 optional (turbo)compressor3 storage tanks at different pressures4 helium outlet flow to low pressure point in primary cycle
FIG. 2. The inventory storage tank system with four pressure tanks. Number and sizeof tanks can be reduced by applying (turbo) compressors.
199

= a valve
-CXh
—tx-CXh
1 helium inlet flow from high pressure point in primary cycle2 positive displacement compressor3 storage tank at high pressure4 intermediate or control tank at lower pressure5 helium outlet flow to low pressure point in primary cycle
FIG. 3. The inventory storage tank system with one high pressure tank and oneintermediate or control tank.
200
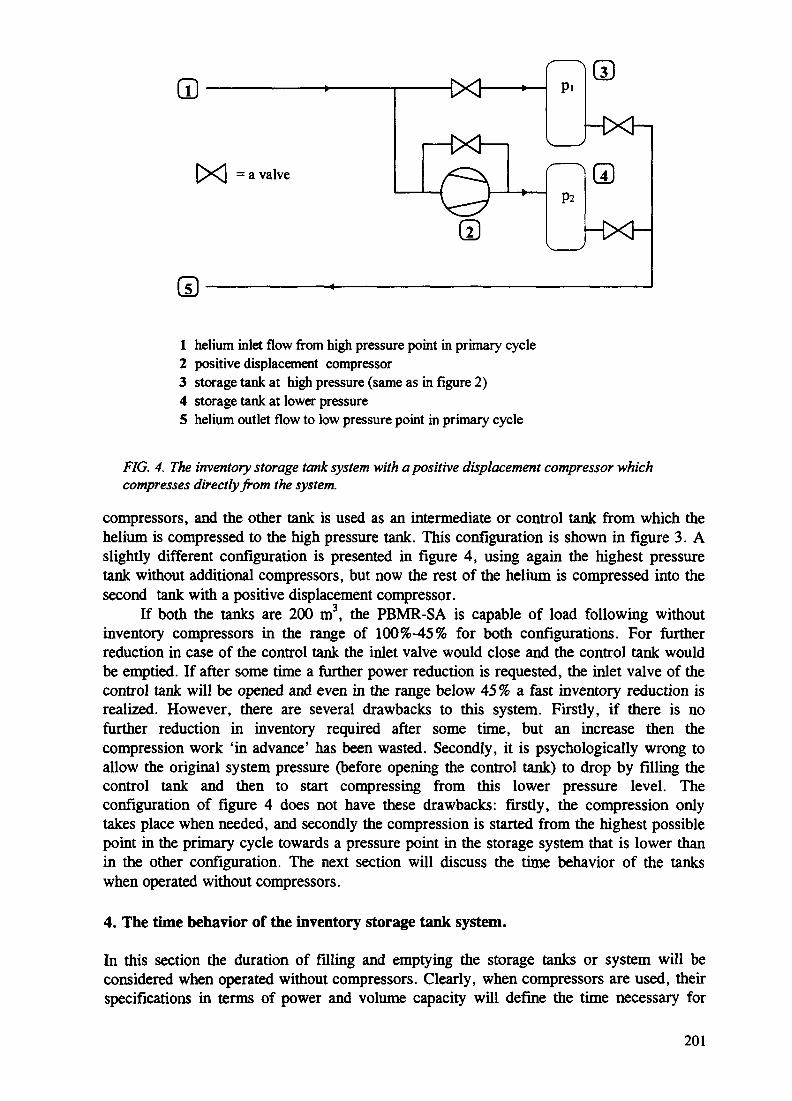
= a valve
-tXH
HXJ-
1 helium inlet flow from high pressure point in primary cycle2 positive displacement compressor3 storage tank at high pressure (same as in figure 2)4 storage tank at lower pressure5 helium outlet flow to low pressure point in primary cycle
FIG. 4. The inventory storage tank system with a positive displacement compressor whichcompresses directly from the system.
compressors, and the other tank is used as an intermediate or control tank from which thehelium is compressed to the high pressure tank. This configuration is shown in figure 3. Aslightly different configuration is presented in figure 4, using again the highest pressuretank without additional compressors, but now the rest of the helium is compressed into thesecond tank with a positive displacement compressor.
If both the tanks are 200 m3, the PBMR-SA is capable of load following withoutinventory compressors in the range of 100%-45% for both configurations. For furtherreduction in case of the control tank the inlet valve would close and the control tank wouldbe emptied. If after some time a further power reduction is requested, the inlet valve of thecontrol tank will be opened and even in the range below 45 % a fast inventory reduction isrealized. However, there are several drawbacks to this system. Firstly, if there is nofurther reduction in inventory required after some time, but an increase then thecompression work 'in advance' has been wasted. Secondly, it is psychologically wrong toallow the original system pressure (before opening the control tank) to drop by filling thecontrol tank and then to start compressing from this lower pressure level. Theconfiguration of figure 4 does not have these drawbacks: firstly, the compression onlytakes place when needed, and secondly the compression is started from the highest possiblepoint in the primary cycle towards a pressure point in the storage system that is lower thanin the other configuration. The next section will discuss the time behavior of the tankswhen operated without compressors.
4. The time behavior of the inventory storage tank system.
In this section the duration of filling and emptying the storage tanks or system will beconsidered when operated without compressors. Clearly, when compressors are used, theirspecifications in terms of power and volume capacity will define the time necessary for
201

storage. When the pressure difference between system and tank is large enough to occasiona 10% or greater decrease in the helium density, the flow is no longer considered to beincompressible. The helium flow from the system at pressure ps(t) into a storage tank atpv(t) through an isentropic nozzle can then be described by solving the energy balance foran adiabatic, horizontal flow process:
with m(t} the mass flow through the nozzle with area A, R the gas constant for helium, Ts
the system temperature. M(t) = v(r) / c is the Mach number, with v(t) the flow velocity andc the velocity of sound in the gas. The ratio of heat capacities at constant pressure andvolume is defined by k=Cp/Cv.
An analytical description for this time-dependent flow process can be found as longas the pressure ratio of system and tank remains larger than the critical pressure ratio:
P,(t)
When equation (9) is valid, the flow velocity will be constant and equal to the velocity ofsound in the gas and the Mach number equals unity. The mass velocity is then proportionalto ps(t) (equation (8)) and independent of the downstream pressure. The flow is said to bechoked. Defining :
and solving the differential equations after substituting equation (9) for the choked process(M = l):
(ID
gives the time !„ for which the flow will be choked:
with J-
The temperature of the system at inlet and outlet point is kept constant by the circulationthrough the reactor core, but the temperature in the tank is not constant. In case of flow
202

into the tank it is reasonable to assume that the temperature in the tank is approximatelyconstant. Firstly there exists a fairly large heat buffer hi the form of the helium present.Secondly the hot system gas is cooled close to the temperature in the tank by adiabaticexpansion. In case of flow out of the tank a satisfactory description for the temperature inthe tank still has to be formulated.
After substituting the values for the PBMR-SA it follows that the storage flow is nolonger choked after 44 seconds (initial storage flow at 2% of the main flow, and graduallydecreasing). The pressure in the system has dropped about 20%. When the flow is nolonger choked, the velocity of flow also becomes tune dependent and a numerical approachof the problem seems more appropriate.
Analytically also interesting is the time tail of the flow process when the densities insystem and tank differ about 10%. Then the gas can be considered as incompressible andan average constant density < p> between tank and system can be assumed. If at that pointAp(to) is the difference in pressure between tank and system, then
and m(t) = A • y2 < p > Ap(0 . (13)
After solving for m(/) follows:
' (14)
This last part of the flow takes just over 2 minutes (starting with storage flow at 2% ofmain flow and gradually decreasing). In reality the diameter of the pipe will be adjustableand the mass flow out or in will be kept at a constant percentage of the mass flow in theprimary cycle in order to maintain stability. Preliminary results from the simulator [2]indicate that storage at a rate of at least 2 % of the primary mass flow does not createstability problems. Higher rates are probably possible and have to be tested.
5. Conclusions.
At this point there is an inclination towards the storage system with four large tankswithout compressors because of its simplicity from control point of view. Also from aneconomical point of view it seems the most advantageous system, provided that thebuilding size has not to be altered significantly due to the large volumes of the tanks.
The system is also fast in terms of in and out flow, but thoughts must still be given tothe extra pressure drop in the tanks due to adiabatic expansion. An adequate descriptionmust be developed to predict this behavior. With the help of the simulator the upper limitfor the storage flow rate will be studied, and what transients are to be expected in thepower conversion unit.
Literature
1. L. Liebenberg, Power Conversion Unit for the South Africa Direct Cycle HTGR. Inproceedings of TCM-HTGR Technology Development, 13-15 November 1996, SouthAfrica.
2. B. Kullman, An Engineering Simulator as a Design Tool. In proceedings of TCM-HTGR Technology Development, 13-15 November 1996, South Africa.
( NEXT PAQE(S) • 203left BLANK

POWER CONVERSION UNIT FOR THE XA9846682SOUTH AFRICAN DIRECT CYCLE HTGR
J.J. LIEBENBERGAtomic Energy Corporation of South Africa Ltd,Pretoria, South Africa
Abstract
The system parameters chosen to optimise the thermal efficiency of the Eskom PBMR whilst maintainingcomponent simplicity is discussed Power Conversion Unit components, which are no\\ at a preliminarydesign stage, comprise a precooler. two turbo units consisting of a turbine driven compressor recuperatorand a power turbine, driving an alternator Design aspects of even component is mentioned and theinventor, method of po\ver control is explained with reference to start-up and shut-down events makingthe system an effective load following device, down to 4% of full power Application of the same designprinciples forHTGRs smaller than 25MWe is discussed
1 SYSTEM DESIGN PHILOSOPHY
A two stage interceded compression, recuperated Bray ton cycle was chosen for the Power ConversionUnit to operate in direct mode with the HTGR With a reactor outlet temperature of 900 °C. the overalltotal pressure ratio for maximum cycle efficiency, based on anticipated component efficiencies, is 2.5 butin order to lower the reactor inlet temperature and reducing turbomachine size, an optimised pressureratio of 2,7 was used Other parameters resulting from such a choice and a reactor thermal rating of 220MW, is given in Table 1 A system electrical output of 100 MW could be expected under Koeberg seawater temperature conditions of 1SPC
The thermodynamic cycle and flo« diagram of the system, operating under full power conditions, isshown in Figure 1. coinciding with the process properties of the various conditions given in Table 1
Contrary to the traditional, an inventon method of power control is utilised Tins causes the reactor inletand outlet temperatures to be constant, minimising thermal stress c\ cling. \\hilst the speed of the turbomachines, its' blade settings, volume flo\\ rates and their pressure ratios are all constant over the entireoperating range, from full to 4% po\\er A requirement that the s\stcm must respond to up to a 10% ofload, step function in load, necessitates variable stator blade geometn on the turbo machines becauseinventon transfer to and from storage is relatively slow Other special measures required to assistinventory control under transient conditions, is discussed later
2 SYSTEM COMPONENTS
Design detail of PCU components, as at this preliminary stage, is gucn belo\\ The design requirementfor the present first phase of the contract is to generate such detail, that reliable cost and performancefigures would be obtained Off-design and detail performance of the turbo machines is therefore notavailable yet The PCU general assembly is shown in Figure 2
2 1 LP TURBO
The LP Turbo consists of a 9 stage axial flow compressor mounted on the same shaft as its driving singlestage, parallel flo\\ axial turbine The rotor is suspended by electromagnetic bearings Rotor speed ischosen such that an optimised specific speed is found without compromising turbine blade stressesElementary turbine rotor blade cooling will be utilised to increase blade creep life and mtbo Stator bladeshave a single cooling channel which \\ill also scavenge hot gas ingress to the disc front and the inter-discspace
205

Table 1. PMBR Process Parameters
Position
Cvcle
Turbo
System
i ParameterCore mass-flowReactor thermal powerReactor outlet temperatureAlternator electrical outputOverall pressure ratioCooling water temperatureReactor cooling massflovvAlternator efficiencyCycle efficiencySystem efficiency
Unit HP compShaft speed r/min 18 000Isentropic effy % 87Inlet diameter mm 476Hub-tip ratio — 0,7Blade tip speed m/sec 449Load coefficient — 0,306Flow coefficient — 0,51No stages — 9Power MW 48,5Cooling flow kg/sec
Condition Pressure MPa
1 2,5932A 4,2772a 4,2712 7,03 6,9724 6,8255A 5,5815a 4,4985 2,656 2,594
Unitkg/secMW°CMW—°Ckg/sec%%%
LPcomp HPturb15000 1800087 89586 5730.664 0,89460 5400,306 1,60,51 0,779 1+148,5 49.1
0.13
abs Temperature °
2710526103558900820740570141
Value117.8220900101.62.7184,497,547.946.2
LPturb
15000896610,905201J0,751 + 149,20.12
C
Power turb
30009014870.9282342,21,028105,312.22
206
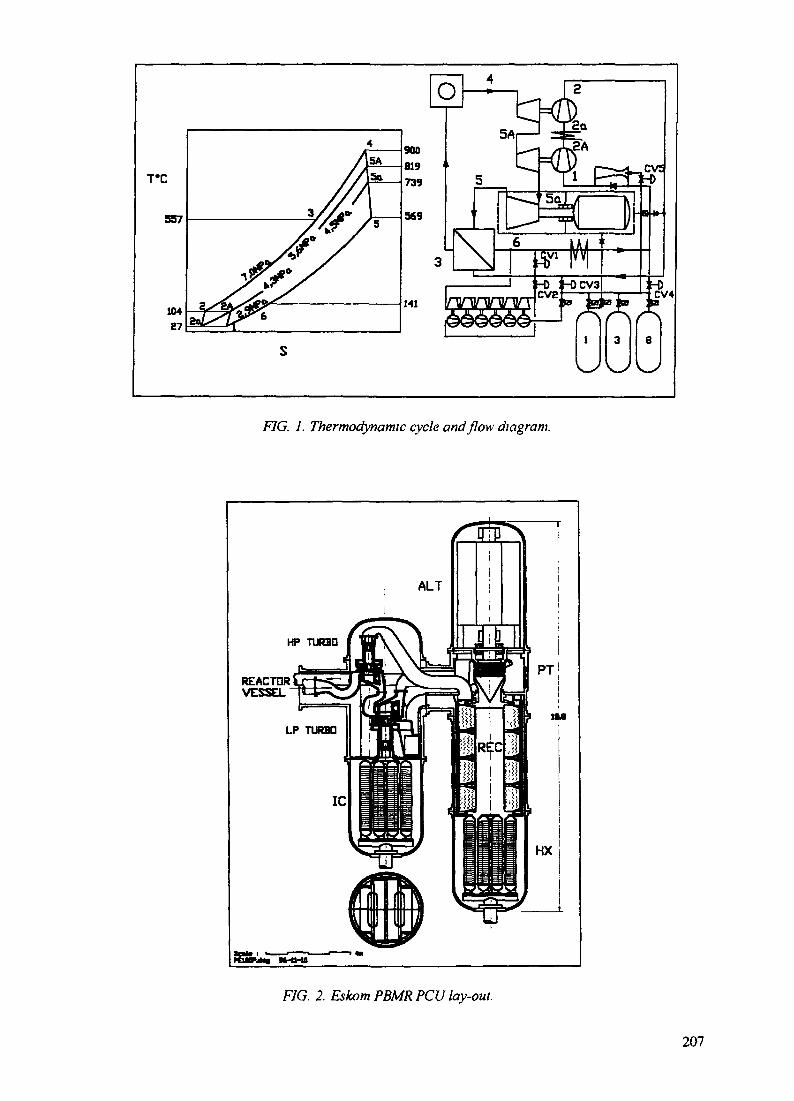
. 7. Thermodynamic cycle and flow diagram.
HP TURBD
REACTORVESSEL
FIG. 2. EskomPBMRPCU lay-out.
207

14.5
Seal*PC3U*g 96-11-10
FIG. 3. 35MWe PCU lay-out.
ELECTROMAGNETIC THRUST BEARINGRADIAL ELECTROMAGNETIC BEARING
— 9 COMPRESSOR STAGES
RADIAL ELECTROMAGNETIC BEARING
DOUBLE ENTRY TURBINE
TURBINE INLETTURBINE OUTLETPARTICLE SEPARATOR
FIG. 4. HP Turbo lay-out.
208

Mechanical lay-out is shown in Figure 4 The turbine end overhangs the radial bearing, so that the bearingcompartment could be kept at a low temperature It also obviates the need to cross the hot turbine streamfor bearing services Compressor and turbine is mounted such, that minimum thrust force is generatedThe turbo compartment is kept at system high pressure (condition 3) from where cooling and sealing flowcould be drawn
Apart from improved maintenance resulting from the electromagnetic bearing having no friction, andtherefore no wear, the absence of vibration transmitted to the base structure is also an advantage Rotordynamics is designed such that the bending frequency is at least 30% higher than the maximum over-speed rotational frequency This simplifies the control algorithm, making the use of identical bearingcomponents for the two turbos possible and improves bearing reliability
Aerodynamic design is biased towards maximum efficiency \\ith compressor and turbine characteristicsshown in Table 1 Secondary losses on the compressor blades will be counteracted with a small blade tipclearance due to the electromagnetic bearing and casing treatment over the rotor swept area
Compressor and turbine is fitted with variable geometry stator blades Turbine mass flow could therebybe changed from 120% down to 5% of nominal The compressor could only handle +25% down to -22%of design volume flow rate at the design pressure ratio The 10° blade angle adjustment needed for thisrange can be accomplished with servo-actuators within half a second
2 2 HP TURBO
The HP Turbo is a scaled-down version of the LP Turbo, with practicalK the same design parametersThe higher turbine inlet temperature makes rotor blade cooling more critical and it requires a largercooling gas flow rate Comparative dimensions of the two turbos are given in Table 1
23 POWER TURBINE
The mechanical design of this machine is stretched towards a very high hub-tip ratio of 0,928, caused bythe requirement that turbine speed has to be 3000 r/min, driving a 50 Hz alternator directly Thismechanical complication more than compensate for the gearbox or frequenc\ converter which wouldotherwise had to be used The power turbine and alternator is protected from an overspeed condition if thenormal control malfunctions, by a turbine by-pass valve
Under full power the turbine has a load coefficient of 2.2 and a flo\\ coefficient of 1 02 at a blade tipspeed of 234 m/sec, which are all in line for a high efficiency The stator blades are adjustable over arange of 80% to 150% of nominal mass flow
The rotor shaft is also of overhung construction, mounted directly on the alternator shaft the rotor issuspended on electromagnetic bearings, which are located in the alternator compartment This volume iscontinuously purged through filters from condition 2a, escaping via a labyrinth to condition 6. whichanchors the pressure in the compartment
24 RECUPERATOR
A compact design utilising a perforated fin plate has been used, because of the very large heat transferwhich has to be accomplished by this unit The flow channels are wedged in order to fit into cylindricalformat, as shown by the lay-out drawing. Figure 5 The 1300 sectors are joined together by a top andbottom mounting nng to form a donut shaped cassette The pressure difference between the two sides is4MPa and only a small defect will cause a major mass-flow by -pass It is therefore important to finallyinspect and locally repair the construction, which is possible with this lay -out A further advantage is inthe system integration, where no complicated ducting is required
Four cassettes are stacked on top of each other to finally compose a 3 76 m length of finned counter flowchannel Recuperator performance is listed in Table 1
209
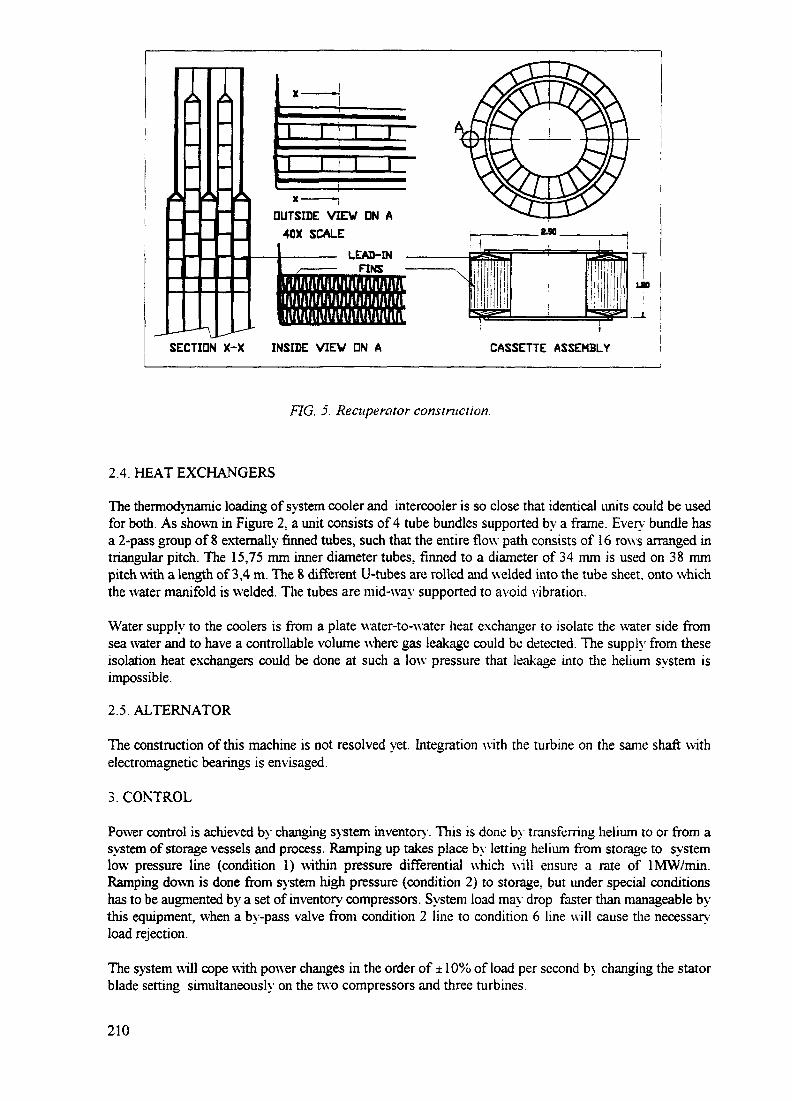
I I
•\SECTION X
X ————
i r 1 1T 1^
X —————
1 1
OUTSIDE VIEW DN A40X SCALE
INSIDE VIEW ON A
MC.
CASSETTE ASSEMBLY
FIG. 5. Recuperator construction.
2.4. HEAT EXCHANGERS
The thermodynamic loading of system cooler and intercooler is so close that identical units could be usedfor both. As shown in Figure 2, a unit consists of 4 tube bundles supported by a frame. Every bundle hasa 2-pass group of 8 externally finned tubes, such that the entire flow path consists of 16 rows arranged intriangular pitch. The 15.75 mm inner diameter tubes, finned to a diameter of 34 mm is used on 38 mmpitch with a length of 3,4 m. The 8 different U-tubes are rolled and welded into the tube sheet, onto whichthe water manifold is welded. The tubes are mid-way supported to avoid vibration.
Water supply to the coolers is from a plate water-to-water heat exchanger to isolate the water side fromsea water and to have a controllable volume where gas leakage could be detected. The supply from theseisolation heat exchangers could be done at such a low pressure that leakage into the helium system isimpossible.
2.5. ALTERNATOR
The construction of this machine is not resolved yet. Integration with the turbine on the same shaft withelectromagnetic bearings is envisaged.
3. CONTROL
Power control is achieved by changing system inventory. This is done by transferring helium to or from asystem of storage vessels and process. Ramping up takes place by letting helium from storage to systemlow pressure line (condition 1) within pressure differential which will ensure a rate of IMW/min.Ramping down is done from system high pressure (condition 2) to storage, but under special conditionshas to be augmented by a set of inventory compressors. System load may drop faster than manageable bythis equipment, when a by-pass valve from condition 2 line to condition 6 line wi l l cause the necessaryload rejection.
The system will cope with power changes in the order of ± 10% of load per second b\ changing the statorblade setting simultaneously on the two compressors and three turbines.
210

Table 2. 35MW Svstem Process Parameters
Position Parameter Unit ValueCycle Core mass-flow kg/sec 58.7
Reactor thermal power MW 84Reactor outlet temperature °C 900Alternator electrical output MW 36.4Overall pressure ratio — 1 .9Cooling water temperature °C 28Reactor cooling massflov, kg/sec 2.4Alternator efficiency % 96Cycle efficiency % 43.8System efficiency % 41.6
Turbo Parameter Unit
Shaft speed r/minIsentropic effy %Tip diameter mmHub-tip ratio —Blade tip speed m/secLoad coefficient —Flow coefficient —No stages —Power MWCooling flow kg/sec
System Condition
12A2a2345A5a56
HPcomp LPcomp HPturb
2470081467—6030,75
117.0
Pressure3.6845,0785,0787,06,9886,9746.0995.293,7123.684
22 10081523—6060,75
I17.0
MPa abs
24700893680.844761.50,721 + 117.20.1
Temperature40933789647900845789666148
LP turb
22 100894080.844731.50.651 + 117.20.09°C
Po\\erturb
30009013000.942051.650,79838.31.72
Table 3. PCU Component cost, US $'000
Component
HP TurboLP TurboPower turbineRecuperatorCoolerIntercoolerPressure vesselsPipeworkAlternator
Total
Eskom PBMR 35 MWe Unit
1 8002000230035001 2001 2003200800
500021000
9001 0001 1001 800600600
1 900400
190010200
211

33 START-UP
The system will be brought into po\\er reach state by the following steps
Fill system with helium at 150kPa abs
Start low, volume cooling water circulation
Start the reactor and ramp the temperature to 406C
Energise the jet pump from the low pressure storage vessel This \\ill cause a helium circulation inthe system and if theturbo's blade angles are set correctly, they \\ill start to turn and accelerate
Ramp reactor temperature to 900°C and increase inventory to 20% The by-pass valve must beused to control the speed of the turbos This is necessary to ensure an alternator enclosure pressureof at least 500kPa abs. in order to avoid flash-over
The power turbine can now be brought to synchronous speed by means of it's stator blades andswitched to take over the house load Full cooling water circulation could then be s\\ itched
When switched to the gnd. the system can start at any po\\er level lo\\er than 20% with the closureof the by-pass valve and ramp from there at a rate of IMW/min
4 SMALLER SYSTEMS
By sacrificing power capacity, a reactor system could be built which will never need a re-fuelling activitySuch a system, using a 20 year PAP reactor with centrifugal compressors instead of axial machines, isconfigured to be manufactured with the present SA capability The penalty paid by such a system is
Power capacity 35MWe vs lOOMWe
System efficiency 43% vs 47%
Although the fuel recycling system is absent, the reactor vessel is marginally smaller in diameter,but longer to hold the 20 years' supply The reactor cost per MW could then be more than doublethat of the Eskom PBMR version
A typical lay-out is shown in Figure 3. with coinciding process parameters in Table 2 The turbinearrangement of the turbo units is shown as two stages in series, whereas a parallel arrangement \\ill beused, as with the Eskom PBMR machines
5 PCUCOST
No cost figures are available at this stage Cost objectives of the PCU components are given in Table 3.quoted in US $
212
XA9846683SIMULATION OF THE PEBBLE BED MODULAR REACTORNATURAL AIR CONVECTION PASSIVE HEAT REMOVAL SYSTEM
M.L. DAMSIntegrators of System Technology Ltd,Waterkloof, South Africa
Abstract
Cooling of the Pebble Bed Nuclear Reactor under evaluation in South Africa is primarilyeffected by the flow of helium through the cavity which contains the nuclear fuel.However, apart from this, a certain amount of heat flows from the reactor cavity, throughthe graphite barrel and reactor vessel to the containment building and ultimately to theenvironment During normal operation this passive heat loss represents approximately1MW for a 100MW reactor and constitutes an undesirable loss of power. In the event of ashutdown or loss of main coolant, however, this passive heat removal is relied upon toremove the decay heat from the core. A study was initiated to simulate the process of thisheat removal to provide an indication of the maximum vessel temperature and powertransfers after shutdown. However, there is a lack of precise data indicating values forthermal conductivity, heat transfer coefficients, heat capacities or even densities. Thispaper describes the assumptions made and the manner in which these data were estimatedso as to provide what is hoped to be a reasonably accurate estimate of the behaviour ofthe passive heat removal process.
1. INTRODUCTION
The Pebble Bed Nuclear Reactor being studied in South Africa is a high temperature helium coolednuclear reactor with a Brayton cycle for the power conversion unit. The cooling of the reactor ismainly effected by the flow of helium through the cavity which contains the nuclear fuel. Apartfrom that, however, a certain amount of heat flows from the reactor cavity, through the graphitebarrel and reactor vessel to the containment building and ultimately to the environment. This iswhat is termed the passive heat loss from the core. During normal operation this heat loss amountsto approximately 1MW for a 100MW reactor and constitutes an undesirable loss of power. In theevent of a shutdown or loss of main coolant, however, this passive heat removal is relied upon toremove the decay heat from the core.
The purpose of this study was to simulate this process of heat removal to give an indication of themaximum vessel temperature and power transfers after a shutdown. This study formed part of thework involved in producing an engineering simulator for the pebble bed reactor.
The main problem encountered during this study was the lack of precise data indicating values forthermal conductivity, heat transfer coefficients, heat capacities or even densities. This paperdescribes the assumptions made and the way in which these data were estimated so as to providewhat is hoped to be a reasonably accurate estimate of the behaviour of the passive heat removalprocess.
213

2. DESIGN BASIS
Figure 1 shows the civil structures that were taken into account in the study.
Discussing these briefly, we see the reactor cavity (labeled "gas" in the figure), surrounded by agraphite barrel. The incoming helium flows through channels inside this barrel before entering thecavity. Between the barrel and the reactor vessel there is a narrow space that is intended to carry asmall "leak flow" of cold helium taken from the highest pressure point of the main coolant loop.This leak flow has a temperature of approximately 90 degrees Celsius and keeps the reactor vesselcool. The leak flow enters the cavity after cooling the vessel.
For power calculations, the graphite barrel is in fact considered to be made up of three parts. Aninner graphite barrel, a middle graphite barrel through which the inlet channels pass and an outercarbon insulating barrel.
The vessel exterior is in contact with the air in the containment building. A passive coolingstructure consisting of hollow panels assists in cooling the vessel. This is called the reactor cavitycooling system (rccs). Air flows from the environment into the lower part of the panels, upthrough panels and out back to the environment through a chimney. The vessel transfers heat to therccs via conduction and radiation. The main purpose of the rccs is to keep the vessel cool in thecase of failure of the "leak flow" cooling. A similar vent cooling system exists with the purposeof cooling the containment pit.
concrete
Figure 1 : Passive Heat Removal Structures - Plan
pitrccs cooling
concrete
Figure 2 : Passive Heat Removal Structures - elevation
214

The civil structures, and the spaces between them have the following dimensions (SI units). Thesedimensions were obtained from civil drawings.
Table 1 : Passive Heat Removal Structure Dimensions
structure
core gasgraphitecarbon (steelliner)HE inletsHe leak flowVesselvessel-rccsairRCCS steelRCCS airpit airpit vent steelpit vent airconcrete
innerdiam-3.64.7
-5.86.06.3
6.56.57.1999.6
outerdiam3.64.75.8
0.16.06.36.5
7.17.199.39.312.4
Hght
101414
1114169
9920141422
Thickness-0.50.5
-0.10.150.1
0.30.30.950.150.151.4
innerarea-158206
-255300178
183183446395395663
outerarea158206255
221263316183
200200565409409857
vol
57113113
5.5264618
305748061601064
The structures are assumed to have the following characteristics (SI units). The density of gas iscalculated using the ideal gas law. (R for helium = 2078 J/KgK. R for air = 287 J/KgK)
Table 2 : Passive Heat Removal Structures Characteristics
structure
core gasgraphitecarbon (steelbarrel)HE inletsHe leak flowVesselvessel-rccsairRCCS steelRCCS airpit airpit vent steelpit vent airconcrete
density(Kg/m3)
P/RT22403510
P/RTP/RT7850P/RT
7850P/RTP/RT7850P/RT2400
thermalconductivity(W/mK)
see note1688.9
see notesee note55see note
55see notesee note55see note1.5
specificheatcapacity(J/KgK)5193710854
519351935001005
500100510055001005880
emissivity(W/mK4)
--0.4e-8
--2.4e-8-
0.4e-8--0.4e-8-5.3e-8
NOTE
The transfer of heat from a solid wall to a gas (helium or air) and vice versa is calculated using theGrigull equation which produces a heat transfer coefficient dependent on various parameters of thegas and the wall and which takes into account natural convection.
215
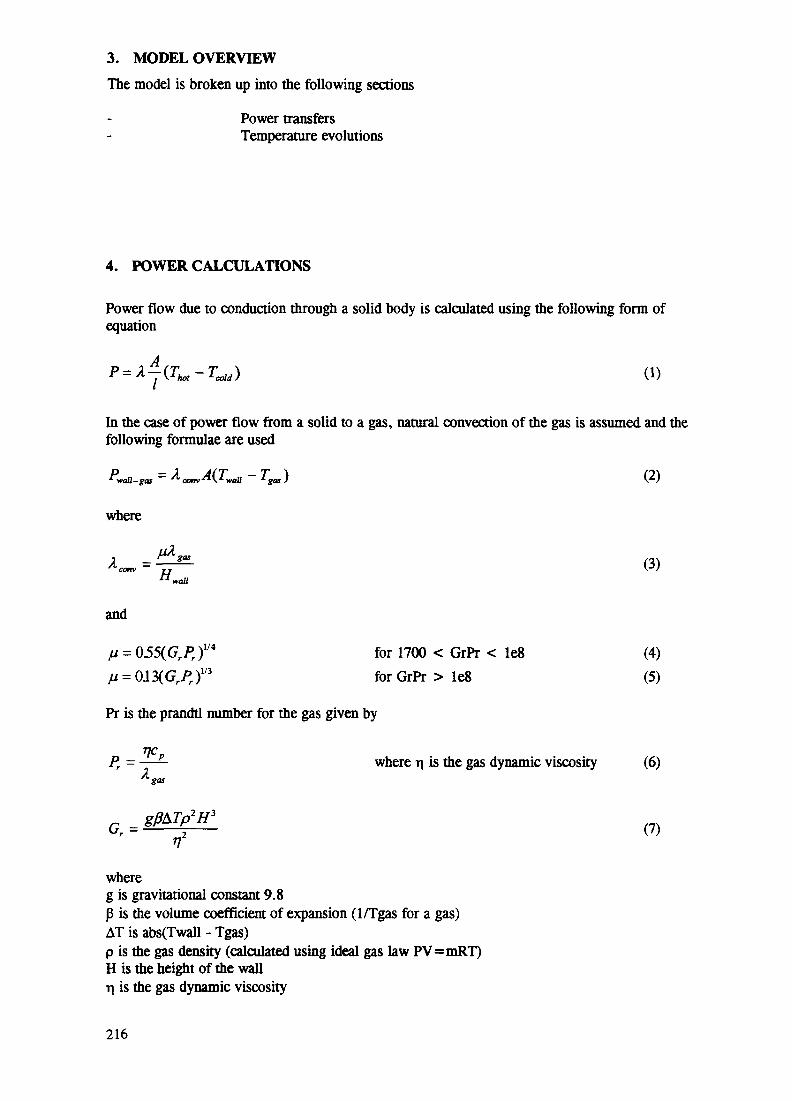
3. MODEL OVERVIEWThe model is broken up into the following sections
Power transfersTemperature evolutions
4. POWER CALCULATIONS
Power flow due to conduction through a solid body is calculated using the following form ofequation
In the case of power flow from a solid to a gas, natural convection of the gas is assumed and thefollowing formulae are used
fwaU-gas = *• conv^d^waU ~ T-gas ) (2)
where
•«**> -•"wofl
and
H = 0.55(C?rPr)"4 for 1700 < GrPr < Ie8 (4)H = OJ3(C7rPr)1/3 for GrPr > Ie8 (5)
Pr is the prandtl number for the gas given by
770Pr = — — where TI is the gas dynamic viscosity (6)
^ gas
Gr = ^^———— (?)
whereg is gravitational constant 9.8P is the volume coefficient of expansion (1/Tgas for a gas)AT is abs(Twall - Tgas)p is the gas density (calculated using ideal gas law PV=mRT)H is the height of the wallTI is the gas dynamic viscosity
216
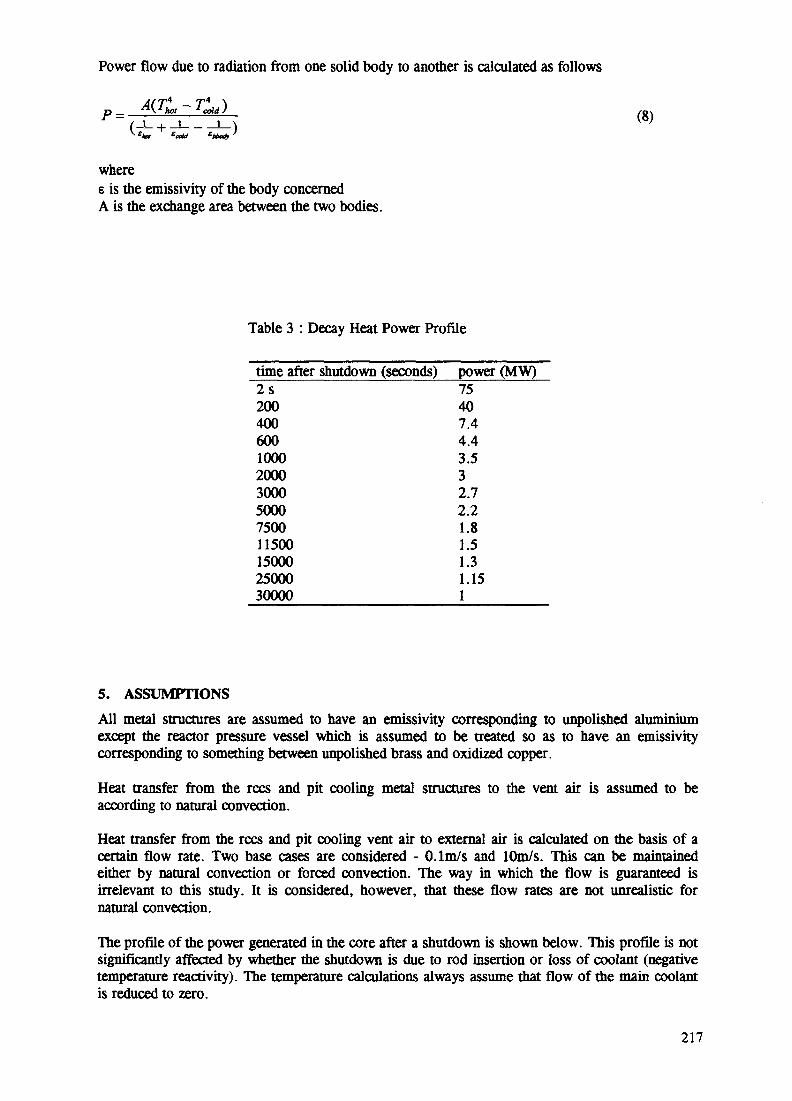
Power flow due to radiation from one solid body to another is calculated as follows
D _
whereE is the emissivity of the body concernedA is the exchange area between the two bodies.
Table 3 : Decay Heat Power Profile
time after shutdown (seconds) power (MW)2s 75200 40400 7.4600 4.41000 3.52000 33000 2.75000 2.27500 1.811500 1.515000 1.325000 1.1530000 1
5. ASSUMPTIONSAll metal structures are assumed to have an emissivity corresponding to unpolished aluminiumexcept the reactor pressure vessel which is assumed to be treated so as to have an emissivitycorresponding to something between unpolished brass and oxidized copper.
Heat transfer from the rccs and pit cooling metal structures to the vent air is assumed to beaccording to natural convection.
Heat transfer from the rccs and pit cooling vent air to external air is calculated on the basis of acertain flow rate. Two base cases are considered - O.lm/s and lOm/s. This can be maintainedeither by natural convection or forced convection. The way in which the flow is guaranteed isirrelevant to this study. It is considered, however, that these flow rates are not unrealistic fornatural convection.
The profile of the power generated in the core after a shutdown is shown below. This profile is notsignificantly affected by whether the shutdown is due to rod insertion or loss of coolant (negativetemperature reactivity). The temperature calculations always assume that flow of the mam coolantis reduced to zero.
217

6. POWER FLOW PATHS
The following power flows are considered
Conduction with natural convection coefficientcore gas to graphite inner barrelgraphite mid barrel to inlet gas
Conductiongraphite inner to graphite mid barrelgraphite mid barrel to carbon outer barrel
Conduction with natural convection coefficientcarbon outer barrel to helium leak flow pathhelium leak flow path to vessel
Radiationcarbon outer barrel to vesselvessel to rccsvessel to concrete
Conduction with natural convection coefficientvessel to air between vessel and rccsair between vessel and rccs to rccsair between vessel and rccs to pit airrccs to pit airpit air to pit cooling stackpit air to concreterccs to vent airpit cooling stack to vent air
Radiationrccs to pit cooling stackpit cooling stack to concrete
Power flow due to mass flowHelium flow through coreHelium flow through leak flow pathAir flow in rccs ventAir flow in pit cooling vent
Optionally, power by conduaion from the vessel directly to the rccs is considered.
7. TEMPERATURE EVOLUTIONS
Temperature in a particular structure is calculated as follows
(H_ _ (U>in - If out)dt mcp
wherem is the mass of the structureCp is the specific heat capacity of the structure
218

8. TEST SCENARIOS
The following test cases were simulated. Temperatures are shown in Kelvin.
8.1 LOFC (with leakflow)
Main helium flow is reduced to zero but the leak flow is maintained.The rccs is assumed to be separated from the vessel.
Results are shown in figure 3.
The fuel and gas temperatures rise sharply at first and then start to fall off as the decay powerreduces and the heat is slowly evacuated to the graphite barrel.At the same time the graphite temperature rises slowly.The vessel temperature stays constant due to the cooling effect of the helium leak flow.
8.2 LOFC (no leakflow) - vent air flows about 0.1 m/s
Main helium flow is reduced to zero and helium leak flow is lost.The rccs is assumed to be separated from the vessel.An air flow of 0. Im/s is assumed in the cooling stacks which seems conservative when thinking ofnatural convection at a temperature of about 320K.
Results are shown in figure 4.
The vessel temperature rises due to the loss of leakflow cooling. A peak of about 650K seemslikely.
83 LOFC (no leakflow) - vent air flows about 10 m/s
This is the same test as above except that the vent air flow is assumed to be lOm/s.
Results are shown hi figure 5.
The difference in vessel temperature is very small. A peak of about 630K seems likely.The effect on pit air temperature is more pronounced.
8.4 LOFC (no leakflow) - vent air flow lOm/s - vessel joined to rccs
This test is the same as above but the rccs is assumed to be physically attached to the vessel. Thethermal conductivity is assumed to be that of steel divided by ten. This is to allow for perhaps onlya 10% effective join between rccs and vessel (to allow inspection channels or air flow paths forexample)
Results are shown in figure 6.
The result is that the graphite barrel temperature is marginally reduced and that the vesseltemperature is significantly reduced (without apparent effect on pit air temperature however).A peak vessel temperature of about 550K seems likely.
219
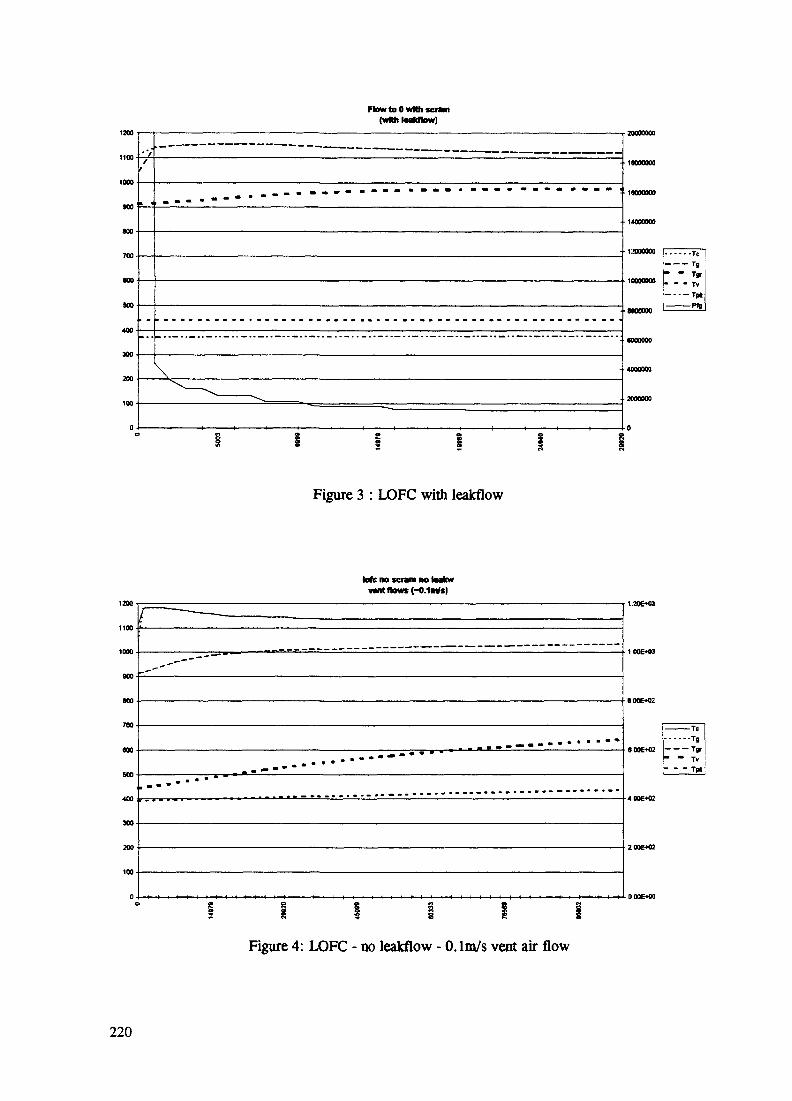
1100
1000
400
c
/
• 1
Flow too with scram(wKh taakftow)
._ —————————————————— _ ___
\
^ ——— —————
I § 1 1 I I
10000000
14000000
14000000
12000000
8000000
0000000
400QQQQ
2000000
Figure 3 : LOFC with leakflow
toft no scram no >Mkwwntftowt(-O.lnVf)
1200
1100
1000
900
no
TOO
300
200
100
0
Figure 4: LOFC - no leakflow - 0. Im/s vent air flow
220
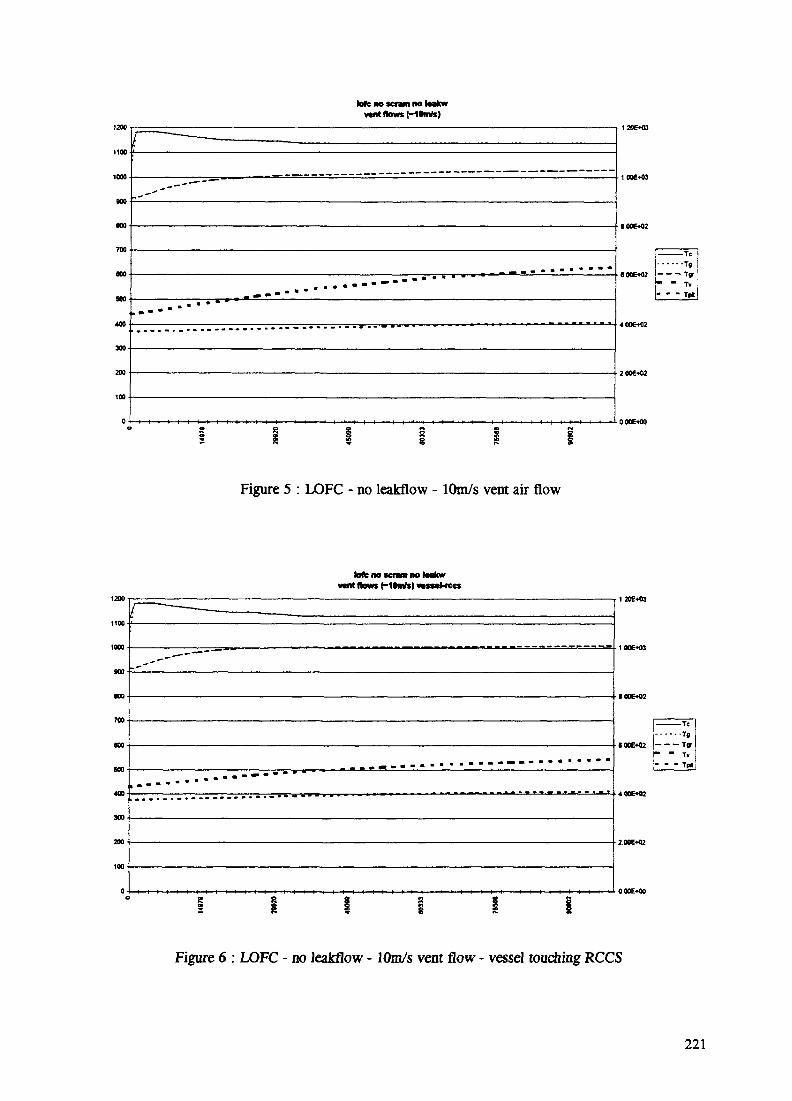
tofc no scnm no taakwvent flows (-10tnfe)
1100
1000
900
100
0
6 OOE«02 — — —
Figure 5 : LOFC - no leakflow - lOm/s vent air flow
tote no scnm no toakwvtnt flows (-10mfe)i
no
TOO
400
300
200
100-
0
«OOE«02 -TgrTV
Figure 6 : LOFC - no leakflow - lOm/s vent flow - vessel toucbing RCCS
221
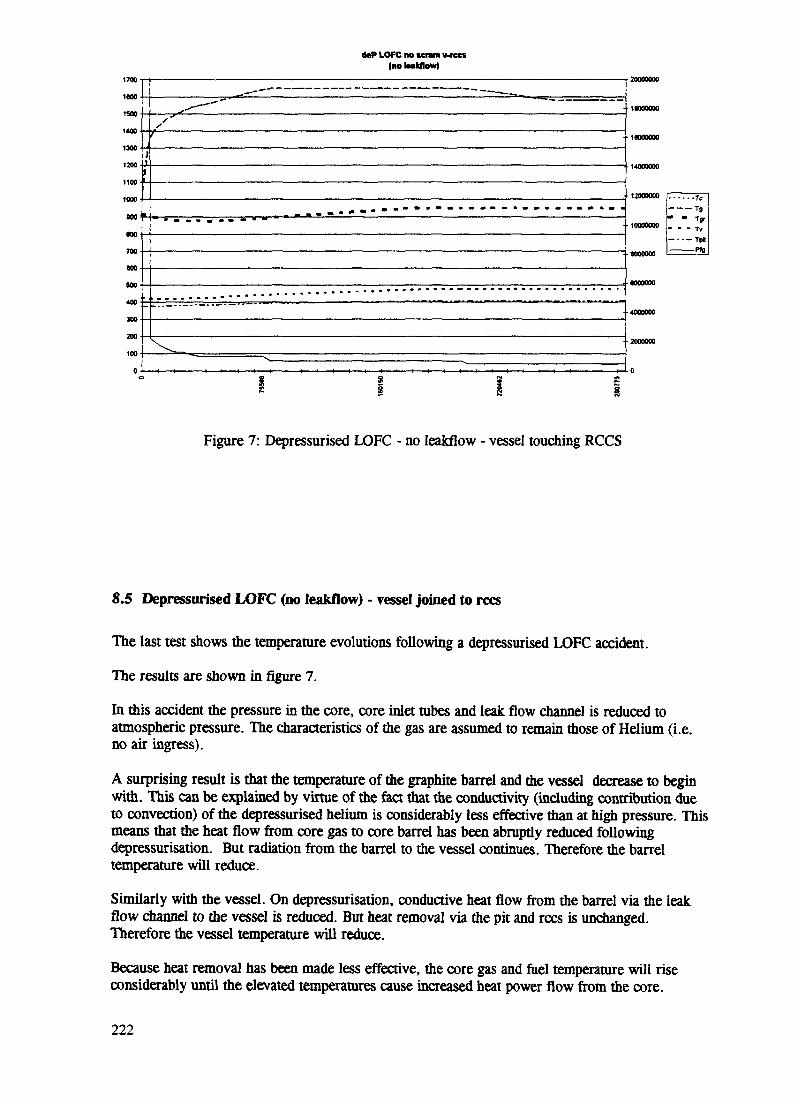
ttf LOFC no scnm V-KCS(no toakflow)
1700
18001500
1400
1300
1200
1100
1000
BOOWO700WO500400
300
200
1000
• 16000000
; 12000000
14000000
• 10000000 .
• 6000000
2000000
Figure 7: Depressurised LOFC - no leakflow - vessel touching RCCS
8.5 Depressurised LOFC (no leakflow) - vessel joined to rccs
The last test shows the temperature evolutions following a depressurised LOFC accident.
The results are shown in figure 7.
In this accident the pressure in the core, core inlet tubes and leak flow channel is reduced toatmospheric pressure. The characteristics of the gas are assumed to remain those of Helium (i.e.no air ingress).
A surprising result is that the temperature of the graphite barrel and the vessel decrease to beginwith. This can be explained by virtue of the fact that the conductivity (including contribution dueto convection) of the depressurised helium is considerably less effective than at high pressure. Thismeans that the heat flow from core gas to core barrel has been abruptly reduced followingdepressurisation. But radiation from the barrel to the vessel continues. Therefore the barreltemperature will reduce.
Similarly with the vessel. On depressurisation, conductive heat flow from the barrel via the leakflow channel to the vessel is reduced. But heat removal via the pit and rccs is unchanged.Therefore the vessel temperature will reduce.
Because heat removal has been made less effective, the core gas and fuel temperature will riseconsiderably until the elevated temperatures cause increased heat power flow from the core.
222

9. CONCLUSION
The conclusions that can be drawn from the above study are the following.
Firstly, the assumptions made for characteristic data and coefficients produced realistic resultswithout having had the need to tune them to expected results.
Natural air convection alone appears capable of limiting the vessel temperature to below 6SOK (380degrees C). The cooling of the reactor vessel can be dramatically improved by having conductivecontact between the vessel and the cooling stack.
The effect of reduced air flow in the cooling stacks has a minimal effect on the vessel and coretemperatures in the time scales considered in mis study. The consequence of this is that a failure orblockage of the stacks need not be considered important since one has about 10 hours available forcorrective action.
223

FOLLOW UP ON AIR COOLED PASSIVE HEAT REMOVAL
During the presentation on the air cooled passive heat removal system it was observed that vent flows inthe rccs and pirvent stacks of 0. Im/s could not possible evacuate the decay heat of the core and that ventflows of lOm/s were unrealistic.
The pages below indicate power flows and heat xfer coefficient in the rccs at beginning and end of atypical transient. On studying the data the following observations can be made.
It is important to avoid drawing false conclusions from the passive heat removal paper. Remember thatthe initial conditions for all the transients studied were a steady state full power core that had been cooledby the helium bypass flow so that the vessel and graphite barrel were cool. This means that during theshutdown transient in which helium bypass flow is absent a lot of the energy that is produced becomesstored in the graphite barrel and vessel and goes into heating these structures up. This energy is laterdrawn out slowly on the conntainment side to be evacuated by the cooling stacks at greatly differing ratesdepending on the vent flow of 0.1 or 10.0 m/s. Studying the data below we see that at 0.1 m/s the powerflow out of the stacks after 3 hours is about 25KW each - virtually nothing. At 10 m/s the power flowafter 3 hours is about 100KW in the rccs and about 176KW in the pit cooling stack -just over 1/4MWtogether.
This means that the air cooling system is able to maintain the vessel temperatures at levels shown in thepaper only if the initial condition is as stated above and presuming that the shutdown occurs in a normalway. A sustained ATWS with longterm elevated temperatures - for example - would most likely result inelevated temperatures of varying degrees in different parts of the system. At best, therefore, the air cooledsystem can provide a support service together with other cooling structures to provide vessel cooling anddecay heat evacuation.
A quick aside to look at the approximate amount of energy that is stored in the graphite and vessel duringthe transients described in the paper.
The relevant data areMgraphite = 508480Kg Mvessel = 361 lOOKgCp graphite = 710 Cp vessel = 588
Consider a case where in 30 hours we observe the following temperature risesdelta T graphite =110 delta T vessel = 200
The total energy stored in the system is given by Q = M.Cp.dTQgraphite = 39 7e9 J Qvessel = 42.4e9 J
The total energy evacuated by the stacks is very approximately estimated by a power flow of 27.6KW to be27.6e9 J
The above three terms total to 109.7e9 J
Compare this to the decay heat produced after 30hrs estimated at about 117e9 J.
The missing energy can be easily accounted for as being stored in various other structures such as thecooling stack metal parts and the concrete.
224

Vent flows at lOm/s
tWrccs00071 941000071 942000071 943000171 944000271 945000271 946000071 94
9400 90719495005171 949600 1271 949699 7371 949799 3471 949898 9571 949998 5671 94
Pv-amn Rv-rccs Prccs-air PrccsflowWpvent HXcoeff-rccsair Wvolrccs Wvolpvent000 000 000 50611509 000 5422661953 96 0 00 10 00 10 009886528 6407992 9919220 99192615396 557 1000 10009953282 6427724 9919220 99192615396 557 1000 10009995682 6451193 9919220 99192615396100323539610069053961010585396
1360325396136418539613680653961371935396137581539613796953961383575396
55780557
98557
42557
08561
97561
13561
63561
36562
36562
59562
100064747 02100064982 491000
65218351000
89316531000
89612 261000
89908 521000
90205 331000
90502 69100090800 59100091099051000
100099192 20
100099192 20
100099192 20
1000
1000
1000
1000
1000
1000
1000
1000
101976
102057
102137
102217
102297
102378
102458
7705
34
56
90
1349
9919261
9919261
9919261
101968 37
102047 80
102127 23
102208 87
10228831
102369 95
102449 38
Ppvent-air
189069 8618891225
188757 03
188601
188446
188291
176198
176198
176198
176198
176198
176198
176198
80
59
45
77
77
77
77
77
77
77
Ppventf
189069188922
188767
188611
188456
188300
176208
176208
176208
176208
176208
176208
176208
low
9870
14
59
03
47
38
3838
38
38
38
38
225
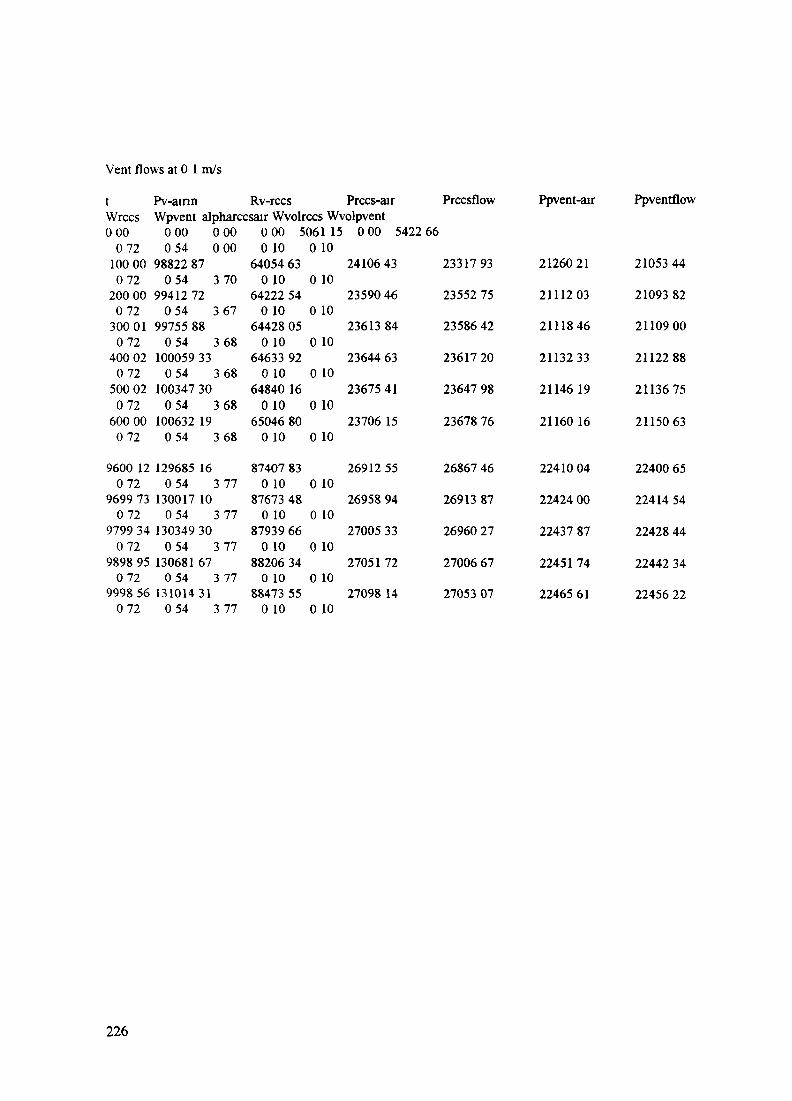
Vent flows at 0 1 m/s
t Pv-ainn Rv-rccs Prccs-air PrccsflowWrccs Wpvent alpharccsair Wvolrccs Wvolpvent000 000 000 000 506115 000 5422660 72 0 54 0 00 0 10 0 1010000 98822870 72 0 54 3 7020000 99412720 72 0 54 3 6730001 99755880 72 0 54 3 6840002 100059330 72 0 54 3 6850002 100347300 72 0 54 3 68600 00 100632 190 72 0 54 3 68
9600 12 129685 160 72 0 54 3 77
969973 130017 100 72 0 54 3 77
979934 130349300 72 0 54 3 77
9898 95 130681 670 72 0 54 3 77
999856 131014310 72 0 54 3 77
Ppvent-air Ppventflow
64054 630 10 0 10
64222 540 10 0 10
64428 050 10 0 10
64633 920 10 0 10
64840 160 10 0 10
65046 800 10 0 10
87407 830 10 0 10
87673 480 10 0 10
87939 660 10 0 10
88206 340 10 0 10
88473 550 10 0 10
24106 43
23590 46
2361384
23644 63
23675 41
23706 15
26912 55
26958 94
27005 33
27051 72
27098 14
2331793
23552 75
23586 42
2361720
23647 98
23678 76
26867 46
26913 87
26960 27
27006 67
27053 07
2126021
2111203
2111846
2113233
2114619
21160 16
22410 04
22424 00
22437 87
22451 74
22465 61
21053 44
21093 82
2110900
2112288
2113675
2115063
22400 65
22414 54
22428 44
22442 34
22456 22
226
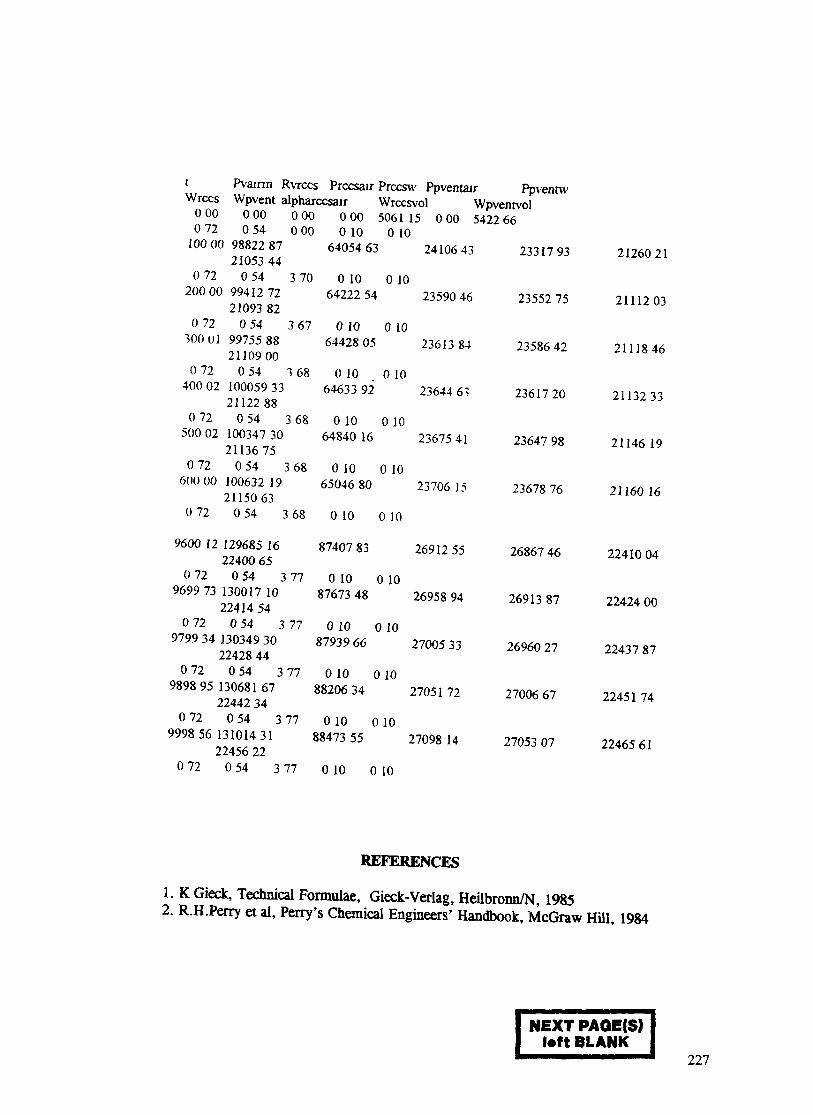
t Pvainn Rvrccs Prccsair Prccsw Ppventair PpventwwPvent alpharccsair Wrccsvol Wpventvol
0 00 0 00 0 000 72 0 54 0 0010000 9882287
21053 440 72 0 54 3 7020000 9941272
21093 820 72 0 54 3 6710001 9975588
21109000 72 0 54 1 6840002 10005933
21122880 72 0 54 3 6850002 10034730
21136750 72 0 54 3 6860000 100632 19
21150630 72 0 54 3 68
9600 12 129685 1622400 65
0 72 0 54 3 77969973 130017 10
22414540 72 0 54 3 77
979934 1303493022428 44
0 72 0 54 3 77989895 13068167
22442 340 72 0 54 3 77
999856 1310143122456 22
0 72 0 54 3 77
000 5061 15 000 5422660 10 0 10
64054 63 2410643
0 10 0 1064222 54 23590 46
0 10 0 106442805 2361384
0 10 0 1064633 92 23644 63
0 10 0 106484016 2367541
0 10 0 106504680 23706150 10 010
87407 83 26912 550 10 0 10
87673 48 26958 94
0 10 0 1087939 66 27005 33
0 10 0 108820634 2705172
0 10 0 1088473 55 27098 140 10 0 10
2331793
23552 75
23586 42
2361720
23647 98
23678 76
26867 46
26913 87
26960 27
27006 67
27053 07
2126021
2111203
2111846
2113233
21146 19
21160 16
22410 04
22424 00
22437 87
2245174
22465 61
REFERENCES1. K Gieck, Technical Formulae, Gieck-Verlag, Heilbronn/N, 19852. R.H.Perry et al, Perry's Chemical Engineers' Handbook, McGraw Hill, 1984
NEXT PAGE(S)(•ft BLANK
227
POTENTIAL AND LIMITATIONS IN MAXIMIZING THE POWEROUTPUT OF AN INHERENT SAFE MODULAR PEBBLE BED HTGR
W. SCHERER, HJ. RUTTEN, K.A. HAASKemforschungszentrum Jiilich GmbH, XA9846684Julich, Germany
Abstract
The past development of modular pebble-bed HTGRs in Germany led to two well-defined reactordesigns, namely the 200 MWth HTR-MODUL and the 250 MWth HTR-100 by SIEMENS/Interatom andABB/HRB, respectively. Recently the South African utility, ESKOM, decided to include the pebble-bed HTGRdesign as a future supply option.
In contrast to the German designs, ESKOM prefers a direct cycle helium turbine system on the powerconversion side. This imposes certain modified boundary conditions on the reactor design and enables a higherplant efficiency.
Nuclear and thermal-hydraulic investigations have been performed at KFA-ISR to determine thepotential and limitations of increasing the unit thermal power output of the reactor compared to the formergerman designs. In doing so an upper limit for the maximum fuel element temperature of 1600°C wasobserved. The impact of all modifications in view onto the efficiency of the nuclear control and shut-downsystems was also considered.
The results obtained so far demonstrate the well-adapted and conservative design of the SIEMENS HTR-MODUL within a 10% safety margin to the higher region. The introducaon of graphite noses has a remarkablypositive influence on the shut-down and control systems, while the positive effect on the maximum accidenttemperature depends strongly on the fast neutron dose-related thermal conductivity of the nose graphite.Considering the fact that effecnve conductivity of the pebble-bed core is maintained at high temperatures, thetemperature effect due to the noses are of secondary influence at this point.
1. Introduction
The development of modular pebble-bed HTGRs in Germany during the last 20 years hasled to two well-defined reactor designs, namely the 200 MWth HTR-MODUL and the 250MWth HTR-100 by SIEMENS/Interatom and ABB/HRB, respectively. Although negotiationsespecially for the HTR-MODUL e.g. with the former Sowjet Union were promising to acertain extent, neither of these two systems has been commercially realised up until now.Nevertheless primarily because of the outstanding inherent safety properties of that reactorconcept the world-wide interest in pebble-bed high temperature reactors is not only stillremaining but seems to extent further. At the Institute for Nuclear Energy Technology (INET)of the Tsinghua University in Beijing, China, a 10 MW pebble-bed HTR is being built todayand recently the South African utility, ESKOM, decided to include the pebble-bed HTGRdesign as a future supply option into the considerations. Especially this activity may be lookedat as a new starting point for the commercialization of this reactor type.
Against this background the question of finding the limits for the unit power output ofsuch reactors was raised again in order to increase the overall system economy.
In contrast to the German designs, ESKOM prefers a direct cycle helium turbine systemon the power conversion side. This imposes certain modified boundary conditions on thereactor design, such as a higher gas inlet temperature. On the other hand, the direct cycleenables a higher plant efficiency.
Starting with the well-known 200 MWa, HTR-MODUL nuclear and thermal-hydraulicinvestigations have been performed at KFA-ISR to determine the potential and limitations ofincreasing the unit thermal power output of the reactor. This paper will first give an overviewof some basic considerations to the possibilities and limits for the maximum power output.
229

Following the consequences of these considerations a more detailed core-design will bepresented. Finally the results will be discussed and upper limits for the power output on thebasis of today's knowledge will be indicated.
2. General Aspects and boundary conditions for the maximum power output
Modular pebble-bed reactor designs reflect the philosophy of a new quality of safety, theso-called 'catastrophe-free' nuclear reactor technology. Thereby they are governed by threemain boundary conditions:
1. Self-acting stabilization of the nuclear power and the fuel temperatures atpermissible values in all operational and accident situations
2. Self-acting removal of the nuclear decay heat in all possible accident situations3. . Control-and Shut-down equipment placed outside the pebble-bed.
Item 2 and 3 impose limitations to the reactor geometry, while item 1 restricts theoperational excess reactivity bound in movable control elements to certain maximum values.Therefore the reactor designs are characterized by tall and small cylindrical core shapesbecause of reaching a large surface-to-volume ratio and by a restricted region of part-loadoperation because of the xenon override problem. The introduction of item 3 into the designconditions was a direct consequence of the german THTR-300 experience, where control- andshut-down rods directly inserted into the pebble-bed led to a significant amount of fuel elementdamage.
The condition, to control and shut-down the reactor from outside the pebble-bed leads toa very strong limitation of the core diameter for purely cylindrical configurations as can easilybe shown by some calculations for the dependence of the maximum effectivity of controlsystems as a function of the core diameter. The results of such calculations are shown in figure1. Using the nuclear data for the 200 MW«h SIEMENS HTR-MODUL it is found, that thecore diameter may not be increased significantly over 3m, when a cold shut-down reactivityefficiency of about 14% nominal is required. An increase of the core diameter to 3.5 m willreduce the reactivity efficiency to less than 75% if a shut-down system like in the HTR-MODUL is used. Even if the density of the shut-down elements is further increased to thetheoretical maximum the reactivity efficiency will be less than 85 %, which is too low.
g 120
HTR Reflector Control Rod Efficiencyversus Core Diameter
(constant poison density, 1-D calculation)
o 110
100
90
80
70
60
J_
rho-rel. max/%
2,7 2,9 3,1 3,3 3,5 3,7D-Core/m
FIG. 1. Reflector Rod Efficiency
230

As a consequence of this the diameter of a purely cylindrical core is limited to 3 m, ifcontrol and shut-down is provided by reflector absorber systems. This situation can only bechanged in either going from the pure cylindrical core shape to other geometries or in fallingback to a shut-down philosophy with control-rods directly moving into the pebble-bed. Adesign concept with a different core-geometry will be discussed later on.
Concerning item 2 of the list of conditions, the safe decay heat removal, the situationseems to be a little more flexible. Increasing the core diameter in this case has two basiceffects, namely the increase of the path-length for the heat transport inside the core, which willincrease the temperature difference over the core, and the increase of the reflector surface,which will decrease the temperature difference over the reflector and outer components up tothe surface cooler. A rough estimation already shows, that the second effect is larger than thefirst, which gives some potential for enlarging the power output with increased core-diameter.A more detailed dynamic calculation of a depressurisation transient shows an even greaterpotential as is shown in fig. 2.
Maximizing the Power-Outputof an inherent safe MODUL-HTR
Maximum Core-Power as a Function of Core-RadiusLambda-eff bte V SOP
Rcon/m
1 50
1 75
200
1 50
1 75
200
200
DML/ID Pow*r/MW
080 200
055 250
OX
080
0.55
030
300
230
215
240
030 270
SC(250°C-7000Q
T™. / C tfTrm.) / H
1476 32:"' ;'1
1693
N^-safc-•
" vt«w
m s
64
, 9? -•-
«*
GT(600°C-900°Q
T™/C
W81708
1776
-
1-562"JS88
•
1(Tm.)/h
w38
50
•
36S& \
~
FIG. 2. Maximum Power output of a Cylindrical Modular Pebble-Bed Reactor
The figure shows the maximum fuel temperature after a depressurisation accident as afunction of the core diameter for a typical steam-cycle system and for a gas-turbine cycle.Caused by the much larger average temperature during normal operation the 1600 degree limitwill be reached at lower power outputs for the gas-turbine cycle. It should also be kept inmind, that the results shown here don't take into account, that there are additional uncertaintiesto be accounted for, which finally will reduce the maximum allowable power again to someextent. In any case the results indicate, that concerning the 1600 degree limit there is an almostlinear dependence of the achievable power from the core diameter.
Because of the limitation in control- and shut-down capability an increase of the corediameter has to be accompanied by some modifications in geometry, if the reflector-basedshut-down philosophy is maintained. The easiest way to do this was already exercised in thegerman AVR-reactor as well as in the HTR-100 design. By introducing graphite constructions,the so-called 'noses', which protrude from the side reflector region into the core a possibility isopened to extend the reflector control to a region much closer to the core centre and therebyto a region of much larger neutron importance. In doing so, the effectivity of shut-downabsorbers can be dramatically increased, as is shown in figs. 3 and 4. In these figures the resultsof preliminary 2-D neutronic reactor calculations are shown using previously generated roughnuclear data. The important result is, that the achievable reactivity effect is about 14% to 16 %
231
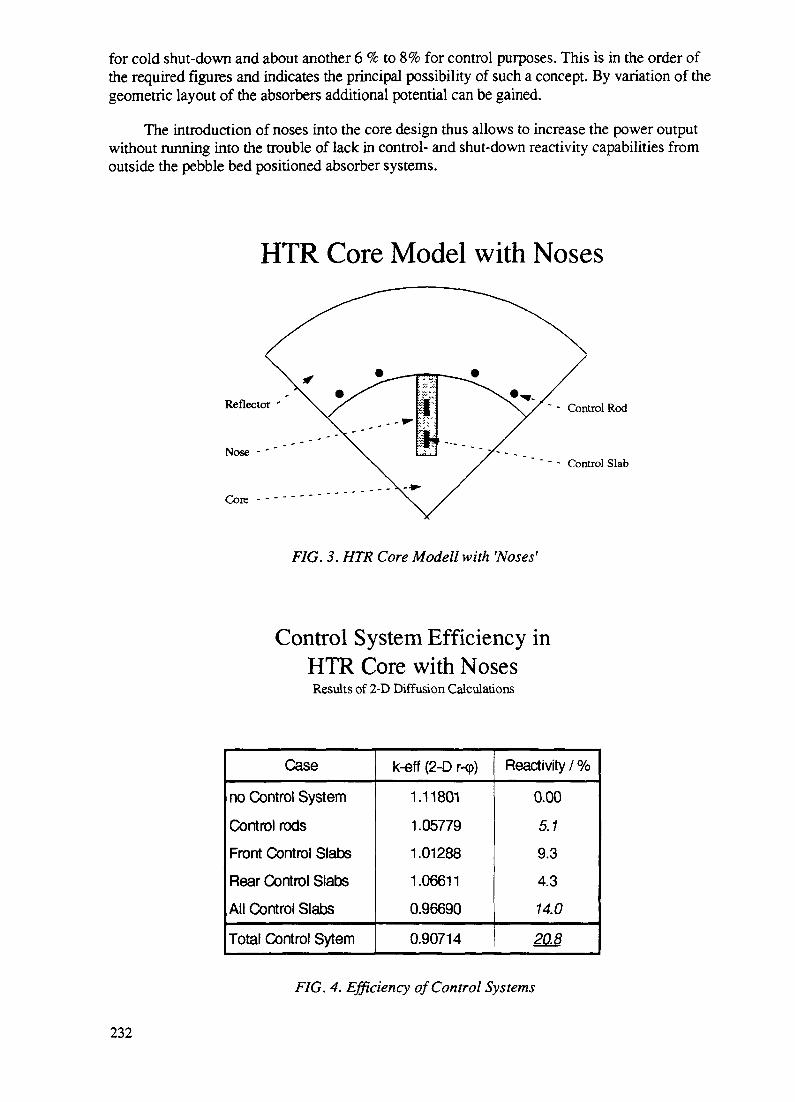
for cold shut-down and about another 6 % to 8% for control purposes. This is in the order ofthe required figures and indicates the principal possibility of such a concept. By variation of thegeometric layout of the absorbers additional potential can be gained.
The introduction of noses into the core design thus allows to increase the power outputwithout running into the trouble of lack in control- and shut-down reactivity capabilities fromoutside the pebble bed positioned absorber systems.
HTR Core Model with Noses
Reflector
Nose - '
Core - - - "
" - Control Rod
" - - Control Slab
FIG. 3. HTR Core Modell with 'Noses'
Control System Efficiency inHTR Core with NosesResults of 2-D Diffusion Calculations
Case
no Control System
Control rodsFront Control Slabs
Rear Control SlabsAll Control Slabs
Total Control Sytem
k-eff (2-D HP)
1.11801
1.05779
1.01288
1.06611
0.96690
0.90714
Reactivity / %
0.00
5.1
9.3
4.3
14.0
20.8
FIG. 4. Efficiency of Control Systems
232

The next question is related to the effect of 'noses' on the maximum accident fueltemperature. Here the comparison of the effective heat conductivity inside the pebble-bed withthat of the 'nose'-graphite is helpful. In fig. 5 this is shown for typical data. As can be seen fromthe figure, depending on the type of graphite and the fast dose, there is equilibrium between theeffective pebble-bed heat conductivity and the graphite conductivity in the temperature rangebetween 1000 °C and 1500 °C. This corresponds fairly well to the situation in at least somepans of the core at accident temperatures. It may be therefrom concluded, that no stronginfluence of the 'noses' on the maximum accident fuel temperature can be expected.
Effective Heat Conductivityin a Pebble-Bed HTR
depending on Temperature and Fast Neutron Dose
Irradiated Refl Graphite Conductivity
500
FIG. 5. Heat Conductivities in a Pebble Bed HTR
Impact of Noses on MaximumHTR Fuel Temperature at LOCA (SC)
Power = 200/250 MW 2-D Simulation
Oa.1700 -
1650 -
1600 -
1550 -
1500 H
1450 -
1400 •
1350
•lano .
* *•" ^_. *
^~^=
." »~~* "
ii n »— ~.1540
i. .nWI .
.— .
— — MODUL 200 3.00 m
—— 'NOSES 250 3.35 m
- - LARGE 250 3.35m
^B
» * *•
- —————— . ———
** * ]»
-•• III .._
-
B5 ————————
20 30 40 50 60 70 80time/h
FIG. 6. Nose Influence on LOCA Temperature for Steam Cycle
233
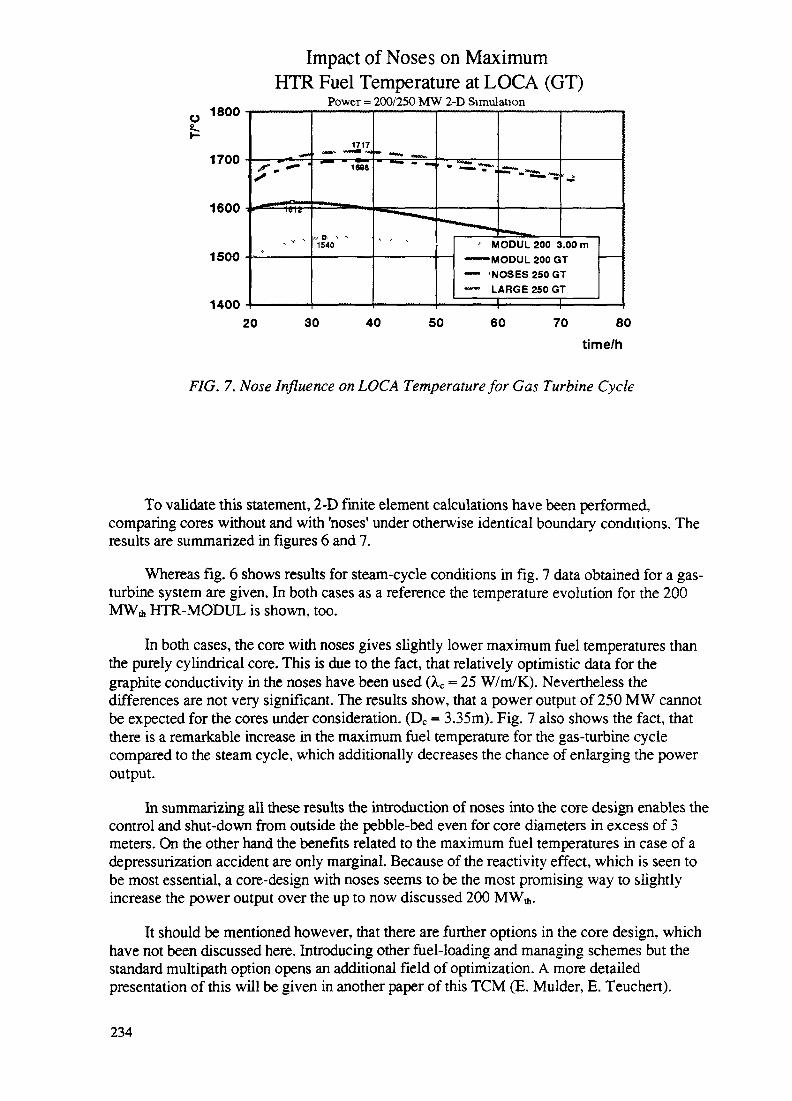
p 1800
1700
1600
1500
Impact of Noses on MaximumHTR Fuel Temperature at LOCA (GT)
Power = 200/250 MW 2-D Simulation
1400
1717
1698
1540 - MODUL 200 3.00 m——-MODUL 200 GT—— -NOSES 250 GT— LARGE 250 GT
20 30 40 50 60 70 80
time/h
FIG. 7. Nose Influence on LOCA Temperature for Gas Turbine Cycle
To validate this statement, 2-D finite element calculations have been performed,comparing cores without and with 'noses' under otherwise identical boundary conditions. Theresults are summarized in figures 6 and 7.
Whereas fig. 6 shows results for steam-cycle conditions in fig. 7 data obtained for a gas-turbine system are given. In both cases as a reference the temperature evolution for the 200
th HTR-MODUL is shown, too.
In both cases, the core with noses gives slightly lower maximum fuel temperatures thanthe purely cylindrical core. This is due to the fact, that relatively optimistic data for thegraphite conductivity in the noses have been used (kc = 25 W/m/K). Nevertheless thedifferences are not very significant. The results show, that a power output of 250 MW cannotbe expected for the cores under consideration. (Dc = 3.35m). Fig. 7 also shows the fact, thatthere is a remarkable increase in the maximum fuel temperature for the gas-turbine cyclecompared to the steam cycle, which additionally decreases the chance of enlarging the poweroutput.
In summarizing all these results the introduction of noses into the core design enables thecontrol and shut-down from outside the pebble-bed even for core diameters in excess of 3meters. On the other hand the benefits related to the maximum fuel temperatures in case of adepressurization accident are only marginal. Because of the reactivity effect, which is seen tobe most essential, a core-design with noses seems to be the most promising way to slightlyincrease the power output over the up to now discussed 200
It should be mentioned however, that there are further options in the core design, whichhave not been discussed here. Introducing other fuel-loading and managing schemes but thestandard multipath option opens an additional field of optimization. A more detailedpresentation of this will be given in another paper of this TCM (E. Mulder, E. Teuchert).
234

3. A core-design including noses
3.1. Modelling the reactor
In case of the 200 MW HTR-Modul reactor a 2-dimensional treatment was sufficient forthe evaluation of the burnup history of the fuel elements and of the coupled spatial distributionof the neutron flux and of the thermal power. Introducing graphite noses into the core region,however, disturbs the azimuthal symmetry of the core. Thus, in view of the strong couplingbetween the flux distribution, the neutron spectrum and the bumup of the fuel, a 3-dimensionalevaluation of these items becomes necessary. For this purpose, the 3-dimensional version ofthe V.S.O.P. (96)-code was used in order to investigate the neutronics of the reactor. V.S.O.P.(96) III is the successor of V.S.O.P(94) 12 /, now solving the bumup equations for 28 heavymetal isotopes from Th-232 through Cm-244, and using burnup-dependent resonance integralsfor the lumped U-238 and (if present) for Th-232.
The continuous fuelling of the reactor provides a multipassing of the fuel elements (10times), i.e. 1/10 of the loaded fuel elements are fresh ones, 9/10 have already passed from thetop to the bottom of the core 1 through 9 times. 1/10 of the elements, which have reached theirfinal bumup (80 MWd/kg HM ) after their tenth passage, are finally disloaded.
cm
200
100-
0 100 200 278.5cm
Calculotionol Model: Medul with noses, 3-dim., 1/4-core, core plane
FIG. 8: Calculational model of the reactor (horizontal cross section)
235

Fig. 8 shows a horizontal cross section of the approximation of the real core geometryfor the calculational treatment in an ,,X-Y-Z"- model. The core structure allows to restrict theexplicit calculation to 1A of the core, applying reflecting boundary conditions at y=0 and at x=0.The hatched areas indicate the reflectors and the graphite noses, where boundaries areapproximated by step functions because of the x-y-mesh structure of the calculation. In axialdirection, the core is divided into 9 planes, each again divided into 12 regions as it is shown inFig. 8. Each of the herefrom resulting 108 core regions is homogeneous for the diffusioncalculation, but is further subdivided into ten different fuel batches, representing ten differentstates of bumup. These correspond to the first through the tenth passage of the fuel elementsfrom the top to the bottom of the core. Thus, 1080 states of fuel element bumup are explicitlyfollowed by the code.
Fuel cell calculations, diffusion and bumup calculations are repeated using time stepshaving a length of some days in the reactor operation, while the fuel management is performedas it was described above. This procedure is ended as soon as the spatial distribution of theneutron flux, the power and the bumup have converged and thus an equilibrium state of thecore has been reached. Finally, an ,,outer" iteration has to be done, allowing a feedback of theresulting fuel and moderator temperature to the evaluation of the thermal neutron spectrumand to the resonance shielding.
For the assessment of the reactor in view of its thermodynamic properties in general andin view of temperature transients following a loss-of-coolant accident the THERM IX-code isincluded in V.S.O.P. In contrary to the neutronics parts of this code system, the transientTHERMIX calculations are restricted to 2 spatial dimensions. It was outlined in chapter 2, thatno strong influence of the ,,noses" on the accidental fuel temperature needs to be expected.Thus, the following procedure was applied in order to get a sufficiently good approximation ofthe 3-D-Core in a 2-dimensional model:The neutronics were recalculated in an ,,r-z"-approximation of the real geometry, replacing thegraphite noses by fuel elements and keeping the total power of the core at the original value(220 MW). The steady-state temperature distribution was then calculated on the basis of theresulting 2-d power distribution. The same was done for the time and space dependent decaypower of the fuel, which will occur after a depressurization event. The local decay power wascalculated on the basis of the german standard DIN 25485. Upon this basis the temperaturetransients were then evaluated.
3.2. Results
3.2.1. 3-D-Calculations
The results of the 3-D calculations presented in the following were performed for thethermal core power 220 MW. Actually, this power level is a result of an iteration between theneutronics of the core and its resulting thermal behaviour under accident conditions (Seechapter 3.22). The maximum fuel temperature appearing during a loss-of-coolant accident hasbeen regarded as the limiting factor for the core power. In view of the retention of the fissionproducts within the fuel elements the temperature shall be restricted to about 1600 CC.
Fig. 9 shows the thermal neutron flux and the power density for a 90°-section of the core,reaching from the middle of one ,,nose" to the middle of the next one, at different axialpositions. One can see the strong peaking of the neutron flux within the graphite noses. Here,the power density results in zero according to the assumption within the code, that thecomplete fission energy (except neutrino energy) is released just where the fissions occur. Themaximum power is in a plane, which is located between 3 and 4 m below the core surface. Thetotal power peaking (maximum/average power density) of the core is 1.9.
236

FIG. 9: Thermal neutron flux (left) and power density (right) in the upper core region(upper pictures), at 4m below core surface ( middle) and near the bottom of thecore.(90 ° - sectors)
One important safety criterion of a nuclear reactor is a negative feedback between thetemperature of the core and its reactivity. An increase in temperature should always result in adecrease of the reactivity, so that the reactor will be stabilized inherently in case of a release ofreactivity and a resulting increase of its power. The prompt reactivity effect (fuel temperaturecoefficient) is dominated by the broadening of the U-238 resonances for neutron absorption.The contributions of the temperature changes of the fuel and of the moderator are listed in Fig.10. One can see a slight positive contribution of the reflector regions, but the by far dominatingeffect is the negative contribution of the fuel and of the graphite within the fuel elements.
237

Temperature coefficients at full core power
A Kefr /Kelvin
FuelModeratorNosesOuter reflectors
Total
-3.06xl(T5
- 2.68 x 10 '5
+ 0.90 x 10 -5
+ 0.74 x 10 '5
- 4.10 x 10 '5
1.00
0.99-
0.9B-
0.97-
FIG. 10: Temperature Coefficients
X«-Ov»rride 100 —> 70 %
1.00
0.97 J
1.00
0.99-
0.98-
0.97-
10 15 20 24 hours
Xe-0v«rride 100 —> 50 %
10 15 20 24 hours
Xa-Override 100 —> 20 %
! T I I I [ I I
10 155 10 15 20 24 hours
Fig. 11: Reactivity changes caused by load changes
238

The continuous fuelling of the MODUL-HTR implies that no excess reactivity isnecessary in order to compensate bumup effects. Nevertheless, a certain margin is required forthe reactor control and to compensate changes of the xenon concentration following changesof the reactor power. Fig. 11 illustrates the neutron multiplication factor after a change fromfull power operation down to 70, 50 and 20%, respectively. The resulting deviation fromKrff=l must be compensated by the control system. It results that if the utility, which operatesthe reactor, supposes to change from full power down to 20 % of it, then an excess reactivityequal 2.3 % A K is required. In case of an erroneous movement of the control system,releasing this reactivity, the fuel temperature would increase until the reactivity is compensatedby the negative temperature coefficient. Using the coefficient value of Fig. 10 , this increasewould be 560 °C. This, of course, is only a rough number, because of the temperaturedependence of the temperature coefficient and of the space dependence of the temperature.
In case of a long-term shut down, several reactivity effects are superposed (Fig. 12). Asthe reactor is cooled down, the reactivity increases according to the temperature coefficient.As in the beginning Jiss decays to Xeiss, the reactivity decreases and reaches a minimumvalue after about 9 hours. Then Xe]35 decays and K^ reaches unity after about 20 hours. Themaximum value of Keff appears after about 4 days. Afterwards, there is a slight decrease again,mainly because of the decay of Pmi49 to Smi49. The maximum reactivity margin, which has tobe compensated by the shut down system , is A K=0.073.
10Cold Shut-down
20 3D 40 48 hours
10 15 2Cd<iyiCold Shut-down
Fig. 12: Reactivity vs. time after reactor s/zwf down
239

3.2.2 Loss-of-coolant accident (2-d-caIculations)
As it was already mentioned in chapter 3.2.1., the reference power 220 MWA of thecore, which was the matter of the 3-d-investigations, was the result of a parametric study. Thepurpose of it was to determine, which power level could be realized in the given core structureunder the boundary condition, that in case of a depressurization event the temperature 1600 °Cwill not be exceeded within the fuel at any time during the resulting temperature transient. Theresults of this study are outlined in fig. 13. They were obtained in a 2-d-approximation of thereactor, as it has been explained above (Chapter 3.1.).
The lower curve shows the so defined maximum temperature versus the reactor power(T-nominal). If one suggests an uncertainty of two standard deviations for the evaluation of thedecay power on the basis of a given spatial power distribution, and in addition adds a 5 %margin to the nominal power at each local position of the fuel elements in the core with respectto uncertainties of the spatial reactor power distribution, then the temperature resultsaccording to the upper curve of fig. 13 (Decay-power * 1.1). It can be seen, that here thelimiting temperature is reached at the power 220 MW^. Consequently, this power level wastaken as the reference in order to perform the final 3-d-investigations.
1700-
1 Rf\r\ m
w1600 '£_x 1400««i i Qnn .
1200-
1100-
2(
——————————————————————————— ^__^---^*
*——-""""""" — ' " — - — — """— - — -~~~~^ —— — — ' — — "~
—-—~ —
-•- T (nominal)
-*-T(Dfifi-pow.*1.1)
i • • • 1
)0 210 220 230 240 250P-th[MW]
Fig. 13: Maximum fuel temperature of the depressurized corevs. the core power
In case of a loss-of-coolant, the maximum of the fuel temperature is reached after about30 hours since depressurization occurred. After this time the decreasing decay power in theinner core regions is balanced by the heat transport to the outer parts of the reactor and to thesurface coolant system of the reactor cell. Afterwards, the fuel temperature decreases again,while the temperature of the outer reactor components still increases. The pressure vesselreaches its maximum temperature (- 400 °C) after about two days.
240

1500
1000
500
fuel•iMntnts
100 hours
Fig. 14: Temperature of the fuel elements and of the pressure vessel vs. time duringa loss-of-coolant accident (220 MW,h core power)
4. Control- and Shut-down Systems
Using the nuclear data, that have been produced according to the descriptions of the lastchapter, 2-D and 3-D reactor calculations have been performed to evaluate the design andefficiency of control- and shut-down systems for the proposed pebble-bed reactor concept. Thecalculations were performed using the diffusion code CITATION /3/. The effective cross-sections for the absorber materials were prepared using the methods derived at KFA-ISR forsuch purposes 141.
Following the design of both of the german modular pebble-bed reactors a system ofsmall absorber spheres (KLAK) has been chosen as the cold shut-down system. This systemhas been analyzed experimentally in detail by INTERATOM/SIEMENS for the MODUL-HTRand as a part of this design has been positively reviewed during the site-independent designreview by the TUV-Hannover, Germany. Similar to the HTR-100 design it is proposed tointroduce this KLAK system into borings of the four graphite noses.
In standard LWR reactor design besides a shut down system for long-term shut-down afast acting 'first' shut-down system is necessary, which has to guarantee the shut-down of thereactor to a hot subcritical situation from any operational and accidental situation. Because ofthe excellent inherent safety properties of a HTGR such a system is not required a priori forsuch reactors from safety arguments. It is another question, whether it could be useful fromoperational considerations. In any case a facility for operational control is necessary. It isproposed to use a system of movable control rods or similar absorbing systems for thispurpose. These may either be inserted into rear borings of the noses as shown in fig. 15 or maybe placed in a more conventional way around the reflector perimeter as foreseen for thegerman designs. The final decision will depend on the reactivity efficiency of these systems, onthe requirements (shut-down or control only) and on additional conditions such as thedistortion of the power shape during normal operational transients.
The basis of the calculations was a KLAK system with four different KLAK positions inthe front part of the graphite noses. The dimensions of the rectangular borings were chosen as35x9 cm2. The borings cover the complete height of the active core. It was assumed that the
241

PBMR Core Model (I)
Reflector
Nose - -
Core - - - - -
- Control Slab
" KLAK Shut-down System
FIG. 15. Core Model with Noses
small absorber spheres will have a filling factor of 0.6 and that they will be made of graphitewith 10% boron-carbide. As a first guess for the additional control system a slab-like absorberrod system was assumed, moving in rear borings of the graphite noses. As indicated before,this system may be enhanced by additional control rods in the side reflector.
The results for the efficiency of these absorber systems obtained so far are summarized infig. 16.
PBMRControl- and Shutdown Reactivity
System Variant I
Case k-eff(2-Dx-y)
Full Power, no CS
Control Slabs (total)
Max Slab missingControl Slabs (half)
1.02989
0.93474
0.96529
-
Max. Slab missing •
Cold ITS, no CS 1.09681
KLAK 0.93958
max KLAK missing 0.99193
Fteact./%|k-eff(3-Dx-y-z)
0.00
9.9
6.5
-
-
45.94
15.3
9.6
1.00207
0.90820
0.93798
0.96839
0.97232
1.07227
0.91795
0.96883
React/ %0.00
10.3
m^ - \3.5
.88* !
46.53
15.7
*Bff/i
FIG. 16. Control- and Shutdown Reactivity
The table shows the effective multiplication factors and the reactivities for both absorbersystems. The control system has been analyzed in the hot full power core whereas the KLAKresults were obtained in the long-term cold (LTS) core. 2-D (x-y) and 3-D (x-y-z) results arereported.
242
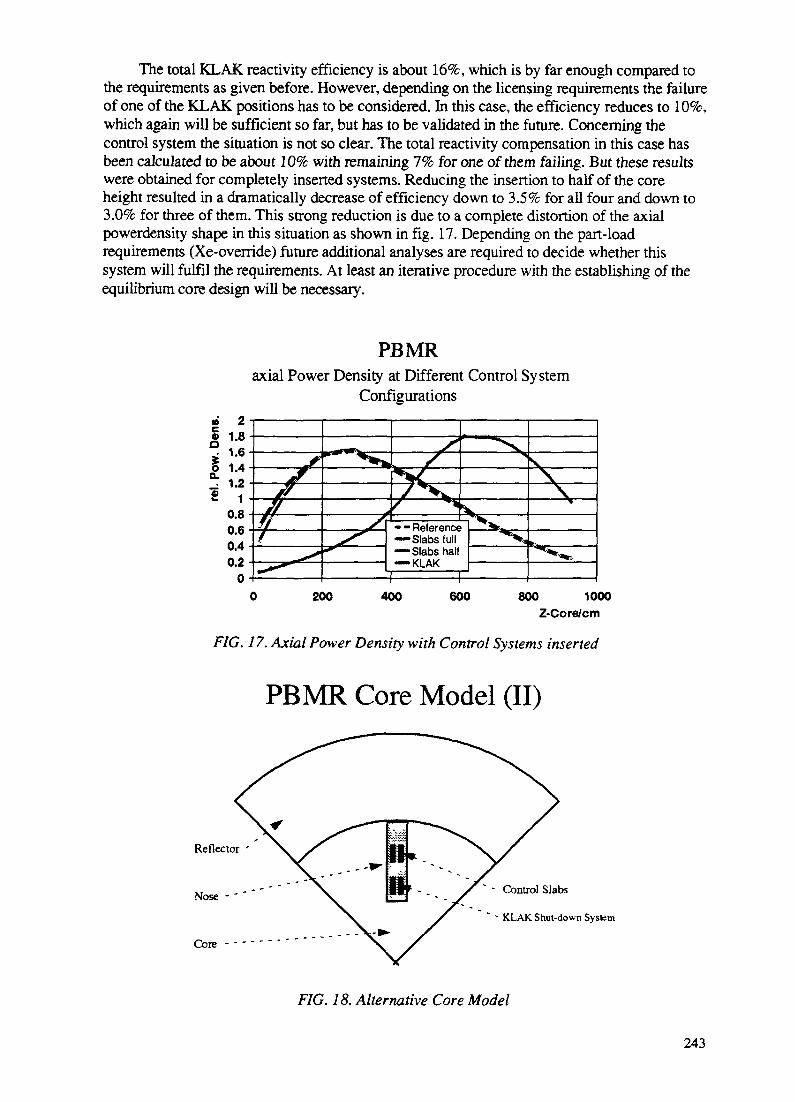
The total KLAK reactivity efficiency is about 16%, which is by far enough compared tothe requirements as given before. However, depending on the licensing requirements the failureof one of the KLAK positions has to be considered. In this case, the efficiency reduces to 10%,which again will be sufficient so far, but has to be validated in the future. Concerning thecontrol system the situation is not so clear. The total reactivity compensation in this case hasbeen calculated to be about 10% with remaining 7% for one of them failing. But these resultswere obtained for completely inserted systems. Reducing the insertion to half of the coreheight resulted in a dramatically decrease of efficiency down to 3.5% for all four and down to3.0% for three of them. This strong reduction is due to a complete distortion of the axialpowerdensity shape in this situation as shown in fig. 17. Depending on the part-loadrequirements (Xe-override) future additional analyses are required to decide whether thissystem will fulfil the requirements. At least an iterative procedure with the establishing of theequilibrium core design will be necessary.
PBMRaxial Power Density at Different Control System
Configurations« 2I
200 400 600 800 1000Z-Core/cm
FIG. 17. Axial Power Density with Control Systems inserted
PBMR Core Model (II)
Reflector
Nose - *
Core - - -
- Control Slabs
" - KLAK Shut-down System
FIG. 18. Alternative Core Model
243

To show some additional potential for the control- and shut-down system a slightlymodified design has been analyzed, too. By separating the KLAK and Slab borings whileconserving the total absorber volume as shown in fig. 18 some gain in reactivity efficiency wasobserved. The results of the corresponding 2-D calculations together with those of thereference variant repeated are given in fig. 19. Therefrom it may be concluded that anadditional capacity reserve of about 15%-20% for the reactivity efficiency may easily beactivated.
PBMRControl- and Shutdown Reactivity
Comparison of Variants(2-D Calculations only)
Case
Hot FP, no CS
Control Slabs (total)
Max. Slab missing
CddLTS,noCS
KLAK
max. KLAK missing
Variant 1
k-eff(2-Dx-y)
1.02969
0.93474
0.96529
1.09681
0.93958
0.99193
React. /%
0.00
9.9:t &5
45.9
15.31 as
Variant II
k-eff(2-Dx-y)
1.02969
0.92099
0.95717
1.09681
0.91305
0.97839
React/ %
0.00
11.5
T.4 ^
+5.9
18.3
11$ j
FIG. 19. Comparison of Control Model Variants
5. Open Questions, Planned Investigations and Additional Options
In the course of the research reported here, some assumptions had to be made on items,which have not yet been clarified. These may have a certain impact on the layout of the reactorcore and may be to a certain degree also on its safety features.
The calculation of the spatial power distribution was done for the core being free of anycontrol devices. In order to allow load changes of the power plant according to the demand ofthe grid, a certain amount of excess reactivity has to be available for a release in order tocompensate the combined so called 'Xe-override' reactivity (see chapter 3.2.1.). In view ofreactor safety, this reactivity should be small. Once that a reactivity requirement will be fixed,the resulting position of the control devices during full power operation has to be evaluated.This again will influence the power peaking of the reactor core and the local fuel burnup. Thetransients during a loss-of- coolant event will have to be investigated for different positions ofthe control devices.
The 2-dimensional model of the core, which was used for the calculation of the heattransfer, can account for the power peaking in axial and in radial direction only, using equalvalues in azimuthal direction. From the 3-d-calculations of the power we see an additionalpeaking in azimuthal direction close to the graphite noses. On the other hand, the neutronreflection by the noses tends to flatten the power distribution in radial direction. It has to bevalidated, that the resulting uncertainty in view of the prediction of accident temperatures arecovered by the applied safety margin.
244
Uncertainties concerning the heat conductivity of the graphite noses presently prevent afinal answer to the question, whether they hinder or even improve the heat transfer in radialand in axial direction of the core. Here, additional research is foreseen, in order to answerthese open questions.
In parallel to the research, which is reported in this paper, an alternative fuelling schemefor a small Pebble-bed-HTR has been investigated, which aims at a simplified fuel management.This provides only a single pass of the fuel elements through the reactor core. The results ofthis research are presented in a paper of E. MULDER on the 'OTTO-PAP' within the frame ofthis meeting.
6. Summary
In the paper presented here the possibilities and limitations in increasing the power outputof a modular pebble-bed high temperature reactor with multipath fuel loading scheme and 1 -zone loading pattern are discussed. In touring the horizon some basic features andrequirements for a inherent safe behaviour during operation and accidents are given and severaldesign modifications are presented compared to the well defined and analysed german HTR-MODUL design.
The design modifications considered include an increase of the core radius and theintroduction of graphite constructions, the so-called 'noses', which protrude from the sidereflector region into the core similar to the german AYR and HTR-100 constructions. Theimpact of such modifications on the maximum fuel temperature in a LOCA and on theefficiency of the nuclear control and shut-down systems is considered.
The results obtained so far demonstrate the well-adapted and conservative design of theSIEMENS HTR-MODUL within a 10% safety margin to the higher region. The introductionof graphite noses has a remarkably positive influence on the shut-down and control systems,while the positive effect on the maximum accident temperature depends strongly on the fastneutron dose-related thermal conductivity of the nose graphite. Considering the fact thateffective conductivity of the pebble-bed core is maintained at high temperatures, thetemperature effect due to the noses are of secondary influence at this point.
Based on these results a core design for a 220 MWA core with noses and a diameter of3.5 m for a direct cycle gas-turbine application has been presented. It has been shown, thatsuch a design meets the basic requirements of a new generation safety philosophy. Themaximum accident fuel temperature remains below the 1600 °C limit and the efficiency of theshut-down and control systems seems to be sufficient. Operational details like the range ofunlimited part-load and the system dynamics of the gas turbine cycle have to be discussedfurther.
According to the results obtained and referring to previous investigations the utmost limitfor the maximum power output of pebble-bed cores in a steam cycle system, fitting into apressure vessel of about 6 m diameter, seems to be close to 230 MWu,, if purely cylindricalcore geometry is envisaged, and close to 270 MWth, if graphite noses are taken into account.The corresponding values for a modem turbine cycle system are 200 MWA and 240respectively.
245

REFERENCES
III E. Teuchert, K.A. Haas, H.J. Riitten, H. Brockmann, H. Gerwin, U. Ohlig, W. Scherer:VSOP (94), Computer Code System for Reactor Physics and Fuel Cycle SimulationInput Manual and CommentsJiil-2897, April 1994
111 VSOP (96) (to be published in the near future)
/3/ T.B. Fowler, D.R. Vondy, G.W. CunninghamNuclear Reactor Analysis Code: CITATIONORNL-TM-2496, Rev. 2 (1971)
/4/ V. Fen, M. Lebedev, V. Sarytchev, W. SchererModelling of Neutron Absorbers in High Temperature Reactors by combined Transpon-Diffusion MethodsJul-2573 (Jan. 1992)
246
OTTO-PAP: AN ALTERNATIVE OPTION TO XA9846685THE PBMR FUELLING PHILOSOPHY
E. MULDERAYR GmbH,Jtilich
E. TEUCHERTKemforschungszentrum Julich GmbH,Julich
Germany
Abstract
Once Through Then Out, Power Adjusted by Poison (OTTO-PAP) fuelling of a high temperaturepebble-bed reactor offers a simple alternative to the MEDUL (Mehrfachdurchlauf - German formulti-pass) fuelling regime folio-wed in pebble bed reactor designs to date
The prerequisite for a modular reactor unit of maximum power output, subject to observing passivesafety characteristics is a sufficiently flat axial neutron flux profile This is achieved by introducingB4C coated particles ofpre-calculated size and packing density within the fuel spheres
In accordance with AYR operating practise the temperature profile is radially equalised byintroducing a 2-zone core loading Adding pure graphite spheres loosely into the centre column areaof the core effectively reduced the maximum power in the middle
Increasing the reactor diameter is enabled by the introduction of noses A 3-D geometric modellerdeveloped in cylindrical co-ordinates enables a given flow description of the pebbles adjacent to thenose boundaries and in the vicinity of the shut down / control rods After translation of the geometricdata the neutromc behaviour of the reactor is followed in 3-D by the CITATION code
This study is aimed towards achieving an optimal core layout with a LEU (Low Enriched Uranium)fuel cycle Physical properties of the OTTO-PAP, 150 MWt reference design is reported, whilecomputations performed observe results obtained by the reference HTR-MODUL design
Introduction, Background
As part of a series of supply side option investigations ordered by ESKOM, South Africanpower utility, a feasibility study was launched to establish the technical and economicfeasibility of modular high temperature gas-cooled reactors when coupled to direct-cycle,closed-loop, helium power turbines Apart from the preliminary operational requirements asdocumented in /1,2/ the unit size is subject to the basic owner requirement that no physicalprocess, however unlikely, must cause a radiation induced off-site hazard This is achieved inprinciple in the Pebble Bed Modular Reactor (PBMR) by demonstrating during a postulateddepressurised loss of coolant incident that• the decay heat produced in the post accident condition is exceeded by the inherent heat
removal capability of the reactor vessel,• peak temperatures within the core never reaches 1600°C, thus remaining well below the
demonstrated onset point of fuel degradation, i e fuel temperature maintained at 1600°Cfor a period in excess of 100 hours /3/
247

Keeping in mind the abovementioned, it is reasonable to employ the fundamental approach ofadherence to available technology, observing the proven operational base, and selecting acommercially viable unit size, albeit small and modular.
Central to this study is the selection of a viable fuelling regime. A unit size of 70 - 100 MWelends itself to two basic fuelling options currently under consideration, viz. MEDUL andOTTO. A third option, i.e. Peu-a-Peu (PAP), is of interest for unit sizes of 5 - 40 MWe.Twenty years continuous operation with only one step defuelling at the end of operation offersunsurpassed simplicity and, while awarding a high degree of proliferation resistance 161.
In /4/ a 220 MWt PBMR reference proposal based on the HTR-MODUL (200 MWt) andHTR-100 (250 MWt) designs by SEEMENS/Interatom and BBC/HRB respectively, isinvestigated. This concept refers to well-proven technology demonstrated by the operationalhistories of the AYR experimental reactor in Jiilich /see 5/ and the THTR demonstration plantin Schmehausen.
OTTO employs a special fuelling mode of MEDUL, i.e. a single pass of the fuel elementsthrough the core. This concept is extremely attractive for its simplicity, yet remained limited toa maximum thermal power output of 120 MWt due its characteristic neutron flux shape asdepicted in Fig. 1. Advantages of this feature are well-documented by several authors /see7,8/. The major disadvantage to this fuelling concept remained however, its inability to deliverpower within the 150 - 200 MWt range, whilst adhering to the principles of passive safety.
A variation of the abovementioned fuelling regime, OTTO & PAP, broadly coincides with theproposal in /9/ as suggested for the PBMR-SA fuelling. Table I poses a summary of theconsiderations which prompted the current investigation.
OTTO: Typical vs. Ideal Power Distribution
FIG. 1: OTTO - Typical neutron flux distribution in axial direction
248

TABLE I: CONSIDERATIONS FOR GOING OTTO
PROS CONS1. Fuel management - Simplified by single
pass through the core2. Fuel handling - Minimised by single pass
through core
3. Measurement equipment - Weightdifference will suffice for the separation offuel and absorber spheres
4. OTTO fuelling - Is a special case ofMEDUL scheme => Enhanced testingopportunity in a dual-fuelling prototype
5. Minimised abrasion - Dust production isminimised. This is of importance in direct-cycle operation
6. Off-line defuelling offers operationalfreedom
7. OTTO technology base - Analyticalinvestigations since 1970 provide a solidscientific base
1. Unwanted neutron flux profile for unitsizes exceeding 120 MWt
2. Operational in-experience - Close synergyis to be observed with MEDULexperience. A MEDUL plant design canincorporate OTTO fuelling regime
300-
200-
100-
0-
7-co-
200-
300-
400-.
500-.
600-
700-
800-
Thermo PowerFuelHeovy nHerlium
netol loodmo^temperature
MW
q/ball'C
150U027560-900
1 —
v -1
/L4i'f
—
—
i1i — —
i —
t~'ii ____
_ —.-_-
Ipik
-i
L
-----
———
——— >
Control rodsPebble bed
Carbon bricks
[- Helium coolant
Dtsloodmg tube
0 100 ZOO 300CM
FIG. 2: VSOP model of the OTTO-PAP reactor layout
249
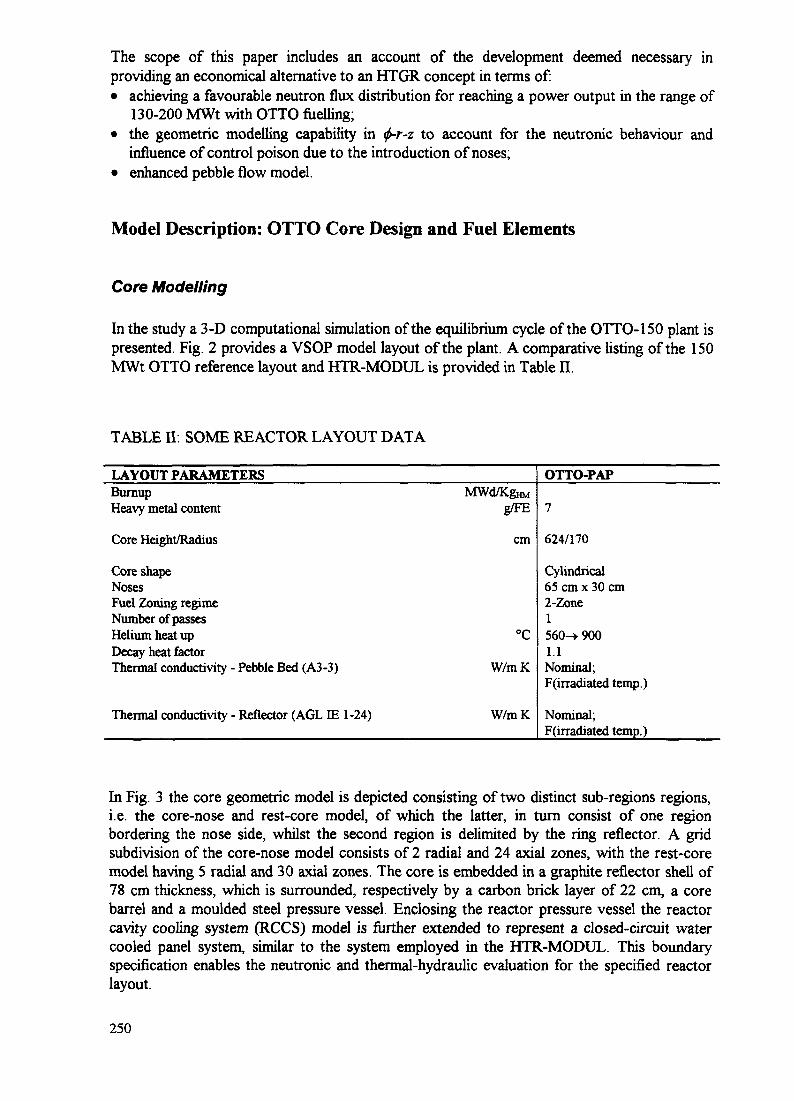
The scope of this paper includes an account of the development deemed necessary inproviding an economical alternative to an HTGR concept in terms of:• achieving a favourable neutron flux distribution for reaching a power output in the range of
130-200 MWt with OTTO fuelling;• the geometric modelling capability in 0-r-z to account for the neutronic behaviour and
influence of control poison due to the introduction of noses;• enhanced pebble flow model.
Model Description: OTTO Core Design and Fuel Elements
Core Modelling
In the study a 3-D computational simulation of the equilibrium cycle of the OTTO-150 plant ispresented. Fig. 2 provides a VSOP model layout of the plant. A comparative listing of the 150MWt OTTO reference layout and HTR-MODUL is provided in Table II.
TABLE II. SOME REACTOR LAYOUT DATA
LAYOUT PARAMETERSBurnupHeavy metal content
Core Height/Radius
Core shapeNosesFuel Zoning regimeNumber of passesHelium heat upDecay heat factorThermal conductivity - Pebble Bed (A3-3)
Thermal conductivity - Reflector (AGL IE 1-24)
MWd/KgHMg/FE
cm
°C
W/mK
W/mK
OTTO-PAP
7
624/170
Cylindrical65 cm x 30 cm2-Zone1560-> 9001.1Nominal;F(irradiated temp.)
Nominal;F(irradiated temp.)
In Fig. 3 the core geometric model is depicted consisting of two distinct sub-regions regions,i.e. the core-nose and rest-core model, of which the latter, in turn consist of one regionbordering the nose side, whilst the second region is delimited by the ring reflector. A gridsubdivision of the core-nose model consists of 2 radial and 24 axial zones, with the rest-coremodel having 5 radial and 30 axial zones. The core is embedded in a graphite reflector shell of78 cm thickness, which is surrounded, respectively by a carbon brick layer of 22 cm, a corebarrel and a moulded steel pressure vessel. Enclosing the reactor pressure vessel the reactorcavity cooling system (RCCS) model is further extended to represent a closed-circuit watercooled panel system, similar to the system employed in the HTR-MODUL. This boundaryspecification enables the neutronic and thermal-hydraulic evaluation for the specified reactorlayout.
250

For the computational simulation of the reactor life the discretized core is sub-divided intomany batches in both the axial and radial directions. Batch positions remain stationary over aburaup period of approximately 8 weeks (load factor of 0.76). Thereafter movement of onestep downward follows. Batches at the bottom are unloaded, while the top ones are made upwith fresh fuel. This scheme simulates continuous OTTO fuelling by sub-dividing the timescale into relatively large, discrete time steps.
The calculational procedure described above can simultaneously be regarded as representativeof Peu-a-Peu fuelling with defuelling steps of 8 weeks. Adaptation of the defuelling period iseasily achievable by modifying the downward shuffling to multiple time steps. Defuelling of 3layers at one time but filling the top layers bit-by-bit represents OTTO-Peu-a-Peu fuelling witha 6 months defuelling period.
Based on a recent study of the flow of spheres through the core of the THTR plant /10/ andexperimental data compiled by Kleine-Tebbe /I I/ the BIRGIT code flow model could beenhanced to simulate the flow of spheres more accurately in pebble bed HTRs. In Fig. 4 theflow results as compiled by Kleine-Tebbe is depicted. Data obtained experimentally can thusbe employed to validate forthcoming sensitivity studies on flow regime variations.
REST CORE MODEL NOSE MODEL
14"
FIG. 3: Discrete core model:- rest-core and core-nose schemes FIG. 4: THTR experimental flow data
251
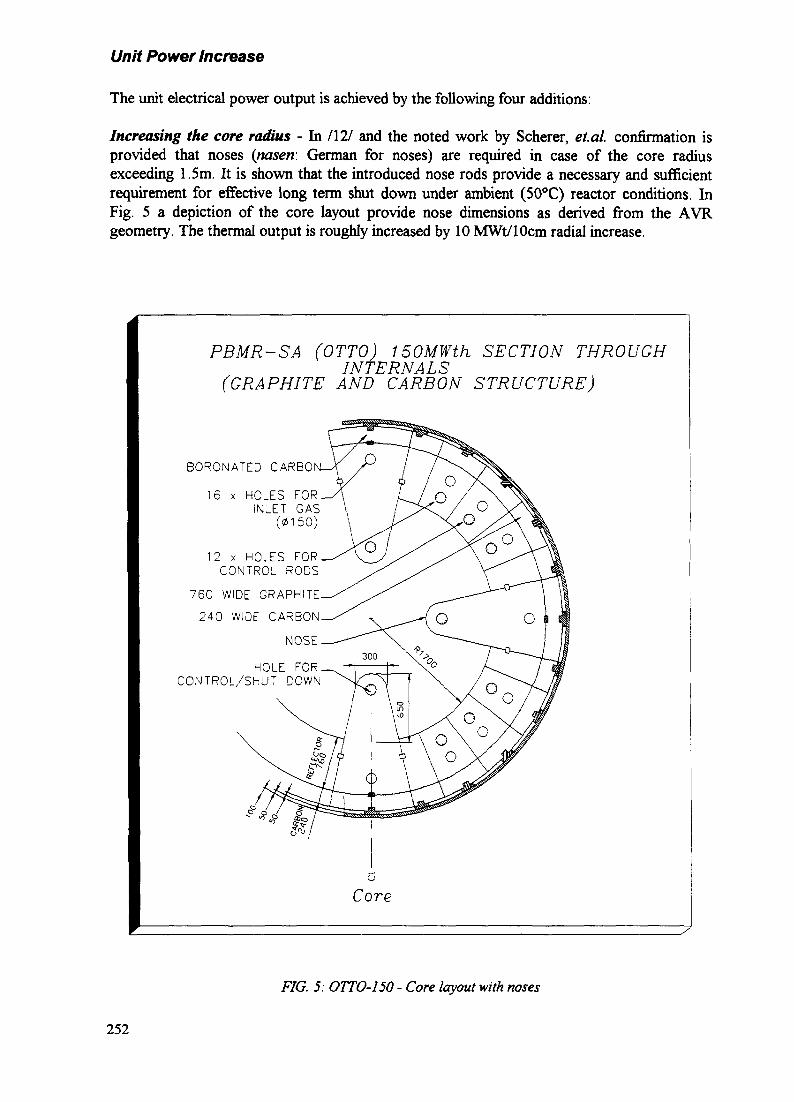
Unit Power Increase
The unit electrical power output is achieved by the following four additions:
Increasing the core radius - In /12/ and the noted work by Scherer, et.al. confirmation isprovided that noses (nasen. German for noses) are required in case of the core radiusexceeding 1.5m. It is shown that the introduced nose rods provide a necessary and sufficientrequirement for effective long term shut down under ambient (50°C) reactor conditions. InFig. 5 a depiction of the core layout provide nose dimensions as derived from the AYRgeometry. The thermal output is roughly increased by 10 MWt/lOcm radial increase.
PBMR-SA (OTTO) 1 SOMWth SECTION THROUGHINTERNALS
(GRAPHITE AND CARBON STRUCTURE)
BORONATED CARBO
16 x HOLES FORINLET GAS
(0150)
12 x HOLES FORCONTROL RODS
760 WIDE GRAPHITE
240 WIDE CARBON
NOSE
HOLE FORCONTROL/SHUT DOWN
o
Core
FIG. 5: OTTO-150 - Core layout with noses
252

Increasing the core height - A parameter variation is performed to determine characteristicsensitivity for the yield in thermal output versus increase in height. In summary the tendency inthermal gain is ~10%/m.
Apart from the 3-D calculational requirement necessitated by the resultant core geometry,effective physical modelling of the downward fuel flow through the core dictated theintroduction of cylindrical geometry. The FIRZIT code is subsequently developed to performthe 3-D geometrical modelling in <f>-r-z. Diffusion calculations in 3-D is performed with theCITATION code. In Fig. 6 a sectional depiction of the OTTO core is posed.
1/8 Section of OTTO Core
Carbon Bricks
Ref lector
Contro RodCoreNose
100 200 300CM
FIG. 6: OTTO-150 - 1/8 Section of the core and reflector model
Introduction of a 2-zone core loading scheme - This concept is well-proven in practiseduring the AYR operation. The fuelling tubes in the AYR design are perfectly suitable to beemployed towards this end. In the note /13/ a mixture of 25% graphite spheres (blindkugeln) isshown to be effectively employed for creating an equalised distribution of the power densityfrom within the centre column of the core radially outward. This is done without upsetting thefuel/moderator ratio in the core. A flatter temperature profile is achieved in this way due thedecrease of fissionable material in the inner core area (see Fig. 7). The obtained reducedpower density results in a reduction of the decay heat production in the inner core.
253

Helium Exit Temperature Distribution
1000
900
BOO
700
600
500
400
fl-ZONE HE EXIT TEMPERATURE
f2-ZONE HE EXIT TEMPERATURE
/{lEUUM ENTRY \
30 60 90
Core Radius
120 150
FIG 7 2-Zone versus I-Zone core layout
Deploying an advanced fuel design by including E4C coated particles - In the calculationalmodel the shielding of all coated particles, whether fuel or burnable poison, is observed. Selfshielding factors (SSF) in the thermal-neutron energy range influencing reaction rates in theparticle kernels, coatings and moderator material have been calculated The theory is based onthe derivations in /147 which includes an accurate description of the penetration probability fora neutron traversing the coated particles
Self Shielding Factors in the modelled Spectrum Zones
FIG 8 Calculated SSF in Spectrum Zones 1-10 ranging from top (1) to the bottom (10) of core
254

1.6
1,4
1.2
0,6
0,4
0.2
0
OTTO-P: Power Distribution in Channel 1
7Batch #
10 11 12 13
FIG. 9: OTTO-P - In-core (inner column) estimated power distribution
TABLE HI. SOME FUEL AND REFLECTOR CHARACTERISTICS OF THEREFERENCE REACTOR
Fuel Elements:
Sphere radiusFuel matrix radiusUranium enrichment - Nus/NuHeavy metal loading per fuel sphereFuel spheres / Graphite spheres(inner - outer core zone)
Coated Fuel Particles:Particle diameterDensityCoating materialThicknessDensity
Coated B4C Particles:Particle diameterDensityCoating materialThicknessDensity
Reflector:ThicknessGraphite density
cmcm%
g/sphere%
|img/cm3
jimg/cm3
umg/cm3
Jimg/cm3
cmg/cm3
First Core32.54.66770/30 - 100/0
50010.4C/iPyC/SiC/oPyC95/40/35/401.05/1.90/3.18/1.90
4002.45C/iPyC/SiC/oPyC95/40/35/401.05/1.90/3.18/1.90
Inner781.75
Equilibrium Core32.59.45767/33 - 100/0
Outer221.55
255
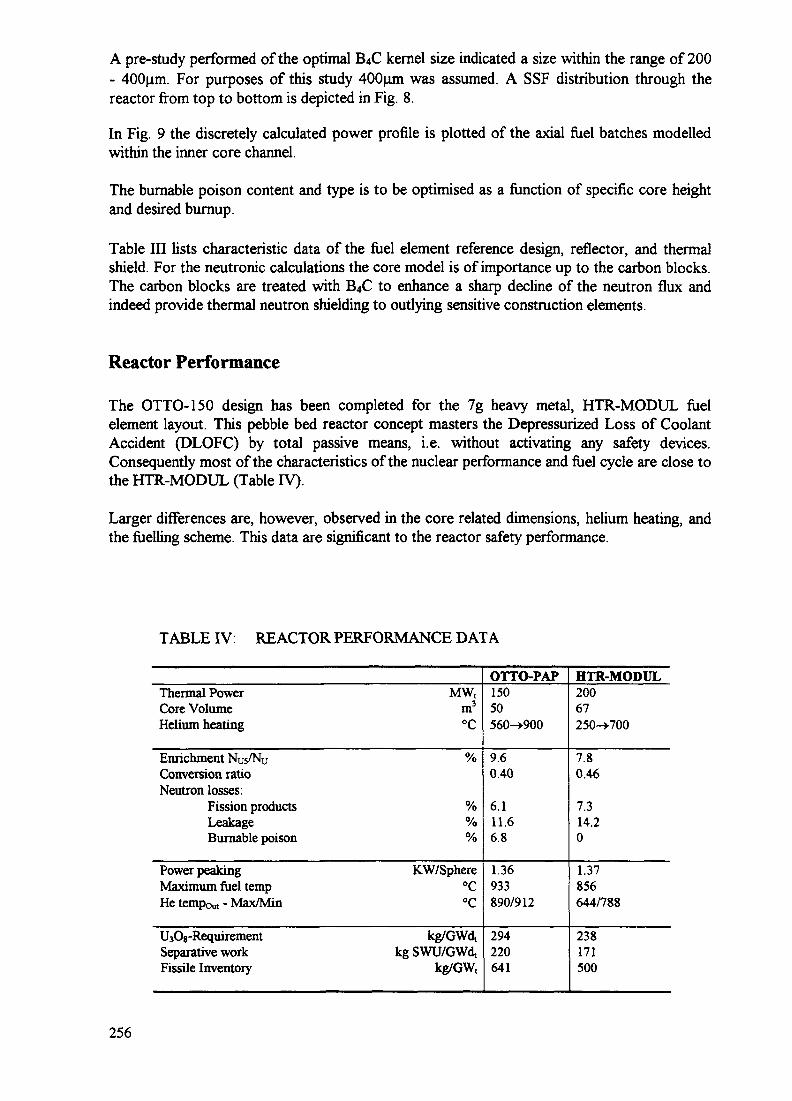
A pre-study performed of the optimal B4C kernel size indicated a size within the range of 200- 400um. For purposes of this study 400u,m was assumed. A SSF distribution through thereactor from top to bottom is depicted in Fig. 8.
In Fig. 9 the discretely calculated power profile is plotted of the axial fuel batches modelledwithin the inner core channel.
The burnable poison content and type is to be optimised as a function of specific core heightand desired burnup.
Table III lists characteristic data of the fuel element reference design, reflector, and thermalshield. For the neutronic calculations the core model is of importance up to the carbon blocks.The carbon blocks are treated with B4C to enhance a sharp decline of the neutron flux andindeed provide thermal neutron shielding to outlying sensitive construction elements.
Reactor Performance
The OTTO-150 design has been completed for the 7g heavy metal, HTR-MODUL fuelelement layout. This pebble bed reactor concept masters the Depressurized Loss of CoolantAccident (DLOFC) by total passive means, i.e. without activating any safety devices.Consequently most of the characteristics of the nuclear performance and fuel cycle are close tothe HTR-MODUL (Table IV).
Larger differences are, however, observed in the core related dimensions, helium heating, andthe fuelling scheme. This data are significant to the reactor safety performance.
TABLE IV: REACTOR PERFORMANCE DATA
Thermal PowerCore VolumeHelium heating
Enrichment NUS/NUConversion ratioNeutron losses:
Fission productsLeakageBurnable poison
Power peakingMaximum fuel tempHe tempos - Max/Min
U3O8-RequirementSeparative workFissile Inventory
MWtm3
°C
%
%%%
KW/Sphere°C°C
kg/GWd,kg SWU/GWdt
kg/GW,
OTTO-PAP15050560->900
9.60.40
6.111.66.8
1.36933890/912
294220641
HTR-MODUL20067250-»700
7.80.46
7.314.20
1.37856644/788
238171500
256
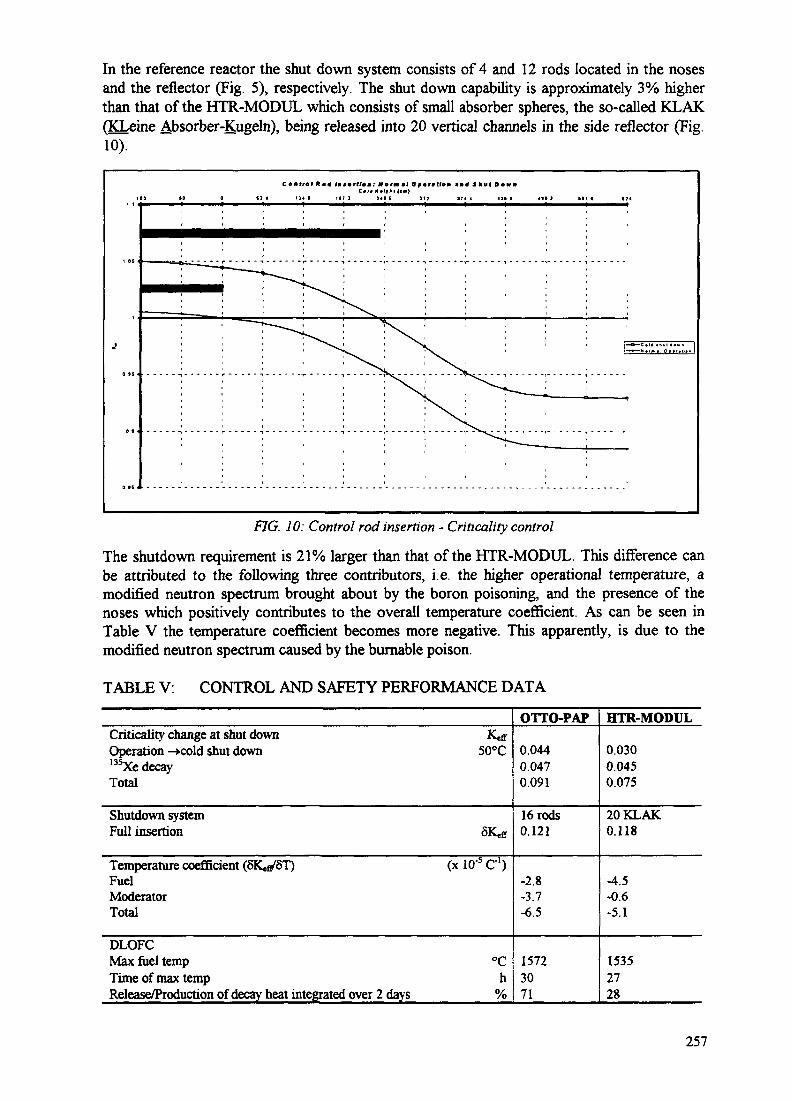
In the reference reactor the shut down system consists of 4 and 12 rods located in the nosesand the reflector (Fig. 5), respectively. The shut down capability is approximately 3% higherthan that of the HTR-MODUL which consists of small absorber spheres, the so-called KLAK(KLeine Absorber-Kugeln), being released into 20 vertical channels in the side reflector (Fig.10).
FIG. 10: Control rod insertion - Criticality control
The shutdown requirement is 21% larger than that of the HTR-MODUL. This difference canbe attributed to the following three contributors, i.e. the higher operational temperature, amodified neutron spectrum brought about by the boron poisoning, and the presence of thenoses which positively contributes to the overall temperature coefficient. As can be seen inTable V the temperature coefficient becomes more negative. This apparently, is due to themodified neutron spectrum caused by the burnable poison.
TABLE V: CONTROL AND SAFETY PERFORMANCE DATA
Criticality change at shut down K,ffOperation -»cold shut down 50°C135Xe decayTotal
Shutdown systemFull insertion SK,s
Temperature coefficient (SK.tf'ST) (x 10'5 C1)FuelModeratorTotal
DLOFCMax fuel temp °CTime of max temp hRelease/Production of decay heat integrated over 2 days %
OTTO-PAP
0.0440.0470.091
16 rods0.121
-2.8-3.7-6.5
15723071
HTR-MODUL
0.0300.0450.075
20 KLAK0.118
-4.5-0.6-5.1
15352728
257
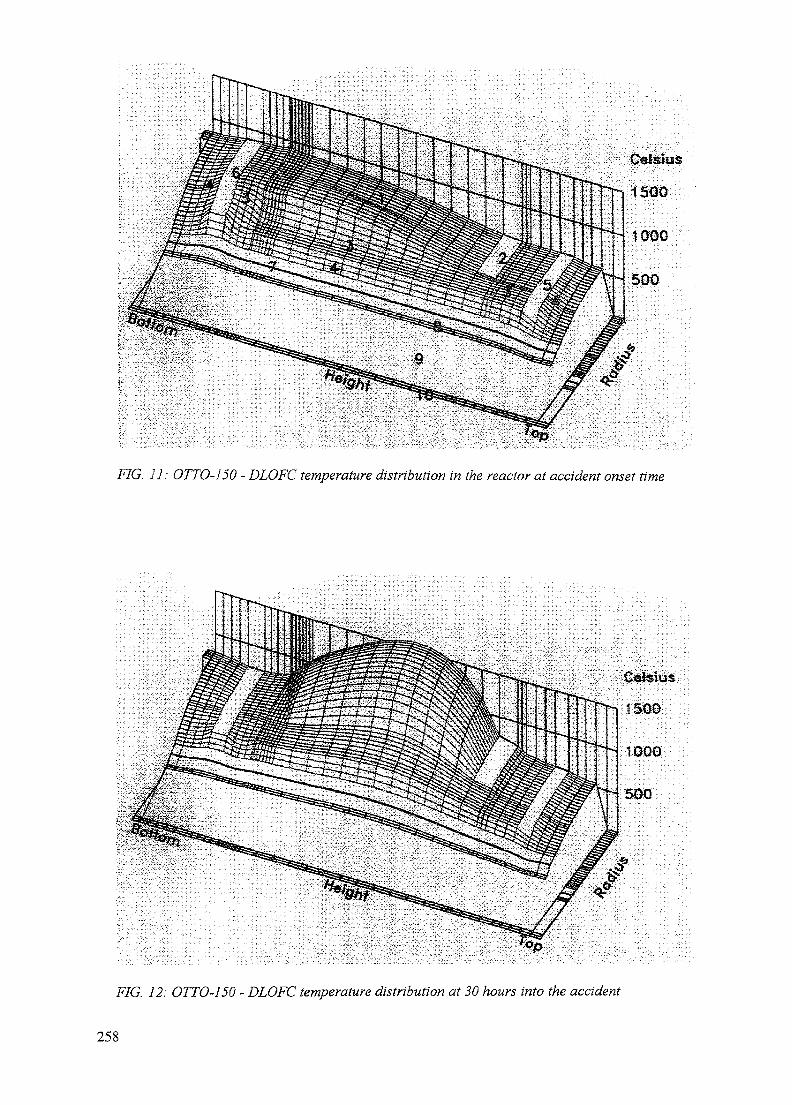
l^iii^y^ii^FIG. 11: OTTO-150 - DLOFC temperature distribution in the reactor at accident onset time
FIG. 12: OTTO-150 - DLOFC temperature distribution at 30 hours into the accident
258

In Fig 11 the OTTO-PAP model layout is presented
During a DLOFC the passive removal of the decay heat proceeds exactly in accordance withthe HTR-MODUL. The maximum fuel temperature, depicted in Fig 12 remains below thelimit of 1600°C, which is regarded the limiting temperature for full retention of the radioactivenuclides in the coated particles An important difference is observed in the decay heat domainWhilst in the HTR-MODUL decay heat is mostly stored (72%) in the reactor and internalcomponents over the first 2 days, the OTTO-PAP predominantly releases decay heat (only29% stored) via the reactor pressure vessel to be removed by the reactor cavity cooling system(RCCS) (see Figs 13a & b) This is due to the higher operational temperature of the reactor,taken as the initiating temperature of the DLOFC transient calculation
90
80
70
60
OTTO-150: Decay Heat Storage during DLOFC
imrrm Heat stored in Reflector
EZZ2 Heat stored in Fuel
—— Integral decay powsr
99 112
FIG 13a OTTO-150 Characteristic decay heat storage during DLOFC
120
100
I 60
20
HTR-M: Decay Heat Storage during DLOFC I
Hiiiim Heat stored in Reflector
112
FIG 13b HTR-MODUL - Characteristic decay heat storage during DLOFC
259

In Fig 14 the temperature behaviour in the fuel and reactor pressure vessel is depicted duringthe accident, while Fig 13a clearly displays cooling down of the core and reflector after 33hours since the time of accident inception Fig 13b outlines the heat storage performancedifferences within the HTR-MODUL reactor
Fuel and Reactor Pressure Vessel Tenperatures during DLOFC
2000
•1500. ———-
1000 A -
500
58 72 86 99 112
-o- T-Max in Fuel -o-T%Avg in Fuel -A- T-Max in RFV
FIG. 14 OTTO-150 - Temperature transients during DLOFC
Conclusions
A PBMR reactor design based on the following philosophy is offeredTechnology pertaining to reactor layout and control is considered within the realm of observeddynamic similarity,The proposed advanced fuel design can be realised (manufactured and qualified) within theexisting infra-structural frame of reference /15/
During OTTO-PAP fuelling of a high temperature pebble-bed reactor, fuel spheres are initiallybeing added daily, on-line, in accordance with the fuel burnup Off-line, batchwise de-fuellingis possible for a period to be optimised between six months and two years after reaching anequilibrium core Axially a flat neutronic flux profile resembling that of the MEDUL fuellingregime is achieved by introducing B4C coated particles of particular size in accordance with apre-calculated packing density within the fuel spheres. A higher power output together with anoptimised overall fuel utilisation is achieved by this manipulation
An optimised radial temperature distribution is achieved by introducing a 2-zone core loadingThe excellent possibility is offered for power production when coupled to a the powerconversion unit (PCU) with Brayton cycle due to the relatively low temperature gradientwithin the fuel spheres
260

Physical properties of the OTTO-150 reference design is reported, while computationsperformed observe results obtained by the reference MEDUL design. Characteristic data forthis reactor layout is presented.
Advantages of the OTTO-PAP and Peu-a-Peu fuelling schemes include simplification of theoverall fuel management regime, operational ease offered by off-line de-fuelling, andconsiderable capital saving due to the simplified component requirements for re-fuelling,burnup measurement and instrumentation. The basic fuel elements under consideration areconventional, well-tested with regards to production techniques, temperature and irradiationperformance, and bumup.
REFERENCES
/!/ Owner Requirement Specifications, Rev. 1, ESKOM, Technology Group
flf User Requirement Specifications, Rev. 1, ESKOM, Technology Group
131 K Verfondern, W Schenk, and H Nasbielek Passive Safety Characteristics of Fuel fora Modular High-Temperature Reactor, and Fuel Performance Modelling underAccident Conditions, Nuclear Technology: 91, 235-246, Aug. 1990
/4/ W Scherer, K-A Haas and H-J Rutten Potential and Limitations in Maximising thePower Output of an Inherently Safe Modular Pebble-Bed HTGR, ISR-KFA, To bepresented at this Conference
IS/ AYR- Experimental High-Temperature Reactor: 21 Years of Successful Operation fora Future Energy Technology, Association of German Engineers, VDI-Society forEnergy Technologies (Publ.), VDI-Verlag GmbH
/6/ E Teuchert, H Gerwin, K-A Haas, R Schulten and Y Sun Features of Passive Controlof a Small Pebble BedHTRfor Gas Turbine Cycle, Research Center Julich GmbH,KFA-ISR
111 E Teuchert, V Maly, K-A Haas, Basisstudie zum Kugelhaufenreaktor in OTTO-Beschickung, Jul-858-RG, Nuclear Research Center Julich GmbH, May 1972
/8/ H Eladly Grofie modulare Kugelhaufenreaktoren mil passivenSicherheitseigenschaften als ein Beitrag zur katestrophenfreien Kerntechnik -Fexibilitat in Auslegung und Anwendung, Jiil-3179, Nuclear Research Center Julich,KFA-ISR, January 1996
/9/ E J Mulder and M Fox Architect Engineering Study Report: Technical Descriptionand Phase 1 Study Definition, ESKOM/IST Internal Report, February 1996
/10/ E Teuchert Anpassung des Kugelfliefischemas an das bei der Entladung des THTRbeobachtete Fliefiverhalten, Notiz 1-96, April 1996
/I I/ A Kleine-Tebbe Arbeiten zu einem ringformigen Kugelhaufenkern, KFA ResearchReport, September 1995
261

/12/ K Kugeler and R Schulten Hochtemperaturreaktortechnik - HTR, Springer VerlagBerlin Heidelberg New York London Paris Tokyo Hong Kong, 1989
/13/ E Teuchert 2-Zonen-Core far Kugelhaufenreaktor in OTTO-Beschickung mit einereinzigen Brennstoffanreicherung, Notiz 2-96, April 1996
/14/ E Teuchert and R Breitbarth Resonanzintegralberechnung far mehrfach heterogeneAnordungen, Jiil-551-RG, KFA, Julich, 1968
/15/ Private communication with M. Hrovat, October 1996
262

HTR PLANT SYSTEM AND COMPONENT DESIGN
NEXT PAQE(S)toft BLANK

GENERATOR TECHNOLOGY FOR HTGR POWER PLANTS
D. LOMBA, D. THIOTGEC Alsthom Power Generation, XA9846686Belfort, France
Abstract
Approximately 15% of the worlds installed capacity in electric energy production is fromgenerators developed and manufactured by GEC Alsthom. GEC Alsthom is now workingon the application of generators for HTGR power conversion systems. The main generatorcharacteristics induced by the different HTGR power conversion technology includehelium immersion, high helium pressure, brushless excitation system, magnetic bearings,vertical lineshaft, high reliability and long periods between maintenance.
1- Experience
When we speak about manufacturing, experience is one of the major concerns for Power Plantusers. Only previous experiences can ensure the real feasibility and safety of an equipment.GEC ALSTHOM is a world leader in Generators manufacturing. It supplies Air-Cooled andHydrogen-Cooled generators for different power plant applications: Hydro, Nuclear,Combined Cycle, Fossil Fired, Gas Turbine.It has a world record in generators with a rating of more than 1710 MVA in a single unit(Chooz Nuclear Power Plant in France).
With about 15% of the world installed capacity in electric energy production, GECALSTHOM developed expertise in different Power Plant development and manufacturing.
In all continents, many countries are now equipped with GEC ALSTHOM equipment.
GEC ALSTHOM is one of the main suppliers of power conversion systems for nuclear powerplants. Its experience in the nuclear field is unique with a total of 117 units manufactured:- France: 68 units- United Kingdom: 24 units- Belgium: 8 units- South Korea: 6 units- China : 2 units + 2 under manufacturing- USA: 3 units- South Africa: 2 units- Sweden: 2 units
The large experience of GEC ALSTHOM in Hydrogen-immersed generators permits theapplication of their technology to the HTGR generator systems.
GEC ALSTHOM is now working in different applications of generators for HTGR powerconversion systems.
265

2- Main technical characteristics of the HTGR Power Convertion system
Main characteristics induced by the different HTGR power conversion technologies to thegenerator systems are:
A- Helium immersionB- High pressureC- Brushless excitation systemD- Magnetic BearingsE- Vertical lineshaftF- High reliabilityG- Long periods between maintenances
These parameters shall be taken into account for the generator design.
A- Helium immersion
The dielectric properties of helium have to be taken into account. The dielectric strength ofHelium is much lower than the air one. The generator design needs to respect insulationdistances with a view to avoid dielectric origin problems.This problem can be solved by pressure increase: it is assumed that the dielectric strenght ofHelium at 10 to 15 bars pressure is equivalent to air at atmospheric pressure. This is the reasonthat with a standard design no full voltage in the generator is expected before this minimumpressure value. Nervertheless, the machine can be excited at reduced voltage - for examplewhen it is connected to a startup frequency converter. In fact, there is a direct relation betweengenerator maximum voltage and helium pressure.Under certain conditions, a special design adapted to a lower minimum pressure can berealized.
B- High pressure
More than the absolute value of the service pressure the pressurisation and depressurisationrates of the generator vessel are one of the sensible points of the system.According to the compacity of the insulation used, the pressurisation and depressurisationactions versus time may be limited .Effects of rapid variation of pression on the usual insulation system will have to be determinedby tests.Nevertheless some tests performed in the past on other Helium immersed and smaller electricalmachines gave promissing results and showed that (or adaptations of) existing insulationtechnics can be used.
C- Brushless excitation system
Due to the direct helium flow through turbine and nuclear core, no dust is allowed.As access to the excitation system wil be exeptional, it will not be possible to use staticexcitation with brushes, furtheremore, static excitations need a lot of care.A brushless excitation without direct rotor contact will be compulsary.GEC ALSTHOM has a large experience on compact brushless excitation systems.
266

D- Magnetic Bearings
For the same above reason, no oil will be acceptable inside the system. The only technologynow available is magnetic bearings.Magnetic bearings and thrust bearing integration on such a generator is an advantage. Dynamicmagnetic bearings can participate on the stability of the lineshaft.
E- Vertical lineshaft
The vertically of the lineshaft is a choice. This choice was taken mainly because of civil workssaving reasons (the nuclear vessel and power convertion vessels may be under earth ). Theshortness of the connection in between the two vessels is also one important point of thischoice.Verticality of the lineshaft can also be an advantageous configuration as far as the magneticsupporting is concerned.
GEC ALSTHOM has a large experience in vertical oriented lineshafts. this was mainly onhydro-generators application.
F- High reliability
Due to the high pressure vessel enclosure, the generator access will be more difficult than inconventional machines.The reliability of equipment is one of the major concerns.
G- Long periods between maintenances
The limited generator accesses and the maximization of availability will lead to long periodsbetween maintenances.Maintenance executed each 6 years is now common on GEC ALSTHOM maintenance policy.Additional instrumentation can be installed in the generator with a view to control itsbehaviour.
3- Implication of these different parameters
The implication of these different parameters will lead GEC ALSTHOM to adapt theirconventional proven generator design to this specific application.
Nevertheless, this constraining environment will imply different checks and tests of the capacityof the GEC ALSTHOM technology to comply with these specific requirements.
Some investment in research and development will be then necessary for confirmation ofcompliance of the existing technology or to change for a suitable one.
267
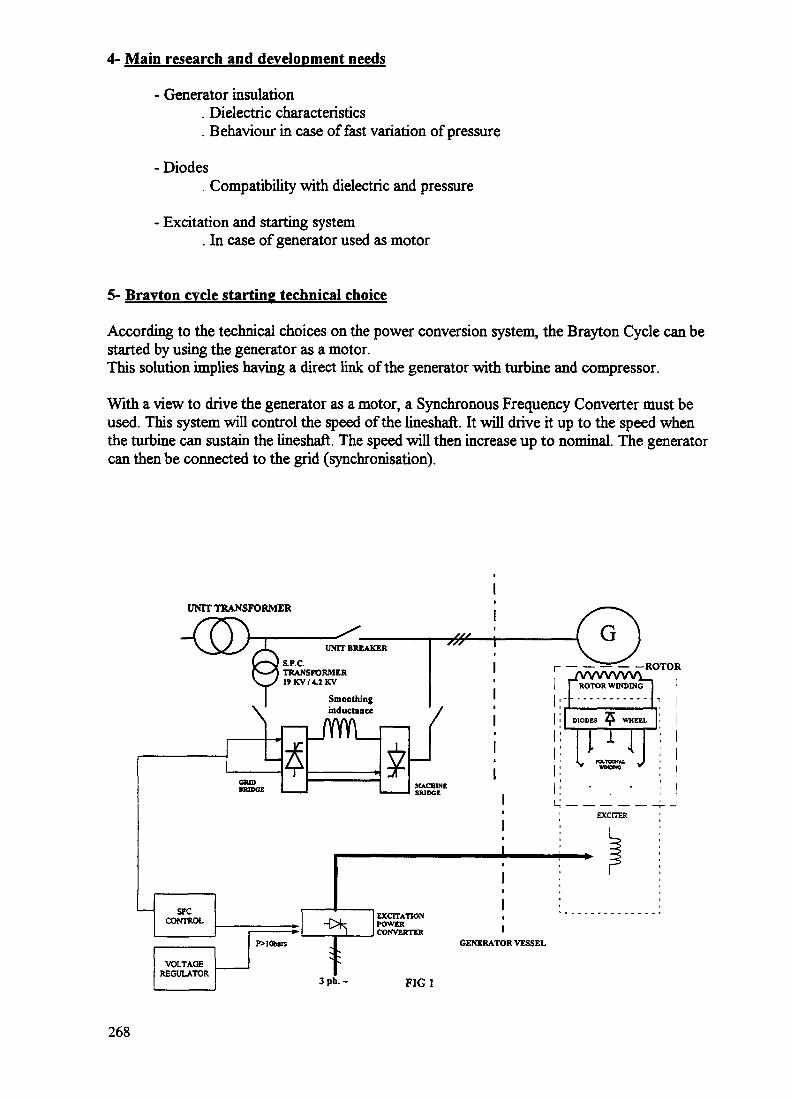
4- Main research and development needs
- Generator insulation. Dielectric characteristics. Behaviour in case of fast variation of pressure
- Diodes. Compatibility with dielectric and pressure
- Excitation and starting system. In case of generator used as motor
5- Bravton cycle starting technical choice
According to the technical choices on the power conversion system, the Brayton Cycle can bestarted by using the generator as a motor.This solution implies having a direct link of the generator with turbine and compressor.
With a view to drive the generator as a motor, a Synchronous Frequency Converter must beused. This system will control the speed of the lineshaft. It will drive it up to the speed whenthe turbine can sustain the lineshaft. The speed will then increase up to nominal. The generatorcan then be connected to the grid (synchronisation).
UNIT TRANSFORMER
S.F.C.TRANSFORMERWKV/4.ZKV
inducUncc
EAKER
ing
,„ ,,_r ,,... ,_^i! <-j1 I
--hBRIDCE
JC/AI
M 111JL\7fJi
CONTROL
VOLTAGEREGULATOR
P>10tars-OHf
3 ph.-
MACHINEBRIDGE
EXCITATIONPOWERCONVERTER
FIG1
r — —^=-— —ROTORi/vwvvvi_.ROTOR WINDING
DIODES *•* WHEEL
GENERATOR VESSEL
268

RESISTIVETURBINE TORQUE -10 mo 4h 8h 8h30
- 26000 mN
HtAB& PRESSURE4 ban
~ 53000 mN 10 BARS
2b*n
STATOR VOLTAGE
SYNCHRONIZING
19 KV
4.2 KV
TIME
FIG2a
SPEED3600 RPM
-8h-10 ran - 8 h 30mn
EXCITATIONCURRENT
EXCITATIONTIME
SFC ~ * >' Vw- r
CONTROL BY VOLTAGE REGULATOR
FIG2b
The frequency converter can be used when stopping the unit the speed can be controlledaccording to appropriate stages of deceleration and to help core cooling
Finally, it can also stop the lineshaft acting as a brake
Fig 1, 2a and 2b illustrate a simplified schematic single line diagram and the associated startingsequence, both established for the General Atomics/ GT-MHR project
269
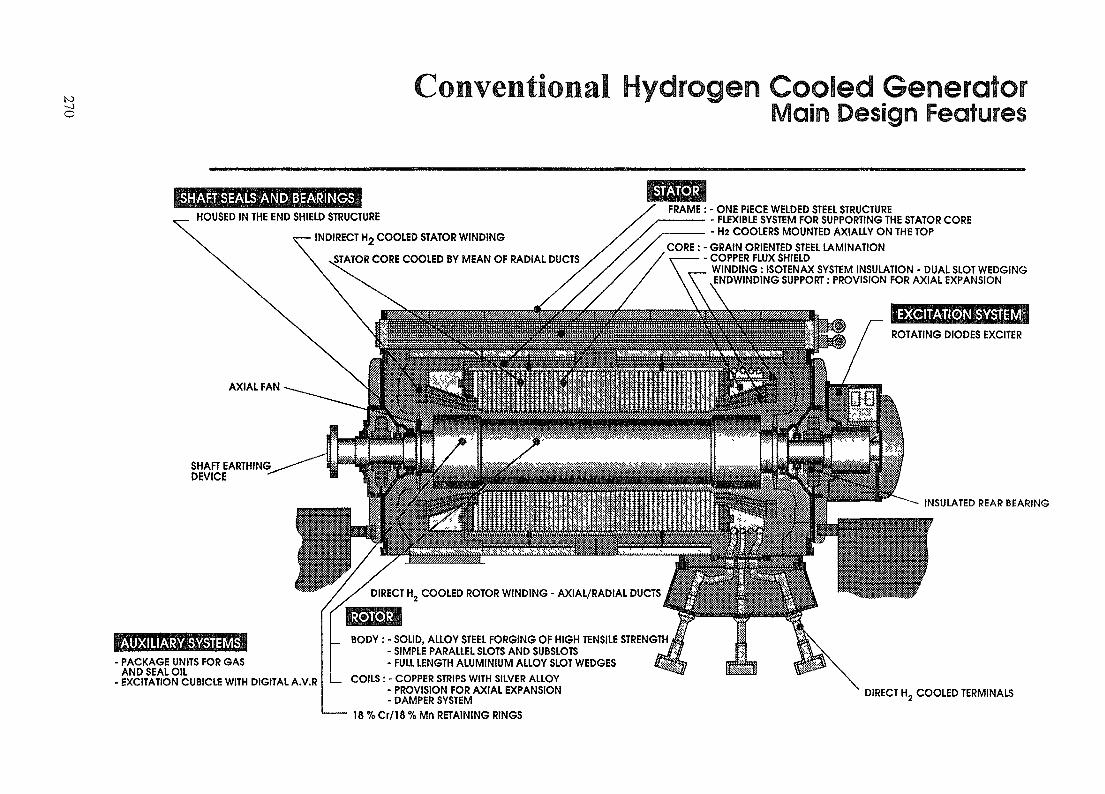
to-jO Main
ISt-iAFfiSEALS ANRiBEARlNGSiHOUSED IN THE END SHIELD STRUCTURE
INDIRECT H2 COOLED STATOR WINDING
sSTATOR CORE COOLED BY MEAN OF RADIAL DUCTS
SHAFT EARTHINGDEVICE
ISTATORFRAME : - ONE PIECE WELDED STEEL STRUCTURE———— - FLEXIBLE SYSTEM FOR SUPPORTING THE STATOR CORE
- H2 COOLERS MOUNTED AXIALLY ON THE TOPCORE : - GRAIN ORIENTED STEEL LAMINATION
- COPPER FLUX SHIELDWINDING : ISOTENAX SYSTEM INSULATION - DUAL SLOT WEDGINGENDWINDING SUPPORT : PROVISION FOR AXIAL EXPANSION
DIRECT H, COOLED ROTOR WINDING - AXIAL/RADIAL DUCTS
IAOXlLIARY®STEIv1$l• PACKAGE UNITS FOR GASAND SEAL OIL
• EXCITATION CUBICLE WITH DIGITAL A.V.R
_ BODY : - SOLID, ALLOY STEEL FORGING OF HIGH TENSILE STRENGTH t- SIMPLE PARALLEL SLOTS AND SUBSLOTS- FULL LENGTH ALUMINIUM ALLOY SLOT WEDGES
COILS : - COPPER STRIPS WITH SILVER ALLOY- PROVISION FOR AXIAL EXPANSION- DAMPER SYSTEM
- 18 %Cr/18%Mn RETAINING RINGS
EXCITATION SYSTEMROTATING DIODES EXCITER
INSULATED REAR BEARING
DIRECT H2 COOLED TERMINALS

6- HTGR Generator main technical caracteristics
| Main generator caracteristics Comments
Power
Power factorVoltage
Cooling water temperature atgenerator inlet coolersEfficiency
Speed
Over speed
Cooling medium
Helium pressure
Temperature
Bearings
Lineshaft orientationExcitationGenerator used as motor
Planned maintenance intervals
Design lifeTurbine-generator Coupling
from 30 to 500 MW
usualy 0.85from 10 to 26 kV
15to35°C
~ 98 %
3000 or 3600 RPM
120 %
helium to water coolers
normal operation «30 bars
insulation: class F155°Cmax.
Magnetic bearings
verticalBrushlesswith S. F. C. drive
» every 6 years
30 yearsusually direct coupling
according to the power plantproject choiceto be defined by the customerfunction of generator power anddynamic operation of the systemaccording to the country and sitelocationefficiency is lower in Helium highpressures due to increasedmechanical lossesaccording to the frequency of thegrid 50 or 60Hzusual requirements withstandard machinesrotor and stator: axial-radialcoolingaccording to nuclear core andturbine operationIEC standards
can participate actively on thestability of the lineshaftproject choiceStatic excitation to be avoidedproject choice
according to main power plantmaintenance planned periodwith half-life refurbishmentcoupling and torsionnal analysisof the lineshaft depends on theflexibilities, inertias andgenerator short-circuit torque
7- HTGR Generator technical description
The HTGR generator is directly derivated from a standard GEC ALSTHOM machine whereexisting proven technologies are applied. The Figure 3 shows an example of generalarrangement for such a HTGR generator.
A) magnetic core stacking
The magnetic core is made of silicon steel segmental laminations with high permeability andlow specific losses. These laminations are varnished on both sides, assembled in annularmanner, and separated into packets by radial vents through which the cooling gas circulates.
271

After stacking the core assembly is securely clamped between two heavy fingered plates andkeybars uniformly distributed at the periphery of the magnetic core. A flux shield of highconductivity material is mounted on the clamping plates and protects the stator ends from theleakage flux between the stator and the rotor (please see Fig. 4 ).
B) Stator armature winding
The armature winding is formed by connecting half-coil bars to make a balanced three phasetype winding.There are two bars per slot. The connection between consecutive bars is made bybrazing their ends with lateral copper plates .The bars are made of insulated copper strands,transposed according to the Roebel system all along the core length, and ground insulatedover their full length ( please see Fig. 5 ).
The standard insulation technology consists of a mica paper tape, glass cloth and bondingepoxy resin. Each bar is insulated over its whole length, straight portion and ends bycontinuous taping according to the Isotenax process. After wrapping, the bar is moulded andhot-polymerized.
The endwindings are rigidly supported by fibre glass rings which are themselves supported bya number of axial brackets fixed to the stator core endplate assembly (please see Fig. 6 ).
C) Flexible suspension
The magnetic attraction between the rotor and the stator produces a rotating ellipticaldeformation resulting in a double frequency vibration whose amplitude depends on themachine's electromagnetic sizing and core frequency.
U.S. DOE GT-MHR PROGRAM
BJWCafflEJCIIB
MOCTIC BEMIIC vim MOBMIMU ————————
T0MW. COMCTIM
GEKMTR CflllT
CWE-WIN ORIENTED NOETIC S££I
CPTIMUEO DO NMTScaret UK SHODKIH. BPM61M
MOCTIC SEARIIC VIIH WOBt
WHLE————————
DIODES
mtMK NOUMTEO AC EffillB)
•IIOIKCT IB.IW COCLffi STUW
4 Mill. KUWMTEft HOURS
IIM. SWWS
ieu SUSPE«I»IJyE UIU-RUIN. DUCTS
KLIUrDIRECI-COUD riELO VIWI*
MULCHMtl.
WIN. FAN VITH KMMGU GU0E5
HIM. SJRWIS
I I I I I '
UJLUFIGS
272

1 - Standard lamination packets2 - Vent ducts3 - Stepped lamination packets4 - Key bars5 - Welding6 - Clamping plate7 - Clamping fingers8 - End flux shield9 - Stator bars
FIG4
r1
i
1
= —
fs
|
. .,_
i
^=
i
=
2
=
Z
i
=7
BOTTOM STRIP
EARTH INSULATION (ISOTENAX)
SOLID STRAND
INTER-BAR SPACER
INTERMEDIATE TRANSPOSmON PACKINGSEPARATOR
WEDGING STRIP
SLOT WEDGE
FIGS
273
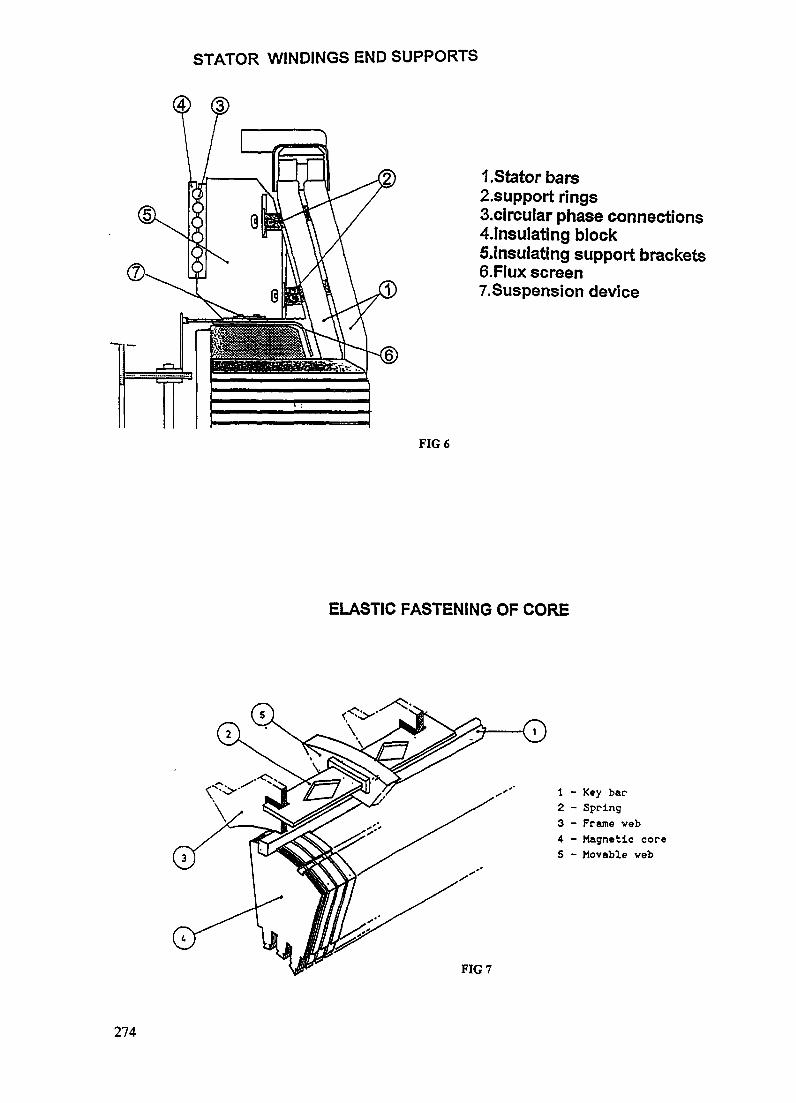
STATOR WINDINGS END SUPPORTS
FIG 6
1 .Stator bars2.support rings3.circular phase connections4.insulating block5,insulating support brackets6.Flux screen7.Suspension device
ELASTIC FASTENING OF CORE
1 - Key bar2 - Spring3 - Frame web4 - Magnetic core5 - Movable veb
FIG 7
274

The core is flexibly mounted to the frame so that vibrations transmitted to the frame areminimised (please see Fig. 7). The flexible suspension also influences the short-circuit torquestransmission.
D) Rotor
The rotor is a monobloc steel forging in which some slots are machined to receive the fieldwinding. Each winding turn consists of two strips of alloy copper. The slots are fitted with aninsulation to earth consisting of epoxy resin impregnated glass slot liners. Complete coils areobtained by brazing the half coils in the axis of the poles (please see Fig. 8a and 8b ).
ROTOR COIL DETAILS
3 LAND SEATING
INVERTED THROUGH
SINGLE PATH VENTILATION
FIGSa
C80SSPOLEIlfeRTlASlJTS
BALANCE WEIGHTHOLES
aiDWINDING PACKING
FINGER BLOCKS
\18/18 STAINLESS STEELRETAINING RING
SPRING RINGCONTINUOUS ALUMINIUMALLOY WEDGES
FIGSb
275

AXIAL-RADIAL VENTILATIONMAGNETIC CORE + STATOR WINDING
ROTOR WINDING
FIG 9
The endwindings are secured by retaining rings and insulating blocks between each coil.Theretaining rings are forged in high mechanical properties non-magnetic alloyed steel, andseparated from the enwindings' copper by layers of laminated bonded glass
E) Cooling
In high pressure Helium, there is no need for water cooled stator bars before at least 500 MWThe stator cooling is simple and reliable, of the indirect type, similar to air cooled machines
The rotor is of direct cooling type, using a combination of radial and axial ducts machined inthe rotor forging and in the copper strands, in which the cold Helium flows under the effect ofrotationThe general gas circulation in the machine is ensured by two axial fans mounted on each end ofthe rotor.
All the losses produced in the generator are absorbed by Helium which circulates in closedcircuit and is cooled by water exchangers arranged around the stator (please see Fig. 9 )
F) Brushless/Bearingless exciter
A brushless rotating diode exciter is an inverted AC generator, the stationary part being thefield magnet and the rotating part of the armature The armature winding is multiphase and isconnected to the main generator field winding through a diode rectifier bridge mounted inoverhang (Fig 10) The rotating armature of this exciter is directly bolted at the rotor shaftend and has no additionnal bearing.
276

BRUSHLESS EXCITER CROSS-SECTION.
EXCITER ARMATURERETAINING RING
HOUSING
FIG 10
Diodes are electrically oversized. A failure of these components can be detected by itsinfluence on the exciter's field current waveshape.
In the case of association with a static frequency converter, some adaptations are necessaryto allow starting from zero speed.
G) Design Adaptations to HTGR
This basic technology will be retained for the HTGR application, but some specific adaptationsmay be realized in the general dimensioning of the machine
- The generator can be smaller than a conventionnal machine. This is due to the very highcooling capability of pressurized Helium.
277

- The cooling gas flow is reduced at the minimum possible value to limit the ventilation losses
- The rotor design may be adapted if necessary, in order to obtain a higher overspeed value,lower the friction losses and maintain usual electrical characteristics.
- Under certain conditions, a special stator design, allowing operation at Helium pressuresinferior to 10 bars can be obtained.
H) Maintenance
The generator can be equipped with a complete monitoring system to avoid unproductiveinspections and removals of the generator:
- Temperature of core- Temperature of windings- Conditions of insulation- Radiofrequency detection
The maintenance operations are of the same type as for conventional generators. With themachine placed at the upper part of the lineshaft, their duration is comparable, with somepossible adaptations, as a function of the turbo machine's accessibility and detailed design.
Minor repairs ( diode replacement, rewedging of end-windings...) can be done withoutremoving the generator.
For minor insulation touch ups, only the rotor is removed.
For major insulation touch ups, the generator can be exchanged with a replacement unit andthe repair is done on site.
278

XA9846687DEVELOPMENT OF AN ENGINEERING SIMULATOR AS ADESIGN TOOL FOR THE PEBBLE BED MODULAR REACTOR
B.A. KULLMANN, M.L. DAMSIntegrators of System Technology Ltd,Waterkloof, South Africa
Abstract
The Pebble Bed Nuclear Reactor concept being studied in South Africa has, in manyaspects, taken a new approach to and moved away from other designs. Differentinternational entities are supplying expertise on different specific parts of the plant. All ofthe subsystems are well defined in their own sphere of expertise. However, the interactionsbetween the individual components remained a question mark. An engineering simulatorwas developed to overcome these uncertainties and to investigate the response of thesystem. This paper describes the extent and scope of the simulation as well as the resultsobtained so far in Phase 1.
1. Introduction
The Pebble Bed Nuclear Reactor concept being studied in South Africa has , in manyaspects, taken a new approach to and moved away from other designs. A number ofinternational concerns each supply expertise on a specific part of the plant e.g. the AEC inSouth-Africa on the turbo-machinery, KFA of Germany on the reactor core [3][10] etc.There are many more experts involved in the active and passive heat removal elements aswell as the helium inventory system.
All these subsystems are well defined hi their own sphere of expertise. The interactionsbetween the individual components however remained a question mark . To overcome theseuncertainties it was decided to investigate the response of the system by developing anengineering simulator. This simulator is intended to investigate the above mentionedcomponent interaction. The platform used was the G2 Expert System from Gensym.
Much time and effort was expended hi trying to model the major components of the plant asaccurately as possible to the experts' design and to incorporate the current design base of allparties into the design tool. This paper describes the extent and scope of the simulation aswell as results obtained so far hi Phase 1.
2. Plant Overview and Extent of Simulation
The Pebble Bed Reactor Plant is envisaged to consist of the following subsystems:
• Main/Primary System - Reactor Core and PCU• Helium Inventory System• Shutdown Heat removal system• Active Heat removal system• Passive heat removal• Plant Control system
279

• Ventilation & Fire protection System® Water supply & purification system• Plant electrical system® Decontamination & Waste storage• Spent fuel system® Fuelling & Defuelling system® Primary loop initial cleanup system
The focus in the first phase of development clearly falls on the critical elements of thesystem which also form the largest part of the study. The parts of the overall systemmodelled were chosen on the basis of the uncertainty the design team encountered duringthe initial stages of the study.
The most important of these was the Main/Primary System i.e. the reactor core, turbo-machinery, heat removal and power conversion components such as the alternator. In short,all the systems involved in the Brayton cycle. Necessary for the analysis of the BraytonCycle and component interaction were the following subsystems - Helium Inventory ,shutdown- , active- and passive heat removal as well as those parts of the plant controlsystem involved in regulating the cycle. Control systems included are those regulatingpower, inventory, active cooler temperatures and control rod position.
FIG. 1
280
3. Scope of Simulation
Before discussing the scope of the simulation it is necessary to explain both the purpose anddesired results of the engineering simulator.
The purpose of the simulator is threefold:
• Investigate the interaction between the components of the system,included in which was a study on the stability of the Brayton cycle inthe current system configuration.
• To study the system's power ramping and step change capability .• Develop and study the plant control philosophy.
Component models are tailored to function correctly under the operating condition expectedduring these tests. It was not envisaged to perform detail testing on individual components.The following is a look at the scope/detail of simulation for the unit elements. Equationsand calculations are shown where relevant and where the models are not too complex to bereproduction here.
3.1 Reactor core
The core simulation employs a point kinetic neutronics model as supplied by the coreexperts at KFA in Germany [3][10]. It takes into account reactivity effects such as fuel,rods and moderator reactivity as well iodine and xenon effects. Temperatures of fuel,moderator and pebble shell are modelled and the thermal energy transfer from pebble to gasas well as thermal interaction with the environment are also included.
As yet the model does not incorporate the full thermohyraulics for thermal transfer betweenpebbles and helium flowing through the core. This would mean splitting up the core intoregions / layers, which will most likely be incorporated into the simulator during the nextphase of design. The current model is sufficiently accurate to allow analysis of the system.
3.2 Power Conversion Unit
The power conversion unit consists of the following pieces of equipment who'sinterconnection can be seen in Figure 1. A network of pipes, two (2) turbo-compressorpairs, a power-turbine, alternator , recouperator and active cooling elements. These areindividually discussed below:
3.2.1 Network of pipes and pressure nodes
The flow system is modelled as a network of pipes in which a momentum balance ismaintained and a set of pressure nodes at the component-pipe interface taking care of themass- and energy balance of the system [5]. Temperatures are transferred along the pipes at arate proportional to the mass flow in that part of the system.
The terms Kflow is included for numerical stability only. Kpress is introduced also forstability reasons since the global- instead of the real compressibility was used. Both terms donot influence the dynamics of the system but enhances numerical stability.
281

3.2.1.1 Momentum Balance
The conventional equation for momentum balance is [5]
L dW-—— = Pt-P0-dPfr+dPp-pgh Equation 1
where dPfr is given by [5]
dPfr = KfrW\W\Equation 2
Kfr=Q\LI(2A*)Applying a filtering coefficient as follows Equation 1 becomes
W = W + Kflow * dT(P, -P0- dPfr - pgh)A IL
Equation 3
Kflow was chosen to be 0.1. It has no effect on the steady state condition of the plant.
3.2.1.2 Pressure calculation at nodes
The pressure node calculations [5] calculated at the component hi- and outlets is as follows:
Cl — = ZW + Kpress*dt(^^—P)
Equation 4
The term Kpress provides for a correction of the pressure towards the value correspondingto the ideal gas law.
3.2.1.3 Mass Balance at nodes
The conventional mass balance formula [5] is used
dm—— = I,Wl-I.W0 Equation 5at
Due to the fact that the compressibility used in the pressure calculation is not the true value,the mass variations arising from a set of flows do not correspond exactly to the pressurevariations arising from the same set of flows.
The mass calculated above should be used in the pressure/flow calculations, but if a truemass value corresponding to the current pressure is required then the ideal gas law shouldbe used.
282
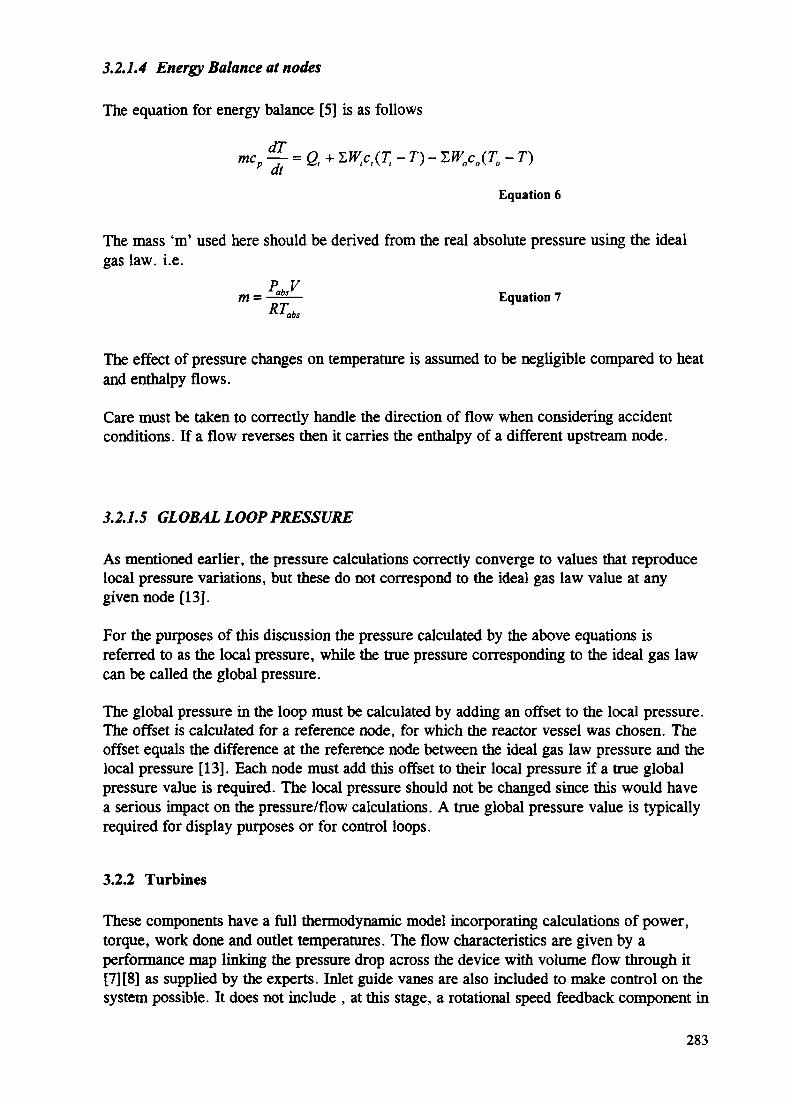
3.2.1.4 Energy Balance at nodes
The equation for energy balance [5] is as follows
,c,(T, - T) - I.W0c0(T0 - T)
Equation 6
The mass 'm' used here should be derived from the real absolute pressure using the idealgas law. i.e.
P Vm = -3!z— Equation 7
The effect of pressure changes on temperature is assumed to be negligible compared to heatand enthalpy flows.
Care must be taken to correctly handle the direction of flow when considering accidentconditions. If a flow reverses then it carries the enthalpy of a different upstream node.
3.2.1.5 GLOBAL LOOP PRESSURE
As mentioned earlier, the pressure calculations correctly converge to values that reproducelocal pressure variations, but these do not correspond to the ideal gas law value at anygiven node [13].
For the purposes of this discussion the pressure calculated by the above equations isreferred to as the local pressure, while the true pressure corresponding to the ideal gas lawcan be called the global pressure.
The global pressure in the loop must be calculated by adding an offset to the local pressure.The offset is calculated for a reference node, for which the reactor vessel was chosen. Theoffset equals the difference at the reference node between the ideal gas law pressure and thelocal pressure [13]. Each node must add this offset to their local pressure if a true globalpressure value is required. The local pressure should not be changed since this would havea serious impact on the pressure/flow calculations. A true global pressure value is typicallyrequired for display purposes or for control loops.
3.2.2 Turbines
These components have a full thermodynamic model incorporating calculations of power,torque, work done and outlet temperatures. The flow characteristics are given by aperformance map linking the pressure drop across the device with volume flow through it[7][8] as supplied by the experts. Inlet guide vanes are also included to make control on thesystem possible. It does not include , at this stage, a rotational speed feedback component in
283

its performance map influencing volume-flow. This effectively means that the volume flow(Q) through the turbine is given by Q = f (Pressure ratio, guide vane setting ) i.e.
Q = / — Equation 8\p2JW = Q x p Equation 9
The temperature drop across the turbine and the outlet temperature are given by ,
dT = Tlx 1- M? Equation 10
T2 = Tl + dT Equation 11
The enthalpy drop is found from Equation 8dh = Cpx dT Equation 12
From Equation 9 & 12 the mechanical power and torque are calculated.P = dhx Wx 77 Equation 13
~ 60xPT = - ————— Equation 14
2x TTX N
3.2.3 Compressors
Compressors are modelled [8] [11] [12] hi approximately the same manner as the turbinesexcept that the performance maps incorporate both rotational speed and inlet guide-vanesi.e.
Q = f(N$ , Gv) Equation 15
Mass flow is the a function of volume flow and inlet density
W = p*Q Equationl6
And the work done is given by
( tl N
•Z- * ~ 1 Equation 17
From these both the outlet temperature and mechanical power and torque are derived,
YkT2 = ——— Equation 18
T,P = ———— Equation 19
60-PT = ————— Equation 20
2x ;rx N
284

3.2.4 Alternator
The alternator is represented by a full scale model of a device similar to the one used inKoeberg power station. Included in the calculations are electrical / mechanical power andtorque, stator voltage and current, active and reactive power, power factor etc.Synchronisation to both an infinite and finite grid are possible so that scenarios such as con-and disconnection from grid (infinite grid), operation on a separate grid (frequency nolonger fixed) as well as incidents such as loss of grid or alternator trip can be analysed.The model is too involved to reproduce here . Detail on this topic can be found in internalreference documents or in any text referencing the Parks transform [6] [9].
3.2.5 Recouperator
The recouperator model is capable of providing outlet temperatures under both co- andcounter current flows. This allows some process upsets during shutdowns to be evaluatedduring which the flow in one of the paths may reverse . It is set up by means of a heat transfercoefficient and a transfer surface area for a 20°C long mean temperature difference (LMTD).
3.2.6 Active cooling equipment
This section comprises both the pre- and intercoolers which provide a stable inlet temperaturefor the compressors. The models used to calculate the cooler's helium outlet temperature areidentical to those used in designing the components. They include flow dynamics such asdynamic viscosity and variations in density and transfer coefficients along the length of theexchange unit.Since process upsets causing flow reversal in the relevant PCU regions are unlikely (thecompressor performance maps do not cater for reverse flow), the coolers are also only validunder helium forward flow conditions.
3.2.7 Helium Inventory System
The inventory system is modelled in detail. A system of four(4) pressure vessels together witha set of valves for controlling inventory flow makes up the system. In addition to the normalhydraulic case passive heat loss from the pressure vessels is included. Adiabatic effects bothin the vessels and the flow to/from the PCU are not taken into account. This can be toleratedsince only a relatively small adiabatic temperature shift results with a ratio of inventory- toprocess flow in the region of 1/50. For a maximum of 2 kg s"1 inventory flow and a 100 kg s"1
process flow, the impact of not calculating adiabatic effects is negligible. For furtherinformation on the helium inventory system consult [1].
3.3 Passive Heat Removal system
He passive heat removal system is modelled according to the civil structure as a set oflayers through which the thermal energy is lost/removed. Layers are the graphite barrel (split in three(3) parts), the pressure vessel, RCCS, pit cooling and concrete structures.Helium leak flow between the barrel and reactor vessel is also included. For detail on thecalculation performed in the model, please reference [2].
285

3.4 Control Philosophies and systems
The control philosophy for this type of nuclear plant can be quite different from thoseemployed in PWR type reactors due to some of the inherent characteristics of the core andPCU. For this reason the philosophies and systems shown here are in a very early stage ofdevelopment and analysis and should be viewed in that light. Most likely they will changeas better insight is gamed into the function of the system .
The control philosophy at this point is that all circuits are given a setpoint which is derivedfrom the required electrical power on the alternator [4][11].The inlet guide vanes on the power turbine are set to provide the correct mechanical powerand torque for the alternator. This guide vane setting then has a direct influence on theinventory control system and an indirect effect on the core control rod position controller.The rod control system keeps the temperature of the helium flowing out of the core as close aspossible to a specified setpoint. For a graphical representation see the figure below:
Alternative tor Invertory centra
(Pcore-Pe:
POWER CONTROL PHILOSOPHY
FIG. 2
The individual control loops employ standard PID rate control algorithms, of which mostlythe P and I actions are used. The power control structure can also be seen in FIG. 2. Thefunction of these controllers is illustrated in Chapter 4(Results).
286
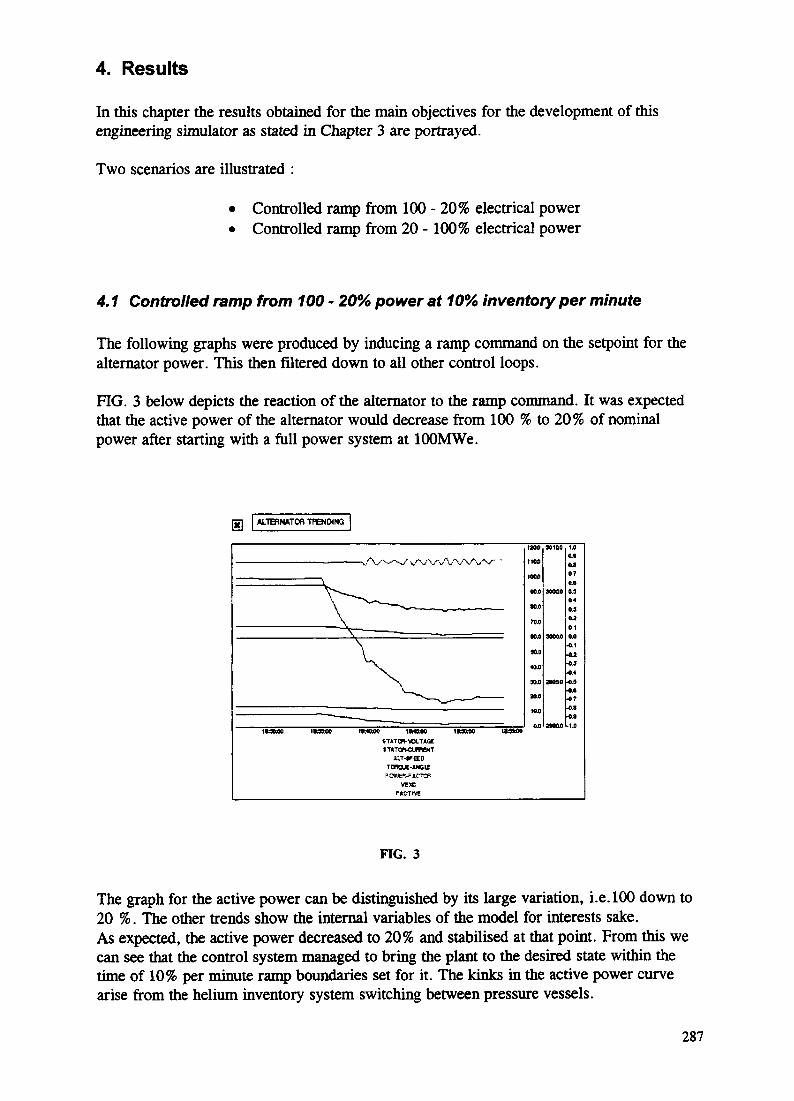
4. Results
In this chapter the results obtained for the main objectives for the development of thisengineering simulator as stated hi Chapter 3 are portrayed.
Two scenarios are illustrated :
• Controlled ramp from 100 - 20% electrical power• Controlled ramp from 20-100% electrical power
4.1 Controlled ramp from 100 - 20% power at 10% inventory per minute
The following graphs were produced by inducing a ramp command on the setpoint for thealternator power. This then filtered down to all other control loops.
FIG. 3 below depicts the reaction of the alternator to the ramp command. It was expectedthat the active power of the alternator would decrease from 100 % to 20% of nominalpower after starting with a full power system at lOOMWe.
m ALTERNATOR TFB4DING
STXTOn-VOLTiBEJTHTOKWTOIT
JU.T-SPEEDTCROLC-tMQUEFOWBJJIC-TCF
VEXCr«crivt
FIG. 3
The graph for the active power can be distinguished by its large variation, i.e. 100 down to20 %. The other trends show the internal variables of the model for interests sake.As expected, the active power decreased to 20% and stabilised at that point. From this wecan see that the control system managed to bring the plant to the desired state within thetime of 10% per minute ramp boundaries set for it. The kinks hi the active power curvearise from the helium inventory system switching between pressure vessels.
287
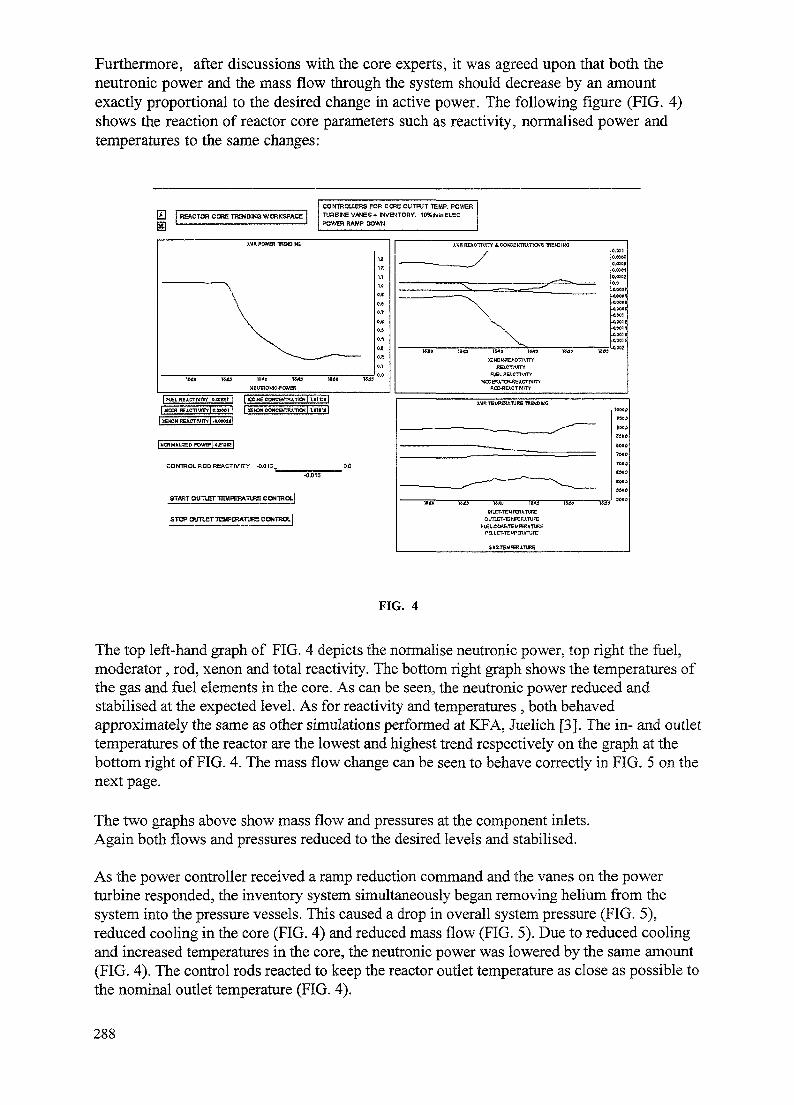
Furthermore, after discussions with the core experts, it was agreed upon that both theneutronic power and the mass flow through the system should decrease by an amountexactly proportional to the desired change in active power. The following figure (FIG. 4)shows the reaction of reactor core parameters such as reactivity, normalised power andtemperatures to the same changes:
REACTOR CORE TRADING WORKSPACECONTROLLERS FOR CORE OUTPUT TEMP. POWERTURBINE VANES + INVENTORY. 10%jhiinELECPOWER RAMP DOWN
AVR REHCTtVlTir JLCOfCEtmWTlCNB WEND1HG
M« ISO 1MO WflJ TWO
KElCTtVfTYFU
MCDff
I _MCOH I JCTUHTV] ft MO0 1^ | XENOM MCtSTTfUTlON j lull 18 [AVfi TEWBUTURE 1RDIONC
CONTROL ROD REACTIVITY -0.013,,
ST*RT OUTLET TEH PBWTtJRE CONTROU
STOP OmETTEHPERATURE CONTROLINUET.TEUFe5Jl.TWE
OUTI.eT.TE hfEKJmjFEFLeL-ecRSTEMra1:* TIKE
PRIET-TE MPBUTUFE
FIG. 4
The top left-hand graph of FIG. 4 depicts the normalise neutronic power, top right the fuel,moderator , rod, xenon and total reactivity. The bottom right graph shows the temperatures ofthe gas and fuel elements in the core. As can be seen, the neutronic power reduced andstabilised at the expected level. As for reactivity and temperatures , both behavedapproximately the same as other simulations performed at KFA, Juelich [3]. The in- and outlettemperatures of the reactor are the lowest and highest trend respectively on the graph at thebottom right of FIG. 4. The mass flow change can be seen to behave correctly in FIG. 5 on thenext page.
The two graphs above show mass flow and pressures at the component inlets.Again both flows and pressures reduced to the desired levels and stabilised.
As the power controller received a ramp reduction command and the vanes on the powerturbine responded, the inventory system simultaneously began removing helium from thesystem into the pressure vessels. This caused a drop in overall system pressure (FIG. 5),reduced cooling in the core (FIG. 4) and reduced mass flow (FIG. 5). Due to reduced coolingand increased temperatures in the core, the neutronic power was lowered by the same amount(FIG. 4). The control rods reacted to keep the reactor outlet temperature as close as possible tothe nominal outlet temperature (FIG. 4).
288

————————————————————————————| »FLOW COMPARISON TRENDING. | povVER RAMP DOWN
px] | pressure coMPAnisoN
FIG. 5
4-2 Controlled ramp from 20 -100% power at 10% inventory per minute
The power ramp command to increase power from 20 to 100% was given from the 20% leveldescribed in Chapter 4.1 . The expected result of such a command would be that the plantwould return to its original state at 100% power (lOOMWe).
The graphs and trends below show that both the alternator, reactor and other systems return to100%.
ALTERNATOR TRENDING
IB-W-00 IfcCCHM XJ IfrlMW3TflTOVWO_TAQT
1*13:00 1MO-OC
FIG. 6
289
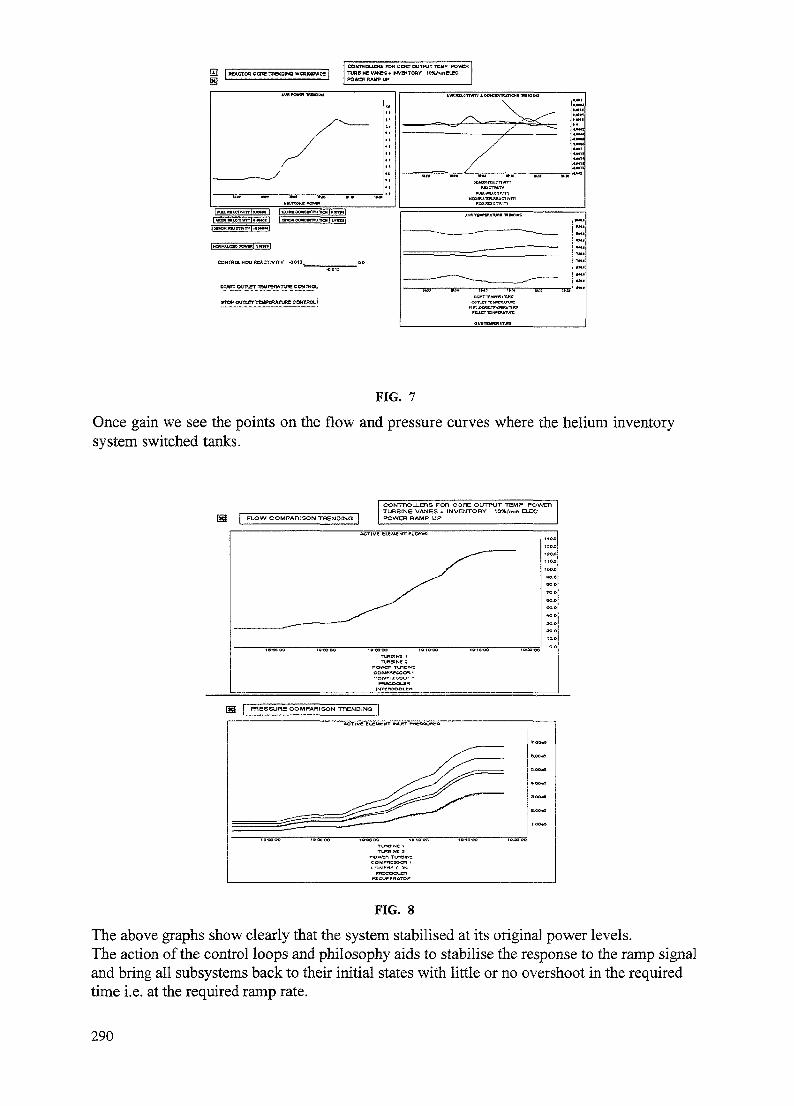
ftCACTOR CCRC TBWDJNO VCONTTfOUJ-RC TOR CCRC OUTPUT TCUP POWER•njBBIHCVJWe* NVWTOftV lOX/nnBLECPOWER RAUP UP
CONTftDLHOD REACTIVITY -OC13,
6T.WJTJXJTU-T T»JIFeftA7l«e CONTROL
STOP OUTUrrttMPCRATURC COHTCOt \
IT. "IWaUTUW WWO KG
FIG. 1
Once gain we see the points on the flow and pressure curves where the helium inventorysystem switched tanks.
FLOW COMPARISON TRENDING I
CONTROLLINGS FOR CORE OUTPUT TEMP POWERTURBINE VANES + INVENTORY 10%/min ELECPOWER RAMP UP
rnecootim
PRESSURE COMPARISON TRENDING
e ELEMENT HH.KT
mecooten
FIG. 8
The above graphs show clearly that the system stabilised at its original power levels.The action of the control loops and philosophy aids to stabilise the response to the ramp signaland bring all subsystems back to their initial states with little or no overshoot in the requiredtime i.e. at the required ramp rate.
290

5. Conclusion and Validity of Results
The discussion on both the extent and scope of simulation should show that the engineeringsimulator is still hi an early phase of development. Some of the models may not contain oneor the other function, but all omissions are well founded either by consultation with theexperts or by a separate study showing the effects to be small to negligible.
The reason for the development of such an engineering simulator was not to retest andevaluate the individual designs, which at least for the core and active cooling elements arebeing simulated and evaluated in much more detail by the relevant experts. For the purposeof analysing the system as a whole and the interactions between the components, theassumptions and simplifications made still give sufficiently accurate results. Except inaccident- and extreme process conditions, the simulator performs the specified transientsand has provided valuable insight and information to system- , control- and mechanicalengineers alike.
The simulator has proven itself to be capable of performing operational power transientsand has shown the reactor/PCU system hi the current configuration to be stable andcontrollable at all power levels as can be seen from the results hi Chapter 4. This hasboosted confidence hi the design. Having revealed much already, the simulator should be ofgreat assistance hi evaluating design changes and control philosophies during the next phaseof the project.
References
[1] Helium Storage and Control System for the PBMR, E.C VerkerkIAEA TCM on HTGR Technology Development, 1996
[2] Simulation of the Pebble Bed Modular Reactor Natural Ah- ConvectionPassive heat removal system, M.L. Dams, IAEA TCM on HTGRTechnology Development, 1996
[3] Rechnerische Darstellung des HTR-Modul-Reaktors, E. Teuchert, H.J.Ruetten, K.A. Haas, Institut fuer Sicherheitsforschung undReaktortechnik, ISSN 0366-0885, May 1992
[4] Ontwerp van die Beheeralgoritmes vir die Stoomvoorsieningstelsel vann Drukwaterreaktor, F.J.E. Laubscher, MIng. Thesis , UPE, 1989
[5] R.H. Perry et al, Perry's Chemical Engineers' Handbook, McGrawHill, 1984
[6] Robust Redesign of Power System Damping Controllers, G.N.Taranto, J.H. Chow, H.A. Othman, IEEE Trans. Control Sys. Tech.,September 1995, Vol3, Nr 3, ISSN 1063-6536
[7] Conceptual Design of Helium Gas Turbine for MHGTR-GT, E.Matsuo, M.Tsutsumi, K.Ogata, S.Nomura, Mitsubishi HeavyIndustries
291
[8] A Model for the Dynamic Simulation of a two-shaft industrial gasturbine with dry low NOX Combustor, W. Blotenberg, IGTACongress and Exposition, May 1993
[9] Effects of Torsional Dynamics on Non-linear Generator Control,E.H.ALlen, J.W.Chapman, M.D.Ilic, IEEE Trans. Cont. Sys. Tech.Vol.4, No.2, March 1996
[10] Simulation Study of AVR-U Nuclear Process Heat Plant, M.Takano,L.Wolf, W.Scherer, Journal of Nuc. Sci. & Tech., 24 pp.526-535,July 1987
[11] Centrifugal and Axial Compressor Control, G.K.McMillan, IRPStudent Text, ISA 1983, ISBN 0-87664-744-1
[ 12] Turbolog Compressor Simulation, MAN-GHH, 1994
[13] The Properties of Gases & Liquids, 4th Edition, R.C.Reid, J.M.Prausnitz,B.E.Polling, McGraw-Hill, 1987
292
STUDIES ON SELF-ACTING HEAT REMOVAL SYSTEMS ONTHE BASIS OF PARTIAL BOILING OF WATER FOR STEELPRESSURE VESSEL COOLING OF MODULAR HTRs
H. BARNERT, J. SINGH """'"""'XA9846688Kemforschungszentrum Julich GmbH,Jiihch, Germany
Abstract
A review is given on the technology of reactor pressure vessel cooling in HTR conceptualdesigns, plants in construction and existing plants of the HTR Additionally an overview isgiven on the results of studies on heat removal systems for the cooling of the steel pressurevessel and the reactor cavity for modular HTR designs, as well as for the cooling of hot gasducts, e g in the project ,,AVR reconstruction"For the recent conceptual design and layout work on the Pebble Bed Modular Reactor with adirect Gas Turbine Cycle, PBMR-GT, a self-acting heat removal system on the basis of partialboiling liquids is proposed as a back-up system in the case of the loss of forced cooling of thepressure boundary of the primary circuit in normal operation Analyses for the heat removalvalues were carried out for different parameters Thermal radiation depends upon theemmisivity of the surfaces of the reactor pressure vessel and of the cooling pannels, and of thearrangement of these two surfaces to each other The influence of the change of the emmisivityon the basis of the surface conditions and temperatures has been evaluated Moreover theeffects of heat convection and conduction have been calculated and their influence in the totalheat removal has been analysed Results on the evaluation of natural convection of the heattransfer medium, the liquid, preferably water, are reported with variation of the differentconditions of evaporation and condensation Moreover the arrangement of the heat transferloops, in open and in closed form, e g the raiser pannels, down comer tubes, and condensationtubes, have been varied to get the maximum buoyancy for the flow of the heat transfermedium
The arrangement of the raiser pannels has been done in such a way that these can be readjustedfrom their normal position in the reactor cavitiy, so that sufficient place is available for thenormal inspection of the reactor pressure vessel Outlet ducts are also arranged in a flexiblestructure, so that these can be also removed from their normal place The concrete temperatureof the reactor cavity is kept under the value of about 65 °C, by insulating all the structures inthe cavity, which are not required for the heat removal In conclusion It is possible to realize aself-acting heat removal system of the base of partial boiling of water for a steel pressure vesselcooling with a heat flux density of about 5 kW/m2 and thereby with a total heat flux of about800 kW The proposed system is a back-up system starting its function only in case of the lossof the normal operation forced cooling, which is provided by the gas turbine, and in case ofreactor shut-down by an auxiliary circulator cooling loop
293
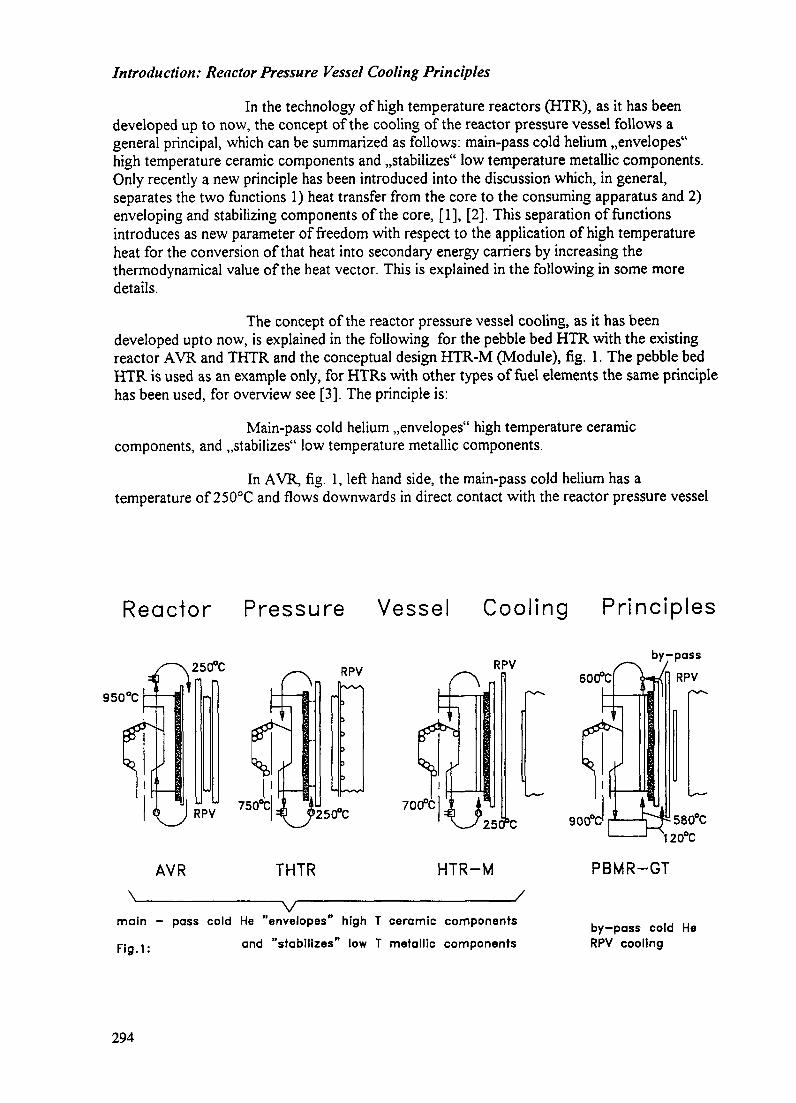
Introduction: Reactor Pressure Vessel Cooling Principles
In the technology of high temperature reactors (HTR), as it has beendeveloped up to now, the concept of the cooling of the reactor pressure vessel follows ageneral principal, which can be summarized as follows: main-pass cold helium ,,envelopes"high temperature ceramic components and ,,stabilizes" low temperature metallic components.Only recently a new principle has been introduced into the discussion which, in general,separates the two functions 1) heat transfer from the core to the consuming apparatus and 2)enveloping and stabilizing components of the core, [1], [2]. This separation of functionsintroduces as new parameter of freedom with respect to the application of high temperatureheat for the conversion of that heat into secondary energy carriers by increasing thethermodynamical value of the heat vector. This is explained in the following in some moredetails.
The concept of the reactor pressure vessel cooling, as it has beendeveloped upto now, is explained in the following for the pebble bed HTR with the existingreactor AYR and THTR and the conceptual design HTR-M (Module), fig. 1. The pebble bedHTR is used as an example only, for HTRs with other types of fuel elements the same principlehas been used, for overview see [3]. The principle is:
Main-pass cold helium ,,envelopes" high temperature ceramiccomponents, and ,,stabilizes" low temperature metallic components.
In AYR, fig. 1, left hand side, the main-pass cold helium has atemperature of 250°C and flows downwards in direct contact with the reactor pressure vessel
Reactor Pressure Vessel Cooling Principles
950°C
RPV
RPV*WS
RPV
250°C700°C
250PC
60CfC
AYR THTR HTR-M\ ——————v————————————
main - pass cold He "envelopes" high T ceramic components
pj_ i. and "stabilizes" low T metallic components
r3 —HI———rV
580°C
PBMR-GT
by-pass cold HeRPV cooling
294

(RPV) arrangement. The components from inside to outside are: pebble bed, graphite sidereflector, carbon brick thermal insulation, core barrel, main-pass cold helium, inner steelpressure vessel, biological shielding, outer steel reactor pressure vessel.
At THTR the main-pass cold helium likewise has a temperature of 250°C.It flows upwards in direct contact with the cast iron thermal shield. The components frominside to outside are: pebble bed, graphite side reflector, carbon brick thermal insulation,metallic support structures in the main-pass cold helium, cast iron thermal shield, reactor cavitywith stagnant helium, liner insulation, liner, liner cooling, presstressed concrete reactorpressure vessel.
In the HTR-M the main pass cold helium likewise has a temperature of250 °C but here the main-pass cold helium, flowing upwards, has direct contact with the colderparts of the side reflector structure. The components from inside to outside are: pebble bed,graphite side reflector structure, carbon brick thermal insulation, core barrel, stagnant heliumspace, steel reactor pressure vessel, reactor cavity, cavity cooler, concrete cavity structure.
In all these three cases the main-pass cold helium ,,envelopes" hightemperature ceramic components, and ,,stabilizes" low temperature metallic components. Thelatter one are in particular metallic components supporting the core structure, as explainedabove, but are as well e.g. the metallic components for control and shutdown of the reactor.The recently proposed principle for reactor pressure vessel cooling introduces in general anindependent cooling for the cooling purposes, e.g. a stream of
,,by-pass cold helium for RPV cooling",
as well as other low temperature metallic components, [1]. This is explained in some moredetail in fig. 1, right hand side as follows:
For the recent conceptual design and layout work on the Pebble BedModular Reactor with a direct cycle Gas Turbine, PBMR-GT, it is proposed to use the heatvector with temperatures of roughly 600 °C to 900 °C in the gas turbine and to use a stream of,,by-pass cold helium" with a temperature about 120 °C for the cooling needs. The componentsfrom the inside to the outside are: pebble bed, graphite side reflector (with ,,cold" helium of600 °C form the gas turbine), carbon brick thermal insulation, core barrel, by-pass cold heliumwith a temperature of 120 °C, reactor pressure vessel, cavity cooling system, concretestructure of cavity.
The advantage of this proposal is the possibility to increase the efficiencyof the conversion process ,,HTR heat into electricity" considerably, [1]. In the second example,[2], for this proposal the advantage is the better applicability of the high temperature heatvector for process heat applications, e.g. refinement of coal. The disadvantages of the newproposal are 1) not proven and 2) design issue in its own.
Modularization of the core and self-acting heat removal
All modern concepts of HTRs follow the general priniple of themodularization of the core as a general priniple to produce safety by design. The principle is aresult of the fundamental problem to improve reactor technology after the accident of Three-Mile-Island by avoiding the possibility of a core-melt. The solution is the HTR-module, [4],with its design principle to allow the afterheat to be transferred out of the core into outsidestructures, including cooling systems. This general principle can be improved, e.g. by theproposal of a self-acting heat removal system in the reactor cavity, as proposed in manyconceptual designs.
295

For the PBMR-GT, [1], the normal operation by-pass cooling is providedby the gas turbine and therefore additionally a forced decay heat auxiliary removal system hasbeen proposed, so that the temperature of the reactor pressure vessel as well as of the core-barrel can be kept say under 200 °C. This cold helium gasflow flows upwards between theRPV and core-barrel and afterwards it flows downwards through the holes for the reflectorrods and also cool these, before it flows to the hot gas chambre at the bottom. Subsequentlythis helium flows further to the other components of this auxiliary decay heat removal system,such as cooler and circulator. With this system also the core temperature is kept near normaloperational temperatures, because the heat dissipates to the side reflector or to the graphitenoses, where the forced cooling is effective. By this way no forced cooling through the core isnecessary, whereby a minimum helium flow against the thermal buoyancy in the core isrequired.
In the case of the loss of forced cooling of the pressure boundary of theprimary circuit, a selfacting heat removal system is proposed as a back up system, which startsits function only after such failures. This system can be based on the natural convection of onlyhot water or of partial boiled water. Analyses for the heat removal values were carried out fordifferent parameters and are described in the following.
Heat Transfer befrveen Reactor Pressure Vessel (RPV) and Cooling Pannels (CPA)
Heat can be removed from the reactor pressure vessel by highertemperatures mainly through the thermal radiations. If it is possible to put the heat transfercooling pannels very near to the RPV, also thermal conductivity can play an important role.Moreover natural convection of the air in the reactor cavitiy also transport heat from the RPVto the CPA.
Thermal radiations depend upon the emissivity of the surfaces of the RPVand of the CPA, and of the arrangement of these two surfaces to each other. Generally theemissivity s changes with the condition of the surfaces, such as the grade of oxidation and withthe temperature of the surfaces. Moreover the arrangement of the both heat transfer surfacescan play a dominant role if these are not parallel or the distance between both surfaces is largeor these have different heigts.
Analyses have been done for the variations of emissivity 812 between 0.7to 0.9, geometryfactor <pi2 between 0.98 to 1.0, the temperature of the RPV TI betweem 250°C to 450 °C and the temperature of the CPA T2 between 0 °C to 200 °C. The results of thisstudy are shown in fig. 2. Thereby it can be shown that only with thermal radiations underthese conditions heat flux density of about 11 kW/m2 can be achieved, although it requires highemissivity of about 0.9 of the surfaces.
The emissivity 612 of the rough steel surfaces is given near about 0.79, ifthe radiations fall perpendicular to each other [5]. However, under normal conditions this valuereduces to near about 0.762. Therefore this value is also selected for further analyses.
Cooling water pipes are welded separately with fin plates and therebythese build a concentric wall to the RPV, with relative small distance to each other. This allowsto take the geometric factor value near about 0.99. The arrangement of the heat transfer raiserpannels has been done in such a way that these can be readjusted from their normal position inthe reactor cavitiy, so that sufficient place is available for the normal inspection of the reactorpressure vessel.
296
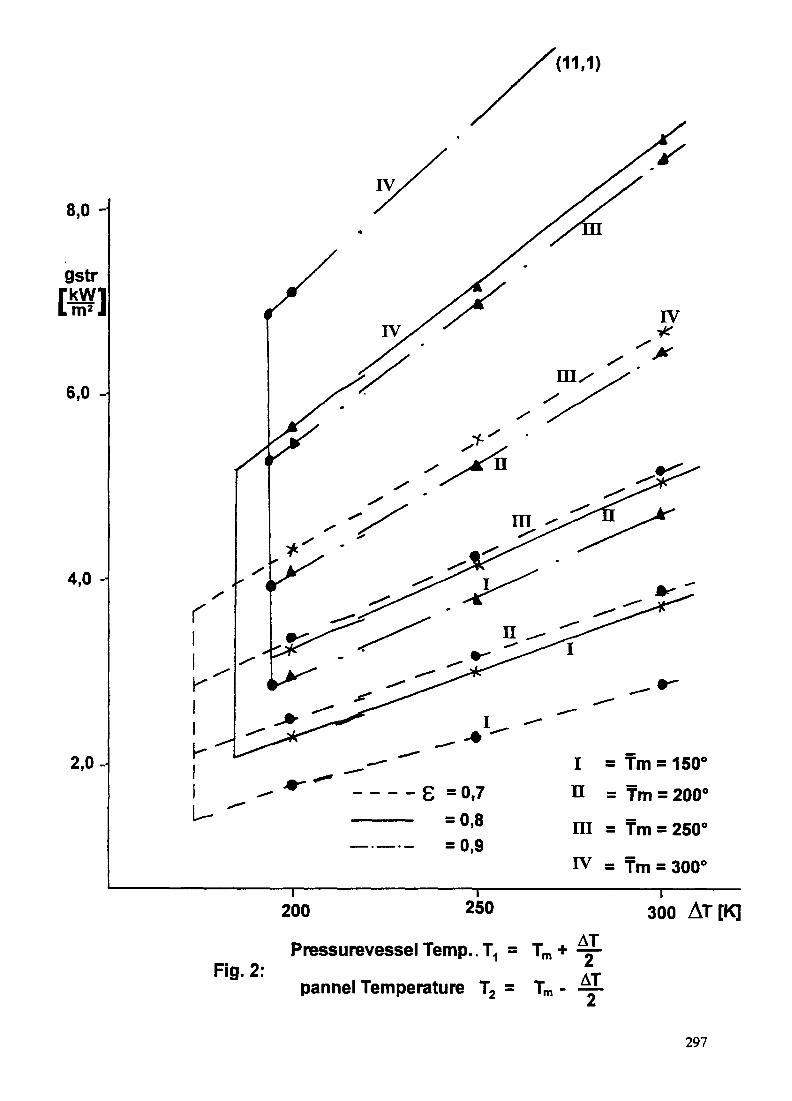
(11,1)
8,0 H
gstrrjkwiLm2 J
6,0 -
4,0-
2,0-
IV
200 250 300 AT[K]
Fig. 2:Pressurevessel Temp.. T, =
pannel Temperature T2 =
T + —'m T 2
T ATjn " A
297
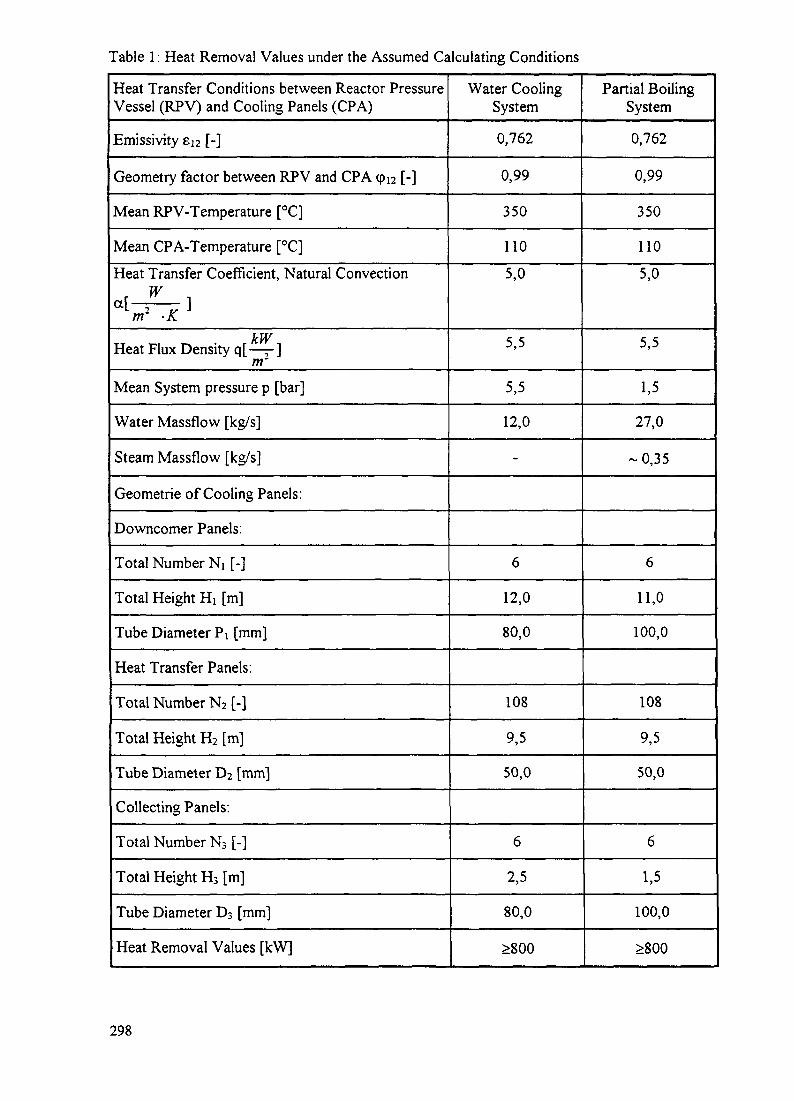
Table 1: Heat Removal Values under the Assumed Calculating Conditions
Heat Transfer Conditions between Reactor PressureVessel (RPV) and Cooling Panels (CPA)
Emissivity 812 [-]
Geometry factor between RPV and CPA (pi2 [-]
Mean RPV-Temperature [°C]
Mean CPA-Temperature [°C]Heat Transfer Coefficient, Natural Convection
Wr i<*[— : —— 1L 2 r/" J
m -KkWHeat Flux Density q[— — ]m-
Mean System pressure p [bar]
Water Massflow [kg/s]
Steam Massflow [kg/s]
Geometric of Cooling Panels:
Downcomer Panels:
Total Number NI [-]
Total Height HI [m]
Tube Diameter PI [mm]
Heat Transfer Panels:
Total Number Nj [-]
Total Height H2 [m]
Tube Diameter D2 [mm]
Collecting Panels:
Total Number N3 [-]
Total Height H3 [m]
Tube Diameter D3 [mm]
Heat Removal Values [kW]
Water CoolingSystem
0,762
0,99
350
1105,0
5,5
5,5
12,0
-
6
12,0
80,0
108
9,5
50,0
6
2,5
80,0
>800
Partial BoilingSystem
0,762
0,99
350
110
5,0
5,5
1,5
27,0
-0,35
6
11,0100,0
108
9,5
50,0
6
1,5
100,0
>800
298
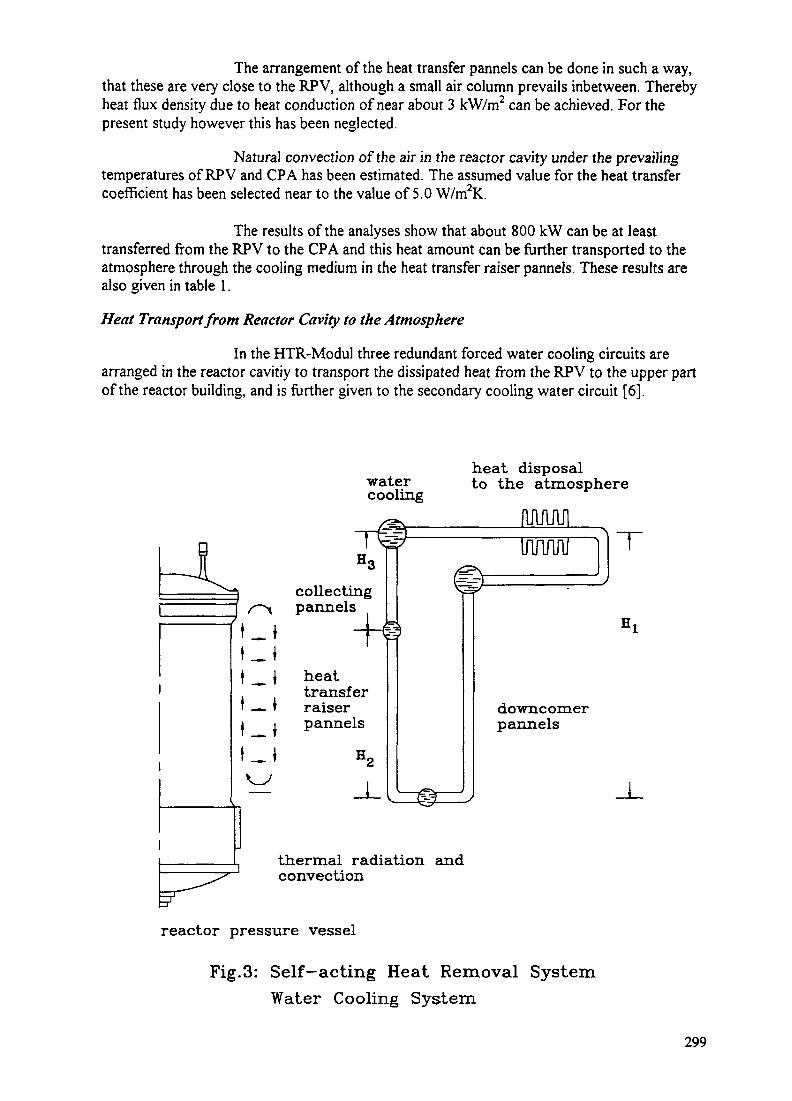
The arrangement of the heat transfer pannels can be done in such a way,that these are very close to the RPV, although a small air column prevails inbetween. Therebyheat flux density due to heat conduction of near about 3 kW/m2 can be achieved. For thepresent study however this has been neglected.
Natural convection of the air in the reactor cavity under the prevailingtemperatures of RPV and CPA has been estimated. The assumed value for the heat transfercoefficient has been selected near to the value of 5.0 W/m2K.
The results of the analyses show that about 800 kW can be at leasttransferred from the RPV to the CPA and this heat amount can be further transported to theatmosphere through the cooling medium in the heat transfer raiser pannels. These results arealso given in table 1.
Heat Transport from Reactor Cavity to the Atmosphere
In the HTR-Modul three redundant forced water cooling circuits arearranged in the reactor cavitiy to transport the dissipated heat from the RPV to the upper partof the reactor building, and is further given to the secondary cooling water circuit [6].
watercooling
heat disposalto the atmosphere
fuuum
collectingpannels
heattransferraiserpannels
©
innnni
downcomerpannels
thermal radiation andconvection
reactor pressure vessel
Fig.3: Self-acting Heat Removal SystemWater Cooling System
299

Similar vessel cooling system is also constructed at the site of HTTR-plant [7]. As it represents an engineered safety device, a dual system is used with twocirculation pumps.
The present proposal is based on natural circulating of water andtherefore it is a self acting system. However, two different systems are investigated, whereas infig. 3 only water cooling system is shown, on the other hand in fig. 4 the system is based on thepotential boiling of water and subsequently its condensation and thereby heat is transported tothe atmosphere.
From the water drum outside the reactor building downcomer pannelstransport cold water to the bottom water collector inside the reactor cavity. Heat transferraiser pannels are welded to this bottom water collector and are arranged around the reactorpressure vessel at equal distance to the RPV as well as between each other.
Heat is transported to these raiser pannels, as already described, wherebythe water is only further heated or it gets also partially boiled. Hot water or the mixture of hot
heat disposalto the atmosphere
steam—condensation
collectingpannels Hg
heattransferraiserpannels
EL
53
downcomerpannels
thermal radiation andconvection
reactor pressure vessel
Fig.4: Self-acting Heat Removal SystemPartial Boiling of Water
300

water with steam flows upwards in these raiser pannels and subsequently it is collected in theupper water collector. From here this hot water is further transported through the collectingpannels to the upper water drum. This drum can also contain some steam, if the second systemis followed.
From this drum several water tubes with ribbs are arranged around thereactor building to dissipate the heat to the atmosphere. Also cooling tower can be arranged inthis system. Safety analyses are still required, before one or the other system is selected,because e.g. the tubes need more place for their arrangement, but on the other hand thechances of their damage due to external events is lower. Cold water flows back to the drum,before it further flows to the reactor cavitiy.
By the water cooling system, as shown in fig. 3, system pressure at thetop has been chosen to the value of 5 bars, so that no water boiling in the whole circuit cantake place. Further the height difference between the upper water drum and the bottom watercollector is selected to the value of 12 m to get sufficient buoyancy for the natural circulationof water in this closed loop.
Pannels diameters in the whole circuit and their arrangement is chosen insuch a way, so that low pressure drop through water flow on one side, but at the same timeenough heat transfer coefficient in the raiser tubes is possible. At present for this system coldwater temperature of 100 °C and temperature increase in the raiser pannels to the value fo 20°K is selected, so that sufficient heat from the RPV can be removed and at the same time thisheat can be dissipated without any cooling tower, only with the arrangement of 114 coolingtubes with ribbs, to the atmosphere with natural air convection. The length of each tube is nearabout 12m. Through thermal buoaancy in this circuit about 12 kg/s water flow through it.Results are shown in table 1.
Partial boiling of water in the circuit increases the flexibility of the layoutof the second system, as shown in fig. 4, because with the change of phase of water in steamheat transfer coefficient and also at the same time thermal buoyancy in raiser pannels increases.Moreover condensation of this steam in the atmosphere requires also smaller heat transfersurface area in comparison to the cooler tubes in the first system.
For this system, as shown in fig. 4, a system pressure of 1 bar and thewater temperature of 100 °C in the upper water drum is chosen. This drum is arranged at theheight of about 11 m in comparison to the ground level, where the bottom water collector isplaced. Due to this arrangement, the system pressure at this level is near about 2 bars. In theraiser panels, where the water flows upwards, the water temperature from 100 °C has to beraised to the value of saturation temperatur of water in accordance to the prevailing pressure atthe level. Calculations have shown that at the height of about 8 m in the raiser panels, theunder cooling of the water is completed and at this stage the upward flow of water starts to getpartialy boiled. However only very small amount of steam is produced, because the heattransfer area of the raiser panels is reletively small. Moreover in this region, the boundaryconditions are changing very fast, because of low heat flux density on one hand and the changeof static pressure with the change of height on the other hand. Further the water bubbles havehigher velocity than the average water velocity in the raiser panels. These effects are shown infig. 5 [8], but the minimum system pressure in this diagram is 20 bar. The pressure drop inthese panels depends on the area of the water bubbles, and their relative velocity. Correlationsfor the system pressure near about 1 bar and for small amount of steam flow is not exactlygiven in this literature and also others. Moreover also thermal buoyancy conditions arechanging with the height of the closed circuit. Estimations however have given that about 0.35kg/s steam is produced at the inlet of the upper drum, which is situated outside of the reactor
301

s Lit: LEDINEGG -1966 : Dampferzeugung , Naturumlaufkessel ,8.259
100 •"Bier """Abtvartssfromung
Dampfb/asen aofiriirfsFig. 5:Abb. 191 a. Ermittlung der Wichte eines Dampfwassergemisches bei Aufwartsstromung von Dampf und Wasser(Steigstromung, Ausgangsmalistab rechts vom Nullpunkt) und bei Aufwartsstromung des Dampfes und Ab-wartsstromung des Wassers (Ausgangsmafcstab 0 -1 links vom Nullpunkt). Der Linienzug abed und dervon wr = 0,46m/s uber/? = 40 kp/cm2 nach rffiihrende mussen bei richtiger Annahme von MV zum gleichen
Punktfuhren. Gl. (418), (419)

building. This steam can be condensed in the condensor tubes, which are arranged near to thisdrum, whereby heat is dissipated to the atmosphere. The results are shown in tab. 1. Theamount of heat removed from the RPV depends on its surface temperature. For the presentestimations it is higher than about 800 kW.
Both of these sysems can be combined, so that at lower temperature ofthe reactor pressure vessel, only natural water circulation takes place and at highertemperatures partial water boiling is possible. However for this system the cooling tower atoutside of the reactor building may become necessary to dissipate enough heat to theatmosphere. These studies are further going on.
Conclusion
The principle of reactor pressure vessel cooling allows an improvement bythe recently proposed by-pass cooling with cold helium from the gas turbine.
It can be shown that the self acting heat removal system for steel pressurevessel cooling of modular HTRs is possible. Partial boiling of water can be established with aparticular system arrangement of the closed circuit.
The concrete temperature of the reactor cavitiy is kept under the value ofabout 65 °C, by insulating all the structures in the cavitiy, which are not required for the heatremoval.
The proposed system is a back-up system starting its function only in case of the loss of thenormal operation foreced cooling, which is provided by gas turbine and in case of reactor shut-down by an auxiliary circulator cooling loop. This system has the capacity to remove heatabove the value of about 800 kW.
REFERENCES
[1] Fox, M., Mulder, E.: Pebble bed modular reactor - South Africa, International AtomicEnergy Agency, IAEA: Design and development of gas-cooled reactors with closed cyclegas turbines, Proceedings of the Technical Committee Meeting held in Beijing, China, 30.Oct. 2. Nov. 1995, IAEA-TECDOC-899, pages 251-270, August 1996.
[2] Drecker, S., Singh, J., Barnert, H.: Temperature equalization phenomenon in hightemperature reactor core with central column, Nuclear Eng. & Design 147 (993, 39-46).
[3] Kugeler, K., Neis, H., Ballensiefen, G.: Fortschritte in der Energietechnik fur einewirtschaftliche, umweltschonende und schadensbegrenzende Energieerzeugung, Prof. Dr.Rudolf Schulten zum 70. Geburtstag, Forschungszentrum Julich GmbH, Monografie, Band8, 1993.
[4] Reutler, H., Lohnert, G., Will, M., Steinwarz, W., Leuchs, U.: Der HTR-Modul, eine neueMoglichkeit der Kernenergieentwicklung auf europaischer Basis, S. 375-382 in [3].Translation into English: The HTR-module, a new possibility of development of nucleartechnology on European basis, pp. 375-382, in [3].
[5] VDI-Warmeatlas Auflage, 1991
[6] Siemens, Interatom: High-Temperature Reactor Module Power Plant, Safety AnalysisReport, April 1987.
303

[7] Kunitomi, K. et al:Design and Fabrication of Reactor Vessel Cooling System (VCS) in HTR.Proceedings of the 3rd JAERI Symposium on HTGR TechnologiesFebruary 1996, Oarai, Japan
[8] LedineggDampferzeugung 1966
304
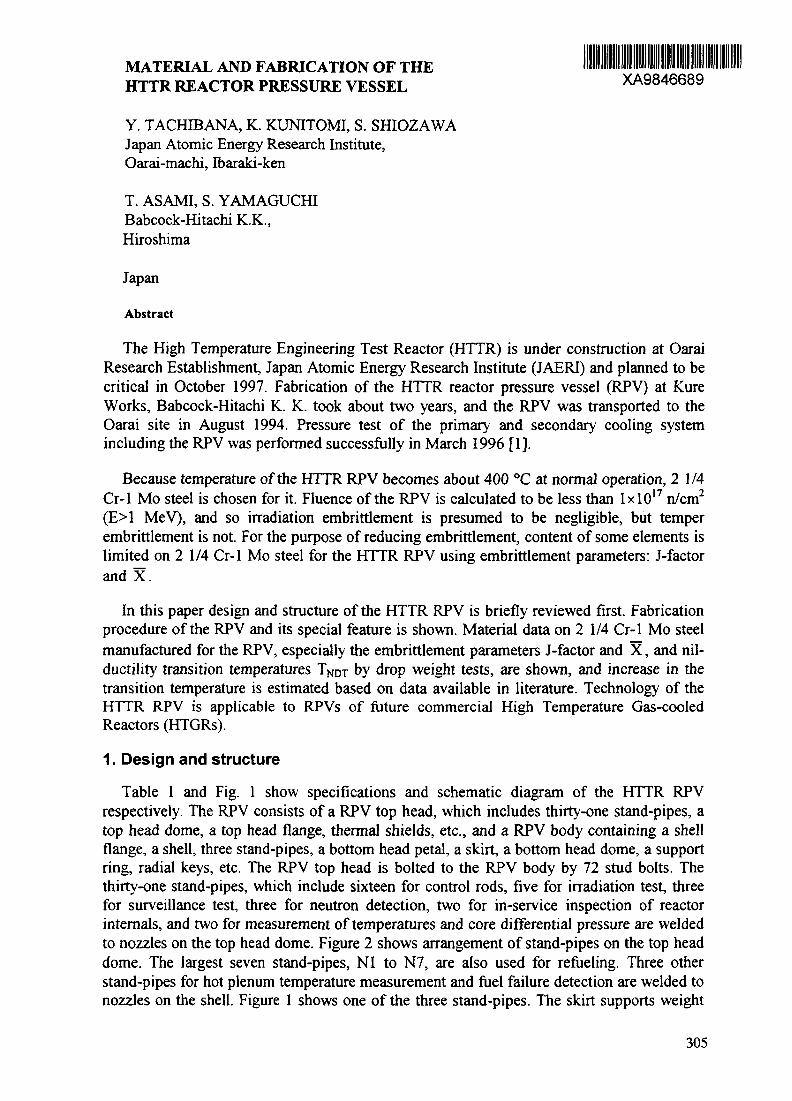
MATERIAL AND FABRICATION OF THEHTTR REACTOR PRESSURE VESSEL XA9846689
Y. TACHIBANA, K. KUNITOMI, S. SHIOZAWAJapan Atomic Energy Research Institute,Oarai-machi, Ibaraki-ken
T. ASAMI, S. YAMAGUCHIBabcock-Hitachi K.K.,Hiroshima
Japan
Abstract
The High Temperature Engineering Test Reactor (HTTR) is under construction at OaraiResearch Establishment, Japan Atomic Energy Research Institute (JAERI) and planned to becritical in October 1997. Fabrication of the HTTR reactor pressure vessel (RPV) at KureWorks, Babcock-Hitachi K. K. took about two years, and the RPV was transported to theOarai site in August 1994. Pressure test of the primary and secondary cooling systemincluding the RPV was performed successfully in March 1996 [1].
Because temperature of the HTTR RPV becomes about 400 °C at normal operation, 2 1/4Cr-1 Mo steel is chosen for it. Fluence of the RPV is calculated to be less than IxlO17 n/cm2
(E>1 MeV), and so irradiation embrittlement is presumed to be negligible, but temperembrittlement is not. For the purpose of reducing embrittlement, content of some elements islimited on 2 1/4 Cr-1 Mo steel for the HTTR RPV using embrittlement parameters: J-factorand X.
In this paper design and structure of the HTTR RPV is briefly reviewed first. Fabricationprocedure of the RPV and its special feature is shown. Material data on 2 1/4 Cr-1 Mo steelmanufactured for the RPV, especially the embrittlement parameters J-factor and X, and nil-ductility transition temperatures TNDT by drop weight tests, are shown, and increase in thetransition temperature is estimated based on data available in literature. Technology of theHTTR RPV is applicable to RPVs of future commercial High Temperature Gas-cooledReactors (HTGRs).
1. Design and structure
Table 1 and Fig. 1 show specifications and schematic diagram of the HTTR RPVrespectively. The RPV consists of a RPV top head, which includes thirty-one stand-pipes, atop head dome, a top head flange, thermal shields, etc., and a RPV body containing a shellflange, a shell, three stand-pipes, a bottom head petal, a skirt, a bottom head dome, a supportring, radial keys, etc. The RPV top head is bolted to the RPV body by 72 stud bolts. Thethirty-one stand-pipes, which include sixteen for control rods, five for irradiation test, threefor surveillance test, three for neutron detection, two for in-service inspection of reactorinternals, and two for measurement of temperatures and core differential pressure are weldedto nozzles on the top head dome. Figure 2 shows arrangement of stand-pipes on the top headdome. The largest seven stand-pipes, Nl to N7, are also used for refueling. Three otherstand-pipes for hot plenum temperature measurement and fuel failure detection are welded tonozzles on the shell. Figure 1 shows one of the three stand-pipes. The skirt supports weight
305

Table 1. Major specification of the HTTR reactor pressure vessel
Design pressure 4.7 MPa [gauge]Design Temperature 440 °CNormal operating pressure 3.9 MPa [gauge]Inlet coolant temperature 395 °CInside diameter 5.5 mHeight 13.2 mThickness of cylindrical shell and bottom head 122 mm [minimum]domeThickness of top head dome 160 mm [minimum]Number of stand-pipes 34Material 2 1/4 Cr-1 Mo steel
(Normalized and_____________________________tempered)_________
and seismic load of the reactor. Horizontal seismic load is sustained by six stabilizers and astand-pipe support beam as well as the skirt. The support ring support vertical load of thecore, and the radial keys hold horizontal movement of the core through core restraintmechanism. The thermal shields are made up of layers of metallic plates, which protect theRPV top head from overheating, especially in loss of forced coolant circulation accidents.
Because temperature of the HTTR RPV becomes about 400 °C at normal operation, 21/4Cr-1 Mo steel, normalized and tempered, which has higher creep rupture strength than Mn-Mo steel for RPVs of Light Water Reactors, is chosen for it. Three kinds of 2 1/4 Cr-1 Mosteel: forgings of Japan Industrial Standard (JIS) specification SFVAF22B, equivalent toASTM A-336 Gr. F22, Cl. 3, plates of JIS SCMV4-2, equivalent to ASTM A-387 Gr. 22, Cl.2, and seamless pipes of JIS STPA24, equivalent to ASTM A-335 Gr. P22 are used forcomponents as shown in Fig. 3, which also shows weld lines.
The safety evaluation criteria for temperatures of the HTTR RPV are as follows:maximum temperature shall not exceed 500 °C in anticipated operational occurrences and550 °C in accidents. The maximum temperature of the RPV in the depressurization accidentis calculated to be about 530 °C [2].
2. Fabrication
Figure 4 shows fabrication procedure of the HTTR RPV. As shown in Figs. 3 and 4, twotypes of stand-pipes exist, designated "Stand-pipe a" and "Stand-pipe b" in Fig. 4: a forging,and a forging and a pipe welded together respectively. The inner nineteen stand-pipes forcontrol rods and irradiation tests, which require dimensional accuracy in manufacturing, areforgings. Heads of the outer twelve stand-pipes on the top head dome and three stand-pipeson the shell are forgings, which are welded to seamless pipes, making up the "Stand-pipe b."
The top head dome is a very large forging, and nineteen nozzles for the inner nineteenstand-pipes above are integrated with itself, that is there are no weld lines between the domeand the nozzles. Since gaps among the nineteen nozzles are so narrow, it is impossible toperform in-service inspection: ultrasonic testing, of the weld lines when they exist. Ultrasonictesting of the weld lines between the stand-pipes and the nozzles is possible utilizing specialequipment for it. The other thirteen nozzles including a manhole nozzle, are welded to thetop head dome. Regarding these weld lines, it is possible to conduct ultrasonic testing,because there is enough distance between the nozzles, and the weld lines are accessible from
306

Stand-pipeStand-pipe support beam
Thermal shields
Stabilizer
Top head dome
Stud bolthead flange
Shell flangeStabilizer bracket
Bottom head petal
rShell
Stand-pipe
|-Support ring
Support rib
Bottom head dome
Fig. 1 Schematic diagram of the HTTR RPV
307
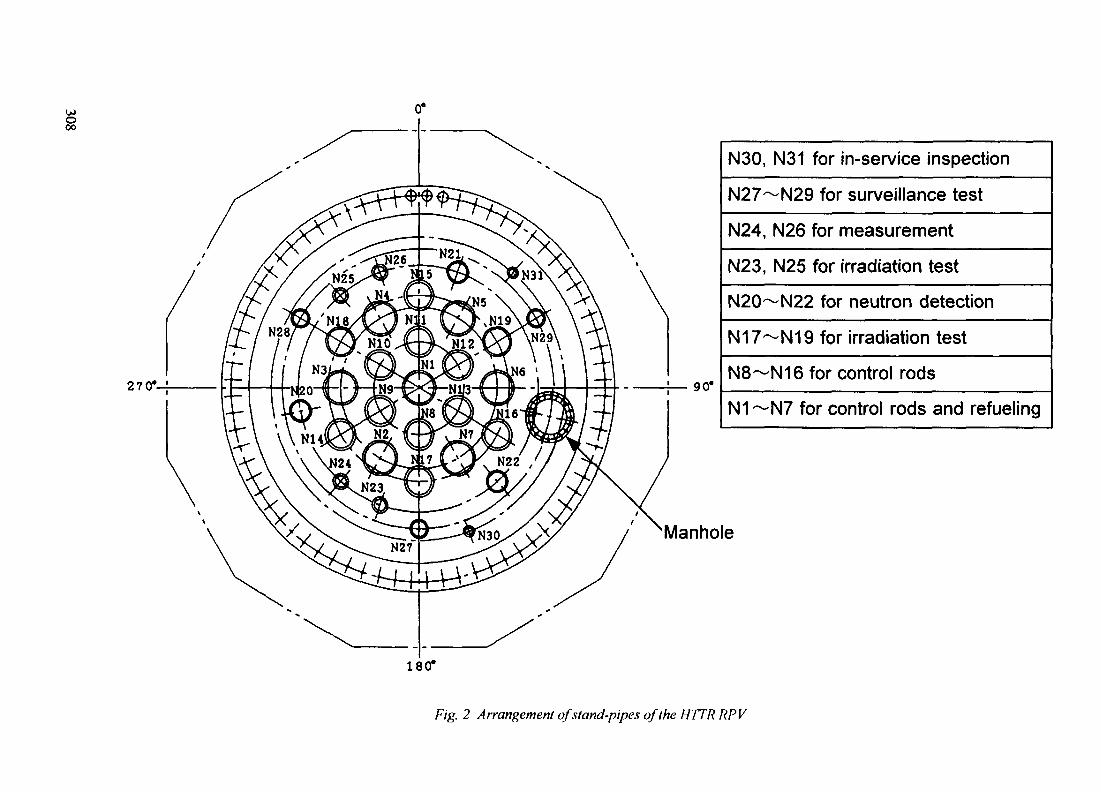
OJo00
270*
N30, N31 for in-service inspection
N27~N29 for surveillance test
N24, N26 for measurement
N23, N25 for irradiation test
N20~N22 for neutron detection
N17~N19 for irradiation test
N8—N16 for control rods
N1~N7 for control rods and refueling
Manhole
180*
Fig. 2 Arrangement of stand-pipes of the HTTR RPV

Plate.
Stand-pipe 2Forging
ForgingTop head dome
Top head flangey
Forging
Stand-pipe 1Seamless pipe
Plate
Bottom headpetal
PlateSeamless pipe
ForgingPlate
Plate
Forging
Forging Plate
Plate : JIS SCMV4-2, Forging : JIS SFVAF22B,Seamless Pipe : JIS STPA24
Fig. 3 Material and weld lines of the HTTR RPV
309

Stand-pipe aStand-pipe b
Top headdomeTop headflange
top head)D
| Welding
Welding SR
Shell flange
Finalmachining
Welding SR(local)
Shell (upper)
Shell (lower)Forming Welding
CRPV body)
Bottom headpetal____
Bottom headdome
Skirt
|Forming I Welding Welding
Hydrostatictest
Shipping^
Forming Welding
Fig. 4 Fabrication procedure of the HTTR RPV

outside. After welding the top head dome to the upper flange, a large forging, stress relieving(SR) and final machining was performed. Then stand-pipes were welded to the top headdome, followed by local stress relieving as shown in Fig. 4.
Cylindrical shell of the HTTR RPV is made up of four plates formed and welded togetheras shown in Figs. 3 and 4. The shell was welded to the shell flange, a large forging. Thebottom head petal, a large forging, was welded to the bottom head dome, which consists offormed four plates, and the skirt. These were then welded together, building up the RPVbody, and stress relieving and final machining was conducted.
For the welding of the large components, automatic narrow-gap (groove) MIG welding,developed by Babcock-Hitachi, K. K. and schematically shown in Fig. 5, was mainlyutilized. The narrow-gap MIG welding is superior to ordinary submerged arc welding (SAW)in the following points:
(i) higher ductility of weld and narrower heat-affected zone is attained because ofsmaller heat input,
(ii) smaller number of path reduces probabilistic occurrence of weld defect,
(iii) smaller amount of welding consumables is needed by adopting square groove.
Hydrostatic test of the RPV at the fabricator was performed before shipping. The RPVwas transported to Oarai Research Establishment, JAERI in August 1994. After theinstallation of the RPV body into the containment vessel, reactor internals started to beinstalled, which was followed by closing of the RPV top head in October 1995. After thatstand-pipe closures with control rods, surveillance holders, etc. were fixed. Pressure test ofthe primary and secondary cooling system including the RPV was performed successfully inMarch 1996.
BendingRoller Wire feed
RollerTorchGroove
Fig. 5 Mechanism of automatic narrow-gap MIG welding
311

3. Material
Because fluence of the RPV is calculated to be less than IxlO17 n/cm2 (E>1 MeV),neutron irradiation embrittlement is presumed to be negligible. However, the integrity of theRPV can be impaired due to temper embrittlement at 400 °C. For the purpose of reducingembrittlement, content of some elements is limited on 2 1/4 Cr-1 Mo steel for the HTTRRPV using embrittlement parameters:
J-factor = (Si+Mn)(P+Sn) x 104 < 100 (Si, Mn, P, Sn : wt%) (1)
X = (10P+5Sb+4Sn+As)/100 < 10 (P, Sb, Sn, As : ppm) (2)which is called HTGR specification and applied to both base metal and weld metal. J-factoris a commonly used parameter proposed by Watanabe et al. [3]. This factor implies that theimpurities Si (silicon) and Mn (manganese) alone in the absence of P (phosphorus) and Sn(tin) cannot cause any embrittlement. Similarly in the absence of Si and Mn, P and Sn, donot cause any embrittlement. It is indicated by Viswanathan and Jaffee [4] that the formercoincide with their study but the latter does not, that is Si and/or Mn do not cause temperembrittlement in the absence of the impurity elements P and Sn, however, the combination(P+Sn) is capable of causing significant embrittlement in the absence of Mn and Si contraryto the predictions of the J-factor. Thus it is necessary to employ the other parameter X.
Base metal
Figure 6 shows J-factor and X of nineteen heats of manufactured 21/4 Cr-1 Mo steels forthe HTTR RPV. J-factor and X ranges from 25 to 55 and from 4.1 to 8.3 respectively, whichsatisfies the HTGR specification. Regarding the plates and four large forgings, the top headdome, top head flange, shell flange, and bottom head petal, which consist main part of theRPV, J-factor and X are less than 38 and 5.1 respectively. For these nineteen heats of 2 1/4Cr-1 Mo steel, J-factor and X exhibit almost linear relation. Chemical composition and theembrittlement factors, J-factor and X, of ten components of the RPV are shown in Table 2,see also Fig. 3 pointing the components with names in boxes.
Figure 7 shows one example of correlation between J-factor and increase in 50 percentductile-to-brittle fracture appearance transition temperatures (AFATT) from the paper byViswanathan and Jaffee [4]. According to the figure, which arranges long term (20,000 to60,000 hr) isothermal embrittlement studies in the range 343 °C to 510 °C on numerousheats of commercial, heavy section 21/4 Cr-1 Mo steels in a variety of product forms, theAFATT becomes less than 10 °C when J-factor is less than 50. Most components of theHTTR RPV fulfill this condition except some medium and small forgings whose valuesexceed it a little.
Figure 8 shows distribution of nil-ductility transition temperature, TNDT, correlated to J-factor. The figure contains 68 results (some of which overlap each other) of drop weight testson the components made from the nineteen heats of steels. It should be noted that for all thecomponents reference temperatures, RTNDT, became equal to the nil-ductility transitiontemperatures, TNDT. The TNDT or RTNDT lies in the range -80 °C to -30 °C, satisfying anotherHTGR specification that RTNDT should be less than -20 °C. Because TNDT depends onmanufacturing process, the results scatter for components of the same heat. Although J-factoris usually related to increase in ductile-to-brittle transition temperatures, it seems to haveweak correlation with TNDT.
312

Table 2. Chemical composition and reference temperature (RTNDT) on some components of HTTR reactor pressure vessel
u>
(wt%)Forging(ladle analysis)JIS spec(SFVAF 22B)HTGR specTop head domeTop head flangeShell flangeBottom head petalNozzle 1Stand-pipe 1Stand-pipe 2Plate(ladle analysis)JIS spec(SCMV4-2)HTGR specShell 1Shell 2Seamless pipe(ladle analysis)JIS spec(STPA24)HTGR specStand-pipe 3
C
5015
0 140 140140 150 130 12014
C
SO 17
0 150 14
C
5015
0 11Note RTNDT (reference
Weld
JIS spec of wire(YG2CM-A)HTGR specWireWeld metal
C
50 15
0 120 12
Si Mn
SO 50 0 30-060
007 0550 04 0 540 03 0 54005 0550 07 0 46010 045010 046
Si Mn
SO 50 0 30-060
010 055010 057
Si Mn
SO 50 0 30-060
0 02 0 48
P
50030
0003000300030003000600050006
P
50030
00030004
P
50030
0005
S Cr
50 030 2 00-250
0001 2290001 2290 003 2 290001 2300 002 2 440 003 2 320 004 2 37
S Cr
SO 030 2 00-250
0001 2450001 243
S Cr
50 030 1 92-260
0 002 2 35
Mo
090-1 10
1061051001 05105103105Mo
090-1 10
106105Mo
087-1 13
099temperature) was equal to TNDT (nil-ductility transition
Si Mn
0 20- 0 40-0 90 1 40
0 38 0 860 22 0 63
P
50025
00070005
S Cr
50025 210-270
0 007 2 330 006 2 25
Mo
090-1 20
1 12105
Cu Ni V
0 04 0 08 0 005004 009 0005003 010 00050 03 0 04 0 0050 02 0 04 0 0060 03 0 04 0 0060 03 0 06 0 007Cu Ni V
001 015 0010001 017 0010Cu Ni V
002 005 0010
Co Al
0 008 <0 0050 009 <0 0050 008 <0 0050 007 <0 0050 007 0 0030 006 0 0030 007 0 003
Co Al
0006 00190006 0011
Co Al
0 004 0 002temperature) regarding all the components
Cu Ni V
5040
0010 03 0 02 0 003
Co Al
00020 003 0 004
Sn
0003<0003<0001<0003000300030003Sn
00010001
Sn
0002above
Sn
0002
As
00030004
<00030003000200020003As
00020002
As
0002
As
0002
Sb x(ppm)
5100 0009 5 0000)0 5100010 5000011 500 0006 7 70 0007 6 80 0008 7 9
Sb x(ppm)
510<0001 41<0001 51
Sb x(ppm)
5100001 65
Sb x(ppm)
510
0001 60
J RTNDT(wt%) (°C)
5100 5-2037 2 -5034 8 -6534 2 -55360 -3547 7 -4044 0 -6050 4 -65
(wt%) (°C)
5100 5-20260 -5533 5 -55
(wt%) (°C)
5100 5-2035 0 -30
J RTNDT(wt%) (°C)
5100 5-20
60 0 -35

10
8
X 6
mm
o
•*»
XVC A :
A
D PlateO Lame forgingA Medium and smO Seamless pipe
L, A*A A
all forging
20 30 40J-factor
50 60
Fig. 6 Distribution of X and J-factor on 2 1/4 Cr -1 Mo steelfortheHTTRRPV
314
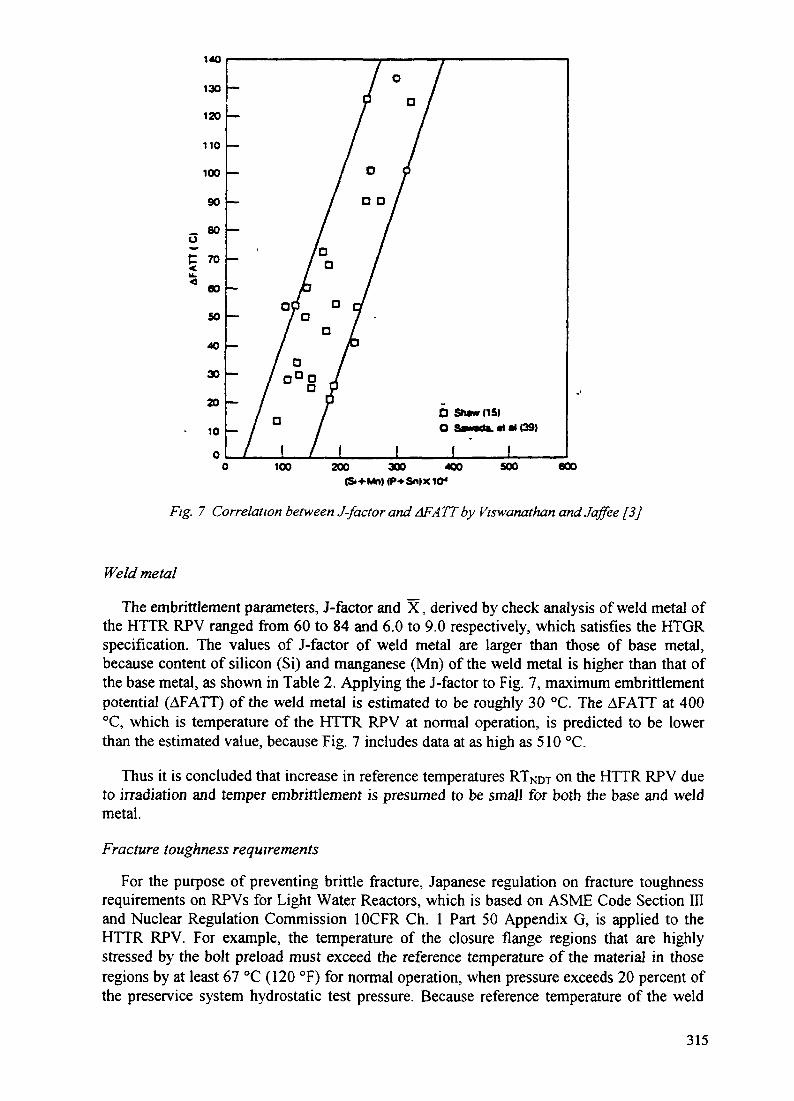
140
130
120
110
100
90
~ 80U
I TOu.< 60
50
40
30
20
100
100 200 300 400 500 600
. 7 Correlation between J-factor and AFATT by Viswanathan and Jaffee [3]
Weld metal
The embrittlement parameters, J-factor and X, derived by check analysis of weld metal ofthe HTTR RPV ranged from 60 to 84 and 6.0 to 9.0 respectively, which satisfies the HTGRspecification. The values of J-factor of weld metal are larger than those of base metal,because content of silicon (Si) and manganese (Mn) of the weld metal is higher than that ofthe base metal, as shown in Table 2. Applying the J-factor to Fig. 7, maximum embrittlementpotential (AFATT) of the weld metal is estimated to be roughly 30 °C. The AFATT at 400°C, which is temperature of the HTTR RPV at normal operation, is predicted to be lowerthan the estimated value, because Fig. 7 includes data at as high as 510 °C.
Thus it is concluded that increase in reference temperatures RTNDT on the HTTR RPV dueto irradiation and temper embrittlement is presumed to be small for both the base and weldmetal.
Fracture toughness requirements
For the purpose of preventing brittle fracture, Japanese regulation on fracture toughnessrequirements on RPVs for Light Water Reactors, which is based on ASME Code Section IIIand Nuclear Regulation Commission 10CFR Ch. 1 Part 50 Appendix G, is applied to theHTTR RPV. For example, the temperature of the closure flange regions that are highlystressed by the bolt preload must exceed the reference temperature of the material in thoseregions by at least 67 °C (120 °F) for normal operation, when pressure exceeds 20 percent ofthe preservice system hydrostatic test pressure. Because reference temperature of the weld
315

-20
-40
S -60
-80
-100
O Large forgingA Medium and small forgingO Seamless pipe
20 30 40J-factor
50 60
Fig. 8 Relation between TNDT and J-factor on 2 l/4Cr-lMo steelfor the HTTR RPV
316
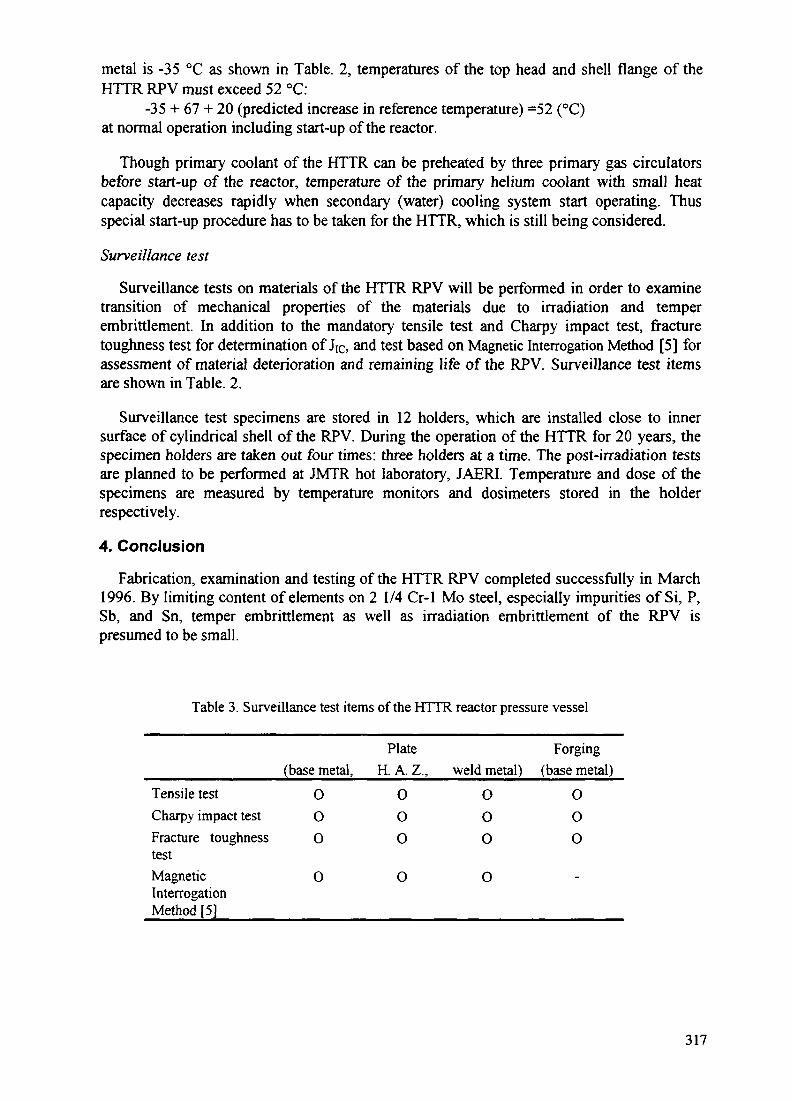
metal is -35 °C as shown in Table. 2, temperatures of the top head and shell flange of theHTTR RPV must exceed 52 °C:
-35 + 67 + 20 (predicted increase in reference temperature) =52 (°C)at normal operation including start-up of the reactor.
Though primary coolant of the HTTR can be preheated by three primary gas circulatorsbefore start-up of the reactor, temperature of the primary helium coolant with small heatcapacity decreases rapidly when secondary (water) cooling system start operating. Thusspecial start-up procedure has to be taken for the HTTR, which is still being considered.
Surveillance test
Surveillance tests on materials of the HTTR RPV will be performed in order to examinetransition of mechanical properties of the materials due to irradiation and temperembrittlement. In addition to the mandatory tensile test and Charpy impact test, fracturetoughness test for determination of JIC, and test based on Magnetic Interrogation Method [5] forassessment of material deterioration and remaining life of the RPV. Surveillance test itemsare shown in Table. 2.
Surveillance test specimens are stored in 12 holders, which are installed close to innersurface of cylindrical shell of the RPV. During the operation of the HTTR for 20 years, thespecimen holders are taken out four times: three holders at a time. The post-irradiation testsare planned to be performed at JMTR hot laboratory, JAERI. Temperature and dose of thespecimens are measured by temperature monitors and dosimeters stored in the holderrespectively.
4. Conclusion
Fabrication, examination and testing of the HTTR RPV completed successfully in March1996. By limiting content of elements on 2 1/4 Cr-1 Mo steel, especially impurities of Si, P,Sb, and Sn, temper embrittlement as well as irradiation embrittlement of the RPV ispresumed to be small.
Table 3. Surveillance test items of the HTTR reactor pressure vessel
(base metal,Tensile testCharpy impact testFracture toughnesstestMagneticInterrogationMethod [5]
OOO
O
PlateH. A. Z.,
OOO
O
weld metal)OOO
O
Forging(base metal)
00O
-
317

References
[1] S. Terado, Y. Tachibana, K. Kunitomi, and Y. Fukaya, "Design and Fabrication of HTTRReactor Pressure Vessel," Report of the Japan Atomic Energy Research Institute, JAERI-Tech 96-034,1996. (in Japanese)
[2] S. Saito, et al., "Design of High Temperature Engineering Test Reactor (HTTR)," Reportof the Japan Atomic Energy Research Institute, JAERI1332, 1994.
[3] J. Watanabe, et al., "Temper Embrittlement of 2 1/4 Cr-1 Mo Pressure Vessel Steel,"Presented at ASME 29th Petroleum Mech. Eng. Conf, Dallas, Sept. 15-18, 1974.
[4] R. Viswanathan and R. I. Jaffee, "2 1/4 Cr-1 Mo Steels for Coal Conversion PressureVessels," Journal of Engineering Materials and Technology, Vol. 104, pp. 220-226, 1982.
[5] K. Ara, N. Nakajima, N. Ebine, K. Sakasai, "Magnetic Interrogation Method forNondestructive Measurement of Radiation Hardening of Nuclear Reactor PressureVessels," Proc. of 8th Int. Conference on Pressure Vessel Technology, Canada, pp. 183-189, 1996.
318

STATUS OF GAS COOLED TEST REACTOR PROGRAMMES
NEXTPAGE(S)Uf tBLANK
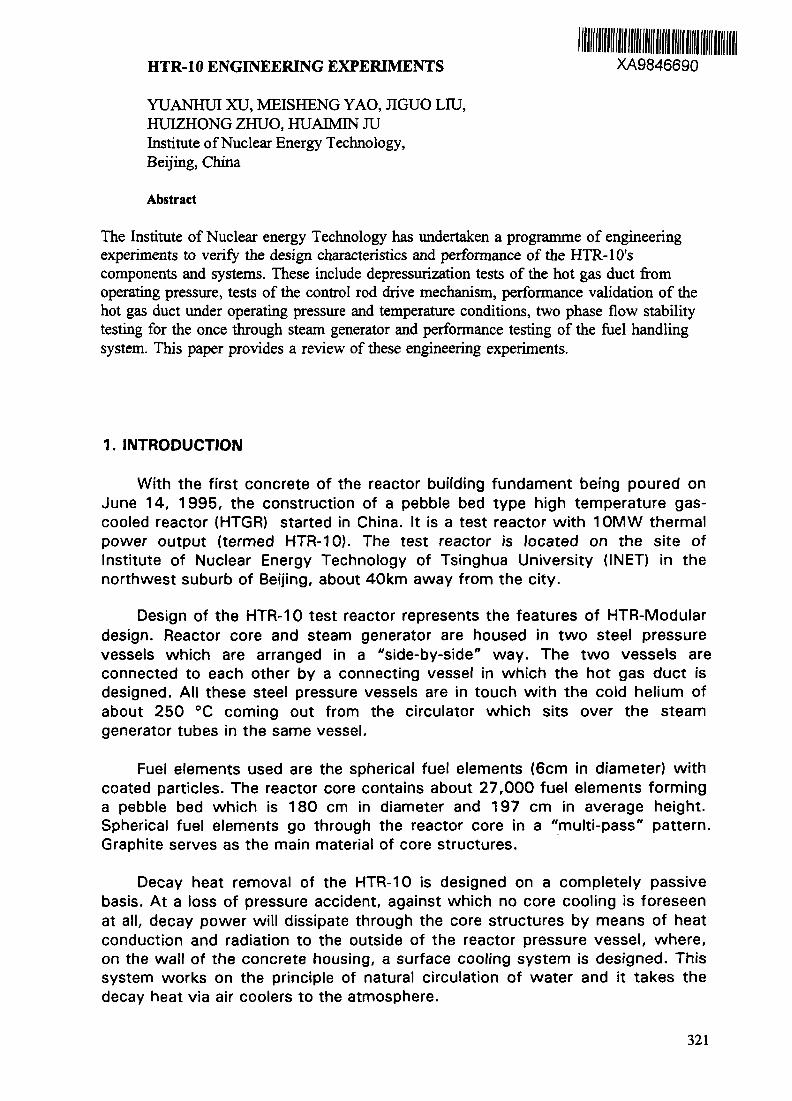
HTR-10 ENGINEERING EXPERIMENTS XA9846690
YUANHUIXU, MEISHENG YAO, JIGUO LIU,HU1ZHONG ZHUO, HUAIMIN JUInstitute of Nuclear Energy Technology,Beijing, China
Abstract
The Institute of Nuclear energy Technology has undertaken a programme of engineeringexperiments to verify the design characteristics and performance of the HTR-10'scomponents and systems. These include depressurization tests of the hot gas duct fromoperating pressure, tests of the control rod drive mechanism, performance validation of thehot gas duct under operating pressure and temperature conditions, two phase flow stabilitytesting for the once through steam generator and performance testing of the fuel handlingsystem. This paper provides a review of these engineering experiments.
1. INTRODUCTION
With the first concrete of the reactor building fundament being poured onJune 14, 1995, the construction of a pebble bed type high temperature gas-cooled reactor (HTGR) started in China. It is a test reactor with 10MW thermalpower output (termed HTR-10). The test reactor is located on the site ofInstitute of Nuclear Energy Technology of Tsinghua University (INET) in thenorthwest suburb of Beijing, about 40km away from the city.
Design of the HTR-10 test reactor represents the features of HTR-Modulardesign. Reactor core and steam generator are housed in two steel pressurevessels which are arranged in a "side-by-side" way. The two vessels areconnected to each other by a connecting vessel in which the hot gas duct isdesigned. All these steel pressure vessels are in touch with the cold helium ofabout 250 °C coming out from the circulator which sits over the steamgenerator tubes in the same vessel.
Fuel elements used are the spherical fuel elements (6cm in diameter) withcoated particles. The reactor core contains about 27,000 fuel elements forminga pebble bed which is 180 cm in diameter and 197 cm in average height.Spherical fuel elements go through the reactor core in a "multi-pass" pattern.Graphite serves as the main material of core structures.
Decay heat removal of the HTR-10 is designed on a completely passivebasis. At a loss of pressure accident, against which no core cooling is foreseenat all, decay power will dissipate through the core structures by means of heatconduction and radiation to the outside of the reactor pressure vessel, where,on the wall of the concrete housing, a surface cooling system is designed. Thissystem works on the principle of natural circulation of water and it takes thedecay heat via air coolers to the atmosphere.
321

There are two reactor shutdown systems, one control rod system and onesmall absorber ball system. They are all designed in the side reflector. Bothsystems are able to bring the reactor to cold shutdown conditions. Since thereactor has strong negative temperature coefficients and decay heat removaldoes not require any circulation of the helium coolant, the turn-off of the heliumcirculator can also shut down the reactor from power operating conditions.
However in the HTR-10 design some modifications from the HTR-Modulewere made to satisfy Chinese conditions. For example, the steam generator iscomposed of a number of modular helical tubes with small diameter, pulsepneumatic discharging apparatus are used in the fuel handling system and stepmotor driving control rods are designed. These modifications would cause someuncertainty in our design. It is necessary to do engineering experiments toprove these new or modified idea. Therefore a program of engineeringexperiments for HTR-10 key technologies is being conducted in INET. The mainaims of these engineering experiments are to verify the designed characteristicsand performance of the components and systems, to feed back on design andto obtain operational experiences.
Those engineering experiments are depressurization test of the hot gasduct at room temperature and operating pressure, performance test of the hotgas duct at operating helium temperature and pressure, performance test of thepulse pneumatic fuel handling system, test of the control rods driving apparatusand two phase flow stability test for the once through steam generator.
2. DEPRESSURIZATION TEST OF THE HOT GAS DUCT
The hot gas duct, is shown in Fig 1, is composed of inner tube, outer tube,insulation layer and corundum bricks etc.. The outer tube acts as the supportingstructure of the inner tube and insulation layer. Both ends of the outer tube arewelded to the corrugated pipes to absorb the thermal expansion. The hot gasduct is divided into five sections in order to be easy to be installed. Eachsection is connected by slide joint. Corundum bricks are used as insulatingmaterial between two inner tubes and fixed to the outer tube.
1 End2 Corruooled pipes3 Flange at the end4 Outer tub*
5 Insulation layer
6 Otrlw tube at the end7 Flange8 Slonless steel fores
9 Bolts10 Inner tube11 Corundum bricks
FIG.1 Structure of the Hot Gas Duct
322

At the depressurization accident the pressure in insulation layer would bereleased only through area of exhaust in slide joints between two inner tubes ofthe hot gas duct. The pressure difference between the insulation layer andoutside the inner tube would be existed due to velocity difference of helium gasflow in insulation and in inner tube at depressurization accident, and may causedamage of the inner tube. In order to research on the effect of depressurizationrate and area of exhaust in slide joints on the pressure difference anexperimental equipment was set up at INET.
The test section is shown in Fig 2. Its diameter is the same as one of thehot gas duct. But only two sections without slide joint between them are takenfor the test and several small holes at the middle of the test section areequipped to simulate area of exhaust in slide joints. The test was carried out atair of 0.8 MPa, nitrogen of 1.0 MPa and 3.0 MPa as well as helium of 0.8 MPa,respectively.
1 Pressure measure tubes
2. CM« tut*3. kwer tube
4 Holes and bolts
5. Insertion layer
6 Pressure measure lube
FIG. 2 Test Section for the DepressurizationTest
The effect of depressurization rate on the pressure difference between theinsulation layer and outside the inner tube is shown in Fig 3. It is clear thatmaximum pressure difference is raised with increase of depressurization rate.
The effect of area of exhaust in slide joints on the pressure differencebetween the insulation layer and outside the inner tube is shown in Fig 4. Itcan seen that maximum pressure difference is increased with decrease of areaof exhaust in slide joints and a critical area of exhaust in slide joints exists, thatis, maximum pressure difference would rapidly increased if area of exhaust inslide joints would be less this critical one. It is also related with depressurizationrate.
323
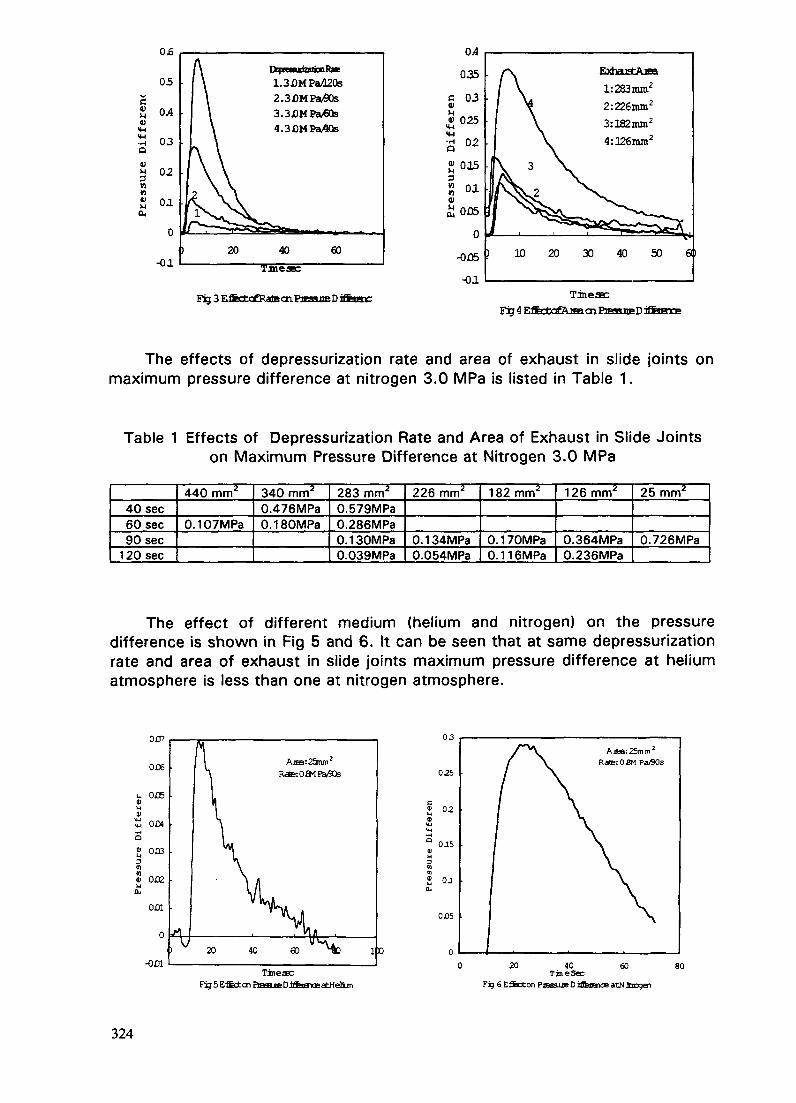
cow
0.6
05
0.4
03
M 02
nm
-0120
DcpraurizaiooRMc1.3J3MPaA20s2.3JDMPa/90s3.3JDMPa/60s4.3JOMFa/4Qs
60Tuie;
FigSEflBctofRatecnPiesaueDJflEn-nc
0.4
035
C 03<v0025
<M
Q °2
£ 003
I 01IV£ 005
0
-OJ35
-01
ExhaistAjea1:283 mm2
2:226mm2
3:lS2mm2
4:126nun2
ID 20 30 40 50 a
Tineaac
The effects of depressurization rate and area of exhaust in slide joints onmaximum pressure difference at nitrogen 3.0 MPa is listed in Table 1.
Table 1 Effects of Depressurization Rate and Area of Exhaust in Slide Jointson Maximum Pressure Difference at Nitrogen 3.0 MPa
40 sec60 sec90 sec
1 20 sec
440 mm2
0.107MPa
340 mm2
0.476MPa0.180MPa
283 mm2
0.579MPa0.286MPa0.130MPa0.039MPa
226 mm2
0.134MPa0.054MPa
182mm2
0.170MPa0.116MPa
1 26 mm2
0.364MPa0.236MPa
25 mm2
0.726MPa
The effect of different medium (helium and nitrogen) on the pressuredifference is shown in Fig 5 and 6. It can be seen that at same depressurizationrate and area of exhaust in slide joints maximum pressure difference at heliumatmosphere is less than one at nitrogen atmosphere.
0£T7
006
-001
03
025
0.15
OJ
0.05
Rater OBMPa/SQs
TinescFig 5 Eifctcn FteseuieD ifeffoeaHeUm
20 40TjneSec
60 80
Fig 6 Eflfecton PiEss-uE 0 iSenanoe atN icojen
324
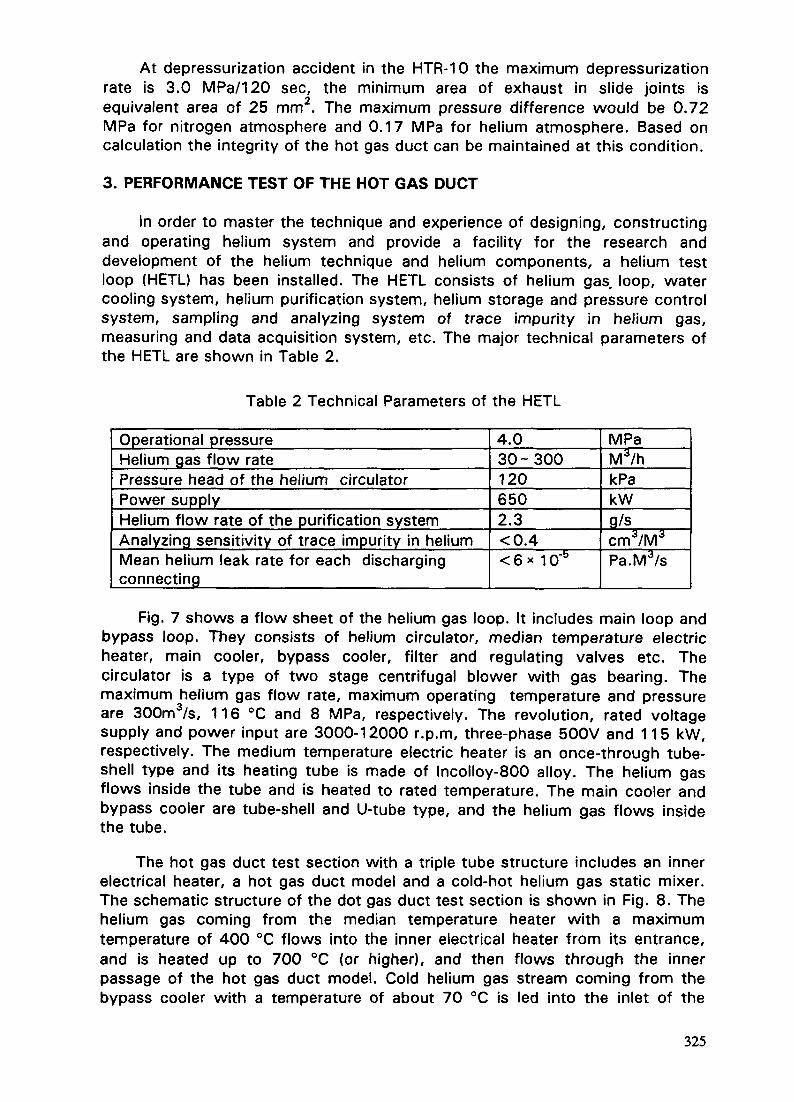
At depressurization accident in the HTR-10 the maximum depressurizationrate is 3.0 MPa/120 sec, the minimum area of exhaust in slide joints isequivalent area of 25 mm2. The maximum pressure difference would be 0.72MPa for nitrogen atmosphere and 0.17 MPa for helium atmosphere. Based oncalculation the integrity of the hot gas duct can be maintained at this condition.
3. PERFORMANCE TEST OF THE HOT GAS DUCT
In order to master the technique and experience of designing, constructingand operating helium system and provide a facility for the research anddevelopment of the helium technique and helium components, a helium testloop (HETL) has been installed. The HETL consists of helium gas, loop, watercooling system, hefium purification system, helium storage and pressure controlsystem, sampling and analyzing system of trace impurity in helium gas,measuring and data acquisition system, etc. The major technical parameters ofthe HETL are shown in Table 2.
Table 2 Technical Parameters of the HETL
Operational pressureHelium gas flow ratePressure head of the helium circulatorPower supplyHelium flow rate of the purification systemAnalyzing sensitivity of trace impurity in heliumMean helium leak rate for each dischargingconnecting
4.030 - 3001206502.3<0.4<6* 10'5
MPaM3/hkPakWg/scm3/M3
Pa.M3/s
Fig. 7 shows a flow sheet of the helium gas loop. It includes main loop andbypass loop. They consists of helium circulator, median temperature electricheater, main cooler, bypass cooler, filter and regulating valves etc. Thecirculator is a type of two stage centrifugal blower with gas bearing. Themaximum helium gas flow rate, maximum operating temperature and pressureare 300m3/s, 116 °C and 8 MPa, respectively. The revolution, rated voltagesupply and power input are 3000-12000 r.p.m, three-phase 500V and 115 kW,respectively. The medium temperature electric heater is an once-through tube-shell type and its heating tube is made of lncolloy-800 alloy. The helium gasflows inside the tube and is heated to rated temperature. The main cooler andbypass cooler are tube-shell and U-tube type, and the helium gas flows insidethe tube.
The hot gas duct test section with a triple tube structure includes an innerelectrical heater, a hot gas duct model and a cold-hot helium gas static mixer.The schematic structure of the dot gas duct test section is shown in Fig. 8. Thehelium gas coming from the median temperature heater with a maximumtemperature of 400 °C flows into the inner electrical heater from its entrance,and is heated up to 700 °C (or higher), and then flows through the innerpassage of the hot gas duct model. Cold helium gas stream coming from thebypass cooler with a temperature of about 70 °C is led into the inlet of the
325

Purification system
Purification system
Vacuum system
Cooling water
1 Circulater 2 Regulating valve 3 Electric heater 4 HGD test section5 Main cooler 6 Filter 7 Bypass cooler
FIG .7 Flow Sheet of the Helium Gas Loop
mixer through the low temperature helium entrance and an annular passage.The hot helium gas and the cold helium gas are mixed in the mixer, and thenthe mixing helium gas with a temperature of about 250 °C passes through theannular passage between the pressure tube and the outer tube of the hot gasduct. The hot gas duct model is designed with the same configuration andradial dimensions as the hot gas duct for the HTR-10. lncolloy-800 alloy waschosen for the inner tube, as it may be exposed to helium gas flow attemperature of 700 °C {or 950 °C). The outer tube and the pressure tube ismade of 16Mn. Fibrous ceramic insulation material, the main composition ofwhich is AI203 and Si02, is divided into two sub-layers by stainless steel foilsand is packed into the space between inner and outer tube.
Flow rate, temperature, pressure and differential pressure are measured.Flow rates are measured by two orifice meter which are installed in main loopand bypass loop. Pressure and differential pressure are measured usingtransmitters. At the cross sections A and B, 610 mm far from two ends of thehot gas duct model, 16 thermocouples are installed for measuring thetemperature of helium gas, liner tube, insulation layer and outer tube. Thetemperatures of helium gas at the inlet and outlet of inner heater, helium gas inthe annular passage and pressure tube are also measured by thermocouples.
326

Entrance for low temperature He 2. Coirj-hot He mixer 3 internal insulation 4 HGD model 5. Pressure tube
6 Inner heoter 7 Outlet for He 8 Electrode assembly 9 Entrance lor median temperature
Fig 8 Schematic Structure of the HGD Test Section
The effective thermal conductivity of insulation layer was measured. Arelationship between the effective thermal conductivity and the averagetemperature of the insulation layer at helium pressure of 3.0, 2.5 and 1.5 MPais shown in Fig 9. The empirical equation of the effective thermal conductivitywere obtained as follows:
Keff =0.3468 + 0.0003T (°C) W/m/°C
Where T is the average temperature of the insulation layer.
u.u
U.B
p 0.6E- g
5 I0-4
B *>-< 0.2O i<
n
X eff= 0.0003T + 03468
O O i c 5 O
A He =0.00031 + 0.1547
200 220 240 260 280 300 320 340 360 380 400 420
AVERAGE TEM PERATURE O F INSULATiDN PC )
OD
3DM PaISM Pa
• Xeff(W /fn • 1C)
25M Pa• XHe (W /fn • 1C)
FIG.9 Relatoin Between X eff and Average temperature of Insulation
The measured effective thermal conductivity are 1.5-2 times as large asthe thermal conductivity of helium gas at the same condition of temperatureand pressure.
The hot gas duct model has been operated more than 100 hours at thetemperature of 700 °C and the pressure of 3.0 MPa, and has been borne over15 times temperature cycle between 300 and 700 °C, and 20 times pressurecycle between atmospheric pressure and 3.0 MPa. No any deterioration ofthermal performance was detected.
327
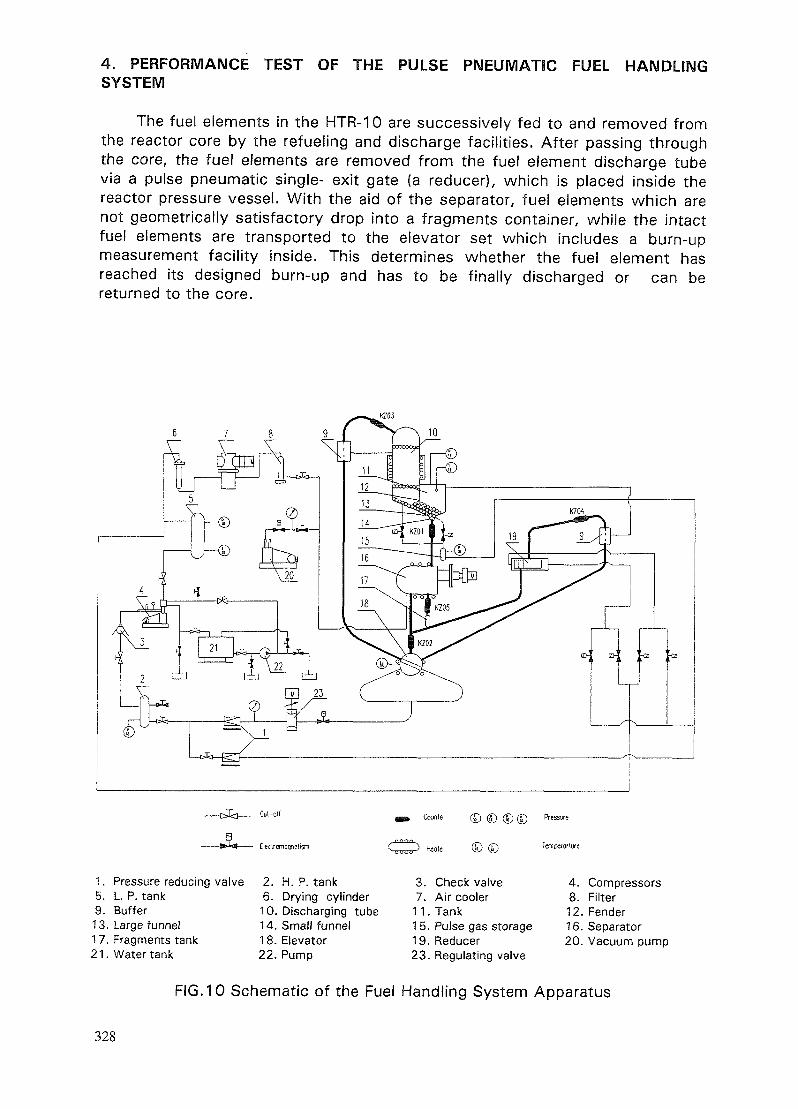
4. PERFORMANCE TEST OF THE PULSE PNEUMATIC FUEL HANDLINGSYSTEM
The fuel elements in the HTR-10 are successively fed to and removed fromthe reactor core by the refueling and discharge facilities. After passing throughthe core, the fuel elements are removed from the fuel element discharge tubevia a pulse pneumatic single- exit gate (a reducer), which is placed inside thereactor pressure vessel. With the aid of the separator, fuel elements which arenot geometrically satisfactory drop into a fragments container, while the intactfuel elements are transported to the elevator set which includes a burn-upmeasurement facility inside. This determines whether the fuel element hasreached its designed burn-up and has to be finally discharged or can bereturned to the core.
Cut-off
[lecUomoonelism
Counle © © © © *'•
Heole © © Ien"
1. Pressure reducing valve5. L. P. tank9. Buffer13. Large funnel17. Fragments tank21. Water tank
2. H. P. tank6. Drying cylinder10. Discharging tube14. Small funnel18. Elevator22. Pump
3. Check valve7. Air cooler11. Tank15. Pulse gas storage19. Reducer23. Regulating valve
4. Compressors8. Filter12. Fender16. Separator20. Vacuum pump
FIG.10 Schematic of the Fuel Handling System Apparatus
328

In order to avoid operating difficulty with mechanical facilities a new fuelhandling system has been developed in our institute. Its features arecharacterized by pulse pneumatic discharging, gas tight magnetic driving andelctro-induction balls counters.
The test at room temperature has been carried out. Its main task is toprove its design concept for fuel discharging. More than 100,000 balls weredischarged by pulse pneumatic discharging way.
Full scale apparatus for test of whole fuel handling system and itscomponents at helium temperature of 180 °C and low pressure was installed.The schematic of the full scale apparatus is shown in Fig. 10. Main componentsin this apparatus are prototype ones. It consists of the discharge tube, areducer, a failed ball separator, an elevator, graphite ball detectors, pressurereducing valves, adjusting valves, heaters and so on. Its helium auxiliary systemconsists of the helium compressor, helium storage tanks, air coolers, filters andvacuum pumps etc.. The power loading control (PLC) is used for automaticcontrol, mosaic simulation panels for simulating display, the computer for datamanagement.
Main parameters of full scale apparatus are listed in Table 3. Theoperation at temperature of 150 °C is being carried out.
Table 3 Main Parameters of Fuel Handling System
Diameter of discharging tubeHeight of discharge tubeMaximum charging heightWidth of tankOperating temperatureOperating pressureCirculating balls numberVolume of pulse gas storage tankOperating pressure of pulse gasPulse frequencyRevolution of separatorDiameter of graphite balls
50042004000500150-1800.2600.050.42160
mmmmmmmm°CMPaballs/hrM3
MPaHz/min.r/min.mm
5. TEST OF THE CONTROL RODS DRIVING APPARATUS
The experiment on the control rods driving system at room temperaturewas done in order to verify its main performance. The performance of thecontrol rod at operating temperature and helium atmosphere of low pressurewill be tested at a full scaling apparatus.The schematic of the control rodsdriving apparatus is shown in Fig.11. It consists of a step motor, a gearbox, achain-chain wheel, a speed restriction, an indictor for position of the control
329

1. Vacuum pump4. Voltage regulator7. Insulation
10. Synchronometer13. Control board
2. Helium cylinder5. Transformer8. Control rod11. Insulation14. Temperature controller
3. Temperature controller6. Insulation9. Step motor12. Heater15. Eddy heater
FIG. 11 Schematic of Control Rods Driving System
1. Helium blower 2. Filter 3 Heater exchanger 4.5 Test section 6 Prehealer 7 Circulating pump8 Pressunzer tank 9 Condenser 10 Healer exchanger 11 Water storage tank
FIG. 12 Flowsheet of Two Phase Flow Stability Loop
330

rod, a control rod and a vessel. Following test will be done by the means of thisapparatus: control rod movement, maximum fall speed of the control rod,indictor performance and life time. The control rods driving apparatus is underinstallation and whole test will be finished at middle of next year.
6. TWO PHASE FLOW STABILITY TEST FOR THE ONCE THROW STEAMGENERATOR
The main purposes of the two phase flow engineering test facility are: tostudy on the stability of the HTR-10 steam generator at operational conditionsand to determine maximum throat diameter of the throttle appertains, to studyflow resistance on the water side and average heat transfer coefficient on thehelium gas side of the steam generator with small curvature radius of the helicaltube.
The two phase flow engineering test facility of the steam generatorconsists of the helium loop, primary water loop and secondary water loop. Inthe helium loop there are two full scale test sections. The schematic for twophase flow engineering test facility of the steam generator is shown in Fig. 12.
The helium loop includes a helium blower, a filter, regulator valves, anelectric heater, two test sections, a main cooler, helium flow meters and thehelium purification system. Helium coming from the helium blower is heated bythe electric heater to 600-700 °C, then led to the test section ( steam generatorbundle model ). In the test section helium gas transfers its heat to the primaryloop water as does in the HTR-10' steam generator. Cooled gas goes throughthe main cooler, the filter and returns to the helium blower to make a heliumgas circulation.
Low voltage, large current heating pattern is used for the electric heater.The heating power is 2 x 180 kW.
The primary water loop mainly consists of a circulating pump, a pre-heater,inlet throttle apparatus, steam generator bundle, a condenser, a heatexchanger, a pressurizer, and a water tank. Deionized water is used in theprimary water loop.
The function of the secondary water loop is to remove the heat from theprimary loop water. The secondary loop consists of a water tank, a sealedpump and an air cooling tower.
The two phase flow engineering test facility of the steam generator isunder installation and will be operated at beginning of next year
331

7. CONCLUSION
A program of engineering experiments for HTR-10 key technologies isbeing conducted in INET. The main aims of these engineering experiments areto verify the designed characteristics and performance of the components andsystems.
The experiment for the hot gas duct at both room and operation conditionwas carried out and the obtained results are satisfied. The experiments for thefuel handling system and the control rods driving system at room temperaturewere completed and the experiments at operation temperature are being carriedout.
332

CHARACTERISTICS OF HTTR's STARTUP PHYSICS TESTS XA9846691
N. NOJIRI, M. NAKANO, M. TAKEUCffl, P. POHL, K. YAMASHITAJapan Atomic Energy Research Institute,Oarai-machi, Ibaraki-ken
Abstract
The High Temperature Engineering Test Reactor (HTTR) which is under construction byJapan Atomic Energy Research Institute (JAERI) is a graphite-moderated and helium gas-cooled reactor with an outlet temperature of 950°C and a thermal output of 30MW. The firstcriticality is expected at the end of October 1997. The start-up physics tests (SPTs) areplanned in the period from mid 1997 to the end of 1998. Characteristic items of the SPTs are1) Criticality approach, 2) Tests on a preliminary annual core, 3) Measurement of scram
reactivity, 4) Excess reactivity test, 5) Measurements along with a 2-step-scram reactorshutdown procedure.
1. IntroductionThe High Temperature Engineering Test Reactor (HTTR) is developed to establish and
upgrade the technological basis for advanced high temperature gas-cooled reactors (HTGRs)and to conduct various irradiation tests for innovative high temperature basic research. TheHTTR is a test reactor with a thermal output of 30MW and a coolant outlet temperature of850°C at rated power operation and 950°C at high temperature test operation. It has thecapability to demonstrate nuclear process heat utilization. The fuel loading will begin in themiddle of 1997. The first criticality is expected at the end of October 1997. The start-up physicstests (SPTs) are planned in the period from mid 1997 to the end of 1998, and full power
operation will be achieved in the beginning of 1999.The SPTs have been selected from two viewpoints. One is to carry out the function tests
necessary for commissioning. These tests consist of the measurement of significant values
concerning safe reactor operation and shutdown so as the control rod reactivity, shutdownmargin, and excess reactivity. The other is to get an insight into HTTR's characteristics. Todetermine scram reactivity, a new approach using a delayed integral counting method will betested and compared to other evaluation methods. Table 1 lists all planned SPTs. This paperdescribes characteristics of the SPTs mainly related to nuclear properties.
333

2. Overview of the HTTR designTable 2 shows the major specifications of the HTTR. The active core, 2.9 m in height and
2.3 m in equivalent diameter, consists of 30 fuel columns and 7 control rod (CR) guide columns.
9 more CR columns are distributed among the adjacent reflector graphite columns. Verticaland horizontal cross sections of the HTTR are shown in Fig. 1 and 2, respectively. Each fuelcolumn consists of 9 graphite blocks of which the inner 5 contain the fuel. Fig.3 shows thestructure of the pin-in-block type fuel used in the HTTR. The fuel rod consists of a graphitesleeve with 14 fuel compacts. The fuel rods are inserted into the coolant channels of the fuelblocks. The fuel compacts contain the Coated Fuel Particles (CFPs). The coolant flow isdownward. Burnable Poison rods (BP) made of boron carbide are inserted into the vertical
holes below the dowel pins of the fuel blocks.
3. Physics Tests
Physics tests are basically divided into tests before reaching first criticality and those thatneed the critical condition. The latter can be divided in the tests carried out at zero power level,
i.e., at room temperature and at a condition where the core is kept isothermal at elevated
QQDjQ
Control rod
Reactor pressurevessel
Cora
Core restraintmechanism
Support post
Main coolantoutlet pipe
Auxiliary coolantoutlet pipe
— Coolant flow
Stand pipe
Permanentreflector
Replaceablereflector
Hot plenumblockThermalinsulator
Diagrid
Fig.1 Vertical cross section of the HTTR
334

Reserved shutdownsystem
Control rodinsertion hole
Side shield
Control rodGuide column
Fuel regionReplaceablereflector
Neutron detectorinsertion hole
Permanentreflector
Reactor pressurevessel
Core restraintmechanism
Fig.2 Horizontal cross section of the HTTR
Fuel handling hole
Fuel kernelHigh density PyC
SiClow density PyC
8 mm
O.H2mm
39mm
PlugDowel
Fuel•^/compact
Graphite'sleeve
t, 34mm
Fuel compact
Burnablepoison rod
Fig.3 Block-type fuel of the HTTR
335

temperatures by operation of the primary He circulators (PGCs), and the tests during reactoroperation at different power and temperature levels.
The tests at zero power level will not only be done with the fully loaded core. There isincreased interest now in annular shaped cores in regard of future HTGRs since this core formallows higher reactor powers than cylindrical cores maintaining the typical passive safetycharacteristics of the modular HTGR concept Therefore, the first fuel columns of the HTTRwill be arranged in an annular way aligning column by column so as to close the circle. The
first criticality is supposed to be reached before the circle is closed, so that, after its closure,the HTTR, at that intermediate stage, will be the first power HTGR with an annular coreoffering the unique opportunity to carry out critical measurements and to generateexperimental data needed for the validation of still-to-improve computer models for annularcore description.
3.1 First fuel loading and approaching criticalityPreparations, initial conditions: At first, the whole core consists of graphite dummy blocks.
Temporary neutron flux instrumentation and a temporary neutron source are provided. Fordetails, see Fig.4. The primary system contains He at normal atmospheric pressure and is notin operation; the core is at room temperature.
Procedure: Column by column, the dummy blocks are replaced by fuel assemblies inclockwise sense starting with fuel column No.l (Fig.4). The approach to criticality ismonitored by inverse multiplication measurements. The core is supposed to become criticalwith 12 columns loaded and the control rods (CRs) fully or nearly fully withdrawn. The firstcriticality is regarded as achieved when, by maintaining the just critical condition, thetemporary neutron source has been removed.
After having established the number of fuel columns needed for first criticality in thedescribed annular arrangement, more columns are filled with fuel, and after each 3 columnsloaded, the respective reactivity increase is determined by IK and scram reactivitymeasurements. These measurements are not only carried out until the annular core isestablished (18 columns) but are, after the completion of the annular core physics testsdescribed below, continued until all fuel is loaded (30 columns, Fig.4). (These reactivityaddition measurements already belong, of course, to the critical measurements.)
336
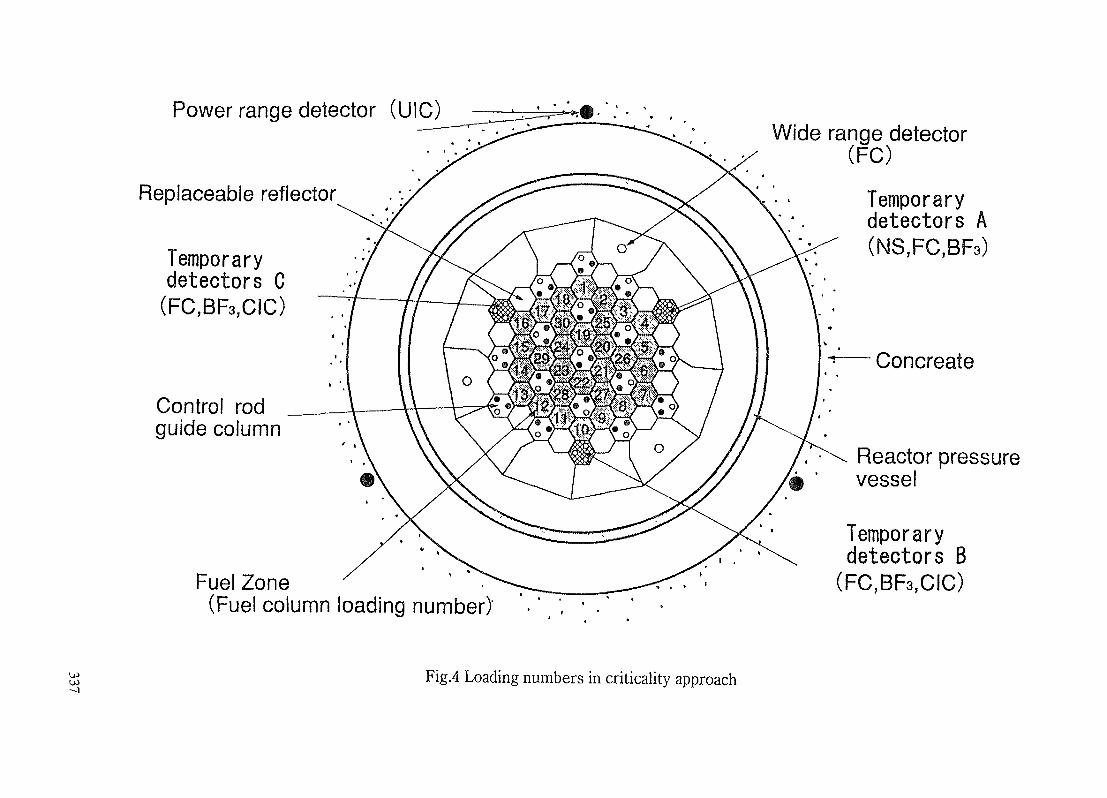
Power range detector (UIC)
Replaceable reflector
Temporarydetectors C(FC,BF3,CIC)
Control rodguide column
Fuel Zone % __(Fuel column loading number)
Wide range detector(FC)
Temporarydetectors A(NS,FC,BF3)
Concreate
Reactor pressurevessel
Temporarydetectors B(FC,BF3,CIC)
--JFig.4 Loading numbers in criticality approach

3.2 Tests at zero power level with the fully loaded coreAlthough zero power tests with the annular core have, naturally, to be carried out before
the core is fully loaded, this chapter regards the tests with the fully loaded core first becausethis concerns the initial HTTR core, and the measurements are more important for theHTTR, particularly in regulatory terms. Furthermore, the annular core tests are comprisedin the tests described in this chapter and can, therefore, be regarded in less detail in the chapterbelow.
Preparations, initial conditions: For most of the tests described here the conditions are thesame as described in 3.1. Only the measurement of the cold temperature coefficient ofreactivity requires different conditions. This test needs the operation of the primarycirculators (PGCs) as heat source to establish an isothermal core at various temperatures upto about 200°C. This conventional core heat-up can only be done with a pressurized primary
system. Therefore, helium will be added and the pressure risen to about 1.7 MPa at roomtemperature. This value is also required for the below described rise-to-power tests. Beforethe primary system is pressurized, the temporary detectors will have to be removed and thesystem be appropriately sealed off.
Procedures: The tests at zero power are the central point of the HTTR start-up testprogramme and comprise various very different measurement methods. The followingdescription of the procedures is therefore divided up into several subsections.
- Rod worth measurements with calculated correctionsMost of the zero power tests are CR reactivity worth measurements (see Table 1) carried
out by the IK method. At first, integral worth curves for each CR (Fig.4) are constructed usingan up-and-down method with another CR for reactivity compensation. All individual integralCR worth curves are added, giving a first integral CR bank worth curve. Systematical
deviations in the individual CR worths caused by reactivity compensation and the deviationin the bank worth by just summing-up the individual results will be corrected for by calculatedfactors. The corrected integral rod worth curves and the known critical CR bank position are
then used to evaluate the full reactivity control effect of the CRs, i.e., their full shutdownmargin, the cold shutdown margin (one CR stuck) and the overall excess reactivity. (The
excess reactivity is identical to the amount of reactivity bound by the CR bank in the cold corewhen inserted to the cold critical position.) The excess reactivity is also determined from themeasurements during fuel loading, described in 3.1, using appropriate calculated correction
factors. The obtained values are compared to the license requirements (Table 1).
338
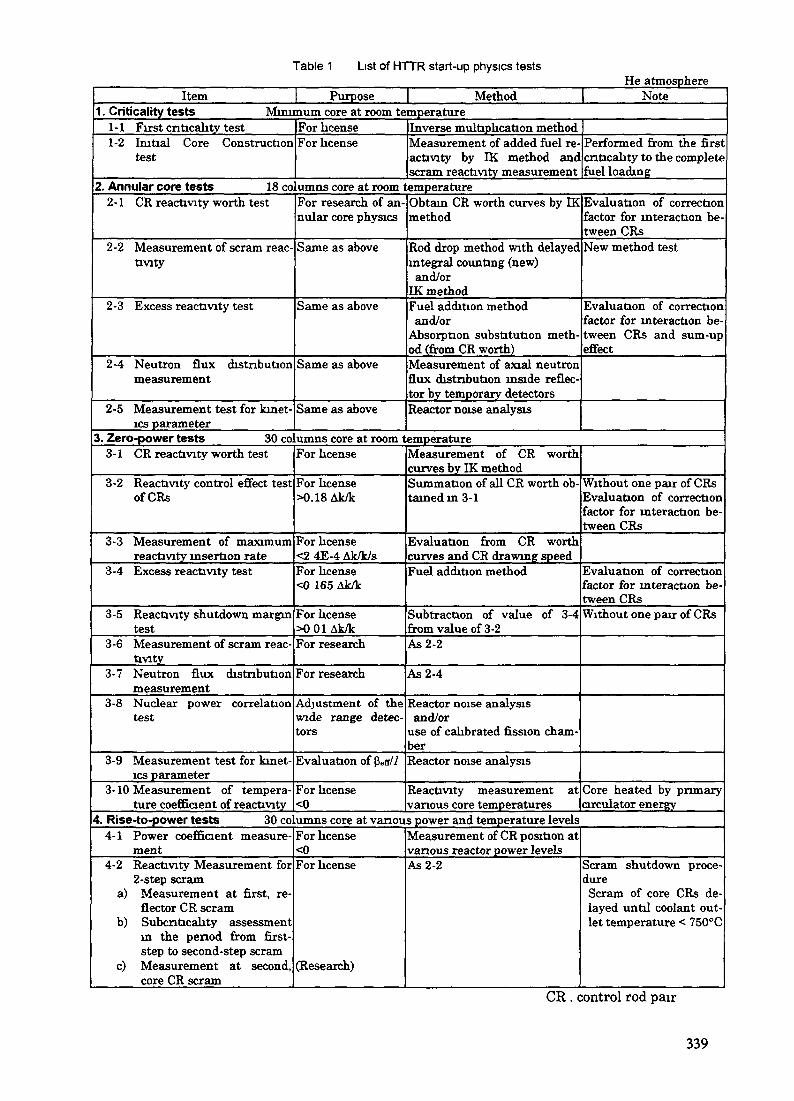
Table 1 List of HTTR start-up physics testsHe atmosphere
Item Purpose Method Note1 . Criticality tests Minimum core at room temperature
1 - 1 First cntacality test1-2 Initial Core Construction
test
For licenseFor license
Inverse multiplication methodMeasurement of added fuel re-activity by IK method andscram reactivity measurement
Performed from the firstcnticality to the completefuel loading
2. Annular core tests 18 columns core at room temperature2- 1 CR reactivity worth test
2-2 Measurement of scram reac-tivity
2-3 Excess reactivity test
2-4 Neutron flux distributionmeasurement
2-5 Measurement test for kinet-ics parameter
For research of an-nular core physics
Same as above
Same as above
Same as above
Same as above
Obtain CR worth curves by IKmethod
Rod drop method with delayedintegral counting (new)and/or
IK methodFuel addition methodand/or
Absorption substitution meth-od (from CR worth)Measurement of axial neutronflux distribution inside reflec-tor by temporary detectorsReactor noise analysis
Evaluation of correctionfactor for interaction be-tween CRsNew method test
Evaluation of correctionfactor for interaction be-tween CRs and sum-upeffect
3. Zero-power tests 30 columns core at room temperature3-1 CR reactivity worth test
3-2 Reactivity control effect testofCRs
3-3 Measurement of maximumreactivity insertion rate
3-4 Excess reactivity test
3-5 Reactivity shutdown margintest
3-6 Measurement of scram reac-tivity
3-7 Neutron flux distributionmeasurement
3-8 Nuclear power correlationtest
3-9 Measurement test for kinet-ics parameter
3-10 Measurement of tempera-ture coefficient of reactivity
For license
For license>0.18Ak/k
For kcense<2 4E-4 AkfkJsFor license<0 165 AkVk
For license>001 Ak/kFor research
For research
Adjustment of thewide range detec-tors
Evaluation of pW/
For license<0
Measurement of CR worthcurves by IK methodSummation of all CR worth ob-tained in 3- 1
Evaluation from CR worthcurves and CR drawing speedFuel addition method
Subtraction of value of 3-4from value of 3-2As 2-2
As 2-4
Reactor noise analysisand/or
use of calibrated fission cham-berReactor noise analysis
Reactivity measurement atvanous core temperatures
Without one pair of CRsEvaluation of correctionfactor for interaction be-tween CRs
Evaluation of correctionfactor for interaction be-tween CRsWithout one pair of CRs
Core heated by primarycirculator energy
4. Rise-to-power tests 30 columns core at vanous power and temperature levels4-1 Power coefficient measure-
ment4-2 Reactivity Measurement for
2-step scrama) Measurement at first, re-
flector CR scramb) Subcnticality assessment
in the period from first-step to second-step scram
c) Measurement at second,core CR scram
For license<0For license
(Research)
Measurement of CR position atvanous reactor power levelsAs 2-2 Scram shutdown proce-
dureScram of core CRs de-layed until coolant out-let temperature < 750°C
CR . control rod pair
339

The maximum differential CR worth found for an individual CR is combined to the known
CR driving speed, giving the maximum reactivity insertion rate (for license).Also, the scram reactivity will be measured. For accuracy studies, both a rod drop evaluation
method with delayed integral counting (details in Reference 1) and the IK method will be appliedfor the evaluation. The delayed integral counting method has been developed to correctsystematical errors for long rod insertion times (like for HTTR).
- Low-deviation rod worth measurementsRod worth measurements are bound to systematical deviations because of the necessary
displacement of compensation rods. This is a major disadvantage in, e.g., the determinationof the subcriticalily. In the above described methods, the problem is overcome by calculatedcorrections. To avoid these corrections and for comparison, major parameters like the coldshutdown margin, i.e., the subcriticality with all CRs inserted and the excess reactivity arealso evaluated by different rod worth measurement techniques in which the deviation behavioris studied experimentally and low-deviation rod combinations are assessed. This method hasbeen employed before. It uses simple flux shift considerations that, although only qualitative
in principle but when backed by some investigating measurements, allow approximately tojudge the deviation incorporated in a certain rod combination. For more details, see Reference2.
- Axial flux distributionFor these measurements, the temporary fission chambers (FCs, with 235U) inserted into
the 3 outer irradiation columns (Fig.4) are moved along the columns and their signals are readat various positions. The CRs are withdrawn bank-wise.
- Reactor noise analysisHTTR will be the first power HTGR at which reactor noise measurements will be carried
out. These tests, common in LWRs, are difficult to evaluate in case of an HTGR because ofthe longer neutron lifetime /. However, by an oscillating movement of the control rods at low
frequency etc., it is hoped that sufficiently clear noise signal can be generated and the reactortransfer function be obtained in high enough resolution.
As detectors, two of the temporary compensated ionization chambers (CICs, Fig.4) will beused and it will be tried to evaluate (3eff / / as well as the reactor power to obtain a first powercalibration of the wide range neutron detectors (WRMS).
340

- Temperature coefficient of reactivity (cold)These measurements are carried out as the last ones within the zero power tests because
they need the pressurized condition. By appropriate operation of the PGCs the core will bemade isothermal at about 70°C, 110°C, 150°C and 200°C. The reactivity difference betweenthe various temperatures, including room temperature, is assessed by rod worth
measurements. Here also, as described above, both a method with calculated correction anda low-deviation method will be applied. To determine the respective temperature difference,all reflector temperatures and the coolant inlet and outlet temperatures, measured withthermo- couples, are averaged.
3.3 Annular core testsMost of the tests at zero power with the fully loaded core, described in the previous chapter,
will, at an earlier stage, also be carried out with the annular core (see Table 1) under the sameconditions. Since the primary system is still depressurized operation of the PGCs is practicallyuseless so that no temperature coefficient can be measured.
3.4 Rise-to-power testsThese tests are mainly license-related. It will have to be assessed that there is a safe
negative reactivity feedback for all reactor power and temperature levels between coldshutdown and high temperature operation (950°C), and that a scram at high temperatureoperation in the prescribed two-step CR insertion manner will result in a safe shutdown at alltimes.
Preparation, initial conditions: The primary system is pressurized, as already for thetemperature coefficient measurements (3.2), and the coolant flow is set to the fixed value of10.2 kg/s (prescribed value for high temperature operation). It will be kept constant at thatlevel until the scram is triggered.
Procedures: At the fixed coolant flow the CR bank will slowly be withdrawn and the reactorpower and temperature increased to 30 MW, 950 °C, respectively with several stationary
intervals. The reactivity difference between the various power and temperature levels will beread from the calculationally corrected integral CR bank worth curve obtained in the zeropower tests (3.2) and related to the respective differences in core power and coolant outlettemperature, thus obtaining values for the power and coolant outlet temperature coefficientsof reactivity.
341

0-
oC3
Reflector rodscran
Core rod scram
Criticality
Subcriticality
0 Time/minReactivity evaluation
40
Section
Case 1
Case 2
a#
Rod drop method
DC method
b
IK method
IK method
C
DC method
DC method
* with delayed integral counting
Fig. 5 Reactivity evaluation methods for the 2-step-scramreactor shutdown procedure
Table 2 Major specifications of the HTTR
Thermal powerCore structureCore equivalent diameterCore heightAverage power densityFuelFuel type
Fuel loadingMaximum fuel temperatureExcess reactivityUranium enrichment
(Average)Fuel bumup (average)Bumup days in a cycleReactivity coefficients
Fuel temperature coefficientModerator temperature coefficientPower coefficient
Prompt neutron lifetimeEffective delayed neutron fractionInlet coolant temperatureOutlet coolant temperaturePower peaking factor
radialaxial
CoolantPrimary coolant pressureCoolant flow in coreEffective core coolant flow rate
30MWGraphite2.3m2.9m2.5W/cmJ
UO,Pin-in-blockCoated Fuel Particle (CFP)off-load. 1 batch1492'C
3- 10wt%about 6wt%22GWd/t660days
-{1.5to4.6)xl<riAk/k/°C(-17.1 to 0.99)x10'5AK/kTC-(2.4 to 4.0)x10'*Ak/k/MW0.67 - 0.70ms0.0047-0.006S395*C8SO*C/950°C
1.11.7Helium gas4MPaDownward88%
342

At high temperature operation (30 MW, 950 °C) a scram will be triggered. At first, only thereflector CRs are dropped. The control system prevents the drop of the core CRs until eitherthe coolant outlet temperature has fallen below 750°C or a time of 40 min has elapsed (CRprotection). After the first scram, the normal core cooling procedure is followed, i.e., the PCS(primary cooling system) is shut down and the ACS (auxiliary cooling system) started up. Themain outcome of this test is, as akeady mentioned above, the confirmation that the reactor isalways subcritical. The scram reactivity of the reflector CRs will be evaluated. Also, it will betried to evaluate the reactivity course between the two scrams as well as the reactivity of thesecond scram. For the evaluation of the first scram, again the two methods, as describedabove, will be employed. The other reactivity changes will be evaluated by the IK method(Fig.5).
4. Conclusions
Although to a great deal related to license requirements the HTTR start-up physics testprogramme is rather comprehensive and includes also some novel evaluation approaches. Itwill contribute to deepen insights into HTGR behavior and deliver important data for annularcore description. In planning tests at power operation, however, some operational restrictions,like the requirement of equal rod withdrawal for reactor power levels >9MW and the fixationof the coolant flow to the full-power operation requirements (850°C or 950°C), had to beobserved. It is hoped that, after a first successful operation period of the HTTR, these regulatoryrestrictions can be reviewed and by that some more interesting testing made available.
References
1. Y. KANEKO et al., "Delayed Integral Counting Method for Rod Drop Experiments", (tobe published)
2. M.Wimmers, P.Pohl, R.Kronchen., "Physikalische Auswertung der Abschaltpause1978/79", AVR (1980)
NEXT PAGE(S)left BLANK
343

STUDY OF A HIGH TEMPERATURE GAS COOLED XA9846692REACTOR HEAT UTILIZATION PLANT
A. IDE, H. HAYAKAWA, T. YASUNO, Y. TAKENAKA, S. HAYASHI,T. KOBAYASffl, S. MAEDA, M. TONOGOUCHI, M. TAKEDA,M. HORIE, K. HAND A, Y. NAKAMURA, M. KANEKO, T. MASUDA,M. IKEHARA, Y. TAKASE, M. ISHIWATARIHTR Heat Utilization Core Group,FAPIG,The First Power Industry Group,Japan
Abstract
A number of nuclear power plants have been successfully constructed andoperating in Japan. The nuclear-generated electricity is expected to be increasing
constantly and to account for 42% of total electricity supply in FY 2010, which is nowabout 30%. Since about 40% of the primary energy supply is consumed for the
electricity production in Japan, the nuclear energy would account for only 20% of theprimary energy supply even if the nuclear-generated electricity could account for 50%of the total electricity supply. In order to preserve the global environment and to securethe stable energy supply, it is most effective to increase the use of the nuclear energy.
However, considering the situation described above, if the nuclear energy is applied
only to electricity generation, the effect is limited. Therefore, it is necessary to utilizethe nuclear energy to wide filed other than the electric power generation. This is veryimportant especially in Japan where most of the energy supply depends on imported
fossil fuels and in the developing countries where the energy demand is increasingrapidly.
From this point of view, FAPIG organized a working group named "HTR-HUC"
(HTR Heat Utilization Core Group) in order to study the heat utilization of HTGR in the
field other than electric power generation. In this study, we considered that the nuclear
heat is utilized most effectively in three fields: in replacing fossil fuel, in producingclean fuels from fossil resources and in producing hydrogen from water as the ultimate
clean energy carrier. We selected the following three types of plants, (D Co-generationPlant: a chemical plant with the modular HTGRs of the outlet temperature of 700°C,
345

(2) Coal Gasification Plant : a coal gasification ammonia production plant with themodular HTGRs of the outlet temperature of 950°C, ® Hydrogen Production Plant :two types of the hydrogen production plants (the thermo-chemical process and the hightemperature steam electrolysis) with modular HTGRs of the outlet temperature up to1050°C.
For each plant, a system outline and basic plan as well as costs, environmentaleffects and management methods were studied. We have presented a paper on the sametopic at the Technical Committee Meeting at Petten on November 28 to 30, 1994. Atthat time, we have mainly explained on the outline of the plant we have chosen for the
study. Now our study has been completed and we would like to present the results ofstudy including additional information we made since the last presentation. We willpresent, in addition to the plant concepts, the results of studies on costs, environmentaleffects and operational and organizational aspects.
1. IntroductionJapan has one gas-cooled reactor and is going to have another gas-cooled reactor.
One is the Tokai Commercial Power Plant (166MWe), which has been in operation forabout 30 years, and the other is the High Temperature Engineering Test Reactor (HTTR),which is under construction and will reach the first criticality in autumn, 1997. FAPIG
joined in the construction of both plants and has been supporting the maintenance of theTokai plant. Through these experiences, FAPIG is confident of the excellent features of
gas-cooled reactors, especially the modular HTGRs.
The modular HTGRs are promising candidate for next generation reactors,
because they can supply high temperature energy up to 1000°C, which allows it to coverover 70% of industrial requirements, and they have various excellent safety features. So
FAPIG organized the HTR-HUC Working Group and has been investigating theintroduction of this type of reactor into industry, especially in process where heat isneeded.
2. Selection of the reference plants
We started this work by getting information on energy consumption in largeenergy consuming plant from the member companies of FAPIG to allow us to makerealistic model plant for the study.
346
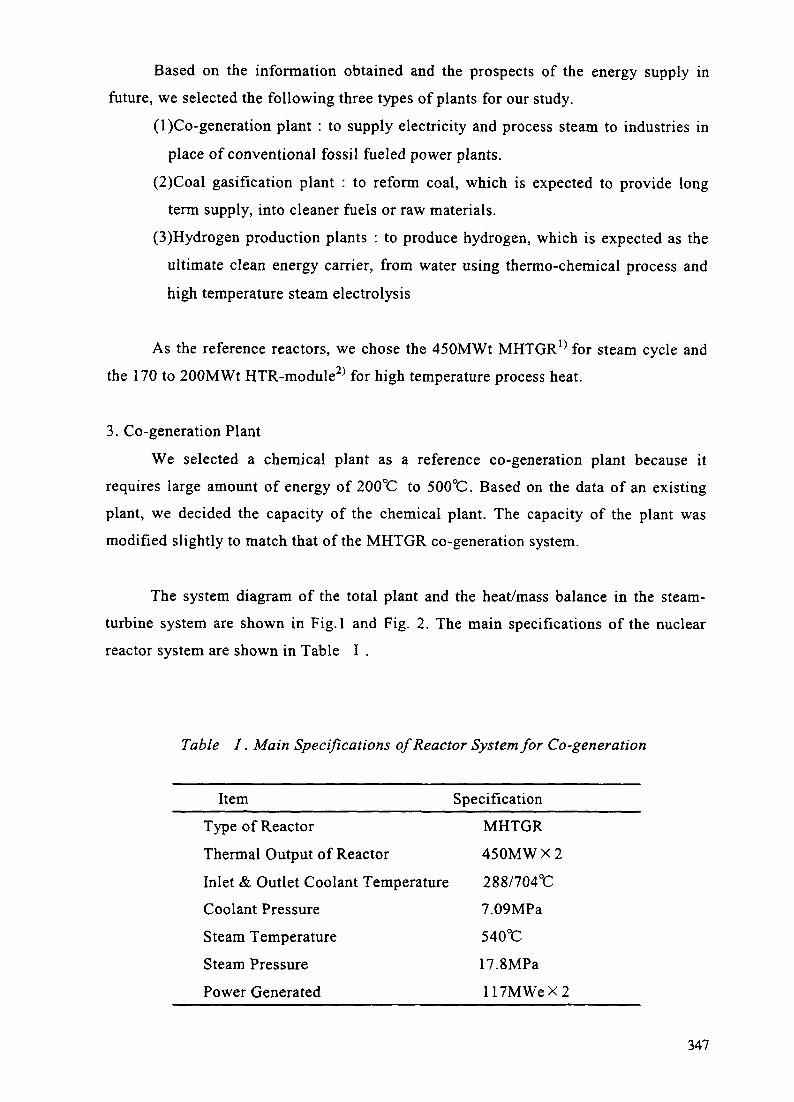
Based on the information obtained and the prospects of the energy supply infuture, we selected the following three types of plants for our study.
(1)Co-generation plant : to supply electricity and process steam to industries inplace of conventional fossil fueled power plants.
(2)Coal gasification plant : to reform coal, which is expected to provide longterm supply, into cleaner fuels or raw materials.
(3)Hydrogen production plants : to produce hydrogen, which is expected as theultimate clean energy carrier, from water using thermo-chemical process andhigh temperature steam electrolysis
As the reference reactors, we chose the 450MWt MHTGR^ for steam cycle andthe 170 to 200MWt HTR-module2) for high temperature process heat.
3. Co-generation PlantWe selected a chemical plant as a reference co-generation plant because it
requires large amount of energy of 200°C to 500°C. Based on the data of an existingplant, we decided the capacity of the chemical plant. The capacity of the plant wasmodified slightly to match that of the MHTGR co-generation system.
The system diagram of the total plant and the heat/mass balance in the steam-turbine system are shown in Fig.l and Fig. 2. The main specifications of the nuclearreactor system are shown in Table I .
Table I. Main Specifications of Reactor System for Co-generation
Item SpecificationType of Reactor MHTGR
Thermal Output of Reactor 450MW X 2Inlet & Outlet Coolant Temperature 288/704°CCoolant Pressure 7.09MPa
Steam Temperature 540°CSteam Pressure 17.8MPaPower Generated 117MWe X 2
347

131MW
Steam Generator
450M«tx2
Caprolactam (290t/D)Ammonium Sullate
(16TOI/0)Nylon (220t/D)
Nitr ic AcidU30t/D)
Sulfuric Acid(1200t/D)
Fig.l. System Diagram ofHTGR Co-generation Chemical Plant
!76ata 54l°C 40ata 334"C STATION LOAD SURPLUS
450MWt-MHTGRx2MODULE
243ata, 1WC
ITSkcal/ka1 1223t/h
_ STEAM_WATER_ELECTRICITY
PRESSURECata]
SPECIFICENTHAU>IE[kcal/kg]
TEMPERATUREPC]
aOIRATE[t/h]
36MWe ELECTRICITY8MWe
x"
kcal/kg
Feed waterpre-heater
260t/h
/kg t/hjCondenserlO.Sata i 220*0686 ' 269t/hkcal/kg
TURBINGENERATEROUTPUT 214MWe
170MWe
PROCESS RETURNen on ED
CHEMICAL PLANT
Fig. 2. Heat/Mass Balance ofHTGR Co-generation Chemical Plant
348

Fig. 3 shows the plot plan of this plant. An area of 800m X 600m is required forthe total system. A bird's-eye view of the plant is shown in Fig. 4.
4. Coal Gasification PlantWe chose ammonia as the product of the coal gasification plant. The coal is
gasified by a steam gasification process with a fluidized bed gasification furnace with agasification temperature of 750°C, and the product gas is supplied to an ammonia plantwith a capacity of 1500 ton/day. The most important subject to be discussed is how touse helium enthalpy most effectively for coal gasification. We adopted a two-stepmethod of gasification in which a pre-reforming fluidized bed uses as much of thehelium energy as possible for gasification.
The main specifications of the nuclear system are shown in Table n . The systemflow diagram is shown in Fig. 5. The main specifications of the ammonia synthesissystem are shown in Table IE.
Fig.6. shows the plot plan of this plant. An area of 430m X 420m is required forthe total system. A bird's-eye view of the plant is shown in Fig. 7.
Table n. Main Specifications of Reactor System for Coal Gasification
Item SpecificationType of Reactor HTR-MThermal Output of Reactor 170MW X 4Inlet & Outlet Coolant Temperature 300/950°C
Coolant Pressure 4.05MPaIntermediate heat exchanger
Primary SecondaryHelium Flow Rate (kg/s) 50.3 47.3Inlet & Outlet
Gas Temperature (°C) 950/292 200/900Inlet & Outlet
Gas Pressure (MPa) 4.04/4.02 4.44/4.25
349

800m
Sea
Fig 3 Plot Plan of HTGR Co-generation Chemical Plant
A a n o n i um•-"Suifate Plant
Fig 4 Bird's-eye View of HTGR Co-generation Chemical Plant
350
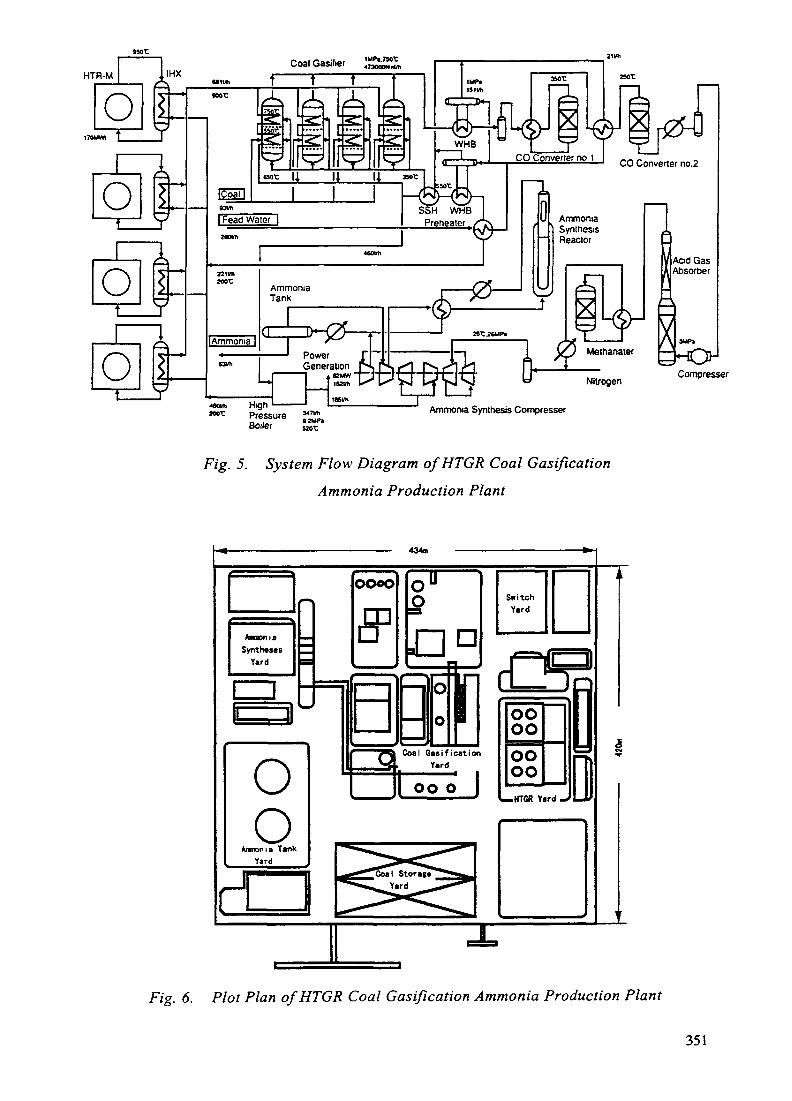
HTR-M
CO Convener no 1 __ »———-—s—————' CO Convener no.2
Ammonia Synthesis Compresser
Fig. 5. System Flow Diagram ofHTGR Coal Gasification
Ammonia Production Plant
Fig. 6. Plot Plan ofHTGR Coal Gasification Ammonia Production Plant
351
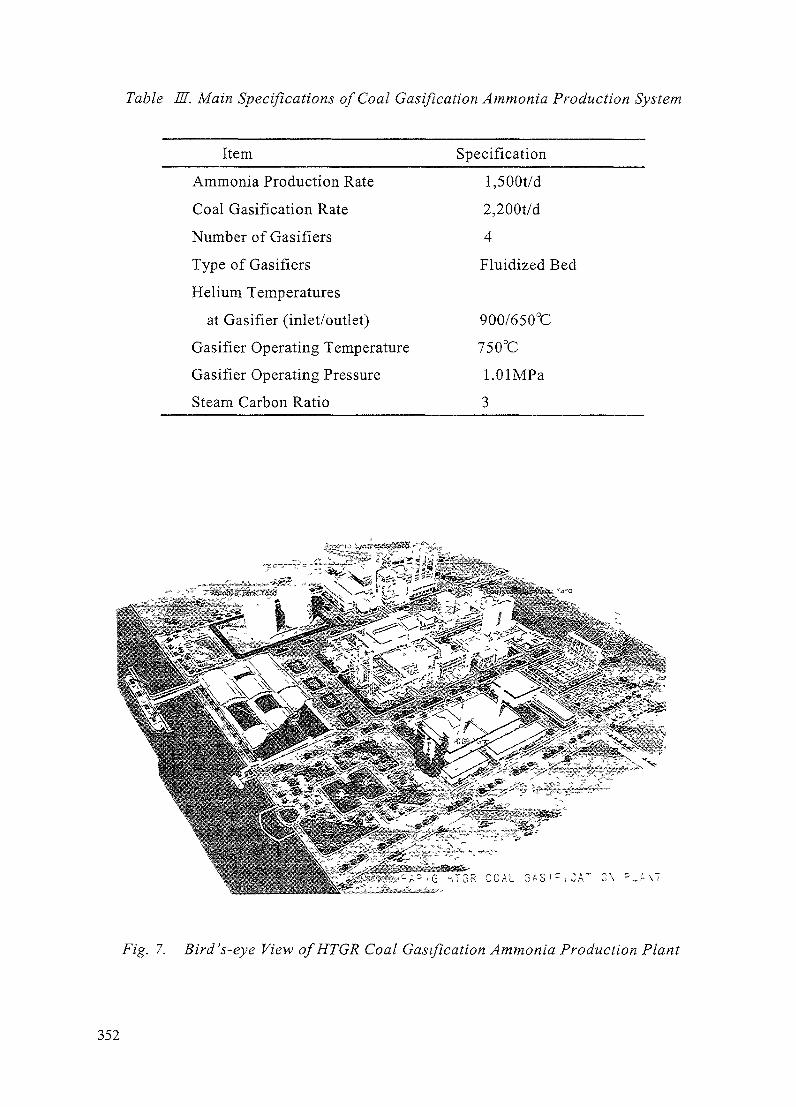
Table US. Main Specifications of Coal Gasification Ammonia Production System
Item Specification
Ammonia Production Rate
Coal Gasification Rate
Number of Gasifiers
Type of Gasifiers
Helium Temperatures
at Gasifier (inlet/outlet)
Gasifier Operating TemperatureGasifier Operating Pressure
Steam Carbon Ratio
l,500t/d2,200t/d
4
Fluidized Bed
900/650°C750°C
l.OlMPa3
7. Bird's-eye View ofHTGR Coal Gasification Ammonia Production Plant
352

5. Hydrogen Production Plant
A hydrogen production system using the nuclear heat from HTR-Ms has been
studied. This study is based on the state-of-the-art engineering expertise expected toexist 30 years from now. In this study we selected the Iodine-Sulfur (IS) process and thehigh temperature steam electrolysis process.
The IS plant is composed of four nuclear reactors and one IS process, which isconnected to the reactors through IHXs, because of the complexity of secondary systemssuch as chemical reactors. Fig. 8 shows the flow diagram of the IS plant.
The high temperature steam electrolysis plant is composed of four nuclearreactors, four high temperature steam electrolysis processes and one gas turbine powergenerator. Fig. 9 shows a block diagram of this system.
Table IV shows the main specifications and performance of the IS and hightemperature steam electrolysis hydrogen production plant.
Table IV. Main Specifications of Hydrogen Production plant
High TemperatureItem IS Process Steam Electrolysis Process
Nuclear Reactor (units)
Thermal Power (MWt)Hydrogen Production
Process
Combined Process using
Low Temperature Heat
Hydrogen Production Rate
(Nm3/hr)Electric Power (MWe)Hydrogen Production
Efficiency (%)
4
800IS Process
1 SystemSG1 unit
37,090
(20,400)*
50.8
40 (22)*
4
800
ElectrolysisCell
4 SystemGas turbine
1 unit
110,000
21.4
49Plant Thermal Efficiency (%) 34 51
""numbers in parenthesis are deducted by laboratory results
353

MHTCR
Oi
IbO
Fig. 8. System Flow Diagram of IS process for Hydrogen Production
H T G R
ZOOMWt
x 4
He
1 0 5 0°C
High TemperatureSteam ElectrolysisProcess
Hydrogen
HO.OOONmVhr
He
8 5 0°C
Gas TurbineSystem
Electricity
Z43MWe
4 9 0°C
Fig. 9. Block Diagram of High Temperature
Electrolysis Hydrogen Production Plant *
354
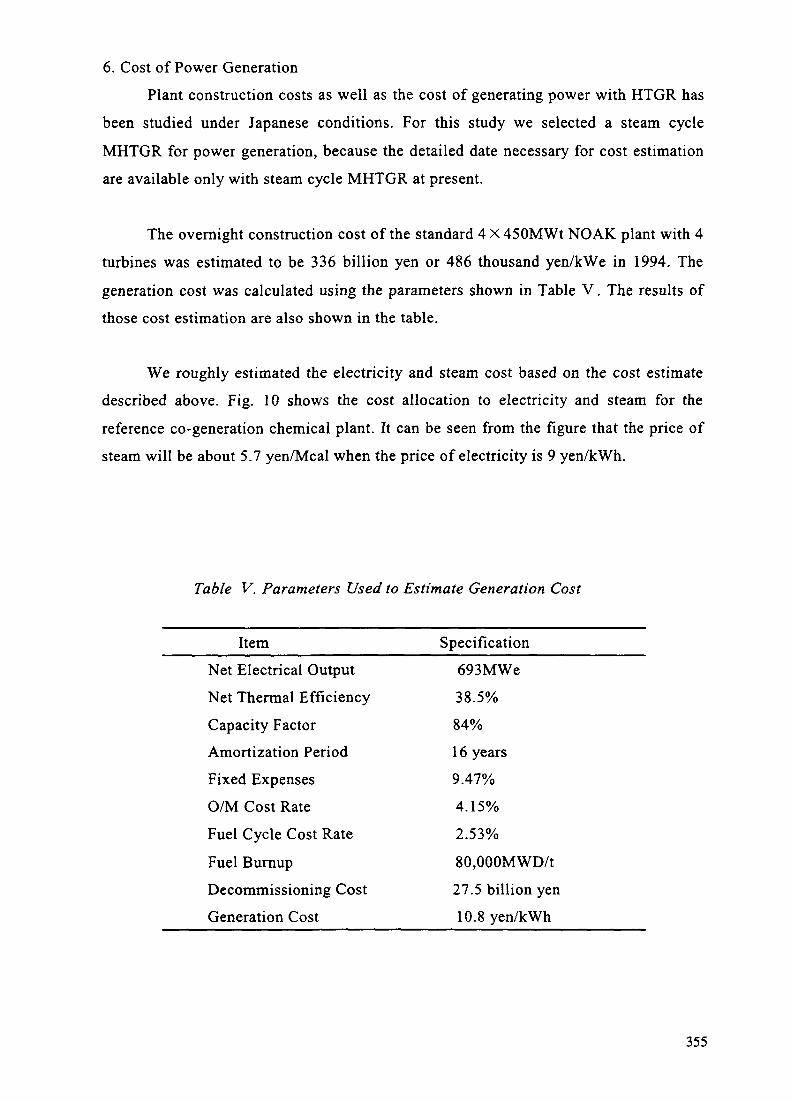
6. Cost of Power Generation
Plant construction costs as well as the cost of generating power with HTGR has
been studied under Japanese conditions. For this study we selected a steam cycle
MHTGR for power generation, because the detailed date necessary for cost estimationare available only with steam cycle MHTGR at present.
The overnight construction cost of the standard 4 X 450MWt NOAK plant with 4
turbines was estimated to be 336 billion yen or 486 thousand yen/kWe in 1994. The
generation cost was calculated using the parameters shown in Table V. The results ofthose cost estimation are also shown in the table.
We roughly estimated the electricity and steam cost based on the cost estimatedescribed above. Fig. 10 shows the cost allocation to electricity and steam for the
reference co-generation chemical plant. It can be seen from the figure that the price ofsteam will be about 5.7 yen/Meal when the price of electricity is 9 yen/kWh.
Table V. Parameters Used to Estimate Generation Cost
Item Specification
Net Electrical Output 693MWe
Net Thermal Efficiency 38.5%
Capacity Factor 84%Amortization Period 16 yearsFixed Expenses 9.47%O/M Cost Rate 4.15%
Fuel Cycle Cost Rate 2.53%
Fuel Burnup 80,OOOMWD/tDecommissioning Cost 27.5 billion yenGeneration Cost 10.8 yen/kWh
355
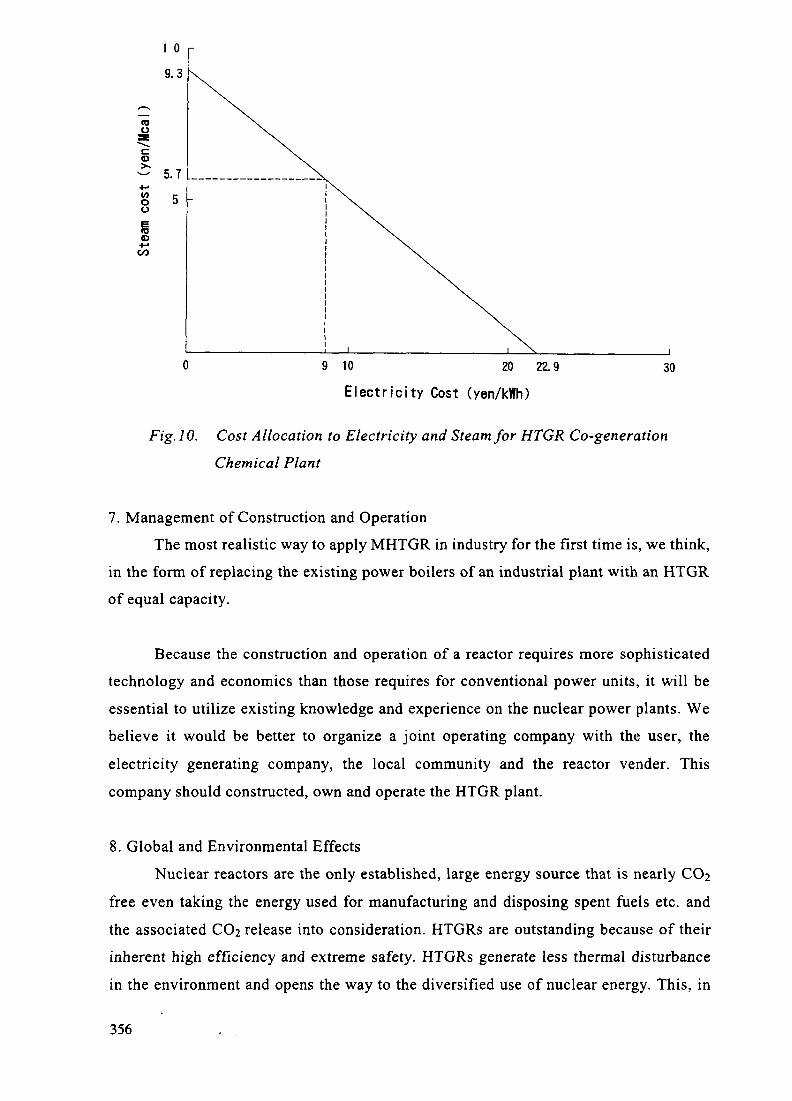
<oo
93>•
V)Oo
9 10 20 22.9
Electricity Cost (yen/kHh)
30
Fig. 10. Cost Allocation to Electricity and Steam for HTGR Co-generation
Chemical Plant
7. Management of Construction and OperationThe most realistic way to apply MHTGR in industry for the first time is, we think,
in the form of replacing the existing power boilers of an industrial plant with an HTGRof equal capacity.
Because the construction and operation of a reactor requires more sophisticatedtechnology and economics than those requires for conventional power units, it will beessential to utilize existing knowledge and experience on the nuclear power plants. Webelieve it would be better to organize a joint operating company with the user, the
electricity generating company, the local community and the reactor vender. Thiscompany should constructed, own and operate the HTGR plant.
8. Global and Environmental EffectsNuclear reactors are the only established, large energy source that is nearly
free even taking the energy used for manufacturing and disposing spent fuels etc. andthe associated COa release into consideration. HTGRs are outstanding because of theirinherent high efficiency and extreme safety. HTGRs generate less thermal disturbance
in the environment and opens the way to the diversified use of nuclear energy. This, in
356

turn, opens the way for developing countries and smaller utilities or industries to select
a reactor as an energy source. This means that HTRs can contribute to widening therange of available energy sources, to conserve the environment and preserve fossil fuels.
In the case of the reference co-generation plant, replacing the coal fired boiler ofthe chemical plant with 2 X 450MWt MHTGRs with steam generators will allow about
160 ton/h of coal to be saved and will reduce COj emissions by about 2.6 millionton/year. For the reference coal gasification ammonia production plant, the amount ofCC>2 emission is reduced by about 2.1 million ton/year than that from the current coal
fired gasification plant (with a partial combustion process).
9. ConclusionThe used of the heat of HTGRs was studied in three fields of application: co-
generation, coal gasification and hydrogen production. We studied the cost of HTRs forpower generation and co-generation and found the possibility of competitiveness withLWRs in small medium sized power plants. Our results have convinced us HTGRs have
possibility of the reasonable competitiveness in the market for heat for industrial use.
Because HTRs can provide various industries with high temperature nuclear heat, webelieve that the development of HTR will benefit the prosperity of the world.
REFERENCES
1) Conceptual Design Summary Report Modular HTGR Plant, DOE-HTGR-87-092,
September 19872) Leuch et.al., Modular high temperature reactor for various applications, Kerntechnik
52 No.2, 96-1003) Proceeding of the 2nd Technical Meeting on High Temperature Gas-Cooled Reactor
Study, JAERI-M-92-090
NEXTPAGE(S)left BLANK
357
TEST PROGRAMMES OF HTTR FOR FUTURE GENERATION HTGRs
K. KUNITOMI, Y. TACHTOANA, T. TAKEDAA. SAIKUSA, S. SHIOZAWA XA9846693Japan Atomic Energy Research Institute,Oarai-machi, Ibaraki-ken,Japan
Abstract
Test programs of the High Temperature Engineering Test Reactor (HTTR) for futuregeneration High Temperature Gas-Cooled Reactors (HTGRs) have been established consideringdesign and development status of HTGRs in Japan and the world. Test programs are divided intosix categories, thermal hydraulics, fuel, safety, high temperature components, core physics andcontrol- instrumentations. All programs are related to the technology of future generation HTGRsand-will be submitted to a new Coordinated Research Program (CRP) so that all participants fromthe world in test programs of the HTTR can use measured data for their future generation HTGRs.
This paper describes test programs of the HTTR for the development of future generationHTGRs after explanation of a future generation HTGR in Japan.
1. IntroductionA High Temperature Gas-cooled Reactor (HTGR) is expected to be of prime importance for
broadening nuclear energy use in the future because it would supply high temperature heat andhave high thermal efficiency, outstanding inherent safety characteristics and high fuel burn-up.Design and development of future generation HTGRs have been conducted in many countries.Recently, in South Africa, Netherlands and China, practical design works have been performedfor the development of commercial HTGRs. In Japan, the High Temperature Engineering TestReactor (HTTR) at Oarai Research Establishment of Japan Atomic Energy Research Institute(JAERI) is at a final stage of construction, and after its first criticality in October 1997, variouskinds of tests under high temperature conditions will be conducted for future generation HTGRs.hi addition to the construction of the HTTR, design studies of future generation HTGRs have beenstarted.
HTGRs have several advantages in safety concept. An Advanced Light Water Reactor (ALWR)is designed based on passive safety concept and accident managements to prevent or mitigatesevere accidents causing core melt down. On the other hand, HTGRs can achieve the same or higherdegree of safety using simpler passive systems and prevent or minimize risk of severe accidentsbecause of their salient inherent safety features. In a severe accident free HTR (SFHTR)[1], highdegree of safety is achieved due to the high fuel performance, negative temperature coefficient, low
359
power density and large heat capacity of the core, inert and single phase characteristics of heliumcoolant, etc. No severe accidents occur even in the worst scenario.
However, in previously designed HTGRs, safety is confirmed by their safety analyses andprobabilistic safety assessments. In contrast, L. M. Lidsky in Massachusetts Institute ofTechnology proposed demonstarable safety [2]. Demonstrable safety is essential for publicacceptance and licensing because the public has little trust in probabilistic safety assessments, andexperience in HTGR history is not enough to convince the regulatory of trusting these safetyassessments. Safety must be demonstrated by nearly full-scale worst case test. In the SFHTR,nearly full-scale worst case tests (safety demonstration tests) will be carried out to obtain licensingbefore commercial operations.
The High Temperature Engineering Test Reactor (HTTR)[3] is the best reactor to demonstratepassive safety systems designed for HTGRs such as a vessel cooling system (core cavity coolingsystem) work well and to confirm safety demonstration tests can be carried out in the SFHTR.Also various tests concerning fuels, high temperature components for future generation HTGRswill be conducted. In this paper, first a conceptual design of the SFHTR is described and then testprograms of the HTTR for future generation HTGRs are presented in section 3 except a testprogram for core physics presented in another issue in this conference[4].
2. Conceptual design of SFHTR2.1 Safety concept of SFHTR
There are two types of SFHTRs, modular SFHTR (MSFHTR) and small SFHTR (SSFHTR).Both SFHTRs are designed based on the same safety concept. Severe accidents are defined as anyconditions beyond designed base accidents causing core damages with the large amount of fissionproduct releases to the environment although all severe accident sequences are very low inprobability. The safety concept of the SFHTR is to avoid or minimize the risk of severe accidentsat least two orders lower than current reactors. In the SFHTR fuel temperature rise exceeding itslimit by complete loss of forced coolant (depressurization accident) without scram or control rodcomplete withdrawal can be avoided because of large heat capacity of the core and low powerdensity. To prevent the risk of fuel oxidation, the development of no-burning fuels is inevitable,and several laboratory scale tests have been started in JAERI. However, in the first design stageof the SFHTR a confinement containing inert gas is installed to prevent fuel oxidation duringdepressurization accidents.
Furthermore, nearly full-scale worst tests will be carried out to obtain licensing before commercialoperations. Fig. 1 shows the difference between the licensing procedure of the HTTR or currentreactors and the SFHTR.
360

f Future generation HTGRJ HTTR
I Safety demonstration test I
Inspection before operation
Construction permit
Evaluation for design and construction
InstalI at ion permit
Safety evaluation
Inspection before operation1Construction permit
Evaluation for design and construction'
InstalI at ion permit
Safety evaluation
Fig. 1 Licensing procedure for future generation HTGR and HTTR
Stand Pipe
/Reactor Pressure Vessel
/ Replaceable Reflector Blocks\
Fuel Blocks
^Primary PipeFig. 2 Vertical and horizontal cross sectional views of the modular SFHTR
361

OJ OV
REPL
ACEA
BLE
REFL
ECTO
R BL
OCK
PERM
ANEN
T RE
FLEC
TOR
BLOC
K
CONC
RETE
BIO
LOG
ICAL
SHI
ELD
Core
Heig
ht(m
)TO
'O
J -rt 1 VI g- S*'
& o •n

Fuel rod-
2500
2000
1500
S. 1000ECDH 500
I ' I 'Reactor Power : 450 MWOutlet Temperature : 950°C
Allowable limit=1800°C
Allowable limit=550TRPV temperature
0 50 100Time(h)
150
Fig. 5 The maximum fuel temperature transient during depressurization accident
Coolont .Graphite block
I
oo
\/
\
o
Cross-section of HTTR fuel assembly Equivalent cylinder Analytical model for code
Fig. 6 Analytical model for reactivity addition accident by BLOOST-J2
363

Table 1 Major Specification of modular and small SFHTR
Thermal OutputOutlet Gas Temp.Inlet Gas Temp.Helium Gas Press.Fuel blockFuelPower densityFuel coating materialBurn-upAllowable Temp.Refueling
Internal GraphiteControl rod clad materialPressure VesselSafety SystemConfinementUtilization System
Plant Life Time
SmallMax. 200MWt
Modular450MWtx 4 Unit (Commercial)
850-950°C350-550°C6.0 MPaPrismatic BlockLow Enriched Uranium
Average 6 w/ccZrC
lOOGWd/t1800°C
Axial shufflingRefueling every year
ISO-63C/C composite9Cr-lMo-VComplete Passive CoolingInert gas
Gas Turbine or Gas TurbineHydrogen production & desalination
& district heating40 years
2.5 w/cc
150GWd/t
1-2 timesduring life time
2.2 Design study of SFHTR2.2.1 Modular SFHTR2.2.1.1 Core design
Table 1 shows major specification of the MSFHTR. The core consists of 108 columns (fiveblocks in each column), and annular arrangement (see fig. 2) is adopted to prevent fuel temperatureincrease during depressurization accidents. A pin-in block type fuel (see fig.6), in which diameterof fuel rods, the number of fuel rods, width of the flow path around fuel rods etc. are modified fromthose of the HTTR, is piled up inside the core.
Nuclear design codes DELIGHT[5] and CITATION[6] verified for the HTTR design are usedto obtain power distribution and fuel bumup. The fuel temperature is calculated using the power
364

Table 2 Fuel burnup after 5 years operation of modular SFHTR
Items
1st fuel block (top)
2nd fuel block
3rd fuel block
4th fuel block
5th fuel block(bottom)
Inner ring
65
72
117
116
131
123
133
123
138
131
Intermediate ring
53
57
94
92
107
98
108
98
111
104
Outer ring
51
56
93
92
106
98
108
93
111
105Unit (GWd/t)
Table 3 Fuel bumup after 15 years operation of small SFHTR
Items
Top fuel block
2nd fuel block
3rd fuel block
4th fuel block
5th fuel block
6th(bottom)
Center
52
119
154
172
154
141
Ringl
45
119
161
184
164
149
Ring 2
29
91
131
159
139
123
Ring 3
26
91
138
167
150
130Unit (GWd/t)
distribution obtained from nuclear analyses by these codes. Fig. 3 shows the calculated maximumfuel temperature distribution during normal operations. The maximum fuel temperature is lowerthan the temperature limit of 1500°C during normal operations. Table 2 shows the fuel burnupafter operations. Average burnup is more than lOOGWd/t because of axial shuffling[7]. In theaxial shuffling, the fuel blocks and top reflector blocks in a column are removed by a refuelingmachine. The fuel block in the core bottom is removed from the core and a new fuel block is setat the top. A fuel cycle is five years and 1/5 of total fuel blocks are refueled.
365

2.2.1.2 Safety evaluationIn the HTTR safety evaluations, various analyses were carried out to obtain fuel temperatures,
boundary temperatures, boundary pressures and so on. According to the results of the HTTR safetyevaluations, the two worst events that have a possibility to cause fatal fuel failure are selected inthe safety analyses for the SFHTR. They are a depressurization accident characterized by a primarypipe rupture, and an abrupt reactivity addition by a stand pipe rupture.(1) Depressurization accident
The two-dimensional heat transfer code TAC-NC [8] is used for analyzing temperature transientduring depressurization accidents. An analytical model for the core, internal structure, ReactorPressure Vessel (RPV) and so on shown in Fig. 4. The major features of the analytical model areas follows;1) Two-dimensional time dependent heat conduction equation is solved.2) Radiation and convection heat transfers are also considered.3) Heat transfer by natural circulation can be solved.
Fig. 5 shows the maximum fuel temperature transient during the depressurization accident. Itdoes not exceed the temperature limit of 1800°C.(2) Reactivity addition accident
The core dynamics code BLOOST-J2 [9] is used for analyzing fuel temperature transient duringthis accident. Fuel elements and blocks are represented by an equivalent cylindrical single channelshown in Fig. 6. The major features of the analytical model are as follows;1) A one point kinetics equation with six groups of delayed neutron precursors is solved in the coredynamics.
Max
imum
Fue
l Tem
pera
ture
(°(-^
-»
• ro
K
o
o\
o
co
o
o
c_0
0
0
C
' 1 ' 1 ' 1 ' 1 'Reactivity Addition Time:0.1sec
• Initial Temperature."! 349*c Elapsed Time3.4sec
" Elapsed TimeElapsed Time 9-Osec
140sec
i , i , i , i ,) 0.2 0.4 0.6 0.8 1
Reactivity Addition (% A K/K)
Fig. 7 Relationship between reactivity and maximum fuel temperature
366
2) Two-dimensional time-dependent heat conduction equation is solved.3) One-dimensional quasistatic heat transfer equation is solved for the primary coolant.4) Heat generation due to nuclear fission reaction in the UO2 fuel kernel of a coated fuel particleis assumed to be generated uniformly in the fuel compact because the heat generated in the fuelkernel is conducted instantly to the graphite matrix around the fuel particle.
The analysis is carried out as a parameter of the reactivity addition. The reactivity is assumedto be added within 0.1 seconds. Fig. 7 shows the relationship between the maximum fueltemperature and the reactivity addition.
The analysis proved that even when 0.7 %Ak/k of reactivity is added, the fuel temperature doesnot exceed the limit temperature. The excess reactivity of the MSFHTR is designed not to exceedthe 3-5%Ak/k, and 10 pairs of control rods are installed in the core. Therefore, if a pair of controlrods is withdrawn from the core, the maximum reactivity addition is 0.3-0.5%Ak/k and the fueltemperature is approximately 1660°C.
2.2.2 Small SFHTRThe small SFHTR(SSFHTR) is designed to be appropriated for a remote area not having electrical
network. Its thermal power is at most 200MWt and used for dedicated applications such asdesalination, district heating as well as electricity generation. Table 1 shows the major specificationof the SSFHTR. The most important issues to be considered in designing the small SFHTR is thatit must be modularised easily and constructed in a shorter time than larger plants, thus reducingits capital cost, however it has higher safety and severe accidents will never occur. The problemof block type HTGRs such as the HTTR is that they need a large size complicated refueling machine.It raises capital cost and makes availability low. Therefore, a fuel cycle of the small SFHTR isdesigned to be more than 15-20 years with a discharged bumup of 150MWd/t so that each plantneed not its own refueling machine. In our preliminary design study of the SSFHTR with SOMWt,it is confirmed that a fuel cycle of 17 years is possible. Table 3 shows fuel burnup after operationscalculated by the DELIGHT and CITATION. The maximum power density is kept lower than9w/cc in this case so that the maximum fuel temperature does not exceed the temperature limit.More than 20 years are feasible in the final design after optimizing the amount of burnable poison(BP), location of BP, fuel enrichment and so on. In the next year, safety evaluations duringdepressurization and reactivity addition accidents without scram will be carried out to confirm thesafety of the SSFHTR.
3. Test programs of HTTR for SFHTR and future generation HTGRs in the world3.1 Objectives
Test programs of the HTTR for future generation HTGRs have been established consideringdesign and development status of HTGRs in Japan and the world. Test programs are divided into
367

six categories, safety, thermal hydraulics, fuel, high temperature components, core physics andcontrol-instrumentations. All programs are related to the technology of future generation HTGRsand will be submitted to a new Coordinated Research Program (CRP) so that all participants fromthe world to the HTTR tests can use measured data for their future generation HTGRs.
3.2 SafetyIn the safety demonstration tests [10] by using the HTTR, the postulated worst two events in
the SFHTR are simulated. They are a loss of forced cooling accident (depressurization accident)and control rod withdrawal accident simulation. The safety demonstration tests will be started in1998 in order to confirm the safety concept of the SFHTR and the other future generation HTGRs.
3.2.1 Loss of forced cooling accident simulation(partly licensed)This test simulates conduction cooldown behavior during depressurization accidents. In this test,
circulators for a primary cooling system stop at a rated power operation, and no active direct corecooling system starts after that. During depressurization accidents in the SFHTR, the naturalcirculation occurs in the RPV and transfers heat from the core to outside. On the other hand, thistest cannot simulate the natural circulation because a guillotine break of the primary pipe cannotbe simulated. However, the flow rate of the natural circulation is low in low pressure conditionand heat transfer by the natural circulation is limited. It is already confirmed that the maximum fueltemperature between the depressurization accident with and without the natural circulation is notdifferent in the HTTR safety analysis.
3.2.2 Control rod withdrawal accident simulation(partly licensed)This test simulates the fuel temperature rise by reactivity addition. In a preliminary test, a pair
of control rods is withdrawn from the core by a control drive mechanism. In a secondary test, acapsule containing a reactivity absorption material such as B4C ball is installed in the center of thecore and immediately ejected from the core.
The maximum fuel temperatures during both simulation tests are measured by the temperaturemonitoring elements installed in the fuel blocks.
heat removalIn HTGRs, even in depressurization accidents and no direct core cooling is expected, the core
temperature does not exceed its temperature limit. A passive heat removal system (Vessel CoolingSystem (VCS) in the HTTR) installed around the RPV removes the heat from the RPV by radiationand natural convection and keeps the core temperature lower the temperature limit (see fig. 5).
368

In the HTTR, the amount of heat transfer from the RPV to VCS will be measured in 0, 30, 50,100% of rated power condition and transient condition after a reactor scram. RPV and VCStemperatures will be also measured to confirm that there is no hot spot on the RPV and to evaluatehow much amount of heat is transferred by radiation or by natural convection.
In addition to above tests, a plan to change the water cooling VCS to a complete passive aircooling VCS has been studied for tests in future. The best system to cool the reactor core and keepthe fuel temperature lower than the limit will be selected after these tests.
3.4 FuelDuring the start-up and normal operation, the following tests are planned concerning
investigation of fuel and fission product behavior.(1) Initial fuel performance test
Performance of the first loading fuel of the HTTR will be examined by fractional releases ofgaseous fission products.(2) Fuel temperature measurement test
Fuel temperature will be measured by melt wires. The validation of the temperature calculationcodes is carried out by comparison of the measured and calculated temperatures.(3) Fission product plateout measurement test
The release fractions and plateout distribution of condensable fission products will beinvestigated by the measurement of plateout distribution in the primary cooling system of the HTTR.(4) Organic iodine measurement test
Fractions of organic iodine in the HTTR will be measured by sampling of the primary coolantas a function of coolant temperatures during the power up test. Based on measured data,mechanism of the organic iodine formation in the HTGR system will be investigated.(5) Dust sampling test
Dust in the primary coolant will be source term in depressurization accidents of the HTGR.Amount, composition and size of dusts will be measured and basic data will be accumulated duringthe start up test of the HTTR.
After tests for initial loading fuels, tests for ZrC coated fuel specimen will be conducted.
3.5 Thermal hydraulicsAs for thermal hydraulics, a total code system to evaluate temperatures of fuel and internal core
structures will be developed and validated in the HTTR. This code system would be used to designfuture generation HTGR in the Japan and world. It includes steady-state fuel temperatureevaluation code (FLOWNET[11], TEMDIM[12]), in-core transient heat transfer analysis code(TAC-NC[8], SSPHEAT[13]) and plant dynamic code (ACCORD[14]). During operations, direct
369
comparison between experimental and analytical fuel temperatures cannot be conducted becausefuel temperature is too high to be measured. However, inside and outside temperatures of permanentreflector blocks around the reactor core, inlet and outlet helium gas temperature, helium gastemperatures in hot plenums, etc. will be measured and these experimental data will be useful for
validation of fuel temperature evaluation codes. After operations, temperature monitors installedin fuel blocks will be removed, and analytical and experimental fuel temperatures will be directlycompared.
Also dynamic tests such as step and ramp change of thermal power, reactor scram and so on willbe carried out to validate plant dynamics codes and in-core transient analysis code.
3.6 Control-instrumentationTests concerning an adaptive neural network methodology will be conducted to investigate its
applicability to HTGRs and reliability. In this test, real time operational data in the HTTR are sentto a neural network system. Researchers for this system find abnormal events in the HTTR withoutany information from operators for the HTTR.
3.7 High temperature componentsAn intermediate heat exchanger (IHX) was newly developed for the HTTR. Thermal
performance tests in steady state condition will be carried out to obtain heat transfer coefficient inthe tube side, heat transfer coefficient on the shell side, over all heat transfer characteristics,temperature of manifold, heat transfer tube, radiation promoter effect, etc. Also in transientcondition, temperature of manifold, heat transfer tube, etc. will be measured, and stress and strainevaluation using real temperature will be conducted to investigate deterioration of thermalperformance after the first high temperature operation to prolong life time.
4. SummaryIn the HTTR, various tests will be performed for the development of future generation HTGRs
in the world and Japan. Test programs and test results are open to the world and are extremelyimportant to the HTGR development because the other HTGRs are not operating except the HTR-10 in China will be operated in the near future. Especially, it is important to confirm safetydemonstration tests are feasible using reactor itself and demonstrable safety concept of the SFHTRcan be accepted for licensing of future generation HTGRs.
370

Acknowledgement
The authors would like to thank Mr. Watanabe and Mr. Nakata in Kawasaki Heavy Industriesfor their kind supports concerning about nuclear calculations of the MSFHTR. The authors wouldalso like to express their gratitude to Prof. Lidsky in Massachusetts Institute of Technology and Mr.Tanaka in Department of HTTR project in JAERI for their useful comments and supports.
References
[I] K. Kunitomi, et al., "Future Prospects for Advance HTGRs -Survey of Future PromisingHTGRs-", Development Status of Modular HTGRs and Their Future Role, Proceeding ofan IAEA Technical Committee Meeting held in Petten, p290-304, The Netherlands, (1994).
[2] L. M. Lidsky, "Nuclear Power in a World With Options", Symposium on (R)EvolutionaryReactor Types, Ultra-Centrifuge Netherlands N. V., Almelo NL. (1991).
[3] S. Saito, et al., "Design of High Temperature Engineering Test Reactor (HTTR)", JAERI1332, (1994).
[4] N. Nojiri et al., "Characteristics of HTTR's Start-up Physics Tests", to be presented in TCMin Johannesburg, South Africa, (1996).
[5] K. Yamashita and R. Shindo, "DELIGHT-6(revised); One dimensional lattice burnup codefor high temperature gas-cooled reactors", (in Japanese), JAERI-M 85-163, (1985).
[6] H. Harada et al and K. Yamashita, "The reactor core analysis code CITATION 1000VP forhigh temperature engineering test reactor",(in Japanese), JAERI-M 89-135, (1989).
[7] K. Yamashita et al., "Upgrading of High Temperature Engineering Test Reactor (HTTR)'sCore Performance by Axial Shuffling of fuel blocks", ICONE-3 p!077-1082, Kyoto, (1995)
[8] K. Kunitomi et al., "Depressurization Accident Analysis for the HTTR by the TAC-NC",Energy Vol. 16, No. 1/2, P471-489, (1991).
[9] Nakagawa et al., "Reactor Kinetics Code BLOOST-J2 for the HTGR" (in Japanese), JAERI-M89-013, (1989).
[10] K. Kunitomi et al., "Safety Demonstration Test and its Safety Analysis"(in Japanese),JAERI-M 90-070, (1990).
[II] S. Maruyama et al., "Verification of invessel thermal and hydraulic analysis code FLOWNET"(in Japanese), JAERI-M 88-138, (1988).
[12] S. Maruyama et al., "Verification of fuel temperature analysis code TEMDIM"(in Japanese),JAERI-M 88-170, (1988).
[13] I. loka et al., "Three-Dimensional Thermal Analysis Code for In-core Test Section (T2) ofHENDEL -SSPHEAT-"(in Japanese), JAERI-M 88-032, (1988).
[14] T. Takeda et al., "Development of Analytical Code ACCORD for Incore and Plant Dynamicsof High Temperature Gas-cooled Reactor"(in Japanese), JAERI-Data/Code 96-032, (1996).
I NEXT PAGE(S) I 371left BLANK I
PRESENT STATUS OF INITIAL CORE XA9846694FUEL FABRICATION FOR THE HTTR
N. KITAMURA, K. WATARUMI, K. SATONuclear Fuel Industries Ltd,Naka-gun, Ibaraki-ken
K. SAWA, S. SHIOZAWA, T. TANAKAJapan Atomic Energy Research Institute,Oarai-machi, Ibaraki-ken
Japan
Abstract
This paper describes present status of initial core fuel fabrication for the HTTR in Japan.The High Temperature Engineering Test Reactor (HTTR) is being constructed satisfactorily,
aiming the first criticality in October 1997. Fuel fabrication for the HTTR was started in June1995 at Tokai works of Nuclear Fuel Industries, Ltd. (NFI). The fabrication technologies havebeen developed through cooperation works of NFI and Japan Atomic Energy Research Institute.
The initial core fuel of the HTTR consists of 150 fuel assemblies. An HTTR fuel assembly isso-called a pin-in-block type of hexagonal graphite block containing 31 or 33 fuel rods. A fuelrod consists of a graphite sleeve and of 14 fuel compacts. In a fuel compact about 13,000 TRISOcoated fuel particles are dispersed densely.
Fabrication of the fuel is being carried out at NFI's facility, and a half of the initial fuels havebeen completed. The results of inspection for the size, the density and the sphericity of coated fuelparticle, and the as-manufactured particle failure fractions in fuel compacts, which are mostimportant inspection items from the view point of quality assurance, are quite satisfactory.
Transportation and assembling of the fuel rods will be carried out at the reactor site from themiddle of 1997.
1. IntroductionThe High Temperature Engineering Test Reactor (HTTR), which is the first High Temperature
Gas-cooled Reactor (HTGR) in Japan, is now being constructed at the Oarai ResearchEstablishment of Japan Atomic Energy Research Institute (JAERI) and the first criticality isplanned to be attained in October 1997. After the completion, it will be the only HTGR underoperation in the world. Also, it will be the first HTGR that will demonstrate the high
temperature nuclear heat utilization.
373

U02 kernelHigh density PyC
SiCLow density PyC
8mmr39mm
Rib PlugDowel pin
Fuel handling hole
Fuel/compact
.Graphitesleeve
Fuel compact Fuel assembly
Fig. 1 The HTTR fuel configuration
Nuclear Fuel Industries, Ltd. (NFI) started the fabrication of initial core fuel for HTTR in June1995, and has finished about a half amount of fabrication of the total fuel. The fabrication of allfuels, about 900 kgU fuels, will be completed in the end of 1997.
2. Fuel Fabrication2.1. Fuel Design(1)
The initial core fuel of the HTTR consists of 150 fuel assemblies. An HTTR fuel assembly isso-called a pin-in-block type of hexagonal graphite block containing 31 or 33 fuel rods. A fuelrod consists of a graphite sleeve and of 14 fuel compacts. In a fuel compact, about 13,000 TRISOcoated fuel particles are dispersed densely. The fuel configuration is shown in Fig.l.
The fuel temperature is limited below 1495°C under normal operation conditions and below1600°C under abnormal transient condition. The fuel burnup is limited to be 3.6% FEMA as forthe HTTR initial core fuel. The safety design criteria for the initial core fuel are as follows.
(1) The initial failure fraction in the coating layers of the fuel fabrication shall be regulatorilyless than 0.2% in terms of the sum of heavy metal contamination and SiC defects, while theexpected one is less than W4.(2) The coated fuel particles shall not fail systematically under normal operating conditions,that is, in the safety analyses,
(a) The penetration depth of the Pd/SiC interaction shall not exceed the thickness of SiClayer of 25 \i m, because the full-penetrating Pd/SiC interaction is thought to lead loss offission fabrication retention in SiC coating layer.
374
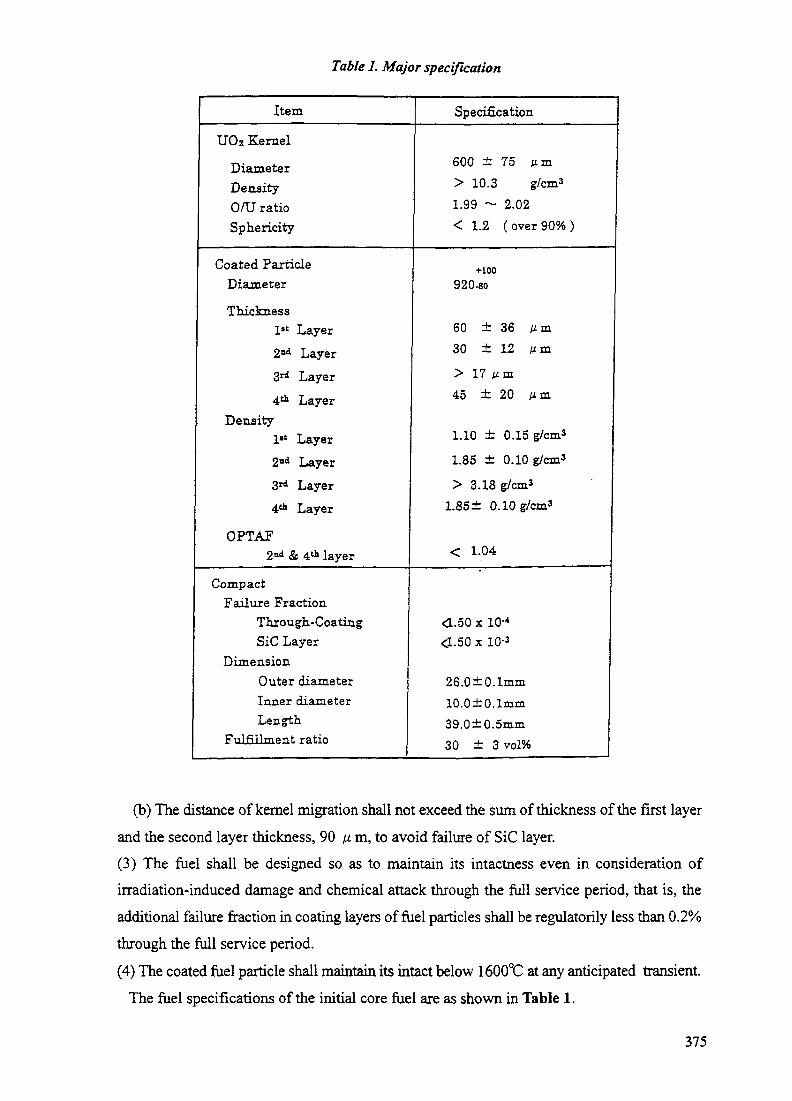
Table 1. Major specification
Item Specification
UO2 Kernel
DiameterDensity0/U ratioSphericity
600 ±75 urn> 10.3 g/cm3
1.99 ~ 2.02< 1.2 (over 90%)
Coated ParticleDiameter
Thickness1st Layer
2ttd Layer3rd Layer
4th LayerDensity
1st Layer2nd Layer3rd Layer4th Layer
OPTAF2nd & 4tii iayer
•HOC920-ao
60 ±36 ^m30 ±12 urn
> 17 u.m45 ±20 ^m
1.10 ± 0.15 g/cm3
1.85 ± 0.10 g/cm3
> 3.18 g/cm3
1.85± 0.10
< 1.04
CompactFailure Fraction
Through- CoatingSiC Layer
DimensionOuter diameterInner diameterLength
Fulfillment ratio
<L50 x 10-4
<1.50 x 10⁻³
26.0±0.1mm10.0±0.1mm39.0±0.5mm30 ± 3vol%
(b) The distance of kernel migration shall not exceed the sum of thickness of the first layerand the second layer thickness, 90 M m, to avoid failure of SiC layer.(3) The fuel shall be designed so as to maintain its intactness even in consideration ofirradiation-induced damage and chemical attack through the full service period, that is, theadditional failure fraction in coating layers of fuel particles shall be regulatorily less than 0.2%through the full service period.(4) The coated fuel particle shall maintain its intact below 1600°C at any anticipated transient.
The fuel specifications of the initial core fuel are as shown in Table 1.
375

2-2. ProcessU02 kernels are fabricated by the well-known gel precipitation process. Uranyl nitrate
solution mixed with additives is dropped into ammonium solution to form ammoniumdiuranate (ADU) spheres. After washing and drying, these are calcinated and sintered into U02
kernels. U02 kernels are coated in a fluidized bed to form TRISO coated particles. All U02
kernels and TRISO coated particles are classified by vibrating table to exclude odd shapeparticles. TRISO coated particles are overcoated with graphite powder and binder resinmixture, and hot-pressed to make up green fuel compacts. The green compacts are baked ina furnace to be fuel compacts. Fourteen fuel compacts are inserted in a graphite sleeve to makea fuel rod. Then fuel rods are assembled into graphite blocks. The Sleeves and the blocks aremade of IG-110 grade graphite.
Fabrication process of the HTTR fuel is shown in Fig. 2.
Uranyl Nitrate |I Additncs ±.
Formation ofspherical particler ,ADU particle |
TCalcination Ii
HO > particle 1
Sintering______|X
HO , kernel
CoatingX__________,
ITRJSO coated particle!
I Graphite powder |
[ Binder resineMixing I——H Overcoating
I
First layer Low densitypyrolilic carbon
Second layer High densitypyrolilic carbon
Third layer Silicone carbide„ Forth layer High density
pyrotitic carbon
I Hot-pressing___|i "
I Pre-baking_____|1
i B a k . n g |X
| Fuel compact |
Graphite sleeve -H InsertionA.
Fuel rod
| Graphite Block \- Assemblmg-L
Fuel assembly
Fig. 2 Fabrication process of the HTTR fuel
376

2-3. PlantNFI started its research and development work for HTGR fuel fabrication technology in the
end of 1960's, and has proceeded cooperatively with JAERI during this quarter of a century.NFI fabricated 260 kgU fuel for VHTRC (Very High Temperature Reactor Critical Assembly)of JAERI as the first mass fabrication from 1985 to 1986 by a pilot plant with 200 KgU/yearin fabrication capacity.
NFI completed the construction of the new HTGR fuel plant at Tokai in October 1992. Inthe plant the fabrication technologies gained through the long-term development works wasapplied. The main facility building is made of ferroconcrete with two floors and 1,500 squaremeters area. There are two fabrication lines for the fuel kernel and coating processes.Day-shift capacity of these is totally about 1,500 KgU/y. There is one line for fuel compactfabrication process which capacity is about 40,000 compacts/y at now. Two coatersdesigned originally by NFI are prepared. Fabrication capacity of each coater is max. 3.4KgU/batch in standard operation. Hot-pressing equipment is operated full-automatically fromweighing overcoated particles to lining up green compacts on a tray.
2-4. ScheduleBefore starting the fuel fabrication of initial HTTR fuel performed qualification test and JAERI
certificated the quality level. Fuel fabrication in NFI's facility will be finished at the end of 1997.Assembling of fuel will be started at the middle of 1997.
Table.2 shows the fuel fabrication schedule.
Table 2. Fuel fabrication schedule
1. Fuel Fabrication
Fuel compact
Fuel rod
Transporting
Fuel assembly
377

3. Quality Control and assurance system(2)
It is impossible to inspect all fuel products because initial HTTR fuel contains a largenumber of coated fuel particles and fuel compacts. Therefore it is necessary to establishquality control and assurance methods such as inspection items, sampling method. Basicallysampling method is applied to certificate fuel quality. An Inspection lot is a product group ofa uniform quality. Namely a raw uranium powder lot is an assemblage of same enricheduranium material which is mixed by solution. A kernel lot and a coated particle lot arearranged by mixing plural fabrication batches uniformly in each process stage. A compact lotmeans a product assemblage baked at the same time. The lots of raw uranium powder istwelve and those of kernel, coated particle, and compact are about one hundred. Thearrangement method of inspection lot is shown in Fig. 3.
DO » kernel batch
DO > kernel lot
(Max. 15KgU)
Coating batch
Coated fuel particle lot
(Max. ISKgU)Overeating batch
Hot pressing batch
Baking batch
Fuel compact lot
(Max. 700compac()
Fig. 3 Lot arrangement of fuel production
378

Table 3. Inspection item and method
Iteml.UOj Kernel
1) "HJ Enrichment
H) Impurities
Ut) Diameterb) Sphericity
•*) Density
vl)0/U ratio2 Coated Particle
1) Diameter
U) Appearance
iil) Cross section
iv) Layer thicknessv) Layer density
vi)OPTAF(2«< & 4tk layer)
Method
Mass spectro analysis &r -ray spectro analysis
Emission spectro analysis
Particle size analysisParticle size analysisMercury substitution method
Oxidation ^weighing method
Particle size analyzerVisual observation
Ceramography
X-ray radiograph
Solvent substitution method &Sink-float method
Polarization photometer
Item3. Fuel Compact1 ) Appearance &
Marking certification
11) Dimension111) Density (matrix)
» ) U contentv) Failure particle fraction
Trough-coating-Iayer
SiC Layervl) Compressive strength
vu) Impurities
via) 0/U ratio
4 Fuel Rod1 ) U content
11) Dimension
Ml) Appearance &Marking certification
i Fuel assemblyi ) JMU enrichment
11) Appearance
ill) U content
Method
Visual observation
Micrometer
Weighing & calculation
y -ray analysis
Electric dismounting & nitricacid leaching methodBurn & leach methodStrength tester
Emission spectro AnalysisOxidation & weighing method
Calculation
CaliperVisual observation
Certification of marking
Visual observation
Calculation
The inspection items and method for HTTR fuel are shown in Table 3. The inspectionequipment is set to measure automatically as much as possible to obtain the reliability andrationalization of inspection. Diameter and sphericity of coated particles, the thickness ofcoating layers, sizes of fuel compacts, and uranium contents of fuel compact are measuredautomatically. The coating layer thickness is measured by analyzing the image of X-rayradiograph of coated particles.
A computer integrated system for quality assurance enables tracing a large number ofinspection data.
The inspections by government (Science and Technology Agency) have been carried out forevery process stage of 12 kinds of uranium enrichment. In total over thirty inspections will becarried on during this fabrication of initial HTTR fuel.
4. QualityThe standard deviations of diameter and density of UO2 kernels, thickness and density of
coating layer and diameter of coated particles are shown Table 4 and 5 and Fig. 4. The resultsare small in comparison with the specifications as shown in table 1. Sphericities of UO2
kernels and coated particles are also excellent and the difference of mean value of the two is
379
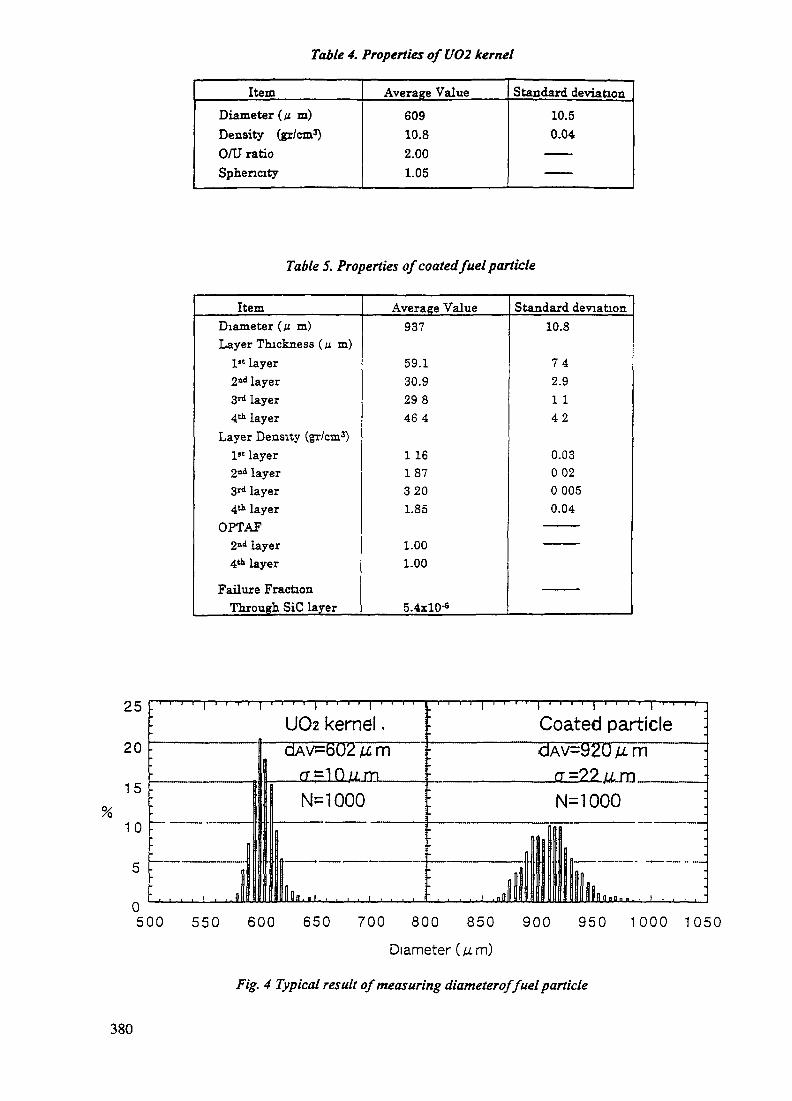
Table 4. Properties ofUO2 kernel
ItemDiameter (n m)Density (gr/cm3)0/U ratioSphericity
Average Value60910.82.001.05
Standard deviation10.50.04
Table 5. Properties of coated fuel particle
ItemDiameter (n m)Layer Thickness ( M m )
1st layer2ad layer3rd layer4th layer
Layer Density (gr/cm3)l>t iayer
2nd layer3rd layer4* layer
OPTAF2nd layer4th layer
Failure FractionThrough SiC layer
Average Value937
59.130.929846 4
1 161873201.85
1.001.00
5.4xlO-«
Standard deviation10.8
7 42.91 14 2
0.0300200050.04
————————
————
25
20
15
10
i — r— i — 1 — | — 1 — 1 1 1 —
. . . . . . . J
— 1 — I I I ) — 1 1 1 1 1 1 1 — I—I ——
UO2 kernel -dAV=602 v. m
CT^lQjUJTi i
N=1000 j
Il0l..l.. . . . . . . . . i
—r—i — i — i — | — i — i- r • r— — i — i — i—i — j — i — i — i — i — | — i—i — t— i —
Coated particle •dAv=920Mm ;
a =22 /i m :
: N=1000 :
|
nil• . . . ..j ,M\\\ l i l l l lSdnndn . . . I , , , , '
500 550 600 650 700 800 850 900 950 1000 1050Diameter
Fig. 4 Typical result of measuring diameterof fuel particle
380

25
20
15
10
5
0
UOz kernel Coated particle:
SAv=1.049 SAV= 1.050
N=100
Bl ca a . , i ,
N=100
ra . , i
1 1 05 1.1 115 1 1.05sphericity
1 1 1 15 1 2
Fig. 5 Typical result of measuring sphericity of fuel particle
very small as shown in Fig. 5. Average Failure fractions of SiC layer of coated particles is5.4X10"6 as shown in table 5. Therefore, the coated particle fabrication process is judged to bewell controlled.
The inspection results of dimensions of fuel compact satisfy the allowances of specifications,± O.lmm.
As for the failure fraction of fuel compact, the numbers of the through-coatings defectparticles in fuel compact are 0 or 1 for all fabricated fuel compacts as shown in Fig. 6, and theaverage failure fraction is 4x10"*. The inspection data measured by bum & leach method areshown in Fig.7. There are some fuel compacts containing plural defect particles. However, thenumber of fuel compacts containing defect particles is decreasing. Although the averagefraction in the latter half of 1995 is 1.2x10"*, one in the second quarter of 1996 is improved toS.lxlO"5. About 85% of fuel compacts fabricated in the second quarter of 1996 contain 0 or1 defect particle as shown in Fig.8., and average failure fractions in compact lots are rangingbetween l.SxKT6 and 1.8x10"*.
We have made extensive efforts to stabilize the quality of fuel compact. The reason thatcauses the SiC-defect in a compact is considered as follows. Since packing fraction of thecoated particle is relatively high, 30 vol.%, in the fuel compact and pressing to form compactis carried on under hot condition, a few coated particles could be contacted. We consider thatthe SiC layer of these particles results in failure during the compact fabrication process.Therefore to prevent damaging the coating layer during the compact fabrication process, weset up proper overcoating condition and pressing condition such as temperature and speed. Inthe R&D work before initial fuel fabrication, w temperature and speed are determined to beas low as possible to prevent contacts of coated particles. Furthermore, during the fabrication
381

100%
o
3cr
50.0%45.0%40.0%35.0%30.0%25.0%20.0%15.0%10.0%5.0%0.0%
0 1 2
Defect particle /Fuel compact
Fig. 6 Failure fraction through coating layers
ID The second quarter/1996DThe first quarter/1996• Latter half of 1995(Fiscal year)
0 1 2 3 4 5 6Defect particle/Fuel compact
Fig. 7 Failure fraction by burn & leach method
3§f
0 1 2 3 4 5
Defect paricle/Fuel compact
Fig.8 Failure fraction by burn & leach method(The second quarter/1996)
382
of initial HTTR fuel, we found out that about 0.1% overcoated particles contained two coatedparticles. Since these coated particles could easily be contact during pressing, we have removedthem from overcoated particle batches. These efforts enable decreasing the failure fraction byburn&leach method.
5. Conclusion
The fabrication of the initial core fuel for HTTR was started in June 1995 and finished abouta half of the total amount at Sep. 1996. The fuel fabrication will be completed at the end of1997. The failure fraction measuring by burn & leach method is l.lxlO"4 at the beginning ofthe fabrication, but it is improved to S.lxlO'5 now. The fuel qualities at present are satisfactory,however, we will carry out further efforts to attain the higher quality of fuel.
References
(1) S. Shiozawa et al., "The status of HTGR fuel development in Japan", Proc. of an IAEATCM, Petten, (1994)
(2) KKobayashi et al., "An Inspection Standard of Fuel for the High Temperature EngineeringTest Reactor", JAERJ-M 92-079(3) K.Minato et.al., Private communication
NEXT PAGE(S) Ileft BLANK |
————————* 383

TECHNICAL DEVELOPMENTS IN GAS COOLED REACTOR DESIGN
NEXTPAGE(S)left BLANK
XA9846695THE EOR SYSTEM IN DURI: COMPARISON BETWEENCONVENTIONAL AND NON-CONVENTIONAL SYSTEMS
A.N. LASMAN, M.D. ISNAENINational Atomic Energy Agency,Batan, Indonesia
Abstract
EOR system in Duri. Comparison between conventional and non-conventionalsystems. One of oil field location in Indonesia, which produces about 25% or more than 300bpd, located in Duri, Sumalera island. The oil depth location is between 75 until 200 meter.Because the Duri oil is classified as heavy oil, only 7.5% of oil could be pumped out byusing conventionally system. By using of EOR system, in this case uses steam injection, itis hoped that the amount of oil pumped could be reach until 65% of oil resources. It isinteresting to study again the using of High Temperature Reactor for Duri steam flood (DSF)project after their feasibility study and after the DSF project has been used oil burning for thesteam production. The Duri oil field area is divided into 12 regions. The DSF project hasfinished 8 regions. The other regions are still in project progress. In this study is discussedthe EOR seven point system, the comparison between the present and prediction of thermalpower required for DSF project and the DSF by using HTRs. Jt is calculated that the presentthermal power required is less than '/2 of the last feasibility study by using of (4x200 MWth.)HTRs.
INTRODUCTION
The Duri oil field is located approximately in the center of the province of Riau,which covers the northern central section of the Sumatera island, and has the distance ofabout 170 km from Pekanbaru. It is the biger oil field in Indonesia. The bigest one is theMinas oil field, which is located about 150 km from Duri. The oil resources of both field aredifference. The oil of Minas is categorized as light oil and the oil of Duri is heavy oil. Itmakes the oil pumpe systems of both region are diffrence. The first oil production in the Durifield was in May 1958 by using the primary recovery system. The oil pumping wassuccessfully, but only 7.5 % oil could be pumped out from the reservoir11'.
To increase the oil production some techniques had been done, i.e.:1. The water flood techniques.
It was done in year 1960 until 1963. It was predicted that 16% of oil reservoir couldbe pumped out.
2. The cyclic steaming or huff-puff technique.It was done in year 1967. The steam was injected into the production wells and thanthe wells were closed. After some days the production wells were opened and the oilwas pumped out. The same technique was done again if the oil reservoir temperatureand also its oil result decreased. By this technique can be pumped out the heavy oiluntil 20% from its reservoir.
387

3. The (continue) steam flood technique.This technique had been used since 1975. The steam flood technique uses continuesteam injection into the injection wells. This techique promises that 65% oilproduction from the heavy oil reservoir can be reached.
Before the DSF project was done in some Duri oil field regions the steam injectionsystem was investigated by using the HTR's. The comparison between using oil and nuclearheat sources is interesting for HTR studies especially for non electrical applications.
THE STEAM INJECTION SYSTEM
The Duri oil field area is about 76.5 km2, which is divided into 12 developmentregions and each has an average area 6 km2 (Fig.l). Now the 8lh region is done by the DSFproject. Steam injection system uses 7 point pattern, which 6 points are located at thehexagonal corners as the production wells. One point is located at the middle of the hexagonaland its functions as the steam injection well. The distance between points at the hexagonalcomers is 135 meter121 (Fig. 2).
At present the DSF project is the bigest steam flood plant in the world. Until 8lh regionthe DSF project needs about 340,000 ton water per day. The steam is produced in the Boilersand the Waste Heat Recovery (WHR) machines. The boilers use oil as fuel and the WHRmachines use the heat release from the gas turbines. The DSF project has 5 WHRs. EachWHR can process 1,675 ton water per day. The steam is transported through 75 cm diameterpipes. The using of 5 WHRs reduces the total steam cost.
l''ig. 1 Duri oil field area
388

3 pi Ls t
SL.1-
a !!.. Jt
/v• (W
.\ . . i\ !!
hr^ _SUMU«
IN|[ KM
1 1
ritoouKsi
\IAIANMOIIL
\J[
h 1
V/ »«"
/ ll. V- -IL.- ./|AIAN riPA
Hg.2 Seven point pattern
POWER REQUIRED
The thermal power is required for the steam production and electrical generation. Thetotal power is predicted for all area of the Dun oil field.
Tlic DSF Project.
Until the 8th region is replaced 367 steam generators with the power required is 6,5MW thermal. The electrical generation is 22 MWe or about 70 MW thermal. It means that"the total power required is about 76 MW thermal. The amount of oil production is 367,000bpd or about 30% of the total Indonesia oil production. The heat and electricity are producedby using oil in the amount of 64,000 bpd.
The total length of the steam pipe is 3,219 km and the total of injection andproduction wells is 4,501. It means that each hexagonal well system needs in average about5 km pipe length. The steam pressure at the steam generator outlet is 65 bar and at the inletof the injections well is 28 bar or reduce by factor 0.43.
Based on the real power need until the 8lh region development, it is predicted that theDSF project will be finished for all 12 region developments and required the thermal powerfor 114 MW. At that time the production rate is 550,000 bpd.
HTR as power source
Using HTRs for the DSF project has investigated in year 1985/86. Because theapplication of HTRs is feasible if the oil price is more than 24 US$/barrelm, and in fact thatthe oil price until now is less than the calculation. It makes the using HTRs in the DSFproject is not feasible. The study, 'which was done by China and uses the present technology,said that the HTR could be build for EOR if the oil price is more than 18 USS/barrcl1*1.
In this case the steam quality is better, has a factor 4, than the present technology. Butthe pressure drop factor1'1' is bad ( > 0.9) because the distance between the heat source andthe injection wells. If 2 HTRs are replaced into the region 3 and 10 (Fig. 1) with the nominalpower 200 MWth each, the present production capacity can be reached.
389

The difference result between this calculation and the old calculation |5t is based onthe scenario of the 7 point pattern. This pattern is used at the beginning of 1990. Using thispattern makes that the number of the steam injection wells is less in factor 0.6. Thisdifference is a meaningful].
CONCLUSION
P.xccpt the oil price variable the using of FlTRs for Duri steam flood is intcrcsling.especially the number of the HTRs can be reduced. It is caused by the using of 7point pattern.The pipe length variable is significant to influence the pressure drop. In this case thepresent system has an advantage, because the steam generators can be build no farfrom the steam injection wells.The using HTRs heat for Natuna CO2 conversion plant is different as in DSF project.The influence of the pipe length for Natuna is less than in DSF area, especially if theCO2 conversion plant is adjacent with the reactor building.
References
[I] PT CPI. Injeksi Uap Duri, 1992[2] Personal communication, Hari Bustaman & Wahyudi Atmo, PT CPI, June 1995[3] Personal communication, W. Froehling, KFA Forschungszentrum GmbH, Dec. 1994[4] Personal communication. Yuliang Sun, AGM in Jakarta, Nov. 1995[5] KWU, Economic Feasibility Investigation of First HTR-4 Module Co-generation Plant
for Tertiary Oil Recovery from Duri Oil Field, Sumatera, August 1987[6] S.L.Soo, Thermodynamics of Engineering Science, Prentice Hall Inc.
390

RESULTS OF COST ESTIMATES FOR THE EXPLOITATION OFTHE NATUNA GAS FIELD IN INDONESIA USING THE HTR:A NEW MOMENTUM FOR COMMERCIALIZATION
H. BARNERT QKAGKQR,. c , ^_ r..,. , „ , T, XA9846b9bKemforschungszentrum Jiilich GmbH,Julich, Germany
Abstract
The results of a simplified method for cost estimations are presented. The main result is: Thereexists a potential of economical competitiveness for the exploitation of the gas of the NatunaGas Field in Indonesia. The potential consists in the production of Energy Alcohol from thegas of the Natuna Gas Field, making use of nuclear energy in the form of high temperature heatand electricity from the High Temperature reactor, HTR. The reason is that Energy Alcohol isa readily marketable product as a substitute for gasoline and diesel, with their relatively highmarket values. This is not so for methane, because of its lower market value, being used mainlyin the heat market only. In the conversion process some - or a little more - of thecarbondioxide CC>2, the main constituant of the gas of the Natuna Gas Field, is used; thecompetitiveness of the product decreases with the increasing consumption of COi.
The results in more detail are: Four processes have been investigated, these are:
Process 1: ,,Steam plus carbondioxde"-reforming for reformer gas plus electrolytic hydrogen,and synthesis of methanol; remark: 3 variants a; b; and c are considered.Process 2: ,,Carbondioxide"-reforming for reformer gas with separation of CO2, pluselectrolytic hydrogen for synthesis of methane (so-called enrichment of CHj), and synthesis ofmethanol from the reformer gas.Process 3: Addition of electroylic hydrogen to Natuna Gas for the synthesis of methane, as analternative to process 2, if the objective is to produce as much as possible methane.Process 4: Separation of methane (as product) and CCh plus electrolytic hydrogen for synthesisof methanol.
The estimated cost figures C for methanol (100 %, no methane), process 1, variant a; b; and c,are C = 4.9; 7.5; and 15.1 $/GJ for high specific investments, resp. are C = 4.1; 5.5; and 9.4$/GJ for low specific investments (50 % of high S for HTR and electrolyser). The variants a; b;and c make use of increasing amounts of Natuna CC^, measured by the percentage of NatunaCC>2 of 15; 25 and 100 %. Process 1, variants a and b, are for high specific investments S (and- of course - for low S) economically competitive in comparison to e.g. lower break-evenprices of e.g. 8 $/GJ, but most of the Natuna-C02 is emitted. Process 1, variant c, which makesuse of all Natuna-CC>2 is economically competitive only for low specific investments S to meanor high break-even prices, of e.g. 10 or 12 $/GJ. The estimated cost figures C for processes 2;3 and 4 lie in the high region being economically of less interest.
391

The discussed projects for the exploitation are large, this offers the possibility of mass-production of HTR-Moduls; representing an encouraging momentum for commercializing theHTR.
1. The Natuna Project and Possible Alternatives
1.1. In Summary: The Natuna Gas Field in Indonesia is discussed for exploitation to enlargethe countries export capabilities. The disadvantage of the Natuna gas in comparison to othergas fields is its high content of carbondioxide CO2. In conventional technology with re-injection of CO2 the estimated supply costs are high. Therefore the idea was developed to usenuclear energy for the exploitation of the gas from the Natuna Gas Field, including thecarbondioxide.
1.2 In detail on the background of the Natuna Project and possible alternatives:
1.2.1. Indonesia is an oil and gas producing country. Its energy base is confronted withincreasing inland consumption and decreasing oil resources, lit. AHIMSA-1995; SASMOJO-SUBKI-LASMAN -1995. The available resources in natural gas, including the Natuna GasField, are therefore becoming important.
1.2.2. Indonesia's Pertamina in 1994 was producing as much as 24 to 26 million tons/year ofLiquified Natural Gas, LNG, from 6 production units Arun, Aceh, on the northern tip ofSumatra, and 6 plants Bontang, East Kalimantan. Most of the LNG was shipped to Japan, withthe remained going to South Korea and Taiwan, lit. IPE-1995, p. 196.
1.2.3. The Natuna Gas Field in Indonesia was discovered in 1973, 225 km from Natuna Islandin the South China Sea. This gas field contains approximately 1270 billion cubic meters ofrecoverable hydrocarbon reserves, making it one of the largest gas fields in the world (in termsof gas in place and recoverable hydrocarbons), lit.: GREENHOUSE ISSUES-1996. But thegas consists with 66.5 % of carbondioxide CO2- The energy content is equivalent to about 1.5TWy (TWy = Terra Watt Year), or for 30 years 50 GWt, equiv. to 15 large LWRs.
1.2.4. Pertamina, the National Oil Company of Indonesia, and Esso Exploration andProduction Natuna, Inc., an affiliate of Exxon Corp., are planning the development of theNatuna Gas Field under a Production Sharing Contract, PSC, awarded in 1980. Pertamina, theworld's largest supplier of LNG has major natural gas and LNG operations. Exxon Corp. hasworldwide experience in developing and operating large energy projects, lit. PERTAMINA-ESSO-1993, p. 1. The estimated supply costs for new LNG plants under consideration for theNatuna gas field are 4.27 to 5.20 S/MBTU (S/MBTU = US $ pro Million British ThermalUnits), lit.: IPE-1995, p. 197, table 4, equivalent to 4.05 to 4.93 $/GJ, (at 12 % discount rate),and is comparatively expensive. Parts of the additional cost are produced by the proposal ofthe re-injection of carbondioxide CO2 into the ground.
392

1.2.5. On that background the idea is developed to use nuclear energy, and possibly othercheap energies, to make use of the Natuna- C02, to contribute to solutions of the countriesenergy problems, lit. RUSLI-1995-1; SANTOSO-BARNERT-1995.
2. Process Variants, Process Layout and Design
2.1. In summary: The conditions of the feasible products, the unit operations of reforming,and the objective of economical competitiveness make that 6 process variants can be identified.These are four processes, labeled as 1; 2; 3; and 4; with process 1 in three variants, labeled asla; Ib; and Ic. The processes Ic; 2; 3; and 4 make use of all Natuna-CO2, whereas process larespectively Ib uses only 15 respectively 25 % of the Natuna-CC>2. The processes in short are:1: H2O plus CO2-REF and ELY H2 for methanol2: CO2-REF and ELY H2 for methane (enrichtment) and methanol3: NA and ELY H2 for methane4: SEP for methane and ELY H2 for methanol.
2.2. In detail: On the objectives, the overview, and the approach:
2.2.1. The objectives of a process layout and design are :1) the product of the process should be economically competitive,2) the process should be environmentally benign to the largest extend, and3) modern feasible technology should be used.
The objective 2 means that as much as possible of Natuna-CO2 should be used in the processand being converted into a marketable product.
2.2.2. The conditions of the feasible products, the unit operations for reforming and theobjective of economical competitiveness make that 6 process variants, consisting of 4processes, labeled as 1; 2; 3; and 4; with process 1 in three variants labeled la; Ib; and Ic canbe identified. The feasible products are methane, the main constituent of Liquified Natural Gas,LNG, and methanol - a liquid - as the main constituent of Energy Alcohol, as a substitute fordiesel and gasoline.The unit operations for reforming are the ,,steam plus carbondioxide"-reforming, H2O plus C02-REF, as it has been tested in the Research Centre Jiilich GmbH,KFA, in 1988, lit. BARNERT-SINGH-1996, and the ,,carbondioxide"-reforming, CO2-REF, -in contrary to ,,steam"-reforming, (often used in industry) -, as being tested since a few years atthe Weizmann Institute of Science, Israel, lit. EPSTEIN-1995. The objective of economicalcompetitiveness, being hard to be met, makes that the variants a and b for process 1 are takeninto consideration. In these process variants only 15 and 25 % of the Natuna-C02 is convertedinto the marketable product methanol. The amount of used Natuna-CO2 is measured by theratio CO2/CH4 in the feed R for the variants a; b; and c with R = 0.4; 0.67; and 2.67. The lattervalue is that of the Natuna gas. The processes in short description are:
393

Process 1: Steam plus carbondioxide-reforming, H^O plus CCb-REF, for reformer gas, heatedby HTR-helium, with addition of electrolytic hydrogen, being produced from nuclear electricityof the HTR, and synthesis of methanol, in mixture with other alcohols. In the variants a and bthe processes begin with a separation of most of the C02 from the Natuna gas. The separated
is emited.
Process 2: Carbondioxide-reforming, CCVREF., heated by HTR-helium, for reformer gas,separation of the remaining carbondioxide and addition of electrolytic hydrogen, beingproduced from HTR electricity, into the separated streams for the syntheses of methane andmethanol. The amount of the product methane from the synthesis is larger than the amount ofmethane in the feed to the reformer, this is called the enrichment of methane, lit.: ARBIE-1996, lit.: EPSTEIN- 1995.
Process 3 : Addition of electrolytic hydrogen, produced by nuclear electricity from the HTR, tothe cleaned Natuna gas for the synthesis of methane. This process is taken into consideration asan alternative for process 2, if the objective is to produce as much as possible methane.
Process 4. Separation of methane as the product from the Natuna gas and addition ofelectrolytic hydrogen, produced from electricity from the HTR, to the remaining carbondioxidefor the production of methanol.
Remark: The processes 1 and 2 use the unit operation of reforming. The required hightemperature heat is supplied by the HTR. The processes 3 and 4 do not use the unit operationof reforming. The unit operation electrolysis in its conventional form needs only electricity,which can be supplied by any nuclear reactor, e.g. the Light Water Reactor; but there are moremodern forms: the steam electrolysis and the so called hot electrolysis, which need hightemperature heat, and therefore the HTR.
2.2.3. The approach for the process layout and design, as well as for the cost estimation, isconcentrating on the essentials by simplification for the constituents of the Natuna gas, for themol-balances, for the chemical reactions, and for the energy balances. Thereby a betterunderstanding is being produced. The simplifications are as follows:
A) The calculation is done for an input of 1.2 x 10⁹ SCFD (SCFD = Standard Cubic Food perDay), being equivalent to 17 548.87 mol/s with the important constituents of CH4, x = 25.1%, equivalent 4 405 mol/s, and higher alcanes, Ca+, x = 1 %, equivalent 175 mol/s, and withCOa, x = 66.5 %, equivalent 1 1 670 mol/s. These mole fluxes are put together anddescribed by ,,simple" numbers with CH*: 4 500 mol/s and CO2: 12 000 mol/s, together NA= 16 500 moUs.
B) The reaction turnovers of the unit operations reforming, electrolysis, methanol-synthesis andmethanation are in all cases taken to be 100 %. In reality this can only be approached by
394
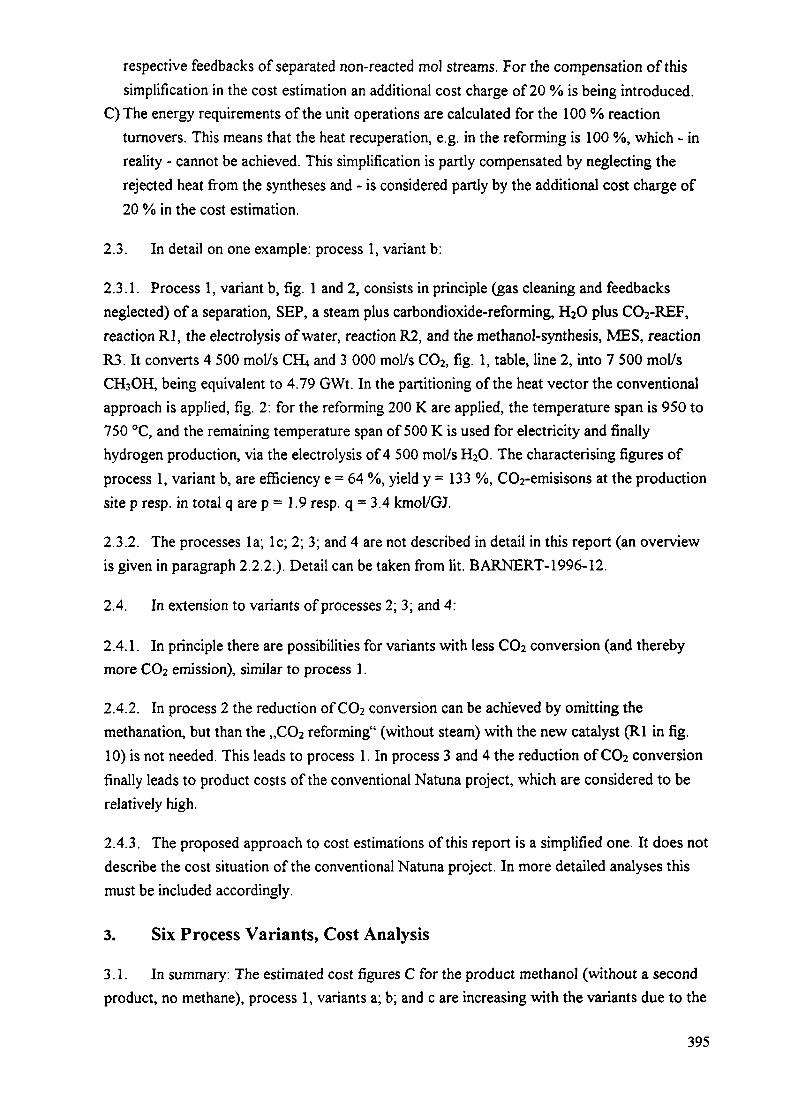
respective feedbacks of separated non-reacted mol streams. For the compensation of thissimplification in the cost estimation an additional cost charge of 20 % is being introduced.
C)The energy requirements of the unit operations are calculated for the 100 % reactionturnovers. This means that the heat recuperation, e.g. in the reforming is 100 %, which - inreality - cannot be achieved. This simplification is partly compensated by neglecting therejected heat from the syntheses and - is considered partly by the additional cost charge of20 % in the cost estimation.
2.3. In detail on one example: process 1, variant b:
2.3.1. Process 1, variant b, fig. 1 and 2, consists in principle (gas cleaning and feedbacksneglected) of a separation, SEP, a steam plus carbondioxide-reforming, IfcO plus CO2-REF,reaction Rl, the electrolysis of water, reaction R2, and the methanol-synthesis, MES, reactionR3. It converts 4 500 mol/s CHU and 3 000 mol/s C02, fig. 1, table, line 2, into 7 500 mol/sCHsOH, being equivalent to 4.79 GWt. In the partitioning of the heat vector the conventionalapproach is applied, fig. 2: for the reforming 200 K are applied, the temperature span is 950 to750 °C, and the remaining temperature span of 500 K is used for electricity and finallyhydrogen production, via the electrolysis of 4 500 mol/s HaO. The characterising figures ofprocess 1, variant b, are efficiency e = 64 %, yield y = 133 %, CCVemisisons at the productionsite p resp. in total q are p = 1.9 resp. q = 3.4 kmol/GJ.
2.3.2. The processes la; Ic; 2; 3; and 4 are not described in detail in this report (an overviewis given in paragraph 2.2.2.). Detail can be taken from lit. BARNERT-1996-12.
2.4. In extension to variants of processes 2; 3; and 4:
2.4.1. In principle there are possibilities for variants with less CO2 conversion (and therebymore CCb emission), similar to process 1.
2.4.2. In process 2 the reduction of CC^ conversion can be achieved by omitting themethanation, but than the ,,CC>2 reforming" (without steam) with the new catalyst (Rl in fig.10) is not needed. This leads to process 1. In process 3 and 4 the reduction of CC>2 conversionfinally leads to product costs of the conventional Natuna project, which are considered to berelatively high.
2.4.3. The proposed approach to cost estimations of this report is a simplified one. It does notdescribe the cost situation of the conventional Natuna project. In more detailed analyses thismust be included accordingly.
3. Six Process Variants, Cost Analysis
3.1. In summary: The estimated cost figures C for the product methanol (without a secondproduct, no methane), process 1, variants a; b; and c are increasing with the variants due to the
395
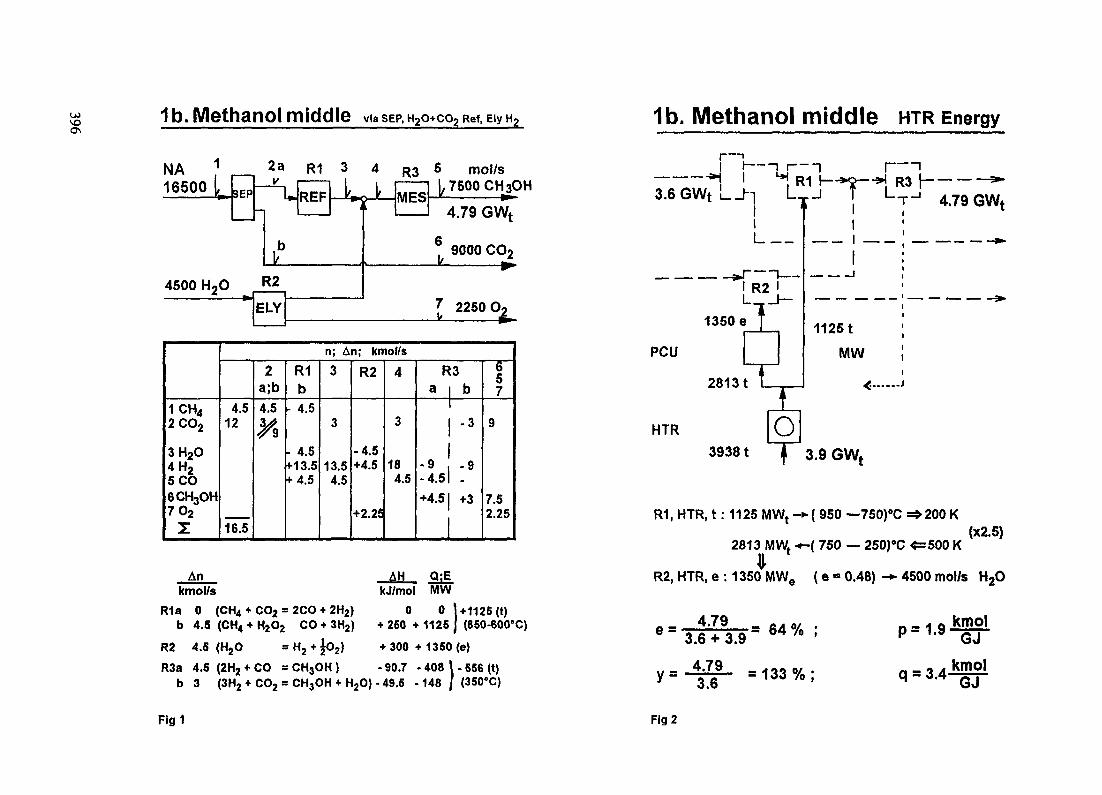
1b. Methanol middle viasep,H2o+co2Ref, EIV H2
NA 2a R1 3 4 RS 5 mol/s16500 |^_
4500 H2O
SFP
I
E
-n
vb
R2
LY
Lpec1
L ..„» b7500CH3CUL-MES-* ————— -
4.79 GWt
* 9000 CO2^
7 2250 O2u £
1 CH42C02
3H2O4H2SCO6CH3OH702
z
n; An; kmot/s
4.512
16.5
2a;b4.5
%
R1b
- 4.5
- 4.5+13.5+ 4.5
3
3
13.54.5
R2
-4.5+4.5
+2.25
4
3
184.5
R3a
q- 0
-4.5+4.5
b
-3
q:9
+3
657
9
7.52.25
An AH Q;Ekmol/s kJ/mol MW
R1a 0 (CH4 + CO2 = 2CO + 2H2) 0 0 Ul125 (t)b 4.5(CH4 + H2O2 CO + 3H2) + 250 + 1125 j (850-600°C)
R2 4.5 (H2O = H2 + |02) + 300 + 1360 (e)
R3a 4.5 (2H2 + CO = CH3OH ) - 90.7 - 408 I - 556 (t)b 3 (3H2 + CO2 = CH3OH + H20) - 49.5 -148 / (350'C)
Fig1
1b. Methanol middle HTR Energyi—• i—i
3.6 GWt I- -h
L__
I R2 I
1350e
PCU
HTR
2813 t
1125 t
MW
I————'4.79 GW,
39381 if 3.9 GWt
R1, HTR, t: 1125 MWt -»( 950 —750)°C =^-200 K(X2.5)
2813 MWf *-( 750 — 250)°C 4=500 K*
R2, HTR, e : 1350 MWe (e = 0.48) -*> 4500 mol/s H2O
=133%;QJ
kmol
Fig 2
increasing application of Natuna-CO2 from C = 4.9 to 15.1 $/GJ ($/GJ = US Dollar per Giga-Joule, lower heating value, throughout this report) for high specific investments S, resp. 4.1 to9.4 $/GJ for low S, fig. 14, left hand side results (same as fig. 1). The estimated cost figures Cfor processes applying 100 % Natuna-CO2, - these are the processes Ic; 2; 3; and 4 -,producing methanol (Ic), mixtures of methanol and methane (2 and 4) and methane (3) have ina band of max. 12 % similar costs C = 15.1 to C = 16.9 $/GJ for high specific investments S,resp. C = 9.2 to 10.2 $/GJ for low S, fig. 14, right hand side results (same as fig. 1).
3.2. In detail on the method of cost calculation and on assumptions, as well as on theresults, fig. 3, in particular for process 1, variant b, fig. 4:
3.2.1. The cost calculation is done in the form of tables, fig. 15 to 20 for high specificinvestments S ,,High S" and for low specific investmens, ,,Low S", using the followingequations:
X = (PT)FXF/(PT) + Ia/(PT), with I = nS or PS, and Y = al, and C = 1.2X.
The symbols, used in these equations and in the tables have the following meanings and units,respectively values:
C estimated cost of products, unit: $/GJ, lower heating value, throughout this report.X calculated cost value in table, without correction factor for losses, unit: $/GJ.1.2 correction factor for compensation of the assumption that the reaction turnover is over
100 %, considering the losses, unit: 1.Y yearly money flow, turnover, unit: Mio $/y.a annuity, a = 12 %/y, as in lit. IPE-1995, p. 195, table 4, right hand side.I investment, unit: Mio $.n characteristic mol-stream for costing, unit: mol/s.P characteristic power for costing, thermal or electric, unit: MWt, or MWe.S specific investment value with adequate unit: 1 000 $/(mol/s), or $/kWt, or $/kWe.T yearly hours of operation, availability, T = 8 000 h/y.(PT)F yearly amount of thermal energy, fuel, unit: 106 GJ/y, for Natuna gas (lower heating
value) and for thermal energy of HTR, unit: 106 MWht/y and yearly amount ofelectrical energy, fuel, unit: 10s MWhe/y.
(PT) yearly amount of thermal energy of product, unit: 10s GJ/y.XF price of Natuna gas, assumed to be 1 $/GJ, and
price of nuclear fuel, assumed to be 1 $/GJ for thermal energy, equivalent to7.2 $/MWh for electrical energy, with the assumption that the efficiency is 50 %.
3.2.2. The results of the calculation are ,,estimated costs" only, because of the following facts:the method of calculation is rather simple (e.g. operational costs are not very detailed), theassumption of 100 % reaction turnover is compensated via an over-all correction factor of 1.2only, the method of calculation of investment with a characteristic capacitive measure and itsspecific equivalent is simple, because the gas cleaning of the Natuna gas is not included, andbecause the cost of the Natuna gas with XF = 1 $/GJ is a first assumption only.
397

voooCost Estimation NATUNA + HTRMethanol (Liquid) + Methane (Gas)
4 Processes , Process 1 in 3 Variants
ProcessVariant
Methanol (tiq) ; %Methane (g) ; %
Percentage NA-C CX, ;%
Ratio CO2/CH4 ;%
Variation High S
of S for
HTR+ELY Low S
1
a ' b ' c
1000
15 I 25 | 100
0.4 ' 0.67 ' 2.671 |
2
5149
3
0100
4
6832
100
2.67
Estimated Cost C ; $ / GJ
4.9 1 7.5 il 5.1i ii i
4.115.519.4
16.5
10.2
16.9
10.1
15.2
9.2
Process:1 : Methanol min., middle, max.
2 : Methane (Enrichment) plus Methanol
3 : Methane
4 : Methane (Separation) plus Methanol
1500$/kWe for HTR. 1000$/kWe for ELY Low S : 50 % of High S
1b. Methanol middleHigh S
Costs
1 SEP
2R1.REF
3 HTR, t4 R2, ELY, e
5 HTR.e
6 R3, MES
7lnv.
T= 8000 h/yt:e:
8 NA t
9 R1 HTR, t
10R2HTR,e
11 Prod.,t
12 Cost C
nP S
mol/s 10*tl(mollsMW tfltU/W"U »'K"|,.
16500 20
4500 110
1125 500
1350 1000
1350 1500
7500 90
a = 12%/y
I
' MIO$
330
495
5631350
2025
675
5438
P PT XF
GW 10eGJ/y $/GJGW 106MWh/y $/MWh
3.6 103.7
1.125 32.4
1.35 10.8
4.79 138.0
1
1
7.2
Y
Mlo $/y
>405
625.6
YFMio$/y
103.7
32.4
77.8
866.5
C = X11 X 1.2(forl«s«)
X X/X,
$/OJ %
2.9 39
("'I\46.5 /
0.56 7.5
6.28
7.53
Fig 3 Fig 4

3.2.3. The cost calculation has been done for two sets of specific costs S for the HighTemperature Reactor, HTR, as well as for the electrolyser, ELY, to produce an overview onthe influence of the coupling of these cost intensive technologies. In the first set of costcalculations, the values of S = 1 500 $/kWe for HTR for electricity production (and 500 $/kWtfor heat production), and 1 000 $/kWe for ELY, - called: high specific investment S andlabeled ,,High S" -, have been taken, fig. 3 and 4, for the example.. In a second set ofcalculations low specific investments have been taken, - called: low specific investment S andlabeled ,,Low S", which are 50 % of the values of ,,High S. The other specific investments forthe processing of the gases and the syntheses are not changed and remain the same, e.g. forSEP: S = 20 x 103 $/(mol/s), in all 12 cases.
3.2.4. The estimated cost figure C for methanol (only methanol as product, no methane),process 1, variants a; b; and c are C = 4.9; 7.5; and 15.1 $/GJ ($/GJ = US $ per Giga-Joule,lower heating value throughout this report) for high specific investments S, fig. 3 and fig. 4 forthe example. The variants a; b; and c apply to increasing amounts of Natuna-COa, measured asthe fraction of the Natuna-COa with P = 15; 25; and 100 %, resp. measured by the ratioCO2/CH4 in the feed with R = 0.4; 0.67; and 2.67 (the latter is Natuna gas).
3.2.5. The estimated cost figure C for processes producing methane and methanol (process 2and 4) and 100 % methane (process 3 no methanol) for the processes 2; 3 and 4 are C = 16.5;16.9 and 15.2 $/GJ for high specific investments S, fig. 3. In these processes - as well as in theprocess variant Ic -100 % of the Natuna-CC>2 is used in the conversion process. It is ofinterest that these cost figures are higher than the cost figure of process 1, variant c with 15.1$/GJ by about 1 % up to 12 %. One reason is the higher needs of hydrogen for the conversionprocesses.
3.2.6. The comparison of the six process variants shows that the hydrogen production on thebase of nuclear energy via electrolysis has a big influence on the total cost, in particular for theprocesses with a 100 % application of Natuna-COj. The cost part fractions for the nuclearelectrolytic hydrogen can be calculated from the investments on the HTR (for electricityproduction), the electrolysis and the fuel for the HTR for electricity production. The result forthe fraction of the nuclear electrolytic hydrogen of the total cost for the process are 46.5 %.Only for process 1, variants a and b, the fraction is low resp. not too large. From the viewpoint of the mol-balances it is clear: the HZ is needed for the conversion of CO2 into theproducts.
3.2.7. The estimated cost figure for methanol (the only product, no methane), process 1,variants a; b; and c for the low specific investments S (50 % of High S) are 4.1; 5.5; and 9.4$/GJ, fig. 3. Remark: the low specific investments S are rather low values, and may beachieved only in future mass production of these technologies, High Temperature Reactor,HTR, and electrolysis, ELY.
399

Cost Estimation NATUNA + HTRCost vs. Fraction Methanol / Methane
18EstimatedCosts
- 9.6 $/GJGasoline700 Rupiah/l(31 */l)
\ -f- 5.2) Natuna4.5] Project
3.0 $/GJMalaysia
100 50Fraction Methanol; %
0 55Fraction Methane; %
100
FigS
Cost Estimation NATUNA + HTRCost vs. Ratio COj/Chfy for Process 1
18
EstimatedCosts15-
-5 25 Percentage NA-CO2 ; %-»
0.5
Ratio CO2 / CH4 In Feed R NA
Fig 6

3.2.8. The estimated cost figures C for processes producing methane and methanol (process 2and 4) and 100 % methane (process 3, no methanol) for the processes 2; 3; and 4 for lowspecific investments S are C = 10.2; 10.1; and 9.2 $/GJ, fig.3. Remark: also for the low specificinvestments S the fraction of costs for hydrogen are still high, e.g. process 3 fraction of nuclearelectrolytic hydrogen X (H2)/C = 78 %.
3.2.9. The estimated cost figures C for processes producing methane and methanol (process 2and 4) are mean values with the assumption that both products methane and methanol have thesame value in the end user market. This is - of course - not the case and therefore needsparticular consideration. An example is given for process 4 in fig. 5: The mean case of C = 15.2$/GJ are to be split, if methane is sold for 3 $/GJ, than methanol would cost about 21 $/GJ,according to PT-C = PTiCi + PT2C2, or C = FA + F2C2 (F: Fraction in fig.5), whichrepresents a straight line in fig. 5.
3.2.10. The values for the specific investment S for the chemival conversion unit operation: gasseparation, SEP; reforming (of the two kinds), REF; methanol synthesis, MES; andmethanation, MET, fig. 4, upper part, have been taken from respective evaluations in theProject prototype Plant Nuclear Process Heat" (PNP) from lit. POTENTIALSTUDY-1987.The values of the specific investment S for the High Temperature Reactor HTR with S = 1 500$/kWe and for the unit operation electrolysis; ELY with S = 1 000 $/kWe; are typcial expectedvalues of the future. They are taken as relatively high, called high specific investmens S, labeled,,High S". For nuclear energy in general, see chapter 5.
4. Estimation on Economical Competitiveness, Six Process Variants
4.1 In summary: There exists a potential of economical competitiveness for the exploitationof the gas from the Natuna Gas Field in Indonesia, it consists in the production of energyalcohol, mainly methanol - a liquid -, as a substitute for gasoline and diesel, from the methaneCH4 gas and from some or a little bit more carbondioxide CO2 gas from the Natuna gas field,making use of nuclear energy in the form of high temperature heat and electricity from theHigh Temperature Reactor, HTR. The reason ist that methanol, as a substitute for diesel andfor gasoline, is a readily marketable product, competing in the market for motor fuel with arelatively high value. This is not so for methane because this is used only as a heating fuel witha relatively low value.
4.2. In detail on the situation of competition and on the results with respect to the costfigures for economical competitiveness, fig. 5 and 6:
4.2.1. The situation of competition of products from the exploitation of the Natuna gas allowsthe differentiation into the two rather different commodities of secondary energy carriers, andthis is ,,motor fuel", in particular diesel and gasoline, and ,,heating fuel", here mainly naturalgas. For the description of the competition two values are taken for both commodities. For
401
motor fuel the reasoning is: the price of gasoline in Indonesia at the gas station is 700 Rupiahliter, lit. RUSLI-1995, equivalent to 9.6 $/GJ, minus distribution costs of assumed 1.6 $/GJresulting in 8 $/GJ as a lower point of the edge of the band of break-even. The price of dieselin the European Community in 1990 is 15.3 $/GJ, lit. EU-1993, p. 34, and in BARNERT-1995-7 p. 19, minus distribution of assumed 3.3 $/GJ, resulting in 12 $/GJ as an upper point ofthe edge of the band of break-even. The reasoning for methane as a heating fuel to betransported in the form of LNG: It is the estimated supply costs for new LNG plants underconsideration from lit. IPE-1995, p. 197, table 4, with the costs for the project Malaysia LNG-3 of about 3 $/GJ as a lower point of the edge of the band of break-even, and the costs of thediscussed Natuna-project of about 4.5 $/GJ as an upper point of the edge of the band of break-even. The situation of competition of the two competitors Motor Fuel and Heating Fuel independence from the fraction (Mixture) of the two products methanol and methane isdescribed by a linear interpolation of the respective lower and upper points, forming the bandof break-even, depicted in fig. 5 and 6 with dashed lines.
4.2.2. Process 1, variants a and b, both producing methanol, are for high specific investmentsS with costs of C = 4.9 and 7.5 $/GJ, and - of course - for low S with costs of C = 4.1 and 5.5$/GJ economically competitive in comparison to the lower edge of break-even with a price ofe.g. 8 $/GJ, fig. 5 and 6. But for these variants most of the Natuna COi is after separationemitted to the atmosphere. Process 1, variant c, which makes use of all Natuna-CO2 (andtherefore has zero emission of carbondioxide COa at the production site) is economicallycompetitve only to mean or even high break-even prices of e.g. 10 to 12 $/GJ at low specificvalues S, fig. 5 and 6.
4.2.3. From the processes 2; 3; and 4, producing mixtures of methane and methanol and puremethane (process 3) only process 4 with low specific investments S may be economicallycompetitive with C = 9.2 $/GJ against the upper edge of the band of break-even of e.g. 9.6$/GJ (linear between 12 and 4,5 for motor fuel and heating fuel), fig. 5. All other processes 2;3; and 4 for high S, and processes 2; and 3 for low S, are not economically competitive, fig. 5.
4.2.4. The scientific objective to make use of the Natuna CC>2 to an extend, which should beas large as possible, can be fulfilled by process 1, with low specific investments S only withcosts of 9.4 $/GJ against a middle break-even price of e.g. 10 $/GJ. But the scientific objectiveis in conflict with the objective to produce products, which should be economically competitvefor a lower break-even price of e.g. 8 $/GJ, fig.5. The economical limit to the ratio CO2/CH4for process 1 with high specific investments is about 0.7 to 1.2 for the lower to higher edges ofthe break-even band resp. with low S is about R = 1.3 for the lower edge of the break-evenband; for low S there is no economical limit for R from the upper edge, that is the Natuna gascan be used in its ratio of R = 2.67 still being economically competitive fig.6. Of course - goingto the limits - reduces the profits.
402

High Temperature Reactor, HTRConcept of an Advanced HTR (AHTR) forProcess Heat Application & Electricity Production
n isnnn
Concrete
Cor Don BlockE§£| GraphiteI'. XSI Cast -iron
12315678910
Annu I ar core 1 1Central -column \%Side reflector 13Bottom reT lector |4Top reflector 15Cold gas chamber \&Hot gas chamber i 7Hot QBS annular chamber 18Hot gas channels 19Hot gas venturi jet 20
Cold gas venturi jetThermal schieldThermeI i nsuI at i onSphere discharge tubeControl rodControl rod driveAfter heat coolerPrestressed concrete reactor vesselVessel cIosureControl rod resp. KLAK-System
(PCRV)
Advanced High Temperature Rc.trtor(AHTR-5flO)
Fig 7
403

5. In extension to HTR technology and economics:5..1. In summary: The technical and industrial feasibility of the production and application ofhigh temperature heat from the HTR has been demonstrated. The economical attractiveness ofnuclear energy still exists, if capital cost are lowered. The hugh size of discussed projects forthe exploitation of the Natuna Gas Field offers the possibility of mass-production of HTR-Moduls, an encouraging momentum in nuclear energy application in comparsion to thehistorical development in electricity protection. The demonstration of the coupling needs to bedone. A technical answer to the historical cost increases of nuclear energy could be:catastrophe-free nuclear energy technology and simplification, lit.: BARNERT-1995-11.
5..2. The main driving force for economical attractiveness of nuclear energy is the fact thatnuclear fuel is by a factor of 3 to 4 cheaper than fossil alternatives. The price of nuclear fuel inFRG is about 3.7 US $ (90)/MWt, equivalent to 1.03 US $(90)/GJt, calculated with anefficiency of 31 % for LWR-fuel. The over all trend fo the development of the nuclear fuelprices in FRG is a reduction of 25 %, this is an encouraging positive fact for nuclear energyfrom the historical development.
5..3. For the reason of the historical increase of the capital cost the utilities in the US and inEurope have formulated goals (limits) for the capital costs of future nuclear plants. TheEuropean Utility Requirements, formulated the goal for the capital cost C = 1 100 ECU/kWe
(ECU = European Currency Unit), equivalent to 1 447 US $ (95)kWe (1,8681 DM/1 ECU x 1US $71,42 DM, Oct. 1995).
5..4. A new proposal for the concept of an advanced FfTR for process heat application andelectricity production summarizes modern features of catastrophe-free design characteristics(self-acting stabilization of power and fuel temperature by negative feedbacks, self-actingremoval of after-heat by modularization of the core, self-acting protection against corrosion bycoating of graphite surfaces, and self-acting stabilization of pressure boundary by prestressedconcrete reactor pressure vessel) with increased in- and outlet temperatures, fig. 7, lit.DRECKER-SINGH-BARNERT-1992.
5.. 5. The huge size of the Natuna Gas Field and the size of the discussed production lines (inthis report the calculation has been done for an input of 1.2 x 10⁹ SCFD, see paragraph3.2.2.A) make that much nuclear energy is needed. An example indicates that: For process 1,variant 6, the needed HTR thermal power is 3 900 MWt, see fig. 7, which represents about 20HTR-modules, a 200 MWt. This offers the possibility of series production (for moreproduction lines; mass-production) of HTR-Modules, lit. BARNERT-1996, representing anencouraging momentum in nuclear energy application in comparison to the historicaldevelopment in electricity generation.
404

Literature
AHIMSA-1995Ahimsa, Djali, Director General of Balan: Opening Remark, IAEA Advisory Group, Meetingon ,,Non-Electric Applications of Nuclear Energy", Jakarta, Indonesia, 21-23 Nov. 1995.
ARBIE-1996Arbie, Bakri.: Methane Enrichment Process, flow chart and tables, National Atomic EnergyAgency of Indonesia BAT AN, Centre for Multipurpose Reactor, fax of Mr. Bakri Arbie, April24, 1996.
BARNERT-1996-2Barnert, H., paper presented by Kugeler, K.: HTRs in Mass Production for Energy-Alcoholfrom COa -Rich Natural Gas, Panel Discussion: future Perspectives of Nuclear EnergyUtilization and Expected Role of HTGR", the 3rd JAERI Symposium on HTGR Technologies,Oarai, Ibaraki, Japan, February 15-16, 1996.
BARNERT-1996-12Barnert, H.: Approach to Cost Estimations for the Exploitation of the Natuna Gas Field inIndonesia, Using Nuclear Energy, in particular the HTR. Jul-Report, forthcoming.
BARNERT-1995-7Barnert, H.: Energy Alcohol from Plant Biomass plus High Temperature Heat, the CCVNeutral, Environmentally Benign, and Consumer Friendly Future Alternative, Research CenterJiilich GmbH, KFA, Jiil-3089, July 1995.
BARNERT-1995-11Barnert, H.: HTR Process Heat Applications, Status of Technology and Economical Potential,IAEA Advisory Group Meeting on ,,Non-Electric Applications of Nuclear Energy", NationalAtomic Energy Agency of Indonesia, Badan Tenaga Atom Nacional, BAT AN, Jakarta,Indonesia, 21-23 November 1995.
B ARNERT-SINGH-1996Barnert, H.; paper presented by Singh, J.: Proposal of ,,Direct Reforming of CO2-Rich NaturalGas" and H20 plus CCVReforming of CHi in ,,One and the Same" Reformer, The 2nd ReseachCoordination Meeting RCM for the Coordinated Research Programme CRP4 on ,,Design andEvaluation of Heat Utilization Systems for the HTTR" Oarai, Japan, February 19-23, 1996.
DRECKER-SINGH-B ARNERT-1993Drecker, St.; Singh, J.; Barnert, H.: Temperature equilization phenomenon in a hightemperature reactor core with central column, Nuclear Engineering and Design 147, p. 39-46-1993.
EPSTEIN-1995Epstein, M.: Reforming Technology for Syngas Production, IAEA Advisory CommitteeMeeting (AGM) on ,,Non-Electric Applications of Nuclear Energy", Jakarta, Indonesia, Nov.21-23, 1995.
EU-1995Commission of the European Communities, Directorate-General for Energy (DGXVII):Energy in Europe, Annual Energy Review, Special Issue, April 1993.
405
GREENHOUSE ISSUES-1996Greenhouse Issues, a newsletter of the IE A Greenhouse R&D Program: CC>2 Capture andStorage in the Natuna LNG Project, Number 22, January 1996.
IPE-1995International Petroleum Encyclopedia: World LNG Exports Aim for Larger Volumes, p. 193,Volume 28, 1995.
PERTAMINA-ES SO-1993Pertamina, Esso Exploration and Production Natuna, Inc.: LNG-NATUNA-Project, Indonesia,booklet, published 1993 (available in part, information from the company Pertamina, theNational Oil Company of Indonesia, to the IAEA-expert mission, 24.-30. November 1995).
POTENTIALSTUD Y-1987Barnert, H., Singh, I, Niefien, H.F., Neis, H., Hohn, H.: Potential-Studie zur Kohleveredlungdurch Wasserdampf/Kohle-Vergasung (WKV) mit Hochtemperaturreaktor-(HTR)-Warme,Verbesserungspotential durch verfahrenstechnisch-reaktortechnische Entwurfe,Title in English: Potential Study for the Refinement of Coal by the Steam Coal GasificationProcess (SCG) Using High Temperature Reactor-(HTR)Heat, Potentials of Improvements byDesigns Regarding Chemical Engineering and Nuclear Engineering.Forschungszentrum Julich GmbH, KFA, Institut fur Reaktorentwicklung, JUL-2131, Mai1987.
RUSLI-1995-1Rusli, Amir: C02 Reforming for Methanol Production, Workshop and Seminar on HighTemperature Technology and Applications II, Theme ,,Nuclear Technology Applications in the21th Century, Fissile and Fossile Synergetic Approach", National Atomic Energy Agency ofIndonesia, BAT AN, Jakarta, Indonesia, 18 and 19 Jan. 1995.
RUSLI-1995-11Rusli, Amir: Private Communication: The price of gasoline at the gas filling station inIndonesia in 1995 is 700 Rupiah per liter.
SANTOSO-B ARNERT-1995Santoso, Budi; Barnert, H.: Notes on HTR Applications in Methanol Production, the IAEA-Advisory Group Meeting on ,,Non-Electrical Application of Nuclear Energy", Jakarta, 21-23Nov. 1995.
SASMOJO-SUBKI-LASMAN-1995Sasmojo, Saswinadi; Subki, lyos, R.; Lasman, AsNatio: Strategic areas for non-electricapplication of nuclear energy, IAEA-Advisory Group Meeting on ,,Non-Electrical Applicationof Nuclear Energy", Jakarta, Indonesia, 21-23 Nov. 1995.
406

REACTOR PHYSICS CALCULATIONS ON XA9846697THE DUTCH SMALL HTR CONCEPT
J.C. KUIJPER, J.B.M. DE HAAS, H.TH. KLEPPEL,A. HOGENBIRK, J. OPPE, C. SCIOLLA,R.C.L. VAN DER STAD, B.C. ZHANGNetherlands Energy Research Foundation,Petten, Netherlands
Abstract
As part of the activities within the framework of the development of INCOGEN, a"Dutch" conceptual design of a small HTR, the ECN reactor physics code system has beenextended with the capability to perform combined neutronics and thermal hydraulicssteady-state, burnup and transient core calculations on pebble-bed type HTRs, by joiningthe general purpose reactor code PANTHER and the HTR thermal hydraulics codeTHERMDC/DIREKT in the PANTHERMDC code combination. The validation of the ECNcode system for HTR applications is still in progress, but some promising first calculationresults on unit cell and whole core geometries are presented, which indicate that theextended ECN code system is quite suitable for performing the pebble-bed HTR corecalculations, required in the INCOGEN core design and optimization process.
1. INTRODUCTION
In 1993 an HTR project was initiated at ECN within a wider national Dutch nucleardevelopment programme. The most important activity at ECN comprises the first effortstowards a "Dutch" conceptual design of a small HTR. The plan is to compose andoptimize a modular HTR design, best suited to Dutch development and marketcircumstances, built out of components of existing design, always keeping in mind thecosts of development and market introduction.
This paper is primarily devoted to the validation of the ECN reactor physics code systemOCTOPUS for the reactor physics analyses of the first selection of a small 40 MWth HTRconcept. This first concept, INCOGEN, which stands for Inherently safe NuclearCOGENeration [1], is primarily based on the Julich PAP20 reactor [2]. Emphasis is put onthe calculation of safety related physics parameters, like reactivity coefficients anddynamic behaviour during transients.
The ECN reactor physics analysis code system OCTOPUS [3] covers the whole rangefrom nuclear model calculations upto whole-core calculations. Within this code packagedifferent calculational approaches can be used to solve the same problem, e.g.deterministic versus Monte Carlo. In the OCTOPUS code system several codes and codesystems, including NJOY, SCALE-4, KENO-V, DORT/TORT, WIMS, MCNP4A andPANTHER are interconnected, and also connected to the point-depletion codes ORIGEN-Sand FISPACT-4. In Section 2.1 a brief description will be given of the ECN reactorphysics code system OCTOPUS in general and with respect to the application in HTRreactor physics calculations.
407

Recently the capabilities of the ECN reactor physics code system have been extended withthe possibility to perform pebble-bed HTR core physics calculations. Both steady-state andbumup core physics and reactivity transient calculations for High Temperature Reactorsare being performed by connecting the general purpose modular reactor code PANTHER[4,5] and the HTR thermal hydraulics module THERMIX/DIREKT [6] from KFA Julichin a code combination PANTHERMIX. Some features of this code combination arepresented in Section 2.2.
Until a couple of years ago no HTR reactor physics calculations had been performed withthe ECN code system. Consequently, benchmarking of our code system withcomputational and experimental benchmarks was required. Therefore ECN has beenparticipating in the IAEA Coordinated Research Programme on "Validation of SafetyRelated Calculations for Low-Enriched HTGR's". In this programme institutions fromJapan, China, USA, Russia, Germany, Switzerland, France and The Netherlands arecollaborating in benchmark calculations for the HTR-PROTEUS experiment in Villigen,Switzerland, which deals with the well-known spherical fuel elements with a diameter of6 cm. In Section 3 some results will be presented of the validation of the ECN codesystem for these steady-state HTR applications. An intercomparison is made between theHTR-PROTEUS benchmark calculation results of the deterministic code packages WIMS(versions E-5 and 6) and SCALE-4, and the Monte Carlo code MCNP4A.
The feasibility of the PANTHERMIX code combination for steady-state, burnup andtransient calculations is being demonstrated in a benchmark exercise on the PAP20 pebble-bed reactor, which is carried out together with KFA Julich, comparing the ECN codepackage, in particular the PANTHERMIX code combination, with the KFA HTR codepackage. The benchmark exercise is still in progress, but in Section 4 some results will bepresented of steady state and reactivity transient calculations on the PAP20 reactorconcept. The final benchmark comparison results will be reported at a later stage.
Presently the core physics calculations for the "Dutch" small 40 MW reactor conceptINCOGEN are still in progress, but in Section 5 some first results will be presented fromthe whole-core calculations with the coupled neutronics-thermal-hydraulics codecombination PANTHERMIX for the first version of INCOGEN. Also some results will bepresented of MCNP shielding calculations on the INCOGEN conceptual design.
2. OCTOPUS - THE ECN REACTOR PHYSICS CODE SYSTEM
2.1. General aspects
The ECN reactor physics analysis code system covers the whole range from basic nucleardata libraries and nuclear model calculations, through (pin-)cell and assembly calculationsupto 3-D combined neutronic and thermal hydraulic whole-core calculations. The codesystem includes internationally recognized codes as NJOY (Los Alamos NationalLaboratory; basic nuclear data processing and library generation), SCALE (Oak RidgeNational Laboratory; deterministic neutron transport for (pin-) cells and assemblies),WIMS (AEA Technology, U.K.; deterministic neutron transport and diffusion for a varietyof core subsystems), MCNP (LANL; general purpose continuous energy Monte Carlo),KENO (ORNL; groupwise Monte Carlo), ORIGEN (ORNL; fuel depletion and activationsource terms), FISPACT (AEA Technology, U.K.; fuel depletion and activation) andPANTHER (Nuclear Electric, U.K.; steady-state, burnup and transient core physics) [4,5].
408

The maintenance, verification, validation and application of the codes is subject to strictquality assurance procedures, which guarantee the tracebility and reproducebility of theresults obtained.
A relatively new development at ECN is the OCTOPUS system [3], which interconnectsand integrates the codes and code systems mentioned above. This provides flexibility andthe possibility of parallel routes through the entire code system, which also enablesinternal verification of calculation results: the same calculation result can by obtained bytaking different routes through the code system, i.e. within the code system differentcalculational methods, e.g. deterministic and Monte Carlo, can be used to solve the sameproblem. At the moment all reactor physics codes use nuclear data libraries based on theJoint Evaluated File JEF-2.2, but for special purposes the basic nuclear data libraries canbe extended.
The OCTOPUS code system is mainly being applied for criticality calculations, shieldinganalyses, HFR (High Flux materials testing Reactor) calculations, and cell and assemblycalculations, in which reactivity coefficients and bumup effects for PWR, BWR, andCandu geometries are determined. Also sensitivity and uncertainty analyses for reactivitycalculations and shielding applications can be carried out in this code system.
For steady-state neutronics HTR calculations initially the deterministic codes SCALE(version 4.1) and WIMS (versions E-5, 6 and 7) and the continuous energy Monte Carlocode MCNP (version 4A) [7] code were selected [8,9]. The SCALE system uses theNordheim method (in the NTTAWL code) for the resolved resonance treatment and theBondarenko method (in the BONAMI code) for the unresolved resonance treatment. Inboth methods a Dancoff factor is applied in the treatment of the spatial heterogeneity.One-dimensional neutron transport calculations (in slab, cylindrical or spherical geometry)can be performed with the XSDRN code. However, in the SCALE code system no specialoptions exist to treat the double heterogeneous geometry of HTR fuel (spherical fuelpebbles and cylindrical fuel compacts). Therefore, the calculation for a unit cell isperformed in two stages [8,9]. First a "micro cell" (or grain cell) calculation is performedby BONAMI, NTTAWL and XSDRN in the fine (172-group) energy group structure. Thecalculated neutron flux distribution in the micro cell is used to homogenize the fuel grainwith the coatings and the matrix. This mixture is then used in a "macro cell" XSDRNreactivity calculation in which the entire fuel pebble (or compact) and moderator pebbles(if required) are modelled. The XSDRN neutron transport calculations can be performedusing S32 quadrature and P5 scattering order. The Dancoff factor for the doubleheterogeneous geometry, required in BONAMI and NTTAWL, is calculated by the MCNPcode, employing a special option built in by ECN [8,9].
The WIMS code (versions E-5, 6 and 7) contains a special module, PROCOL, which canexplicitly treat the double heterogeneity associated with granular fuel in HTR fuelelements, both in the resonance shielding treatment by the subgroup method and thesubsequent multi-group neutron transport calculation [10]. PROCOL was designed forspherical fuel grains (with possible coatings) embedded in an annular structure of matrixmaterial, which is the correct geometry for the fuel compacts in MHTGR-like reactors [9].As PROCOL is not capable of treating grains in spheres, an equivalent cylinderapproximation was used to model fuel pebbles containing grains. In the equivalent cylinderapproximation the radius of the fuel zone containing the grains is chosen in such a waythat the average chord length of the spherical fuel zone is preserved, thereby preservingthe escape probability in the fuel zone. In order to check this approach, MCNP
409

calculations were performed for both models. A good agreement between equivalentcylinder and spherical unit cell is observed [8,9]. The deviation in k^ is within thestatistical uncertainty (~ 0.1 %), whereas the deviation in spectral indices is less than 3 %.
For whole-core calculations the SNAP diffusion module is available in WIMS, which cantreat e.g. 2-D R-Z and 3-D Hex-Z geometries. The latter is useful for modelling MHTGR-type geometries (consisting of hexagonal blocks), but it can also be used to approximatecylindrical structures (like pebble-bed HTRs) by specifying a small flat-to-flat distance ofthe hexagons (in the order of centimetres). The SNAP module initially has been checkedfor HTR application by comparing 2-group SNAP diffusion calculations and fine-groupneutron transport calculations by the WIMS modules PROCOL and THESEUS for thesame (cylindrical) geometry, yielding satisfactory agreement [9]. Further validation ofSNAP (also in multigroup mode) has been done in the framework of the HTR-PROTEUSand PAP20 benchmark studies, presented in this paper.
The continuous energy Monte Carlo code MCNP (version 4A) offers the possibility tomodel explicitly all details of a 3-dimensional geometry. E.g. fuel grains (including thecoating shells) in a unit cell can be modelled, thereby explicitly treating the doubleheterogeneity, but it is also possible to model fuel grains in pebbles in a complete (3-D)reactor [7,8]. In view of its extensive geometric and explicit resonance treatmentcapabilities the MCNP code was selected for reference calculations and also for shieldingcalculations.
In order to validate the codes mentioned above for steady-state pebble bed HTRapplications, calculations have been performed within the framework of theHTR-PROTEUS benchmark [11]. In Section 3 some results will be presented of cell andwhole core HTR-PROTEUS calculations by the three code systems.
For the HTR power reactor physics calculations the core physics code PANTHER wasselected. The commercially available, general purpose modular reactor code PANTHER[4,5] has been in use at ECN for some time now. The code's capabilities comprisesteady-state, burnup and transient combined reactor physics (neutronics) and thermalhydraulics calculations for a number of different reactor types. Its main areas ofapplication concern light water (PWR, BWR) and gas cooled (Magnox, AGR) reactors, forwhich thermal hydraulic models are included in the code. However, the code does notcontain a model for detailed thermal hydraulics (including more-than-one-dimensional heattransfer) of hexagonal prismatic or pebble-bed High Temperature Gas-cooled Reactors. Forthe purpose of pebble-bed HTR core physics calculations the thermal hydraulic codeTHERMIX/DIREKT [6] from KFA Jiilich has been combined with the PANTHER code,enabling both steady state and bumup core physics and reactivity transient calculations.
2.2. PANTHERMIX - a PANTHER-THERMIX/DIREKT interaction
The combined code system PANTHER-THERMIX/DIREKT (PANTHERMIX) [12]consists of the PANTHER code, which calculates (in steady-state and transient mode) the3-dimensional neutron flux and power distribution for a given temperature distribution, theTHERMIX/DIREKT [6] code, which calculates (in steady-state or transient mode) thetemperature and flow distribution for a given power distribution, and two interface codesfor data transfer and format conversion between the main codes. THERMIX/DIREKT isan improved version of the THERMDC/KONVEK module of the VSOP code [13]. The
410

combined code system is controlled from the PANTHER code, which calls the interfacingcodes and THERMIX/DIREKT from within a calculation loop.
It is important to note that for the development of the combined code systemPANTHERMDC no changes to the PANTHER code were required (Quality Assurance!)and that only minor changes were required to the THERMIX/DIREKT code. Thesechanges concern only in/output procedures to generate of files containing data (fluid- andsolid-state temperature distributions) to be transferred to PANTHER through one of theinterfacing codes. The transfer of data (power distribution) from PANTHER toTHERMIX/DIREKT is also performed by an interface code, which generates part of theTHERMIX/DIREKT data input from the power distribution information contained in astandard formatted, generated by PANTHER.
In order to check the suitability of the PANTHER neutronics modelling for HTRapplications an intercomparison was carried out, within the framework of an MHTGRbenchmark exercise [9], between the WIMS module SNAP (in 2-D R-Z and 3-D Hex-Zmode) and PANTHER (in 3-D Hex-Z mode), both using 2-group nuclear constantsgenerated by the WIMS code package, employing the PROCOL module. A very closeagreement (within 1 pcm) was found for k,.ff (in Hex-Z geometry). Also the agreementbetween the calculated k^ for Hex-Z and R-Z geometries hi SNAP (preserving materialvolumes) was found to be quite close [9], from which it may be concluded that acylindrical structure (such as a pebble-bed HTR) can be approximated, for neutronicspurposes, by a Hex-Z geometry, provided that the hexagons are not too large.
This is very important for the development of the PANTHERMDC code combination, inview of the fact that PANTHER has to approximate the 2-D R-Z geometrical structureemployed in THERMDC/DIREKT by a 3-D Hex-Z model with small ("mini") hexagons.This is done as follows. A radial mesh in the THERMDC/DIREKT geometry specificationcan be associated with a set of hexagons in the PANTHER geometry description, of whichthe total area is equal to the area of the THERMIX/DIREKT radial mesh (see FIG. 1and 2). For radial meshes and hexagon sets associated in this way the power distributionand temperature distribution information is transferred between the codes. The linearpower densities for a set of hexagons associated with a particular radial mesh, ascalculated by PANTHER, are averaged and transformed into a power density for theassociated radial mesh, as required by THERMDC/DIREKT, thereby preserving the totalmesh power. The fluid and solid-state temperatures for a radial mesh, as calculated byTHERMDC/DIREKT, are transferred to all associated hexagons.
The procedure described above is followed for each axial mesh. For the axial direction nospecial treatment is necessary as the axial geometry can be modelled in the same way inboth PANTHER and THERMDC/DIREKT.
PANTHERMDC requires a nuclear database containing - presently - 2-group nuclear datafor all reactor materials, depending on irradiation, fuel temperature, xenon density, etc.The WIMS code (version 7) was selected to generate these databases, in view of thepresence of the special PROCOL module and also because of the possibility to performbumup calculations in a convenient way within the WIMS7 code system. The WIMS7code system also provides the 6-group delayed neutron data (yields P;), required fortransient calculations by PANTHER. In the near future a multigroup (up to 12 neutronenergy groups) version of PANTHER will be operational.
411

14 16 18 20 22 24 26 28 30 32 M 36 38 « > « « 4«15 17 19 21 23 23 27 29 31 33 35 37 34 41 43 4i
IS 17 19 21 23 25 V 29 31 33 35 37 39 41 43 4514 16 II 20 22 24 26 28 V) 32 3« 36 3» 40 42 44 46
FIG. 1 "Mini" hexagon structure in PANTHER. The numbers indicate the associated radialmesh in FIG. 2.
FIG. 1 Radial mesh structure in THERMEX/DIREKT, corresponding to the "mini" hexagonstructure shown in FIG. 1.
412
In the PANTHERMK code combination the core height of the pebble-bed HTR model(i.e. the position of the boundary between the core and the gas space) can be variedcontinuously by making use of the control rod treatment method of the PANTHER code.In the PANTHER part of PANTHERMIX this treatment uses "unrodded" material (the fuelpebbles) and "rodded" materials (the gas space above the core). The boundary between the"rodded" and "unrodded" material is marked by the position of the "control rod" tip. Alsowithin-node "rod tip" positions are possible, in which case the "rodded" and "unrodded"material properties (viz. 2-group nuclear constants) for that particular node are mixed byaxial flux-volume weighting. In the THERMIX/DIREKT part of PANTHERMIX theboundary between the top of the core and the gas space must coincide with an axial meshboundary. PANTHERMIX automatically selects the top layer of the core in theTHERMIX/DIREKT model in such a way that the actual upper boundary of the core, inthe PANTHER model, is contained in the core top layer of the THERMIX/DIREKTmodel, thereby also avoiding direct energy production in the gas space.
As PANTHER uses diffusion theory, calculational stability problems can be expectedwhen using the actual diffusion coefficients (in the order of metres) in the gas spaces.Gerwin and Scherer have provided a recipe [14] to calculate the effective radial and axialdiffusion coefficients in a cylindrical gas (or vacuum) space. This recipe is succesfullyapplied in our pebble-bed HTR PANTHER calculations. However, the calculated Ic^ andflux shapes are not sensitive to changes in the diffusion coefficients in the gas space, aslong as these coefficients are still large.
The PANTHERMDC code combination can be used for both steady-state and transientpebble-bed HTR calculations. For some transient scenarios (e.g. LOCA - Loss Of CoolantAccident) the reactor is subcritical for an extended period of time until recriticality (as aconsequence of xenon decay and decreasing temperatures) occurs. In order to preventnumerical instability and precision problems as the power keeps on decreasing during thatperiod, a fixed source is modelled as a seventh delayed neutron group with a very smallyield (& - 1.0 x 10'9) and a small decay constant (A, - 1.0 x 10'5 s'1; T1/2 - 19.3 h). In thecases studied this puts a lower limit on the reactor power of about 0.5 W.
The decay heat is modelled in PANTHER according to [15], employing 23 decay heatgroups.
Presently a benchmark exercise is being carried out, together with KFA Julich, on thePAP20 pebble-bed HTR, comparing PANTHERMIX with the KFA HTR code package. InSection 4 some initial results will be presented of steady-state, burnup and transientcalculations on the PAP20 reactor, demonstrating the feasibility of the PANTHERMIXcode combination for pebble-bed HTR applications.
3. PROTEUS BENCHMARK EXERCISE
3.1 Introduction
In the framework of the IAEA Co-ordinated Research Programme (CRP) on "Validation ofSafety Related Physics Calculations for Low-Enriched (LEU) HTGRs" calculationalbenchmarks are performed on the basis of LEU-HTR pebble-bed critical experimentscarried out in the PROTEUS facility at PSI, Switzerland. ECN joined this CRP early 1994with the aim to validate the available reactor physics codes and nuclear data for applicati-
413
on to this type of reactors. Of special interest is the treatment of the double heterogeneityof the fuel particles and the spherical fuel elements of these pebble bed core configurati-ons. Also of interest is the proper calculation of the safety related physics parameters, likethe effect of water ingress and control rod worth.
3.2. Problem description
The PROTEUS benchmark consists of a series of 6 graphite reflected 16.7 % enricheduranium pebble bed systems, named LEUPRO-1 to LEUPRO-6 [11]. There are 3 differenttypes of geometrical arrangements of the pebble bed lattice (with packing fractions 0.74,0.60 and 0.62, respectively) and 2 different moderator to fuel pebble ratios (1/2 and 2/1,respectively). The pebble diameter is 6 cm. Each fuel pebble contains about 9400 coatedparticles (in total about 1 g 235U) in a graphite matrix. The diameter of the fuel zone is5 cm. The coated particles (TRISO type) consist of a fuel grain with a diameter of 500 umand 4 layers of different coatings, with a total diameter of 915 um.
In the PROTEUS facility the cylindrical core, which is filled with fuel and moderatorpebbles, has a diameter of 125 cm, and is surrounded by radial and axial graphitereflectors. The control and shutdown rods are situated in the radial reflector. The core isfilled until criticality is reached.
The benchmark exercise comprises unit-cell calculations and whole-core calculations forthe 6 different pebble-bed configurations. Unit cell calculations have been performed withWIMS (versions E-5 and 6) for LEUPRO-1 till -6, and with SCALE-4 and MCNP4A forLEUPRO-1 and -2 only (hexagonal closed-packed configuration with M/F ratio of 1/2).Whole-core calculations have been performed with WIMS (versions E-5 and 6) forLEUPRO-1 till -6 and with MCNP4A for LEUPRO-1. Emphasis is put on theintercomparison of the results obtained by the deterministic codes and the reference MonteCarlo calculations. For intercomparison of the codes all the ECN codes will make use ofJEF-2.2 based nuclear data libraries.
3.3. Unit cell calculations
In the unit cell the fuel zone is represented by a sphere of 5 cm diameter surrounded by a5 mm thick graphite shell, which together represent the fuel pebble. Around this fuelpebble sphere a spherical shell with outer diameter of 7.592 cm (for the LEUPRO-1 unitcell) represents the homogenized mixture of moderator pebbles and lattice void.
The unit eel calculations were performed for the single heterogeneous model and thedouble heterogeneous model. In the single heterogeneous model the coated particles andthe matrix material in the fuel pebbles are homogenized over the fuel zone of 5 cmdiameter. Of special interest are the cell calculations of the double heterogeneous model,in which the fuel grains are explicitly modelled inside the fuel zone of the fuel pebbles.
TABLE I, n and HI show the final results of the double heterogeneous unit cellcalculations for LEUPRO-1 and -2 (which are representative for the entire series ofLEUPRO cases) obtained with WIMS (using the 69-group "1986" library and the172-group, JEF-2.2 based "1993" "XMAS" library), SCALE-4 and MCNP4A. Also foreach item to be determined the benchmark average [16] is presented. Good agreement of
414

TABLE I Unit cell calculation results for LEUPRO-1.
UB2 = 0)
UB2 = BCT2)
Bcr2 (cm'2)
M2 (cm2)
P28
625
628
C*
TABLE H Unit
k.(B2 - 0)
kJB2 = BCT2)
BCT2 (cm'2)
M2 (cm2)
P28
S25
S28
c*
WIMS6(172 gr.)
1.72741.67757.91 -10-4
8577.68
0.1101.85 -10'3
0.193
SCALE(172 gr.)
1.7271.678--
7.68
0.1091.85 -10'3
0.193
cell calculation results for LEUPRO-1
WIMS6(172 gr.)
1.5981.582-
-
3.240.0460
1.55 -10'3
0.0971
TABLE m Unit cell calculation
UB2 - 0)k«(B2 = Bcr
2)
BCT2 (cm'2)
M2 (cm2)
P28
S25
g28
C*
WIMS6(172 gr.)
1.75661.7198
6.57 -10'4
10964.17
0.05831.178 -10'3
0.119
SCALE(172 gr.)
1.597
1.582
-
-
3.250.0457
1.54 -10'3
0.0976
results for LEUPRO-2SCALE(172 gr.)
1.756
1.720
-
-
4.17
0.0578
1.200 -lO'3
0.119
MCNP
1.7291.681--
7.57
0.1091.85 -10'3
0.191
with 20 vol. %
MCNP
1.6001.573
-
-
3.330.0456
1.53 -10'3
0.0992
MCNP
1.7561.722
-
-
4.21
0.0591
1.230 -10'3
0.120
BM average[16]
1.71841.6721
7.73 -10-4
874
7.65
0.112
1.647 -10'3
0.1921
water.
BM average[16]1.5971
1.57911.325 -10'3
438
3.280.0467
1.379 -10'3
0.0988
BM average[16]
1.7508
1.7154
6.40 -10'4
1117
4.17
0.05930.958 -10-3
0.1188
415
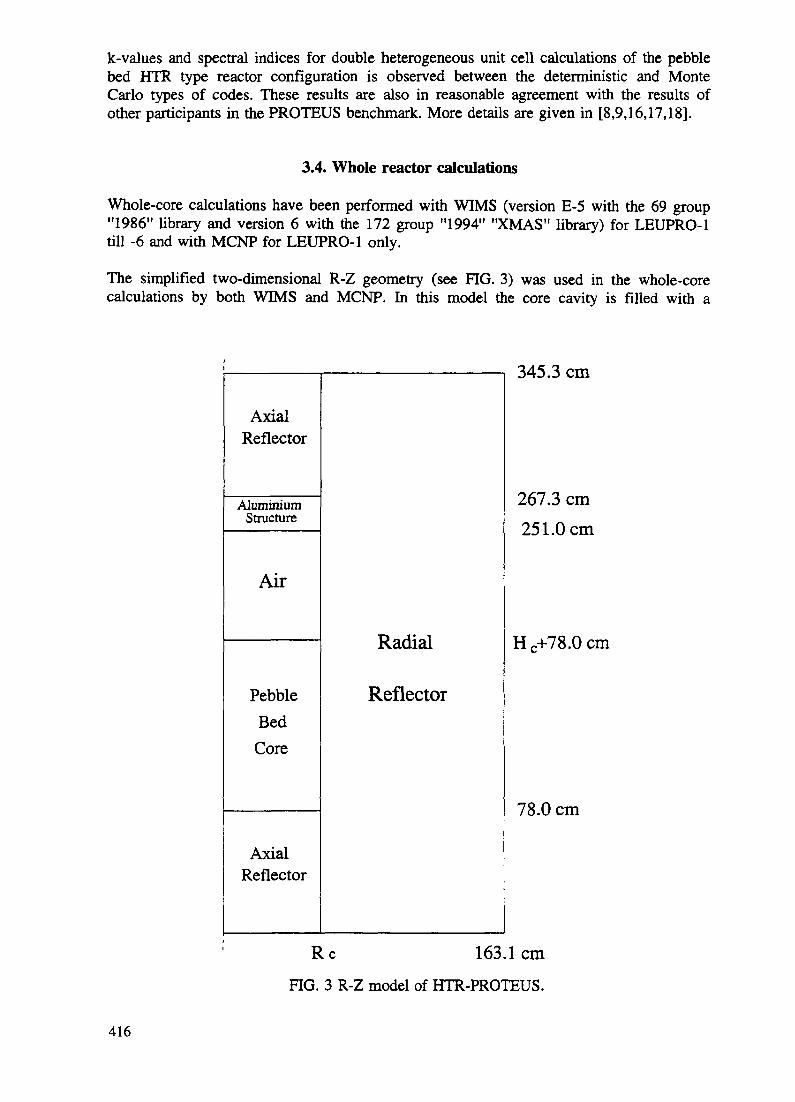
k-values and spectral indices for double heterogeneous unit cell calculations of the pebblebed HTR type reactor configuration is observed between the deterministic and MonteCarlo types of codes. These results are also in reasonable agreement with the results ofother participants in the PROTEUS benchmark. More details are given in [8,9,16,17,18].
3.4. Whole reactor calculations
Whole-core calculations have been performed with WIMS (version E-5 with the 69 group"1986" library and version 6 with the 172 group "1994" "XMAS" library) for LEUPRO-1till -6 and with MCNP for LEUPRO-1 only.
The simplified two-dimensional R-Z geometry (see FIG. 3) was used in the whole-corecalculations by both WIMS and MCNP. In this model the core cavity is filled with a
345.3 cm
AxialReflector
AluminiumStructure
Air
PebbleBedCore
AxialReflector
Radial
Reflector
267.3 cm251.0cm
Hc+78.0cm
78.0 cm
Re 163.1cmFIG. 3 R-Z model of HTR-PROTEUS.
416

235
34.0
^ 32.0(D
"E
.o•£ 30.0"55ffi
28.0
o
24.00.0
U fission rate radial distributions(r,z) model for LEUPRO-1
——— WIMS6——— MCNP
26.0-- —
20.0 40.0distance from the center (cm)
60.0
FIG. 4 Comparison of WTMS and MCNP calculation results: radial distribution of thefission rate for LEUPRO-1.
1.040
The effect of the number of energy groups on K-eff(r,z) model for LEUPRO-1 (H=99cm)
1.030 -
03
1.020
1.010
0——OWIMS60——DWIMSE5A
"2.0 8.0 14.0The number of energy groups (in SNAP calculation)
-O
FIG. 5 Influence of the number of energy groups on the calculated kjg, as calculated byWIMS/SNAP in 2-D R-Z mode for LEUPRO-1.
417
mixture of fuel and moderator pebbles. The core is surrounded by radial and axialreflectors. Between the pebble bed core and the upper axial reflector, there is a void spaceand an aluminium structure which is 16.3 cm thick.
In WIMS the whole core calculations have been performed with the diffusion moduleSNAP (in 2-D R-Z geometry) with a small number of energy groups (varying from 2 to16 groups). The few-group cross sections for all materials and zones were generated bycondensing fine energy groups after one-dimensional radial and axial calculations with theWIMS modules PROCOL and THESEUS, respectively. In MCNP the LEUPRO-1 core (inthe R-Z geometry as of FIG. 3) with all individual fuel and moderator elements wasexplicitly modelled in closed packed hexagonal geometry.
TABLE IV, V and VI show the results of whole core calculations for LEUPRO-1 and -2(which are representative for the entire series of LEUPRO cases), obtained withWIMS/SNAP (10 energy groups) and MCNP (for LEUPRO-1 only). For each item to bedetermined also the average outcome of the calculations of all benchmark participants ispresented [16]. For LEUPRO-1 (with and without water ingress) a good agreement isfound between the results obtained with WIMS (version 6) and those obtained withMCNP, with both codes using JEF-2.2 based nuclear data libraries. Also a reasonableagreement is found with the results of the other benchmark participants. However, the 1^-and kjff-values, as calculated by the various participants, agree much better with each otherthan the spectral indices, which may be associated to compensating errors in theeigenvalue calculations. The values of 828 and - to a lesser extent - S25 are particularlydiscrepant between the various participants [16], which calls for a further investigation.
The good agreement between the WIMS and MCNP results is demonstrated once more inFIG. 4, which shows the 235U fission rate distribution for LEUPRO-1 in radial direction, ascalculated by WIMS and MCNP.
In the analysis also the influence of different mesh sizes, geometry descriptions andnumber of energy groups have been examined [18]. In FIG. 5 the influence is shown ofthe number of energy groups in the 2-D R-Z SNAP calculation on the value of k^ for theLEUPRO-1 case. For an increasing number of energy groups a lower value of kjff isfound. So, a 2-group calculation, as is performed e.g. with the PANTHER code, isexpected to yield a conservative value for k^.
3.5 Conclusions
Calculations have been performed, by the WIMS, SCALE and MCNP codes, for unit celland whole reactor geometries of the LEUPRO-1 till -6 cases of the HTR-PROTEUSbenchmark. For the unit cell calculations a particularly good agreement was found betweenthe results of the codes in use at ECN and also generally a good agreement was foundwith the results of the other benchmark participants. Also for the whole reactorcalculations a good agreement was found between the results of the WIMS and MCNPcodes.
The results obtained with the WIMS, SCALE and MCNP codes for the unit cellcalculations, and those obtained with WIMS and MCNP for the whole core PROTEUScalculations indicate that the codes in use at ECN are quite suitable for (steady-stateneutronics only) pebble-bed HTR applications. For further investigations, in particular theINCOGEN core design and optimization, the WIMS code (version 7) was selected forsteady-state calculations (without thermal hydraulics feedback) and nuclear database
418
generation for combined neutronics/thermal hydraulics calculations by PANTHERMIX.For selected cases, the WIMS (and PANTHER) calculation results will be checked againsta detailed geometry/continuous energy reference calculation by the MCNP code.
Presently, the MCNP code, and associated cross section library, is being validated furtherfor pebble-bed HTR applications by calculating the PROTEUS Core 5 experiment. Firstresults indicate that MCNP reproduces very well the experimental value of
4. PAP BENCHMARK
4.1. Introduction
PAP20 is a conceptual design of KFA Jiilich for a small simplified pebble bed reactor of20 MW (thermal) where new fuel elements are added little by little (i.e. peu a peu) [2].No fuel is removed during the life of the core. At End Of Life (EOL) all fuel elements areunloaded in one step. The initial core height is about 1 m. At the end of the core life(about 18 years) the core height is about 4 m. This fuelling mode avoids the handling ofirradiated elements over the core life and devices for fuel unloading during reactoroperation are superfluous.
In view of its simplicity (no fuel unloading during operation, no fuel recycling) the PAP20was selected to serve as benchmark for the validation of the PANTHERMIX codecombination for steady-state, bumup and transient pebble-bed HTR core calculations.Presently this benchmark study is being carried out, together with KFA Julich, comparingthe code system is use at KFA (viz. VSOP [13]) with PANTHERMIX, and also withWIMS/SNAP and MCNP, for selected steady-state cases.
The benchmark exercise is still in progress, but some first results of steady-state, burnupand transient calculations on the PAP20 by the PANTHERMIX code combination will bepresented.
4.2. Benchmark description
In FIG. 6 the - simplified - PAP20 geometry is presented, together with the geometry ofthe first conceptual design of the INGOGEN reactor (to be discussed in Section 5), whichis almost identical to the PAP20, except for the B4C-layer in the bottom reflector. InTABLE Vn the main parameters of both PAP20 and INCOGEN (first concept) are listed.In both reactors the fuel is contained in the well-known 6 cm fuel pebbles. Compared tothe original PAP20 model some radial dimensions have been slightly changed, in order tofacilitate "mini-hexagon" modelling in the PANTHER part of PANTHERMIX. Furtherdetails of the (modified) PAP20 reactor will be given in the benchmark report (to bepublished).
The PAP20 benchmark exercise comprises initial (Beginning Of Life - BOL) steady-state,bumup (fill up) and transient calculations. Presently, only the definition of the initialsteady-state part has been agreed upon by ECN and KFA. The definition of the burnupand transient cases is in progress. However, some preliminary calculations, based onproposed specifications, have already been performed. The final specifications of allbenchmark cases will be included in the forthcoming benchmark report.
419
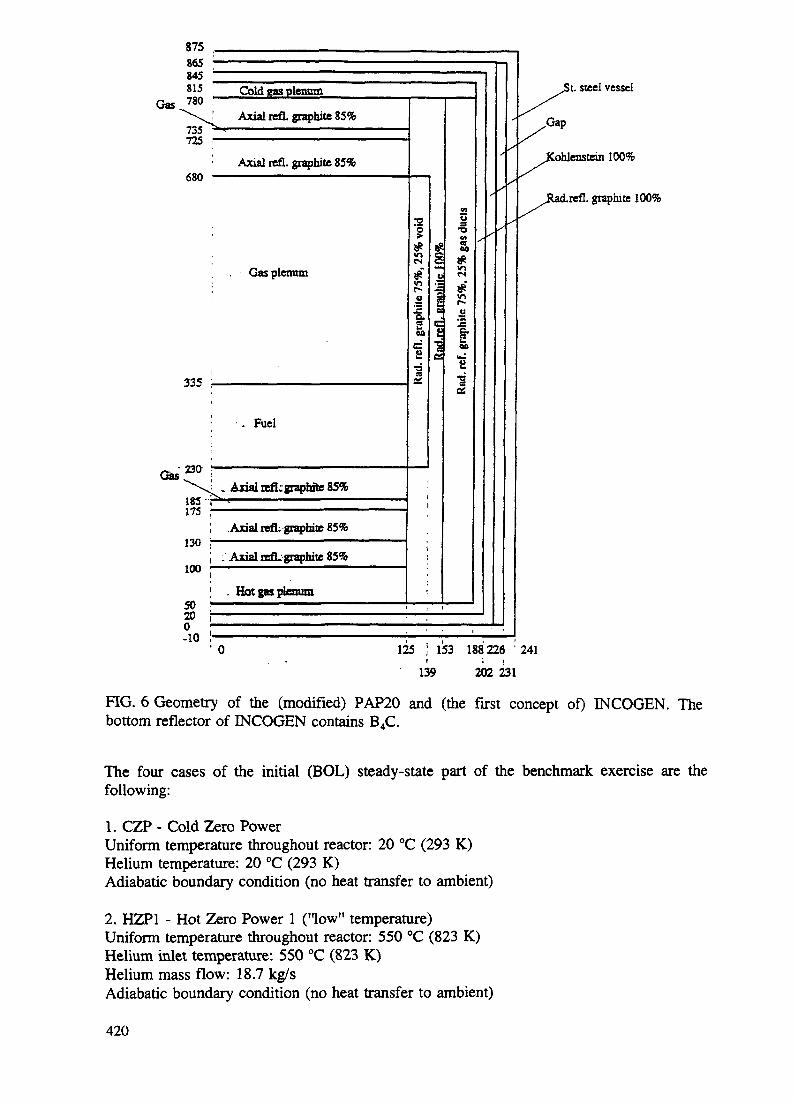
875
Gas.
Gas
865 : ———————————————————845815 Cold gas plenum780 ."- " —— B"-r'-
^\l Axial refl. graphite 85%
725 i ——————————————————————
' Axial refl. graphite 85%
Gas plenum
iT15
. Fuel
ZJU
^\ . Anal refl; graphite 85%
175 ————————————————————————.Axial refl; graphile 85%
!.?« t
; _ Axial cefL graphite 85%100 _ , , , . , _ ,„_..
; . Hot gas plenum50 i ————————————————————20 , •°,n i
Rad.
refl.
gra
phile
75%
, 25%
voi
d
i
t
iij
jeet
CflUa•o
1#V~lcs>*"8SPC
1SO«J&"SK
''**
^
1 0
stein 100%ICohlensteii
Radrefl. graphite 100%
St. steel vessel
.Gap
125 I 153 188 226 ' 241139 202 231
FIG. 6 Geometry of the (modified) PAP20 and (the first concept of) INCOGEN. Thebottom reflector of INCOGEN contains B4C.
The four cases of the initial (BOL) steady-state part of the benchmark exercise are thefollowing:
1. CZP - Cold Zero PowerUniform temperature throughout reactor: 20 °C (293 K)Helium temperature: 20 °C (293 K)Adiabatic boundary condition (no heat transfer to ambient)
2. HZP1 - Hot Zero Power 1 ("low" temperature)Uniform temperature throughout reactor: 550 °C (823 K)Helium inlet temperature: 550 °C (823 K)Helium mass flow: 18.7 kg/sAdiabatic boundary condition (no heat transfer to ambient)
420
3. HZP2 - Hot Zero Power 2 ("high" temperature)Uniform temperature throughout reactor: 750 °C (1023 K)Helium inlet temperature: 750 °C (1023 K)Helium mass flow: 18.7 kg/sAdiabatic boundary condition (no heat transfer to ambient)
4. HFP - Hot Full Power (nominal conditions; see TABLE VH)Power: P^ - 20 MWXe-equilibriumHelium inlet temperature: 550 °C (823 K)Helium outlet temperature: -750 °C (1023 K)Helium pressure: 50 barNominal helium mass flow: 18.7 kg/sHeat transfer coefficient to ambient: a - 10"3 W/cm2K or a = 10"6 W/cm2K (approx.adiabatic)Search on helium mass flow to reach criticality
4.3. Calculation method
At ECN, the PAP20 benchmark core calculations are generally being performed by thePANTHERMDC code combination in 2 energy groups. In the PANTHER part of thePAP20 model, the 2-D R-Z structure is approximated by a 3-D Hex-Z structure, consistingof "mini-hexagons" with a flat-to-flat distance of 14.96 cm (i.e. an area of 193.92 cm2). Asmentioned above, the original radial mesh dimensions of the PAP20 have been slightlychanged to ensure equivalence of corresponding volumes between the Hex-Z and R-Zdescriptions of the geometry.
Reference calculations for the initial steady-state cases with negligible thermal hydraulicfeedback (i.e. with approximately uniform temperature throughout the geometry) have alsobeen performed by WIMS/SNAP (R-Z, multigroup diffusion theory) and MCNP (R-Z,continuous energy Monte Carlo).
For PANTHER calculations a nuclear database is required, which contains 2-group nuclearconstants for all reactor materials, depending upon e.g. (local) irradiation (burnup) and(local) temperature. The nuclear database for the HTR applications presented here wasgenerated by WIMS (version 7) burnup and branching calculations in a 1-D cylindricaland in a 1-D slab pseudo reactor, respectively, using the 69-group WIMS "1995" library,based on JEF-2.2.
4.4. Initial steady-state calculations
One of the items to be determined for the initial steady-state cases is the critical coreheight. In PANTHERMDC the critical core height search can be performed by actuallyadjusting the core height continuously (employing the control rod insertion mechanism ofPANTHER) until criticality is reached. For the codes WIMS/SNAP and MCNP the criticalcore height search is performed by calculating k^ voor different core heights Hc. As l/k^is, to a very good approximation, a linear function of 1/HC
2, the critical value of Hc can beeasily obtained.
421

TABLE IV Whole core calculation results for LEUPRO-1.
k^H = 99 cm)
HCT (cm)Prod./abs. (core)Core centre:P28
d25
528
c*Core average:P28
825
528
C*
TABLE V Whole
keff(H = 99 cm)HCT (cm)Prod./abs. (core)Core centreP28
o-25
628
C*Core averageP28
S25
628
C*
WIMS6(JEF-2.2)
1.0191194.01.76871
7.8457
0.11974
1.89519 -lO'3
0.19597
4.72816.7099 -10-2
1.4411 -10-3
0.13043
core calculation results
WIMS6(JEF-2.2)
1.1080071.7
1.60065
3.2368
4.5850 -lO'2
1,5462 -10'3
0.097113
2.58263.6537 -lO'2
1.2854 -10'3
0.082641
WIMSE-5("1986")
1.01437
95.21.76998
7.905130.11173
1.92133 -10'3
0.19536
4.7974
6.7449 -10'2
1.4261 -10'3
0.13747
MCNP BM(JEF-2.2) average
1.0279 1.021193.0 93.54
1.7589
7.563 7.680.1130 0.11391.917 -10'3 1.75 -10'3
0.1895 0.1921
4.94
7.36 -10-2
1.341 -10'3
0.1357
for LEUPRO-1 with 20 vol. % water.
MCNP(JEF-2.2)
1.1103
69.5-
3.488
4.644 -10'2
1.561 -lO'3
0.1030
2.640
3.705 -10'2
1.398 -10'3
0.08398
BM average[16]1.112270.101.5979
3.164.62 -10'2
1.445 -10'3
0.0955
2.663.74 -10'2
1.163 -10-3
0.0847
422

TABLE VI Whole core calculation results for LEUPRO-2.
k^H = 99 cm)Ha (cm)ProdVabs. (core)
Core centreP28
8*828
C*
Core averageP28
5*828
C*
WIMS6(JEF-2.2)
0.9918141.7
1.76233
4.2243
5.8785 -10'2
1.1937 -10'3
0.11962
2.90154.0340 -10'2
0.9917 -10'3
0.09028
WIMSE-5("1986")
0.9862144.3
1.76511
4.2627
5.8942 -lO'2
1.2144 -10'3
0.11930
2.95184.0798 -10-2
1.0468 -10'3
0.090597
BM average[16]0.9941140.90
1.7573
4.16
5.91 -10'2
0.991 -10'3
0.1179
2.994.40 -10-2
0.863 -10-3
0.0920
TABLE VH Main (nominal) parameters of PAP20 and INCOGEN
Power (MWth)
He inlet temperature (°C)He outlet temperature (°C)He pressure (bar)He mass flow (kg/s)Core diameter (m)Core cavity height (m)Fuel
UO2 density (g/cm3)HM loading per pebble (g)
PAP20
205507505018.72.50
4.00
U0210 % enriched (startup)19.75 % enriched (fuelling)
10.512
INCOGEN
40
493
-800
23.2
25.0
2.50
4.00
UO210 % enriched (startup)19.75 % enriched (fuelling)10.512
423
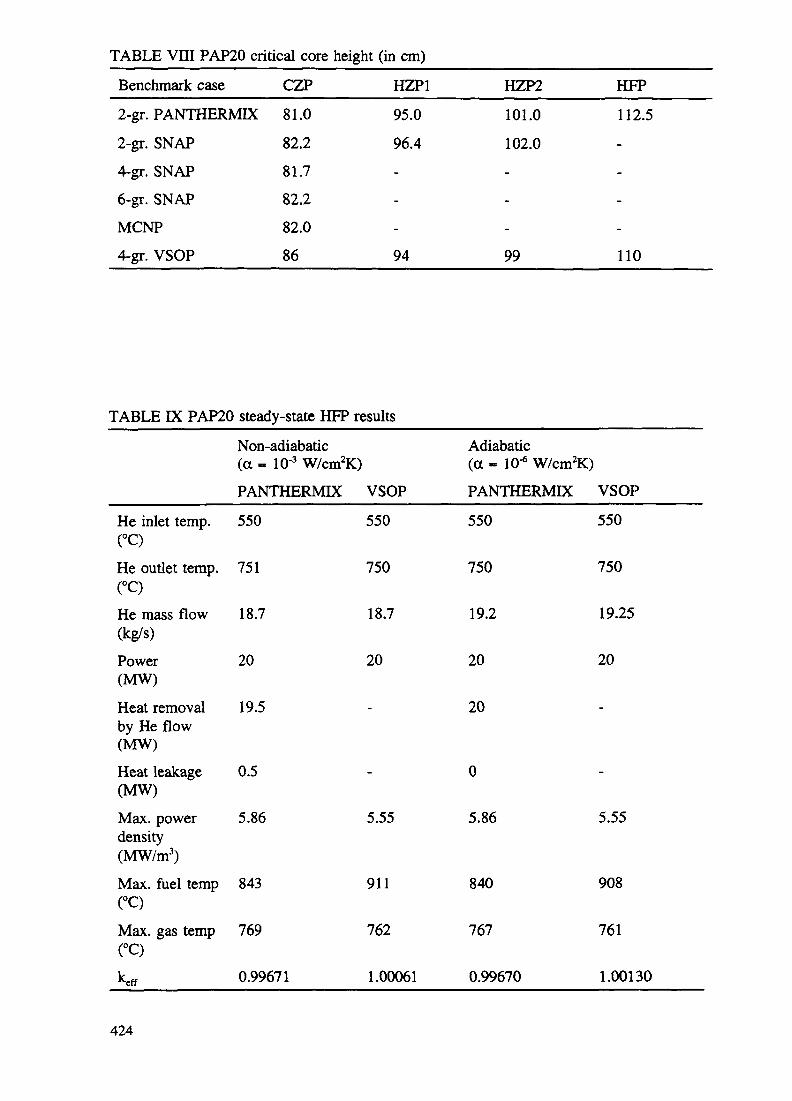
TABLE Vm PAP20 critical core height (in cm)
Benchmark case CZP HZP1
2-gr. PANTHERMIX 81.0 95.0
2-gr. SNAP 82.2 96.44-gr. SNAP 81.7
6-gr. SNAP 82.2
MCNP 82.0
4-gr. VSOP 86 94
HZP2 HFP
101.0 112.5
102.0---
99 110
TABLE DC PAP20 steady-state HFP resultsNon-adiabatic(a - 10'3 W/cm2K)PANTHERMIX VSOP
He inlet temp. 550 550
He outlet temp. 751 750
He mass flow 18.7 18.7(kg/s)Power 20 20(MW)
Heat removal 19.5by He flow(MW)Heat leakage 0.5(MW)Max. power 5.86 5.55density(MW/m3)Max. fuel temp 843 911
Max. gas temp 769 762
keff 0.99671 1.00061
Adiabatic(a - 10-6 W/cm2K)
PANTHERMIX VSOP
550 550
750 750
19.2 19.25
20 20
20
0
5.86 5.55
840 908
767 761
0.99670 1.00130
424
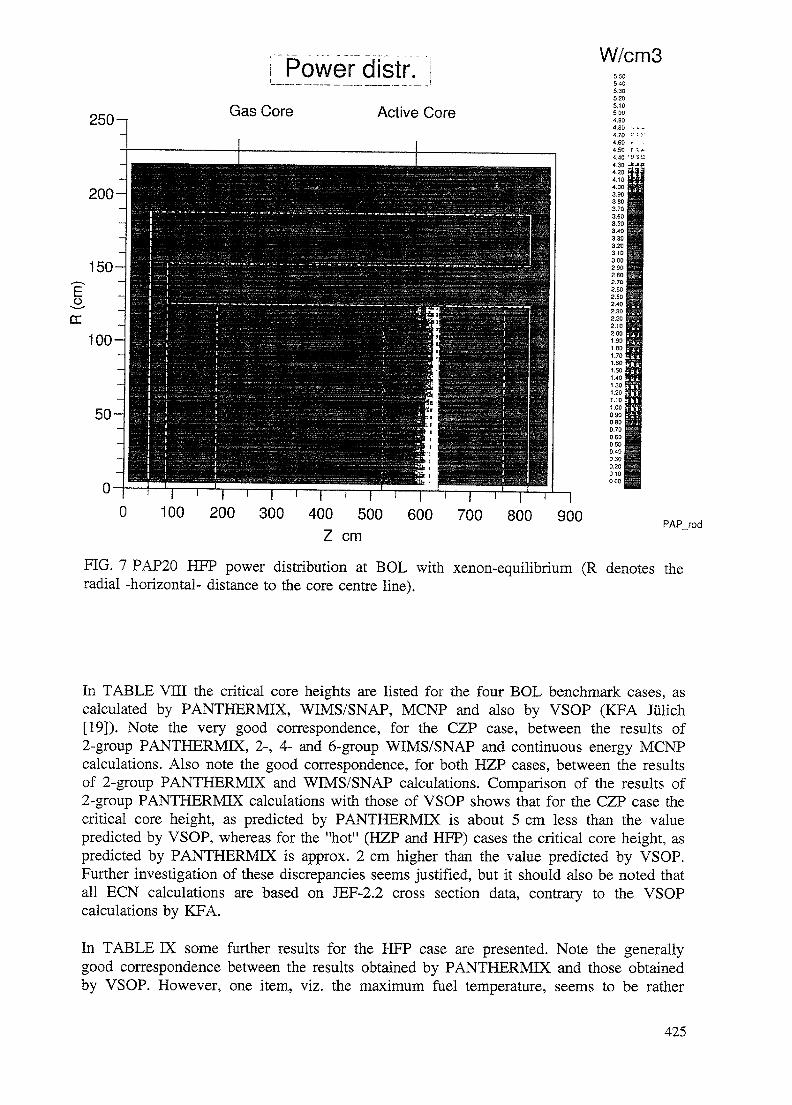
Power distr. W/cm3
250 -i
200-
150-
Gas Core Active Core
EC
100-
50-
5.505405.305205.105004.904.804.704.604.504.40 '4.30 -4.20 i4.10 j4.00 I3.90138013.70 i3.60 I3.50 I3.40 I3.30 I3.20 i3.10 !300 I290 I280 I2.70 I2.60 I2.50 I2.40 I2.30 I2.20 I2.102001.90 j180 j1.70 I1.6011.50 I1.40 I130 I1.201.10 !1.00 j090 I080 I0.70!060 I05010.40 103010.20 I010 I000 1
100 200 300 400 500 600 700 800Z cm
900 PAP rod
FIG. 7 PAP20 HFP power distribution at BOL with xenon-equilibrium (R denotes theradial -horizontal- distance to the core centre line).
In TABLE VIH the critical core heights are listed for the four BOL benchmark cases, ascalculated by PANTHERMIX, WIMS/SNAP, MCNP and also by VSOP (KFA Jiilich[19]). Note the very good correspondence, for the CZP case, between the results of2-group PANTHERMIX, 2-, 4- and 6-group WIMS/SNAP and continuous energy MCNPcalculations. Also note the good correspondence, for both HZP cases, between the resultsof 2-group PANTHERMIX and WIMS/SNAP calculations. Comparison of the results of2-group PANTHERMIX calculations with those of VSOP shows that for the CZP case thecritical core height, as predicted by PANTHERMIX is about 5 cm less than the valuepredicted by VSOP, whereas for the "hot" (HZP and HFP) cases the critical core height, aspredicted by PANTHERMIX is approx. 2 cm higher than the value predicted by VSOP.Further investigation of these discrepancies seems justified, but it should also be noted thatall ECN calculations are based on JEF-2.2 cross section data, contrary to the VSOPcalculations by KFA.
In TABLE IX some further results for the HFP case are presented. Note the generallygood correspondence between the results obtained by PANTHERMIX and those obtainedby VSOP. However, one item, viz. the maximum fuel temperature, seems to be rather
425

discrepant between PANTHERMIX and VSOP. The maximum fuel temperatures, aspredicted by VSOP, are 68 °C higher than the corresponding values obtained byPANTHERMIX. This is connected to a difference in thermal hydraulic modelling. KFAhas specified a heterogeneous pebble model in the THERMIX part of VSOP, whereasECN presently uses a homogeneous pebble model in the THERMIX part ofPANTHERMIX. So, the VSOP calculations yield the centre temperature of the pebbles,whereas the present PANTHERMIX calculations yield the average pebble temperature.However, the THERMIX part of PANTHERMIX is also capable of modellingheterogeneous pebbles. So, for consistency reasons, the heterogenous pebble model will beincorporated in the benchmark specifications and consequently the final benchmarkcalculation results will be obtained employing a heterogeneous pebble model.
In FIG. 7, 8 and 9, respectively, the power distribution, the solid state temperaturedistribution and the gas flow distribution are shown for the HFP case with a =10'3 W/cm2K. Note that for the BOL HFP situation the maximum power density andmaximum fuel temperature occurs at the bottom of the core. Also note that the gas flow inthe core and in the gas space above the core is only in the vertical (downward) direction,the average mass flow density being 3.81 -10'4 kg s^cm"2.
Reactor temp.
250
200
150E
,CJ,
DC100
0
T(K)10901070105010301010990970 M ' i950 B ' I930 «"•"910 j890 j870 j850 j830 I810 1790 I7701750 I7301710 I690 I670 I650 1630 I610 I590 I570 j550 j530 I510 1490 1470 I450 I430410390370350330310 I290 I270 1
100 200 300 400 500Z cm
I600 700 800 900 PAP rod
FIG. 8 PAP20 HFP solid state temperature distribution at BOL with xenon-equilibrium (Rdenotes the radial -horizontal- distance to the core centre line).
426
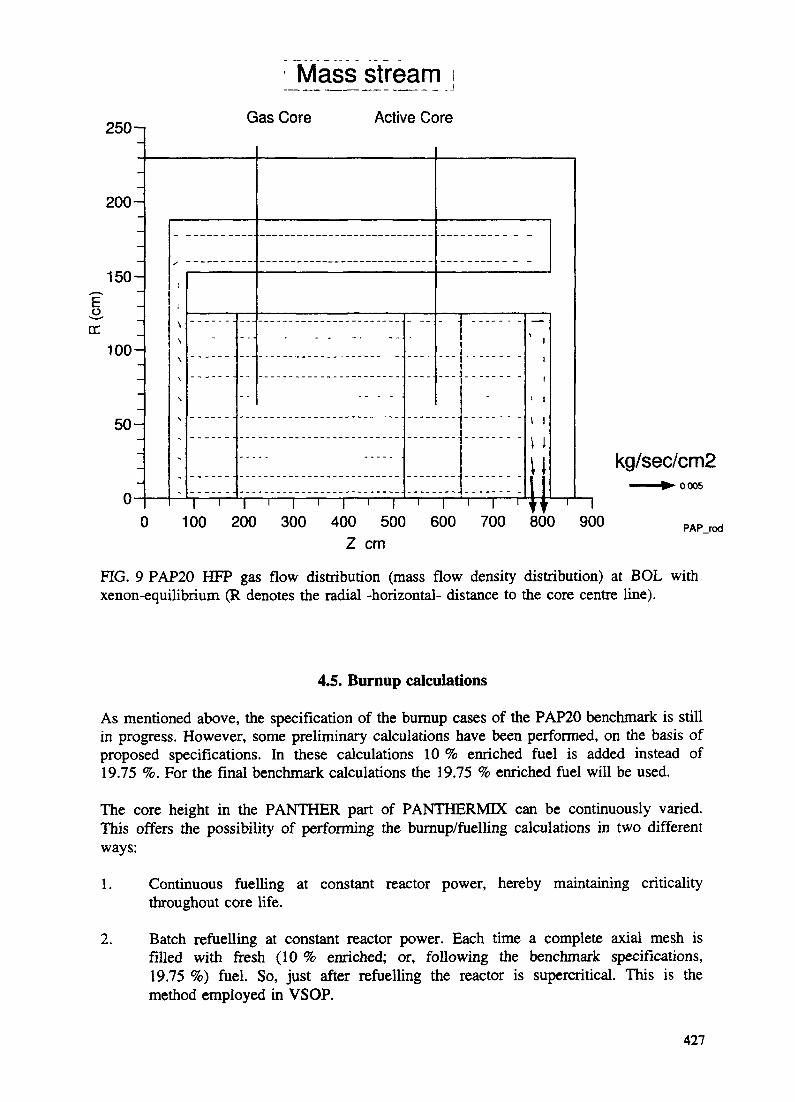
Gas Core Active Core
o-• -
DC
250-i
200-_
-
160-
100--
-
50-
-
0-\c)
1
1
\\\
\
1
-
I '00 2
...
- -
I!00
- -
-- - - •
' I ' I ' I300 400 500
Z cm
-
ie
- -•"•....
itoo
i i '700
\
> ii\ i\
801i
3 9C
kg/sec/cm2
PAP_rod
FIG. 9 PAP20 HFP gas flow distribution (mass flow density distribution) at BOL withxenon-equilibrium (R denotes the radial -horizontal- distance to the core centre line).
4.5. Burnup calculations
As mentioned above, the specification of the bumup cases of the PAP20 benchmark is stillin progress. However, some preliminary calculations have been performed, on the basis ofproposed specifications. In these calculations 10 % enriched fuel is added instead of19.75 %. For the final benchmark calculations the 19.75 % enriched fuel will be used.
The core height in the PANTHER part of PANTHERMDC can be continuously varied.This offers the possibility of performing the burnup/fuelling calculations in two differentways:
1. Continuous fuelling at constant reactor power, hereby maintaining criticalitythroughout core life.
2. Batch refuelling at constant reactor power. Each time a complete axial mesh isfilled with fresh (10 % enriched; or, following the benchmark specifications,19.75 %) fuel. So, just after refuelling the reactor is supercritical. This is themethod employed in VSOP.
427

150.0
140.0 -
JL 130.0
g>
120.0O
110.0
100.0
Core height during burnupPAP 20 reactor
Continuous fuelling
Batch fuelling
0.0 100.0 200.0# Full power days
FIG. 10 PAP20 core height during bumup.
300.0
1.040 r
1.020
1.000
keff during burnupPAP 20 reactor
Batch fuelling
Continuous fuelling
0.980 j-
0.9600.0 100.0 200.0
# Full power days
FIG. 11 PAP20 keff during burnup.
300.0
428
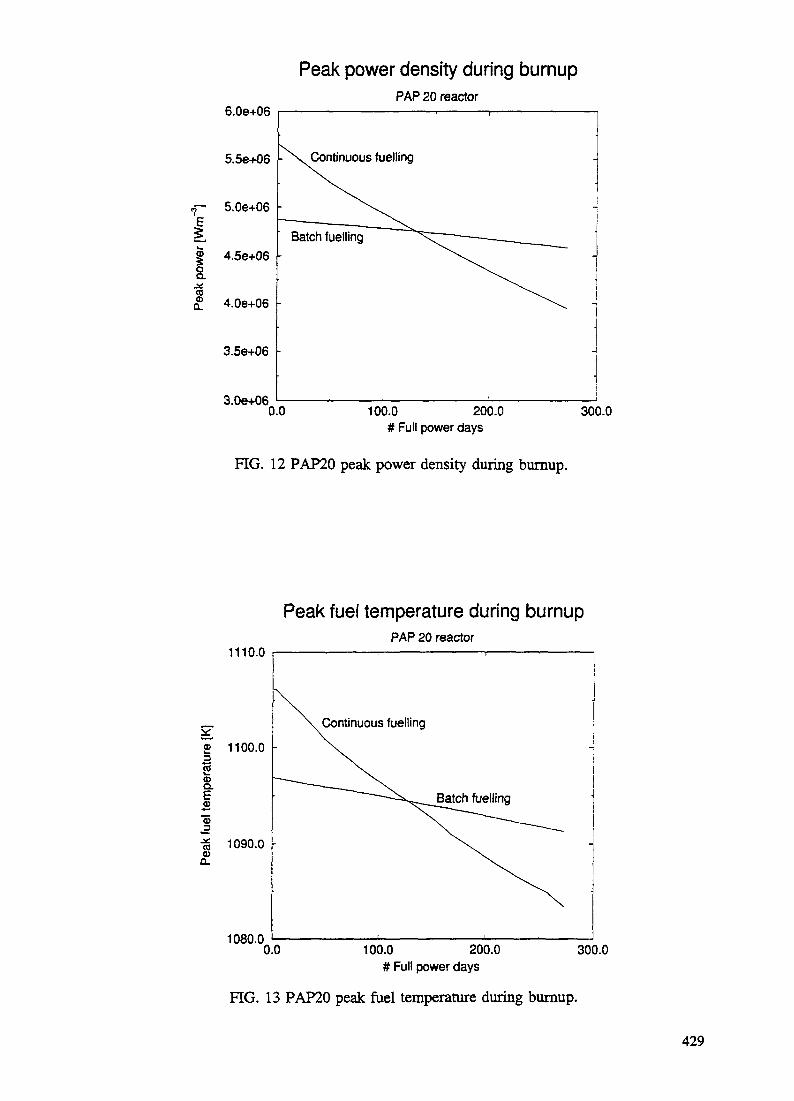
Peak power density during burnupPAP 20 reactor
6.0e+06
3.0e+060.0 100.0 200.0
# Full power days300.0
FIG. 12 PAP20 peak power density during burnup.
Peak fuel temperature during burnupPAP 20 reactor
1110.0
1080.0100.0 200.0
# Full power days300.0
FIG. 13 PAP20 peak fuel temperature during bumup.
429
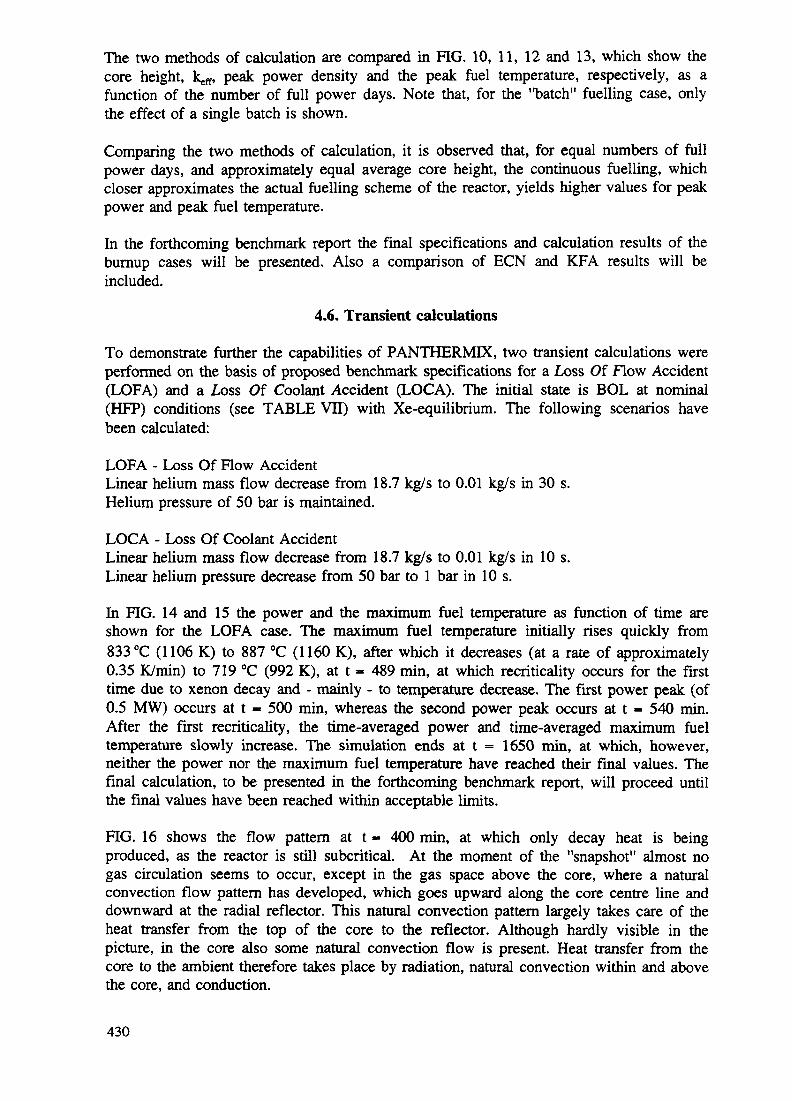
The two methods of calculation are compared in FIG. 10, 11, 12 and 13, which show thecore height, k^, peak power density and the peak fuel temperature, respectively, as afunction of the number of full power days. Note that, for the "batch" fuelling case, onlythe effect of a single batch is shown.
Comparing the two methods of calculation, it is observed that, for equal numbers of fullpower days, and approximately equal average core height, the continuous fuelling, whichcloser approximates the actual fuelling scheme of the reactor, yields higher values for peakpower and peak fuel temperature.
In the forthcoming benchmark report the final specifications and calculation results of theburnup cases will be presented. Also a comparison of ECN and KFA results will beincluded.
4.6. Transient calculations
To demonstrate further the capabilities of PANTHERMDC, two transient calculations wereperformed on the basis of proposed benchmark specifications for a Loss Of Flow Accident(LOFA) and a Loss Of Coolant Accident (LOCA). The initial state is BOL at nominal(HFP) conditions (see TABLE YE) with Xe-equilibrium. The following scenarios havebeen calculated:
LOFA - Loss Of Flow AccidentLinear helium mass flow decrease from 18.7 kg/s to 0.01 kg/s in 30 s.Helium pressure of 50 bar is maintained.
LOCA - Loss Of Coolant AccidentLinear helium mass flow decrease from 18.7 kg/s to 0.01 kg/s in 10 s.Linear helium pressure decrease from 50 bar to 1 bar in 10s.
In FIG. 14 and 15 the power and the maximum fuel temperature as function of time areshown for the LOFA case. The maximum fuel temperature initially rises quickly from833 °C (1106 K) to 887 °C (1160 K), after which it decreases (at a rate of approximately0.35 K/min) to 719 °C (992 K), at t = 489 min, at which recriticality occurs for the firsttime due to xenon decay and - mainly - to temperature decrease. The first power peak (of0.5 MW) occurs at t = 500 min, whereas the second power peak occurs at t = 540 min.After the first recriticality, the time-averaged power and time-averaged maximum fueltemperature slowly increase. The simulation ends at t = 1650 min, at which, however,neither the power nor the maximum fuel temperature have reached their final values. Thefinal calculation, to be presented in the forthcoming benchmark report, will proceed untilthe final values have been reached within acceptable limits.
FIG. 16 shows the flow pattern at t = 400 min, at which only decay heat is beingproduced, as the reactor is still subcritical. At the moment of the "snapshot" almost nogas circulation seems to occur, except in the gas space above the core, where a naturalconvection flow pattern has developed, which goes upward along the core centre line anddownward at the radial reflector. This natural convection pattern largely takes care of theheat transfer from the top of the core to the reflector. Although hardly visible in thepicture, in the core also some natural convection flow is present. Heat transfer from thecore to the ambient therefore takes place by radiation, natural convection within and abovethe core, and conduction.
430
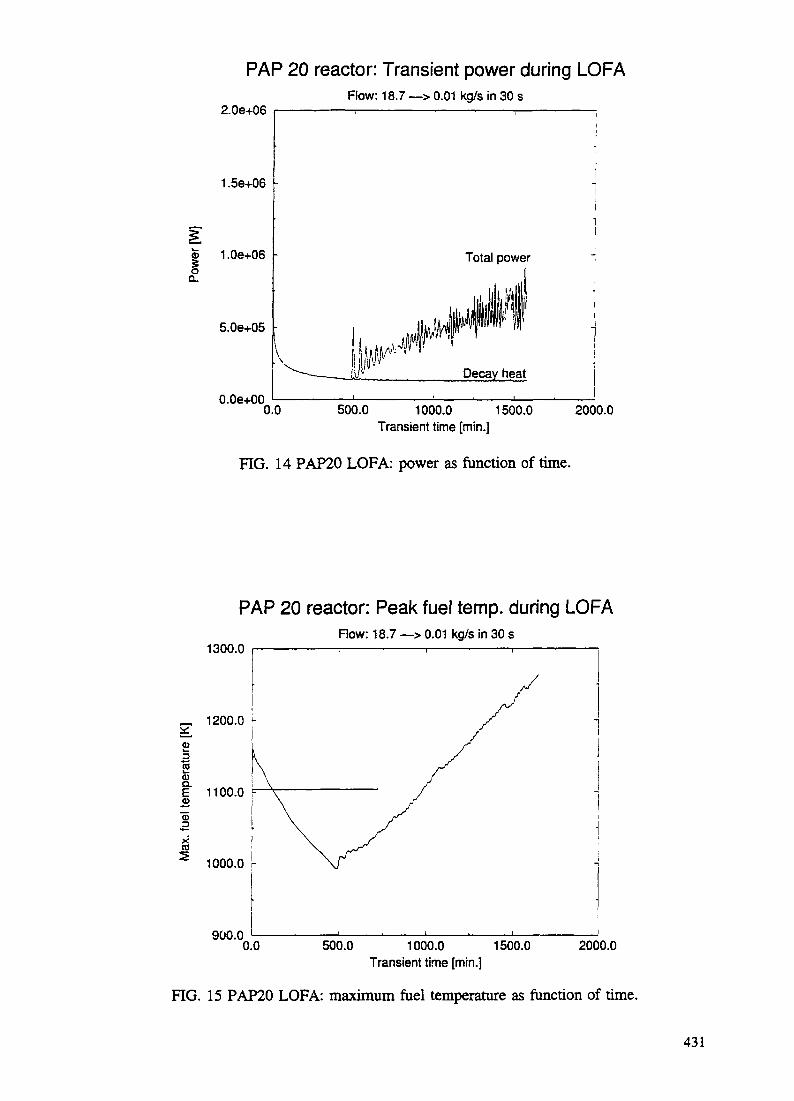
PAP 20 reactor: Transient power during LOFAFlow: 18.7 —> 0.01 kg/s in 30 s
1.56+06
LOe+06
S.Oe+05
O.Oe+00
Total power
' Decay heat
0.0 500.0 1000.0 1500.0 2000.0Transient time [min.]
FIG. 14 PAP20 LOFA: power as function of time.
PAP 20 reactor: Peak fuel temp, during LOFAFlow: 18.7 —> 0.01 kg/s in 30 s
1300.0
900.00.0 500.0 1000.0 1500.0
Transient time [min.]2000.0
FIG. 15 PAP20 LOFA: maximum fuel temperature as function of time.
431

250-1
i Mass streamGas Core Active Core
^o_cc
200-
150-
100-
50-
i i i \ \ i i i i250 500 750
kg/sec/cm2
PAP_tofa_24000
FIG. 16 PAP20 LOFA: flow distribution at t = 400 min (R denotes the radial -horizontal-distance to the core centre line).
PAP 20 reactor: Power during LOCAFlow: 18.7 —> 0.01 kg/s; Pressure: 50 —> 1 bar
5.0e+05
4.0e+05 -
3.0e+05 It-
I 2.0e-t-05 r
1.0e+05 -
O.Oe+00 L
2000.0 4000.0Transient time [min.]
FIG. 17 PAP20 LOCA: power as function of time.
6000.0
432

PAP 20 reactor: Max. fuel temperature during LOCA
1500.0
1400.0 -
Flow: 18.7 —> 0.01 kg/s; Pressure: 50 —> 1 bar
75 1300.0 -Q.
O
§ 1200.0 -,Xra
1100.0 -
1000.02000.0 4000.0
Transient time [min.]6000.0
250-,
FIG. 18 PAP20 LOCA: maximum fuel temperature as function of time.
i_ Mass stream \Gas Core Active Core
o
200-
150-
100-
50-
0-(3
i*
i i
u
kS^,
1
/ / - ' ' ' ' '
,,,,.. -",,.:• ' ""
.,,.. . I t \ v
>\\NX
-s'' ^
| 1 1 1 1
250 5CCi i 1 ! 1
75(i
3i i
kg/sec/cm2•0.0005
PAP toca 24000
FIG. 19 PAP20 LOCA: flow distribution at t = 400 min (R denotes the radial -horizontal-distance to the core centre line).
433

For the LOCA case the power and maximum fuel temperature as function of time areshown in FIG. 17 and 18, respectively. Initially, the maximum fuel temperature (whichinitially is 1106 K) rises to about 1200 K at t = 150 min, after which the maximum fueltemperature decreases. At t = 620 min the maximum fuel temperature is again 1106 K. Asa result of this behaviour of the temperature, recriticality is expected to occur about300 min later than in the PAP20 LOFA case. Recriticality, caused by temperature decreaseand xenon decay, occurs, for the first time, at t = 800 min. At t = 3500 min a maximumpower of 500 kW is reached, after which the power decreases slowly but monotonically.At the end of the simulation, at t = 5350 min, the peak fuel temperature has reached1493 K. Although at this point in time the temperature is still increasing, it is expectedthat the final peak fuel temperature will not be much higher than 1500 K, in view of thesmall and decreasing rate of increase, and the decreasing power.
FIG. 19 shows the flow pattern at t = 400 min. At the time of the "snapshot" only a littlegas flow circulation occurs and the heat transfer from the core to the ambient mainly takesplace by radiation and conduction.
Although the PAP20 benchmark exercise is still in progress, it already seems that thePANTHERMIX code combination is quite suitable for performing steady-state, burnup andtransient pebble-bed HTR core calculations. Final conclusions will be presented in theforthcoming benchmark report, which will also contain the final specifications and resultsof the transient calculations, together with a comparison of the ECN and KFA calculationresults.
5. INCOGEN - THE "DUTCH" SMALL HTR CONCEPT
5.1. Introduction
The ultimate goal of the validation of the ECN reactor physics code system OCTOPUS(with PANTHERMIX) for pebble-bed HTR applications is to acquire and reinforce thecapability to perform the core design and optimization for the "Dutch" small HTR conceptINCOGEN.
The first concept of INCOGEN is based on the PAP20 design of KFA. In fact, thegeometry is almost identical to that of the PAP20, except for the borated graphite layer inthe bottom reflector, as was shown in FIG. 6. But also the nominal power is twice that ofthe PAP20, which causes changes in the nominal values of helium temperatures, pressuresand mass flow. In TABLE Vn the main parameters have been listed of both the originalPAP20 design and the first concept of INCOGEN.
5.2 First calculation results
Within the framework of the INCOGEN core design and optimization activities, steady-state, bumup and transient calculations are under performance, which are very similar tothe calculations carried out in the PAP20 benchmark. As mentioned before, also thesecalculations are in progress, each calculation following the corresponding PAP20calculation, taking advantage of the experience gained with the latter.
434

1.5e+06
INCOGEN: Power during LOFAFlow: 25.0 —> 0.1 kg/s in 15 min.
1.0e+06
ioQ.
Total power
5.0e+05 -'
O.Oe+00
Decay heat
0.0 1000.0 2000.0 3000.0 4000.0Transient time [min.]
FIG. 20 INCOGEN LOFA: power as function of time.
INCOGEN: Max. fuel temperature during LOFA
1600.0 rFlow: 25 —> 0.1 kg/s in 15 min.
800.00.0 1000.0 2000.0 3000.0
Transient time [min.]4000.0
FIG. 21 INCOGEN LOFA: maximum fuel temperature as function of time.
435
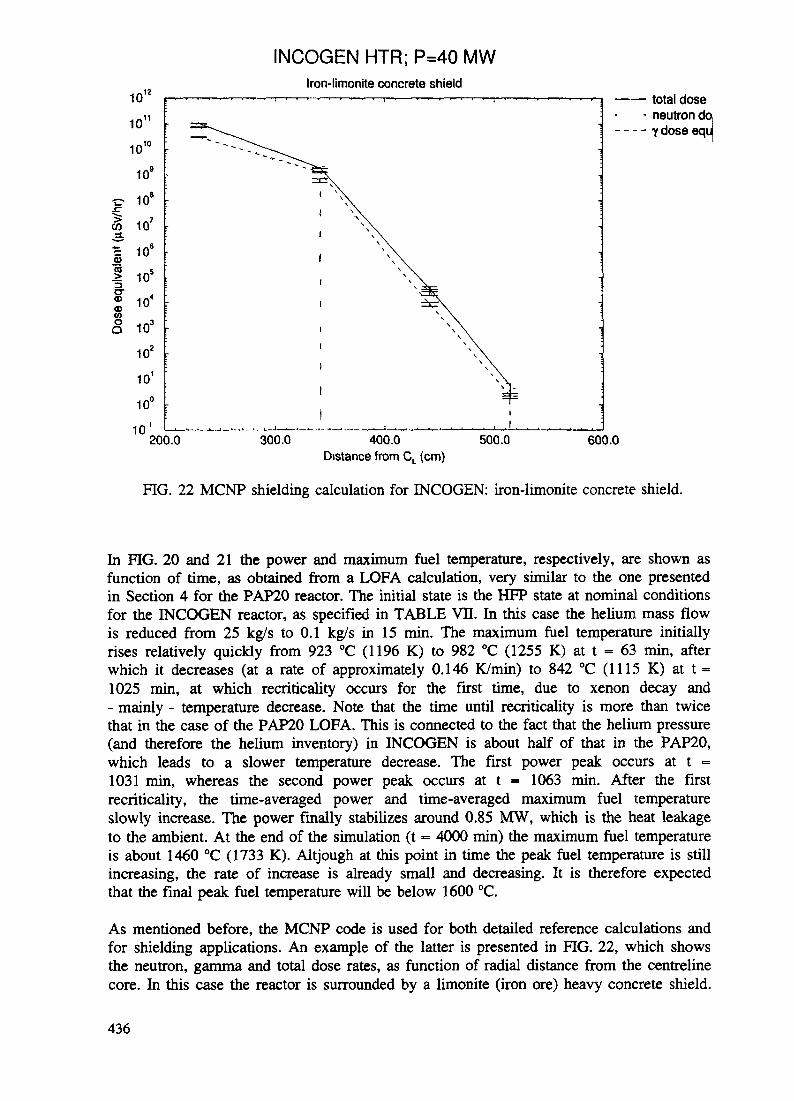
INCOGEN HTR; P=40 MWIron-limonite concrete shield
10"
1011
10'°
109
F 10s
I 107
^1 1°°| 105
!1°48 io3
10*
101
10U
10'
—— total dose• neutron do
- - - - Y dose equ
200.0 300.0 400.0Distance from CL (cm)
500.0 600.0
FIG. 22 MCNP shielding calculation for INCOGEN: iron-limonite concrete shield.
In FIG. 20 and 21 the power and maximum fuel temperature, respectively, are shown asfunction of time, as obtained from a LOFA calculation, very similar to the one presentedin Section 4 for the PAP20 reactor. The initial state is the HFP state at nominal conditionsfor the INCOGEN reactor, as specified in TABLE VII. In this case the helium mass flowis reduced from 25 kg/s to 0.1 kg/s in 15 min. The maximum fuel temperature initiallyrises relatively quickly from 923 °C (1196 K) to 982 °C (1255 K) at t - 63 min, afterwhich it decreases (at a rate of approximately 0.146 K/min) to 842 °C (1115 K) at t =1025 min, at which recriticality occurs for the first time, due to xenon decay and- mainly - temperature decrease. Note that the time until recriticality is more than twicethat in the case of the PAP20 LOFA. This is connected to the fact that the helium pressure(and therefore the helium inventory) in INCOGEN is about half of that in the PAP20,which leads to a slower temperature decrease. The first power peak occurs at t =1031 min, whereas the second power peak occurs at t = 1063 min. After the firstrecriticality, the time-averaged power and time-averaged maximum fuel temperatureslowly increase. The power finally stabilizes around 0.85 MW, which is the heat leakageto the ambient. At the end of the simulation (t «= 4000 min) the maximum fuel temperatureis about 1460 °C (1733 K). Altjough at this point in time the peak fuel temperature is stillincreasing, the rate of increase is already small and decreasing. It is therefore expectedthat the final peak fuel temperature will be below 1600 °C.
As mentioned before, the MCNP code is used for both detailed reference calculations andfor shielding applications. An example of the latter is presented in FIG. 22, which showsthe neutron, gamma and total dose rates, as function of radial distance from the centrelinecore. In this case the reactor is surrounded by a limonite (iron ore) heavy concrete shield.
436

From this calculation it could be concluded that a limonite concrete shield of 175 cmthickness sufficiently reduces the neutron and gamma radiation. However, in axialdirection large variations in dose rates occur. An improvement may be obtained byborating the outer part of the reflector, hereby reducing the capture gamma sources in thevessel and concrete (7.5 MeV gammas caused by (n,y)-reactions in iron). This alsoreduces radiation embrittlement in the vessel-steel. Additional studies are being performed.
6. CONCLUSIONS
Within the framework of the development of INCOGEN, a "Dutch" conceptual design of asmall HTR, the ECN reactor physics code system OCTOPUS has been extended with thecapability to perform combined neutronics and thermal hydraulics steady-state, bumup andtransient core calculations for pebble-bed HTR type reactors. This extension was obtainedby connecting the general purpose modular reactor code PANTHER and the HTR thermalhydraulics code THERMEX/DIREKT in the PANTHERMIX code combination.
In the process of validating its reactor physics code system for HTR applications, ECN istaking part in two benchmark exercises, viz. HTR-PROTEUS (steady-state; neutronicsonly) and PAP20 (power reactor; steady-state, bumup and transient; combined neutronicsand thermal hydraulics).
The results obtained by the WIMS, SCALE and MCNP codes for the LEUPRO unit cellcalculations, and with WIMS and MCNP for the whole core LEUPRO calculations,indicate that the codes in use at ECN are quite suitable for (steady-state neutronics only)pebble-bed HTR applications. Presently, the MCNP code, with associated JEF-2.2 basedcross section library, is being validated further by calculating the PROTEUS Core 5experiment. First results indicate that MCNP reproduces very well the experimental value
Presently the PANTHERMIX code combination is being compared with the KFA codesystem in the PAP20 benchmark exercise, which comprises initial steady-state, bumup andtransient combined neutronics and thermal hydraulics calculations. Although thebenchmark exercise is still in progress, the first results are promising and indicate that theECN reactor physics code system, extended with PANTHERMIX, is quite suitable forperforming the pebble-bed HTR core physics calculations required in the INCOGEN coredesign and optimization process.
REFERENCES
[1] van Heek, A.I., "INCOGEN: Nuclear Cogeneration in the Netherlands", this TCM.
[2] Teuchert, E, et al, "Features of safety and simplicity of advanced pebble bedHTR's", paper IAEA TCM on "Development Status of Modular High TemperatureReactors and their Future Role", Petten, The Netherlands, 28-30 November 1994,Proceedings published by ECN as report ECN-R-95-026, September 1995.
[3] Kloosterman, J.L. , Kuijper, J.C., de Leege, P.F.A., "The OCTOPUS Burnup andCriticality Code System", Proc. PHYSOR 96.
437

[4] Hutt, P.K. et al, "The UK Core Performance Package", Nucl. Energy, 30, No. 5,291, October 1991.
[5] Hutt, P.K., "Overview Functional Specification of PANTHER: A ComprehensiveThermal Reactor Code for Use in Design, Assessment and Operation",PANTHER/FSPEC/OVERVffiW 2.0, Nuclear Electric Pic., U.K., December 1992.
[6] Struth, S., "THERMIX-DIREKT: Ein Rechenprogramm zur instationaren,zweidimensionalen Simulation thermohydraulischer Transienten", ISR-KFA, August1994 (private communication).
[7] Briesmeister, J.F., "MCNP - A general Monte Carlo N-particle transport Code,version 4A", Los Alamos National Laboratory, Report LA-12625-M, November1993.
[8] Hogenbirk, A., et al., "HTR-PROTEUS Benchmark Calculations. Part 1: Unit cellresults LEUPRO-1 and LEUPRO-2", ECN-C--95-087, September 1995.
[9] Klippel, H.Th., et al., "Reactor physics calculations of HTR type configurations",paper "ECN workshop on the role of modular HTRs in the Netherlands", Petten,The Netherlands, 28-30 November 1994, Proceedings published by ECN as reportECN-R--95-027, June 1995.
[10] "WIMS6 - WIMSE user guide", AEA Technology, Report AEEW - R 2442, April1995.
[11] Mathews, D., Chawla, R., "LEU-HTR Calculational Benchmark Specifications",PSI memorandum 1990 (private communication).
[12] Oppe, J., de Haas, J.B.M., Kuijper, J.C., "PANTHERMDC - aPANTHER-THERMIX interaction", ECN-I-96-022, May 1996.
[13] Teuchert, E., et al "V.S.O.P. ('94) - Computer Code System for Reactor Physicsand Fuel Cycle Simulation - Input Manual and Comments", Berichte desForschungszentrums Juelich, 2897, April 1994.
[14] Gerwin, H., Scherer, W., "Treatment of the Upper Cavity hi a Pebble-BedHigh-Temperature Gas-Cooled Reactor by Diffusion Theory", Nucl. Sci. Eng. 97,9 - 1 9 (1987).
[15] "Berechnung der Nachzerfallsleistung der Kernbrennstoffe vonHochtemperaturreaktoren mit Kugelformigen Brennelementen", DIN 25485, May1990.
[16] Mathews, D., "Compilation of IAEA-CRP results for the LEU-HTR PROTEUSCalculational Benchmarks", PSI memorandum 1996 (private communication).
[17] Zhang, B.C., Kuijper, J.C., "Results for the LEUPRO-1-6 Cell Calculations withWIMS-E", ECN-I--95-007, November 1995.
438

[18] Zhang, B.C., Kuijper, J.C., "Results for LEUPRO1-6 Whole Reactor Calculationswith WIMS", ECN-I--96-007, March 1996.
[19] Riitten, H.J., Haas, K.A., KFA Julich, May 1996 (private communication).
APPENDIX A - SPECTRAL INDICES
p28 = ratio epithermal-to-thermal captures in ^U
o"25 = ration epithermal-to-thermal fissions in 235U
S28 = ratio 238U fissions to ^U fissions
C* = ratio 238U captures to ^U fissions
The thermal break is at 2.1 eV.
NEXT PAQE(S) Ileft BLANK |
—————————1 439

OTHER PAPERS SUBMITTED
NEXTPAGE(S)left BLANK

PRELIMINARY STUDY ON THE DEVELOPMENT OF AN IN-SERVICEINSPECTION TECHNIQUE FOR GRAPHITE COMPONENTS IN THE HTTR
M. ISHIHARA, S. HANAWA, T. FURUSAWA, J. AIHARA, Y. TACHIBANAJapan Atomic Energy Research Institute,Oarai-machi, Ibaraki-ken
XA9846698Japan
Abstract
Development of a nondestructive measuring method on a residual strain and/or stressaccumulating in the graphite component is one of major research subjects in the HTTR. Forthe purpose of the development of the method deformation characteristic under a smallmagnitude of a pressure load was measured using graphite specimens on which several levelsof residual strains were produced. The pressure load was applied using a microhardnesstesting machine. In the experiment indentation load to depth characteristic and amicrohardness were measured as a function of the residual strain.
In this paper we describe the deformation characteristic influenced by the residual strain,and discuss the applicability of the micro-indentation method to the estimation of the residualstrain arising in graphite components as an inservice inspection technique.
1. Introduction
The High Temperature engineering Test Reactor (HTTR) which is under construction atJapan Atomic Energy Research Institute, is a graphite-moderated and helium gas-cooledreactor with a maximum helium coolant temperature of 950 °C at the reactor outlet[l]. Thecore internals are made of mainly graphite material which is superior in thermal resistivity.The arrangement of graphite components is shown in Fig.l. Core graphite components arethe replaceable structures connected by the dowel pin and socket elements, and core supportcomponents are the permanent structures connected by the key and keyway elements.
The graphite component is subjected to high temperature and high temperature gradientin neutron irradiation environment to achieve a high temperature coolant gas. Although nosignificant thermally-induced creep of the graphite occurs less than about 2000°C, neutronirradiation-induced creep occurs at significant rates at the temperature range of the graphitecomponent in the HTTR, which is about 500°C to 1200°C. Moreover, neutron irradiationcauses dimensional change in the graphite component, which is a function of the neutronfluence and the irradiation temperature. These deformations accumulate gradually in thegraphite component with the reactor operation. Especially for the fuel graphite block theaccumulating residual strain and/or stress becomes high enough to limit the lifetime of it.Thereby, an evaluation of the residual strain and/or stress by a nondestructive measurementis important to confirm the structural integrity of graphite components.
443

Some methods on the measurement of the residual strain have been developed; e.g. thecutting method[2] in which the released deformation is measured by cutting at theaccumulating residual strain area, the X-ray method and so on. However these methods arenot applicable in this case, since the residual strain and/or stress has to be measurednondestructive^ and to be measured on an arbitrary surface by a remote control technique.
It is well known that the graphite and carbon materials have a nonlinear relationship inthe stress-strain behavior. If the tensile or compressive load applies to the component inwhich the residual strain accumulates, the deformation characteristic, e.g. the deformationand/or strain under a tensile or compressive load, would be thought to change with theresidual strain owing to the decrease of the deformation resistivity with increasing residualstrain; the tangent on the stress-strain curve is gradually decrease with increasing the strain.
The deformation characteristic was measured, therefore, under small magnitude ofpressure load so as not to make a damage to the component. The microhardness testingmachine was used in the test. The indentation depth under a constant indentation load andthe microhardness were measured to clarify the deformation resistance with the residual strain.The applicability of the micro-indentation method was studied from the preliminary testresult.
CORE GRAPHITE COMPONENTS
REPLACEABLE REFLECTORBLOCK (IG -110)
CONTROL ROD GUIDEBLOCKUG-110)
FUEL BLOCK( 10-110)
CORE SUPPORT GRAPHITECOMPONENTS
PERMANENT REFLECTORBLOCK ( PCX)
HOT PLENUM BLOCK (PCX)
SUPPORT POST( IG-110)
LOWER PLENUM BLOCK (PCX)CARBON BLOCK (ASR-ORB)BOTTOM BLOCK ( PCX )
Fig. 1 Arrangement of core internals in the HTTR.
444

2. Residual stress in the graphite component
Figure 2 shows the horizontal view of the HTTR core. The column A, B and C showsthe fuel region columns. In the fuel block at the column C the higher residual stress arisesdue to the higher temperature difference within the component; the irradiation-induced creepstrain becomes higher owing to higher thermal stress as well as the higher irradiation-induceddimensional change (irradiation strain) owing to higher temperature difference within theblock. The residual strain and/or stress was estimated by the VEENUS code[3], visco-elasticstress analysis code, which treats the steady state and transient creep strains besides irradiationand thermal strains as shown in Fig.3.
A column
B column
££) C column
Fig. 2 Horizontal view of the core graphite blocks in the HTTR.
Mechanical strain
£EElastic strain
EE
Stead y-scacecreepscrain
Ms
£T
Transientcreep scrain
MT
i1
£e
Thermal strain Irradiationstrain
r-^WV-C ET <J (Stress
LA/W-JFig. 3 Analytical model of graphite under neutron irradiation.
445
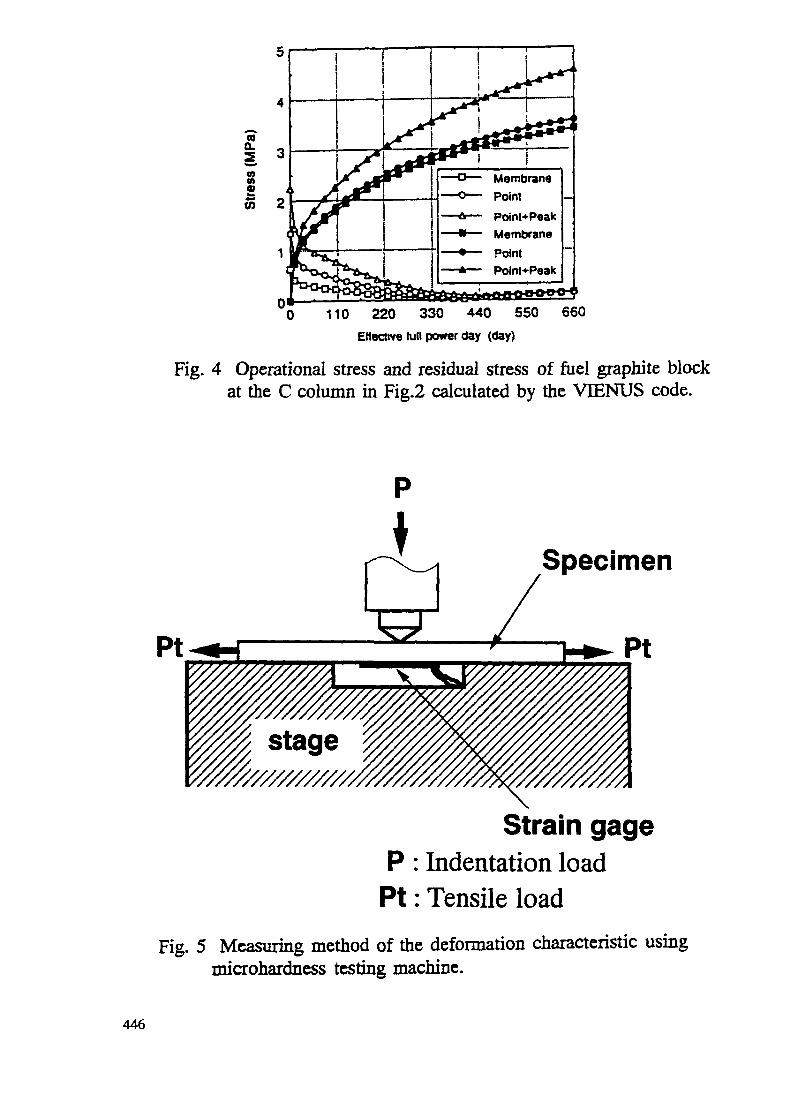
COQ.2sCOm£55
MembranePointPoinl+PeafcMembranePointPoint+Peak
110 220 330 440 550Effective lull power day (day)
660
Fig. 4 Operational stress and residual stress of fuel graphite blockat the C column in Fig.2 calculated by the VENUS code.
Specimen
Pt
Strain gageP : Indentation load
Pt: Tensile loadFig. 5 Measuring method of the deformation characteristic using
microhardness testing machine.
446

The calculation result by the VDBNUS code for the fuel block at C column is shown inFig.4[4]. The operational stress which is mainly caused by the thermal stress in the fuelblock is gradually reduced with the plant operation by the irradiation-induced creepdeformation. However the residual stress arises gradually with plant operation due to theaccumulating creep and irradiation strains in the graphite block. For the safety operation itis important, therefore, to estimate the residual strain and/or stress state in the graphitecomponent as an inservice inspection.
3. Experiment
For the purpose of the estimation of the residual strain and/or stress arising in thegraphite component with plant operation deformation characteristic was measured using themicrohardness testing machine.
3.1 Experimental method
As shown in Fig.5 the residual strain arising in the graphite component was imitated bythe strain under the tensile load. The magnitude of the imitated strain was measured by thestrain gage attached on the other side of the specimen. The pressure load was applied by themicrohardness testing machine using trigonal pyramid type indentor on the specimen in whicha specified residual strain was produced. The pressure load was IN in the test. Theindentation load to depth characteristic and the microhardness were measured at differentresidual strain levels.
3.2 Test specimen
The specimen was made of IG-11 graphite, fine-grained isotropic nuclear-gradegraphite for the fuel block in the HTTR reactor. The typical mechanical properties are listedin table I. The specimen configuration is shown in Fig.6. The parallel section is 7.5 mm hiwidth and 10 mm in length with 5 mm thickness. The indentor was pressed at the parallelsection of the specimen.
3.3 Experimental result
Obtained typical indentation load to depth curve was shown in Fig.7. We can see fromthis figure that the deformation resistivity decreases with increasing the residual strain. Themean indentation depth at IN of the indentation load was 16.7fim and 17.6(uim at 0% and0.2% (that corresponds to about 40% to 50% of the tensile fracture strain) residual strains,respectively.
The hardness, Dh, for the trigonal pyramid type indentor was given by the equation
Dh=3.858xl03P/62 (1)
where P is the indentation load (N) and 5 is the indentation depth(nm). From this equation,the change in the hardness is sensitive to the estimation of the residual strain compared withthe change hi the indentation depth. Hence the change in the hardness as a function of theresidual strain was investigated.
447

10CM'CM
v «
r70 -H
(unit: mm)Fig. 6 Configuration of the test specimen.
20Depth
Fig. 7 Relationship between indentation load and depth.
448

The hardness calculated by equation (1) was plotted in Fig. 8 at several imitated residualstrain levels. In this figure the hardness was normalized by the mean hardness at 0% residualstrain. From this figure we can see that the hardness was gradually decreased with increasingthe residual strain owing to the decreasing of the deformation resistivity.
The relationship between the hardness and the residual strain was estimated as followingmanner. The deformation resistivity, dr, is defined by the indentation load and depth as
P«dr-6 (2)
For the constant indentation load condition equation (2) is
dr-6=C! (constant) (3)
If the deformation resistivity is assumed to be proportional to the tangent on the stress-straincurve, equation (3) is rewritten as
(do/de)-6=C2 (constant) (4)
For the IG-110 graphite the stress-strain relationship was reported[5] as
e=1.003x!0-4a+2.039xlO-6o2 (5)
From equations (4) and (5) the normalized indentation depth is given as
6=(l+40.3e)1/2 (6)
where the normalization was performed by the mean indentation depth at 0% of the residualstrain. Therefore, from equation (1) the normalized hardness is estimated as
DhKl+40.36)'1 (7)
where the normalization was performed by the mean hardness at 0% of the residual strain.
The estimated line from equation (7) was also plotted in Fig.8. It is found from thisfigure that the change of the hardness as a function of residual strain could be estimated bythe model in which the deformation resistivity is assumed to be proportional to the tangentof the stress-strain curve. From the result of the experiment it can be said that the residualstrain and/or stress accumulating in the graphite component could be estimated by theindentation method.
4. Application of Indentation Method as Inservice Inspection
From the obtained hardness data the evaluation line to the accumulating residual strainin the graphite component is proposed as the line with 99% confidence level in Fig.9. Theevaluation line is calculated using the average of the hardness at each strain level; in thecalculation it is assumed that the difference between the average hardness at each strain leveland the mean line obeys the normal distribution function. The residual strain is, therefore,
450
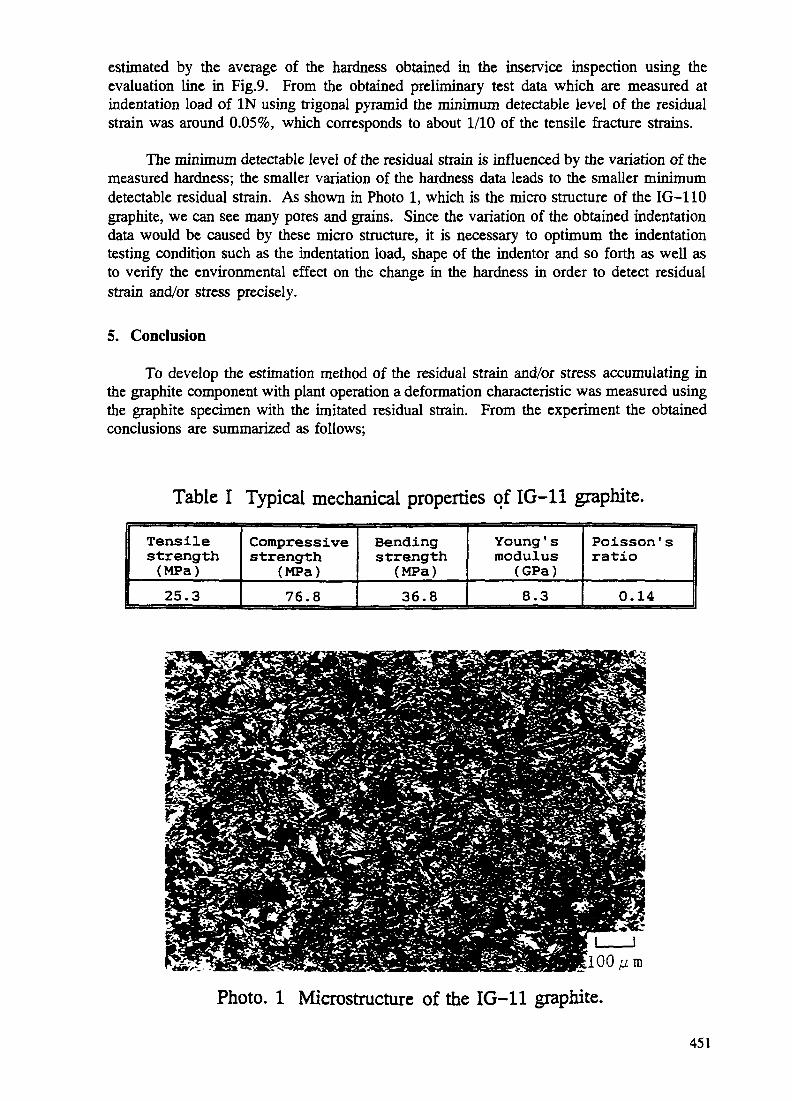
estimated by the average of the hardness obtained in the inservice inspection using theevaluation line in Fig.9. From the obtained preliminary test data which are measured atindentation load of IN using trigonal pyramid the minimum detectable level of the residualstrain was around 0.05%, which corresponds to about 1/10 of the tensile fracture strains.
The minimum detectable level of the residual strain is influenced by the variation of themeasured hardness; the smaller variation of the hardness data leads to the smaller minimumdetectable residual strain. As shown in Photo 1, which is the micro structure of the IG-110graphite, we can see many pores and grains. Since the variation of the obtained indentationdata would be caused by these micro structure, it is necessary to optimum the indentationtesting condition such as the indentation load, shape of the indentor and so forth as well asto verify the environmental effect on the change in the hardness in order to detect residualstrain and/or stress precisely.
5. Conclusion
To develop the estimation method of the residual strain and/or stress accumulating inthe graphite component with plant operation a deformation characteristic was measured usingthe graphite specimen with the imitated residual strain. From the experiment the obtainedconclusions are summarized as follows;
Table I Typical mechanical properties of IG-11 graphite.
Tensilestrength(MPa)25.3
Compress ivestrength
(MPa)76.8
Bendingstrength
(MPa)36.8
Young ' smodulus
(GPa)8.3
Poisson' sratio
0.14
f c l O O / z m
Photo. 1 Microstructure of the IG-11 graphite.
451
(1) Under the constant indentation load indentation depth increased with increasing theresidual strain; i.e. the deformation resistivity decreased with increasing the residual strain.
(2) The hardness decreased with increasing residual strain. The change of the hardness couldbe estimated by the model in which the deformation resistivity assumed to be proportionalto the tangent on the stress-strain curve.
(3) The indentation method has an applicability as an evaluation method for the inserviceinspection of the graphite component.
Further investigation on the testing condition would be necessary to optimum themeasuring method such as indentation load, indentor shape etc. as well as to clarify theenvironmental effect on the hardness such as an irradiation damage, an oxidation damage andso on in order to achieve more precisely estimation of the residual strain and/or stress in thegraphite component.
References
(1)S.Saito et al.,"Design of High Temperature Engineering Test Reactor (HTTR)", JAERI1332(1994).
(2)C.F.Wallroth, C.M.Miller and JJ.Saurwein, "Residual Stress, Strain and StrengthMeasurements in Peach Bottom Fuel Test Elements",GA-A14704(1979).
(3)T.Iyoku, M.lshihara and H.Shirai/'Development of Thermal/irradiation Stress AnalyticalCode "VffiNUS" for HTTR Graphite Block",Nucl.Sci.Tech,Vol.28,No.lO,p.921(1991).
(4)M.Ishihara, et al.,"Development of Irradiation-induced Stress Analysis Code-system forGraphite Components in Gas-cooled Reactor",SMiRT-12,C08/l,P.167(1993).
(5)M.Ishihara et al.,"An Explication of Design Data of the Graphite Structural Design Codefor Core Components of High Temperature Engineering Test Reactor", JAERI-M91-153(1991).
452

POST-IRRADIATION HEATING TESTS OF XA9846699ZrC COATED FUEL PARTICLES
K. MINATO, T. OGAWA, K. FUKUDA,H. SEKJNO, I. TAKAHASHIJapan Atomic Energy Research Institute,Oarai-machi, Ibaraki-ken
Japan
Abstract
Postirradiation heating tests of the ZrC-Triso coated UO2 particles were performed at1600°C for 4500 h and at 1800°C for 3000 h to study the release behavior of fission products.The bumup and irradiation temperature of the heated particles were 1.5%FIMA and 900°C,respectively. During heating of the particles, the radioactivity in flowing helium wasmonitored with an ionization chamber to detect fission gas release. The radioactivity ingraphite components of a cold-wall furnace was measured by Y~ray spectrometry to identifyand evaluate the released metallic fission products. The fission gas release monitoring and theX-ray microradiography revealed that no pressure vessel failure occurred during the tests.Diffusion coefficients of 137Cs and 106Ru in the ZrC coating layer were evaluated from therelease curves based on a diffusion model. The ZrC-Triso coated fuel particles showed bettercesium retention than the standard Triso-coated fuel particles. In spite of better cesiumretention, the ZrC layer showed a less effective barrier to ruthenium than the SiC layer.
1. INTRODUCTION
In the current designs of the high temperature gas-cooled reactor (HTGR), the Triso-coated fuel particles are to be used [1-3]. The Triso-coated fuel particle consists of amicrospherical kernel of oxide or oxycarbide fuel and coating layers of porous pyrolyticcarbon (PyC), inner dense PyC (IPyC), silicon carbide (SiC) and outer dense PyC (OPyC).The function of these coating layers is to retain fission products within the particle. The SiCcoating layer gives mechanical strength to the particle and acts as a barrier to the diffusionof metallic fission products which diffuse easily through the IPyC coating layer.
Although SiC has excellent properties, it gradually loses mechanical integrity at veryhigh temperatures, especially above 1700°C, by thermal dissociation and transformation ofP-SJC to a-SiC [4-6]. The fuel temperatures are, therefore, limited to well below 1700°Cduring the design-basis accidents in the current HTGR designs [1-3].
Zirconium carbide (ZrC), which is known as a refractory and chemically stablecompound, is a candidate to replace the SiC coating layer of the Triso-coated fuel particles;the resulting particles are termed ZrC-Triso coated fuel particles. The results of earlyirradiation experiments of the ZrC-coated fuel particles were encouraging [7-9]. It has beendemonstrated that the ZrC-Triso coated fuel particles have much higher temperature stabilitythan the normal SiC-Triso coated fuel particles [9,10]. In addition, the ZrC coating layershave higher resistance to chemical attack by fission products such as palladium than the SiCcoating layers [11,12]. However, the data on retention of fission products by the ZrC coatinglayer are limited [13-15], which could allow no conclusive evaluation of the fission productretentiveness of the ZrC coating layer.
453
The present paper describes the results of postirradiation heating tests of the ZrC-Trisocoated fuel particles at 1600°C for 4500 h and at 1800°C for 3000 h, which were performedto study the fission product retentiveness of the ZrC coating layer.
2. EXPERIMENTAL
2.1. Samples
The ZrC-Triso coated fuel particles heated in the present experiments were sampledfrom an irradiated fuel compact after electrolytic deconsolidation. The fuel kernel was UO2,and the ZrC coating layer was deposited by the bromide process [16]. TABLE I showscharacteristics of the particles.
The fuel compact was irradiated in a gas-swept capsule in the Japan Materials TestingReactor (JMTR) [10]. The irradiation conditions of the fuel compact are listed in TABLE II.The release-to-birth ratio of ^Kr (1^=2.84 h) during the irradiation was from 2xlO"7 to4x10~7 at about 900°C, which indicated that no failed particle was contained in the fuelcompact.
TABLE I. CHARACTERISTICS OF COATED FUEL PARTICLES
UO2 kernelBuffer layerIPyC layerZrC layerOPyC layer
Diameter or Thickness(urn)
60864263155
Density(Mg/m3)
10.61.111.84n.d.'1.95
not determined.
TABLE II. IRRADIATION CONDITIONS OF FUEL COMPACT
Duration 79.9 EFPDTemperature 900 °CBumup 1.5 %FIMAFluence 1.2x10* nT2 (E>29 fl)R/BC*Kr) 2xlO'7 to 4xlO'7
454

2.2. Postirradiation Heating
The equipment used for the postirradiation heating was installed in a hot cell. Aschematic representation of the furnace is shown in FIG. 1. The furnace is composed of agraphite heater, a graphite sample holder, graphite holder disks and carbon insulators withina stainless steel vessel. The coated fuel particles were placed individually in the holes of thegraphite disks. Total 100 particles loaded in two disks were heated in flowing helium. Thetemperature was read and controlled with an optical pyrometer from the top of the furnace.
The heating tests at 1600°C for 4500 h and at 1800°C for 3000 h were divided intoseven and eight time steps, respectively, as shown in TABLE III. At the end of each timestep, the graphite components and the carbon insulators were replaced by new ones and thecoated particles were examined by X-ray microradiography to confirm the integrity of thecoatings. The coated particles were heated repeatedly for 4500 h and 3000 h, respectively.
During the heating tests, the fission gas release was monitored by an ionizationchamber; the activity in flowing helium was due mostly to ^Kr (T1/2=10.73 y). The graphitecomponents and the carbon insulators, which were removed from the furnace at the end ofeach time step, were measured by y-ray spectrometry to identify and evaluate the releasedmetallic fission products.
He inlet He outlet
FIG. 1. Schematic representation of the furnace and X-ray microradiograph of the holder disk forpostirradiation heating.
455

TABLE III. HEATING CONDITIONS OF SAMPLES
1600°C Heating Test 1800°C Heating Test
Step Time Total time Step Time Total time00 00 00 <b)
1 100 100 1 24 242 300 400 2 46 703 500 900 3 80 1504 700 1600 4 200 3505 900 2500 5 550 9006 1000 3500 6 700 16007 1000 4500 7 900 2500
______________ 8 500 3000
The fission product release data were treated as the fractional release:
F = R/I, (1)
where F is the fractional release of a nuclide, R the released amount of the nuclide measuredby y-ray analysis, and / the inventory of the nuclide measured before the heating test.
After the heating tests, all the coated fuel particles were examined by X-raymicroradiography. About fifty particles were polished to the equator of the particle andobserved by optical microscopy.
3. RESULTS AND DISCUSSION
3.1. Coating Integrity
During both the heating tests at 1600°C for 4500 h and at 1800°C for 3000 h, nothrough-coating failure was detected by the ^Kr release monitoring. A burst release of 85Krwould be observed if a through-coating failure, or a pressure vessel failure, occurs in a shorttime. X-ray microradiographs of the coated particles after the heating tests revealed no OPyCfailure, which confirmed the results of the gas release monitoring.
Typical polished cross sections of the ZrC-Triso coated fuel particles after the heatingtest at 1600°C for 4500 h are shown in FIG. 2. No failure was observed in the ZrC and OPyCcoating layers. In some particles the IPyC coating layers were cracked in the radial direction.No palladium attack and thermal degradation of ZrC were observed.
456
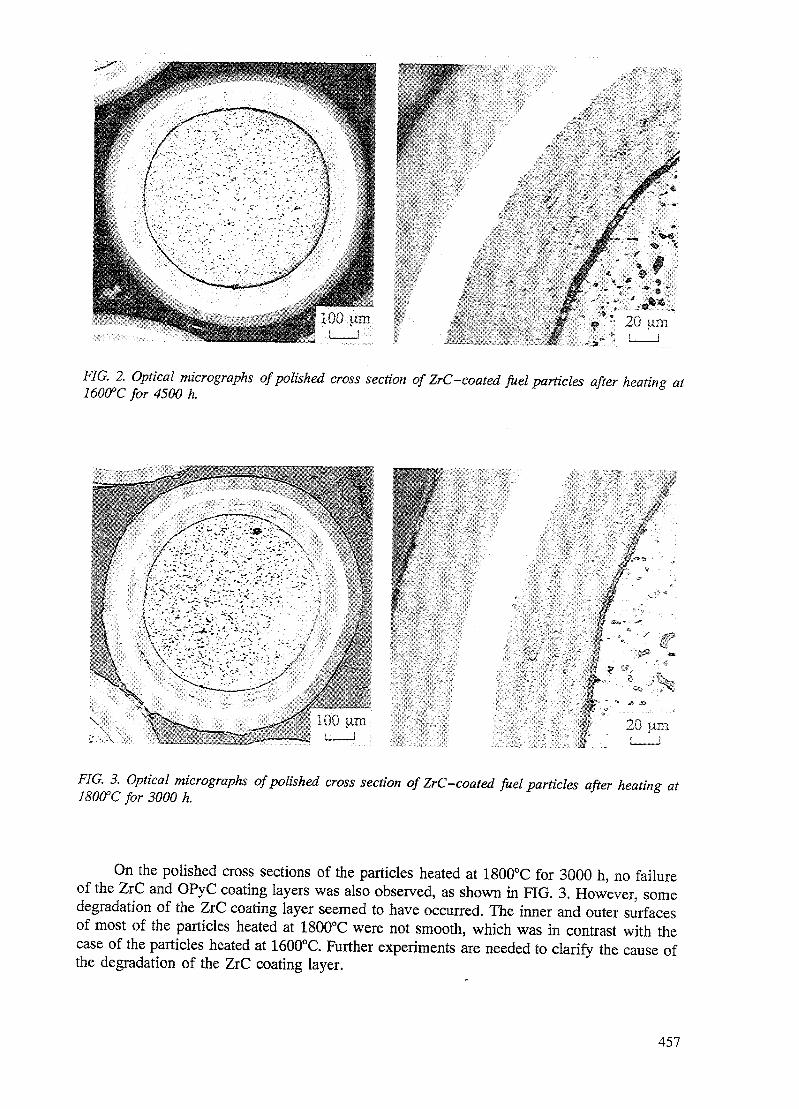
F/G. 2. Optfcfl/ micrographs of polished cross section of ZrC-coated fuel particles after heating at160CPC for 4500 h.
FIG. 3. Optical micrographs of polished cross section of ZrC-coated fuel particles after heating at180(fC for 3000 h.
On the polished cross sections of the particles heated at 1800°C for 3000 h, no failureof the ZrC and OPyC coating layers was also observed, as shown in FIG. 3. However, somedegradation of the ZrC coating layer seemed to have occurred. The inner and outer surfacesof most of the particles heated at 1800°C were not smooth, which was in contrast with thecase of the particles heated at 1600°C. Further experiments are needed to clarify the cause ofthe degradation of the ZrC coating layer.
457
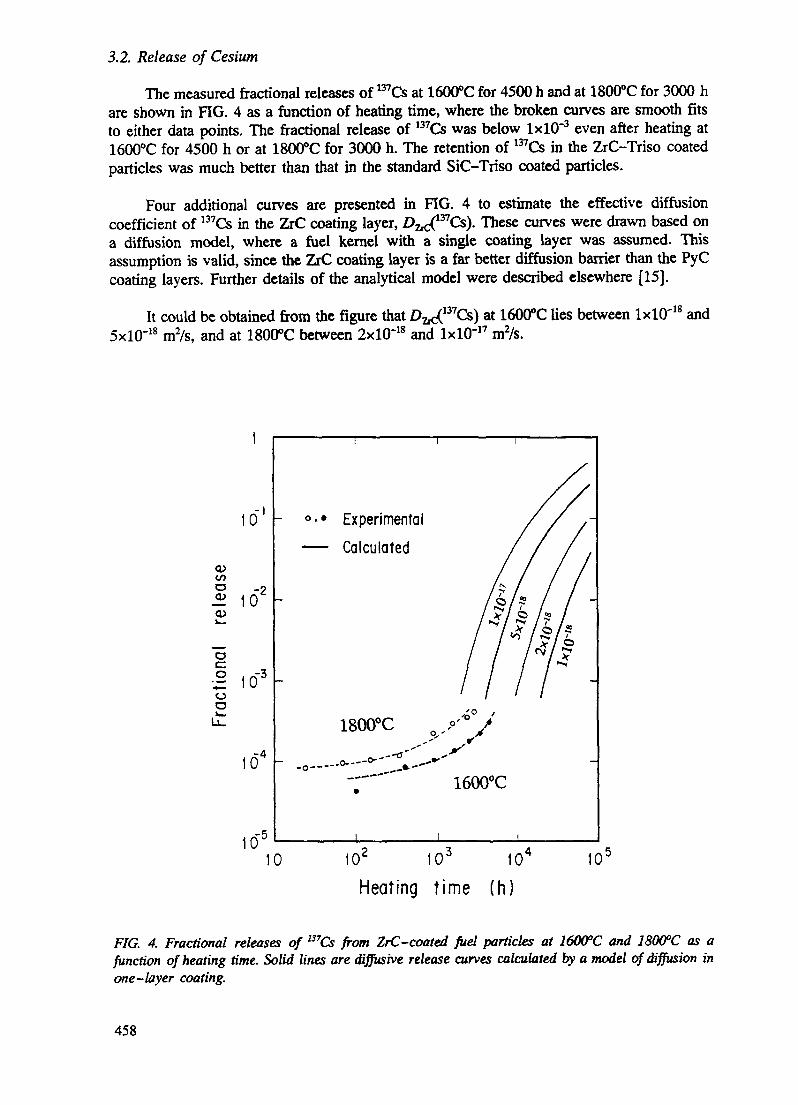
3.2. Release of Cesium
The measured fractional releases of 137Cs at 1600°C for 4500 h and at 1800°C for 3000 hare shown in FIG. 4 as a function of heating time, where the broken curves are smooth fitsto either data points. The fractional release of 137Cs was below IxlO"3 even after hearing at1600°C for 4500 h or at 1800°C for 3000 h. The retention of 137Cs in the ZrC-Triso coatedparticles was much better than that in the standard SiC-Triso coated particles.
Four additional curves are presented in FIG. 4 to estimate the effective diffusioncoefficient of 137Cs in the ZrC coating layer, D^^Cs). These curves were drawn based ona diffusion model, where a fuel kernel with a single coating layer was assumed. Thisassumption is valid, since the ZrC coating layer is a far better diffusion barrier than the PyCcoating layers. Further details of the analytical model were described elsewhere [15].
It could be obtained from the figure that D7t^yrCs) at 1600°C lies between IxlO'18 and5xlO-38 m2/s, and at 1800°C between 2xlO'18 and IxlO'17 m2/s.
0
o>t/>0 -2* 10
•2 103
oo
o4
105
«•• Experimental— Calculated
1800°C
10 * 103 10
Heating time (h)10'
FIG. 4. Fractional releases of 137Cs from ZrC-coated fuel particles at 1600PC and 180GPC as afunction of heating time. Solid lines are diffusive release curves calculated by a model of diffusion inone-layer coating.
458

It is apparent in the figure that the shape of the measured fractional release curves weredifferent from that of the calculated diffusive release curves. The rather flat parts of themeasured curves at very low fractional release were attributed to the release of contaminated137Cs in the OPyC layer, which was not considered in the calculation. In both the heatingtests, the diffusive release through the ZrC layer just started near the end of the heating tests.The fractional release curves of this kind were often observed in several postirradiationheating experiments [17-19].
The present values for D^^Cs) are compared with the reported effective diffusioncoefficients of 137Cs in the SiC coating layer, D^^Cs) [17,20-22] in FIG. 5. At 1600°C thepresent D^^Cs) was more than one order of magnitude as low as DSiC(137Cs), whereas at1800°C Dz^^Cs) was more than two orders of magnitude as low as
Although DZ^^CS) data at higher temperatures than 1800°C are needed, these resultsencourage us to use the ZrC-Triso coated fuel particles at higher temperatures than theSiC-Triso coated fuel particles from the viewpoint of the retention of the key fission product.
Temperature (°C)-14 2000 1800 1600 1400 1200
1 U i i i i
:o
.¥ 10'o
15
cuoo10'
Oto
5 Id'8
10
KFA1991SiC)
Minato et al.( S i C )
KFA 1986(S iC )
Present data(Z rC )
i
Ogawa et al.(SiC)
4 5 6Reciprocal temperature (10 /K)
FIG. 5. Comparison of diffusion coefficients of 137Cs in ZrC with those in SiC as a function oftemperature. Data from literature are Minato et al. [17], Ogawa et al. [20], Moormann & Verfondern[21], and Verfondern & Muller [22].
459

3.3. Release of Ruthenium
The measured fractional releases of 106Ru at 1600°C for 4500 h and at 1800°C for3000 h are shown in FIG. 6 as a function of heating time. The calculated diffusive releasecurves are also shown in the figure, which were fitted to the data points of either heatingtests. The diffusion model used was the same as that described above.
The release behavior of 106Ru was determined by the transport both in the UO2 kerneland in the ZrC coating layer, which was in contrast with the 137Cs release behavior controlledby the transport in the ZrC coating layer. For the best fit the diffusion coefficients ofD2>c(106Ru)=3xlO-16 m2/s at 1600°C and DZlC(J06Ru)=5xlO-15 m2/s at 1800°C were obtained.
The release of 106Ru was not reported in the postirradiation heating tests of theSiC-Triso coated fuel particles at 1600°C as long as 500 h and at 1800°C as long as 200 h[17-19]. The present fractional releases of 106Ru were more than IxlO"1 at 1600°C for 4500 hand about 9xlO-1 at 1800°C for 3000 h. These values were very large compared with the caseof the SiC-Triso coated particles, suggesting that SiC is a better diffusion barrier toruthenium than ZrC. Ogawa et al. [13] previously pointed out that the diffusion coefficientof ruthenium in ZrC is somewhat larger than that in SiC and discussed the fast diffusion ofruthenium by means of the atomic radius ratio of Ru/Zr.
10"
1/5o
OCO
10~3
-410
10
1800°C
° • • Experimental—— Calculated
10 102 103 104
Heating time (h)10"
FIG. 6. Fractional releases of "*Ru from ZrC-coated fuel particles at 1600°C and 2800°C as afunction of heating time. Solid lines are diffusive release curves calculated by a model of diffusion ina fuel kernel and one-layer coating.
460

3.3. Release of Other Fission Products
Besides 137Cs and 106Ru, the release of fission products of l34Cs, 144Ce, 154Eu and 155Euwere detected by y-iay spectrometry of the graphite components. These fission products musthave been released through the coating layers. Although the release data of 137Cs and 106Rucould be treated quantitatively, the accuracy of the measured values for 134Cs, 144Ce, 154Eu and1S5Eu was not enough to evaluate the effective diffusion coefficients since the counts by y-rayspectrometry were small.
The fission products with relatively short half lives could not be detected since thepresent experiment was carried out about 9 years after the end of irradiation of the ZrC-Trisocoated fuel particles.
The radionuclide 110mAg, whose half life is 250.4 d, is known as one of the mostreleasable radionuclides from the SiC-Triso coated fuel particles. Although the release of110mAg was not detected in the present experiment, it cannot be concluded that the ZrC coatinglayer has excellent 110mAg retentiveness. In the present study, the ratio of inventories of 110l"Agto 106Ru was less than IxlO"3 just before the heating tests, meaning that the inventory of110DIAg was too small to be detected even if 110mAg was released.
to
o
10
Temperature (°C).,4 2000 1800 1600 1400
IO 15
IO 16
OJo
I io17oIO
5 1018
io 19
1200
106 RuN
N ItOrn.
.105Ru
' ""ft,
'"CS J«oBaI37« A
CS o 85
4 5 6 7
Reciprocal temperature (10~4/K)
FIG. 7. Diffusion coefficients of fission products in ZrC as a Junction of temperature. Data of solidcircles are from the present experiments, open circles from Ogawa & Ikawa [13], and broken linesfrom Chernikov[14].
461

The diffusion coefficients in ZrC obtained in the present experiment and those inliterature [13,14] are shown in FIG. 7. The number of the data is limited and furtherexperiments are, therefore, needed.
4. CONCLUSIONS
Postirradiation heating tests of the ZrC-Triso coated UO2 particles were performed at1600°C for 4500 h and at 1800°C for 3000 h to study the release behavior of fission products.The following was concluded:
(1) The fission gas release monitoring and the X-ray rnicroradiography revealed thatno pressure vessel failure occurred during the heating tests.
(2) The ZrC-Triso coated fuel particles showed better cesium retention than thestandard Triso-coated fuel particles.
(3) In spite of better cesium retention, the ZrC layer showed a less effective barrierto ruthenium than the SiC layer.
ACKNOWLEDGEMENTS
The authors wish to express their thanks to Dr. M. Hoshi, Director of Department ofChemistry and Fuel Research, Japan Atomic Energy Research Institute (JAERI), for hisinterest and encouragement, and colleagues in Department of JMTR Project, JAERI, for theircooperation in the irradiation test.
REFERENCES
[1] FUKUDA, K., OGAWA, T., HAYASHI, K., SHIOZAWA, S., TSURUTA, H.,TANAKA, H., SUZUKI, R, YOSHIMUTA, H., KANEKO, M., J. Nucl. Sci. Technol.28 (1991) 570.
[2] NABIELEK, H., KUHNLEIN, W., SCHENK, W., HEIT, W., CHRIST, A., RAGOSS,H., Nucl. Eng. Design 121 (1990) 199.
[3] GOODIN, D. T., Energy 16 (1991) 187.[4] NABIELEK, H., SCHENK, W., HEIT, W., MEHNER, A. -W., GOODIN, D. T., Nucl.
Technol. 84 (1989) 62.[5] GOODIN, D. T., J. Am. Ceram. Soc. 65 (1982) 238.[6] KURATA, Y., KAWA, K., IWAMOTO, K,, J. Nucl. Mater. 92 (1980) 351.[7] REYNOLDS, G. H., JANVEER, J. C, KAAE, J. L., MORLEVAT, J. P., J. Nucl. Mater.
62 (1976) 9.[8] WAGNER, P., High Temperature Fuel Technology for Nuclear Process Heat: ZrC-
Containing Coated Particle Fuels and High-Density Graphite Fuel Matrices, Los AlamosNational Laboratory, Report LA-6984 (1977).
[9] OGAWA, T., IKAWA, K., FUKUDA, K., KASHIMURA, S., IWAMOTO, K., inNuclear Fuel Performance (BNES, London, 1985) p. 163.
[10] OGAWA, T., FUKUDA, K., KASHIMURA, S., TOBITA, T., KOBAYASHI, F.,KADO, S., MIYANISHI, H., TAKAHASHI, L, KIKUCHI, T., J. Am. Ceram. Soc. 75(1992) 2985.
462

[11] OGAWA, T., IKAWA, K., High Temp. Sci. 22 (1986) 179.[12] OGAWA, T., FUKUDA, K., Proc. the 4th International Symposium on Advanced
Nuclear Energy Research, Mito, Japan, Feb. 5-7, 1992, JAERI-M 92-207 (1992) pp.554-560.
[13] OGAWA, T., IKAWA, K., J. Nucl. Mater. 105 (1982) 331.[14] CHERNIKOV, A. S., Proc. IAEA Specialists Meeting on Fission Product Release and
Transport in Gas-Cooled Reactors, Berkeley, UK, Oct. 22-25, 1985 (IAEA, Vienna,1986) pp. 170-181.
[15] MINATO, K., OGAWA, T., FUKUDA, K., NABIELEK, K., SEKINI, H., NOZAWA,Y., TAKAHASHI, I., Fission Product Release from ZrC-coated Fuel Particles duringPostirradiation Heating at 1600°C, J. Nucl. Mater. 224 (1995) 85.
[16] OGAWA, T., IKAWA, K., IWAMOTO, K., J. Nucl. Mater. 97 (1981) 104.[17] MINATO, K., OGAWA, T., FUKUDA, K, SEKINO, H., MIYANISHI, H., KADO, S.,
TAKAHASHI, I., J. Nucl. Mater. 202 (1993) 47.[18] SCHENK, W., POTT, G., NABIELEK, H., J. Nucl. Mater. 171 (1990) 19.[19] SCHENK, W., NABIELEK, H., Nucl. Technol. 96 (1991) 323.[20] OGAWA, T., FUKUDA, K., KASHIMURA, S., TOBITA, T., ITOH, T., KITAGAWA,
I., MIYANISHI, H., SEKINO, H., NUMATA, M., IWAMOTO, K., IKAWA, K.,Release of Metal Fission Products from Coated Particle Fuel -Swept-gas Capsule74F9J, 75F4A and 75F5A, Japan Atomic Energy Research Institute, Report JAERI-M85-041 (1985).
[21] MOORMANN, R., VERFONDERN, K., Methodflc umfassender probabilistischerSicherheitsanalysen fur zukunftige HTR-Anlagenkonzepte -Ein Statusbericht (Stand1986), Band 3: Spaltproduktfreisetzung, Forschungszentrum Julich, Report Jul-Spez-388/Vol. 3 (1987).
[22] VERFONDERN, K., MULLER, D., Proc. IAEA Specialists' Meeting on Behaviour ofGCR Fuel under Accident Conditions, Oak Ridge, USA, Nov. 5-8, 1990 (IAEA,Vienna, 1991) pp. 45-54.
NEXT PAGE(S) Ileft BLANK I
I 463

LIST OF PARTICIPANTS
Arbie, B.
Bailey, P.
Balz, W.
Bamert, H.
Bastien, D.
Beyer, E.
Brey, H.L.
Brown, K.
Carruthers, F.
Clapisson, G.A.
Coker, I.
Crommelin, G.A.K.
Dams, M.
Davies, M.A.
National Atomic Energy Agency,Pusat Reaktor Serba Guna,Puspiptek Building 31,Serpong, Indonesia
PGBI Engineers and Constructors (Pty) Ltd,P.O. Box 2668, Rivonia 2128, South Africa
European Commission,200, rue de La Loi, Office M075 5/37,B-1049 Brussels, Belgium
Kernforschungszuntrum Jiilich GmbH,P.O. Box 1913, D-52425 Jiilich, Germany
CEA/SACLAY,DMT/DIR,F-91191 Gif-sur-Yvette-Cedex. France
Integrators of System Technology (Pty) Ltd,P.O. Box 95355, Waterkloof 0145, South Africa
International Atomic Energy Agency,P.O. Box 100, Wagramerstrasse 5,A-1400 Vienna, Austria
Atomic Energy Corporation of South Africa, Ltd,P.O. Box 582, Pretoria 0001, South Africa
INTENS (Pty) Ltd,Private Bag XI0, Kernkrag 7440, South Africa
Council for Nuclear Safety,P.O. Box 7106, Hennopsmeer 0046, South Africa
Eskom,Megawatt Park, P.O. Box 1091,Johannesburg 2000, South Africa
Tsjaikovskilaan 10,NL-2253 HS Voorschoten, Netherlands
Integrators of System Technology (Pty) Ltd,P.O. Box 95355, Waterkloof 0145, South Africa
AEA Technology,THOR12, Thomson House,Risley, Warrington, Cheshire,United Kingdom
465
de Beer, J.A.
de Lange, M.
de Vries, G.F.
Dowds, B.
du Plessis, I.
du Preez, W.
du Toit, D.
Fox, M.
Geabashe, T.
Geng, Z.
Giret, B.
Haas, K.A.
Haasbroek, A.C.
Hayakawa, H.
Hayashi, T.
Haywood, W.
Eskom,Megawatt Park, P.O.Box 1091,Johannesburg 2000, South Africa
Integrators of System Technology (Pty) Ltd,P.O. Box 95355, Waterkloof 0145, South Africa
SCITEC,P.O. Box 1110, Rivonia 2128, South Africa
Eskom,Megawatt Park, P.O. Box 1091,Johannesburg 2000, South Africa
Integrators of System Technology (Pty) Ltd,P.O. Box 95355, Waterkloof 0145, South Africa
Integrators of System Technology (Pty) Ltd,P.O. Box 95355, Waterkloof 0145, South Africa
Integrators of System Technology (Pty) Ltd,P.O. Box 95355, Waterkloof 0145, South Africa
Integrators of System Technology (Pty) Ltd,P.O. Box 95355, Waterkloof 0145, South Africa
Department of Minerals and Energy,P.O. Box 646, Pretoria 0001, South Africa
China State Science and Technology Commission,Fuxing Road, Beijing 100862, China
Framatome,Private Bag X08, Melkbosstrand,Cape Province 7437, South Africa
Kernforschungszentrum Jtilich GmbH,P.O. Box 1913, D-52425 Jtilich, Germany
Integrators of System Technology (Pty) Ltd,P.O. Box 95355, Waterkloof 0145, South Africa
Fuji Electric Co, Ltd,1-12-1 Yurakucho 1-chome, Chiyoda-ku,Tokyo 100, Japan
Tokai University,2-28-4 Tomigaya, Shibuya-ku Toyko, Japan
Integrators of System Technology (Pty) Ltd,P.O. Box 95355, Waterkloof 0145, South Africa
466

Henderson, N.R.
Hill, T.F.
Jones, I.O.
Kitamura, N.
Kullmann, B.
Kuijper, J.C.
Kupitz, J.
Kussman, M.
La Bar, M.
Lasman, A.N.
Laubscher, F.
Liebenberg, L.L.
Lomba, D.
Matev, A.
Matzner, D.
Council for Nuclear Safety,P.O. Box 7106, Hennopsmeer 0046, South Africa
Council for Nuclear Safety,P.O. Box 7106, Hennopsmeer 0046, South Africa
PGBI Engineers and Constructors (Pty) Ltd,P.O. Box 2668, Rivonia 2128, South Africa
Nuclear Fuel Industries, Ltd,3135-41, Muramatu, Tokai-mura,Naka-gun, Ibaraki 319-11, Japan
Integrators of System Technology (Pty) Ltd,P.O. Box 95355, Waterkloof 0145, South Africa
Netherlands Energy Research Foundation,Westerduinweg 3, P.O. Box 1,NL-1755 ZG Petten, Netherlands
International Atomic Energy Agency,P.O. Box 100, Wagramerstrasse 5,A-1400 Vienna, Austria
Council for Nuclear Safety,P.O. Box 7106, Hennopsmeer 0046, South Africa
General Atomics,P.O. Box 85608, San Diego, California 92186,United States of America
National Atomic Energy Agency,Jl. KH. Abdul Rohim, Kuningan Barat,Mampang Prapatan, Jakarta 12710, Indonesia
Integrators of System Technology (Pty) Ltd,P.O. Box 95355, Waterkloof 0145, South Africa
Atomic Energy Corporation of South Africa, Ltd,P.O. Box 582, Pretoria 0001, South Africa
GEC Alsthom Power Generation,3, avenue des trois chenes,F-90018 Belfort Cedex, France
Eskom,Megawatt ParkJP.O. Box 1091,Johannesburg 2000, South Africa
Integrators of System Technology (Pty) Ltd,P.O. Box 95355, Waterkloof 0145, South Africa
467

Minatsuki, I.
Mulder, E.
Mysenkov, A.
Nicholls, D.R.
Penzhorn, H.
Pohl, P.
Preston, J.
Reutler, H.
Roux, A.J.A.
Riitten, H.J.
Sato, K.
Schaal, M.O.
Scherer, W.P.
Shiozawa, S.
Advanced Reactor Deparment,Nuclear Engineering System Headquarters,Mitsubishi Heavy Industries Ltd,3-1 Minatomirai 3-chome,Nishi-ku, Yokohama 220-84, Japan
AVR GmbH,Wilhelm-Johnen-Strasse,D-52425 Jiilich, Germany
Council for Nuclear Safety,P.O. Box 7106, Hennopsmeer 0046, South Africa
Eskom,Megawatt Park D3242, P.O. Box 1091,Johannesburg 2000, South Africa
Integrators of System Technology (Pty) Ltd,P.O. Box 95355, Waterkloof 0145, South Africa
AVR GmbH,Wilhelm-Johnen-Strasse, D-52428 Jiilich, Germany
EWI,Electrowatt House, North Street,Horsham RH12 1RF, United Kingdom
HTR GmbH,Wachtersbacher Strasse 78, D-60386 Frankfurt, Germany
Atomic Energy Corporation of South Africa, Ltd,P.O. Box 582, Pretoria 0001, South Africa
Kemforschungszentrum Jiilich GmbH,P.O. Box 1913, D-52425 Jtilich, Germany
Nuclear Fuel Industries, Ltd,3135-41, Muramatu, Tokai-mura,Naka-gun, Ibaraki 319-11, Japan
PGBI Engineers and Constructors (Pty) Ltd,P.O. Box 2668, Rivonia 2128, South Africa
Keraforschungszentnim Jiilich GmbH,P.O. Box 1913, D-52425 Jiilich, Germany
Japan Atomic Energy Research Institute,Oarai-machi, Ibaraki-ken 311-13, Japan
468
Singh, J.
Skopal, P.
Strydom, A.
Sukharev, Y.
Taviv, E.
Tajiri, H.
Tachibana, Y.
Teuchert, E.
Thiot, D.
Tsuchie, Y.
van Heek, A.
Venter, G.P.N.
Verkerk, E.
von Lensa, W.
Walmsley, J.
Kemforschungszentrum Jtilich GmbH,P.O. Box 1913, D-52425 Jiilich, Germany
Eskom,Megawatt Park, P.O. Box 1091,Johannesburg 2000, South Africa
Integrators of System Technology (Pty) Ltd,P.O. Box 95355, Waterkloof 0145, South Africa
OKB Mechanical Engineering,Bumakovsky Proezd 15, 603603 Nizhny Novgorod 74,Russian Federation
Eskom,Megawatt Park, P.O. Box 1091,Johannesburg 2000, South Africa
Nuclear Fuel Industries, Ltd,3135-41, Muramatu, Tokai-mura,Naka-gun, Ibaraki 319-11, Japan
Japan Atomic Energy Research Institute,Oarai-machi, Ibaraki-ken 311-13, Japan
Kemforschungszentrum Jtilich GmbH,P.O. Box 1913, D-52425 Jtilich, Germany
GEC Alsthom Power Generation,3, avenue des trois chenes,F-90018 Belfort Cedex, France
Japan Atomic Power Co. Ltd,1-6-1 Otemachi Chiyoda-ku, Tokyo 100, Japan
Netherlands Energy Research Foundation,Westerduinweg 3, P.O. Box 1,NL-1755 ZG Petten, Netherlands
Department of Minerals and EnergyP.O. Box 59, Pretoria 0001, South Africa
Integrators of System Technology (Pty) Ltd,P.O. Box 95355, Waterkloof 0145, South Africa
Kemforschungszentrum Jtilich GmbH,P.O. Box 1913, D-52425 Jtilich, Germany
Eskom,Megawatt Park, P.O. Box 1091,Johannesburg 2000, South Africa
469

Whitacker, H. Koeberg Nuclear Power Station,Melkbosstrand, Cape Town, South Africa
Will, M. AYR GmbH,Wilhelm-Johnen-strasse,D-52428 Jiilich, Germany
Wium, D. AFRICON,P.O. Box 905, Pretoria 0001, South Africa
Xu, Y. Institute of Nuclear Engineering Technology,Tsinghua University, Beijing, 100084, China
in<ooCOoriO)
470