Capability of different microalgae species for phytoremediation processes: Wastewater tertiary...
10
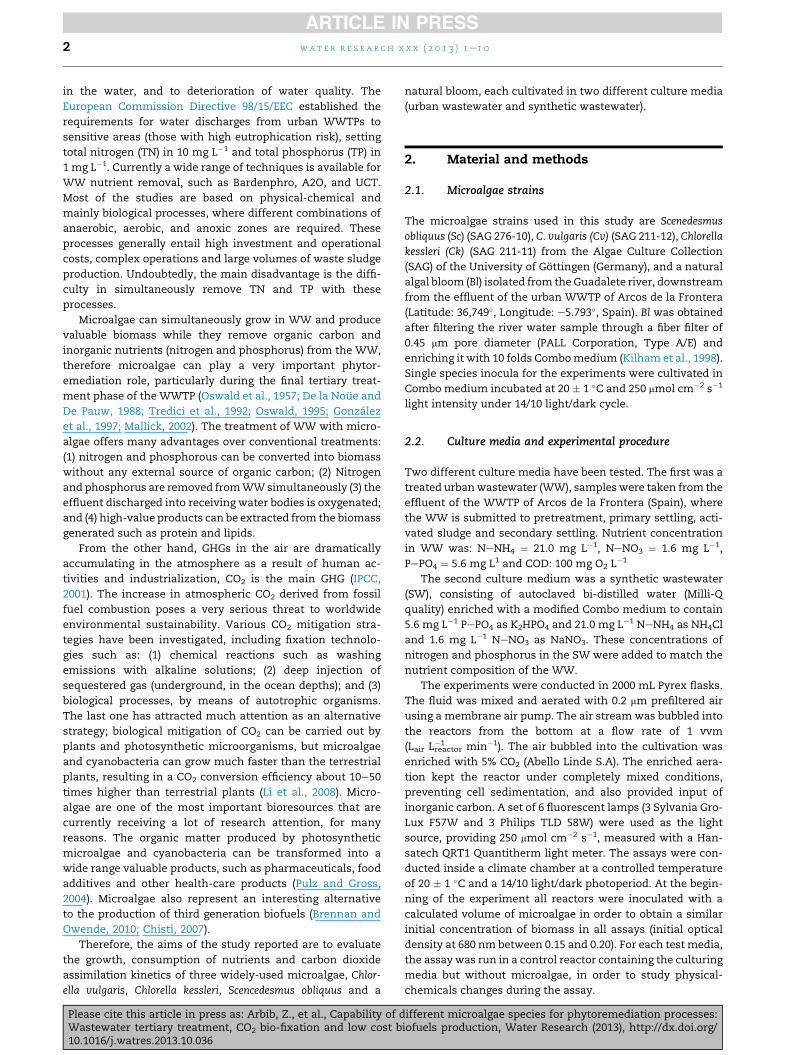
Capability of different microalgae species for phytoremediation processes: Wastewater tertiary treatment, CO 2 bio-fixation and low cost biofuels production Zouhayr Arbib a,b, *, Jesu ´ s Ruiz a , Pablo A ´ lvarez-Dı´az a , Carmen Garrido-Pe ´rez a , Jose ´ A. Perales a a Department of Environmental Technologies, Centro Andaluz de Ciencia y Tecnologı´a Marinas (CACYTMAR), Campus de Excelencia Internacional del Mar (CEIMAR), Campus Universitario de Puerto Real, University of Ca ´diz, 11510 Puerto Real, Ca ´diz, Spain b Aqualia Gestion Integral del Agua SA, Spain article info Article history: Received 29 July 2013 Received in revised form 10 October 2013 Accepted 13 October 2013 Available online xxx Keywords: Microalgae Tertiary treatment Eutrophication Carbon dioxide Lipids abstract Scenedesmus obliquus, Chlorella vulgaris, Chlorella kessleri and a natural Bloom were cultivated in batch experiments, under controlled conditions, in urban wastewater (WW) and syn- thetic wastewater (SW) under 5% CO 2 in air, with the object of estimating their capacity for nutrient removal, carbon dioxide biofixation, and generation of valuable biomass. In both culture media, the Bloom (Bl) and Scenedesmus (Sc) showed higher final biomass concen- tration (dried weight, dw) than the other species; the maximum yield obtained was 1950 243 mg L 1 for Bl and the minimum 821 88 mg L 1 for Cv, both in synthetic wastewater. Maximum specific growth rate values do not show significant differences between any of the 4 strains tested (p 0.05), nor between the 2 culture media. A new homogeneous method of calculating productivities has been proposed. Nitrogen removal in all the reactors was higher than 90%, except for BlSW (79%), and for phosphorus, the removal was higher than 98% in all trials. Maximum CO 2 consumption rates reached were 424.4 and 436.7 mg L 1 d 1 for ScSW and ScWW respectively. ª 2013 Elsevier Ltd. All rights reserved. 1. Introduction Currently the high rate of urban population growth is generating very large amounts of waste that must be treated before discharge. Wastewater (WW) and greenhouse gases (GHG) e mainly carbon dioxide (CO 2 ) e are two of the main wastes that pose a major challenge to global environmental sustainability. Considering first the problem of WW, a relatively new requirement for wastewater treatment plants (WWTP) is the capacity to remove high concentrations of nutrients, in particular, nitrogen and phosphorus, which otherwise present a serious risk of eutrophication when those nutrients accu- mulate in rivers and lakes. Eutrophication causes an acceler- ated growth of algae and plants, leading in turn to an undesirable disturbance to the balance of organisms present * Corresponding author. Department of Environmental Technologies, Centro Andaluz de Ciencia y Tecnologı´a Marinas (CACYTMAR), Campus de Excelencia Internacional del Mar (CEIMAR), Campus Universitario de Puerto Real, University of Ca ´ diz, 11510 Puerto Real, Ca ´ diz, Spain. E-mail address: [email protected] (Z. Arbib). Available online at www.sciencedirect.com ScienceDirect journal homepage: www.elsevier.com/locate/watres water research xxx (2013) 1 e10 Please cite this article in press as: Arbib, Z., et al., Capability of different microalgae species for phytoremediation processes: Wastewater tertiary treatment, CO 2 bio-fixation and low cost biofuels production, Water Research (2013), http://dx.doi.org/ 10.1016/j.watres.2013.10.036 0043-1354/$ e see front matter ª 2013 Elsevier Ltd. All rights reserved. http://dx.doi.org/10.1016/j.watres.2013.10.036
Transcript of Capability of different microalgae species for phytoremediation processes: Wastewater tertiary...
ww.sciencedirect.com
wat e r r e s e a r c h x x x ( 2 0 1 3 ) 1e1 0
Available online at w
ScienceDirect
journal homepage: www.elsevier .com/locate/watres
Capability of different microalgae species forphytoremediation processes: Wastewater tertiarytreatment, CO2 bio-fixation and low cost biofuelsproduction
Zouhayr Arbib a,b,*, Jesus Ruiz a, Pablo Alvarez-Dıaz a,Carmen Garrido-Perez a, Jose A. Perales a
aDepartment of Environmental Technologies, Centro Andaluz de Ciencia y Tecnologıa Marinas (CACYTMAR),
Campus de Excelencia Internacional del Mar (CEIMAR), Campus Universitario de Puerto Real, University of Cadiz,
11510 Puerto Real, Cadiz, SpainbAqualia Gestion Integral del Agua SA, Spain
a r t i c l e i n f o
Article history:
Received 29 July 2013
Received in revised form
10 October 2013
Accepted 13 October 2013
Available online xxx
Keywords:
Microalgae
Tertiary treatment
Eutrophication
Carbon dioxide
Lipids
* Corresponding author. Department of EnvCampus de Excelencia Internacional del MaCadiz, Spain.
E-mail address: [email protected] (Z.
Please cite this article in press as: Arbib,Wastewater tertiary treatment, CO2 bio-10.1016/j.watres.2013.10.036
0043-1354/$ e see front matter ª 2013 Elsevhttp://dx.doi.org/10.1016/j.watres.2013.10.036
a b s t r a c t
Scenedesmus obliquus, Chlorella vulgaris, Chlorella kessleri and a natural Bloom were cultivated
in batch experiments, under controlled conditions, in urban wastewater (WW) and syn-
thetic wastewater (SW) under 5% CO2 in air, with the object of estimating their capacity for
nutrient removal, carbon dioxide biofixation, and generation of valuable biomass. In both
culture media, the Bloom (Bl) and Scenedesmus (Sc) showed higher final biomass concen-
tration (dried weight, dw) than the other species; the maximum yield obtained was
1950 � 243 mg L�1 for Bl and the minimum 821 � 88 mg L�1 for Cv, both in synthetic
wastewater. Maximum specific growth rate values do not show significant differences
between any of the 4 strains tested (p � 0.05), nor between the 2 culture media. A new
homogeneous method of calculating productivities has been proposed. Nitrogen removal
in all the reactors was higher than 90%, except for BlSW (79%), and for phosphorus, the
removal was higher than 98% in all trials. Maximum CO2 consumption rates reached were
424.4 and 436.7 mg L�1 d�1 for ScSW and ScWW respectively.
ª 2013 Elsevier Ltd. All rights reserved.
1. Introduction Considering first the problem of WW, a relatively new
Currently the high rate of urban population growth is
generating very large amounts of waste that must be treated
before discharge. Wastewater (WW) and greenhouse gases
(GHG) e mainly carbon dioxide (CO2) e are two of the main
wastes that pose a major challenge to global environmental
sustainability.
ironmental Technologies,r (CEIMAR), Campus Uni
Arbib).
Z., et al., Capability of dfixation and low cost b
ier Ltd. All rights reserved
requirement for wastewater treatment plants (WWTP) is the
capacity to remove high concentrations of nutrients, in
particular, nitrogen and phosphorus, which otherwise present
a serious risk of eutrophication when those nutrients accu-
mulate in rivers and lakes. Eutrophication causes an acceler-
ated growth of algae and plants, leading in turn to an
undesirable disturbance to the balance of organisms present
Centro Andaluz de Ciencia y Tecnologıa Marinas (CACYTMAR),versitario de Puerto Real, University of Cadiz, 11510 Puerto Real,
ifferent microalgae species for phytoremediation processes:iofuels production, Water Research (2013), http://dx.doi.org/
.
wat e r r e s e a r c h x x x ( 2 0 1 3 ) 1e1 02
in the water, and to deterioration of water quality. The
European Commission Directive 98/15/EEC established the
requirements for water discharges from urban WWTPs to
sensitive areas (those with high eutrophication risk), setting
total nitrogen (TN) in 10 mg L�1 and total phosphorus (TP) in
1 mg L�1. Currently a wide range of techniques is available for
WW nutrient removal, such as Bardenphro, A2O, and UCT.
Most of the studies are based on physical-chemical and
mainly biological processes, where different combinations of
anaerobic, aerobic, and anoxic zones are required. These
processes generally entail high investment and operational
costs, complex operations and large volumes of waste sludge
production. Undoubtedly, the main disadvantage is the diffi-
culty in simultaneously remove TN and TP with these
processes.
Microalgae can simultaneously grow in WW and produce
valuable biomass while they remove organic carbon and
inorganic nutrients (nitrogen and phosphorus) from the WW,
therefore microalgae can play a very important phytor-
emediation role, particularly during the final tertiary treat-
ment phase of the WWTP (Oswald et al., 1957; De la Noue and
De Pauw, 1988; Tredici et al., 1992; Oswald, 1995; Gonzalez
et al., 1997; Mallick, 2002). The treatment of WW with micro-
algae offers many advantages over conventional treatments:
(1) nitrogen and phosphorous can be converted into biomass
without any external source of organic carbon; (2) Nitrogen
and phosphorus are removed fromWWsimultaneously (3) the
effluent discharged into receiving water bodies is oxygenated;
and (4) high-value products can be extracted from the biomass
generated such as protein and lipids.
From the other hand, GHGs in the air are dramatically
accumulating in the atmosphere as a result of human ac-
tivities and industrialization, CO2 is the main GHG (IPCC,
2001). The increase in atmospheric CO2 derived from fossil
fuel combustion poses a very serious threat to worldwide
environmental sustainability. Various CO2 mitigation stra-
tegies have been investigated, including fixation technolo-
gies such as: (1) chemical reactions such as washing
emissions with alkaline solutions; (2) deep injection of
sequestered gas (underground, in the ocean depths); and (3)
biological processes, by means of autotrophic organisms.
The last one has attracted much attention as an alternative
strategy; biological mitigation of CO2 can be carried out by
plants and photosynthetic microorganisms, but microalgae
and cyanobacteria can grow much faster than the terrestrial
plants, resulting in a CO2 conversion efficiency about 10e50
times higher than terrestrial plants (Li et al., 2008). Micro-
algae are one of the most important bioresources that are
currently receiving a lot of research attention, for many
reasons. The organic matter produced by photosynthetic
microalgae and cyanobacteria can be transformed into a
wide range valuable products, such as pharmaceuticals, food
additives and other health-care products (Pulz and Gross,
2004). Microalgae also represent an interesting alternative
to the production of third generation biofuels (Brennan and
Owende, 2010; Chisti, 2007).
Therefore, the aims of the study reported are to evaluate
the growth, consumption of nutrients and carbon dioxide
assimilation kinetics of three widely-used microalgae, Chlor-
ella vulgaris, Chlorella kessleri, Scencedesmus obliquus and a
Please cite this article in press as: Arbib, Z., et al., Capability of dWastewater tertiary treatment, CO2 bio-fixation and low cost b10.1016/j.watres.2013.10.036
natural bloom, each cultivated in two different culture media
(urban wastewater and synthetic wastewater).
2. Material and methods
2.1. Microalgae strains
The microalgae strains used in this study are Scenedesmus
obliquus (Sc) (SAG 276-10), C. vulgaris (Cv) (SAG 211-12), Chlorella
kessleri (Ck) (SAG 211-11) from the Algae Culture Collection
(SAG) of the University of Gottingen (Germany), and a natural
algal bloom (Bl) isolated from the Guadalete river, downstream
from the effluent of the urban WWTP of Arcos de la Frontera
(Latitude: 36,749�, Longitude: e5.793�, Spain). Bl was obtained
after filtering the river water sample through a fiber filter of
0.45 mm pore diameter (PALL Corporation, Type A/E) and
enriching it with 10 folds Combomedium (Kilham et al., 1998).
Single species inocula for the experiments were cultivated in
Combo medium incubated at 20 � 1 �C and 250 mmol cm�2 s�1
light intensity under 14/10 light/dark cycle.
2.2. Culture media and experimental procedure
Two different culture media have been tested. The first was a
treated urbanwastewater (WW), sampleswere taken from the
effluent of the WWTP of Arcos de la Frontera (Spain), where
the WW is submitted to pretreatment, primary settling, acti-
vated sludge and secondary settling. Nutrient concentration
in WW was: NeNH4 ¼ 21.0 mg L�1, NeNO3 ¼ 1.6 mg L�1,
PePO4 ¼ 5.6 mg L1 and COD: 100 mg O2 L�1
The second culture medium was a synthetic wastewater
(SW), consisting of autoclaved bi-distilled water (Milli-Q
quality) enriched with a modified Combo medium to contain
5.6 mg L�1 PePO4 as K2HPO4 and 21.0 mg L�1 NeNH4 as NH4Cl
and 1.6 mg L�1 NeNO3 as NaNO3. These concentrations of
nitrogen and phosphorus in the SW were added to match the
nutrient composition of the WW.
The experiments were conducted in 2000 mL Pyrex flasks.
The fluid was mixed and aerated with 0.2 mm prefiltered air
using a membrane air pump. The air stream was bubbled into
the reactors from the bottom at a flow rate of 1 vvm
(Lair Lreactor�1 min�1). The air bubbled into the cultivation was
enriched with 5% CO2 (Abello Linde S.A). The enriched aera-
tion kept the reactor under completely mixed conditions,
preventing cell sedimentation, and also provided input of
inorganic carbon. A set of 6 fluorescent lamps (3 Sylvania Gro-
Lux F57W and 3 Philips TLD 58W) were used as the light
source, providing 250 mmol cm�2 s�1, measured with a Han-
satech QRT1 Quantitherm light meter. The assays were con-
ducted inside a climate chamber at a controlled temperature
of 20 � 1 �C and a 14/10 light/dark photoperiod. At the begin-
ning of the experiment all reactors were inoculated with a
calculated volume of microalgae in order to obtain a similar
initial concentration of biomass in all assays (initial optical
density at 680 nm between 0.15 and 0.20). For each test media,
the assaywas run in a control reactor containing the culturing
media but without microalgae, in order to study physical-
chemicals changes during the assay.
ifferent microalgae species for phytoremediation processes:iofuels production, Water Research (2013), http://dx.doi.org/
wat e r r e s e a r c h x x x ( 2 0 1 3 ) 1e1 0 3
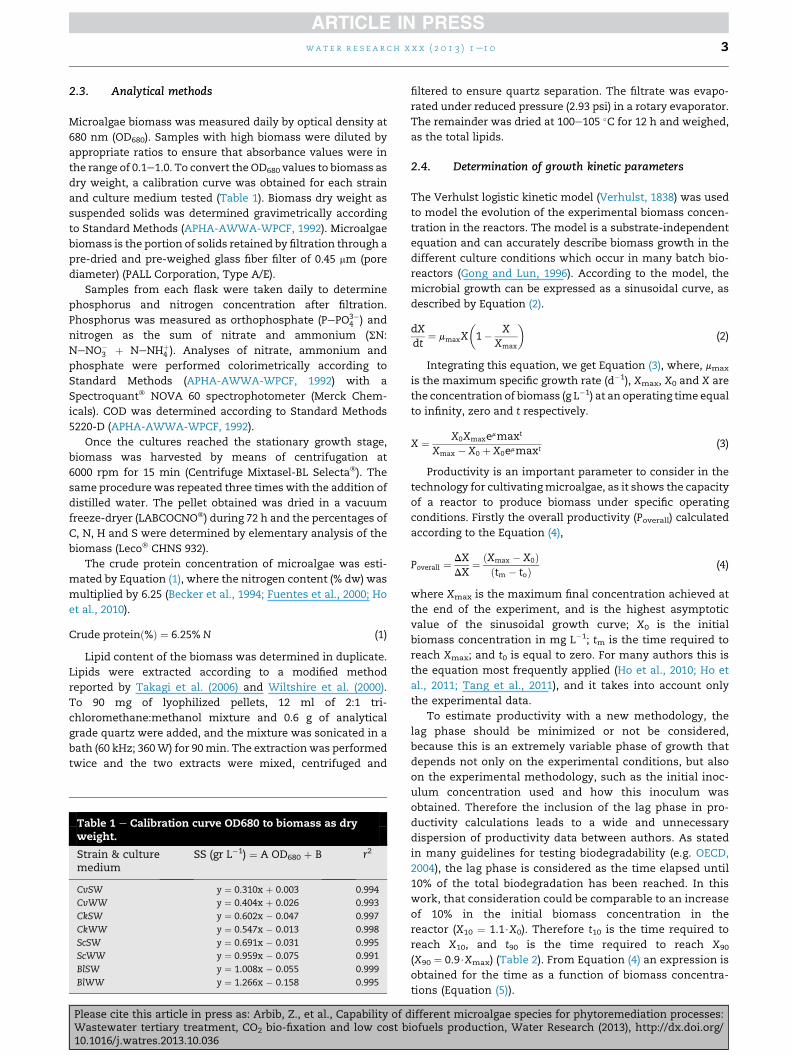
2.3. Analytical methods
Microalgae biomass was measured daily by optical density at
680 nm (OD680). Samples with high biomass were diluted by
appropriate ratios to ensure that absorbance values were in
the range of 0.1e1.0. To convert the OD680 values to biomass as
dry weight, a calibration curve was obtained for each strain
and culture medium tested (Table 1). Biomass dry weight as
suspended solids was determined gravimetrically according
to Standard Methods (APHA-AWWA-WPCF, 1992). Microalgae
biomass is the portion of solids retained by filtration through a
pre-dried and pre-weighed glass fiber filter of 0.45 mm (pore
diameter) (PALL Corporation, Type A/E).
Samples from each flask were taken daily to determine
phosphorus and nitrogen concentration after filtration.
Phosphorus was measured as orthophosphate (PePO3�4 ) and
nitrogen as the sum of nitrate and ammonium (SN:
NeNO�3 þ NeNHþ
4 ). Analyses of nitrate, ammonium and
phosphate were performed colorimetrically according to
Standard Methods (APHA-AWWA-WPCF, 1992) with a
Spectroquant� NOVA 60 spectrophotometer (Merck Chem-
icals). COD was determined according to Standard Methods
5220-D (APHA-AWWA-WPCF, 1992).
Once the cultures reached the stationary growth stage,
biomass was harvested by means of centrifugation at
6000 rpm for 15 min (Centrifuge Mixtasel-BL Selecta�). The
same procedure was repeated three times with the addition of
distilled water. The pellet obtained was dried in a vacuum
freeze-dryer (LABCOCNO�) during 72 h and the percentages of
C, N, H and S were determined by elementary analysis of the
biomass (Leco� CHNS 932).
The crude protein concentration of microalgae was esti-
mated by Equation (1), where the nitrogen content (% dw) was
multiplied by 6.25 (Becker et al., 1994; Fuentes et al., 2000; Ho
et al., 2010).
Crude proteinð%Þ ¼ 6:25% N (1)
Lipid content of the biomass was determined in duplicate.
Lipids were extracted according to a modified method
reported by Takagi et al. (2006) and Wiltshire et al. (2000).
To 90 mg of lyophilized pellets, 12 ml of 2:1 tri-
chloromethane:methanol mixture and 0.6 g of analytical
grade quartz were added, and the mixture was sonicated in a
bath (60 kHz; 360W) for 90min. The extractionwas performed
twice and the two extracts were mixed, centrifuged and
Table 1 e Calibration curve OD680 to biomass as dryweight.
Strain & culturemedium
SS (gr L�1) ¼ A OD680 þ B r2
CvSW y ¼ 0.310x þ 0.003 0.994
CvWW y ¼ 0.404x þ 0.026 0.993
CkSW y ¼ 0.602x � 0.047 0.997
CkWW y ¼ 0.547x � 0.013 0.998
ScSW y ¼ 0.691x � 0.031 0.995
ScWW y ¼ 0.959x � 0.075 0.991
BlSW y ¼ 1.008x � 0.055 0.999
BlWW y ¼ 1.266x � 0.158 0.995
Please cite this article in press as: Arbib, Z., et al., Capability of dWastewater tertiary treatment, CO2 bio-fixation and low cost b10.1016/j.watres.2013.10.036
filtered to ensure quartz separation. The filtrate was evapo-
rated under reduced pressure (2.93 psi) in a rotary evaporator.
The remainder was dried at 100e105 �C for 12 h and weighed,
as the total lipids.
2.4. Determination of growth kinetic parameters
The Verhulst logistic kinetic model (Verhulst, 1838) was used
to model the evolution of the experimental biomass concen-
tration in the reactors. The model is a substrate-independent
equation and can accurately describe biomass growth in the
different culture conditions which occur in many batch bio-
reactors (Gong and Lun, 1996). According to the model, the
microbial growth can be expressed as a sinusoidal curve, as
described by Equation (2).
dXdt
¼ mmaxX
�1� X
Xmax
�(2)
Integrating this equation, we get Equation (3), where, mmax
is the maximum specific growth rate (d�1), Xmax, X0 and X are
the concentration of biomass (g L�1) at an operating time equal
to infinity, zero and t respectively.
X ¼ X0Xmaxemmaxt
Xmax � X0 þ X0emmaxt(3)
Productivity is an important parameter to consider in the
technology for cultivatingmicroalgae, as it shows the capacity
of a reactor to produce biomass under specific operating
conditions. Firstly the overall productivity (Poverall) calculated
according to the Equation (4),
Poverall ¼ DXDX
¼ ðXmax � X0Þðtm � toÞ (4)
where Xmax is the maximum final concentration achieved at
the end of the experiment, and is the highest asymptotic
value of the sinusoidal growth curve; X0 is the initial
biomass concentration in mg L�1; tm is the time required to
reach Xmax; and t0 is equal to zero. For many authors this is
the equation most frequently applied (Ho et al., 2010; Ho et
al., 2011; Tang et al., 2011), and it takes into account only
the experimental data.
To estimate productivity with a new methodology, the
lag phase should be minimized or not be considered,
because this is an extremely variable phase of growth that
depends not only on the experimental conditions, but also
on the experimental methodology, such as the initial inoc-
ulum concentration used and how this inoculum was
obtained. Therefore the inclusion of the lag phase in pro-
ductivity calculations leads to a wide and unnecessary
dispersion of productivity data between authors. As stated
in many guidelines for testing biodegradability (e.g. OECD,
2004), the lag phase is considered as the time elapsed until
10% of the total biodegradation has been reached. In this
work, that consideration could be comparable to an increase
of 10% in the initial biomass concentration in the
reactor (X10 ¼ 1.1$X0). Therefore t10 is the time required to
reach X10, and t90 is the time required to reach X90
(X90 ¼ 0.9$Xmax) (Table 2). From Equation (4) an expression is
obtained for the time as a function of biomass concentra-
tions (Equation (5)).
ifferent microalgae species for phytoremediation processes:iofuels production, Water Research (2013), http://dx.doi.org/
wat e r r e s e a r c h x x x ( 2 0 1 3 ) 1e1 04
t ¼ 1mLn
�X$ðXmax � X0ÞX0$ðXmax � XÞ
�(5)
With this equation t90 and t10 can be obtained (Equations (6)
and (7)).
t90 ¼ 1mLn
�9$ðXmax � X0Þ
X0
�(6)
t10 ¼ 1
mLn
�1:1$ðXmax � X0ÞðXmax � 1:1$X0Þ
�(7)
Considering that productivity in the exponential growth
period in the batch photobioreactor could be approximated to
Equation (8).
PB ¼ ðX90 � X10Þðt90 � t10Þ ¼ ð0:9$Xmax � 1:1$X0Þ
ðt90 � t10Þ (8)
by the combination of Equations (6)e(8), an expression is ob-
tained that relates productivity with the kinetic parameters (m,
t10, t90) (Equation (9)).
PB ¼ m$ð0:90$Xmax � 1:10X0ÞLn
�9$ðXmax�1:1$X0Þ
1:1$X0
� (9)
2.5. Kinetic parameters for nutrient removal
To compare the kinetics for nitrogen and phosphorus
removal, a calculation has been made of the time required to
reach 10 mg L�1 (SN) and 1 mg L�1 (PePO3�4 ) (the most
restrictive concentrations in European Union Directive 98/15/
CE concerning requirements of N and P in the effluents
permitted from urban wastewater treatment). In order to
obtain these times, phosphorous and nitrogen consumption
has been modeled according to the Quiroga-Sales kinetic
model for substrate consumption bymicroorganisms in batch
reactors (Equation (10)) (Quiroga et al., 1999).
v ¼ K2$S2 þ K1 þ K0 (10)
In this equation, S is the substrate concentration in the
medium (nitrogen or phosphorous) (mg L�1) and K2, K1, and K0
are kinetic constants.
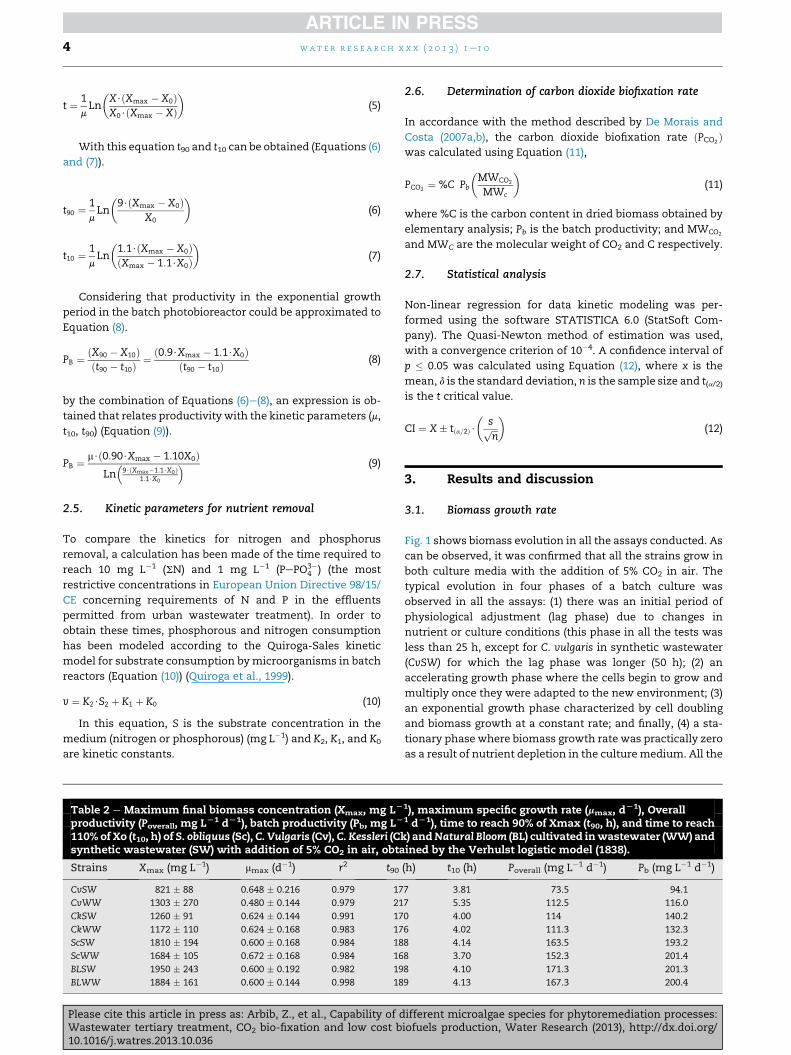
Table 2 e Maximum final biomass concentration (Xmax, mg LL
productivity (Poverall, mg LL1 dL1), batch productivity (Pb, mg LL
110%of Xo (t10, h) of S. obliquus (Sc), C. Vulgaris (Cv), C. Kessleri (Cksynthetic wastewater (SW) with addition of 5% CO2 in air, obta
Strains Xmax (mg L�1) mmax (d�1) r2 t90
CvSW 821 � 88 0.648 � 0.216 0.979 17
CvWW 1303 � 270 0.480 � 0.144 0.979 21
CkSW 1260 � 91 0.624 � 0.144 0.991 17
CkWW 1172 � 110 0.624 � 0.168 0.983 17
ScSW 1810 � 194 0.600 � 0.168 0.984 18
ScWW 1684 � 105 0.672 � 0.168 0.984 16
BLSW 1950 � 243 0.600 � 0.192 0.982 19
BLWW 1884 � 161 0.600 � 0.144 0.998 18
Please cite this article in press as: Arbib, Z., et al., Capability of dWastewater tertiary treatment, CO2 bio-fixation and low cost b10.1016/j.watres.2013.10.036
2.6. Determination of carbon dioxide biofixation rate
In accordance with the method described by De Morais and
Costa (2007a,b), the carbon dioxide biofixation rate ðPCO2 Þwas calculated using Equation (11),
PCO2¼ %C Pb
MWCO2
MWc
� �(11)
where %C is the carbon content in dried biomass obtained by
elementary analysis; Pb is the batch productivity; and MWCO2
and MWC are the molecular weight of CO2 and C respectively.
2.7. Statistical analysis
Non-linear regression for data kinetic modeling was per-
formed using the software STATISTICA 6.0 (StatSoft Com-
pany). The Quasi-Newton method of estimation was used,
with a convergence criterion of 10�4. A confidence interval of
p � 0.05 was calculated using Equation (12), where x is the
mean, d is the standard deviation, n is the sample size and t(a/2)is the t critical value.
CI ¼ X� tða=2Þ$
�sffiffiffin
p�
(12)
3. Results and discussion
3.1. Biomass growth rate
Fig. 1 shows biomass evolution in all the assays conducted. As
can be observed, it was confirmed that all the strains grow in
both culture media with the addition of 5% CO2 in air. The
typical evolution in four phases of a batch culture was
observed in all the assays: (1) there was an initial period of
physiological adjustment (lag phase) due to changes in
nutrient or culture conditions (this phase in all the tests was
less than 25 h, except for C. vulgaris in synthetic wastewater
(CvSW) for which the lag phase was longer (50 h); (2) an
accelerating growth phase where the cells begin to grow and
multiply once they were adapted to the new environment; (3)
an exponential growth phase characterized by cell doubling
and biomass growth at a constant rate; and finally, (4) a sta-
tionary phase where biomass growth rate was practically zero
as a result of nutrient depletion in the culturemedium. All the
1), maximum specific growth rate (mmax, dL1), Overall
1 dL1), time to reach 90% of Xmax (t90, h), and time to reach) andNatural Bloom (BL) cultivated inwastewater (WW) andined by the Verhulst logistic model (1838).
(h) t10 (h) Poverall (mg L�1 d�1) Pb (mg L�1 d�1)
7 3.81 73.5 94.1
7 5.35 112.5 116.0
0 4.00 114 140.2
6 4.02 111.3 132.3
8 4.14 163.5 193.2
8 3.70 152.3 201.4
8 4.10 171.3 201.3
9 4.13 167.3 200.4
ifferent microalgae species for phytoremediation processes:iofuels production, Water Research (2013), http://dx.doi.org/

Fig. 1 e Modeled biomass evolution using the Verhulst
logistic model (1938) for Chlorella vulgaris (Cv), Chorella
kessleri (Ck), Scenedemus obliquus (Sc) and natural Bloom (BL)
in wastewater (WW) and synthetic wastewater (SW) Solid
lines indicate the predicted data (pr), and the experimental
data is shown by the symbols (e).
wat e r r e s e a r c h x x x ( 2 0 1 3 ) 1e1 0 5
strains cultivated show a similar biomass concentration in
WW and SW, except for Cv which grew better in WW than in
SW.
At the beginning of the experiments all the reactors shows
a drop in the pH (data not presented) associated with the CO2
injection; then as the trial progresses an increase of pH occurs,
except in the control reactors CtrSW and CtrWW. In the control
reactors, pH suffers an initial drop from 6.25 to 5.78 for CtrSW,
and from 7.15 to 6.73 for CtrWW but it does not rise subse-
quently, as in the inoculated assays. In both cases this pH
behavior is because of the formation of carbonic acid in water
as the result of the CO2 injection. Once the culture begins to
grow, the CO2 consumption rate increases, as well as the
Please cite this article in press as: Arbib, Z., et al., Capability of dWastewater tertiary treatment, CO2 bio-fixation and low cost b10.1016/j.watres.2013.10.036
inorganic carbon consumption kinetic; so in those reactors
with biomass growth the pH increases.
Modeled data (Fig. 1) showed a good fit between experi-
mental data (symbols) and the predicted values obtained with
the Verhulst model (lines). In all the experiments the regres-
sion coefficient (r2) was higher than 0.978 (Table 2). Regarding
the final biomass concentration achieved (Xmax) (Table 2)
three different groups can clearly be distinguished. The first
one was composed of the CvSW where Xmax achieved at the
end of the assay was 821 � 88 mg L�1, the lowest value ob-
tained in all the trials. Chiu et al. (2008) reported similar re-
sults (Xmax: 899� 30mg L�1) cultivating Chlorella sp. inoculated
at high cell density (8$106 cell ml�1) in a modified f/2 medium
in artificial seawater with addition of 5% CO2. Sydney et al.
(2010) reported an Xmax of 1940 mg L�1, twice as high as the
value obtained in our work, when they cultured C. vulgaris
Leb-104 in Modified Bristol medium and with addition of 5%
CO2.
The second group was composed of CvWW, CkWW and
CkSW. There were no significant differences between these
microalgae (p < 0.05), and the final concentration achieved
was 1303 � 270, 1260 � 91 and 1172 � 110 mg L�1 for CvWW,
CkWW and CkSW respectively. De Morais and Costa (2007b)
reported similar results for C. Kessleri when cultivated in
Bristolmedium, 1450� 10 and 980� 10mg L�1 with addition of
0.0389% and 6% CO2 (v/v) respectively.
The third group consisted of S. obliquus and Bl in both
culture media (SW and WW). No significant differences can
be seen between strains or between culture media. The Xmax
obtained in this group was 32% higher than the group
composed of CvWW, CkWW and CkSW, and 55.18% higher
than CvSW. The Xmax obtained was 1810 � 194, 1684 � 105,
1950 � 243 1884 � 161 mg L�1 for ScSW, ScWW, BlSW and
BlWW respectively. These results are similar to those
obtained by Tang et al. (2011) for Scenedesmus obliquus culti-
vated in modified BG11 medium with 5% CO2 (Xmax:
1800 � 20 mg L�1). De Morais and Costa (2007a) also obtained
similar Xmax for Scenedesmus obliquus when cultivated in
vertical tubular reactors enriched with 6% CO2 in MCmedium
(Xmax: 1560 mg L�1).
Themaximum specific growth rates (mmax; d�1) obtained do
not show significant differences between any of the strains
tested (Table 2), nor between culture media, since there were
no differences between the trials in light intensity, nutrient
concentrations or CO2 addition. However the mmax values in
this study were slightly higher than those obtained by other
authors: for Scenesdemus obliquus and Chlorella kessleri culti-
vated with 6% CO2, De Morais and Costa (2007a) obtained
0.261 � 0.020 d�1 and 0.267 � 0.013 d�1 respectively (Table 3);
this difference could be attributed to the very low light in-
tensity employed by De Morais and Costa (2007b) in the
experiment (88 mmol cm�2 s�1), indicating that in the case
of De Morais and Costa (2007a,b) the strains suffered lack of
light. On the other hand, for Scenesdesmus obliquus with 5%
CO2, Tang et al. (2011) reported a slightly higher mmax
(0.943 � 0.021 d�1) (Table 3), in this case this difference can
attributed not to the light intensity used (180 mmol cm�2 s�1)
but to a temperature effect: Tang et al. (2011) operated at
25� 1 �Cwhile in our work the temperaturewas 20� 1 �C, thisindicate a great effect of the temperature in the growth rate.
ifferent microalgae species for phytoremediation processes:iofuels production, Water Research (2013), http://dx.doi.org/
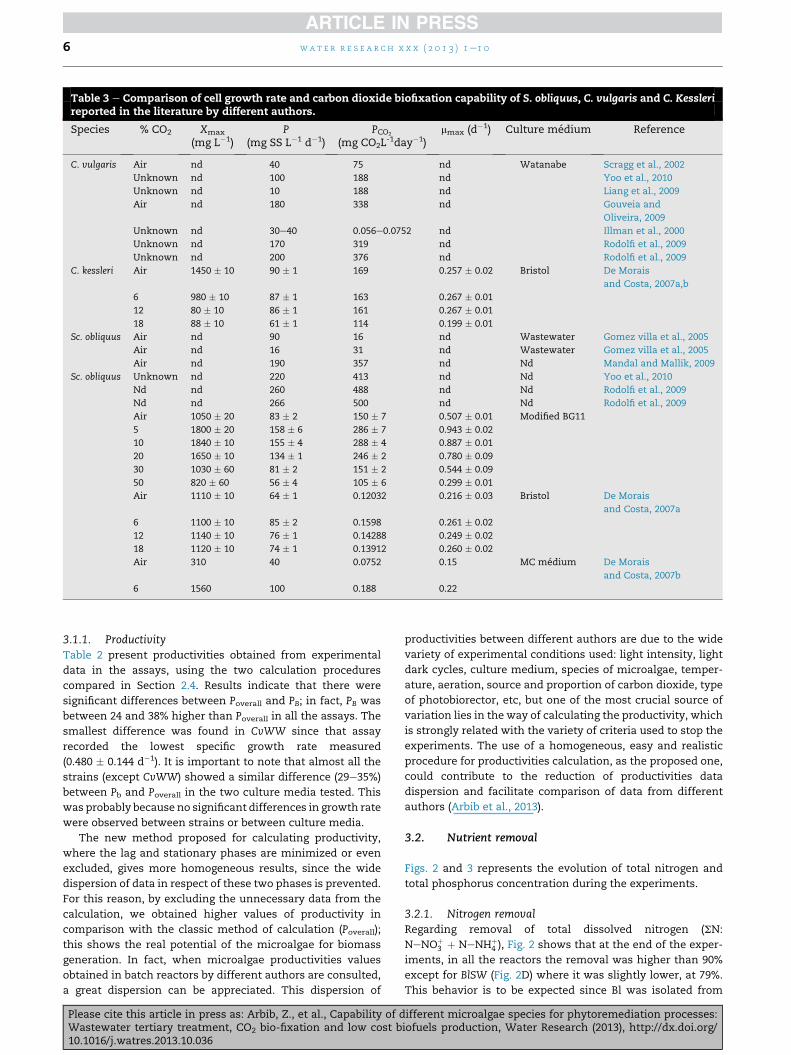
Table 3 e Comparison of cell growth rate and carbon dioxide biofixation capability of S. obliquus, C. vulgaris and C. Kesslerireported in the literature by different authors.
Species % CO2 Xmax
(mg L�1)P
(mg SS L�1 d�1)PCO2
(mg CO2L-1day�1)
mmax (d�1) Culture medium Reference
C. vulgaris Air nd 40 75 nd Watanabe Scragg et al., 2002
Unknown nd 100 188 nd Yoo et al., 2010
Unknown nd 10 188 nd Liang et al., 2009
Air nd 180 338 nd Gouveia and
Oliveira, 2009
Unknown nd 30e40 0.056e0.0752 nd Illman et al., 2000
Unknown nd 170 319 nd Rodolfi et al., 2009
Unknown nd 200 376 nd Rodolfi et al., 2009
C. kessleri Air 1450 � 10 90 � 1 169 0.257 � 0.02 Bristol De Morais
and Costa, 2007a,b
6 980 � 10 87 � 1 163 0.267 � 0.01
12 80 � 10 86 � 1 161 0.267 � 0.01
18 88 � 10 61 � 1 114 0.199 � 0.01
Sc. obliquus Air nd 90 16 nd Wastewater Gomez villa et al., 2005
Air nd 16 31 nd Wastewater Gomez villa et al., 2005
Air nd 190 357 nd Nd Mandal and Mallik, 2009
Sc. obliquus Unknown nd 220 413 nd Nd Yoo et al., 2010
Nd nd 260 488 nd Nd Rodolfi et al., 2009
Nd nd 266 500 nd Nd Rodolfi et al., 2009
Air 1050 � 20 83 � 2 150 � 7 0.507 � 0.01 Modified BG11
5 1800 � 20 158 � 6 286 � 7 0.943 � 0.02
10 1840 � 10 155 � 4 288 � 4 0.887 � 0.01
20 1650 � 10 134 � 1 246 � 2 0.780 � 0.09
30 1030 � 60 81 � 2 151 � 2 0.544 � 0.09
50 820 � 60 56 � 4 105 � 6 0.299 � 0.01
Air 1110 � 10 64 � 1 0.12032 0.216 � 0.03 Bristol De Morais
and Costa, 2007a
6 1100 � 10 85 � 2 0.1598 0.261 � 0.02
12 1140 � 10 76 � 1 0.14288 0.249 � 0.02
18 1120 � 10 74 � 1 0.13912 0.260 � 0.02
Air 310 40 0.0752 0.15 MC medium De Morais
and Costa, 2007b
6 1560 100 0.188 0.22
wat e r r e s e a r c h x x x ( 2 0 1 3 ) 1e1 06
3.1.1. ProductivityTable 2 present productivities obtained from experimental
data in the assays, using the two calculation procedures
compared in Section 2.4. Results indicate that there were
significant differences between Poverall and PB; in fact, PB was
between 24 and 38% higher than Poverall in all the assays. The
smallest difference was found in CvWW since that assay
recorded the lowest specific growth rate measured
(0.480 � 0.144 d�1). It is important to note that almost all the
strains (except CvWW) showed a similar difference (29e35%)
between Pb and Poverall in the two culture media tested. This
was probably because no significant differences in growth rate
were observed between strains or between culture media.
The new method proposed for calculating productivity,
where the lag and stationary phases are minimized or even
excluded, gives more homogeneous results, since the wide
dispersion of data in respect of these two phases is prevented.
For this reason, by excluding the unnecessary data from the
calculation, we obtained higher values of productivity in
comparison with the classic method of calculation (Poverall);
this shows the real potential of the microalgae for biomass
generation. In fact, when microalgae productivities values
obtained in batch reactors by different authors are consulted,
a great dispersion can be appreciated. This dispersion of
Please cite this article in press as: Arbib, Z., et al., Capability of dWastewater tertiary treatment, CO2 bio-fixation and low cost b10.1016/j.watres.2013.10.036
productivities between different authors are due to the wide
variety of experimental conditions used: light intensity, light
dark cycles, culture medium, species of microalgae, temper-
ature, aeration, source and proportion of carbon dioxide, type
of photobiorector, etc, but one of the most crucial source of
variation lies in the way of calculating the productivity, which
is strongly related with the variety of criteria used to stop the
experiments. The use of a homogeneous, easy and realistic
procedure for productivities calculation, as the proposed one,
could contribute to the reduction of productivities data
dispersion and facilitate comparison of data from different
authors (Arbib et al., 2013).
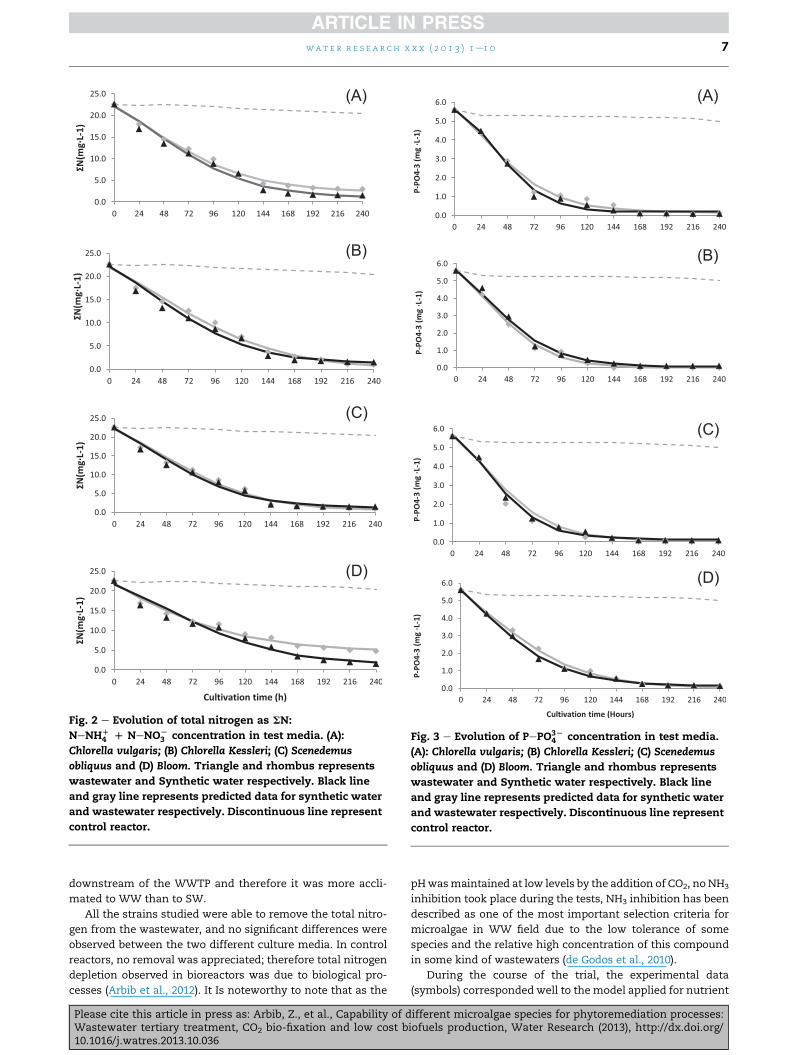
3.2. Nutrient removal
Figs. 2 and 3 represents the evolution of total nitrogen and
total phosphorus concentration during the experiments.
3.2.1. Nitrogen removalRegarding removal of total dissolved nitrogen (SN:
NeNOþ3 þ NeNHþ
4 ), Fig. 2 shows that at the end of the exper-
iments, in all the reactors the removal was higher than 90%
except for BlSW (Fig. 2D) where it was slightly lower, at 79%.
This behavior is to be expected since Bl was isolated from
ifferent microalgae species for phytoremediation processes:iofuels production, Water Research (2013), http://dx.doi.org/
(A)
(B)
(C)
(D)
Fig. 2 e Evolution of total nitrogen as SN:
NeNHD4 D NeNOL
3 concentration in test media. (A):
Chlorella vulgaris; (B) Chlorella Kessleri; (C) Scenedemus
obliquus and (D) Bloom. Triangle and rhombus represents
wastewater and Synthetic water respectively. Black line
and gray line represents predicted data for synthetic water
and wastewater respectively. Discontinuous line represent
control reactor.
(A)
(B)
(C)
(D)
Fig. 3 e Evolution of PePO3L4 concentration in test media.
(A): Chlorella vulgaris; (B) Chlorella Kessleri; (C) Scenedemus
obliquus and (D) Bloom. Triangle and rhombus represents
wastewater and Synthetic water respectively. Black line
and gray line represents predicted data for synthetic water
and wastewater respectively. Discontinuous line represent
control reactor.
wat e r r e s e a r c h x x x ( 2 0 1 3 ) 1e1 0 7
downstream of the WWTP and therefore it was more accli-
mated to WW than to SW.
All the strains studied were able to remove the total nitro-
gen from the wastewater, and no significant differences were
observed between the two different culture media. In control
reactors, no removal was appreciated; therefore total nitrogen
depletion observed in bioreactors was due to biological pro-
cesses (Arbib et al., 2012). It Is noteworthy to note that as the
Please cite this article in press as: Arbib, Z., et al., Capability of dWastewater tertiary treatment, CO2 bio-fixation and low cost b10.1016/j.watres.2013.10.036
pHwasmaintained at low levels by the addition of CO2, no NH3
inhibition took place during the tests, NH3 inhibition has been
described as one of the most important selection criteria for
microalgae in WW field due to the low tolerance of some
species and the relative high concentration of this compound
in some kind of wastewaters (de Godos et al., 2010).
During the course of the trial, the experimental data
(symbols) corresponded well to themodel applied for nutrient
ifferent microalgae species for phytoremediation processes:iofuels production, Water Research (2013), http://dx.doi.org/

Table 4 e Time needed to reach 10 mgN LL1 (t10N) and1 mg P LL1 (t1P) in filtered test media (most restrictiveconcentrations value in Directive 98/15/CE), obtained byQuiroga et al. (1999) model.
Strain & culture Total nitrogen Phosphorus
r2 t10N (h) r2 t1P (h)
CvSW 0.992 85 0.989 92
CvWWW 0.984 79 0.989 80
CkSW 0.99 87.5 0.996 80.5
CkWW 0.983 78 0.994 88.7
ScSW 0.985 77.5 0.984 89.1
ScWW 0.983 72.5 0.995 80.5
BLSW 0.982 101.6 0.996 112
BLWW 0.969 90.0 0.998 101.4
wat e r r e s e a r c h x x x ( 2 0 1 3 ) 1e1 08
removal. In all the reactors R2 was higher than 0.969 (Table 4).
It can be appreciated in Table 4 that, for the four species
tested, the time required to reach 10 mg l�1N (t10N) was higher
in synthetic than in wastewater (Ruiz et al., 2011; Arbib et al.,
2012), which demonstrate again the great capability of
microalgae in growing in WW. Between species, t10N was very
similar except for BlSW with the slower nitrogen uptake ki-
netic (101.6 h).
3.2.2. Phosphorus removalFor phosphorus (Fig. 3), the behavior observed is similar to
that for total nitrogen removal. At the end of the experiments
phosphorous removal in all the assays was higher than 98%.
As in the case of nitrogen, in the control reactors no phos-
phorous removal was observed, so only biological processes
are involved in the bioreactors (Arbib et al., 2012).
It is noteworthy that after the first 25 h of the assays the
phosphorous concentration suffers a sudden drop. This initial
drop implies the removal of up to 20% of the total. For CkSW
and ScSW this initial removal was slightly higher, at 25% for
both. According to several authors (Boyd and Musig, 1981;
Okada et al, 2004; Khummongkol et al., 1982; El Yousri, 1995;
Arbib et al., 2012) this drop can be attributed to two different
processes: (1) Precipitation and deposition at the bottom of the
reactor due to a high pH (above 9); and/or (2) adsorption to the
microalgae cell wall and subsequent assimilation. However
because this initial drop was not observed in the control
Table 5 e Elementary analysis of dried biomass obtained by Lebiomass. Kinetic parameters of carbon dioxide biofixation.
Strain andculture medium
C (% dw) N (%dw) Crudeprotein (% dw)
Lip(%
CvWW 54.8 � 2.6 3.5 � 0.2 21.85 � 1.25 22.02
CvSW 56.6 � 2.5 3.4 � 0.3 21.25 � 1.87 21.75
CkWW 50.4 � 0.8 3.3 � 0.3 20.62 � 1.87 20.55
CkSW 50.7 � 1.2 3.5 � 0.1 21.87 � 0.62 19.25
ScWW 47.8 � 0.2 2.6 � 0.5 16.25 � 3.12 19.38
ScSW 48.8 � 0.9 2.5 � 0.3 15.62 � 1.87 18.50
BLWW 46.5 � 0.7 3.8 � 0.8 23.75 � 5.0 26.82
BLSW 46.7 � 1.1 3.9 � 0.7 24.37 � 4.37 29.55
P�CO2: 1.88 � PB, which is derived from the typical molecular formula of m
PCO2 : PBatch2 � (%C) � ðMWCO2=MWCÞYCO2=SS : PCO2 /PB.
Please cite this article in press as: Arbib, Z., et al., Capability of dWastewater tertiary treatment, CO2 bio-fixation and low cost b10.1016/j.watres.2013.10.036
reactors (Fig. 3) and the pH during the entire assaywas below 9
in all the reactors (data not presented), it can be concluded
there is no removal due to a precipitation process; therefore
the initial large percentage drop in phosphorous concentra-
tion was attributed to the adsorption to the microalgae cell
wall.
As for total nitrogen, the experimental data of phosphorus
consumption (Fig. 3) showed a good fit to the kinetic model
applied for nutrient uptake (R2 > 0.911) (Table 4). The time
needed to reach the discharge limit for P (t1P ¼ 1 mg L�1) is
presented in Table 4. In WW the t1P was lower than in SW,
except for C. Kessleriwhere the t1Pwas 80.5 and 88.7 for SW and
WW respectively, this results indicate again the great capa-
bility of different microalgae strain in growing in WW.
An important point to note regarding the nutrient removal
capability, is that the time needed to reach the two discharge
limits (t1P and t10N) was comparable in all the reactors (Table
4). Therefore our study shows that the simultaneous
removal of nitrogen and phosphorus to below the most
restrictive limits for effluent discharge can be achieved.
Hence, in the operating conditions employed in these assays,
neither nitrogen nor phosphorus assimilation kinetics limit
the overall process.
3.3. Biomass composition
Table 5 presents the biomass composition for the four
microalgae studied. Regarding the percentage of carbon in the
biomass, it can be seen that there were significant differences
between strains. The maximum was obtained in CvSW
(56.6 � 2.5% C) and theminimum in BLWW (46.5� 0.7% C). But
no significant differences were observed between the two
media tested for each strain. For example, for ScWW and ScSW
the values obtained were 47.8 � 0.2%C and 48.8 � 0.9% C
respectively.
The total lipids content (also in Table 5) from the micro-
algae cultivated in this study ranged from 18.50 � 2.22% to
29.55 � 2.55% of the dry weight. It can be appreciated that
there were no significant differences in lipid content between
the two culture media tested for each strain, as the nutrient
concentrations (nitrogen and phosphorous) were similar in
WW and SW, and the culture conditions were also the same.
Lipid content of biomass from Bl was the highest in both
co CHNS 932, Crude protein content and Lipid percentage in
idsdw)
P�CO2
(mg CO2 L�1 d�1)
PCO2
(mg CO2 L�1 d�1)
YCO2=SS
(mg CO2 L�1)
� 2.20 214.12 236.42 2.076
� 2.75 277.34 296.75 2.012
� 3.00 323.70 319.99 1.858
� 2.25 307.19 302.17 1.849
� 1.75 444.99 424.40 1.793
� 2.22 461.63 436.67 1.778
� 2.75 453.80 413.77 1.714
� 2.55 460.37 417.52 1.705
icroalgal biomass, CO0.48H1.83N0.11P0.01 (Chisti, 2007).
ifferent microalgae species for phytoremediation processes:iofuels production, Water Research (2013), http://dx.doi.org/
wat e r r e s e a r c h x x x ( 2 0 1 3 ) 1e1 0 9
culture media (26.82 � 2.75 and 29.55 � 2.55% for BlWW and
BlSW respectively).
The lowest crude protein content (Table 5) was observed
for S. obliquus in both cultures (16.25� 3.12% and 15.62� 1.87%
for ScWW and ScSW respectively), and in Chlorella strains
there were no differences between the two strains tested in
the two culture media.
3.3.1. Carbon dioxide biofixation capacityBatch productivity (PB) (Table 2) and carbon content in
biomass (Table 5) were used to calculate the kinetic parame-
ters related to the carbon dioxide fixation (De Morais and
Costa, 2007b; Tang et al., 2011). Those parameters were: PCO2
(g CO2 L�1 d�1) and YCO2 (g CO2 g SS�1) (Table 5). PCO2 was also
calculated by the typical molecular formula of microalgal
biomass CO0.48H1.83N0.11P0.01, according to Equation (11) (De
Morais and Costa, 2007a,b).
The yield coefficient ðYCO2 Þ obtained ranged between 1.705
and 2.010 g CO2 g SS�1 (Table 5). Values were similar to those
obtained by other authors for different microalgae species.
Scragg et al. (2002) have reported that C. vulgaris cultivated in
Watanabe’s medium and low nitrogen medium gave a yield
coefficient of 1.875 g CO2 g SS�1 for both cultures. For Chlorella
kessleri, De Morais and Costa (2007b) have reported a yield
coefficient of 1.875 g CO2 g SS�1. The yield coefficient for Sce-
nedesmus obliquuswas 1.931 and 1.771 g CO2 g SS�1 respectively
when it was cultivated in wastewater in summer and winter
(Gomez-Villa et al., 2005). It is noteworthy that the YCO2 ob-
tained was close to 1.88, the constant used in the equation of
Chisti (See Table 5). This value is directly related to the carbon
percentage in the biomass dry weight.
With respect to the PCO2 , it can be appreciated that differ-
ences between the PCO2 obtained through kinetic parameters
and the equation of Chisti ðP�CO2Þ are very small, between
(10.4% and �1.1%)
4. Conclusions
All the strains tested were able to grow in wastewater media.
No significant differences in the maximum biomass concen-
tration were found when Scenedesmus obliquus, Chlorella kes-
sleri and the natural bloomwere cultured in either synthetic or
actual wastewater media. A new procedure (PB) for calculating
the productivity of a batch reactor has been proposed, in order
to avoid data variations, although an established procedure
(Poverall) was also used in these experiments, In all the assays
PB was between 24 and 38% higher than Poverall.
All four species tested have high potential for removing
nitrogen and phosphorous from urban wastewater, to levels
even lower than the most restrictive currently imposed
(Directive 98/15/CE). Results indicate that the time needed to
reach the stipulated limits for removal of both nutrients (t1Pand t10N) were comparable in all the reactors. This means that
the simultaneous photobiological removal of Nitrogen and
Phosphorus from wastewater is technically feasible.
No influence of the culture media was observed in relation
to the carbon dioxide biofixation capacity. This parameter
ðPCO2 Þ was related more closely with the strain tested. Those
strains with higher biomass productivities (Scenedesmus
Please cite this article in press as: Arbib, Z., et al., Capability of dWastewater tertiary treatment, CO2 bio-fixation and low cost b10.1016/j.watres.2013.10.036
obliquus and the bloom) were also the ones with higher CO2
biofixation kinetics, as biomass carbon content was very
similar between experiments.
r e f e r e n c e s
APHA-AWWA-WPCF, 1992. Standard Methods for theExamination of Water and Wastewater, eighteenth ed.American Public Health Association, Washington, DC.
Arbib, Z., Ruiz, J., Alvarez, P., Garrido, C., Barragan, J., Perales, J.A.,2012. Chlorella stigmatophora for urban wastewater nutrientremoval and CO2 abatement. Int. J. Phytoremed. 14, 714e725.
Arbib, Z., Ruiz, J., Alvarez, P., Garrido, C., Barragan, J., Perales, J.A.,2013. Photobiotreatment: influence of nitrogen andphosphorus ratio in wastewater on growth kinetics ofscenedesmus obliquus. Int. J. Phytorem. 15, 774e788.
Becker, E.W., 1994. Oil production. In: Baddiley, et al. (Eds.),Microalgae: Biotechnology and Microbiology. CambridgeUniversity Press.
Boyd, C.E., Musig, Y., 1981. Orthophosphate uptake byphytoplankton and sediment. Aquaculture 22, 165e173.
Brennan, L., Owende, P., 2010. Biofuels from microalgae e areview of technologies for production, processing, andextractions of biofuels and co-products. Renew. Sust. Energ.Rev. 14, 557e577.
Chisti, Y., 2007. Biodiesel from microalgae. Biotechnol. Adv. 25,294e306.
Chiu, S.Y., Kao, C.Y., Chen, C.H., Kuan, T.C., Ong, S.C., Lin, C.S.,2008. Reduction of CO2 by a high-density culture of Chlorellasp. in a semicontinuous photobioreactor. Bioresour. Technol.99, 3389e3396.
de Godos, I., Vargas, V.A., Blanco, S., Gonzalez, M.C., Soto, R.,Garcıa-Encina, P.A., Becares, E., Munoz, R., 2010. Acomparative evaluation of microalgae for the degradation ofpiggery wastewater under photosynthetic oxygenation.Bioresour. Technol. 101, 5150e5158.
De la Noue, J., De Pauw, N., 1988. The potential of microalgalbiotechnology: a review of production and uses of microalgae.Biotech. Adv. 6, 725e770.
De Morais, M.G., Costa, J.A.A., 2007a. Biofixation of carbon dioxideby Spirulina sp. and Scenedesmus obliquus cultivated in athree-stage serial tubular photobioreactor. J. Biotechnol. 129,439e445.
De Morais, M.G., Costa, J.A.A., 2007b. Isolation and selection ofmicroalgae from coal fired thermoelectric power plant forbiofixation of carbon dioxide. Energy Convers. Manag. 48,2169e2173.
El Yousri, F., 1995. Analisis del consumo de fosforo y crecimientode Scenedesmus obliquus en fotobiorreactores discontinuo ycontinuo. Ph.D. thesis. Granada University, Spain.
European Commission Directive, 1998. 98/15/EC of 27 February.Official J. Eur. Commun..
Fuentes, M.M.R., Fernandez, G.G.A., Perez, J.A.S., Guerrero, J.L.G.,2000. Biomass nutrient profiles of the microalga Porphyridiumcruentum. Food Chem. 70, 345e353.
Gomez Villa, H., Voltolina, D., Nieves, M., Pina, P., 2005. Biomassproduction and nutrient budget in outdoor cultures ofScenedesmus obliquus (chlorophyceae) in artificialwastewater, under the winter and summer conditions ofMazatlan, Sinaloa, Mexico. Vie et milieu 55 (2), 121e126.
Gonzalez, L.E., Canizares, R.O., Baena, S., 1997. Efficiency ofammonia and phosphorus removal from a Colombianagroindustrial wastewater by microalgae Chlorella vulgarisand Scenedesmus dimorphus. Bioresour. Technol. 60, 259e262.
Gong, H., Lun, S., 1996. The kinetics of lysine batch fermentation.Chin. J. Biotechnol. 12 (Suppl.), 219e225.
ifferent microalgae species for phytoremediation processes:iofuels production, Water Research (2013), http://dx.doi.org/
wat e r r e s e a r c h x x x ( 2 0 1 3 ) 1e1 010
Gouveia, L., Oliveira, A.C., 2009. Microalgae as a raw material forbiofuels production. J. Ind. Microbiol. Biotechnol. 36, 269e274.
Ho, H.H., Chen, C.Y., Yeh, K.L., Chen, W.M., Lin, C.Y., Chang, J.S.,2010. Characterization of photosynthetic carbon dioxidefixation ability of indigenous Scenedesmus obliquus isolates.Biochem. Eng. J. 53, 57e62.
Ho, H.H., Chen, C.Y., Lee, D.J., Chang, J.S., 2011. Perspective onmicroalgal CO2 emissions systems e a review. Biotechnol.Adv. 29, 189e198.
Illman, A.M., Scragg, A.H., Shales, S.W., 2000. Increase inChlorella strains calorific values when grown in low nitrogenmedium. Enzyme Microb. Technol. 27, 631e635.
Intergovernmental Panel on Climate Change (IPCC), 2001. ClimateChange 2001: The Scientific Basis. Cambridge University Press,Cambridge, U K.
Khummongkol, D., Canterford, G.S., Fryer, C., 1982. Accumulationof heavy metals in unicellular algae. Biotechnol. Bioeng. 24,2643e2660.
Kilham, S., Kreeger, D., et al., 1998. COMBO: a defined freshwaterculture medium for algae and zooplankton. Hydrobiologia 377,147e159.
Liang, Y.N., Sarkany, N., Cui, Y., 2009. Biomass and lipidproductivities of Chlorella vulgaris under autotrophic,heterotrophic and mixotrophic growth conditions. Biotechnol.Lett. 31, 1043e1049, 635.
Li, Y., Horsman, M., Wu, N., Lan, C.Q., Dubois-Calero, N., 2008.Biofuels from microalgae. Biotechnol. Prog. 24, 815e820.
Mallick, N., 2002. Biotechnological potential of immobilized algaefor wastewater N, P and metal removal: a review. BioMetals15, 377e390.
Mandal, S., Mallick, N., 2009. Microalga Scenedesmus obliquus asa potential source for biodiesel production. Appl. Microbiol.Biotechnol. 84, 281e291.
OECD Guideline for the testing of chemicals, 2004. AerobicMineralisation in Surface Water e Simulation BiodegradationTest No. 309, 23 Nov 2004. 21 pp., ISBN 9789264070547 http://dx.doi.org/10.1787/9789264070547-en (PDF).
Okada, S., Devarenne, P.T., Murakami, M., Abe, H., Chappell, J.,2004. Characterization of botryococcene synthase enzymeactivity, a squalene synthase-like activity from the greenmicroalga Botryococcus braunii, Race B. Arch. Biochem.Biophys. 422, 110e118.
Oswald, W.J., Gotaas, H.B., Golueke, C.G., Kellen, W.R., 1957. Algaein wastetreatment. Sewage Ind. Wastes 29, 437e455.
Please cite this article in press as: Arbib, Z., et al., Capability of dWastewater tertiary treatment, CO2 bio-fixation and low cost b10.1016/j.watres.2013.10.036
Oswald, W.J., 1995. Ponds in the twenty first century. Water Sci.Technol. 31, 1e8.
Pulz, O., Gross, W., 2004. Valuable products from biotechnology ofmicroalgae. Appl. Microbiol. Biotechnol. 65, 635e648.
Quiroga, J.M., Perales, J.A., Romero, L.I., Sales, D., 1999 Nov.Biodegradation kinetics of surfactants in seawater.Chemosphere 39 (11), 1957e1969.
Rodolfi, L., Zittelli, G.C., Bassi, N., Padovani, G., Biondi, N.,Bonini, G., Tredici, M.R., 2009. Microalgae for oil: strainselection, induction of lipid synthesis and outdoor masscultivation in a low-cost photobioreactor. Biotechnol. Bioeng.102, 100e112.
Ruiz, J., Alvarez, P., Arbib, Z., Garrido, C., Barragan, J., Perales, J.A.,2011. Effect of nitrogen and phosphorus concentration ontheir removal kinetic in treated urban wastewater by Chlorellavulgaris. Int. J. Phytoremed. 13, 884e896.
Scragg, A.H., Illman, A.M., Carden, A., Shales, S.W., 2002. Growthof microalgae with increased calorific values in a tubularbioreactor. Biomass Bioenerg. 23, 67e73.
Sydney, E.B., Sturm, W., De-Carvalho, J.C., Thomaz-Soccol, V.,Larroche, C., Pandey, A., Soccol, C.R., 2010. Potential carbondioxide fixation by industrially important microalgae.Bioresour. Technol. 101, 5892e5896.
Takagi, M., Karseno, et al., 2006. Effect of salt concentration onintracellular accumulation of lipids and triacylglyceride inmarine microalgae Dunaliella cells. J. Biosci. Bioeng. 101,223e226.
Tang, D., Han, W., Li, P., Miao, X., Zhong, J., 2011. CO2 biofixationand fatty acid composition of Scenedesmus obliquus andChlorella pyrenoidosa in response to different CO2 levels.Bioresour. Technol. 102, 3071e3076.
Tredici, M.R., Margheri, M.C., Zitelli, G.C., Biagiolini, S.,Capolino, E., 1992. Nitrogen and phosphorus reclamation frommunicipal wastewater trough an artificial food-chain system.Biores. Technol. 42, 247e253.
Verhulst, P.F., 1838. Notice sur la loi que la population suit dansson accroissement. Corr. Math. Phys. 10, 113e121.
Wiltshire, K.H., Boersma, M., et al., 2000. Extraction of pigmentsand fatty acids from the green alga Scenedesmus obliquus(Chlorophyceae). Aquat. Ecol. 34, 119e126.
Yoo, C., Jun, S.Y., Lee, J.Y., Ahn, C.Y., Oh, H.M., 2010. Selection ofmicroalgae for lipid production under high levels carbondioxide. Bioresour. Technol. 101, S71.
ifferent microalgae species for phytoremediation processes:iofuels production, Water Research (2013), http://dx.doi.org/