Can Change in Prolonged Walking Be Inferred From a Short Test of Gait Speed Among Older Adults Who...
29
doi: 10.2522/ptj.20130628 Published online May 1, 2014 PHYS THER. Zhang Suzanne Satterfield, Elsa S. Strotmeyer and Yuqing Q. Tamara B. Harris, Luigi Ferrucci, Eleanor M. Simonsick, Lavalley, Stephen B. Kritchevsky, Michael C. Nevitt, Daniel White, Tuhina Neogi, Wendy C. King, Michael Are Initially Well-Functioning? a Short Test of Gait Speed Among Older Adults Who Can Change in Prolonged Walking Be Inferred From http://ptjournal.apta.org/content/early/2014/04/30/ptj.20130628 found online at: The online version of this article, along with updated information and services, can be E-mail alerts to receive free e-mail alerts here Sign up corrections and replace the original author manuscript. : edited and typeset versions of articles that incorporate any author Page proofs readers almost immediate access to accepted papers. PTJ accepted for publication but have not yet been copyedited or typeset. This allows : PDF versions of manuscripts that have been peer-reviewed and Author manuscripts publishes 2 types of Online First articles: PTJ ). PTJ ( Therapy Physical Online First articles are published online before they appear in a regular issue of at APTA Member on May 8, 2014 http://ptjournal.apta.org/ Downloaded from at APTA Member on May 8, 2014 http://ptjournal.apta.org/ Downloaded from
Transcript of Can Change in Prolonged Walking Be Inferred From a Short Test of Gait Speed Among Older Adults Who...
doi: 10.2522/ptj.20130628 Published online May 1, 2014PHYS THER.
ZhangSuzanne Satterfield, Elsa S. Strotmeyer and Yuqing Q. Tamara B. Harris, Luigi Ferrucci, Eleanor M. Simonsick,Lavalley, Stephen B. Kritchevsky, Michael C. Nevitt, Daniel White, Tuhina Neogi, Wendy C. King, MichaelAre Initially Well-Functioning?a Short Test of Gait Speed Among Older Adults Who Can Change in Prolonged Walking Be Inferred From
http://ptjournal.apta.org/content/early/2014/04/30/ptj.20130628found online at: The online version of this article, along with updated information and services, can be
E-mail alerts to receive free e-mail alerts hereSign up
corrections and replace the original author manuscript. : edited and typeset versions of articles that incorporate any authorPage proofs
readers almost immediate access to accepted papers.
PTJaccepted for publication but have not yet been copyedited or typeset. This allows : PDF versions of manuscripts that have been peer-reviewed andAuthor manuscripts
publishes 2 types of Online First articles: PTJ). PTJ (Therapy
PhysicalOnline First articles are published online before they appear in a regular issue of
at APTA Member on May 8, 2014http://ptjournal.apta.org/Downloaded from at APTA Member on May 8, 2014http://ptjournal.apta.org/Downloaded from
Running head: Changes in Walking Ability Over 8 Years in Older Adults
Research Report
Can Change in Prolonged Walking Be Inferred From a Short Test of Gait Speed
Among Older Adults Who Are Initially Well-Functioning?
Daniel White, Tuhina Neogi, Wendy C. King, Michael Lavalley, Stephen B. Kritchevsky,
Michael C. Nevitt, Tamara B. Harris, Luigi Ferrucci, Eleanor M. Simonsick, Suzanne
Satterfield, Elsa S. Strotmeyer, Yuqing Q. Zhang; for the Health ABC study
D. White, PT, ScD, MSc, Department of Physical Therapy and Athletic Training, Boston
University, 635 Commonwealth Ave, 5th Floor, Boston, MA 02215 (USA). Address all
correspondence to Dr White at: [email protected].
T. Neogi, MD, PhD, Clinical Epidemiology Research and Training Unit, Boston
University School of Medicine, Boston, Massachusetts.
W.C. King, PhD, Department of Epidemiology, University of Pittsburgh, Pittsburgh,
Pennsylvania.
M. Lavalley, PhD, Department of Biostatistics, School of Public Health, Boston
University.
at APTA Member on May 8, 2014http://ptjournal.apta.org/Downloaded from
2
S.B. Kritchevsky, PhD, Sticht Center on Aging, Wake Forest School of Medicine,
Winston-Salem, North Carolina.
M.C. Nevitt, PhD, Department of Biostatistics and Epidemiology, University of
California–San Francisco, San Francisco, California.
T.B. Harris, MD, MS, Geriatric Epidemiology, National Institutes of Health, Bethesda,
Maryland.
L. Ferrucci, MD, PhD, Longitudinal Studies Section, National Institutes of Health,
Baltimore, Maryland.
E.M. Simonsick, PhD, National Institutes on Aging, National Institutes of Health,
Baltimore, Maryland.
S. Satterfield, MD, DrPH, Preventive Medicine, University of Tennessee, Memphis,
Tennessee.
E.S. Strotmeyer, PhD, MPH, Department of Epidemiology, University of Pittsburgh.
Y.Q. Zhang, MD, DSc, Clinical Epidemiology Research and Training Unit, Boston
University.
at APTA Member on May 8, 2014http://ptjournal.apta.org/Downloaded from
3
[White D, Neogi T, King WC, et al; for the Health ABC study. Can change in prolonged
walking be inferred from a short test of gait speed among older adults who are initially
well-functioning? Phys Ther. 2014;94:xxx–xxx.]
© 2014 American Physical Therapy Association
Published Ahead of Print: XXX
Accepted: April 20, 2014
Submitted: January 13, 2014
at APTA Member on May 8, 2014http://ptjournal.apta.org/Downloaded from
1
ABSTRACT
Background: The ability to walk for short and prolonged periods of time is often measured with
separate walking tests. It is unclear whether decline in the two-minute walk coincides with
decline in a shorter 20-meter walk among older adults.
Objective: To describe patterns of change in the 20-meter walk and two-minute walk over 8
years among a large cohort of older adults. Should change be similar between tests of walking
ability, separate re-testing of prolonged walking may need to be reconsidered.
Design: Longitudinal Observational Cohort
Methods: Data were from 1,893 well-functioning older adults (> 70 years). The 20-meter walk
and two-minute walk were repeatedly measured over 8 years to measure change in short- and
prolonged-walking, respectively. Change was examined using a dual group-based trajectory
model (dual model) and agreement between walking trajectories was quantified with a Weighted
Kappa statistic.
Results: Three trajectory groups for the 20-meter walk and two-minute walk were identified.
Over 86% of subjects were in similar trajectory groups for both tests from the dual model. There
was high chance corrected agreement (Kappa = 0.84, 95%CI [0.81, 0.86]) between 20-meter
walk and two-minute walk trajectory groups.
Limitations: One-third of the original Health ABC cohort was excluded from analysis due to
missing clinic visits followed by being excluded for health reasons for performing the two-
minute walk, limiting generalizability to healthy older adults.
at APTA Member on May 8, 2014http://ptjournal.apta.org/Downloaded from

2
Conclusions: Patterns of change in the two-minute walk are similar to the 20-meter walk. Thus,
separate re-testing of the two-minute walk may need to be reconsidered to gauge change in
prolonged walking.
at APTA Member on May 8, 2014http://ptjournal.apta.org/Downloaded from
3
INTRODUCTION
A physical therapist is the most likely member of the health care team to objectively assess
walking ability in older adults. This is an important task given that walking plays a central-role
in the performance of many activities of daily living, the well-known recognition of walking
ability as a strong predictor of future limitation in physical functioning and mortality in older
adults, and the fact walking slows with aging.1-4 The 2003 American Physical Therapy
Association’s Guide to Physical Therapist Practice reinforces this responsibility by adding that
measuring walking ability synthesizes the diagnosis, prognosis, and plan of care for patients.5
Since there is no one standard method for measuring walking ability, a physical therapist is left
to choose the most appropriate test for a given patient. What specific test of walking ability is
ultimately employed can be tailored to exploit limitations in specific areas of function. For
instance, a short walking test, such as the 20-meter walk, can be used to gauge an older adult’s
gait speed (distance/time) and risk of adverse health outcomes,1, 2 while a prolonged walking test,
such as the two-minute walk (distance covered), provides insight into restrictions with tasks that
require walking for a sustained period of time, such as walking across a large parking lot or
grocery shopping.
Small cross-sectional studies have found moderate to high correlations (r range = 0.69 to 0.80)
between short- and prolonged-walking among people with multiple sclerosis,6 chronic
obstructive pulmonary disorder,7 and stroke.8 However, it is not known whether the pattern of
decline longitudinally from a short-walking test is relatively the same as a prolonged walking test
in older adults. For instance, are older adults who are on a trajectory of fast decline as measured
at APTA Member on May 8, 2014http://ptjournal.apta.org/Downloaded from
4
by the 20-meter walk also on a similar trajectory of fast decline as measured by the two-minute
walk? This is a major gap in physical therapy practice since employing multiple tests to quantify
different aspects of walking ability is burdensome and time-consuming. Should there be high
agreement in changes between both measures over time, then change in the two-minute walk
could be inferred from the quicker to test 20-meter walk, and potentially negate the need to
perform both tests in older adults to detect decline in walking ability.
The purpose of this study was to describe patterns of change in the two-minute walk and 20-
meter walk within a large cohort of initially high functioning older adults. Should change be
similar between tests of walking ability, separate re-testing of prolonged walking may need to be
reconsidered. To determine this, we examined contemporaneous change over 8-years for the 20-
meter walk and two-minute walk using a dual group-based trajectory model, or dual model. The
key advantage of the dual model is that it provides conditional proportions linking the 20-meter
walk and two-minute walk trajectories.9 This permits a more detailed summary of the
connection between the 20-meter walk and two-minute walk trajectories than a single summary
statistic.
at APTA Member on May 8, 2014http://ptjournal.apta.org/Downloaded from
5
METHODS
Study Sample: The Health, Aging and Body Composition (Health ABC) study is a longitudinal
study of the association between changes in body composition and functional decline in initially
well-functioning older adults. Details of Health ABC have been previously described.3 In brief,
Health ABC consists of 3075 community dwelling older adults aged 70 to 79 at baseline.
Participants were recruited from a random sample of Medicare beneficiaries and all community
dwelling black residents in zip codes in and around Memphis, TN and Pittsburgh, PA. Eligibility
criteria included no self-reported difficulty walking approximately 400 meters, i.e., one-quarter
mile, climbing 10 steps, or performing basic activities of daily living. People with terminal
cancer or plans to move out of the area within 3 years of the baseline examination were
excluded. The baseline examinations took place between April 1997 and June 1998. All
participants provided informed consent.
Study Subsample:
For this study, we used the Year 2 visit as our “baseline” since administration of the 20-meter
walk separately from the two-minute walk began at this visit. Measurement of the 20-meter
walk occurred annually for the next 4 years and then biennially, resulting in 7 assessments over 8
years of follow-up (years 2, 3, 4, 5, 6, 8 and 10). Measurement of the two-minute walk occurred
biennially for a total of 5 assessments over 8 years (years 2, 4, 6, 8 and 10). To be included in
the trajectory analyses, measures of the 20-meter walk and the two-minute walk were needed
from baseline and from at least two follow-up visits.10
at APTA Member on May 8, 2014http://ptjournal.apta.org/Downloaded from
6
Measures of walking ability:
The 20-meter walk and the two-minute walk were measured over a 20-meter course in an
unobstructed corridor marked by cones on both ends. For the 20-meter walk, participants were
instructed to walk one length of the course at their usual pace. Timing started with the first step
(footfall) over the starting line and ended with the first step (footfall) over the finishing line.
Gait speed was quantified in meters/second (m/s), i.e., calculated as 20 meters divided by
seconds needed to complete the 20-meter walk. Participants were allowed to use walking aids
during the test, such as canes or walkers, if needed. Gait speed measured over a 20-meter
walkway has high test-retest reliability in older adults with intra-class correlation coefficients
greater than 0.9.11, 12
To measure the two-minute walk, participants were first screened in accordance to the American
College of Sports Medicine guidelines for exercise testing.13 Participants with electrocardiogram
abnormalities, systolic and diastolic blood pressure exceeding 199 mmHG or 109 mmHG,
respectively, or a heart rate < 40 or > 110 beats per minute were excluded. Second, participants
reporting heart attack, angioplasty or heart surgery, exacerbation of chest pain, shortness of
breath, fainting, or angina within the past three months were excluded. Eligible participants
were instructed to “cover as much ground as possible” over a two-minute walking period on the
same course as the 20-meter walk. Heart rate was monitored during the two-minute walk and
participants were stopped if their heart rate exceeded 135 beats per minute or they experienced
debilitating pain, shortness of breath, syncope, or excessive fatigue. The distance walked was
recorded in meters. If study participants started the walk, but did not walk for the full two
minutes, the total distance covered was still recorded.
at APTA Member on May 8, 2014http://ptjournal.apta.org/Downloaded from
7
Subject Characteristics:
Characteristics of participants were collected at Year 1 of Health ABC, except for age, and Body
Mass Index (BMI), which were collected at our study baseline, i.e., Year 2 for Health ABC.
Statistical analysis:
We compared the characteristics of Health ABC participants included and not included (due to
insufficient walk test data; figure 1) in our sample by performing t-tests for continuous variables
and chi-square tests for categorical variables. We described trajectories of the 20-meter walk
and the two-minute walk over 8 years using group-based trajectory models among participants
with both walk tests at baseline and at least 2 follow-up visits. A trajectory group is an assembly
of study participants who follow the same pattern of change in an outcome over time. The
group-based trajectory model makes no assumptions regarding the pattern or shape of change
over time or the distribution of trajectory groups. Rather, the group-based trajectory model is a
statistical device that approximates an unknown number and shape of trajectories across a
sample.14 This model assumes missing values are missing completely at random.9 We employed
the SAS macro PROC TRAJ to formulate trajectory groups.15
To describe change in walking ability over time, we first identified trajectories for each walking
test as a separate outcome using three steps.
• The first step was to determine the number of trajectory groups. We required a minimum
of 10% of the subjects from the sample to be within each group and adjacent trajectory
groups to have slopes differing by more than 5%. We chose these restrictions to provide
at APTA Member on May 8, 2014http://ptjournal.apta.org/Downloaded from
8
a description of trajectory group that were meaningful and pragmatic from a clinical
perspective. Stipulating these differences in trajectory groups enables clinicians to
classify patients into one of several broad trajectory groups, rather than an innumerable
number of small groups with little difference in change.
• The second step was to describe the shape of change over time. We initially added both
linear and quadratic terms to test for the presence of a curvilinear pattern of decline.
However, none of the quadratic terms attained statistical significance (p > 0.05); thus we
included only a linear term in the final regression models.
• The third step was to evaluate the adequacy of the individual trajectories from each
subject fitting the broader trajectory group classification. We calculated this likelihood
that an individual’s trajectory fit within each of the trajectory groups, which is termed the
posterior probability.14 Specifically, higher probability values indicate higher likelihood
that an individual’s trajectory pattern fits within the broader trajectory group.
Next, we evaluated contemporaneous change in the 20-meter walk and two-minute walk in three-
steps.
• As a first step, we used a dual model from the SAS macro PROC TRAJ to identify
trajectories for both outcomes at the same time. In particular, we first described the
proportion of participants within each 20-meter walk trajectory who were in each two-
minute walk trajectory group. Next we described the proportion of participants within
each two-minute walk trajectory who were in each 20-meter walk trajectory. Lastly, we
estimated the joint proportion of the trajectories, i.e., the cross-tabulation of the
proportion in each 20-meter walk trajectory by each two-minute walk trajectory. We
at APTA Member on May 8, 2014http://ptjournal.apta.org/Downloaded from
9
required a minimum of 10% of subjects to be in each 20-meter walk and two-minute
walk trajectory group and assumed a linear pattern of decline.
• As a second step we evaluated the posterior probabilities of group membership.
• Lastly, we examined the agreement between 20-meter walk and two-minute walk
trajectory membership from the dual model by calculating Weighted Kappa statistic, an
index of chance correct agreement, and 95% confidence Interval.
RESULTS
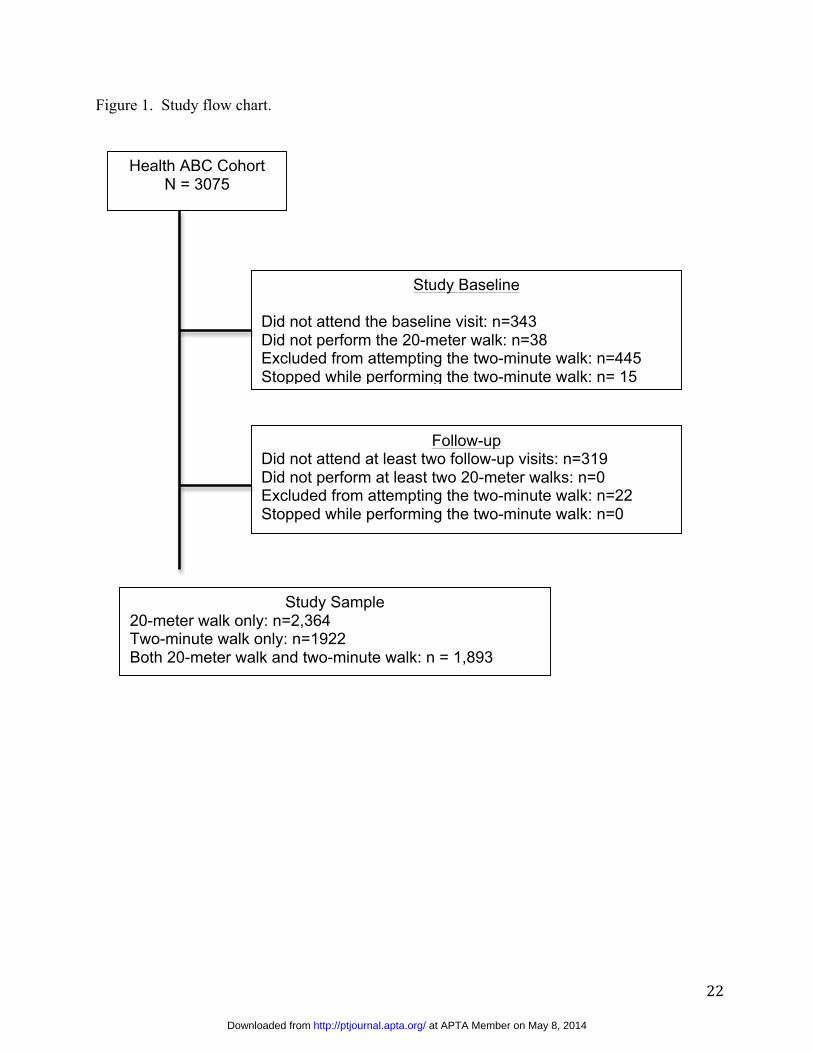
Of the 3075 Health ABC participants at baseline, 1,182 were excluded for the reasons detailed in
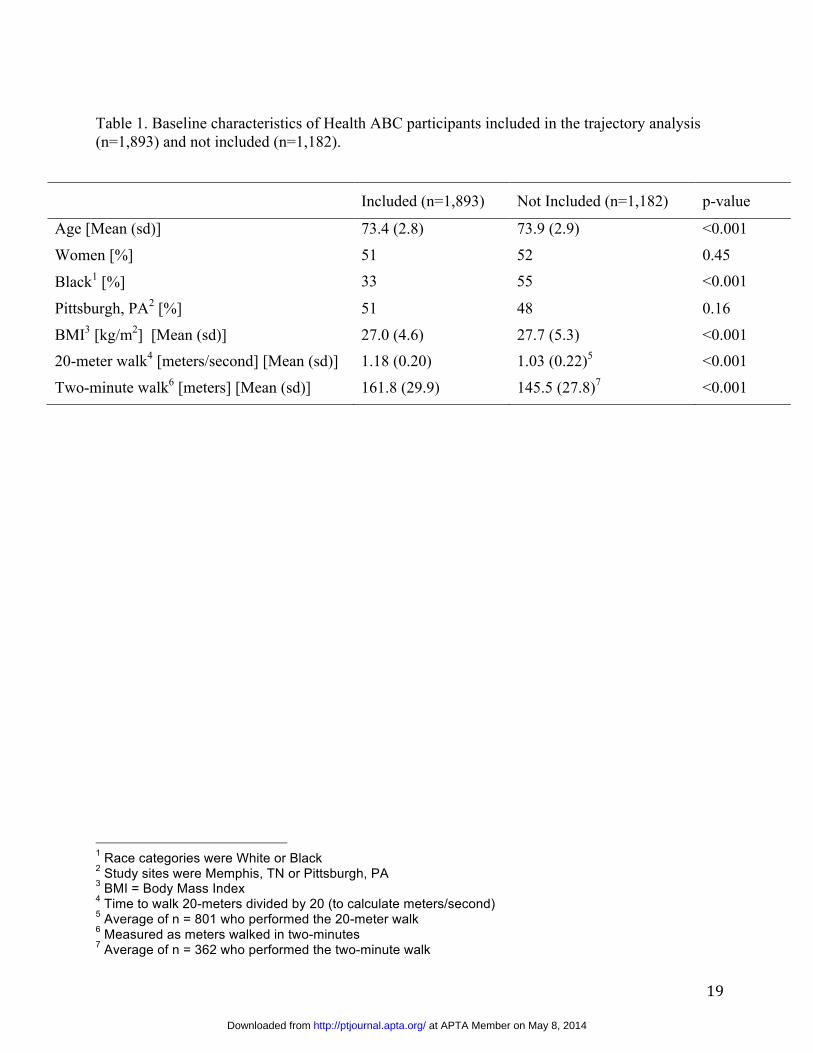
Figure 1, leaving 1,893 participants eligible for the trajectory analysis. No statistically
significant differences existed in sex or study site distribution between groups. However,
compared with participants included in the trajectory analysis, those not included were more
likely to be older, black, have a higher BMI, lower strength, a slower 20-meter walk speed, and
cover less distance in the two-minute walk at baseline (Table 1).
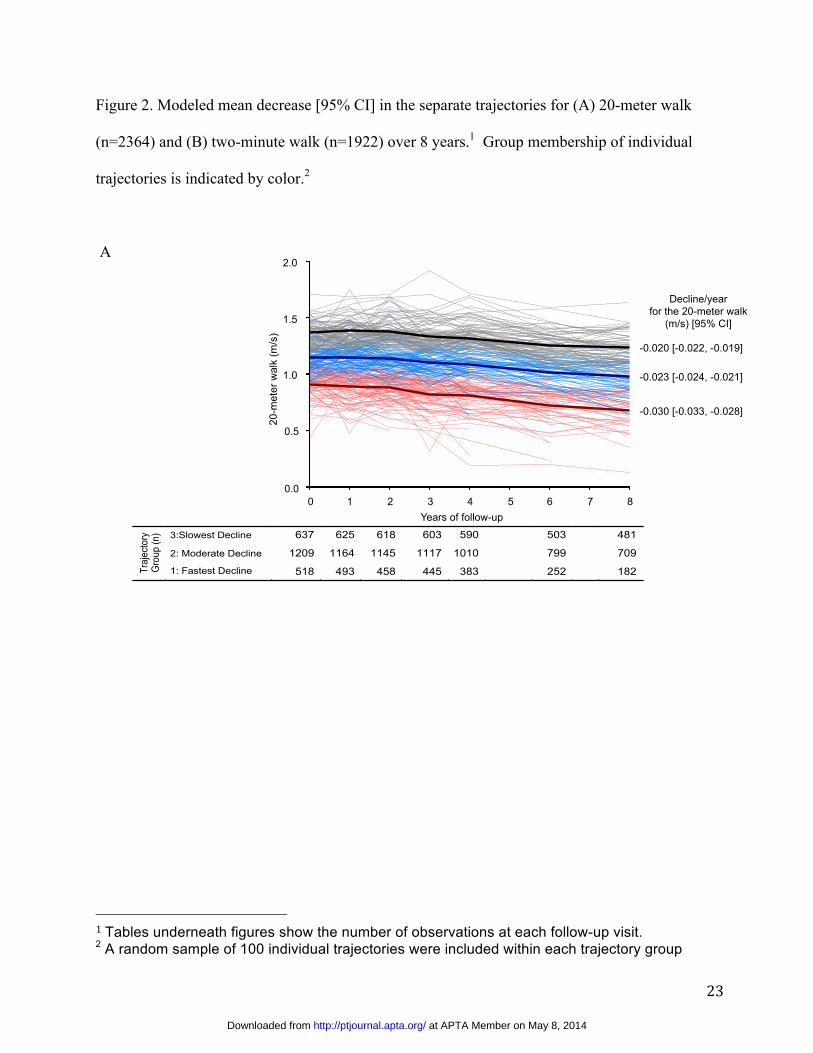
20-meter walk trajectories over 8 years
We identified three 20-meter walk trajectories. Figure 2, Panel A shows the superimposed mean
decline of each trajectory along with a random sample of 100 individual 20-meter walk values
within each trajectory group. The posterior probability of allocating each study participant into
trajectory groups was greater than 0.94, indicating a good fit of the model of group trajectories to
individual patterns of change. As shown in Figure 2 Panel A, participants in the group with the
greatest decline in 20-meter walk (n=518 (22%)) had a mean (sd) baseline gait speed of 0.90 m/s
(0.15) and slowed 0.030 m/s per year on average (95%CI [-0.033, -0.028]). Participants in the
at APTA Member on May 8, 2014http://ptjournal.apta.org/Downloaded from
10
group with the least decline in 20-meter walk (n=637 (27%)) had a mean baseline gait speed of
1.37 m/s (0.13) and slowed 0.020 m/s per year on average [-0.022, -0.019].
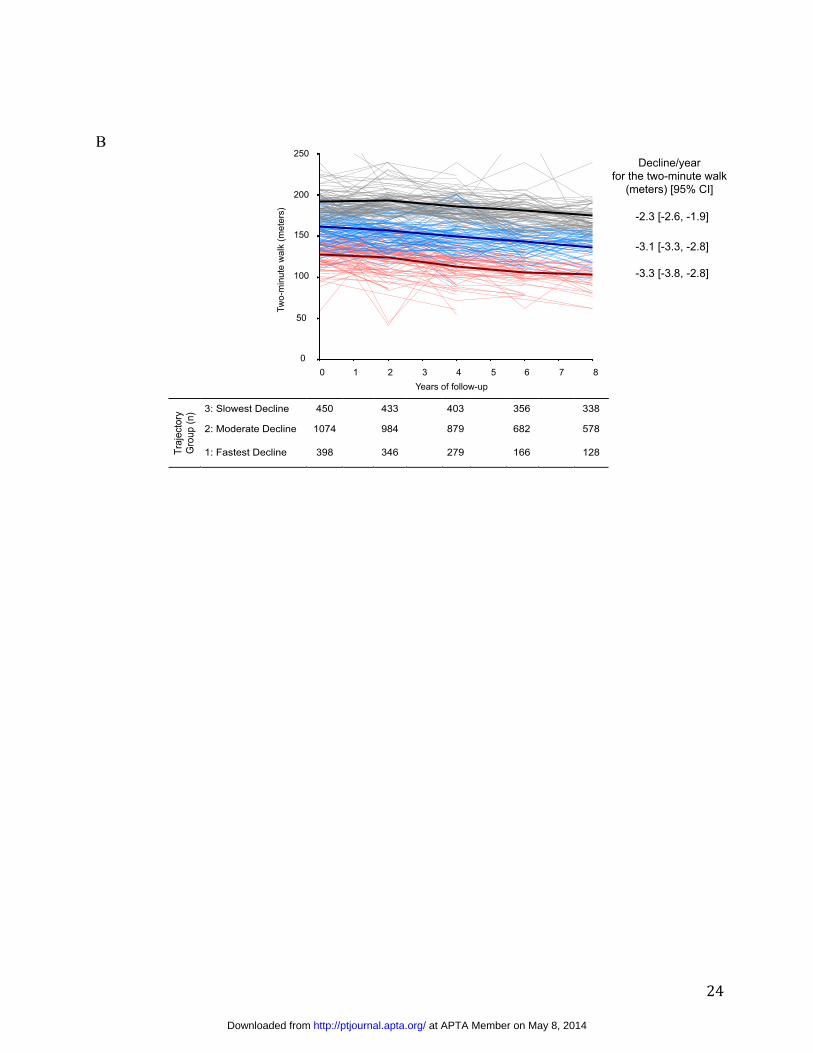
Two-minute walk trajectories over 8 years
We identified three two-minute walk trajectories (Figure 2, Panel B). The posterior probability
of group membership was greater than 0.89. Participants in the group with the greatest decline
(n=398: 21%) walked a mean of 127.2 (22.3) meters over two-minutes at baseline and on
average changed -3.3 meters per year [-3.8, -2.8]. The mean distance walked over two-minutes
for participants in the group with the least decline (n=450: 23%) was 196.2 (21.5) meters at
baseline and on average these participants changed -2.3 meters per year [-2.6, -1.9].
Dual Trajectory Model
There were three trajectory groups for both the 20-meter walk and two-minute walk using the
dual model. Among those who experienced fast decline in the 20-meter walk, 85.4% also had
fast decline in the two-minute walk and none had slow decline in the two-minute walk. (Table 2,
Panel A) Similarly, among those with moderate decline in the 20-meter walk, 87.8% had
moderate decline in the two-minute walk. Lastly, among those with slow decline in the 20-meter
walk, 91.9% had slow decline in the two-minute walk and 0.4% had fast decline in the two-
minute walk. We observed similar proportions for those with fast-, moderate-, and slow- decline
in the 20-meter walk among those in the same respective two-minute walk trajectories. (Table 2,
Panel B) The posterior probability of group membership was greater than 0.92. The joint
proportion of membership in trajectories along the diagonal summed to 86.9% and there was
at APTA Member on May 8, 2014http://ptjournal.apta.org/Downloaded from
11
high chance corrected agreement (Weighted Kappa =0.84, 95% Confidence Interval [0.82, 0.86])
between the 20-meter walk and two-minute walk trajectory groups. (Table 2, Panel C)
DISCUSSION
The majority of Health ABC participants experienced a similar trajectory pattern for the two-
minute walk as the 20-meter walk over eight years. In particular, 86.9% of participants with a
pattern of slow-, moderate-, or fast-decline for the two-minute had the same respective pattern
for the 20-meter walk. We also found high chance corrected agreement (Weighted Kappa=0.84)
with patterns of decline in the 20-meter walk and two-minute walk over this period of time
despite representing different components of walking ability in older adults. Hence, older adults
with the fastest decline for walking a short distance are unlikely to sustain the ability to walk for
prolonged distances. Our findings are consistent with previous cross-sectional studies of people
with neurological 6, 8 and cardiorespiratory pathology,7 and adds that there is high correlation
with patterns of decline in short- and prolonged-walking among initially well-functioning older
adults. These findings suggest that patterns of change in the two-minute walk can be reasonably
measured from 20-meter walk, and separate re-testing of the two-minute walk may not be
necessary in healthy older adults to detect decline in walking ability.
Our study showed a slightly stronger correlation between the 20-meter walk and two-minute
walk trajectories for those with slow rather than fast decline. Specifically, the proportion of fast
decline in the 20-meter walk among people with fast decline in the two-minute walk (84.2%)
was similar to the opposite comparison, i.e., the proportion of fast decline in the two-minute
walk among those with fast decline in the 20-meter walk (85.4%). However for slow decline,
at APTA Member on May 8, 2014http://ptjournal.apta.org/Downloaded from
12
the proportion was 91.9% for the 20-meter walk among those with slow decline in the two-
minute walk, and 86.8% for the opposite comparison. These findings suggest that while both
tests similarly predict fast decline in the other over time, prolonged walking is slightly more
predictive of slow decline in short walking than vice versa. This suggests that if clinicians have
flexibility to perform either test, the two-minute walk is marginally better at capturing slow
decline than the 20-meter walk, though each test appears to equally predict the other for fast
decline. These findings are important for physical therapists’ understanding of how both tests of
walking ability change together over time, and help set uncertainty for inferring change in one
test from another.
The rates of decline we found within trajectory groups were small relative to known clinically
meaningful thresholds. For instance, we found yearly decline to occur at a rate of -0.03 m/s in
the fastest decline 20-meter walk trajectory, which is well below a known clinically meaningful
threshold of about -0.1 m/s for older adults.16 However, over time health will be impacted
sooner in the fastest decline trajectory compared with slowest decline trajectory. For example,
walking less than 1.0 m/s is a known risk factor for poor health outcomes in older adults.1 Given
our sample’s average starting speed of 1.18 m/s, those within the fastest decline trajectory would
reach the 1.0 m/s threshold in about 6 years, compared with 9 years for the slowest decline
trajectory, which slowed -0.02 m/s per year.
Limitations of our study should be acknowledged. Over a third of the Health ABC cohort (1,182
of 3,075), which already was limited to well-functioning older adults, was excluded for our
analyses. Study participants were most common excluded for not attending the baseline visit
at APTA Member on May 8, 2014http://ptjournal.apta.org/Downloaded from
13
[29% (343/1,182)], not attending at least two follow-up visits [27% (319/1,182)], and being
excluded for attempting the baseline two-minute walk due to health reasons [38% (445/1,182)].
These excluded study participants had poorer health status characterized by higher BMI, less
strength, a slower gait speed, and less distance covered for the two-minute walk test.
Consequently, reported rates of decline in gait speed or prolonged walking may be
underestimated by our sample. While the exclusion of participants with worse health limits the
generalizability of findings to all older adults, it focuses this study to specifically evaluate
whether different walk tests are needed among well-functioning older adults with low
cardiovascular disease risk, given the strict exclusion criteria for attempting the two-minute walk
test. Interestingly, the strict stopping criteria for those attempting the two-minute walk test was
not a major reason for exclusion. Among those excluded from our sample, only 15 study
participants were stopped during the two-minute walk due to a heart rate > 135 beats/minute or
painful symptoms. Our study did not investigate the causal relationship between the 20-meter
walk and two-minute walk, but rather described the contemporaneous change between these tests
over time. Thus, no inference can be made regarding whether treatment targeting improved gait
speed translates to improvement in prolonged walking, and vice versa. Lastly, the ability of
trajectories of the 20-meter walk and two-minute walk to predict future adverse health outcomes,
such as mortality or functional limitation, was not examined, as this was beyond the scope of our
present study. Before a firm conclusion can be made regarding the necessity of both measures,
future study should evaluate whether each test provides unique information about the
development of adverse health outcomes.
at APTA Member on May 8, 2014http://ptjournal.apta.org/Downloaded from
14
Despite these limitations, there are several strengths to this study. First, Health ABC is a well-
described cohort of older adults who had systematic 20-meter walk and two-minute walk
assessments over 8 years. Second, to our knowledge this is the first study to employ a dual
model to describe contemporaneous change in measures of walking ability. This approach
provides a more detailed description of the linkages of contemporaneous change between
measures of walking ability than a single summary estimate of agreement.9 Third, given the
mean posterior probabilities were over 89% for all group classifications, we believe there were
few instances of misclassification of individual trajectories into their respective trajectory group.
In summary, decline in the ability to walk for a prolonged period of time is likely to coincide
with decline in the ability to walk for a short period of time in initially well-functioning adults as
they transition from their eighth to ninth decade of life. The separate testing of gait speed and
prolonged walking should continue when physical therapists believe they are both necessary.
However, our study results indicate that physical therapists may reconsider the need to separately
re-test both in follow-up visits for healthy older adults and instead re-test the less-burdensome
20-meter walk to detect decline in walking ability.
at APTA Member on May 8, 2014http://ptjournal.apta.org/Downloaded from
15
Dr White, Dr Neogi, Dr King, Dr Lavalley, Dr Kritchevsky, Dr Nevitt, Dr Ferrucci, and Dr
Zhang provided concept/idea/research design. Dr White, Dr Neogi, Dr King, Dr Nevitt, Dr
Harris, Dr Simonsick, Dr Satterfield, Dr Strotmeter, and Dr Zhang provided writing. Dr Neogi,
Dr Nevitt, Dr Harris, and Dr Simonsick provided data collection. Dr White, Dr Neogi, Dr
Lavalley, and Dr Zhang provided data analysis. Dr Satterfield, Dr Somonsick, Dr Strotmeyer,
and Dr Harris provided project management and study participants. Dr White, Dr Neogi, Dr
Nevitt, and Dr Harris provided fund procurement. Dr Nevitt, Dr Ferrucci, Dr Satterfield, and Dr
Simonsick provided institutional liaisons. Dr Neogi, Dr King, Dr Lavalley, Dr Ferrucci, Dr
Satterfield, Dr Strotmeyer, and Dr Simonsick provided consultation (including review of
manuscript before submission).
The study protocol was approved by the institutional review boards of the University of
Tennessee‒Memphis, the University of California‒San Francisco, and the University of
Pittsburgh. The present analysis was approved by the Institutional Review Board at Boston
University.
This work was supported, in part, by the Intramural Research Program of the National Institutes
of Health (NIH); the National Institute on Aging (NIA) (grants N01-AG-6-2101, N01-AG-6-
2103, N01-AG-6-2106, and R01-AG028050); the National Institute of Nursing Research (grant
R01-NR0124590); the National Institute of Child Health and Human Development as part of the
Medical Rehabilitation Infrastructure Network R24HD0065688; the Boston Claude D. Pepper
Older Americans Independence Center from the NIA (grant P30-AG031679); the Foundation for
Physical Therapy Geriatrics Research Grant; the American College of Rheumatology Research
at APTA Member on May 8, 2014http://ptjournal.apta.org/Downloaded from
16
Foundation’s Rheumatology Investigator Award; and the National Institute of Arthritis and
Musculoskeletal and Skin at NIH (grants AR47785 and R01-AR062506).
DOI: 10.2522/ptj.20130628
at APTA Member on May 8, 2014http://ptjournal.apta.org/Downloaded from
17
References
1. Cesari M, Kritchevsky SB, Penninx BW, et al. Prognostic value of usual gait speed in
well-functioning older people--results from the Health, Aging and Body Composition
Study. Journal of the American Geriatrics Society. Oct 2005;53(10):1675-1680.
2. Studenski S, Perera S, Patel K, et al. Gait speed and survival in older adults. JAMA. Jan 5
2011;305(1):50-58.
3. Newman AB, Simonsick EM, Naydeck BL, et al. Association of long-distance corridor
walk performance with mortality, cardiovascular disease, mobility limitation, and
disability. JAMA. May 3 2006;295(17):2018-2026.
4. Bohannon RW, Williams Andrews A. Normal walking speed: a descriptive meta-
analysis. Physiotherapy. Sep 2011;97(3):182-189.
5. Guide to Physical Therapist Practice: American Physical Therapy Association; 2003.
6. Dalgas U, Severinsen K, Overgaard K. Relations between 6 minute walking distance and
10 meter walking speed in patients with multiple sclerosis and stroke. Arch Phys Med
Rehabil. Jul 2012;93(7):1167-1172.
7. Andersson M, Moberg L, Svantesson U, Sundbom A, Johansson H, Emtner M.
Measuring walking speed in COPD: test-retest reliability of the 30-metre walk test and
comparison with the 6-minute walk test. Prim Care Respir J. Dec 2011;20(4):434-440.
8. Bijleveld-Uitman M, van de Port I, Kwakkel G. Is gait speed or walking distance a better
predictor for community walking after stroke? J Rehabil Med. Jun 2013;45(6):535-540.
9. Nagin D. Group-Based Modeling of Development. Cambridge, MA: Harvard University
Press; 2005.
at APTA Member on May 8, 2014http://ptjournal.apta.org/Downloaded from
18
10. White D, Neogi T, Nevitt M, et al. Trajectories of gait speed predict mortality in well-
functioning older adults: The Health, Aging, and Body Composition Study. The journals
of gerontology. 2012;In Press.
11. Simonsick EM, Gardner AW, Poehlman ET. Assessment of physical function and
exercise tolerance in older adults: reproducibility and comparability of five measures.
Aging (Milano). Aug 2000;12(4):274-280.
12. Steffen TM, Hacker TA, Mollinger L. Age- and gender-related test performance in
community-dwelling elderly people: Six-Minute Walk Test, Berg Balance Scale, Timed
Up & Go Test, and gait speeds. Physical therapy. Feb 2002;82(2):128-137.
13. American College of Sports Medicine, Guidelines for Exercise Testing. 5th ed. Baltimore:
WIlliams and Wilkins; 1995.
14. Nagin DS, Odgers CL. Group-based trajectory modeling in clinical research. Annu Rev
Clin Psychol. 2010;6:109-138.
15. Jones B, Nagin D, Roeder K. A SAS procedure based on mixture models for estimating
developmental trajectories. Social Methods Res. 2001;29:374-393.
16. Perera S, Mody SH, Woodman RC, Studenski SA. Meaningful change and
responsiveness in common physical performance measures in older adults. J Am Geriatr
Soc. May 2006;54(5):743-749.
at APTA Member on May 8, 2014http://ptjournal.apta.org/Downloaded from
19
Table 1. Baseline characteristics of Health ABC participants included in the trajectory analysis (n=1,893) and not included (n=1,182).
1 Race categories were White or Black 2 Study sites were Memphis, TN or Pittsburgh, PA 3 BMI = Body Mass Index 4 Time to walk 20-meters divided by 20 (to calculate meters/second) 5 Average of n = 801 who performed the 20-meter walk 6 Measured as meters walked in two-minutes 7 Average of n = 362 who performed the two-minute walk
Included (n=1,893) Not Included (n=1,182) p-value
Age [Mean (sd)] 73.4 (2.8) 73.9 (2.9) <0.001
Women [%] 51 52 0.45
Black1 [%] 33 55 <0.001
Pittsburgh, PA2 [%] 51 48 0.16
BMI3 [kg/m2] [Mean (sd)] 27.0 (4.6) 27.7 (5.3) <0.001 20-meter walk4 [meters/second] [Mean (sd)] 1.18 (0.20) 1.03 (0.22)5 <0.001
Two-minute walk6 [meters] [Mean (sd)] 161.8 (29.9) 145.5 (27.8)7 <0.001
at APTA Member on May 8, 2014http://ptjournal.apta.org/Downloaded from
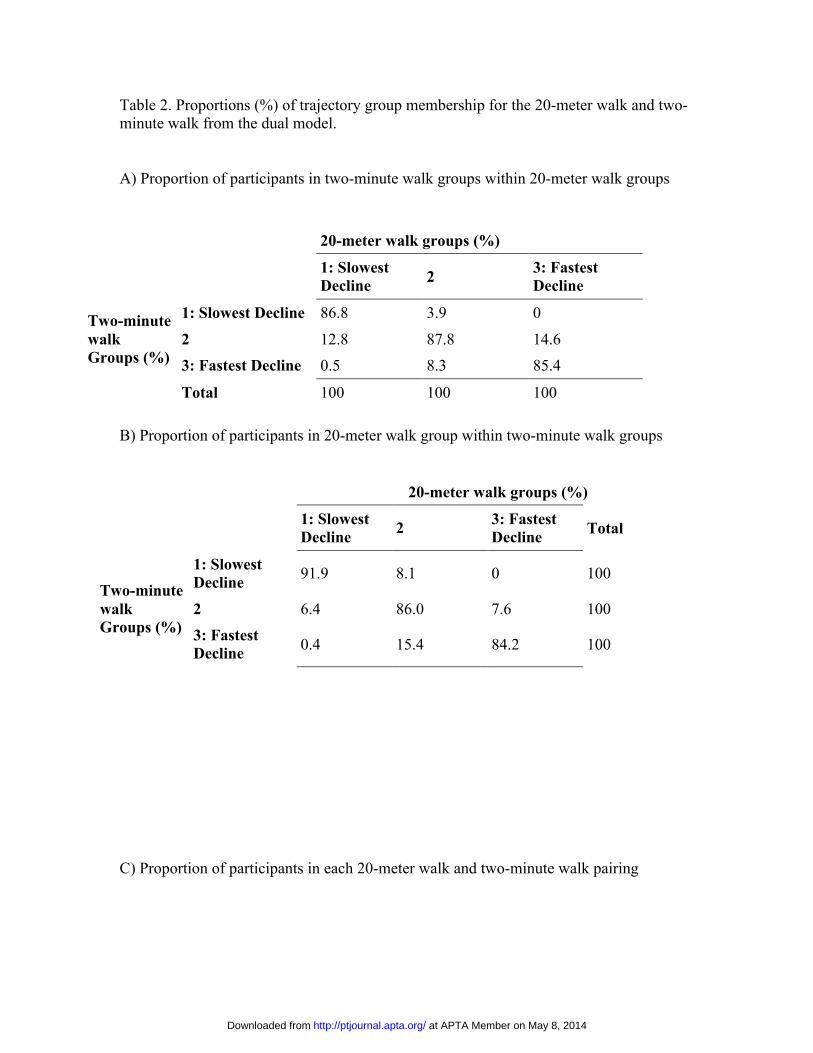
Table 2. Proportions (%) of trajectory group membership for the 20-meter walk and two-minute walk from the dual model. A) Proportion of participants in two-minute walk groups within 20-meter walk groups
B) Proportion of participants in 20-meter walk group within two-minute walk groups
C) Proportion of participants in each 20-meter walk and two-minute walk pairing
20-meter walk groups (%)
1: Slowest Decline 2 3: Fastest
Decline
Two-minute walk Groups (%)
1: Slowest Decline 86.8 3.9 0
2 12.8 87.8 14.6 3: Fastest Decline 0.5 8.3 85.4
Total 100 100 100
20-meter walk groups (%)
1: Slowest Decline 2 3: Fastest
Decline Total
Two-minute walk Groups (%)
1: Slowest Decline 91.9 8.1 0 100
2 6.4 86.0 7.6 100 3: Fastest Decline 0.4 15.4 84.2 100
at APTA Member on May 8, 2014http://ptjournal.apta.org/Downloaded from
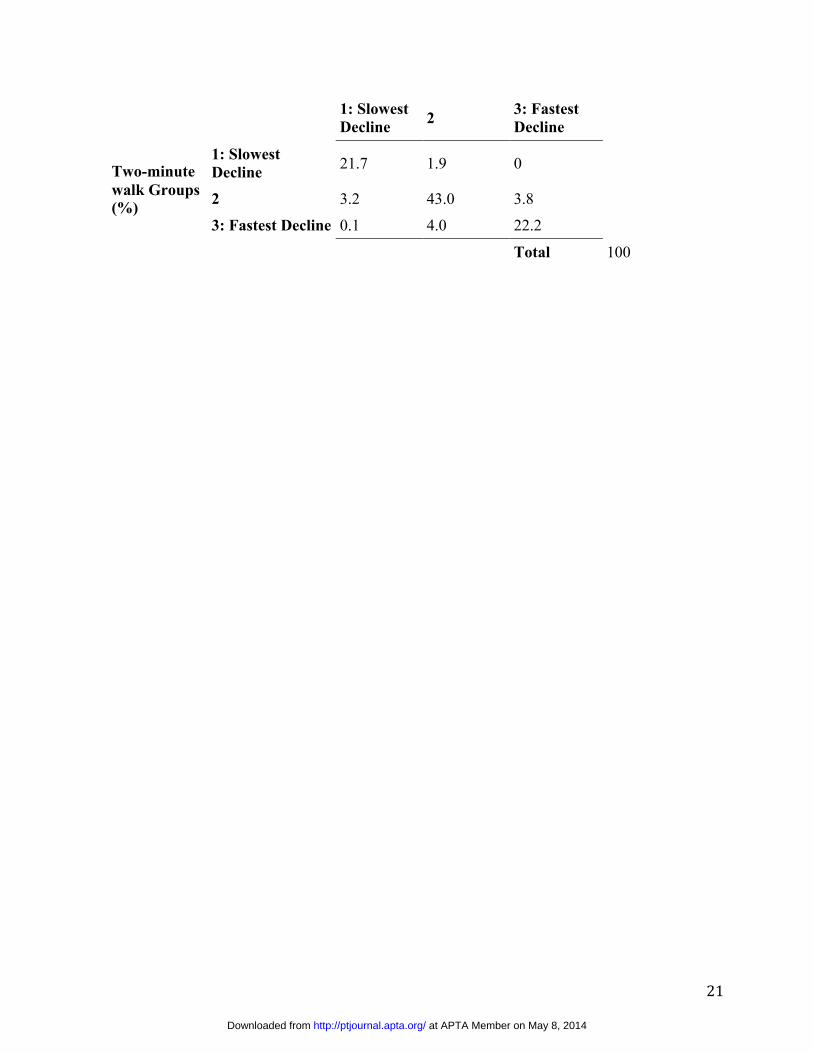
21
1: Slowest Decline 2 3: Fastest
Decline
Two-minute walk Groups (%)
1: Slowest Decline 21.7 1.9 0
2 3.2 43.0 3.8
3: Fastest Decline 0.1 4.0 22.2
Total 100
at APTA Member on May 8, 2014http://ptjournal.apta.org/Downloaded from
22
Figure 1. Study flow chart.
Health ABC Cohort N = 3075
Study Baseline Did not attend the baseline visit: n=343 Did not perform the 20-meter walk: n=38 Excluded from attempting the two-minute walk: n=445 Stopped while performing the two-minute walk: n= 15
Follow-up Did not attend at least two follow-up visits: n=319 Did not perform at least two 20-meter walks: n=0 Excluded from attempting the two-minute walk: n=22 Stopped while performing the two-minute walk: n=0
Study Sample 20-meter walk only: n=2,364 Two-minute walk only: n=1922 Both 20-meter walk and two-minute walk: n = 1,893
at APTA Member on May 8, 2014http://ptjournal.apta.org/Downloaded from
23
Figure 2. Modeled mean decrease [95% CI] in the separate trajectories for (A) 20-meter walk
(n=2364) and (B) two-minute walk (n=1922) over 8 years.1 Group membership of individual
trajectories is indicated by color.2
A
1 Tables underneath figures show the number of observations at each follow-up visit. 2 A random sample of 100 individual trajectories were included within each trajectory group
!
Traj
ecto
ry
Gro
up (n
) 3:Slowest Decline 637 625 618 603 590 503 481
2: Moderate Decline 1209 1164 1145 1117 1010 799 709
1: Fastest Decline 518 493 458 445 383 252 182
Decline/year for the 20-meter walk
(m/s) [95% CI]
-0.020 [-0.022, -0.019]
-0.023 [-0.024, -0.021]
-0.030 [-0.033, -0.028]
0 1 2 3 4 5 6 7 80.0
0.5
1.0
1.5
2.0
0 1 2 3 4 5 6 7 80.0
0.5
1.0
1.5
2.0
0 1 2 3 4 5 6 7 80.0
0.5
1.0
1.5
2.0
0 1 2 3 4 5 6 7 80.0
0.5
1.0
1.5
2.0
Years of follow-up
20-m
eter
wal
k (m
/s)
0 1 2 3 4 5 6 7 8 0.0
2.0
1.5
1.0
0.5
at APTA Member on May 8, 2014http://ptjournal.apta.org/Downloaded from
24
B
!
Traj
ecto
ry
Gro
up (n
) 3: Slowest Decline 450 433 403 356 338
2: Moderate Decline 1074 984 879 682 578
1: Fastest Decline 398 346 279 166 128
-2.3 [-2.6, -1.9]
Decline/year for the two-minute walk
(meters) [95% CI]
-3.1 [-3.3, -2.8]
-3.3 [-3.8, -2.8]
Years of follow-up
Two-
min
ute
wal
k (m
eter
s)
0 1 2 3 4 5 6 7 80
50
100
150
200
250
0 1 2 3 4 5 6 7 80
50
100
150
200
250
0 1 2 3 4 5 6 7 80
50
100
150
200
250
0 1 2 3 4 5 6 7 80
50
100
150
200
250
0 1 2 3 4 5 6 7 8 0
250
150
100
50
200
at APTA Member on May 8, 2014http://ptjournal.apta.org/Downloaded from
doi: 10.2522/ptj.20130628 Published online May 1, 2014PHYS THER.
ZhangSuzanne Satterfield, Elsa S. Strotmeyer and Yuqing Q. Tamara B. Harris, Luigi Ferrucci, Eleanor M. Simonsick,Lavalley, Stephen B. Kritchevsky, Michael C. Nevitt, Daniel White, Tuhina Neogi, Wendy C. King, MichaelAre Initially Well-Functioning?a Short Test of Gait Speed Among Older Adults Who Can Change in Prolonged Walking Be Inferred From
Information Subscription http://ptjournal.apta.org/subscriptions/
Permissions and Reprints http://ptjournal.apta.org/site/misc/terms.xhtml
Information for Authors http://ptjournal.apta.org/site/misc/ifora.xhtml
at APTA Member on May 8, 2014http://ptjournal.apta.org/Downloaded from