“A Biomechanical Assessment of Gait Patterns and Risk of ...
432
[1] “A Biomechanical Assessment of Gait Patterns and Risk of Associated Overuse Conditions among Mature Female Runners.” Submitted by Kim Louise Lilley to the University of Exeter as a thesis for the degree of Doctor of Philosophy in Sport and Health Sciences In February 2012. This thesis is available for Library use on the understanding that it is copyright material and that no quotation from the thesis may be published without proper acknowledgement. I certify that all material in this thesis which is not my own work has been identified and that no material has previously been submitted and approved for the award of a degree by this or any other University. Signature: …………………………………………………………..
-
Upload
khangminh22 -
Category
Documents
-
view
0 -
download
0
Transcript of “A Biomechanical Assessment of Gait Patterns and Risk of ...

[1]
“A Biomechanical Assessment of Gait Patterns and Risk of Associated Overuse Conditions
among Mature Female Runners.”
Submitted by Kim Louise Lilley to the University of Exeter as a thesis for the degree of
Doctor of Philosophy in Sport and Health Sciences In February 2012.
This thesis is available for Library use on the understanding that it is copyright material and
that no quotation from the thesis may be published without proper acknowledgement.
I certify that all material in this thesis which is not my own work has been identified and that
no material has previously been submitted and approved for the award of a degree by this or
any other University.
Signature: …………………………………………………………..

[2]
ABSTRACT
Due to a proliferation of health and social advantages, the popularity of running among the
more mature members of the female population is expanding steadily. However, with both
age and gender acting as possible risk factors, the incidence of running related injuries and
associated conditions is high among this group. With the predominance of debilitating
conditions such as knee joint osteoarthritis acting at the knee joint, knowledge of lower limb
biomechanics during running will provide insight into possible risk factors and potential
management strategies. Three biomechanical and one magnetic resonance imaging study
focussed on the specific running gait of mature females and the effect of footwear on lower
limb joint kinematics and loading. The biomechanical studies used synchronised ground
reaction force and lower extremity kinematic data to provide three dimensional running data
and knee moments for each female. The long term study objectives were to 1) determine
whether the running gait of mature females could be a predisposing factor to injuries and
conditions at the knee joint, and 2) determine if changes in footwear could modify
biomechanical variables associated with the development of injuries and overuse conditions
among this group.
In Study One, a direct comparison of mature and young female running gait was used to
identify any biomechanical movement characteristics specific to the mature group that could
predispose to injuries and debilitating conditions. It was found that rearfoot eversion, ankle
dorsiflexion, knee internal rotation, and knee external adductor moment that are associated
with increased loading of the lateral knee joint and possible medial knee joint osteoarthritis
development, were significantly higher among the mature females compared to the younger
group (p<0.05).

[3]
A common management strategy for running related conditions is the adaption of footwear.
Therefore Study Two investigated the effect of a motion control running shoe on the running
gait of young and mature females, with a specific focus on the variables associated with knee
joint injury and osteoarthritis development. The results showed a motion control shoe to
reduce certain biomechanical variables (rearfoot eversion and knee internal rotation)
associated with mature female runners. However, one variable (knee external adductor
moment) commonly associated with increased medial knee loading and osteoarthritis
development, remained high among the mature females.
One specific method used to reduce the knee external adductor moment, is the
implementation of a lateral wedge in running shoes. Therefore, Study Three assessed the
singular effects of a medial wedge, a lateral wedge, and then the effect of an orthotic
combining both interventions on the running gait of mature females. Results demonstrated
non significant changes in any kinematic variable with the medial or lateral wedge, although
the lateral wedge was shown to reduce the knee external adductor moment. The orthotic
intervention however produced significant reductions in rearfoot eversion, knee internal
rotation, and knee external adductor moment previously found to be high among mature
female runners.
Although all mature females studied had previously been characterised as free from
symptoms of knee injury or osteoarthritis, a final investigation was undertaken to assess the
condition of the knee joint (Study Four). Magnetic resonance imaging scans of the knee were
taken for ten of the mature females. Results indicated that eight out of the ten females had
early stage osteoarthritis present, with an average 79% of features presenting on the medial
side of the knee joint. Additionally, there was a strong positive correlation between knee

[4]
osteoarthritis and the knee external adductor moments measured in the ongoing
biomechanical study (Study Three).
These studies have shown that the running gait of mature females is significantly different to
that of younger female runners, and could predispose the mature group to injury and knee
osteoarthritis development. The trends in kinematic adaption to a motion control shoe have
shown promising results, and indicated the potential for footwear to reduce rearfoot eversion
and knee internal rotation among mature female runners. However, a specific orthotic,
incorporating both medial and lateral support has been found to reduce biomechanical
features of gait associated with overloading at both the medial and lateral knee joint. The
positive correlation between the knee adductor moment and signs of osteoarthritis for an
asymptomatic population suggests that the knee adductor moment may be a useful predictive
tool for identifying female runners at risk of osteoarthritis development.

[5]
CONTENTS PAGE
TITLE PAGE 1
ABSTRACT 2
LIST OF CONTENTS 5
LIST OF TABLES 11
LIST OF FIGURES 13
PUBLICATIONS AND PRESENTATIONS 19
LIST OF DEFINITIONS 20
ACKNOWLEDGEMENTS 22
CHAPTER TITLE
1. INTRODUCTION 23
2. REVIEW OF LITERATURE 27
2.1 Running: An ability, a sport, a risk. 27
2.1.1 Human gait and the ability to run 27
2.1.2 Incidence of running related injuries and debilitating conditions 28
2.1.3 Location of running related injuries and debilitating conditions: the
knee joint.
29
2.1.3.1 Anatomy of the knee joint. 31
2.1.4 Conditions affecting the knee joint. 33
2.1.4.1 Knee joint osteoarthritis 34
2.2 Mature Female Runners 38
2.2.1 Age related changes of the musculo-skeletal system. 38
2.2.2 Age related changes to gait 40
2.2.3 Gender differences in gait and injury risk 41
2.2.4 Influence of hormones and menopause 45
2.3 Analysis of Human Gait 47
2.3.1 Human Movement 47
2.3.2 Three dimensional gait analysis 48
2.3.3 Smoothing and filtering kinematic data 49
2.3.4 Errors in kinematic assessment 50
2.3.4.1 Reliability, repeatability and accuracy 52
2.4 Kinematic Movement Data 53
2.4.1 Assessment of joint centres and angles 53
2.4.2 Ankle motion: Dorsiflexion/Plantarflexion 53
2.4.3 Subtalar joint motion: Eversion and inversion 58
2.4.4 Motion of the foot: Abduction/adduction 59
2.4.5 Knee Joint Motion 61
2.4.5.1 Sagittal plane movements: flexion/extension 61
2.4.5.2 Frontal plane motion: Knee abduction/adduction 62
2.4.5.3 Transverse plane motion: Knee internal rotation 63
2.5 Kinetic Analysis 65
2.5.1 The ground reaction force 65
2.5.2 Force platform accuracy and targeting 68
2.6 Joint Moments 70
2.6.1 Anthropometry 70
2.6.2 Joint Forces 71
2.6.2.1 In-vivo measurements 71

[6]
2.6.2.2 External measurement of joint forces 72
2.6.3 Joint moments 75
2.7 Knee Joint Stiffness 78
2.7.1 Introduction to stiffness 78
2.7.2 Knee contribution to overall leg stiffness 80
2.8 Muscle Strength 82
2.8.1 Skeletal muscle structure and function 82
2.8.2 Quadriceps Femoris Muscle 83
2.8.3 Muscle strength 85
2.9 Footwear 87
2.9.1 Shoe design and function 87
2.10 Summary of literature review and general thesis rationale 89
2.10.1 Long term study objective 90
2.10.2 Scope and boundaries of the study 90
2.10.3 Study Overviews 91
2.10.3.1 Study One 91
2.10.3.2 Study Two 91
2.10.3.3 Study Three 91
2.10.3.4 Study Four 92
3.
A BIOMECHANICAL COMPARISON OF THE RUNNING GAIT OF MATURE
AND YOUNG FEMALES.
93
3.1 Introduction 93
3.1.1 Running and the Risk of Injury 93
3.1.2 Mature Female Runners and Injuries 94
3.1.3 Biomechanics of Motion and Injury Risk 95
3.1.3.1 Ground reaction force variables and injury risk 95
3.1.3.2 Subtalar joint motion and injury risk 97
3.1.3.3 Sagittal plane ankle motion and injury risk 99
3.1.3.4 Knee internal rotation and injury risk 101
3.1.3.5 Q-angle and injury risk 102
3.1.3.6 The knee external adductor moment 104
3.1.4 Study One Intentions and Hypotheses 105
3.2 Methods 106
3.2.1 Participation Selection 106
3.2.2 Motion Analysis and Data Capture 107
3.2.3 Kinematic and Kinetic Variables 111
3.2.3.1 Joint moment calculation 113
3.3 Results 114
3.3.1 Participant information and analyses of KOOS assessment 114
3.3.2 Assessment of biomechanical variables during running gait 117
3.2.2.1 Standing Q angle assessment 118
3.2.2.2 Ground reaction force variables 119
3.2.2.3 Rearfoot eversion angle 120
3.2.2.4 Knee internal rotation Angle 122
3.2.2.5 Peak ankle dorsiflexion angle 124
3.2.2.6 Correlation of Koos Scores with kinematic data 126
3.2.2.7 Knee joint moments throughout the stance phase of
running gait
127

[7]
3.4 Discussion 129
3.4.1 Aims and Hypothesis 129
3.4.2 KOOS Results 130
3.4.3 Kinetic Variables : Peak impact force and loading rates 131
3.4.4 Kinematic Variables and Risk of injuries and overuse conditions 133
3.4.4.1 Standing Q angle data 133
3.4.4.2 Kinematics during running 134
3.4.5 Knee joint moments 137
3.4.6 Limitations 141
3.5 Conclusion 142
3.6 Progression and further research 143
3.6.1 Summary of background 143
4
THE INFLUENCE OF MOTION CONTROL SHOES ON THE RUNNING GAIT
OF MATURE AND YOUNG FEMALES
144
4.1 Summary of previous study findings and conclusions 144
4.2 Introduction and review of literature 144
4.2.1 Incidence of Running Injuries among mature females 144
4.2.2 Excessive rearfoot eversion, knee internal rotation and loading rates
during running
145
4.2.3 Knee flexion and injury risk 147
4.2.4 Knee abduction angle and injury risk 149
4.2.5 Knee joint stiffness 151
4.2.5.1 Laxity 151
4.2.5.2 Joint stiffness 152
4.2.5.3 Methods of assessing stiffness 154
4.2.5.4 Knee joint stiffness, osteoarthritis and injuries 155
4.2.6 Quadriceps Strength 158
4.2.6.1 Factors influencing muscle strength 158
4.2.6.1.1 Gender 158
4.2.6.1.2 Age 159
4.2.6.2 Quadriceps strength, gait and injury 161
4.2.6.3 Assessing Quadriceps Femoris strength 162
4.2.7 The Influence of Footwear 163
4.2.7.1 Cushioning properties in footwear 164
4.2.7.1.1 Footwear and Loading rates 164
4.2.7.2 The motion control effect 167
4.2.7.3 Footwear and the Knee External Adductor Moment 169
4.2.7.4 The comfort of footwear 172
4.2.8 Aims and Hypotheses 173
4.3 Methods 174
4.3.1 Participants and KOOS 174
4.3.2 Test Running Shoes 175
4.3.3 Motion Analysis and Force Plate Assessment 177
4.3.4 Static Assessment 178
4.3.5 Analysis of Running Gait 179
4.3.5.1 Knee joint moment arm assessment 180
4.3.5.2 Knee joint stiffness 182
4.3.5.3 Muscle strength assessment 184

[8]
4.4 Results 187
4.4.1 KOOS results 187
4.4.2 Kinematic results 187
4.4.2.1 Significant Kinematic Results 189
4.4.2.1.1 Rearfoot Eversion 191
4.4.2.1.2 Knee Internal Rotation 192
4.4.2.1.3 Knee Abduction Angle 192
4.4.2.2 Non-significant Kinematic Results 192
4.4.3 Kinetic Results 194
4.4.4 Peak Knee External Adductor Moment and Moment Arm 196
4.4.5 Knee Joint Stiffness 199
4.4.6 Quadriceps Muscle Strength 201
4.4.7 Summary of results and overall findings 203
4.5 Discussion 204
4.5.1 Hypothesis One: A controlled neutral shoe 205
4.5.1.1 Kinematic differences in the running gait of mature and
young females in a controlled neutral footwear condition
205
4.5.1.2 Kinetic differences in running biomechanics between
mature and young females
211
4.5.1.3 Biomechanical similarities between mature and young
female runners
213
4.5.1.4 Knee joint stiffness 216
4.5.2 Hypothesis Two: A motion control shoe 218
4.5.2.1 Effectiveness of a motion control shoe to alter kinematics
during running
218
4.5.2.2 Additional factors influencing the effectiveness of a
motion control shoe
222
4.5.3 Hypothesis Three: The knee external adductor moment 223
4.5.4 Hypothesis four: Muscle strength 225
4.6 Conclusion and future direction 228
4.6.1 Future Research and Intervention shoe 228
5.
THE EFFECT OF A LATERAL WEDGE AND ARCH SUPPORT ORTHOTIC ON
THE RUNNING BIOMECHANICS OF MATURE FEMALES
231
5.1 Introduction and Review of Literature 231
5.1.1 Review of previous study findings and conclusions 231
5.1.2 Rearfoot eversion, knee internal rotation and forefoot abduction 231
5.1.3 The knee external adductor moment, medial knee joint loading and
osteoarthritis.
233
5.1.4 The effect of footwear on the knee external adductor moment 235
5.1.5 Aims and Hypotheses 238
5.2 Methods 239
5.2.1 Pilot Study 239
5.2.2 Participant Selection and KOOS 240
5.2.3 Test Conditions 241
5.2.4 Experimental Procedure for Assessment of Running Gait 244
5.2.4.1 Marker Placement and Static Trial 245
5.2.4.2 Gait Analysis 245
5.2.5 Three-Dimensional Data Analysis 246

[9]
5.3 Results 248
5.3.1 KOOS Scores and Somnio Line-Up Assessment Outcomes 248
5.3.1.1 KOOS Results 248
5.3.1.2 Somnio Line Up Device Results 251
5.3.2 Kinematic results during stance phase of running gait 251
5.3.2.1 Ankle/Subtalar joint 254
5.3.2.1.1 Rearfoot eversion 254
5.3.2.1.2 Foot abduction 256
5.3.2.1.3 Ankle Dorsiflexion 258
5.3.2.2 Knee joint 259
5.3.2.2.1 Knee Flexion 259
5.3.2.2.2 Knee Abduction (varus) 260
5.3.2.2.3 Knee Internal Rotation 262
5.3.3 Knee Moments: the external knee adductor moment and moment arm 265
5.3.3.1 Regression analysis between moment and moment arm
length
268
5.4 Discussion 269
5.4.1 Initial Assessments: KOOS and Somnio Line-Up Device 270
5.4.1.1 KOOS Outcome 270
5.4.1.2 Arch height and pronation: Somnio Line up device 271
5.4.2 Biomechanical movement patterns during running 272
5.4.2.1 Selection of medial and laterally inclined wedge height 272
5.4.2.2 Medial wedge 273
5.4.2.2.1 Ankle/Subtalar joint kinematics 273
5.4.2.2.2 Knee joint kinematics and moments 274
5.4.2.3 Lateral wedge 275
5.4.2.3.1 Ankle-Foot complex 276
5.4.2.3.2 Knee joint kinematics and moments 278
5.4.2.4 Orthotic footwear condition; lateral wedge and medial
support
282
5.4.2.4.1 Orthotic induced kinematic changes at the
ankle/subtalar joint
282
5.4.2.4.2 Orthotic induced changes in kinematics at the
knee joint
285
5.4.2.4.3 Effect of orthotic intervention on the knee
external adductor moment
287
5.5 Conclusion: Positive effect of combined medial and lateral support 290
6
BIOMECHANICAL INDICATIONS OF MEDIAL KNEE OSTEOARTHRITIS
AND EVIDENCE OF BONE CHANGES ON MAGNETIC RESONANCE
IMAGING
292
6.1 Introduction and Review of Relevant Literature 292
6.1.1 Longitudinal changes to biomechanics for six consistent mature
female participants.
292
6.1.2 Osteoarthritis; a debilitating condition of the knee joint 294
6.1.2.1 The Knee Joint and Articular (Hyaline) Cartilage 294
6.1.2.2 Knee Joint Osteoarthritis Development 295
6.1.3 Epidemiology of Osteoarthritis 297
6.1.4 Biomechanical alignment associated with knee osteoarthritis 297

[10]
6.1.5 Magnetic Resonance Imaging as a method to identify early stage
osteoarthritis
298
6.1.6 Aims and Hypotheses 302
6.2 Methods 303
6.2.1 Participant Selection 303
6.2.2 Magnetic Resonance Imaging 303
6.2.3 Osteoarthritis progression evaluation 303
6.2.4 Correlation Tests 307
6.2.4.1 Correlation of MRI data with Knee Osteoarthritis
Observation Survey
307
6.2.4.2 Correlation of MRI data with age and menopause 307
6.2.4.3 Correlation of MRI Data with Biomechanical Data 308
6.3 Results 309
6.3.1 Participant information 309
6.3.2 Results from the MRI scans 310
6.3.3 Correlation of MRI score with age, KOOS score, and biomechanical
data
317
6.3.4 Reliability test 320
6.4 Discussion 321
6.4.1 Knee joint osteoarthritis evaluation 321
6.4.2 Osteoarthritis among asymptomatic mature female runners 324
6.4.2.1 Osteoarthritis among mature members of the female
population
324
6.4.2.2 Osteoarthritis among runners 324
6.4.2.3 Osteoarthritis and age 326
6.4.3 KOOS scores, osteoarthritis and biomechanical alignment 328
6.4.3.1 Correlation between MRI evidence and KOOS scores 328
6.4.3.2 Correlation between KOOS and knee external adductor
moment
329
6.4.4 Relationship between MRI evidence of osteoarthritis and knee
external adductor moment.
330
6.4.5 Limitations 332
6.5 Conclusion 334
7.
SUMMARY AND CONCLUSION
335
7.1 A Biomechanical Comparison of the Running Gait of Mature and Young
Female Runners
335
7.2 The effect of motion control shoes on the biomechanical running gait of
mature and young female runners
337
7.3 The effect of medial and lateral wedges and an orthotic intervention on the
running gait of mature female runners
339
7.4 The use of MRI scanning to identify osteoarthritis of the knee joint among
mature female runners and associations with the knee external adductor
moment
340
7.5 Summary and future direction 342
APPENDIX
344
REFERENCES
384

[11]
LIST OF TABLES
TABLE. PAGE
Table 3.1 Summary table illustrating the specific running gait variables for analysis. 112
Table 3.2 Presentation of mean group subject information, including KOOS scores. 114
Table 3.3 Results from a one-way ANOVA for group mean KOOS scores. 115
Table 3.4 Statistical output from regression tests between KOOS score for each
subscale and age.
116
Table 3.5 Table displaying kinematic and kinetic group means for each
biomechanical variable assessed during gait.
117
Table 3.6 Tabular presentation of results from a regression analysis between KOOS
score and kinematic variables.
126
Table 3.7 Group means for the knee joint moments (Nm/kg) and occurrence times
(s) calculated throughout the stance phase of running gait. All moments
presented are normalised for body weight.
128
Table 4.1 Demographic information for the two groups, mature and young females,
including KOOS scores.
175
Table 4.2 Description of key running technologies of both Adidas shoes. 176
Table 4.3 Kinematic results for both conditions among the mature and young female
runners.
188
Table 4.4 Tables presenting p values from the variables showing statistically
significant differences.
189
Table 4.5 Statistical output from a two-way ANOVA for the effect of age and
footwear conditions.
195
Table 4.6 Mean knee external adductor moment data, displaying peak values and
moment arm length.
197
Table 4.7 Mean data for knee joint stiffness for mature and young participants in the
neutral footwear condition.
199
Table 4.8 Mean torque generated by the quadriceps for each participant, averaged
from three trials.
201
Table 5.1 Participant information table including 10 km run times and KOOS
scores.
248
Table 5.2 Summary of kinematic values produced by 20 mature female runners. 252

[12]
Table 5.3 Statistical output illustrating results from regression analyses between
each variable and age.
253
Table 5.4 Summary of group means and occurrence time for peak knee external
adductor moment (Nm/kg) and moment arm length (m).
266
Table 5.5 Statistical analysis of difference in knee external adductor moment (a) and
moment arm length (b) between footwear conditions.
267
Table 5.6 Results from a regression analysis of peak moment and moment arm
length.
268
Table 6.1 Mean rearfoot eversion and knee internal rotation angle produced by the 6
participants within each biomechanical investigation.
292
Table 6.2 Table displaying participant information, including date of birth, years of
menopause, and the hormone replacement therapy.
309
Table 6.3 Tables illustrating qualitative results of the MRI scans, with the location
of osteophytes (a), bone oedema (b), beaked tibial spines and (c)
subarticular cysts identified for each female.
313/314
Figure 6.4 Table displaying quantified osteoarthritis results alongside previously
obtained knee external adductor moments.
315
Figure 6.5 Results from correlation coefficient test and regression analysis tests for
MRI results with age, KOOS results, and the knee external adductor
moment (KEAM).
317

[13]
LIST OF FIGURES
FIGURE. PAGE
Figure 2.1 Percentage distribution of activity-related musculo-skeletal injuries
isolated to the lower extremity. Adapted from Hootman et al., (2002).
30
Figure 2.2. Anterior deep view of the knee joint. Source: Adapted from Totora and
Grabowski, (2003).
32
Figure 2.3. Effect of joint compression on articular cartilage; a) excessive
compressive loading causes b) tension stress on the collagen fibres and
matrix. Source: adapted from Norris, (2004).
35
Figure 2.4 Illustration of the Q angle; calculated between the line of quadriceps and
the vertical line through the mid point of the patella. Source: Adapted
from Schumacher, (2012).
43
Figure 2.5 Process of movement produced through transmission of signal from the
central nervous system. Source: Adapted from Vaughn, Davis &
O’Connor, (1999).
47
Figure 2.6 Joint coordinate system for the knee. Source: Adapted from (Robertson,
Caldwell, Hamill, Kamen, & Whittlesey, 2004, p. 52).
54
Figure 2.7 Right limb illustrating the bones at the ankle joint. Source: Adapted from
Totora & Grabowski (2003) p.236.
56
Figure 2.8 Position of the right subtalar joint in weight bearing, showing supination
(a), neutral (b) and pronation (c). Source: Adapted from Norris (2004)
p.182.
58
Figure 2.9 Abduction and adduction of the right foot. Source: Adapted from The
Complete Foot Health Clinic, (2003).
60
Figure 2.10 Illustration of the valgus and varus position of thee knee joints. Source:
adapted from myorthosports.com.
62
Figure 2.11 Oblique view of the femur and tibia with the tibial plateau shaded (a) and
superior view of the knee joint highlighting the position of the tibial
plateau (dotted line) on the condyles during flexion and extension (b).
Source: Adapted from Nordin & Frankel, (1989) p.121.
64
Figure 2.12 Diagram of the body during the stance phase of gait, illustrating the three
components of ground reaction force (dotted line illustrates position of
second leg).
66
Figure 2.13 Sample running ground reaction force traces for the rearfoot striker;
illustrating the three components of ground reaction force. Source:
adapted from Richards, (2008).
67
[14]
Figure 2.14 Free body diagram of the foot and ankle complex, illustrating the forces
acting at the joint during a static position. Source: Kirtely (2006) pp.122.
74
Figure 2.15 A spring-mass model representative of a single linear leg spring,
illustrating “mass” equivalent to body mass or force (σ), deformation of
material (γ), and leg spring (k). Source: Adapted from Butler et al.,
(2003).
79
Figure 2.16 Image displaying microstructure of a single skeletal muscle fiber. Source:
Hargreaves & Hawley, (2003).
82
Figure 2.17 Image of the muscles acting around the knee joint, including the main
contributors of the quadriceps femoris muscle (Source: Totora &
Grabowski, 2003).
84
Figure 2.18 Components of the running shoe. Source: Adapted from Norris, 2004 p.
292.
87
Figure 3.1 Annotated illustration of marker placement along the right lower limb;
both anterior and posterior views. Not to scale.
108
Figure 3.2 Sample vertical force time history. Data taken from subject 19, trial 5. 110
Figure 3.3 Quadriceps angle calculation. 111
Figure 3.4 Line graph illustrating average KOOS scores. 115
Figure 3.5 Graphical representation of the association between individual KOOS
scores and age (mature females).
116
Figure 3.6 Bar chart illustrating mean Q angle data for the two groups, including
standard deviations.
118
Figure 3.7 Sample vertical force ground reaction time history produced by Subject
19 (young) (FzBW).
119
Figure 3.8 Sample bar graph illustrating mean peak vertical force (Fz), peak loading
rate (LR), and significance (p) values for both groups. Data scaled to body
weight.
120
Figure 3.9 Graphical representation of the ankle inversion/eversion angle during
ground contact for subject 14 performing 10 running trials.
121
Figure 3.10 Bar graph illustrating significant difference in rearfoot eversion angle
between the two groups.
121
Figure 3.11 Bar graph illustrating significant difference in knee internal rotation angle
between the two groups.
122
Figure 3.12 Graphical representation of knee internal rotation angle during ground
contact produced by one sample subject from each group over one single
123
[15]
running trial (Trial 5).
Figure 3.13 Ankle dorsiflexion angle throughout the stance phase of gait. Mean data
for subject 5 (mature) and subject 9 (young).
124
Figure 3.14 Dorsiflexion angle traces produced by participant 7 (mature). 125
Figure 3.15 Bar graph illustrating individual mean data for peak ankle dorsiflexion
angle throughout the stance phase of gait.
125
Figure 3.16 Correlation between KOOS score and rearfoot eversion angle (a), and
knee internal rotation angle (b) among mature females.
126/127
Figure 3.17 Correlation between KOOS score and knee external adductor moment. 128
Figure 3.18 Knee external adductor moment acting on the right knee joint. Source:
Adapted from Riskowski, Dufour & Hannan, Current Opinion in
Rheumatology, (2011).
138
Figure 4.1 Load (R) acting through the centre of the knee joint in a neutrally aligned
knee. Source: Maquet, (1984).
150
Figure 4.2 Image of knee joint stiffness in the sagittal plane of movement. Torsional
stiffness calculated as the gradient of the best fit line through the moment-
angle curve, from maximum flexion moment to extension moment. Graph
created from sample data.
153
Figure 4.3 Illustration of the foot-ankle complex at heel strike, indicating the ground
reaction force acting posterior to the ankle joint, and the action of the
tibialis anterior muscle. Image adapted from Kirtley (2006).
165
Figure 4.4 Diagram of the knee external adductor moment acting as a combination of
the ground reaction force and the distance to the knee joint centre.
Adapted from Russell et al., 2010.
170
Figure 4.5 Lateral wedge added to decrease moment arm length at the knee joint, and
reduce the knee external adductor moment. Adapted from Russell et al.,
2010.
171
Figure 4.6 Image of testing laboratory including force platform, timing gates, and the
cameras in view.
178
Figure 4.7 Diagram of the components for moment arm calculation at the right knee.
Image of the lower leg adapted from Hunt et al., (2006).
180
Figure 4.8 Illustration of the lower limb positioning during running, and the
components of knee joint stiffness.
182
Figure 4.9 Sample moment graph illustrating the sagittal plane knee moment over
the stance phase of gait (subject 10, mature).
183

[16]
Figure 4.10 Sample graph illustrating the knee angle throughout the stance phase of
running gait (mean data, subject 6 mature).
183
Figure 4.11 Illustration of a participant seated on the dynamometer, indicating knee
extension movement.
185
Figure 4.12 Bar graphs illustrating difference in rearfoot eversion (a), knee internal
rotation (b) and knee abduction angle (c) between mature and young
females in both footwear conditions.
190
Figure 4.13 Rearfoot eversion graph illustrating mean data from Subjects 6 (y) and 9
(m) in both footwear conditions.
191
Figure 4.14 Graph illustrating mean data for ankle dorsiflexion (a) and knee flexion
(b).
193
Figure 4.15 Sample ground reaction force-time history for participant 19 (m) in
neutral (a) and motion control (b) footwear conditions.
194
Figure 4.16 Sample knee external adductor moment for a mature and young female
performing one running trial in the neutral footwear condition.
196
Figure 4.17 Sample graph illustrating mean knee abduction angle and mean knee
external adductor moment trace produced by Subject 10 (mature) in the
neutral condition.
204
Figure 4.18 Moment arm length calculated throughout the stance phase of gait for
Subject 10 in the neutral condition.
204
Figure 4.19 Sample moment-angle graph for the knee joint during running trials
performed by a mature participant (4) in the neutral condition.
200
Figure 4.20 Sample trace of the sagittal plane knee moment and the knee angle
produced by a mature participant (10) in the neutral condition.
200
Figure 4.21 Scatter diagram illustrating relationship between muscle strength and age
(a) and muscle strength and body mass (b) for the mature females.
202
Figure 4.22 Comparison of the normal and varus aligned knee during gait.
Source: Richards, 2008.
210
Figure 5.1 The external adductor moment acting at the knee joint (right) compared
with “normal” alignment (left). View from the front.
234
Figure 5.2 Illustration of the trainers, foot beds and wedged inserts added to the
shoes. Source: Somnio FEAT system, Inc, 2010.
241
Figure 5.3 Somnio Line-Up Device Procedure, as adhered to in this study. (Somnio
Inc, 2010).
242

[17]
Figure 5.4 Annotated Image of the Somnio Line Up Measuring device and different
foot beds (Somnio Inc, 2010).
243
Figure 5.5 Image of the orthotic intervention, incorporating arch support and lateral
wedge technology. Source: Salfordinsole™
244
Figure 5.6 Line graph illustrating average KOOS results from the mature female
runners.
249
Figure 5.7 Line graph illustrating KOOS scores from mature female runners over
three years.
250
Figure 5.8 Line graph illustrating KOOS scores for the consistent 6 mature female
runners over three years.
250
Figure 5.9 Group mean rear foot angles with changes in footwear condition. 255
Figure 5.10 Mean rearfoot eversion angle data for neutral and orthotic footwear
conditions. Subject 10.
255
Figure 5.11 Scatter diagram illustrating linear relationship between peak rearfoot
eversion angles and age among mature female runners.
256
Figure 5.12 Annotated diagram of the foot abduction angle calculated. Source (foot):
Microsoft Office Clip Art (2011).
256
Figure 5.13 Scatter diagram illustrating positive relationship between foot abduction
and age.
257
Figure 5.14 Mean peak dorsiflexion angle time history produced by subject 7 in all
four conditions.
258
Figure 5.15 Line graph illustrating mean peak knee flexion angle produced by the
mature female runners in all four conditions.
259
Figure 5.16 Knee flexion graph illustrating mean data for Subject 12. 260
Figure 5.17 Diagram illustrating the knee abduction angle calculated. 260
Figure 5.18 Line graph illustrating difference in peak knee abduction between the four
footwear conditions.
261
Figure 5.19 Knee abduction angle line graph produced by Subject 20 in the neutral
and orthotic conditions.
262
Figure 5.20 Line graph illustrating a significant difference between peak knee internal
rotation between the four footwear conditions.
263
Figure 5.21 Knee internal rotation graph representing mean data for the four footwear
conditions (Subject 5).
264

[18]
Figure 5.22 Sample knee external adductor moment graph, illustrating the peak
external adductor moment. Data taken from Subject 9.
265
Figure 5.23 Graphical illustration of relationship between peak knee joint moment and
moment arm length produced by each female in each footwear condition.
268
Figure 6.1 Knee external adductor moment (Nm/kg) produced by six mature
participants across the three biomechanical investigations.
293
Figure 6.2 Adapted simplistic illustration of the right knee displaying osteoarthritic
changes. Source: sportsinjuryclinic.net.
296
Figure 6.3 Deep anterior coronal view of the left knee joint illustrating the distinction
of medial to lateral compartments of the femur and tibia. Picture (knee)
taken from ClipArt, Office Word 2007
304
Figure 6.4 Sample MRI scan of the right knee in the sagittal plane. Diagram
highlights the method of sectioning of the femur, tibia and patella, for
osteoarthritis evaluation. MRI scans taken from the pilot study.
305
Figure 6.5 (a) Sample slice (28) acquired in the sagittal view illustrating the femur,
tibia and patella. Osteophyte highlighted on the posterior tibia (Participant
1). (b) Sample slice (28) acquired in the sagittal view illustrating the
femur, tibia and patella. No features were identified (Participant 3).
310/311
Figure 6.6 Slice acquired in the sagittal view highlighting bone oedema on the
posterior patella (Participant 1).
311
Figure 6.7 Sample graph illustrating the knee external adductor moment produced
during one running stride. Stance phase and measured peak are
highlighted.
316
Figure 6.8 Scatter Diagrams illustrating the relationship between osteoarthritis
present at the knee joint and age (a), KOOS score (b) and the knee
external adductor moment (c) among nine mature females.
318/319
Figure 6.9 Correlation of MRI scores produced on day 1 compared with a second
assessment on day 2.
320

[19]
PUBLICATIONS AND CONFERENCE PRESENTATIONS
Publications.
Lilley, K., Dixon, S., Stiles, V. (2011). A Biomechanical Comparison of the Running Gait of
Mature and Young Females. Gait and Posture, 33 (3), pp. 496-500.
Lilley, K., Dixon, S., Stiles, V. (2011). The Influence of Motion Control Shoes on the
Running Gait of Mature and Young Females. Gait and Posture, Under review.
Presentations.
Presented at European College of Sport Science (ECSS) conference in Portugal July 2008.
Lilley, K, & Dixon, S. (2008). Biomechanical difference in running gait of mature and young
females. Proceedings of ECSS, Portugal.
Presented at Biomechanics Interest Group (BIG) conference in Cardiff, May 2008. Lilley, K.,
Dixon, S., & Stiles.V. (2008). Biomechanical difference in running gait of mature and young
females. Proceedings of BASES, Cardiff.
Presented at Biomechanics Interest Group (BIG) conference in Bath, April 2010. Lilley, K, &
Dixon, S., Stiles, V. (2010). The influence of motion control shoes on running gait in mature
and young females. Proceedings of BASES, Bath.

[20]
LIST OF DEFINITIONS.
TERMINOLOGY DEFINITION
Angular Velocity Rate of change of angular displacement.
Baby Boomers Person born post World War II, between 1946 and 1964.
Calibration Comparison of a measurement to a standard of known
accuracy.
Gait The pattern of movement of limbs during locomotion.
Ground Reaction Force The force exerted by the ground on to a body.
Injury Damage to soft tissue or bone of the musculoskeletal
system.
Insole See footbed. Can be altered to increase cushioning.
Joint Stiffness Relationship between the deformation of a body and a
given force.
Moment A combination of the force applied to a segment, and the
distance to the centre of rotation.
Motion Capture System Combination of cameras and force plates used to assess
human motion.
Muscle Strength Propensity of a muscle to move a limb about a joint.
Orthotic Orthopaedic device designed to support or alter the
alignment of the limb or torso. Lateral wedge
Osteoarthritis A multifactorial degenerative joint disease.
Overuse/Debilitating Condition Degeneration of the bone or articular cartilage.
Plane of Movement
Frontal Longitudinal plane that divides the body into anterior and
posterior sections.
Sagittal Vertical plane that divides the body into medial and lateral
sections.
Transverse Horizontal plane that divides the body into superior and
inferior sections.

[21]
Smoothing Removal of high frequency noise from a data set.
Footwear Variables
Footbed Manufacturer designed lining of shoe.
Orthotic Intervention Full length lateral wedge with medial arch support.
Wedge 6mm (medial/lateral) wedge placed under footbed .
Variables of Gait
Abduction Movement of a limb away from the midline of the body
(frontal).
Adduction Movement of a limb towards the midline of the body
(frontal).
Eversion Lateral tilt of the rearfoot on the oblique axis of the subtalar
joint (frontal).
Extension Movement of a joint causing an increased angle between
two segments (sagittal).
Flexion Movement of a joint causing a decreased angle between
two segments (sagittal).
Inversion Medial tilt of the rearfoot on the oblique axis of the subtalar
joint (frontal).
Rotation Rotation of a segment or joint about a rotation axis
(transverse).
Abbreviations
KOOS Knee Osteoarthritis Observation Survey
MRI Magnetic Resonance Imaging
[22]
ACKNOWLEDGEMENTS
I wish to acknowledge and extend my thanks to all those who have supported me throughout
the course of this research project. A thanks to Dr Sharon Dixon and Dr Vicky Stiles for their
continued support and expert advice throughout each stage. It has been their guidance,
understanding and encouragement that have enabled the completion of each study and paper.
Without their supervision, I would not have been able to explore different areas of the
subject, and learn the intricate aspects involved in the biomechanics of human movement.
A special thanks goes to my family. Without their endless support from day one, I would not
have embarked upon and continued this research project. They have provided the faith and
encouragement needed for me to continue the nine years of study at Exeter University. An
additional thanks to Clare and my friends, who have supported me through each stage.
A thank you also goes to those who have helped with the collection and interpretation of data,
including Dr Peter Shranz, for giving up his time to share his knowledge of knee joint
osteoarthritis. And finally, to all the women from Exeter Women’s Running Network, who
have given up their time and energy to volunteer for participation. Without their enthusiasm
and willingness this project would not have been possible.

[23]
Chapter 1. Introduction.
Exercise is defined as a form of physical activity that is planned, structured, repetitive, and
purposeful in the sense that improvement or maintenance of one of more components of
physical fitness is the key (Caspersen, Powell, & Christensen, 1985). Running is one form of
physical activity that is commonly undertaken regularly, with the intent to improve
cardiovascular fitness (Dunford & Doyle, 2011). In the spring of 2011, approximately 36,000
people took part in the London marathon, an increase from the 6,255 that completed the
inaugural marathon in March 1981. Running as a recreational activity, appeals to all ages and
genders across the world. Despite the fashion associated with recent gym based activities
such as aerobics and dance related exercise classes, running still holds the interest of a large
proportion of the population.
Regular participation in running has been proven to increase cardiovascular health, and
decrease the risk of developing pathological conditions such as diabetes and psychological
distress linked with depression (Thompson, Buchner, Pina, Balady, Williams et al., 2003;
Knowler, Barrett-Connor, & Fowler, 2002; Pollock, 2001). Although popular among people
of all ages, a particular group is becoming ever prevalent among the cohort of runners. In
previous years, female runners comprised only 5 % of the population of runners, but with
increasing popularity, the year 2008 showed this number to reach 50 % (Barrios, 2008).
Furthermore, this increasing female cohort of runners has caused a re-characterisation of the
sport, with fashion taking a headline in the industry almost to the exclusivity of males
(Barrios, 2008).
With the baby boomers reaching retirement age and the mean age of the population
continuing to increase, the popularity of running has expanded across all ages (Fukuchi,
Eskofier, Duarte, & Ferber, 2011; Nigg, Fisher, & Ronsky, 1994). Due to its record of
success both in weight loss, and stress relief, this particular sport is specifically becoming
ever popular among the more mature generation of females. According to Barrios (2008), the
pressure of creating balance between career, family, and health has caused running to be a
“saving grace” for the more mature members of the female population; requiring minimal
time, instruction, equipment, and economic expenditure (Barrios, 2008, pp.3).
Despite these benefits of running, according to Galloway (2005) the endorphins and “attitude
boost” associated with this activity often drives the individual to ignore the early warning

[24]
signs of an injury or debilitating condition, until one erupts (Galloway, 2005; pp.201). The
increasing number of people that take part in recreational and competitive physical activity
has lead to a corresponding increase in the number of running related injuries and overuse
conditions (Van Middlekoop, Kolkman, Van Ochten, Bierma-Zeinstra & Koes, 2008). In a
systematic review of seventeen reports regarding lower extremity injuries and conditions,
Van Gent (2007) reported the average incidence to range from 19.4 % to 79.3 %. These
injuries and conditions present in a spectrum of severity, ranging from inflammation and pain
to structural degeneration, with the knee joint the most common site for occurrence
(Hootman, Macera, Ainsworth, Addy, Martin, & Blair, 2002). Among those sustained by
runners, patellofemoral pain syndrome, shin splints, stress fractures, plantar fasciitis and
osteoarthritis are among the most common, many appearing to be more common among
women, and increase in prevalence with advancing age (Taunton et al., 2002).
Injuries and overuse conditions sustained by runners are often severe enough to cause a
significant decrease or even cessation of training, and it has been reported that 12 to 44 %
require medical attention (Brunet, 1990; Koplan et al., 1995). As one of the most common
and disabling degenerative conditions, knee joint osteoarthritis has received a great level of
attention within the literature. Knee joint osteoarthritis is considered to be twice as common
among females when compared to males, and is known to substantially increase with age
(Ballinger & Patchett, 2000). This suggests that the specific group of mature females is at a
high risk of the condition.
Knee joint osteoarthritis is a degenerative disease of the articular cartilage, characterised by
pain, inflammation and changes to the morphology of the joint that affects an abundance of
people worldwide. Previously, radiographic techniques have been the primary method for
identification of osteoarthritis; however more recently magnetic resonance imaging
techniques have been considered to be superior (Cicuttini et al., 2004). In clinical settings, a
range of surveys have also been validated to assess early signs of the condition (Roos and
Toksvig-Larsen, 2003). Although the definitive causative factors and pathophysiology of
knee joint osteoarthritis have not been confirmed, a clear association has been made between
the biomechanical variable of knee external adductor moment and the initiation, development
and progression of the condition (Hurwitz et al., 2000). As such, the use of techniques to
assess biomechanical components of gait can be employed to investigate this condition
among specific groups of runners.

[25]
Although the link between physical activity rates and the development of lower extremity
injuries and conditions appears equivocal, it has been acknowledged that certain
biomechanical variables during gait can predispose to the development of degenerative
changes. During running, the movement of rearfoot eversion or subtalar joint pronation has
received an increasing amount of interest among the biomechanical research community. It
has been shown that a coupling action occurs between rearfoot eversion and internal rotation
of the tibia and knee joint; both of which can predispose to injuries and debilitating
conditions in the lower extremity (O’Connor & Hamill, 2004).
A fundamental method of limiting the rates of injury and development of overuse conditions
is considered to be the application of suitable running footwear (Clarke et al., 1983). As such,
the main item of equipment required for most runners is a suitable pair of running shoes. The
concept of the athletic shoe was not considered until the American inventor Charles
Goodyear patented the process of vulcanization of rubber. Since then, an abundance of
designs and styles have become available, and highlighted by the vast number of
advertisements in the sports magazines (for example, Runners World, Women’s Running).
One of the main concepts in running shoe design is the prevention and management of these
sports injuries and debilitating conditions among runners. The idea behind these designs lies
in the desire to ensure normal foot movement is achieved during the ground contact phase of
running. Commonly, footwear attempts to control rearfoot eversion during running. Based on
limited knowledge, an increasing number of people are under the impression that pronation is
dangerous to runners, and many runners are purchasing trainers based on self diagnosis from
uninformed internet sites. It is important to remain aware that subtalar joint pronation is a
natural and essential motion required for normal biomechanics during gait. However, an
excess of this motion has been linked with increased and uneven distribution of load on the
structures of the lower extremity.
Although not unanimous in effectiveness, modifications to footwear have been described in
the literature as an injury management strategy. Both wedging of the medial and lateral soles
have been investigated in relation to injuries and conditions associated with subtalar joint
pronation and the knee external adductor moment respectively (Clarke, Frederick & Hamill,
1983; Nester, Linden Bowker, 2003). However, these results have been disputed, and other
researchers have suggested little effect of footwear modifications on the biomechanics during
gait (Nigg et al., 1994).
[26]
It is suggested that alterations in footwear and orthotic design may have an influence on the
running gait of mature female runners. Due to the high level of injuries and debilitating
conditions such as knee joint osteoarthritis among this group, it is deemed important to
investigate possible prevention methods. Currently, a proliferation of the research regarding
footwear interventions have involved previously injured individuals, and therefore
controversy exists as to the cause-consequence relationship between the biomechanics of
running gait, footwear and the development of debilitating conditions at the knee joint.
The aim of this research thesis is to investigate gait patterns among mature female runners, to
ascertain whether changes occur with age that could place this group at an increased risk of
injuries and conditions. Certain footwear interventions will be investigated, to identify
whether specific adaptations to the sole of the shoe may be suitable in the management of
injuries and conditions for this particular group of runners.
Within this research project, an extensive review of the relevant literature is presented in
Chapter 2, with specific focus on the topics that lead to the investigation of running injuries
and conditions among mature female runners. The first study presented in Chapter 3
illustrates a direct comparison between the running gait of mature and young females, with a
desire to further expand on the current theories regarding biomechanical changes with age,
and the association of gait variables with injuries and debilitating conditions.
Chapter 4 presents an investigation of the effectiveness of motion control shoes to produce
modifications in the running gait of mature and young females. This was performed to
increase the knowledge regarding motion control shoes in potential injury prevention and
management, and to assess the ability of footwear to alter biomechanics among mature
female runners.
The third study is presented in Chapter 5, with a range of wedges and an intervention orthotic
assessed. Each footwear condition was selected based on the previously illustrated pattern of
running gait specific to mature female runners, with the intention of highlighting possible
injury management techniques. An MRI study is presented in Chapter 6; performed to
investigate the association between mature female runners and the signs of knee joint
osteoarthritis development that formed the basis of this research project.

[27]
Chapter 2. Literature Review.
“We are under exercised as a nation. We look instead of play. We ride instead of walk. Our
existence deprives us of the minimum of physical activity essential for healthy living”
John F. Kennedy (1917-1963).
2.1. Running: An Ability, A Sport, A Risk.
2.1.1. Human gait and the ability to run.
In today’s society, a main challenge faced by the Department of Health is the growing
epidemic of obesity, with the latest Health Survey for England (HSE) data showing nearly 1
in 4 adults are categorised obese (Department of Health, 2011). Similarly, the cost of obesity
to the National Health Service is estimated at £4.2 billion, and is forecast to double by the
year 2050 (Department of Health, 2011). This has lead to considerable media attention on the
wider health risks of the sedentary routine led by many (Rose, Birch, & Kuisma, 2011).
Habitual physical activity is therefore recognised as an important component of a healthy
lifestyle, and running, as an accessible basic exercise, can be practised by almost any living
human (Armstrong, 2007).
Today, millions of people run for the extensive benefits associated with the sport, including
cardiovascular fitness and social expansion, and in the year 2008, over 34,000 people finished
the London Marathon (Gifford, 2008). Regular participation in running causes a long term
improvement in the circulatory system, with a decrease in resting heart rate and blood
pressure, and an increase in stroke volume (volume of blood pumped with each heart beat)
(Davis, Bull, Roscoe & Roscoe, 2000). Furthermore, regular participation in running
improves muscle strength, increases cognitive functioning, and decreases the chance of
psychological stress disorders (Weinberg & Gould, 2010).
Although the ability to run is an inborn quality among many, this skill requires the input of a
variety of sources (Hawley, 2000). These include a talent for running, systematic coaching,
adequate lifestyle habits, and most importantly an understanding of the body’s systematic

[28]
functioning (Hawley, 2000). For running to be accomplished, a combination of actions from
the body’s systems is required, including the cardiovascular, digestive and endocrine systems.
Additionally, a main factor that determines the ability of an individual to perform
successfully is the human musculoskeletal system, which produces the process of running
gait. Although the jointed lower limbs of most living humans are capable of a broad range of
muscle-use and gait patterns, they generally prefer only two; walking and running (Srinivasan
& Ruina, 2006). Running is accessible to most people, and with minimum equipment
required, is the sport of choice for a large proportion of the population (Taunton, Ryan,
Clement, McKenzie, Lloyd-Smith, & Zumbo, 2002).
2.1.2. Incidence of running related injuries and debilitating conditions.
According to Dishman and colleagues, an active lifestyle including regular running in
comparison to sedentariness, is associated with a lower risk of premature death and
developing chronic diseases such as coronary heart disease (Dishman, Washburn, Heath,
2004). However, it has been suggested that although a worldwide participation rate in
running has been reported as 54.8%, the incidence rates of running related musculoskeletal
injuries ranges from 19.4-79.3%. (Van Middlekoop, Kolkman, Van Ochten, Bierma-Zeinstra
& Koes, 2008; Van Gent, Siem, Van Middlekoop, Van Os, Biernma-Zienstra & Koes, 2007).
These injuries are commonly categorised into one of two groups; acute or chronic. Acute
injuries occur from a single event where as chronic injuries tend to occur over time (Noakes
and Granger, 1996). For the purpose of this thesis, the latter form is focussed upon, although
both are initially considered.
Definitions of running injuries tend to differ between studies in the literature, and therefore
make direct comparisons difficult (Van Gent et al., 2007). In general, running related injuries
are most commonly soft-tissue injuries and stress fractures. In contrast, degeneration of the
bone and articular cartilage is referred to as an over use, degenerative or debilitating
condition (Van Gent et al., 2007). The cause of these running-related injuries and the
development of running-related debilitating conditions have however both been subject to
extensive research, with a variety of factors identified as risks (Chang, Shih, & Chen, 2011).

[29]
These include training errors, previous musculoskeletal injuries, incorrect shoe choice and
malalignment (Lohman, Sackiriyas, & Swen, 2011). Training errors can be identified from an
extensive knowledge of history, and commonly involve a sudden increase in mileage or
intensity of training, or a change in environment, limiting the ability of the musculoskeletal
system to adapt to the altered terrain (Migliorini, 2011). Similarly, an insufficient recovery
period, or a lack of variation in training can often add to an individual’s injury risk in the
form of training errors (Hutson and Speed, 2011). Previous musculoskeletal injury has also
been described as a risk factor, due to a compromise in the condition of the joint or muscle.
Among football players, previous hamstring, groin or knee joint injury instigated a three
times increase in the likelihood of sustaining an identical injury in the following season, and
among long distance runners, a lower limb injury sustained previously was significantly
correlated with its reoccurrence over time (Hagglund, Walden & Ekstrand, 2006;
Middlekoop, Kolkman, Ochten, Bierma-Zeinstra, Koes, 2008).
Training errors and previous injury are examples of extrinsic and intrinsic risk factors
respectively. Footwear and malalignment of the lower extremity are two more risk factors,
similarly categorised as extrinsic and intrinsic factors respectively. However these two are
linked, with appropriate footwear being frequently prescribed as a method of correcting
biomechanical abnormalities during gait. The role of footwear in injury incidence and
prevention is discussed in detail in a later chapter (4.2.7).
2.1.3. Location of running related injuries and debilitating conditions: the knee joint.
The dispersion of running related injuries is not even among the joints and muscles of the
lower limb (Dishman et al., 2004). Figure 2.1 illustrates the percentage distribution of
running related musculoskeletal conditions by lower limb body part among women. Injuries
sustained to the upper body (32.6 %) are discounted.

[30]
Figure 2.1. Percentage distribution of activity-related musculo-skeletal injuries isolated to the
lower extremity. Adapted from Hootman et al., (2002).
According to Hootman and colleagues, the knee joint is the most common site for running
related injuries, sustaining 22.3% of all injuries to the body, calculated from a sample of 260
active females (Hootman, Macera, Ainsworth, Addy, Martin, & Blair, 2002). This was also
supported by Taunton and colleagues, who assessed running related injuries over a two year
Foot (15.7%) Achilles Tendon (0.4%)
Quadriceps (2.9%)
Hip (6.6%)
Knee (22.3%)
Hamstrings (5.4%)
Calf (2.1%)
Ankle (8.7%)
Shin (3.3%)

[31]
period, and showed the knee joint to be the most common site for injury, accounting for 43.1
% of all injuries recorded (Taunton et al., 2002).
2.1.3.1. Anatomy of the knee joint.
The knee is the largest, most easily accessible, and one of the most complex joints in the
human body (Logan & Rowe, 1994). Figure 2.2 illustrates a deep anterior view of the knee
joint (Totora & Grabowski, 2003). Knowledge of the anatomy of the knee joint is paramount
to understand the biomechanical function during gait, and mechanisms of knee injuries and
conditions. Figure 2.2 illustrates the general basic anatomy of the joint, highlighting the
major bones and ligaments. There are four major bones and two main joints at the knee; the
patellofemoral joint and the tibiofemoral (Arokoski, Jurvelin, Vaatainen, & Helminen, 2000).
The patellofemoral joint includes the intermediate articulation between the femur; the longest
bone in the human body, and the patella; the largest sesamoid bone. At the tibiofemoral joint,
the medial and lateral distal femoral condyles articulate with the corresponding plateaus of
the tibia; the second longest bone in the human body (Logan & Rowe, 1994). The fibula is
the fourth bone that articulates at the knee joint, positioned behind the lateral condyle of the
tibia and acting as a site for the attachment of muscles and the lateral collateral ligament
(Logan and Rowe, 1994).
Ligaments are present at the knee joint to restrict excessive knee excursion and maintain
stability during stance and movement (Rybski, 2004). The two major ligaments are the
cruciate ligaments, which join the femur and tibia within the articular capsule of the joint
(Moore & Agur,1995). The anterior cruciate ligament (ACL) arises from the anterior
intercondylar area of the tibia and extends superiorly, posteriorly and laterally to attach to the
posterior lateral condyle of the femur. During knee extension, the ligament is taut, preventing
posterior displacement of the femur on the tibia and hyperextension of the knee joint (Moore
& Agur, 1995). Conversely, the posterior cruciate ligament (PCL) is the stronger of the two,
and is the primary restraint to posterior movement of the tibia on the femur. It arises from the
posterior intercondylar tibia, passing on the medial side of the ACL extending superiorly and
anteriorly to attach to the medial femoral condyle (Rybski, 2004).

[32]
The two collateral ligaments, the medial collateral ligament and the lateral collateral ligament
(MCL and LCL) resist movement in the valgus and varus directions respectively. When the
knee is in the position of full extension, these two ligaments are taut, assisted by the
posteromedial and lateral joint capsules, making extension the most stable position of the
knee joint (Rybski, 2004). The iliotibial band (ITB) is a combination of the gluteus maximus
and tensor fascia lateral tendons, and crosses the knee in the area of the lateral femoral
condyle to insert to the Gerdy’s tubercle (bony prominence just inferior and anterior to the
lateral condyle of the tibia) (Behnke, 2006). This structure is also involved in controlling the
flexion-extension movements of the knee joint.
Figure 2.2. Anterior deep view of the knee joint. Source: Adapted from Totora and
Grabowski, (2003).
Patella surface of femur
Medial meniscus
Medial collateral ligament
Tibia
Fibular
Lateral collateral ligament
Lateral meniscus
Lateral femoral condyle
Anterior cruciate ligament
Posterior cruciate ligament
Medial femoral condyle

[33]
As well as ligaments, a variety of tendons and muscles are involved in the function of the
knee joint. Although approximately thirteen muscles act across the knee joint, most can be
categorised into one of three main groups; the quadriceps, the hamstrings, and the calf
muscles (Eaves, 2010). The tendons act to attach muscles to bone, and transmit the forces
produced by the muscle groups across the joint. As shown in Figure 2.2, the knee joint also
contains cartilage. The menisci are wedged-shaped cross sectional fibrocartilage structures
that rest on the tibia at the anterior and posterior condyles (Norris, 2004). These structures
receive blood flow from the genicular arteries and by adult hood, 10 – 25 % of the periphery
of the meniscus is vascular. The menisci enable a better fit between the uneven shapes of the
articulating bones of the knee joint, improving the bony correlation and shock absorption
(Eaves, 2010).
Compared to fibrocartilage of the menisci, the articular cartilage is a soft tissue located at
ends of bones; present to enable even distribution of forces and frictionless movement at the
joint (Andriacchi, Mundermann, Smith, Alexander, Dyrby, & Koo, 2004). Articular cartilage
is composed of chondrocytes within an organic matrix consisting of collagen fibrils (Fullick,
2000). The elastic characteristic of articular cartilage enables it to endure compressive forces
and prevent wear of the articulating joint (Fullick, 2000). Detail regarding the internal
structure and degradation of articular cartilage is described in a later section (2.1.4.1).
2.1.4. Conditions affecting the knee joint.
As described previously, injuries and conditions at the joints are commonly classified as
either acute or chronic. Although acute injuries often occur and can result in debilitating
consequences, this research thesis has focussed on the latter. A range of chronic conditions
are known to affect the knee joint, including patella femoral pain syndrome, iliotibial band
friction syndrome, meniscal injuries and osteoarthritis (Taunton et al., 2002). Various risk
factors have been associated with many of these conditions, including gender, age,
biomechanical alignment, and muscular functions. The influence of each factor is discussed
in later sections.

[34]
2.1.4.1. Knee joint osteoarthritis.
As one of the most common conditions to present at the knee joint, osteoarthritis is given a
particular focus within this thesis. Osteoarthritis is the degenerative disease of the joint; a
process that involves the gradual loss of joint cartilage and changes in bone morphology
(Totora & Grabowski, 2000). As the prevalence of knee osteoarthritis is expected to increase
substantially with the aging of the baby boomers, it is important to understand the factors
associated with knee osteoarthritis that may contribute to disability (Oatis, Wolff & Lennon,
2006). Osteoarthritis is commonly viewed as a disorder of cartilage and subchondral bone
that results in a clinical syndrome of symptoms evolving from pathophysiologic changes
within the joint (Dixon, Hinman, Creaby, Kemp, & Crossley, 2010).
Articular cartilage is a unique tissue with viscoelastic and compressive properties. Normal
articular cartilage consists of a hydrated extracellular matrix containing non collagenous
proteins, synthesised and maintained by a sparse population of specialised cells; the
chondrocytes (Moskowitz, Altman, Hochberg, & Goldberg, 2007). The chondrocytes exist
singularly or in groups, with spaces between them known as lacunae in the matrix. Although
the weakest form of cartilage in the body, articular cartilage is flexible, allowing the bones to
grow, and provides support at the articulating joints (Totora & Grabowski, 2003).
The extra cellular matrix of this cartilage is maintained in homeostatic balance by the
catabolic and anabolic activity of the chondrocytes. Healthy articular cartilage in adults
functions under a range of loading situations; although a change above or below the coping
strategies of the cells may lead to cartilage degradation. Previous studies have supported this,
suggesting that the loading environment of the joint is vital in maintaining activity of the
chondrocytes. Griffin and colleagues highlighted the importance of loading for chondrocytes
activity through in vivo assessment, and Arokoski and colleagues showed through an in-vitro
epidemiological study, that moderate loading is vital in maintaining healthy cartilage (Griffin
and Guilak, 2005; Arokoski, Jurvelin, Vaatainen, & Helminen, 2000). This theory is
supported by Carter and colleagues who suggested that articular cartilage is healthiest when
contact pressure and cartilage fluid pressure are high, although excessive and repetitive
mechanical loading causes the initiation of articular cartilage degeneration (Carter, Beaupre,
Wong, Smith, Andriacchi & Schurman, 2004). The effect of loading on cartilage form is
illustrated in Figure 2.3.

[35]
a)
Figure 2.3. Effect of joint compression on articular cartilage; a) excessive compressive
loading causes b) tension stress on the collagen fibres and matrix.
Source: adapted from Norris, (2004).
Although the pathogenesis of osteoarthritis remains unknown, it is commonly suggested that
the condition is characterised by an imbalance between the anabolic and catabolic activities
of cartilage cell population, with secondary inflammatory changes to the synovium and
articular cartilage itself (Moskowitz, Altman, Hochberg, & Goldberg, 2007). Anabolic
activities involve a construction of molecules from smaller units, whereby the enzymes cause
Tension stress
on collagen
Collagen fibre
Mucopolysaccharid
– water matrix
Deformation
Sub-chondral
bone
Surface layers Excessive Compressive Loading
b)
Compression

[36]
the chondrocytes to form cartilage. An excess of proteoglycan and collagen molecules then
cause extra fluid to be diffused into the joint, diluting the chondrocytes, and causing the
cartilage to be depleted. Conversely, catabolic activity involves an excess of destructive
enzymes in the matrix, causing weakened collagen and lack of proteoglycans (Fox, Taylor,
Yazdany & Brewer, 2006). Articular cartilage is formed from polymers, and as soon as
degradation occurs, the bonds forming the polymer chains are destroyed, giving the condition
it’s predominantly irreversibly nature (Sabatini, Pastoureau, & De Ceuninck, 2004). Although
cartilage repair and growth is possible, ostensibly cartilage is a metabolically inactive
material, with limited blood supply and substances for repair. As such, the repair process
requires blood cells to diffuse into the cartilage (Totora & Grabowski, 2003).
Although cartilage must be exposed to loading in order to maintain healthy operation, it has
been suggested that excessive load, or an uneven distribution of load at the knee joint may
instigate irreversible changes to the cartilage of the articulating joint (Roemhildt, Coughlin,
Peura, Fleming, & Beynnon, 2006). During running, loads equalling between 1.5 and 5 times
body weight are attenuated throughout the each leg during the stance phase of gait (Hreljac,
2004). As such, it could be considered that excessive impact forces attained during running
could have a negative effect on the articular cartilage. The earliest studies involving animal
models have shown mixed results, with running producing both minimal effects and harmful
changes to articular cartilage.
According to Burton-Wurster and colleagues, compressive loads increasing from 0.025 to 1.2
MPa (mega pascal; unit of internal pressure) applied to canine articular cartilage over an 18
hour period caused a non linear inhibition of protein synthesis which would decrease enzyme
concentration, limit the number of polymer chains formed and alter the assembly of the
cartilage inner-structure (Burton-Wurster, Vernier-Singerm Farquhar, & Lust, 1993;
Motaung, & Pieterse, 2011). However, it was also shown that intermittent loading of this
cartilage partially prevented the increase in water content in the cartilage, suggesting that
intermittent loading may help to maintain normal cartilage composition (Burton-Wurster et
al., 1993). Roemhildt and colleagues supported the suggestion that high loads cause
degenerative changes to articular cartilage in an investigation among rabbits (Roemhildt, et
al., 2010). An in-vivo procedure illustrated a significant increase in permeability of articular
cartilage with loads increasing from 0% increase in body weight to a 22% and 44% increase
in body weight. Increased permeability represents decreased proteoglycan content in the

[37]
cartilage. This was also supported by the increase in cartilage thickness, which occurs from
the swelling of the matrix, decrease in proteoglycan content, and disruption of the collagen
fibres that resist the swelling pressure (Roemhildt et al., 2010). It was however noted here
that these changes were site specific, and certain areas of the knee joint were more greatly
affected when compared to others (Roemhildt et al., 2010).
Zhang and colleagues similarly showed changes to the articulating joint and cartilage
structure, when loads of up to 17 MPa were applied to the joints of rabbits (Zhang, Vrahas,
Baratta, & Rosler, 1999). In contrast, Borelli and colleagues also investigated the cartilage of
rabbits, and showed single impacts of up to 55 MPa did not produce any significant change or
signs of damage to the tissue, including enzyme activity, changes in proteoclycan
concentration, or collagen breakdown (Borrelli, Zhu, Burns, Scandell, & Silva, 2004).
The equivocal results regarding loading effects on articular cartilage have contributed to the
lack of definition for the pathogenesis of osteoarthritis. However it is reasonable to assume
that abnormal loads are a likely primary component of the pathogenic mechanism of knee
joint osteoarthritis. As well as magnitude of load, joint malalignment modifies the inter-
segmental compressive loads across the articulating joint, and has been shown as a primary
risk factor for development of osteoarthritis (Felson, Anderson, Naimark, Walker, & Meenan,
1988). As such, biomechanical factors can create loading situations that may increase load on
specific areas of the knee joint and articular cartilage. Commonly, it is suggested that factors
such as age, gender, strength and reduced joint range of motion (stiffness) can contribute to
the susceptibility of the condition, and although many may act in combination, identifying the
contribution from individual factors is helpful in isolating specific populations that are more
prone to the condition. Each factor is discussed in detail in the following sub chapters.

[38]
2.2. Mature Female Runners.
Advances in health and medical services has lead to overall longer life expectancy (Kim,
Lochart, & Yoon, 2005) and a greater proportion of mature people taking part in regular
physical activity (Henriksson & Hirschfeld, 2005). However, a selection of studies has
considered age as a risk factor for the development of injuries or joint conditions such as
osteoarthritis (Fukuchi, Eskofier, Duarte, & Ferber, 2011). According to Bus (2003), the
greater incidence of injuries and conditions among this specific active group may be due to
age related changes in musculo-skeletal properties such as strength or joint stiffness, or
biomechanical movement patterns during gait.
2.2.1. Age related changes of the musculo-skeletal system.
Increasing age is not merely a passage of time, but a manifestation of biological events that
occur over a period of time (Robergs & Ketyian, 2003). Physiologically, certain changes
occur with increasing age, including a reduction in maximal oxygen uptake during exercise
(VO2max) of 8% to 10% per decade after the age of 30 years (Robergs & Ketyian, 2003).
This is supports McArdle, Katch and Katch (2001) who showed average VO2max scores as
31 to 38.9 mL.kg-1
.min-1
for females aged at or below 29 years, and 21 to 32.9 mL.kg-1
.min-1
for those aged 60 to 69 years. As VO2max is defined as the maximal rate at which the body
can absorb oxygen during exercise (Robergs & Ketyian, 2003), this suggests that changes
occur to the physiological system; the ability of the muscles to use available oxygen and the
combined ability of the cardiovascular and pulmonary system to transport oxygen in the
blood may reduce with age.
Advancing age is also known to instigate changes in the structure of bone, ligaments and
tendons. As age increases, longitudinal trabaculae bone becomes thinner, and transverse
trabaculae bone is resorbed (Nordin & Frankel, 1989). These result in a marked decrease in
cancellous bone and a thinning of the cortical bone, in turn increasing the relative brittleness
and limiting the energy storing capacity. These changes commonly occur first at the head of
the femur, leading primarily to changes in hip function (Nordin & Frankel, 1989). A decline

[39]
in bone mineral density has been shown among men and women aged 55 years and over, with
significantly greater decline in bone mineral density of the femoral neck among women
compared to males (Burger, Van Daele, Algra, Ouwelan, Grobbeem Hofman et al., 1994).
This suggestion of gender related differences in the reduction of bone mineral density with
age was also supported by Lim and colleagues, who stated that body composition changes
with age differ between males and females, altering the changes to bone structure and
function (Lim, Joung, Shin, Lee, Kim, Shin, Kim, Lim & Cho, 2004).
As well as age related changes to the bone structure and function, certain alterations occur in
the composition of tendons and ligaments within the body. According to Nordin and Frankel
(1989), up to the age of 20 years, the number and quality of cross links within and between
the collagen molecules of the tendons and ligaments steadily increases, producing an increase
in the tensile strength of the structure. However, after maturation there is a plateau in the
structure of the tendon or ligament, followed by a slight decline in the mechanical properties
and the ability to withstand deformation during loading (Nordin & Frankel, 1989). This
notion is supported by Baratz and colleagues who suggested that although biochemical
analyses have not definitively shown dramatic age related changes in tendon or ligament
matrix composition, the collagen and water composition tends to decline as the collagen cross
links decrease in number and mechanical adaptation to load is compromised (Baratz, Watson,
& Imbriglia, 1999).
Due to the invasive nature of monitoring ligament and tendon internal structure over time, the
majority of research that has lead to these conclusions is based on studies involving animals.
Woo and colleagues investigated changes in the medial collateral ligament among rabbits
over a period of time, and showed a reduction in tensile strength of the structure at 18 months
compared with that measured at 12 months (Woo, Ohland & Weiss, 1990). Similarly, Smith
and colleagues showed tendons in older horses were less able to respond to exercise training,
compared to tendons in younger horses that demonstrated an increase in fibril diameter and
distribution (Smith, Birch, Patterson-Kane, Firth, Williams, Cherdchutham, Weeren, &
Goodship, 1999). Noyes and Grood (1976) also showed the anterior cruciate ligaments from
middle aged and elderly humans (48-86 years) failed by avulsion or detachment of the bone
under the ligament insertion site more frequently than the same ligaments from younger
humans (16-26 years).

[40]
2.2.2. Age related changes to gait.
Although many of the more mature members of the population are taking part in recreational
and competitive running (Fukuchi et al., 2011), previous studies analysing gait changes with
age have predominantly involved males during walking activities (Nigg, Fisher & Ronsky,
1994). Similarly, many have enabled a self selected walking pace to be analysed, and as gait
speed and subsequent joint and segment velocities influence kinematic variables, these may
not show a true reflection of age related changes in biomechanics (Hagerman & Blanke,
1986).
Grabiner and colleagues investigated differences in gait patterns of two groups of walkers
(72.13 ± 3.96 years; 25.06 ± 4.02 years) and showed the only age related difference in gait to
be an increased variability in stride width among the older group (Grabiner, Biswas &
Grabiner, 2001). An earlier study investigating walking gait changes among young (23.9 ±
3.6 years) and mature (66.9 ± 7.6 years) women however showed the elderly group to display
significantly smaller stride length, reduced ankle range of motion, and reduced pelvic
obliquity (axial tilt) than the younger group (Hagerman, & Blanke, 1986). It was however
noted that the speed selected by the younger group was significantly faster than that of the
elderly group and no screening occurred to negate the possibility of a pathological condition
that may have affected gait. Marigold and Patla (2008) showed a similar decrease in gait
speed among a group of more mature walkers (74.1 ± 7.2 years) compared to a younger
group (26.1 ± 5.2 years), and a shorter stride length. This concept was highlighted by Nigg
and colleagues who suggested that decrease in walking speed commonly seen among the
more mature members is associated with a reduction in step length as opposed to cadence
(number of steps per unit of time) (Nigg et al., 1994). Additionally, Marigold and co-workers
showed increased medial to lateral acceleration of trunk centre of mass, and increased trunk
roll among the more mature group, suggesting decreased stability compared to the younger
group (Marigold & Patla, 2008).
Although not extensive in the research literature, changes in joint angles with age have been
shown among the more mature members of the population. As suggested previously,
Hagerman and Blanke (1986) showed significant reductions in ankle range of motion among
elderly women during walking gait, which supports the earlier work of Murray and
colleagues, who showed decreased heel rise and ankle extension among males at the end of

[41]
stance phase of gait (Murray, Kory, & Clarkson, 1969). Nigg and colleagues showed
significant changes in gait pattern with increasing age, and interpreted these as a consequence
of changes in muscle strength in individuals over the age of 50 years (Nigg et al., 1994). In
one investigation, a reduction was demonstrated in ankle range of motion, and an increase in
the inversion-eversion passive range of motion, combined with increased foot abduction
among the mature group (Nigg et al., 1994).
In a later study of age related changes in running gait, Fukuchi and Duarte (2008) illustrated
mature runners (67 – 73 years) to show significant decreases in knee range of motion in the
sagittal plane and significant increase in foot abduction (toe-out) angle compared to a group
of younger runners aged 26 – 36 years. This was later supported by Fukuchi and colleagues
who showed a similar discrepancy in knee flexion range of motion between male runners
aged between 69 ±2 years and 31 (±6) years (Fukuchi et al., 2011). The combination of
research suggests that gait related changes occur with age in walking and running. However
increased research is required to assess the changes during running, with speed of gait
controlled to eliminate possible variation in self selected running speeds between age groups.
2.2.3. Gender differences in gait and injury risk.
In addition to age, gender is considered to have an effect on an individual’s risk of
developing a running related injury or condition. According to Taunton and colleagues, when
compared to males, females are twice as likely to sustain certain running related injuries and
debilitating conditions (Taunton et al., 2002). It has been postulated that this could be due to
differences in musculoskeletal structure and function during gait (Ferber, McClay, Davis, &
Williams, 2003). Obvious anatomical and less obvious physiological differences exist
between males and females, both of which often favour males in the performance of sports
and physical activity that requires strength and size (Armstrong, 2007).
Many of the differences that exist between males and females can be attributed to the average
increased size of physique of the male in comparison to the female physique. Often, when
variables are corrected for or scaled to size, these changes are markedly reduced or abolished
(McKean et al., 2007). Although changes between males and females occur during puberty or

[42]
maturation, in adulthood, differences in bone mass are suggested to occur as a result of the
physically smaller female skeleton. According to Brukner and Khan (2006), a physiological
difference exists in body fat composition, where average values for males and females are 14
% and 26 % respectively. This is combined with relatively less muscle mass among females.
This difference is due to the levels of the female hormone oestrogen, which causes fat to be
deposited at certain anatomical sites such as the hips and thighs (Martin & Gerstung, 2005).
Under the influence of the male hormone testosterone, males have a wider shoulder girdle,
narrower pelvis and longer limbs compared to females. One of the main biomechanical
differences between males and females is therefore the quadriceps angle (Q angle). This
angle is created by the wide pelvis relative to shorter femur length in the female body, and is
commonly associated with a varus (abducted) position at the hips, anteversion (forward
rotation) of the femoral head and valgus (adduction) at the knees (see Figure 2.4) (Norris,
2004; Arendt, 1994). The Q angle is created between the force line of the quadriceps muscle,
and the line of pull of the patella tendon (Comfort, & Abrahamson, 2010). Compared to
males, females have a wide pelvis in relation to shoulder width and limb length, which, as a
positive advantage, can lead to a slightly lower centre of mass, and potentially improved
balance and stability (Brukner & Khan, 2006). It is however important to note that this
increased Q angle is not universal among females, and it has been suggested that although
some females have greater valgus angles of the thigh, this is uncommon among female
athletes. According to Atwater (1990), generalisations that all females are inferior to males in
running due to a wider pelvis and increased femoral obliquity have frequently been cited with
little scientific proof.

[43]
Figure 2.4. Illustration of the Q angle; calculated between the line of quadriceps and the
vertical line through the mid point of the patella. Source: Adapted from Schumacher, (2012).
Among individuals with high Q angles, calculating this variable has been described as a
method of assessing potential knee problems, due to an excess pull on the anterior cruciate
ligament of the knee joint, and could be one explanation for the increased incidence of
running related injuries among females (Comfort & Abrahamson, 2010). The results from an
early study using cadaver knee joints supported this theory. Huberti & Hayes (1984) used
pressure sensitive film to assess the pressure within the knee joint, at varying Q angles, and
showed a 10 degree increase in Q angle to increase the peak pressure in the knee joints
(Huberti & Hayes, 1984). Similarly, another in vitro study showed an increase in Q angle
applied to cadaver knee joints increased the lateral patellofemoral contact pressure and could
increase risk of patella dislocation (Mizuno, Kurnagai, Mattessich, Elias, Ramrattan,
Cosgarea, Chao, 2001). According to Messier and colleagues, increased Q angles among
females could play a partial role in the increased incidence of patellofemoral conditions that
women experience (Messier, Davis, Curl, Lowery, & Pack, 1991). Conversely, Caylor and
colleagues investigated the relationship between Q angle at maximum extension (0o flexion)
and anterior knee pain syndrome and showed no association between higher Q angles and the

[44]
incidence of the condition (Caylor, Fites, & Worrell, 1993). Similarly, Bierdert and Warnke
(2001) showed no association between Q angle at full extension and the position of the
patella. It is noted however that all participants in this investigation were suffering with
patella femoral pain syndrome at the time of investigation (Bierdet & Warnke, 2001).
Additionally, these latter researchers suggested that the varying methods of measuring the Q
angle, including both static and dynamic measurements, and the position of the knee joint
could be the cause for the equivocal results presented in the literature.
In addition to the aforementioned biomechanical disparities, males and females have also
been shown to display different patterns of gait. An increase in stride length has been shown
for males when compared to females (Kerrigan, Todd, & Della Croce, 1998), although this
has been shown to disappear when the data is normalised for height (McKean et al., 2007).
According to Roislien and colleagues, when compared to males, women have been shown to
walk with increased plantarflexion at toe off and initial swing, increased knee extension
during stance and increased knee flexion during swing phase. Additionally, women were
shown to walk with increased knee valgus (adduction) angles and increased hip internal
rotation angle throughout the entire gait cycle (Roislien, Skare, Gustavsen, Broch, Rennie, &
Opheim, 2009). It is suggested that these latter two movements are due to the previously
described larger quadriceps angle inherent to females. Ferber and colleagues also showed a
greater hip adduction angle among female runners when compared to males, and although not
measured, postulated that this could be due to the gendered structural difference of hip width
to femoral length ratio (Q angle) (Ferber, McClay Davis, Williams, 2003).
Cho and colleagues also showed differences between males and females during walking, and
illustrated increased anterior pelvic tilt and increased hip flexion among the female
participants (Cho, Park & Kwon, 2004). It was suggested that the increased hip flexion could
be due to a learned behaviour of walking in high heels, or a decrease in the muscular strength
of the abductor muscles. Additionally, females were shown to walk with decreased ankle
plantarflexor moment, increased knee valgus angle, and increased hip adduction and
abduction moment (Cho et al., 2004). The relatively smaller feet inherent to females could
reduce the length of the lever arm of the sagittal moment at the ankle, reducing the
plantarflexor moment and limiting the energy at the push off phase of gait (Cho et al., 2004).
Increased hip internal rotation was also demonstrated among the female group, similar to that
produced in the earlier study by Roislien and collagues (Cho et al., 2004; Roislein et al.,

[45]
2009). This difference in hip internal rotation was also demonstrated by a group of
participants during running trials (Ferber et al., 2003). As well as increased hip internal
rotation, the females in this investigation showed significantly greater knee valgus,
combining to suggest an increased Q angle. According to Cho et al (2004), this
biomechanical variable could be due to the anatomically shorter length of the female femur.
Malinzak and colleagues investigated gender differences among participants during running,
and illustrated similar frontal plane motion, but an average of 11o increased knee valgus
among females when compared to males. Additionally, less knee flexion range of motion was
shown for the female group (Malinzak, Colby, Kirkendall, Yu, & Garrett, 2001).
Although differences exist between studies, it has been shown that an increase in hip internal
rotation and adduction angle appears to be common among females when compared to their
male counterparts. This is commonly combined with an increase in knee joint valgus and
often a reduction in sagittal plane range of motion at the knee joint. It is suggested that the
increase knee valgus could contribute to various running related injuries and conditions that
affect female runners (Chumanov, Wall-Scheffler, & Heiderscheit, 2008).
2.2.4. Influence of hormones and menopause.
The main female hormone, produced by the ovaries, is oestrogen. This hormone, along with
follicle stimulating hormone (FSH) and luteinising hormone (LH) act to regulate the
menstrual cycle (Totora & Grabowski, 2003). It has been proposed that an increase in risk of
injury or development of running related debilitating conditions may be contributed to by
hormonal fluctuations associated with the female menstrual cycle (Clark, Bartold, & Bryant,
2010). The majority of ligaments within the human body possess oestrogen and relaxin
receptors, suggesting that these structures, and the potential for damage, may be influenced
by the stages of the menstrual cycle (Clark et al., 2010). Oestrogen has also been linked with
cardiovascular health, with increased levels of the hormone associated with the activation of
endothelial nitric oxide synthesase, leading to vasodilation and reduced risk of arterial
blockage (Mendelsohn, 2002).

[46]
Oestrogen is thought to passively diffuse into the cells in the body, and as such has been
shown to have an effect on bone structure and remodelling. Throughout a life time, millions
of small packets of bone are constantly remodelled through the balance between the amount
of bone formed and resorbed. Bone resorption describes the process by which osteoclasts
break down bone and release minerals, causing a transfer of calcium from bone fluid to blood
(Krassas & Papadopoulou, 2001). After damage or wear on a bone, the major action of
oestrogen may be to decrease this resorption of bone as opposed to aiding the formation of
new bone (Krassas & Papadopoulou, 2001). According to the results from Liu and Howard, a
treatment of oestrogen causes osteoclasts to lose attachment to the bone surface, undergo
degenerative changes and limit the ability to resorb bone (Liu & Howard, 1991). As such it
could be proposed that oestrogen protects bone from degenerative changes over time.
During the menopause, oestrogen levels decrease dramatically, due to the cessation of
menstruation and the menstrual cycle. As such, bone loss or reduced bone remodelling during
or after the menopause is common in women over the age of 50, and can be considered an
additional risk factor for the development of degenerative conditions at the joints (Kanis,
1996). This was supported by Felson and colleagues, who suggested that the high incidence
of osteoarthritis among post menopausal women infers that oestrogen deficiency plays a role
in causing disease (Felson et al., 2000). The association between hormone replacement
therapy (oestrogen tablets) and reduced incidence of radiographic osteoarthritis further
supports this theory (Zhang, McAlindon, Hannan, Chaisson, Klein, & Wilson, 1998).

[47]
2.3. Analysis of Human Gait.
2.3.1. Human movement.
The production of coordinated human movement is achieved through a physiological process,
combining actions from the nervous, muscular and skeletal systems of the human body
(Davis, Bull, Rosco & Roscoe, 2000). According to Vaughan and colleagues, the cyclic
movement of human gait is achieved through the following sequence of events:
Figure 2.5. Process of movement produced through transmission of signal from the central
nervous system. Source: Adapted from Vaughn, Davis & O’Connor, (1999).
Registration of demand for movement in the central nervous system;
brain and spinal cord (CNS).
Transmission of signals to the peripheral nervous
system (PNS).
Message received at effector muscles
Generation of forces and moments at the
articulating synovial joints.
Regulation of forces and moments by rigid
skeletal systems.
Movement of segments in a pattern
recognised as gait.
Generation of external forces (ground
reaction forces).
[48]
Muscles can only contract and produce movement when a nerve ending is stimulated from an
outgoing impulse sent from the central nervous system. Each contractile system is organised
into a number of sections, each one controlled by a single motor neurone (Davis et al., 2000).
When activated, the muscles develop tension, which generates forces and moments at the
articulating joints, and produce movement at the rigid skeletal links (Vaughan, Davis, &
O’Connor, 1999). This sequence of events is required to enable the cyclic movements of
walking and running; motion commonly classified as gait (Vaughan et al., 1999).
2.3.2. Three dimensional gait analysis.
Three dimensional assessment of gait has been widely accepted as capable of quantifying gait
and assisting in surgical decision making (Dorocjak & Cuddeford, 1995). The three
dimensional aspect enables joint motion to be identified in the three planes of movement and,
according to Chambers and Sutherland (2002), enables identification of rotational movements
in the transverse plane, that are commonly mistaken with coronal or sagittal plane
abnormalities, or subject to perspective error when using two dimensional methods. Early
systems of kinematic analysis commonly captured data at slow sampling frequencies of 50
Hz or 60 Hz. This rate indicates how often the instrument records a measurement, and is
therefore often selected based on the speed of the movement being captured (McGinnis,
2005). As such, the terms motion analysis and gait analysis now tend to refer to specialised
hardware and software for collecting, processing and analysing kinematic and dynamic
parameters of movement, and commonly involve systems including Peak Motus or Vicon
(Peak Vicon, Oxford Metrics Co. Ltd, UK) (Hirsch, 2000). These systems permit the
acquisition of coordinates of a series of reflective markers attached to anatomical landmarks,
the spatial trajectories of whom are intended to be measured (Giannini et al., 1994).

[49]
2.3.3. Smoothing and filtering kinematic data.
Most methods employed for the analysis of movement introduce an amount of noise, or high
frequency fluctuations from a signal (Bogert, 1996). These can often be removed after
identification of the source. As such, a smoothing or filtering operation is performed on the
coordinates of each maker to remove the noise. Within biomechanics, these two terms are
often used interchangeably, and data smoothing techniques are commonly equivalent to low-
pass filters. Filtering generally describes the removal of high frequency components from a
signal, as noise has been suggested to be of a higher frequency than the frequency of the true
signal (Winter, Sidwall, & Hobson, 1974). This method has been proved successful in
removing noise from movement data; in a comparison between angular acceleration data
acquired from accelerometers and synchronised video data, the digital filter effectively
reduced signal noise and provided an accurate representation of the kinematic parameters
(Pezzack, Norman & Winter, 1977). It is however noted that care is required when using the
filtering technique, to ensure the process does not change the movement data itself (Richards,
2008). Smoothing techniques commonly employs the use of piece wise polynomials to
determine a line of best fit curve through a set of data points (Wood & Jennings, 1979). A
smoothing spline is a series of polynomials joined together at the nodes. This process is
commonly used in conjunction with motion analysis software, and involves a smoothing
parameter that controls the smoothness and closeness of fit (Richards, 2008). This is therefore
used to represent the smooth nature of human movement and reject the random noise in the
digitised coordinates (Bartlett, 2007). A noise factor is employed within the motion analysis
system (Vicon, Oxford) which defines the maximum distance a marker can deviate from a
parabola with respect to time, and is scaled relative to the calibration units to ensure the
magnitude is dependent on the size of the capture volume. Noise factor set too high or low
may cause the system to create false paths or delayed path assignments respectively.
Different smoothing techniques have been reported in previous studies for the reduction of
noise from the raw displacement data. In a direct comparison of the effectiveness of a cubic
spline, quintic spline, and digital filter, Vaughan (1982) illustrated the quintic spine to be
superior to the other methods. This was supported by Challis and Kerwin (1988) who
suggested that the quintic spline smoothing techniques is most accurate in producing the first
and second derivatives, supporting its use in calculations of acceleration (second derivative).

[50]
2.3.4. Errors in kinematic assessment.
Despite the technological advancement of three dimensional gait analysis, as well as noise
within the data, collection of biomechanical kinematic data is still often impeded by errors.
As discussed previously, within two dimensional analyses, parallax and perspective error
occur as subjects move away from the optical axis of the camera and out of the intended
capture volume (Kirtley, 2006). However, although superior in ability to view tri-planar
motion, when performing three dimensional motion analyses, error is encountered in many
other areas.
All measurement that involves biological phenomena is subject to error. One of the main
forms of error in the assessment of human gait is the assumption of rigid body segments, and
subsequent marker placement. The mathematical model of the lower limb on which the
markers are placed is a series of rigid linked bodies which move in space with six degrees of
freedom; three linear translation, and three orthogonal angular rotations (Gianni et al., 1998).
As such, within this form of analysis, it is assumed that soft tissue dynamics are ignored, all
segments are rigid and the placement of markers on the anatomical landmarks represents the
kinematics of the segment during gait (Nigg and Herzog, 1994). However the positions of
these markers are subject to two forms of error; absolute and relative. Intrinsically linked,
these two forms refer to the error produced in the movement of two markers that define rigid
segments, and that produced from the movement of a marker relative to the anatomical
landmark it is representing (Nigg and Herzog, 1994). Both forms of error can therefore be
expected due to the movement of the soft tissue on which the marker is places. According to
the results from a study comparing skin mounted markers, and markers attached to a plaster
of paris mould of the limb assuming rigid segments, Capazzo (1991) illustrated a difference
in movement of the underlying bone compared to the skin marker. During walking,
displacement between markers was shown as 10 and 7 mm for the markers on the greater
trochanter and femoral condyle respectively (Capazzo, 1991). Reinschmidt and colleagues
also supported this theory, and showed that when comparing with bone pins secured to the
underlying bone, external skin markers produced oscillations in rotation values calculated at
the knee joint (Reinschmidt, Van Bogert, Lundberg, Nigg, Stacoff, & Stano, 1997). However
it was noted that the external markers did reflect the knee extension – flexion movements and
the tibiocalcaneal rotation movements. Lundberg (1996) has also stated that marker error is

[51]
effected by the specific marker assessed; the marker placed on the anterior shank where the
skin is relatively tightly held across the bone will represent the bony movement to a superior
level when compared to a marker on the knee joint (Lundberg, 1996). This is supported by
Kirtley (2006) who suggested that the hip joint marker is the marker most prone to absolute
error, due to the level of soft tissue around the pelvis and hips, especially among women.
However although methods such as securing bone pins directly to the underlying bone may
reduce these errors, it is noted that this method is not ethically acceptable for routine motion
analysis (Richards, 2008).
Forms of absolute error are commonly encountered with regard to the clothing worn by
participants, and whether markers are affixed to footwear or directly to the skin of the foot-
ankle complex; common factors in gait analysis. In one comparison between the markers
placed on skin and those on lycra to represent the bony landmark of the anterior superior iliac
spine, Hazelwood and colleagues illustrated significantly more movement of the skin
mounted marker, suggesting lycra to be preferable in error limitation (Hazelwood, Hillman,
Lawson,, & Robb, 1997). Analysis of rearfoot motion has also been shown to be affected by
marker placement, and according to Stacoff and colleagues, comparisons of results between
studies is difficult due to overestimation of joint movement with both skin and show mounted
markers compared to markers affixed to the bone (Stacoff, Nigg, Reinschmidt, Bogert, &
Lundberg, 2000). Morio and colleagues have discussed this error, and in one investigation,
chose to look at the effects of sandals rather than shoes, due to the proposed difficulty of
monitoring foot movement inside a shoe (Morio, Lake, Guillaume, Baly, 2009). Similarly,
Wolf and colleagues attempted to overcome the marker error by attaching markers at cut out
points in the shoe, to enable the markers to be attached directly to the skin (Wolf, Simon,
Patrikas, Schuster, Armbrust, & Doderlein, 2008). Shultz and Jenkyn, (2011) further
investigated this method, and investigated the optimal diameter of the hole in the shoe to
enable sufficient maker movement but little change in footwear properties. It is therefore
suggested that due to the specificity of the size and shape of the hole in the shoe, this method
may not be applicable to studies involving large groups of participants required to wear the
same footwear, due to individual variation in foot shape.

[52]
2.3.4.1. Reliability, repeatability and accuracy.
When performing gait analysis, a level of error exists in any measurement taken; which
directly affects the accuracy of the system. The data can only be manipulated to define
parameters that are clinically significant if there is sufficient reliability, repeatability and
accuracy of the system in question (Giannini et al., 1994). Reliability determines the capacity
of the system to give a faithful representation of movement in different sessions, and can be
expressed as the minimum standard deviation acquired from the measurements (Gianni et al.,
1994). Conversely, repeatability refers to the stability of the measurement over time; the
correlations between reproductions of the same movement from the same subject in the same
session (Gianni et al., 1994). Accuracy is a measure of the difference between the true value
and the observed or measured value produced from the system (Ehara, Fujimoto, Tanaka, &
Yamamoto, 1995). According to Allard and colleagues, the root mean square error (RMSE) is
a statistic used to illustrate the difference between the observed and known values, and can
therefore be used to represent and compare the accuracy of a system (Allard, Blanchi, &
Aissaoui, 1995). An assessment of the accuracy of the system used in this research project is
provided in the appendix, Appendix A. The root mean square error provides a standard
deviation and is calculated using the formula below.
RMSE = √∑(X-α)2/(n-1)
Equation 2.1
The root mean square error is calculated where X is the known or true value, α is the
measured value and n refers to the number of observations. A measurement of a point
location is taken, and the arithmetic error is calculated as the difference between the
measured and true value. This is squared, and the square of differences are combined. The
square root of this sum is then divided by the number of observations minus one, to produce a
root mean square error or accuracy that can be compared between systems.
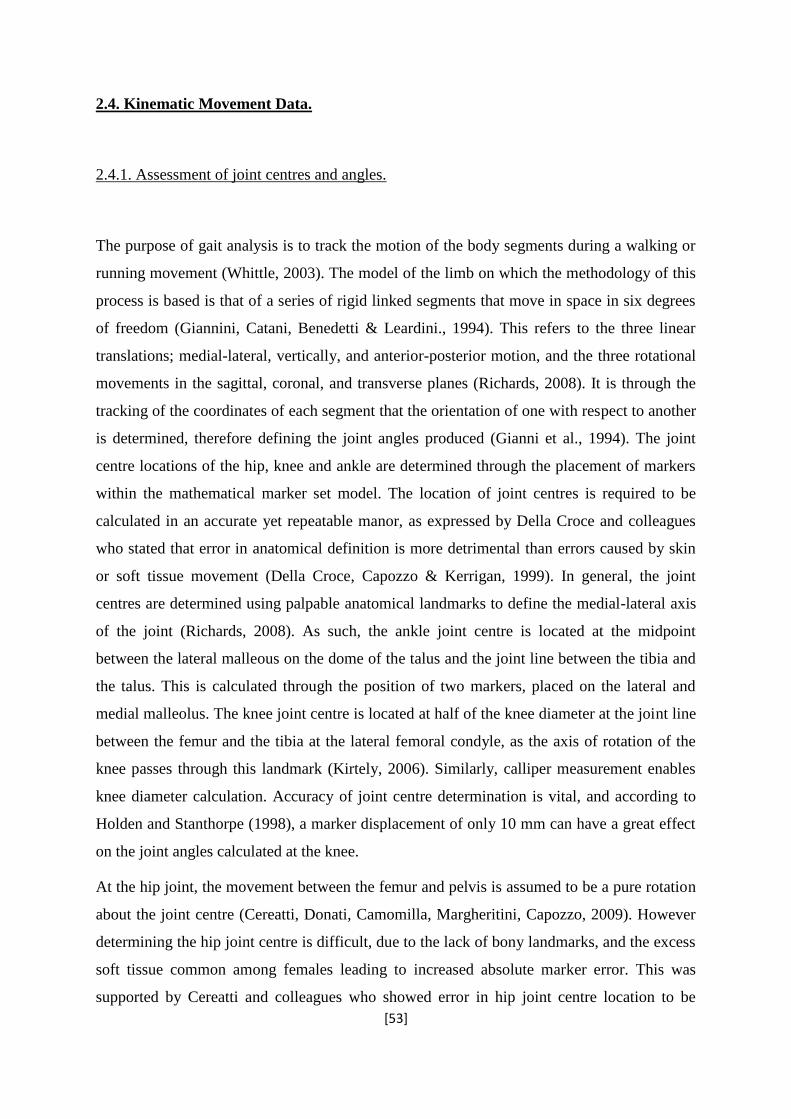
[53]
2.4. Kinematic Movement Data.
2.4.1. Assessment of joint centres and angles.
The purpose of gait analysis is to track the motion of the body segments during a walking or
running movement (Whittle, 2003). The model of the limb on which the methodology of this
process is based is that of a series of rigid linked segments that move in space in six degrees
of freedom (Giannini, Catani, Benedetti & Leardini., 1994). This refers to the three linear
translations; medial-lateral, vertically, and anterior-posterior motion, and the three rotational
movements in the sagittal, coronal, and transverse planes (Richards, 2008). It is through the
tracking of the coordinates of each segment that the orientation of one with respect to another
is determined, therefore defining the joint angles produced (Gianni et al., 1994). The joint
centre locations of the hip, knee and ankle are determined through the placement of markers
within the mathematical marker set model. The location of joint centres is required to be
calculated in an accurate yet repeatable manor, as expressed by Della Croce and colleagues
who stated that error in anatomical definition is more detrimental than errors caused by skin
or soft tissue movement (Della Croce, Capozzo & Kerrigan, 1999). In general, the joint
centres are determined using palpable anatomical landmarks to define the medial-lateral axis
of the joint (Richards, 2008). As such, the ankle joint centre is located at the midpoint
between the lateral malleous on the dome of the talus and the joint line between the tibia and
the talus. This is calculated through the position of two markers, placed on the lateral and
medial malleolus. The knee joint centre is located at half of the knee diameter at the joint line
between the femur and the tibia at the lateral femoral condyle, as the axis of rotation of the
knee passes through this landmark (Kirtely, 2006). Similarly, calliper measurement enables
knee diameter calculation. Accuracy of joint centre determination is vital, and according to
Holden and Stanthorpe (1998), a marker displacement of only 10 mm can have a great effect
on the joint angles calculated at the knee.
At the hip joint, the movement between the femur and pelvis is assumed to be a pure rotation
about the joint centre (Cereatti, Donati, Camomilla, Margheritini, Capozzo, 2009). However
determining the hip joint centre is difficult, due to the lack of bony landmarks, and the excess
soft tissue common among females leading to increased absolute marker error. This was
supported by Cereatti and colleagues who showed error in hip joint centre location to be

[54]
greater among participants that had greater soft tissue artefacts (Cereatti et al., 2009). During
gait analysis, the hip joint centre is commonly identified through a functional method,
whereby the femur is moved passively or actively, to locate the middle of the head of the
femur within the sphere formed by the acetabulum (Della Croce, Leardini, Chiari, &
Capozzo, 2005).
A joint angle is that which lies between two connecting segments that share a common point.
Two dimensional angles are generally determined counter clockwise from the first to the
second segment. Conversely, three dimensional angles are calculated as the internal angle
between two segments, and range from 0 to 180 degrees. Within this thesis, joint angles are
determined through using the joint coordinate system (Figure 2.6), whereby one coordinate
axis is used from each local coordinate system of the two segments that constitute the joint.
This method employs simple trigonometry to calculate joint angles (Equation 2.2 a-c).
Figure 2.6. Joint coordinate system for the knee. Source: Adapted from (Robertson, Caldwell,
Hamill, Kamen, & Whittlesey, 2004, p. 52).
K leg
I thigh
J thigh
K thigh
Floating Axis
K leg
I thigh
J leg
I leg

[55]
a) flex-ext = 90 – cos-1
(Kproximal · FA)
b) abd-add = -90 – cos-1
(Kdistal · Iproximal)
c) int-ext = 90 – cos-1
(Idistal · FA)
Equation 2.2a-c
Figure 2.6 illustrates a joint coordinate system for the knee, whereby the longitudinal axis is
the vertical axis of the distal segment and the lateral axis is the medial-lateral axis of the
proximal segment. The third axis is a floating axis (FA) that is the cross product of the
longitudinal and lateral axis and acts in a perpendicular direction (Robertson et al., 2004).
Description of the anatomy and joint movements of the ankle and knee joints are detailed in
the following sections.
2.4.2. Ankle motion: Dorsiflexion/plantarflexion.
The complete movement of the foot as an object about the tibia is referred to as ankle joint
motion (Richards, 2008). The ankle is a weight-bearing joint, the movements of which
strongly determine the pattern of gait (Norris, 2004). This joint is referred to as the talocrural
joint, as it is formed by the bones of the leg and a single tarsal bone, the talus (Jenkins, 1998).
Overall, it consists of the trochlear surface of the talus, and the distal ends of the tibia and
fibula. Figure 2.7 illustrates the ankle joint and the motions involved.
The relationship among these three bones is maintained by musculotendinous structures,
ligaments and a fibrous capsule (Alter, 2004). There are three articulating surfaces within the
joint; the upper, medial and lateral. The former is the main articulation of the joint,
cylindrical in shape, and formed by the tibia and talus (Whittle, 2003). This joint is

[56]
essentially a hinge joint, with movement almost entirely limited to flexion and extension in
the sagittal plane (Norris, 2004). The two main movements at the talocrural joint are
dorsiflexion and plantar flexion.
Figure 2.7. Right limb illustrating the bones at the ankle joint. Source: Adapted from Totora
& Grabowski (2003) p.236.
Plantar flexion of the ankle involves extension of the foot (Alter, 2004). This motion causes
the narrow posterior part of the trochlear surface of the talus to move into the broader
tibiofibular mortice (Norris, 2004). This motion is primarily produced by the actions of the
Anterior View Posterior View
Medial malleolus Lateral
malleolus
Anterior border
Fibula
Talus
Calcaneus
Lateral
malleolus
Tibia

[57]
gastrocnemius and soleus muscles on the calcaneus (Martini & Nath, 2008). The flexor
hallucis longus, flexor digitorum longus, and the tibialis posterior muscles in the calf also
play an important role in assisting plantar flexion, with their tendons sent posteriorly around
the medial malleolus (Jenkins, 1998). Finally, the peroneus longus and brevis contained in the
lateral compartment can also produce plantar flexion of the ankle (Dutton, 2005).
In contrast to the motion of plantar flexion, dorsiflexion of the ankle forces the broad anterior
section of the talus into the narrower mortice between the tibia and fibula (Norris, 2004).
Simply, this causes the foot to be pulled towards the shin, and as such the tibialis anterior is
therefore the most important muscle involved (Jenkins, 1998). Similar to plantar flexion
however, there are additional muscles that can aid the motion, and in the case of paralysis of
the former muscle, dorsiflexion of the ankle is produced through the actions of the extensor
digitorum longus and associated peroneus tertius (Jenkins, 1998). The major ligaments of the
ankle are those between the tibia and fibula, their primary function being to prevent distance
forming between these two bones (Whittle, 2003). During dorsiflexion, the joint moves into
its most stable closed pack position and the tibiofibular ligaments are stressed (Norris, 2004).
Both plantar flexion and dorsiflexion are movements essential to normal running gait. During
a heel strike running gait, the importance of this overall movement of the foot to the tibia is
based on its role in shock absorption at heel impact and its function in the propulsive stage
immediately prior to toe off (Richards, 2008). Peak dorsiflexion of the ankle occurs as the
tibia moves over the ankle during the latter stage of midstance, and maximum plantar flexion
is reached as the heel lifts at the end of the stance phase (Richards, 2008).
Ankle joint motion in the sagittal plane is calculated using the position of the two segments;
the foot and the tibia. As described previously, the segment angles are calculated using
trigonometry (Robertson et al., 2004). These are then used to calculate each joint angle. As
the neutral position of the ankle is 90o, this means subtracting 90. Positive values for this
angle therefore represent dorsiflexion, and negative values represent plantarflexion. The
ankle joint angle is therefore calculated as follows:
θ Ankle Joint = 90o - (θ proximal segment – θ distal segment).
Equation 2.3.

[58]
2.4.3. Subtalar joint motion: Eversion and inversion.
The subtalar or talocalcaneal joint lies within the vertical weight-bearing column between the
heel and the tibia; between the concave under-surface of the talus, and the convex posterior
surface of the calcaneum (Perry, 1992). The axis of the joint is obliquely orientated, inclined
in the sagittal plane to approximately 45o (Root, Weed, Sgarlto, & Bluth, 1966). The joint
runs in a primarily forward, but also upwards and medial direction, allowing the foot to tilt
medially and laterally (Whittle, 2003). A large number of ligaments join the two bones
together and to all adjacent bones; its ligamentous support consisting of the collateral
ligaments, the interosseous ligaments and the talocalcaneal ligaments (Hall & Brody, 2005).
This joint is in its neutral position when the posterior aspect of the heel lies vertical to the
supporting surface of the foot. This neutral position becomes the baseline to determine foot
and lower limb alignments (Norris, 2004). The functional importance of this joint lies in its
capability to permit abduction and adduction of the hind foot; two movements essential to
normal gait (Whittle, 2003). Furthermore, an important feature of the subtalar joint is its
ability to perform tri-planar motion which is permitted by its oblique nature (Norris, 2004).
Pronation of the foot is one such tri-planar motion, involving eversion of the calcaneus
(frontal), abduction (transverse) and dorsiflexion (sagittal) (Norris, 2004). Pronation and
supination are presented visually in Figure 2.8.
Figure 2.8. Position of the right subtalar joint in weight bearing, showing supination (a),
neutral (b) and pronation (c). Source: Adapted from Norris (2004) p.182.

[59]
Inversion and eversion movements cause the foot to tilt on the obliquely orientated axis in a
medial and lateral direction respectively (Perry, 1992). During one gait cycle, both
movements occur throughout the swing and stance phases; however the motion during the
latter is more significant due to its influence on the weight-bearing alignment of the proximal
joints (Perry, 1992). The stance phase of running gait consists of three stages; heel strike,
midstance, and toe-off. At the point of initial contact, the heel is slightly inverted, and the
forefoot supinated (Whittle, 2003). This inversion is controlled by the actions of the tibialis
anterior and posterior, with normal ranges between 0 o
to 25o (Kingston, 2000). During the
first stage of heel-strike stance, following initial plantar flexion, the subtalar joint moves from
an inverted to an everted position. This is a normal passive response to initial contact of the
heel with the ground, and unlocks the midtarsal joint to produce a relatively flexible forefoot
enhancing shock absorption and adaptation to irregularities in the ground floor surface
(Nordin & Frankel, 2001). This is combined with the toes moving outward away from the
mid line of the body (abduction) and the decreased distance between the toes and the lower
leg (dorsiflexion). As mentioned, pronation is the term used to describe this combination of
three movements. The movement of pronation causes the foot to roll medially, turning the
sole of the foot outward and flattening the longitudinal arch. Due to the oblique axis of the
subtalar joint, pronation and supination are therefore coupled with internal/external rotation
of the lower leg (Norris, 2004). Normal ranges of subtalar joint eversion are known to be
between 0 o and 15
o; above the latter value is defined as excessive (Kingston, 2000).
2.4.4. Motion of the foot: Abduction/adduction.
Movements of the ankle and foot joint are achieved through the combined actions of the
talocrural joint, the subtalar joint, and the midtarsal joint (Perry,1992). The midtarsal joint
consists of two articulations, the talonavicular joint and the calcaneocuboid joint. The
midtarsal comprises joints which lie between each of the tarsal bones and their immediate
neighbours. Together, the joints are combined to create a link between the hind foot and the
forefoot, permitting a small amount of movement in all directions (Whittle, 2003). The
movement of this joint is dependent on ligamentous and muscular tension to maintain its
position and integrity (Hyde & Gengenbach, 2007). The ligamentous support is provided by
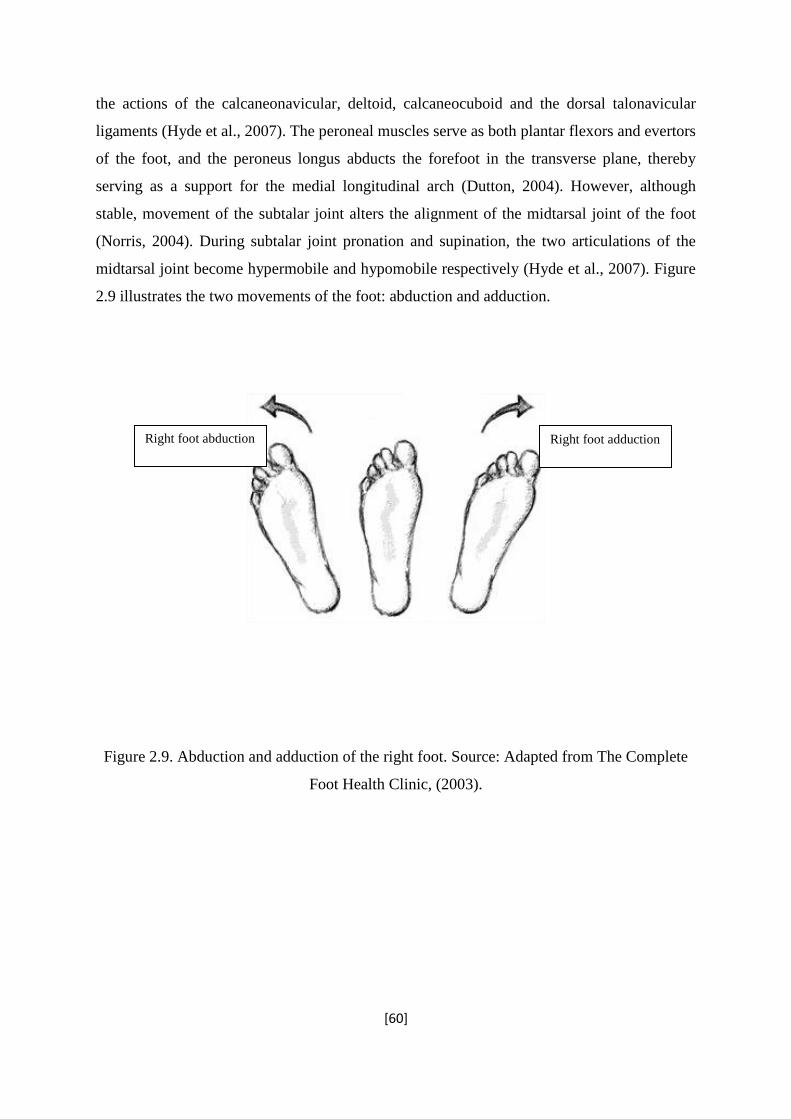
[60]
the actions of the calcaneonavicular, deltoid, calcaneocuboid and the dorsal talonavicular
ligaments (Hyde et al., 2007). The peroneal muscles serve as both plantar flexors and evertors
of the foot, and the peroneus longus abducts the forefoot in the transverse plane, thereby
serving as a support for the medial longitudinal arch (Dutton, 2004). However, although
stable, movement of the subtalar joint alters the alignment of the midtarsal joint of the foot
(Norris, 2004). During subtalar joint pronation and supination, the two articulations of the
midtarsal joint become hypermobile and hypomobile respectively (Hyde et al., 2007). Figure
2.9 illustrates the two movements of the foot: abduction and adduction.
Figure 2.9. Abduction and adduction of the right foot. Source: Adapted from The Complete
Foot Health Clinic, (2003).
Right foot adduction Right foot abduction

[61]
2.4.5. Knee joint motion.
2.4.5.1. Sagittal plane movements: flexion/extension.
The knee is the largest and substantially most complex joint in the human body (Marieb &
Hoehn, 2004). Although ostensibly a hinge joint permitting flexion and extension, the knee
also allows frontal plane motion of abduction and adduction, and transverse plane internal
and external rotation. Throughout gait, the knee undergoes movement in all three planes of
motion, suggesting the knee is loaded in different areas at different points in time. As such,
knee injuries and degradation can occur in various areas of the joint. This theory is
considered in greater detail in Study 3. Knee movement in the sagittal plane involves flexion
and extension, both of which occur at the tibiofemoral joint. The neutral position of the knee
is the position where by no flexion or extension angle is calculated; from which up to 140o of
flexion is possible in the uninjured human body (Norris, 2004). Knee flexion involves
bringing the posterior surfaces of the upper and lower leg together, and is controlled by both
the eccentric contraction of the quadriceps and the concentric action of the hamstring muscle
groups (McGinnis, 2005). The sole knee extensor is the quadriceps femoris muscle of the
anterior thigh; the most powerful muscle in the body (Marieb & Hoehn, 2007). During the
stance phase of gait, the knee is extended at ground contact, with an average knee angle of
less than 10 degrees, and then reaches peak flexion during mid stance (Whittle, 2003). This is
often accompanied by initial plantar flexion of the ankle joint, with a net effect of acting as a
shock absorber during the loading phase. The knee flexion during the mid stance phase is
controlled by the eccentric contraction of the quadriceps, and reflects their role as shock
absorbers (Richards, 2008; Novacheck, 1998). Finally the knee extends to a similar position
of that achieved at ground contact, rapidly followed by ankle dorsiflexion to allow the toe to
clear the ground.

[62]
2.4.5.2. Frontal plane motion: Knee abduction/adduction.
As described, the knee is predominantly a hinge joint, with motion permitted in both the
frontal and transverse planes. Therefore, the majority of movement at the knee will take place
in the sagittal plane of motion. However, although often debated, the joint does have to
ability to permit a small degree of movement in the coronal plane (Richards, 2008). Although
minimal, during loading there may be a slight degree of adduction or abduction of the joint,
the direction of which is determined by the anatomical alignment of the knee; varus or valgus
respectively (Richards, 2008). This is highlighted in the diagram below.
Figure 2.10 Illustration of the valgus and varus position of thee knee joints. Source: adapted
from myorthosports.com.
Knee Valgus Neutral Knee Varus
Adduction Abduction

[63]
However, as described, this deformation is controlled and therefore minimal. This is due to
the control and stability of the joint, achieved through the action of ligaments (Whittle, 2003).
The medial collateral ligament prevents adduction or valgus actions at the knee joint, and the
lateral collateral ligament opposes abduction or varus actions. Both ligaments therefore act to
stop their respective side of the knee from unfastening or opening up (Whittle, 2003).
2.4.5.3. Transverse plane motion: Knee internal rotation.
During gait, the knee joint permits a degree of movement in the transverse plane,
predominantly dominated by the tibia rotating about the femur. As motion in this plane is less
versatile than in the sagittal plane, important functional and pathological movements may be
observed during these motions (Richards, 2008).
A common theme in the literature is that internal and external rotation of the knee is often
coupled with flexion and extension of the joint during both stance and swing phases of gait.
According to Hertling and Kessler, (2006) this is attributed to the structure and function of
the joint and the femoral condyles. Figure 2.2 illustrates the condyles of the knee joint, and
Figure 2.11 illustrates the association between sagittal plane motion and rotation of the knee
joint. The medial condyle is curved and oblique in orientation; where as the lateral condyle is
situated on the sagittal plane, and shorter in the anteroposterior direction than the medial. Due
to the longer length of the medial articulating surface, as the tibia extends the lateral side of
the joint completes its motion prior to the medial. The medial tibia then continues to move
forward along the curved medial femoral condyle, whereas the lateral tibial joint surface
undergoes a twist. The net effect is therefore a rotation of the tibia on the femur in an external
direction. This process is then reversed throughout flexion of the tibia, as a combination of
rolling and gliding movements of the femoral condyles occurs (Hertling & Kessler, 2006).
This is supported by Norris (2004), who suggested that it is during the last 15o of extension
during the stance phase of gait that the knee rotates. Additionally, knee internal/external
rotation is often a consequence of the action of the cruciate ligaments; as the knee extends the
cruciate ligaments tighten and are twisted in a direction to rotate the tibia (Hertling &
Kessler, 2006).
[64]
Figure 2.11a and b. Oblique view of the femur and tibia with the tibial plateau shaded (a) and
superior view of the knee joint highlighting the position of the tibial plateau (dotted line) on
the condyles during flexion and extension (b). Source: Adapted from Nordin & Frankel,
(1989) p.121.
External
rotation
Internal
rotation
Flexion
Extension
(a)
(b)
Flexion and
Internal
Rotation Medial Lateral
Tibial plateau
Extension and
External
Rotation

[65]
2.5. Kinetic Analysis.
“Kinetic variables are based on force – the cause of change in motion”.
(McGinnis, 2005).
2.5.1. The ground reaction force.
In 1680, Borrelli was the first to measure the centre of mass of the body, and the first to
consider ground reaction forces that act during gait (Richards, 2008). These are based on
Newton’s third law of motion. This is commonly stated as
“To every action, there is an equal and opposite reaction”.
During static standing, a force is being applied to the person in equal and opposite
magnitudes to body weight (Kirtely, 2006). This is known as the ground reaction force. In
reality we are never completely static, and variations in body position will affect the exact
location through which the ground reaction force acts (Richards, 2008). During both walking
and heel strike running gait, the magnitude of ground reaction changes, showing peaks at
both ground contact (peak impact force) and push off phase (peak active force) of the gait
cycle (Kirtley, 2006). This force is distributed over the entire surface of the foot that is in
contact with the ground; the centre of pressure thereby describing the theoretical movement
of the applied ground reaction force throughout stance (Miller, 1990).
This ground reaction force is a vector quantity, whereby the resultant force can be reduced to
components which describe the magnitude of the force acting along the three orthogonal axes
(x, y, and z). This is highlighted in Figure 2.12. A typical convention is set up such that the x
axis refers to the forces acting in the medio-lateral direction, the y axis indicates the anterio-
posterior direction, and the vertical direction is illustrated by the z axis (Miller, 1990). A
typical recording of all three components of ground reaction force during running is

[66]
highlighted in Figure 2.13. Among the vertical ground reaction vector, the graph illustrates
the previously mentioned peaks associated with heel strike and ground contact and the push
off phase. According to Miller (1990) the majority of research has focussed on this
component during analysis of gait, due to the magnitude and distinguishable trace. Within
this research thesis a specific focus has remained on the vertical component of the ground
reaction force during gait. This is further supported in a later section, with specific focus on
ground reaction force variables and injury (Section 3.1.3.1).
Figure 2.12. Diagram of the body during the stance phase of gait, illustrating the three
components of ground reaction force (dotted line illustrates position of second leg).
Fz
Fx
Fy

[67]
(a: Fz, Vertical)
(b: Fx, Anterior/posterior)
(c: Fy, Medial/lateral)
Figure 2.13a-c. Sample running ground reaction force traces for the rearfoot striker;
illustrating the three components of ground reaction force. Source: adapted from Richards,
2008.
Force (N)
Force (N)
Force (N)
Time (s)
Time (s)
Time (s)

[68]
As well as the vertical component of the ground reaction force, Figure 2.13 illustrates both
the anterior-posterior and the medial-lateral component. Following ground contact, the
anterior-posterior component peaks in the opposite direction to the vertical ground reaction
force, and is termed the braking phase (Munro, Miller, & Fuglevand, 1987). Following this,
the second peak of the vertical component acts at a similar time to the positive peak of the
anterior-posterior trace, termed the propulsion phase (Munro et al., 1987). The medial-lateral
force trace illustrates minimal movement of the force in this direction. According to Miller
(1990), the vertical component of the ground reaction force is a function of movement
performance that is readily understandable, and therefore will take the focus of the ground
reaction force assessment within this research thesis.
The loading rate of the vertical ground reaction force describes the gradient of the first peak,
and illustrates the rate of the impact force development. This is calculated using the first
central difference method as follows (Equation 2.4):
Loading rate = (Ffinal – Finitial)
(tfinal – tinitial)
Equation 2.4
Where Ffinal and F initial refer to the force points immediately after and prior to the point for
which the loading rate is to be calculated, and tfinal and tinital are the time components for the
respective force points.
2.5.2. Force platform accuracy and targeting.
Individual ground reaction forces during running can be determined using a force platform; a
precision instrument using either strain gauges (Advanced Medical Technilogies
Incorporated, Watertown) or piezo-electric quartz crystals (Kistler Instruments, Witerthur,
Switzerland). The measuring surface is square or rectangular in shape, with the usual
measurements of approximately 40 cm by 60 cm (McGinnis, 2005). Both methods convert
ground reaction force into electrical signals (Kirtely, 2006). Overall, force platforms have

[69]
been suggested to provide an accurate method of ground reaction force assessment during
movement. According to Gill and O’Connor (1997), the accuracy is however dependant on
the method by which the force platform was mounted into the floor, as unstable force
platforms can alter the signal produced.
The accuracy of force platform data was investigated by Gill and O’Connor (1997) who
determined that vertical force measurement and reconstruction of the centre of pressure is
acceptable with the use of an AMTI force platform, with low levels of interference between
the different components of ground reaction force (Gill and O’Connor, 1997). However a
limitation associated with kinetic force assessment using force platforms is the force plate
targeting inaccuracy. According to Miller (1990), the major consideration when investigating
ground reaction forces with a platform, is whether the data collected from a running trial is
representative of the individuals normal gait. When undergoing an assessment of gait, it is
common for individuals to alter the stride in attempt to contact the force platform with the
desired foot, which may influence the quality of data produced.
According to one investigation by Grabiner and colleagues, force plate targeting did not
significantly affect the ground reaction force or increase variability of the force profile among
healthy males during walking trials (Grabiner, Feuerbach, Lundin & Davis, 1995). This result
supported the earlier research by Patla and colleagues who showed no significant difference
in ground reaction impulse between the conditions with and without visual cues for foot
placement (Patla, Robinson, Samways, & Armstrong, 1989). In contrast however, Cuddeford
and colleagues demonstrated a significant change in hip power when subjects were asked to
target a force plate during walking compared to the trials performed with no visual cues
(Cuddeford, Yack, Jensen, Peterson, Simonsen & Eichelberger, 1998). Similarly, in a study
with experienced runners, Challis (2001) showed that trials including force plate targeting
elicited significant differences in the peak magnitude of vertical ground reaction forces and a
change in spatial coordinates over time (Challis, 2001). However, consistency was
demonstrated in the ground reaction force traces, and the low standard deviations suggest that
force plates are a reliable method for assessing ground reaction forces during gait, supposing
no obvious stride alterations are made in attempt to contact the platform (Challis, 2001).
[70]
2.6. Joint Moments.
Shelburne, Torry & Pandy (2006) showed that the major contribution to medial knee joint
loading was the orientation of the ground reaction force vector due to its component in joint
moment calculation. The following section describes the calculation of moments at the joints
of lower limb, and the relevant application of the ground reaction force components.
Moments that act about the joints during running are calculated as the product of the joint
force and the distance of that force from the joint centre location (Hay, 1993). As such,
details of the internal forces acting about the joints are required.
2.6.1. Anthropometry.
The method of inverse dynamics combines the study of kinetics and kinematics to obtain
quantitative values for joint moments during the support (stance phase) of gait (Richards,
2008). This approach involves a series of Newton’s equations and the construction of a link-
segment model of the lower limb, disarticulating each segment to form rigid bodies (Winter,
1990). Basic rigid body analysis of the lower limb involves the individual segments of the
foot, shank, thigh and trunk, each with a uniform density and the mass located at a single
point along the length (centre of mass). Identification of centre of mass (CoM) location and
magnitude can often be quantified using precise measurements from magnetic resonance
imaging (Richards, 2008). However due to lack of availability and cost, the majority of
research relies on measurements performed using cadavers (Demster, 1955). The first stage
of this process involved dissection of the cadaver (frozen limb), to disarticulate the individual
segments. Simply, the single segments were then weighed to determine the mass, and
balanced on a single point to determine the location of that segment centre of mass
(Dempster, 1955). The latter calculation was then expressed as a percentage of length from
the distal end (Kirtley, 2006). According to Richards (2008), the measurements suggested by
Dempster in 1955, although categorised estimates, are still considered the ideal
anthropometric values for body segment parameters.

[71]
It is however important to consider that the estimation of joint centre of mass through
anthropometric measurements has a few limitations. Although applied to calculations among
a range of human participants, values based from the work of Dempster and colleagues do not
account for vast cases of atypical distribution of body mass (Cotton, Vanoncini, Fraisse,
Ramdeni, Demircan, Murray and Keller, 2011). In general, the calculations of centre of mass
location account for variations within a relatively small category of participants including
healthy adult Caucasians. As such, the higher the deviation from nominal body mass
distribution, the higher the modelling error (Cotton et al., 2011).
2.6.2. Joint forces.
2.6.2.1. In-vivo measurements.
Within each joint in the human body, a state of equilibrium exists where the external forces
are balanced by the internal joint forces (Richards, 2008). Understanding these forces
provides information regarding muscle mechanics, physiology, motor control,
musculoskeletal mechanics and neuro-mechanics (Kjaer, 2003). As such, within the field of
biomechanics, it is of interest to quantify the patterns of force acting on the muscles,
ligaments and tendons in the joints (Roberston, 2004). Developments in technology and
surgical implantation procedures made it possible to measure forces internally, which lead to
an application of in-vivo techniques for studying the loading of tendons during human
locomotion (Kjaer, 2003). Early research therefore investigated methods to successfully
quantify these internal forces including internal force transducers; however an abundance of
limitations and negative reception of their use made them subject to concern.
Within an Achilles tendon study, although a quantification of the force was obtained, the
output only provided information on the activity of the Achilles tendon, with no data from the
forces of the triceps surae muscle groups (Kolt & Snyder-Mackler, 2003). Furthermore,
difficulties associated with calibration of the transducers exist, as calibration will always be
specific for the single tendon investigated (Meyer, Nyffler, & Geber, 2004). This requires
calibration to be intraoperative at implantation, or precise measurement of the tendon

[72]
diameter, both of which require the use of specialised equipment and expertise, alongside the
potential discomfort to the participant (Meyer et al., 2004). Finally, the placement of
equipment internally will potentially disturb the observed motion of the limb (Robertson,
2004). Therefore, although such methods have the potential to provide accurate information
regarding internal forces, measurement of forces in-vivo requires invasive methods that are
subject to limitations. As such, these techniques are unlikely to be widely accepted as a
means of quantifying internal joint forces during motion (Robertson, 2004).
2.6.2.2. External measurement of joint forces.
During the stance phase of gait, several forces act on the joints of the lower limb; combining
to provide an overall vertical and horizontal joint force. A diagram of the forces acting at the
ankle joint is displayed in Figure 2.14.
As previously described, every single body segment has a mass, which in turn has
acceleration due to gravity. As such, the weight (mg) of that segment can be assumed as a
combination of its mass (m) and the acceleration due to gravity (g=9.81 m.s-1
) (Kirtley,
2006). This weight of each segment is then assumed to act vertically down at its centre of
mass; the location of which is determined through cadaver data (Dempster, 1955). Therefore,
as the weight of the foot acts at the centre of mass, so the ground reaction forces act at the
segments centre of pressure. As such, when the foot is in a plantarflexed position during
stance, the weight and the ground reaction forces act at different places (see Figure 2.14)
(Kirtley, 2006). Finally, as the ankle-foot segment has been disarticulated from the body,
there is an additional force acting, known as the joint reaction force (Kirtely, 2006). Using
Newton’s laws of motion (specifically, force = mass x acceleration), these forces are
considered to be acting along a reference frame, and can be resolved in both the vertical and
horizontal directions.

[73]
Forces acting on the ankle and foot:
Horizontal: Rx ank + Fx = max Rx ank = max - Fx
Vertical: Ry ank + Fy – mgfoot = max Ry ank = max – Fy + mg foot
Equation 2.5
Where R x and y and F x and y are the ankle reaction forces and the components of GRF in both
the horizontal (x) and vertical (y) components respectively.
As displayed in Figure 2.14, when there is no horizontal acceleration acting on the foot
segment, this joint is in a static position. As such ax and y will be close to zero, negating the ma
component. The horizontal ankle force Rx is therefore equal and opposite to Fx. These
methods are also applicable to the proximal joints of the lower limb. The equations below
illustrate the overall forces acting at the knee and hip joint during a static position of the limb.
Forces acting on the shank and knee:
Horizontal: Rx knee + Rx ank = max Rx knee = max - Rx ank
Vertical: Ry knee + Ry ank – mgshank = max Ry knee = max – Ry ank + mgshank
Equation 2.6

[74]
Forces acting on the thigh and hip:
Horizontal: Rx hip + Rx knee = max Rx hip = max - Rx knee
Vertical: Ry hip + Ry knee – mgthigh = max Ry hip = max – Ry knee + mgthigh
Equation 2.7.
Figure 2.14. Free body diagram of the foot and ankle complex, illustrating the forces acting at
the joint during a static position. Source: Kirtely (2006) pp.122.

[75]
2.6.3. Joint moments.
The method of inverse dynamics simply implements a rigid-linked segment model, used to
calculate the net muscle moment acting at the ankle, knee and hip joints (Farley et al., 1998).
As such, forces applied to the joint through the actions of the muscles need to be considered.
Using the example of the ankle-foot segment, concentric actions of the gastrocnemius-soleus
and the anterior tibialis muscle groups cause the foot to plantar-flex and dorsi-flex
respectively. This in turn produces a moment at the joint acting negatively in a clock-wise or
positively in an anticlockwise direction (Richards, 2008). In simple terms, a moment acting at
a joint is calculated by multiplying the magnitude of the total force acting through the joint,
by the perpendicular distance to the fulcrum (CoM), known as the moment arm (Whittle,
2003). Therefore within the calculations, the magnitude of each force is multiplied by the
perpendicular distance from the location of the force to the centre of mass. As such, the
moment arm of the segment weight is zero as it passes directly through the segment COM.
The moment acting at the joint is calculated using the following equation:
M = Iα,
Equation 2.8
where I is the moment of inertia, and α is the angular acceleration of the segment (Kirtley,
2006). Therefore, assuming that the joint is frictionless, and that air resistance is negligible,
the formula for calculating the ankle joint moment is as follows:

[76]
Forces and moment at the ankle joint:
Horizontal: Rx ank = max - Fx
Vertical: Ry ank = max – Fy + mg foot
Ankle Moment: Ma = Fydx + Fxdy – Rypx – Rxpy + Iα
Equation 2.9.
Where dx dy px py are the distances from the respective forces to the joint centre of mass.
Similarly, following calculation of the joint reaction forces and the moment acting at the
ankle joint, moments can then be determined at the proximal joints of the lower limb; the
knee and the hip.
Forces and moment at the knee and hip joint:
Horizontal: Rx knee = max - Rx ank
Vertical: Ry knee = max – Ry ank + mgshank
Knee Moment: Mk = Ry ankpx+ Rx ankpy - Ry kneeqx - Rx kneeqy – Iα
Equation 2.10.

[77]
Horizontal: Rx hip = max - Rx knee
Vertical: Ry hip = max – Ry knee + mgthigh
Hip Moment: Mh = Ry kneeqx + Rx kneeqy - Ry hiptx - Rx hipty – Iα
Equation 2.11.
As described, joint moments simply symbolise where the resultant force is acting at the joint
during motion. This information is important in clinical assessments and research projects, as
it highlights the presence of joint malalignment and uneven force distribution at the joint
(Whittle, 2003).

[78]
2.7. Knee Joint Stiffness.
In previous sections, the relative influence of kinematic variables, kinetic variables, and joint
moments have been considered in their association with the development of lower limb
injuries and over use conditions. Knee joint stiffness is an additional biomechanical variable
that has been similarly associated with running related conditions, due to a relative reduction
in joint range of motion.
2.7.1. Introduction to stiffness.
Hopping, trotting and running are a variety of different gaits used by legged animals to move
from one place to another. Although all animals vary in body shape and dimensions, each gait
permits movement across the ground similar to the motion of a bouncing ball, as the
musculoskeletal system behaves like a spring (Farley, Houdijk, Strien, & Louie, 1998). This
occurs as the muscle-tendon complex of the lower extremity alternately stretch and shorten
using the elastic potential of the muscles and tendons (Kuitunen, Komi & Kyrolainen, 2002).
According to Gunther & Blickhan (2002), the spring-mass model provides a well accepted
theoretical basis on which to construct the global dynamics of fast legged locomotion under
gravity. These varied gaits of animals can consequently be modelled using a spring-mass
system, and as a result, the concept of stiffness has its origins in physics. Hooke’s Law
applies to all deformable bodies which store and return elastic energy, providing their shape
is not permanently changed. Hooke’s law is defined as follows:
σ = kγ,
Equation 2.12.
where the force required to deform a material (σ), is proportional to the spring constant (k),
and the distance the material is deformed (γ) (Menard, 2008). The leg of an animal is often
modelled as a spring supporting the mass of the body (Figure 2.15). The constant (k)

[79]
describes the stiffness of the spring and mass system (Butler, Crowell, McClay Davis, 2003),
and as a result represents the average overall stiffness of the musculoskeletal system during
the ground contact phase of gait (Farley et al., 1998).
Figure 2.15. A spring-mass model representative of a single linear leg spring, illustrating
“mass” equivalent to body mass or force (σ), deformation of material (γ), and leg spring (k).
Source: Adapted from Butler et al., (2003).
In its simplest terms, stiffness is the relationship between the deformation of a body and a
given force; the force acting on the leg divided by the change in length of the leg (Butler et
al., 2003; Kuitunen, Komi & Kyrolainen, 2002). It is the ability of the system to resist the
applied stretch or force (Kuitunen et al., 2002). As displayed in Figure 2.15, the leg is often
modelled as a spring supporting the mass of the body during gait. When studying the
mechanical behaviour of the musculoskeletal system, the advantage of the spring-mass
system to identify leg stiffness is its simplicity, as it uses only one idealised spring to model

[80]
the behaviour of the body. However, it has been suggested that this model ignores the
mechanisms of this multi-spring system (Kuitunen et al., 2002). According to Farley et al
(1998), components other than mass are known to affect the behaviour of the leg spring, and
the changes in spring length correspond to the alternating flexion and extension motion of the
joints. In a multi-jointed system such as the human skeleton, overall stiffness is dependent on
the specific torsional stiffness of each joint as well as the geometry of the musculoskeletal
system (Farley et al., 1998). This notion was later supported by Gunher and Blickhan (2002)
who suggested that the elasticity (and therefore stiffness) of the leg during running and
jumping movements can be identified on the joint level, and global leg stiffness may emerge
from local elasticity established by the appropriate joint torques. As a result, overall stiffness
of the lower limb can be determined by the individual magnitude of the torsional stiffness of
the ankle, knee and hip joints.
2.7.2. Knee contribution to overall leg stiffness.
As described above, all joints of the lower limb contribute to overall leg stiffness. However, it
has previously been suggested that the stiffness of the knee joint is the greatest contributor to
leg stiffness. While linear stiffness is defined as linear force per linear displacement, knee
joint stiffness is operationally defined as the ratio of the change in torque to a change in knee
angle (Oatis, Wolff & Lennon, 2006). In an assessment of lower limb stiffness, Laughton,
McClay and Hamill (2003) illustrated forefoot strikers to present greater knee joint stiffness
than rearfoot strikers. Similarly, overall leg stiffness was greater in the forefoot group,
whereas ankle stiffness was greater in the rearfoot group, suggesting knee joint stiffness has a
greater contribution to overall leg stiffness than ankle joint stiffness (Laughton et al., 2003).
This notion was further supported in a study investigating the effect of knee stiffness on leg
stiffness during hopping. Hobara, Muraoka, Omuro, Gomi, Sakamoto, Inoue and Kanosue
(2009) performed a multiple regression analysis which revealed knee stiffness to explain
more of the variance in leg stiffness than did the torsional stiffness of the ankle or hip.
According to the results of the discussed study, the spring-like behaviour of the leg during
hopping is adjusted by changing the knee joint stiffness, while the stiffness at the ankle joint
remains constant (Hobara et al., 2009). Finally Arampatzis, Bruggemann and Metzler (1999)

[81]
illustrated that with increasing velocity, as well as increases in overall leg stiffness, larger
changes were observed in the spring stiffness of the knee joint compared with that at the
ankle joint, indicating that the increase in leg stiffness is caused in the most part by the
increase in knee joint spring stiffness.
During movement, a degree of stiffness is required to achieve optimal utilization of the
strength-shortening cycle, resulting in efficient use of the stored elastic energy in the
musculoskeletal system during loading (Butler et al., 2003). Therefore, a possible reason for
the lack of change in ankle stiffness compared to that at the knee, is the ankle joint’s inability
to tolerate the applied load and utilise the stored elastic energy as efficiently as the knee joint
(Hobara et al., 2009). Therefore, when compared to the ankle, the knee joint appears to be a
greater contributor to overall leg stiffness.
Within this thesis, a specific focus has been on running related injuries and debilitating
conditions that affect the knee joint. As illustrated above, the knee joint is the major
contributor to overall leg stiffness; and as such knee joint stiffness will be investigated in its
potential association with overuse conditions.

[82]
2.8. Muscle Strength.
2.8.1. Skeletal muscle structure and function.
Skeletal muscle is the tissue accountable for generating the forces that produce movement of
joints during human motion. This tissue accounts for approximately 40 to 45% of total body
mass (Hargreaves and Hawley, 2003). Within the human body, each skeletal muscle is a
separate organ, composed of thousands of multinucleated elongated cells named muscle
fibers (Tortora & Grabowski, 2003). It is the arrangement of structure and subsequent actions
of elements within each of these muscle fibers that are responsible for each muscular
contraction. The microstructure of a skeletal muscle fiber is displayed in Figure 2.16.
Figure 2.16. Image displaying microstructure of a single skeletal muscle fiber. Source:
Hargreaves & Hawley, (2003).

[83]
Each muscle fiber often extends the length of the skeletal muscle; measuring from 10 to 100
micrometers in diameter and up to 750,000 micrometers in length. The predominant feature
of each fiber is the numerous myofibrils; cylindrical shapes within the membranous network
of the fiber called the sacroplasmic reticulum (Sherwood, 2007). These myofibrils constitute
80% of the entire muscle fiber, and contain the contractile apparatus; the thick (myosin) and
thin (actin) protein filaments organised into contractile units (Hargreaves and Hawley, 2003).
It is a cross bridge interaction between these two protein filaments by means of the sliding
filament mechanism that causes muscle contraction (Sherwood, 2007). Each muscle is
stimulated by motor neurones from the somatic nervous system which instigates an action
potential propagated along the fiber. This in turn causes a release of calcium from the
sarcoplasmic reticulum which allows the myosin head to attach to the actin filament (cross-
bridge formation). The thin actin filaments then slide along the thick myosin filaments,
undergoing a process known as the sliding filament mechanism. This produces an overall
shortening of the sarcomere, the whole muscle fiber, and the entire skeletal muscle; initiating
a single muscular contraction (Tortora & Grabowski, 2003).
2.8.2. Quadriceps Femoris Muscle.
During running, the movements of the lower limbs are predominantly controlled by actions of
the quadriceps and hamstring muscles. Concentric contraction of the quadriceps causes a
shortening of the quadriceps femoris muscle, producing an extension of the lower leg at the
knee joint. Conversely, concentric action of the hamstring muscle group causes shortening of
this muscle, producing a flexion movement at the knee joint (Robergs & Keteyian, 2003).
Both movements occur countless times in each body during the course of one day, as each
movement is inherent within the gait of both walking and running.

[84]
Figure 2.17. Image of the muscles acting around the knee joint, including the main
contributors of the quadriceps femoris muscle (Source: Totora & Grabowski, 2003).
Figure 2.17 illustrates the main muscles acting around the knee joint. The quadriceps femoris
is the largest muscle mass covering anterior, medial and lateral aspects of the femur, and
functions as the greatest extensor of the leg. This composite muscle group is made up of the
vastus medialis, the vastus lateralis and the vastus intermedius muscles. These are recognised
as major contributors to patellofemoral joint function, and act to facilitate restraint of the
patella in medial and lateral directions respectively. The rectus femoris muscle is the rounded
anterior head of the quadriceps, and appears as a separate muscle despite its insertion
(Jenkins, 1998). The insertion of all four muscles of the quadriceps femoris is at the patella
tendon which inserts to the patella and through the patella ligament to the tibial tuberosity
(Tortora & Grabowski, 2003). The rectus femoris muscle arises from the anterior inferior

[85]
iliac spine, and crosses both the hip and the knee joint. This muscle has varied functions;
extends the lower leg and assists to flex the thigh on the pelvis. The vastus muscles serve to
extend the leg at the knee joint, and facilitate restraint of the patella in the medial and lateral
directions (Totora & Grabowski, 2009). Subsequently, weakness of these vastus muscles
manifests as an abnormal position or motion of the patella with chronic instability of the knee
joint.
2.8.3. Muscle strength.
Muscle strength is an essential component of most aspects of movement and performance,
and is underpinned by muscular, neural and mechanical factors. Within the clinical setting the
use of the term strength is almost always representative of muscle torque (Clarkson, 1999).
Torque is the propensity of a force (muscle tension) to turn a lever (limb) about an axis of
rotation (joint). It is measured as the function of the muscle force proportional to cross
sectional area and the biomechanical advantage of the moment arm or lever system.
Therefore measurement of muscle torque during isolated joint movements provides a value
for the strength of the muscle under consideration.
The bracket of muscular strength is commonly divided into endurance and strength. Strength
is the human ability to exert a physical force, and is measured as the maximal torque one can
exert in a single maximum voluntary contraction (MVC), when the type of muscular
contraction, limb velocity and joint angle are specified (Kumar, 2004). Conversely, muscular
endurance is the ability to maintain a force over a period of time or a set number of
repetitions or contractions (Rybski, 2004).
There are two basic categories of muscular contraction, dynamic (isotonic and isokinetic) and
static (isometric); each is classified according to the mechanical changes that occur in the
muscle during action. Isometric contractions occurs as tension is developed but the length of
the muscle remains constant (Robergs & Keteyian, 2003). Both isotonic and isokinetic
involve a change in the length of the muscle, either shortening (concentric) or lengthening
(eccentric), however an isokinetic contraction produces movement at a constant speed.

[86]
Muscle actions generate tension that is transferred to bone and enables movement. Muscles
are categorised according to their major role in producing this movement. An agonist muscle
or prime mover is a muscle or muscle group that makes the major contribution to movement
at the joint, for example the quadriceps muscle. Alternatively, an antagonist muscle relaxes as
the prime mover acts, working in opposition to the agonist muscle (Clarkson, 1999).
Examples of an antagonist and agonist working in opposition are the biceps and triceps
muscle through flexion and extension of the elbow, or the quadriceps and hamstring muscles
through flexing and extending at the knee joint. The strength of each muscle is different, and
underpinning the choice of muscle action to examine must be the activity specific component
under investigation (Armstrong, 2007).

[87]
2.9. Footwear.
2.9.1. Shoe design and function.
For the last three decades, the footwear biomechanics community have been asking
fundamental questions regarding the association between footwear, performance and the
development of injuries and debilitating conditions. To a large extent, this has been market-
led due to the consistent increase in the number of people participating in jogging for both
recreational and competitive purposes (Norris, 2004).
While footwear aims to protect and support the foot, the extensive range of shock-absorbing
properties and motion control techniques cause running shoes to surpass what one may
expect of an ordinary shoe. In 1980, the shoes gained the top rating in Runner’s World
Magazine were characterised by price, weight, shock absorbency and durability (Shorten,
2000). However since this time, great changes have been seen in the design of running shoes,
and contemporary designers focus on the anatomy and movement of the foot-ankle complex,
with shoes readily available in all styles and colours (Shariatmadari et al., 2010). It has now a
common phenomenon that most running shoe manufacturers will include a method of anti-
pronation or stability within the running shoe selection. Each running shoe may now have as
many as 20 parts to it, as is illustrated in Figure 2.18 (below). Although the design of running
shoes has become increasingly intricate, controversy still exists regarding the ability to create
a shoe that will be suitable to the unique anatomy of each individual.
Figure 2.18. Components of the running shoe. Source: Adapted from Norris, (2004 p. 292).

[88]
The majority of the following theory is based on that of Norris, (2004), who described the
components of running shoes in great depth (Figure 2.18). The purpose of the outer sole is to
provide traction, tread, flexibility and grip. Above this is the insole board, midsole and the
wedge, generally made from ethyl vinyl acetate (EVA) or polyurethane, which provides
cushioning and foot control during the stance phase of running. The heel counter is often
made from a hard thermoplastic material, which exists to counter rearfoot motion or
excessive pronation of the subtalar joint. It is commonly the wedge and the heel counter that
are adapted to form the motion control aspect of stability shoes (Norris, 2004). The shoe
upper section is designed to contour the foot, and will vary depending on the anatomical
width and depth of the foot, generally controlled by the lacing system.

[89]
2.10. Summary of literature review and general thesis rationale.
Running is a popular recreational activity among the mature female members of the
population. However the risk for the development of running related injuries and conditions
is high, with the risk for certain conditions becoming greater with age. These injuries and
conditions seemingly dominate at the knee joint. Due to the association with gender and age,
the specific condition of knee joint osteoarthritis is among the most frequently seen among
this mature female group.
Although demonstrated as a high risk group, there is a lack of research regarding injuries and
evidence of causative factors among this cohort. It is speculated that advancing age causes
anatomical and physiological changes to occur, that may heighten an individual’s
susceptibility to the development of injuries and conditions, although there is a lack of
research based on the specific group of mature females to confirm this. It is further
considered that post menopausal females may be at risk of developing degenerative
conditions at the joints, due to the reduction in oestrogen and a change in the catabolic and
anabolic activity within the bones
It is speculated that as the risk of injuries and debilitating conditions appears to increase with
age, certain biomechanical changes are expected that could place this specific group of
mature females at risk. Due to the current lack of definitive evidence regarding running styles
among mature females, investigation into changes in gait is justified.
Peak rearfoot eversion and knee internal rotation have consistently been linked with running
injuries, although this has not been extensively documented among the more mature members
of the population. Kinetically, loading rates and impact forces have been associated with
overloading during running, and knowledge of joint moments provides information regarding
the influence of these forces on the joints. Knee joint stiffness has been associated with
osteoarthritis; however the cause – consequence relationship appears equivocal. It has been
suggested that reductions in muscle strength may occur with age, and therefore could provide
insight into possible injury mechanisms among this group. With a lack of previous research
regarding running styles among mature female runners, the investigation of biomechanical
changes with age is warranted.

[90]
It has been postulated that a possible management strategy for injuries and running related
conditions, is through the prescription of footwear. Although not without contention,
cushioning properties in shoes have been shown to reduce impact forces and loading rates.
Similarly motion control devices have been found to limit rearfoot motion and internal
rotation of the tibia and knee among runners. However, the potential of these footwear
interventions to influence biomechanical risk factors among the mature members of the
running population have not been well documented.
2.10.1. Long term study objective.
The main objective of this research project is to determine whether age related biomechanical
changes occur in running gait among the female population of runners. Following this, the
effectiveness of management strategies in the form of footwear control will be investigated
specific for mature female runners. Finally, an investigation into the current condition of the
knee joint of the mature females will occur, to further substantiate biomechanical variables as
risk factors for the development of osteoarthritis.
2.10.2. Scope and boundaries of the study.
This research project describes and evaluates the biomechanical changes to running gait that
occur with increasing age among active females. Furthermore, a second study will consider
possible physiological factors will be considered in their contributory role to these
biomechanical changes. This project then investigates the role of footwear in injury and
osteoarthritis prevention and management, and considers biomechanical variables of gait as
diagnostic tools. In the final study, the use of magnetic resonance imaging allows an
investigation of diverse techniques to identify degenerative changes that occur at the knee
joint with increasing age among females.

[91]
2.10.3. Study Overviews.
2.10.3.1. Study One.
Study one is an investigative study, which aims to directly compare the running gait of young
and mature females to investigate whether mature females demonstrate gait characteristics
that may predispose them to the development of running related knee injuries and overuse
conditions. All subjects were assessed for the presence of knee joint injuries or osteoarthritis
through the use of a validated knee osteoarthritis observation survey (KOOS). Both kinetic
and kinematic analysis occurred to investigate variables associated with injuries including
rearfoot eversion, knee internal rotation and loading rate. Knee joint moments were identified
in the frontal plane to assess the risk of osteoarthritis. Subjects performed this assessment in
their own running footwear.
2.10.3.2. Study Two.
Study Two involved further investigation of the biomechanical differences identified in Study
One, with an additional focus on the influence of motion control footwear. Similar to Study
One, a direct comparison between mature and young female runners took place. In addition, a
current commercially available motion control shoe from a well known retailer was included
as a test condition to assess the ability of a motion control shoe to reduce specific observed
differences in running biomechanics between mature and younger female runners. Additional
assessments of knee joint stiffness and muscle strength were included in the investigation, to
develop the understanding of age related differences.
2.10.3.3. Study Three.
Study Three involved an intervention study. Based on the results of Study One and Study
Two, the aim was to assess the effect of both a medial and lateral wedge, and a combined
orthotic intervention with both medial and lateral support, on the running gait of mature

[92]
females. The changes in footwear conditions were based on each variable identified in the
previous studies and an intervention multi-purpose orthotic footwear condition incorporating
both a medial and lateral wedge was included to aim to control rearfoot motion and the knee
external adductor moment among mature female runners.
2.10.3.4 Study Four.
Study four occurred at a similar time to Study Three. This supplementary investigation aimed
to support the original theory that mature female runners are at a higher risk for the
development of debilitating conditions, specifically knee joint osteoarthritis. A magnetic
resonance imaging (MRI) scanner was used to scan the knees of each mature female, to
identify any early signs of osteoarthritis present in the joint. These results were then
correlated with previous surveys of osteoarthritis presence. Further correlation tests were
performed to investigate the previously proposed association between specific biomechanical
variables of gait and the development of injuries and debilitating conditions at the knee joint.

[93]
Chapter 3.
“A Biomechanical Comparison of the Running Gait of Mature and Young Females”
3.1. Introduction.
3.1.1. Running and the risk of injury.
The number of females participating in running is increasing, augmented by the
overwhelming concern for the growing epidemic of obesity (Rose, Birch, & Kuisma, 2011).
As a consistently available form of physical activity, middle and long distance running is a
relatively simple means of increasing overall fitness (Birrer & O’Connor, 2004) and these
participation rates have been attributed to the benefits associated with physical activity, such
as improvements in aerobic fitness, self perceptions and mood state (Weinberg & Gould,
2010). This concept also holds true for the more mature members of the female population,
and with the baby boom generation reaching retirement age along with the vast
improvements in medicine, this cohort is growing at a substantial rate. In the year 2010, there
were 531 million people worldwide over the age of 65, and this number is due to triple by the
year 2050 (Whitbourne & Whitbourne, 2011). It could therefore be assumed that the number
of mature female runners is expected to increase.
Running is a natural entity, and over the course of a one mile run, an individual will make
approximately 1600 foot strikes, each causing propulsive forces at to act through the lower
limb (Requa, Deavilla, & Garrick, 1993; Spurgeon, 2005). Subsequently, despite
documented benefits, running is known to pose one of the highest risks for the occurrence of
injuries, and running related conditions; according to Requa et al., (1993) an average ratio of
running injury occurrence to hours training existed as 1:100. Similarly, from the millions of
people that are involved in running activities, 37-56% sustained an injury in the course of a
one year investigation (Van Mechelen, 1992). More recently, in a systematic review of 17
reports describing the incidence of lower extremity running related conditions among
runners, the overall incidence ranged from 19.4-79.3% per year (Van Gent, Siem,
Middlekoop, Van Os, Bierma-Zeinstra, Koes, 2007). The most common site of lower

[94]
extremity injuries was the knee joint, attaining an average of 7.2% to 50.0% of all injuries
across the studies (Van Gent et al., 2007).
3.1.2. Mature female runners and injuries.
It is widely recognised that females are at a greater risk of sustaining an overuse injury, with
research results focussing on the lower extremity, including the hip, knee and ankle joints
(Taunton, 2002). Several studies have investigated possible mechanisms through which these
injuries occur, and it has been suggested that differences in lower limb structural kinematics,
muscular characteristics, hormone conditions and gait biomechanics may be leading
contenders in injury causation (See Chapter 2).
Although injury rates are prominent among the female population, a specific cohort most
susceptible is that of mature female runners, as indicated by Taunton et al., (2002). In a
prospective study, age was a significant catalyst in injury rates; an age of 50 years and above
was deemed a risk factor for running-related injuries. Lanyon and colleagues supported this
theory of age as a risk factor, and excluded all volunteers under 40 years when assessing
prevalence of hip osteoarthritis due to changes that occur in the joints (Lanyon, Muir,
Doherty, & Doherty, 2000). Therefore, with increased participation of mature females in
running, understanding the effects of ageing on function and movement is increasingly
important (Hageman and Blanke, 1986).
Changes in movement patterns have previously been documented among the more mature
members of the population; however the majority of this research has focussed on males
during walking. According to Murray, Kory and Clarkson, (1969), increased age initiated
decreased stride length and cadence (increased cycle time), and increased duration of the
stance phase as a percentage of the gait cycle. These changes suggest that gait alterations
occur with age. Lui and Lockhart (2006) lent support to this notion of altered gait patterns
with age, demonstrating significantly greater extensor moments and internal rotation at the
knee joint among older walkers. Similarly, Nigg, Fisher and Ronsky (1994) suggested that as
age progresses from 20 to 79 years, there is a significant reduction in range of hip flexion and
extension, and knee flexion during swing phase, and from the age of forty years, rearfoot
[95]
eversion angle increases in females. However, although overuse running-related injuries are
prevalent among mature females, limited evidence exists as to the differences in kinetics and
kinematics among this group during running gait compared with younger female runners.
3.1.3. Biomechanics of motion and injury risk.
Within this investigation, both injuries and degenerative conditions are considered in their
association with specific biomechanical variables of running gait. The knee is the weight
bearing joint most commonly affected with injuries and overuse conditions, and during gait,
it is often considered that abnormal biomechanics of both the proximal and distal joints will
have a negative effect on the knee joint (Hunt et al., 2006). Although the pathomechanics of
running related injuries and conditions are not definitive, strong relationships seemingly exist
between knee conditions such as patellofemoral pain syndrome or osteoarthritis, and dynamic
knee joint loading. The forces that act at the knee joint during the stance phase of gait are
described in Chapter 2 (2.5.1).
3.1.3.1. Ground reaction force variables and injury risk.
As illustrated in Figure 2.13, the vertical component of the ground reaction force undergoes
two peaks. This is dependant on foot position, and strike pattern during gait. Ground reaction
forces are also dependent on speed of gait, and footwear characteristics, as is discussed in a
later section (Bates, Osternig and Sawhill, 1983). Centre of pressure changes with foot strike
were identified by Cavanagh and Lafortune (1980), who showed the location to vary from the
rear third, the middle third and the front third among rearfoot, mid foot and forefoot strikers
respectively. These discrepancies were also shown to affect the force trace, whereby the
impact peak was most distinguishable among the rearfoot strikers, and forefoot strikers have
been shown to produce smooth almost indistinguishable peaks late in stance (Lees &

[96]
McCullagh, 1984). As such, the vertical trace of the ground reaction force is used to indicate
the foot strike pattern of participants during running trials within biomechanical assessments.
The vertical ground reaction force is an approximate measure of the loading of the lower
extremity musculoskeletal system (Zadpoor & Nikooyan, 2011). According to Miller (1990)
a justification for measuring the vertical component of ground reaction force during gait is
the strong association between the magnitude of this variable and the development of overuse
injuries. According to the early work of Radin and colleagues, if joints are regularly subjected
to high force peaks as is expected during gait, degenerative changes take place in articular
cartilage and subchondral bone (Radin, Parker, Pugh Steinberg, Paul & Rose, 1973).
Similarly, Clement and colleagues have suggested that impact force peaks play a role in the
development of pain and injuries among runners (Clement, Taunton, Smart & Nicol, 1981).
In a slightly later investigation, Grimston and co-workers found that a group of females who
had experienced stress fractures of the lower limb exhibited significantly greater peak impact
forces than a group of injury free females (Grimston, Nigg, Fisher & Ajemian, 1994).
Similarly, according to Hreljac and colleagues, a comparison of biomechanical variables
between a group of injured and injury free runners illustrated significant increases in both the
magnitude and the rate of loading of the impact peak, suggesting that these variables may be
associated with overuse injuries (Hreljac, Marshall, & Hume, 2000). In contrast, Dixon and
colleagues studied a group of individuals with and without stress fractures and observed no
differences in vertical ground reaction force, loading rates or the horizontal braking force
(Dixon, Creaby, & Allsopp, 2006). This supported the earlier work of Crossley and
colleagues, who similarly showed no difference in vertical ground reaction force or loading
rate between a stress fracture and an injury free group (Crossley, Bennell, Wrigley, & Oakes,
1999). Therefore, due to the lack of unanimous results regarding the role of impact forces in
the development of injury and overuse conditions, it may be considered beneficial to
investigate these variables among a group of injury free, high risk individuals.
[97]
3.1.3.2. Subtalar joint motion and injury risk.
Alongside loading rates, subtalar joint pronation and knee internal rotation (Figures 2.8 and
2.11 respectively) have both been related to the development of knee injuries and debilitating
conditions (Johnson & Pedowitz, 2007). At the ankle-foot complex, the subtalar joint is
formed by the postcrolateral and the anteromedial joints, containing the inferior calcaneus
and the talus. This joint is therefore an arthroditic joint, and a degree of congruity occurs as
one portion attempts to slide over the other (Viladot, 1992). Three types of motion are present
at this joint, including flexion-extension, pronation-supination and adduction and abduction
(Viladot, 1992). Subtalar joint pronation is a combination of eversion, dorsiflexion and
abduction. According to Shorten (2000), although all three movements are involved in
pronation, rearfoot eversion is the most dominant, and therefore became a main focus of this
investigation among mature female runners.
Both pronation and supination of the subtalar joint are required movements of normal human
walking and running gait. Where pronation is required for shock absorption and adaptation of
the foot to the ground surface, supination enables the foot to act as a rigid lever in the
propulsion (push off) phase of gait to propel the runner forwards (Richards, 2008). Although
the mechanisms for running related injuries are ambiguous in origin, the association between
excessive rearfoot eversion and knee injury development is one link that is often reported
with significant outcome. The concept that runners who over pronate (have high magnitudes
of maximum rear foot eversion) are at a greater risk of sustaining an injury than those who
run with a lower maximum value of rearfoot eversion, is widely held by runners and coaches
alike (Hintermann and Nigg, 1998).
According to Hamill, Emmerik and Heiderschiet (1999), excessive rearfoot pronation and the
timing of which, are associated with excessive load and injuries at the knee joint. Willems,
and colleagues, investigated the dynamic biomechanical intrinsic risk factors of exercise
related lower leg pain. In a prospective study, these researchers found increased eversion
angle of the rearfoot, and accompanied increase in loading under the medial forefoot to be
significantly related to the development of exercise related lower leg pain (Willems, 2006).
Furthermore, Bates, James and Osternig (1978) suggested that it is often the timing of
rearfoot eversion that can be a contributing factor to injury occurrence.

[98]
In contrast, Burns and colleagues showed no link between pronation and the development of
an overuse injury in a retrospective study among triathletes. Interestingly a fourfold increase
in risk of injury was however seen among those athletes with a supinated subtalar joint during
gait (Burns, Keenan, & Redmond, 2005). Hreljac and colleagues similarly disputed the
association between pronation and running injuries, and showed runners who incorporated a
moderately rapid rate of rearfoot eversion to be at a reduced risk of injury (Hreljac, Marshall,
& Hume, 2000). It is however noted that this retrospective investigation involved a
comparison of injury free runners, and those who had sustained an injury in the previous year
but were free from injury at the time of testing. Therefore at the time of testing, both groups
were free from injury. Additionally, no significant difference was noted in the magnitude of
peak rearfoot eversion angle between the two groups, and the mean values of 4.0o and 5.9
o
for the previously injured and injury free groups were within normal ranges (Hreljac et al.,
2000).
During normal gait, maximum eversion, tibial internal rotation, and knee flexion all occur
during the same phase of stance. This relationship has been described by Seigler and
colleagues as kinematic coupling, whereby differences in the timing of pronation of knee
flexion result in contradictory rotations of the tibia and knee joint (Seigler, Chen, & Schneck,
1988). However if the subtalar joint continued to pronate as the knee extended, the tibia
would be subject to antagonistic counter rotations. Therefore, delayed or prolonged
maximum rear foot eversion could lead to excessive stress at the knee joint, increasing
vulnerability to injury.
It has been proposed that the link between rearfoot eversion and injuries is therefore
attributed to the coupling between these two joints. As described above, during heel strike of
running gait the distal portion of the calcaneus touches the ground and everts. As the talus
and the tibia are both contained within the ankle joint, and the talus is connected to the
calcaneas through the talocalcaneal interosseous ligament, movement of the calcaneum is
transmitted to the tibia (Jenkins, 1998). Therefore, at the distal end of the tibia, rotation of the
foot about the longitudinal axis is transmitted to the tibia, imposing a rotation about its long
axis. Thus, rotation of the foot from a supinated to a pronated position results in an internal
rotation of the tibia about its longitudinal axis (Stergiou, Bates & James, 1999). This notion
supports Hintermann and Nigg (1998) who stated that calcaneus eversion is linked through
the talus to tibial internal rotation. Furthermore, according to Olson (2007), increases in the

[99]
magnitude, velocity and acceleration of subtalar joint eversion result in a similar increase in
the magnitude, velocity and acceleration of tibial internal rotation. This in turn is then
transmitted to the knee to cause an increase in the internal rotation and adduction of the knee
joint. During the stance phase of gait, it is not only the magnitude of rear foot eversion, but
the means by which it is transferred into tibial internal rotation, that may be crucial to the
overloading and stress applied to the knee joint (Eslami, Begon, Farahpour, Allard, 2007).
This is supports Hintermann and Nigg (1998), who suggested the transfer of the eversion
movement of the calcaneus to the tibia may be associated with overloading of the knee joint.
Levinger and Gilleard (2005) similarly showed a correlation between the time of peak
eversion and tibial rotation among a group of walkers with patellofemoral pain syndrome.
Results indicated a delayed and prolonged rearfoot eversion among the patellofemoral pain
group, which was not however seen among the injury free group. It was therefore suggested
that prolonged rearfoot eversion reduced the time of tibial rotation, which may affect the
normal patellofemoral mechanics during gait (Levinger & Gilleard, 2005). Therefore, when
investigating mechanisms of injury to the knee joint, it is deemed important to assess the
magnitude, timing and velocity of rear foot eversion, as well as the similar variables
associated with tibial internal rotation.
Although the term ‘excessive’ has not been clearly defined, and the aetiology of lower limb
injuries is certainly multi-factorial, high values of pronation may disrupt normal
biomechanics during gait, and the weight of the literature presented above suggests a
relationship between excessive rear foot eversion and knee injuries.
3.1.3.3. Sagittal plane ankle motion and injury risk.
The range of ankle plantar flexion is greater than that of dorsiflexion, with average values for
running gait between 30-50o and 20-30
o of the former and latter respectively (Norris, 2004).
However these values often vary between individuals and it has been frequently suggested
that ankle dorsiflexion range can be a strong predictor of injuries to the lower limb (Pope,
Herbert, & Kirwan, 1998). Among heel strikers, long distance running involving a heel-toe

[100]
motion, works the ankle through its full range (Grisogono, 1984). Limitations to the available
range of motion are likely to impede gait and increase the risk of injury.
Ankle dorsiflexion range and ankle plantar flexion strength are important components of gait
(Drewes, McKeon, Kerrigan, & Hertel, 2009). Malliaras, Cook and Kent (2006) hypothesised
that impairment of these variables may increase the load applied to the patella tendon, and
result in injury (patellar tendinopathy). Their cross sectional study investigated the
association between range of motion and the presence of injury among volleyball players.
Results suggested that patellar tendinopathy was significantly associated with reduced range
of ankle dorsiflexion, when compared with normal tendons. Furthermore, less than 45o ankle
dorsiflexion range increased the risk of this injury by 1.8-2.8 times (Malliaras et al., 2006). It
is noted that this study investigated range of motion during jumping rather than over ground
running, however the association between dorsiflexion and injury still bears importance.
Drewes, McKeon, Kerrigan, and Hetrel (2008) later supported this theory, suggesting that
during gait, limited ankle dorsiflexion range may increase the risk of ankle sprains and
subsequent recurrent injuries. Reduced terminal dorsiflexion prevents the ankle from
reaching its stable closed-packed position at midstance during dynamic tasks such as running.
Additionally, reduced dorsiflexion may increase the vulnerability of the ankle to
hypersupination where the ankle inverts excessively and the medial longitudinal arch is lifted
from the ground; another risk factor for injury (Lindsay, 2008). Reduced range of motion at
the ankle may be a consequence of reduced flexibility in the muscles, a common factor
associated with increasing age. As well as investigating range of motion at the joint, the
eccentric action of the calf muscles that controls dorsiflexion, and its association to injury has
also been investigated. Naicker, McClean, Esterhuizen and Peters-Futre (2007) reported low
peak dorsiflexion torque as a factor associated with ankle injury among female hockey
players, consistent with the earlier findings of Baumhauer, Alosa, Renstrom, Trevino and
Beynnon, (1995) who found a greater plantar flexion to dorsiflexion strength ratio was
associated with a greater incidence of injuries among 145 college-aged athletes.
Inadequate dorsiflexion control may be a result of weakness in the anterior tibial muscles, or
the incidence of these muscles being overpowered by spasticity of the triceps surae muscles
(Whittle, 2003). The weight of the research supports the notion that altered ankle
biomechanics play a role in the genesis of running related lower limb injuries, and therefore

[101]
needs to be assessed when determining the cause or potential management of such conditions
(Willems, De Clercq, Delbaere, Vanderstraeten, De Cock, & Witvrouw, 2006).
3.1.3.4. Knee internal rotation and injury risk.
As previously described (section 2.4.3) the rearfoot and the knee are mechanically linked by
the tibia, and owing to the inclined axis of the subtalar joint in the sagittal plane, eversion of
the foot leads to internal rotation of the knee (Willems et al., 2006). As rotation of the foot
occurs with subtalar pronation, this motion is transmitted to the tibia through its longitudinal
axis (Stergiou et al., 1999). Although a small degree of rotation is inherent during gait,
excessive amounts have been related to injury development particularly at the knee joint. At
the knee joint, altered tibiofemoral rotation during the stance phase of gait is proposed to alter
the normal patella tracking and increase patellofemoral joint compression in specific areas
(Norris, 2004). According to Olson (2007), high values of internal rotation of the knee
interferes with normal knee function as the patella is shifted medially, which in turn increases
the vertical pull of the vastas medialis obliques, increasing the compressive forces acting on
the knee joint. Additionally, internal rotation causes decreased patellofemoral contact area,
which in turn increases the pressure in specific areas of the knee, increasing the wear on the
medial condyles of the knee joint (Norris, 2004), and according to Olson (2007), internal
rotation of the knee joint causes excessive overstretching or twisting of the ligaments or
tendons or increased shearing forces on the bursa surrounding the knee. In addition, if the
timing between rearfoot eversion and knee internal rotation is disrupted, the normal coupling
between the joints is affected and an antagonistic relationship occurs. This in turn could then
lead to soft tissue stress, and with multiple repetitions as would be expected during running,
an injury is likely to occur (Stergiou et al., 1999). Common knee conditions related to such
mechanisms include iliotibial band syndrome as the iliotibial band attempts to restrict the
excessive rotation of the tibia (Noehren, Davis, & Hamill, 2007). Additionally,
patellofemoral pain syndrome can occur with excessive internal rotation of the tibia, as this
can create lateral mis-tracking of the patella in the patella grove of the femur (Olson, 2007).

[102]
3.1.3.5. Q-angle and injury risk.
The Q angle is a measure of the alignment between the femur and the tibia in the frontal
plane (McGinnis, 2005). The patella is the largest sesamoid bone in the body, and is attached
to the quadriceps tendon above and the patella tendon below which inserts in to the tibial
tubercle (Norris, 2004). The vastus medialis, vastus intermedius, vastus lateralis and rectus
femoris are the four main elements of the quadriceps muscle which combine to form the
quadriceps tendon. This surrounds the patella and continues beyond it to become the patellar
tendon (Whittle, 2003). The direction of pull of the quadriceps tendon is along the shaft of the
femur, and that of the patella tendon is almost vertical; therefore a frontal plane angle is
formed between these two lines (Norris, 2004). Specifically the angle is created in the
intersection of two lines; the line from the anterior superior iliac spine to the centre of the
patella, and the line connecting the centre of the patella to the tibial tuberosity (Figure 2.4)
(Heiderscheit, Hamill, & Caldwell, 2000).
The Q angle is routinely implemented to assess anatomical alignment of the lower extremity
in regard to the patella (Sweden, 2001). In the clinical situation, malalignment has been
speculated as a risk factor for running injuries (Caine, Harmer & Schiff, 2009). During
activities such as running, the knee joint is exposed to high levels of stress due to the imposed
ground reaction force and the subsequent tension in the muscles crossing the joint. In normal
alignment, the resultant force ideally passes through the joint centre of the knee, minimising
the risk of injury occurrence. Normal values for the Q angle are in the region of 10o to 15
o;
according to the American Orthopaedic Association (AOA, 2011) Q angles reaching a value
above 15o are defined as “excessive” (Heiderscheit et al., 2000; Norris, 2004). High Q angles
can be a result of anatomical abnormalities such as the displacement of the tibial tubercles to
the outer side rather than the centre of the shin bone, or if there is an obvious valgus (knock-
kneed) position during standing (Grisogono, 1984). This was supported by Mizuno and
colleagues who showed a reduction in Q angle to reduce the valgus angle at the knee, and
reduce the lateral tibiofemoral contact pressure (Mizuno, Kumagai, Mattessich, Elias,
Ramrattan, Cosgarea, & Chao, 2001). Additionally, high Q angles have often been related to
increased pronation at standing or during the stance phase of gait (Grisogono, 1984).
As stated, greater Q angles produce malalignment of the lower extremity. An early study by
Subotnick (1975) suggested that increased Q angle causes greater rearfoot eversion, and

[103]
subsequent pronation, as a result of knee valgus. During running gait, where high forces are
attenuated through the lower extremity, large Q angles can therefore place the body at a
greater risk for injury occurrence. According to Grisogono, (1984), a large angle between the
patellar tendon and the quadriceps muscle causes the patella to deviate from its normal
pathway on the distal end of the thigh bone. During a repetitive movement such as running,
these mechanical factors may cause persistent minor dislocations of the patellar. This in turn
could lead to joint laxity of the medial ligaments, sub-patella swelling, patella tracking
problems, and ultimately disruption of the patellofemoral joint (Grisogono, 1984).
This theory was supported by Sweden (2001) who suggested that high Q angles cause a
valgus force to act on the patella, and can predispose the knee to lateral patella subluxation or
dislocation, increasing the vulnerability of the joint. Furthermore, the notion of a link
between high Q angle and patellofemoral injuries was illustrated by Messier, Davis, Curl,
Lowery and Pack (1991), who suggested that a relationship exists between certain
anthropometric and biomechanical measures, and patellofemoral pain. Results of their
investigation showed Q angle to be a significant discriminator between patients presenting
patellofemoral pain, and controls, lending support to the suggestion that greater values of Q
angle may be a contributing factor to the aforementioned condition. Similarly, Rauh,
Koepsell, Rivara, Margherita and Rice (2006) investigated Q angles among high school
athletes, and found boys with a Q angle above 15 o
and girls above 20o were twice as likely to
incur an injury during cross country running. This was supported in a subsequent prospective
study, which indicated runners with a Q angle above 20 o
had a risk of injury to the knee joint
1.7 times that of runners with an angle below 15o (Rauh, Koespell, Rivara, Rice and
Margherita (2007). According to Heiderscheit et al., (2000), the association between rearfoot
eversion and excessive Q angles as supported by Subnotnick, 1975, may subsequently result
in delayed maximum eversion angle and tibial internal rotation angle. As such, increased
torsional load is applied to the tibiofemoral joint as the knee attempts to regain its normal
extension phase. Therefore, in light of the literature presented, it is suggested that high Q
angles may be a contributing factors to injuries occurring at the knee joint during running. It
is therefore important to assess this variable when reviewing possible injury mechanisms in a
group of injury prone individuals.

[104]
3.1.3.6. The knee external adductor moment.
Alongside kinematic variables, a common clinical measure of gait when assessing knee
conditions is the knee external adductor moment; a feature consistently associated with
medial knee loading and osteoarthritis development (Lui & Lockhart, 2006). As described,
joint moments are a product of the force acting through the joint, and the distance of the force
from the joint centre (moment arm). Both the ground reaction force component and the
moment arm are independent variables that can each be manipulated separately, and have an
individual influence on the calculated moment (Hunt, Birmingham, Griffin, & Jenkyn, 2006).
As such, an increase in the magnitude of ground reaction force, or malalignment of a joint,
could both contribute to increases in joint moments (Richards, 2008). The relative influence
of the magnitude of the ground reaction force and the size of moment arm on the moment
calculated at the knee joint was investigated by Hunt et al (2006). Here it was shown that the
calculated moment was more greatly associated with the length of the moment arm than with
the magnitude of the ground reaction force variable (Hunt et al., 2006). Similarly, Stief and
colleagues later suggested that higher moments at the knee joint were considered a product of
malalignment as opposed to an increase in magnitude of ground reaction force (Steif, Bohm,
Schwirtz, Dussa, & Doderlein, 2011).
As well as suggesting a greater influence of moment arm length, both aforementioned studies
have also shown an association between greater moments and the development of injuries or
overuse conditions. Hunt and colleagues found significantly greater knee external adductor
moments among a group of osteoarthritis patients compared with a group of asymptomatic
individuals (Hunt et al., 2006). This was later supported by Davies-Tuck and colleagues, who
found the presence of medial mensical tears to be positively associated with an increase in the
peak knee external adductor moment among post menopausal women (Davies-Tuck, Wluka,
Teichtahl, Martel-Pelletier, Pelletier, Jones, Ding, Davis, & Cicuttini, 2008). Steif and
colleagues showed an increase in knee adduction moment, and knee internal rotation
moments among a group of young patients with cartilage degeneration compared with a
symptom free group (Steif et al., 2011). According to Stefanshyn and colleagues, loading of
the knee joint represented by calculation of the moments, may also play a functional role in
the onset of patellofemoral pain syndrome among runners (Stefanyshyn, Stergiou, Lun,
Meeuwisse, & Nigg, 1999). Results from their investigation illustrated significantly higher
[105]
frontal plane and transverse plane moments among a group of injured compared to injury free
runners, suggesting that increased moments may be a contributing factor to the onset of this
condition (Stefanyshyn et al., 1999). Although research has looked into the association
between the knee adductor moment and osteoarthritis, it is considered that the weight of this
research is based on symptomatic patients during walking trials. Within this thesis, a focus
will remain on running trials, to further investigate this association among runners.
The above research has highlighted the link between joint moments and injury, and expressed
the importance of considering the independent ground reaction force and moment arm
components individually when investigating moments as a potential mechanism for injury
and overuse conditions.
Increasing age is known to cause structural changes within the female body, specifically from
the age of 40 years and above (Lanyon, Muir, Doherty, & Doherty, 2000). These structural
changes may contribute to potential differences in the running gait patterns between young
and mature females. An understanding of the dynamic functional anatomy is of critical
importance to appreciate the pathomechanics of injuries and conditions such as osteoarthritis
(Olson, 2007).
3.1.4. Study One intentions and hypotheses.
The purpose of this study was to compare the running gait of young and mature females to
investigate whether mature females demonstrate gait characteristics that may predispose them
to the development of running related knee injuries and overuse conditions. One research
hypothesis was assessed:
1. When compared to a younger group, mature female runners will exhibit greater values
of peak rate of loading (vertical ground reaction force), peak knee internal rotation,
peak rearfoot eversion, and peak knee external adductor moment.

[106]
3.2. Methods.
3.2.1. Participation selection.
Thirty female participants (15 mature and 15 young) were recruited on a volunteer basis
through both the local Women’s Running Network and the University of Exeter Exercise and
Sports Science cohort. A letter was sent to the running network, refreshing previous alliance
and detailing the proposed study. Additionally, a similar email was forwarded to the younger
female students. Participants were included based on age, the younger group aged 18 to 25
years (mean 20.9 years, sd 1.9 years) and the mature group aged 40 to 60 years (mean 49.3
years, sd 4.6 years), as 40 years was classified as the age at which structural changes begin to
occur at the joints (Lanyon et al., 2000). All females had a minimum of 12 months running
experience, and were participating in a minimum of three one hour sessions of running per
week. 10 km run-time was used to indicate running standard (Table 3.2). Prior to gait testing,
each subject was requested to complete a PAR-Q health and safety form to quantify relative
ages, heights, mass, running experience and overall health status to ensure participants were
eligible for participation. All females were requested to state their experience of overuse
injuries, and the use of orthotics. Although not a study requirement, it was noted that no
orthotics were used or injuries presented by any participant. Participants also filled out the
KOOS (Knee Osteoarthritis Observation Survey) questionnaire as advocated by Roos and
Toksvig-Larsen, (2003), to assess the prevalence of or potential for knee osteoarthritis
development (Appendix B). Although unexpected in the younger age group, all subjects were
required to complete the form. A summary table of subject information is presented at
beginning of the results section (Table 3.2). The majority of previous studies have used the
WOMAC scale when assessing osteoarthritis presence and severity, however recently the
KOOS score has been shown to improve validity of results and deemed at least as responsive
as the former (Roos and Toksvig-Larsen, 2003). Therefore in light of the described research,
the KOOS score was considered most appropriate for the present study.
In order to assess the potential or presence of osteoarthritis, the survey recorded scores on
five subscales; Pain, Other Symptoms (Symptoms), Function in Daily Living (ADL),
Function in Sport and Recreation (Sport/Rec), and Knee Related Quality of Life (QOL).

[107]
Reviewing the results of the five Likert boxes then indicated the prevalence of osteoarthritis;
total scores ranged from 0 to 100 representing extreme to no symptoms respectively.
Ethical consideration was given to all aspects of the proposed research study. It was
emphasised that all participants were above the age of 18 years, the procedure was entirely
non invasive, and that all participants had the right to withdraw at any moment in time. A
proposal was handed to the ethical committee at the School of Sport and Health Sciences,
who approved the experimental protocol and enabled a solid foundation upon which to carry
out the intended research.
3.2.2. Motion analysis and data capture.
Subjects were required to wear their usual running attire including their own running trainers,
to encourage them to run in their usual style. Three-dimensional kinematic analysis of the
right lower limb was performed using an eight camera motion capture system (120Hz,
Automatic, opto-electronic system; Peak Performance Technologies, Inc., Englewood, CO.),
synchronised with a single floor mounted force platform containing strain gauge transducers
(960Hz, AMTI, Advanced Mechanical Technology, Inc., Massachussetts). Data were
synchronized within the Vicon software using initial foot strike as an automatic event
detection (vertical force > 10N). The eight cameras were positioned in an oval shape
focussing on the force plate. A static L-shaped frame denoting the horizontal axis of motion,
and calibration wand of length 0.98 m with two reflective markers of known distance apart
were used to calibrate the system.
The spatial movement of the lower limb was determined from the position of spherical
markers. Eleven reflective markers were attached to the greater trochanter, medial and lateral
knee at the tibial plateaus, the musculo tendinous junction where the medial and lateral belly
of the gastrocnemius meet the Achilles tendon, the mid tibia below the belly of the tibialis
anterior, the superior and inferior calcaneus, the lateral malleolus, the third proximal head of
the third metatarsal, and the distal head of the fifth metatarsal joint to denote the anatomical
position of the thigh, shank and foot (Soutas-Little et al., 1987) (Figure 3.1). This was based
on the model designed by Soutas Little, Beavis, Vertraete, & Markus, (1987), who used 11

[108]
reflective markers to define the anatomical co-ordinate system of the lower limb and track
segment motion during gait. Within this model, each body segment was modelled as a rigid
body, maintaining a constant distance between two points. Kinematic data were then filtered
with a quintic spline processor (peak performance default optimal smoothing technique using
5th
degree quintic polynomials; Woltring, 1985); the spline being a smooth curve passing
through a minimum of two points. The error was determined using a default method within
Peak Vicon Technologies, enabling raw coordinate data to be smoothed based on this
estimate of error in relation to a central trend (Wood, 1982).
Figure 3.1. Annotated illustration of marker placement along the right lower limb; both
anterior and posterior views. Not to scale.
Inferior calcaneus Superior calcaneus
Inferior calcaneus Toe
Anterior View: Right Leg Posterior View: Right Leg
Lateral malleolus
Lateral knee
Shank
5th
MTP
Greater trochanter
Superior Achilles
Inferior Achilles
Medial knee

[109]
Following the laboratory set up phase, subjects were given an adequate habituation period.
Each female was permitted to self select the approach distance to the force plate, within the
boundaries of the laboratory, and provided feedback regarding the running speed. Running
velocity was recorded using two infrared timing gates, situated 2 metres apart, categorising
each trial as acceptable at 3.5 m.s-1
± 5%.
All kinematic data were referenced to a relaxed standing position, where by neutral joint
angle data were obtained to provide anatomically relevant values. Each participant performed
a single standing trial on the force platform, enabling recognition of individual marker
location and body mass. These data were also used to compare standing Q angles between
females, and then subtracted from the kinematic values obtained during the running trials, to
calculate body position during each trial (Hunt et al., 2006). This method enabled running
data to be compared between individuals, without the influence of possible differences in
standing position.
Following the familiarisation period and collection of neutral data, the force plate was zeroed
and each individual performed ten running trials, ensuring complete right foot contact with
the platform on each occasion. Data were collected for one second within which the force
plate was contacted. Running trials where stride adjustment occurred prior to force plate
contact were repeated. Trials were deemed acceptable when running gait remained visibly
natural, complete right foot force plate contact occurred, running velocity fell within 5% of
the targeted speed, and markers remained visible throughout the trial. Each female was then
permitted a 30 second rest period to reduce the possibility of fatigue, the force plate was
zeroed, and the next trial commenced.
Ground reaction force data were sampled at a frequency of 960 Hz. The vertical force
component applied to the plate during ground contact was the main point of interest within
the ground reaction force data. Although not a requirement for this investigation, during the
familiarisation period, all females were categorised as heel strikers. As such, each force time
graph highlighted impact force peak, and the rate of loading denoted by the gradient during
the impact phase. Details of the method used to calculate loading rate are described in
Chapter 2 (2.5.1). Figure 3.2 shows a sample vertical force time history, highlighting
important aspects including loading rate.

[110]
Figure 3.2. Sample vertical force time history. Data taken from subject 19, trial 5.
Three-dimensional analysis of each subject’s running gait occurred through synchronisation
of the eight cameras situated in the laboratory. Kinematic data were sampled at a rate of
120Hz. Peak angles including peak knee internal rotation and rearfoot eversion were
determined and compared between subjects. Finally the transformed co-ordinates and ground
reaction force data were exported from Peak into MATLAB (Version 7.0, Mathworks, Inc)
which was used to determine frontal plane knee moments; the knee external adductor
moment. Moments were then normalised for body mass, and presented in Nm/kg, enabling
between subject comparisons.
Loading Rate
Peak Impact Force
Peak Active Force
End of Ground
Contact
Start of Ground
Contact

[111]
3.2.3. Kinematic and kinetic variables.
The Q angle was calculated for each participant during the standing static trial. Two seconds
of data were captured at 120 Hz, and an average value was calculated. The Q angle was
measured as the angle between the line from the medio-lateral coordinate (xtroch) of the
marker on the greater trochanter to the central patella measured between the two x-
coordinates of the markers on the knee, and the vertical line from the central patella to the
tibial tubercle (Kirtley, 2006). In this investigation, the raw value was measured as an
absolute angle, and the relative Q angle was calculated from the following:
Figure 3.3. Quadriceps angle calculation.
xmidknee = xkneelat – xkneemed
Equation 3.1
Qo = 180
o – Calculated absolute angle σ
o
Equation 3.2.
Q o
Q o
(xtroch)
(xkneelat) (xkneemed)
(xmidknee)
(xtroch)
σo

[112]
The following variables were assessed to characterise each individuals running gait, and
attain group means. Each angle was measured as the peak value during stance. A detailed
description of angle calculations is provided in Chapter 2. A summary of the variables
measured in this investigation is displayed below (Table 3.1). Statistical analysis of obtained
results involved a series of independent sample t-tests to identify significant differences
between the two groups for each variable measured.
Table 3.1. Summary table illustrating the specific running gait variables for analysis.
Gait Parameter Description
Kinetic
Variables
Peak Impact Force (Fz) Maximum value achieved in the first peak of
the vertical component of the ground reaction
force trace.
Peak Loading Rate
Gradient of vertical force time curve. The rate
at which the impact force occurs within first
50ms of force generation.
Kinematic
Variables
Peak Ankle Eversion
Angle
Angle created between the line through the
two points on the calcaneus, and those on the
inferior and superior Achilles tendon,
measured in the XZ reference plane.
Peak Knee Internal
Rotation
Rotation of the tibia relative to the femur
about a longitudinal axis embedded within the
tibia. When the frontal plane of the tibia is
parallel to the medial-lateral axis of the femur
knee rotation is measured as 0o.
Peak Dorsiflexion
Angle
Angle created between the foot and the tibia,
calculated in the sagittal plane. Neutral
dorsiflexion angle is 90o.
Joint
Moments
Frontal Plane: Peak
Knee Adduction
Moment
Moment produced as the net ground reaction
force passes medially to the knee; a
combination of the frontal plane force
magnitude and the moment arm to knee joint
centre.
[113]
3.2.3.1. Joint moment calculation.
Determination of the joint centre location and moments is described in detail in chapter 2 (2.4
and 2.6). Prior to initiation of data collection, two anatomical measurements were taken with
the consent of each participant. Width measurements of the forefoot (widest as observed in
shoe) and ankle (from lateral to medial malleolus bones) were taken using a set of callipers.
Based on the cadaveric studies by Dempster (1955), the ankle joint centre is considered to fall
within the body of the talus in the axis that passes through the line between the centre of the
lateral and medial malleoli (Nair, Gibbs, Arnold, Abboud, & Wang, 2010). As illustrated
above (Figure 3.1), a marker is placed on the lateral malleolus; therefore the ankle joint
centre is calculated using the position of this marker and the measured diameter to the medial
malleous. The diameter of the forefoot enabled the foot to be measured as a rigid body,
repressed as the centre line through the lower calcaneus marker and the mid point of the
forefoot. The foot centre of mass used for the moment calculation was then determined using
the data from Dempster (1955).

[114]
3.3 Results.
3.3.1. Participant information and analyses of KOOS assessment.
Table 3.2 presents a summary of participant information. Included are the results from the
KOOS survey, which revealed all subjects both mature and young to be categorised as low
risk in all subscales; pain, symptoms, activities of daily living, sport/recreation, and quality of
life, with an average score of 96.5 and 90.8 out of 100 for the young and mature respectively
(Table 3.2).
Table 3.2. Presentation of mean group subject information, including KOOS scores.
YOUNG
MATURE
AGE (years)
20.9 (1.9) 49.3 (4.6)
HEIGHT (cm)
165.5 159.3
WEIGHT (kg)
60.9 (1.3) 58.2 (2.4)
10k Time (minutes)
55 mins 57 mins
KOOS
Pain
97.9 (1.6) 94.2 (2.1)
Symptom
98.1 (1.5) 91.5 (3.5)
Activities of daily
living
98.7 (1.4) 92.9 (2.04)
Sport & Recreation
93.8 (4.2) 87.8 (2.5)
Quality of life
94.1 (4.04) 87.9 (3.4)
MEAN 96.5 ± 2.4 90.8 ± 2.9

[115]
A sample line graph illustrating group means for each subscale of the KOOS survey is
presented in Figure 3.4. Results from a one-way ANOVA for the two sets of results
illustrated a significant difference in the scores for the two groups (p = 0.0089, p<0.05)
(Table 3.3).
Figure 3.4. Line graph illustrating average KOOS scores.
Table 3.3. Results from a one-way ANOVA for group mean KOOS scores.
ANOVA
Average
Variance about the
mean
Mature Females 90.8 8.37
Young Females 96.5 5.52
Source of Variation
Degrees of
Freedom
P-value
Between Groups 1 0.0089*

[116]
Results from a series of regression tests are presented in Table 3.4; illustrating the
relationship of each variable with age of the mature females. Individual data illustrating these
relationships among the mature females are presented in Figure 3.5.
Table 3.4. Statistical output from regression tests between KOOS score for each subscale and
age.
Regression Analyses
R value P-value
Age: Pain -0.612 0.015*
Age: Symptoms -0.55 0.033*
Age: ADL -0.57 0.026*
Age: Sport & Rec -0.58 0.023*
Age: QOL -0.58 0.025*
Figure 3.5. Graphical representation of the association between individual KOOS scores and
age (mature females).

[117]
3.3.2. Assessment of biomechanical variables during running gait.
Individual mean data for each biomechanical variable is presented in the appendix (Appendix
C). Group averages are summarised below, highlighting where relevant, significant
differences between mature and young female runners.
Table 3.5. Table displaying kinematic and kinetic group means for each biomechanical
variable assessed during gait.
Mean results acquired from 10 trials.
MATURE
(n=15)
YOUNG
(n=15)
p value
Average Q Angle
(Degrees)
Mean 8.03 6.62 0.57
SD 7.3 6.3
Peak Impact Force
(BW)
Mean 2.0 1.9 0.49
SD 0.6 0.5
Peak Loading Rate
(BW.s-1
)
Mean 54.9 36.5 0.003*
SD 9.02 8.92
Ankle Eversion Angle
(Degrees)
Mean 11.1 6.7 0.00029*
SD 3.2 2.57
Ankle Dorsiflexion Angle
(Degrees)
Mean 23.04 27.64 0.00056*
SD 3.01 3.44
Knee Internal Rotation
(Degrees)
Mean 12.5 8.3 0.00007*
SD 2.3 2.57
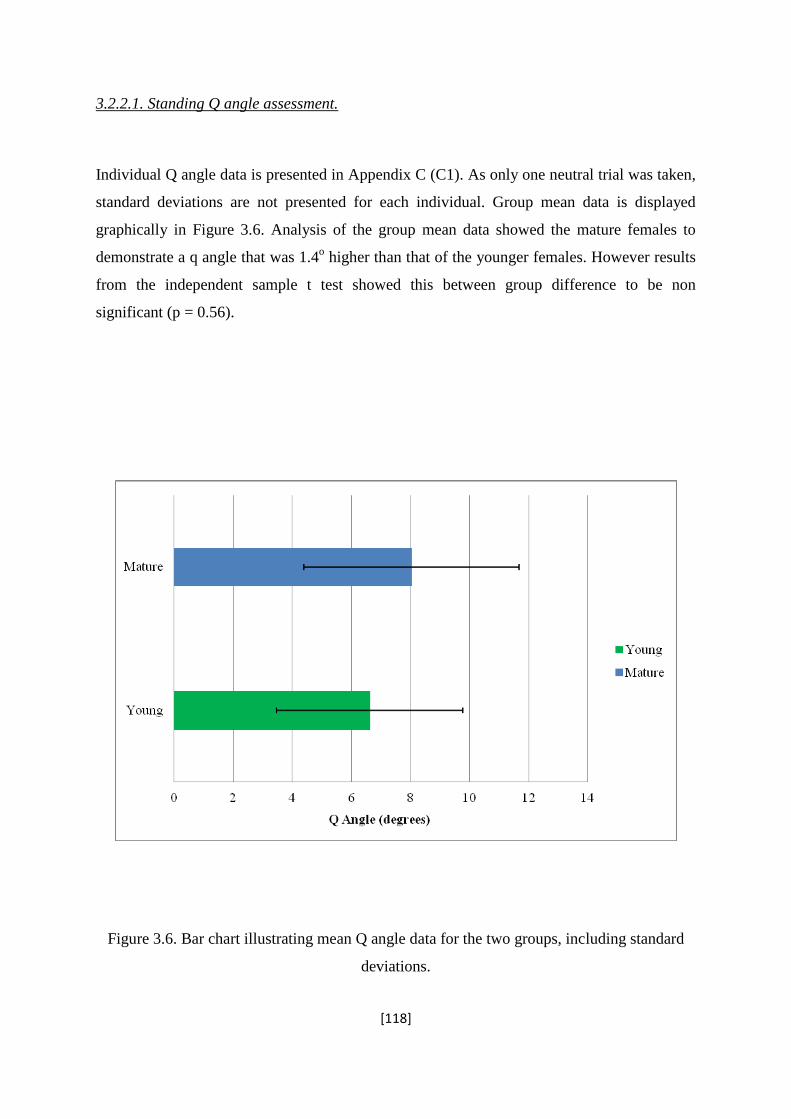
[118]
3.2.2.1. Standing Q angle assessment.
Individual Q angle data is presented in Appendix C (C1). As only one neutral trial was taken,
standard deviations are not presented for each individual. Group mean data is displayed
graphically in Figure 3.6. Analysis of the group mean data showed the mature females to
demonstrate a q angle that was 1.4o higher than that of the younger females. However results
from the independent sample t test showed this between group difference to be non
significant (p = 0.56).
Figure 3.6. Bar chart illustrating mean Q angle data for the two groups, including standard
deviations.

[119]
3.2.2.2. Ground reaction force variables.
Figure 3.7 shows a sample vertical force time graph illustrating results from 9 trials
performed by Subject 19 (young). One trial was omitted due to an error in the fore plate
measurement. Each curve exhibited two distinct peaks; peak impact force and peak active
force, a characteristic pattern indicative of a heel-toe running gait. Here it was noted that all
participants employed this same running style. As indicated in Table 3.5, no significant
difference was observed in peak Fz, however a significant difference was found in peak
loading rate at the p<0.05 level (p = 0.49, p = 0.003). Differences between the group means
for both variables are presented in graphical form in Figure 3.8. For clarity of the display,
standard deviations were not included in this graph. Among the mature females, a low and
non significant correlation was found between KOOS score and loading rate (r = -0.06, p =
0.0412).
Figure 3.7. Sample vertical force ground reaction time history produced by Subject 19
(young) (FzBW).

[120]
Figure 3.8. Sample bar graph illustrating mean peak vertical force (Fz), peak loading rate
(LR), and significance (p) values for both groups. Data scaled to body weight.
3.2.2.3. Rearfoot eversion angle.
Figure 3.9 illustrates a sample angle time history produced by subject 14 throughout the ten
running trials (mature). Data from two trials was omitted due to incomplete force plate
contact. As illustrated in the graph, the rearfoot moves from a slightly inverted position at
heel strike to peak eversion at early to mid stance. The rearfoot then returns to inversion as
ground contact progresses through to late stance and just prior to toe off. Calculation of the
group mean values illustrated an overall difference of 5.6 degrees between mature and young
female runners, which was significant at the p < 0.05 level (Table 3.5). This difference is
highlighted in the bar graph (Figure 3.10).
Fz, P = 0.49
LR, P = 0.003*

[121]
Ankle Eversion Angle - Subject 14 (Mature)
-15
-10
-5
0
5
10
15
20
0
0.02
50.
05
0.07
50.
1
0.12
50.
15
0.17
50.
2
0.22
5
Time (Seconds)
An
gle
(D
eg
rees)
Trial 1
Trial 2
Trial 3
Trial 4
Trial 5
Trial 8
Trial 9
Trial 10
Figure 3.9. Graphical representation of the ankle inversion/eversion angle during ground
contact for subject 14 performing 10 running trials.
Figure 3.10. Bar graph illustrating significant difference in rearfoot eversion angle between
the two groups.
P = 0.029*

[122]
3.2.2.4. Knee Internal Rotation Angle.
Figure 3.11 displays a bar graph highlighting the significant difference in knee internal
rotation angle between the two groups. An angle time graph for knee internal rotation
throughout the ground contact phase of gait is displayed in Figure 3.12. This displays a
sample graph illustrating angle-time curves taken from the fifth trial of two individual
subjects; one young and one mature. Calculation of group means showed a significant
difference in the peak knee internal rotation angle between the two groups (p<0.05, Table
3.5).
Figure 3.11. Bar graph illustrating significant difference in knee internal rotation angle
between the two groups.
LR, P = 0.00007*

[123]
Figure 3:12. Graphical representation of knee internal rotation angle during ground contact
produced by one sample subject from each group over one single running trial (Trial 5).

[124]
3.2.2.5. Peak ankle dorsiflexion angle.
Peak ankle dorsiflexion angle illustrated significant between group differences (p<0.05)
(Table 3.5). Mature female runners showed an average peak value 4.6 degrees less than that
produced by the younger runners. Figure 3.13 illustrates mean dorsiflexion angle trace for a
single participant from each group. Figure 3.14 presents the dorsiflexion graphs produced by
a mature female over the ten running trials. Data from two trials were omitted, as the graph
suggested an adjustment in stride had occurred in order to contact the force plate. A bar chart
of individual group means for each participant is presented in Figure 3.15, demonstrating an
average trend for lower peak angles among the mature group.
Figure 3.13. Ankle dorsiflexion angle throughout the stance phase of gait. Mean data for
subject 5 (mature) and subject 9 (young).

[125]
Figure 3.14. Dorsiflexion angle traces produced by participant 9 (mature).
Figure 3.15. Bar graph illustrating individual mean data for peak ankle dorsiflexion angle
throughout the stance phase of gait.

[126]
3.2.2.6. Correlation of Koos Scores with kinematic data.
Determination of a Pearson Product Moment Correlation Coefficient between KOOS score
and kinematic variables are presented in Table 3.6. Where significant, correlations are
presented in scatter diagrams (Figure 3.16a and b).
Table 3.6. Tabular presentation of results from a regression analysis between KOOS score
and kinematic variables.
Mean
Regression Analyses
R-Value P-Value
Rearfoot eversion angle
(degrees)
11.1 (±3.2)
0.78
0.00055*
Knee internal rotation
angle (degrees)
12.5 (±2.3)
0.50
0.019*
(a)
R = 0.78, p = 0.00055*

[127]
(b)
Figure 3.16 a and b. Correlation between KOOS score and rearfoot eversion angle (a), and
knee internal rotation angle (b) among mature females.
3.2.2.7. Knee joint moments throughout the stance phase of running gait.
Knee joint moments were calculated in the frontal plane of motion during the ground contact
phase of running gait. Group results are presented in Table 3.7. As shown, knee external
adductor moments elicited an average between group difference of 0.58 Nm/kg; a value
shown to be significant at the p < 0.05 alpha level.
Results from a regression analysis of the relationship between KOOS score and knee external
adductor moment showed a significant positive correlation between the two variables (r =
0.53, p = <0.05). This relationship is highlighted through the use of a scatter diagram (Figure
3.17).
R = 0.50, p = 0.019*

[128]
Table 3.7. Group means for the knee joint moments (Nm/kg) and occurrence times (s)
calculated throughout the stance phase of running gait. All moments presented are normalised
for body weight.
Group Data
averaged from 15
subjects
Frontal Plane Knee
Moment
Mean Peak
(Nm/kg)
Occurrence
Times (s)
Mature subjects
1.75±0.25
(Adduction)
0.2
0.009
P = 0.00041*
Young subjects
1.31±0.34
(Adduction)
0.2
0.008
Figure 3.17. Correlation between KOOS score and knee external adductor moment.
R = 0.53, p = 0.044*

[129]
3.4. Discussion.
3.4.1. Aims and hypothesis.
The main aim of the current study was to compare the running gait of young and mature
females to investigate whether mature females demonstrate gait characteristics that may
predispose them to the development of running related knee injuries and overuse conditions.
With reference to related literature, it was anticipated that mature women (aged 40 years and
above) would demonstrate significantly lower KOOS scores (indicative of more prominent
knee symptoms) and different characteristics of running gait when directly compared to
younger females. Specifically, it was hypothesised that mature women would demonstrate:
i. Greater rate of loading
ii. Greater knee internal rotation
iii. Greater rearfoot eversion angle
iv. Greater external knee adductor moments.

[130]
3.4.2. KOOS results.
Prior to initiation of gait testing, all females were assessed for the presence or potential of
knee osteoarthritis via a questionnaire. All subjects both mature and young, were categorised
as extremely low risk in all subscales; pain, symptoms, activities of daily living, sport and
recreation, and quality of life, with an average score of 96.5 and 90.8 out of 100 for the young
and mature respectively.
The knee osteoarthritis survey has been developed as an instrument to ascertain a person’s
opinion about the condition of their knee and associated problems. Although a range of other
knee assessment questionnaires exist, Roos and colleagues showed the KOOS to be more
sensitive and discriminative than the WOMAC assessment specifically the “sport and
recreation” and the “quality of life” subscale (Roos, Roos, & Lohmander, 1999). This was
based on an investigation of two groups; a group of patients diagnosed with osteoarthritis via
radiography, and a group of controls. The KOOS scores showed significant differences
between the two groups, demonstrating the efficiency of the survey in identifying
osteoarthritis (Roos et al., 1999). Among the female runners, the results from the KOOS
survey showed a significant difference between the two groups (p<0.05), with the mature
group producing significantly lower scores (indicative of greater symptoms). Therefore,
although both groups were categorised as free from signs of osteoarthritis, the results suggest
a sensitivity of the survey to identify change in opinion of joint health with age.
A regression analysis was performed to ascertain the possibility of a relationship present
between KOOS score and age among the mature females. Results illustrated an average
negative correlation with age (r = -0.6, p<0.05) present on each subscale, the most prominent
being the pain subscale; the greater the age, the lower the score. This therefore is consistent
with Hascall & Kuetter, (2002) who suggested that osteoarthritis prevalence increases with
age. Despite this, it is difficult to ascertain whether these results are expected, as currently no
average score exists for different age brackets. In addition, a series of regression analyses
were performed with the average KOOS score and the mean kinematic variables and
moments produced by each participant (Figure 3.16 a and b; Figure 3.17). The observation
that rearfoot eversion angle, knee internal rotation angle and knee external adductor moment
were negatively correlated with KOOS scores (r=-0.78, r = -0.50, r = -0.53; respectively)

[131]
suggests that these variables may be linked with the eventual development of osteoarthritis or
other conditions at the knee joint.
3.4.3. Kinetic variables: Peak impact force and loading rates.
Both kinetic and kinematic data were collected to provide a complete biomechanical
description of lower extremity changes during gait, in attempt to characterise differences for
two groups of different mean age. Following the scaling of all kinetic data to body weight,
results from the female runners showed no difference in magnitude of the peak impact force
between the two groups, suggesting no effect of age on this variable. Although little research
has been carried out to investigate the effect of age group on ground reaction force variables,
the results among the mature females appear contrary to one early study. In one investigation
of walkers, Martin and colleagues demonstrated a change in age from a minimum of 27.5 to a
maximum age of 73.5 years to elicit a significant decrease in vertical ground reaction force
(Larish, Martin, & Mungiole, 1987). However it is noted that the results presented did not
specify which phase of ground contact was measured, and the participants were not
performing running trials. In contrast, a more recent study performed by Bus (2003) showed
16 older runners (55-65years) to exhibit significantly greater peak impact forces when
compared to a group of younger runners (20-35 years). Here it was suggested that, although
not measured, a difference in fat pad thickness under the calcaneus may have been a factor in
these increased peak forces. More recently, it has been shown that peak vertical ground
reaction force is lower among patients with symptomatic osteoarthritis of the knee joint
(Childs, Sparto, Fitzgerald, Bizzani, & Irrgang, 2004). As such, the lack of change between
the mature and young female runners suggests that the effect of age on this variable of gait is
not certain.
The assumption that the impact peak of vertical ground reaction force can lead to overuse
injuries are based on theoretical models of increased force and joint damage (Hreljac, 2004),
however recent experimental studies appear to disagree. According to the results of a meta-
analysis, Zadpoor and Nikooyan (2011) showed no association between the magnitude of
ground reaction force and the development of stress fractures. Here it was suggested that the

[132]
ground reaction force cannot fully represent the loading of bones, and the impact force is, at
most, only one risk factor for injury to the lower extremity. It is the internal force attenuation
strategies (muscles, tendons, ligaments) that increase susceptibility to injury.
It has therefore been suggested that it is the rate at which the force occurs as opposed to the
magnitude of the peak that has a greater influence on injury rates (Hawley, 2000). High rates
of loading have been shown to be more damaging to the articular cartilage and subchondral
bone than are forces of greater magnitude that are applied gradually (Kenneth & Brandt,
1997). As such, the vertical rate of loading during the impact phase of ground contact was
assessed among the female runners. Results from the current study demonstrate an average
loading rate of 54.9 ± 9.0 BW.s-1
and 36.5 ± 8.9 BW.s-1
for the mature and young female
runners respectively, indicating the rate at which load is transmitted to the lower extremity
(Aguinaldo & Mahar, 2003). With a significance observed at the P<0.05 level, the higher
value observed for loading rate of ground reaction force for the mature females than for the
younger, suggests shock absorbency is relatively poor for mature females, which could relate
to poor function at the knee joint (Richards, 2008).
Loading rates can be harmful to the joint, if magnitudes exceed the physiologic tolerance
level for an individual. In an early mechanical test of bones, it was discovered that the fatigue
stress of bone (indicating the level of fatigue the bone can handle prior to damage) was
significantly lower when load was applied at a higher strain rate (Schaffler, Radin & Burr,
1989). As such, it could be suggested that high loading rates could increase the risk of
running related injuries (stress fractures) to the bones of the lower limb. According to Syed
and Davis (2000), high loading rates can also lead to articular cartilage damage, suggesting
that the mature females are at higher risk of developing conditions such as osteoarthritis. This
variable has been associated with accelerated progression of existing osteoarthritis, and onset
of osteoarthritis at previously asymptomatic joints (Mundermann, Dyrby and Andriacchi,
2005). It has been shown that rapid acceleration of load does not allow sufficient time for the
periarticular muscles, the major shock absorbers protecting the joint, to absorb the load
(Scott, Menz & Newcombe, 2007) suggesting that the joint is subsequently subjected to a
higher load.
The greater loading rate of ground reaction force observed for the mature females compared
with younger female runners in the current study therefore suggests that investigation of an
intervention to reduce loading rates in this population would be beneficial. If this could be

[133]
achieved, it may reduce the incidence or development of running related injuries such as
stress fractures and overuse conditions including osteoarthritis. The most common approach
to reducing this variable has been the introduction of a cushioned heel in footwear, either
through the selection of shoes with specific heel cushioning, or through the addition of a
cushioning insole within the shoe (Mundermann, Stefanyshyn & Nigg, 2001). Whilst
conflicting evidence exists regarding the success of this approach in reducing loading rate
(Withnall, Eastlaugh, & Freemantly, 2006), it is suggested that the potential of this
intervention in reducing this variable in mature female runners should be investigated further.
3.4.4. Kinematic variables and risk of injuries and overuse conditions.
3.4.4.1. Standing Q angle data.
The observation of no significant difference in Q angle between the mature females and the
younger group indicates that relative anatomic angle does not alter with age among this
population of females. These results support those presented by Hsu and colleagues, who,
despite illustrating a significant effect for gender, showed age to have little effect on factors
relating to axial alignment of the lower extremity (Hsu, Himeno, Coventry, & Chao, 1990).
In addition, it has previously been speculated that high rates of participation in activities that
involve quadriceps contraction, causes the Q angle to straighten or decrease in magnitude
(Hahn, & Foldspang, 1997). As such, it could be supposed that the similar level of running
undertaken by the females in each group may be an additional reason for the similar
quadriceps angles produced by the two age groups.
The Q angle is a measurement of patellofemoral joint biomechanics, commonly used in
musculoskeletal medicine, as an indication of uneven load at the knee joint, and changes in
lateral compartment pressure (Herrington & Nester, 2004). It has been demonstrated in the
literature that females present a greater Q angle when compared to males, however little
research has investigated the effect of age. The Q angle values calculated among the mature
and young females are low in comparison to those presented in the literature. In an evaluation
of lower extremity running injuries, Hamill and colleagues categorised high and low Q angles

[134]
as those calculated to be above and below 15o respectively (Hamill et al., 1999). It could be
considered that differences in calculation methods may affect the Q angle produced, as within
this investigation, the angle was measured from the greater trochanter, not the anterior
superior iliac spine as suggested in the literature (Kirtley, 2006). However as a standardised
method was used to calculate this angle for all females in this study, the particular method
used has little effect on group comparisons, and the lack of difference between the two
groups suggests little effect of age among the females in the current study.
3.4.4.2. Kinematics during running.
Examination of the kinematic data collected in the present study indicated a significant
difference in biomechanical movement patterns of young and mature females. Within this
investigation, mature females demonstrated an average peak rearfoot eversion angle of 5.6o
greater than the young females (p<0.05), which is consistent with the literature suggesting
that greater rearfoot eversion angles are commonly associated with increasing age (Scott,
Menz and Newcombe, 2007). As shown in Figure 3.9, the rearfoot progresses from an
inverted position at heel strike, to maximum eversion during early to mid stance. As all
females were categorised as heel strikers, this movement occurred as the forefoot contacted
the ground during early midstance, the body weight was positioned over the foot, and the
subtalar joint pronated to absorb impact forces and allow the foot to adapt to the terrain
(Maffulli, 2001).
One possible explanation for these high eversion angles could be the increased laxity of the
ligaments within the foot and ankle that has been shown to occur with age. Although the
association between arch height and subtalar pronation is not equivocal (Nigg et al., 1993),
according to Nigg and colleagues, laxity of the plantar ligaments supporting the arch of the
foot was higher among a group of mature compared to younger females (Nigg, Fisher, &
Ronsky, 1994).
It is suggested that the large magnitudes of rearfoot eversion produced by the mature females
could predispose this group to injury and debilitating conditions at the knee joint. High
eversion angles and accompanied loading under the medial forefoot have been associated

[135]
with injuries such as patellofemoral disorders and iliotibial band friction syndrome, and the
development of exercise related lower leg pain (Willems, DeClercq, Delbaere,
Vanderstraeten, DeCock & Witvrouw, 2006; Clanton, 1992). Similarly, a strong association
has been shown between flat-footed individuals and the incidence of knee joint osteoarthritis
(Reilly, Barker Shamley & Sandall, 2006); although no direct causative mechanism between
foot structure and osteoarthritis development was concluded. It is suggested that flat-
footedness may increase subtalar joint pronation due to increased laxity of the ligaments in
the ankle, subtalar joint and medial longitudinal arch that would enable the latter structure to
collapse. These results contribute to the justification for exploring the role of footwear in the
development of lower extremity conditions. Although not definitive in the literature, footwear
techniques have been proven to alter rearfoot kinematics during running, and will therefore
be explored in the following study among mature female runners.
According to Bus (2003), age has been shown to have little effect on rearfoot eversion, or
range of motion, among male runners aged 55to 65 years (Bus, 2003). Based on the results
from the current study among female runners, it could be considered that age related changes
in running gait occur during the third and fourth decades. As the standard deviations among
the females in this investigation were low, it is suggested that the results produced do
highlight a difference in rearfoot mechanics for mature female runners compared with
younger females.
An increased magnitude of subtalar joint pronation has also been associated with increased
knee internal rotation and suggested to increase lateral knee loading (Olson, 2007).
Hintermann and Nigg (1998) suggested it is not only the amount of rearfoot eversion, but the
transfer mechanism of eversion into tibial internal rotation that is crucial to knee joint stress,
and leads to lower extremity overloading. Felson et al., (2000) support this, suggesting
greater eversion of the subtalar joint causes the knee to assume a more internally rotated
position. This conflicts with external rotation during knee extension as the body weight
passes over the foot, increasing pressure on the soft tissue of the knee joint.
The present study supports these theories with significantly higher knee internal rotation
angles also observed for the mature females (p<0.05). As illustrated in Figure 3.12,
throughout the stance phase of one single running step, for both groups the knee moves from
a slightly externally rotated position, to peak internal rotation during the first half of stance.
Following this, the knee then returns to an externally rotated position, which coincides with

[136]
the peak knee external adductor moment occurring during mid to late stance. Peak internal
rotation angles were identified as 12.5 ± 2.3o and 8.3 ± 2.57
o for the mature and young
females respectively. According to Beckman (1980), excessive internal rotation of the tibia
and knee interferes with the normal knee-muscle force vectors, and shifts the patella
medially, causing increased compressive forces to act on the knee joint. Additionally,
Hunter, Dolan and Davis (1995) suggested that large values of internal knee rotation could
increase the force between the lateral aspect of the patella and the lateral femoral condyle,
increasing lateral knee pressure. Within their research, Hunter et al., (1995) further
suggested a link between this internal rotation and increased Q angles, which cause
displacement of the resultant force acting at the knee joint, increasing the irritation to the
articular cartilage of the knee. Although the standing Q angles were not different between the
two groups, the knee internal rotation during the stance phase of gait likely to have produced
an increase in Q angle. Therefore, in light of the present results, alongside a review of
relevant literature, both the greater ankle eversion angle, alongside the increased knee internal
rotation displayed by the mature female runners are deemed potential factors predisposing to
conditions at the knee joint.
Results from this investigation showed mature females to run with significantly smaller
angles of peak dorsiflexion during the stance phase of gait (p<0.05). Among heel strikers,
dorsiflexion occurs during both the heel contact and mid stance phase of running gait. As
illustrated in Figure 3.13, ankle dorsiflexion at heel contact was followed by plantarflexion
during early stance. Peak ankle dorsiflexion occurred during mid to late stance, followed by
the second peak of ankle plantarflexion in preparation for toe off. It is noted here that
variability within each participant’s data was seen in the dorsiflexion at initial contact. As
shown in Figure 3.14, a variation in initial contact angle of up to 10o could be seen between
trials, eliciting large standard deviations in the means. As such, this variable at initial contact
was not assessed between groups.
During the stance phase of running gait, dorsiflexion combines with subtalar joint pronation
and internal rotation of the tibia to act as a shock absorbing mechanism (Novacheck, 1998).
According to Brukner & Khan (2006), dorsiflexion is required during gait to enable the tibia
to rotate over the foot during the stance phase, without early heel lift or excessive subtalar
pronation occurring to compensate. Angles of peak dorsiflexion below 15 degrees are
occasionally considered a consequence of increased tightness of the gastrocnemius, and may

[137]
cause the subtalar joint to excessively pronate in order to utilise the dorsiflexion component
of pronation (Brukner & Khan, 2006). Although the mean angle produced by the mature
females was 23.04 ± 3.01o, as an average, these values are considered on the lower side of
ideal. Comparative studies in the literature have illustrated average dorsiflexion values among
uninjured runners to be around 25o to 30
o (Novacheck, 1998; Hamill & Knutzen, 2003), a
value higher than that produced during both walking and sprinting. As the average value for
the younger group was 27.6o, the lower values for the mature group could suggest decreased
shock absorbing ability among this latter cohort.
The effect of age on biomechanics during gait has previously shown mixed results, with
general theories suggesting that both posture and balance are the main variables that change
with increasing age (Kim, Lockhart and Yoon, 2005). Furthermore, it has commonly been
suggested that mature participants tend to adopt a slower gait, and decrease stride length
(Kim et al., 2005). This notion was supported in a sample study by Bus who showed a group
of more mature runners to automatically adopt a slower self selected running speed compared
to a group of younger participants (Bus, 2003). Among the female runners in the current
study, the speed of gait was controlled, reducing the possible effect on gait. As data were
based on one single running step, stride length was not measured. It is suggested that the gait
differences displayed by the mature and young females were unaffected by the speed and
stride changes that occur with age.
3.4.5. Knee joint moments.
Previous research has suggested that the peak knee external adductor moment is an indirect
measure of dynamic knee joint loading during gait; therefore this was assessed during
running and compared between mature and young females (Andriacchi, 1994). As displayed,
the mature females demonstrated an average moment 33.1% greater than the young; a
possible cause of greater malalignment among this group (Table 3.7). Figure 3.18 illustrates a
diagram of the external adductor moment acting at the knee joint; influenced predominantly
by the calculation of the moment arm from the knee joint centre to the line of ground reaction
force, and the magnitude of that force (Riskowski, Dufour, & Hannan, 2011).

[138]
Figure 3.18. Knee external adductor moment acting on the right knee joint. Source: Adapted
from Riskowski, Dufour & Hannan, Current Opinion in Rheumatology, (2011).
The knee external adductor moment (Figure 3.18) is generated by the combination of the
ground reaction force passing medially to the centre of the knee joint, and the perpendicular
distance from the line of this force to the knee joint centre (Andriacchi, 1994). This occurs
when the knees are in a varus position, and the moment acts to adduct the knee joint
increasing the load on the medial compartment (Russell and Hamill., 2011). As such, the
knee external adductor moment can be used as a valid and reliable representative of the
medial to lateral load distribution at the knee joint (Birmingham et al., 2007). The first to
propose this theory were Schipplein and Andriacchi, who predicted medial compartment
loads with a statically determinate muscle model, and suggested the knee external adductor
moment was the primary predictor of dynamic medial compartment load (Schipplein &
Andriacchi., 1991). Following this, Noyes and colleagues illustrated a statistically significant
correlation between medial compartment load and the knee external adductor moment among
ACL deficient patients, and Hurwitz and colleagues later significantly associated the knee
external adductor moment with the distribution of bone between the medial and lateral sides
of the proximal tibia (Noyes, Schipplein, Andriacchi, Saddemi & Weise, 1992; Hurwitz et al.,
1998). Finally, Zhao and colleagues demonstrated a significant positive correlation between
Moment lever arm from knee joint
centre to line of ground reaction
force
Ground reaction force vector
Knee external adductor moment

[139]
knee external adductor moment and medial compartment loads measured internally (Zhao,
Banks, Mitchell, D’Lima, Cowell., & Fregly, 2007).
When large moments present at the knee joint, the articulation between the medial aspect of
the tibia and the inferior medial femoral condyle experiences increased loads (Hunt et al.,
2006). As such high knee external adductor moments have been consistently associated with
features of medial compartment knee osteoarthritis, including joint space width, disease
severity and progression (Miyazaki, Wafa, Kawahara, Sato, Baba & Shimada, 2002). For
example higher baseline moments were observed among patients who went on to develop
radiographic progression of osteoarthritis compared to those that did not (Hurwitz, Summer,
Andriacchi, & Sugar, 1998). Furthermore, Bolt and Morag (2007) have even used peak
adductor moments as a direct reflection of internal loads at the knee joint when assessing the
effects of orthotics, supporting the association of moments and overuse injury potential.
Age, previous joint injury, and malalignment are well-known risk factors for the progression
of osteoarthritis at the knee joint. The knee external adductor moment has been associated
with osteoarthritis development both among severe and early stage patients. According to
Erhart and colleagues, the knee external adductor moment has been associated with severity,
rate of progression and treatment outcomes of medial compartment knee osteoarthritis
(Erhart, Mundermann, Elspas, Giori & Andriacchi, 2008), and Sharma et al., (2001)
significantly associated knee external adductor moments with disease severity among
symptomatic OA patients. Other longitudinal investigations have looked at the effect of knee
external adductor moments over time, and one study has showed the value of knee moments
at baseline to predict disease progression in the medial compartment of the knee joint over a
six year time frame (Miyazaki et al., 2002). Consequently, due to this association between
knee adduction moments and osteoarthritis, this biomechanical variable has become a
potential method to assess treatment outcomes. Many surgical outcomes and biomechanical
interventions are aimed at reducing the knee external adductor moment, to represent reduced
loading of the medial knee (Erhart et al., 2008).
Although the external adductor moment has commonly been investigated among
osteoarthritic patients, an association between the condition of the knee and the magnitude of
the knee external adductor moment has been shown among healthy mature females. In one
investigation, Davies-Tuck and colleagues demonstrated a significant correlation between
meniscal tears and knee external adductor moment, showing a link between this variable and

[140]
early signs of joint degradation (Davies-Tuck, Wluka, Teichtahl, Martel-Pelletier et al.,
2007). Among the mature female runners of the current study, the results from the knee
osteoarthritis observation survey showed a significant correlation between KOOS score and
knee external adductor moment (Figure 3.17). Although all females were categorised as free
from symptomatic osteoarthritis, this significant correlation suggests increased investigation
is required into the association between asymptomatic medial knee osteoarthritis and the knee
external adductor moment, perhaps using an alternative method for the quantification of
osteoarthritis presence.
A strong association between knee external adductor moments and medial compartment knee
joint osteoarthritis has been verified in the literature. As a result of this, the majority of
research has focussed on this biomechanical variable among more mature, osteoarthritis
prone, individuals. Therefore the direct association between knee external adductor moments
and age has not been extensively investigated. Rudolph and colleagues showed a change in
medial-lateral joint laxity among a group of elderly participants during walking, and
increased knee adduction, although the age range was above that of the mature females in this
study (Rudolph, Schmitt, & Lewek, 2007). It is suggested that the main association between
knee external adductor moment and age is due to the theory that osteoarthritis risk increases
with age. According to Loeser (2010) the concept that aging contributes to but does not
directly cause osteoarthritis is consistent with the multifactorial nature of the condition. It is
suggested that the high external adductor moments produced by the mature female runners
when compared to the younger runners in the current study could be a main cause of the high
risk of overuse conditions among the former group, particularly the incidence of medial
compartment knee osteoarthritis. The increased medial load indicated by the high knee
external adductor moment is in addition to the high lateral knee load suggested by greater
rearfoot eversion and knee internal rotation for this cohort. However, the relationship
between rearfoot movement and localized knee joint loading requires further investigation.

[141]
3.4.6. Limitations.
A limitation in this investigation was the difference in age range of the two groups, with a
range of 20 years and 6 years for the mature and young group respectively. This occurred due
to difficulty in recruiting mature females, and a need to maintain similar group sizes.
Additionally, the runway used in this study was only 10 metres long, which may have limited
each participant’s ability to attain a natural, consistent running style. However, all attempts
were made to overcome this potential limitation, and familiarisation trials occurred to enable
participants to run with a natural gait. Furthermore, participants were encouraged to repeat
trials did not feel reflective of their natural style. Force plate targeting was an additional
potential limitation; however participants were permitted to mark the floor once a
comfortable start position had been identified. Each female would track the pace from the
start position to ensure a natural running pace could be achieved, and force plate contact
could occur relatively effortlessly. Furthermore, during data analysis, horizontal velocity
values were assessed to ensure a constant pace was adopted. Finally, the footwear was not-
standardised. Participants wore their own trainers, in an attempt to reflect their natural
running style. As comparisons were made been ankle and foot biomechanics between the two
groups, it is considered that the different footwear worn by each participant may have altered
the gait. This in combination with the abundance of previous research that has investigated
the influence of footwear on running biomechanics, gave way to a possibility of including
footwear as a variable in future research within this group.

[142]
3.5. Conclusion.
This investigation was undertaken to compare the running gait of young and mature
females to investigate whether mature females demonstrate gait characteristics that may
predispose them to the development of running related knee injuries and overuse conditions.
The pathogenesis of both overuse injuries and knee joint osteoarthritis is complex and
involves many correlated factors that can be measured with gait analysis (Astephen &
Deluzio, 2003). A review of relevant literature suggested that certain gait parameters are
closely related to potential injury and osteoarthritis development, including rate of loading of
impact force, knee internal rotation and subtalar joint pronation (Norris, 2004). Furthermore,
high external knee adductor moments have consistently been demonstrated among
osteoarthritis patients, and been described as a significant risk factor for disease instigation
(Kaufmann, Hughes, Morrey, Morrey, & An., 2001; Landry, McKean, Hubley-Kozey,
Stanish, & Deluzio., 2007).
The results from this investigation support the proposed hypotheses; with higher
values of loading rate, internal rotation of the knee, ankle eversion and knee external adductor
moments observed for the mature females. In addition, lower rates of ankle dorsiflexion were
shown among mature females. This study lies among several other research papers in the
categories of overuse injuries and knee osteoarthritis. The results of the current study,
combined with the weight of the research literature, lend support to the initial notion that the
running gait of mature females exhibits certain characteristics that may predispose to lower
limb and knee injuries, and medial compartment knee osteoarthritis. Although results from
the KOOS survey provide little evidence of osteoarthritis present among the mature females,
it is possible that osteoarthritis or other conditions may develop over time if these runners
continue to exhibit such gait patterns.

[143]
3.6. Progression and further research.
3.6.1. Summary of background.
The first study within this research thesis produced the following summarised conclusions.
When comparing the biomechanical components of running gait between a group of young
(18-24 years) and a group of mature (40-60 years) females, significant differences were
observed. Kinetic analysis of the ground reaction force variables displayed a significant
difference in the loading rate data. The rate of loading during the impact phase of one running
stride was significantly greater for the mature women compared to the younger. The group
means for the peak knee internal rotation angle also showed significantly greater angle
magnitude for the mature group, as did the group means for the peak rearfoot eversion angle
exhibited during the ground contact phase. Group means for peak ankle dorsiflexion during
mid stance were shown to be significantly lower among the mature group. Finally, the frontal
plane knee moments (peak external adductor moment) produced during running were on
average 33.1 % higher among the mature females compared to the younger. A review of
relevant literature has suggested that each of these gait parameters have previously been
related to the initiation of joint deterioration and osteoarthritis development (Norris, 2004;
Landry, McKean, Hubley-Kozey, Stanish, & Deluzio., 2007). Therefore, in light of the
conclusions drawn, it appears clear that further investigation is required within this specific
population.
[144]
Chapter 4.
“The Influence of Motion Control Shoes on the Running Gait of Mature and Young
Females.”
4.1. Summary of Previous Study Findings and Conclusions.
As the age of female runners increases, certain biomechanical features of running gait are
subject to change. When compared to a group of younger runners, mature females have been
shown to run with increased rearfoot eversion, knee internal rotation, high loading rates, and
large knee external adductor moments (Lilley, Dixon & Stiles, 2011). A discussion of results
combined with those presented in the relevant literature suggested that each component of
gait could predispose this group to running injuries. As a commonly accessible form of
altering alignment during running, the effect of a motion control shoe on each component of
gait could provide insight into possible injury prevention techniques for this specific group.
4.2. Introduction and Review of Relevant Literature.
4.2.1. Incidence of running injuries among mature females.
Both gender and age have put mature female runners at a high risk of overuse injuries to the
lower limb (Taunton et al., 2002), and the development of knee joint osteoarthritis (Hunt et
al., 2006). Furthermore, it has also been noted that as the age of this population of runners
increases, the running gait patterns are subject to change (Ferber et al., 2003). The
relationship between advancing age and biomechanical factors influencing risk of overuse
injuries and conditions among females was therefore investigated in the previous chapter
(Lilley, et al., 2011). This study directly compared the running gait of mature (mean 48.2 ±
3.6 years) and young (mean 22.5 ± 4.8 years) females. Results from this initial study

[145]
illustrated mature females to demonstrate a significantly different running pattern compared
to the younger females (p<0.05). Specifically, the mature group were found to exhibit
significantly greater rate of loading, peak knee internal rotation angle, peak rearfoot eversion
angle, decreased ankle dorsiflexion, and increased peak knee external adductor moment,
during the stance phase of running (p<0.05). Discussion and interpretation of these results
with reference to related relevant literature suggested a link between each variable and the
potential for injury occurrence and the development of knee joint osteoarthritis. Specifically,
the high knee external adductor moment produced by the mature female runners was
associated with the potential for injury occurrence and increased medial knee joint
osteoarthritis risk (Hunt et al., 2006).
4.2.2. Excessive rearfoot eversion, knee internal rotation and loading rates during running.
As the foot is represented as a rigid structure, rearfoot eversion is commonly accepted as the
dominant and therefore representative component of subtalar joint pronation. Mature female
runners have been shown to run with high magnitudes of loading rate, rearfoot eversion
angle, and knee internal rotation when compared to a group of younger female runners. As
discussed in the previous chapter, excessive rearfoot eversion and knee internal rotation have
commonly been linked with increased risk and development of running related injuries. At
the distal end of the tibia, subtalar joint pronation allows for the absorption of impact forces,
and without this movement, the forces would have to be absorbed abruptly causing a high
level of stress on the supportive structures (Bates et al., 1978). However, in excessive
magnitudes, rearfoot eversion causes increased rotation of the tibia and knee due to the
coupling between these joints. This results in overloading of the knee joint and increased
injury risk (Hintermann and Nigg, 1998).
Rate of loading of ground reaction force during running describes the velocity with which the
ground reaction force vector is attenuated. A detailed description of ground reaction force and
loading rate calculation is described in Chapter 2 (2.5.1, Equation 2.4). According to Stergiou
and colleagues, the repetitive encounter between the ground and the foot during running
results in impact forces that must be absorbed by the supportive structures of the lower limb

[146]
(Stergiou et al., 1999). During heel strike running gait, these forces can be subdivided into the
impact forces as the segments decelerate at ground contact, and the active forces during push
off phase (Nigg, Bahlsen, Luethi, & Stokes, 1987). The peak of the impact force is defined as
that which occurs within the first 50 milliseconds after the heel has contacted the ground
(Nigg et al., 1987). During this impact phase, the momentum from the decelerating limb
alters at ground contact, resulting in the transient force transmitted up the skeleton
(Aguinaldo & Mahar, 2003). Although early research commonly considered that high impact
forces during running were associated with pain, injuries and damage to the articular cartilage
(Clement et al., 1981), more recently it has been suggested that it is the rate of loading of this
impact force that is more strongly associated with injury risk (Hawley, 2000). Similarly, Nigg
later suggested that combined theoretical, experimental and epidemiological evidence on
ground reaction impact force did not lend support to an association between this variable of
gait and chronic and/or acute running related injuries (Nigg, 2001). Despite this, although not
uniformly conclusive, the loading rate of impact force during running and walking has
previously been linked with injury risk and development. According to Nigg and colleagues,
high loading rates are linked with periodic stretching of the soft tissues in the joints, which in
turn is connected with pain and injuries in the lower leg (Nigg, Bahlsen, Luethi & Stokes,
1987). In support of this, Hennig and Lafortune associated increased loading rates with
higher levels of shock transmitted along the lower extremity, and Grimston and colleagues
linked loading rates to increased risk of bony injuries of the lower limb (Hennig &
Lafortune., 1991; Grimston, Ensberg, Kloiber, & Hanley, 1991).
In light of these theories presented in the literature, it has become clear that the running style
associated with mature females could be a contributing factor to the vast level of injuries and
overuse conditions among this particular sub population. However, prior to an investigation
of possible injury reduction techniques, both quadriceps strength and knee joint stiffness were
considered in their contribution to biomechanical gait related changes with age. Strength of
the quadriceps muscle is assessed using isokinetic technologies, and is an important factor in
the control of knee joint motion during running (Norris, 2004). Knee joint stiffness implies a
reduction in knee range of motion in the sagittal plane, and has been linked with the
development of knee joint osteoarthritis (Butler, Crowell, & Davis., 2003).

[147]
4.2.3. Knee flexion and injury risk.
It is clear that the flexion extension movement of the knee is cyclic, precisely controlled by
the predominant muscles in the upper leg. However gait abnormalities can involve the failure
of one or both of these actions to complete their required motion (Whittle, 2003). When
investigating the differences in maximum flexion angle between injured and non injured
groups, previous research has indicated varied results. Baliunas and colleagues indicated
greater knee flexion during walking in subjects presenting medial compartment knee
osteoarthritis compared to controls (Baliunas, Hurwitz, Ryals, Karrar, Case, Block and
Andriacchi, 2002). Similarly, a later study by Heiden and colleagues showed a group of
physician diagnosed osteoarthritis patients to exhibit significantly greater flexion angles at
heel strike, early and late stance when compared to a group of asymptomatic controls
(Heiden, Lloyd, & Ackland, 2009). However this is not a consistent finding among
osteoarthritis patients, and Mudermann and colleagues (2005) showed greater knee flexion
among a group of osteoarthritis patients when compared to controls (Mundermann, Dyrby, &
Andriacchi, 2005). Zeni and Higginson (2009) showed no significant difference in sagittal
plane knee joint motion between patients with moderate osteoarthritis and controls, whereas a
group of patients with severe osteoarthritis showed reduced knee range of motion.
Therefore it seems that in comparison to other gait parameters such as rearfoot eversion, the
knee flexion/extension movements are less definitive in their role as injury mechanisms. It
could be suggested that variation in findings when investigating diagnosed osteoarthritis
patients could be due to severity of the condition, length of time since diagnosis, and specific
location of the pathology. This is further highlighted in a direct comparison between the
study performed by Messier and colleagues who investigated ten osteoarthritis patients with
varying severities in all three compartments of the knee joint, and Schmitt and Rudolph who
investigated twenty eight patients with osteoarthritis confined to the medial compartment
(Messier, DeVita, Cowan, Seay, Young & Marsh, 2005; Schmitt & Rudolph, 2007). Results
from the former study illustrated no difference in knee kinematics and kinetics between
osteoarthritis patients and controls, whereas results from the latter study showed significantly
reduced range of motion among the osteoarthritis patients compared to the controls.
Some research has identified a link between the magnitude of peak flexion and extension
angles during gait and certain injuries and loading. Boden, Dean, Feagin and Garrett (2000)

[148]
investigated knee injuries, specifically injuries to the ligaments, among a group of athletes.
Their findings suggested that the majority of injuries occur during knee extension phases of
gait, as the quadriceps contract concentrically and power is generated (Novacheck, 1998).
Additionally, results indicated greater laxity in the hamstring flexibility parameters measured
among the injured, indicative of reduced flexion control and subsequent abnormal knee
motion during running. This notion that reduced flexion control may be linked to injury was
further supported by Noyes, Dunworth, Andriacchi, Andrews and Hewett (1996), who
demonstrated an increase in knee flexion and related decrease in extension moment during
the stance and terminal stance phases respectively, resulting in a significant decrease in the
calculated medial tibiofemoral loads among symptomatic patients with ligament complex
injury. Similarly, it has been suggested that increasing knee flexion angle may reduce
ligament loading, thereby reducing the risk of injuries to the knee joint (Cochrane, Lloyd,
Besier & Ackland, 2003). Cochrane et al., (2003) later supported this hypothesis, showing a
strength and balance training programme to significantly increase knee flexion angles and
decrease internal knee loading (Cochrane, Lloyd, Besier, Ackland & Elliot, 2003). This
theory has been investigated during landing movements, where reductions in knee flexion
angle are more common among females, and can increase risk of injury to the knee joint
(Lephart, Ferris, Riemann, Myers, & Fu, 2002). Although not investigated during running,
these authors suggest that weaker thigh muscles and reduced flexion control may cause an
increased stiffness of the knee and lower leg during landing, and increase risk of injury. This
was supported by Malinzak and colleagues, who showed females to exhibit reduced knee
flexion angles when compared to men during running, side-cutting and cross-cutting
activities suggesting different motor control patterns that may increase female risk of injuries
to the knee joint (Malinzak, Colby, Kirkendall, & Yu, 2001). Although previous literature
findings suggest an ambiguous link between knee flexion angle and injury, the literature
above illustrates a notion that reduced flexion during gait can increase the internal loading at
the knee joint; a possible mechanism of injury.

[149]
4.2.4. Knee abduction angle and injury risk.
As described in section 2.4.5.2, although the medial and lateral collateral ligaments are in
place to increase the stability of the knee joint, certain deformities and malalignments can
occur during standing and gait. This can therefore alter the inherent load attenuation
strategies present in the lower extremity. During the flexion and extension movements of the
knee throughout gait, it has been suggested that the patella should ideally travel in line with
the long axis of the femur (Norris, 2004). However, in a malaligned knee, the tracking of the
patella could be slightly distorted, subjecting the patella to minor dislocations during gait
(Norris, 2004). Furthermore, during running high loads are applied to the lower extremity,
and alignment is a key determinant of load distribution at the knee joint (Sharma, Song,
Felson, Cahue, Shamiyeh, and Dunlop, 2001). These loads are transmitted through the
mechanical axis of the lower extremity; a line progressing from the centre of the head of the
femur to the mid superior talus (Johnson, Leitl, & Waugh, 1980). In the normal knee, this line
passes through or very near to the centre of the knee joint (Maquet, 1984). This is highlighted
in the diagram (Figure 4.1).
In theory a shift from the collinear alignment of the hip knee and ankle affects the load
distribution at the knee; deviations to the position of the line can imply excessive load
bearing on one compartment. In a valgus knee, the contact of the bone surfaces are uneven
with reduced contact on the medial side. Therefore as the forces are transmitted through the
knee, higher loads are applied to the lateral knee, increasing the wear on this area of the joint,
and increasing the susceptibility to related conditions such as lateral compartment knee joint
osteoarthritis (Johnson et al., 1980).

[150]
Figure 4.1. Load (R) acting through the centre of the knee joint in a neutrally aligned knee.
Source: Maquet, (1984).
Early research by Maquet (1976) illustrated the significance of varus and valgus deformities
in the coronal plane to the development of osteoarthritis of the medial and lateral
compartments of the knee respectively. This notion was later supported by Sharma, Song and
Felson (2001), who performed a longitudinal study to assess the varus and valgus alignment
among 237 subjects, and the development of osteoarthritis. Results from this study illustrated
varus and valgus alignments to produce a fourfold increase in the risk of medial and lateral
tibiofemoral osteoarthritis respectively; determined by the presence of tibiofemoral
osteophytes. Similarly, this was again supported in an 18 month follow-up study, where
Cahue, Dunlop, and Hayes (2004) demonstrated malalignment to influence the likelihood of
patellofemoral osteoarthritis development. Varus alignment was shown to increase the risk of
osteoarthritis isolated to the medial patellofemoral compartment, and a valgus alignment to
the lateral patellofemoral compartment.
In the normal knee, the medial compartment carries a greater proportion of the load when
compared to the lateral knee, and during gait it has been suggested that the loads across the

[151]
medial compartment are over twice the magnitude of those acting through the lateral
compartment (Baliunas, Hurwitz, Ryals, Karrar, Case, Block, & Andriacchi, 2002). As such,
although osteoarthritis is common in both the medial and lateral compartments of the knee
joint, the prevalence of the condition is greater in the former location (Maquet, 1984).
Therefore the weight of the research suggests that the mechanical effects of lower limb
malalignment on load distribution create a biological possibility that varus and valgus
alignment can markedly increase the risk of debilitating conditions such as osteoarthritis
development at the knee joint.
4.2.5. Knee joint stiffness.
4.2.5.1. Laxity.
Knee joint stiffness and laxity are clinical measures of knee joint behaviour, and adopt an
inverse relationship (Hewett, Shultz, & Griffin, 2007). Laxity refers to the stability of a joint,
and subsequently represents the degree of abnormal motion occurring at that joint (Alter,
2004). During the stance phase of gait, the force is applied externally to the knee joint to
displace the tibia on the femur (Hewett et al., 2007). Defined, laxity is the amount of joint
displacement at a given force, and can lead to episodes of instability of the knee joint (Lewek,
Rudolph, Snyder-Mackler (2004).
According to Gali, Rigoldi, Brunner, Virji-Babul, & Giorgio (2008) the impedance of
dynamic joint stabilisation associated with joint laxity has been related to increased incidence
of musculoskeletal deformities. Too little stiffness at the joint may allow for excessive joint
motion leading to soft tissue injury (Butler et al., 2003). Granata, Padua and Wilson (2001)
demonstrated reduced knee joint stiffness and increased laxity among females during a
hopping task, which could provide explanation for higher rates of knee ligamentous injuries
among females. Furthermore, unsteady gait can lead to increased cautiousness during
walking and running, in turn causing lower velocities and shorter stride length (Gali et al.,
2008). Laxity of the knee joint is suggested to be multifactorial, resulting from such factors as

[152]
increased capsule-ligamentous laxity, altered lower extremity muscular strength, structural
damage to the knee, and changes in neuromuscular control (Miura, Takasugi, Kawano,
Manabe, & Iwamoto, 2009). Furthermore, excessive joint laxity can be a result of chronic
injury or develop through congenital or hereditary conditions (Alter, 2004).
4.2.5.2. Joint stiffness.
Stiffness of a joint in the human body in simple terms involves the loss of normal active and
passive range of motion for that joint (Copeland, Gschwend, Landi & Saffar, 1997). Range of
motion is important for activities, as various degrees of movement are required for mobility
(DeLisa, Gans, & Walsh, 2005). Biomechanically, knee joint stiffness can be assessed using
three-dimensional gait analysis, and is defined as follows:
kjoint = ΔM/Δθ
Equation 4.1
where ΔM reflects change in joint moment and Δθ reflects change in joint angle (Farley et al.,
1998). Therefore in theoretical terms, greater stiffness of the knee joint in the sagittal plane
will result from reduced knee excursion solely or in conjunction with higher knee moments
(Dixon, Hinman, Creaby, Kemp & Crossley, 2010).

[153]
Figure 4.2. Image of knee joint stiffness in the sagittal plane of movement. Torsional stiffness
calculated as the gradient of the best fit line through the moment-angle curve, from maximum
flexion moment to extension moment. Graph created from sample data.
As illustrated in Figure 4.2, reduced magnitude of joint angle or increased joint moment will
cause an increase in the torsional stiffness measured. However, previous research has
suggested additional explanations for changes in dynamic joint stiffness. Although the
regulation of the spring-mass system of the leg is predominantly controlled by the central
nervous system, the situation at the joint is somewhat different (Kuitunen et al., 2002). The
stiffness of a single joint is influenced by several variables. One of the most frequently cited
factors affecting stiffness is the co-contraction of antagonist and agonist muscles, and
according to Zeni and Higginson (2009) high antagonistic muscle activity can underlie an
increase in joint stiffness. According to Hobara et al., (2009), muscle morphology may also
affect stiffness, and when compared to the ankle joint, the muscles surrounding the knee have
longer muscle fibers, larger volume, and greater cross sectional area. These characteristics
may produce greater joint moments, increasing stiffness, which could additionally provide
explanation for the greater contribution that knee joint stiffness has to overall leg stiffness
(Hobara et al., 2009). When muscles are shorter than their ideal length they are at a
biomechanical disadvantage when it comes to generating force. Dixon et al (2010) later

[154]
supported this notion suggesting that active elements at the joint including muscle strength,
activation and co-contraction may all influence joint stiffness. Furthermore, knee stiffness has
been associated with viscoelastic changes in the joint, changes in articular cartilage structure,
osteophytes formation, and thickening and stiffening of supporting ligaments (Oatis et al.,
2006). Finally, although possibly not a direct cause, it is possible that stature and body mass
index also have an effect on changes in stiffness at the joints (Oatis et al., 2006).
The magnitude of stiffness at the joints has previously been reported to increase with the
demands of the activity undertaken, and changes in gait pattern could therefore be related to
the magnitude of stiffness at the joints (Butler et al., 2003). According to Butler et al., (2003)
as the body is exposed to increased forces; greater resistance to movement is needed to
maintain controlled movements. Changes in stride length and walking speed have been
shown to alter joint angles and moments, therefore affecting stiffness (Zeni & Higginson,
2009), and it has been shown that for a given velocity, a decrease in stride length is
associated with increase in stiffness (Farley & Gonzalez, 1996). This is important for
performance, as although increasing stride length may improve performance, there may be a
negative side affect of increased stiffness which in turn could consequently decrease running
velocity. This was supported by Kuitunen, Komi and Kyrolainen (2002) who reported
significant increases in knee stiffness with increase in sprinting velocity. Additionally, studies
have previously suggested that changes in torsional stiffness in the sagittal plane may be
related to foot strike pattern during gait (Butler et al., 2003). As highlighted previously, in
their study of tibial shock in forefoot and rearfoot striking runners, Laughton, McClay Davis,
and Hamill (2003) assessed ankle, knee and leg stiffness to provide additional information on
shock attenuation among the two groups. Results illustrated that among the forefoot strikers,
knee flexion excursion was lower than the rearfoot group, indicative of higher knee stiffness
when striking with the forefoot.
4.2.5.3. Methods of assessing stiffness.
Joint stiffness can be identified as either the symptom of pain on moving a joint, or the
physical sign of reduced range of joint motion. Patients will recognise stiffness using the first

[155]
method; however in the clinical setting the final method is preferred by practitioners to
provide an objective measure of joint stiffness. Different methods of assessing joint stiffness
are likely to produce different results, and as such caution is warranted when making
comparisons between results from non uniform methods (Butler et al., 2003).
As illustrated in Figure 4.2, knee joint stiffness can also be biomechanically determined by
calculating the gradient of the regression line through joint moment against joint angle data
(Butler et al., 2003). This method is made possible through the use of three-dimensional gait
analysis, and although often not applicable to the clinical setting, it provides a reliable
objective measure of stiffness ideal for research comparisons.
One of the most common methods of clinically assessing stiffness is through the use of the
self-report tool (Oatis, Wolff & Lennon, 2006). The Western Ontario and McMaster
Universities Osteoarthritis Index (WOMAC) is a survey comprising 24 separate questions, 5
addressing pain, 17 addressing function, and 2 addressing stiffness. Within this survey,
stiffness is identified as restriction or slowness in the ease with which the joint can be moved.
Although this tool has been validated and is often used when assessing treatment outcomes,
the test-retest reliability of the WOMAC scale is low (Bellamy, Buchanan, Goldsmith,
Campbell & Stitt, 1988). Additionally, it is limited in its ability to specify solely an
individual’s complaint of stiffness (Oatis et al., 2006). According to Dixon et al (2010)
stiffness is difficult to both define and quantify using the self report assessment, as substantial
individual variability may exist in the interpretation of what constitutes stiffness. Therefore
although easy to carry out, the reliability of a self report tool is limited, and it is suggested
that future research should look to develop an alternative clinical tool to augment self-
reported results (Dixon et al., 2010).
4.2.3.4. Knee joint stiffness, osteoarthritis and injuries.
Stiffness is a common complaint of patients with osteoarthritis. Clinically, knee joint stiffness
begins with inflammation, immobility, and quadriceps weakness (Norris, 2004). Patients
presenting knee stiffness are unable to gain full extension at the knee joint, and patella glide
is restricted. Ranges of motion deficits are a well known sequelae of osteoarthritis. Knee

[156]
osteoarthritis classically involves extension lag, but flexion may also be limited. The
pathophysiology of range of motion deficits is most probably multifactorial in origin
including articular changes within the joint as well as shortening of myotendinous structures
in areas of pain or weakness. Decreased range of motion is often found at other joints within
the same limb and even in the contra lateral limb.
Reduced knee range of motion and increased knee joint moments associated with knee joint
stiffness could increase the rate of loading during gait, and subsequently increase risk of knee
joint injuries (Butler et al., 2003). As such, some studies have investigated knee joint stiffness
as a possible risk factor. In one prospective study, although stiffness was not directly
measured, a group of non injured runners were shown to run with decreased ground reaction
forces, but similar knee flexion angles compared to a group of runners that sustained an
injury, suggesting the latter group had higher joint moments and subsequent stiffness values
(Hewett et al., 1996). A similar finding was demonstrated in a retrospective study, where
Williams (2003) showed a group of high arched runners with increased leg stiffness to sustain
an increased number of injuries when compared to low arched runners with reduced stiffness
levels. In contrast, Granata and colleagues suggested low levels of stiffness are a risk factor
for injury, due to increased instability of the joint (Granata, Padua, & Wilson, 2001).
As illustrated, although knee joint stiffness has been linked with both osteoarthritis and
injuries, the results in the literature are not conclusive. When investigating the association
with osteoarthritis, increased research is required into the role of stiffness as a cause or
consequence of the condition. According to Butler et al (2003), an increased number of
studies are required to substantiate the association between joint stiffness and injuries and
osteoarthritis, with a prospective style enabling the determination of stiffness as a risk factor
or consequence.
Dynamic knee joint stiffness describes the interaction between changes in joint moment and
changes in joint angle during the stance phase of running and walking gait (Zeni &
Higginson, 2009). Knee joint stiffness has previously been related to degenerative changes,
and as such, it has often been characterised as one of the 6 criteria for clinical diagnosis of
osteoarthritis (Gignac, Davis, Hawker, Wright, Mahomed, & Fortin, 2006). Based on the
review of literature presented in Chapter 2 (2.7), within this investigation, knee joint stiffness
during running is investigated, in its association with knee joint loading and potential
osteoarthritis and injury risk. According to Farley and colleagues, joint stiffness is a

[157]
quantitative measure of the resistance that muscles and soft tissues provide during joint and
limb movement (Farley, Houdijk, Van Strien, & Louie, 1998). As such, increases in muscle
activation are related to increases in joint stiffness (Gerritsen, van der Bogert, & Nigg, 1995).
In terms of gait, analysis of dynamic knee joint stiffness may provide insight into the
different strategies used to overcome instability of the knee joint. Previously, it has been
shown that women demonstrate lower values of joint stiffness, and consequently higher
levels of instability compared to males (Hsu, Fisk, Yamamoto, Debski & Woo, 2006). This
suggests that women may have lower muscle strength compared to males; a potential risk
factor for the development of degenerative conditions and injuries at the knee joint
(Cammarata, & Dhaher, 2008). The association between joint stiffness and variables of gait
was further supported by Farley and colleagues who suggested that foot strike pattern directly
affects stiffness of the ankle and knee joints, although this was shown among participants
during hopping movements (Farley et al., 1998). In addition, it has previously been
postulated that increased stiffness is associated with decreased knee range of motion and
increased peak forces, leading to increased loading rates (Butler et al., 2003). However the
direct relationship between knee joint stiffness and loading rates is not conclusive during gait,
and it has previously been shown that stiffness did not contribute to rate of loading of ground
reaction force during walking (Dixon, Hinman, Creaby, Kemp & Crossley, 2010). Dixon and
colleagues also investigated the association between knee joint stiffness and the knee external
adductor moment among osteoarthritis patients during walking, and found no association
between the variables (Dixon, et al., 2010). However, as is apparent in one investigation, and
among many others, the association between knee joint stiffness and features of gait that may
lead to osteoarthritis has commonly been examined among patients already diagnosed with
the condition. Therefore the affect of structural changes associated with the condition may
influence stiffness data and gait variables (Dixon, et al., 2010). Furthermore, the association
between knee joint stiffness and osteoarthritis risk has previously been an indirect one, where
loading rates have often been used as representatives of joint stiffness (Butler et al., 2003).
Although the direct association between knee joint stiffness and injury rates is not well
established, knowledge of knee joint stiffness among mature females may provide insight
into the differences displayed in running gait, and the high loading rates among this group.
Furthermore, high magnitudes of knee joint stiffness may support the theory that it is the

[158]
running gait of mature females that predisposes this group to degenerative joint changes and
injuries among this group.
4.2.6. Quadriceps strength.
4.2.6.1. Factors influencing muscle strength.
Muscular strength is an accepted component of health related fitness, and largely affects
human ability to perform tasks of daily living without undue physical stress and fatigue.
Strength is formed from an interaction between the musculoskeletal system and systems that
provide metabolic, hormonal and neurologic support (Frontera, 1999).Whether muscles
contract for strength or endurance, many factors influence the development of active forces in
the muscles (Rybski, 2004). The main determining factor influencing muscle contraction is
the physiological makeup of the muscle, including muscle fiber type, arrangement and size
(Rybski, 2004). However other factors including age, gender, health status, psychological
well being, and level of physical activity also present an immediate and direct impact on
muscle function (Frontera, 1999). Additionally, joint position and type of muscular
contraction affect the torque produced, however during assessment these are generally
controlled for (Clarkson, 1999). As two of the factors involved in this thesis, both age and
gender effects on muscle strength are assessed in greater depth.
4.2.6.1.1. Gender.
According to Rybski (2004), females are approximately 40 to 50% weaker in the upper body
and 20 to 30% weaker in the lower body when compared to males of similar age. Many
factors are suggested to contribute to this discrepancy, giving men a mechanical advantage
over women, enabling them to handle more weight and generate more power. The large
gender difference in upper body strength has previously been accounted for by the greater

[159]
proportion of tissue distributed in the upper body among males (Miller, MacDougall,
Tarnopolsky and Sale, 1993). One additional gender difference includes the shorter
extremities and subsequent length of bones in the female skeleton. Finally, the reduction in
strength in the lower extremity has been previously related to the wider pelvis relative to
length of the femur inherent in the female body. This produces an increased Q angle, which
has been shown to negatively affect optimal muscle firing in lower extremities, suggesting
the presence of a relationship between muscle strength and biomechanical alignment
(Holloway & Baechle, 1990). This effect was further supported by Kumar (2004) who
suggested that instantaneous muscle length, influenced by joint angles and body position, is a
crucial determinant of strength. In addition, according to Miller et al., (1993) women were
shown to display 30% smaller muscle cross sectional area for the vastas lateralis muscle
when compared to aged matched males, affecting the absolute muscle strength achieved.
4.2.6.1.2. Age.
The ability of the muscles to produce torques of high magnitude increases from birth to a
maximum point between 20 and 30 years of age (Clarkson, 1999). From the age of 65
decreases in isokinetic muscle strength occur at a rate of approximately 2.5% per year,
depending on specific muscle group and contraction velocity (Chandler & Brown, 2008).
This progressive loss of muscle mass with increasing age is termed sarcopenia (Chandler &
Brown, 2008). This notion is supported by Robergs and Keteyian (2003) who suggested that
muscle strength begins to decline around the age of 40 years, with an accelerated decline after
60 years. According to Larson, Grimby and Karlsson (1979), it is reasonable to assume that
an important part of the changes in muscle strength with age takes place in the muscle tissue
itself due to muscle atrophy (decrease in the mass of the muscle). Clarkson (1999) suggested
a decrease in the size and number of muscle fibers, an increase in connective tissue and fat,
and a decrease in the respiratory capacity all contribute to an overall decrease in strength of
muscles as age progresses. Additionally, as age increases, the tendency towards a sedentary
lifestyle increases, and decreased muscle mass has often been attributed to such changes in
lifestyle and decreased use of the musculoskeletal system (Robergs and Keteyian, 2003).

[160]
Several studies have investigated this relationship between muscular strength and advancing
age. In one early study, Larsson et al (1979) investigated both dynamic and isometric
quadriceps strength characteristics of participants aged between 11 and 70 years. Results of
this study indicated strength to increase from 11 to 30 years, remain constant into the fifth
decade, and then decline from 50 years onwards. Muscle biopsy results further illustrated a
decrease in type II muscle fiber area, and type II muscle fiber atrophy in subjects from 50
years and above. Therefore this supports the suggestion of decreased muscle strength with
age. However, it is noted that this study only investigated male subjects, and all subjects were
categorised with a low physical activity level (Larsson et al., 1979). A later study further
investigated this relationship between age and strength in 654 women and men aged 20 to 93
years (Lindle, Metter, Lynch, Fleg, Fozard, Tobin, Roy, & Hurley, 1997). Differences in
isometric, concentric and eccentric torque of the quadriceps muscles were assessed, with
results once again showing significant age-related declines (8-10% per decade) in knee
extensor strength across both sexes. Significant decreases were also shown in the muscle
quality (strength per unit of muscle) or concentric knee extensor torque in both sexes with
increasing age. However it was noted here that only men presented a decline in the muscle
quality of the peak eccentric knee extensor torque. Additionally, age-related declines in
isometric and concentric strength began in the forth decade for both sexes, however the age-
related decline for eccentric muscle strength began a decade later for women. This suggests
older females have a greater capacity to store and utilise elastic energy; a function of
eccentric muscle contraction (Lindle et al., 1997). However although these results once again
support the theory of age-related decline in muscle strength, it was documented that less than
1% of participants took part in any regular resistive activity, and no record was made of
participation in regular physical exercise.
Murray, Duthie, Gambert, Sepic and Mollinger (1985) lent support to this trend of age-related
strength decline in an investigation of knee muscle strength among women. Results from this
investigation illustrated the isometric and isokinetic recorded muscle strength of women aged
up to 86 years to reach only 56% that of women aged 20 years. Additionally, Young, Stokes
and Crowe (1984) showed quadriceps strength of women in their 70s to be 35% weaker than
that of women in their 20s, with a 33% reduction in quadriceps cross sectional area. This
investigation showed a correlation between strength and area, and suggested that there is no
difference in the intrinsic strength of the quadriceps muscles in women aged between 30 and
80 years (Young et al., 1984). However a later study by Pearson, Bassey and Bendall (1985)

[161]
suggested alternative results and showed age to have a significant negative correlation with
strength of the triceps surae muscle, and strength per cross sectional area of the calf muscles.
Therefore, changes within the muscle must account for decreases in strength (Pearson et al.,
1985). However it is noted that the population investigated were females aged between 65
and 90 years, and as the approach was not longitudinal, significant strength changes may
have already occurred at an earlier age.
Therefore in light of the research it seems apparent that a clear decline in strength occurs with
age among females. However, the effect of regular physical activity on this strength decline
among the more mature groups has received little investigation. It seems important to
investigate quadriceps strength among females of advancing age compared with younger
females that take part in similar levels of regular physical activity.
4.2.6.2. Quadriceps strength, gait and injury.
Due to the close association between biomechanical movement patterns and the anatomy and
physiology of the human musculoskeletal system, it is likely that strength of the muscles in
the lower limb could affect running gait. Although not equivocal, some evidence supports an
association between reduced muscle strength and injury risk (Bartlett, 1999). Experimental
data combined with conventional knowledge lead to the theory that the muscles in the human
body serve as the main shock absorbers during gait (Mikesky, Meyer, & Thompson, 2000).
According to Gage (1993), muscles absorb force through eccentric (lengthening) contraction.
As such, muscle weakness or imbalance can often lead to compensatory changes in
movement patterns, which can in turn increase the stress on segments elsewhere in the kinetic
chain during gait (Bartlett, 2002). This theory is supported by Lewek and colleagues, who
suggested an association between reduced strength of the quadriceps muscles, and reduced
range of motion at the knee joint during walking and running (Lewek, Rudolph, Axe &
Snyder-Mackler, 2002). The quadriceps muscles, involving the vastas medialis and vastas
lateralis are recognised as major contributors to patellofemoral joint function; they act to
facilitate restraint of the patella in medial and lateral directions respectively. Abnormalities or
weaknesses of these muscles have been linked to patellofemoral pathologies including

[162]
osteoarthritis of the knee joint (Felson, Naimark, Anderson, Kazis, Castelli & Meenan, 1987).
Insufficient strength of the quadriceps muscles could interfere with the shock attenuating
function of the knee joint during stance, leading to degenerative changes to occur (Lewek et
al., 2002). Similarly, among females, reduced quadriceps strength has been associated with
increased loading rate during the stance phase of walking gait (Mikesky et al., 2000). This
investigation found that the strength-trained group were on average 29% stronger, and had
significantly lower rates of loading, decreasing the risk to the long-term joint integrity
(Mikesky et al., 2000). Mikesky and colleagues related this to an earlier study by Radin and
co-workers, who found an association between rates of loading and knee pain, and theorised
that individuals with high rates of loading had lower muscle strength (Radin, Yang, Reigger,
Kish, & O’Connor, 1991). Therefore, the proposed association between loading rates and
muscle strength highlights the importance of strength assessments among mature female
runners. It is possible that lower quadriceps strength among this group could be a factor in the
high loading rates, and relative risk of injuries and osteoarthritis at the knee joint.
4.2.6.3. Assessing Quadriceps Femoris strength.
Muscular strength is specific to the muscle group being tested, and as such no single test
exists to assess total body muscular strength or endurance (Robergs & Keteyian, 2003). As
described above, muscular strength refers to the ability to exert maximum muscular force
statically or dynamically. The measurement of the quadriceps muscle torque at the knee joint
using isokinetic dynamometry is very useful in providing an insight into muscle function and
in obtaining muscle performance data for various modelling purposes. (Barlett, 2002).
Isokinetic testing involves an electromechanical resistance instrument containing a speed
controlling mechanism that enables constant velocity with the application of a force
(McArdle, Katch & Katch, 2003). This enables an individual to generate maximum force or a
percentage of maximum effort, through the full range of motion at a pre-established velocity
of limb movement (McArdle et al., 2003). A microprocessor within the dynamometer acts to
continually monitor the immediate level of applied force and the voltage output is transferred
directly to a computer for almost instantaneous feedback. When considering methods of
assessing muscle strength, it is however important to bear in mind the possible influence of

[163]
the nuances of the testing procedures used, including degree of practice, level of motivation,
and level of understanding of the purpose and nature of the test (De Ste Croix, 2007).
4.2.7. The influence of footwear.
As mature females have been shown to exhibit patterns of gait that differentiate them from a
younger group, it was deemed important to investigate methods to alter this pattern of gait in
attempt to reduce the injury rates. Within the first study of this thesis, all subjects wore their
own footwear. According to Froncioni (2006), running trainers are a high-tech device
purpose-designed to protect the runner from injury and improve performance; however two
out of every three runners are still side-lined every year with a running related injury. The
interaction between the sport shoe and the runner has therefore previously been subject to
much speculation, and has often been considered to influence impact forces, loading, and foot
pronation (Nigg, 2001). As such, mechanisms of cushioning and motion control properties of
running shoes have been subject to extensive research, in an attempt to determine adequate
strategies in injury prevention (Nigg, 2001).
Although limited, the capacity to reduce such injuries often involves training advice and
prescription of suitable footwear (Richards, et al., 2009). Footwear is essential equipment for
runners (Cheung & Ng, 2007), and in recent years, an abundance of biomechanical research
has focussed on the properties of footwear. This has taken place with a variety of functions,
including optimising sporting performance, reducing injuries, and recently enhancing muscle
tone and weight loss (Fit Flops Inc). Certain shoes are specifically designed with technologies
aiming to increase cushioning, and reduce impact forces during running. Most frequently,
shock absorbing properties within running shoes involve low stiffness foams and gels, and
viscoelastic materials which reduce the acceleration of the heel at heelstrike (Noe, Voto,
Hoffman, Askew, & Gradisar, 1993). These footwear types generally fall into the bracket of
“neutral” or “cushioning” shoes, and do not contain additional support to control the
alignment of the foot (Drenth, 2011). As such, the inclusion of a neutral shoe in the
investigation of mature female runners will negate the effect of different footwear, in a
comparison between lower limb kinematics of a mature and young group.

[164]
4.2.7.1. Cushioning properties in footwear.
By virtue of their anatomical position, the foot and ankle create a dynamic link with the
ground. Recent advances in biomechanical technology have enabled a quantitative evaluation
of the foot and ankle function during the process of running (Shariatmadari, English &
Rothwell, 2010). In general, the majority of footwear research has focussed on rearfoot
strikers, and aims to modify forces and control motion of the calcaneus immediately
following heel strike (Spurgeon, 2005). Over the course of one mile, an individual will make
approximately 1600 foot strikes (Spurgeon, 2005). Throughout running, impact forces are
transmitted to the lower extremity with every stance phase of gait. During this phase, at heel
strike the foot accommodates both a vertical impact force and a horizontal shearing force that
creates friction (Norris, 2004). Anatomically, the viscoelastic properties of the tissues in the
heel provide significant shock absorption, however impact forces and rate of loading have
still been linked with the development of overuse conditions (primarily osteoarthritis) and
injuries such as stress fractures, plantar fasciitis and knee pain (James, Bates & Osternig,
1978; Ferber, McClay-Davis, Hamill, Pollard, & McKeown, 2002). A wide variety of
materials and design concepts have been added to footwear in attempt to produce shoes that
will absorb a large proportion of the impact energy attenuated during running gait (McNair &
Marshall, 1994). This is generally referred to as the cushioning property of running footwear,
and has been shown to reduce impact force at heel strike (Subotnick, 1983). Overall, the
effect of footwear on the vertical ground reaction force peak and loading rates have elicited
varied results.
4.2.7.1.1. Footwear and Loading rates.
As a variable of gait that has been linked with injuries within the muscle strength and knee
joint stiffness literature, the effect of footwear on the loading rate during running is discussed.
Although the effect of loading rate on injury risk and development of osteoarthritis has been
subject to much speculation (Gill and O’Connor, 2003), many footwear companies have

[165]
focussed on shock-attenuating properties within shoes, resulting in a huge industry in running
shoe design (Kirtley, 2006).
Figure 4.3. Illustration of the foot-ankle complex at heel strike, indicating the ground reaction
force acting posterior to the ankle joint, and the action of the tibialis anterior muscle. Image
adapted from Kirtley (2006).
During gait, the initial movement following heel strike involves plantarflexion of the ankle
joint, which pivots around the calcaneus, and enables absorption of the impact forces (Figure
4.3) (Kirtley, 2006). This is achieved through three mechanisms; the fat pad of the heel,
which absorbs the shock by providing a layer of anatomical cushioning, the eccentric
contraction of the dorsiflexors (tibialis anterior muscle), and pronation of the subtalar joint
Tibialis Anterior contracting
eccentrically.
Foot lowered to the floor
during plantarflexion.
Ground Reaction Force
Fulcrum of calcaneus, about which
the foot pivots after heel strike.

[166]
(Kirtley, 2006). This latter mechanism unlocks the transverse tarsal joint, and enables the
flexible foot to adjust to alterations in the ground surface, and reduces the shock travelling up
to the proximal joints of the lower limb (Norris, 2004). As such, it is proposed that a motion
control shoe, designed to reduce pronation of the subtalar joint, may limit this mechanism,
and result in increased loading rates during running in the early stage of stance. This
proposition was partially supported by Lee and colleagues, who investigated the effect of
motion control and neutral shoes on both treadmill and over ground running. Within this
study it was shown that during over ground running, the motion control shoe increased the
maximum loading rate by an average of 2.8 % compared to the neutral shoe, although the
significance of this difference was not noted (Lee, Lafortune, & Valiant, 2007). Butler and
colleagues showed a higher rate of loading among high arched runners compared with low
arched runners, linking increased loading rates with reduced subtalar joint pronation (Butler,
Hamill, & Davis, 2007). Furthermore, the inclusion of a motion control shoe was shown to
significantly increase instantaneous loading rate by 11.8 body weights per second when
compared to a neutral cushioned shoe. This was also supported in an earlier study by Perry
and Lafortune, who illustrated a motion control wedge insert to reduce rearfoot eversion, but
increase vertical loading rate when compared to the neutral shoe (Perry & Lafortune, 1995).
Within the current study, it will therefore be important to assess any changes in loading rate
with the inclusion of a motion control shoes among the mature female runners.
According to Lees & McCullagh (1984), viscoelastic shock absorbing shoe insoles have been
shown to produce reductions in vertical peak impact force and loading rates among runners.
Similarly, Clarke and colleagues illustrated an increase in cushioning of running shoes to
significantly increase the time to peak impact force, although no change was shown in the
magnitude. Therefore the cushioning aspect of the shoes appears to alter the loading rate of
impact force (Clarke, Frederick & Cooper, 1983). This has also been shown during walking
trials where softer insoles can cushion the impact forces at heel strike (Lafortune & Hennig,
1992). In contrast, Nigg and colleagues demonstrated no significant differences in ground
reaction force variables when viscoelasctic shock absorbing insoles were added to running
shoes (Nigg, Herzog & Read, 1988). It is however noted that this latter study only
investigated group reactions to insoles, and individual variations may have been overlooked.

[167]
4.2.7.2. The motion control effect.
According to McPoil (2000), footwear during gait has four main functions, each developed to
enhance the prevention of running injuries. Shoes act to protect the plantar surface of the
foot, provide traction between the foot and the ground, control motion, and aid attenuation of
impact forces during activity. However of the four main functions, it is the mainstream
technology of motion control design that has been the subject of the majority of recent
research interest (McPoil, 2000).
Evidence exists to suggest that footwear may be able to alter motion of the foot during
walking and running (Rose et al., 2011). The term rearfoot control is based on the ability of a
shoe to limit the movement of the rearfoot following heel strike (Clarke, Frederick & Hamill,
1983). Although a certain amount of rearfoot motion is essential during gait, the current
concept of the motion control shoe is to reduce the chance of excessive motion, which is
commonly associated with injuries (section 3.1.3.2). It has been suggested that excessive
rearfoot eversion during running and associated increased internal rotation of the lower limb
causes a change in load distribution, and a relative increase in load acting at certain areas of
the lower extremity (Taunton et al., 2002).
Several investigations into rearfoot and forefoot motion during running have therefore
occurred to determine the desired amount of control that should be imposed by the shoe on
the foot. In general, the motion control design targets to reduce excessive rearfoot eversion
and subsequent internal rotation of the lower leg and knee, during running, through altering
deformation rates and geometry between the medial and lateral sides of the shoe, (Cheung &
Ng, 2007). Increased density and height is therefore added to the medial sole of motion
control shoes, to support the medial longitudinal arch and reduce the movements associated
with subtalar joint pronation.
In a study of footwear design during running, Clarke and colleagues illustrated that shoes
containing both medium and hard midsoles (Shore 35 and 45) significantly reduced
maximum rearfoot eversion and total rearfoot movement compared to those with softer
midsoles (Shore 25) (Clarke et al., 1983). Hamill, Freedson, Boda and Reichsman (1988)
supported this in a later investigation into differences in rearfoot movement among women
wearing motion control shoes and racing flats. Results showed an average 42% increase in
maximum rearfoot eversion in the flats when compared to shoes with greater medial support.

[168]
This theory was later supported by Cheung and co-workers who showed increased medial
support in motion control shoes to significantly reduce average rearfoot eversion by 4o among
a group of 28 female runners (23.5±6.8 years) (Cheung & Ng, 2007). In terms of injury rates
and reduction methods, Knapit and colleagues examined the effect of matching the support in
shoes to foot type and pronation level, and showed 50% reduction in injuries to the lower
extremity and the back over a six month period (Knapik, Feltwell, Canham-Chervek, &
2001). However it is noted that the mechanisms behind the injury reductions were not
detailed and therefore cannot be commented on.
According to Morio and colleagues, when compared to barefoot locomotion, footwear causes
reductions in the rearfoot eversion angle and velocity; during running, the total range of
rearfoot eversion was reduced by 20 % in the footwear condition (Morio, Lake, Gueguen,
Rao & Baly, 2009). The reduction of a heel counter (as described earlier) was investigated by
Jorgensen (1990) among a group of asymptomatic heel-strike runners. Results showed that
when the firm heel counter was removed, the electromagnetic activity of the triceps surae
muscles occurred significantly earlier than when the heel counter was in place, suggesting an
increased action of the triceps surae muscle group to maintain stability in the former
condition (Jorgensen, 1990). Butler and colleagues also showed the effect of motion control
shoes on the musculoskeletal system, and illustrated that when compared to a cushioned
(neutral) shoe, a stability (motion control) shoe significantly decreased the tibial internal
rotation angle among a group of low arched runners (Butler, Hamill, & Davis, 2007).This
effect suggests that motion control shoes may be a method to reduce the patellofemoral joint
strain that has been associated with low arched runners (Williams, McClay, & Hamill, 2001).
These researchers support the overall theory that increasing support in the medial sole of the
shoe controls for subtalar joint pronation. However, speculation still exists as to the correct
location of support along the medial sole to best control for excessive frontal plane movement
of the rearfoot. A review of early literature has revealed a range of published studies with
varying results. One early study by Shaw suggested that forefoot support is adequate to
control for pronation during gait; a theory later supported by Ramig and colleagues (Shaw,
1975; Ramig, Shadle, & Watkins, 1980). Novick and Kelley later disputed this, suggesting
that both rearfoot and forefoot support in the shoe bed was required to control for pronation
during gait, and Subotnick showed that rearfoot posting alone is sufficient to control for
pronation, including forefoot motion, during gait (Novick & Kelley, 1990; Subotnick, 1983).

[169]
Although the former results were shown during walking trials, this latter result supports the
theory that rearfoot eversion is the dominant component of pronation. Johanson and
colleagues performed a later study which supported the previous two theories, and suggested
that due to the combination of movements that produce subtalar pronation, ideal control is
achieved through heel focussed medial support, or combined heel through to forefoot support
(Johanson et al., 1994). These authors suggest that posting at the medial arch alone, as is
found in many motion control shoes, does not adequately control for excessive subtalar joint
pronation (Johanson et al., 1994).
Although many studies support the use of motion control shoes to reduce rearfoot motion, it
is important to note that a certain degree of rearfoot eversion is due to the natural adaptive
movement of the subtalar and mid-tarsal joints for shock absorption and thus is beneficial to
gait (Nordin & Frankel, 2001). Furthermore, it is important to note that the predominant
feature of pronation is rearfoot eversion, and as described above, in the general motion
control shoe, the support tends to be centred on the medial arch, supporting the foot later in
stance (Johanson et al., 1994). Although there have been studies that have supported the use
of motion control shoes to alter tibiocalcaneal kinematics during running, other researchers
have shown no effect (Stacoff et al., 2000; Butler et al., 2007). As suggested by Clarke, the
efficacy of motion control shoes is highly dependent on the foot form and structure, and
many studies have not controlled for heterogeneity (Clarke et al., 1983). Therefore it is
suggested that equivocal results may be due in part to variations in support design, the
materials used, and the level of posting within the shoe. Although evidence regarding the use
of motion control shoes to reduce rearfoot eversion is not without dispute, the promising
results produced in some studies have caused footwear adaptations to often be implemented
in injury prevention and rehabilitation. As such, the effect of a motion control shoe on lower
limb kinematics will be assessed among mature female runners.
4.2.7.3. Footwear and the knee external adductor moment.
As discussed, the motion control aspect of footwear is implemented to control excessive
subtalar joint pronation and subsequent internal rotation of the lower leg and knee. In

[170]
contrast, other researchers have investigated the effect of footwear modifications to reduce
the knee external adductor moment that has been associated with knee joint osteoarthritis
(section 3.4.5) (Hunt et al., 2006). This biomechanical variable occurs as the ground reaction
force and centre of pressure act medially to the knee joint centre causing an adductor moment
to act at the knee (Hunt et al., 2006). This is compounded with an increased varus alignment
as the moment arm from the knee joint centre to the line of ground reaction force increases,
causing an increased load experienced by the medial relative to the lateral compartment of the
knee joint (Figure 4.4). Over time this increased loading leads to a general degeneration of
the medial tibiofemoral articular cartilage, and the development of certain conditions such as
osteoarthritis (Hunt et al., 2006). According to Hunt and colleagues, the magnitude of this
moment is highly dependent on the length of the moment arm described (Hunt et al., 2006).
As such, methods to reduce this moment arm are often centred around altering the position of
the foot on the ground, to reduce the varus position of the knee, and move the centre of
pressure laterally on the foot (Kakihana et al., 2005).
Figure 4.4. Diagram of the knee external adductor moment acting as a combination of the
ground reaction force and the distance to the knee joint centre. Adapted from Russell et al.,
2010.
Ground Reaction Force
Moment arm between knee
joint centre and GRF
Knee external adductor
moment.

[171]
Current interventions to reduce this knee external adductor moment and subsequent loading
of the medial knee are therefore seemingly opposite to the interventions designed for rearfoot
eversion. More specifically, lateral wedging has been investigated with the goal of reducing
symptoms and progression associated with medial compartment knee osteoarthritis. If proven
effective in knee external adductor moment, this specific intervention could be deemed useful
for future management and prevention of osteoarthritis of the knee joint. According to
Crenshaw (2000), a 5o wedge on the lateral side shifts the centre of pressure laterally,
reducing the external adductor moment and knee abduction (varus) positions, and offloading
the medial knee. This is illustrated in the Figure below.
Figure 4.5. Lateral wedge added to decrease moment arm length at the knee joint, and reduce
the knee external adductor moment. Adapted from Russell et al., 2010.
Reduced moment arm length
Increased support on the
lateral sole of the shoe
Knee abduction (varus)
reduced

[172]
As such, the inclusion of increased medial sole support, common in the current motion
control shoe is expected to have an opposing effect, and increase the loading at the medial
knee. This theory is supported in one study that investigated the effect of a current stability
(motion control) shoe and a mobility shoe (indicative of barefoot) on the knee external
adductor moment (Bourgit, Millet, & Fuchslocher, 2008). Results indicated that when
compared to the barefoot condition and the barefoot simulator shoe, the motion control shoe
instigated a slight increase (8%) in the external adductor moment. However these results were
demonstrated among a group of symptomatic OA patients, and the gait adaptations to
footwear may have been affected by pain. The effect of a motion control shoe on the knee
external adductor moment of healthy runners has not been extensively researched. Based on
the theories described, it is suggested that, among a group of asymptomatic females, a current
motion control shoe is likely to increase the external knee adductor moment during running.
4.2.7.4. The comfort of footwear.
As well as biomechanical changes to the shoe, the concept of comfort cannot be ignored; and
according to Miller and co-workers, comfort as an aspect of shoe design may be related to
fatigue, injury development and performance (Miller, Nigg, & Liu, 2000). However it has
been suggested that comfort is an individual response, based on a multitude of mechanical,
neurophysiological, and psychological attributes unique to the individual (Miller et al., 2000).
It is suggested that as malalignment and high impact forces are factors that may influence
comfort, a shoe incorporating correct alignment and cushioning properties, should provide a
generic level of comfort despite individual variation (Miller et al., 2000).
Among mature female runners, the influence of footwear should be considered based on the
association with injuries. It is noted that footwear companies have introduced a distinction
between male and female runners. However, due to the aforementioned high numbers of
runners within the mature sector of the population, and a possible alteration of gait with
advancing age, an investigation into the effect of footwear on the running gait of this group is
deemed appropriate.
[173]
4.2.8. Aims and hypotheses
The main purpose of this study was to assess the ability of a motion control shoe to reduce
specific observed differences in running biomechanics between mature and younger female
runners. Three research questions were addressed:
Is the running gait in neutral shoes significantly different for mature compared with
younger females?
Does a motion control shoe significantly alter the running biomechanics of mature
and young females?
Do physiological factors have an influence on running gait among mature females,
specifically strength of the quadriceps femoris muscle?
Four hypotheses were therefore assessed:
1. Running trials performed in a consistent test shoe, marketed as a running neutral shoe,
would result in greater magnitude of loading rates, peak rear foot eversion, knee
internal rotation angle, knee external adductor moment, and knee joint stiffness for
mature compared to younger females.
2. Quadriceps strength will be significantly lower for the mature females when
compared to the younger group.
3. The motion control shoe would significantly reduce magnitudes of rearfoot eversion
and knee internal rotation among females during the stance phase of running gait.
4. The motion control shoe would increase knee external adductor moment during the
stance phase of gait, through an increase in the varus (abducted) position of the knees
and a subsequent increase in moment arm.

[174]
4.3. Methods.
4.3.1. Participants and KOOS.
A statistical power analysis (Power and Precision, Version 2, 2000) based on the results from
the previous study indicated a sample size of 12 per group would produce a power of 80%,
suggesting 80% likelihood the study would yield a significant difference where present,
between mature and young females. A sample report of the statistical power analysis is
presented in the appendix (Appendix C). Twenty two injury free female participants were
recruited on a volunteer basis for involvement in this study, and assigned to one of two
groups; young and mature. The young females ranged in age from 18 to 25 years (mean 21.2
years, sd 2.1) and were recruited from the University of Exeter Sport and Health Sciences
student cohort. The mature females ranged in age from 40-60 years (mean 49.7 years, sd 3.7),
and were volunteers from a local women’s running club (Women’s Running Network). All
females had a minimum of 3 years running experience and participated in at least three one
hour sessions per week. Best 10-km run time was used as an indicator of standard (Table
4.1). Prior to the start of testing, each participant completed a Physical Activity Readiness
Questionnaire; PAR-Q form to assess participant statistics (age, height, weight) and to ensure
all females were free from any major visual or balance pathology, or debilitating condition
that could hinder performance (PAR-Q, Canadian Society for Exercise Physiology, 2002).
This investigation was provided ethical approval from the University of Exeter ethics
committee.
Alongside this, each participant completed a KOOS questionnaire (knee osteoarthritis
observation survey) to assess the presence or potential of osteoarthritis and injuries present at
the knee joint (Appendix B) (Roos & Toksvig-Larsen, 2003). Results were correlated with
kinematic data to investigate potential links between knee osteoarthritis and lower limb
biomechanics during running gait. A summary of demographic data and KOOS scores for
both groups is illustrated in Table 4.1.

[175]
Table 4.1. Demographic information for the two groups, mature and young females,
including KOOS scores.
YOUNG MATURE
AGE (YEARS) 21.2 (2.1) 49.7 (3.7)
MASS (KG) 60.5 (7.8) 58.2 (5.1)
10-KM TIME (MINS) 56.5 58.5
KOOS SCORE 96.5 90.8
PAIN 97.9 (1.9) 94.2 (1.9)
SYMPTOMS 98.1 (0.9) 91.2 (1.2)
ADL 98.7 (0.5) 92.9 (0.8)
SPORT &
REC
93.8 (0.6) 87.8 (1.5)
QOL 94.1 (0.6) 87.9 (0.8)
4.3.2. Test running shoes.
Each participant performed 10 running trials in two running shoe models; the Adidas
Supernova Sequence (motion control) and the Adidas Supernova Glide (neutral). The motion
control differed from the neutral shoe in the medial section of the sole, where an increase in
the density and height of the arch support was present aiming to reduce excessive pronation.
Descriptions of the components inherent to each shoe are presented in table form (Table 4.2).

[176]
Table 4.2. Description of key running technologies of both Adidas shoes.
SUPERNOVA SEQUENCE SUPERNOVA GLIDE
FORMOTION: Adapts to the ground for
smoothness and comfort.
FORMOTION: Adapts to the ground for
smoothness and comfort.
adiPRENE: Shock absorbent material that
cushions and protects heel at impact.
adiPRENE: Shock absorbent material that
cushions and protects heel at impact.
adiPRENE+: Resilient cushioning to protect
forefoot and provide responsive dynamic toe-
off.
adiPRENE+: Resilient cushioning to protect
forefoot and provide responsive dynamic toe-
off.
GEOFIT: Internal footwear technology
enhancing fit and comfort.
GEOFIT: Internal footwear technology
enhancing fit and comfort.
TORSION: Adaptive midfoot support. TORSION SYSTEM: Lightweight arch
support enabling independent movement of
the forefoot and rearfoot.
adiLITE: Lightweight, Increases comfort. adiLITE respoEVA: Sockliner for instep
comfort and antimicrobial protection.
adiWEAR: Outsole for high-wear durability. Women’s specific outsole with larger forefoot
platform and anatomically adjusted flex
grooves.
PROMODERATOR: Medial device
prevents over pronation.
Blown rubber outsole for lightweight grip and
cushion.

[177]
4.3.3. Motion analysis and force plate assessment.
Running analysis took place in the biomechanics research laboratory. Each subject was
affixed with 11 reflective markers along the right lower limb using a modified version of the
model presented by Soutas-Little; greater trochanter, medial and lateral knee at the tibial
plateaus, the musculo tendinous junction where the medial and lateral belly of the
gastrocnemius meet the Achilles tendon, the mid tibia below the belly of the tibialis anterior,
the superior and inferior calcaneus, the lateral malleolus, the third proximal head of the third
metatarsal, and the distal head of the fifth metatarsal joint (Soutas-Little et al., 1987). The
position of these markers illustrated the anatomical position and spatial movement of the
thigh, shank, and foot during one running ground contact (Soutas-Little et al., 1987).
Three dimensional analysis of running gait occurred using an eight camera motion capture
system (Vicon Peak, 120 Hz, automatic, opto-electronic system; Peak Performance
Technologies, Inc., Englewood, CO.), synchronised with a single floor mounted force
platform (960 Hz, AMTI, Advanced Mechanical Technology, Inc., Massachussetts). Data
were synchronized within the Vicon software using initial foot strike as an automatic event
detection (vertical force > 10N). The eight cameras were positioned in an oval shape
focussing on the force plate. A static L-shaped frame denoting the horizontal axis of motion,
and calibration wand of length 0.998 m with two reflective markers of known distance apart
were used to calibrate the system. An image of the biomechanics laboratory including force
plate, cameras and timing gates is displayed below (Figure 4.6).

[178]
Figure 4.6. Image of testing laboratory including force platform, timing gates, and the
cameras in view.
4.3.4. Static assessment.
Prior to data collection, participants performed one single standing trial with anatomical
markers attached, to provide standing joint angles for adjustment of anatomical angles during
each trial. Posture was standardized with arms crossed in front of the chest, and feet shoulder
width apart on the force plate. Data were collected to recognise marker orientation, relevant
geometry and segment reference frames to provide the local coordinate systems. Width
measurements of the forefoot (widest as observed in shoe) and ankle (from lateral to medial
malleolus bones) were taken using a set of callipers. These data were then used to define the
ankle joint centre and the centre line of the foot, allowing calculation of foot centre of mass
for use in subsequent joint moment calculations (See previous Chapter, 3.2.3.1).

[179]
4.3.5. Analysis of running gait.
Running gait was assessed for each participant individually. Running velocity was recorded
using two one meter high infrared light timing gates located along a 10 m concrete runway,
situated 2.5 meters either side of the centre of the force plate, categorising each trial
acceptable at 3.5 m.s-1
± 5% (speed determined in a pilot study). Following each trial, the
force plate was set to zero. Participants were provided time to familiarise with the procedure
and ensure running gait was reflective of each female’s natural pattern. Participants marked
the floor once a pace was set to ensure the right foot would successfully hit the centre of the
force platform for each trial. Trials were accepted when running speed was within the
allocated range, and the participant made full right foot contact with the force plate with no
adjustment in stride. Unacceptable trials were repeated.
Mean results were collected for each subject performing 10 trials in each condition. Peak rate
of loading of impact force was calculated as the rate at which impact force occurred within
the first 50 ms of force generation, and presented relative to body weight. Kinematic
variables of peak knee internal rotation and rearfoot eversion angles were calculated using a
joint co-ordinate system approach. Knee internal rotation was calculated as the angle created
as the knee rotated medially, using the knee abduction adduction vector and the position of
the shank. Ankle eversion was calculated as the anatomical 180o angle between the line of the
Achilles and the line of the calcaneus in the XZ reference frame. Knee joint flexion was
calculated as the absolute angle infront of the knee joint (Figure 4.8). Within this
investigation, knee flexion angles were positive. Finally, the transformed co-ordinates and
ground reaction force data were exported from Peak into MATLAB (Version 7.0,
Mathworks, Inc), and the external knee adductor moment was calculated at 120 Hz through
inverse dynamics utilising a customised Matlab code, with inertia characteristics provided by
Dempster (Dempster, 1955). Both ground reaction force data and moment values were then
presented in relation to body weight (BW and Nm/kg). Significant differences between
groups and conditions were detected through the use of a 2 way (between-within) ANOVA
(p<0.05).

[180]
4.3.5.1. Knee joint moment arm assessment.
As described previously, the knee external adductor moment is predominantly a product of
the line of the frontal ground reaction force, and moment arm between this force and the
centre of the knee joint. As such, the length of moment arm was determined in order to
demonstrate the influence of this variable and associated lower limb alignment, on the
magnitude of the moment. As described in Chapter 2, kinematic data from the standing trial
were used to obtain three-dimensional coordinates for the knee joint centre; calculated as the
midpoint between the lateral and medial knee joint markers (Figure 4.7, Equation 4.2).
Figure 4.7. Diagram of the components for moment arm calculation at the right knee. Image
of the lower leg adapted from Hunt et al., (2006).
Medial knee marker
(x,y,z)
Lateral knee marker
(x,y,z)
Knee Joint Centre
Ground Reaction
Force Vector
Y
(anterior-posterior)
Z
(inferior-superior)
X
(medial-lateral)

[181]
For the purpose of the moment arm calculations, the x coordinate of the midpoint of the knee
joint was calculated as follows:
Mid knee (x) = medial knee (x) + [0.5*(lateral knee (x) – medial knee (x))]
Equation 4.2
The frontal plane moment arm was calculated as the perpendicular distance between the
frontal plane vector of the ground reaction force and the knee joint centre. The frontal plane
ground reaction force vector was calculated as the resultant force vector of the mediolateral
and vertical components of the ground reaction force as follows:
GRFfrontal = GRFz + GRFx
Equation 4.3
The distance (d) between the mid knee in the mediolateral direction and the frontal plane
ground reaction force was calculated to find the perpendicular distance between the frontal
plane ground reaction force and the knee joint centre.
d = Midkneex * GRFfrontal.
Equation 4.4.
As such, the moment arm of the knee joint was determined, using the frontal plane coordinate
of the ground reaction force (GRFfrontal), the scalar distance to the centre of pressure (d) and
the knee joint centre coordinate (Midkneex).
Moment arm = Midkneex - (d*GRFfrontal)
Equation 4.5.

[182]
Moment arm length at peak moment was calculated throughout the stance phase of gait,
providing an indication of the position of the knee joint in relation to the line of ground
reaction force. Negative and positive moment arms were therefore representative of the knee
in an abducted and adducted position respectively.
4.3.5.2. Knee joint stiffness.
Figure 4.8 illustrates the components of knee joint stiffness; calculated as the change in
sagittal plane joint angle in response to the applied joint moment during the stance phase of
gait (Equation 4.7) (Dixon et al., 2010). Sample graphs are presented to show the knee angle
and moment throughout the stance phase of gait (Figures 4.9 & 4.10).
Figure 4.8. Illustration of the lower limb positioning during running, and the components of
knee joint stiffness.
Knee
angle (θ)
Knee moment
(sagittal plane) (Mk)

[183]
Figure 4.9. Sample moment graph illustrating the sagittal plane knee moment over the stance
phase of gait (subject 10, mature).
Figure 4.10. Sample graph illustrating the knee angle throughout the stance phase of running
gait (mean data, subject 6 mature).
Peak sagittal plane knee
moment (Nm)
Knee angle at peak
flexion (degrees)
Knee angle at peak
extension (degrees)
Minimum sagittal plane
knee moment (Nm)

[184]
Δθ = knee angle at peak flexion – knee angle at peak extension
Equation 4.6
ΔMk = Maximum sagittal plane moment – minimum sagittal plane knee moment.
Equation 4.7
Knee joint stiffness = Δθ / ΔMk
Equation 4.8
Sagittal knee joint moment was calculated using an inverse dynamics technique, with inertia
values provided by Dempster (1955). Change in knee angle was calculated instantaneously as
the difference between the maximum angle at peak flexion (midstance) and the knee angle at
heel strike (Equation 4.6). A similar technique was then employed to calculate the change in
sagittal plane knee moment, with minimum moment at heel strike taken from maximum
moment during midstance (Equation 4.7). Direction for the positive knee moment is
illustrated in the diagram; moments acting in the anticlockwise direction are positive, while
moments acting clockwise are negative (Figure 4.8).
4.3.5.3. Muscle strength assessment.
Quadriceps strength was assessed with the use of a Biodex Isokinetic Dynamometer (System
3, IPRS Mediquipe, Suffolk, UK). This assessment provided information on the strength of
the quadriceps femoris muscles during single leg extension exercises, and has been shown to
be reliable for knee flexion/extension measurements (Ly & Handelsman, 2002). Muscle

[185]
strength was assessed prior to running trials to reduce the possibility of fatigue influencing
results. Figure 4.11 provides an illustration of muscle strength assessment.
Figure 4.11. Illustration of a participant seated on the dynamometer, indicating knee
extension movement.
Quadriceps strength was measured isometrically, with the participant seated on the
dynamometer. Stabilisation was achieved with various straps, and handles affixed to the
chair. One strap was placed around the waist and two around the tested leg; midway along the
upper quadriceps, and around the ankle joint. The non-tested leg was strapped around the
ankle to restrict any unwanted movement. In this assessment, only the right leg was tested.
While seated, both the hip and the knee joints were positioned at approximately 90 degrees;
the axis centre of knee flexion at the tibiofemoral joint was aligned by the eye with the axis of
the dynamometer. The weight of the lower leg was measured with an inbuilt dynamometer
facility for automatic gravity correction. The distal end of the shin attachment was placed at
Concentric contraction of the
quadriceps femoris.
Movement of the lower leg
Axis of the dynamometer

[186]
approximately 5 cm above the lateral malleolus of the right leg, and adjusted based on
comfort for the participant. After several practice attempts, followed by a five minute rest
period, participants performed three maximum voluntary contractions of the quadriceps
through extending the lower leg at the knee joint. Each contraction lasted approximately three
seconds, with a minimum rest period of five seconds between each contraction. Maximum
voluntary quadriceps force for each contraction was taken, and a mean for each participant
was calculated. An independant sample t-test was employed to determine significant
differences in maximum quadriceps strength between the mature and young females.

[187]
4.4. Results.
4.4.1. KOOS results.
The results from the KOOS (Table 4.1) demonstrate that both groups (young, 90.5; mature,
96.5) had minimal symptoms of osteoarthritis and knee injuries (KOOS, English Version LK
1.0). This was the case for both the left and the right knee. However it was observed that the
Sport and Recreation, and Quality of Life subscales illustrated lowest scores (young, 93.8 and
94.1; mature 87.8 and 87.9).
4.4.2. Kinematic results.
Individual results are presented in Appendix E. Mean results from the kinematic assessment
are presented in Table 4.3. Tables 4.4 a and b show a summary of the significance values for
comparisons between mature and young females in both footwear conditions (a) and between
the motion control and the neutral shoes among mature and young females (b).

[188]
Table 4.3. Kinematic results for both conditions among the mature and young female runners.
Significance is highlighted within the tables with the symbols * and γ, denoting a significant difference between young and mature females (*)
and motion control shoes and neutral condition (γ) at the p < 0.05 level.
MATURE FEMALE
RUNNERS
Component of variable measured during the stance phase of gait
Initial Angle (deg)
Mature Young
Peak Angle (deg)
Mature Young
Occurrence time (sec)
Mature Young
ROM (deg)
Mature Young
Peak Angular Velocity (deg/s)
Mature Young
REARFOOT
EVERSION
N
MC
3.3 ± 5.2
1.97 ± 6.7
3.0 ± 6.0
2.0 ± 6.5
17.0 ± 5.6
10.91 ± 4.1 γ
12.06 ± 3.9*
8.8 ± 3.3*γ
0.12 ± 0.04
0.12 ± 0.04
0.12 ± 0.05
0.12 ± 0.06
11.9 ± 4.5
9.4 ± 4.9
14.0 ± 4.7
13.2 ± 7.3
308.8 ± 225.5
307.2 ± 114.6
355.2 ± 216.8
325.3 ± 89.2
ANKLE
DORSIFLEXION
N
MC
12.3 ± 13.1
12.6 ± 15.7
18.4 ± 22.5
18.9 ± 14.4
26.2 ± 6.5
26.2 ± 3.6
33.9 ± 12.6
34.3 ± 12.6
0.13 ± 0.04
0.12 ± 0.02
0.1 ± 0.04
0.09 ± 0.04
22.2 ± 11.9
21.9 ± 12.4
18.0 ± 14.5
16.5 ± 8.6
613.3 ± 308.3
572.6 ± 204.6
656.3 ± 257.5
504.2 ± 216.2
KNEE FLEXION N
MC
3.64 ± 2.5
3.32 ± 2.6
1.74 ±1.92*
1.45 ± 1.2*
32.3 ± 11.4
32.2 ± 9.2
28.9 ± 12.12
30.5 ± 12.65
0.14 ± 0.07
0.15 ± 0.0
0.14 ± 0.05
0.13 ± 0.04
39.4 ± 19.8
36.8 ± 19.2
40.7 ± 10.5
38.0 ± 8.9
483.0 ± 149.6
463.8 ± 116.4
497.9 ± 105.7
460.5 ± 80.4
KNEE
ABDUCTION
N
MC
15.2 ± 3.2
16.3 ± 4.0
12.2 ± 5.3
11.2 ± 8.8
23.1 ± 5.1
24.0 ± 6.5
17.0 ± 5.96*
17.1 ± 6.38*
0.23 ± 0.02
0.23 ± 0.03
0.23 ± 0.03
0.22 ± 0.04
13.6 ± 6.9
15.4 ± 8.9
19.5 ± 4.6
19.6 ± 7.8
93.0 ± 42.5
85.8 ± 12.5
99.6 ± 34.0
88.6 ± 21.8
KNEE
INTERNAL
ROTATION
N
MC
11.2 ± 10.3
13.3 ± 7.9
11.6 ± 5.5
13.4 ± 7.1
-18.4 ± 3.7
-15.1 ± 3.1γ
-14.3 ± 2.1*
-12.6 ± 2.6*
0.10 ± 0.03
0.11 ± 0.05
0.11 ± 0.07
0.1 ± 0.07
16.5 ± 17.6
17.1 ± 14.8
9.3 ± 10.3
11.4 ± 12.2
108.8 ± 55.0
87.9 ± 42.4
99.2 ± 34.6
94.9 ± 16.5

[189]
Tables 4.4 a and b. Tables presenting p values from the variables showing statistically
significant differences.
a)
Mature : Young (Neutral) Mature : Young (Motion Control)
Peak Rearfoot eversion P = 0. 03* P = 0.34
Initial knee flexion P = 0.008 P = 0.007
Knee abduction P = 0.04* P = 0.03*
Knee internal rotation P = 0.005* P = 0.06*
b)
Motion Control: Neutral (Mature) Motion Control: Neutral (Young)
Rearfoot eversion P = 0.03* P = 0.05*
Knee internal rotation P = 0.04* P = 0.14
4.4.2.1. Significant kinematic results.
The figures below illustrate the differences in the peak rearfoot eversion (a), knee internal
rotation (b), and knee abduction angles (c) between the two groups in both footwear
conditions.

[190]
(a)
(b)
Figure 4.12. Bar graphs illustrating difference in rearfoot eversion (a), knee internal
rotation (b) and knee abduction angle (c) between mature and young females in both
footwear conditions.
(c)

[191]
4.4.2.1.1. Rearfoot eversion.
Eversion of the calcaneus occurred during the stance phase of gait, with peak rearfoot
eversion occurring shortly after heel strike among both groups (0.12 ± 0.015 seconds).
Results of the two way between-within ANOVA suggested that the peak rearfoot angle
was significantly higher for the mature females compared to the young group in the
neutral footwear condition (p < 0.05). Trials performed in the motion control condition
however showed no significant difference between mature and young females (p > 0.05).
Further analyses showed a significant difference between the motion control and the
neutral condition among both groups (p < 0.05). Despite this, no significant difference
was demonstrated between mature and young, or between footwear conditions in the
initial angle, occurrence time of peak angle, range of motion or angular velocity of
eversion (p>0.05). A sample angle time history throughout the stance phase of gait is
displayed in Figure 4.13, showing single trial data for both a mature and young female in
both footwear conditions.
Figure 4.13 Rearfoot eversion graph illustrating single trial data from Subjects 6 (y) and 9
(m) in both footwear conditions.

[192]
4.4.2.1.2. Knee internal rotation.
Peak knee internal rotation was measured throughout stance, and peaked at an average of
0.1 ± 0.05 seconds. Peak knee internal rotation angles were significantly greater among
mature compared to younger females, and were significantly reduced among the mature
group with the use of motion control shoes (p < 0.05). However the motion control shoes
did not significantly affect peak knee internal rotation values among the younger group (p
> 0.05). No significant differences were observed in initial angle, occurrence time of peak
knee internal rotation, maximum range of motion and angular velocity between groups or
footwear condition.
4.4.2.1.3. Knee abduction angle.
Peak knee abduction angle calculated throughout the stance phase of running gait was
significantly greater for the mature group compared to the younger group in both
footwear conditions (p<0.05). However no significant difference was seen in peak angle
when comparing the trials performed in the neutral shoe with the motion control
condition among either group (p>0.05). Similarly, no significant difference was seen in
the initial angle, the occurrence time of peak angle, or the angular velocity of peak knee
abduction (p>0.05).
4.4.2.2. Non-significant kinematic results.
Peak ankle dorsiflexion and peak knee flexion angles both elicited no significant
differences between groups or with the different footwear conditions (p > 0.05). A
significant between group difference was however seen in the initial knee angle (p<0.05).
However no differences were demonstrated in initial angle of dorsiflexion. Similarly, no

[193]
significant difference was seen in occurrence time of peak angle, range of motion or
angular velocities for either kinematic variable (p > 0.05). Bar charts highlighting the
consistency between groups and trends with footwear conditions are highlighted for ankle
dorsiflexion and knee flexion, in Figures 4.14a and b respectively.
(a)
(b)
Figure 4.14. Graph illustrating mean data for ankle dorsiflexion (a) and knee flexion (b).

[194]
4.4.3. Kinetic results.
A sample vertical force time history for a mature female in both footwear conditions is
presented in Figures 4.15 a and b, illustrating the impact force peak. Mean results for each
participant are displayed in the appendix (Appendix E). Results from the statistical
analysis for difference in the means are presented in Table 4.5. For the ground reaction
force variables assessed, no significant effect was demonstrated for age, or footwear
conditions among the two groups (p>0.05).
(a)
(b)
Figure 4.15 a and b. Sample ground reaction force-time history for participant 19 (m) in
neutral (a) and motion control (b) footwear conditions.
Peak Impact
Force

[195]
Table 4.5. Statistical output from a two-way ANOVA for the effect of age and footwear
conditions.
P-Values
MOTION CONTROL Vs NEUTRAL
YOUNG
Pk Fz 0.27
Occ Time PkFz 0.46
Loading rate (LR) 0.58
Occ Time LR 0.44
MATURE
Pk Fz 0.81
Occ Time PkFz 0.80
Loading rate (LR) 0.94
Occ Time LR 0.58
MATURE Vs YOUNG
NEUTRAL
Pk Fz 0.23
Occ Time PkFz 0.21
Loading rate (LR) 0.84
Occ Time LR 0.18
MOTION CONTROL
Pk Fz 0.49
Occ Time PkFz 0.77
Loading rate (LR) 0.68
Occ Time LR 0.59

[196]
4.4.4. Peak knee external adductor moment and moment arm.
Peak knee external adductor moment was measured as the second peak on the moment-
time history. A sample knee external adductor moment time graph highlighting the
second peak is displayed in Figure 4.16. This graph illustrates a difference of 42.31 Nm
between the two peaks; the greatest difference seen in any raw trial data between the
mature and the young female runners in the neutral condition. Mean moment and moment
arm data from the two groups for the two footwear conditions is presented in Table 4.6.
Results illustrate a significant difference in peak knee external adductor moment between
the mature and the young in both the motion control and the neutral footwear conditions
(p<0.05). A similar significant difference was seen in the moment arm length (p<0.05).
The effect of the motion control shoes was not significant in either group for the peak
moment (young, p = 0.83, mature, p = 0.81) or the moment arm (young, p = 0.36, mature
p = 0.10).
Figure 4.16. Sample knee external adductor moment for a mature and young female
performing one running trial in the neutral footwear condition.
Peak Knee External Adductor
Moment

[197]
Table 4.6 Mean knee external adductor moment data, displaying peak values and moment
arm length.
(a)
NEUTRAL
Mature Young
MOTION CONTROL
Mature Young
Mean Peak Knee
External Adductor
Moment (Nm/kg)
Significance level (0.05)
1.45 (±0.17)
1.11 (0.12)
1.48 (±0.24)
1.13 (0.14)
P = 0.0008*
P = 0.002*
Mean Knee External
Adductor Moment
Arm (cm)
Significance level (0.05)
3.0 (±0.05)
2.5 (±0.05)
3.2 (±0.03)
2.8 (±0.03)
P = 0.037*
P = 0.014*
Figure 4.17 illustrates the association between the knee external adductor moment and the
knee abduction angle produced by one mature female throughout the stance phase of gait.
Mean data for both variables was used to represent all running trials performed in the
neutral condition. Figure 4.18 illustrates the moment arm length throughout the stance
phase of gait. As described previously, positive moment arm illustrates an adducted knee
joint, whereby moment arm length calculated as a negative value illustrates an abducted
(varus) knee joint position.

[198]
Figure 4.17. Sample graph illustrating sample knee abduction angle and sample knee
external adductor moment trace produced by Subject 10 (young) in the neutral condition.
Figure 4.18. Moment arm length calculated throughout the stance phase of gait for
Subject 10 in the neutral condition.
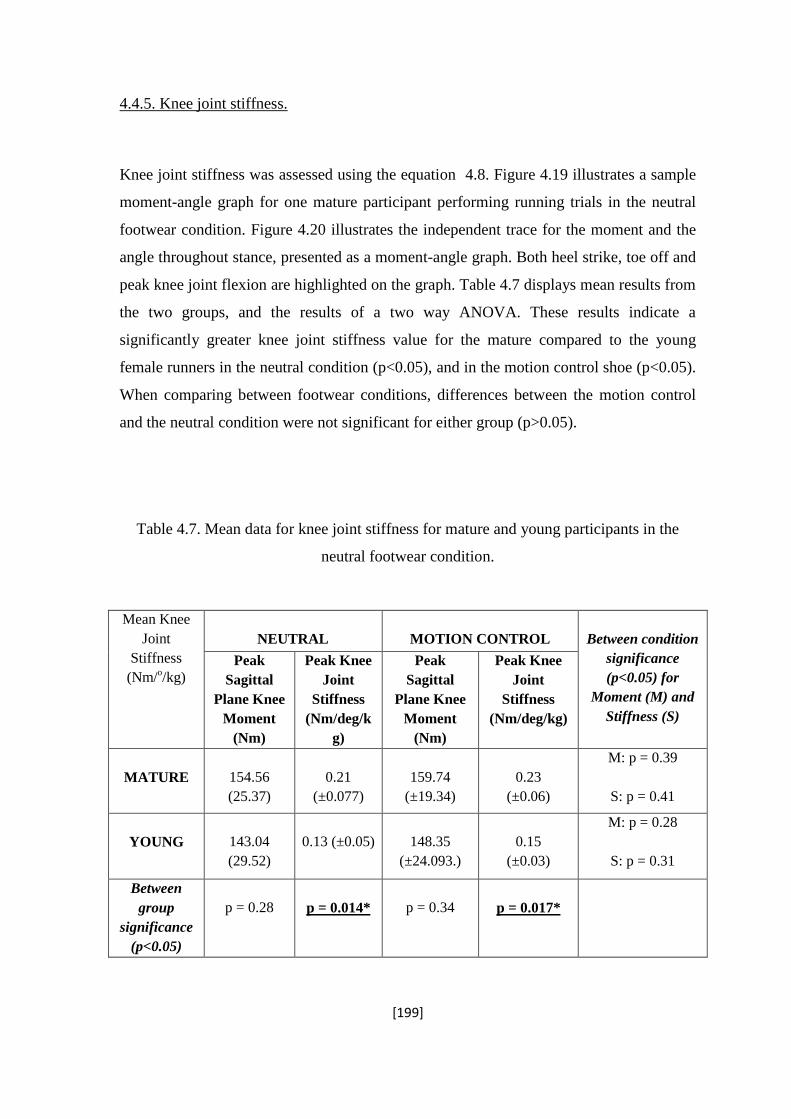
[199]
4.4.5. Knee joint stiffness.
Knee joint stiffness was assessed using the equation 4.8. Figure 4.19 illustrates a sample
moment-angle graph for one mature participant performing running trials in the neutral
footwear condition. Figure 4.20 illustrates the independent trace for the moment and the
angle throughout stance, presented as a moment-angle graph. Both heel strike, toe off and
peak knee joint flexion are highlighted on the graph. Table 4.7 displays mean results from
the two groups, and the results of a two way ANOVA. These results indicate a
significantly greater knee joint stiffness value for the mature compared to the young
female runners in the neutral condition (p<0.05), and in the motion control shoe (p<0.05).
When comparing between footwear conditions, differences between the motion control
and the neutral condition were not significant for either group (p>0.05).
Table 4.7. Mean data for knee joint stiffness for mature and young participants in the
neutral footwear condition.
Mean Knee
Joint
Stiffness
(Nm/o/kg)
NEUTRAL
MOTION CONTROL
Between condition
significance
(p<0.05) for
Moment (M) and
Stiffness (S)
Peak
Sagittal
Plane Knee
Moment
(Nm)
Peak Knee
Joint
Stiffness
(Nm/deg/k
g)
Peak
Sagittal
Plane Knee
Moment
(Nm)
Peak Knee
Joint
Stiffness
(Nm/deg/kg)
MATURE
154.56
(25.37)
0.21
(±0.077)
159.74
(±19.34)
0.23
(±0.06)
M: p = 0.39
S: p = 0.41
YOUNG
143.04
(29.52)
0.13 (±0.05)
148.35
(±24.093.)
0.15
(±0.03)
M: p = 0.28
S: p = 0.31
Between
group
significance
(p<0.05)
p = 0.28
p = 0.014*
p = 0.34
p = 0.017*

[200]
Figure 4.19. Sample moment-angle graph for the knee joint during running trials
performed by a mature participant (4) in the neutral condition.
Figure 4.20. Sample trace of the sagittal plane knee moment and the knee angle produced
by a mature participant (10) in the neutral condition.
Ground contact
Toe-Off
Peak knee flexion

[201]
4.4.6. Quadriceps Muscle strength.
Table 4.8 displays both mean results for quadriceps femoris muscle strength for each
participant, and group means for the mature and the young female runners. Although the
young group produced a mean muscle strength of 10.66 Nm greater than the mature
group, the use of an independent sample t-test showed this difference to be non-
significant (p>0.05). Figures 4.21 a and b illustrate the association between strength and
age (a) and body mass (b) among the mature group. Results from a regression analysis for
strength and age showed the relationship to be positive, but not significant (r = 0.52, p =
0.12), as was that between strength and body mass (r = 0.41, p = 0.23).
Table 4.8. Mean torque generated by the quadriceps for each participant, averaged from
three trials.
Mean maximum
quadriceps
strength,
averaged from 3
trials (Nm).
Mature
Participant
Young
Participant
1 77.5 (± 3.4) 1 70.2 (±1.2)
2 80.9 (±1.6) 2 90.1 (±2.8)
3 35.2 (±2.6) 3 88.3 (±0.9)
4 55.1 (±2.0) 4 72.7 (±2.0)
5 91.3 (±1.5) 5 81.7 (±1.7)
6 49.2 (±1.6) 6 100.0 (±1.3)
7 63.4 (±0.8) 7 61.4 (±1.1)
8 71.4 (±2.5) 8 59.3 (±0.8)
9 73.1 (±2.1) 9 77.7 (±1.5)
10 84.0 (±0.2) 10 61.4 (±1.0)
11 95.9 (0.5)
12 86.6 (±1.8)
Mean 68.12 78.78
Standard
Deviation
17.36 13.91
P-Value P = 0.17

[202]
(a)
(b)
Figure 4.21a and b. Scatter diagram illustrating relationship between muscle strength and
age (a) and muscle strength and body mass (b) for the mature females.

[203]
4.4.7. Summary of results and overall findings.
Compared with young females, the mature females exhibited:
Significantly greater peak ankle eversion angle (neutral).
Significantly greater peak knee internal rotation angle (neutral and motion
control).
Significantly greater peak knee abduction angle (neutral and motion
control).
Significantly greater initial knee angle (neutral).
Significantly greater peak knee external adductor moment (neutral and
motion control).
Significantly greater peak knee external adductor moment arm (neutral and
motion control).
Significantly greater knee joint stiffness (neutral and motion control).
Compared with the neutral shoe, the motion control shoe resulted in:
A significant decrease in ankle eversion angle (mature and young).
A significant decrease in peak knee internal rotation angle (mature).
No significant change in peak knee external adductor moment or moment
arm length.

[204]
4.5. Discussion.
The posture of the foot and ankle complex has long been considered to contribute to the
development of lower limb musculo-skeletal injuries and conditions, due to the effect on
mechanical alignment and dynamic function during gait (Levinger, Menz, Menz,
Fotoohabadi, Feller, Bartlett, Bergman, 2010). As such, attention has been given to the
differing influence of footwear as both an injury treatment and prevention method. This
study aimed to compare the running gait of young and mature females while wearing a
controlled neutral shoe, and to investigate the influence of a motion control shoe on
running biomechanics. Twenty two females, ten mature (40-60 years) and twelve younger
(18-25 years) performed running trials in two footwear conditions; a neutral and a motion
control running trainer. Alongside the gait analysis assessment, all females were assessed
for maximum strength of the quadriceps femoris muscle.
It was hypothesised that the running trials performed in the neutral shoe would result in a
difference in the gait of mature compared to younger females; specifically, higher peak
values of rearfoot eversion, knee internal rotation, knee external adductor moment and
knee joint stiffness. Secondly, it was hypothesised that the motion control shoe would
reduce the biomechanical variables of rearfoot eversion and knee internal rotation among
all females, with greater modifications for the mature group. Thirdly, it was hypothesised
that the medial support in the motion control shoe would increase the knee abduction and
the moment arm length, producing an overall rise in the peak knee external adductor
moment in both groups. Finally, in terms of physiological differences, it was
hypothesised that the muscle strength of the mature group would be significantly lower
than that of the younger group.

[205]
4.5.1 Hypothesis One: A controlled neutral shoe.
In support of hypothesis one, when running in the controlled neutral shoe, rearfoot
eversion, knee internal rotation, knee external adductor moment, and knee joint stiffness
were significantly higher among mature (40-60 years) compared to young females (18-25
years). Although this theory was suggested in the previous chapter, the results from this
current investigation support the notion that, after controlling for the effect of footwear,
the biomechanics of running gait were significantly different among a group of mature
females when compared to a younger group.
4.5.1.1. Kinematic differences in the running gait of mature and young females in a
controlled neutral footwear condition.
Rearfoot eversion is a natural mechanism involved in shock attenuation during the stance
phase of walking and running gait (Nordin & Frankel, 1989). However, it has been
extensively reported that excessive magnitudes of rearfoot eversion lead to increased risk
of developing lower limb conditions (Clarke et al., 1983; Hintermann & Nigg, 1998;
O’Connor et al., 2004).
The increased rearfoot eversion demonstrated by mature females leads to a suggestion
that increasing age results in altered biomechanics. An early study by Hutton and
colleagues suggested that advancing age causes a “sag” in the longitudinal arch of the
foot, increasing the proportion that is in contact with the ground, and producing a
pronated position at the subtalar joint (Hutton & Dhanendran, 1979). This was later
confirmed by the theory that changes in foot structure and biomechanics occur with
advancing age, and Staheli and colleagues indicated a trend towards flatter feet in people
over the age of 30 years (Staheli, Chew & Corbett, 1987). Similarly, with the use of an
arch index assessment, Scott and colleagues showed mature participants to present with
higher levels of pronation compared to a younger group (Scott, Menz & Newcombe,
2007). Although the results from this latter study (Scott et al., 2007) were shown during
both standing and walking gait, the results among the mature females appear to confirm

[206]
the suggestions that changes occur with age, with significantly greater values of rearfoot
eversion compared to a younger group in a neutral footwear condition.
At the foot-ankle complex, excessive rearfoot eversion and subtalar joint pronation places
increased pressure on the plantar fascia during weight-bearing; a common risk factor for
the development of plantar fasciitis (Irving, Cook, Young, & Menz, 2007). The high
magnitude of rearfoot eversion seen among the mature females therefore supports
suggestions in the literature that increasing age is a common risk factor for the
development of plantar fasciitis among runners (Scher, Belmont, & Owens., 2007).
Therefore it could be suggested that the link between age and this condition is due to
tendency for mature participants to run with an increased magnitude of rearfoot eversion.
Increased rearfoot eversion and associated pressure on the plantar fascia during the stance
phase of running, has been suggested to alter the biomechanics of the adjacent limbs and
reduce the efficiency of force absorption (Kilber, Goldberg, Chandler, 1991). Excessive
rearfoot eversion may therefore also lead to adverse effects at the proximal joints;
specifically the knee joint.
According to Laughton and colleagues, excessive rearfoot eversion leads to increased
strain on the soft tissues around the knee joint, and an increased risk of developing
specific conditions associated with overloading (Laughton, McClay-Davis, & Hamill,
2003). It has been shown that increased eversion angle of the rearfoot and accompanied
increased loading under the medial forefoot is significantly related to the development of
exercise related lower leg pain (Willems et al., 2006). In addition, Reilly and colleagues
illustrated a significantly greater frontal plane calcaneal angle, indicative of rearfoot
eversion, among a group of patients presenting medial knee osteoarthritis (Reilly, Barker,
Shamley, & Sandall, 2006). However there is no mention of the certainty that the rearfoot
eversion angle was not a consequence of the altered knee biomechanics caused by the
osteoarthritis, as opposed to a causative factor itself. The link between medial
compartment knee osteoarthritis and higher values of rearfoot eversion was however also
considered by Riegger and Krugh (1996) who suggested that people with higher levels of
knee osteoarthritis and associated knee external adductor moments, also display higher
values of subtalar pronation, to enable the foot to plantigrade (with the heel, metacarpals,
carpals and phalanges all in contact with the ground) during the stance phase of gait.
However, as these female runners were free from symptoms of osteoarthritis or injuries at
[207]
the knee joint, the possibility of subtalar joint pronation occurring as a result of
biomechanical changes due to injury appears minimal. Instead, the high subtalar
pronation appears more likely a risk factor for this population.
Although the mature females demonstrated a significantly greater peak eversion angle, no
difference was seen in the occurrence time of the angle, or the velocity with which the
angle reached its peak. This is contrary to previous research suggesting that an increase in
peak angle is associated with a faster occurrence time, and it is the latter that is also
associated with increased stress at the knee joint (Hamill, Emmerik, & Heiderscheit,
1999). Despite this, it is suggested that it is the peak angle of rearfoot eversion angle
presented by the mature females that may contribute to the high injury rates documented
for this population (Taunton et al., 2002; Hintermann & Nigg, 1998).
Due to the coupling between the subtalar joint and the tibia, and the inclination of the
subtalar axis, rearfoot eversion is coupled to internal rotation of the tibia and knee joint
(Nigg et al., 1993). This relationship has been supported in this study, with the
significantly higher peak knee internal rotation angle presented by the mature females in
the current study (p<0.05) likely related to the high rear foot eversion. Although the
occurrence time of peak knee internal rotation angle was not different between the two
groups, in the neutral condition, both rearfoot eversion angle and knee internal rotation
peaked at an average of 0.11 seconds for both groups.
Knee internal rotation occurs during the early stages of the stance phase of gait (loading
phase). This movement is dominated by the motion of the tibia rotating about the femur,
and as such is commonly linked with the position of the foot and ankle on the ground
(Richards, 2008). Knee internal rotation is partly controlled by the posterolateral
structures of the knee joint, and as such is commonly linked with the increased risk of
damage to the anterior cruciate ligament (ACL). Although this current study with the
mature females did not directly consider ACL injuries, the association between this
condition and knee internal rotation is discussed. It has commonly been suggested that in
an ACL deficient knee joint, knee internal rotation is higher, with increases of 20%
reported in the literature (Andriacchi & Dyrby, 2005). Similarly, it has also been reported
that the strength of the ACL ligament structure and its insertion diminishes with
advancing age (McKeon, Bono, & Richmond, 2009). As such, it is possible that reduced

[208]
flexibility and strength of the ligaments within the knee joint could be a contributing
factor to the high level of knee internal rotation demonstrated by the mature females.
This high knee rotation for mature females is likely contributing to the higher injury rates
that have been documented for this population (Taunton et al., 2002; Rose et al., 2011).
Excessive pronation of the subtalar joint, and internal rotation of the knee, forces the
patella out of the patellar grove of the femur to ride over the lateral aspect of the groove
and irritate the lateral patella cartilage (Ramig, Shadle, & Watkins, 1980). The magnitude
of rearfoot eversion and the transferral into tibial internal rotation, and internal rotation of
the knee joint has therefore been related to overloading and stress at the lateral knee
(Eslami et al., 2007). According to Andriacchi and Dyrby (2004), an altered rotational
position of the knee joint could produce changes in the tibiofemoral contact area during
gait, leading to degenerative changes in the meniscus and articular cartilage. Similarly,
during gait, high values of knee internal rotation interfere with normal knee function as
the patella is shifted laterally, in turn increasing the vertical pull of the vastas medialis,
increasing compressive forces on the knee joint (Olson, 2007). Additionally, excessive
internal rotation of the knee joint causes decreased patellofemoral contact area, in turn
increasing the pressure in specific areas, increasing wear on the lateral condyles of the
knee joint (Norris, 2004).
Although no significant difference was seen in the peak knee flexion angle between the
two group, the initial knee angle was significantly greater among the mature compared to
younger female runners (p<0.05). This suggests that at ground contact, the mature
females had significantly more flexion angle at the knee joint, in contrast to the younger
group who tended to strike with a straighter leg. During running gait, in preparation for
heel strike, the hamstring muscles contract to control for knee hyperextension. Among the
mature female runners, the increased knee flexion angle at heel strike could therefore be
considered a possible consequence of tightness of this muscle group. According to
Akinpelu, Bakare and Adegoke (2005), hamstring tightness significantly increases with
age up to 49 years, suggesting that the hamstrings of the mature group will naturally be
tighter than those of the younger group of females.
It has been shown that an increase in knee angle (flexion) at heel strike improves the
impact attenuation during the early stance phase of running gait (McMahon, Valiant &
Frederick, 1987). However, other researchers have suggested that an increase in knee

[209]
angle at ground contact has varying effects on impact attenuation above and below the
knee joint; with impact attenuation of the shank shown to increase, and of the thigh,
shown to improve (Hamill, Derrick & Holt, 1995; Derrick, Hamill & Caldwell, 1998).
The consequence of knee angle at initial contact has been subject to debate, and will be
discussed in greater detail in its relation to knee joint stiffness in a later section.
A significant difference was also observed in the magnitude of knee abduction angle,
where mature females ran with a significantly greater peak knee abduction angle
(p<0.05). This occurred during late stance among both groups. The increase in knee
abduction among the mature females is of particular interest due to its association with
the knee external adductor moment. Although it was not directly hypothesised that the
mature group would display greater knee abduction angles, as the adductor moment was
predicted to be greater, the position of the knee was expected to be in a more abducted
(varus) position. An increase in knee abduction causes an increase in the moment arm
length; the distance between the knee joint centre and the line of frontal plane ground
reaction force, therefore increasing the knee external adductor moment. This therefore
indirectly links higher values of knee abduction to an increased risk of medial
compartment knee osteoarthritis among this mature group of runners; a notion supported
in the following review of relevant research.
An abducted or varus knee during running causes medial displacement of the resultant
force acting through the knee joint (Maquet, 1976). This in turn has been shown to place
specific areas of the knee under increased loads, with a varus knee causing a fourfold
increase in the risk of medial tibiofemoral osteoarthritis, determined by the presence of
tibiofemoral osteophytes (Sharma et al., 2001). Therefore, among the mature females, the
high knee abduction values are considered a potential risk factor for the development of
conditions at the knee joint including medial compartment osteoarthritis.
In support of this Chang et al (2011) suggested varus tibiofemoral malalignment in the
frontal plane can be regarded as a typical marker of osteoarthritis disease severity, and a
risk factor for unicompartmental progression of osteoarthritis of the medial knee (Chang
et al, 2011; Janakiramanan et al., 2008). Chang and coworkers also related dynamic varus
thrust, implying a lateral movement of the knee joint, during ambulation to be an
important factor in the progression of medial compartment knee osteoarthritis (Chang et
al., 2011). Additionally, Cahue, Dunlop, Hayes, Song, Torres, & Sharma (2004)

[210]
demonstrated a varus alignment of the knee to significantly increase the risk of
osteoarthritis to the medial patellofemoral compartment, due to a varus shift in the
collinear alignment of the hip, knee and ankle. This varus alignment in comparison to a
“normally” aligned knee is illustrated in Figure 4.22.
Figure 4.22. Comparison of the normal and varus aligned knee during gait.
Source: Richards, 2008.
Normal alignment Varus alignment

[211]
A malaligned knee, with varus alignment has also been shown to increase knee valgus-
varus laxity of the joint (Chang, Hayes, Dunlop, Hurwitz, Song & Cahue, 2004). Varus
malalignment causes repetitive stretching of the collateral ligament, which increases
capsule ligamentous laxity (Chang et al., 2004). Varus-valgus laxity at the knee joint has
been related to development and progression of knee osteoarthritis, and has been shown
to precede osteoarthritis development, and may predispose individuals to the condition
(Sharma, Lou, Felson, Dunlop, Kirwin-Mellis, & Hayes, 1999). Similarly, laxity at the
knee has been shown to increase with age, and is more common among women than men.
In an investigation of 450 participants, radiographic signs of osteoarthritis were found in
18.4% of men and 26% of women. Interestingly, among women, of those with
radiographic osteoarthritis, only 32.5% reported pain. Additionally, the incidence of
valgus-varus laxity associated with radiographic osteoarthritis was significantly higher for
women than men (p<0.00001), with varus laxity demonstrated in 48.5% of women and
only 13% of men. The association of knee varus with medial compartment knee joint
osteoarthritis is further discussed in a later section, in relation to the moment arm of the
knee external adductor moment.
4.5.1.2. Kinetic differences in running biomechanics between mature and young females.
When running in the neutral shoe, as hypothesised a significant differences was observed
in the knee external adductor moment between the mature and the young females. These
results lie in accordance with those from the previous study; however this difference was
observed when participants were wearing neutral shoes. This suggests that the differences
in biomechanical joint moments are inherent to the mature group, as footwear has
previously been shown to have an effect on knee external adductor moments. According
to Yasuda and Sasaki (1987), an increase in the lateral support within running shoes may
significantly reduce knee moments and medial compartment load. Therefore with no
differing effect of footwear between the two groups, the significant difference in knee
external adductor moment is considered a possible change inherent with increasing age
among females.

[212]
The knee external adductor moment is an important biomechanical marker of joint
pathology (Foroughi et al., 2009). Large knee external adductor moments are related to
knee varus movements as described above, in turn increasing the loads at the medial
compartment of the knee joint (Norris, 2004). This therefore lies in accordance with the
kinematic results, indicating significantly greater knee abduction movements among the
mature compared to the young females. The association between these two variables is
shown in a sample graph (Figure 4.17), illustrating the two peaks to occur at a similar
time in stance. This relationship is further supported by the results from the moment arm
data. The higher moment arm produced by the mature group, suggests that the midpoint
of the knee was located significantly further from the line of ground reaction force, when
compared to the younger group. Furthermore, as all the moment arm values calculated
were negative, this illustrates that the knee joint centre was positioned laterally to the line
of ground reaction force, and the knee was in an abducted position.
As the results from the KOOS survey categorised all females as free from symptoms and
signs of osteoarthritis, the high knee external adductor moments produced by this group
suggest a high risk for the development of the condition. As discussed, the knee external
adductor moment acts at the knee joint in response to an abducted knee position
(Levinger et al., 2010). According to Miyazaki et al (2002) the knee external adductor
moment is a strong predictor of medial compartment load and osteoarthritis, suggesting a
possible reason for the high incidence and risk of this condition among this population.
Furthermore, Sharma et al (1999) significantly associated knee external adductor
moments with narrowing of the medial tibiofemoral compartment, suggesting increased
magnitude of intrinsic compressive load. The significant difference between the mature
and the young females in the magnitude of this moment suggest a possible association
between age and altered joint torque. These results could therefore lie in accordance with
the theory that an increase in age is a risk factor for knee joint osteoarthritis. Although the
literature clearly categorises age as a risk factor for osteoarthritis development, little
research has occurred to investigate the role of biomechanical changes with age.
Therefore it is suggested that, with footwear controlled for, the mature females run with
increased knee abduction and external adductor moments, which could increase
susceptibility to conditions such as medial compartment knee osteoarthritis.

[213]
4.5.1.3. Biomechanical similarities between mature and young female runners.
In contrast to the significant changes in rearfoot eversion, knee internal rotation, knee
abduction, and knee external adductor moment, several biomechanical variables appeared
to show no difference for the two age groups. As illustrated in Table 4.3, no significant
differences were seen in the peak ankle dorsiflexion or peak knee flexion angles between
the mature and the young female runners (p>0.05). Both motions during gait occur in the
sagittal plane, and are therefore predominantly controlled by the antagonistic muscles
around the femur and those around the shank (Norris, 2004). Ankle dorsiflexion occurs
when the talus glides posteriorly on the tibia, and forms a stable, closed-pack position
during midstance (Malliaras, Cook & Kent, 2006).
Average ankle dorsiflexion angle ranges between 20-30o; runners presenting values below
this range have been suggested to be at an increased risk of damage to the ankle and knee
joint (Norris, 2004). Reduced dorsiflexion during running prevents the ankle from
reaching its stable closed pack position at midstance, causing instability of the joint, and
increased vulnerability to hypersupination; an additional risk factor for injuries (Lindsay
et al., 2008). Similarly, Pope, Herbert and Kirwan (1998) investigated running gait of
1093 male army recruits over 12 weeks of intensive training, and recorded 48 injuries to
the lower limb. A significant correlation was then demonstrated between reduced ankle
dorsiflexion range of motion and injury occurrence.
Among the mature females, running trials in the neutral conditions elicited an average
peak ankle dorsiflexion of 26.2 ± 6.5 degrees, compared to 33.9 ± 12.6 degrees shown by
the younger group. Therefore, since both values are within or above the range suggested
by the literature it is suggested that neither group is showing signs of increased injury risk
associated with sagittal plane motion at the ankle joint (Brukner & Khan, 2006).
In addition to ankle dorsiflexion, peak knee joint flexion was also similar between the two
groups. Reduced peak knee joint flexion angle has been associated with increased
tightness of the hamstring and glutei muscles and subsequent risk of associated injury to
both (Norris, 2004). Additionally, it has been proposed that decreased knee flexion
throughout the stance phase of gait elicits anterior tibial shear loads that are in high
enough magnitudes as to damage the anterior cruciate ligament of the knee joint (Myer,

[214]
Ford, Khoury, Succop & Hewett, 2011). Consideration of this lack of difference in the
peak knee flexion is further discussed in relation to strength of the quadriceps muscle and
knee joint stiffness during running.
Although an association between ankle dorsiflexion and knee flexion exists, this is
predominantly seen at the end of swing phase (DeLisa, Gans & Walsh, 2005). However,
the two motions do occur concurrently during the initial stages of running gait; as the
ankle dorsiflexors and the knee extensors are simultaneously activated, termed the
loading response (Kirtely, 2006). This therefore supports the results from the mature and
young females, as no differences were seen in either variable between the two groups.
When directly comparing results from the two groups of females, the lack of change in
range of motion at the knee and ankle joint tends to lie in opposition to the theory that
decreased joint range of motion is a common factor associated with ageing (Messier et al.,
1991). The conclusion based on the results from the females suggests that a change in
range of motion does not occur from the approximate ages of 20 to 50 years. These
results do however support those of Roach and Miles (1991) who conducted a large study
into the effect of aging. Here it was suggested that differences in range of motion in
people aged between 25 and 74 years were minimal (3-5 degrees) and any change in
range of motion in people before the latter age should be considered abnormal (Roach and
Miles, 1991).
Similar to the kinematic variables of knee joint flexion and ankle dorsiflexion, the loading
rates exhibited by the two groups were not significantly different in the neutral footwear
condition. Each participant within this study was categorised as a heel striker, indicating
that the initial contact with the ground at the end of swing phase occurs with the heel. The
force attained here is the impact peak, and occurs within the first 10% of stance (Hreljac,
2004). Depending on speed and kinematic position of the ankle and foot complex, during
running the impact force varies from 1.5 to 5 BWs. The rate of loading implies the speed
with which this force is applied and transmitted to the lower limb, and has been
consistently linked with overuse injury prevalence. The lack of difference in loading rates
among the mature females compared to the younger group is surprising given the
significant difference shown in the previous study.
Common theories have previously associated high loading rates with running-related
overuse conditions; eliciting a direct risk to damage of articular cartilage and subchondral

[215]
bone of the knee joint (Syed & Davis, 2000). Nigg and colleagues recruited a group of
both control and injured participants, and found the latter to have significantly higher
rates of loading than the former group (Nigg et al., 1981). Similarly, Hreljac (2000)
investigated a group of female runners with a history of various overuse conditions, and
showed them to present significantly greater loading rates than a group of females that
had not previously attained an overuse condition. In an additional study on female
runners, Ferber et al (2002) reported that a history of stress fractures was positively
associated with higher loading rates during running, although this investigation only
incorporated injuries to the tibia as opposed to the knee joint.
Although all the mentioned studies appear to link high loading rates to injury risk, it is
noted that the link is often retrospective, with previous or current injury status being
correlated with high loading rates. This therefore questions the categorisation of loading
rates as a lone risk factor for the development of injuries. This latter thought is supported
by the results of one prospective study, which showed that subjects with greater loading
rates during gait in fact sustained significantly fewer running related injuries than those
with higher magnitudes of the kinetic variable (Nigg et al., 1997). Similarly, results from
one study among post-menopausal women who were exposed to a two-year long
programme of high impact exercise showed a 4 % increase in bone mineral density,
compared to a decline among a non-impact group (Heinonen, Kannus & Sievanen.,
1996). These findings therefore lie in contrast to previous suggestions that impact loading
leads to injury.
It was initially hypothesised that the mature group would display significantly greater
loading rates compared to the younger group, as the former are suggested to be more
prone to injury occurrence. Although in a high risk category, the lack of higher loading
rates among the mature group could be due to the fact that no participant had sustained a
previous injury while running. Similarly, although mature females appear to be at a
greater risk of injury and debilitating conditions due to certain biomechanical features, the
results from this study alongside those in the literature question the importance of these
loading rates as a risk factor for running related conditions and injuries.

[216]
4.5.1.4. Knee joint stiffness.
Knee joint stiffness is often defined as the change in sagittal plane joint angle in response
to an applied joint moment from initial ground contact to peak knee joint flexion (Farley,
& Morgenroth, 1999). Although mean stiffness has often been calculated throughout the
entire stance phase, it is suggested that this method may overlook the possibility of
differing stiffness values throughout the impact and active phase of gait (Butler et al.,
2003). As such, for the purpose of this investigation, knee joint stiffness was calculated as
the change in joint moment divided by the change in joint angle, from initial ground
contact to peak knee flexion. In the neutral condition, results among the mature females
showed knee joint stiffness to be significantly higher than that produced by the younger
group. Despite this, no significant difference was displayed in the peak knee flexion angle
between the two groups. However a significant difference was seen in the initial knee
joint angle, with mature females showing higher angles of flexion at ground contact. It
could therefore be considered that the increase in knee joint stiffness was in part, due to
the increased knee angle at contact; reducing the overall knee excursion. This supports the
previous research of Farely and colleagues, who suggested that joint stiffness may be
primarily influenced by the initial knee joint angle (Farley et al., 1999), and Dixon and
colleagues, who suggested that increased knee flexion at ground contact causes a
reduction in knee excursion range and an increase in knee stiffness (Dixon et al., 2010).
Prior to normalising for body weight, the knee joint stiffness values ranged from 5.84 to
17.48 Nm/degree among the mature, and 4.04 to 12.09 Nm/degree among the younger
group. These values fall in line with those presented in the literature, including an average
of 4 Nm/degree for participants walking, and those ranging from 17 to 24 Nm/degree
with increasing running speed (Dixon et al., 2010; Kuitunen et al., 2002). Within this
investigation among female runners, the mature group was shown to display significantly
greater values of knee joint stiffness than the younger group during running trials in a
controlled neutral shoe. This suggests that an effect of age exists for this biomechanical
variable; a notion also supported by Lark and colleagues (Lark, Buckley, Bennett, Jones
& Sargent, 2003). In an investigation, Lark and co-workers showed a significant increase
in joint stiffness among more mature men compared to younger men. Although these
differences were predominantly seen at the ankle joint, during stepping motions, it is

[217]
suggested that muscle control mechanisms in response to activity change with age (Lark
et al., 2003).
An increase in joint stiffness acts to maintain stability of the joint during gait, and reduce
the movement excursions of the lower extremity. However, negative consequences have
also been shown, with an increase in torsional stiffness associated with deleterious effects
on the integrity of the cartilage. According to Griffin and Guilak (2005), increased
antagonistic forces that produce stiffness often result in increased joint compressive
forces, and increased risk for conditions such as osteoarthritis of the joint. Although not
significant, the knee joint moments were higher among the mature group (young to
mature 143.04 Nm to 154.56 Nm), where as the peak knee flexion angles were similar
(young to mature 28.9o to 32.3
o), suggesting that the observed differences in stiffness
were contributed to primarily by the differences in initial knee angle and a slight increase
in joint moment. This suggests that higher loads for the mature group acted over a similar
range of articular surface, which could initiate cartilage degradation among the mature
females (Zeni and Higginson, 2009).
As suggested previously, an increase in knee joint stiffness could, in part, be due to an
increase in tightness of the hamstring muscles that is common with increasing age.
Additionally higher values of knee joint stiffness could be contributed to by passive
restraint caused by ligaments, joint geometry, friction between cartilage surfaces, and the
load on the joint caused by compressive forces resulting from gravity and the muscles
acting on the joint (Lephart, & Fu, 2000). Therefore, with a lack of knowledge regarding
these features it is suggested that the values produced by the females enable only
inferences on the exact stiffness of the knee joint of each runner in the current study.
The suggested association between knee joint stiffness and osteoarthritis has commonly
been a retrospective one, with high magnitudes of joint stiffness often demonstrated
among symptomatic diagnosed patients (Zeni et al., 2009; Dixon et al., 2010). However,
with higher values demonstrated for a symptom free group of females, it is suggested that
this biomechanical variable could be a risk factor for the development of debilitating
conditions, such as osteoarthritis at the knee joint.

[218]
4.5.2 Hypothesis Two: A motion control shoe.
4.5.2.1. Effectiveness of a motion control shoe to alter kinematics during running.
The results from this investigation partially support the second hypotheses, as significant
changes were observed in two variables with footwear interventions. When compared to
the neutral shoe, the running trials performed in the motion control shoe illustrated
significant reductions in the peak rearfoot eversion angle and the peak knee internal
rotation angle among both groups of females. Furthermore, larger reductions in peak
rearfoot eversion and knee internal rotation were found for the mature compared to the
young group. Among the mature group, peak rearfoot eversion decreased by an average
of 4.9o, compared to a 2.5
o decrease among the younger group. Among the mature
females, individual analyses illustrated nine from the ten participants to show a reduction
in rearfoot eversion with the motion control shoe. Participant 5 however showed an angle
of 5.7o (± 1.05) with the neutral and 7
o (± 2.66) with the motion control shoe. Similarly,
among the younger group nine from the ten participants illustrated a decrease in rearfoot
eversion with the motion control shoe with participant 10 showing an increase of 2.5o.
From the twenty two participants tested, 90.9% showed a decrease in rearfoot kinematics
with the motion control shoe. In addition, the effectiveness of the motion control shoe in
altering rearfoot kinematics was further supported by the lack of significant difference in
the rearfoot eversion angle between the younger group and the mature females in the
motion control shoe (p>0.05), suggesting a greater change in eversion angle among the
mature group of runners.
Many running related injuries have previously been associated with malalignment of the
skeleton during movement, due to the uneven distribution of forces across the joints
(Nigg, 2001). As such, alignment of the musculoskeletal system has been one of the main
functions of running shoes, inserts and orthotics (Nigg, 2001). The motion control shoe
used within this investigation incorporated differing support on the medial and lateral
sides, with an increase in arch height and sole hardness on the medial longitudinal arch.
Biomechanically, the foot is represented in the current study as a rigid structure; therefore
reduced medial movement of the mid foot is represented by the movement of the rearfoot.

[219]
As all mature females were categorised as heel-strikers, at ground contact the calcaneus
strikes the ground on the lateral side and quickly progresses through to rearfoot eversion
(Richards, 2008). As forward progression occurs, maximum subtalar pronation occurs to
a position where by the body weight is positioned over the foot (Dungan, & Bhat, 2005).
Although this motion is an essential movement associated with gait, the higher angle of
rearfoot eversion shown among the mature group could increase risk of running-related
overuse conditions in the lower limb (Yamashita, 2005).
The purpose of the “motion control” aspect in the running shoe is to reduce the frontal
plane motion of the heel into eversion, and limit the ability of the longitudinal arch to
collapse during the stance phase of gait (Rose et al., 2011), influencing the movement of
the foot and orientation of the subtalar axis (Stacoff et al., 2000). Therefore, due to the
coupling mechanism between the foot, ankle and tibia, the reduction in rearfoot eversion
with the motion control shoe among the participants in this investigation was as expected,
with all females showing a significant decrease in rearfoot eversion with the motion
control shoe (p<0.05). Although not equivocal in the research literature, these results
among the females do fall in line with much previous research. Cheung and Ng (2007)
demonstrated a motion control shoe to reduce rearfoot eversion by 4o and Clarke (1983)
similarly showed an increase in midsole hardness of a shoe to significantly reduce
rearfoot motion and subsequent pronation. Perry and Lafortune (1995) demonstrated a
motion control shoe insert with a 5o medial wedge, to significantly reduce rearfoot
eversion by an average of 6.7o and Eng and Pierrynowski (1994) illustrated a decrease in
transverse and frontal plane movement at the ankle and knee to reduce with motion
controlling foot orthotics during the early stance phase of gait. Both of these latter studies
however investigated the effect of orthotics.
In contrast to the evidence provided in the previous paragraph, the positive effect of
footwear has not been shown to be unanimous within the research literature (Butler et al.,
2007). Results from a study involving bone pins placed in the calcaneus, tibia and femur
during gait, showed little alterations in kinematics with different shoes and orthotics
during running (Stacoff et al., 2000). This result queries the claim that footwear can align
the skeleton during movement. This was later discussed by Nigg and colleagues, who
suggested that the neuromuscular system is programmed to adopt a minimal resistance
movement path, whereby appropriate muscles will act in response to an intervention that

[220]
changes this path (Nigg et al., 2001). However it could be speculated that the high
eversion angles demonstrated among the mature females have developed as a result of
age, and are therefore producing movements that are different from the original
movement path when the females were younger. As such, the ability of footwear to
change the lower limb kinematics among mature females as seen in this investigation
could be due to the recent increase in rearfoot eversion among this group. This notion is
further supported by the greater decrease in rearfoot eversion among the mature compared
to the younger female runners. Further longitudinal research is required in this area to
assess the change in kinematics over time, and the subsequent ability of footwear to alter
the biomechanics during running.
Alongside reductions in rearfoot eversion, the motion control shoes also significantly
reduced knee internal rotation among the mature females (p<0.05). This was however not
similar for the younger females, with a non significant difference of only 1.7o (p>0.05).
Peak knee internal rotation angle represents the peak rotation of the tibia relative to the
femur about a longitudinal axis embedded within the tibia. An internal rotation angle of
0o indicates the parallel position of the frontal plane of the tibia relative to the medial-
lateral axis of the femur. As shown among the female runners, when running in a
supportive shoe, the ability of the rearfoot to move into eversion is limited. As such, the
normal movement of the tibia and knee is consequently reduced. This is due to the axial
coupling between the foot segment and the tibia bone, via the anterior talofibular and
superior deltoid ligaments (Huson et al., 1986). Additionally, when the subtalar joint
everts, the large range of motion is permitted at the joint and axis, permitting the shock
absorbing mechanism of this movement. However, when in inversion, or before eversion
is achieved, the midtarsal and subtalar joint are locked, reducing the movement
transmitted to the tibia and proximal joints of the lower limb (Huson, 2000).
This effect of motion control shoes on knee movement was supported by Butler and
colleagues (2007), who demonstrated a motion control shoe to significantly reduce tibial
and knee internal rotation. However, surprisingly there was no change in the subtalar joint
motion with the motion control shoes, which contradicts the previous theory that rearfoot
motion and tibial rotation are linked. It is speculated that as the support was centred in the
midsole of the motion control shoe, the effect on the rearfoot may not have been as
influential (Rose et al., 2011). These results were similar to those produced by Nigg and

[221]
colleagues, who found that medially posted moulded orthotics, had a negligible effect on
rearfoot motion during running, although a significant reduction was shown in the
rotation of the tibia, with a 31% reduction shown in the mean angle (Nigg et al., 1999). In
a more recent research study by Rose and colleagues a motion control shoe was once
again shown to significantly reduce tibial rotation among a group of healthy runners
(mean difference of 1.4o). In this research, Rose and colleagues did not however look at
the effect on rearfoot motion (Rose et al., 2011). If tibial and knee internal rotation are
taken as a coupled mechanism, (Kirtley, 2006) these results seem to strongly support
those from this investigation among mature female runners.
Although the mature females showed a significant decrease in knee internal rotation angle
with the motion control shoe, there was still a significant difference between the peak
angle produced by the two groups. This suggests that although the motion control shoes
were effective, the reduction in angle was not sufficient to cause the mature females to
run with rotation values similar to a group of younger runners. As such, results imply that
although the current level of support in the tested motion control shoe may reduce knee
internal rotation among the mature females, the level of support may not be sufficient to
alter the increase in rotation that appears to occur with age among female runners.
Although the inclusion of a motion control shoe did not significantly alter ankle
dorsiflexion, knee abduction or loading rate among mature and young female runners,
results from this study suggest that wearing a motion control shoe such as the Supernova
Sequence could significantly reduce the likelihood of mature females developing an
overuse injury or condition related to eversion and subsequent knee internal rotation. It
has been shown in this investigation that mature female runners as a specific group react
as intended to the motion control element for the running shoe model tested.
[222]
4.5.2.2. Additional factors influencing the effectiveness of a motion control shoe.
It has previously been suggested that patient or shoe characteristics may mediate the
effect of motion control shoes or footwear interventions on the biomechanics of running
gait, suggesting that certain individuals may be more likely to respond (Hinmann &
Bennell, 2009). Therefore an additional consideration when investigating the efficacy of a
motion control shoe in modifying biomechanical parameters of gait is the level of support
in the shoes worn by each participant on a regular basis. This is supported by Hintermann
and Nigg (1998), who suggested that an increase in habituation time to additional support
in trainers causes an incremental increase in the effectiveness of the orthotics to alter gait.
Therefore, although not assessed, if motion control shoes were worn by mature females
on a regular basis, the rearfoot eversion angle may be more adaptable with the inclusion
of this footwear type in the study, when compared to those who wore neutral shoes
regularly. Additionally, the manufacturer brand and design of the regularly worn trainers
may alter each individual’s adaptation to the Adidas shoe provided within this study. This
difference may be a cause for the inconsistent reduction in knee internal rotation among
the younger females, or the lack of change in knee abduction angle or loading rate of
impact force with the motion control shoe among either group.
Similarly, the gait inherent to each individual female runner may mediate the
biomechanical responsiveness to a motion control shoe; however this has not been
extensively reported in the literature. One study by Lidtke and colleagues (2006) did
however show an increase in baseline rearfoot eversion to be associated with an increase
in reduction of the knee external adductor moment with a lateral wedge footwear
intervention. As such, it could be considered that the higher levels of rearfoot eversion
shown by the mature females could in part, provide explanation for the greater reductions
in rearfoot eversion and knee internal rotation angle seen with the motion control shoe
among this group.

[223]
4.5.3. Hypothesis Three: The knee external adductor moment.
The results from this investigation did not support hypothesis three. The motion control
shoes did not significantly increase knee abduction angle, and did not alter the external
knee adductor moment in either group. It was expected that the medial support in the
motion control shoes would significantly increase the varus (abducted) position of the
knees, due to a lateral tilt provided by the mid sole of the shoe. This would reduce the
possibility of the knee moving into valgus (adduction), and cause an increase in the lateral
movement of the knee joint during stance. Similarly, the medial support provided by the
motion control shoe would potentially move the line of action of the ground reaction
force and centre of pressure medially, and increase the varus position of the legs, thereby
increasing the moment arm at the knee (Hunt et al., 2006).
The knee external adductor moment has been linked to symptoms, progression and initial
development of medial knee joint osteoarthritis. Due to this strong association, this
biomechanical variable has recently become recognised as a non-invasive method for
investigating knee joint forces, and acts as a valid and reliable representative of medial to
lateral load distribution at the knee joint (Radzimski, Mundermann, & Sole, 2011). As
such, techniques to reduce the knee external adductor moment during gait have received a
vast amount of interest, and footwear modifications have been viewed as a potential
conservative management of knee joint osteoarthritis (Radzimski et al., 2011).
The non significant change among the female runners lies in contrast to a sample of
results presented in the literature, that investigated motion control shoes and medial knee
joint loading. One study investigated the difference between barefoot running, and
running in a motion control shoe (Brooks Adrenaline) and showed an average increase of
38.33 % in the knee external adductor moment among healthy individuals (Kerrigan et
al., 2009). Similarly, another study looked at the effect of a current stability (motion
control) shoe and a mobility shoe (indicative of barefoot) on the knee external adductor
moment (Shakoor et al., 2008). Results also indicated that when compared to the barefoot
condition and the barefoot simulator shoe, the motion control shoe instigated a slight
increase (8%) in the external adductor moment. However these results were demonstrated
among a group of symptomatic OA patients during walking trials. Schmalz and
colleagues also investigated the effect of a medial wedge on the walking gait of healthy

[224]
individuals and showed a 9.26 % increase in knee external adductor moment when
compared to a non wedged insole (Schmalz et al., 2006).
As such, it appears that the results produced by the mature females fall in contrast to
those presented in the literature. It is speculated that as the mature females had a high
level of rearfoot eversion in the neutral condition, the motion control aspect of the shoe
provided only enough support to bring the foot back to an ideal alignment of the subtalar
joint. Similarly, as the peak external adductor moment occurred during late stance, it is
possible that the medial support based in the heel and mid foot was not adequate to alter
the peak moment produced.
According to Hunt and colleagues, the knee external adductor moment is more dependent
on the length of the moment arm than the magnitude of the ground reaction force,
suggesting that the levels of support in the shoe designed to alter alignment of the lower
limb will have greatest effect on the moment (Hunt et al., 2006). This is supported by an
additional study, where a 1% increase in moment arm length was shown to cause a 6.5
times increase in radiographic progression of medial knee osteoarthritis (Hurwitz et al.,
1998). This is indirectly supported by the results produced by the female runners in the
current study, as no significant change was demonstrated in the moment arm between the
two footwear conditions, consistent with the lack of difference in the knee external
adductor moment (p>0.05).
According to Kakihana and colleagues, changing the component of footwear will alter the
position of the centre of pressure, and subsequent moment arm at the knee; in one study, a
lateral wedge in the shoe caused a lateral shift in the centre of pressure, decreasing the
knee external adductor moment (Kakihana et al., 2005). Additional studies have
investigated varying stiffness levels of the shoe, and consistently showed stiffness of the
lateral as opposed to the medial sole to instigate a reduction in knee external adductor
moment. Fisher demonstrated a 7.2% decrease in knee external adductor moment with an
increase in lateral sole stiffness among a healthy population, and Erhart found an increase
in lateral support to decrease the moment by an average of 6.2% among symptomatic OA
patients (Fisher et al., 2007; Erhart et al., 2008). As such, it is suggested that a footwear
adaptation including lateral support in the shoe will be expected to have the greatest effect
on the knee external adductor moment during stance.

[225]
Since the external adductor moment is commonly associated with osteoarthritis
development at the medial knee, the high knee external adductor moment for the mature
compared with the young runners is potentially detrimental. Therefore, to reduce this
moment among mature females, a footwear intervention is advised, with increased
support on the lateral sole.
4.5.4. Hypothesis four: Muscle strength.
Hypothesis four suggested that the mature females would display reduced quadriceps
strength when directly compared to a group of younger runners. Results from the current
investigation however did not support this expectation. As illustrated in Table 4.8,
although an average of 10.66 Nm difference was demonstrated between the two groups,
this difference was not significant (p>0.05). This suggests that the concentric strength of
the quadriceps muscles was not affected by age, between a mean age of 21.2 and 49.7
years.
Although it was hypothesised that muscle strength would be lower for the mature group,
it is possible that the average age of the mature females was not great enough to warrant a
difference in strength. According to Larsen and colleagues, muscle strength is maintained
between the ages of 30 to 50 years, however from 50 to 70 years there is a 30 % decline
in force generating capacity within the muscles (Larsson et al., 1979). As such, as the
average age of the mature group was below 50 years, the decline in strength may not have
been initiated.
As the age of the mature group spanned 20 years, a regression analysis was performed to
assess whether an effect was seen for age within this particular group. Although the
scatter diagram (Figure 4.21a) appeared to graphically illustrate a linear relationship, the
results were not significant (p>0.05). As shown in the scatter diagram, one participant
seemed to produce results that did not follow the linear trend line. Participant 6 within the
mature group produced a muscle strength maximum of only 49.2 Nm, a value lower than
what would be expected for this female’s age if following the linear relationship. It is
likely that this one subject’s data may have resulted in a non significant regression result.

[226]
Although not assessed in this study, a reduction in muscle strength is often associated
with a decline in muscle mass and muscle fibre size. According to Young and colleagues,
among mature females, the cross sectional area of the quadriceps muscle explained 44 %
of the difference in strength compared to a younger group (Young, Stokes, & Crowe,
1984). This was later supported by Lambert and colleagues who, in a review of the
literature, suggested that cross sectional area of muscles is the factor that most influences
muscle force production (Lambert, & Evans, 2002). Therefore, based on the results
produced by the mature group, it is suggested that the cross sectional area of the
quadriceps femoris muscle was not significantly different between the two groups.
Figure 4.21b illustrates the relationship between muscle strength and body mass.
Although a positive relationship was shown in the graph, results from a regression
analysis proved the relationship to be non significant. This is contrary to previous
research, whereby increased weight among females has commonly been associated with
decreased muscle strength (Slemenda et al., 1998). However it is noted that increased
body mass in this researcher’s investigation was related to obesity. Among the mature
females, the maximum body weight was 60 kg; a value that would not categorise any
mature female as obese. This was as expected, as all females were categorised as runners;
each training three times in a week.
The concept of regular exercise is an additional factor that may explain the lack of
significant difference in the muscle strength between the two groups of females. As a
sedentary lifestyle is a common catalyst for the relationship between age and strength
decline, it is suggested that as all the mature females within the current study train
(running) for the same weekly duration as the younger group, the muscle mass among the
former group may be maintained for longer. This is supported by Eyigor (2004) who
showed a progressive resistive exercise programme to be effective in increasing flexor
and extensor peak torques among a group of participants aged 40 to 70 years. It is noted
here that all participants had some stage of osteoarthritis, further supporting the theory
that strength may reduce the onset of osteoarthritis among the mature members of the
population (Eyigor, 2004).
This association between osteoarthritis and muscle strength has been reported in the
literature. It has been proposed that reduced quadriceps strength is associated with
increased osteoarthritis risk. In a prospective study by Slemenda and colleagues, an 18%

[227]
reduction in quadriceps strength at baseline was associated with the eventual development
of osteoarthritis among females (Slemenda, Heilman, Brandt, Katz, Mazzuca, Braunstein,
& Byrd, 2004). However, no mention of the activity levels of these females was
presented. It is suggested that although the mature female runners may be at an increased
risk of osteoarthritis development, a reduction in muscle strength does not appear to be a
factor.

[228]
4.6. Conclusion and Future Direction.
In light of the results presented, it is apparent that the application of a motion control shoe
significantly alters certain gait parameters inherent to the mature female runner (40 to 60
years). Trials performed in the controlled neutral running shoe confirmed findings from
the previous study, and showed mature females to exhibit a significantly different running
gait pattern compared to younger females. Among the mature group, the motion control
shoe was shown to significantly reduce the magnitude of peak rearfoot eversion and knee
internal rotation; however the peak knee external adductor moment was not changed. In
light of the results of this investigation in conjunction with previous relevant literature, it
is suggested that although the current motion control shoe reduces certain biomechanical
differences between young and mature runners, further footwear adaptations should be
made to adequately reduce other variables associated with the gait of mature females.
4.6.1. Future Research and Intervention shoe.
Excessive joint movement in specific directions during gait has been shown to be a risk
factor for the development of conditions and injuries among runners. An intervention
shoe designed to control the gait of mature female runners is suggested.
Increased arch support has been shown to decrease rearfoot eversion and knee internal
rotation. Therefore, this component of medial support is essential. The current motion
control shoe (Supernova Sequence) was designed with a simplified arch support system.
However, a flattened medial arch is likely to cause negative effects on the knee joint. A
low support medial arch during running increases the risk of soft tissue injuries on the
medial side of the lower limb (Norris, 2004). Furthermore, decreased arch support on the
medial side causes the foot to roll medially during running, causing an uneven
distribution of load, and instigating excessive internal tibial rotation and subsequent
internal rotation of the knee joint (Mirkin, 2005). In addition, it has been suggested that
increasing age can cause slight reductions in arch support, and increased flattening of the
medial arch, due to increased laxity of the plantar ligaments supporting the arch of the

[229]
foot which occurs with age (Moore, 1992). Finally, in an article presented in Runner’s
World Magazine, a review about the Supernova Sequence Women, indicated a common
theme that females felt the medial arch was not supportive enough (Runner’s World, Jan
2010).
In addition to arch support, the inclusion of an increased stiffness on the lateral sole is
suggested for the intervention shoe designed for mature females. As one of the variables
most commonly associated with osteoarthritis development at the medial knee, the high
knee external adductor moment for the mature compared with the younger runners is
important. A high peak knee external adductor moment has been associated with the
severity, rate of progression, and treatment outcome of medial compartment knee joint
osteoarthritis (Baliunas et al., 2002; Miyazaki et al., 2000). Subsequently, researchers
have suggested a lateral wedge as an intervention to decrease this moment. Although such
methods have been shown to reduce the adductor moment, the use of a lateral wedge has
a major limitation in its cause of discomfort (Kerrigan et al., 2002). Therefore, a variable
stiffness shoe is advised, with arch support combined with increased stiffness on the
lateral sole. This has been previously shown to decrease the knee external adductor
moment during walking to the same extent as the wedge in both healthy and osteoarthritic
subjects, with no noted reports of discomfort (Fisher et al., 2007; Erhart et al., 2008).
Although the running gait changes that occur with age have not been extensively
documented with respect to females, certain differences are still applicable to the mature
female runner. According to Whittle (2003) advancing age causes changes to occur to the
musculoskeletal system that can directly and indirectly affect gait. A main structural
change is the reduction in the thickness of the plantar fat pad of the foot (Frey, 1997).
Repeated impact as occurs during running could therefore increase the risk of injury or
pain in this area. Increased cushioning in the shoe sole may counteract this possible
effect.
Although abundant on the shelves of running shoe shops, current motion control shoes do
not control for all components of gait that are related to injury occurrence. Mature female
runners have demonstrated certain gait parameters that could predispose them to injuries
and conditions at the knee (knee external adductor moment), and are unaffected by
motion control components in shoes. Therefore, in light of the results of this investigation
in conjunction with previous relevant literature, it is suggested that certain adaptations are

[230]
made to the current motion control shoe. This will provide a shoe design specific for the
mature female runner, aimed at reducing the currently high incidence of running related
conditions.

[231]
Chapter 5.
“The effect of a lateral wedge and arch support orthotic on the running biomechanics of
mature females.”
5.1. Introduction and Review of Literature.
5.1.1. Review of previous study findings and conclusions.
Mature female runners have been shown to run with increased rearfoot eversion and knee
internal rotation, as well as significantly greater knee external adductor moments
compared with younger females (Lilley et al., 2011). In high magnitudes, all three
components of gait have previously been associated with the predisposition to, and
development of, running related conditions at the knee joint. Furthermore, the use of a
motion control shoe has been demonstrated as successful in reducing the rearfoot eversion
and knee internal rotation movements (Lilley et al., 2011). However, the knee external
adductor moment, frequently associated with knee injury and debilitating conditions
(Miyazaki et al., 2002), was not shown to be influenced by this shoe design. This chapter
considers alternative approaches to reducing knee external adductor moment among
mature female runners.
5.1.2. Rearfoot eversion, knee internal rotation and forefoot abduction.
Rearfoot eversion is an essential component of gait, dominant in early stance and required
for shock absorbency. However excessive rearfoot eversion has often been related to
injury occurrence. High magnitudes of eversion of the rearfoot suggests a hyper-flexible
and unstable foot (Cheung et al., 2007), and previous studies have indicated a link with
increased risk of Achilles tendon injury, plantar fasciitis, and shin pain (Clement et al.,

[232]
1984; Stacoff et al., 2000). Abnormal eversion of the rearfoot occurs when the degree of
eversion is excessive (above 15o), or when pronation occurs when the foot should be
supinating (Kingston, 2000; Brukner and Khan, 2006). Furthermore, an excessively
everted rearfoot tends to internally rotate the lower limb during weight-bearing, through
the transfer of movement proximally along the limb. This increases the demands and
loads placed on the anatomical structures of the leg (Brukner and Khan, 2006) and as
such, the link between excessive eversion and knee rotation has been shown to increase
the risk of knee conditions and pain (Stacoff et al., 2000). Internal rotation of the tibia and
knee joint causes lateral subluxation of the patella, and a change in alignment of the
patella tendon. These contribute to increased tightness of the iliotibial band, and overall
patellofemoral dysfunction during the early stance phase of gait (Brukner and Kahn,
2006).
As previous research has shown rearfoot eversion and knee internal rotation to be
excessively high among a group of mature females, it has been suggested that the running
gait of this specific group may predispose to injuries and conditions at the knee joint. The
previous study demonstrated that the use of an existing motion control shoe with
increased arch support however significantly reduced both variables among mature
female runners. Therefore it has been suggested that this intervention may be suitable for
this specific group.
Although not assessed in the previous studies, forefoot abduction has previously been
associated with excessive values of subtalar joint pronation, and therefore may be high
among mature female runners. As described, the movement of the midtarsal joint is
restricted due to the ligaments crossing the joint; the predominant movement permitted is
that of abduction and adduction of the foot (Perryn, 1992). Adduction involves medial
flexion of the anterior part of the foot, and is one of the movements associated with
inversion, whereas abduction involves lateral flexion associated with eversion (Jenkins,
1998). The initial rearfoot inversion at ground strike is accompanied by adduction of the
midtarsal joint. During the loading response of pronation, abduction of the midtarsal joint
occurs (Whittle, 2003). However, although it is clear that a small degree of both
abduction and adduction are required throughout the gait cycle, deviations from the
normal magnitude of these angles may lead to degeneration of the joints and subsequent
development of debilitating conditions. Forefoot abduction describes the supinated

[233]
position of the metatarsal heads in relation to the hindfoot when the subtalar joint is fixed
in neutral (Root, Orien., & Weed, 1977). During gait, excessive forefoot abduction tends
to induce increased pronation, to enable the medial metatarsal heads to contact the ground
(Alonzo-Vaquez, Villarroya, Franco, Asin & Calvo., 2009). As such, this forefoot
movement has been related to the injuries associated with excessive subtalar joint
pronation (Alonzo et al., 2009). Although not assessed with a motion control shoe in the
previous study, it may be interesting to assess the effect of footwear interventions on this
parameter of gait. Due to the association with rearfoot eversion it is suggested that a
medial wedge may be suitable to reduce this movement among mature female runners.
According to Kernozek and Richard (1990), excessive abduction during the stance phase
of gait can lead to a lowered longitudinal arch of the foot (flat foot), and increased
pronation. This in turn is then related to increased rear foot motion, excessive rearfoot
eversion and greater risk of load related conditions developing at the knee joint. This
notion was later supported by Myerson, (1999) who stated that flat foot deformity during
the stance phase of gait was associated with increased abduction of the foot. Furthermore,
it was suggested that abduction of the midtarsal joint was related to increased lateral
displacement of the foot, lower limb malalignment, and subsequent medial displacement
of the resultant force acting through the knee joint.
5.1.3. The knee external adductor moment, medial knee joint loading and osteoarthritis.
The knee external adductor moment, acting in the frontal plane during stance phase, has
been shown to be consistently high among mature female runners (Lilley et al., 2011).
However, current motion control shoes with medial support have been shown to have
little effect on this potentially harmful component of running gait (Lilley et al., 2011).
As described in Chapter 3, lower limb alignment of the hip, knee and ankle, contributes to
the distribution of load by proportionately dividing it across a load bearing axis, between
the medial and lateral components of the joint (Hunter et al., 2005). This axis is
represented by a line drawn from the mid femoral head to the centre of the ankle, and
during weight-bearing in neutral alignment, the medial compartment is known to

[234]
accommodate between 60 and 70% of the entire load experienced at the knee joint
(Jenkyn et al., 2008).
Figure 5.1. The external adductor moment acting at the knee joint (right) compared with
“normal” alignment (left). View from the front.
It is widely accepted that both the magnitude and distribution of biomechanical forces are
associated with the development of degenerative conditions at the knee joint (Andriacchi
et al., 2004). When a knee external adductor moment acts at the knee joint, the relative
load on the medial compartment is increased, and the risk of the initiation and progression
of these conditions increases (Miyazaki et al., 2000; Zhao et al., 2006). High magnitudes
of this variable experienced during walking and running gait have therefore been shown
to increase the development of degenerative conditions such as osteoarthritis of the
medial compartment (Sharma et al., 1998; Hurwitz et al., 1998; Jenkyn et al., 2008).
As described in Chapter 2, osteoarthritis is a degenerative joint condition, and the most
common form of arthritis to affect people of all ages. It is however most common among
the more mature members of the developed world (Hinton, Moody, Davis & Thomas,

[235]
2002). This condition occurs as increased loads on the medial compartment lead to
degeneration of the articular cartilage surrounding the femur and tibia (Foroughi, Smith &
Vanwanseele, 2009). Early stages are defined by evidence of thinning cartilage, bruising
of the underlying bone (oedema), and the development of osteophytes and sub articular
cysts (Gormley & Hussey, 2005). However, as articular cartilage is not innervated, these
radiographic signs are often not married with clinical signs and symptoms of parity
(Gormley & Hussey, 2005).
5.1.4. The effect of footwear on the knee external adductor moment.
Orthoses are a means by which to alter the alignment of the foot and lower limb during
static stance and gait. As such, a medially or laterally inclined wedge is bracketed under
the same heading as an orthotic, with the intention of modifying the alignment of the
lower limb during locomotion.
Over the past two decades, research has been conducted to investigate the effect of
modified footwear as a potential conservative management strategy for knee
osteoarthritis. Although the majority of this research has focussed on diagnosed
symptomatic patients during walking, interventions that are proven to reduce this
moment, are a key step to potentially managing symptoms and reducing rates of knee
osteoarthritis.
Among healthy subjects, studies investigating the effect of footwear on the knee external
adductor moment have predominantly involved subjects performing walking trials.
However two studies have looked at symptom free subjects running at self selected
speeds. Kerrigan et al (2009) investigated the effect of a motion control shoe on the knee
external adductor moment, and demonstrated a 38.33% increase in moment among a
group of males and females with a mean age of 34 years. In an additional study, Eslami et
al (2009) recruited 11 males with a mean age of 27.9 years, and assessed knee external
adductor moment among subjects running in sandals and sandals with a semi rigid
orthotic. Results demonstrated a slight decrease in the knee external adductor moment
among trials performed in the orthotic compared to the sandal. However these results

[236]
were insignificant with large standard deviations, and were attributed to differences in
individual adaptation to footwear interventions (Eslami et al., 2009).
Although the above investigations have looked at medial support modifications, lateral
wedging of shoes has been investigated more frequently with the aim to reduce the knee
external adductor moment (Radzimski et al., 2011). One early study looked at the effect
of a nickleplast lateral wedge extending the entire inferior border from hindfoot to
forefoot, on the external knee adductor moment of 17 female participants (mean age 27.7
years). Participants wore their own shoes as the control, and then the orthotics were
added providing the test trials. After walking at a self selected speed, a significant mean
reduction of 6.76% was demonstrated in the peak knee external adductor moments in the
lateral wedge condition (Crenshaw et al., 2000). This was supported in later
investigations, where a 3 degree and 6 degree lateral wedge were shown to reduce the
knee external adductor moment by 8.9% and 24.4% respectively among 10 participants (5
males, 5 females, mean age 25 years) (Kakihana et al., 2004), and a 14 degree lateral
wedge reduced the moment by 5.6% among 6 males and 4 females aged 34 years (Shmalz
et al., 2006), although this latter result was reported insignificant in the article. Kakihana
and colleagues later performed two studies isolating males and females, and showed a 6
degree lateral wedge tested under the same conditions to demonstrate reductions of 9.38%
and 11.33% among males and females respectively (Kakihana et al., 2005; Kakihana et
al., 2007).
A later study also looked at the effect of increasing the speed of walking on changes in
knee external adductor moment. Erhart et al (2008) demonstrated both a 4 degree and 8
degree lateral wedge to significantly reduce the knee external adductor moment among 9
females and 6 males (mean age 28.6 years), with an additional effect for speed. When
three walking speeds were assessed, the addition of the 8 degree lateral wedge illustrated
the greatest decrease in knee external adductor moments at the highest speed (slow,
17.3% reduction; fast, 19.1% reduction).
Therefore, although this did not look at the effect of running, results suggest that the
reductions in the knee external adductor moment through shoe modifications may be
greater when subjects perform running trials. Additionally, reductions in knee moment
may demonstrate a gender effect, with reductions seemingly greater for female
participants when compared to males.

[237]
With regard to the results achieved in the previous chapter, it is suggested that mature
females may benefit from a range of control interventions in their running shoes.
Although little research has investigated a multipurpose modification to running shoes, to
my knowledge one study has investigated the effect of combining both lateral wedge and
medial arch support on the gait of healthy volunteers. Nakajima and colleagues (2009)
investigated the effect of a lateral wedge combined with arch support, on the gait of 11
males and 9 females (mean age 28 years) walking at a self selected speed. Results showed
that the lateral wedge alone significantly decreased the knee external adductor moment by
8.8%, and the inclusion of the arch support decreased the knee moment by 7.5%
compared to the neutral condition. Therefore, although the arch support produced a slight
reduction in the percentage decrease, the knee external adductor moment was still
significantly lower than in the control condition (Nakajima et al., 2009).
Similarly, Schmalz et al (2006) investigated the effect of footwear modifications on the
walking gait of 6 males and 4 females, aged 34 years (±9). As well as investigating the
effect of a lateral wedge, this discussed research included the addition of a semi-rigid
ankle support to restrict movement in the frontal plane. Results indicated that when
wearing a lateral wedge combined with the ankle support, the knee external adductor
moment was reduced by 9.26%. However, although indicating a significant effect, the
frontal plane support used by Schmalz and colleagues was obtrusive, and not applicable
for the recreational use of healthy individuals.
The salfordinsole orthotic, designed by Dr Richard Jones, comprises lateral wedge
technology with arch support incorporated. Research incorporates in the design process
showed this orthotic to significantly reduce the knee external adductor moment among
patients with mild and severe medial compartment knee osteoarthritis. Furthermore, it
was also shown that the inclusion of the medial support significantly preserved the height
of the medial longitudinal arch, thereby eliminating the consequential increase in subtalar
joint pronation possible with an increase in lateral support. As such, this readily available
orthotic is deemed appropriate for the mature female runners to reduce the currently high
levels of rearfoot eversion, knee internal rotation angle and knee external adductor
moment during running.

[238]
5.1.5. Aims and hypotheses.
In light of the combination of discussed literature and the results from the previous study,
it is suggested that a range of orthotics are investigated, and the effect on the running
biomechanics of mature females is analysed. The aim of this investigation was to assess
the effect of both a medial and lateral wedge, and a combined orthotic with both medial
and lateral support, on the running gait of mature females. Three hypotheses were
developed.
1. During running, the medial wedge will produce a significant decrease in the
rearfoot eversion and knee internal rotation angle among mature female runners,
with no adverse effect on the knee external adductor moment.
2. During running, the lateral wedge will produce a significant decrease in the peak
knee abduction angle and peak knee external adductor moment among mature
female runners, with an accompanied increase in rearfoot eversion and knee
internal rotation angles.
3. The orthotic device will reduce rearfoot eversion and knee internal rotation angles,
and produce significant reductions in the knee external adductor moment among
mature female runners.
[239]
5.2. Methods.
5.2.1. Pilot study.
A pilot study was conducted in order to finalise the test conditions appropriate for this
study. Six wedges were tested, alongside one orthotic intervention. The wedges tested
comprised a selection of 2 degree, 4 degree and 6 degree lateral and medial wedges
spanning the length of the shoe, made from flexible plastic. These wedges were added to
the shoe under the manufacturer footbed, to control for excessive movement of the rear
and forefoot in the frontal plane of motion. The orthotic intervention comprised both
medial rearfoot and arch support and lateral rear and mid foot support. This was tested to
ensure no discomfort was experienced when running.
The wedges and orthotic intervention device were tested on a mature female (age 50
years), who volunteered for participation. This participant performed 10 running trials in
each randomly selected condition, and provided verbal feedback on each condition. Three
dimensional biomechanical data was captured using the Peak Vicon Motion Capture
System, and the main variables of rearfoot eversion and knee internal rotation were
assessed. Knee external adductor moment was calculated using inverse dynamics through
MATLAB.
Results indicated no significant effect for both the 2 degree and 4 degree medial and
laterally wedges (p>0.05). However a significant effect was seen in all three variables in
both the 6 degree lateral and medial wedges, and the orthotic intervention (p<0.05).
Additionally, no discomfort was experienced in either the 6 degree medial or lateral
wedge, or with the orthotic intervention. As such, the test conditions deemed appropriate
were the 6 degree medial and lateral wedges and the orthotic intervention.
[240]
5.2.2. Participant selection and KOOS.
Based on the decrease of 6.09 degrees in rearfoot eversion with a motion control shoe
seen in Study 2, a sample size of 20 mature females would produce a power of 87%.
Twenty able-bodied mature females were therefore recruited on a volunteer basis from a
local women’s running club (Women’s Running Network). Of this group, ten had been
included in the previous study. Females were recruited from the age bracket of 40-60
years, and selected volunteers ranged in age from 42 years to 59 years (Mean, 50.7, sd,
4.5). All volunteers described running as recreational, each with a minimum of 5 years
running experience. Each female participated in at least three one hour sessions of
running per week, which was standardised as all females ran on training evenings.
Females had no history of orthopaedic or neurological ailments that could affect running
gait, and were free from symptoms of a musculoskeletal injury at the time of testing. Each
female’s average 10 km run time was used as an indicator of running standard. All
participants were within a 5% time range (60.9 ± 2.96 minutes).
As a prerequisite, prior to the start of gait analysis, each female completed a Physical
Activity Readiness Questionnaire; PAR-Q form to assess participant statistics (age,
height, weight) and to ensure all females were free from any major visual or balance
pathology, or debilitating condition that could hinder performance (PAR-Q, Canadian
Society for Exercise Physiology, 2002). Participants also completed a KOOS (knee
osteoarthritis observation survey) to assess the presence or potential of osteoarthritis and
injuries present at the knee joint (Roos et al., 2003). KOOS results were correlated with
collected movement data to investigate potential links between knee osteoarthritis and
lower limb biomechanics during running. A summary of demographic data and KOOS
scores for both groups is illustrated in Table 5.1. The experimental procedures were
approved by the University of Exeter research ethics committee.

[241]
5.2.3. Test conditions.
Within this study, the effect of four different shoe conditions was assessed. The shoes
incorporated were Somnio Women’s Pacemaker 2.0 (Somnio Inc., 2010), a neutral
women’s running trainer. These specific shoes were selected for this study due to the
customisable feature; F.E.A.T (Functionally Engineered Adaptable Tricomponent
System). This provided interchangeable foot-beds for the shoe based on individual arch
height, and adjustable medial/lateral wedge inserts to accommodate for differences in
biomechanics. Each part is presented in Figure 5.2.
Figure 5.2. Illustration of the trainers, foot beds and wedged inserts added to the shoes.
Source: Somnio FEAT system, Inc, 2010.
Foot beds determined from
the Somnio line up device
and arch height.
Wedged
foot inserts
6mm wedge focussed
along medial heel.

[242]
Within this study, the foot-bed added to each female’s shoe was determined using the
Somnio Line-Up Device (Somnio, Inc. 2010) (Figure 5.4). The procedure for the line-up
device arch height assessment is detailed in the diagram below (Figure 5.3). This
assessment enabled the specific foot bed to be selected for each participant, adjusting for
“normal, low and high” arch types (Somnio Inc, 2010).
Figure 5.3. Somnio Line-Up Device Procedure, as adhered to in this study. (Information
from Somnio Inc, 2010).

[243]
Figure 5.4. Annotated Image of the Somnio Line Up Measuring device and different
footbeds.
The results from the arch height assessment and laser line-up test are presented in section
5.3.1.2. Arch height determined which foot-bed was required. Each individual’s selected
foot bed was then inserted into the shoe, and this was labelled the neutral (control)
condition for each female. As each individual was assessed with the same medial and
lateral inserts, the results from the line-up test were noted, and later correlated with the
kinematic data collected for each individual.
The medial and lateral inserts were wedged with a 6 mm incline on the either the medial
or lateral sides respectively, focussed in the heel. These were placed in the running shoes
under the footbed, and were tested as separate conditions. The final condition was an
orthotic device based on the results from the previous study, and included a lateral wedge
as well as rearfoot control. These orthotic devices were made from a thermoplastic
elastomer, with silver-based anti-microbial agents embedded in the sole (Salfordinsoles,
Incorporating Lateral Wedge Technology, Inc, 2008) (Figure 5.5). The orthotic devices
were added to the shoe in place of the foot bed as an additional test condition.
Heel cup
Arch height
adjustment levels.
Lazer
Arch height
measurement device.

[244]
Figure 5.5. Image of the orthotic intervention, incorporating arch support and lateral
wedge technology. Source: Salfordinsole™
5.2.4. Experimental procedure for assessment of running gait.
Three dimensional analysis of human gait occurred using an 8 camera motion capture
system (Vicon Peak, 120 Hz, automatic, optoelectronic system; Peak Performance
Technologies, Inc., Englewood, CO.) synchronised with a single floor mounted force
platform (960 Hz, AMTI, Advanced Mechanical Technology, Inc., Massachusetts). Data
were synchronised within the Vicon software using initial foot strike as an automatic
event detection (vertical force > 10N). The 8 cameras were positioned in an oval shape
surrounding the force platform, located in the middle of a 10 meter runway. The capture
volume (1.0 m in length, 0.5 m in width, and 0.75 m in height) encompassed the right
lower limb motions of each female during the running trials.
Medial heel and
arch support
Lateral wedge along
lateral border

[245]
5.2.4.1. Marker placement and static trial.
The model of the right lower limb, on which the methodology is based, is that of a series
of rigid linked bodies. These move in space with six degrees of freedom, describing the
three lineal translations, and three angular rotational movements of each segment
(Giannini et al., 1994). In order to obtain the description of this movement, each segment
is associated with a rigid configuration of spherical markers, fixed in known locations. In
this study, eleven reflective markers were attached to the right lower limb of each female,
using a modified version of the model presented by Soutas-Little (Soutas-Little et al.,
1983). This was the same model used in the previous chapters; therefore location of
marker placement is described in detail in Chapter 3. Due to the possible presence of high
frequency noise in the digitised position of each marker, data were filtered using a
Quintic Spline incorporated within the motion analysis system (Peak Performance Default
Optimal Smoothing).
Each female performed one, two second static trial with markers attached, and both feet
placed on the force platform. This procedure was standardised; participants were
requested to look straight ahead with eyes focussed on the wall at eye level to reduce any
unnatural shift in body weight. The static trial was consistently performed in the control
(neutral) shoe condition. Data collected during the two second interval provided standing
joint angles for adjustment of anatomical angles during running (Hunt et al., 2006).
5.2.4.2. Gait analysis.
The gait experiments were performed with each female running along a 10 meter runway,
through the capture volume, and striking the force platform with the right foot. Running
velocity was monitored at 3.5 m.s-1
± 5% (a speed determined in Pilot Study of Study
One) using two, one meter high infrared timing gates located along the 10-m concrete
runway, 2.5 meters either side of the centre of the force plate. Participants were permitted
practice trials to ensure the step landed in the middle of the force platform, and the gait
was not altered in order to land on target. Trials that did not land on the force platform, or

[246]
that were not within the required range of velocity were discarded. A successful trial was
one which had the right foot land on the centre of the platform, with all eleven markers
visible throughout the stance phase of running gait. Ten successful trials were then
performed in each condition. Test conditions were selected randomly with the order
undisclosed to the participant.
5.2.5. Three-Dimensional data analysis.
Kinematic data were calculated during the stance phase of running gait, and peak values
were obtained for lower limb movement in the sagittal, transverse and frontal plane of
motion. Each variable of interest was isolated from the data, and ten trial means for each
participant in each condition were used to obtain group means. Force and moment data
were presented relative to body weight. When calculating the external joint moments,
each limb segment (thigh, shank, foot) was idealised as a rigid body and the positions of
the joint centres were located relative to the position of the skin markers. Knee and ankle
joint centres were therefore located based on the markers positioned at the lateral joint
line of the knee, and the lateral malleolus respectively. The knee external adductor
moment was then calculated using a customised MATLAB code. Inverse dynamics
techniques were used, with data from marker position, force plate and inertia parameters
provided by Dempster (Dempster et al., 1955). Peak moment was calculated as the
maximum during the stance phase of gait, and average peak moment values over 10 trials
were presented for each participant and shoe condition.
Moment arm length of the ground reaction force about the knee joint centre was
calculated for each trial performed by every participant in all four footwear conditions.
The length was calculated with the same method as is discussed in the previous chapter
(Equation 4.5). Peak moment arm was calculated as that which occurred at the time of
peak moment during stance, and the occurrence time was noted. A repeated measures
ANOVA was used to assess the difference in moment arm length among the mature
females between the neutral, medial, lateral and orthotic footwear conditions. A

[247]
regression test was then performed to assess the relationship between maximum moment
arm length and peak knee external adductor moment.
Effect size for change in biomechanical variable for each shoe condition was calculated.
The size of the effect was determined from the values presented by Cohen (1988),
whereby an effect size of 0.01 was small; 0.059 was medium; and 0.138 was large.
Significance between footwear conditions was determined with a repeated measures
ANOVA conducted with participant means. Data was significant at the p < 0.05 level.
Where results were significant, a post hoc Tukey Honeslty Significant Differences (HSD)
test was performed to identify where specific statistical differences existed between
footwear conditions (Equation 5.1).
HSD = q(k,dfE) sqrt MSE/n
equation 5.1
Where HSD is the honestly significant difference, q is the studentised range distribution
for k (the number of groups) and dfE (degrees of freedom related to the error term). MSE
is the mean square error from the ANOVA, and n is the sample size.

[248]
5.3. Results.
5.3.1. KOOS Scores and Somnio Line-Up assessment outcomes.
5.3.1.1. KOOS Results.
The knee osteoarthritis survey (Appendix B) was completed by each mature female prior
to the initiation of the gait assessment. This survey assessed each individual’s opinion
about the condition of their own knee, and associated conditions. Group results are
presented in Table 5.1. Average results were initially isolated for each subscale, and an
outcome profile was plotted (Figure 5.6). Results indicated all females as free from
symptoms of knee osteoarthritis and injuries (mean 89.2, sd 2.6). However, a slight
discrepancy was illustrated between the subscales, with both quality of life and sports and
recreation subscales displaying lower scores than the other three categories.
Table 5.1. Participant information table including 10 km run times and KOOS scores.
MATURE FEMALE RUNNERS
AGE (YEARS) 50.55 (4.5)
MASS (KG) 58.33 (5.6)
10-KM TIME (MINS) 60.9 ± 2.96
KOOS SCORE 89.2
PAIN 89.7 (2.6)
SYMPTOMS 89.1 (3.4)
ACTIVITIES OF DAILY LIVING 93.2 (1.9)
SPORT AND RECREATION 87.4 (2.4)
QUALITY OF LIFE 86.6 (2.9)
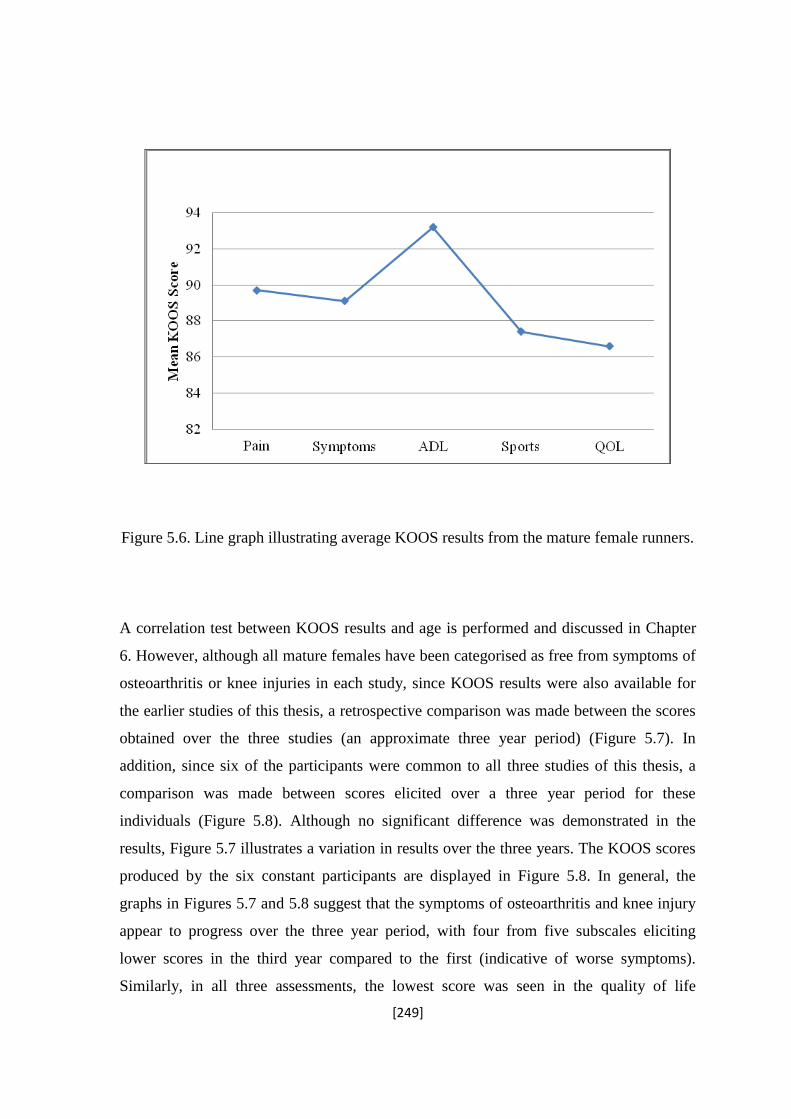
[249]
Figure 5.6. Line graph illustrating average KOOS results from the mature female runners.
A correlation test between KOOS results and age is performed and discussed in Chapter
6. However, although all mature females have been categorised as free from symptoms of
osteoarthritis or knee injuries in each study, since KOOS results were also available for
the earlier studies of this thesis, a retrospective comparison was made between the scores
obtained over the three studies (an approximate three year period) (Figure 5.7). In
addition, since six of the participants were common to all three studies of this thesis, a
comparison was made between scores elicited over a three year period for these
individuals (Figure 5.8). Although no significant difference was demonstrated in the
results, Figure 5.7 illustrates a variation in results over the three years. The KOOS scores
produced by the six constant participants are displayed in Figure 5.8. In general, the
graphs in Figures 5.7 and 5.8 suggest that the symptoms of osteoarthritis and knee injury
appear to progress over the three year period, with four from five subscales eliciting
lower scores in the third year compared to the first (indicative of worse symptoms).
Similarly, in all three assessments, the lowest score was seen in the quality of life

[250]
subscale. However, results from an ANOVA test showed no difference in score was
significant (p = 0.24).
Figure 5.7. Line graph illustrating KOOS scores from mature female runners over three
years.
Figure 5.8. Line graph illustrating KOOS scores for the consistent 6 mature female
runners over three years.

[251]
5.3.1.2. Somnio Line Up Device results.
Results from the Somnio line up device and archometer assessment showed all females to
have moderate arch heights. The outcome suggested all females were mild pronators. The
orange (medium) foot bed was added to the shoe to act as the neutral condition in the
assessment.
5.3.2. Kinematic results during stance phase of running gait.
A numerical comparison of gait variables with changes in footwear condition is presented
in Table 5.2. Data include mean peak values of the gait variable, alongside occurrence
times, and peak angular velocity, presented in radians per second. Results from the
repeated measures ANOVA are presented with each variable, and significant differences
between footwear conditions are categorised at the p<0.05 alpha level. A table including
individual subject means for each peak variable is presented in Appendix F.

[252]
Table 5.2. Summary of kinematic values produced by 20 mature female runners.
*Differences were statistically significant compared to neutral condition at p<0.05 level.
GAIT VARIABLE (PEAK VALUE)
SHOE CONDITION
SIGNIFICANCE
LEVEL
NEUTRAL
MEDIAL
LATERAL
ORTHOTIC
ANKLE/
SUBTALAR
JOINT
Rearfoot
Eversion
Peak Angle
(degrees)
14.03
(±3.7)
13.65
(±4.9)
15.69
(±4.68)
8.47*
(±4.2)
P = 0.00003*
Occurrence
time (seconds)
0.096
(±0.005)
0.098
(±0.001)
0.10
(±0.06)
0.098
(±0.005)
P = 0.49
Eversion
velocity (rad.s-1)
4.03
(±0.94)
4.15
(±0.91)
4.20
(±0.73)
3.79
(±0.39)
P = 0.32
Foot
Abduction
Peak Angle
(degrees)
11.7
(±5.18 )
11.95
(±9.02)
11.83
(±7.97)
11.2
(±7.69)
P = 0.99
Occurrence
time (seconds)
0.16
(±0.04)
0.15
(±0.03)
0.16
(±0.05)
0.15
(0.01)
P = 0.18
Abduction
velocity (rad.s-1)
2.24
(±1.0)
1.86
(±0.6)
1.86
(±0.6)
2.10
(±1.1)
P = 0.44
Dorsiflexion
Peak Angle
(degrees)
19.9
(±3.64)
18.2
(±3.54)
18.8
(±3.88)
17.7
(±1.83)
P = 0.24
Occurrence
time (seconds)
0.13
(±0.02)
0.13
(±0.03)
0.13
(±0.04)
0.13
(±0.03)
P = 0.95
Dorsiflexion
velocity (rad.s-1)
10.16
(±0.4)
10.52
(±0.5)
10.34
(±0.6)
10.5
(±0.5)
P = 0.37
KNEE
JOINT
Knee Flexion Peak Angle
(degrees)
35.25
(±5.58)
33.54
(±5.14)
32.58
(±5.66)
34.38
(±6.77)
P = 0.51
Occurrence
time (seconds)
0.17
(±0.05)
0.18
(±0.02)
0.18
(0.03)
0.18
(0.02)
P = 0.15
Flexion
velocity (rad.s-1)
15.00
(±0.5)
14.6
(±0.4)
14.9
(±0.3)
14.7
(0.4)
P = 0.10
Knee
Abduction
Peak Angle
(degrees)
13.13
(±7.37)
12.31
(±4.91)
9.69
(±5.65)
9.74
(±5.72)
P = 0.17
Occurrence
time (seconds)
0.21
(0.0002)
0.23
(±0.0004)
0.22
(±0.0003)
0.23
(±0.0009)
P = 0.02*
Abduction
velocity (rad.s-1)
1.77
(±0.2)
1.72
(±0.2)
1.82
(±0.2)
1.69
(±1.2)
P = 0.77
Knee Internal
Rotation
Peak Angle
(degrees)
-14.4
(±2.47)
-12.99
(±2.84 )
-14.13
(±3.06)
-9.81*
(±2.68)
P = 0.00021*
Occurrence
time (seconds)
0.12
(±0.02)
0.17
(±0.02)
0.12
(±0.09)
0.17
(±0.001)
P = 0.99
Rotation
velocity (rad.s-1)
2.65
(±0.2)
2.40
(0.2)
2.50
(0.1)
2.22*
(±0.2)
P = 0.011*

[253]
Table 5.3 indicate results from a regression analysis performed between each variable and
age. Specific kinematic data are discussed in detail in the following tables, and where
appropriate, data are presented in graphical form to illustrate trends and magnitudes of
differences in study variables with shoe conditions.
Table 5.3. Statistical output illustrating results from regression analyses between each
variable and age.
STATISTICAL
ANALYSIS
OUTPUT
ANKLE/SUBTALAR JOINT
KNEE JOINT
AGE:RF EV
AGE:DF
AGE:FABD
AGE:KFLEX
AGE:KABD
AGE:KINT
Correlation
Coefficient
0.62
0.096
0.50
0.06
0.30
0.23
R Square
0.39
0.0094
0.25
0.004
0.088
0.05
Observations
20
20
20
20
20
20
P-Value (2 sf)
0.0033*
0.68
0.025*
0.79
0.20
0.32
*Regression was statistically significant at p<0.05 level.

[254]
5.3.2.1. Ankle/Subtalar joint.
5.3.2.1.1. Rearfoot eversion.
Comparisons of the mean peak rearfoot eversion angles produced by each mature female
indicated a significant difference between conditions (p<0.05). Results from the post-hoc
analysis (Tukey’s Honestly Significant Difference test) indicated that the significance lay
between the orthotic intervention and the other three footwear conditions. The orthotic
condition produced an average decrease of 5.56 degrees in peak rearfoot eversion when
compared to the neutral condition. This difference is highlighted in Figure 5.9, which
graphically illustrates the differences between conditions. Here is it shown that the
orthotic condition produced the lowest rearfoot eversion value. The lateral footwear
condition increased rearfoot eversion by 1.66 degrees above that produced in the neutral
condition, although this increase was not significant (p>0.05, effect size 0.046). A sample
graph illustrating rearfoot eversion angle throughout the stance phase of gait, and the
discrepancy between the neutral and orthotic condition is illustrated in Figure 5.10. This
graph displays mean data from Subject 10. There was no significant difference in the
occurrence times between conditions (p>0.05), and results from a repeated measures
ANOVA with the mean rearfoot angular velocity produced by each participant illustrated
no significant differences between conditions. The relationship between rearfoot eversion
and age within the group of mature females is illustrated in Figure 5.11. Results from the
regression analysis indicate a significant positive linear relationship (r = 0.62, p<0.05),
suggesting an increase in rearfoot eversion occurred across an age gap of 17 years (Table
5.3).
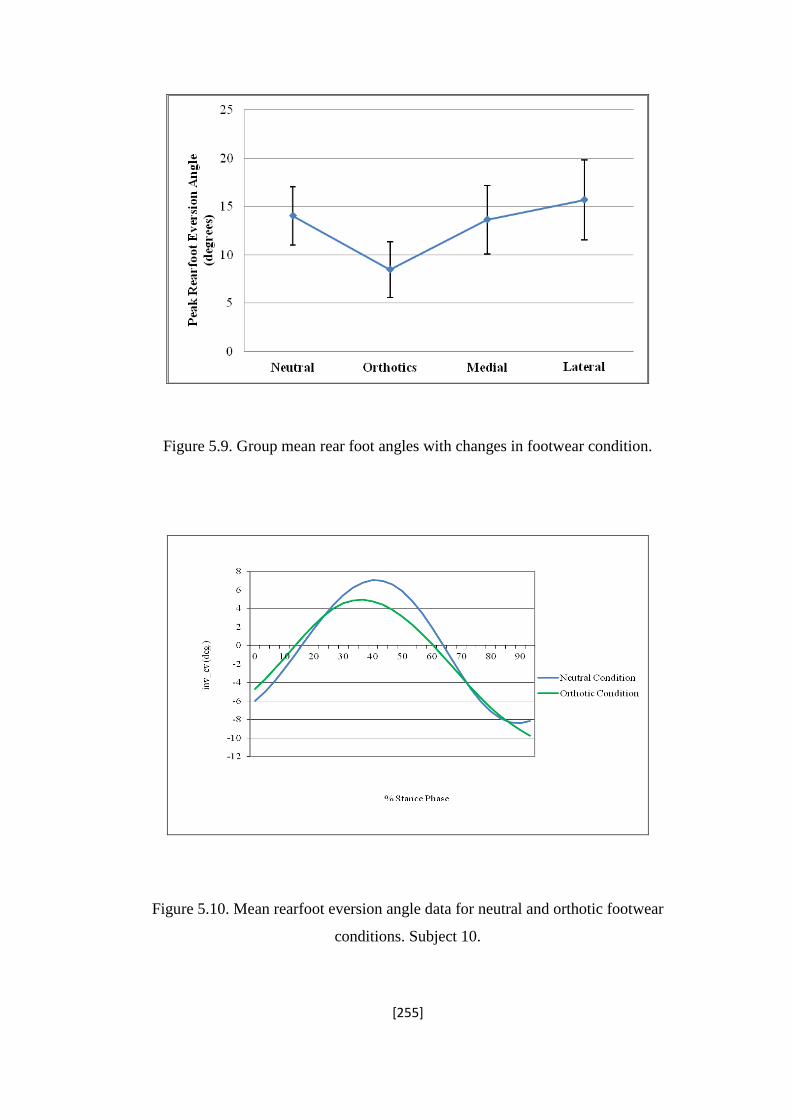
[255]
Figure 5.9. Group mean rear foot angles with changes in footwear condition.
Figure 5.10. Mean rearfoot eversion angle data for neutral and orthotic footwear
conditions. Subject 10.

[256]
Figure 5.11. Scatter diagram illustrating linear relationship between peak rearfoot
eversion angles and age among mature female runners.
5.3.2.1.2. Foot abduction.
Figure 5.12. Annotated diagram of the foot abduction angle calculated. Source (foot):
Microsoft Office Clip Art 2011.
Angle created between the line of
foot and the y-axis.
y-axis of the foot
Centre line of the
foot
R = 0.62, p = 0.0033

[257]
Mean foot abduction data produced by the mature females is presented in Table 5.2.
Among the mature female runners, results from this variable were consistent between
conditions, with no significant differences identified between footwear (p>0.05). Despite
this, it was seen that the medial wedge produced the highest value (11.95o), compared to
the orthotic condition which produced the lowest (11.2o) although the values varied by
less than one degree (Table 5.2). The standard deviation of the means produced by the
neutral condition was noted to be smaller than those produced from the three footwear
interventions.
Mean occurrence of peak foot abduction was not significantly different between footwear
conditions (p>0.05). Similarly, peak angular velocity produced non significant
differences, although the highest foot abduction velocity was illustrated in the neutral
condition when compared to the three footwear interventions (p>0.05). Results from the
regression analysis indicated a significant positive correlation between foot abduction and
age (r = 0.50, p<0.05), suggesting that the mature females at the higher end of the age
scale ran with increased abduction of the forefoot during stance. This relationship is
highlighted graphically in Figure 5.13.
Figure 5.13. Scatter diagram illustrating positive relationship between foot abduction and
age.

[258]
5.3.2.1.3. Ankle dorsiflexion.
Peak ankle dorsiflexion occurred during the later stage of mid-stance phase, at
approximately 50 % of stance (Figure 5.14). Within the neutral condition, mature females
produced an average dorsiflexion angle of 19.9o (±3.64
o); the highest peak angle
compared to the three footwear interventions. The lowest peak angle was shown in the
orthotic condition (17.7o). However, no significant differences were observed between the
four footwear conditions (p>0.05, effect size 0.084) (Table 5.2). Peak dorsiflexion angle
was consistently shown to act at 0.13 seconds, with no significant difference seen
between footwear conditions (p>0.05). Peak dorsiflexion velocity was lowest in the
neutral condition compared with the orthotic, medial and lateral wedge, although again
this difference was not significant (p>0.05). Among the 20 mature females, peak
dorsiflexion angle did not differ significantly with age (r = 0.22, p>0.05).
Figure 5.14. Mean peak dorsiflexion angle time history produced by subject 7 in all four
conditions.
Peak ankle
dorsiflexion angle

[259]
5.3.2.2. Knee joint.
5.3.2.2.1. Knee flexion.
The peak knee flexion angles, occurrence times, and peak angular velocities produced by
the mature females were not significantly different between footwear conditions (p>0.05)
(Table 5.2). Similarly, there was no significant correlation between knee flexion angle
and age (r = 0.06, p>0.05). The largest variation in peak angle (2.67o) for this variable
was demonstrated between the neutral shoe, and the lateral wedge condition (Figure
5.15). A sample knee flexion time history is shown in Figure 5.16, illustrating mean data
produced by Subject 12. The graph shows the knee moving from a low degree
(approximately 5o) of flexion at heel strike, to maximum flexion at mid stance, where
flexion is calculated as a negative value.
Figure 5.15. Line graph illustrating mean peak knee flexion angle produced by the mature
female runners in all four conditions.

[260]
Figure 5.16. Knee flexion graph illustrating mean data for Subject 12.
5.3.2.2.2. Knee abduction (varus).
Figure 5.17. Diagram illustrating the knee abduction angle calculated.
Knee abduction
angle (o)
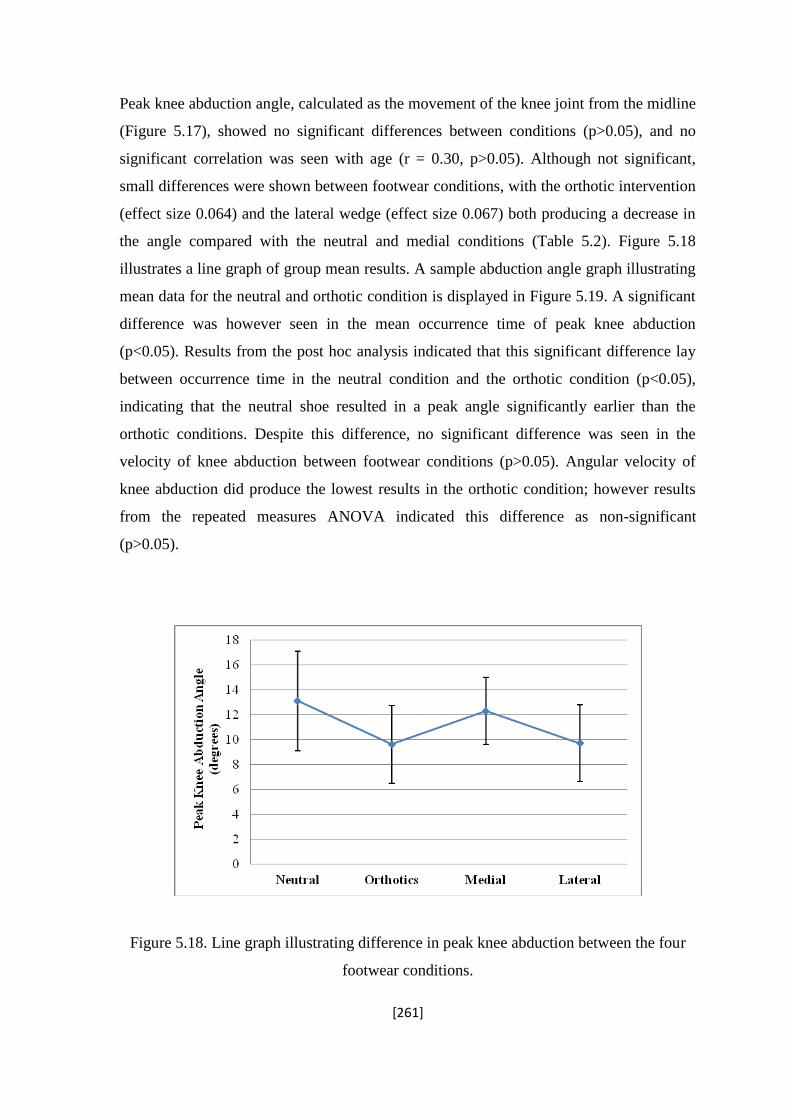
[261]
Peak knee abduction angle, calculated as the movement of the knee joint from the midline
(Figure 5.17), showed no significant differences between conditions (p>0.05), and no
significant correlation was seen with age (r = 0.30, p>0.05). Although not significant,
small differences were shown between footwear conditions, with the orthotic intervention
(effect size 0.064) and the lateral wedge (effect size 0.067) both producing a decrease in
the angle compared with the neutral and medial conditions (Table 5.2). Figure 5.18
illustrates a line graph of group mean results. A sample abduction angle graph illustrating
mean data for the neutral and orthotic condition is displayed in Figure 5.19. A significant
difference was however seen in the mean occurrence time of peak knee abduction
(p<0.05). Results from the post hoc analysis indicated that this significant difference lay
between occurrence time in the neutral condition and the orthotic condition (p<0.05),
indicating that the neutral shoe resulted in a peak angle significantly earlier than the
orthotic conditions. Despite this difference, no significant difference was seen in the
velocity of knee abduction between footwear conditions (p>0.05). Angular velocity of
knee abduction did produce the lowest results in the orthotic condition; however results
from the repeated measures ANOVA indicated this difference as non-significant
(p>0.05).
Figure 5.18. Line graph illustrating difference in peak knee abduction between the four
footwear conditions.

[262]
Figure 5.19. Knee abduction angle line graph produced by Subject 20 in the neutral and
orthotic conditions.
5.3.2.2.3. Knee internal rotation.
Results produced from the mature females indicated an average internal rotation value of
12.6o across all four conditions. Results from a repeated measures ANOVA indicated a
significant difference in knee internal rotation values for the four footwear conditions,
with the orthotic conditions producing the lowest value of rotation (p<0.05) (Figure 5.20).
The post hoc analysis indicated that the orthotic condition produced significantly lower
values of rotation when compared with both the neutral and the lateral footwear
conditions (p = 0.0000017; p = 0.000022). Figure 5.21 visually displays this difference,

[263]
with mean data from Subject 5 clearly showing reduced knee internal rotation values with
the orthotic intervention.
The mean occurrence time of peak knee internal rotation was not significantly different
between footwear conditions. However, velocity of internal rotation elicited a significant
difference between conditions (p<0.05). Post hoc analysis showed the significant
difference to lie between the neutral and orthotic condition, with the neutral shoe
producing an angular velocity 0.43 rad.s-1
faster than the orthotic intervention. Results
from a regression analysis indicated no significant correlation between knee internal
rotation and age (r = 0.23, p = 0.3) (Table 5.3).
Figure 5.20. Line graph illustrating a significant difference between peak knee internal
rotation between the four footwear conditions.
p < 0.05 p < 0.05

[264]
Figure 5.21. Knee internal rotation graph representing mean data for the four footwear
conditions (Subject 5).

[265]
5.3.3. Knee Moments: the external knee adductor moment and moment arm.
The knee external adductor moment was calculated throughout the stance phase of
running gait, for each trial performed by every mature female. A sample external
adductor time history is displayed in Figure 5.22, highlighting the second, larger peak as
the peak used for the averages. Moment arm length was calculated at the time of peak
moment. A summary of individual means for both variables in each footwear condition,
and average occurrence time are presented in the Appendix (Appendix F). Moment data
are presented in both raw form (Nm) and scaled to body mass (Nm.kg). Group means for
both peak moment and moment arm, and average occurrence times are presented in Table
5.4.
Figure 5.22. Sample knee external adductor moment graph, illustrating the peak external
adductor moment. Data taken from Subject 15.

[266]
Table 5.4. Summary of group means and occurrence time for peak knee external adductor
moment (Nm/kg) and moment arm length (m).
KNEE EXTERNAL
ADDUCTOR MOMENT
FOOTWEAR CONDITION
SIGNIFICANCE
LEVEL (P <
0.05)
NEUTRAL
ORTHOTICS
MEDIAL
LATERAL
Peak
Moment
(Nm/kg)
Peak Angle
(degrees)
1.15
(±0.12)
0.92
(±0.19)
1.05
(±0.17)
1.02
(±0.015)
P = 0.000538*
Peak
Moment
arm (cm
Peak Length
(metres)
-0.020
(±0.001)
-0.019
(±0.001)
0.020
(±0.003)
0.018
(±0.003)
P = 0.07*
Occurrence time
(seconds)
0.20
(±0.016)
0.20
(±0.013)
0.20
(±0.0016)
0.19
(±0.017)
P = 0.13
A breakdown of statistical results are presented in Tables 5.5 a and b. Results from a
repeated measures ANOVA of peak moment illustrated a significant difference in the
peak knee external adductor moment with the different footwear conditions. Post hoc
analysis showed this difference to lie between the neutral and orthotic condition (p <
0.05), the neutral and the lateral condition (p < 0.05), and the medial and the orthotic
condition (p < 0.05) (Table 5.5a).
Similarly, statistical results from the moment arm data showed a significant difference in
this variable between footwear conditions. As shown in Table 5.5b, this difference lay
between the neutral and the orthotic condition (p < 0.05), and the neutral and the lateral
condition (p < 0.05)

[267]
Table 5.5 a and b. Statistical analysis of difference in knee external adductor moment (a)
and moment arm length (b) between footwear conditions.
(a)
Footwear
Condition
Neutral Orthotic Medial Lateral
Neutral —
Orthotic 0.00076* —
Medial 0.061 0.024* —
Lateral 0.0094* 0.065 0.57 —
(b)
Footwear
Condition
Neutral Orthotic Medial Lateral
Neutral —
Orthotic 0.0015* —
Medial 0.51 0.16 —
Lateral 0.025* 0.94 0.22 —
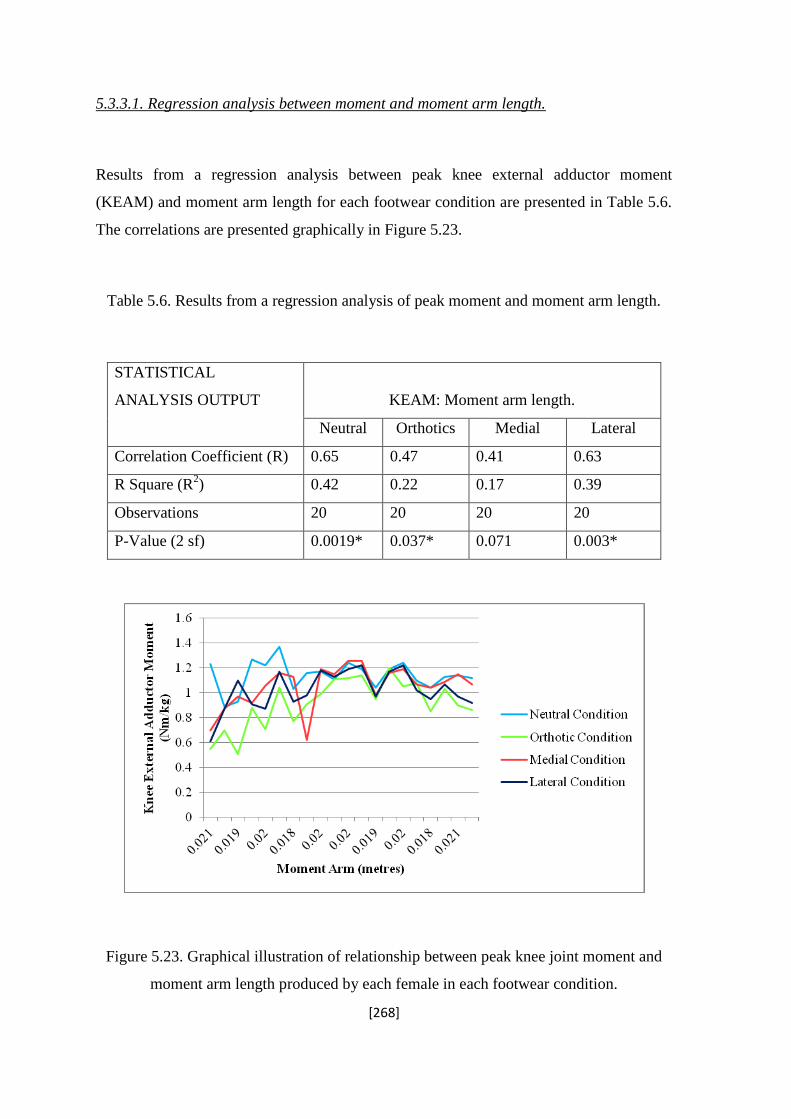
[268]
5.3.3.1. Regression analysis between moment and moment arm length.
Results from a regression analysis between peak knee external adductor moment
(KEAM) and moment arm length for each footwear condition are presented in Table 5.6.
The correlations are presented graphically in Figure 5.23.
Table 5.6. Results from a regression analysis of peak moment and moment arm length.
STATISTICAL
ANALYSIS OUTPUT
KEAM: Moment arm length.
Neutral Orthotics Medial Lateral
Correlation Coefficient (R) 0.65 0.47 0.41 0.63
R Square (R2) 0.42 0.22 0.17 0.39
Observations 20 20 20 20
P-Value (2 sf) 0.0019* 0.037* 0.071 0.003*
Figure 5.23. Graphical illustration of relationship between peak knee joint moment and
moment arm length produced by each female in each footwear condition.
[269]
5.4. Discussion.
The purpose of this biomechanical study was to assess the effect of different footwear
interventions on the running gait of mature females. Twenty females with a mean age of
50.6 ± 5.6 years were recruited for participation on a volunteer basis. Each female ran
along a marked pathway, while the motion was analysed with an eight camera motion
capture system, synchronised with a force platform embedded in the ground. The four
footwear conditions included a neutral shoe, a medial wedge, a lateral wedge, and an
orthotic intervention. The Somnio 6 mm medial and lateral wedges were composed from
rubber-plastic, and inserted into the shoe under the medium foot bed. The 6 mm wedges
began at the heel, and continued to the start of the medial arch (medial wedge) and the
lateral mid foot (lateral wedge), reducing to the standard height at the forefoot. The
purpose of the medial wedge was to restrict subtalar joint pronation. Conversely, the
purpose of the lateral wedge was to reduce the lateral tilt of the foot and subsequent
abduction of the lower leg and knee joint. The orthotic intervention incorporated both
mechanisms, although rearfoot eversion control was achieved through increased medial
support at the heel and under the medial longitudinal arch, restricting rearfoot eversion
shortly after heel strike. The lateral wedge was focussed along the length of the lateral
sole and into the forefoot, aiming to restrict lateral movement of the foot and lower leg at
mid stance.
Although several variables of gait were not altered with the different footwear conditions,
significant group trends observed in specific aspects of human movement were identified.
The use of post hoc analyses identified where these differences lay, and the overall effect
of each footwear condition on the running gait of mature females was assessed.

[270]
5.4.1. Initial Assessments: KOOS and Somnio Line-Up Device.
5.4.1.1. KOOS outcome.
All female participants were within the 40 to 60 year age bracket, and as such were
proposed to be at high risk for osteoarthritis of the knee joint (Guccione, 1997).
Additionally, as each female was known to undertake a session of physical activity a
minimum of three times per week, the link between physical activity participation and
susceptibility to injury or knee OA could be considered to heightens the position of this
group to a high risk category (Imeokparia, Barrett, Arrieta, Leaverton, Wilson Hall and
Marlowe, 1994). Based on this, the results from the KOOS assessment were unexpected,
with all females categorised as free from symptoms and signs of osteoarthritis.
The results from the survey showed the lowest score, indicative of increased signs of
osteoarthritis, to be present in the quality of life subscale. Comparatively, the subscale
showing the least signs of osteoarthritis was the activities of daily living. These results
suggest that although categorised as mild, all the mature females within this investigation
suffer an element of discomfort that may have an impact on their lives.
It has been suggested that there is a poor association between symptomatic and
radiographic levels of osteoarthritis (Dawson, Fitzpatrick, Fletcher, & Wilson, 2004).
Thus, despite the high scores from the KOOS assessment, it is possible that the study
participants have a degree of radiographic osteoarthritis that does not yet elicit symptoms.
According to Dawson and colleagues, the extent of radiographic osteoarthritis at the knee
joint does not predict the likely progression to a symptomatic state (Dawson, Fitzpatrick,
Fletcher, & Wilson, 2004). However, the presence of osteoarthritis among this specific
group of mature females is currently unknown, and will be assessed in the magnetic
resonance imaging study, Chapter 6. Here a direct correlation with KOOS scores will
investigate this relationship further.
Figure 5.7 illustrates the average KOOS scores produced by a group of mature females
over the past three years. Although the group did not consistently contain the same
females, six participants were involved in all three studies. The results displayed in the

[271]
line graph suggest a general tendency for scores to drop over the three years, although this
difference was not significant.
For the six participants that were involved in all three studies, a second comparison of
scores across the years occurred (Figure 5.8). Here it was shown that an obvious increase
in signs and symptoms of osteoarthritis was observed over the three years, with a
difference in score of up to 7.27 seen in the sport and recreation subscale. This suggests
that as age of mature females increases, perception of the condition of the knee
deteriorates, having the greatest effect during times of physical activity. Although still
categorised as symptom free on the KOOS scale, these results support the suggestion that
knee condition deteriorates with age, and risk of osteoarthritis increases (Hurwitz et al.,
2000).
5.4.1.2. Arch height and pronation: Somnio Line up device.
The Somnio line up device is designed to enable a quick assessment of arch height and
pronation level based on position of the foot and movement of the knee joint centre
during knee flexion. This procedure was undertaken for each mature female prior to the
gait analysis assessment, and the foot bed was selected based on the results. All females
were categorised as having a moderate arch height with mild pronation, suiting them to
the medium foot bed. As it has been shown that pronation (rearfoot eversion) angles are
higher than average among the mature females (Study1 and Study2), the use of the
Somnio assessment as a guideline is supported. However, as all mature females were
consistently categorised as mild pronators, the variation in pronation values produced in
the biomechanical assessment suggests limitations of the device to specifically prescribe
footwear. Currently, no research exists to critique the use of this assessment in footwear
prescription. Based on results among the mature females in the current study, it is
suggested that although this method may provide an indication of alignment, the results
are extracted with a low degree of accuracy. To accurately assess rearfoot motion or
subtalar joint pronation, three dimensional motion analysis techniques remain superior.

[272]
5.4.2. Biomechanical movement patterns during running.
The four footwear conditions included a neutral foot bed, two 6 mm wedges in the medial
(medial wedge) and lateral (lateral wedge) directions, and an orthotic intervention
incorporating both medial and lateral support. All subjects performed ten running trials in
each condition, and results were collaborated.
5.4.2.1. Selection of medial and laterally inclined wedge height.
The 6o incline of both the medial and lateral wedges were selected based on the results of
a pilot study conducted prior to onset of data collection for the main investigation. Results
from this preliminary investigation with one mature female illustrated no significant
changes to gait with either a 2o or 4
o inclined wedge on the medial or lateral sides. The 6
o
medial wedge however showed a significant reduction in the rearfoot eversion and knee
internal rotation angles during the stance phase of gait. Similarly, the 6o lateral wedge
caused a significant reduction in the first peak knee external adductor moment calculated.
On observation, and when questioned, the participant involved in the pilot study
suggested that no discomfort was experienced with either the 6o medial or lateral wedge
when running. As such, this level of inclination was selected for investigation, to
significantly alter the rearfoot and knee biomechanics among mature females during
running.

[273]
5.4.2.2. Medial wedge.
5.4.2.2.1. Ankle/Subtalar joint kinematics.
The running trials performed in the medial wedge produced no significant changes in the
biomechanics of running gait among the group of mature females. At the foot-ankle
complex, subtalar joint pronation is produced from the combination of three movements;
foot abduction, ankle dorsiflexion, and rearfoot eversion, the latter being the most
dominant variable in subtalar joint pronation. Within this investigation, it was initially
hypothesised that when compared with those produced in the neutral condition, running
trials performed in the medial footwear condition would produce significantly lower
values of rearfoot eversion. Results from the motion analysis showed the medial wedge to
have a non significant effect on the peak rearfoot eversion angle (p>0.05). A low effect
size of 0.0023 was produced, suggesting that 0.2% of change in rearfoot eversion was
influenced by the medial wedge. Similarly, no significant difference was observed in
occurrence time of peak rearfoot eversion or the angular velocity with the medial wedge.
These results therefore suggest little effect of a 6 mm wedge on rearfoot motion.
Rearfoot motion indicates the amount of subtalar joint pronation that occurs during
walking and running gait (Kilmartin, & Wallace, 1994). During normal running gait, the
subtalar joint passes from a position of supination at heel strike to pronation at early
midstance. This joint movement is represented in the sample rearfoot angle graph
produced by Subject 10 (Figure 5.10). In the neutral condition, among the mature
females, the rearfoot moved from an average of 6 degrees of inversion (subtalar
supination) to an average of 14.03 degrees of rearfoot eversion. According to Kilmartin et
al., (1994), ideal values of rearfoot eversion peak at an average of 10 degrees, suggesting
the peak produced by the mature runners in this investigation were high. Excessive
magnitudes of rearfoot eversion and therefore subtalar joint pronation have been
associated with a range of running injuries and the development of degenerative
conditions at the knee joint (Taunton, McKenzie, & Clement, 1988).
Although research has commonly supported the use of shoe inserts to control for
excessive rearfoot motion, the lack of change in eversion angle among the mature females

[274]
is in line with the research by Stacoff and colleagues (Stacoff et al., 2001). In one
investigation, rearfoot control was intended to be affected by alterations on the lateral side
of the shoe, and rearfoot eversion control aimed through a reduction in height of the
lateral heel, causing the rearfoot to invert. However, results showed no effect on rearfoot
motion, and suggestions were made that the tibiocalcaneal kinematics of every individual
are unique, and will respond to footwear interventions differently (Stacoff et al., 2001). It
could therefore be suggested that the 6 mm wedge was not great enough to alter the
natural kinematics of the mature female runners.
An abundance of research has shown footwear interventions in the form of rearfoot
control to produce positive results. The early research performed by Clarke and
colleagues (1983), demonstrated a significant decrease in rearfoot angle with a medial
heel flare, although the incline was 15 degrees. Similarly, Russell and co-workers showed
a decrease in rearfoot eversion with a wedge of 8 degrees, although the significance of
this decrease was not tested (Russell, Gruber, O’Connor, Emmerick., & Hamill, 2009).
Although the results from this investigation of mature females appear contrary to results
in the literature, it is suggested that the height of the medial wedge is a limiting factor in
its ability to control excessive rearfoot motion. Additionally, the lack of effect on rearfoot
mechanics among the mature females may indicate that the type of material used in the
medial wedge or the degree of rearfoot posting was not sufficient to elicit a significant
change in rearfoot motion (Stackhouse et al., 2004).
5.4.2.2.2. Knee joint kinematics and moments.
At the knee joint, when compared to the neutral condition the medial wedge produced no
significant difference in joint kinematics or knee external adductor moment among the
mature female runners. It was hypothesised that the medial wedge would cause a
significant decrease in knee internal rotation, due to the proposed reduction in rearfoot
eversion and subsequent tibial internal rotation. The lack of significant difference is in
line with the results from Eslami and colleagues (2009) who investigated the effect of

[275]
wedged orthoses on the movement of the lower limb, and showed a non significant
change in tibial and subsequent knee internal rotation (p = 0.06).
Analysis of the combined kinematic and kinetic data enabled calculation of the frontal
plane knee moment for each female during each running trial. It was hypothesised that the
medial wedge would have little effect on this knee external adductor moment. Results
from the biomechanical assessment with the mature females supported this hypothesis,
with no significant difference in moment elicited with the medial wedge compared to the
neutral condition (p>0.05). When compared to the results presented in the literature, the
data produced by the mature females appears to support the uncertain relationship
between medial support and knee external adductor moment. One study performed by
Schmalz and colleagues showed an average increase in knee external adductor moment of
9.26% (0.59Nm/kg) with a medial wedge, although the incline was 14 degrees, and
therefore not directly comparable to the mature female’s data (Schmalz et al., 2006).
Conversely, consistent with the findings of the current study, Nester and co-workers
assessed the effect of a 10 degree medial wedge, and showed no change in the knee
external adductor moment compared to the neutral condition (Nester et al., 2003). Both
of these studies however assessed the knee external adductor moment during walking
trials. One study involved healthy subjects performing running trials, and showed an
average increase of 4.11 % in peak external adductor moment, however it is noted that the
medial wedge inserted into the shoe was 26 mm (Franz, Dicharry, Riley, Jackson, Wilder,
& Kerrigan, 2008). It is suggested that the relatively small 6 mm thickness of the medial
insert in the current study was not sufficient to influence the knee external adductor
moment.
5.4.2.3. Lateral wedge.
The lateral wedge incorporated an increase in wedge height on the lateral side of the shoe,
beginning at the heel and reducing at the midfoot. It was hypothesised that the running
trials performed in the lateral wedge would produce a significant reduction in knee

[276]
abduction angle and knee external adductor moment among the mature females, with a
consequential increase in the rearfoot eversion and knee internal rotation angles.
5.4.2.3.1. Ankle-Foot complex.
Results from running trials in the lateral wedge reject hypothesis two, as no significant
effect was shown in the peak rearfoot angle, occurrence time, or velocity during the
stance phase of running gait. However, the lateral condition produced a small change in
the average peak angle; increasing the peak by an average of 1.66 degrees (P>0.05, effect
size: 0.046). As effect sizes of 0.01 are categorised as small, it could be considered that,
although not significant, the influence of the lateral wedge on rearfoot eversion was
moderate (Cohen, 1988).
The lateral wedge technology placed in the shoe is designed to reduce excessive varus
motion at the knee joint, which can in turn rotate the foot segment into a more everted
position (Russell et al., 2011). The non significant effect of the lateral wedge on the
rearfoot kinematics of the mature females is similar to the results produced by Russell and
colleagues. Here it was shown that among the healthy participants, an 8 degree ethylene
vinyl acetate lateral wedge produced no significant change in peak rearfoot angle during
the stance phase of walking gait. Despite this, many studies have shown lateral wedges to
produce significant increases in rearfoot movement, highlighting the negative effect this
intervention may have on the lower limb kinematics and the clinical implication during
gait.
Butler and co-workers investigated the effect of laterally wedged foot devices on the gait
of osteoarthritis patients, and showed a significant increase in peak rearfoot eversion
angle during the stance phase of gait (Butler, Barrios, Royer, & Davis., 2009). However
the lateral wedge technology used among the patients involved full length orthotic
conditions, as opposed to the wedge worn by the mature females. Similarly, Souza and
colleagues demonstrated a 10 degree laterally wedged sandal to produce a significant
increase in rearfoot eversion among healthy individuals (Souza, Pinto, Trede, Kirkwood,
pretence, & Fonseca, 2009). Here it was suggested that distal factors that increase
eversion at the foot-ankle complex may affect lower extremity kinematics. However it is
important to note that the lateral wedges in the sandal were only inclined in the forefoot,

[277]
and the rearfoot eversion was significantly increased at mid to late stance. No significant
difference was identified in the peak rear foot eversion during heel strike (Souza et al.,
2009). Therefore as the lateral wedge worn by the mature runners in the current study
included a heel-based incline with little forefoot support, it could be suggested that
position of the wedge was the possible reason for the non significant changes. It is
therefore proposed that it is the location of the lateral wedge within the shoe that
influences the effect on the kinematic movement patterns during gait. As the lateral
wedge worn by the mature females was low thickness (6 mm) and based at the heel, the
effect on peak rearfoot motion was limited.
The effect of the lateral wedge on the peak ankle dorsiflexion and peak forefoot abduction
values similarly produced no significant changes. The change in peak forefoot abduction
was negligible, with a mean difference of 0.1 degrees between the neutral and lateral
wedge condition (p>0.05, effect size: 0.00006). The non significant change in forefoot
abduction among the mature females was expected, due to the association between this
variable of gait and pronation. The results from this study among mature females supports
the coupling action between rearfoot eversion and forefoot abduction, with the lateral
wedge producing non significant effects for both variables during running gait.
Currently, little research investigating the direct effect of lateral wedge technology on
forefoot movement exists, however an association between forefoot varus and knee
external adductor moment has been demonstrated (Teichtahl et al., 2006). According to
Andrews and co-workers, participants that displayed increased forefoot varus had
significantly lower knee external adductor moments during gait (r = 0.44, p>0.05)
(Andrews, Noyes, Hewett, & Andriacchi, 1996). This theory was later supported by
Hurwitz and colleagues, who showed forefoot varus to be significantly correlated with the
knee external adductor moment during mid-late stance among osteoarthritis patients (r = -
0.45, p<0.001), indicating that increases in knee moment reduce forefoot varus (Hurwitz,
Ryals, Case, Block & Andriacchi, 2002). Therefore, as lateral wedge technology is
designed to decrease the knee external adductor moment, it could be expected that an
increase in forefoot abduction would be seen. However, this was not shown among the
mature female runners in the current study, and it is suggested that the lack of significant
results is due to the heel-focussed wedge in the shoe.

[278]
As no significant changes in rearfoot eversion and forefoot abduction were demonstrated
by the mature females; the non-significant difference in peak ankle dorsiflexion with the
lateral wedge was expected, due to the association of all three variables of gait. Ankle
dorsiflexion is commonly linked with rearfoot eversion and forefoot abduction, as the
first metatarsal joints lower in relation to the lateral border of the foot, forcing the latter
into dorsiflexion (Bates et al., 1978). As such, it was expected that a lateral wedge would
increase this angle, producing higher peaks of dorsiflexion among the mature females.
However, the lack of significant difference is once again suggested to be due to the wedge
acting at the heel or a consequence of the low wedge thickness (6mm).
5.4.2.3.2. Knee joint kinematics and moments.
The lateral wedge was expected to produce little effect on the maximum knee flexion
angle during the stance phase of gait. Maximum flexion is achieved at mid stance, as the
body weight is positioned over the foot (Kirtley, 2006). Among the mature females, no
significant change was seen in the peak angle, time of occurrence or knee flexion angular
velocity during the running trials performed in the lateral wedge. These results are similar
to those presented in the literature. In one assessment of the effect of lateral wedges,
Crenshaw and colleagues showed no significant change in knee flexion angle among a
group of healthy individuals (Crenshaw, Pollo & Calton, 2000). This was later supported
by Russell and co-workers who similarly showed a non significant change in knee flexion
angle among healthy subjects, with mean peak angles of 15.5 and 15.8 degrees for the
lateral wedge and control conditions respectively (Russell et al., 2003). Richard, Jones
and Kim (2006) performed a later study with a brace and lateral wedge, and illustrated no
change in knee flexion angle among participants. Although the dominance of studies
involve assessments of walking gait, the consistency of results support those found
among the mature females, and suggest little effect of lateral wedge technology on the
knee flexion angle in the sagittal plane during gait.
Among mature female runners in the current study, the lateral wedge was predicted to
significantly reduce peak knee abduction angle during the stance phase of gait. The mean

[279]
data illustrated a mean difference of 2.9 degrees between the neutral and the lateral
footwear conditions, although this difference was not significant (p>0.05). However, with
an effect size shown as 0.067, it is shown that 6.7 % of the variance in knee abduction
was due to the lateral wedge; a moderate effect (Cohen, 1988). Based on the literature,
and the results from the previously discussed kinematic variables, it is suggested that it
could be the location of the heel wedge that limits the reduction in knee varus angle
among this group. This is supported by Hinman and colleagues, who suggested that a full
length orthotic with a wedge expanding the entire lateral border is more effective in
affecting knee dynamics than a wedge at the heel (Hinman, Bowles, Payne, & Bennell.,
2008). According to Inman (1976), this is due to the orientation of the subtalar joint axis;
inclined from the lateral calcaneus to the first metatarsal head. As such, the full length
lateral wedge supports the lesser metatarsal joints, and produces a lateral shift in the
location of the centre of pressure throughout mid stance (Kakihana et al., 2004). This is
further supported with the results of the investigation among the mature females, as the
peak abduction angle occurred at a later time (0.22 seconds) than peak rearfoot eversion
angle (0.096 seconds), suggesting the efficiency of controlling lower limb kinematics
with the lateral heel is diminished shortly after heel strike.
The results from the knee internal rotation data among the mature females do not support
the study hypotheses, with no significant increase in knee rotation with the lateral wedge.
This result is similar to that produced by Nester and colleagues, who showed no change in
peak knee internal rotation angle during gait with a lateral wedge orthotic (Nester el al.,
2003). Due to the coupling mechanism between the rearfoot and the tibia, it is suggested
that the non significant change in knee internal rotation is associated with the lack of
change in rearfoot eversion shown with this footwear condition, and the height of the
wedge could be the limiting factor in affecting the tibial and knee internal rotations during
gait.
The kinetic knee data produced from the running trials in the lateral wedge however lend
support to the second hypothesis. When compared to the neutral condition, the lateral
wedge elicited a significant reduction in the peak knee external adductor moment, and
moment arm length among the mature female runners. Therefore despite a consistent lack
of kinematic change observed with the lateral wedge, this specific footwear condition did
produce a significant reduction in the knee external adductor moment among mature
[280]
female runners (P>0.05). This is consistent with results presented in the literature, which
have investigated the effect of lateral wedges on the knee external adductor moment and
knee joint loading (Crenshaw et al., 2000). Although not a direct measure of knee joint
loads, due to its strong association with medial knee loads this frontal plane knee moment
often acts as a dependant variable when assessing effective strategies to reduce medial
knee joint loading during gait (Hunt et al., 2007).
Lateral wedge technology is often used to modify the knee external adductor moment and
decrease medial loads and osteoarthritis risk at the knee joint (Russell & Hamill, 2011).
This is achieved through a shift in the centre of pressure laterally relative to the centre of
the knee joint, which causes a decrease in the length of the moment arm of the ground
reaction force about the knee joint centre (Yasuda and Sasaki, 1987). The results from the
running trials performed by the mature females in the lateral wedge support this theory, as
a significant reduction was seen in the peak moment arm calculated during the stance
phase of gait (p<0.05). This therefore suggests that the wedge in the lateral heel and
midfoot affected the moment arm produced at peak stance with enough magnitude to
significantly affect the knee external adductor moment produced by the mature female
runners.
When comparing these results with those presented in the literature, direct comparisons
were compromised due to the lack of studies investigating lateral wedges during running.
Despite this, one study performed by Nigg and colleagues demonstrated a 4.5 mm lateral
wedge to significantly shift the centre of pressure laterally and reduce the moment arm
length among subjects during running trials. It is however noted that this significant
change in centre of pressure location was achieved only with a full length lateral wedge,
and no significant changes were observed with the half length wedge (Nigg et al., 2003).
As suggested, the majority of research in this area has involved subjects performing
walking trials, although many studies have included varying speeds, and as such the
results from the faster speeds were primarily considered. Erhart and co-workers
investigated the effect of two different heights of lateral wedge (4 degree and 8 degree)
on a group of healthy individuals performing walking trials at slow, medium and fast
speeds. Results from this study indicated a systematic increase in reduction of knee
external adductor moment with both the height of the lateral wedge and the speed of
walking; with walking trials in the 8 degree wedge producing a reduction of 19.66 Nm/kg

[281]
x m% at the fast speed compared with a reduction of 12.56 Nm/kg x m% at the normal
speed (Erhart et al., 2008). Similarly, the effects of lateral wedge in walking trials at self-
selected speeds have commonly shown decreases in knee external adductor moments
(Crenshaw et al., 2000) although the results are not always consistent (Maly et al., 2002).
Additional studies support the results among the mature females, showing the effect of
lateral wedge technology among healthy individuals. One study performed by Kakihana
and co-workers showed a 6 degree lateral wedge to decrease the knee external adductor
moment by an average 24.44 %, and a later investigation showed a 5 degree lateral wedge
to decrease the peak knee external adductor moment by an average of 6.76 % (Kakihana
et al., 2004; Crenshaw et al., 2000). Conversely, Maly and colleagues indicated a 5 degree
lateral wedge to produce no change in knee external adductor moment during walking.
However it is noted that this investigation was performed using a heel wedge, and
subjects were all diagnosed with medial compartment knee osteoarthritis (Maly et al.,
2002). In the same way, Nester and co-workers showed minimal effect of lateral wedges
on the knee kinetics and kinematics among healthy subjects during walking trials,
although similar to the previously discussed study (Maly et al., 2002; Nigg et al., 2003),
the lateral wedges were not full length (Nester et al., 2003).
Although the results among the mature females indicated a positive effect of lateral
wedges, the inconsistency of significant changes seen in knee kinetics with a lateral
wedge is discussed by Shelbourne and colleagues. Here it is suggested that a lateral
wedge will cause a lateral shift in the centre of pressure. However, even a substantial
displacement of centre of pressure of 5 mm in the lateral direction, will only produce a 3
Nm (0.5 % BW * height) decrease in knee external adductor moment, suggesting a
possible reason for often non significant changes in peak moment (Shelbourne et al.,
2008). Therefore, the majority of research, combined with the results among the mature
females lend support to the theory that a lateral wedge will reduce the knee external
adductor moment during gait. It is however clear that an increase in research on the effect
of these wedges during running gait is required to substantiate these theories.

[282]
5.4.2.4. Orthotic footwear condition; lateral wedge and medial support.
Among the mature females, the running trials performed in the orthotic condition elicited
the biggest change in both kinematics and kinetics of the lower limb. It was hypothesised
that the medial support in the orthotic would significantly reduce rearfoot eversion and
knee internal rotation, while the full length lateral wedge would produce reductions in
knee abduction and peak knee external adductor moments.
5.4.2.4.1. Orthotic induced kinematic changes at the ankle/subtalar joint.
At the ankle joint, the orthotic footwear condition produced minimal changes in peak
dorsiflexion angle and peak foot abduction during running, with slight reductions
demonstrated in both angles (p>0.05 effect sizes: 0.084, 0.0021). The peak rearfoot
eversion angle was however significantly reduced among the group when compared to the
neutral condition (p<0.05), although no change was seen in the peak eversion occurrence
time or velocity (p>0.05). These results initially tend to contest the theory that foot
abduction and dorsiflexion are linked with rearfoot eversion. Although the slight
reductions in both kinematic variables do support the theory that rearfoot eversion is the
primary variable of pronation (Bates et al., 1978). Additionally, although designed to
reduce the negative effects of pronation, the medial support in the orthotic condition was
primarily hypothesised to reduce rearfoot motion.
The significant change in rearfoot eversion angle among mature females supports the
theories in the literature, suggesting increased medial support in the heel and the arch
reduce the maximum rearfoot eversion angle during the stance phase of gait (Kilmartin et
al., 1994). In a review of literature, Kilmartin and colleagues suggest that the majority of
research reports a similar finding; that medial support biomechanical orthoses reduce
rearfoot pronation during gait (Kilmartin et al., 1994).This supports Novick and Kelley
(1990), who examined the effect of orthotics with postings in the rear and forefoot, and
showed a significant decrease in peak calcaneal eversion with respect to the lower leg.
Similarly, Eslami and co-workers showed a medial support foot orthotic to significantly

[283]
reduce peak rearfoot eversion angle during running, with no change in occurrence time, a
result similar to that produced by the mature females (Eslami et al., 2009). MacLean and
colleagues also supported this theory, showing an orthotic footwear condition to
significantly reduce maximum rearfoot eversion angle among healthy runners (MacLean
et al., 2006). The results from the mature females therefore lend support to these previous
studies. Despite this, there is still uncertainty based around the role and efficiency of
orthotics and previous research has also shown little effect of medial posting on rearfoot
motion during running and walking. Stacoff et al (2000) reported small, non significant
and inconsistent effects of orthotics on the rearfoot mechanics of healthy individuals, and
Stackhouse et al (2004) later supported this, showing foot orthotic devices to produce no
significant effect on rearfoot motion among healthy subjects performing running trials.
However it was noted that although the overall group response was not significant, some
subjects did show a reduction in peak rearfoot angle, supporting the theory that individual
responses to orthotics can hinder significance of group studies (Stackhouse et al., 2004).
Due to the association between excessive rearfoot eversion and injuries, the effect of
specific footwear and orthotic interventions on rearfoot motion during running has
received a high level of interest, with research consistently producing equivocal results.
The results from this investigation among the mature females support the use of medial
wedging to reduce rearfoot eversion among mature female runners. Additionally, the
inclusion of a lateral support within the shoe elicited no negative effects on the subtalar
joint movement, a notion supported by Nakajima and colleagues who showed a combined
orthotic similar to the one worn by the mature females to produce a reduction in rearfoot
eversion (Nakajima et al., 2009). The lack of negative effect on the rearfoot eversion was
further supported by Teichtahl and colleagues, who suggested that at early stance the
ground reaction force acts through the heel and therefore the position of the forefoot has
little effect on the knee kinetics (Teichtahl et al., 2006). This is an important result as the
magnitude of peak ankle eversion has implications for soft tissue injury, particularly at
the knee (Bates et al., 1979; Tiberio, 1987). It appears that the study orthotic device could
therefore act as a successful strategy for reducing key biomechanical variables associated
with knee injury.
The lack of significant change in rearfoot eversion velocity is not surprising due to the
mixed responses presented in the literature. In an early study, Smith and colleagues

[284]
showed foot orthotics to produce a decrease in rearfoot eversion velocity, however Brown
and colleagues later showed no effect of orthotics on eversion velocity while walking, and
Stackhouse later showed no change in calcaneal velocity with orthotic intervention when
running (Smith Clarke, Hamill and Santopietro, 1986; Brown, Donatelli, Catlin, &
Wooden, 1995; Stackhouse et al., 2004). It is therefore suggested that although the peak
angle of rearfoot eversion may change with orthotics, the velocity and occurrence time
may not be affected.
When compared with the neutral condition, the orthotic produced a slight decrease in
ankle dorsiflexion (effect size: 0.084, medium). As a component of pronation, a reduction
in ankle dorsiflexion was expected, as the orthotic was intended to reduce pronation
values. The lack of significant change in dorsiflexion angle is suggested a possible
consequence of data collected from only 20 females, as 80% of the participants showed a
reduction in dorsiflexion value with the orthotic. This could therefore be a result of
individual variability in response to the orthotics, as four out of the twenty participants
showed an increase in peak ankle dorsiflexion with the orthotic condition. The increase in
peak ankle among four mature females suggests an independence of ankle dorsiflexion
movement from rearfoot eversion, and could be due to the orthotic elevating the medial
arch, which increases the mediolateral position of the subtalar axis, and produces an
increase in dorsiflexion about this axis (Stackhouse et al., 2004). However this response
may be expected with only medial support, and the lateral support in the orthotic may
have counteracted this movement.
The overall lack of significance in ankle dorsiflexion movement with the orthotic is
suggested a consequence of the combined medial-lateral support, reducing the overall
movement of the ankle in the sagittal plane, and variability in individual response. This is
similar to the results produced for the forefoot abduction variable, where no significant
changes occurred between the neutral and the orthotic condition among the mature female
runners. It has previously been suggested that the inclusion of a lateral wedge reduces the
forefoot abduction angle during gait (Nester et al, 2003); however this is reversed by the
inclusion of a medial wedge within the orthotic (Nakajima et al., 2009). Therefore the
arch support included in the orthotic worn by the mature females could have counteracted
any reduction in foot abduction produced by the lateral wedge technology. According to
Hurwitz and colleagues, an increase in toe out gait (foot abduction) produces a significant

[285]
reduction in the knee external adductor moment, and subsequent medial knee joint
loading. This therefore initially suggests a possible limitation to the lateral wedge
intervention designed to reduce this moment. However, both the results among the mature
females, and those presented by Nakajima and colleagues suggest that the inclusion of
medial support within the orthotic device counteracts this possible drawback, with no
significant reduction in foot abduction shown (Nakajima et al., 2009). This is further
supported with the kinetic results that will be discussed in a later section, displaying no
increase in knee external adductor moment with the orthotic intervention.
At the ankle joint, the orthotic intervention significantly reduced rearfoot eversion, but
produced no change in ankle dorsiflexion or foot abduction. This tends to fall in line with
previous research, and the group significance demonstrated suggests a positive role of this
form of orthotic among mature females.
5.4.2.4.2. Orthotic induced changes in kinematics at the knee joint.
At the knee joint, the orthotic condition was hypothesised to significantly reduce knee
internal rotation and knee abduction angle. Overall, little change was demonstrated in the
peak knee flexion or abduction angle, although the orthotic intervention significantly
delayed the occurrence time of the peak knee abduction angle (p<0.05). Additionally, the
orthotic significantly reduced the magnitude of peak knee internal rotation angle and
angular velocity during the stance phase of running gait (p<0.01).
According to Nawoczenski and colleagues, knee flexion is linked with subtalar joint
pronation and tibial and knee internal rotation in the weight-bearing position
(Nawoczenski et al., 1995). It is possible that the increase in support on the lateral sole
counteracted this effect, reducing the significance of knee flexion reduction. The lack of
significant change in peak knee flexion angle among the mature female runners was
similar to the early work of Cavanagh and Edington, who showed both a 10 degree lateral
and medial wedge to produce no effect on the magnitude or time of peak knee flexion
during the stance phase of gait, and Bates and colleagues who showed no effect of
orthoses on knee flexion during treadmill running (Cavanagh & Edington, 1989; Bates et

[286]
al., 1979). This was further supported more recently by Nester and colleagues who
similarly showed no change in knee flexion angle with orthotic intervention (Nester et al.,
2003). It is possible that as the wedging in the orthotic worn by the mature females was
based on both the medial and lateral sides of the sole, the effect on kinematics in the
sagittal plane of motion is minimal. This is further supported by the lack of significant
change in the peak ankle dorsiflexion angle.
Although no significant change in knee abduction angle was elicited with the orthotic
condition, the peak angle was reduced in 19 of the 20 participants, with an average
reduction shown as 3.3 degrees. Additionally, 6.5 % of the change in knee abduction was
due to the orthotic condition (effect size: 0.065). It was expected that the lateral wedge
would decrease the peak abduction angle among the mature females; however the
inclusion of the medial support may have limited the magnitude of this reduction.
Although the difference in magnitude of peak knee abduction angle was not significant, it
is suggested that the reduction in knee abduction angle is associated with the reduction in
moment arm length at the knee joint. A displacement of the knee joint centre towards the
midline of the body reduces the moment arm between the centre of the knee joint and the
line of the ground reaction force acting vertically (Hunt et al., 2006). Therefore, although
not significant, the orthotic condition is suggested to have a greater effect on the
kinematics at the knee joint through the decrease in knee abduction angle during the
stance phase of gait. It is possible that the significance of this reduction in knee abduction
angle could be influenced by the number of participants (20) within this current study,
and an increase in participants may have substantiated this result. This is supported by
statistical power analysis, and based on the 0.9 degree change in knee abduction angle
with the motion control shoe in Study 2, a sample of 20 females would only elicit a power
of 17%. However, this was based on results with a motion control shoe, with no specific
intervention designed to alter knee abduction. Based on the means from the current study,
the effect of the orthotic intervention on the knee abduction would produce a power of 54
% with a sample size of 20. Therefore, although higher than the power from the previous
study, this could be considered a limiting factor.
Despite no significant change in peak angle, the orthotic, combining lateral wedge and
medial support did however produce a significant delay in the peak knee abduction
occurrence time among the mature females, showing a maximum angle to occur 0.02

[287]
seconds later than in the neutral condition. This, combined with a reduction in angular
velocity, suggested that the lateral support in the shoe delayed the movement of the knee
to peak abduction, possibly reducing the speed with which load is dispersed to the medial
compartment. This therefore could also be related to the reduction in knee external
adductor moment that occurred during late stance.
The main finding among the kinematic data at the knee joint is the significant reduction in
peak knee internal rotation angle during running. As illustrated, the medial wedge within
the orthotic condition significantly reduced the rearfoot eversion angle among the mature
females. Due to the coupling between tibial and knee internal rotation with rearfoot
eversion, the decrease in rotation at the knee joint was expected. This falls in line with
previous research showing the positive effect of orthotics on the knee internal rotation
angle during gait (Nawoczanski et al., 1995; Stackhouse et al., 2004). However the main
interest in the results among the mature females is the lack of negative effect of the lateral
wedge within the orthotic device. It was possible that the lateral wedge would counteract
the medial support, enabling the tibia and knee to internally rotate, as was demonstrated
in the neutral condition. However the addition of the lateral support still produced a
significant reduction in peak knee internal rotation angle during running. It is suggested
that as the tibial and knee internal rotation is produced by the motion of the rearfoot, the
medial wedge based at the heel and medial arch limit this motion. As the majority of
lateral support is based in the mid and forefoot, this support has little effect on the
magnitude of knee internal rotation achieved during running. The significant reduction of
0.43 radians per second in knee internal rotation velocity further supports these theories,
showing the medial support to reduce the speed with which the knee internally rotates
during stance.
5.4.2.4.3. Effect of orthotic intervention on the knee external adductor moment.
Among the mature females, the running trials performed in the orthotic condition elicited
the greatest reduction in knee external adductor moment, with an average decrease of
0.23 Nm/kg from the neutral condition. These results support the study hypothesis for this

[288]
variable with the reduction showing statistical significance (p<0.01). The peak knee
external adductor moment was measured from the second peak (Figure 5.22), and
therefore occurred during mid to late stance. To this end, it was expected that the lateral
wedge based along the length of the lateral sole would restrict movement of the knee joint
towards a varus position at mid to late stance, thereby reducing the moment arm at the
knee joint. These results were further supported by the significant reduction in moment
arm length, measured from the midpoint of the knee joint to the line of frontal ground
reaction force acting through the joint, (p<0.05). The moment arm was also significantly
correlated with the peak knee external adductor moment in the neutral, orthotic and lateral
footwear conditions (p<0.05).
These results fall in line with many studies in the literature supporting the use of lateral
wedge technology for reduction in knee external adductor moments and consequential
medial knee joint loading (Crenshaw et al., 2000; Russell et al., 2011). However, a main
point of interest when discussing results produced in the orthotic intervention is the lack
of negative effect of the medial wedge within the orthotic device. During the stance phase
of gait, the heel strikes in an inverted position, loading the lateral side of the calcaneus
(Whittle, 2003). As gait progresses to early midstance, the calcaneus moves quickly into
eversion; a movement closely coupled with internal rotation of the tibia and knee joint
(Richards, 2008). At this point, the knee often moves into an adducted position. Among
the mature females, as gait progresses into mid to late stance, the knee joint moves into
abduction, creating a moment arm between the centre of the knee joint, and the medio-
lateral coordinate of the centre of pressure, and a knee external adductor moment acts at
the joint (Figure 5.1). This progression of movement therefore lends explanation to the
positive results displayed by the medial and laterally wedged orthotic worn by this group.
As the medial wedge is based at the heel and arch, this component controlled for early
stage gait movements including rearfoot eversion and knee internal rotation. However as
the lateral component is based along the mid and forefoot, the abduction movement and
knee external adductor moment is limited.
The significant correlation between moment arm length and knee external adductor
moment in the neutral, orthotic and lateral footwear conditions, lends support to the
theory that altering alignment and moment arm length is an effective way to reduce the
knee external adductor moment during running (Hunt et al., 2006). These results are

[289]
supported by a recent study within the literature. Nakajima and colleagues investigated
the effect of a lateral wedge with medial arch support among a group of healthy
individuals. In the results it was shown that although no change in the peak knee external
adductor moment was shown with the inclusion of medial arch support, the average
moment throughout stance was significantly reduced, with the greatest reduction shown at
late stance (Nakajima et al., 2009). In contrast, Abdallah and co-workers investigated the
effect of laterally wedged orthotics with medial support on the walking gait of patients
diagnosed with medial compartment knee osteoarthritis. Results indicated that no
significant difference was seen in the knee external adductor moment, (Abdallah et al.,
2009). However, although no change was demonstrated in the knee external adductor
moment with the lateral wedge, the addition of a medial wedge did not increase the knee
adduction moment. Furthermore, on evaluation of the methodology, it is noted that these
results were displayed among a group of diagnosed patients, and according to Kakihana
and colleagues, osteoarthritis patients demonstrate significantly smaller changes in
kinetics and kinematics with orthotics than changes seen among healthy participants
(Kakihana et al, 2007).

[290]
5.5. Conclusion: Positive effect of combined medial and lateral support.
Although lateral wedge technology has been advocated to reduce knee external adductor
moments and medial knee joint loading, a lack of support under the medial arch while
placing the foot in an everted position increases the tension and peak pressures on the
medial aspect of the foot (Butler et al., 2007; Tsung et al., 2004). Similarly, many
subjects have complained of discomfort when walking in shoes with lateral wedges
(Abdallah et al., 2011). As such, the addition of medial support at the rearfoot and medial
arch is suggested to reduce these negative effects (Nakajima et al., 2009).
The results from the running trials performed in the orthotic footwear condition in this
study support two main theories presented in the literature. Firstly, that the length of the
lateral support influences the effect on knee kinetics, and secondly, that the addition of a
medial arch support improves the overall effect of a laterally wedged orthotic (Hinman et
al., 2008; Nakajima et al., 2009). Results from both the individual medial and lateral
wedges showed little significance on the kinematics among mature female runners.
However, both the full length lateral wedged orthotic intervention, combined with the
addition of a medial wedge at the heel and arch produced significant reductions in gait
variables commonly associated with debilitating conditions.
Both rearfoot eversion and knee internal rotation have been related to the development of
lower limb and knee injuries and overuse conditions, due to an increase in strain on the
ligaments and an uneven force distribution at the knee joint (Cheung et al., 2006).
Similarly, the knee external adductor moment is a variable of gait that has been
consistently related to the development of medial compartment knee osteoarthritis.
Within this study, the orthotic device produced significant reductions in both peak
rearfoot eversion and knee internal rotation angle among a group of mature female
runners, with no negative influence of a lateral wedge seen among this group.
Furthermore, the significant reduction in the knee external adductor moment produced
with the orthotic device supports the theory of lateral wedge technology with combined
medial support in potential management of overuse injuries and medial compartment
osteoarthritis at the knee joint.

[291]
Although the orthotic condition did not produce significant changes among all
investigated variables, including knee abduction angle, the lack of consistency of results
could be due to the variability in response to orthotic devices and the relatively small
sample sizes. This is supported by the moderate effect sizes shown. To see the same
response in knee abduction among 19 of the 20 mature females is potentially unusual and
although many results were not significant it is possible that a larger sample size would
increase likelihood of significant results (Nigg et al., 1999).
The results from this study among mature female runners therefore suggests that an
orthotic intervention combining both a lateral wedge with medial rearfoot and arch
support could significantly reduce the risk of lower extremity injuries and medial
compartment knee osteoarthritis among this group.

[292]
Chapter 6
“Biomechanical Indications of Medial Knee Osteoarthritis and Evidence of Bone
Changes on Magnetic Resonance Imaging.”
6.1. Introduction and Review of Relevant Literature.
6.1.1. Longitudinal changes to biomechanics for six consistent mature female
participants.
Within this thesis, three previous biomechanical investigations have included a subset of
six constant participants. As such, a review of kinematic results produced by these mature
females provides an indication into longitudinal changes over the course of 30 months.
Table 6.1 indicates the changes in rearfoot eversion angle for the 6 participants over this
duration, and Figure 6.1 indicates the similar changes in the knee external adductor
moment for each participant.
Table 6.1. Mean rearfoot eversion and knee internal rotation angle produced by the 6
participants within each biomechanical investigation.
PARTICIPANT REARFOOT EVERSION (deg) KNEE INTERNAL ROTATION (deg)
Study 1 Study 2 Study 3 Study 1 Study 2 Study 3
1 11.2 ± 3.49 14.1 ± 3.12 14.5 ± 3.9 14.0 ± 2.4 16.0 ± 3.2 17.4 ± 1.23
2 12.5 ± 1.6 15.9 ± 3.62 18.5 ± 5.7 16.0 ± 2.5 10.8 ± 3.28 9.5 ± 1.1
3 10.5 ± 3.2 12.3 ± 1.2 13.1 ± 6.42 12.6 ± 3.5 12.6 ± 2.75 12.5 ± 1.91
4 12.9 ± 4.1 17.1 ± 2.79 17.2 ± 2.82 14.5 ± 3.49 14.0 ± 3.42 14.0 ± 2.4
5 13.4 ± 2.38 18.1 ± 8.17 19.6 ± 3.22 13.8 ± 3.2 14.8 ± 1.53 12.0 ± 3.99
6 14.0 ± 6.1 21.2 ± 13.5 19.9 ± 2.67 14.5 ± 2.8 11.6 ± 3.90 14.3 ± 2.3

[293]
Figure 6.1. Knee external adductor moment (Nm/kg) produced by six participants across
the three biomechanical investigations.
Although there is a tendency for both the rearfoot eversion angle and the knee internal
rotation angle to increase across this period, there is a notable decrease in the knee
external adductor moment among each participant in the final biomechanical
investigation. As the footwear was changed for each study, it is possible that the shoes
worn in the final study incorporated certain design features that decreased the varus
position of the knee joint, and decreased the knee external adductor moment acting at the
joint. It is however noted that the inter-individual patterns remained similar, suggesting
the knee external adductor moment was reduced similarly among each participant.
Due to the general increase in rearfoot eversion and knee internal rotation angle across the
three studies, and the increase in the knee external adductor moment across studies one
and two, it is suggested that gait changes occur with respect to increasing age, and the
vulnerability of the knee joint to degenerative conditions has increased. Despite a lack of
increase in the knee external adductor moment in the third biomechanical investigation,
the moments produced remain high when compared to literature examples, and therefore
suggest the risk of knee joint osteoarthritis remains high among this specific group.

[294]
6.1.2. Osteoarthritis; a debilitating condition of the knee joint.
Osteoarthritis is a major cause of pain and mobility-related disability among an ever
increasing number in the population (Felson et al., 2003). This condition is commonly
considered a consequence of the natural wear and tear of synovial joints over time, is
most frequently present in the knee joint, and is often preceded by an injury (Tiderius et
al., 2003). However, advances in laboratory and clinical research has recognised
osteoarthritis as a complex mechanical and biological disorder of the joint that in time
leads to loss of function and pain (Hascall & Kuettner, 2002).
6.1.2.1. The knee joint and articular (hyaline) cartilage.
The knee joint is the largest and most complex joint in the human body, comprising three
joints within a single synovial cavity (Totora & Grabowski, 2003). The details of the
anatomy and mechanics of the knee joint are provided in Chapter 2; however a brief
summary is provided here to, due to the nature of this study. Simply, the knee
encompasses the distal end of the femur, the proximal end of the tibia, and the patella.
Laterally, the knee forms the tibiofemoral joint, comprising the lateral condyle of the
femur, lateral meniscus and lateral condyle of the tibia. Conversely, on the medial side,
the second tibiofemoral joint comprises the medial condyle of the femur, the medial
meniscus and the medial condyle of the tibia. Both tibiofemoral joints are hinge joints.
Finally, the intermediate patellofemoral joint is formed between the patella, and the
patellar surface of the femur, forming a planar joint (Totora & Grabowski, 2003).
At the knee joint, articular (hyaline) cartilage lies over the articulating surface of the
distal femur and proximal tibia, and the posterior side of the patella. This is the most
common form of cartilage, composed of cellular chondrocytes and an extracellular matrix
made up of hyaluronic acid, proteoglycans, type II collagen, and water (Majumdar, 2010).
In addition to this articular cartilage, menisci are also present at the knee joint, consisting
of fibrocartilage, a dense, fibrous and more resistant form of cartilage, arranged in
concentric plates in the medial and lateral knee joint (Totora & Grabowski, 2003).

[295]
6.1.2.2. Knee joint osteoarthritis development.
The pathogenesis of osteoarthritis is manifested by a combination of morphologic,
biochemical, molecular, and biomechanical changes of both the cells and matrix of the
structures and articular cartilage at the knee joint (Majumdar, 2010). This leads to
softening, and fibrillation of the articular cartilage, eburnation of the subchondral bone,
and the development of osteophytes and subchondral cysts (Moskowitz, 2007). During
the development of osteoarthritis of the knee joint, the loss of hyaline cartilage is the
central pathologic event (Felson et al., 2003). Articular cartilage is gradually lost due to a
developed imbalance between biosynthesis and degradation of matrix constitutes such as
type II collagen and glycosaminoglycans (Tiderius et al., 2003). During the early stages
of osteoarthritis development, when compared with healthy cartilage, the degenerating
hyaline cartilage contains increased water and decreased proteoglycan concentrations.
This is coupled with weakened collagen network, due to the decreased synthesis of Type
II collagen fibres (Majumdar, 2010). These changes have been attributed to increased
presence of specific molecular messengers such as Interleukin-1 within the articular
cartilage, which releases catabolic enzymes and acts to suppress the synthesis of type II
collagen. It has also been shown that the chondrocytes of osteoarthritic knee joints are
increasingly susceptible to Interleukin-1 than are those found in healthy joints
(Majumdar, 2010).
Following the breakdown of collagen within the articular cartilage, the matrix undergoes
a process of fibrillation as the superficial layers are broken down. Eventually, the
cartilage is worn down through the full depth; exposing subchondral bone plates which
become the new articulating surface of the knee joint (Majumdar, 2010). As such,
although cartilage loss is a known pathologic function of osteoarthritis development,
abnormal bone formation is another associated element (Felson et al., 2003). As normal
everyday movement occurs at the knee joint, the stages of osteoarthritis progress, and the
exposed bone undergoes repeated frictional forces, and becomes smoothed and burnished
(eburnation). This then leads to the formation of sub-chondral cysts and osteophytes,
established in the areas of exposed bone.
Bone edema (bruising) is an additional feature, caused by changes in articular contact
points at the sites of biomechanically failing cartilage (Moskowitz, 2007). Bone edema
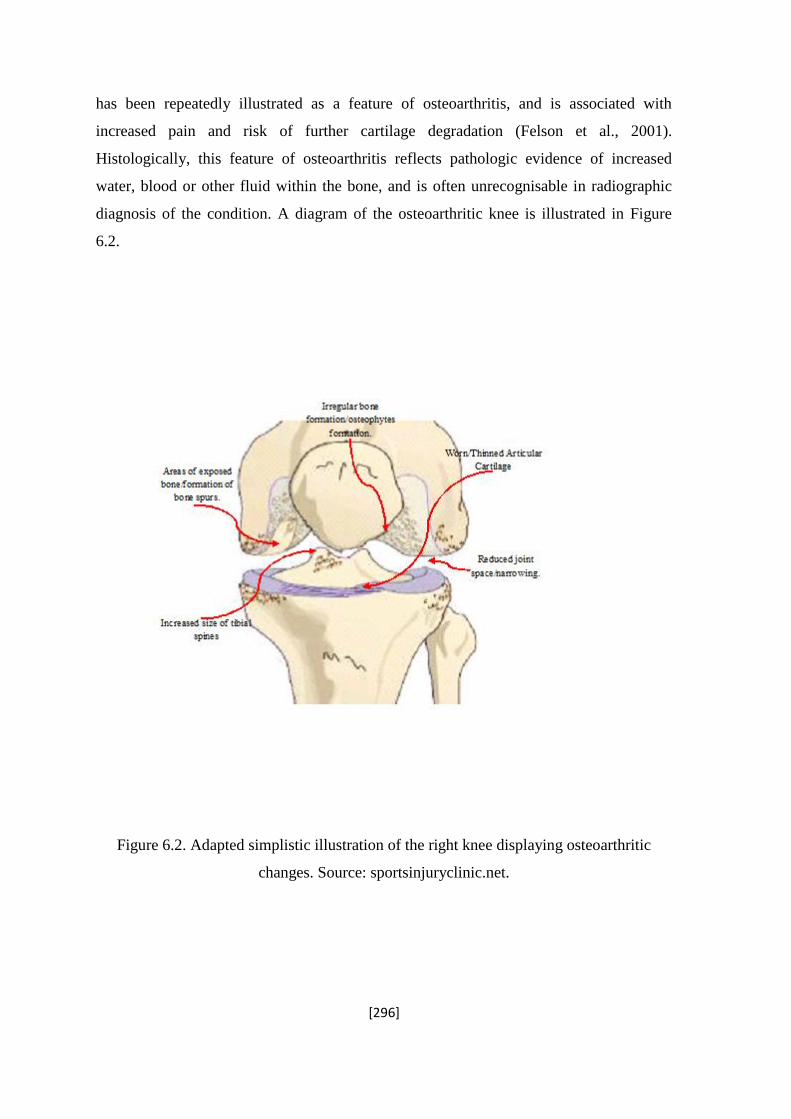
[296]
has been repeatedly illustrated as a feature of osteoarthritis, and is associated with
increased pain and risk of further cartilage degradation (Felson et al., 2001).
Histologically, this feature of osteoarthritis reflects pathologic evidence of increased
water, blood or other fluid within the bone, and is often unrecognisable in radiographic
diagnosis of the condition. A diagram of the osteoarthritic knee is illustrated in Figure
6.2.
Figure 6.2. Adapted simplistic illustration of the right knee displaying osteoarthritic
changes. Source: sportsinjuryclinic.net.

[297]
6.1.3. Epidemiology of osteoarthritis.
Osteoarthritis is a degenerative condition that affects an ever expanding number among
the population. As the most common skeletal disorder in adults, the risk of osteoarthritis
increases with age, and is almost twice as common in women as it is in men. These
gender differences are often attributed to the hormonal influence of oestrogen on the
structure of the articular cartilage, a gender variation in injury risk, and differences in
biomechanics between males and females, including increased Q angle among females,
and a lower muscle strength to body mass ratio (Moskowitz et al., 2007). Several studies
have supported these theories, with specific statistics showing osteoarthritis of the knee
joint to be more prevalent in women than their male counterparts (Davis, Ettinger., &
Neuhaus, 1989).
The risk of developing osteoarthritis at the knee joint is also increased in those who have
suffered earlier trauma to the joint (Zuluaga, Briggs, Carlisle, McDonald, McMeeken,
Nickson, Oddy & Wilson, 1995). Ligamentous and meniscal damage decreases stability
of the knee joint, and leads to excessive and uneven loading in specific areas. Therefore,
with higher force being attenuated at the knee joint in activities such as running, the
uneven distribution of load heightens the risk of structural degeneration and osteoarthritis
development (Zuluaga et al., 1995).
6.1.4. Biomechanical alignment associated with knee osteoarthritis.
As well as age and gender, lower limb malalignment has also been reported as a potential
risk factor for the development and structural progression of knee osteoarthritis (Felson et
al., 2003). This condition is a result of local mechanical factors acting within the context
of systemic susceptibility at the knee (Sharma et al., 2001). At this joint, site-specific
factors, including alignment, govern how load is distributed across the structure, and a
disproportionate medial transmission of load occurs from a stance phase adductor
moment. As discussed in the previous chapter, the knee external adductor moment, and
increased moment arm length, is associated with a varus position at the knees (Figure

[298]
5.1). This moment has been shown to reflect the intrinsic compressive load acting on the
medial compartment during gait (Sharma et al., 2001). One longitudinal study illustrated
an increased risk of medial compartment osteoarthritis progression among patients with
knee varus alignment; baseline knee varus was associated with a four-fold increase in the
risk of medial compartment progression (Sharma et al., 2001). These findings are
consistent with previous biomechanical studies that have shown increased knee varus
alignment to increase medial compartment load and risk of progression (Hsu et al., 1990;
Miyazaki et al., 2002).
It is however often questioned whether increased knee external adductor moment and
varus alignment precedes osteoarthritis development, or is simply a consequence of the
condition acting at the medial knee (Brouwer et al., 2007). Osteoarthritis present at the
knee joint can cause malalignment due to articular cartilage loss and changes in bone
formation, resulting in an uneven articulating surface (Sharma et al., 2001). Brouwer and
colleagues investigated this theory and illustrated lower limb varus malalignment,
measured as the femorotibial angle using radiographic imaging, to predate knee
osteoarthritis development (Brouwer et al., 2007). As such, it is assumed those mature
females that present with high knee external adductor moments in the current study are at
an increased risk of developing osteoarthritis in the medial compartment of the knee joint.
6.1.5. Magnetic Resonance Imaging as a method to identify early stage osteoarthritis.
There is known to be a poor correlation between pathological severity of osteoarthritis
and patient symptoms, and as such clinicians have constantly relied on medical tools for
diagnostic purposes (Ehrman, Gordon, Visich, & Keteyian., 2003). Early stages of
osteoarthritis have predominantly been identified using radiographic images, which
depicts joint-space narrowing and osteophytes formation (Ding et al., 2007). However
radiographic images have been shown to have a range of limitations in osteoarthritis
identification, including limited sensitivity to change, and poor prediction of cartilage loss
(Cicuttini et al., 2004). Furthermore, it has been illustrated that reduction in the volume of
cartilage, alongside the development of smaller cartilage defects, has the ability to occur

[299]
within the joint before radiographic scans can identify abnormalities (Ding et al., 2007).
As such, the use of MRI scans has been advocated to enhance identification of early signs
of knee osteoarthritis, within both symptomatic and asymptomatic patients (Pessis et al.,
2003; Cicuttini et al., 2004).
MRI can offer a distinct advantage over knee radiography, since cartilage can be assessed
directly (Amin et al., 2005). Although radiography is non-invasive and inexpensive, it
remains an indirect measure of cartilage loss through osteoarthritis. However in addition
to cartilage changes, osseous modifications are ideally depicted by MRI, with
visualisation of both cortical and trabecular bone. Furthermore, due to the tomographic
nature of MRI scanning, this method is more advances at delineating structures such as
subchondral osteophytes that are often obscured by overlying structures on conventional
radiographs (Moskowitz, 2005). Standard MRI techniques including fat-saturated, T1-
weighted and T2-weighted spin sequences have recently been utilised to directly assess
structural changes in the knee joint, including cartilage volume, defects, subchondral bone
changes and meniscal lesions, all which can be identified during the early stages of
osteoarthritis development (Ding et al., 2007). Both T1 and T2 weighted scans are similar
basic scans, which differentiate fat from water to highlight differences in composition of
cartilage and muscle. In the T2 weighted scan, the fat shows up darker, and water lighter,
highlighting suitability to imaging bone edema. Furthermore, MRI can provide 3-
dimensional imaging of the knee, in contrast to the 2-dimensional radiographic images.
As such, cartilage morphology can be assessed in multiple compartments of the knee
joint. Commonly, the tibiofemoral joint is divided into five compartments of cartilage
when assessing for osteoarthritis development using MRI. These include the central and
posterior femur, and the anterior, posterior and central tibia (Amin et al., 2005).
One study investigating the superiority of MRI scanning above the use of radiographic
images, examined the relationship between joint narrowing on radiographic images and
cartilage loss on MRI (Amin et al., 2005). Coronal, axial and sagittal images of the knee
were obtained from 224 men and women (mean age 66 years). Results showed that 46%
had cartilage loss visible on MRI. Of this value, 42% of patients showed cartilage loss
visible on MRI, where no radiographic progression was present. As such, it was
concluded that radiography is not a sensitive measure of knee osteoarthritis, and if used
unaccompanied by MRI scans, will miss a substantial proportion of knees with cartilage

[300]
loss (Amin et al., 2005). Furthermore, although changes in joint space are often detectable
through radiographic images, it has been shown that these changes reflect cartilage loss in
the central regions of the weight-bearing surface of the knee joint rather than any other
areas (Amin et al., 2005). As such, MRI scans in the coronal plane could be used to
facilitate identification of cartilage loss occurring at other areas of the tibiofemoral joint,
particularly the posterior femur compartment.
According to Bartko (1995), vital characteristics of the ideal method to assess
osteoarthritis of the knee joint include simplicity, validity, reliability, and sensitivity to
change. The final characteristic is the most difficult to achieve, as sensitivity to change in
cartilage breakdown over the course of one year is commonly insignificant through the
use of radiography and arthroscopic parameters (Pessis et al., 2003). Arthroscopy can be
used to analyse pre-radiographic cartilage changes, however as an invasive measure it
results in post operative functional limitations and further complications (Tiderius et al.,
2003). In an assessment of knee osteoarthritis progression, Pessis et al (2003) showed no
statistically significant changes in cartilage degradation through the use of radiography
and arthroscopy. However, in the same study, MRI scans in the coronal and sagittal
planes illustrated significant worsening of the chondropathy, demonstrating the ability of
MRI to identify characteristics of osteoarthritis that are unrecognisable through the use of
radiographic x-rays (Pessis et al., 2003). Additionally, the presence of bone oedema that
is recognisable through the use of MRI scans could determine whether the chondral
disorder is likely to progress over the following year.
Bone marrow oedema is recognisable through coronal scans showing increased signal on
the marrow on fat-suppressed T2-weighted images. These bone marrow lesions are
defined as areas of increased signal, present in either the medial or lateral compartment of
the femur or the tibia, and graded based on size. Previously it has been suggested that
only lesions graded 2 and above are associated with pain. As such, within this study it
would be pertinent to look for smaller lesions (graded below 2), as all participants are
anticipated to be pain free (Felson et al., 2003). A study by Felson et al (2003) confirmed
that bone lesions identified through MRI images significantly predicted local structural
deterioration. When medial compartment lesions were identified, risk for medial
compartment progression of osteoarthritis was increased more than six fold (Felson et al.,
2003). Furthermore, the presence of lesions in the knee joint was commonly associated

[301]
with biomechanical malalignment, both statically and dynamically; with increased lesions
in the medial compartments significantly associated with varus alignment of the lower
limb. This suggests the high influence of frontal plane malalignment in the structural
progression of knee osteoarthritis (Felson et al., 2003). Furthermore, this supports the
suggestion that radiographic outcome varies with the specific degree of knee flexion
(Tiderius et al., 2003). Therefore the above highlights the importance of using MRI
images to identify bone marrow oedema seen in bone lesions (Felson, et al., 2003). These
lesions have been shown to be present without the onset of pain, and have consistently
been associated with the progression of osteoarthritis.
The weight of the above research therefore highlights the importance of MRI scans in the
detection of early stage osteoarthritis of the knee joint. Although radiographic images
have been used previously, it has been highlighted that changes in the morphology of the
cartilage can occur prior to radiographic identification. Furthermore, MRI scans have
been shown to identify progressive changes in the cartilage degradation over the course of
one year, which appears untraceable through the use of radiography. MRI offers a safe
and accurate method to assess early stage osteoarthritis non-invasively (Tideruis et al.,
2003).

[302]
6.1.6. Aims and hypotheses.
The main aim of this investigation was to support the original theory that mature female
runners are at a higher risk for the development of debilitating conditions, specifically
knee joint osteoarthritis. This occurred with an assessment of the presence of early stage,
medial compartment knee osteoarthritis among a group of asymptomatic mature female
runners using magnetic resonance imaging. Two hypotheses were addressed:
1. Mature females would demonstrate early stages of knee osteoarthritis identifiable
through the use of MRI.
2. A significant positive correlation will exist between the knee external adductor
moment (as measured in the previous study) and the severity of early stage
osteoarthritis determined from the MRI scans.

[303]
6.2. Methods.
6.2.1. Participant selection.
This investigation was provided ethical approval from the University of Exeter ethics
committee. 10 female participants were recruited on a volunteer basis for participation in
an investigation of early stage osteoarthritis of the knee joint. The females had a mean age
of 51.8 years, with a minimum age of entry of 40 years, based on the methodology of the
previous investigations. All participants had taken part in the biomechanical assessment
involved in Study 3, which had occurred two weeks earlier. Therefore, the time delay
between the data collected from the motion analysis investigation and the MRI
assessment was minimal. As described previously, all females were classified at the same
standard in running, by weekly club attendance and 10 km run time. All participants were
asymptomatic and had never been diagnosed with knee joint osteoarthritis. All females
provided informed consent, and completed a patient safety checklist, which assessed
suitability for participation. Prior to this, each female was provided an information sheet,
detailing the intentions of the study, the technology involved in each scan, and the low
level risks apparent. Each female was requested to attend the scanner following a rest day,
to limit the presence of knee joint bruising (bone oedema) possible following a run.
6.2.2. Magnetic Resonance Imaging.
All scans were performed with a Philips 1.5 Whole Body Imager (Philips Gyroscan
Clinical Intera, Koninklijke Philips Electronics N.V), located in the Peninsular Medical
Building at the University of Exeter. Each participant volunteered for a single session,
during which scans were performed on the right knee of each mature female. All scans
were performed with a Quadrature Knee Coil to hold the knee in place while in the
scanner, and ensure uniformity between patients. The type of scan selected was a T-1
weighted scan with fat suppression, which differentiates fat from water. Due to the short
repetition time, this standard basic scan enables prompt collection of high resolution 3-
dimensional data. During each session, three image sets were taken, with 70, 1.5 mm

[304]
thick slices acquired continuously. Two sets had in-plane resolution of 0.49 x 0.49 mm;
one acquired in the sagittal direction, and the second in the coronal direction. The third
set was obtained in the sagittal direction with a resolution of 0.63 x 0.75 mm. Both the
coronal and sagittal slices were acquired for each participant’s knee joint allowing
identification of discrepancies between the medial to lateral, anterior to posterior, and
superior to inferior compartments of the knee joint (see Figures 6.3 and 6.4). The knee
was scanned in a non weight-bearing position.
6.2.3. Osteoarthritis progression evaluation.
To evaluate the presence and progression of knee joint osteoarthritis, the T1-weighted
scans were analysed in each plane of motion individually. This process was performed
twice, on two days separated by one week, to assess the reliability of the results.
Figure 6.3. Deep anterior coronal view of the left knee joint illustrating the distinction of
medial to lateral compartments of the femur and tibia. Picture (knee) taken from ClipArt,
Office Word (2007).

[305]
Figure 6.4. Sample MRI scan of the right knee in the sagittal plane. Diagram highlights
the method of sectioning of the femur, tibia and patella, for osteoarthritis evaluation. MRI
scans taken from the pilot study.
Posterior compartment of
femur
Central compartment of
femur
Anterior compartment of
femur
Posterior compartment of
tibia
Central compartment of
tibia
Anterior compartment of
tibia
Anterior compartment of
patella
Superior compartment of
patella
Posterior compartment of
patella
Inferior compartment of
patella
FEMUR
TIBIA
PATELLA

[306]
As illustrated in Figures 6.3 and 6.4, each femur and tibia was divided into medial, lateral
and central compartments, and each patella was divided into four quadrants, resulting in
ten potential sites of osteoarthritis development. Early stage osteoarthritis of the knee
joint was identified through the presence of features associated with the condition (See
Figure 6.2). Within the different compartments of the knee joint, osteophytes, bone
oedema, enlarged tibial spines and sub articular cysts were identified and the exact
location documented. These features were distinguished with the help of a local
orthopaedic consultant, who was involved in the analysis of data. Each slice taken from
every set of scans was scrutinised three times to aid reliability of results and limit the
possibility of overlooking small occluded features. This assessment was then repeated on
a separate day a week later, and the two sets of data compared with a test-retest
assessment of reliability.
Osteophytes were identified as small formations of bone protruding into the articular
cartilage surrounding the surface. They were identified as small hooks, commonly found
on outer edges of each bone analysed (Kraan & Berg, 2007). The bone oedema was
identified as ill-defined areas of intermediate to low signal on the T1-weighted images,
presenting as white patches on the black bone, indicating increased fluid in that specific
area (Pessis et al., 2003). The beaked tibial spines were identified in the coronal view,
with the appearance of sharp hooks on each spine. Finally, the sub-articular cysts were
associated with small circular areas of definitive white, appearing in the deep surface of
the bone.
The severity of osteoarthritis present in each knee joint was quantified based on the
number of features identified, and the existence with regard to the progression of
osteoarthritis. The presence of osteophytes, bone oedma, beaked tibial spines, and sub
articular cysts were graded with a score of one point for each single feature, and two
points for each cyst as these are a later feature of osteoarthritis (Amin et al., 2005). As
such, each knee was allocated a final score; the greater the value, the increased presence
of early stage osteoarthritis. Medial and lateral osteoarthritis were categorised separately.

[307]
6.2.4. Correlation tests.
6.2.4.1. Correlation of MRI data with Knee Osteoarthritis Observation Survey.
A knee Osteoarthritis Observation Survey (KOOS) was completed by each participant
prior to involvement in the biomechanical running investigation. This survey assessed the
presence and potential for running injuries and osteoarthritis at the knee joint, within the
sub categories of pain, symptoms, activities of daily living, sports and recreation, and
quality of life. Each answer categorised osteoarthritis on a Likert Scale 0-5. Results
indicated the severity of symptomatic osteoarthritis, with an average score of 100
representing a symptom free participant. To enable a correlation test, results were
inverted, and the KOOS score was taken from 100 to give a positive value of
osteoarthritis present. Participant mean results were then directly correlated with the
results from the scans, to assess the relationship between symptomatic and MRI identified
osteoarthritis at the knee joint.
6.2.4.2. Correlation of MRI data with age and menopause.
The quantified MRI data was initially correlated with the age of each participant, to
evaluate the trend of increased severity and age among the female population. A simple
correlation test was performed with the two sets of data, and a follow up regression
analysis took place to assess the statistical significance of the r value. The correlation
coefficient was deemed significant at the p<0.05 level. The results from the MRI
scanning session were also correlated with information attained regarding the menopause
and the supplementation of hormones. This was performed to determine whether any
relationship existed between osteoarthritis and hormone replacement therapy, specifically
oestrogen enhancement.

[308]
6.2.4.3. Correlation of MRI data with biomechanical data.
The biomechanical data involved in this study was taken from the biomechanical motion
analysis investigation (Study 3) that had occurred two weeks in advance. The peak knee
external adductor moment produced during running trials in a neutral running shoe was
collected for each mature female who underwent MRI scans of the knee joint. The
moment was calculated using inverse dynamics methods described in the previous
chapters. The moment was only taken for the right knee, and was then correlated with the
results from the MRI scans. The correlation test was performed with the grade allocated
to each knee (medial and lateral osteoarthritis distinguished), and the average peak knee
external adductor moment as calculated from ten running trials. A regression analysis
then occurred to obtain the statistical significance of the correlation.

[309]
6.3. Results.
6.3.1. Participant information.
Ten asymptomatic mature female runners, each with one knee studied, met the inclusion
criteria and volunteered for participation in this study. Table 6.2 presents participant
information, including details of age, current menstruation, and any additional hormone
supplements.
Table 6.2. Table displaying participant information, including date of birth, years of
menopause, and the hormone replacement therapy.
PARTICIPANT DOB/AGE MENOPAUSE OESTROGEN
SUPPLIMENT
1 12/11/64: 46 years Irregular 18 months. No
2 03/04/1952: 59 years >5 years No
3 23/04/1967: 44 years N/A N/A
4 14/05/59: 52 years >5 years No
5 18/07/62: 49 years 2 years No
6 06/01/58: 53 years >5 years No
7 24/08/57: 54 years 3 years No
8 13/12/1953: 58 years > 5 years No
9 23/02/64: 47 years N/A N/A
10 18/10/54: 56 years > 5 years No
MEAN 51.8
STANDARD
DEVIATION
5.15

[310]
6.3.2. Results from the MRI scans.
Of the female participants that volunteered for participation in this study, eight showed
signs of early stage osteoarthritis at the knee joint. One set of scans showed the presence
of metal artefact, which occluded a substantial proportion of the knee. This knee was
therefore not included in the analyses. One female was classified as symptom free
(Participant 3), with no signs of osteoarthritis present in any compartment of the knee
joint. This knee was still incorporated in the analyses, as its inclusion was required for the
correlation test.
A set of sample images are displayed to illustrate some of the features of osteoarthritis
described in the following results tables. Figures 6.5a-b and 6.6 illustrate sample scans
acquired in the sagittal plane. Figure 6.5a highlights the presence of an osteophyte on the
posterior tibia, compared with a knee showing no signs of osteoarthritis (Figure 6.5b).
The presence of bone oedema on the posterior patella is highlighted in Figure 6.6. This
was identified as the area of white activity on the bone, and was measured at 6 mm.
Figure 6.5a. Sample slice (28) acquired in the sagittal view illustrating the femur, tibia
and patella. Osteophyte highlighted on the posterior tibia (Participant 1).
Osteophyte identified.

[311]
Figure 6.5b. Sample slice (28) acquired in the sagittal view illustrating the femur, tibia
and patella. No features were identified (Participant 3).
Figure 6.6. Slice acquired in the sagittal view highlighting bone oedema on the posterior
patella (Participant 1).
6 mm bone oedema
identified (not to scale).

[312]
Assessment of the results was initially qualitative, with signs of osteoarthritis determined
from the presence of osteophytes, bone oedema, and subarticular cysts. Tables 6.3a-c
illustrates the qualitative results from the MRI scans of the knees of each female. As
highlighted, osteophytes were the most common feature identified, with all eight knees
that showed signs of osteoarthritis, presenting a minimum of one (Table 6.3a). Bone
oedema and beaked tibial spines appeared less frequently, both presenting in only 37.5%
of the knees (Table 6.3b and c). Sub-articular cysts, a later feature of osteoarthritis, were
only identified in one knee (Table 6.3c). Assessment of the knee joint in the coronal plane
illustrated discrepancies in osteoarthritis between the medial and lateral compartments of
the femur and tibia (Figure 6.3). Six knees showed signs of early osteoarthritis in the
femur and tibia, with 79% of the features identified, isolated to the medial compartment.

[313]
Tables 6.3a-c. Tables illustrating qualitative results of the MRI scans, with the location of
osteophytes (a), bone oedema (b), beaked tibial spines and (c) subarticular cysts identified
for each female.
a)
PARTICIPANT
OSTEOPHYTES
PATELLA
FEMUR
TIBIA
Inferior Superior Medial Lateral Medial Lateral
1 Osteophyte Osteophyte No features
identified.
No features
identified.
Osteophyte on
medial tibial
plateau.
Osteophyte on
medial tibial
spine.
No features
identified.
2 Osteophyte Osteophyte Osteophyte on patella-femoral area Osteophyte on
medial tibial
plateau.
No features
identified.
3 No
features
identified.
No
features
identified.
No features identified.
4 Osteophyte Osteophyte Osteophyte on
medial
intercondyle
notch.
Osteophyte on
medial femoral
condyle.
Osteophyte on
lateral
intercondyle
notch.
Osteophyte on central posterior
tibia.
5 No
features
identified.
Osteophyte No features identified.
6 Osteophyte Osteophyte Osteophyte on anterior surface of
femur.
Osteophyte on
posterior medial
tibia
Osteophyte on
anterior lateral
tibia. Osteophyte on
medial femoral
condyle.
Osteophyte on
lateral femoral
condyle.
7 Osteophyte Osteophyte Osteophyte on
anterior patella-
femoral surface.
No features
identified.
Osteophyte on
medial posterior
tibia.
No features
identified.
8 No
features
identified.
Osteophyte No features identified.
Osteophyte on
anterior tibia.
No features
identified.
9 LARGE AMOUNT OF METAL ARTIFACT OCCLUDED VISION.
10 Osteophyte Osteophyte No features identified.

[314]
(b)
PARTICIPANT BONE OEDEMA
PATELLA
FEMUR
TIBIA
Inferior Superior Medial Lateral Medial Lateral
1 6 mm at
midpoint of
inferior surface.
No features
identified.
7.9 mm on
posterior third
of medial
femur.
No features identified.
2 No features identified.
3 No features identified.
4 No features identified.
5 No features identified.
6 No features
identified.
4.4 mm on
superior patella
on deep surface.
No features identified.
7 No features identified.
8 No features identified.
9 LARGE AMOUNT OF METAL ARTIFACT OCCLUDED VISION.
10 No features
identified.
6 mm on
superior patella.
No features identified.
(c)
PARTICIPANT TIBIAL SPINES SUB-ARTICULAR CYSTS
TIBIA
PATELLA
Superior Inferior
1 Slight beaking due to osteophyte
presence
No features identified.
2 No features identified.
3 No features identified.
4 No features identified.
5 No features identified.
6 Beaking of tibial spines No features identified.
7 Beaking of tibial spines No features identified.
8 No features identified.
9 LARGE AMOUNT OF METAL ARTIFACT OCCLUDED VISION.
10 No features identified. 2 Sub articular cysts
present on superior
patella.
No features
identified.

[315]
The qualitative results as presented in the above tables (Table 6.3a-c) were quantified
using a scale as described in the methods section. The results from the biomechanical
assessment of knee external adductor moment during running are presented in Table 6.4,
alongside the quantified data from the osteoarthritis evaluation. A sample moment time
history for the knee external adductor moment is presented in Figure 6.7 (Subject 2).
Table 6.4. Table displaying quantified osteoarthritis results alongside previously obtained
knee external adductor moments.
PARTICIPANT
KNEE OA SCORE
KEAM
(Nm/kg)
KOOS RESULTS
(100 – Score)
1 7 1.27 85.35 = 14.65
2 4 1.03 93.79 = 6.21
3 0 0.89 94.14 = 5.86
4 6 1.17 92.225 = 7.775
5 1 1.10 98.15 = 1.85
6 9 1.37 89.84 = 10.16
7 5 1.19 98.91 = 1.09
8 2 1.04 94.66 = 5.34
10 7 1.24 83.27 = 16.73
MEAN 4.56 1.14
92.25/7.74
STANDARD
DEVIATION 3.05 0.15
4.99

[316]
Figure 6.7. Sample graph illustrating the knee external adductor moment produced during
one running stride. Stance phase and measured peak are highlighted.
Stance Phase
Peak Knee
External
Adductor
Moment
measured.

[317]
6.3.3. Correlation of MRI score with age, KOOS score, and biomechanical data.
Correlation tests were performed to assess the association of knee osteoarthritis score
with age, KOOS results and the knee external adductor moment (Figures 6.8 a-c). Table
6.5 illustrates the results of the follow up regression analysis. The correlation between
knee osteoarthritis and age (0.22) was not significant (p>0.05), although when presented
graphically, a moderate positive linear relationship is shown by the trend line (Figure
6.8a). The relationship between knee osteoarthritis and KOOS score showed a positive
correlation coefficient (r=0.64) although this too was not statistically significant (p>0.05)
(Figure 6.8b). However, similar to the osteoarthritis and age relationship, Figure 6.8b
shows the trend line to demonstrate a positive linear relationship between the two
variables.
A correlation and regression test indicated a significant positive correlation between the
osteoarthritis outcome and the knee external adductor moment among the mature female
runners (p<0.05) (Table 6.5). Furthermore, the regression analysis demonstrated an R-
square value of 0.83, suggesting that the regression line (Figure 6.8c) approximates 83%
of the data. A scatter diagram highlights the association between knee external adductor
moment and osteoarthritis presence, with the best fit line showing a linear correlation
(Figure 6.8c).
Table 6.5. Results from correlation coefficient test and regression analysis tests for MRI
results with age, KOOS results, and the knee external adductor moment (KEAM).
STATISTICAL ANALYSIS
OUTPUT
MRI:AGE MRI:KOOS MRI:KEAM
Correlation Coefficient 0.22 0.64 0.92
R Square 0.05 0.41 0.83
Observations 9 9 9
P-Value (2 sf) 0.56 0.061 0.000512*
Significant difference highlighted (*).

[318]
(a)
(b)
R = 0.22, p = 0.56
R = 0.64, p = 0.061

[319]
(c)
Figure 6.8 a-c. Scatter diagrams illustrating the relationship between osteoarthritis present
at the knee joint and age (a), KOOS score (b) and the knee external adductor moment (c)
among nine mature females.
R = 0.92, p = 0.00051
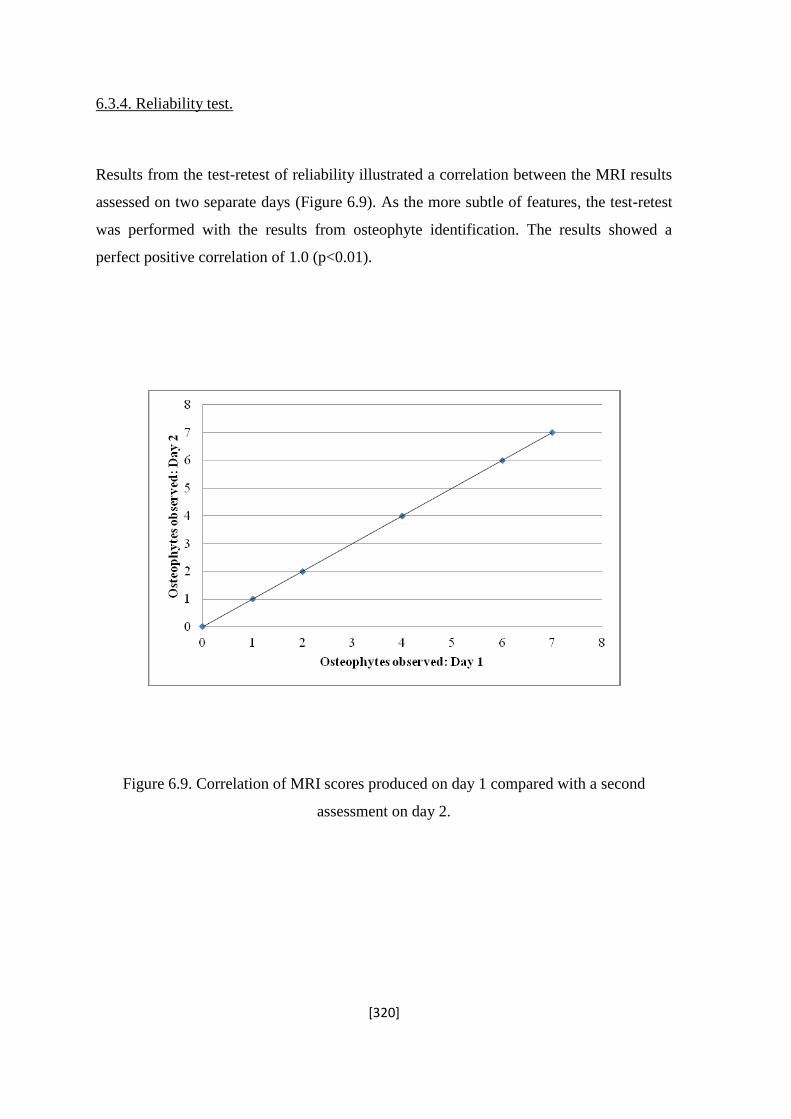
[320]
6.3.4. Reliability test.
Results from the test-retest of reliability illustrated a correlation between the MRI results
assessed on two separate days (Figure 6.9). As the more subtle of features, the test-retest
was performed with the results from osteophyte identification. The results showed a
perfect positive correlation of 1.0 (p<0.01).
Figure 6.9. Correlation of MRI scores produced on day 1 compared with a second
assessment on day 2.

[321]
6.4. Discussion.
The aim of this study support the original theory that mature female runners are at a
higher risk for the development of debilitating conditions, specifically knee joint
osteoarthritis. The purpose was to assess the current condition of the knee joint of each
participant, and investigate the relationship with age, KOOS results, and knee external
adductor moment. Ten mature female runners of similar running ability (determined
through results of the most recent 10 km race) volunteered to take part following
involvement in the ongoing biomechanical assessment. Each female was classified as
symptom free from the results of a completed knee osteoarthritis observation survey
(KOOS, see chapter 5, section 5.3.1.1). Magnetic resonance imaging techniques were
employed to identify changes in the joint, which are commonly unrecognisable through
radiographic assessments. Results were then combined with those produced from the
ongoing biomechanical investigation, and a correlation test was performed to assess the
relationship between the knee external adductor moment and the scale of osteoarthritis
present in the knee joint.
6.4.1. Knee joint osteoarthritis evaluation.
Of the ten female participants that underwent magnetic resonance imaging scans, eight
displayed signs of early stage osteoarthritis; each diagnosed knee showing the formation
of at least one osteophyte (Figure 6.5a). Osteophytes are fibrocartilage-capped bony
outgrowths, which take the form of one of three types; the traction spur, the inflammatory
spur, and the genuine osteophyte (Kraan, & Berg, 2007). The former two are located at
the insertion of tendons and ligaments, with the inflammatory spur represented by the
syndesmophyte; a bony growth formed inside a ligament (Menkes & Lane, 2003). The
genuine osteophyte, commonly known as osteochondrophyte, presents at the periosteum
overlying the bone at the junctional zone between cartilage and bone (Menkes and Lane,
2003). It is this latter form of osteophytes that were identified in the knee joints of the
mature female runners.

[322]
The clinical relevance of osteophyte formation was summarised by Kraan and Berg
(2007), who suggested that osteophytes are a main feature of osteoarthritis, and form in
the early development of the condition, often identified prior to joint space narrowing. In
support of this, Bullough (1992) stated that joints affected by osteoarthritis are
characterised by the production of new connective tissue in the form of osteophytes.
Osteophytes have also been identified in experimentally induced osteoarthritis of the knee
joint, supporting this feature’s role in the development of the condition (Moskowitz and
Goldberg, 1987). The presence of osteophytes in the knees of mature females in the
current study and the positive correlation with the knee external adductor moment support
this suggestion; that osteophyte presence is a sign of early stage osteoarthritis.
However, the link between osteophyte formation and osteoarthritis is not equivocal, and
several researchers have more clearly linked osteophyte presence with positive effects on
distribution of forces. According to Menkes and Lane (2003), osteophyte formation is
considered to be an adaptive reaction of the joint to cope with instability, and plays a
compensatory role in the redistribution of forces, aiding articular cartilage protection.
Similarly, Pottenger, Phillips and Draganich, (1990) demonstrated the removal of
osteophytes to increase the varus-valgus movement at the knee joint, highlighting the role
of these features in joint stabilisation. However, it is noted that these knees had previously
been diagnosed with severe osteoarthritis, and the role of osteophytes as a cause or
consequence of the condition is not clear. It is however apparent that, despite uncertainty
regarding the order of appearance, osteophyte formation is succinct with osteoarthritis,
and can therefore be considered a feature associated with the condition.
An additional feature identified in the knees of the mature females in the current study is
the beaking of the tibial spines. According to Holten (2004) the beaked tibial spines are a
positive finding in diagnosis of knee joint osteoarthritis, supporting the suggestion that
the mature females were illustrating early stage osteoarthritis of the knee. This is further
supported by a recent investigation, analysing the morphological features of osteoarthritis
in paleopathological specimens. Hayeri and colleagues indicated a positive correlation
between tibial spine height and grading of osteoarthritis, confirming it as a feature of the
condition (Hayeri, Shiehmorteza, Trudell, Hefflin, & Resnick, 2010). Similarly, Hayeri et
al., (2010) associated tibial spine beaking with the development of osteophytes in early

[323]
stage osteoarthritis. This association was supported in the results from the current study,
as osteophytes were present in each knee that displayed beaked tibial spines.
Bone oedema was identified in three of the eight knees that showed signs of early stage
osteoarthritis. This was identified as signs of increased activity producing areas of white
colour on the scans of the bone (Figure 6.6). The identification of this feature not only
supports the suggestion that the mature females were presenting with early stage knee
osteoarthritis, but also supports the use of magnetic resonance imaging techniques in
diagnosis, as oedema is often unidentifiable with radiography (McQueen & Ostendorf,
2006). The association of bone oedema as an early sign of osteoarthritis is supported by
Felson and colleagues, who performed a longitudinal study into the progression of
osteoarthritis of the knee joint. Here it was shown that risk of progression was increased
six fold among patients with signs of bone oedema (Felson et la., 2001). This was further
supported by Garnero and colleagues who associated the presence of bone oedema with
increased collagen breakdown, and McQueen (2007) who suggested bone oedema to be
intimately involved in the pathological process, predicting radiographic erosive
progression (Garnero, Peterfy, Zaim, & Schoenharting, 2005; McQueen, 2007). Both
investigations therefore lend support to the findings and assumptions that the bone
oedema identified among the mature females is a sign of osteoarthritis.
The presence of early stage knee joint osteoarthritis in the knee joint of one participant
was supported by the identification of subarticular cysts. Bone cysts have been well
recognised as features of advanced osteoarthritis for decades, often taking one of two
forms (Rhaney & Lamb, 1955; Crema, Roemer, Marra, Niu, Lynch, Felson, & Guermaz,
2010). The synovial fluid intrusion theory suggests that increases in sub-articular pressure
forces fluid into the subchondral bone via damaged cartilage causing cysts to form deep
within areas of eroded cartilage (Landells, 1953). The second form of cyst, known as the
bony contusion cyst, is a consequence of traumatic impact between two opposing
articular surfaces (Crema et al., 2010). As a loss of cartilage was not reported for any
participant within this investigation, the subchondral cysts identified in the knee of
participant 10 are likely be of the latter form. This therefore suggests that osteoarthritis is
present in this knee due to uneven articulation between the patella and femur.

[324]
6.4.2. Osteoarthritis among asymptomatic mature female runners.
6.4.2.1. Osteoarthritis among mature members of the female population.
As all participants were female, with an average age of 51.8 (±5.15) years, each runner
was assumed to be in a high risk category for the development of osteoarthritis at the knee
joint (Moskowitz et al., 2007). Despite this, throughout the previous chapters and
investigations, all mature female runners were characterised as free from symptoms of
debilitating knee conditions. Results from the magnetic resonance imaging scans
illustrated that out of the nine knees included in the analysis, eight presented with early
stage knee osteoarthritis. This alone supports the previously presented theory that there is
a poor association between symptomatic and diagnosed osteoarthritis at the knee joint
(Hannan et al., 2000).
Although males were not included in this study for comparative purposes, the presence of
osteoarthritis identified in 89 % of the females could be considered to support the theory
that osteoarthritis is common in women. Results from the Framingham Osteoarthritis
Study (Felson, 1990), showed women to present an overall higher level of radiographic
osteoarthritis compared to a group of aged matched men. However, as suggested, no such
comparison occurred in the current study, and the results can only be used to make
inferences on the population of mature females based on a sample of 9 knees.
6.4.2.2. Osteoarthritis among runners.
The relationship of physical activity to the development and progression of the condition
has previously been examined with mixed results. Our investigation included ten
participants who were classified as recreational runners, of which eight presented with
early stage osteoarthritis. As no comparison was made with a control group of sedentary
aged-matched females, these results enable only speculation on the role of exercise in
osteoarthritis development.

[325]
An early case control study performed by Imeokparia and colleagues, suggested that the
female gender, physical activity levels, and age were all risk factors for the development
of osteoarthritis at the knee joint (Imeokparia, Barrett, Arrieta, Leaverton, Wilson Hall
and Marlowe, 1994). This association between osteoarthritis development and physical
activity was further supported in an additional study which looked at the development of
the condition among ninety two participants. Although this latter study displayed a
significant effect for physical activity, information regarding osteoarthritis presence was
determined through questionnaires (Kohatsu and Schurman, 1990).
An additional study shown to support the association between physical activity and
osteoarthritis was performed with dancers (Teitz and Kilcoyne, 1998). These results
indicated the level and frequency of dancing undertaken to significantly increase the risk
of premature symptomatic and radiographic osteoarthritis. Additionally, a prospective
study performed with the Framingham study data indicated that heavy levels of physical
activity undertaken by the elderly was a risk factor for osteoarthritis development,
independent of previous injuries or participation in elite sports. However, neither
investigation directly looked at the effect of long distance running.
In contrast, a study performed at a similar time suggested that long distance running, even
at elite level, may not be an independent risk factor for the development of knee
osteoarthritis (Kujala, Kettunen, and Paananen, 1995). Similarly, a more recent
longitudinal study found that running was not associated with accelerated incidence or
radiographic progression of knee joint osteoarthritis (Chakravarty, Hubert, Lingala,
Zatarain, and Fries, 2008). It is important to note here however, that when compared to a
group of inactive participants, the long distance runners did have increased radiographic
osteoarthritis at baseline.
As the results from our study showed 88% of runners to display early signs of
osteoarthritis, with no comparison of a control group, it is uncertain whether the activity
of running is an independent risk factor for this incidence. It is possible that an aged-
matched group of sedentary females may present similar signs of osteoarthritis. As such,
future longitudinal research is needed to further understand the relationship between
running and osteoarthritis, with assessments among a group of gender and aged matched
individuals, free from the condition at baseline.

[326]
6.4.2.3. Osteoarthritis and age.
Although all females were classed as mature based on inclusion in the 40 – 60 years
category, the participants ranged in age from 44 years to 59 years. As such, a correlation
test was performed to assess the effect that age had on the scale of osteoarthritis identified
at the knee joint. As illustrated in Table 6.5, although a moderate linear relationship was
present between the two variables (Figure 6.8a), the correlation coefficient was not
statistically significant (p>0.05).
This result is in contrast to theories presented in the literature, suggesting that increasing
age is a risk factor for osteoarthritis development and progression (Felson, 1990). It has
been commonly suggested that age is directly proportional to risk of osteoarthritis, and
according to Loeser (2000), by the age of 60 years, 100% of the population will have
signs of osteoarthritis at one or more joints. Similarly, in the Framingham osteoarthritis
study (age range 63-94 years), knee osteoarthritis was seen to progressively increase with
age, with a rate of 4% per year among women (Felson, Naimark, Anderson, Kazis,
Castelli & Meenan, 1987). Furthermore, a later study showed the prevalence of
osteoarthritis to significantly increase with age in women but not in men, supporting the
earlier association between osteoarthritis and gender (Felson, 1990).
Although the age range of the mature females was only 15 years, it was noted that there
was a discrepancy in hormones, based on the premise that 33% of the group had not been
through the menopause (Table 6.2). During the menopause, oestrogen is no longer
cyclically released into the bloodstream, and as such many women are prescribed
oestrogen replacement supplements. The information collected from the mature females
however show that no participant was or had ever taken any form of hormone
replacement therapy. As such, it was assumed that the three females that had not been
through the menopause had higher levels of oestrogen than the post-menopausal group.
Results from the MRI scans showed participant 1 (pre-menopausal) to have 7 signs of
osteoarthritis at the knee joint (Table 6.4). Participant 3 however was also described as
pre-menopausal, and was diagnosed as free from features of early stage osteoarthritis. It is
also noted that this was the youngest female in the group. Participant 9 was described as
pre-menopausal, although due to the presence of metal artefact, the association with
osteoarthritis could not be analysed.

[327]
These results are therefore conflicting. However, while no direct relationship between
hormonal status and osteoarthritis presence could be established within the scope of this
study, the possibility of oestrogen levels influencing the results must be acknowledged.
Within the literature, the effect of the menopause, and subsequent reduced levels of
oestrogen on osteoarthritis is conflicting. Epidemiological studies have often provided
support for an association between oestrogen deprivation and osteoarthritis development,
by showing an increase in prevalence of the condition among women over the age of 50
years (Felson and Zhang, 1998). Prior to 50 years, incidence of osteoarthritis appeared
greater among men compared to women, however beyond this age the prevalence was
reversed (Felson and Zhang, 1998). Similarly, a positive relationship has been shown
between oestrogen replacement therapy and reduced osteoarthritis risk, indicating a
possible therapeutic role of oestrogen in osteoarthritis (Felson and Nevitt, 1998). This
appears to support the general theory presented in the literature, although a small number
of studies have indicated non-significant effects of hormone replacement therapy. One
study showed no effect of hormone replacement therapy on osteoarthritis; however it is
noted that the condition was monitored in the finger joints, and methodological
differences limit the ability to directly compare with the results among the mature females
in the current study (Maheu, Dreiser, Guillou, & Dewailly, 2000).
As the seven mature female runners that were categorised as post-menopausal with no
hormonal supplements all showed signs of osteoarthritis, it is possible that the lack of
oestrogen within the blood stream could be an additional factor contributing to the
development of this condition at the knee joint. Although the overall effect of age on
osteoarthritis scale among the mature females was not significant, the age range of the
group was only 15 years, and the results were based on the osteoarthritis findings of only
nine females. Therefore, it is proposed that an increase in sample size may have
strengthened the linear relationship seen.
[328]
6.4.3. KOOS scores, osteoarthritis and biomechanical alignment.
6.4.3.1. Correlation between MRI evidence and KOOS scores.
Although pain is one of the most common symptoms of knee osteoarthritis, the non
significant correlation between the KOOS survey and osteoarthritis shown among the
mature females in the current study (r = 0.64, p > 0.05) support the theory that there is
often a poor association between symptoms of pain and the early stages of the condition.
This is similar to the results found by Barker and colleagues, who demonstrated a poor
correlation between radiographic signs of early stage osteoarthritis and results from the
WOMAC (Western Ontario and McMaster Universities) index (p>0.05) (Barker, Lamb,
Toye, Jackson & Barrington, 2004). Similarly, Spector and Hart (1992) found less than
50 % of people presenting with radiographic signs of osteoarthritis to have symptoms
related to the findings, demonstrating the poor relationship between self reported knee
pain and severity of diagnosed osteoarthritis.
In contrast, Kornaat and colleagues found a strong association between osteophytes
present in the patellofemoral area and pain reported among a group of osteoarthritis
patients (Kornaat, Bloem, Cleulemans, Riyazi, Rosendaal, Nelissen, Carter, Le Graverand
& Kloppenburg, 2006). It is however noted that all patients were classified with moderate
to severe osteoarthritis, which may have contributed to the pain recorded.
The insignificant relationship between MRI evidence of knee osteoarthritis and symptoms
could be related to the lack of cartilage degradation and joint space narrowing identified
at the joints of the female runners at this stage. According to Ayral and colleagues,
cartilage loss on arthroscopy had a strong positive correlation with knee pain and
disability (Ayral, Dougados, Listrat, Bonvarlet, Simonnet, & Amor, 1996). However, as
there are no pain receptors within articular cartilage, the association between cartilage
loss and pain severity is ambiguous (Hunter, March, & Sambrook, 2003) and the lack of
cartilage loss appears to have little relevance on the non significant correlation between
osteoarthritis and pain among mature females in the current study.
Although not significant the correlation (r = 0.64) reported among the mature females
suggests that a larger sample size in this investigation may have increased the

[329]
significance of the association between pain and osteoarthritis presence. According to
Stephens, Martire, Cremeans-Smith, Druley, & Wojno, (2006) pain is a personal
experience, and therefore the methods use to assess pain reliably among a variety of
individuals is difficult. Therefore it may be that differences in inter-individual perception
of pain among the females could be a limiting factor in the relationship between
symptoms at osteoarthritis.
6.4.3.2. Correlation between KOOS and knee external adductor moment.
The relationship between KOOS results and the knee external adductor moment is
explored in detail in Chapter 5. Here it is suggested that a positive correlation exists
between the knee external adductor moment and symptoms at the knee joint, a result
similar to that presented in the literature. Hurwitz and colleagues showed a significant
positive correlation between symptoms of pain, and the knee external adductor moment in
symptomatic osteoarthritis patients (Hurwitz, Ryals, Block, Sharma, Schnitzer &
Andriacchi, 2000). It is important to note here that this previous study involved the use of
symptomatic patients. Additionally, although a positive correlation did exist between
KOOS scores and knee external adductor moment in the current study, all mature females
were classified as symptom free. These results support the theory that the knee external
adductor moment may linked with the development of early stage osteoarthritis.
It is important to note that although correlations with KOOS scores were demonstrated in
the current study, results from this survey categorised all females as symptom free.
Therefore, although variance was seen in the results produced by the mature females, the
range of scores was small (83.27-98.15), basing correlation results on a small range of
values. It is suggested that a larger sample size of mature female runners, including both
symptomatic and asymptomatic participants, may strengthen the associations between
osteoarthritis, biomechanical alignment and symptoms at the knee joint.

[330]
6.4.4. Relationship between MRI evidence of osteoarthritis and knee external adductor
moment.
As described, although the theories within the current literature are not equivocal, it
appears that the features identified among the mature female runners in the current study
are likely signs of early stage knee osteoarthritis. A correlation was therefore performed
to assess the relationship between the level of osteoarthritis present at the knee joint, and
the knee external adductor moment recorded during running. Overall, the results from this
test lend strong support to the positive association between the knee external adductor
moment and knee joint osteoarthritis development (Figure 6.8c).
Osteoarthritis is widely believed to be the consequence of local mechanical factors acting
within the context of systemic susceptibility (Sharma et al., 2001). At the joints, certain
site-specific factors govern how load is distributed between the medial and lateral
compartments, and the overall ability of the structures to manage that load (Sharma et al.,
2001). At the knee joint, alignment is a key determinant of load distribution, and the knee
external adductor moment is a known measure of medial knee joint loading, and
increased varus position of the knees (Zhao et al., 2007). As such it was anticipated that
participants with greater knee external adductor moments recorded during running trials
would display increased levels of knee joint osteoarthritis compared those who ran with
lower moments.
The correlation was performed with nine participants, and showed a positive correlation
of R squared 0.83 (p<0.05), indicating that the increased knee external adductor moment
strongly predicted the osteoarthritis level within the joint, with 83 % of the variation in
osteoarthritis signs being explained by the knee external adductor moment. This result
lies in accordance with previous biomechanical studies suggesting that increased knee
external adductor moments are associated with increased medial knee joint loading
(Foroughi et al., 2009). During gait, in the normally aligned knee joint, the load is
disproportionately transmitted to the medial compartment, which carries up to 70% (Hunt
et al., 2001). When an external adductor moment acts at the joint, the knee moves to
assume a varus position, and the medial knee carries up to 100% of the load. As such, it
was expected that the increased moments would be associated with increased signs of
wear on the medial compartment. Among the mature females that presented signs of

[331]
osteoarthritis, in the coronal plane 79% was identified on the medial compartment. This
therefore further supports the association between varus alignment, medial compartment
loading, and joint degradation.
The average knee external adductor moments produced by the mature females were
recorded as high, compared with those produced by younger females in the literature
(Pollard, Davis, & Hamill, 2004). Additionally, direct comparisons with younger female
runners in previous studies demonstrated the statistical significance of this difference
(Lilley et al., 2011; Lilley et al., 2011). The average knee external adductor moment was
taken from the second, higher peak in the moment time history trace, occurring at
midstance of a running stride (Figure 6.7). This peak occurs as the knee moves into a
varus position with the body weight positioned over the foot, increasing the moment arm
between the line of ground reaction force and the knee joint centre (Chapter 5, Figure
5.1). The high moments produced by the mature females cause a high load to be
consistently focussed at the medial knee during each foot stride taken in a run, suggested
to result in the degeneration of that compartment. This notion is supported in the findings
from the magnetic resonance imaging scans.
Although the features identified among the mature females are all categorised as signs of
early stage osteoarthritis, the statistically significant correlation result suggests an
association between knee external adductor moment, and severity of the condition. This
result is similar to those presented in the literature; when comparing the knee external
adductor moment among both less and more severe osteoarthritis patients as well as with
control participants, results in the literature have commonly shown significantly greater
moments among the most severe group (Sharma et al., 1999; Mundermann et al., 2005).
Similarly, one prospective study showed that higher knee external adductor moments at
baseline significantly predicted faster knee osteoarthritis progression (Miyazaki et al.,
2002), and Astephen and colleagues showed a significant increase in the knee external
adductor moment between a group of asymptomatic, moderate, and severe osteoarthritis
patients (Astephen, Deluzio, Caldwell & Dunbar, 2008).
However, the osteoarthritis patients involved in these studies, even at baseline have
frequently been categorised within the moderate to latter stages of disease progression,
and in a systemic review Foroughi and colleagues highlighted the lack of research
performed with early stage osteoarthritis participants (Foroughi et al., 2009). This has

[332]
lead to a theory suggesting that the increased knee external adductor moments found
among osteoarthritis patients could be a consequence of the disease presenting at the knee
joint (Foroughi et al., 2009). It has been previously suggested that higher knee external
adductor moments among more severe cases of osteoarthritis could be a consequence of
morphological changes such as cartilage loss and meniscus degeneration (Grainger &
Cicuttini, 2004).
The results from this current investigation among the mature females, however tend to
discount this possibility and maintain the initial theory suggesting the knee external
adductor moment as a possible risk factor for osteoarthritis occurrence. The results from
the examination of the knee joints indicated no loss of cartilage or joint space narrowing;
factors which could have increased knee joint varus/valgus positioning (Grainger &
Cicuttini, 2004). Similarly, all subjects were classified pain free, limiting the possibility
of pain induced malalignment. The supposed theory suggesting knee external adductor
moments as a possible consequence of knee osteoarthritis does not therefore seem
applicable here. This is further supported by one prospective study that showed knee
external adductor moment at baseline to be significantly correlated to initiation and
progression of knee joint osteoarthritis (Miyazaki et al., 2002). Therefore, the results from
the mature females alongside this prospective study tend to support the theory that the
knee external adductor could be a risk factor for osteoarthritis development and
progression.
6.4.5. Limitations
Within this magnetic resonance imaging study, several limitations were encountered.
Firstly, the results of the magnetic resonance imaging scans, and the overall indications of
osteoarthritis were based on a small sample size. Furthermore, of the ten participants that
volunteered, one set of data had to be excluded due to metal occlusion in the knee joint.
The difficulty in attaining volunteers was primarily due to a lack of desire to undertake a
scan, and the incidence of claustrophobia among many of the mature females. This

[333]
limitation is not unusual and has been encountered in previous studies involving magnetic
resonance imaging (Amin et al., 2005)
Secondly, the scans were only taken for the right knee of each participant, causing
inferences to be made on the overall condition of each mature female. This was however
based on the results from the biomechanical assessments, where data was only collected
for the right knee of each participant. Collecting data for both knees would have doubled
the scanning time, and could have lead to an additional drop in the number of volunteers.
Limitations were encountered in the positioning of the participant, and ability of each
female to remain still for the duration of the scans. Occasionally, the scans appeared
slightly blurred, indicative of movement within the magnet.
In addition, this study involved the use of a 1.5 T magnet, with T1 fat saturated images.
However, fast spin echo T2 fat saturated images are more reliable for showing bone
oedema, which could suggest that this lesion was present in the knees that were
categorised as free from this feature (Pessis et al., 2003). Despite this, bone oedema was
identified in three knees, and was therefore still included in the results.

[334]
6.5. Conclusion.
The overall findings from this magnetic resonance imaging study support the use of this
technique to identify early stage osteoarthritis among asymptomatic mature female
runners. Of the ten females that volunteered for participation, eight showed signs of early
stage osteoarthritis, with the results from one participant inaccessible, and one female
runner categorised as symptom free. These findings support the theories that osteoarthritis
is prevalent among the more active mature members of the female population. Although
non significant, a linear relationship between knee osteoarthritis and KOOS score
indicates a tendency for mature females to recognise pain, however all females were
categorised as symptom free. The significant relationship between knee osteoarthritis and
knee external adductor moment strongly supports the theory that, in high magnitudes, this
variable can lead to degradation of the knee joint. The diagnosis of each female within the
early stage of osteoarthritis development further supports this theory, suggesting that the
knee external adductor moment may be a contributing factor to the initial development of
the debilitating condition. Furthermore, the association between this biomechanical
variable and osteoarthritis shown in this current study could provide support for the use of
the knee external adductor moment as a possible diagnostic tool for early signs of the
condition in asymptomatic mature female runners.

[335]
Chapter 7. Summary and Conclusion.
Due to the number of people participating in running as a recreational or competitive
activity, there has been a proliferation of research regarding the mechanisms and potential
management techniques for running related injuries and conditions. The majority of these
methods involve the adaptation of biomechanical variables during gait, using the
influence of footwear control.
It has been suggested in the literature that certain aspects of running biomechanics are
associated with an increased risk for the development of running related injuries and
conditions, and this incidence is greater for women compared to men (Taunton et al.,
2002). Furthermore, it has been speculated that as the age of the runner increases, so too
does this risk (Verzijl et al., 2002). As such, this research project began by investigating
lower limb biomechanics in young and mature females to determine the influence of age
on running gait. The influence of a motion control shoe was then assessed in mature and
young females to reveal whether changes in footwear could positively influence lower
limb biomechanics. Alternative and combined footwear interventions were then assessed
to identify appropriate footwear devices specific for mature female runners, with the
potential to reduce the risk of overuse conditions and injuries. Finally, an MRI study
occurred to investigate the current condition of the knee joint among a select group of
mature female runners. This enabled further investigation of the association between
biomechanical variables of gait and the development of knee joint osteoarthritis.
7.1. A Biomechanical Comparison of the Running Gait of Mature and Young
Female Runners.
There has been a wealth of studies published to argue that biomechanical variables of
running are linked with injuries and overuse conditions (Sharma et al., 2001; Taunton et
al., 2002, Baliunas et al., 2002; Noehren et al., 2007). Specifically, rearfoot eversion and
the coupled movement of knee internal rotation have received a vast level of attention,
although the conclusions are still varied (Messier & Pittala, 1988; Hargrave. Carcia,

[336]
Gansneder, & Shultz, 2003). Additionally, considering osteoarthritis as an overuse
condition (Van Gent et al., 2007) the knee external adductor moment has been
consistently linked with its initiation, progression and development (Miyazaki et al.,
2003).
Study One was performed to directly compare the running gait of a group of young (18-
25 years) and mature (40-60 years) female runners. The experimental protocol was
selected, on which the methodology of all further studies would be based. Since running
is considered to be a bilaterally cyclic activity, for the purpose of this research it was
speculated that there was a symmetry between left and right legs (Zifchock et al., 2008).
Therefore both kinematic and kinetic data were collected for the right leg of each mature
female performing running trials at a controlled speed. An assumption continued
throughout each study of this research project was that rearfoot eversion can be
determined from placing markers on the surface of the shoe as opposed to directly on the
skin. It was therefore assumed that the foot does not move within the shoe, and that the
rearfoot eversion angle calculated was not affected by the lacing or the fit of the heel
around the calcaneum (Kilmartin et al., 1994).
Kinematic and kinetic analyses demonstrated that biomechanical measures could reveal
differences in gait associated with age. Specifically, it was shown that during the stance
phase of running, mature females display significantly greater magnitudes of peak loading
rate, rearfoot eversion angle, knee internal rotation angle, and knee external adductor
moment (p<0.05). Discussion and interpretation of these results suggested that these
parameters of gait could be a contributing factor to the high levels of injuries and
debilitating conditions among this specific group of mature female runners.
However a limitation of this investigation was highlighted in the footwear, with all
females performing trials in their own footwear. As footwear variations have been shown
to affect parameters of gait, it was deemed necessary to assess this difference in a
controlled neutral shoe. A summary of conclusions based on the results form Study One
are presented below:
The running gait of mature and young females can be identified using three
dimensional gait analysis.

[337]
Significant differences exist in the biomechanics of running gait between young
and mature females.
Certain biomechanical features associated with mature female runners could
predispose this group to running related injuries and conditions.
7.2. The effect of motion control shoes on the biomechanical running gait of mature
and young female runners.
Study Two employed a similar methodology to that used in Study One, with a direct
comparison between the running gait of mature and young females initially performed.
However within this assessment, a controlled neutral shoe was worn by each participant
to remove the possible effect of variations in footwear. In addition, a currently available
motion control shoe was included to investigate the ability of footwear to control
biomechanical variables of gait. Additional measures such as muscle strength and knee
joint stiffness were also analysed to quantify and further explore gait and injury risk
differences between the two groups. It was hypothesised that the neutral shoe would show
differences in gait between the two groups similar to those found in Study One, and knee
joint stiffness would be higher among the mature group. Secondly, it was hypothesised
that the strength of the quadriceps femoris muscle would be lower among the mature
group. Thirdly, it was hypothesised that the motion control shoe would reduce rearfoot
eversion and knee internal rotation, and could therefore act as a method of injury
management among the mature group. Finally, it was hypothesised that the motion
control shoe would increase the knee external adductor moment during the stance phase
of gait.
The neutral shoe was found to yield significantly greater rearfoot eversion, knee internal
rotation, peak loading rates of impact force and knee external adductor moments among
the mature group. The inclusion of a motion control shoe significantly reduced the
rearfoot eversion and knee internal rotation angles among the mature group, although no
difference was seen in the loading rate of impact force or the knee external adductor
moment among either group. The assessment of muscle strength elicited no significant

[338]
difference between the two groups. Knee joint stiffness was however shown to be
significantly greater among the mature group.
Discussion and interpretation of these findings lent support to Study One, substantiating
previous suggestions that certain parameters of running gait change with age. Irrespective
of footwear, mature female runners appear to adopt a running style that could predispose
them to injuries and the development of debilitating conditions at the knee joint
The increase in knee joint stiffness displayed by the mature group lends support to the
theory that this group is at an increased risk of developing debilitating condition at the
knee joint (Griffin & Guilak, 2005). The ability of a motion control shoe to reduce
rearfoot eversion and knee internal rotation supports previous research that concludes
footwear modifications to play an important role in injury management (Rose et al.,
2011). The significant reduction in rearfoot eversion and knee internal rotation among the
mature group contests the theory that mature people are less responsive to footwear
adaptations compared to younger individuals (Kakihana et al., 2007). Furthermore the
biomechanical changes demonstrated with the use of a readily available running shoe
could provide valuable insight into possible methods of reducing the injury risk
associated with increasing age. These results support the use of gait analysis for footwear
recommendations among the mature female runners, and lend support to the use of
motion control shoes in reducing subtalar joint pronation.
Given that the knee external adductor moment was not affected by the use of a motion
control shoe, yet this variable is commonly associated with the development of
debilitating conditions such as osteoarthritis, further investigation was required to
determine whether this variable can be reduced with variations in support underfoot.
Summary conclusions:
In a controlled neutral shoe, mature females display significantly different
biomechanics of running gait compared to a younger group.
The use of a currently available motion control shoe significantly reduced rearfoot
eversion and knee internal rotation among the mature female runners.
The motion control shoe did not affect the knee external adductor moment among
either group of runners.

[339]
Current motion control shoes are not sufficient to control for all aspects of gait
specific to mature female runners that could predispose to overuse conditions.
7.3. The effect of medial and lateral wedges and an orthotic intervention on the
running gait of mature female runners.
Study Three was developed based on the results from the previous two investigations. It
had consistently been shown that mature females illustrated variables of gait that could
predispose to injuries and conditions. Although the use of a current motion control shoe
was shown to reduce peak rearfoot eversion and knee internal rotation compared to a
neutral shoe in both young and mature females, the knee external adductor moment was
considered to remain a high risk factor for the development of medial compartment knee
joint osteoarthritis. In addition, the knee external adductor moment has also been linked
with the development of other conditions, such as injury to the meniscus of the knee joint
(Davies-Tuck et al., 2008), which in turn increases the risk of developing medial knee
joint osteoarthritis in the future. This therefore substantiates the need to identify methods
of reducing the knee external adductor moment.
The use of a medial wedge was hypothesised to produce changes similar to those shown
by the motion control shoe in Study Two. In contrast the inclusion of a lateral wedge was
expected to reduce the knee external adductor moment, due to the previously shown
association between lateral wedge and reductions in this moment (Crenshaw et al., 2000).
The additional intervention orthotic was included based on the results of Study One and
Study Two, including both a medial and lateral wedge. It was therefore hypothesised that
the medial wedge would produce reductions in the rearfoot eversion and knee internal
rotation angles, and the lateral wedge would reduce the knee external adductor moment. It
was hypothesised that the orthotic intervention would significantly reduce all three
variable of gait.
Results and discussion showed little effect of the 6 mm lateral and medial wedges on the
kinematics of running gait among mature female runners. As speculated within the
discussion of Study 2, although not extensively reported within the literature, it is

[340]
possible that the level of support in the current running shoes worn regularly by each
individual, and differences in individual biomechanical characteristics may have
influenced the biomechanical responsiveness to different footwear interventions.
However the intervention orthotic was shown to significantly reduce the rearfoot
eversion, knee internal rotation and the knee external adductor moment during the stance
phase of gait. This suggests that a combined effect of lateral wedging with medial arch
support could be an appropriate intervention to reduce the risk of debilitating conditions
among mature female runners.
Summary conclusions:
A 6mm medial wedge based in the heel of the shoe did not significantly alter the
biomechanics of running gait among a group of mature female runners.
Although no change in kinematics was found with the 6mm lateral wedge, this
intervention did significantly reduce the knee external adductor moment among
mature female runners.
An orthotic intervention incorporating both a medial and lateral wedge
significantly reduced rearfoot eversion, knee internal rotation, and the knee
external adductor moment among mature female runners.
A combined intervention including both medial and lateral wedge technology may
be appropriate to reduce injuries and overuse conditions among mature female
runners.
7.4. The use of MRI scanning to identify osteoarthritis of the knee joint among
mature female runners and associations with the knee external adductor moment.
The fourth study of this research thesis was included to assess the presence of
osteoarthritis among a selection of mature female runners. It has been postulated that a
poor link exists between the development of knee joint osteoarthritis and the development
of symptoms (Ehrman et al., 2003). As such, the knees of a group of mature female
runners were scanned using the magnetic resonance imaging techniques.

[341]
Results illustrated 8 from the 9 mature female runners to exhibit a minimum of one sign
of early stage osteoarthritis, based on the presence of physiological changes within the
joint. This therefore supports the use of this method in identifying early stages of the
condition among asymptomatic individuals. Correlation tests between these results and
the knee external adductor moment lent support to the association between high moments
and osteoarthritis development among mature female runners. As such it was suggested
that the biomechanics adopted by a group of mature female runners could lead to the
initiation of debilitating conditions at the knee joint, even prior to the onset of symptoms.
These results therefore lend support to earlier suggestions that footwear interventions are
recommended as a method for injury management among the mature members of the
female running population. Similarly, due to the strong association between the knee
external adductor moment and the presence of early stage osteoarthritis at the knee joint,
it is proposed that assessment of this variable using three dimensional gait analysis
techniques could be implemented as a tool in early detection of the degenerative
condition.
Summary conclusions:
Although the KOOS survey showed all females to be free from symptoms of
osteoarthritis, the results from an MRI scan showed 8 out of 9 mature female
runners to present signs of early stage osteoarthritis.
The significant correlation between the knee external adductor moment and the
identified signs of knee joint osteoarthritis supports this variable as an indication
of joint loading, and a possible tool in diagnosis of early stages of the condition.

[342]
7.5. Summary and future direction.
The main purpose of this research project was to investigate biomechanical changes in
running style among the mature members of the female population. Due to the lack of
research regarding this specific group of runners, the results from this project increase the
area of knowledge regarding the link between age and injury or osteoarthritis risk.
Understanding the role of footwear in injury management methods is vital, due to the
effect on the kinematics and kinetics during motion and the accessibility of this
intervention. The results from this project lend support to the theory that footwear
interventions can alter biomechanical variables of running gait among a mature group.
Furthermore, the promising results from the third study suggest that an intervention
orthotic incorporating both medial arch support and a lateral wedge is appropriate to limit
the risk of injuries and conditions associated with the gait of mature female runners.
Although the results do not directly support footwear as an injury prevention method, the
abundance of literature that has associated certain biomechanical features of gait with
injuries lends support to the theory.
Future research within this area is required to investigate the possible causative factors
leading to the changes in running biomechanics among mature females. Although the
physiological variable of muscle strength was assessed, and the concept of hormonal
fluctuations was speculated upon, an increased depth of research is required. Furthermore,
within the specific field of osteoarthritis, future research is required among mature female
runners to compare between those free from osteoarthritis and those diagnosed with early
or variations in the stage of the condition, to further assess the effect on the
biomechanical variables of running gait. Longitudinal research is also required, to assess
the strength of relationship between the identified variables of gait, and the development
of injuries and conditions over time.
In terms of footwear development, results from the mature females elicited promising
inferences. Although motion control shoes currently exist to reduce subtalar joint
pronation among runners, this intervention does not appear sufficient for the mature
female runners, to control for the knee external adductor moment. Within the running
industry, at present the categories of footwear include the groups; males, females, and
children. Conclusions drawn from this study suggest that the current range of footwear

[343]
may not accommodate for all biomechanical changes in running gait that occur with
increasing age among the female population. Furthermore, among the mature females in
the current study, biomechanical movement patterns have been shown to change
throughout the stance phase of gait, suggesting variable support is required in different
areas of the shoe sole. As a cohort of runners comprising high numbers, it is suggested
that mature female runners would benefit from specific footwear interventions that would
reduce the likelihood of developing overuse injuries and conditions. It is proposed that
footwear companies give consideration to the development of an additional category of
running shoe.

[344]
APPENDIX
PAGE
Appendix A Peak Vicon Accuracy Study 345
Appendix B Sample Knee Osteoarthritis Observation Survey 361
Appendix C Study 1 Individual Data 368
Appendix D Sample Statistical Power Analysis Report 370
Appendix E Study 2 Individual Data 372
Appendix F Study 3 Individual Data 376

[345]
Appendix A: Peak Vicon Accuracy Study.
Introduction and Literature Review.
Introduction.
Within the domain of scientific analysis, the quality of the data achieved is measured
against a number of factors; accuracy, relevance, timeliness, completeness, trust and
accessibility (Olsen, 2003). Data accuracy is a measurement of error, and is therefore the
dimension that formulates the foundation of data quality. In all applications of scientific
measurement, the reproducibility and accuracy of the method must be established in order
to enable meaningful contribution (Eston & Reilly, 2001). Assessing and making large
improvements in data accuracy and the quality of information from the data can however
only be accomplished through proactive activities. Therefore, within biomechanical
research, accuracy assessments are essential, as without highly accurate data, information
quality cannot be achieved (Olsen, 2003).
Movement Analysis.
The most commonly used gait tool in the clinical setting is observational gait analysis
(Montgomery & Connolly, 2002). This application requires systemic observation of each
body segment throughout each phase of gait, and has a number of limitations (Chapter 2).
When in combination with one or more force platforms, three dimensional motion
analysis systems provide the main implement in gait analysis (Lewis, Stewart, Postans &
Trevelyan, 2007). Analysis of gait was traditionally used as a research tool; however the
impetus to diagnose and objectively document the benefits of medical intervention has
resulted in a reliance on such analysis as a clinical diagnostic tool (Skinner, 1995). The
assessment and publication of normal data allows for definition of pathological gait, and
analysis in a gait laboratory can assess initial deviation from “normal” values. Therefore,

[346]
as an increasingly common procedure in the diagnosis of movement disorders, and as a
major determinant of important clinical decisions, confidence in the quality of gait
assessment is essential. These systems therefore require regular monitoring to detect
changes in performance; a possible consequence of sudden changes such as camera
failure or slow deterioration (Lewis et al., 2007).
The worthwhile application of data collected through gait analysis is therefore dependent
on the resulting accuracy and precision of the testing system (Payton & Bartlett, 2008).
During motion analysis, measured values invariably differ from the actual values; they
contain errors. Therefore, quantification of the errors in a measurement is essential, to
ensure the certainty with which a statement about the results of an analysis is known
(Payton & Bartlett, 2008).
Calibration.
The process of calibration involves comparing an instrument’s performance to a standard
of known accuracy; to assess and document any deviation from this known standard. For
any system collecting kinematic data, a suitable means of calibration must be used to
ensure the image co-ordinates are correctly scaled to size (Robertson, Caldwell, Hamill,
Karren, & Whittlesey, 2004). Although errors cannot completely be eliminated, regular
calibration checks are essential to minimise the potential errors in a measurement;
forming part of a quality assurance programme (Lewis, et al., 2007). Without calibration,
it is impossible to measure distances accurately (Whittle, 2003). The calibration process
exploits a model or calibration frame which is viewed by all the cameras. Computer
software is then used to calculate the relationship between the known three dimensional
position of the markers on the frame, and the two dimensional positions of those markers
in the fields of view of the different cameras (Whittle, 2003). For two dimensional data
analysis, a calibrated ruler is placed in the plane of motion, and its known length
digitised. However, within three dimensional data multiple cameras are employed, and a
set of “control points” are established whose exact coordinates are known (Robertson et
al., 2004). As suggested, calibration does not eliminate, but minimises error in

[347]
measurement, and within calibration of a motion analysis system, the control point
positions are not known to 100% accuracy (Payton & Bartlett, 2008).
Error.
Performance of motion capturing systems strongly depends on their setup and is highly
sensitive against alterations (Windolf, Gotzen, & Morlock, 2008). During data collection,
performance errors arise through various situations including marker propertied and
camera configuration (Furnee, 1991). Analysis of error is fundamental to the design of
any instrument; an understanding of the source of error enables insight into the nature of
the scientific measurement under analysis (Kamm, 1995). Both two-dimensional as well
as three-dimensional analyses are subject to error (Ackland, Elliott, & Bloomfield, 2008).
Initially, research into the errors associated with the three-dimensional system has
primarily focussed on the comparison between opto-reflective and video-based systems
(Ackland et al., 2008). However, it is well known that several error sources exist
associated with both kinematic and kinetic data analysis, often attributed to limitations of
the hardware and software capabilities (Dorocjak & Cuddeford, 1995). In general, error is
introduced due to the process used to collect data (Grimshaw, Less, Fowler, & Burden,
2007). System performance errors include camera resolution and placement which affect
the quality of the image.
An additional common source of error is that due to a change in condition at the time of
acquisition compared with when calibration occurred (Whittle, 2003). Finally, other
sources of error can include skin movement, mathematical model assumptions and marker
placement (Dorocjak & Cuddeford, 1995). According to Kamm et al., (2007), errors
during data collection for motion analysis can be categorised into image recording errors,
digitising errors and timing errors. Image recording errors include foreshortening error,
depth error and obliquity error, suggesting the image is portrayed as smaller, greater or
more blurred at the edges than in its true form. Digitising error refers to point location
error, where difficulty exists in identification of reference points and joint centres.
Additionally, resolution errors occur, due to the ability of the digitising system to resolve,

[348]
the image size, and the size of the field of view. Finally, timing errors generally arise due
to the timing mechanism used, and the timing error, for example, heel strike in running
can only be judged to ±1 frame (Kamm et al., 2007). The overall effect of the above
errors is a general inexactness with which any single point can then be estimated.
Quantification of this error is therefore required via an assessment of the accuracy of the
system. The main aim of this study is therefore to assess the level of accuracy of the Peak
Vicon Optical Capture System in the University of Exeter Biomechanics Research
Laboratory.

[349]
Methods.
Introduction to methods.
Accuracy is assessed through a comparison between known and measured values; during
image-based motion analysis, accuracy is reported as the difference between the true
location of the control points and their predicted values (Payton & Bartlett, 2008). The
control points utilised in this assessment are however different from those used during the
calibration process. According to Challis and Kerwin (1992), to obtain a true estimation
of accuracy, an independent assessment criterion is required as utilisation of the same
points greatly overestimates accuracy. Therefore a frame or accuracy model is utilised
specific for the accuracy assessment. The performance of three dimensional measurement
tools is quantified with both static and dynamic tests (Scheirman and Aoki 1999), the
former assesses accuracy from stationary points within a specified space, and the latter
from moving points. Within this study, both methods will be employed and results
analysed separately.
Calibration.
In advance of the accuracy assessment procedure, the eight cameras employed in the
motion analysis system were calibrated. Four retroreflective markers, arranged in an L
shape on a frame placed on the floor, were used for setting up the Vicon coordinate
system at static calibration (Windolf et al., 2008). The frame covered an operation
volume of 1.0 by 0.5 by 0.75 m3. It was essential that all markers were in view of each
camera to be calibrated. Following this setup phase, a calibration wand was used, with
two fixed markers placed 0.913m apart. This wand was then oscillated in the field of view
of all cameras, within the area outlined by the static frame. Data was collected for 120
seconds, with the wand moving throughout the entire cubic area. Once the system was

[350]
successfully calibrated, the newly calibrated template was imported into a template
prepared for the accuracy assessment procedure.
Static Assessment.
The static accuracy assessment took place in the biomechanics research laboratory at the
University of Exeter. This assessment involved the use of a modified multi-arm frame
(Figure A.1) situated in the field of view of all 8 cameras. As illustrated in Figure A.1,
this frame included 16 reflective markers or spheres of known coordinates, located along
8 rods. The cameras were kept stationary while the multi-arm frame was videoed. The
calibration frame with four retro reflective markers arranged in an L shape, was once
again used, increasing the ease of marker identification during the data processing stage.
Figure A.1. Illustration of the Multi-Arm Frame used in the static Accuracy Assessment.
3C
3B
2B
2C 6C
6B
7B
7C
8C
8B
5B
5C 4B
4C
1B
1C

[351]
The view from each camera was checked, ensuring the frame was visible. The presence of
additional unknown markers was assessed; any apparent were minimised through
reduction of light and eclipsing reflective areas. Following the setup phase, with all
cameras turned on and all markers in the field of view of each, the data collection phase
was instigated. The recording lasted a total of 5 seconds, with no movement in the field
of view. The Peak Vicon software was used to transfer images recorded from each
camera, and present raw data on the computer. The template used in the Vicon system
was specifically designed for the static accuracy assessment, therefore enabling each
marker to be assigned its correct label. The paths were then identified manually, ensuring
each marker was represented with its specific label and subsequent coordinates.
Transformed co-ordinates were then assessed. The coordinates of each marker were
calculated relative to the origin (0,0). Data were then compared to a table of accurate
coordinates for each marker in the x, y, and z directions.
Dynamic Assessment.
Similar to the static assessment, the dynamic assessment of the accuracy of the Vicon
motion analysis system took place in the research laboratory at the University of Exeter.
In contrast to the static assessment, a wand was moved within the field of view during
data collection. This procedure involved the use of a 1 meter long black aluminium bar
with matte finish. A marker was attached at each end of the 0.913m calibration wand. The
exact distance was measured prior to the measurement, to ensure no unwanted marker
movement had occurred. Similar to the static assessment, the L shaped calibration frame
was positioned on the floor to increase the ease of marker identification and direction of
camera view. Once again, a template specifically designed for the dynamic accuracy
assessment was opened, and the newly calibrated template was imported. The view from
each camera was checked to ensure the calibration frame markers were clearly visible,
and any unwanted reflections were minimised. The dynamic accuracy assessment then
occurred in the three planes of motion; Vertical (z), Horizontal (y) and Transverse (x).

[352]
The measurement of accuracy in the vertical direction was the first determined. The
aluminium bar was held in the subject’s hand, ensuring their forearm was parallel with
their torso. A cardanic joint was attached to the centre of the wand, allowing free
oscillation during data collection. Using this joint, the wand was then moved in the
vertical direction, with minimal deviations in either the x or y planes of motion. The wand
was moved an approximate distance of 0.3meters, with data collected for a total of 5
seconds. This test was then performed four more times, collecting a total of five separate
sets of data to improve reliability.
The measurement of accuracy in the direction of motion across the force plate (y) was
then determined. The subject walked along the field of view of the cameras, holding the
wand by the joint, in the same position as was described for the vertical test. The subject
walked forwards and backwards at an extremely slow pace, to ensure the wand was in the
field of view of the cameras for all 5 seconds of data collection. Once again, this test was
then performed four more times, producing 5 sets of data.
Finally, measurement of accuracy in the medio-lateral direction (x) direction was
determined. The subject once again positioned the wand, their forearm parallel to their
torso, and walked across the plate in the x direction with the wand held out in front.
Again, movement in the z and y directions was kept as minimal as possible. Data was
collected for 5 seconds, with all markers in the field of view for the entire duration. As
occurred for the two previous dynamic accuracy tests, a total of 5 different tests occurred,
producing 5 consecutive sets of data. All data from each test performed in this accuracy
assessment was then transferred into an excel spreadsheet, and calculations to determine
the distance between the markers were performed.

[353]
Root Mean Square Error.
Following completion of the data collection stage, a series of mathematical and statistical
calculations were completed to process and apply the results. A main method for
assessing the accuracy of a system is through the arithmetic error; the mean difference
between the measured and the true values. Although this method does provide
information regarding the system accuracy, it is not without fault, as both negative and
positive values within the data can cancel one another out (Payton & Bartlett, 2008). The
preferable measure of accuracy is the root mean square error as it is the most conservative
of the criterion (Payton & Bartlett, 2008). This measurement statistic for accuracy was
similarly used in an early research study by Challis and Kerwin (1992), and is calculated
through taking many measurements of a point location (Scheirman & Aoki, date).
√∑(X-α)2/(n-1)
Equation A1.
Where:
X = Measured Value
α = True Value
n = Number of times measurement was taken
The above algebraic equation describes the process for determining the root mean square
error of a data set. The value achieved describes the overall residual error between data
points, highlighting the accuracy of the measurement system (Mow & Huiskes, 2004).

[354]
Results.
Static Accuracy Assessment.
Within the static assessment of accuracy, a series of five consecutive data sets were
produced from five individual tests. These data were then transferred into an excel
spreadsheet and analysed. Three coordinates (x, y, and z) were produced for each marker;
each measured relative to the assigned origin (0,0). The data were then compared with
known true values. Two tables of results are presented, indicating the measured values
and the standard expected coordinate values (Table A.1), and the calculated root mean
square errors (Table A.2).
Table A1. Summary table of results from the static accuracy assessment, illustrating
calculated and known coordinates of each marker.
ROD
X COORDINATE
(mm)
Y COORDINATE
(mm)
Z COORDINATE
(mm)
NUMBER MARKER Measured
Value
Real
Value
Measured
Value
Real
Value
Measured
Value
Real
Value
1 B 0.349 0.3446 0.4817 0.4813 0.4223 0.4224
C 0.594 0.5920 0.8262 0.8268 0.7232 0.7232
2 B 0.3408 0.3408 0.4784 0.4783 1.504 1.5042
C 0.5913 0.5913 0.8264 0.8265 1.22 1.2100
3 B 0.3396 0.3395 1.7445 1.7446 1.54002 1.54002
C 0.5908 0.5908 1.3949 1.3949 1.208 1.2080
4 B 0.345 0.3449 1.737 1.7370 0.4212 0.4211
C 0.5915 0.5918 1.3934 1.3934 0.722 0.7220
5 B 1.2415 1.2414 1.7393 1.7393 0.4202 0.4201
C 0.996 0.9962 1.3934 1.3934 0.7215 0.7214
6 B 1.2407 1.2484 1.75 1.7438 1.5022 1.5022
C 0.9976 0.9988 1.393 1.3950 1.209 1.2090
7 B 1.2428 1.2428 0.4771 04770 1.505 1.5044
C 0.9988 0.9988 0.8253 0.8253 1.2096 1.2095
8 B 1.2427 1.2428 0.479 0.4791 0.4223 0.4223
C 0.9968 0.9967 0.9967 0.9967 0.7232 0.7232

[355]
Table A2. Summary table of the root mean square errors across all markers along each
axis.
Root Mean Square Error (RMSE) (m)
X Y Z
0.002 0.001 0.002
Dynamic Accuracy Assessment.
Within the dynamic assessment of accuracy, five consecutive trials were achieved in each
direction of motion (x, y, and z). The average value produced from a total of 5 seconds of
data collection was calculated and compared to the real value (0.913). These data are
summarised in Table A.3, illustrating average results. Root Mean Square Error
calculations then occurred to determine how close the data produced was to the true
values (Table A.4). A demonstration of this root mean square error result is demonstrated
in the graph, illustrating the fit between the calculated data line and the standard. Figure
A.2 presents a sample data set in graphical form. The line graph shows data collected in
the vertical (z) direction on trial 3. The calculated wand length is plotted against the
standard length, illustrating minimal deviations.
Table A3. Summary table of results from the dynamic accuracy assessment. Values report
distance measured between coordinates of two markers.
TRIAL
NUMBER
REAL
DISTANCE
(m)
WAND MOVEMENT IN DIRECTION
X Y Z
1
0.913
0.913 0.915 0.914
2 0.91 0.912 0.910
3 0.910 0.911 0.912
4 0.912 0.913 0.91
5 0.915 0.910 0.912
AVERAGE 0.912 0.912 0.911

[356]
Table A4. Summary table of the root mean square errors (m).
TRIAL X RMSE Y RMSE Z RMSE
1 0.913 <0.0005 0.915 0.009 0.914 0.001
2 0.91 0.003 0.912 0.002 0.910 0.003
3 0.910 0.003 0.911 0.003 0.912 0.002
4 0.912 0.002 0.913 <0.0005 0.91 0.003
5 0.915 0.009 0.910 0.003 0.912 0.002
Comparison of Calculated and Real Wand Length
0.8
0.82
0.84
0.86
0.88
0.9
0.92
0.94
0.96
0.98
1
0
0.1
9
0.3
8
0.5
8
0.7
7
0.9
6
1.1
5
1.3
4
1.5
3
1.7
3
1.9
2
2.1
1
2.3
2.4
9
2.6
8
2.8
7
Time (Seconds)
Dis
tan
ce b
etw
een
mark
ers
(Met
ers)
Calculated Distance
Real Distance
Figure A.2. Sample line graph illustrating comparison between calculated and real wand
length. Data taken from trial 3 in the dynamic accuracy assessment with wand movement
in the Z direction.

[357]
Discussion and Conclusion.
Static Accuracy Assessment.
The principle aim of the current study was to assess the accuracy of the Peak Vicon
Optical Capture System within the University of Exeter Biomechanics Research
Laboratory. Two separate tests were performed; a static and a dynamic assessment, and
the errors associated with both were investigated. Within the static assessment of
accuracy, three-dimensional coordinates of 16 stationary reflective markers were
calculated. A modified multi-arm frame was employed, as illustrated in the methods
section, and the locations of markers along each rod (arm) were calculated in relation to
the origin sphere. Mean difference of the measured coordinates compared with the true
values were computed and the root mean square errors (RMSE) were assessed. This
statistic measures both the deviation and consistency of results, and provides a clear
indication of the accuracy of the measurements. Greater values are associated with higher
deviations, relating to decreased accuracy (Schmidt & Lee, 1999). In this study, root
mean square error of 0.002, 0.001 and 0.002 in the X, Y and Z directions respectively
were found for reconstruction accuracy of fixed test points in the calibrated volume.
These results compare well to those presented by Scheirman and Aoki (1999), who
similarly assessed the accuracy of the Peak Optical Motion Capture System. The RMSEs
presented in their results were reported as 0.001, 0.002 and <0.0005 in the X, Y and Z
directions respectively. Additionally, when assessing the accuracy of the larger (in
comparison to the current study) 6.6m3 volume, Coleman and Rankin (2005) illustrated
root mean square errors of 0.007, 0.009 and 0.005 in the X, Y and Z directions
respectively following a static assessment with a calibration frame. Finally, the results
from the present study suggest a high level of accuracy was achieved, when compared to
data from the research of Challis (1995). This study reported root mean square errors
ranging from 0.006 to 0.023 in the similar coordinates measured; higher values than those
reported in the present study.
Subsequently, the results from the static accuracy assessment performed in the present
study combined with the weight of the research, suggests the peak vicon optical capture

[358]
system produced data with a high level of accuracy. With a maximum difference of only
3mm, compared with 20mm previously reported by other researchers, the system is
suggested accurate for the purpose of the data collection methods.
Dynamic Accuracy Assessment.
The data achieved from the dynamic accuracy assessment produced evidence of system
performance and identified possible failures (Lewis et al., (2007). This notion is
supported by Sheirman and Aoki, (1999) who stated dynamic accuracy assessments to
reveal errors occurring from movements. It is therefore essential to determine the inherent
error and overall accuracy of any experimental procedure (Anderson, 2009). The dynamic
accuracy analysis in this study was carried out within an observation volume as typically
used for biomechanical applications investigating motion magnitudes (Windolf, et al.,
2008). This test was employed to assess the accuracy of the Peak Vicon Motion Analysis
system involved the use of an aluminium wand, affixed with a reflective marker at each
end. This wand was then moved in the three planes of motion (x, y and z), producing
three separate sets of data. Within each data set, the coordinates of the markers were
identified, and the measured distance between the two calculated. This figure was then
compared to the standard known length of the wand (0.913m), and the presence of
differences assessed. The calculated magnitude of the differences between figures then
produced an indication of the accuracy of the system.
The root mean square errors of the results from each trial are expressed in Table A.4 in
the results section. The mean RMSE for each coordinate, X, Y and Z are illustrated,
suggesting an estimation of the overall accuracy of the system for moving points. As
illustrated, the average RMSE range from 0.002 to 0.003, with mean errors of 3mm, 3mm
and 2mm in the X, Y and Z direction. These results are similar to those suggested in the
literature regarding the static accuracy assessments, and were once again lower than the
results of the study performed by Coleman and Rankin, (2005), suggesting a higher level
of accuracy. Furthermore, when compared with results of an earlier study performed by
Ehara, Fujimoto, Miyazaki, Mochimaru, Tanaka, and Yamomoto (1997), the results from

[359]
the present study once again indicate a high level of accuracy. Within their investigation,
Ehara et al., (1997) demonstrated errors ranging from 4mm to 8.5mm, when dynamically
assessing the Vicon Optical Motion Capturing System in the three coordinates of
movement, X, Y and Z. Therefore, with one maximum error value of 9mm, and an
average of 3mm, the values in the present study suggest an acceptable level of accuracy
achieved.

[360]
Conclusion.
Three dimensional motion analysis systems are widely used clinical tools. When in
combination with one or more force platforms, these systems provide the main implement
in gait analysis. This study was conducted to examine the accuracy of observational
methods for analysis of the lower limb during running gait. The data presented above
suggests that the Peak Vicon Optical Motion Capturing System worked effectively,
producing accurate data with minimal error. As suggested, no motion capturing system
can work perfectly; a degree of error will always be present. The presence of error causes
the measured values to invariably differ from the actual true values; however it is the
magnitude of the errors that determines the accuracy of the system. Although the results
combined with the weight of the research suggest the system under investigation
produced effectively accurate data, errors still exist.
Attributes such as marker roundness or disfigurement, reflective capacity, optical
contrast, lighting conditions, calibration velocity and duration, and size of the field of
view may all affect measuring error (Windolf et al., 2008). Within their assessment of
accuracy, Windolf et al., (2008) revealed larger markers to significantly increase the level
of accuracy and precision of the motion capturing system, with each marker size
establishing a statistical subset. Additionally, within the dynamic assessment, although
kept as constant as possible, manual wand motion remains uncontrolled. The use of an
automated calibration procedure may therefore increase the accuracy due to a more
consistent calibration path (Windolf et al., 2008).
In order to assess the effect of such error present in the motion analysis system, future
research should involve the performance of a sensitivity study. This will determine what
effect the maximum possible error will have on data achieved. However, through
comparisons with previous studies, it is suggested that outcome data from this system is
accurate for the purpose of biomechanical evaluation of lower limb motion during
running.

[361]
Appendix B
Knee and Osteoarthritis Outcome Score (KOOS), English version LK1.0 1
KOOS KNEE SURVEY
Todays date: _____/______/______ Date of birth: _____/______/______
Name: ____________________________________________________
INSTRUCTIONS: This survey asks for your view about your knee. This
information will help us keep track of how you feel about your knee and how
well you are able to do your usual activities.
Answer every question by ticking the appropriate box, only one box for each
question. If you are unsure about how to answer a question, please give the
best answer you can.
Symptoms
These questions should be answered thinking of your knee symptoms during
the last week.
S1. Do you have swelling in your knee?
Never Rarely Sometimes Often Always
o o o o o
S2. Do you feel grinding, hear clicking or any other type of noise when your
knee
moves?
Never Rarely Sometimes Often Always
o o o o o
S3. Does your knee catch or hang up when moving?
Never Rarely Sometimes Often Always
o o o o o
S4. Can you straighten your knee fully?

[362]
Always Often Sometimes Rarely Never
o o o o o
S5. Can you bend your knee fully?
Always Often Sometimes Rarely Never
o o o o o
Stiffness
The following questions concern the amount of joint stiffness you have
experienced during the last week in your knee. Stiffness is a sensation of
restriction or slowness in the ease with which you move your knee joint.
S6. How severe is your knee joint stiffness after first wakening in the
morning?
None Mild Moderate Severe Extreme
o o o o o
S7. How severe is your knee stiffness after sitting, lying or resting later in
the day?
None Mild Moderate Severe Extreme
o o o o o
Pain
P1. How often do you experience knee pain?
Never Monthly Weekly Daily Always
o o o o o
What amount of knee pain have you experienced the last week during the
following ativities?
P2. Twisting/pivoting on your knee
None Mild Moderate Severe Extreme
o o o o o
P3. Straightening knee fully

[363]
None Mild Moderate Severe Extreme
o o o o o
P4. Bending knee fully
None Mild Moderate Severe Extreme
o o o o o
P5. Walking on flat surface
None Mild Moderate Severe Extreme
o o o o o
P6. Going up or down stairs
None Mild Moderate Severe Extreme
o o o o o
P7. At night while in bed
None Mild Moderate Severe Extreme
o o o o o
P8. Sitting or lying
None Mild Moderate Severe Extreme
o o o o o
P9. Standing upright
None Mild Moderate Severe Extreme
o o o o o
Function, daily living
The following questions concern your physical function. By this we mean
your ability to move around and to look after yourself. For each of the
following activities please indicate the degree of difficulty you have
experienced in the last week due to your knee.

[364]
A1. Descending stairs
None Mild Moderate Severe Extreme
o o o o o
A2. Ascending stairs
None Mild Moderate Severe Extreme
o o o o o
For each of the following activities please indicate the degree of difficulty
you have experienced in the last week due to your knee.
A3. Rising from sitting
None Mild Moderate Severe Extreme
o o o o o
A4. Standing
None Mild Moderate Severe Extreme
o o o o o
A5. Bending to floor/pick up an object
None Mild Moderate Severe Extreme
o o o o o
A6. Walking on flat surface
None Mild Moderate Severe Extreme
o o o o o
A7. Getting in/out of car
None Mild Moderate Severe Extreme
o o o o o
A8. Going shopping
None Mild Moderate Severe Extreme
o o o o o

[365]
A9. Putting on socks/stockings
None Mild Moderate Severe Extreme
o o o o o
A10. Rising from bed
None Mild Moderate Severe Extreme
o o o o o
A11. Taking off socks/stockings
None Mild Moderate Severe Extreme
o o o o o
A12. Lying in bed (turning over, maintaining knee position)
None Mild Moderate Severe Extreme
o o o o o
A13. Getting in/out of bath
None Mild Moderate Severe Extreme
o o o o o
A14. Sitting
None Mild Moderate Severe Extreme
o o o o o
A15. Getting on/off toilet
None Mild Moderate Severe Extreme
o o o o o
For each of the following activities please indicate the degree of difficulty
you have experienced in the last week due to your knee.
[366]
A16. Heavy domestic duties (moving heavy boxes, scrubbing floors, etc)
None Mild Moderate Severe Extreme
o o o o o
A17. Light domestic duties (cooking, dusting, etc)
None Mild Moderate Severe Extreme
o o o o o
Function, sports and recreational activities
The following questions concern your physical function when being active
on a higher level. The questions should be answered thinking of what degree
of difficulty you have experienced during the last week due to your knee.
SP1. Squatting
None Mild Moderate Severe Extreme
o o o o o
SP2. Running
None Mild Moderate Severe Extreme
o o o o o
SP3. Jumping
None Mild Moderate Severe Extreme
o o o o o
SP4. Twisting/pivoting on your injured knee
None Mild Moderate Severe Extreme
o o o o o
SP5. Kneeling
None Mild Moderate Severe Extreme
o o o o o

[367]
Quality of Life
Q1. How often are you aware of your knee problem?
Never Monthly Weekly Daily Constantly
o o o o o
Q2. Have you modified your life style to avoid potentially damaging
activities to your knee?
Not at all Mildly Moderatly Severely Totally
o o o o o
Q3. How much are you troubled with lack of confidence in your knee?
Not at all Mildly Moderately Severely Extremely
o o o o o
Q4. In general, how much difficulty do you have with your knee?
None Mild Moderate Severe Extreme
o o o o o
Thank you very much for completing all the questions in this
questionnaire.

[368]
Appendix C: Study One Individual Results.
C.1. Individual Q angle data for mature and young female runners (Study 1).
Participant
Q Angle
Young Mature
1 5.477 1.386
2 6.74 2.506
3 0.346 25.873
4 2.997 19.42
5 26.674 9.41
6 1.48 10.48
7 9.675 4.64
8 3.75 2.912
9 0.36 4.096
10 8.64 13.65
11 5.635 11.46
12 6.94 8.736
13 9.75 2.313
14 5.75 3.476
15 5.08 0.147
MEAN (Standard Deviation) 6.62 (±6.3) 8.03 (±7.29)
P-Value P = 0.57

[369]
C.2. Individual mean data for mature and young female runners (Study 1).
Pk Loading Rate (BW/s)
Pk RF Eversion (deg)
Pk Knee Int Rot (deg)
Peak DF (deg)
Pk KEAM (deg)
M Y M Y M Y M Y M Y
50.6 ± 5.6 36.24 ± 8.8 5.4 ± 3.2 5.21 ± 1.6 9.3 ± 4.2 13.9 ± 6.2 21.9 ± 8.1 22 ± 2.6 2.079 ± 0.39 1.1 ± 0.23
75.1 ± 10.2 47.104 ± 10.7 3.6 ±1.96 6.8 ± 1.3 9.5 ± 3.9 10.02 ± 8.5 24.8 ± 4.8 30.3 ± 7.72 2.08 ± 0.1 1.3 ± 0.15
59.8 ± 9.6 39.304 ± 6.7 8.6 ± 2.4 9.3 ± 3.46 10 ± 3.9 4.43 ± 2.8 28.2 ± 2.9 30.5 ± 8.1 1.97 ± 0.44 1.48 ± 0.16
59.86 ± 7.1 17.4 ± 7.8 10.2 ± 5.2 4.28 ± 3.2 12 ± 4.5 5.77 ± 4.2 29.5 ± 3.2 28.7 ± 2.0 2.01 ± 0.53 1.18 ± 0.37
51.24 ± 10.0 51.04 ± 9.9 12.5 ± 1.6 3.29 ± 4.6 16 ± 2.5 5.64 ± 2.2 19.99 ± 3.21 28 ± 7.6 2 ± 0.19 1.66 ± 0.15
54.16 ± 6.3 44.104 ± 3.5 12.5 ± 2.33 3.21 ± 5.4 10.8 ± 2.66 4.74 ± 1.8 22.5 ± 1.25 29.2 ± 5.31 1.2 ± 0.22 0.96 ± 0.5
64.51 ± 9.8 36.48 ± 4.8 11.2 ± 3.49 11.4 ± 5.6 14 ± 2.4 9.12 ± 5.7 21.7 ± 2.8 30.25 ± 4.9 1.46 ± 0.3 1.96 ± 0.49
56.92 ± 8.5 36.48 ± 5.3 10 ± 4.2 5.67 ± 0.9 11.4 ± 1.96 10.3 ± 2.9 21.0 ± 4.6 28 ± 5.2 1.64 ± 0.8 1.16 ± 0.30
46.87 ± 8.6 50.10 ± 7.6 10.5 ± 3.2 7.43 ± 6.1 12.6 ± 3.5 8.32 ± 2.9 23.1 ± 8.6 26.1 ± 11.7 1.6 ± 0.46 1.02 ± 0.13
43.27 ± 7.1 29.99 ± 8.4 14 ± 6.1 5.84 ± 4.0 14.5 ± 2.8 9.18 ± 3.6 22.65 ± 6.7 27.5 ± 5.7 1.68 ± 0.12 1.98 ± 0.51
41.57 ± 10.1 30.27 ± 10.1 14.7 ± 8.4 8.72 ± 3.6 10.3 ± 2.1 8.65 ± 2.5 21.7 ± 3.9 23.6 ± 6.8 1.87 ± 0.41 1.05 ± 0.37
43.61 ± 5.2 31.99 ± 5.9 11.6 ± 5.2 11.4 ± 4.3 12.4 ± 3.2 5.99 ± 3.1 18.69 ± 1.3 31.6 ± 4.1 1.66 ± 0.16 1.18 ± 0.20
57.96 ± 7.9 34.58 ± 4.7 15 ± 4.33 6.37 ± 1.5 16.6 ± 3.64 10.15 ± 2.0 20.64 ± 6.5 28.9 ± 3.1 1.87 ± 0.36 1.52 ± 0.13
57.43 ± 10.1 28.65 ± 9.3 12.9 ± 4.1 5.38 ± 2.7 14.5 ± 3.49 9.01 ± 0.9 26.5 ± 2.7 30.4 ± 5.6 1.6 ± 0.30 1.19 ± 0.25
60.7 ± 11.2 33.6 ± 8.5 13.4 ± 2.38 5.45 ± 1.5 13.8 ± 3.2 9.87 ± 2.3 22.73 ± 6.9 19.58 ± 6.1 1.54 ± 0.41 0.94 ± 0.39
54.9±9.02 36.49±8.92 11.07±3.24 6.65±2.57 12.51±2.33 8.34±2.57 23.04±3.01 27.64±3.44 1.75±0.26 1.31±0.34

[370]
Appendix D: Sample Statistical Power Analysis report for Study 2.
Rearfoot eversion data from Study 1 was used to calculate the sample size and statistical
power for study two. Calculations were performed using Power and Precision Version 4
(Borenstein, Rothstein, & Cohen, 2001).
This study will compare two groups of females (mature and young) on a scale of
rearfoot eversion. This variable is measured on a continuous scale with a possible range
of 3 to 20 degrees. The null hypothesis is that the mean response for mature and young
females is identical. The intent is therefore to disprove the null hypothesis, and show
that the rearfoot eversion is significantly different for mature and young females. The
computation of sample size is based on the following assumptions.
Based on the results from Study 1, it is assumed that the means produced will be 10o
and 6o for the mature and young females respectively. The common within-group
standard deviation was assumed to be 3o. The following graphs were calculated in the
programme and illustrate the expected distribution of scores for mature (a) and young
(b) females.
(a)

[371]
(b)
An expected percentage of missing data was predicted to be 10%, suggesting that for
every 100 participants, 10 would provide data that could not be included in the analysis.
Results from the power analysis showed that when a difference of three degrees is
predicted between the two groups (with a 10% chance of missing data), the study will
have a power of 80%, and a sample size of 12 would be required to yield statistically
significant results (p<0.05), which will allow us to conclude the groups differ.

[372]
Appendix E: Individual mean results for peak variables. Study 2.
Rearfoot Eversion.
MATURE FEMALES YOUNG FEMALES
Neutral Motion Control Neutral Motion Control
14.1 ± 3.21 5.2 ± 1.83 17.5 ± 3.21 12 ± 2.52
21.2 ± 13.5 5.4 ± 1.78 11.4 ± 8.41 5.8 ± 3.79
22.1 ± 7.4 18.7 ± 9.94 11.8 ± 6.97 6.5 ± 1.86
26.4 ± 11.4 23.2 ± 5.62 15.3 ± 1.97 13.5 ± 5.4
5.7 ± 1.05 7 ± 2.66 11.5 ± 6.02 9.5 ± 3.49
15.9 ± 3.62 12.5 ± 2.74 12.7 ± 2.78 6.8 ± 4.23
17.1 ± 2.79 10.2 ± 5.42 17.4 ± 4.55 14.9 ± 1.84
18.1 ± 8.17 14.7 ± 6.48 14.5 ± 2.41 9.3 ± 2.9
12.3 ± 1.2 3.6 ± 1.3 7.11 ± 4.99 3.5 ± 2.01
16.4 ± 1.36 8.6 ± 3.68 4.4 ± 1.08 6.9 ± 3.61
12.0 ± 4.07 8.9 ± 2.34
9.12 ± 3.94 8.36 ± 2.77
17.0 ± 5.6 10.91 ± 4.1 12.06 ± 3.9 8.8 ± 3.3
Ankle Dorsiflexion.
MATURE FEMALES YOUNG FEMALES
Neutral Motion Control Neutral Motion Control
29.1 ± 5.67 27.7 ± 6.93 52 ± 17.4 42 ± 17.1
23.9 ± 4.89 27.7 ± 7.7 30.5 ± 8.03 38 ± 15.6
31.1 ± 12.4 22.8 ± 5.18 25.4 ± 2.03 26.4 ± 1.32
34.5 ± 7.67 30.2 ± 8.7 20.1 ± 10.8 18.1 ± 10.6
22.3 ± 2.9 26.6 ± 7.5 55.2 ± 18 31.4 ± 8.1
25 ± 4.26 21.4 ± 5.57 30.8 ± 5.77 31.4 ± 7.47
10.9 ± 1.68 26.2 ± 10.23 18.6 ± 4.4 18 ± 4.2
27.2 ± 8.9 20.6 ± 9.56 33.9 ± 5.6 34.3 ± 2.67
29.8 ± 5.69 31.7 ± 7.35 30.3 ± 1.11 45.5 ± 4.22
28.1 ± 7.51 27.3 ± 9.91 42.9 ± 11.5 64.4 ± 13.5
25 ± 1.83 29.8 ± 2.29
41.6 ± 2.08 31.9 ± 2.9
26.2 ± 6.5 26.2 ± 3.6 33.9 ± 12.6 34.3 ± 12.6
Knee Flexion.
MATURE FEMALES YOUNG FEMALES
Neutral Motion Control Neutral Motion Control
33.9 ± 3.7 31.4 ± 2.6 47.6 ± 6.8 47.9 ± 3.7
13.2 ± 2.6 19 ± 1.9 17.4 ± 6.0 24 ± 8.14
31.2 ± 5.9 31.8 ± 7.2 16.6 ± 2.53 14.6 ± 3.0
43.3 ± 12.9 35.7 ± 7.9 26.9 ± 8.0 28.1 ± 2.7
20 ± 1.45 35.2 ± 2.04 22.2 ± 9.0 33.3 ± 6.9
42.1 ± 12.0 29.1 ± 7.2 34.4 ± 5.7 31.6 ± 3.1
36.6 ± 14.36 17.4 ± 4.9 29.8 ± 2.0 27.6 ± 3.0
44.8 ± 11.0 44.0 ± 1.2 32.5 ± 1.8 34.3 ± 4.9
18.2 3.2 46.1 ± 7.6 6.2 ± 8.0 4.1 ± 4.0
39.6 ±2.0 32.7 ± 6.0 28.0 ± 2.7 30.5 ± 2.66
41.4 ± 4.0 44 ± 6.0
43.7 ± 5.1 46.2 ± 5.0
32.3 ± 11.4 32.2 ± 9.2 28.9 ± 12.12 30.5 ± 12.65

[373]
Knee Abduction.
MATURE FEMALES YOUNG FEMALES
Neutral Motion Control Neutral Motion Control
24.7 ± 3.65 28.6 ± 7.69 20.6 ± 5.01 28.6 ± 3.2
27.9 ± 3.92 29.7 ± 1.924 14.7 ± 1.59 29.7 ± 6.75
24 ± 10.3 24.1 ± 4.05 11.1 ± 5.49 11.1 ± 6.88
21.1 ± 2.85 23.3 ± 1.96 23.3 ± 3.65 23.3 ± 3.0
20.4 ± 3.26 20.0 ± 5.91 10.0 ± 5.89 10.0 ± 3.87
32.35 ± 5.11 34.6 ± 8.43 25.1 ± 2.71 24.6 ± 3.17
27.3 ± 9.63 28.9 ± 10.54 23.9 ± 7.2 26.6 ± 6.3
20.0 ± 5.8 21.0 ± 1.89 21.0 ± 3.9 21.0 ± 7.9
17.2 ± 4.54 13.5 ± 7.54 13.5± 8.43 13.5 ± 8.09
16.1 ± 2.0 16.7 ± 1.13 6.7 ± 3.23 6.7 ± 7.6
16.0 ± 6.49 15.9 ± 6.22
18.0 ± 3.9 18.1 ± 3.58
23.1 ± 5.1 24.0 ± 6.5 17.0 ± 5.96 17.1 ± 6.38
Knee Internal Rotation.
MATURE FEMALES YOUNG FEMALES
Neutral Motion Control Neutral Motion Control
16.0 ± 3.2 16 ± 2.53 13.8 ± 2.21 10.3 ± 2.54
11.6 ± 3.90 11.6 ± 2.67 15.5 ± 3.53 12.5 ± 3.07
18.3 ± 5.9 18.3 ± 7.2 13.5 ± 2.75 10 ± 2.61
19.3 ± 3.15 19.3 ± 7.3 12.7 ± 3.3 12.8 ± 6.9
19.4 ± 2.81 19.4 ± 4.8 16 ± 2.58 11.91 ± 3.641
10.8 ± 3.28 10.8 ± 3.76 18.3 ± 2.3 18.2 ± 1.94
14.0 ± 3.42 14 ± 2.89 10.2 ± 2.36 13.8 ± 2.69
14.8 ± 1.53 14.8 ± 7.5 13.9 ± 2.6 11.65 ± 3.3
12.6 ± 2.75 12.6 ± 2.61 15.4 ± 6.5 13.4 ± 7.1
14.5 ± 3.15 14.5 ± 3.18 16 ± 3.2 16 ± 3.96
12 ± 1.8 9 ± 2.4
14.0 ± 2.09 11.9 ± 2.76
18.4 ± 3.7 15.1 ± 3.1 14.3 ± 2.14 12.6 ± 2.56

[374]
Ground Reaction Force Results.
Mature Females.
MATURE
FEMALES
Mean (SD)
VARIABLE
Peak Impact Force
(BW)
Occurrence Time
(PkFz)
Loading Rate
(BW)
Occurrence Time
(LR)
1 N
MC N
1.82 (0.5)
1.84 (0.34)
0.024 (0.007)
0.025 (0.004)
90.964 (21.934)
79.054 (15.564)
0.021 (0.004)
0.020 (0.006)
2
N
MC
2.45 (0.79)
2.34 (0.77)
0.032 (0.005)
0.031 (0.004)
94.685 (31.813)
103.53 (33.77)
0.025 (0.006)
0.028 (0.005)
3 N
MC
2.11 (0.52)
1.95 (0.56)
0.025 (0.006)
0.026 (0.004)
90.253 (7.6459)
101.05 (25.1)
0.018 (0.009)
0.020 (0.003)
4 N
MC
1.78 (0.95)
1.79 (0.64)
0.017 (0.005)
0.019 (0.004)
122.52 (14.497)
82.372 (6.35)
0.024 (0.002)
0.023 (0.002)
5 N
MC
1.98 (0.45)
1.89 (0.5)
0.024 (0.006)
0.028 (0.004)
173.25 (22.09)
186 (22.89)
0.017 (0.005)
0.019 (0.006)
6 N
MC
2.22 (0.09)
2.23 (0.10)
0.030 (0.005)
0.029 (0.004)
118 (13.2)
125.36 (20.3)
0.016 (0.006)
0.016 (0.005)
7 N
MC
1.99 (0.29)
2.08 (0.30)
0.034 (0.002)
0.028 (0.001)
77.59 (7.9)
76.77 (6.23)
0.019 (0.003)
0.021 (0.006)
8 N
MC
2.97 (0.55)
2.94 (0.67)
0.018 (0.006)
0.021 (0.006)
100.36 (5.4)
102.31 (5.55)
0.025 (0.007)
0.026 (0.002)
9 N
MC
1.70 (0.89)
2.16 (0.59)
0.017 (0.003)
0.019 (0.002)
112.35 (19.5)
98.23 (21.2)
0.028 (0.005)
0.029 (0.003)
10 N
MC
1.23 (0.3)
1.51 (0.28)
0.026 (0.004)
0.027 (0.005)
90.65 (13.97)
125.36 (13.25)
0.015 (0.006)
0.017 (0.004)
Mean
(SD)
N
MC
2.07 (0.39)
2.03 (0.47)
0.025 (0.006)
0.025 (0.004)
107.06 (21.17)
108.06 (32.24)
0.021 (0.004)
0.022 (0.004)
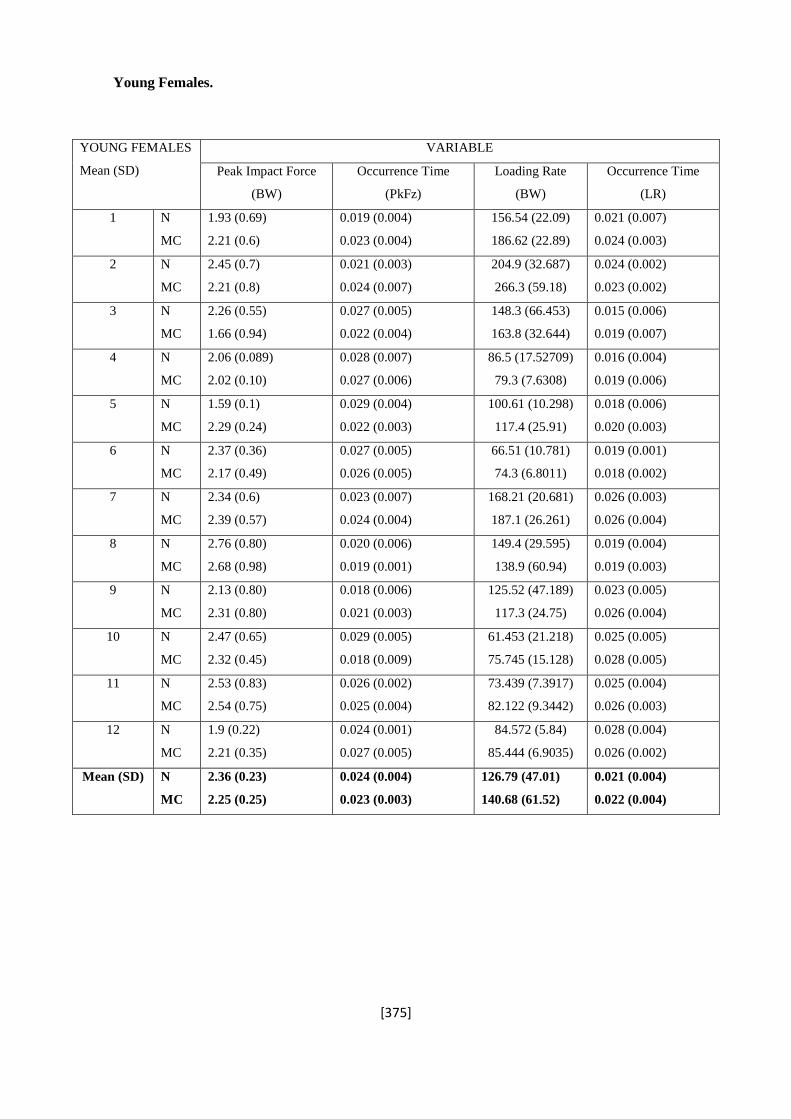
[375]
Young Females.
YOUNG FEMALES
Mean (SD)
VARIABLE
Peak Impact Force
(BW)
Occurrence Time
(PkFz)
Loading Rate
(BW)
Occurrence Time
(LR)
1 N
MC N
1.93 (0.69)
2.21 (0.6)
0.019 (0.004)
0.023 (0.004)
156.54 (22.09)
186.62 (22.89)
0.021 (0.007)
0.024 (0.003)
2
N
MC
2.45 (0.7)
2.21 (0.8)
0.021 (0.003)
0.024 (0.007)
204.9 (32.687)
266.3 (59.18)
0.024 (0.002)
0.023 (0.002)
3 N
MC
2.26 (0.55)
1.66 (0.94)
0.027 (0.005)
0.022 (0.004)
148.3 (66.453)
163.8 (32.644)
0.015 (0.006)
0.019 (0.007)
4 N
MC
2.06 (0.089)
2.02 (0.10)
0.028 (0.007)
0.027 (0.006)
86.5 (17.52709)
79.3 (7.6308)
0.016 (0.004)
0.019 (0.006)
5 N
MC
1.59 (0.1)
2.29 (0.24)
0.029 (0.004)
0.022 (0.003)
100.61 (10.298)
117.4 (25.91)
0.018 (0.006)
0.020 (0.003)
6 N
MC
2.37 (0.36)
2.17 (0.49)
0.027 (0.005)
0.026 (0.005)
66.51 (10.781)
74.3 (6.8011)
0.019 (0.001)
0.018 (0.002)
7 N
MC
2.34 (0.6)
2.39 (0.57)
0.023 (0.007)
0.024 (0.004)
168.21 (20.681)
187.1 (26.261)
0.026 (0.003)
0.026 (0.004)
8 N
MC
2.76 (0.80)
2.68 (0.98)
0.020 (0.006)
0.019 (0.001)
149.4 (29.595)
138.9 (60.94)
0.019 (0.004)
0.019 (0.003)
9 N
MC
2.13 (0.80)
2.31 (0.80)
0.018 (0.006)
0.021 (0.003)
125.52 (47.189)
117.3 (24.75)
0.023 (0.005)
0.026 (0.004)
10 N
MC
2.47 (0.65)
2.32 (0.45)
0.029 (0.005)
0.018 (0.009)
61.453 (21.218)
75.745 (15.128)
0.025 (0.005)
0.028 (0.005)
11 N
MC
2.53 (0.83)
2.54 (0.75)
0.026 (0.002)
0.025 (0.004)
73.439 (7.3917)
82.122 (9.3442)
0.025 (0.004)
0.026 (0.003)
12 N
MC
1.9 (0.22)
2.21 (0.35)
0.024 (0.001)
0.027 (0.005)
84.572 (5.84)
85.444 (6.9035)
0.028 (0.004)
0.026 (0.002)
Mean (SD) N
MC
2.36 (0.23)
2.25 (0.25)
0.024 (0.004)
0.023 (0.003)
126.79 (47.01)
140.68 (61.52)
0.021 (0.004)
0.022 (0.004)

[376]
Appendix F. Individual mean results from Study 3 for peak values in each
footwear condition.
Rearfoot Eversion.
PARTICIPANT
REARFOOT EVERSION
NEUTRAL ORTHOTICS MEDIAL
WEDGE
LATERAL
WEDGE
1 9.8 ± 1.15 4.8 ± 1.2 6.2 ± 0.85 10.32 ± 1.33
2 14.4 ± 4.38 8.4 ± 2.61 12.9 ± 2.67 11.25 ± 2.37
3 14.5 ± 3.9 9.75 ± 1.63 15.3 ± 4.34 17.2 ± 5.61
4 19.9 ± 2.67 12.33 ± 2.1 16.5 ±1.7 16.5 ± 6.3
5 13.1 ± 6.42 7.8 ± 4.46 13.2 ± 5.72 15.3 ± 4.03
6 18.5 ± 5.7 13.2 ± 3.6 17.5 ± 5.26 18 ± 3.79
7 19.6 ± 3.22 10.2 ± 2.5 19.8 ± 6.59 20.9 ± 5.89
8 14.2 ± 2.29 7.43 ± 1.78 13.7 ± 2.861 14.6 ± 0.41
9 12.6 ± 1.2 4.89 ± 5.4 8.7 ± 2.6 14.9 ± 1.84
10 7.17 ± 3.44 5.16 ± 1.72 6.56 ± 5.5 6.69 ± 1.57
11 13.8 ± 4.05 8.4 ± 2.77 11.5 ± 4.51 13.9 ± 3.6
12 9.8 ± 3.25 5.6 ± 6.9 7.8 ± 3.23 11.4 ± 3.27
13 17.2 ± 2.82 10.2 ± 1.53 19.6 ± 2.84 20.4 ± 2.9
14 10.3 ± 1.57 3.8 ± 2.6 10.6 ± 5.58 13.2 ± 3.84
15 10.56 ± 1.94 13.56 ± 1.15 20.8 ± 2.82 24.6 ± 1.08
16 16.4 ± 8.5 8.33 ± 2.74 20.6 ± 3.22 22.5 ± 3.22
17 14.7 ± 1.107 9.23 ± 3.23 13.7 ± 2.7 12.9 ± 3.23
18 14.05 ± 4.4 8.95 ± 2.6 10.3 ± 2.84 15.002 ± 1.87
19 14.64 ± 3.13 9.05 ± 4.63 13.5 ± 1.8 17.5 ± 2.5
20 15.36 ± 1.28 8.4 ± 1.3 14.3 ± 1.6 16.8 ± 1.64
Mean (SD) 14.03 ± 3.7 8.47 ± 4.2 13.65 ± 4.9 15.69 ± 4.68

[377]
Ankle Dorsiflexion.
PARTICIPANT
ANKLE DORSIFLEXION
NEUTRAL ORTHOTICS MEDIAL
WEDGE
LATERAL
WEDGE
1 20.5 ± 3.5 19.2 ± 1.14 24.6 ± 4.6 19.9 ± 2.33
2 20 ± 3.11 25.6 ± 2.83 19.5 ±5.35 19.3 ±3.3
3 25 ± 5.2 20.4 ± 5.69 20 ± 4.13 20.9 ± 5.078
4 20.3 ± 5.31 18.9 ± 5.1 18.2 ± 5.58 19.1 ± 5.14
5 16.4 ± 6.3 13.5 ± 4.4 13.4 ± 2.24 13.8 ± 2.03
6 23.3 ± 1.99 17.2 ± 2.4 16.2 ± 2.22 16.4 ± 1.27
7 11.3 ± 3.6 11.5 ± 4.16 12.5 ± 5.6 11.4 ± 5.33
8 25.7 ± 7.36 20.5 ± 6.83 19.4 ± 1.35 18.4 ± 1.82
9 18.5 ± 2.81 20.5 ± 1.22 18.61 ± 3.397 21 ± 5.112
10 21 ± 1.3 20.3 ± 1.18 19.23 ± 1.85 21.7 ± 1.57
11 16.5 ± 2.69 13.2 ± 1.08 13.4 ± 1.56 10.2 ± 1.3
12 16.5 ± 1.995 18.3 ± 2.357 20.3 ± 7.13 20.4 ± 5.9
13 24.5 ± 10.07 21.3 ± 9.09 24.4 ± 5.73 23.5 ± 9.56
14 22 ± 1.13 17.8 ± 2.15 20.7 ± 2.38 20.6 ± 1.98
15 24.2 ± 1.91 21.1 ± 1.09 20.1 ± 1.79 26.4 ± 1.11
16 17 ± 1.7 14.2 ± 1.1 15.1 ± 1.62 16.5 ± 1.9
17 19.9 ± 4.49 16.2 ± 4.75 21.4 ± 6.97 16.5 ± 5.18
18 16 ± 1.35 12.5 ± 2.2 13.5 ± 3.2 18.9 ± 3.93
19 18.9 ± 4.9 13.9 ± 3.5 15.2 ± 2.6 17.4 ± 1.5
20 19.5 ± 1.4 17.8 ± 2.4 17 ± 6.45 19.2 ± 3.6
Mean (SD) 19.9 ± 3.64 17.7 ± 1.83 18.2 ± 3.54 18.8 ± 3.88

[378]
Forefoot Abduction.
PARTICIPANT
FOREFOOT ABDUCTION
NEUTRAL ORTHOTICS MEDIAL
WEDGE
LATERAL
WEDGE
1 19.2 ± 1.65 20.5 ± 0.74 24.6 ± 2.03 19.9 ± 2.04
2 10.92 ± 3.5 25.81 ± 2.99 6.19 ± 6.8 20.58 ± 3.9
3 9.6 ± 5.221 13.8 ± 4.09 10.5 ± 6.23 9.54 ± 5.32
4 20.1 ± 3.17 17.16 ± 3.7 36 ± 2.65 29.5 ± 3.67
5 21.2 ± 1.42 28.1 ± 1.878 26.6 ± 2.936 26.1± 3.82
6 18.4 ± 3.950 11.3 ± 3.875 15.96 ± 4.137 15.39 ± 4.13
7 14.2 ± 3.25 11.8 ± 3.002 12.6 ± 1.05 13.2 ± 0.96
8 12.1 ± 2.34 5.6 ± 1.51 11.9 ± 3.48 11.8 ± 1.86
9 8.5 ± 1.745 7.5 ± 3.26 10.5 ± 2.81 9.7 ± 2.64
10 7.64 ± 4.69 6.66 ± 4.32 8.26 ± 5.67 8.06 ± 4.17
11 10.9 ± 6.9 4.12 ± 2.67 5.79 ± 3.63 3.54 ± 2.757
12 5.42 ± 3.07 3.55 ± 5.08 7.41 ± 3.08 6.33 ± 4.69
13 4.91 ± 2.73 3.47 ± 1.92 5.68 ± 4.73 3.95 ± 4.20
14 7.26 ± 3.8 3.07 ± 5.6 5.08 ± 1.374 4.69 ± 2.08
15 8.02 ± 6.19 7.99 ± 2.17 5.6 ± 9.05 6.87 ± 7.01
16 11.7 ± 3.4 11.2 ± 2.19 7.49 ± 1.5 8.94 ± 5.87
17 8.6 ± 6.35 8.14 ± 6.0 3.08 ± 2.8 3.07 ±6.6
18 11.8 ± 6.9 11.1 ± 4.2 13.2 ± 2.72 13.3 ± 3.32
19 11 ± 3.5 10.9 ± 3.07 10.5 ± 2.4 10.2 ± 2.8
20 13.2 ± 3.45 12 ± 4.24 11.95 ± 3.08 11.9 ± 3.93
Mean (SD) 11.7 ± 5.18 11.2 ± 7.69 11.95 ± 9.02 11.83 ± 7.97

[379]
Knee Flexion.
PARTICIPANT
KNEE FLEXION
NEUTRAL ORTHOTICS MEDIAL
WEDGE
LATERAL
WEDGE
1 27 ± 1.59 20 ± 1.55 25 ± 2.07 24 ± 1.66
2 31.6 ± 5.7 48.7 ± 5.3 30.4 ± 2.9 31.2 ± 6.2
3 24 ± 4.52 37 ± 5.876 23.7 ± 4.6 20.1 ± 3.54
4 35 ± 4.1 32 ± 4.5 32 ± 4.05 33 ± 3.71
5 44.5 ± 5.4 40.2 ± 3.3 38.4 ± 5.0 38.8 ± 3.2
6 46.2 ± 5.8 37.5 ± 5.9 38.7 ± 4.9 29.7 ± 3.4
7 38 ± 3.41 34 ± 2.6971 34 ± 3.01 33 ± 5.99
8 35 ± 3.2 23 ± 4.1 33 ± 7.5 31 ± 4.6
9 39 ± 3.02 43 ± 2.23 45 ± 3.14 43 ± 2.406
10 33 ± 5.5 31 ± 3.2 31 ± 6.5 31 ± 4.9
11 36 ± 2.6 30 ± 3.3 33 ± 1.86 44 ± 1.45
12 28 ± 4.09 29 ± 2.726 28 ± 1.2 29 ± 5.3
13 40 ± 1.57 34 ± 3.9 34 ± 3.9 33 ± 7.0
14 36 ± 2.8 35 ± 4.56 34 ± 3.9 33 ± 5.3
15 41 ± 4.8 45 ± 3.1 42 ± 2.2 40 ± 2.1
16 36 ± 3.7 35 ± 3.0 37 ± 4.7 31 ± 4.0
17 29 ± 7.8 30 ± 4.7 31 ± 4.3 29 ± 1.6
18 36.2 ± 5.4 35.8 ± 3.4 33 ± 5.9 32 ± 5.4
19 35 ± 3.96 32.4 ± 2.5 31.6 ± 1.79 33.6 ± 1.7
20 34.5 ± 1.1 34.9 ± 3.7 35.9 ± 1.7 32.2 ± 4.3
Mean (SD) 35.25 ± 5.58 34.38 ± 6.77 33.54 ± 5.14 32.58 ± 5.66
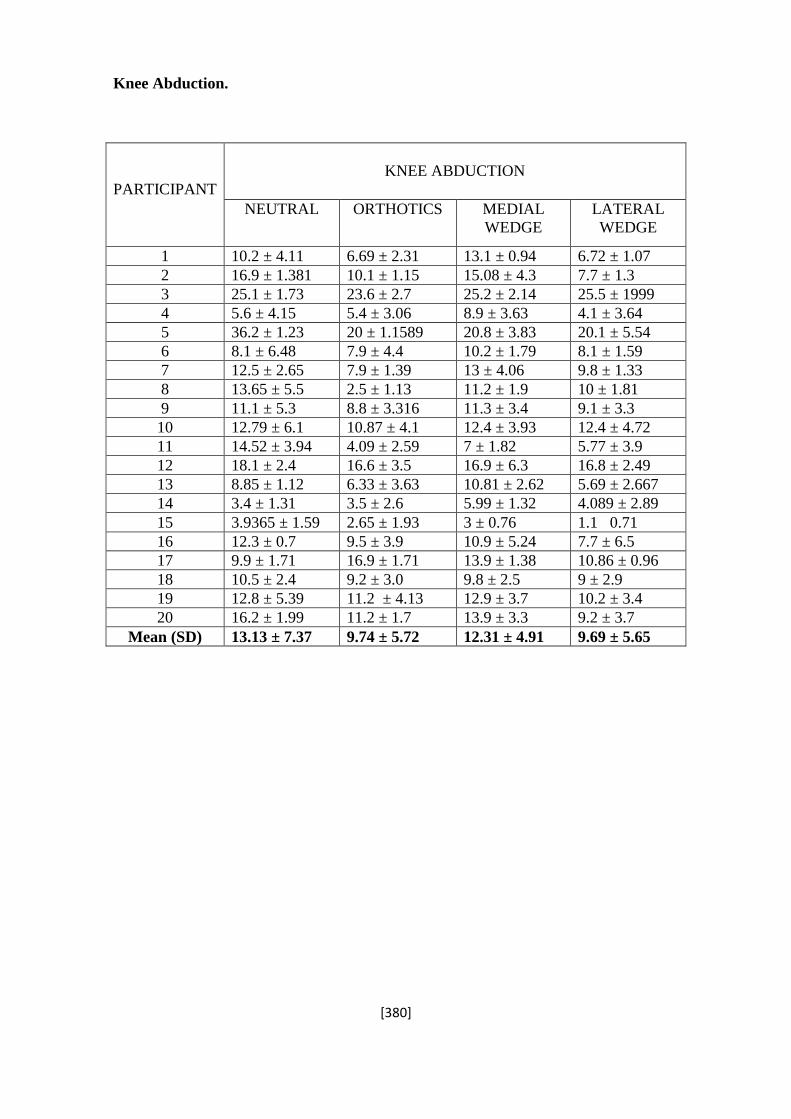
[380]
Knee Abduction.
PARTICIPANT
KNEE ABDUCTION
NEUTRAL ORTHOTICS MEDIAL
WEDGE
LATERAL
WEDGE
1 10.2 ± 4.11 6.69 ± 2.31 13.1 ± 0.94 6.72 ± 1.07
2 16.9 ± 1.381 10.1 ± 1.15 15.08 ± 4.3 7.7 ± 1.3
3 25.1 ± 1.73 23.6 ± 2.7 25.2 ± 2.14 25.5 ± 1999
4 5.6 ± 4.15 5.4 ± 3.06 8.9 ± 3.63 4.1 ± 3.64
5 36.2 ± 1.23 20 ± 1.1589 20.8 ± 3.83 20.1 ± 5.54
6 8.1 ± 6.48 7.9 ± 4.4 10.2 ± 1.79 8.1 ± 1.59
7 12.5 ± 2.65 7.9 ± 1.39 13 ± 4.06 9.8 ± 1.33
8 13.65 ± 5.5 2.5 ± 1.13 11.2 ± 1.9 10 ± 1.81
9 11.1 ± 5.3 8.8 ± 3.316 11.3 ± 3.4 9.1 ± 3.3
10 12.79 ± 6.1 10.87 ± 4.1 12.4 ± 3.93 12.4 ± 4.72
11 14.52 ± 3.94 4.09 ± 2.59 7 ± 1.82 5.77 ± 3.9
12 18.1 ± 2.4 16.6 ± 3.5 16.9 ± 6.3 16.8 ± 2.49
13 8.85 ± 1.12 6.33 ± 3.63 10.81 ± 2.62 5.69 ± 2.667
14 3.4 ± 1.31 3.5 ± 2.6 5.99 ± 1.32 4.089 ± 2.89
15 3.9365 ± 1.59 2.65 ± 1.93 3 ± 0.76 1.1 0.71
16 12.3 ± 0.7 9.5 ± 3.9 10.9 ± 5.24 7.7 ± 6.5
17 9.9 ± 1.71 16.9 ± 1.71 13.9 ± 1.38 10.86 ± 0.96
18 10.5 ± 2.4 9.2 ± 3.0 9.8 ± 2.5 9 ± 2.9
19 12.8 ± 5.39 11.2 ± 4.13 12.9 ± 3.7 10.2 ± 3.4
20 16.2 ± 1.99 11.2 ± 1.7 13.9 ± 3.3 9.2 ± 3.7
Mean (SD) 13.13 ± 7.37 9.74 ± 5.72 12.31 ± 4.91 9.69 ± 5.65

[381]
Knee Internal Rotation.
PARTICIPANT
KNEE INTERNAL ROTATION
NEUTRAL ORTHOTICS MEDIAL
WEDGE
LATERAL
WEDGE
1 11.4 ± 0.98 10.6 ± 1.46 11.6 ± 2.04 13.1 ± 0.99
2 14.6 ± 4.38 4.5 ± 2.61 7.6 ± 1.14 16.3 ± 2.13
3 17.4 ± 1.23 10.2 ± 1.89 11.3 ± 1.18 20.3 ± 2.03
4 14.3 ± 2.3 9.1 ± 7.9 14.1 ± 1.23 14.0 ± 1.3
5 12.5 ± 1.91 9.2 ± 1.41 12.0 ± 2.03 12.3 ± 1.1
6 9.5 ± 1.1 6.2 ± 1.8 8.8 ± 1.78 8.5 ± 1.48
7 12 ± 3.99 7.9 ± 3.59 14.4 ± 4.29 13.8 ± 3.65
8 14.2 ± 1.92 11.3 ± 3.7 13.6 ±1.24 15.2 ± 2.29
9 14.7 ± 1.56 13.8 ± 1.0 14.2 ± 1.82 12.7 ± 1.68
10 15 ± 2.94 12.6 ± 3.3 14.6 ± 3.05 15.1 ± 2.42
11 14 ± 2.59 11.3 ± 3.51 16 ± 4.77 12.8 ± 4.71
12 20.5 ± 3.0 16.8 ± 1.84 18.5 ± 2.8 20.4 ± 3.3
13 14 ± 2.4 9.2 ± 2.12 18.9 ± 2.4 17.2 ± 2.04
14 13.9 ± 2.72 7.2 ± 4.09 8.9 ± 3.29 10.1 ± 3.10
15 11.2 ± 1.01 8.6 ± 2.7 12.2 ± 2.9 10.5 ± 1.9
16 15 ± 5.3 9 ± 2.79 12.2 ± 2.8 13.8 ± 3.0
17 14.6 ± 1.76 11 ± 1.74 11.2 ± 1.8 15.5 ± 3.1
18 16.2 ± 2.0 8.22 ± 2.6 12 ± 2.4 13 ± 1.4
19 16.3 ± 3.99 9.75 ± 3.05 14.22 ± 3.5 14.2 ± 3.8
20 17.1 ± 4.2 9.89 ± 1.7 13.6 ± 2.3 13.9 ± 1.9
Mean (SD) 14.4 ± 2.47 9.81 ± 2.68 12.99 ± 2.84 14.13 ± 3.06

[382]
Knee External Adductor Moment and Moment Arm.
PARTICIPANT
FOOTWEAR CONDITION Nm – Nm/kg
NEUTRAL ORTHOTIC MEDIAL LATERAL
1 74.7495 ± 6.25
1.23 ± 0.10
30.12627 ± 3.2
0.55 ± 0.053
38.30268 ± 4.5
0.70 ± 0.075
33.7389 ± 3.55
0.61 ± 0.059
2 46.3969 ± 4.11
0.89 ± 0.079
36.24614 ± 5.66
0.70 ± 0.11
45.32104 ± 4.95
0.87 ± 0.095
45.07996 ± 4.32
0.87 ± 0.083
3 49.247 ± 5.06
0.93 ± 0.095
27.07696 ± 4.06
0.51 ± 0.077
51.44997 ± 5.55
0.97 ± 0.10
58.17689 ± 6.54
1.10 ± 0.12
4 72.54 ± 9.55
1.27 ± 0.17
50.04 ± 9.16
0.88 ± 0.16
52.25479 ± 8.5
0.92 ± 0.15
51.7093 ± 9.43
0.91 ± 0.17
5 65.6718 ± 5.33
1.22 ± 0.099
38.43344 ± 6.03
0.71 ± 0.11
57.41337 ± 7.41
1.06 ± 0.14
47.017 ± 5.02
0.87 ± 0.093
6 68.4206 ± 5.56
1.37 ± 0.11
52.12537 ± 4.89
1.04 ± 0.098
58.23274 ± 5.12
1.16 ± 0.10
58.57561 ± 6.96
1.17 ± 0.14
7 52.587 ± 4.52
1.03 ± 0.089
39.2218 ± 6.2
0.77 ± 0.12
57.3875 ± 7.46
1.13 ± 0.15
47.5041 ± 5.12
0.93 ± 0.10
8 59.2742 ± 6.33
1.16 ± 0.12
46.63385 ± 6.0
0.91 ± 0.12
31.4967 ± 5.73
0.62 ± 0.11
49.9547 ± 5.16
0.98 ± 0.10
9 58.265 ± 5.98
1.17 ± 0.12
49.5254 ± 5.33
0.99 ± 0.11
59.625 ± 5.0
1.19 ± 0.10
59.0125 ± 5.91
1.18 ± 0.12
10 64.254 ± 7.15
1.11 ± 0.12
64.256 ± 5.41
1.11 ± 0.093
66.662 ± 8.55
1.15 ± 0.15
65.258 ± 9.41
1.13 ± 0.16
11 66.958 ± 6.25
1.24 ± 0.12
60.235 ± 6.68
1.12 ± 0.12
68.254 ± 7.15
1.26 ± 0.13
64.0333 ± 6.55
1.19 ± 0.12
12 70.152 ± 9.51
1.19 ± 0.16
67.198 ± 8.07
1.14 ± 0.14
74.558 ± 9.13
1.26 ± 0.15
72.0214 ± 9.55
1.22 ± 0.16
13 59.215 ± 4.87
1.04 ± 0.085
54.32 ± 5.96
0.95 ± 0.10
55.625 ± 5.81
0.98 ± 0.10
55.0541 ± 3.22
0.97 ± 0.056
14 71.223 ± 5.91
1.19 ± 0.099
72.354 ± 8.01
1.2 ± 0.12
69.568 ± 9.66
1.16 ± 0.16
70.113 ± 9.84
1.17 ± 0.16
15 69.35 ± 9.22
1.24 ± 0.16
58.889 ± 9.84
1.05 ± 0.18
66.691 ± 10.82
1.19 ± 0.19
68.554 ± 10.03
1.22 ± 0.18
16 60.325 ± 4.03
1.10 ± 0.073
59.39636 ± 3.23
1.08 ± 0.059
58.85 ± 2.16
1.07 ± 0.039
56.365 ± 3.08
1.02 ± 0.056
17 60.254 ± 9.66
1.04 ± 0.17
49.14 ± 8.84
0.85 ± 0.15
60.39 ± 7.16
1.04 ± 0.12
55.254 ± 9.0
0.95 ± 0.16
18 55.214 ± 4.69
1.13 ± 0.096
50.23146 ± 5.67
1.03 ± 0.12
53.265 ± 6.04
1.09 ± 0.12
52.325 ± 5.01
1.07 ± 0.10
19 60.32 ± 9.13
1.14 ± 0.17
47.78 ± 9.84
0.90 ± 0.19
60.98 ± 9.64
1.15 ± 0.18
51.236 ± 7.89
0.97 ± 0.15
20 60.258 ± 8.46
1.12 ± 0.16
46.3589 ± 8.61
0.86 ± 0.16
57.856 ± 7.11
1.07 ± 0.13
49.826 ± 8.64
0.92 ± 0.16
MEAN 62.23
1.15
49.80*
0.92*
57.21
1.05
55.54*
1.02*
STANDARD DEVIATION 7.76
0.12
11.89
0.19
10.32
0.17
9.40
0.15
*Differences were statistically significant compared to neutral condition at p<0.05 level.

[383]
PARTICIPANTS
NEUTRAL ORTHOTIC MEDIAL LATERAL
LATERAL
LATERAL LATERAL LATERAL
Mean Occurrence
Time
Mean Occurrence
Time
Mean Occurrence
Time
Mean Occurrence
Time
1 -0.021 ± 0.011 0.22 ± 0.009 -0.019 ± 0.004 0.18 ± 0.013 -0.018 ± 0.003 0.20 ± 0.014 -0.016 ± 0.005 0.17 ± 0.015
2 -0.019 ± 0.008 0.21 ± 0.005 -0.017 ± 0.01 0.19 ± 0.009 -0.018 ± 0.007
0.21 ±0.016 -0.013 ± 0.006 0.19 ± 0.016
3 -0.019 ± 0.009 0.18 ± 0.02 -0.016 ± 0.003 0.19 ± 0.014 -0.020 ± 0.013
0.19 ± 0.01 -0.02 ± 0.009 0.20 ± 0.01
4 -0.020 ± 0.009 0.19 ± 0.01 -0.018 ± 0.009 0.21 ± 0.007 -0.021 ± 0.0091
0.20 ± 0.013 -0.015 ± 0.009 0.20 ± 0.009
5 -0.020 ± 0.012 0.18 ± 0.01 -0.017 ± 0.007 0.19 ± 0.012 -0.022 ± 0.005 0.20 ± 0.01 -0.019 ± 0.005 0.21 ± 0.016
6 -0.023 ± 0.013 0.21 ± 0.015 -0.020 ± 0.006 0.18 ± 0.009 -0.022 ± 0.01
0.21 ± 0.015 -0.021 ± 0.013 0.21 ± 0.013
7 -0.018 ± 0.11 0.22 ± 0.016 -0.019 ± 0.009 0.19 ± 0.01 -0.002 ± 0.005
0.24 ± 0.007 -0.017 ± 0.011 0.20 ± 0.01
8 -0.020 ± 0.008 0.18 ± 0.017 -0.020 ± 0.005 0.19 ± 0.011 -0.014 ± 0.008
0.18 ± 0.009 -0.016 ± 0.009 0.21 ± 0.01
9 -0.020 ± 0.010 0.22 ± 0.009 -0.020 ± 0.001 0.21 ± 0.01 -0.023 ± 0.002 0.19 ± 0.01 -0.021 ± 0.007 0.18 ± 0.015
10 -0.019 ± 0.012 0.19 ± 0.009 -0.019 ± 0.001 0.22 ± 0.009 -0.013 ± 0.004
0.20 ± 0.009 -0.023 ± 0.01 0.16 ± 0.013
11 -0.020 ± 0.009 0.21 ± 0.2 -0.018 ± 0.001 0.19 ± 0.008 -0.021 ± 0.006
0.19 ± 0.009 -0.02 ± 0.006 0.18 ± 0.016
12 -0.020 ± 0.013 0.20 ± 0.008 -0.020 ± 0.0012 0.19 ± 0.01 -0.019 ± 0.011
0.19 ± 0.01 -0.021 ± 0.003 0.17 ± 0.016
13 -0.019 ± 0.021 0.18 ± 0.010 -0.019 ± 0.009 0.18 ± 0.01 -0.018 ± 0.009
0.19 ± 0.011 -0.02 ± 0.013 0.16 ± 0.02
14 -0.018 ± 0.003 0.18 ± 0.010 -0.02 ± 0.005 0.22 ± 0.014 -0.021 ± 0.009 0.21 ± 0.011 -0.02 ± 0.006 0.17 ± 0.016
15 -0.020 ± 0.011 0.19 ± 0.007 -0.017 ± 0.003 0.19 ± 0.01 -0.022 ± 0.007
0.20 ± 0.009 -0.017 ± 0.009 0.20 ± 0.011
16 -0.19 ± 0.002 0.19 ± 0.013 -0.018 ± 0.009 0.19 ± 0.009 -0.023 ± 0.0012
0.20 ± 0.01 -0.017 ± 0.004 0.20 ± 0.009
17 -0.018 ± 0.011 0.20 ± 0.010 -0.016 ± 0.005 0.20 ± 0.008 -0.022 ± 0.003
0.20 ± 0.008 -0.018 ± 0.003 0.21 ± 0.009
18 -0.021 ± 0.0013 0.21 ± 0.011 -0.020 ± 0.001 0.21 ± 0.012 -0.017 ± 0.005 0.21 ± 0.013 -0.02 ± 0.007 0.19 ± 0.01
19 -0.021 ± 0.007 0.22 ± 0.012 -0.017 ± 0.008 0.21 ± 0.012 -0.018 ± 0.004
0.17 ± 0.019 -0.020 ± 0.007 0.19 ± 0.008
20 -0.020 ± 0.016 0.23 ± 0.008 -0.020 ± 0.0012 0.18 ± 0.01 -0.018 ± 0.12
0.17 ± 0.016 -0.015 ± 0.008 0.18 ± 0.017
Mean (SD) -0.020 ± 0.001 0.20 ± 0.016 -0.019 ± 0.001 0.20 ± 0.013 0.020 ± 0.003 0.20 ± 0.016 0.018 ± 0.003 0.19 ± 0.017

[384]
REFERENCES
Abdel-Aziz, Y.I., & Karara, H.M. (1971). Direct linear transformation from comparator
coordinates into object space coordinates in close-range photogrammetry. Proceedings of
the Symposium on Close-Range Photogrammetry (pp. 1-18). Falls Chruch, USA:
Americal Society of Photogrammetry.
Abdallah, A.A., & Radwan, A.Y. (2011). Biomechanical changed accompanying
unilateral and bilateral use of laterally wedged insoles with medial arch supports in
patients with medial knee osteoarthritis. Clinical Biomechanics, vol. 26, pp. 783-789.
Ackland, T.R., Elliott, B.C., & Bloomfield, J. (2008). Applied Anatomy and
Biomechanics in Sport, Ed 2. USA: Human Kinetics.
Aguinaldo, A., & Mahar, A. (2003). Impact Loading in Running Shoes with Cushioning
Column Systems. Journal of Applied Biomechanics, vol. 19, no. 4, pp. 353-360.
Akinpelu, A.O., Bakare, U., & Adegoke, B.A.O. (2005). Influence of age on hamstring
tightness in apparently healthy Nigerians. Journal of Nigeria Society of Physiotherapy,
vo. 15, no. 2.
Allard, P., Blanchi, J.P., & Aissaoui, R. (1995). Bases of Three-Dimensional
Reconstruction. In P. Allard., I.A.F. Stokes, & J.P. Blanchi, (Eds.), Three-Dimensional
Analysis of Human Movement (p. 19-40). Human Kinetics: Champaign, IL.
Alonso-Vazquez, A., Villarroya, M.A., Franco, M.A., Asin, J., & Calvo, B. (2009).
Kinematic assessment of paediatric forefoot varus. Gait and Posture, vol. 29, no. 2, pp.
214-219.
Alter, M.J. (2004). The Science of Flexibility. Champaign, IL. Human Kinetics.
Amin, S., LaValley, M.P., Guermazi, A., grigoryan, M., David, J. (2005). The
relationship between cartilage loss on magnetic resonance imaging and radiographic
progression in men and women with knee osteoarthritis. Arthritis and Rheumatism, vol.
52, no. 10, 3152-3159.
Anderson, C. R. (2009). Determination of rigid body registration marker error from edge
error. Journal of Biomechanics, vol. 42, pp. 949-951.

[385]
Andrews, M., Noyes, F.R., Hewett, T.E., & Andriacchi, T.P. (1996). Lower limb
alignment and foot angle are related to stance phase knee adduction in normal subjects: a
critical analysis of the reliability of gait analysis data. Journal of Orthopaedic Research,
vol. 14, pp. 289-295.
Andriacchi, T.P. (1994). Dynamics of knee malalignments. Orthopaedic Clinics of North
America, vol. 25, pp 395-403.
Andriacchi, T.P., & Alexander, E.J. (2000). Studies of human locomotion: past, present
and future. Journal of Biomechanics, vol. 33, pp. 1217-1224.
Andriacchi, T.P., & Dyrby, C.O. (2005). Interactions between kinematics and loading
during walking for the normal and ACL deficient knee. Journal of Biomechanics, vol. 38,
no. 2, pp. 293-298.
Andriacchi, T.P., Mundermann, A., Smith, R.L., Alexander, E.J., Dyrby, C.O., & Koo, S.
(2004). A framework for the in vivo pathomechanics of osteoarthritis at the knee. Annuals
of Biomedical Engineering, vol. 32, pp. 447-457.
Arampatzis, A., Bruggemann, G-P., & Metzler, V. (1999). The effect of speed on leg
stiffness and joint kinetics in human running. Journal of Biomechanics, vol. 32, pp. 1349-
1353.
Arendt, E. (1994). Orthopaedic issues for active and athletic women. Clinical Sports
Medicine, vol. 13, no. 2, pp. 483-503.
Arendth, E., & Dick, R. (1995). Knee injury patterns among men and women in collegiate
basketball and soccer: NCAA data and review of literature. American Journal of Sports
Medicine, vol. 23, no. 6, pp. 694-701.
Armstrong, N. (2007). Paediatric Exercise Physiology. Philadelphia: Elsevier Limited.
Arnason, A., Sigurdsson, S.B., Gudmundsson, A., Holme, I., Engebretsen, L., & Bahr, R.
(2004). Risk Factors for Injuries in Football. American Journal of Sports Medicine, vol.
32, no. 1, pp. 5-16.
Arokoski, J.P.A., Jurvelin, J.S., Vaatainen, U. and Helminen, H.J., (2000). Normal and
Pathological Adaptations of Articular Cartilage to Joint Loading. Scandinavian Journal of
Medicine and Science in Sports, vol. 10, pp. 186-198.

[386]
Astephen, J.L., & Deluzio, K.J. (2003). The loading response phase of the gait cycle is
important to knee osteoarthritis. Journal of Bone and Joint Surgery, vol. 90-B, pp. 3-5.
Astephen, J.L., Deluzio, K.L., Caldwell, G.E., & Dunbar, M.J. (2008). Biomechanical
changes at the hip, knee and ankle joints during gait are associated with knee
osteoarthritis severity. Journal of Orthopeadic Research, vol. 26, no. 3, pp. 332-341.
Atler, M.J. (2004). The Science of Flexibility. USA: Human Kinetics.
Atwater, A.E. (1990). Gender differences in distance running. In P.R. Cavanagh (Ed.).
Biomechanics of distance running, pp. 321 – 362. Champaign, IL: Human Kinetics.
Ayral, X., Dougados, M., Listrat, V., Bonvarlet, J.P., Simonnet, J., & Amor, B. (1996).
Arthroscopic evaluation of chondropathy in osteoarthritis of the knee. Journal of
Rheumatology, vol. 23, no. 4, pp. 698–706.
Baker, K., Lamb, S.E., Toye, F., Jackson, S., & Barrington, S. (2004). Association
between radiographic joint space narrowing, function, pain and muscle power in severe
osteoarthritis of the knee. Clinical Rehabilitation, vol. 18, no. 7, pp. 793-800.
Baliunas, A.J., Hurwitz, D.E., Ryals, A.B., Karrart, A., Cases, J.P., Block, J.A., &
Andriacchi, T.P. (2002). Increased knee joint loads during walking are present in subjects
with knee osteoarthritis. Osteoarthritis and Cartilage, vol. 10, pp. 573-579.
Ballinger, A., & Patchett, S. (2000).Saunders’ Pocket Essentials of Clinical Medicine.
Baratz, M., Watson, A. D., & Imbriglia, J.E. (1999). Orthopaedic surgery: the essentials.
New York: Thieme Medical Publishers.
Barker, K., Lamb, S.E., Toye, F., Jackson, S., & Barrington, S. (2004). Association
between radiographic joint space narrowing, function, pain and muscle power in sever
osteoarthritis of the knee. Clinical Rehabilitation, vol. 18, no. 7, pp. 793-800.
Barnes, R.A., & Smith, P.D. (1994). The role of footwear in minimizing lower limb
injury. Journal of Sports Sciences, vol. 12, pp. 341-353.
Barrios, D.S. (2008). The Complete Book of Women’s Running. London: Rodale.
Bartko, J.J. (1994). Measure of agreement: a single procedure. Statistics in Medicine, vol.
13, pp. 737-745.
Bartlett, R. (2002). An Introduction to Sports Biomechanics. Oxford: E & FN Spon.

[387]
Bates, B. T., S. L. James, and L. R. Osternig. (1978). Foot function during the support
phase of running. Running, vol. 3, pp. 24-30.
Bates, B.T., Osternig, L.R., & Mason, B. (1979). Foot orthotic devices to modify selected
aspects of lower extremity mechanics. American Journal of Sports Medicine, vol. 7, pp.
338-342.
Baumhauer, J.F., Alosa, D.M., Renstrom, P.A.F.H., Trevino, S., & Beynnon, B. (1995). A
Prospective Study of Ankle Injury Risk Factors. The American Journal of Sports
Medicine, vol. 23, pp. 564-570.
Beckman, S. (1980). Commentary on the foot and chondromalacia: A case of
biomechanical uncertainty. The Journal of Orthopaedic and Sports Physical Therapy,
vol. 2, pp. 51-53.
Behnke, R.S. (2006). Kinetic Anatomy, Volume 1. USA: Human Kinetics.
Bellamy, N., Buchman, W., Goldsmith, C., Campbell, J., & Stitt, L. (1988). Validation
study of WOMAC: a health status instrument for measuring clinically important patient
relevant outcomes to antirheumatic drug therapy in patients with osteoarthritis of the hip
or knee. Journal of Rheumatology, vol. 155, pp. 1833-1840.
Beynnon, B.D., Renstrom, P.A., Alosa, D.M. (2001). Ankle ligament injury risk factors: a
prospective study of college athletes. Journal of Orthopaedic Research, vol. 19, pp. 213-
220.
Bierdert, R.M., & Warnke, K. (2001). Correlation between the Q angle and the patella
position: a clinical and axial computed tomography evaluation. Archives of Orthopaedic
Trauma Surgery, vol. 121, pp. 346-349.
Birmingham, T.B., Hunt, M.A., Jones, I.C. (2007). Test-retest reliability of the peak knee
adduction moment during walking in patients with medial compartment knee
osteoarthritis. Arthritis and Rheumatism, vol. 57, no. 6, pp. 1012-1017.
Birrer, R.B., O’Connor, F.G. (2004). Sports Medicine for the Primary Care Physician.
USA: Library of Congress Cataloging-in-Publication Data.
Boden, B.P., Dean, G.S., Feagin, J.A., & Garrett, W.E. (2000). Mechanisms of anterior
cruciate ligament injury. Orthopaedics, vol. 23, no. 6, pp. 573-578.

[388]
Bogert, T.V.D. (1996). Practical Guide to Data Smoothing and Filtering. Connect, pp. 1-
6.
Bolt, R., & Morag, E. (2007). The range of peak knee adduction moment values for five
off the shelf walking shoes. Journal of Biomechanics, vol. 40 (S2).
Borenstein, M., Rothsein, H., & Cohen, J. (2001). Power and Precision. Englewood:
Biostat, Inc.
Borrelli, J., Zhu, Y., Burns, M., Scandell, L., & Silva, M.J. (2004). Cartilage Tolerates
Single Impact Loads of as Much as Half the Joint Fracture Threshold. Clinical
Orthopaedics and Related Research, vol. 426, pp. 266-273.
Bourgit, D., Millet, G., Fuchslocher, J. (2008). Influence of Shoes Increasing Dorsiflexion
and Decreasing Metatarsus Flexion on Lower Limb Muscular Activity During Fitness
Exercises, Walking, and Running. Journal of Strength and Conditioning Research, vol.
22, no. 3, 966-973.
Bresler, B., & Frankel, J. (1950). The forces and moments in the leg during level walking.
Transactions of the American Society of Mechanical Engineering, pp. 27-36.
Brouwer, G.M., Van Tol, A.W., Bergink, A.P., Belo, J.N., Bernsen, R.M.D., Reijman,
M., Pols, H.A.P., & Bierma-Zeinstra, S.M.A. (2007). Association between valgus and
varus alignment and the development and progression of radiographic osteoarthritis of the
knee. Arthritis and Rheumatism, vol. 56, no. 4, 1204-1211.
Brown, G.P., Donatelli, R., Catlin, P.A., & Wooden, M.J. (1995). The effect of two types
of foot orthoses on rearfoot mechanics. Journal of Orthopaedic Sports Physical Therapy,
vol. 21, no. 5, pp. 258-267.
Brukner, P., & Khan, K. (2006). Clinical Sports Medicine. USA: McGraw-Hill.
Bullough P. (1992). The pathology of osteoarthritis. In: Moskowitz R, Howell D,
Goldberg V, Mankin H, Ed. Osteoarthritis. Philadelphia: W.B. Saunders: 39–69.
Burger, H., Van Daele, P.L.A.V., Algra, D., Van Den Ouweland, F.A., Grobbee, D.E.,
Hofman, A., Van Kuijk, C., Schutte, H.E., Birkenhager, J.C., & Pols, H.A.P. (1994). The
association between age and bone mineral density in men and women aged 55 years and
over: The Rotterdam Study. Bone and Mineral, vol. 25, pp. 1-13.

[389]
Burns, J., Keenan, A.M., & Redmond, A. (2005). Foot type and overuse injury in
triathletes. Journal of the American Podiatric Medical Association, vol. 95, no. 3, pp.
235-241.
Burton-Wurster, N., Vernier-Singer, M., Farquhar, T., & Lust, G. (1993). Effect of
compressive loading and unloading on the synthesis of total protein, proteoglycan, and
fibronectin by canine cartilage explants. Journal of Orthopeadic Research, vol. 11, no. 5,
pp. 717-729.
Bus, S.A. (2003). Ground Reaction Forces and Kinematics in Distance Running in Older-
Aged Men. Medicine and Science in Sports and Exercise, vol. 35, no. 7, pp. 1167-1175.
Butler, R.J., Barrios, J.A., Royer, T., & Davis, I.S. (2009). Effect of laterally wedged foot
orthoses on rearfoot and hip mechanics in patients with medial knee osteoarthritis.
Prosthetics and Orthotics International, vol. 33, no. 2, 107-116.
Butler, R.J., Crowell, H.P., McClay Davis, I. (2003). Lower Extremity Stiffness:
Implications for performance and injury. Clinical Biomechanics, vol. 18, pp. 511-517.
Butler, R.J., Hamill, J., & Davis, I. (2007). Effect of footwear on high and low arched
runners’ mechanics during a prolonged run. Gait and Posture, 26, pp. 219-225.
Butler, R.J., Marchesi, S., Royer, T., & Davis, I.S. (2007). The effect of a subject-specific
amount of lateral wedge on knee mechanics in patients with medial knee osteoarthritis.
Journal of Orthopaedic Research, vol. 25, no. 9, pp. 1121-1127.
Cahue, S., Dunlop, D., Hayes, K., Song, J, Torres, L., Sharma, L. (2004). Varus-valgus
alignemtn in the progression of patellofemoral osteoarthritis. Arthritis Rheumatism, vol.
50, no. 7, pp. 2184.
Cammarata, M.L., & Dhaher, Y.Y. (2008). The differential effects of gender,
anthropometry, and prior hormonal state on frontal plane knee joint stiffness. Clinical
Biomechanics, vol. 23, no. 7, pp. 937-945.
Capazzo, A. (1991). Three-dimensional analysis of human walking: Experimental
methods and associated artefacts. Human Movement Science, vol. 10, 589-602.
Carter, D.R., Beaupré, G.S., Wong, M., Smith, R.L., Andriacchi, T.P., & Schurman, D.J.
(2004). The Mechancobiology of Articular Cartilage Development and Degeneration.
Clinical Orthopaedics and Related Research, vol. 427, pp. 66-77.

[390]
Caspersen, C.J., Powell, K.E., Christensen, G.M. (1985). Physical activity, exercise and
physical fitness: definitions and distinctions for health-related research. Public Health
Reports, vol. 100, pp. 126-131.
Cavanagh, P.R. and Lafortune, M.A. (1980). Ground reaction forces in distance running.
Journal of Biomechanics, vol. 13, no. 5, pp. 397-406.
Cavanagh, P.R., & Edington, C.J. (1989). What happens to the foot with an in-shoe
orthosis? American Orthopaedic Foot and Ankle Society, vol. 13, pp. 655-660.
Caylor, D., Fites, R., & Worrell, T.W. (1993). The relationship between quadriceps angle
and anterior knee pain syndrome. Journal of Orthopaedic Sports Physical Therapy,
January 17, vol. 1, pp. 11-16.
Cereatti, A., Donati, M., Camomilla, v., Margheritini, F., Cappozzo, A. (2009). Hip joint
centre location: an ex vivo study. Journal of Biomechanics, vol. 42, no. 7, pp. 818-823.
Chakravarty, E.F., Hubert, H.B., Lingala, V.B., Zatarain, E., & Fries, J.F. (2008). Long
Distance Running and Knee Osteoarthritis A Prospective Study. American Journal of
Preventative Medicine, vol. 35, no. 2, pp. 133-138.
Challis, J.H. (1995). A multi-phase calibration procedure for the Direct Linear
Transformation. Journal of Applied Biomechanics, vol. 11, pp. 351-358.
Challis, J.H. (2001). The Variability in Running Gait Caused By Force Plate Targeting.
Journal of Applied Biomechanics, vol. 17, pp. 77-83.
Challis, J.H., & Kerwin, D.G. (1988). An evaluation of splines in biomechanical data
analysis. In Biomechanics XI, (eds G. De Groot, A.P. Hollander, P.A. Huijing and G.J.
van Ingen Schenau), Free University Press, Amsterdam, pp. 1057-1061.
Challis, J.H., & Kerwin, D.G. (1992). Accuracy assessment and control point
configuration when using the DLT for photogrammetry. Journal of Biomechanics, vol.
25, pp. 1053-1058.
Chambers, H.G., & Sutherland, D.H. (2002). A practical guide to gait analysis. Journal of
the American Academy of Orthopaedic Surgery. vol. 10, no. 3, pp. 222-231.
Chandler, T.J., & Brown, L.E. (2008). Conditioning for strength and human performance.
USA: Lippincott & Williams.

[391]
Chandler, C.L., & Spector, T.D. (1991). Oestrogens, joint disease and cartilage. Annals of
the Rheumatic Diseases, 5.
Chang, A., Hayes, K., Dunlop, D., Hurwitz, D., Song, J., Cahue, S. (2004). Thrust during
ambulation and the progression of knee osteoarthritis. Arthritis Rheumatism, vol. 50, pp.
3897-3903.
Chang, W-L., Shih, Y-F., & Chen, W-Y. (2011). Running injuries and associated factors
in participants of ING Taipei Marathon. Physical Therapy in Sport, pp. 1-5.
Chao, E.Y. (1985). Gait Analysis: a survey. Proceedings Uppsala Gait Analysis Meeting.
Chapman, A.E. (2008). Biomechanical Analysis of Fundamental Human Movements.
USA: Human Kinetics.
Cheung, R.T.H., & Ng, G.Y.F. (2007). Efficacy of motion control shoes for reducing
excessive rearfoot motion in fatigues runners. Physical Therapy in Sport, vol. 8, pp. 75-
81.
Cheung, R.T.H., Ng, G.Y.F., & Chen, B.F.C. (2006). Association of Footwear with
Patellofemoral Pain Syndrome in Runners. Sports Medicine, vol. 36, no. 3, pp. 199-205.
Childs, J.D., Sparto, P.J., Fitzgerald, K., Bizzini, M., & Irrgang, J.J. (2004). Alterations in
lower extremity movement and muscle activation patterns in individuals with knee
osteoarthritis. Clinical Biomechanics, vol. 19, pp. 44-49.
Cho, S.H., Park, J.M., & Kwon, O.Y. (2004). Gender differences in three dimensional
gait analysis data from 98 healthy Korean adults. Clinical Biomechanics, vol. 19, pp. 145-
152.
Chomiak, J., Junge, A., Peterson, L. (2000). Severe injuries in football players:
Influencing factors. American Journal of Sports Medicine, vol. 28, pp. 58-68.
Chumanov, E.S., Wall-Scheffler, C., & Heiderscheit, B.C. (2008). Gender differences in
walking and running on level and inclined surfaces. Clinical Biomechanics, vol. 23, pp.
1260-1268.
Cicuttini, F.M., et al. (2004). Rate of cartilage loss at two years predicts subsequent total
knee arthroplasty: a prospective study. Annuals of Rheumatism and Disability, vol. 63,
pp. 1124-1127.

[392]
Clanton, T.O. Sports Shoes, insoles and orthoses. In: Drez D., DeLee JC, editors.
Orthopaedic Sports Medicine 322-346. Philidelphia: WB Saunders; 1992.
Clark, R.A., Bartold, S., & Bryant, A.L. (2010). Tibial acceleration variability during
consecutive gait cycles is influenced by the menstrual cycle. Clinical Biomechanics, vol.
25, pp. 557-562.
Clarke, T.E., Frederick, E.C., & Cooper, L.B. (1983). Effects of Shoe Cushioning Upon
Ground Reaction Forces in Running, International Journal of Sports Medicine, vol. 4, no.
4, pp. 247-251.
Clarke, T.E., Frederick, E.C., & Hamill, C.L. (1983). The effects of shoe design
parameters on rearfoot control in running. Medicine and Science in Sports and Exercise,
vol. 15, no. 5, pp. 375-381.
Clarkson, H.M. (1999). Musculoskeletal Assessment: joint range of motion and manual
muscle strength. USA: Lippincott & Williams.
Clement, D.B., Taunton, J.E., & Smart, G.W. (1984). Achilles tendinitis and
peritendinitis: Etiology and treatment. The American Journal of Sports Medicine, vol. 12,
no. 3, pp. 179-184.
Clement. D. B., Taunton, J. E., Smart, G. W. and McNicol, K. L. (1981) A survey of
overuse running injuries. Physician Sports Medicine. vol. 9, 47-58.
Cochrane, J., Lloyd, D., Besier, T., & Ackland, T. (2003). Changes in loading on the knee
and knee flexion following lower limb training programmes implemented to assess the
effect on risk of knee injury and prevention. Australian Conference of Science and
Medicine in Sports, Canberra, Australia.
Cochrane, J., Lloyd, D., Besier, T., & Ackland, T., & Elliot, B. (2003). The effect of
lower limb training programs on muscular support of the knee and prevention of ACL
injury. Australian Conference of Science and Medicine in Sports, Canberra, Australia.
Cohen, J. (1988). Statistical Power Analysis for the Behavioural Sciences. Second
Edition. New Jersey: Lawrence Erlbaum Associates, Inc.
Coleman, S.G.S., & Rankin, A.J. (2005). A three-dimensional examination of the planar
nature of the golf swing. Journal of Sports Sciences, vol. 23, no. 3, pp. 227-234.

[393]
Comfort, P., & Abrahamson, E. (2010). Sports Rehabilitation and Injury Prevention.
Chichester: John Wiley & Sons, Ltd.
Copeland, S., Gschwend, N., Landi, A., Saffar, P. (1997). Joint Stiffness of the Upper
Limb. UK: Martin Dunitz Ltd.
Cotton, A., Vanoncini, M., Fraisse, P., Ramdani, N., Demircan, E., Murray, A., & Keller.
(2011). Estimation of the centre of mass from motion capture and force plate recordings:
a study on the elderly. Journal of Applied Bionics and Biomechanics, vol. 8, pp. 67-84.
Cowan, D.N., Jones, B.H., Frykman, P.N. (1996) Lower limb morphology and risk of
overuse injury among male infantry recruits. Medicine and Science in Sports and
Exercise, vol. 28, 945-952.
Crema, M.D., Roemera, F.W., Marra, M.D., Niu, J., Lynch, J.A., Felson, D.T. (2010).
Contrast-enhanced MRI of subchondral cysts in patients with or at risk for knee
osteoarthritis. The MOST study. European Journal of Radiology, vol. 75, 92-96.
Crenshaw, S.J., Pollo, F.E., Calton, E.F. (2000). Effect of lateral-wedged insoles on
kinetics at the knee. Clinical Orthopaedics, vol. 375, pp. 185-192.
Crossley, K., Bennell, K.L., Wrigley, T., & Oakes, B.W. (1999). Ground reaction forces,
bone characteristics, and tibial stress fracture in male runners. Medicine and Science in
Sports and Exercise, vol. 31, no. 8, pp. 1088-1093.
Cuddeford, T., Yack, H.J., Jensen, L., Peterson, N., Simonsen, J., & Eichelberger, T.
(1998). The effects of force plate targeting on lower extremity kinetics. Presented at the
North American Congress on Biomechanics, University of Waterloo, Waterloo, Ontario,
Canada, August 14-18, 1998.
Dahle, L.K., Mueller, M., & Delitto, A. (1991). Visual assessment of foot type and
relationship of foot to lower extremity injury. Journal of Orthopaedic Sports Physical
Therapy, vol. 14, pp. 70-74.
Davies-Tuck, M.L., Wluka, A.E., Teichtahl, A.J., Martel-Pelletier, J., Pelletier, J-P.,
Jones, G., Ding, C., Davis, S.R., & Cicuttini, F.M. (2008). Association between meniscal
tears and the peak external knee adduction moment and foot rotation during level walking
in postmenopausal women without knee osteoarthritis: a cross-sectional study. Arthritis
Research & Therapy, vol. 10, no. 3, pp. 1-7.

[394]
Davis, R., Bull, R., Roscoe, J., & Roscoe, D. (2000). Physical Education and the Study of
Sport (Fourth Edition). Edinburgh: Harcourt Publishers Limited.
Davis, M.A., Ettinger, W.H., Neuhaus, J.M. (1988). Sex differences in osteoarthritis of
the knee. American Journal of Epidemiology, vol. 27, no. 5, pp. 1019-1030.
Dawson, J., Fitzpatrick, R., Fletcher, J., & Wilson, R. (2004). Osteoarthritis Affecting the
Hip and Knee. In: A Stevens, J Raftery, Jo Mant, Sue S (Eds). Health Care Needs
Assessment – the Epidemiologically Based Needs Assessment Reviews (First Series),
Vol 1. Ch 8, Oxford: Radcliff Publishing, 2004.
DeLisa, J.A., Gans, B.M., & Walsh, N.E. (2005). Physical Medicine and Rehabilitation:
principles and practice. Volume 1. Philadelphia: Lippincott Williams & Wilkins.
Della Croce, U., Capozzo, A., Kerrigan, D.C. (1999) Pelvis and lower limb anatomical
landmark calibration precision and its propagation to bone geometry and joint angles.
Medical and biological engineering and computing, vol. 37, no. 2, pp. 155-161.
Della Croce, U., Leardini, A., Chiari, L., & Capozzo, A. (2005). Human movement
analysis using stereophotogrammetry. Part 4: assessment of anatomical landmark
misplacement and its effects on joint kinematics. Gait and Posture, vol. 21, no. 2, pp.
226-237.
Dempster WT. (1955). Space requirements of the seated operator. Wright-Patterson Air
Force Base, Ohio, WADC Technical Report, pp. 55-159.
Derrick, T.R., Hamill, J., & Caldwell, G.E. (1998). Energy absorption of impacts during
running at various stride lengths. Medicine and Science in Sports and Exercise, vol. 30,
pp. 128-135.
De Ste Croix, M. (2007). Advances in paediatric strength assessment: changing our
perspective on strength development. Journal of sports Science and Medicine, vol. 6, pp.
292-304.
Ding, C., et al. (2007). Tibial subchondral bone size and knee cartilage defects: relevance
to knee osteoarthritis. Osteoarthritis and Cartilage, vol. 15, pp. 479-486.
Ding, Cicuttini, F., & Jones, G. (2008). How important is MRI for detecting early
osteoarthritis? Nature Clinical Practice Rheumatology, vol. 4, pp. 4-5.
[395]
Dishman, R.K., Washburn, R.A., & Heath, G. (2004). Physical activity epidemiology.
USA: Human Kinetics.
Dixon, S.J., creaby, M.W., & Allsopp, A.J. (2006). Comparison of static and dynamic
biomechanical measures in military recruits with and without a history of third metatarsal
stress fracture. Clinical Biomechanics, vol. 21, 4, pp. 412-419.
Dixon, S.J., Hinman, R.S., Creaby, M.W., Kemp, G., & Crossley, K.M. (2010). Knee
Joint Stiffness During Walking in Knee Osteoarthritis. Arthritis Care and Research, vol.
62, no. 1, pp. 38-44.
Dixon, S.J., & Mcnally, K. (2008). Influence of orthotic devices prescribed using pressure
data on lower extremity kinematics and pressures beneath the shoe during running.
Clinical Biomechanics, vol. 23, pp. 593-600.
Dorocjak, R.D., & Cuddeford, T.J. (1995). Determining 3-D System Accuracy for the
VICON 370 System. Gait and Posture, vol. 3, pp. 2.
Drenth, T.S. (2011). Marathon Training For Dummies. Hoboken: Wiley Publishing, Inc.
Drewes, L.K., McKeon, P., Kerrigan, C., & Hertel, J (2008). Dorsiflexion deficit during
jogging with chronic ankle instability. Journal of Science and Medicine in Sport, vol. 12,
pp. 685-687.
Dugan, S.A., & Bhat, K.P. (2005). Biomechanics and Analysis of Running Gait. Physical
Medicine Rehabilitation Clinics of North America, vol. 16, pp. 603-621.
Dunford, M., & Doyle, J.A. (2011). Nutrition for sports and exercise. Wadsworth:
Belmont.
Dungan, S., & Bhat, K. (2005). Biomechanics and analysis of running gait. Physical
Medicine and Rehabilitation Clinics of North America, vol. 16, pp. 603-621.
Eaves, T. (2010). The practical guide to athletic training. Sudbury: Jones & Bartlett
Publishers, LLC.
Dutton, M. (2005). Orthopaedic examination, evaluation & intervention. New York:
McGraw-Hill.

[396]
Ehara, Y., Fujimoto, H., Miyazaki, S., Mochimaru, M., Tanaka, S., & Yamamoto, S.
(1997). Comparison of the performance of 3D camera systems II. Gait and Posture, vol.
5, pp. 251-255.
Ehara, Y., Fujimoto, H., Tanaka, S., & Yamamoto, S. (1995). Comparison of the
performance of 3D camera systems. Gait and Posture, vol. 3, pp. 166-169.
Ehrman, J.K., Gordon, P.M., Visich, P.S., & Keteyian, S.J. (2003). Clinical Exercise
Physiology. USA: Human Kinetics.
Eng, J.J., & Pierrynowski, M.R. (1994). The effect of soft foot orthotics on three-
dimensional lower-limb kinematics during walking and running. Physical Therapy, vol.
74, pp. 836-844.
Erhart, J., Mundermann, A., Elspas, B., Giori, N., & Andriacchi, T. (2008). A variable-
stiffness shoe lowers the knee adduction moment in subjects with symptoms of medial
compartment knee osteoarthritis. Journal of Biomechanics, vol. 41, no. 12, pp. 2720-
2725.
Erdemir, A., Piazza, S.J., Sharkey, N.A. (2002). Influence of loading rate and cable
migration on fiberoptic measurement of tendon force. Journal of Biomechanics, vol. 35,
pp. 857-862.
Erhart, J., Mundermann, A., Elspas, B., Giori, N., & Andriacchi, T. (2008). A variable-
stiffness shoe lowers the knee adduction moment in subjects with symptoms of medial
compartment knee osteoarthritis. Journal of Biomechanics, vol. 41, no. 12, 2720-2725.
Eslami, M., Begon, M., Farahpour, N., Allard, P. (2007). Forefoot-rearfoot coupling
patterns and tibial internal rotation during stance phase of barefoot versus shod running.
Clinical Biomechanics, vol. 22, 74-80.
Eslami, M., Begon, M., Hinse, S., Sadeghi, H., Poppy, P., & Allard, P. (2009). Effect of
foot orthoses on magnitude and timing of rearfoot and tibial motion, ground reaction
force and knee moment during running. Journal of Science and Medicine in Sport, vol.
12, pp. 679-684.
Eston, R., & Reilly, T. (2001). Kinanthropometry and Exercise Physiology Laboratory
Manual. London: Routledge.

[397]
Eyigor, S. (2004). A comparison of muscle training methods in patients with knee
osteoarthritis. Clinical Rheumatology, vol. 23, pp. 109-115.
Farley, C.T., & Gonzalez, O. (1996). Leg stiffness and stride frequency in human
running. Journal of Biomechanics, vol. 29, pp. 181-186.
Farley, C.T., Houdijk, H.H.P., Strien, C.V., & Louie, M. (1998). Mechanism of leg
stiffness adjustment for hopping on surfaces of different stiffness. Journal of Applied
Physiology, vol. 85, no. 3, pp. 1044-1055.
Farley, C.T., & Morgenroth, D. (1999). Leg stiffness primarily depends on ankle stiffness
during human hopping. Journal of biomechanics, vol. 32, pp. 267-273.
Felson, D.T. (1990). The Epidemiology of Knee Osteoarthritis: Results From the
Framingham Osteoarthritis Study, Seminars in Arthritis and Rheumatism, vol. 20, no. 3,
42-50.
Felson, D.T., Anderson, J.J., Naimark, A., Walker, A.M., Meenan, R.F. (1988). Obesity
and knee osteoarthritis. The Framingham Study. Annals of Internal Medicine, vol. 109,
no. 1, pp. 18–24.
Felson, D.T., Lawrence, R., Dieppe, P.A., Hirsch, R., Helmick, C.G., Jordan, J.M.,
Kington, R.S., Lane, N.E., Nevitt, M.C., Zhang, Y., Sowers, M-F., McAlindon, T.,
Spector, T.D., Poole, A.R., Yanovski, S.Z., Ateshian, G., Sharma, L., Buckwater, J.A.,
Brandt, K.D., & Fries, J.F. (2000). Osteoarthritis: New Insights. Annuals of Internal
Medicine, vol. 133, pp. 635-646.
Felson, D.T., McLaughlin, S., Goggins, J., LaValley, M.P., Gale, M.E., Totterman, S.,
Hill, C., & Gale, D. (2003). Bone Marrow Edema and its Relation to Progression of Knee
Osteoarthritis. Annuals of Internal Medicine, vol. 139, 330-336.
Felson, D.T., Naimark, A., Anderson, J., Kazis, L., Castelli, W., & Meenan, R.F. (1987).
The prevalence of knee osteoarthritis in the elderly. The Framingham Osteoarthritis
Study. Arthritis and Rheumatism, 30, pp. 914–918.
Felson, D.T., & Nevitt, M.C. (1998). The effects of estrogen on osteoarthritis. Current
Opinion in Rheumatology, vol. 10, no. 3.

[398]
Felson, D.T., & Zhang, Y. (1998). An update on the epidemiology of knee and hip
osteoarthritis with a view to prevention. Arthritis and Rheumatism, vol. 41, no. 8, pp.
1343-1355.
Ferber, R., McClay-Davis, I., Hamill, J., Pollard, C.D., & McKeown, K.A. (2002).
Kinetic variables in subjects with previous lower extremity stress fractures. Medicine and
Science in Sports and Exercise, vol. 34, S5.
Ferber, R., McClay-Davis, I., & Williams, D.S. (2003). Gender Differences in Lower
Extremity Mechanics During Running. Clinical Biomechanics, vol. 18, 350-357.
Ferber, R., McClay-Davis, I., & Williams, D.S. (2005). Effect of foot orthotics on
rearfoot and tibia joint coupling patterns and variability. Journal of Biomechanics, vol.
38, pp. 477-483.
Fish, D.J., & Neilson, J-P. (1993). Clinical Assessment of Human Gait. Journal of
Prosthetics and Orthotics, vol. 5, no. 2, pp. 39-48.
Fisher, D.S., Dyrby, C.O., Mundermann, A., Morag, E., Andriacchi, T.P. (2007). In
healthy subjects without knee osteoarthritis, the peak knee adduction moment influences
the acute effect of shoe interventions designed to reduce medial compartment knee load.
Journal of Orthopeadic Research, vol. 25, 540-546.
Foroughi, N., Smith, R., & Vanwanseele, B. (2009). The association of external knee
adduction moment with biomechanical variables in osteoarthritis: A systematic review.
The Knee, vol. 16, 303-309.
Fox, B., Taylor, N., Yazdany, J., & Brewer, S. (2006). Arthritis for Dummys. Chichester:
John Wiley & Sons.
Franz, J.R., Dicharry, J., Riley, P.O., Jackson, K., Wilder, R.P., & Kerrigan, D.C. (2008).
The influence of arch supports on knee torques relevant to knee osteoarthritis. Medicine
and Science in Sports and Exercise, vol. 40, pp. 913-917.
Frederick, E.C., Daniels, J.T., & Hayes, J.W. the effect of shoe weight on the aerobic
demands of running. In: Proceedings of the World Congree on Sports Medicine, L. Pokop
(Ed). Vienna: World Congress on Sports Medicine, 1984, pp. 616-625.
Frey, C (1997). Footwear and Stress Fractures. Clinical Sports Medicine, vol. 16, pp. 249-
257.

[399]
Froncioni, J. (2006). Athletic Footwear and Running Injuries. Spiridon.
Frontera, W.R. (1999). Exercise in Rehabilitation Medicine. USA: Human Kinetics.
Fukuchi, R.K., & Duarte, M. (2008). Comparison of three-dimensional lower extremity
running kinematics of young adult and elderly runners. Journal of Sports Science, vol. 26,
no. 13, pp. 1447 – 1454.
Fukuchi, R.K., Eskofier, B.M., Duarte, M., & Ferber, R. (2011). Support vector machines
for detecting age-related changes in running kinematics. Journal of Biomechanics, vol.
44, pp. 540-542.
Furnee, E.H. (1991). Opto electronic movement measurement systems: aspects of data
acquisition, signal processing and performance. In: Boenick, U., Nadar, M. (Eds).
Gage, J.R.(1993). Gait Analysis. An Essential Tool in the Treatment of Cerebral Palsy.
Clinical Orthopaedics and Related Research, vol. 288, pp. 126-134.
Gali, M., Rigoldi, C., Brunner, R., Virji-Babul, N., Giorgio, A. (2008). Joint stiffness and
gait pattern evaluation in children with Down syndrome. Gait and Posture, vol. 28, pp.
502-506.
Galloway, J. (2002). Galloway’s Book on Running. 2nd
Edition. Shelter Publications Inc.
Garnero, P., Peterfy, C., Zaim, S., & Schoenharting, M. (2005). Bone marrow
abnormalities on magnetic resonance imaging are associated with type II collagen
degradation in knee osteoarthritis: a three-month longitudinal study. Arthritis and
Rheumatism, vol. 52, pp. 2822–2829.
Gerritsen, K.G.M., van der Bogert, A.J., & Nigg, B.M. (1995). Direct dynamics
stimulation of the impact phase in heel-toe running. Journal of Biomechanics, vol. 28, no.
6, pp. 661-668.
Giannini, S., Catani, F., Benedetti, M.G., & Leardini, A. (1994). Gait Analysis:
Methodologies and Clinical Applications. Amsterdam: IOS Press.
Gifford, C. (2008). Running. United Kingdom, London: Evans Publishing Ltd.
Gignac, M., Davis, A., Hawker, G., Wright, J., Mahomed, N., & Fortin P. (2006). “What
do you expect? You’re just getting older”: a comparison of perceived osteoarthritis-

[400]
related and aging related health experiences in middle- and older-age adults. Arthritis
Rheumatism, vol. 55, pp. 905-12.
Gill, H.S., & O’Connor, J.J. (1997). A new testing rig for force platform calibration and
accuracy tests. Gait and Posture, vol. 5, pp. 228-232.
Gill, H.S., & O’Connor, J.J. (2003). Heelstrike and the pathomechanics of osteoarthritis: a
pilot gait study. Journal of Biomechanics, vol. 36, pp. 1625-1631.
Gormley, J., & Hussey, J. (2005). Exercise therapy in prevention of disease. Oxford:
Blackwell Publishing Ltd.
Grabiner, P.C., Biswas, S.T., & Grabiner, M.D.(2001). Age-related changes in spatial and
temporal gait variables. Physical Medicine and Rehabilitation, vol. 82, no. 1, pp. 31-35.
Grabiner, M.D., Feuerbach, J.W., Lundin, T.M., & Davis, B.L. (1995). Visual guidance to
force plates does not influence ground reaction force variability. Journal of
Biomechanics, vol. 28, no. 9, pp. 1115-1117.
Grainger, R., & Cicuttini, F.M. (2004). Medical management of osteoarthritis of the knee
and hip joints. Medical Journal of Australia, vol. 180, no. 9, pp.464.
Granata, K.P., Padua, D.A., Wilson, S.E. (2001). Gender differences in active
musculoskeletal stiffness. Part II. Quantification of leg stiffness during functional
hopping tasks. Journal of Electromyography and Kinesiology, vol. 12, pp. 127-135.
Gregor, R.J., Komi, P.V., Browing, R.C., JaK rvinen, M., 1991. A comparison of the
triceps surae and residual muscle moments at the ankle during cycling. Journal of
Biomechanics, vol. 24, pp. 287-297.
Griffin, T.M. and Guilak, F. (2005). The Role of Mechanical Loading in the Onset and
Progression of Osteoarthritis. Exercise and Sports Science Reviews, vol. 33, no. 4, pp.
195-200.
Griffiths, I.W. (2006). Principles of Biomechanics and Motion Analysis. Baltimore:
Lippincott Williams & Wilkins.
Grimshaw, P., Lees, A., Fowler, N., & Burden, A. (2007). Sport and Exercise
Biomechanics. UK, Oxon: Taylor & Francis Group.

[401]
Grimston, S.K., Ensberg, J.R., Kloiber, R., Hanley, D.A. (1991). Bone mass, external
loads, and stress fractures in female runners. International Journal of Sports
Biomechanics, vol. 7, pp. 293–302.
Grisogono, V. (1984). Sports Injuries. London: John Murray Publishers Ltd.
Guccione, A.A. Osteoarthritis, comorbidity, and physical disability. In: Hamerman D
(ad). Ostoarthritis; public health implications for an aging population (ed. Hamerman D).
Baltimore, MD: The Johns Hopkins University Press, 1997, pp. 84-98.
Gunthur, M., & Blickhan, R. (2002). Joint stiffness of the ankle and the knee in running.
Journal of Biomechanics, vol. 35, pp. 1459-1474.
Hagerman, P.A., & Blanke, D.J. (1986). Comparison of Gait of Young Women and
Elderly Women. Physical Therapy, vol. 66, pp. 1382-1387.
Hagglund, M., Walden, M., & Ekstrand, J. (2006). Previous injury as a risk factor for
injury in elite football: a prospective study over two consecutive seasons. British Journal
of Sports Medicine, vol. 40, pp. 767-772.
Hahn, T., & Foldspang, A. (1997). The Q angle and sport. Medicine and Science in Sports
and Exercise, vol. 7. No. 1, pp. 43-47.
Hall, C.M., & Broody, L.T. (2005). Therapeutic exercise: moving toward function.
Lippincott Williams & Wilkins.
Hamill, J., Bates, B.T., & Holt, K.G. (1992). Timing of lower extremity joint actions
during treadmill running. Medicine & Science in Sport and Exercise, vol. 24, no. 7, pp.
808-813.
Hamill, J., Derrick, T.R., & Holt, K.G. (1995). Shock attenuation and stride frequency
during running. Human Movement Science, vol. 14, pp. 45-60.
Hamill, J., Freedson, P.S., Boda, W., & Reichsman, F. (1988). Effect of shoe type on
cardiorespiratory responses and rearfoot motion during treadmill running. Medicine and
Science in Sports and Exercise, vol. 20, no. 5, pp. 515-521.
Hamill, J., & Knutzen, K.M. (2003). Biomechanical Basis of Human Movement. Second
Edition. Baltimore: Lippincott Williams & Wilkins.

[402]
Hamill, J., van Emmerik, R.E.A., Heiderscheit, B.C., Li, L. (1999). A dynamical systems
approach to lower extremity running injuries. Clinical Biomechanics, vol. 14, pp. 297-
308.
Hannan, M.T., Felson, D.T., Pincus, T. (2000). Analysis of the discordance between
radiographic changes and knee pain in osteoarthritis of the knee. Journal of
Rheumatology, vol. 27, pp. 1513-1517.
Hargrave, M.D., Carcia, C.R., Gansneder, B.M., & Shultz, S.J. (2003). Subtalar Pronation
Does Not Influence Impact Forces of Loading During a Single-Leg Landing. Journal of
Athletic Training, January-March, vol. 38, no. 1, pp. 18-23.
Hargreaves, M., & Hawley, J. (2003). Physiological Bases of Sport Performance.
Australia: McGraw-Hill.
Hascall, V.C., & Kuettner, K.E. (2002). The Many Faces of Osteoarthritis. Germany:
Birkhauser.
Hawley, J. (2000). Running. Oxford: Blackwell Science Ltd.
Hay, J.G. (1993). The Biomechanics of Sports Techniques. Fourth Edition. New Jersey:
Prentice-Hall, Inc.
Hayeri, M.R., Shiehmorteza, M., Trudell, D.J., Hefflin, T., & Resnick, D. (2010).
Proximal tibial osteophytes and their relationship with the height of the tibial spines of the
intercondylar eminence: paleopathological study. Skeletal Radiology, vol. 39, no. 9, 877-
881.
Hazlewood, M.E., Hillman, S.J., Lawson, A., Robb, J.E., & Loudon, I.R. (1997). Marker
attachment in gait analysis: on skin or lycra. Gait & Posture, vol. 6, no. 3, pp. 265.
Heiden, T.L., Lloyd, D.G., Acklan, T.R. ( 2009). Knee joint kinematics, kinetics and
muscle co-contraction in knee osteoarthritis patient gait. Clinical Biomechanics, pp. 833-
841.
Heiderscheit, B.C., Hamill, J., & Caldwell, G.E. (2000). Influence of Q-angle on lower
extremity kinematics during running. Journal of Orthopaedic and Sports Physical
Therapy, vol. 30, pp. 271-278.

[403]
Heinonen, A., Kannus, P., & Sievanen, H. (1996). Randomised controlled trial of effect
of high-impact exercise on selected risk factors for osteoporotic fractures. Lancet, vol.
348, pp.1343-1347.
Hennig, E.M., Lafortune, M.A., 1991. Relationships between ground reaction force and
tibial bone acceleration parameters. International Journal of Sports Biomechanics, vol. 7,
pp. 303–309.
Henriksson, M., & Hirschfeld, H. (2005). Physically active older adults display
alterations in gait initiation. Gait and Posture, vol. 21, pp. 289-296.
Herrington, L., & Nester, C. (2004). Q-angle undervalued? The relationship between Q-
angle and medio-lateral position of the patella. Clinical Biomechanics, vol. 19, no. 10, pp.
1070-1073.
Hertling, D., & Kessler, R.M. (2006). Management of common musculoskeletal disorder:
physical therapy principles and methods. Lippincott Williams & Wilkins.
Herzog, W., Longino, D., & Clarke, A. (2003). The role of muscles in joint adaptation
and degeneration. Lagenbecks Archives of Surgery, vol. 388, no. 5, pp. 305-315.
Hewett, T.E., Shultz, S, J., & Griffin, L.Y. (2007). Understanding and Preventing non-
contact ACL injuries. USA: Human Kinetics.
Hinman, R.S., Bowles, K.A., Payne, C., & Bennell, K.L. (2008). Effect of Length on
Laterally-Wedged Insoles in Knee Osteoarthritis. Arthritis and Rheumatism, vol. 59, no.
1, pp. 144-147.
Hintermann, B., & Nigg, B.M. (1998). Pronation in Runners: Implications for Injuries.
Sports Medicine, vol. 26, no. 3, pp.169-176.
Hinton, R., Moody, R., Davis, A.W., & Thomas, S.F. (2002). Osteoarthritis: diagnosis
and therapeutic considerations. American Family Physician, vol. 65, no. 5, pp. 841-848.
Hirsch, R. (2000). Seizing the light – a history of photography. New York: McGraw-Hill.
Hobara, H., Muraoka, T., Omuro, K., Gomi, K., Sakamoto, M., Inoue, K., & Kanosue, K.
(2009). Knee stiffness is a major determinant of leg stiffness during maximal hopping.
Journal of Biomechanics, pp. 1768-1771.

[404]
Holden, J.P., & Stanthorpe, S.J. (1998). The effect of variation in knee centre location
estimates on net knee moments. Gait and Posture, vol. 7, no. 1, pp. 1-6.
Holloway, J.B., & Baechle, T.R. (1990). Strength training for female athletes. A review
of selected aspects. Sports Medicine, vol. 9, no. 4, pp. 216-228.
Holten, K.B. (2004). How should we diagnose and treat osteoarthritis of the knee? The
Journal of Family Practice, vol. 53, no. 2, pp. 134-136.
Hootman, J.M., Macera, C.A., Ainswworth, B.E., Addy, C.L., Martin, M., & Blair, S.N.
(2002). Epidemiology of musculoskeletal injuries among sedentary and physically active
individuals. Medicine and Science in Sports and Exercise, vol. 34, no. 5, pp. 828-844.
Hreljac, A. (2004). Impact and overuse injuries in runners. Medicine and Science in
Sports and Exercise, vol. 36, no. 5, pp. 845 - 849.
Hreljac, A., Marshall, R.N., & Hume, P.A. (2000). Evaluation of lower extremity overuse
injury potential in runners. Medicine and Science in Sports and Exercise, vol. 32, pp.
1635–41.
Hsu, W.H., Fisk, J.A., Yamamoto, Y., Debski, R.E., Woo, S.L. (2006). Differences in
torsional stiffness of the knee between genders: a human cadaveric study. American
Journal of Sports Medicine. vol. 34, pp. 765-770.
Hsu, R.W., Himeno, S., Coventry, M.B., Chao, E.Y. (1990). Normal axial alignment of
the lower extremity and load-bearing distribution at the knee. Clinical Orthopaedics and
Related Research, vol. 255, pp. 215-227.
Huberti, H.H., & Hayes, W.C. (1984). Patellofemoral contact pressures. The influence of
q-angle and tendofemoral contact. The Journal of Bone and Joint Surgery, American
Volume, vol. 66, no. 5, pp. 715-724.
Hunt, M.A., Birmingham, T.B., Giffin, J.R., Jenkyn, T.R. (2006). Associations among
knee adduction moment, frontal plane ground reaction force, and lever arm during
walking in patients with knee osteoarthritis. Journal of Biomechanics, vol. 39, pp. 2213-
2230.
Hunter, S., Dolan, M.G., Davis, J.M. (1995). Foot Orthotics and Therapy in Sport. USA:
Human Kinetics.

[405]
Hunter, D.J., March, L., Sambrook, P.N. (2003). The association of cartilage volume with
knee pain. Osteoarthritis and Cartilage, vol. 11, pp. 725-729.
Hurley, B.F., Roth, S.M. (2000). Strength Training in the Elderly: Effects on Risk Factors
for Age-Related Diseases. Sports Medicine, vol. 30, no. 4, 249-268.
Hurwitz, D.E., Ryals, A.B., Case, J.P., Block, J.A., Andriacchi, T.P. (2002). The knee
adduction moment during gait in subjects with knee osteoarthritis is more closely
correlated with static alignment than radiographic disease severity, toe out angle and pain.
Journal of Orthopaedic Research, vol. 20, no. 1, 101-107.
Hurwitz, D.E., Summer, D.R., Andriacchi, T.P., & Sugar, D.A. (1998). Dynamic knee
loads during gait predict proximal tibial bone distribution. Journal of Biomechanics, vol.
31, pp. 423-430.
Huson, A. (2000). Biomechanics of the tarsal mechanisms. A key to the function of the
normal human foot. Journal of the American Podiatric Medical Association, vol. 90, no.
1, pp. 12-21.
Huson, A., Van Langelaan, E.J., & Spoor, C.W. (1986). Tibiotalar delay and tarsal
gearing. Journal of Anatomy, vol. 149, pp. 244-245.
Hutson, M., & Speed, C. (2011). Sports Injuries. United Kingdom: Oxford University
Press.
Hutton, W.C., & Dhanendran, M. (1979). A study of the distribution of load under the
normal foot during walking. International Orthopaedics, vol. 3, no. 2, pp. 153-157.
Hyde, T.E., & Gengenbach, M.S. (1997). Conservative management of sports injuries.
Philadelphia: Lippincott Williams & Wilkins.
Imeokparia, R.L., Barrett, J.P., arrieta, M.I., Leaverton, P.E., Wilson, A.A., Hall, B.J., &
Marlowe, S.M. (1994). Physical Activity as a Risk Factor for Osteoarthritis of the Knee.
Annuals of Epidemiology, vol. 4, 221-230.
Inman, V. (1976). The joints of the ankle. Baltimore: Williams and Wilkins.
Irving, D.B., Cook, J.L., Young, M.A., & Menz, H.B. (2007). Obesity and pronated foot
type may increase the risk of chronic heel pain: a matched case-control study. BMC
Musculoskeletal Disorders, vol. 8, pp. 41.

[406]
Jackson, B.D., Teichtahl, A.J., Morris, M.E., Wluka, A.E., Davis, S.R., & Cicuttini, F.M.
(2004). The effect of the knee adduction moment on tibial cartilage volume and bone size
in healthy women. Rheumatology, vol. 43, pp. 311-314.
James, B., & Parker, A.W. (1989). Active and passive mobility of lower limb joints in
elderly men and women. American Journal of Physical Medicine, vol. 68, pp. 162-167.
Janakiramanan, N., Teichtahl, A.J., Wluka, A.E., Ding, C., Jones, G., & Davis, S.R.,
(2008). Static knee alignment is associated with the risk of unicompartmental knee
cartilage defects. Journal of Orthopaedic Research, vol. 26, pp. 225–30.
Jenkyn, T.R., Hunt, M.A., Jones, I.C., Giffin, J.R., & Birmingham, T.B. (2008). Toe out
gait in patients with osteoarthritis partially transforms external knee adduction moment
into flexion moment during early stance phase of gait: A tri-planar kinetic mechanism.
Journal of Biomechanics, vol. 41, no. 2, pp. 276-283.
Jenkins, D.B. (1998). Hollinshead’s Functional Anatomy of the Limbs and Back (Seventh
Edition). Pennsylvania: W.B. Saunders.
Johanson, M.A., Donatelli, R., Wooden, M.J., Andrew, P.D., & Cummings, G.S. (1994).
Effects of three different posting methods on controlling abnormal subtalar pronation.
Physical Therapy, vol. 74, no. 2, pp. 149-158.
Johnson, F., Leitl, S., & Waugh, W. (1980). The distribution of load across the knee: a
comparison of static and dynamic measurements. Journal of Bone and Joint Surgery, vol.
62, pp. 346-349.
Johnson, D.H., & Pedowitz, R.A. (2007). Practical Orthopaedic Sports Medicine and
Arthroscopy. USA: Lippincott Williams & Wilkins.
Jones, A. (2011). Switch off your brain, your plate is about to speak. The Independent,
Saturday 26th
November, 2011.
Jorgensen, U. (1990). Body load in heel-strike running: the effect of a firm heel counter.
American Journal of Sports Medicine, vol. 18, pp. 177–81.
Kahler, M.H.H., McGuire, J., Whitney, K., & Schumacher, H.R. (1998). Immediate effect
of foot orthoses on gait parameters in subjects with medial type knee osteoarthritis. In
Gait and Clinical Movement Analysis, San Diego: Gait and Posture.

[407]
Kakihana, W., Akai, M., Nakazawa, K., Naito, K., & Torii, S. (2007). Inconsistent knee
varus moment reduction caused by a lateral wedge in knee osteoarthritis. American
Journal of Physical Medicine and Rehabilitation, vol. 86, no. 6, pp. 446-454.
Kakihana, W., Akai, M., Nakazawa, K., Takashima, T., Naito, K., & Torii, S. (2005).
Effects of laterally wedged insoles on knee and subtalar joint moments. Archives of
Physical Medicine and Rehabilitation, vol. 86, pp. 1465-1471.
Kakihana, W., Akai, M., Yamasaki, N., Takashima, T., Nakazawa, K. (2004). Changes of
joint moments in the gait of normal subjects wearing laterally wedged insoles. American
Journal of Physical Medicine and Rehabilitation, vol. 83, pp. 273-283.
Kakihana, W., Torii, S., Akai, M., Nakazawa, K., Fukano, M., & Naito, K. Effect of a
lateral wedge on joint moments during gait in subjects with recurrent ankle sprain.
American Journal of Physical Medicine and Rehabilitation, vol. 85, pp. 858-864.
Kamm, L.J. (1995). Understanding Electro-mechanical Engineering. Ed 2. John Wiley
and Sons.
Kanis, J.A. (1996). Estrogens, the Menopause, and Osteoporosis. Bone, vol. 19, no. 5, pp.
185-190.
Kaufman, K.R., Hughes, C., Morrey, B.F., Morrey, M., An, K-N. (2001). Gait
characteristics of patients with knee osteoarthritis. Journal of Biomechanics, vol. 34, pp.
907-915.
Kenneth, D., & Brandt, M.D. (1997). Putting some muscle into Osteoarthritis. Annals of
Internal Medicine, vol. 127, no. 2, pp. 154-156.
Kernozek, T.W., & Richard, M.D. (1990). Foot placement and arch type: Effects on
rearfoot motion. Archives of Physical Medicine and Rehabilitation, vol. 71, pp. 998-991.
Kerrigan, D.C., Franz, J.R., Dicharry, J., Della Croce, U., & Wilder, R.P. (2009). The
effect of running shoes on lower extremity joint torques. P M & R, The Journal of Injury,
Function and Rehabilitation, vol. 1, pp. 1058-1063.
Kerrigan, D.C., Lelas, J.L., Goggins, J., Merriman, G.J., Kaplan, R.J., & Felson, D.T.
(2002). Effectiveness of a lateral-wedge insole on knee varus torque in patients with knee
osteoarhtirits. Archives of Physical Medicine and Rehabilitation, vol. 86, 1465-1471.

[408]
Kerrigan, D.C., Todd, M.K., & Della Croce, U. (1998). Gender differences in joint
biomechanics during walking. American Journal of Physical Medicine and
Rehabilitation, vol. 77, pp. 2–7.
Kibler, W.B., Goldberg, C., & Chandler, T.J. (1991). Functional biomechanical deficits in
running athletes with plantar fasciitis. American Journal of Sports Medicine, vol. 19, no.
1, pp.66-71.
Kilmartin, T.E., & Wallace, W.A. (1994). The scientific basis for the use of
biomechanical foot orthoses in the treatment of lower limb sports injuries – a review of
literature. British Journal of Sports Medicine, vol. 28, pp. 180-184.
Kim, S., Lockhart, T., & Yoon, H-Y. (2005). Relationship between age-related gait
adaptations and required coefficient of friction. Safety Science, vol. 43, pp. 425-436.
Kingston, B. (2000). Understanding Joints. A practical guide to their structure and
function. London: Stanley Thornes Publishers Ltd.
Kirtley, C. (2006). Clinical Gait Analysis: Theory and Practice. London: Elsevier
Churchill Livingstone.
Knapik, J.J., Feltwell, D., & Canham-Chervek, M. (2001). Evaluation of Injury Rates
During Implementation of the Fort Drum Running Shoe Injury Prevention Program.
Aberdeen Proving Ground, MD. US Army Center for Health Promotion and Prevention
Medicine. 12-MA-6558-01.
Knowler, W.C., Barrett-Connor, E., & Fowler, S.E. (2002). Reduction in the incidence of
type-2 diabetes with lifestyle intervention of metformin. The New England Journal of
Medicine, vol. 346, pp. 393-403.
Ko, S-U., Tolea, M.I., Hausdorff, J.M., Ferrucci, L. (2011). Sex-specific differences in
gait patterns of healthy older adults: Results from the Baltimore Longitudinal Study of
Aging. Journal of Biomechanics, vol. 44, pp. 1974-1979.
Kohatsu, N.D., Schurman, D.J. (1990). Risk factors for the development of osteoarthrosis
of the knee. Clinical Orthopaedics, vol. 261, pp. 242-246.
Kolt, G.S., & Snyder-Mackler, L. (2003). Physical therapies in sport and exercise.
Philadelphia: Churchill Livingstone.

[409]
Koplan, J.P., Rothenberg, R.B., Jones, E.L. (1995). The natural history of exercise: a 10-
yr follow-up of a cohort of runners. Medicine and Science in Sports and Exercise, vol. 27,
pp. 1180-1184.
Kornaat, P.R., Bloem, J.L., Ceulemans, R.Y.T., Rosendaal, F.R., Nelissen, R.G.,
O.Carter, W., LeGraverand, M-P.H., Kloppenburg, M. (2006). Osteoarthritis of the Knee:
Assocations between Clinical Features and MR Imaging Findings. Radiology, vol. 239,
pp. 811-817.
Kraan, P., & Berg, W.B. (2007). Osteophytes: relevance and biology. Osteoarthritis and
Cartilage, vol. 15, pp. 237-244.
Krassas, G.E., & Papadopoulou, Ph. (2001). Oestrogen action on bone cells. Journal of
Musculoskeletal Neurone Interaction, vol. 2, no. 2, pp. 143-151.
Krohn, K. (2005). Footwear alterations and bracing as treatments for knee osteoarthritis.
Current Opinion in Rheumatology, vol. 17, no. 5, pp. 653-656.
Kuitunen, S., Komi, P.V., & Kyrolainen, H. (2002). Knee and ankle joint stiffness in
sprint running. Medicine and Science in Sports and & Exercise, vol. 34, no. 1, pp. 166-
173.
Kujala UM, Kettunen J, Paananen H. (1995). Knee osteoarthritis in former runners,
soccer players, weight lifters, and shooters. Arthritis and Rheumatism, vol. 38, pp. 539–
346.
Kumar, S. (2004). Muscle Strength. London: Taylor & Francis.
Kurz, M.J., & Stergiou, N. (2003). The spanning set indicates that variability during the
stance period of running is affected by footwear. Gait and Posture, vol. 17, pp. 132-135.
Lafortune, M.A., & Hennig, E.M. (1992). Cushioning properties of footwear during
walking: accelerometer and force platform measurements. Clinical Biomechanics, vol. 7,
no. 3, pp. 181-184.
Lafortune, M.A., Hennig, E., & Valiant, G.A. (1995). Tibial shock measured with bone
and skin mounted transducers. Journal of Biomechanics, vol. 28, pp. 989-993.
Lambert, C.P., & Evans, W.J. (2002). Effects of aging and resistance exercise on
determinants of muscle strength. Journal of American Aging Association, vol. 25, pp. 73-
78.

[410]
Landells, J.W. (1953). The bone cysts of osteoarthritis. Journal of Bone and Joint
Surgery, vol. 35, 643–649.
Landry, S.C., McKean, K.A., Hubley-Kozey, C.L., Stanish, W.D., & Deluzio, K.J.
(2007). Knee biomechanics of moderate OA patients measured during gait at a self-
selected and fast walking speed. Journal of Biomechanics, vol. 40, no. 8, pp. 1754-1761.
Landry, S.C., McKean, K.A., Hubley-Kozey, C.L., Stanish, W.D., & Deluzio, K.J.
(2007). Knee Biomechanics of moderate OA patients measured during gait at a self-
selected and fast walking speed. Journal of Biomechanics, vol. 40, 1754-1761.
Lanyon, P., Muir, K., Doherty, S., Doherty, M. (2000). Assessment of a geriatric
contribution to Osteoarthritis of the hip: Sibling Study. British Medical Journal, vol. 321,
no. 7270, pp. 1179-1183.
Larish, D.D., Martin, P.E., Mungiole, M. (1987). Characteristic patterns of gait in the
healthy old. Annuals of New York Academy of Sciences, vol. 515, pp. 18-32.
Lark, S., Buckley, J., Bennett, S., Jones, D., Sargeant, A. (2003). Joint torques and
dynamic joint stiffness in elderly and young men during stepping down. Clinical
Biomechanics, vol. 18, pp. 848-855.
Larsson, L., Grimby, G., & Karlsson, J. (1979). Muscle strength and speed of movement
in relation to age and muscle morphology. Journal of Applied Physiology, vol. 46, pp.
451-456.
Latash, M.L., & Zatsiorsky, V.M. (1993). Joint stiffness: Myth or Reality. Human
Movement Science, vol. 12, pp. 653-692.
Laughton, C.A., McClay Davis, I., & Hamill, J. (2003). Effect of Strike Pattern and
Orthotic Intervention on Tibial Shock During Running. Journal of Applied Biomechanics,
vol. 19, no. 2, pp. 153-168.
Lee, K-K., Lafortune, M., & Valiant, G. (2007). Effect of running shoes on mechanics of
overground and treadmill running. Biomechanics Laboratory, Nike Research Laboraory,
USA.
Lees, A., & McCullagh, P.J. (1984). A preliminary investigation into the shock
absorbency of running shoes and shoe inserts. Journal of Human Movement Studies, vol.
10, pp. 95-106.

[411]
Lephart, S.M., Ferris, C.M., Riemann, B.L., Myers, J.B., & Fu, F.H. (2002). Gender
differences in strength and lower extremity kinematics during landing. Clinical
Orthopaedic related Research, August, vol. 401, pp. 162-169.
Lephart, S.M., & Fu, F.H. (2000). Proprioception and Neuromuscular Control in Joint
Stability. USA: Human Kinetics.
Levinger, P., Menz, H.B., Fotoohabadi, M.R., Feller, J.A., Bartlett, J.R., & Bergman,
N.R. (2010). Foot posture in people with medial compartment knee osteoarthritis. Journal
of Foot and Ankle Research, vol. 3, no. 29, pp.1-8.
Levinger, P., & Gilleard, W.L. (2005). The relationship between rearfoot eversion and
tibia internal rotation in patellofemoral pain syndrome individuals during walking. Gait
and Posture, June, vol. 21, no. 1, pp. 79.
Lewek, M.D., Rudolph, K.S., Snyder-Mackler, L. (2004). Control of frontal plane knee
laxity during gait in patients with medial compartment knee osteoarthritis. Osteoarthritis
and Cartilage, vol. 12, pp. 745-751.
Lewis, A., Stewart, C., Postans, N., & Trevelyan, J. (2007). Development of an
instrumented pole test for use as a gait laboratory quality check. Gait and Posture, vol.
26, pp. 317-322.
Lilley, K., Dixon, S., Stiles, V. (2011). A Biomechanical Comparison of the Running Gait
of Mature and Young Females. Gait and Posture, vol. 33, 3, pp. 496-500.
Lilley, K., Dixon, S., Stiles, V. (2011). The Influence of Motion Control Shoes on the
Running Gait of Mature and Young Females. Under review.
Lim, S., Joung, H., Shin, C.S., Lee, H.K., Kim, K.S., Shin, E.K., Kim, H.E., Lim, M-K.,
& Cho, S-II. (2004). Body composition changes with age have gender-specific impacts on
bone mineral density. Bone, vol. 35, pp. 792-798.
Lindle, R.S., Metter, E.J., Lynch, N.A., Fleg, J.L., Fozard, J.L., Tobin, J., Roy. T.A., &
Hurley, B.F. (1997). Age and gender comparisons of muscle strength in 654 women and
men aged 20-93 yr. Journal of Applied Physiology, vol. 83, pp. 1581-1587.
Liu, C.C., & Howard, G.A. (1991). Bone-cell changes in estrogen induced bone mass
increase in mice: dissociation of osteoclasts from bone surfaces. Anatomical Record, vol.
229, pp. 240-250.
[412]
Lui, J., & Lockhart, T.E. (2006). Comparison of 3D joint moments using local and global
inverse dynamic approached among three different age groups. Gait and Posture, vol. 23,
pp. 480-485.
Loeser, R.F. (2000). Aging and the etiopathogenesis and treatment of osteoarthritis.
Rheumatic Disease Clinics of North America, vol. 26, 547–567.
Loeser, R.F. (2010). Age-Related Changes in the Musculoskeletal System and the
Development of Osteoarthritis. Clinical Geriatric Medicine, vol. 26, no. 3, pp. 371-386.
Logan, A.L., & Rowe, L.J. (1994). The Knee: Clinical Applications. Maryland: Aspen
Publishers.
Lohman, E.B., Sackiriyas, K.S.B., & Swen, W. (2011). A comparison of the
spatiotemporal parameters, kinematics and biomechanics between shod, unshod, and
minimally supported running as compared to walking. Physical Therapy in Sport, vol. 12,
pp. 151-163.
Ly, L.P., & Handelsman, D.J. (2002). Muscle Strength And Aging: Methodological
Aspects Of Isokinetic Dynamometry and Androgen Administration (2002). Clinical and
Experimental Pharmacology and Physiology, vol. 29, no. 1-2, pp. 39-47.
MacLean, C., McClay Davis., & Hamill, J. (2006). Influence of a custom foot orthotic
intervention on lower extremity dynamics in healthy runners. Clinical Biomechanics, vol.
21, pp. 623-630.
Maffulli, N., Chan, K.M., Macdonald, R., Malina, R.M., & Parker, A.W. (2001). Sports
Medicine For Specific Ages and Abilities. London: Churchill Livingstone.
Mahajan, A., Tandon, V., Verma, S., & Sharma, S. (2005). Osteoarthritis and Menopause.
Journal of Indian Rheumatology Association, vol. 13, pp. 21-25.
Maheu, E., Dreiser, R.L., Guillou, G.B., & Dewailly, J. (2000). Hand osteoarthritis
patients characteristics according to the existence of a hormone replacement therapy.
Osteoarthritis and Cartilage, vol. 8, pp. 33–37.
Majumdar, S. (2010). Advances in MRI of the Knee for Osteoarthritis. USA: World
Scientific Publishing Co. Pte. Ltd.

[413]
Malinzak, R.A., Colby, S.M., Kirkendall, D.T., Yu, B., & Garrett, W.E. (2001). A
comparison of knee joint motion patterns between men and women in selected athletic
tasks. Clinical Biomechanics, vol. 16, pp. 438–445.
Malliaras, P., Cook, J., Kent, P (2006). Reduced ankle dorsiflexion range may increase
the risk of patella tendon injury among volleyball players. Journal of Science and
Medicine in Sport, vol. 9, pp. 304-309.
Maly, M.R., Culham, E.G., & Costigan, P.A. (2002). Static and dynamic biomechanics of
foot orthoses in people with medial compartment knee osteoarthritis. Clinical
Biomechanics, vol. 17, pp. 603-610.
Maquet, P.G.J. (1976). Biomechanics of the Knee. With Applications to the Pathogenesis
and the Surgical Treatment of Osteoarthritis. New York: Springer.
Marieb, E.N., & Hoehn, K. (2007). Human anatomy & physiology. USA: Benjamin-
Cummings Publishing Company.
Marigold, D.S., & Patla, A.E. (2008). Age-related changes in gait for multi-surface
terrain. Gait and Posture, vol. 27, pp. 689-696.
Martin, R., & Gestung, J. (2005). The Estrogen Alternative: A guide to natural hormone
balance. Vermont: Healing Arts Press.
Martin, R.B., Burr, D.B., Sharkey, N.A. (1998). Skeletal Tissue Mechanics. New York:
Springer-Verlag.
Martini, F.H., & Nath, J.L. (2008). Fundamentals of Anatomy & Physiology. Benjamin
Cummings.
McArdle, W.D., Katch, F.L., & Katch, V.L. (2001). Exercise Physiology. Baltimore:
Lipincote Williams & Wilkins.
McGinnis, P.M. (2005). Biomechanics of Sport and Exercise. USA: Human Kinetics.
McKean, K.A., Landry, S.L., Hubley-Kozey, C.L., Dunbar, M.J., Stanish, W.D., &
Deluzio, K.J. (2007). Gender differences exist in osteoarthritic gait. Clinical
Biomechanics, vol. 22, pp. 400-409.
McKenzie, D.C., Clement, D.B., & Taunton, J.E. (1985). Running shoes, orthotics, and
injuries. Sports Medicine, vol. 2, pp. 334–47.

[414]
McKeon, B.P., Bono, J.V., & Richmond, J.C. (2009). Knee Arthroscopy. New York:
Springer Science and Business Media, LLC.
McMahon, T.A., Valiant, G., Frederick, E. (1987). Groucho running. Journal of Applied
Physiology, vol. 62, pp. 2326-2337.
McNair, P.J., & Marshall, R.N. (1994). Kinematic and kinetic parameters associated with
running in difference shoes. British Journal of Sports Medicine, February, vol. 28, pp.
256-260.
McPoil, T.G. (2000). Athletic Footwear: design, performance and selection issues.
Journal of Science and Medicine in Sport, vol. 3, no. 3, pp. 260-267.
McQueen, M. (2007). A vital clue to deciphering bone pathology: MRI bone oedema in
rheumatoid arthritis and osteoarthritis. Annuals of Rheumatic Diseases, 66, pp. 1549-
1552.
McQueen, F, M., & Ostendorf, B. (2006). What is MRI bone oedema in rheumatoid
arthritis and why does it matter? Arthritis Research & Therapy, vol. 8, no. 6, pp. 222.
Mechelen, V.W. (1992). Running Injuries: A review of the epidemiological literature.
Sports Medicine, vol. 14, pp. 320-335.
Mechlelenm W V. (1992). Running injuries: a review of the epidemiological literature.
Sports Medicine, vol. 14, 320-335.
Menard, K.P. (2008). Dynamic Mechanical Analysis: A Practical Introduction. USA:
Taylor & Francis Group.
Mendelsohn, M.E. (2002). Protective effects of estrogen on the cardiovascular system.
The American Journal of Cardiology, June, vol. 89, no. 12, pp. 12-17.
Menkes, C.J., & Lane, N.E. (2004). Are Osteophytes good or bad? Osteoarthritis and
Cartilage, vol. 12, 53-54.
Messier, S.P., Davis, S.E., Curl, W.W., Lowery, R.B., & Pack, R.J. (1991). Etiologic
factors associated with patellofemoral pain in runners. Medicine and Science in Sports
and Exercise, vol. 23, pp. 1008–1015.
Messier, S.P., DeVita, P., Cowan, R.E., Seay, J., Young, H.C., & Marsh, A.P. (2005). Do
older adults with knee osteoarthritis place greater loads on the knee during gait? A

[415]
preliminary study. Archives of Physical Medicine and Rehabilitation, vol. 86, pp. 703-
709.
Meyer, D.C., Nyffeler, J.R.W., & Geber, C. (2004). In vivo tendon force tendon
measurement of 2-week duration in sheep. Journal of Biomechanics, vol. 37, pp. 135-140.
Middlekoop, M.V., Kolkman, J., Ochten, J.V., Bierma-Zeinstra, S.M.A., & Koes, B.W.
(2008). Risk factors for lower extremity injuries among male marathon runners.
Scandinavian Journal of Medicine & Science in Science in Sports, vol. 18, no. 6, pp. 691-
697.
Migliorini, S. (2011) Risk factors and injury mechanism in triathlon. Journal of Human
Sport and Exercise, vol. 6, no. 2, pp. 309-314.
Mikesky, A.E., Meyer, A., & Thompson, K.L. (2000). Relationship between quadriceps
strength and rate of loading during gait in women. Journal of Orthopaedic Research, vol.
18, no. 2, pp. 171-175.
Millar, A.L. (2003). Action Plan for Arthritis. USA: Human Kinetics.
Miller, D.I. (1990). Ground Reaction Forces in Distance Running. In P.R. Cavanagh
(ed.), Biomechanics of Distance Running (p. 203-223). Human Kinetics: Champaign, IL.
Miller, A.E., MacDougall, J.D., Tarnopolsky, M.A., & Sale, D.G. (1993). Gender
differences in strength and muscle fiber characteristics. European Journal of Applied
Physiology and occupational physiology, vol. 66, no. 3, pp. 254-262.
Miller, J.E., Nigg, B.M., Liu, W., Stefanyshyn, D.J., & Nurse, M.A. (2000). Influence of
foot, leg, and shoe characteristics on subjective comfort. Foot and Ankle International,
vol. 21, no. 9, pp. 759-767.
Mirkin, G. (2005). Arches and Running Injuries. Physician and Sports Medicine.
Miura, H., Takasugi, S-I., Kawano, T., Manabe, T., & Iwamoto, Y. (2009). Varus-Valgus
laxity correlates with pain in osteoarthritis of the knee. The Knee, pp. 30-32.
Miyazaki, T., Wafa, M., Kawahara, H., Sato, M., Baba, H., & Shimada, S. (2002).
Dynamic load at baseline can predict radiographic disease progression in medial
compartment knee osteoarthritis. Annuals of the Rheumatic Diseases, vol. 61, pp. 617-
622.

[416]
Mizuno, Y., Kumagai, M., Mattessich, S.M., Elias, J.J., Ramrattan, N., Cosgarea, A.J., &
Chao, E.Y.S. (2001). Q-angle influences tibiofemoral and patellofemoral kinematics.
Journal of Orthopaedic Research, vol. 19, 5, pp. 834-840.
Montgomery, P., & Connolly, B.H. (2002). Clinical Applications for Motor Control.
USA: SLACK inc.
Moore, K.L. (1992). Clinically Orientated Anatomy. Baltimore, USA: Willems &
Wilkins.
Moore, K.L., & Agur, A.M.R. (1995). Essential Clinical Anatomy. Maryland: Williams &
Wilkins.
Morio, C., Lake, M.J., Gueguen, N., Rao, G., & Baly, L. (2009). The influence of
footwear on foot motion during walking and running. Journal of Biomechanics, vol. 42,
pp. 2081-2088.
Moskowitz, R.W., Altman, R.D., Hochberg, J.A., & Goldberg, V.M. (2007).
Osteoarthritis: Diagnosis and Medical/Surgical Management. Philadelphia: Lippincott
Williams & Wilkins.
Moskowitz, R.W., Goldberg, V.M. (1987). Osteophyte evolution: studies in an
experimental partial meniscectomy model. Journal of Rheumatology, vol. 14, pp. 116–
118.
Moskowitz, R.W., Goldberg, V.M. (1987). Studies of osteophyte pathogenesis in
experimentally induced osteoarthritis. Journal of Rheumatology, vol. 14, pp. 311–320.
Motaung, S.C.K.M., & Pieterse, J.J. (2011). Expression of cartilage oligomeric matrix
protein in articular cartilage in response to bone morphogenetic protein-7 and tumour
necrosis factor. Medical Technology SA, vol. 25, no. 1, pp. 38 – 43.
Mow, V.C., & Huiskes, R. (2004). Basic Orthopaedic Biomechanics and Mechano-
biology. Lippincott Williams & Wilkins.
Mundermann, A., Dyrby, C.O., & Andriacchi, T.P. (2005). Secondary gait changes in
patients with medial compartment knee osteoarthritis: increased load at the ankle, knee,
and hip during walking. Arthritis and Rheumatism, vol. 52, pp. 2835-2844.

[417]
Mundermann, A., Nigg, B.M., Humble, R.N., Stefanyshyn, D.J. (2003). Foot Orthotics
affect lower extremity kinematics and kinetics during running. Clinical Biomechanics,
vol. 18, pp. 254-262.
Mundermann, A., Stefanyshyn, D.J., & Nigg, B.M. (2001). Relationship between
footwear comfort of shoe inserts and anthropometric and sensory factors. Medicine and
Science in Sports and Exercise, vol. 33, 1939.
Munro, C.F., Miller, D.I., & Fuglevand, A.J. (1987). Ground reaction forces in running:
A re-examination. Journal of Biomechanics, vol. 20, no. 2, pp. 147-155.
Murphy, D.F., Connolly, D.A.J., Beynnon, B.D. (2003). Risk factors for lower extremity
injury: a review of the literature. British Journal of Sports Medicine, vol. 37, pp. 13-29.
Murray, M.P., Dunthie, E.H., Gambert, S.R., Sepic, S.B., & Mollinger, L.A. (1985). Age-
related differences in knee muscle strength in normal women. Journal of Gerontology,
vol. 40, no. 3, pp. 275-280.
Murray, M.P., Kory, R.C., & Clarkson, B.H. (1969). Walking patterns in healthy old men.
Journal of Gerontology, vol. 24, pp. 169-178.
Myer, G.D., Ford, K.R., Khoury, J., Succop, P., & Hewett, T.E. (2011). Biomechanics
laboratory-based prediction algorithm to identify female athletes with high knee injury
loads that increase risk of ACL injury. British Journal of Sports Medicine, vol. 45, pp.
245-252.
Myerson, M.S. (1999). The diagnosis and treatment of injury to the tarsometatarsal joint
complex. The Journal of Bone and Joint Surgery, vol. 81B, pp. 756-763.
Naicker, M., McLean, M., Esterhuizen, T., & Peters-Futre, E. (2007). Poor peak
dorsiflexor torque associated with incidence of ankle injury in elite field female hockey
players. Journal of science and Medicine in Sport, vol. 10, no. 6, pp 363 – 371.
Nair, S.P., Gibbs. S., Arnold, G., Abboud, R., & Wang, W. (2010). A method to calculate
the centre of the ankle joint: A comparison with the Vicon® Plug-in-Gait model. Clinical
Biomechanics, vol. 25, no. 6, pp. 582-587.
Nakajima, K., Kakihana, W., Nakagawa, T., Mitomi, H., Hitika, A., Suzuki, R., Akai, M.,
Iwaya, T., Nakamura, K., & Fukui, N. (2009). Addition of an arch support improves the
biomechanical effect of a laterally wedged insole. Gait and Posture, vol. 29, pp. 208-213.

[418]
Nawoczenski, D.A., Cook, T.M., & Saltzman, C.L. (1995). The Effect of Foot Orthotics
on Three-Dimensional Kinematics of the Leg and Rearfoot During Running. Journal of
Orthopaedic & Sports Physical Therapy, vol. 21, no. 6, pp. 317-327.
Nester, C.J., Van Der Linden, Bowker, P. (2003). Effect of foot orthoses on the
kinematics and kinetics of normal walking gait. Gait and Posture, vol. 17, pp. 180-187.
Nigg, B.M. (1997). Impact forces in running. Current Opinions in Orthopaedics, vol. 8,
pp.43-47.
Nigg, B.M. (2001). The Role of Impact Forces and Foot Pronation: A New Paradigm.
Clinical journal of Sports Medicine, vol. 11, pp. 2-9
Nigg, B.M., Bahlsen, H.A., Luethi, S.M., & Stokes, S. (1987). The influence of running
velocity and midsole hardness on external impact forces in heel-toe running. Journal of
Biomechanics, vol. 20, pp. 951-959.
Nigg, B.M., Cole, G.K., & Nachbauer, W. (1993). Effects of arch height of the foot on
angular motion of the lower extremities in running. Journal of Biomechanics, vol. 26, no.
8, pp. 909-916.
Nigg, B.M., Denoth, J., & Neukomm, P.A. Quantifying the load on the human body:
problems and some possible solutions. In: Morecki A, Fidelus K, Kedzior K, et al,
editors. Biomechanics VII-B. Baltimore (MD): University Park; 1981. p. 88–99.
Nigg, B.M., Fisher, V., Ronsky, J.L. (1994). Gait characteristics as a function of age and
gender. Gait and Posture, vol. 2, 213-220.
Nigg, B.M., & Herzog, W. (1994). Biomechanics of the musculo-skeletal system. John
Wiley & Sons, Ltd.
Nigg, B.M., Herzog, W., & Read, L.J. (1988). Effect of viscoelastic shoe on vertical
impact forces in heel-toe running, American Journal of Sports Medicine, January, 16 (1),
pp. 70-76.
Nigg, B.M., Nurse, M.A., & Stefanyshyn, D. (1998). Effect of shoe insert construction on
foot and leg movement. Medicine and Science in Sports and Exercise, vol. 30, no. 4, pp.
550-555.

[419]
Nigg, B.M., Nurse, M.A., Stefanyshyn, D.J. (1999). Shoe inserts and orthotics for sport
and physical activities. Medicine and Science in Sports and Exercise, vol. 31, no. 7, pp.
421-428.
Nigg, B.M., Stergiou, P., Cole, G., Stefanyshyn, D., Mundermann, A., & Humble, N.
(2003). Effect of shoe inserts on kinematics, centre of pressure, and leg joint moments
during running. Medicine and Science in Sports and Exercise, vol. 35, pp. 314-319.
Noakes, T., & Granger, S. (1996). Running Injuries. Cape Town: Oxford University
Press.
Noe, D.A., Voto, S.J., Hoffman, M.S., Askew, I.A.J., & Gradisar, I.A. (1993). Role of the
calcaneal heel pad and polymeric shock absorbers in attenuation of heel strike impact.
Journal of Biomedical Engineering, vol. 15, pp. 23-26.
Noehren, B., Davis, I., & Hamill, J. (2007). ASB clinical biomechanics award winner
2006 prospective study of the biomechanical factors associated with iliotibial band
syndrome. Clinical Biomechanics, vol. 22, no. 9, pp. 951-956.
Nordin, M., & Frankel, V.H. (1989). Basic Biomechanics of the Musculoskeletal System.
USA: Williams & Wilkins.
Norris, C. (2004). Sports Injuries: Diagnosis and Management. London: Butterworth
Heinemann.
Novacheck, T.F. (1998) The Biomechanics of Running. Gait and Posture, vol. 7, pp. 77-
95.
Novick, A., & Kelley, D.L. (1990). Position and movement changes of the foot with
orthotic intervention during the loading response of gait. Journal of Orthopaedic Sports
Physical Therapy, vol. 11, pp. 301-312.
Noyes, F.R., Dunworth, L.A., Andriacchi, T.P., Andrews, M., & Hewett, T.E. (1996).
Knee Hyperextension Gait Abnormalities in Unstable Knees: Recognition and
Preoperative Gait Retraining. American Journal of Sports Medicine, vol. 24, no. 1, pp.
35-45.
Noyes, F.R., & Grood, E.S. (1976). The strength of the anterior cruciate ligament in
humans and Rhesus monkeys. The Journal of Bone and Joint Surgery, American Volume,
vol. 58, no. 8, pp.1074-1082.

[420]
Noyes, F.R., Schipplein, O.D., Andriachhi, T.P., Saddemi, S.R., & Weise, M. (1992). The
anterior cruciate ligament-deficient knee with varus alignment: an Analysis of gait
adaptations and dynamic joint loadings. American Journal of Sports Medicine, vol. 20 no.
6, pp. 707–716.
Oatis, C.A., Wolff, E.F., Lennon, S.K. (2006). Knee Joint Stiffness in Individuals with
and Without Knee Osteoarthritis: A Preliminary Study. Journal of Orthopaedic and
Sports Physical Therapy, vol. 36, no. 12, pp. 935-941.
O’Connor, K.M., & Hamill, J. (2004). The role of selected extrinsic foot muscles during
running. Clinical Biomechanics, vol. 19, pp. 71-77.
Olsen, J.E. (2003). Data Quality. The Accuracy Dimension. Ed 5 Illustrated. Morgan
Kaufmann.
Ounpuu, S. (1994). The Biomechanics of walking and running. Clinical Sports Medicine,
vol. 13, no. 4, pp. 843 – 863.
Patla, A.E., Robinson, C., Samways, M., & Armstrong, C.J. (1989). Visual control of step
length during overground locomotion: task specific modulation of the locomotor
syndergy. Journal of Experimental Psychology: Human Perception and Performance,
vol. 1, pp. 603-617.
Payton, C., & Bartlett, R. (2008). Biomechanical evaluation of movement in sport and
exercise. Routledge.
Pearson, M.B., Bassey, E.J., & Bendall, M.J. (1985). The effects of age on muscle
strength and anthropometric indices within a group of elderly men and women. Age and
Aging, vol. 14, no. 4, pp. 230-234.
Perry, J. (1992). Gait analysis: Normal and pathological function. Thorofare, NJ: Slack,
Inc.
Perry, S.D., & Lafortune, M.A. (1995). Influences of inversion/eversion of the foot upon
impact loading during locomotion. Clinical Biomech, vol. 95, no. 10, pp. 253-257.
Pessis, E., Drape, J-L., Ravaud, P., Chevrot, A., Dougados, M., & Ayral, X. (2003).
Assessment of progression in knee osteoarthritis: results of a 1 year study comparing
arthroscopy and MRI. Osteoarthritis and Cartilage, vol. 11, pp. 361-369.

[421]
Pezzack, J.C., Norman, R.W., & Winter, D.A. (1977). An assessment of derivative
determining techniques used for motion analysis. Journal of Biomechanics, vol. 10, pp.
377-382.
Pollard, C.D., Davis, I.M., & Hamill, J. (2004). Influence of gender on hip and knee
mechanics during a randomly cued cutting manoeuvre. Clinical Biomechanics, vol. 19,
pp. 1022-1031.
Pollock, K.M. (2001). Exercise in treating depression: broadening the psychotherapist’s
role. Journal of Clinical Psychology, vol. 57, pp. 1289-1300.
Pope, R., Herbert, R., & Kirwan, J. (1998). Effects of ankle dorsiflexion range and pre-
exercise calf muscle stretching on injury risk in Army recruits. Australian Journal of
Physiotherapy, vol. 44, no. 3, pp. 165-172.
Pottenger, L.A., Phillips, F.M., & Draganich, L.F. (1990). The effect of marginal
osteophytes on reduction of varus-valgus instability in osteoarthritic knees. Arthritis and
Rheumatism, vol. 33, 853-858.
Radin, E.L., Yang, K.H., Riegger, C., Kish, V.L., & O’Connor, J.J. (1991). Relationship
between lower limb dynamics and knee joint pain. Journal of Orthopaedic Research, vol.
9, pp. 398-405.
Radin. E. L., Parker. H. G.. Pugh, J. W..Steinberg. R. S.. Paul, 1. L. & Rose. R. M.
(1973). Response of joints to impact loading. Journal of Biomechanics, vol. 6, pp. 51-57.
Radin, E.L., Yang, KH., Reigger, C., Kish, V.L., & O’Connor, J.J. (1991). Relationship
between lower limb dynamics and knee joint pain. Journal of Orthopaedic Research, vol.
9, no. 3, 398-405.
Radzimski, A.O., Mundermann, A., & Sole, G. (2011). Effect of footwear on the external
knee adduction moment – a systematic review. The Knee, In Press.
Ramig, D., Shadle, J., & Watkins, A. (1980). The Foot and Sports Medicine:
Biomechanical foot faults as related to chondromalacia patellae. Journal of Orthopaedic
Sports Physical Therapy, vol. 2, pp. 48-50.
Rauh, M.J., Koepsell, T.D., Rivara, F.P., Margherita, A.J., & Rice, S.G. (2006).
Musculoskeletal Injuries among High School Cross-Country Runners. American Journal
of Epidemiology, vol. 163, no. 2, pp. 151-159.

[422]
Rauh, M.J., Koepsell, T.D., Rivara, F.P., Rice, S.G., & Margherita, A.J. (2007).
Quadriceps Angle and Risk of Injury Among High School Cross-Country Runners.
Journal of Orthopaedic Sports Physical Therapy, vol. 37, no. 12, pp. 725-733.
Reilly, K., Barker, K., Shamley, D., Sandall, S. (2006). Influence of foot characteristics
on the site of lower limb osteoarthritis. Foot and Ankle International, vol. 27, pp. 206-
211.
Reinschmidt, C., van den Bogert, A.J., Lundberg, A., Nigg, B.M., Murphy, N., Stacoff,
A., & Stano, A. (1997). Tibiofemoral and tibiocalcaneal motion during walking: external
vs. Skeletal markers. Gait and Posture, October, vol. 6, no. 2, pp. 98-109.
Requa, R.K., Deavilla, L.N., & Garrick, J.G. (1993). Injuries in Recreational Adults.
American Journal of Sports Medicine, vol. 21, no. 3, pp. 461-467.
Rhaney, K., & Lamb, D.W. (1955). The cysts of osteoarthritis of the hip. The Journal of
Bone and Joint Surgery, vol. 37B, no 4, pp. 663-675.
Richards, J. (2008). Biomechanics in Clinics and Research. Edinburgh: Churchill
Livingstone.
Richards, J., Jones, R., & Kim, W. (2006). Biomechanical Changes in the Conservative
Treatment of Medial Compartment OA of the knee using Valgus Bracing. International
Cartilage Repair Society, June
Richards, C.E., Magin, P.J., & Callister, R. (2009). Is your prescription of distance
running shoes evidence-based? British Journal of Sports Medicine, vol. 43, 159-162.
Riegger-Krugh, C., & Keysor, J.J. (1996). Skeletal malalignment of the lower quarter:
correlated and compensatory motions and postures. Journal of Orthopaedic Sports
Physical Therapy, vol. 23, pp. 164-170.
Riskowski, J., Dufour, A.B., & Hannan, M.T. (2011). Arthritis, Foot Pain & Shoe Wear:
Current Musculoskeletal Research on Feet. Current Opinions in Rheumatology, vol. 23,
no. 2, pp.148-155.
Roach, K.E., & Miles, T.P. (1991). Normal Hip and Knee Active Range of Motion: The
Relationship to Age. Physical Therapy, vol. 71, no. 9, pp. 656-665.
Robergs, R.A., & Keteyian, S.J. (2003). Fundamentals of Exercise Physiology For
Fitness Performance and Health. USA: McGraw Hill Companies, Inc.

[423]
Robertson, G., Caldwell, G., Hamill, J., & Kamen, G. (2004). Research Methods in
Biomechanics. USA: Humans Kinetics.
Roemhildt, M.L., Coughlin, K.M., Peura, G.D., Fleming, B.C., & Beynnon, B.D. (2006).
Material properties of articular cartilage in the rabbit tibial plateau. Journal of
Biomechanics, vol. 39, no. 12, pp. 2331-2337.
Roemhildt, M.L., Coughlin, K.M., Peura, G.D., Badgerm G.J., Churchill, D., Fleming,
B.C., & Beynnon, B.D. (2010). Effects of increased chronic loading on articular cartilage
material properties in the Lapine tibio-femoral joint. Journal of Biomechanics, vol. 43,
pp. 2301-2308.
Roislien, J., Skare, O., Gustavsen, M., Broch, N. L., Reinnie, L., Orpheim, A. (2009).
Simultaneous estimation of effects gender, age and walking speed on kinematic gait data.
Gait and Posture, vol. 30, pp. 441-445.
Roos, E.M., & Toksvig-Larsen, S. (2003). Knee Injury and Osteoarthritis Outcome Score
(KOOS) – Validation and Comparison to the WOMAC in total knee replacement. Health
and Quality of Life Outcomes, vol. 1, pp. 17.
Root, M.L., Orien, W.P., & Weed, J.H. (1977). Normal and abnormal function of the
foot: clinical biomechanics. Los Angeles: Clinical Biomechanics Corp.
Root, M.L., Weed, J.H., Sgarlato, T.E., Bluth, D.R. (1966). Axis of motion of the subtalar
joint. Journal of American Podiatric Association, vol. 56, pp. 149-155.
Rose, A., Birch, I., & Kuisma, R. (2011). Effect of motion control running shoes
compared with neutral shoes on tibial rotation during running. Physiotherapy, vol. 97, pp.
250-255.
Rougier, P.R., Lachaume, F., Bourse, J., rogeon, M., Monti, A., Regueme, S.C. (2009).
Wearing shoes increasing dorsiflexion improves short-term but not long-term balance
control in young healthy adults. Journal of Biomechanics, vol. 42, 2268-2272.
Rudolph, K.S., Schmitt, L.C., Lewek, M.D. (2007). Age-related changes in strength, joint
laxity and walking patterns: Are they related to knee osteoarthritis? Physical Therapy,
vol. 87, no. 11, 1422-1432.
Runner’s World, (2010). Motion Control Shoes Review: Adidas Supernova Sequence.
UK.

[424]
Rupert, M., Grood, E., Byczkowski, T., & Levy, M. (1998). Influence of sensor size on
the accuracy of in vivo ligament and tendon force measurements. Journal of
Biomechanical Engineering, vol. 120, pp. 764–769.
Russell, E.M., & Hamill, J. (2010). Knee OA and obesity: A cyclical clinical challenge.
Lower Extremity Review.
Russell, E.M., Gruber, A., O’Connor, K., Can Emmerik, R., & Hamill, J. (2009). Wedged
footwear perturbations affect lower extremity coordination dynamics. ISBS Conference
Proceedings Archive, 27 International Conference on Biomechanics in Sports.
Rybski, M. (2004). Kinesiology for occupational therapy. Thorofare, USA: SLACK Inc.
Sabatini, M., Pastoureau, P., & De Ceuninck, F. (2004). Cartilage and Osteoarthritis,
Volume One. USA: Human Kinetics.
Sahrmann, S.A. (2002). Diagnosis and Treatment of Movement Impairment Syndromes.
USA: Mosby.
Sangha, O. (2000). Epidemiology of rheumatic diseases. Rheumatology, vol. 39, pp. 3-12.
Scheirman, G., & Aoki, K. (1999). Performance Comparison Between the Peak Motus 3-
D Optical Motion Capture and Automatic tracking Motion Measurement Systems.
International Report, Peak Performance Technologies, Inc., Englewood, Colorado, USA.
Scher, D.L., Belmont, P.J., & Owens, B.D. (2010). The epidemiology of Plantar Fasciitis.
Lower Extremity Review, April.
Schipplein, O.D., & Andriacchi, T.P. (1991). Interaction between active and passive knee
stabilisers during level walking. Journal of Orthopaedic Research, vol. 9, pp. 113-119.
Schmalz, T., Blumentritt, S., Drewitz, H., & Freslier, M. (2006). The influence of sole
wedges on frontal plane knee kinetics, in isolation and in combination with representative
rigid and semi-rigid ankle-foot-orthoses. Clinical Biomechanics, vol. 21, pp. 631-639.
Schmidt, R.A., & Lee, T.D. (1999). Motor Control and Learning, Ed 3. USA: Human
Kinetics.
Schmitt, L.C., & Rudolph, K.S. (2007). Influences on Knee Movement Strategies During
Walking in Persons with Medial Knee Osteoarthritis, Arthritis Rheumatism, August, vol.
57, no. 6, pp. 1018-1026.

[425]
Scott, L., Ferris, C.M., Riemann, B.L., Myers, J., & Fu, F. (2002). Gender Differences in
Strength and Lower Extremity Kinematics During Landing, Clinical Orthopaedics &
Related Research, August, vol. 401, pp. 162-169.
Scott, G., Menz, H.B., & Newcombe, L. (2007). Age-related differences in foot structure
and function. Gait and Posture, vol. 26, pp. 68-75.
Schaffler, M.B., Radin, E.L., & Burr, D.B. (1989). Mechanical and morphological effects
of strain rate on fatigue of compact bone. Bone, vol. 10, no. 3, pp. 207-214.
Seidel, G.K., Marchinda, D.M., Dijkers, M., & Soutas-Little, R.W. (1995). Hip Joint
Center Location from Palpable Bony Landmarks – A Cadaver Study. Journal of
Biomechanics, vol. 28, no. 8, pp. 995-998.
Shakoor, N., Lidtke, R.H., Sengupta, M., Fogg, L.F., & Block, J.A. (2008). Effects of
specialised footwear on joint loads in osteoarthritis of the knee. Arthritis and
Rheumatism, vol. 15, pp. 1214-1220.
Shambaugh, J.P., Klein, A., & Herbert, J.H. (1991). Structural measures as predictors of
injury in basketball players. Medicine and Science in Sports and Exercise, vol. 23, pp.
522-527.
Shariatmadari, M.R., English, R., & Rothwell, G. (2010). A review of developments into
therapeuatic running footwear research. Procedia Engineering, vol. 2, pp. 2811-2816.
Sharma, L., Lou, C., Felson, DT., Dunlop, DD., Kirwan-Mellis, G., Hayes, KW. (1999).
Laxity in healthy and osteoarthritis knees. Arthritis Rheumatism, vol. 42, 861-870.
Sharma, L., Song, J., Felson, D.T., Cahue, S., Shamiyeh, E., & Dunlop, D.D. (2001). The
role of knee alignment in disease progression and functional decline in knee
osteoarthritis. Journal of the American Medical Association, vol. 286, 188-195.
Shaw, A.H. (1975). The effects of a forefoot post on gait and function. Journal of the
American Podiatric Association, vol. 65, pp. 238-242.
Shelburne, K.B., Torry, M.R., Pandy, M.G. (2006). Contributions of muscles, ligaments,
and the ground-reaction force to tibiofemoral joint loading during normal gait. Journal of
Orthopaedic Research, October, vol. 24, no. 10, pp. 1983-1990.

[426]
Shelburne, K.B., Torry, M.R., Steadman, R., & Pandy, M.G. (2008). Effects of foot
orthoses and valgus bracing on the knee adduction moment and medial joint loading
during gait. Clinical Biomechanics, vol. 23, pp. 814-821.
Sherwood, L. (2007). Human Physiology: from cells to systems. Thomson/Brooks/Cole.
Shmalz, T., Blumentritt, S., Drewtz, H., & Freslier, M. (2006). The influence of sole
wedges on frontal plane knee kinetics, in isolation and in combination with representative
rigid and semi-rigid ankle-foot-orthoses. Clinical Biomechanics, vol. 21, pp. 631-639.
Shorten, M.R. (2000). Running Shoe Design: Protection and Performance. Marathon
Medicine, vol. 159-169.
Shultz, R., & Jenkyn, T. (2011). Determining the maximum diameter for holes in the shoe
without compromising shoe integrity when using a multi-segment foot model. Medical
Engineering and Physics, vol. 34, 1, pp. 118-122.
Siegler, S., Allard, P., Kirtley, C., Rosenbaum, D., & Whittle, M.A. (1995). A joint
coordinate system for the ankle complex. International society for Biomechanics, vol. 59,
pp.6-8.
Siegler, S., Chen, J., & Schneck, C.D. (1988). The three-dimensional kinematics and
flexibility charecteristics of the human ankle and subtalar joints – Part 1 (kinematics).
Journal of Biomechanical Engineering, vol. 110, pp. 364-373.
Skinner, H.B. (1995). Current Diagnosis and Treatment in Orthopaedics. USA:
McGraw-Hill Proffessional.
Slemenda, C., Heilman, D.K., Brandt, K.D., Katz, B.P., Mazzuca, S.A., Braunstein, E.M.,
Byrd, D. (2004). Reduced quadriceps strength relative to body weight: A risk factor for
knee osteoarthritis in women? Arthritis and Rheumatism, vol. 41, no. 11, pp. 1951-1959.
Sloane, E. (2002). Biology of Women. Thomson Delmar Learning.
Smith, R.K., Birch, H., Patterson-Kane, J., Firth, E.C., Williams, L., Cherdchutham, W.,
Weeren, W.R., & Goodship, A.E. (1999). Should equine athletes commence training
during skeletal development?: Changes in tendon matrix associated with development,
ageing, function, and exercise. Equine Vetinary Journal, vol. 31, no. 30, pp. 201-209.

[427]
Smith, L.S., Clarke, T.E., Hamill, C.L., & Santopietro, F. (1986). The effects of soft and
semi-rigid orthoses upon rearfoot movement in running. Journal of the American
Podiatric Medical Association, vol. 76, pp. 227-230.
Soutas-Little, R.W., Beavis, G.C., Vertraet, M.C., & Markus, T.L (1987). Analysis of
foot motion during running using a joint co-ordinate system. Medicine and Science in
Sports and Exercise, vol. 19, pp. 285-293.
Souza, T.R., Pinto, R.Z., Trede, R.G., Kirkwood, R.N., Pertence, A.E., & Fonseca, S.T.
(2009). Late rearfoot eversion and lower-limb internal rotation caused by changes in the
interaction between forefoot and support surface. Journal of American Podiatric Medical
Association, vol. 99, pp. 303-511.
Spector, T.D., & Hart, D.J. (1992). How serious is knee osteoarthritis? Annuals of
Rheumatism Disability, vol. 51, no. 10, pp. 1105-1106.
Spurgeon, B.E.J. (2005). Do running shoes protect all runners? Journal of Sports Science
and Medicine, vol. 4, pp. 617.
Srinivasan, M., & Ruina, A. (2006). Computer optimisation of a minimal biped model
discovers walking and running. Nature, vol. 436, no. 5, pp. 72-75.
Stackhouse, C.L., McClay-Davis, I., & Hamill, J. (2004). Orthotic intervention in forefoot
and rearfoot strike running patterns. Clinical Biomechanics, vol. 19, pp. 64-70.
Stacoff, A., Nigg, B.M., Reinschmidt, C., Bogert, A.J.V-B., & Lundberg, A. (2000).
Tibiocalcaneal kinematics of barefoot versus shod running. Journal of Biomechanics, vol.
33, 1387-1395.
Stacoff, A., Reinschmidt, C., Nigg, B.M., Bogert, V.D., Anton, J., Lundberg, A., Denoth,
J., & Edgar, S. (2001). Effects of shoe sole construction on skeletal motion during
running. Medicine and Science in Sports and Exercise, vol. 33, no. 2, pp. 311-319.
Stacoff, A., Reinschmidt, C., & Nigg, B.M. (2000) Effect of foot orthoses on skeletal
motion during running. Clinical Biomechanics, vol. 15, pp. 54-64.
Staheli, L.T., Chew, D.E., & Corbett, M. (1987). The longitudinal arch. A survey of eight
hundred and eighty-two feet in normal children and adults. Journal of Bone and Joint
Surgery, vol. 69, pp.426-428.

[428]
Steif, F., Bohm, H., Schwitz, A., Dussa, C.U., & Doderlein, L. (2011). Dynamic loading
of the knee and hip joint and compensatory strategies in children and adolescents with
varus malalignment. Gait and Posture, vol. 33, 3, pp. 496-495.
Stefanyshyn, D.J., Stergiou, P., Lun, V.M.Y., Meeuwisse, W.H., & Nigg, B.M. (1999).
Knee joint moments and patellofemoral pain syndrome in runners part 1: a case control
study; part 2: a prospective cohort study. Proc. 4th
Symposium on Footwear
Biomechanics, Canmore, Canada, 1999. Pp. 86-87.
Stephens, MPA., Martire, L.M., Cremeans-Smith, J.K., Druley, J.A., & Wonjo, W.C.
(2006). Older women with osteoarthritis and their caregiving husbands: Effects of pain
and pain experience on husbands’ well-being and support. Rehabilitation Psychology,
Feb, vol. 5, no. 1, pp. 3-12.
Stergiou, N., Bates, B.T., & James, S.L. (1999). Asynchrony between subtalar and knee
joint function during running. Medicine & Science in Sports & Exercise, vol. 31,
(11), November, pp. 1645.
Subotnick, S.S. (1983). Foot orthotics: an update. The Physician & Sportsmedicine, vol.
11, 103-109.
Sweden, N. (2001). Women’s Sports Medicine and Rehabilitation. USA: Lippincott
Williams & Williams.
Syed, I.Y., & Davis, B.L. (2000). Obesity and Osteoarthritis of the knee: hypotheses
concerning the relationship between ground reaction forces and quadriceps fatigue in
long-duration walking. Medical Hypotheses, vol. 54, no. 2, pp. 182-185.
Taunton, J.E., McKenzie, D.C., & Clement, D.B. (1988). The role of biomechanics in the
epidemiology of injury. Sports Medicine, vol. 6, pp. 107-120.
Taunton, J.E., Ryan, M.B., Clement, D.B., McKenzie, D.C., Lloyd-Smith, D.R., &
Zumbo, B.D. (2002). A retrospective case-control analysis of 2002 running injuries.
British Journal of Sports Medicine, vol. 36, pp. 95-101.
Teichtahl, A.J., Morris, M.E., Wluka, A.E., Baker, R., Wolfe, R., Davis, S.R., &
Cicuttini, F.M. (2006). Foot rotation – A Potential target to modify the knee adduction
moment. Journal of Science and Medicine in Sport, vol. 9, pp. 67-71.
[429]
Teitz, C.C., & Kilcoyne, R.F. (1998). Premature osteoarthritis in professional dancers.
Clinical Journal of Sports Medicine, vol. 8, no. 4, pp. 255-259.
Thompson, P.D., Buchner, D., Pina, I.L., Balady, D.J., Williams, M.A., Marcus, B.H.,
Berra, K., Blair, S.N., Costa, F., Frankin, B., Fletcher, G.F., Gordon, N.F., Pate, R.R.,
Rodriguez, B.L., Yancey, A.K., & Wenger, N.K. (2003). Exercise and Physical Activity
in the Prevention and Treatment of Atherosclerotic Cardiovascular Disease.
Arteriosclerosis, Thrombosis, and Vascular Biology, vol. 23, pp. 42-49.
Tiberio, D. (1987). The effect of excessive subtalar joint pronation on patellofemoral
mechanics: a theoretical model. Journal of Orthopaedic Sports Physical Therapy, vol. 9,
pp. 160-165.
Tiderius, C.J., Olsson, L.E., Leander, P., Ekberg, O., & Dahlberg, L. (2003). Delayed
Gadolinium-Enhanced MRI of Cartilage (dGEMRIC) in Early Knee Osteoarthritis.
Magnetic Resonance in Medicine, vol. 49, pp. 488-492.
Totora, G.J., & Grabowski, S.R. (2003). Principles of Anatomy and Physiology.
Hoboken: John Wiley & Sons.
Tsung, B.Y.S., Zhang, M., Mak, A.F.T., & Wong, M.W.N. (2004). Effectiveness of
insoles on plantar pressure redistribution. Journal of Rehabilitation Research
Development, vol. 41, no. 6A, pp. 767-774.
Van Gent, R. N., Siem, D., Van Middelkoop, M., Van Os, A. G., Bierma-Zeinstra, S. M.,
& Koes, B. W. (2007). Incidence and determinants of lower extremity running injuries in
long distance runners: a systematic review. British Journal of Sports Medicine, vol. 41,
pp. 469- 480.
Van Mechelen, W. (1992). Running injuries. A review of the epidemiological literature.
Sports Medicine, vol. 14, no. 5, pp. 320-335.
Van Middelkoop, M., Kolkman, J., Van Ochten, J., Bierma-Zeinstra, S. M., & Koes, B.
(2008a). Prevalence and incidence of lower extremity injuries in male marathon runners.
Scandinavian Journal of Medicine & Science in Sports, vol. 18, pp. 140-144.
Vaughn, C.L. (1982). Smoothing and differentiation of displacement-time data: an
application of splines and digital filtering. International Journal of Bio-Medical
Computing, vol. 13, pp. 375-386.

[430]
Vaughan, C.L., Davis, B.L., & O’Connor, J.C. (1999). Dynamics of Human Gait (Second
Edition). Cape Town: Kiboho Publishers.
Viladot, A. (1992). Biomechanics of the subtalar joint. The Foot, vol. 2, pp. 83-88.
Weaver, L.J., & Ferg, M. (2010). Therapeutic measurement and testing. USA: Delmare
Cengage Learing.
Weinberg, R.S., & Gould, D. (2010). Foundations of Sport and Exercise Psychology
(Fifth Edition). USA: Human Kinetics.
Whittle, M.W. (2003). Gait Analysis: an introduction. London: Butterworth-Heinemann.
Whitbourne, S.K., & Whitbourne, S.B. (2011). Adult Development & Aging.
Biopsychosocial Perspectives. USA: John Wiley & Sons.
Willems, T.M., De Clercq, D., Delbaere, K., Vanderstraeten, G., De Cock, A., Witvrouw,
E. (2006). A prospective study of gait related risk factors for exercise-related lower leg
pain. Gait and Posture, vol. 23, 91-98.
Williams, D.S., McClay Davis, I., Scholz, J.P., Hamill J., Buchanan,T.S., (2003). Lower
extremity stiffness in runners with different foot types. Gait and Posture, in press.
Williams, D.S., McClay, I.S., Hamill, J. (2001). Arch structure and injury patterns in
runners. Clinical Biomechanics, vol. 16, no. 4, pp. 341-347.
Williams, J.A., Thonar, E.J. (1989). Early osteophyte formation after chemically induced
articular cartilage injury. American Journal of Sports Medicine, vol. 17, pp. 7-15.
Winby, C.R., Lloyd, D.G., Besier, T.F., & Kirk, T.B. (2009). Muscle and external load
contribution to knee joint contact loads during normal gait. Journal of Biomechanics, vol.
42, no. 14, pp. 2294-2300.
Windolf, M., Gotzen, N., & Morlock, M. (2008). Systemic accuracy and precision
analysis of video motion capturing systems exemplified on the Vicon-460 system.
Journal of Biomechanics, vol. 41, pp. 2776-2780.
Winklemeyer, M., Nelson, B., Southworth, T., Carlson, K. (2006). Effect of Orthotics and
footwear on static rearfoot kinematics. Journal of Sports Science and Medicine, vol. 5,
pp. 466-472.

[431]
Winter, D.A. (1990). Biomechanics and motor control of human movement. Waterloo:
John Wiley & Sons.
Winter, D.A., Sidwall, H.G., & Hobson, D.A. (1974). Measuremtn and reduction of noise
in kinematics of locomotion. Journal of Biomechanics, vol. 7, pp. 157-159.
Withnall, R., Eastlaugh, J., & Freemantle, N. (2006). Do shock absorbing insoles in
recruits undertaining high levels of physical activity reduce lower limb injury? A
randomised controlled trial. Journal of the Royal Society of Medicine, vol. 99, pp. 32.
Wolf, S., Simon, J., Patikas, D., Schuster, W., Armbrust, P., & Doderlein, L. (2008). Foot
motion in children shoes – A comparison of barefoot walking with shod walking in
conventional and flexible shoes. Gait and Posture, vol. 27, pp. 51-59.
Woo, S.L-Y., Ohland, K.J., & Weiss, J.A. (1990). Aging and sex-related changes in the
biomechanical properties of the rabbit medial collateral ligament. Mechanisms of Ageing
and Development, vol. 56, no. 2, pp. 129-142.
Wood, G.A. (1982). Data smoothing and differentiation procedures in biomechanics.
Exercise and Sports Science Reviews, vol. 10, pp. 308-358.
Wood, G.A., & Jennings, L.S. (1979). On the use of spline functions for data smoothing.
Journal of Biomechanics, vol. 12, pp. 477-479.
Yamashita, M. (2005). Evaluation and selection of shoe wear and orthoses for the runner.
Physical Medicine and Rehabilitation Clinics of North America, vol. 16, pp. 801-829.
Yasuda, K., Sasaki, T. (1987). The mechanics of treatment of the osteoarthritic knee with
a wedged insole. Clinical Orthopaedics, vol. 215, pp. 162-172
Young, A., Stokes, M., & Crowe, M. (1984). Size and strength of the quadriceps muscle
of old and young women. European Journal of Clinical Investigation, vol. 14, 282-287.
Zadpoor, A.A., & Nikooyan, A.A. (2011). The relationship between lower-extremity
stress fractures and the ground reaction force: A systemic review. Clinical Biomechanics,
vol. 26, no. 1, pp. 23-28.
Zeni, J.A., Higginson, J.S. (2009). Differences in gait parameters between healthy
subjects and persons with moderate and severe knee osteoarthritis: a result of altered
walking speed? Clinical Biomechanics, vol. 24, pp. 372–378.

[432]
Zeni, J.A., Higginson, J.S. (2009). Dynamic knee joint stiffness in subjects with a
progressive increase in severity of knee osteoarthritis. Clinical Biomechanics, vol. 24, pp.
366-371.
Zhang, Y., McAlindon, T.E., Hannan, M.T., Chaisson, C.E., Klein, R., & Wilson, P.E.
(1998). Estrogen replacement and worsening of radiographic knee osteoarthritis: the
Framingham Study. Arthritis and Rheumatism, vol. 41, pp. 1867 – 1873.
Zhang, H., Vrahas, M.S., Baratta, R.V., and Rosler, D.M. (1999). Damage to Rabbit
Femoral Articular Cartilage following direct Impacts of Uniform Stresses: an In Vitro
Study. Clinical Biomechanics, vol. 14, pp. 543-548.
Zhao, D., Banks, S.A., Mitchell, K.H., D’Lima, D.D., Colwell, C.W., & Fregly, B.J.
(2007). Correlation between the knee adduction torque and medial contact force for a
variety of gait patterns. Journal of Orthopaedic Research, vol. 25, no. 6, pp.789-797.
Zuluaga, M., Briggs, C., Carlisle, J., McDonald, V., McMeeken, J., Nickson, W., Oddy,
P., & Wilson, D. (1995). Sports Physiotherapy: Applied Science and Practice. Churchill
Livingstone.
Websites
The Complete Foot Health Clinic. “Foot Types”. 2519 Yonga Street, Toronto. Retrieved
from the world wide web, 1st December 2011. URL: http://www.cfhc.ca/health.html.
Obesity. Change for Life. Department of Health, 2011. Retrieved from the World Wide
Web, 19th
December, 2011. URL:
http://www.dh.gov.uk/en/Publichealth/Obesity/index.htm.
Olson, W.R. (2007). Overuse Knee Injuries: Evidence and Management. American
Academy of Podiatric Sports Medicine. Retrieved from the World Wide Web, September
1st, 2007. URL: http://www.aapsm.org/ct1100.htm - olson 2007
Schumacher, S.A. (2012). Chondromalacia Patellae. The Achilles Foot Health Centre.
Retrieved from the World Wide Web, 5th
January, 2012. URL: www.footdoc.ca.