Freezing of gait in Parkinson's disease is associated with ...
Upload
independentCategory
view
6download
0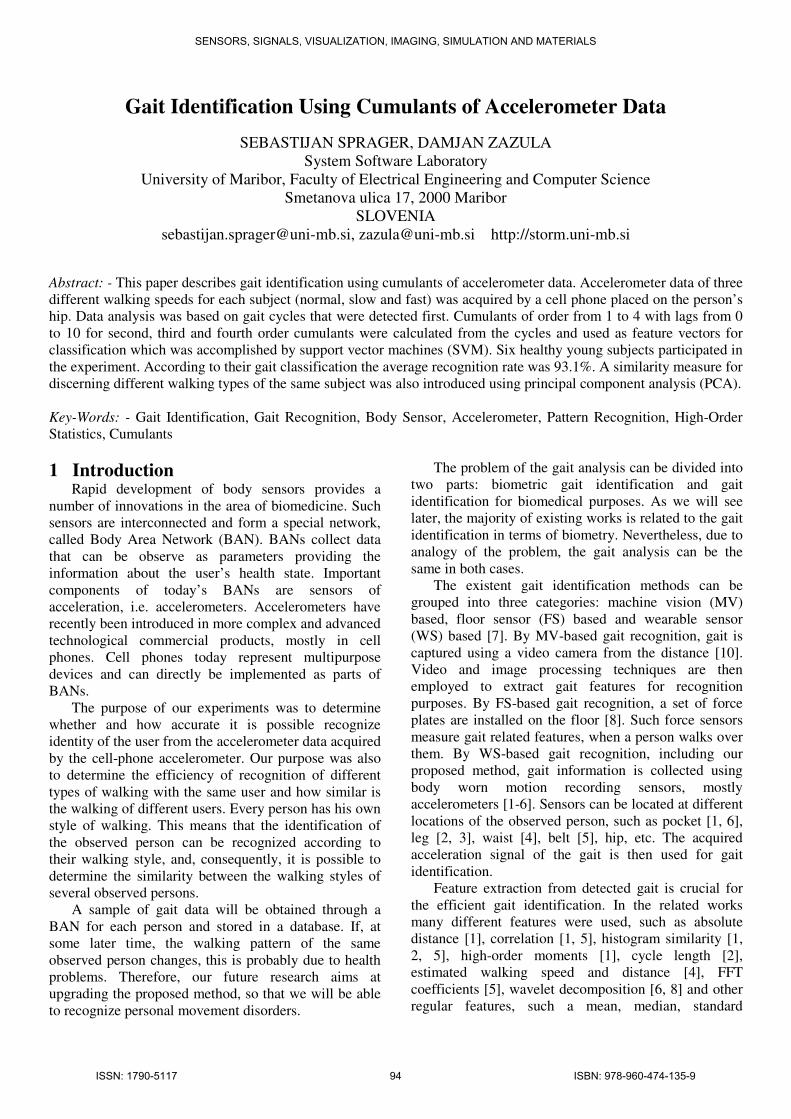
Gait Identification Using Cumulants of Accelerometer Data
SEBASTIJAN SPRAGER, DAMJAN ZAZULA
System Software Laboratory
University of Maribor, Faculty of Electrical Engineering and Computer Science
Smetanova ulica 17, 2000 Maribor
SLOVENIA
[email protected], [email protected] http://storm.uni-mb.si
Abstract: - This paper describes gait identification using cumulants of accelerometer data. Accelerometer data of three
different walking speeds for each subject (normal, slow and fast) was acquired by a cell phone placed on the person’s
hip. Data analysis was based on gait cycles that were detected first. Cumulants of order from 1 to 4 with lags from 0
to 10 for second, third and fourth order cumulants were calculated from the cycles and used as feature vectors for
classification which was accomplished by support vector machines (SVM). Six healthy young subjects participated in
the experiment. According to their gait classification the average recognition rate was 93.1%. A similarity measure for
discerning different walking types of the same subject was also introduced using principal component analysis (PCA).
Key-Words: - Gait Identification, Gait Recognition, Body Sensor, Accelerometer, Pattern Recognition, High-Order
Statistics, Cumulants
1 Introduction Rapid development of body sensors provides a
number of innovations in the area of biomedicine. Such
sensors are interconnected and form a special network,
called Body Area Network (BAN). BANs collect data
that can be observe as parameters providing the
information about the user’s health state. Important
components of today’s BANs are sensors of
acceleration, i.e. accelerometers. Accelerometers have
recently been introduced in more complex and advanced
technological commercial products, mostly in cell
phones. Cell phones today represent multipurpose
devices and can directly be implemented as parts of
BANs.
The purpose of our experiments was to determine
whether and how accurate it is possible recognize
identity of the user from the accelerometer data acquired
by the cell-phone accelerometer. Our purpose was also
to determine the efficiency of recognition of different
types of walking with the same user and how similar is
the walking of different users. Every person has his own
style of walking. This means that the identification of
the observed person can be recognized according to
their walking style, and, consequently, it is possible to
determine the similarity between the walking styles of
several observed persons.
A sample of gait data will be obtained through a
BAN for each person and stored in a database. If, at
some later time, the walking pattern of the same
observed person changes, this is probably due to health
problems. Therefore, our future research aims at
upgrading the proposed method, so that we will be able
to recognize personal movement disorders.
The problem of the gait analysis can be divided into
two parts: biometric gait identification and gait
identification for biomedical purposes. As we will see
later, the majority of existing works is related to the gait
identification in terms of biometry. Nevertheless, due to
analogy of the problem, the gait analysis can be the
same in both cases.
The existent gait identification methods can be
grouped into three categories: machine vision (MV)
based, floor sensor (FS) based and wearable sensor
(WS) based [7]. By MV-based gait recognition, gait is
captured using a video camera from the distance [10].
Video and image processing techniques are then
employed to extract gait features for recognition
purposes. By FS-based gait recognition, a set of force
plates are installed on the floor [8]. Such force sensors
measure gait related features, when a person walks over
them. By WS-based gait recognition, including our
proposed method, gait information is collected using
body worn motion recording sensors, mostly
accelerometers [1-6]. Sensors can be located at different
locations of the observed person, such as pocket [1, 6],
leg [2, 3], waist [4], belt [5], hip, etc. The acquired
acceleration signal of the gait is then used for gait
identification.
Feature extraction from detected gait is crucial for
the efficient gait identification. In the related works
many different features were used, such as absolute
distance [1], correlation [1, 5], histogram similarity [1,
2, 5], high-order moments [1], cycle length [2],
estimated walking speed and distance [4], FFT
coefficients [5], wavelet decomposition [6, 8] and other
regular features, such a mean, median, standard
SENSORS, SIGNALS, VISUALIZATION, IMAGING, SIMULATION AND MATERIALS
ISSN: 1790-5117 94 ISBN: 978-960-474-135-9

deviation, RMS, maximal and minimal value and
amplitude [3].
This paper describes gait identification and
similarity measurement using accelerometer embedded
in the cell phone, which was attached to the hip. From
the accelerometer signal cycles were dete
cumulants of orders from 1 to 4 with lags from 0 to 10
for each order were calculated as features from those
cycles. Classification was performed using support
vector machines. A similarity measure of subjects’ gaits
was performed using principal component analysis.
The paper begins with the description of the
experimental protocol in Section 2. Section 3 explains
the method for gait identification and similarity
measurement. Results are presented in Section
Finally, Section 5 concludes the paper.
2 Experiment protocol description We prepared experimental protocol that induces
collection of data which certainly contains the
information of individual characteristics of a person’s
gait. The experiment was performed on a 50 m long
corridor with the surface made of stone plates. Each
subject was asked to walk across the corridor with their
normal walking speed. After a few seconds of rest the
subject walked back to the starting point with same
walking speed. In the second part of the experime
same procedure was repeated, but now with faster
walking speed, while the last part of the experiment
required slow walking speed. Thus, we collected 6
segments of acceleration signals, two for normal, two
for fast and two for slow walking.
Six healthy male subjects were tested. Their average
age was 30.2 years with standard deviation
The average height of the subjects was 179
standard deviation 3.2 cm.
3 Method for gait identificationOur method for gait identification will follow the signal
processing flow, shown in Figure 1.
explains acquisition of accelerometer signal and its
preprocessing. In Subsection 3.2, the gait cycle
extraction follows from the acquired accelero
signal. Subsection 3.3 explains feature extraction from
detected gait cycles using cumulants,
Subsection 3.4 reveals the classification.
3.1 Accelerometer signal acquisition Acceleration data was acquired using a cell phone
with a built-in accelerometer. The accelerometer used
measures accelerations up to three different directions,
regarding to the type of accelerometer (one, two or
deviation, RMS, maximal and minimal value and
This paper describes gait identification and
similarity measurement using accelerometer embedded
in the cell phone, which was attached to the hip. From
the accelerometer signal cycles were detected and
cumulants of orders from 1 to 4 with lags from 0 to 10
for each order were calculated as features from those
cycles. Classification was performed using support
vector machines. A similarity measure of subjects’ gaits
component analysis.
The paper begins with the description of the
experimental protocol in Section 2. Section 3 explains
the method for gait identification and similarity
are presented in Section 4.
Experiment protocol description We prepared experimental protocol that induces
collection of data which certainly contains the
information of individual characteristics of a person’s
gait. The experiment was performed on a 50 m long
with the surface made of stone plates. Each
subject was asked to walk across the corridor with their
normal walking speed. After a few seconds of rest the
subject walked back to the starting point with same
walking speed. In the second part of the experiment, the
same procedure was repeated, but now with faster
walking speed, while the last part of the experiment
required slow walking speed. Thus, we collected 6
segments of acceleration signals, two for normal, two
tested. Their average
years with standard deviation 4.02 years.
179 cm with the
Method for gait identification Our method for gait identification will follow the signal
processing flow, shown in Figure 1. Subsection 3.1
explains acquisition of accelerometer signal and its
preprocessing. In Subsection 3.2, the gait cycle
extraction follows from the acquired accelerometer
signal. Subsection 3.3 explains feature extraction from
cycles using cumulants, whereas
Subsection 3.4 reveals the classification.
Accelerometer signal acquisition Acceleration data was acquired using a cell phone
in accelerometer. The accelerometer used
measures accelerations up to three different directions,
regarding to the type of accelerometer (one, two or
three-axis accelerometer). Acquired multich
contains the magnitude and the direction of the
acceleration. In our experiments, a cell phone Nokia
N95 was used for data acquisition. The cell phone used
contains a 3-axis accelerometer SM LIS302DL which
measures accelerations between ±2g w
10 bits. Due to power saving function of the cell phone
the sampling frequency was not constant. Therefore we
had to interpolate the acquired signal using linear
interpolation. The obtained average sampling frequency
was 37 Hz.
Fig.1: Signal processing flow of method for gait
identification.
We paid particular attention to the position of the
accelerometer. During our experiment the cell phone
was attached to the right hip of the subject, as shown in
Figure 2. This position turned o
appropriate for the cell phone bearer. We also avoided
the possibility of noise-
movements, for example unwanted bouncing during the
walk, if the cell phone were located in the subject’s
pocket.
The most important task was to eliminate the
influence of the position and orientation of the cell
phone on the accelerometer data, which could later
deteriorate the classification accuracy. Because the cell
phone we used doesn’t have built
to calibrate the accelerometer data to the upright posture
of each subject. Before carrying out the trial, we asked
each subject to stand still in the upright position. The
transformation matrix was calculated based on the
axis accelerometer). Acquired multichannel signal
contains the magnitude and the direction of the
acceleration. In our experiments, a cell phone Nokia
N95 was used for data acquisition. The cell phone used
axis accelerometer SM LIS302DL which
measures accelerations between ±2g with a resolution of
. Due to power saving function of the cell phone
the sampling frequency was not constant. Therefore we
had to interpolate the acquired signal using linear
interpolation. The obtained average sampling frequency
: Signal processing flow of method for gait
We paid particular attention to the position of the
accelerometer. During our experiment the cell phone
was attached to the right hip of the subject, as shown in
. This position turned out to be the very
appropriate for the cell phone bearer. We also avoided
-generating oscillations or
movements, for example unwanted bouncing during the
walk, if the cell phone were located in the subject’s
The most important task was to eliminate the
influence of the position and orientation of the cell
phone on the accelerometer data, which could later
deteriorate the classification accuracy. Because the cell
phone we used doesn’t have built-in gyroscopes, we had
to calibrate the accelerometer data to the upright posture
of each subject. Before carrying out the trial, we asked
each subject to stand still in the upright position. The
transformation matrix was calculated based on the
SENSORS, SIGNALS, VISUALIZATION, IMAGING, SIMULATION AND MATERIALS
ISSN: 1790-5117 95 ISBN: 978-960-474-135-9

gravity component of accelerometer’s signal and
applied to each sample acquired during the subsequent
walking. This ensures that the small difference in
orientation and phone position, related to the person’s
hip, does not influence the accelerometer signal
significantly. However, it is very important that for each
person we achieve more or less same placement and
direction of the cell phone. Different placements of the
device on the same subject would namely lead to
completely various recognition of subject's walk.
Fig.2: Mounting position of cell phone and coordinate
system of the accelerometer.
The result of acquisition are 3-component vectors of
samples stored in the matrix �:
�� � �� � ��, (1)
where represents ID of the subject, �, �, and �
represents vectors of acquired samples for each spatial
direction.
Experimental protocol ends by labeling the acquired
signals. The acquired raw accelerometer data stored in �
were then automatically segmented to the epochs of
walking. An ID of the subject and type of walking were
labeled for each of selected segments.
According to the experiment protocol six segmented
signal sets were collected per each trial–the first two
represent accelerations during normal walk, the next
two fast walk, and the last two slow walk accelerations.
Each set contains 3 signals, one for each spatial
direction.
3.2 Gait recognition To determine walking characteristics, a unified
approach is necessary for all test cases. We decided to
base our further recognition on individual gait cycles.
We assume that we are dealing with periodic signals in
which every gait cycle represents one period. In fact, the
periodicity of gait signals is not strict, which
necessitates processing of all gait cycles from each
signal set.
Visual inspection of acceleration signals discovered
that the cycles are clearly visible and the bounds
between them are seen as the prominent peaks showing
the vertical and horizontal acceleration. We applied the
extraction of gait cycles using a modified peak-
detection method based on combined dual-axial signal,
as described in [9]. We neglected the side acceleration
signals and used only vertical and horizontal
accelerations. The gravity component was removed
from the acceleration signals. Afterwards, the
magnitude calculation followed for the two acceleration
signals. We squared the values of magnitude signal. The
squaring operation leads to positive result and enhances
larger values more than smaller values. The squared
signals were smoothed by 5 samples length moving
average window. Finally, gait cycles for each signal set
were extracted by using peak detection on the processed
signal. For each segment from �� a vector of cycles was
extracted:
�� � � ���� … �����, (2)
where ����represents a cycle defined in (4), � represents
number of cycles for each segment and � � �1,2,3� represents walking type:
���� � ��� �� ���, (3)
where ��, ��, and �� represents the vectors of samples of
the extracted cycle, one for each spatial direction.
3.3 Feature extraction The crucial step in the proposed method for gait
identification is to select features that would give the
best classification results. We experimented with
cumulants of orders from 1 to 4. We calculated all
cumulant coefficients from zero-lag cumulant to
cumulant with lag 10 (for second, third and fourth
order) for each cycle. Due to negligible impact that the
side acceleration signals have on the classification
accuracy, we took into account only the cumulants of
horizontal and vertical acceleration signals. Our feature
set was represented by the cumulant coefficients,
calculated for each cycle, selected in one of symmetrical
regions [11, 12, 13]. First we vectorized non-vector
regions (third and fourth-order cumulants) using zig-zag
procedure, shown in Figure 3. First N values were taken
from each vector as features. The value N was selected
empirically and was set to 10. Thus, for each cycle we
calculated feature vector as follows:
� � !"�#�$��%� !"�#
�$��%��&, (4)
where ' represents order of the cumulant and % ��0 ) ' + 1�, represents lags. Further, a feature vector
SENSORS, SIGNALS, VISUALIZATION, IMAGING, SIMULATION AND MATERIALS
ISSN: 1790-5117 96 ISBN: 978-960-474-135-9
matrix was generated from all feature vectors:
, � � � … -�&, (5)
where " is the number of all calculated feature vectors.
Fig.3: Vectorizing third-order cumulants using zig-zag
procedure.
3.4 Classification The classification task is divided into two parts. Its
block diagram is shown in Figure 4. In the first part we
try to identify gaits using support vector machine
(SVM) [14]. The classification was performed with help
of special tool suite for machine learning, called WEKA
[15]. For SVM classification we used a polynomial
kernel function of order 2. The complexity parameter c
was set to 1. The results of the classification of our
experiment are presented in the subsection 4.1.
Fig.4: Block diagram of the classification procedure
using SVM and PCA.
In the second part we tried to find out how similar
are walking patterns of different persons. This was
performed using Principal Component Analysis (PCA).
PCA was performed using singular value decomposition
(SVD) on the matrix, generated from feature vectors.
We calculated reduced-space feature vector matrix,
where the features are 3D points, represented with first
3 principal components, which can be easily interpreted
when they are plotted in 3D coordinate system as
ellipsoides (results in subsection 4.2). The Karhunen-
Loéve transformation was used to find a singular value
decomposition of the feature vector matrix F:
, � ./0&, (6)
and the dimension reduction was done using projection
of F into the reduced space defined by only first 3
singular vectors, .1:
,1 � .1&, � /101&, (7)
where .1& � �2� … 2-�.
As we mentioned, each feature vector is now
represented as a point 2� in a 3D coordinate space. In
our experiments the points that represent the same class
of gait were grouped together. Therefore, only the mean
of these points was considered for each class for better
representation:
3���� �1
4����52�
���-
�6�,
(8)
where 4����
represents the number of points belonging
to the same class.
Distances between the calculated class centroids
3���� measure the similarity between the subjects’
walking patterns. The shorter the distance between two
centroids, the higher the similarity and vice versa. The
standard deviation for each of the centroid is also
calculated. Thus, each class is represented as ellipsoid in
3D space. Centroid represents the ellipsoid center and
standard deviations for each principal component
represent the axes of the ellipsoid.
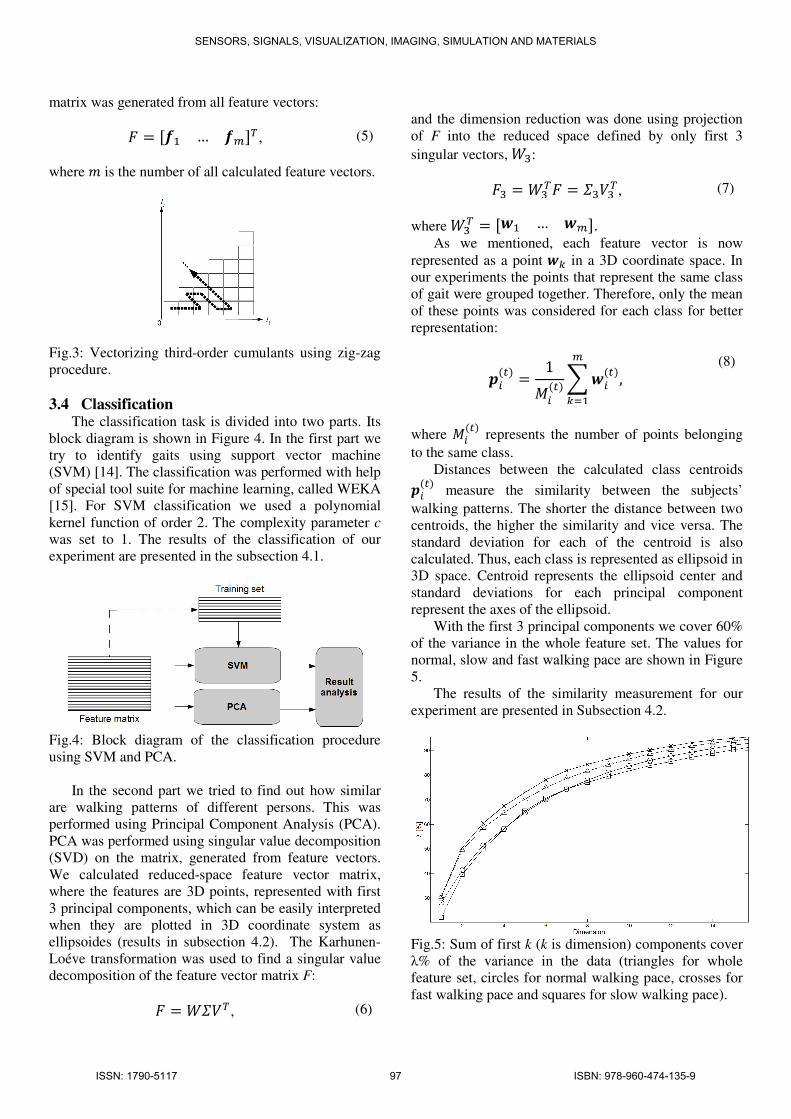
With the first 3 principal components we cover 60%
of the variance in the whole feature set. The values for
normal, slow and fast walking pace are shown in Figure
5.
The results of the similarity measurement for our
experiment are presented in Subsection 4.2.
Fig.5: Sum of first k (k is dimension) components cover
λ% of the variance in the data (triangles for whole
feature set, circles for normal walking pace, crosses for
fast walking pace and squares for slow walking pace).
SENSORS, SIGNALS, VISUALIZATION, IMAGING, SIMULATION AND MATERIALS
ISSN: 1790-5117 97 ISBN: 978-960-474-135-9

4 Results
4.1 Gait identification using SVM Each data set prepared for classification contained
1641 feature vectors for all subjects and types of
walking. A 20-fold cross-validation of the recognition
accuracy was performed by WEKA for classification
with SVM. The results of the classification are shown in
Tables 1 and 2. In Table 1, true positive (TP) and false
positive (FP) rate of classification are presented. In
Table 2, results are presented with the confusion matrix.
The overall classification accuracy is 93.1%.
Class label Number of collected
cycles
TP Rate FP Rate
An 98 0.990 0.005
Af 80 0.988 0.002
As 114 0.921 0.008
Bn 97 0.969 0.002
Bf 87 1.000 0.002
Bs 107 0.953 0.001
Cn 85 0.847 0.007
Cf 75 0.920 0.003
Cs 97 0.897 0.006
Dn 89 0.966 0.003
Df 75 0.920 0.001
Ds 101 0.901 0.006
En 81 0.926 0.003
Ef 82 0.939 0.000
Es 108 0.944 0.004
Fn 86 0.930 0.011
Ff 77 0.870 0.003
Fs 102 0.873 0.006
Table 1: Results of the classification using SVM. Class
label is denoted with capital letter which represents
subject ID and non-capital letter which represents type
of walk (n for normal, f for fast and s for normal
walking pace).
Table 2: Confusion matrix of the classification using
SVM shows recognized classes in the vertical direction.
Compared to other related gait recognition methods,
we can conclude that our method performs considerably
well. The recognition rates of compared methods [1-6]
are between 71% and also up to 100%.
The method was additionally verified by testing
with control gaits. A week after the first experiment we
repeated the same trials with the same subjects in order
to acquire control cycles. Sets of features from the first
experiment were used as training sets. Newly acquired
cycles were used as test sets. The overall recognition
rate was 92.9%. That means that the recognition rate of
subject identification actually remained the same. The
recognition rate of walking types for each subject is a
bit lower (from 73% to 89%) due to inconsistency of
subject’s walking style (e. g. different pace during a
walk). We are going to tackle this issue in further
investigations.
4.1 Gait similarity using PCA We have explained that the distances between the
gait class centroids correspond to the similarity of gait
patterns. The results of similarity of walking styles of
subjects are shown in Table 3. The best way to present
results is to show the matrix which contains class
centroids and its' standard deviations. For better
presentation, class ellipsoids generated from the data in
the Table 3 are depicted in Figure 6. It is evident from
the results that the similar walking patterns as well as
subjects can be recognized using PCA.
Class centroid (means of the first 3 principal components)
A B C D E F
n PC1 0.0757 0.0548 -0.0585 0.0423 0.0320 0.0119
PC2 -0.0148 -0.0857 0.0185 -0.0338 0.1430 0.0358
PC3 -0.0041 0.0085 -0.0351 -0.0292 -0.0134 -0.0087
f PC1 -0.0485 -0.0787 -0.3229 -0.1490 -0.1907 -0.0792
PC2 -0.0427 -0.1311 0.0015 -0.0468 0.1501 0.0208
PC3 0.0508 0.0683 -0.0105 0.0223 0.0800 0.0201
s PC1 0.1105 0.0839 0.0567 0.1036 0.0764 0.0678
PC2 -0.0486 -0.0781 0.0176 -0.0356 0.1263 0.0293
PC3 -0.0118 0.0155 -0.0453 -0.0322 -0.0240 -0.0206
Standard deviations of the first 3 principal components
A B C D E F
n PC1 0.0601 0.0376 0.1199 0.0545 0.0411 0.1051
PC2 0.0421 0.0403 0.0411 0.0300 0.0349 0.0555
PC3 0.0477 0.0220 0.0431 0.0218 0.0253 0.0421
f PC1 0.1537 0.1098 0.2284 0.1137 0.2160 0.1751
PC2 0.0613 0.0308 0.0454 0.0406 0.0761 0.0520
PC3 0.0641 0.0267 0.0402 0.0290 0.0537 0.0423
s PC1 0.0131 0.0223 0.0489 0.0157 0.0287 0.0438
PC2 0.0155 0.0442 0.0450 0.0164 0.0378 0.0334
PC3 0.0157 0.0182 0.0207 0.0182 0.0258 0.0250
Table 3: Means and standard deviations of the first 3
principal components.
5 Conclusion A method for gait identification and similarity
measurement using cumulants calculated from
SENSORS, SIGNALS, VISUALIZATION, IMAGING, SIMULATION AND MATERIALS
ISSN: 1790-5117 98 ISBN: 978-960-474-135-9

accelerometer data has been proposed. The results of the
classification with 6 test subject show that the
identification of people is possible with quite high
recognition rate. The recognition rate of 93.1% is high,
but needs additional validation on a larger number of
test subjects. We expect that the accuracy rate will
slightly fall with the increase of the number of test
subjects. Additional necessary improvements of the
method will be also made. Furthermore, additional
investigations are possible, for example to find the
correlations between subject’s characteristics and
walking styles (for example the influence of their height
on the walking pattern). Finally, we will try to fulfill our
final objective which is to apply the proposed method
for accurate identification of walking disorders of
subjects, which could indicate health problems.
Fig.6: Class ellipsoids generated from the means and
standard deviations of the first 3 principal components.
Subfigure a) shows all classes, b) shows normal walking
pace, c) shows fast walking pace and d) shows slow
walking pace.
References:
[1] D. Gafurov, E. Snekkes, P. Bours, Gait
Authentication and Identification Using
Wearable Accelerometer Sensor, IEEE
Workshop on Automatic Identification Advanced
Technologies, 2007, pp. 220-225
[2] D. Gafurov, K. Helkala, T. Soendrol, Biometric
Gait Authentication Using Accelerometer
Sensor, Journal of Computers, Vol.1, No. 7,
2006, pp. 51-59
[3] A. Annadrhorai, E. Guenterberg, J. Barnes, K.
Haraga, R. Jafari, Human Identification by Gait
Analysis, Proceedings of the 2nd International
Workshop on Systems and Networking Support
for Health Care and Assisted Living
Environments, No.11, 2008
[4] C. Y. Lee, J. J. Lee, Estimation of Walking
Behavior Using Accelerometers in Gait
Rehabilitation, International Journal of Human-
friendly Welfare Robotic Systems, Vol.3 No.2,
2002, pp. 32-36
[5] J. Mantyjarvi, M. Lindholm, E. Vildjiounaite, S.
M. Makela, H. A. Ailisto, Identifying users of
portable devices from gait pattern with
accelerometers, IEEE International Conference
on Acoustics, Speech, and Signal Processing,
Vol.2, 2005, pp. 973-976
[6] T. Iso, K. Yamazaki, Gait Analyzer Based on a
Cell Phone With a Single Three-axis
Accelerometer, Proceedings of the 8th
conference on Human-computer interaction with
mobile devices and services, 2006, pp.141-144
[7] D. Gafurov, A Survey of Biometric Gait
Recognition: Approaches, Security and
Challenges, Nik-2007 Conference, 2007
[8] A. Mostayed, S. Kim, M. M. G. Mazumder,
Foot Step Based Person Identification Using
Histogram Similarity and Wavelet
Decomposition, International Conference on
Information Security and Assurance, 2008, pp.
307-311
[9] H. Ying, C. Silex, A. Schnitzer, S. Leonhardt,
M. Schiek, Automatic Step Detection in the
Accelerometer Signal, 4th International
Workshop on Wearable and Implantable Body
Sensor Networks, 2007, pp. 80–85
[10] L. Wang, T. Tan, W. Hu, H. Ning, Automatic
Gait Recognition Based on Statistical Shape
Analysis, IEEE Transaction on Image
Processing, Vol. 12, No. 9, 2003, pp. 1120-1131
[11] J. M. Mendel, Tutorial on Higher-Order
Statistics (Spectra) in Signal Processing and
System Theory: Theoretical Results and Some
Applications, Proceedings of the IEEE, Vol. 79,
No. 3, 1991, pp. 278-305
[12] C. W. Therrien, Discrete Random Signals and
Statistical Signal Processing, Prentice-Hall
International, 1992
[13] C. L. Nikias, A. P. Petropulu, Higher-Order
Spectra Analysis, PTR Prentice Hall, 1993
[14] J. C. Platt, Fast training of support vector
machines using sequential minimal
optimization, Advances in Kernel Methods:
Support Vector Learning, 1999, pp. 185-208
[15] I. H. Witten, E. Frank, Data Mining: Practical
machine learning tools and techniques, 2nd
Edition, Morgan Kaufmann, 2005
SENSORS, SIGNALS, VISUALIZATION, IMAGING, SIMULATION AND MATERIALS
ISSN: 1790-5117 99 ISBN: 978-960-474-135-9
Copyright © 2022 FDOKUMEN