Gait analysis in children with cerebral palsy - Infoscience - EPFL
219
Acceptée sur proposition du jury pour l’obtention du grade de Docteur ès Sciences par Gait analysis in children with cerebral palsy: bridging the gap between the laboratory and real life Lena CARCREFF Thèse n° 7687 2020 Présentée le 2 octobre 2020 Prof. A. Ijspeert, président du jury Prof. K. Aminian, Dr S. Armand, directeurs de thèse Prof. C. Mazzà, rapporteuse Prof. S. Brochard, rapporteur Prof. G. Courtine, rapporteur à la Faculté des sciences et techniques de l’ingénieur Laboratoire de mesure et d’analyse des mouvements Programme doctoral en biotechnologie et génie biologique
-
Upload
khangminh22 -
Category
Documents
-
view
0 -
download
0
Transcript of Gait analysis in children with cerebral palsy - Infoscience - EPFL
Acceptée sur proposition du jury
pour l’obtention du grade de Docteur ès Sciences
par
Gait analysis in children with cerebral palsy:bridging the gap between the laboratory and real life
Lena CARCREFF
Thèse n° 7687
2020
Présentée le 2 octobre 2020
Prof. A. Ijspeert, président du juryProf. K. Aminian, Dr S. Armand, directeurs de thèseProf. C. Mazzà, rapporteuseProf. S. Brochard, rapporteurProf. G. Courtine, rapporteur
à la Faculté des sciences et techniques de l’ingénieurLaboratoire de mesure et d’analyse des mouvementsProgramme doctoral en biotechnologie et génie biologique

Da ma familh muiañ karet


i
Acknowledgements/Remerciements
Tout d’abord je souhaite remercier mes deux directeurs de thèse, Prof. Kamiar Aminian de l’EPFL et Dr.
Stéphane Armand de l’Université de Genève. Je vous remercie Kamiar pour avoir rendu possible mon
intégration à l’EPFL, et pour m’avoir donné l’opportunité d’intégrer pleinement votre équipe du LMAM
malgré le travail à distance depuis Genève. Je vous remercie également pour votre suivi tout au long de mon
doctorat qui m’a permis d’avancer avec sérénité. Je te remercie Stéphane pour l’inconditionnelle confiance
que tu m’as accordée depuis le début de notre collaboration. C’est grâce à toi que j’ai pu réaliser cette thèse
sur un sujet qui m’a passionné du début à la fin. Merci d’avoir été disponible, à l’écoute à tout moment, d’avoir
suivi mon travail si rigoureusement et m’avoir toujours donné de précieux conseils scientifiques desquels j’ai
beaucoup appris. Et merci aussi pour ton soutien et tes encouragements dans les moments difficiles rencontrés
durant cette thèse.
En second lieu, je souhaite remercier Dr. Christopher Newman du Centre Hospitalier Universitaire Vaudois
(CHUV) qui a non-officiellement endossé le rôle de troisième directeur de thèse. Christopher était à l’initiative
du projet principal intégré dans ce travail doctoral. Il m’a suivi tout au long de mon doctorat en m’apportant
de précieux conseils tant sur le plan clinique que sur le plan méthodologique. Christopher m’a également fait
confiance au point de me proposer un poste dans son équipe de recherche au moment où mes financements de
thèse se terminaient. Encore merci Christopher, je t’en suis très reconnaissante.
Ensuite, je remercie très chaleureusement Dr. Geraldo De Coulon des Hôpitaux Universitaires de Genève
(HUG), qui a su me transmettre sa passion pour l’analyse clinique de la marche. Nos discussions, au cours des
séances d’interprétations de cas cliniques notamment, m’ont guidées tout au long de ce doctorat et ont
largement contribuées à donner du sens à mon travail.
Je remercie également Dr. Joel Fluss des HUG, qui m’a fait découvrir le volet cognitif de l’analyse de la
marche. Merci Joel pour ta confiance, ton suivi et ta disponibilité au cours de notre projet.
Je tiens bien-sûr à remercier mes divers collaborateurs et co-auteurs d’articles. Je remercie Dr. Corinna Gerber
du CHUV avec qui j’ai travaillé main dans la main pendant tout ce doctorat. Merci Corinna pour ta disponibilité
inconditionnelle, que ça soit pour venir m’aider dans la collecte des données les soirs et samedi matins, pour
répondre à chacune de mes interrogations ou pour tes commentaires toujours très pertinents et construits lors
de tes relectures. Je remercie Dr. Anisoara Paraschiv-Ionescu de l’EPFL pour m’avoir supervisé conjointement
avec le Prof. Kamiar Aminian du début à la fin de ce doctorat. Je te remercie pour tes conseils techniques et
méthodologiques. Merci d’avoir pris le temps de m’expliquer les concepts nouveaux abordés durant ma thèse.
Je remercie ensuite Dr. Gilles Allali et Mme Nathalie Valenza des HUG pour leurs disponibilités et leurs
remarques très pertinentes ayant permis d’ajouter une plus-value clinique à mon travail.
Je remercie les membres de mon jury, Prof. Claudia Mazza, Prof. Sylvain Brochard et Prof. Grégoire Courtine,
examinateurs de cette thèse, et Prof. Auke Isjpeert, président du jury. Merci d’avoir accepté d’évaluer mon
travail, et merci pour les questions et commentaires très pertinents lors de mon examen oral.
Je souhaite remercier également l’équipe de GaitUp, notamment Rebekka Anker, Stéphane Lovejoy et Benoît
Mariani qui m’ont aidé dans la prise en main des Physilog, ont toujours répondu à mes appels à l’aide et m’ont
apporté des conseils sur la manipulation des capteurs mais également le traitement des données.
Ce travail de thèse n’aurait été possible sans le soutien financier de diverses fondations. Je remercie donc la
Fondation Leenaards (Lausanne, Suisse), la Fondation Paralysie Cérébrale (Paris, France), la Fondation

ii
Science for Smiles (Villeneuve, Suisse), la Fondation de Recherche Orthopédique de Lausanne (Lausanne,
Suisse) ainsi que les HUG (Genève, Suisse) via le programme « Projets de Recherche et Développement ».
Ce doctorat n’aurait pas non plus vu le jour sans la participation des 60 enfants et adolescents qui ont accepté
de passer plusieurs heures avec moi au laboratoire de marche, parfois de revenir à une semaine d’intervalle et
parfois même de m’avoir accepté chez eux enfin que je les forme à l’utilisation des capteurs. Un grand merci
à eux et à leurs parents !
Je remercie ensuite les 3 équipes de recherche qui m’ont accueilli durant ce doctorat :
En premier lieu, je remercie mes collègues et amis du laboratoire de cinésiologie Willy Taillard qui ont très
largement contribué au plaisir que j’avais de venir travailler chaque matin (sans exception). Les membres de
cette famille Cinésio ont toujours été présents tant pour m’épauler sur des sujets scientifiques que pour me
changer les idées autour d’un verre, d’une piste d’athlétisme ou d’un écran de télévision en période de JO
d’hivers. Merci Anne, Kevin, Alice, Michael, Xavier, Magali, Jennifer, Mickael, Annie, Florent, ainsi que
toutes les personnes ayant fait un passage plus court au laboratoire, Léonie, Anaïs, Sophie, Léopoldine,
Honoré, Antoine, Sébastien et Samuel.
Ensuite, je souhaite sincèrement remercier les membres du LMAM qui m’ont accueilli comme si j’étais un
membre à plein temps de leur équipe. Merci Pritish, Matthieu, Matteo, Chris, Benedikt, Pascal, Francine,
Abolfazl, Arash, Gaëlle, Salil, Mahdi, Wei, Hooman, Mina, Yasaman et tous les étudiants qui sont passé par
le LMAM. Merci pour l’astmosphère bienveillante et sympa que vous apportez au labo et pour les discussions
scientifiques qui m’ont beaucoup aidé dans ce travail doctoral.
Enfin, je remercie la petite équipe de recherche de l’unité de neurologie et neuroréhabilitation pédiatrique du
CHUV constitué de Corinna, Thomas, Didier et Manon. Merci à vous pour votre aide dans la récolte des
données et pour votre enthousiasme dans les projets que vous avez menés. Et merci aussi à tous les collègues
de l’unité qui m’ont accueilli chaleureusement à chacune de mes visites.
J’ai également réussi à accomplir ce travail de thèse grâce aux nombreux moments d’évasion proposés par mes
amis du swing, de l’UTC, de Paris, de Bretagne et partout ailleurs. Impossible de tous les citer ici, c’est bien
dommage. Merci à vous qui vous reconnaitrez.
Merci aussi à ma belle-famille, notamment Isabelle, Florence et Thibaut, qui m’a beaucoup soutenu et m’a
aider à décompresser durant les weekends.
Je remercie toute ma famille, en particulier mes parents, Ewen, Gwenal, Gaëlle et Patricia, pour son soutien à
distance et ses encouragements tout au long de mon travail. Il n’a pas toujours été facile d’être loin de vous.
Merci aussi d’être venu me rendre visite. Sans oublier Maden, Anna et Bleuenn, qui m’ont bien aidé à me
ressourcer.
Et pour finir, je remercie du fond du cœur Charles pour avoir supporté le meilleur et le pire durant ces 4 années
de thèse. Tu as constamment été avec moi, même à distance, pour m’encourager, me remonter le moral et
m’aider à relativiser dans les moments difficiles. Merci aussi pour tes précieux conseils et relectures durant la
préparation de ce manuscrit et de la soutenance qui m’ont aidé à prendre confiance en moi. A nous le début
d’une vie vraiment ensemble maintenant !
Lena Carcreff, le 21 Décembre 2019

iii
Preamble
In the biomedical field, scientists make great endeavors to bring new materials, new devices, new tools and
new methods to increase the knowledge on pathologies and to improve diagnosis and treatments. Concurrently,
clinicians constantly request more precise information about their patients to take better therapeutic decisions.
Both parties sometimes have difficulties in finding the time to share thoughts, hence a lack of communication
often remains between clinicians and scientists. Moreover, the divergence of languages can be an obstacle.
Tightening the links between the hospital and the laboratories through shared biomedical research projects
could improve the medical care of patients, towards personalization at the individual level. This Ph.D. project
fits within this context since it includes translational research based on real clinical needs. This work was
indeed the fruit of a close collaboration between medical and engineering fields to ensure a beneficial
contribution.
Two main research projects fed this thesis. The first was a three-fold project between three institutions: the
University of Geneva/University Hospitals (UNIGE/HUG) led by Dr. Armand, the Ecole Polytechnique
Fédérale de Lausanne (EPFL) led by Dr. Paraschiv-Ionescu, and the Centre Hospitalier Universitaire Vaudois
(CHUV) led by Dr. Newman and was supported by the Leenaards Foundation (Lausanne, Switzerland) from
2015 until 2018. The overall goal was to design (EPFL’s part), validate (UNIGE/HUG’s part) and test in a
clinical trial (CHUV’s part) a wearable system for the physical activity and gait analysis of children with
cerebral palsy. I was initially supposed to contribute to the UNIGE/HUG’part but as long as the project
progressed, I finally had the chance to contribute to all of the three parts. Indeed, as an EPFL Ph.D. student, I
undertook some system design -or more accurately system customization- projects belonging to the EPFL’s
part. And in 2018, as my fundings at UNIGE/HUG ended, Dr. Newman integrated me to his neuropediatric
and neurorehabilitation research unit within the CHUV to take part in the clinical trial in collaboration with
Dr. Gerber.
The second research project was a single and more autonomous project at UNIGE/HUG led by Dr. Armand
and Dr. Fluss, neuropediatrician at the HUG, supported by La fondation Paralysie Cérébrale (Paris, France)
from 2015 to 2017. Its goal was to evaluate the effect of cognitive-motor interferences in children with cerebral
palsy.
At the end of these fundings, i.e. during the last year of my PhD, Prof. Aminian gave me the opportunity to
contribute to a European project involving 34 research patterns supported by the IMI (innovative medicine
initiative) foundation as he put me in charge of realizing a systematic review regarding the estimation of
walking speed in real-life contexts. Besides, I was also involved in several other projects within the HUG,
supported by the “Projets de Recherche et Development” program of the hospital, and the CHUV, supported
by the Science for Smiles Foundation (Villeneuve, Switzerland), regarding physical activity and gait
monitoring in free-living contexts for various populations.
Therefore, in this context, not only I collaborated with different institutions but I actually integrated several
teams and took advantage of each of their expertise to make these projects bear fruit. Finally, this great
opportunity of immersion in such high-level institutions, in tight collaboration with clinicians, allowed me to
publish four peered-review articles during my thesis, submit one that is under review, and communicate in
internal, national and European conferences several times, while building my Ph.D. project.

iv
Abstract
Like 17 million people worldwide, an individual with cerebral palsy (CP) does not have the opportunity to
walk harmoniously in society due to long-life impairments in movement and posture. The natural course of
CP can be modulated by treatments and therapies that are nowadays mostly decided on the basis of assessments
performed in clinical settings. The Clinical Gait Analysis (CGA) consists of a set of instrumented assessments
aiming to obtain precise and quantitative information about a patient’s gait deviations, in order to better identify
his motor disorders and their possible causes. However, it is not clear whether gait assessments in clinics
(‘capacity’) are representative of daily-life behaviors (‘performance’). In this context, the present thesis aimed
at exploring the gap between gait assessed in the laboratory and in real life for children with CP, as compared
to children with typical development (TD). Two main objectives were settled: (i) to propose an objective and
validated tool for gait assessments in a daily-life context with the highest possible accuracy as compared to
clinical standard references; and (ii) to compare gait characteristics between both environments, the laboratory
and the real life.
Considering the immense progress in the design of wearable sensors, notably inertial measurement units
(IMU), great enthusiasm recently arose for their use in ambulatory monitoring. IMUs, including 3D
accelerometers and gyroscopes, were thus exploited in this work as a solution to measure gait features in the
children’s daily life. A comparative study was first carried out to determine the most appropriate wearable
system to be used for children with CP and for long-term measurements. Sensors located on the shanks and
thighs and associated algorithms revealed to be the best solution. Next, a proof-of-concept study was completed
and emphasized the need for personalized data processing for children with CP but also with TD. The second
part (ii), dealing with the comparisons of walking capacity versus performance, adopted a progressive
approach. The first step was the comparison between standardized walking, i.e. during a CGA protocol, and
walking under challenging situations, such as dual tasks, i.e. thinking and talking while walking, in the
laboratory. We found that dual tasks were responsible for lower motor gait capacities. The next step was the
effective comparison of gait characteristics measured in the laboratory with the same gait characteristics
measured in real-life settings, using the previously determined wearable system. First, walking speed, a global
indicator of gait, and second, multiple gait parameters were compared between laboratory and daily life.
Through two studies, we evidenced that children with CP have highly heterogenous behaviors but tend to
perform better in clinical settings. Besides, we have highlighted that capacity is associated with performance
in children with CP when they are evaluated with the same metrics.
Through this doctoral work, the great challenges of using IMUs for gait analysis of children with CP have been
highlighted. The proposed solutions reached a compromise between accuracy, number of outcomes, and
acceptance. Furthermore, the presented clinical results proved with objective and quantitative evidence the
existence of a gap between gait assessed in the laboratory and gait in real life, which could help clinicians to
devise therapeutic plans better tailored to each child’s needs.
Keywords: walking, gait, cerebral palsy, clinical gait analysis, inertial measurement unit, dual task, capacity,
performance, daily life, spatiotemporal parameters, speed, walking bout

v
Résumé
Tout comme 17 millions de personnes dans le monde, une personne atteinte de paralysie cérébrale (PC) n'a
pas l’opportunité de marcher harmonieusement en société en raison de troubles du mouvement et de la posture.
L'évolution naturelle de la PC peut être modulée par des traitements et des thérapies, qui sont à présent
principalement décidés sur la base d'évaluations effectuées en milieu clinique. L’Analyse Quantifiée de la
Marche (AQM) consiste en un ensemble d’évaluations instrumentées visant à obtenir des données précises et
quantitatives sur les déviations de la marche du patient, afin de mieux identifier ses troubles moteurs et leurs
causes possibles. Cependant, il n'est pas évident que les AQM (évaluant la ‘capacité’) soient représentatives
des comportements du patient dans sa vie quotidienne (‘performance’). Dans ce contexte, la présente thèse
visait à explorer l'écart entre la marche des enfants atteints de PC évaluée en laboratoire et celle évaluée dans
la vie quotidienne, par rapport aux enfants avec développement typique (DT). Deux objectifs principaux en
ont découlés: (i) proposer un outil objectif d’évaluation de la marche avec la meilleure précision possible par
rapport aux systèmes de références cliniques; et (ii) comparer la marche en laboratoire et en vie quotidienne
sur la base de caractéristiques identiques.
Compte tenu des progrès dans le domaine des capteurs inertiels, leur utilisation dans l’évaluation de marche
hors contexte clinique s’est récemment intensifiée. Les capteurs inertiels, formés d’accéléromètres et
gyroscopes 3D, ont donc été exploités dans ce travail comme solution permettant de mesurer les
caractéristiques de la marche dans la vie quotidienne des enfants. Une étude comparative a d'abord été menée
pour déterminer le système de capteurs portables le plus approprié pour les enfants atteints de PC, pour des
mesures de longue durée. Un système avec des capteurs situés sur les jambes et les cuisses a montré de bonnes
performances. Ensuite, une étude « preuve de concept » a été réalisée et a souligné la nécessité de la
personnalisation du traitement des données pour les enfants avec PC mais aussi avec DT. La deuxième partie
(ii), consacrée aux comparaisons entre la capacité et la performance de marche, a adopté une démarche
progressive. En premier lieu, nous avons comparé la marche standardisée, c’est-à-dire pendant le protocole
d’AQM, avec la marche en situations difficiles, telles que lors de doubles tâches, à savoir penser et parler en
marchant, en laboratoire. Nous avons constaté que les doubles tâches étaient responsables de diminutions de
capacités motrices. Ensuite, nous avons comparé effectivement les caractéristiques de la marche mesurées en
laboratoire avec celles mesurées dans des conditions réelles, à l'aide du système portable déterminé
précédemment. Premièrement, la vitesse de marche, indicateur global de la qualité de marche, et
deuxièmement, de multiples paramètres de marche ont été comparés entre le laboratoire et la vie quotidienne.
A travers deux études, nous avons montré que les enfants atteints de PC avaient des comportements très
hétérogènes mais semblaient avoir une meilleure qualité de marche en laboratoire. En outre, nous avons
souligné que la capacité est associée à la performance chez les enfants avec PC quand elles sont évaluées par
les mêmes métriques.
Durant cette thèse, les défis liés à l’utilisation des capteurs inertiels dans l’analyse de la marche des enfants
atteints de PC ont été mis en évidence. Les solutions proposées ont abouti à des compromis entre précision,
nombre de paramètres et acceptation. Par ailleurs, les résultats cliniques de cette thèse ont montré par des
preuves objectives et quantitatives l'existence d'un écart entre les mesures en laboratoire et la vie réelle, ce qui
pourrait aider les cliniciens à adopter des plans thérapeutiques plus adaptés aux enfants.
Mots clés: Marche, paralysie cérébrale, analyse quantifiée de la marche, capteurs inertiels, double tâche,
capacité, performance, vie quotidienne, paramètres spatiotemporels, vitesse de marche, épisode de marche
vi
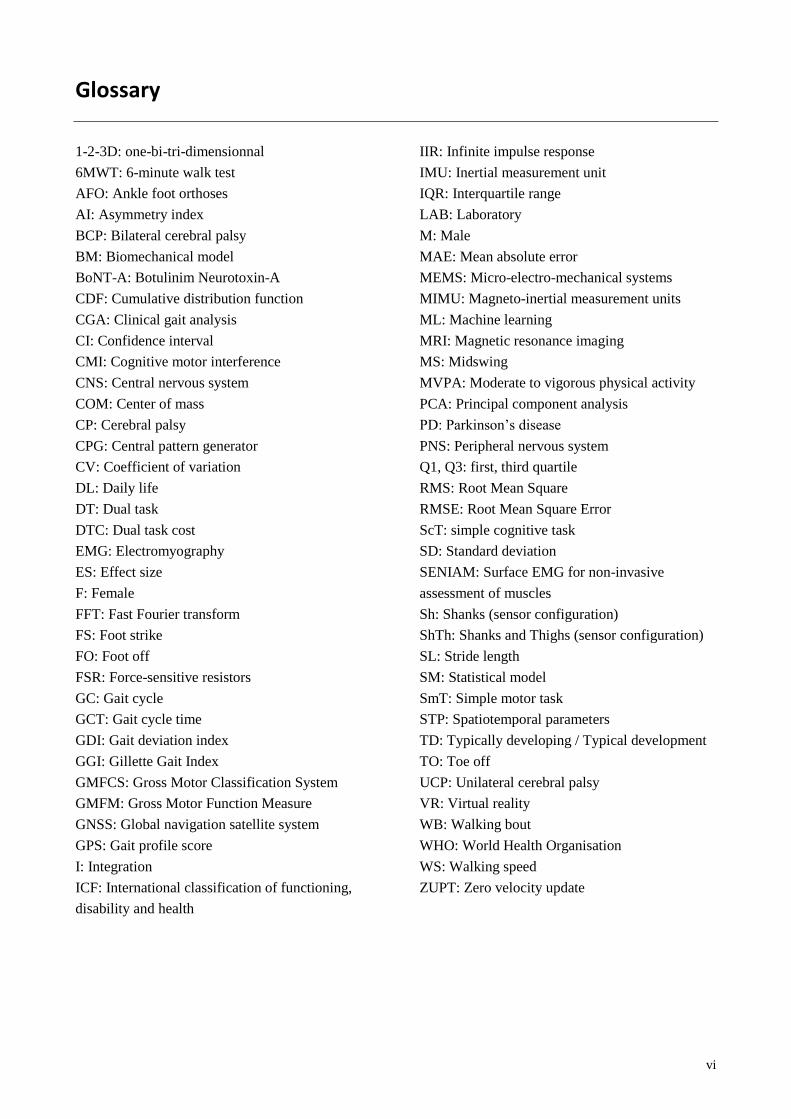
Glossary
1-2-3D: one-bi-tri-dimensionnal
6MWT: 6-minute walk test
AFO: Ankle foot orthoses
AI: Asymmetry index
BCP: Bilateral cerebral palsy
BM: Biomechanical model
BoNT-A: Botulinim Neurotoxin-A
CDF: Cumulative distribution function
CGA: Clinical gait analysis
CI: Confidence interval
CMI: Cognitive motor interference
CNS: Central nervous system
COM: Center of mass
CP: Cerebral palsy
CPG: Central pattern generator
CV: Coefficient of variation
DL: Daily life
DT: Dual task
DTC: Dual task cost
EMG: Electromyography
ES: Effect size
F: Female
FFT: Fast Fourier transform
FS: Foot strike
FO: Foot off
FSR: Force-sensitive resistors
GC: Gait cycle
GCT: Gait cycle time
GDI: Gait deviation index
GGI: Gillette Gait Index
GMFCS: Gross Motor Classification System
GMFM: Gross Motor Function Measure
GNSS: Global navigation satellite system
GPS: Gait profile score
I: Integration
ICF: International classification of functioning,
disability and health
IIR: Infinite impulse response
IMU: Inertial measurement unit
IQR: Interquartile range
LAB: Laboratory
M: Male
MAE: Mean absolute error
MEMS: Micro-electro-mechanical systems
MIMU: Magneto-inertial measurement units
ML: Machine learning
MRI: Magnetic resonance imaging
MS: Midswing
MVPA: Moderate to vigorous physical activity
PCA: Principal component analysis
PD: Parkinson’s disease
PNS: Peripheral nervous system
Q1, Q3: first, third quartile
RMS: Root Mean Square
RMSE: Root Mean Square Error
ScT: simple cognitive task
SD: Standard deviation
SENIAM: Surface EMG for non-invasive
assessment of muscles
Sh: Shanks (sensor configuration)
ShTh: Shanks and Thighs (sensor configuration)
SL: Stride length
SM: Statistical model
SmT: Simple motor task
STP: Spatiotemporal parameters
TD: Typically developing / Typical development
TO: Toe off
UCP: Unilateral cerebral palsy
VR: Virtual reality
WB: Walking bout
WHO: World Health Organisation
WS: Walking speed
ZUPT: Zero velocity update
ii
Table of contents
ACKNOWLEDGEMENTS/REMERCIEMENTS .............................................................................................................I
PREAMBLE ................................................................................................................................................................... III
ABSTRACT ...................................................................................................................................................................... IV
RÉSUMÉ........................................................................................................................................................................... V
GLOSSARY ...................................................................................................................................................................... VI
TABLE OF CONTENTS .................................................................................................................................................. II
LIST OF FIGURES.......................................................................................................................................................... V
LIST OF TABLES ......................................................................................................................................................... VII
PART I - INTRODUCTION
CHAPTER 1 - INTRODUCTION AND OUTLINE OF THE THESIS .......................................................................... 3
1.1 Human locomotion ................................................................................................................................................. 4 1.1.1 Generalities ....................................................................................................................................................... 4
1.1.2 Criteria for quality of life .................................................................................................................................. 4
1.1.3 Physiology ........................................................................................................................................................ 4
1.1.4 Pathological locomotion ................................................................................................................................... 5
1.2 Cerebral palsy ........................................................................................................................................................ 7 1.2.1 Definition .......................................................................................................................................................... 7
1.2.2 Etiology............................................................................................................................................................. 7
1.2.3 Motor disorders ................................................................................................................................................. 8
1.2.4 Associated disorders ......................................................................................................................................... 9
1.2.5 Classifications ................................................................................................................................................... 9
1.2.6 Management of CP ......................................................................................................................................... 13
1.2.7 CP and participation ........................................................................................................................................ 14
1.2.8 Summary of CP characteristics ....................................................................................................................... 14
1.3 Gait evaluation ..................................................................................................................................................... 15 1.3.1 Scale-based evaluations .................................................................................................................................. 15
1.3.2 Clinical gait analysis ....................................................................................................................................... 15
1.3.3 Alternatives to clinical gait analysis ............................................................................................................... 16
1.4 Thesis objectives and outline ............................................................................................................................... 21 1.4.1 Objective ......................................................................................................................................................... 21
1.4.2 Outline ............................................................................................................................................................ 22
1.4.3 Graphical summary ......................................................................................................................................... 23
1.4.4 Overall method ............................................................................................................................................... 23
CHAPTER 2 - LABORATORY MEASUREMENTS: THE CLINICAL GAIT ANALYSIS – STATE OF THE ART 25
2.1 Brief history .......................................................................................................................................................... 26
2.2 Conventions .......................................................................................................................................................... 26 2.2.1 Gait cycle ........................................................................................................................................................ 26
2.2.2 Anatomical planes........................................................................................................................................... 27
2.3 Conventional clinical gait analysis ...................................................................................................................... 27 2.3.1 Physical examination ...................................................................................................................................... 27
2.3.2 Gait assessments ............................................................................................................................................. 28
2.3.3 Data processing ............................................................................................................................................... 34
2.3.4 Interpretations ................................................................................................................................................. 35
2.3.5 Limitations ...................................................................................................................................................... 35
2.3.6 Clinical efficacy of CGA in CP – Pros and Cons ........................................................................................ 37
2.4 Conclusions ........................................................................................................................................................... 38
CHAPTER 3 - REAL-LIFE MEASUREMENT: SPATIOTEMPORAL GAIT PARAMETERS ASSESSMENT
USING WEARABLE TECHNOLOGY – STATE OF THE ART .................................................................................. 39
3.1 Introduction .......................................................................................................................................................... 40
3.2 Method .................................................................................................................................................................. 41 3.2.1 Articles identification ..................................................................................................................................... 41
3.2.2 Studies selection ............................................................................................................................................. 41
3.2.3 Data extraction ................................................................................................................................................ 42
3.3 Results and discussion ......................................................................................................................................... 42
iii
3.3.1 Temporal parameters ...................................................................................................................................... 43
3.3.2 Spatial parameters ........................................................................................................................................... 47
3.3.3 Spatiotemporal parameter ............................................................................................................................... 50
3.3.4 Experimental procedure .................................................................................................................................. 53
3.3.5 Additional gait parameters .............................................................................................................................. 54
3.4 Overview and application to cerebral palsy ...................................................................................................... 55
3.5 Limitations ............................................................................................................................................................ 56
3.6 Conclusion ............................................................................................................................................................ 56
PART II - TECHNICAL STUDIES
CHAPTER 4 - THE CHOICE OF WEARABLE SENSORS CONFIGURATION TO MEASURE
SPATIOTEMPORAL GAIT PARAMETERS IN CHILDREN WITH CEREBRAL PALSY ....................................... 61
4.1 Introduction .......................................................................................................................................................... 62
4.2 Materials and methods ........................................................................................................................................ 63 4.2.1 Participants ..................................................................................................................................................... 63
4.2.2 Protocol ........................................................................................................................................................... 64
4.2.3 Reference spatiotemporal parameters of gait using laboratory setting ........................................................... 64
4.2.4 Spatiotemporal parameters of gait using wearable setting .............................................................................. 65
4.2.5 Data analysis ................................................................................................................................................... 65
4.2.6 Statistical analysis ........................................................................................................................................... 66
4.3 Results ................................................................................................................................................................... 68
4.4 Discussion ............................................................................................................................................................. 73 4.4.1 Temporal detection ......................................................................................................................................... 73
4.4.2 Spatial detection .............................................................................................................................................. 73
4.4.3 Choice for daily life assessment ..................................................................................................................... 74
4.4.4 Limitations and perspectives ........................................................................................................................... 74
4.5 Conclusions ........................................................................................................................................................... 75
CHAPTER 5 - A PERSONALIZED APPROACH TO IMPROVE WALKING DETECTION IN REAL-LIFE
SETTINGS ....................................................................................................................................................................... 77
5.1 Introduction .......................................................................................................................................................... 78
5.2 Materials and methods ........................................................................................................................................ 79 5.2.1 Participants ..................................................................................................................................................... 79
5.2.2 Protocol and material ...................................................................................................................................... 79
5.2.3 Data processing ............................................................................................................................................... 80
5.2.4 Analysis .......................................................................................................................................................... 83
5.3 Results ................................................................................................................................................................... 84 5.3.1 Participants ..................................................................................................................................................... 84
5.3.2 Laboratory gait features .................................................................................................................................. 84
5.3.3 WB detection .................................................................................................................................................. 85
5.3.4 Walking speed estimation ............................................................................................................................... 87
5.4 Discussion ............................................................................................................................................................. 90
5.5 Conclusions ........................................................................................................................................................... 92
5.6 Supplementary information ................................................................................................................................ 93
PART III - CLINICAL STUDIES
CHAPTER 6 - COMPARISON BETWEEN STANDARDIZED GAIT AND GAIT UNDER CHALLENGING DUAL
TASK CONDITIONS ...................................................................................................................................................... 97
6.1 Introduction .......................................................................................................................................................... 98
6.2 Method .................................................................................................................................................................. 99 6.2.1 Participants ..................................................................................................................................................... 99
6.2.2 Protocol ........................................................................................................................................................... 99
6.2.3 Data acquisition ............................................................................................................................................ 100
6.2.4 Parameters ..................................................................................................................................................... 100
6.2.5 Statistical analysis ......................................................................................................................................... 102
6.3 Results ................................................................................................................................................................. 102 6.3.1 Population description .................................................................................................................................. 102
6.3.2 Variable selection ......................................................................................................................................... 103
6.3.3 Dual-task effects on cognitive performance ................................................................................................. 107
6.4 Discussion ........................................................................................................................................................... 107
6.5 Conclusion .......................................................................................................................................................... 113

iv
CHAPTER 7 - LABORATORY VERSUS DAILY LIFE: THE WALKING SPEED .................................................. 115
7.1 Introduction ........................................................................................................................................................ 116
7.2 Method ................................................................................................................................................................ 117 7.2.1 Study design .................................................................................................................................................. 117
7.2.2 Recruitment ................................................................................................................................................... 117
7.2.3 Protocol ......................................................................................................................................................... 117
7.2.4 Wearable sensors .......................................................................................................................................... 118
7.2.5 Optoelectronic system ................................................................................................................................... 118
7.2.6 Data processing ............................................................................................................................................. 118
7.2.7 Data analysis ................................................................................................................................................. 119
7.3 Results ................................................................................................................................................................. 120
7.4 Discussion ........................................................................................................................................................... 125
7.5 Conclusion .......................................................................................................................................................... 130
CHAPTER 8 - LABORATORY VERSUS DAILY LIFE: MULTIFEATURES OF GAIT ......................................... 131
8.1 Introduction ........................................................................................................................................................ 132
8.2 Method ................................................................................................................................................................ 133 8.2.1 Participants ................................................................................................................................................... 133
8.2.2 Measurement protocol .................................................................................................................................. 133
8.2.3 Pre-processing ............................................................................................................................................... 134
8.2.4 Walking bout selection ................................................................................................................................. 134
8.2.5 Walking bout characterization ...................................................................................................................... 134
8.2.6 Data analysis ................................................................................................................................................. 136
8.3 Results ................................................................................................................................................................. 137 8.3.1 Participants’ characteristics and ambulatory activity .................................................................................... 137
8.3.2 Laboratory versus daily life .......................................................................................................................... 138
8.4 Discussion ........................................................................................................................................................... 142
8.5 Conclusion .......................................................................................................................................................... 145
8.6 Appendix ............................................................................................................................................................. 145
8.7 Additionnal results ............................................................................................................................................. 145
PART IV - CONCLUSION
CHAPTER 9 - GENERAL DISCUSSION AND PERSPECTIVES ............................................................................ 149
9.1 Summary of main contributions ....................................................................................................................... 150 9.1.1 Wearable system for spatiotemporal parameters (Chapter 4) ....................................................................... 150
9.1.2 Personalized approach for walking bout detection (Chapter 5) .................................................................... 152
9.1.3 Standardized gait in laboratory versus gait under dual tasks (Chapter 6) ..................................................... 152
9.1.4 Standardized gait in laboratory versus gait in daily life (Chapters 7 & 8) .................................................... 153
9.2 Discussion ........................................................................................................................................................... 154 9.2.1 Wearable system for gait analysis in children with CP ................................................................................. 154
9.2.2 Gait in laboratory versus daily life ................................................................................................................ 157
9.3 Limitations .......................................................................................................................................................... 162 9.3.1 Regarding the study participants ................................................................................................................... 162
9.3.2 Regarding the wearable system .................................................................................................................... 163
9.3.3 Regarding the protocol .................................................................................................................................. 165
9.4 Perspectives ........................................................................................................................................................ 166 9.4.1 Technical perspectives .................................................................................................................................. 166
9.4.2 Clinical perspectives ..................................................................................................................................... 167
9.5 Final conclusion .................................................................................................................................................. 169
REFERENCES .............................................................................................................................................................. 171
CURRICULUM VITAE ................................................................................................................................................ 201
v
List of figures
Figure 1 - Organ systems involved in movement generation ______________________________________________ 5
Figure 2 - Distribution of research efforts regarding gait pathologies between 1970 and 2016 (Chen et al., 2016) ___ 7
Figure 3 – Scheme of causal links resulting from an altered neurological function ____________________________ 8
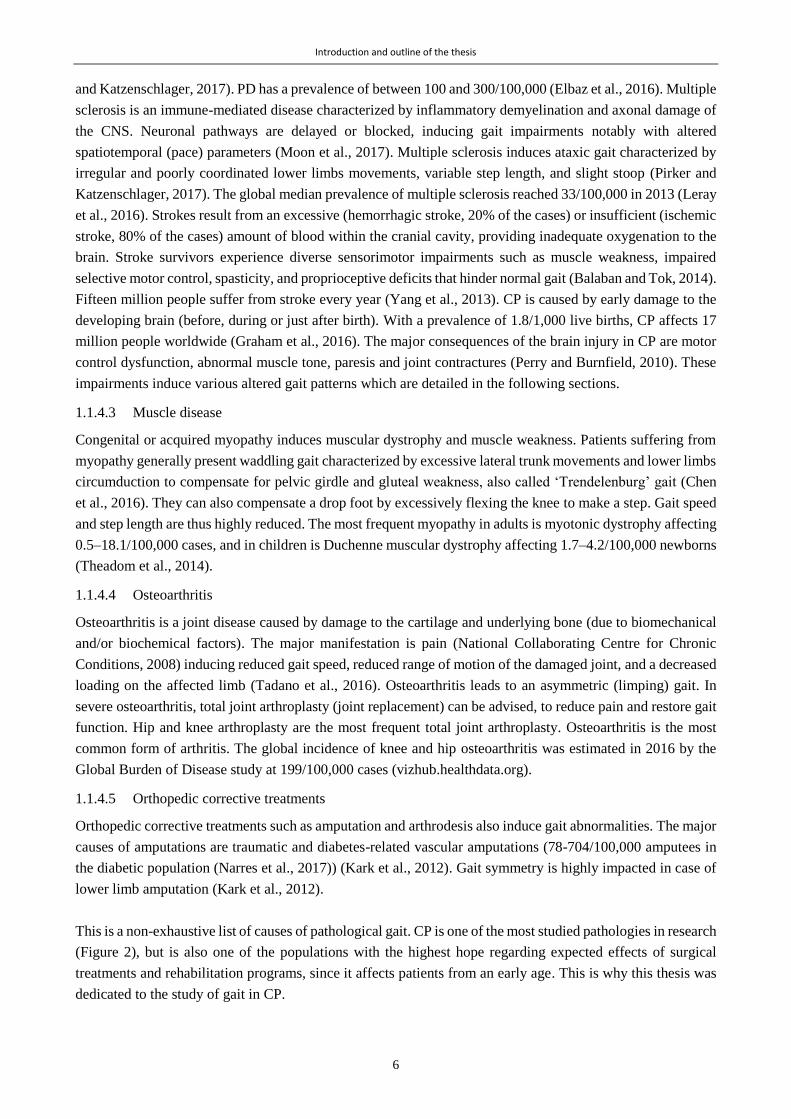
Figure 4 - Topographical description of cerebral palsy _________________________________________________ 10
Figure 5 - Typology of motor disorders according to the localisation of the brain damage _____________________ 10
Figure 6 - Gross Motor Function Classification System (GMFCS) levels ___________________________________ 11
Figure 7 - Gross Motor Function scores evolution according to age and Gross Motor Function Classification (GMFCS)
level (Hanna et al., 2009) ________________________________________________________________________ 12
Figure 8 - Gait patterns classification in cerebral palsy (Papageorgiou et al., 2019) __________________________ 12
Figure 9 – The ICF’s model of health condition (World Health Organization, 2002) __________________________ 16
Figure 10 - graphical summary ___________________________________________________________________ 23
Figure 11 – Overall method of the thesis, including gait assessments in various environment and conditions, belonging
to two distinct study protocols (A and B). ____________________________________________________________ 24
Figure 12 - A gait cycle and its phase division ________________________________________________________ 26
Figure 13 - Anatomical planes and axes ____________________________________________________________ 27
Figure 14 - Material used in gait analysis and associated outcomes _______________________________________ 28
Figure 15 - Marker placement according to a conventional gait model ____________________________________ 29
Figure 16 - Kinematic graphs of the thorax, pelvis and lower limb joints in the sagittal, frontal and transverse planes of
a child with CP in comparison with normal pattern ____________________________________________________ 30
Figure 17 - Kinetic graphs of the ankle of a child with CP in comparison with normal pattern __________________ 31
Figure 18 – Electromyography graphs of gastrocnemius and tibialis anterior muscles of a child with CP during one
gait cycle _____________________________________________________________________________________ 33
Figure 19 - Isobars with a color-scale representing the pressures under the feet of a child with CP during the gait cycle
and lines representing the trajectory of the center of pressures ___________________________________________ 34
Figure 20 - Flow diagram of the literature review concerning the assessment of spatiotemporal gait parameters with
wearable devices _______________________________________________________________________________ 42
Figure 21 – Existing sensor locations used in multiple (a) or single (b) configurations for temporal gait analysis with
the number of studies found for the corresponding sensor location ________________________________________ 43
Figure 22 - Peaks on trunk acceleration norm (A) and shank pitch angular velocity (B) signals corresponding to
midswing, foot off and foot strike areas _____________________________________________________________ 44
Figure 23 - Existing sensor locations used in multiple (a) or single (b) configurations for spatial analysis with the
number of studies found for the corresponding sensor location ___________________________________________ 47
Figure 24 – Common process to estimate the stride length through the integration method with sensors on the feet
(Rebula et al., 2013) ____________________________________________________________________________ 48
Figure 25 - Biomechanical models for step or stride length estimation: the inverted pendulum (a) (Zijlstra and Hof,
1997), and the double pendulum (b) (Aminian et al., 2002) ______________________________________________ 49
Figure 26 - Existing sensor locations used in multiple (a) or single (b) configurations for spatiotemporal analysis with
the number of studies found for the corresponding sensor location ________________________________________ 51
Figure 27 - Data extraction from studies computing and validating walking speed from wearable devices according to
sensor location, computational method, first author, year, reported error, reference system and sensor modality ___ 52
Figure 28 - Repartition of the reviewed studies regarding the experimental environments and settings ____________ 53
Figure 29 - Repartition of the reviewed studies regarding participants' characteristics ________________________ 54
Figure 30 - Equipment on the participant’s lower limbs: reflective markers for the optoelectronic system and inertial
Physilog sensors for the wearable configurations on the thighs, shanks, and feet _____________________________ 64
Figure 31 – Gait events detection represented on the shank angular velocity, the foot angular velocity and the norm of
acceleration signals (measured by the wearable configurations ShTh/Sh and Feet) according to the method _______ 70
Figure 32 - Correlations between the wearable configurations (Shanks-and-Thighs ‘ShTh’, Shanks ‘Sh’, and Feet) and
the optoelectronic system for the three spatiotemporal parameters (stride time, stride length, and stride velocity) ___ 71
Figure 33 - Bland–Altman plots of the three wearable configurations (Shanks-and-Thighs ‘ShTh’, Shanks ‘Sh’, and
Feet) against the optoelectronic system for the three spatiotemporal parameters (stride time, stride length, and stride
velocity) _____________________________________________________________________________________ 72
vi
Figure 34 – Data processing workflow diagram ______________________________________________________ 80
Figure 35 - Illustration of the rules used in the initial algorithm __________________________________________ 82
Figure 36 - Illustrative examples of Midswing detection corresponding to maximum positive peaks on the pitch shank
angular velocity signal. The figure illustrates signals recorded during laboratory gait assessment in four participants
with different gait patterns: (A) TD child, (B) child with CP – GMFCS I, (C) child with CP – GMFCS II and (D) child
with CP – GMFCS III ___________________________________________________________________________ 82
Figure 37 - Example of walking bouts detection for one patient with CP by the three methods (Init, Pop and Indiv) in
comparison with the reference ____________________________________________________________________ 87
Figure 38 - CDF plots of walking speed distributions resulting from Init and Indiv walking bout detection methods for a
TD child and three CP patients with different GMFCS levels ____________________________________________ 88
Figure 39 - Relation between the cadence of the walking bout (detected by FFT) in the laboratory and the 3 temporal
thresholds Th2, Th3, Th4 ________________________________________________________________________ 93
Figure 40 - Experimental protocol including the simple motor task (SmT), the dual tasks (DT), and the simple cognitive
tasks (ScT)____________________________________________________________________________________ 99
Figure 41 - Illustration of variable selection using the principal component analysis (PCA) method. Dual-task effects on
the motor task ________________________________________________________________________________ 103
Figure 42 - Gait parameter representation for each task (vertical facets: simple cognitive task (ScT) and dual tasks
(DT)) and each group (cerebral palsy (CP), typically developing (TD)) ___________________________________ 104
Figure 43 - Dual task costs representation for each task (vertical facets: dual tasks (DT)) and each group (cerebral
palsy (CP), typically developing (TD)) _____________________________________________________________ 105
Figure 44 - Dual task costs representation for the young and old children with cerebral palsy (CP) _____________ 110
Figure 45 - Dual task costs representation for the young and old typically developing (TD) children ____________ 111
Figure 46 - Dual task costs representation for the children with unilateral and bilateral cerebral palsy (UCP and BCP)
___________________________________________________________________________________________ 112
Figure 47 - Flow chart of data processing steps. In green are represented the steps specific to daily life measures _ 119
Figure 48 - Six examples of speed distributions (as Cumulative Distribution Function plots) in laboratory (‘Lab’) and 3
days of daily life: 2 week-days (‘Day 1’, ‘Day 2’), and 1 weekend day ____________________________________ 123
Figure 49 - Comparison (left) and association (right) between median speed in the laboratory and daily life at the
group level __________________________________________________________________________________ 124
Figure 50 - Intra-subject comparisons between laboratory and daily life. Daily life speed distribution is represented by
the box plots _________________________________________________________________________________ 125
Figure 51 – Sensor configuration and flowchart for data processing regarding walking bout (WB) detection, selection
and characterization ___________________________________________________________________________ 137
Figure 52 - Radar plots presenting the 16 gait parameters (8 gait domains) assessed in laboratory (purple curves) and
in daily-life (yellow curves) for the CP and the TD groups _____________________________________________ 140
Figure 53 - Scatterplots representing the relationships between gait parameters measured in daily life and in _____ 141
Figure 54 – ICF model applied to cerebral palsy and gait in the laboratory (capacity) versus daily life (performance)
___________________________________________________________________________________________ 159
Figure 55 –PCA alignment experiment. A) Sensor positioning; B) Protocol: walking with internal rotations; C) Angular
velocity signals according to the sensor position and the alignment (manual or PCA) ________________________ 164
Figure 56 - Effect of signal low pass filter (with Butterworth 4th order) on gait events detection according to the cut off
frequency, on angular velocity during gait of a child with CP-GMFCS III _________________________________ 165
Figure 57 - Calibration posture adapted to individuals with joint contractures proposed by Cutti et al. (2010) ____ 166

vii
List of tables
Table 1 - Primary, secondary and tertiary abnormalities in CP ___________________________________________ 9
Table 2 - Summary of characteristics of CP __________________________________________________________ 14
Table 3 - Examples of challenging gait protocols doable in laboratory settings ______________________________ 17
Table 4 - List of references from the literature dealing with the use of IMU in the CP population ________________ 19
Table 5 - Spatiotemporal parameters of gait (definitions, normal values, common units) _______________________ 32
Table 6 - Description of the three wearable configurations: Shanks-and-Thighs (‘ShTh’), Shanks (‘Sh’), and Feet
according to the sensors placement and associated algorithms ___________________________________________ 67
Table 7 - General characteristics of the study population _______________________________________________ 68
Table 8 - Number of non-detected cycles, mean values (and standard deviation), mean errors (and standard deviation)
against the optoelectronic system for gait event (Foot strike and Foot off) detection and spatiotemporal parameters
(stride time, stride length, and stride velocity) computation _____________________________________________ 69
Table 9- Criteria for thresholds definition, based on the characteristics of the ωz_Shank signal in laboratory for Pop and
Indiv ________________________________________________________________________________________ 83
Table 10 - Study participant details ________________________________________________________________ 84
Table 11 - Population-based characteristics of the pitch angular velocity pattern extracted from laboratory gait
assessments ___________________________________________________________________________________ 84
Table 12 - Sensitivity, specificity, accuracy and precision of walking bouts detection for each method (based on the
algorithm developed by Salarian et al. with fixed thresholds—Init, with population-based customized thresholds—Pop,
and with individual-based personalized thresholds—Indiv), for each group and all the participants ______________ 86
Table 13 - Walking speed distribution descriptors for methods initial and personalized ________________________ 89
Table 14 - Gait domains, gait parameters, definitions, and units _________________________________________ 101
Table 15 - General characteristics of the study sample ________________________________________________ 102
Table 16 - Task effect and group effect results on gait parameters and motor dual-task costs (DTCmotor) _________ 106
Table 17 - Description of the CP population ________________________________________________________ 121
Table 18 - Groups’ characteristics and detected ambulatory activity _____________________________________ 122
Table 19 - Median speed (m/s) in the groups CP and TD in the two different measurement settings _____________ 124
Table 20 - Proportion of individuals in the categories comparing speed in laboratory and speed in daily life ______ 125
Table 21– Participants characteristics and proportion of included daily life WB ____________________________ 138
Table 22– Laboratory and daily-life based gait parameters for each group ________________________________ 139
Table 23 – Thresholds for break and aberrant gait cycles recognition, defined by data recorded in the laboratory _ 145
Table 24 - Associations between gait function and gait quantity (median and maximal number of consecutive steps)
parameters measured in daily life for children with CP ________________________________________________ 146
Table 25 – Comparison of 3 wearable sensor configurations (including ours) regarding the validation measures
reported for stride length and stride velocity computation in children with and without CP (against an optoelectronic
system) _____________________________________________________________________________________ 151
Table 26 – Group averages of gait characteristics (walking speed, stride time and walk ratio) assessed during
spontaneous walking, walking under dual-task in the laboratory and walking during daily-life _________________ 160
1
INTRODUCTION
Part I
2
This introduction part is composed of three chapters that set the context of the thesis. The first chapter
introduces the clinical background from which the objectives of this thesis arise (end of Chapter 1). The second
and third chapters set the state of the art regarding the two aspects of interest: gait measurement in the
laboratory and gait measurement in the daily life.

3
Chapter 1
Introduction and outline of the thesis
Movements punctuate our lives. As emphasized by Etienne-Jules Marey in 1868, a french physiologist pioneer
in motion analysis, movement is a constitutive function of living beings (« Le mouvement est l'acte le plus
important en ce que toutes les fonctions empruntent son concours pour s'accomplir »1 (Marey, 1868)). The
understanding of human movement is thus a fascinating topic and remains fundamental for public health. We
walk thousands of steps every day, perform dozens of posture transitions, and many other specific physical
activities in professional or recreational contexts. Any alteration affecting movement is, therefore, a major
issue for everyday life. There are innumerable causes of alterations; one of them, affecting 17 million people
worldwide, is cerebral palsy (CP). Individuals with CP are characterized by heterogeneous lifelong motor
disorders. Movement analysis helps to identify and understand their impairments. The most analyzed
movement is gait as it is the most repeated movement day-to-day, and its analysis is facilitated by its cyclical
aspect. However, gait assessed in standardized and supervised settings may not reflect real life.
This chapter describes the clinical context of the doctoral project and ends with the thesis objectives and
outlines.
1 «Movement is the most important act since it serves all functions for their accomplishment. »

Introduction and outline of the thesis
4
1.1 Human locomotion
1.1.1 Generalities
Walking is the natural and most convenient mean of moving from one location to another along short distances
(Perry and Burnfield, 2010), and is thus considered as a common and homogeneous ability among human
beings.
Unlike most animal species, the human’s gait maturates slowly (Ivanenko et al., 2007). A typically developing
(TD) child acquires the ability to walk at the age of fifteen months on average and a mature gait pattern is
established at the age of three years (Sutherland et al., 1980), and keeps maturing until the age of eleven
(Gouelle, 2012). This slow maturation is believed to be associated with the complex development of the central
nervous system (CNS) and the challenge of bipedal walking (Ivanenko et al., 2007).
Bipedal gait is a succession of body segments movements leading to the propulsion and the forward
progression of the body while keeping balance (Perry and Burnfield, 2010) which is permitted by the presence
of terrestrial gravity. The gravitational force induces a pendulum-like behavior while walking (Cavagna et al.,
1976; Courtine et al., 2006). Gait is thus a cyclical activity and for each cycle, series of interactions between
two, right and left, multi-segmented lower limbs and the total body mass occur (Perry and Burnfield, 2010).
Natural walking is influenced by many factors such as cultural norms, natural constraints, individual
personality, emotions, and fashion phenomena, resulting in innumerable ways of walking (Troje, 2002).
1.1.2 Criteria for quality of life
The ability to walk guarantees functional independence, and therefore social integration (Hausdorff and
Alexander, 2005). ‘Participation’ as described by the World Health Organization (WHO) is the “involvement
in a life situation” (World Health Organization, 2002). The ability to walk safely, efficiently, harmoniously
and aesthetically is highly related to participation, thus to quality of life and well being (Cuomo et al., 2007).
Walking speed has been considered as the 6th vital sign as it is a reliable, valid, sensitive and specific measure
to predict health status and functional decline (Orendurff et al., 2008). Walking speed is associated with quality
of life (Orendurff et al., 2008).
1.1.3 Physiology
Gait is a complex phenomenon involving various organ systems. Any movement is indeed operated through a
hierarchical chain of commands from the motor cortex to the muscles. The sensory systems (visual, auditory,
vestibular, somatosensory, etc.) send information, through many excitatory and inhibitory neural junctions to
the CNS, which is processed by the cerebral areas and relayed to the spinal cord. Individual motor units bring
the information from the spinal cord to the skeletal muscles so that they activate to generate action at the joint
level, thus creating movement (Figure 1). The spinal cord is also the setting of motor reflexes (Gage et al.,
2009). Rhythm and pattern of locomotion are controlled by a spinal interneuronal network, called “central
pattern generators” (CPG) (Takakusaki, 2013). Considering the numerous systems involved in the movement
generation, a precise understanding of the causes of an altered movement can be challenging (Armand et al.,
2014).

Introduction and outline of the thesis
5
Adapted from (Armand et al., 2014)
Figure 1 - Organ systems involved in movement generation
1.1.4 Pathological locomotion
Since gait is the result of coordination between various organ systems, a great variety of issues altering one or
several of these systems can result in gait disorders: from a thorn piercing the skin to the result of a stroke. The
following are the most common alterations or pathologies affecting gait function.
1.1.4.1 Aging
Mobility limitations are very frequent among older adults and are inevitable during aging. From around 10%
of adults between the ages of 60 and 69 to more than 60% in adults over 80 years experience gait and balance
disorders (Pirker and Katzenschlager, 2017). The various causes of gait disorders associated with age are
impaired proprioceptive functions, impaired vision, vascular encephalopathy and joint osteoarthritis (Pirker
and Katzenschlager, 2017) inducing decreased muscle force and lack of attention. Elderly people thus need to
adopt protective strategies while walking (widening and shortening the steps, prolonging the contact with the
floor, lifting lower the feet, slowing down, etc.) to avoid falls. Indeed, 30% of community-dwelling persons
over 65 years old experience at least one fall per year (Tinetti et al., 1988). Falls are a major cause of functional
decline and mortality among the elderly population (Tinetti et al., 1990), so they constitute a major public
health concern nowadays with ageing populations.
1.1.4.2 Neurological disorders
The most known neurological disorders associated with gait disability are Parkinson’s disease (PD), multiple
sclerosis, cerebral palsy (CP) and stroke. PD is a neurodegenerative, progressive and chronic disease of the
basal ganglia inducing limbs tremor, rigidity stiffness, bradykinesia (slow movements) and postural instability
(Fatmehsari and Bahrami, 2010), inducing difficulties in gait initiations, slow and highly variable gait with
short steps, a narrow base of support and a stooped posture (Pirker and Katzenschlager, 2017; Plotnik et al.,
2007). Patients with PD experience “freezing of gait” episodes when meeting obstacles or narrow paths (Pirker
Introduction and outline of the thesis
6
and Katzenschlager, 2017). PD has a prevalence of between 100 and 300/100,000 (Elbaz et al., 2016). Multiple
sclerosis is an immune-mediated disease characterized by inflammatory demyelination and axonal damage of
the CNS. Neuronal pathways are delayed or blocked, inducing gait impairments notably with altered
spatiotemporal (pace) parameters (Moon et al., 2017). Multiple sclerosis induces ataxic gait characterized by
irregular and poorly coordinated lower limbs movements, variable step length, and slight stoop (Pirker and
Katzenschlager, 2017). The global median prevalence of multiple sclerosis reached 33/100,000 in 2013 (Leray
et al., 2016). Strokes result from an excessive (hemorrhagic stroke, 20% of the cases) or insufficient (ischemic
stroke, 80% of the cases) amount of blood within the cranial cavity, providing inadequate oxygenation to the
brain. Stroke survivors experience diverse sensorimotor impairments such as muscle weakness, impaired
selective motor control, spasticity, and proprioceptive deficits that hinder normal gait (Balaban and Tok, 2014).
Fifteen million people suffer from stroke every year (Yang et al., 2013). CP is caused by early damage to the
developing brain (before, during or just after birth). With a prevalence of 1.8/1,000 live births, CP affects 17
million people worldwide (Graham et al., 2016). The major consequences of the brain injury in CP are motor
control dysfunction, abnormal muscle tone, paresis and joint contractures (Perry and Burnfield, 2010). These
impairments induce various altered gait patterns which are detailed in the following sections.
1.1.4.3 Muscle disease
Congenital or acquired myopathy induces muscular dystrophy and muscle weakness. Patients suffering from
myopathy generally present waddling gait characterized by excessive lateral trunk movements and lower limbs
circumduction to compensate for pelvic girdle and gluteal weakness, also called ‘Trendelenburg’ gait (Chen
et al., 2016). They can also compensate a drop foot by excessively flexing the knee to make a step. Gait speed
and step length are thus highly reduced. The most frequent myopathy in adults is myotonic dystrophy affecting
0.5–18.1/100,000 cases, and in children is Duchenne muscular dystrophy affecting 1.7–4.2/100,000 newborns
(Theadom et al., 2014).
1.1.4.4 Osteoarthritis
Osteoarthritis is a joint disease caused by damage to the cartilage and underlying bone (due to biomechanical
and/or biochemical factors). The major manifestation is pain (National Collaborating Centre for Chronic
Conditions, 2008) inducing reduced gait speed, reduced range of motion of the damaged joint, and a decreased
loading on the affected limb (Tadano et al., 2016). Osteoarthritis leads to an asymmetric (limping) gait. In
severe osteoarthritis, total joint arthroplasty (joint replacement) can be advised, to reduce pain and restore gait
function. Hip and knee arthroplasty are the most frequent total joint arthroplasty. Osteoarthritis is the most
common form of arthritis. The global incidence of knee and hip osteoarthritis was estimated in 2016 by the
Global Burden of Disease study at 199/100,000 cases (vizhub.healthdata.org).
1.1.4.5 Orthopedic corrective treatments
Orthopedic corrective treatments such as amputation and arthrodesis also induce gait abnormalities. The major
causes of amputations are traumatic and diabetes-related vascular amputations (78-704/100,000 amputees in
the diabetic population (Narres et al., 2017)) (Kark et al., 2012). Gait symmetry is highly impacted in case of
lower limb amputation (Kark et al., 2012).
This is a non-exhaustive list of causes of pathological gait. CP is one of the most studied pathologies in research
(Figure 2), but is also one of the populations with the highest hope regarding expected effects of surgical
treatments and rehabilitation programs, since it affects patients from an early age. This is why this thesis was
dedicated to the study of gait in CP.

Introduction and outline of the thesis
7
Figure 2 - Distribution of research efforts regarding gait pathologies between 1970 and 2016 (Chen et al.,
2016)
1.2 Cerebral palsy
The term ‘cerebral palsy’ refers to a clinical condition with shared developmental features rather than a disease
entity (Graham et al., 2016). CP comes from irreversible brain injury during its development (pre, peri or
neonatal) leading to a loss of motor control and abnormal musculoskeletal development. CP is the most
frequent physical disability in childhood, affecting 1.5-2/1000 live births in European countries (Johnson,
2002) and with an equivalent prevalence of 17 million people worldwide (Graham et al., 2016).
CP causes movement difficulties which can considerably limit daily activities throughout life. Because of their
altered motor function, certain children with CP can hardly walk. In fact, only two-thirds of these children are
able to ambulate in society with or without mechanical aids (Beckung et al., 2008).
1.2.1 Definition
CP was first described by J.-B. Cazauvieilh (French psychiatrist) in 1827 (at the time called "congenital
paralysis") (Chabrier et al., 2019). Thereafter, the definition and the appellation have evolved a lot and still
remain debated (Chabrier et al., 2019). The latest and most accepted definition was delineated by an
international group led by P. Rosenbaum and M. Bax in 2005 and stated: “CP describes a group of permanent
disorders of the development of movement and posture, causing activity limitation, that are attributed to non-
progressive disturbances that occurred in the developing fetal or infant brain. The motor disorders of CP are
often accompanied by disturbances of sensation, perception, cognition, communication and behaviour, by
epilepsy and by secondary musculoskeletal problems” (Bax et al., 2005).
1.2.2 Etiology
There is no precise and fixed etiology for CP. Indeed, encephalic lesions causing disability can be localized in
different areas, occur at different stages of brain development and be more or less severe. It is worth mentioning
that the cause of CP remains unknown in certain cases. Hypoxia, infection, stroke or hypotension are the most

Introduction and outline of the thesis
8
frequent causes of brain injury encountered in CP (Wimalasundera and Stevenson, 2016). Injuries happening
in-utero (e.g. infection, genetic mutation, white matter disease, hypoxia, hypotension, hemorrhage, asphyxia
and stroke) account for 80% of CP, hypoxia during delivery accounts for 10% of CP, and post-neonatal injuries
(e.g. infection, hypoglycemia, stroke, accidental or non-accidental trauma) account for 10% of CP
(Wimalasundera and Stevenson, 2016).
Premature birth and difficult delivery are the two main risk factors of CP (Graham et al., 2016). Pre-term birth
before 28 weeks of gestation increases the risk of CP by 50 as compared to full term birth (Graham et al.,
2016).
1.2.3 Motor disorders
CP covers a wide range of clinical presentations depending on the timing and the severity of the brain injury.
Practically, no child with CP is identical to another. However, the general causal links resulting from alterations
of brain function lead to, as depicted in Figure 3, changes in muscular activity and motor function, which
influence the development of the skeleton.
Scheme adapted from (Gage et al., 2009; Gracies, 2005a, 2005b), pictures taken from (Gage et al., 2009;
Graham et al., 2016)
Figure 3 – Scheme of causal links resulting from an altered neurological function
As illustrated in Figure 3, an impaired neurological function alters musculoskeletal anatomy through muscle
function alterations. The central (brain) lesion induces paresis, i.e. decreased voluntary skeletal motor unit
recruitment (Gracies, 2005a). This imposes the immobilization of the paretic limb in a shortened position,
leading to adaptive structural changes of the muscle fibers and eventually shortening of the muscles. The
induced disuse of the limb causes delayed plastic rearrangements in the CNS and the muscle itself,
exacerbating the baseline paresis (Gracies, 2005a). Muscle alterations are mostly stiffness, abnormal length
and tone. This causes joint immobility (contracture) and abnormal forces applied to the bones which eventually
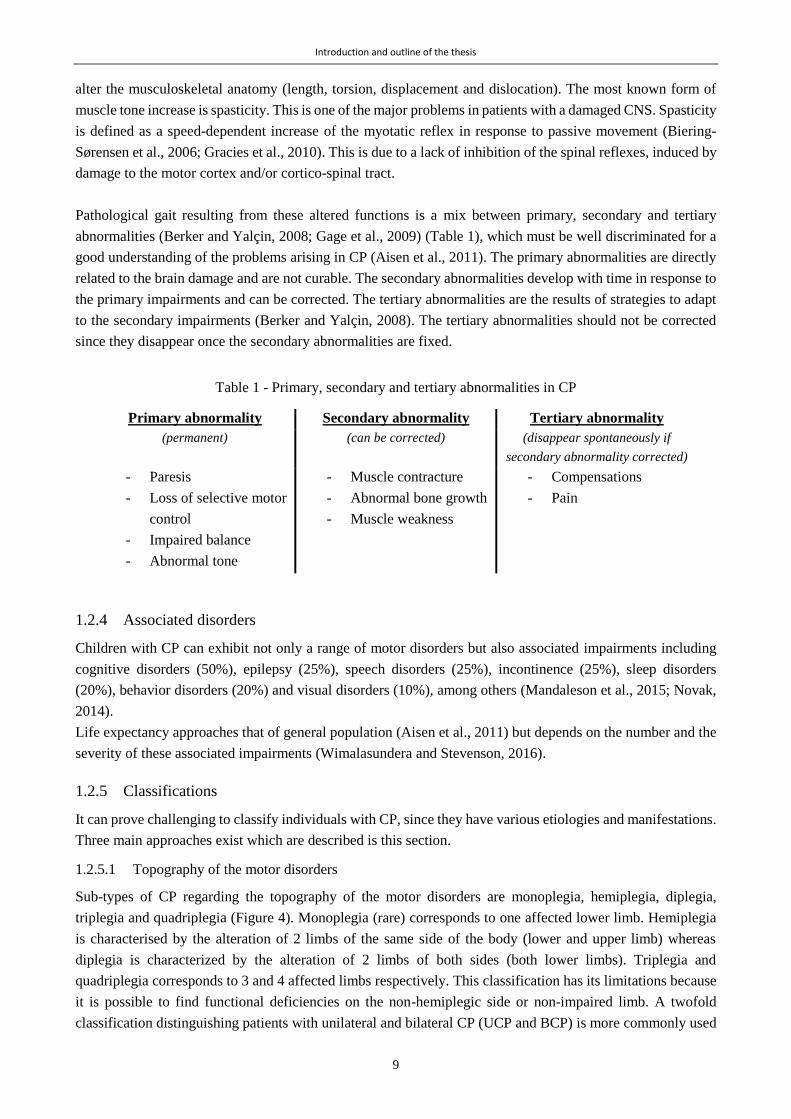
Introduction and outline of the thesis
9
alter the musculoskeletal anatomy (length, torsion, displacement and dislocation). The most known form of
muscle tone increase is spasticity. This is one of the major problems in patients with a damaged CNS. Spasticity
is defined as a speed-dependent increase of the myotatic reflex in response to passive movement (Biering-
Sørensen et al., 2006; Gracies et al., 2010). This is due to a lack of inhibition of the spinal reflexes, induced by
damage to the motor cortex and/or cortico-spinal tract.
Pathological gait resulting from these altered functions is a mix between primary, secondary and tertiary
abnormalities (Berker and Yalçin, 2008; Gage et al., 2009) (Table 1), which must be well discriminated for a
good understanding of the problems arising in CP (Aisen et al., 2011). The primary abnormalities are directly
related to the brain damage and are not curable. The secondary abnormalities develop with time in response to
the primary impairments and can be corrected. The tertiary abnormalities are the results of strategies to adapt
to the secondary impairments (Berker and Yalçin, 2008). The tertiary abnormalities should not be corrected
since they disappear once the secondary abnormalities are fixed.
Table 1 - Primary, secondary and tertiary abnormalities in CP
Primary abnormality Secondary abnormality Tertiary abnormality
(permanent) (can be corrected) (disappear spontaneously if
secondary abnormality corrected)
- Paresis
- Loss of selective motor
control
- Impaired balance
- Abnormal tone
- Muscle contracture
- Abnormal bone growth
- Muscle weakness
- Compensations
- Pain
1.2.4 Associated disorders
Children with CP can exhibit not only a range of motor disorders but also associated impairments including
cognitive disorders (50%), epilepsy (25%), speech disorders (25%), incontinence (25%), sleep disorders
(20%), behavior disorders (20%) and visual disorders (10%), among others (Mandaleson et al., 2015; Novak,
2014).
Life expectancy approaches that of general population (Aisen et al., 2011) but depends on the number and the
severity of these associated impairments (Wimalasundera and Stevenson, 2016).
1.2.5 Classifications
It can prove challenging to classify individuals with CP, since they have various etiologies and manifestations.
Three main approaches exist which are described is this section.
1.2.5.1 Topography of the motor disorders
Sub-types of CP regarding the topography of the motor disorders are monoplegia, hemiplegia, diplegia,
triplegia and quadriplegia (Figure 4). Monoplegia (rare) corresponds to one affected lower limb. Hemiplegia
is characterised by the alteration of 2 limbs of the same side of the body (lower and upper limb) whereas
diplegia is characterized by the alteration of 2 limbs of both sides (both lower limbs). Triplegia and
quadriplegia corresponds to 3 and 4 affected limbs respectively. This classification has its limitations because
it is possible to find functional deficiencies on the non-hemiplegic side or non-impaired limb. A twofold
classification distinguishing patients with unilateral and bilateral CP (UCP and BCP) is more commonly used
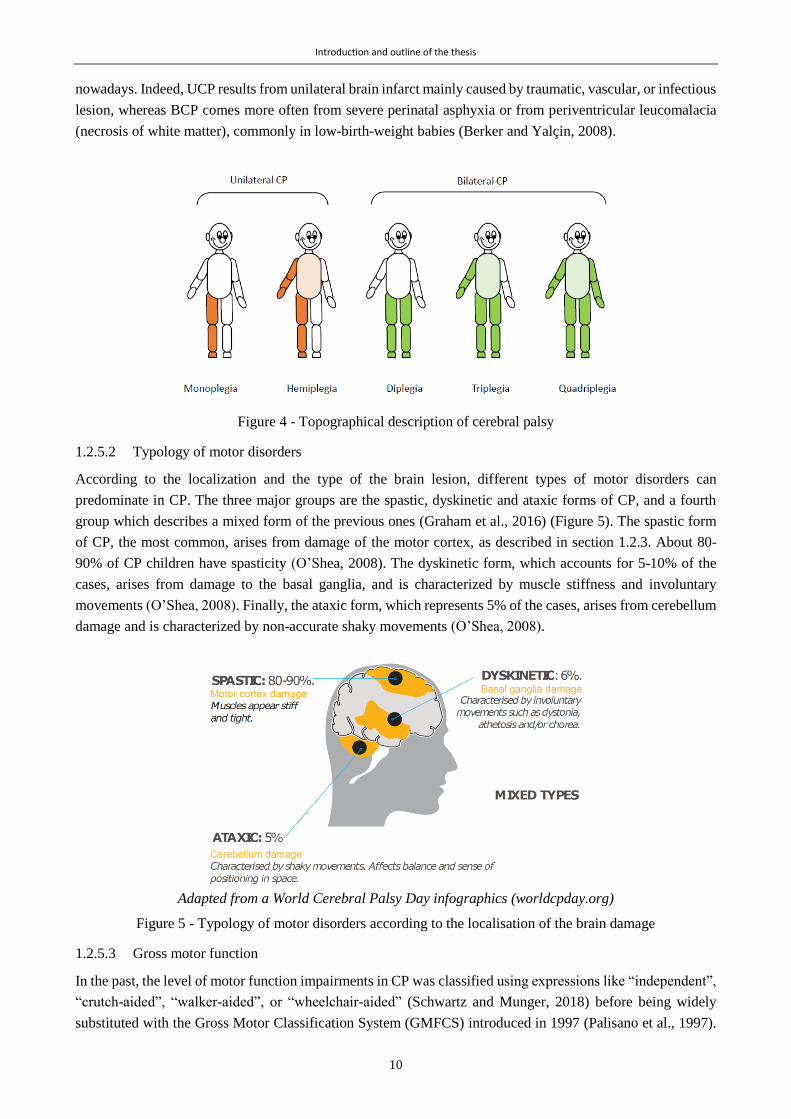
Introduction and outline of the thesis
10
nowadays. Indeed, UCP results from unilateral brain infarct mainly caused by traumatic, vascular, or infectious
lesion, whereas BCP comes more often from severe perinatal asphyxia or from periventricular leucomalacia
(necrosis of white matter), commonly in low-birth-weight babies (Berker and Yalçin, 2008).
Figure 4 - Topographical description of cerebral palsy
1.2.5.2 Typology of motor disorders
According to the localization and the type of the brain lesion, different types of motor disorders can
predominate in CP. The three major groups are the spastic, dyskinetic and ataxic forms of CP, and a fourth
group which describes a mixed form of the previous ones (Graham et al., 2016) (Figure 5). The spastic form
of CP, the most common, arises from damage of the motor cortex, as described in section 1.2.3. About 80-
90% of CP children have spasticity (O’Shea, 2008). The dyskinetic form, which accounts for 5-10% of the
cases, arises from damage to the basal ganglia, and is characterized by muscle stiffness and involuntary
movements (O’Shea, 2008). Finally, the ataxic form, which represents 5% of the cases, arises from cerebellum
damage and is characterized by non-accurate shaky movements (O’Shea, 2008).
Adapted from a World Cerebral Palsy Day infographics (worldcpday.org)
Figure 5 - Typology of motor disorders according to the localisation of the brain damage
1.2.5.3 Gross motor function
In the past, the level of motor function impairments in CP was classified using expressions like “independent”,
“crutch-aided”, “walker-aided”, or “wheelchair-aided” (Schwartz and Munger, 2018) before being widely
substituted with the Gross Motor Classification System (GMFCS) introduced in 1997 (Palisano et al., 1997).
Introduction and outline of the thesis
11
It consists of a 5-level classification describing the gross motor function of the child with regard to his age,
based on his self-initiated movement capacities (Mandaleson et al., 2015). The description of the GMFCS
levels depends on age but can be generalized as follows (Figure 6):
GMFCS level I: Children can walk, run, jump, climb stairs, and carry objects in all settings without limitation,
but are limited in complex motor activities.
GMFCS level II: Children can walk in most indoor settings but with difficulties. They are limited in outdoor
settings, for long distances.
GMFCS level III: Children can walk using a mobility device in most indoor settings and uses wheeled
mobility for long distances.
GMFCS level IV: Children can move thanks to a physical assistance or power mobility in most settings.
GMFCS level V: Children can move only if they are transported in a wheelchair with head and trunk support
by a tertiary person.
Adapted from (Reid et al., 2015)
Figure 6 - Gross Motor Function Classification System (GMFCS) levels
This classification system is the most used classification but it suffers from several drawbacks; one of them
being its impermanence since motor function evolves in time (Schwartz and Munger, 2018). For instance,
Schwartz and Munger (2018) reported that among 562 patients assessed, 23% changed GMFCS levels at least
once due to natural evolution or after a treatment. Indeed, the GMFCS level can change with increasing age.
Young children have a faster progression in gross motor function than older children as illustrated on Figure
7, which represents the evolution of the gross motor function (evaluated by the GMFM, a clinical score that is
introduced in section 1.3.1) with regard to age and GMFCS level. Children with lower levels of GMFCS (e.g.
I and II) have a longer evolution of gross motor function than those with higher levels whom maximal levels
of motor function are reached earlier. Although widely used in clinical practice, research, teaching and
administration (Palisano et al., 1997), this classification is quite confusing since boundaries between two levels
are very thin and also, the inter-rater reliability is only fair to good (Palisano et al., 1997). Also, from one day
to another, a child’s gross motor function can slightly vary and clinicians may interpret the classification
descriptions differently.
GMFCS Level I GMFCS Level II GMFCS Level III
GMFCS Level VGMFCS Level IV

Introduction and outline of the thesis
12
*GMFCS levels with significant decline with age, and dashed lines illustrate age at maximum gross motor
function level
Figure 7 - Gross Motor Function scores evolution according to age and Gross Motor Function Classification
(GMFCS) level (Hanna et al., 2009)
1.2.5.4 Gait patterns
As previously mentioned, patients with CP present multiple various gait patterns. However, similarities can be
observed among unilateral spastic and bilateral spastic CP. Various classifications based on the kinematics of
the lower limbs (mainly in the sagittal plane) have been proposed. A recent systematic review (Papageorgiou
et al., 2019) has identified six consensual multiple joint patterns which were originally introduced by Rodda
et al. (Rodda and Graham, 2001; Rodda et al., 2004), Winters et al. (Winters et al., 1987) and Simon et al.
(Simon et al., 1978). These patterns are depicted in Figure 8. They consist in a progression in the severity and
the localisation (from distal to proximal) of the impairments (Armand et al., 2016).
Figure 8 - Gait patterns classification in cerebral palsy (Papageorgiou et al., 2019)
Type A is characterized by a full knee extension or hyper-extension (recurvatum) during stance with impaired
ankle motor control resulting in permanent plantar flexion (equinus) in type A1, or reduced dorsiflexion in

Introduction and outline of the thesis
13
type A2. Type B is characterized by a drop foot during the swing phase. Type C is characterized by an equinus
during stance. Type D, called ‘jump knee’, is characterized by an equinus and excessive hip and knee flexions
in early stance, followed by hip and knee extension to a variable degree in early stance for type D1, or late
stance for type D2. Type E is characterized by excessive flexion of the hip and the knee with a normal range
of motion of the ankle. Finally, Type F, called ‘crouch gait’, is characterized by excessive flexion at ankle
(dorsiflexion), knee and hip levels as well as excessive pelvic anteversion or retroversion.
Importantly, for bilateral spastic CP, different groups can be attributed to each limb of the same patient (Rodda
and Graham, 2001).
1.2.6 Management of CP
CP is not curable but the consequences at the musculoskeletal level can be managed. Usually, children with
CP follow treatments throughout their childhood. The main treatment options are physiotherapy,
pharmacology, orthotics and surgery. Physiotherapy is recommended to the children as soon as they are
diagnosed with CP (Graham et al., 2016), and is the most common treatment in CP (Armand et al., 2016).
Physiotherapy aims at training the upper and/or lower limbs to maintain or restore adequate ranges of motion,
to improve muscle strength, balance and coordination (Armand et al., 2016) in order to guarantee the best
functional abilities and maximize participation in daily life. Spasticity management is commonly addressed by
injections of Botulinim Neurotoxin-A (BoNT-A) inside the muscle (Fairhurst, 2012). The benefit for the
children is short-term. BoNT-A injection benefits in the long term are not well understood (Graham et al.,
2016). Spasticity is also commonly managed by Baclofen medication, administered orally or intrathecally (into
the spinal canal) (Papavasiliou, 2009). Orthoses and other rehabilitative technologies such as robotic devices,
aim at facilitating ambulation, by providing the necessary support. For example, ankle foot orthoses (AFO) are
very common in children with CP to restore normal ankle rockers, thus improve their gait efficiency (Graham
et al., 2016). Orthopedic surgery is often advised to correct contractures, bone deformities or joint displacement
(Nicholson et al., 2018). For examples, muscle-tendon unit lengthening helps increasing joint range of motion
and rotational osteotomy fixes the bone in an appropriate position and restores lever arm. Current best practices
are to perform single event multilevel surgery to fix multiple abnormalities during a single surgical procedures,
avoiding piecemeal annual surgeries (Fairhurst, 2012), often called the ‘birthday syndrome’ (Armand et al.,
2016; Chang et al., 2010; Švehlík et al., 2016). Finally, selective dorsal rhizotomy is a surgical procedure to
manage spasticity. It consists of a resection of nerve rootlets of the dorsal column, reducing afferent and
efferent activity of the reflex arc (Berker and Yalçin, 2008), providing a permanent and global reduction of the
lower limbs’ muscle tone (Armand et al., 2016). It is worth mentioning that most children have to undergo
several procedures (surgery, injections, etc.) throughout childhood since the musculoskeletal alterations keep
progressing.
Generally, spasticity reduction through BoNT-A injections is advised between 5 and 8 years of age (Gage et
al., 2009) and surgical interventions are advised at later stage, after the peak of the pubertal growth spurt,
around 10 to 12 years of age (Švehlík et al., 2016). In addition, a recent interest was taken in early interventions,
i.e. during the first postnatal years, for infants diagnosed with CP. They consist in light interventions such as
parent education, environment modification, social scaffolding, inhibition of abnormal motor patterns,
facilitation of normal motor patterns, etc. (Morgan et al., 2016). Although variable results were reported in the
literature, early interventions in CP showed overall moderate to large effects on motor outcomes (Hadders-
Algra et al., 2017; Morgan et al., 2016).

Introduction and outline of the thesis
14
Traditional management of motor disabilities aimed at providing a motor pattern as ‘normal’ as possible, and
it has been shown that it was not always aligned with the family and the child’s wishes and expectations
(Thomason et al., 2018). Current practices are now moving toward a management of the disability taking into
account the child’s aspirations. For this purpose, the Gait Outcomes Assessment List (GOAL) was recently
(2014) developed by a multidisciplinary team in Canada to assess gait priorities and functional mobility of
ambulant children with CP (Thomason et al., 2018). This may lead to new intervention programs with a more
appropriate family-centered approach.
1.2.7 CP and participation
CP is the most frequent cause for physical disability in childhood, meaning that activity limitation is a key
element to consider (Cans et al., 2008; Rosenbaum et al., 2006). Children with CP have restricted participation
(“involvement in a life situation” (World Health Organization, 2002)) in daily activities and social interactions
which are associated with the severity of the motor and neurological impairments (Beckung and Hagberg,
2002; Fauconnier et al., 2009). Four factors have been identified as contributing to participation among
children with disabilities: having fun, being successful, doing things on their own and being with others
(Omura et al., 2018).
During adolescence, children with CP, just like TD children, overcome great physical and psychological
changes associated with puberty [12]. Due to their disability, these changes are often slower for children with
CP, leading to greater psychological challenges (Dang, 2012). Participation, as well as well-being, of
adolescents with CP can rapidly be impacted. Maintaining a good level of participation is thus of major
importance for therapists taking care of children with CP.
1.2.8 Summary of CP characteristics
The most important characteristics defining CP are reported in the following table.
Table 2 - Summary of characteristics of CP
CP is …
A description of clinical conditions rather
than an etiological diagnosis (umbrella
term: large number of causes, and large
range of severity)
Mainly manifested with motor disorders but
can be accompanied by many disorders such
as cognitive, behavioural, visual, epileptic or
language impairments
The neurological consequence of lesions
or bad development of the central nervous
system during early life
Not curable but the manifestations can be
treated progressively through surgery,
orthotics, medication and/or physiotherapy
The consequence of a non-progressive and
definitive injury
The cause of decreased levels of physical
activity and participation
The most frequent motor disability in
children
Traditionally categorized into 5 groups of
gross motor function (GMFCS levels)
Characterized by variable manifestations
over time A lifelong disability
Leading to an inability to walk in 1/3 of
cases
(Icons from flaticon.com)

Introduction and outline of the thesis
15
1.3 Gait evaluation
1.3.1 Scale-based evaluations
Gait deviations can be assessed by diverse tools which have different levels of accuracy. Scale-based
evaluations and questionnaires exist to provide a global description of functional mobility. Among the existing
questionnaires assessing gait function (functional mobility), among other functions, the most used are the
Gillette Functional Assessment Questionnaire (FAQ) which assesses the child’s level of functional mobility
on 32 items (Schiariti et al., 2014a), the Pediatric Evaluation of Disability Inventory (PEDI) which assesses
the child’s functional capabilities by observing his mobility, self-care and social function (Schiariti et al.,
2014a) and the Functional Mobility Scale (FMS) which scores functional mobility over three distances (5, 50
and 500m) (Graham et al., 2004). Two known scales are dedicated to the observation of the gait pattern: the
Physician Rating Scale (PRS) and the Edinburgh Visual Gait Analysis Interval Testing (GAIT) (Maathuis et
al., 2005). These two scales were developed to quantify walking pattern of children with CP using a simple
and standardized tool based on video recordings (Maathuis et al., 2005). Indeed, video based observations are
suitable to perceive the most important deviations in a simple and non-expensive way. PRS and GAIT scales
were found to have excellent intra-observer reliability, however, poor inter-observer reliability (Maathuis et
al., 2005). Indeed, a component of subjectivity inherently introduces some bias to these assessments.
The Gross Motor Function Measure (GMFM) is a standardized observational instrument to measure change in
gross motor function over time (Smits et al., 2014; Van Eck et al., 2009). It consists of 88 or 66 items,
depending on the version, assessing five activity domains which are lying and rolling, sitting, crawling and
kneeling, standing, walking, running and jumping. GMFM is one of the few validated tools, with high inter
observer and test-retest reliability, to measure responsiveness of a treatment (Alotaibi et al., 2014; Ko, 2014).
It is considered as the gold standard for assessing function (Schwartz and Munger, 2018), hence highly used
in clinic and research.
1.3.2 Clinical gait analysis
In addition to the previous global gait evaluations, patients with walking disorders are commonly invited to
perform an instrumental evaluation of their gait function called Clinical Gait Analysis (CGA). CGA is a clinical
examination aiming to obtain precise and quantitative information about the motor capacities of a patient, in
order to better identify and understand his motor disorders and the possible causes (Moissenet and Armand,
2015). The analysis is composed of a wide range of instrumented measurements of gait features, as well as a
physical examination to evaluate passive range of motion, muscular spasticity, selectivity and strength. The
instrumented gait analysis mainly includes the recording of kinematics, kinetics, muscular activation and
plantar pressures during walking. The patient walks barefoot along a walkway at his self-selected speed while
being recorded. CGA is carried out in a dedicated laboratory since it requires specific and advanced equipment.
Chapter 2 is dedicated to technical and practical details about CGA.
1.3.2.1 Drawbacks in view of WHO’s considerations
The WHO, in its classification of health and health-related domains: the International Classification of
Functioning, Disability and Health (ICF), considers three domains for a health condition definition: body
structure and function, activities and participation (Figure 9) (World Health Organization, 2002). These
domains are modulated by environmental and personal factors. In this context, the ICF defined two qualifiers
for describing activities and participation: ‘capacity’ and ‘performance’. Capacity describes what a person can
do in a standardized situation and performance describes what a person actually does in his actual

Introduction and outline of the thesis
16
environment (World Health Organization, 2002). The WHO suggests that regardless of the pathology, both
domains have to be evaluated.
Figure 9 – The ICF’s model of health condition (World Health Organization, 2002)
CGA can be considered as a tool to connect the ‘body, functions and structures’ to the walking ‘activity’. Even
if CGA is nowadays the most accurate and complete way to evaluate gait deviations, such an assessment is not
likely to be a real representation of the patient’s usual mobility, his ‘performance’. Although an infinite number
of interpretations of ‘capacity’ can arise from the above-mentioned WHO’s definition, walking during CGA
must describe gait capacity, since it reflects the level of functioning in a standardized environment.
Through CGA, therapeutic decisions are made on the assumption that capacity is equal to performance whereas
they must diverge (Smits et al., 2014). First, the clinical measurements can only be carried out during a short
period of time and at a particular moment of the day. Second, the laboratory has a predefined specific path
where the patient walks only a few steps surrounded by numerous cameras. Therefore, in such a situation, the
patient’s level of functioning can either be improved, if he shows the best of himself, or be hindered because
of discomfort and stress. It has been demonstrated that this behavior can be part of a known phenomenon called
the ‘Hawthorne effect’, being the tendency to substantially change the manner in which symptoms are
expressed while simply being observed by a caregiver or a health worker (Berthelot et al., 2011). Several
studies have highlighted the difference between capacity and performance by exploiting the relationship
between the scores of questionnaires such as those mentioned in the previous section (FMS, PEDI, FAQ,
GMFM, etc). It has been demonstrated that patients with equivalent levels of capacity can have different levels
of performance (Holsbeeke et al., 2009): capacity is shown to exceed performance (Young et al., 1996).
Environmental factors, including physical (home and school settings for instance), social (family, teacher
support) and personal (motivation, choices, personality) factors, are likely to be responsible for this distinction
(Gosselin et al., 2018; Smits et al., 2014).
1.3.3 Alternatives to clinical gait analysis
To overcome the lack of representativeness of the gait assessment during standard CGA, several alternatives
are currently emerging.
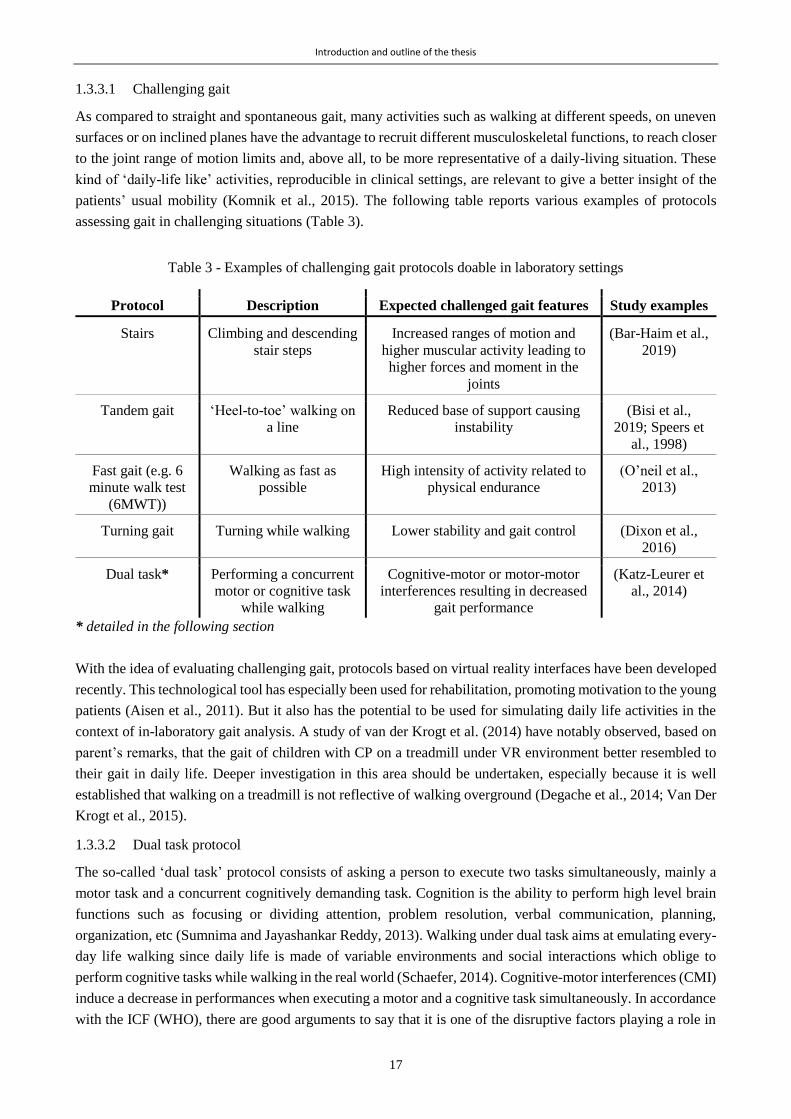
Introduction and outline of the thesis
17
1.3.3.1 Challenging gait
As compared to straight and spontaneous gait, many activities such as walking at different speeds, on uneven
surfaces or on inclined planes have the advantage to recruit different musculoskeletal functions, to reach closer
to the joint range of motion limits and, above all, to be more representative of a daily-living situation. These
kind of ‘daily-life like’ activities, reproducible in clinical settings, are relevant to give a better insight of the
patients’ usual mobility (Komnik et al., 2015). The following table reports various examples of protocols
assessing gait in challenging situations (Table 3).
Table 3 - Examples of challenging gait protocols doable in laboratory settings
Protocol Description Expected challenged gait features Study examples
Stairs Climbing and descending
stair steps
Increased ranges of motion and
higher muscular activity leading to
higher forces and moment in the
joints
(Bar-Haim et al.,
2019)
Tandem gait ‘Heel-to-toe’ walking on
a line
Reduced base of support causing
instability
(Bisi et al.,
2019; Speers et
al., 1998)
Fast gait (e.g. 6
minute walk test
(6MWT))
Walking as fast as
possible
High intensity of activity related to
physical endurance
(O’neil et al.,
2013)
Turning gait Turning while walking Lower stability and gait control (Dixon et al.,
2016)
Dual task* Performing a concurrent
motor or cognitive task
while walking
Cognitive-motor or motor-motor
interferences resulting in decreased
gait performance
(Katz-Leurer et
al., 2014)
* detailed in the following section
With the idea of evaluating challenging gait, protocols based on virtual reality interfaces have been developed
recently. This technological tool has especially been used for rehabilitation, promoting motivation to the young
patients (Aisen et al., 2011). But it also has the potential to be used for simulating daily life activities in the
context of in-laboratory gait analysis. A study of van der Krogt et al. (2014) have notably observed, based on
parent’s remarks, that the gait of children with CP on a treadmill under VR environment better resembled to
their gait in daily life. Deeper investigation in this area should be undertaken, especially because it is well
established that walking on a treadmill is not reflective of walking overground (Degache et al., 2014; Van Der
Krogt et al., 2015).
1.3.3.2 Dual task protocol
The so-called ‘dual task’ protocol consists of asking a person to execute two tasks simultaneously, mainly a
motor task and a concurrent cognitively demanding task. Cognition is the ability to perform high level brain
functions such as focusing or dividing attention, problem resolution, verbal communication, planning,
organization, etc (Sumnima and Jayashankar Reddy, 2013). Walking under dual task aims at emulating every-
day life walking since daily life is made of variable environments and social interactions which oblige to
perform cognitive tasks while walking in the real world (Schaefer, 2014). Cognitive-motor interferences (CMI)
induce a decrease in performances when executing a motor and a cognitive task simultaneously. In accordance
with the ICF (WHO), there are good arguments to say that it is one of the disruptive factors playing a role in

Introduction and outline of the thesis
18
the divergence between level of functioning in a standardized environment (defined as “capacity”) and the
level of functioning in a daily-life environment (defined as “performance”) (World Health Organization, 2002).
CMI can be assessed by the well established dual-task protocol.
The dual-task paradigm has shown its relevance for the assessment of the automaticity of a motor task: when
a motor task is sufficiently acquired, little attentional resource is needed to perform it, whereas when a motor
task is not automated enough, a large amount of attentional resource is required and insufficient resources are
left to maintain good performance when performing a second concurrent task (Al-Yahya et al., 2011).
Although gait as long been considered as an automatic motor task, it has recently been evidenced that gait
control requires high-order cognitive systems (Al-Yahya et al., 2011).
The dual-task paradigm has widely been studied in the elderly population, patients with acquired brain damage
(e.g. stroke) or people with PD to understand the link between loss of motor and cognitive functions and the
risk of fall (Houwink et al., 2011; Montero-Odasso et al., 2012). Walking performances decrease during dual-
tasking: decreased velocity, decreased cadence, decreased stride length, increased stride time and its variability
(Al-Yahya et al., 2011). The walking speed has actually been shown as a sensitive outcome to distinguish
healthy people and those with cognitive impairments (Maquet et al., 2010). New insights on the relevance to
use the dual-task protocol for young patients with neurological disorders, like children with CP, needs to be
gained (Houwink et al., 2011; Katz-Leurer et al., 2014). Given the coexistence of motor and cognitive disorders
in children with CP, we can postulate that they would experience greater CMI than children with TD.
1.3.3.3 Leaving the laboratory
To reflect walking habits, i.e. walking performance, what best than assessing gait in a real life context? The
technology advances of the last two decades have permitted miniaturization of electronic devices, increase in
robustness, memory and power autonomy as well as decrease in cost (Tao et al., 2012). Therefore, new tools
based on wearable sensors have recently been developed to carry out-of-laboratory gait assessments. Light-
weight sensors are more and more appropriate to be worn by patients without interfering with their normal
movements (Najafi et al., 2009). The next paragraphs introduce existing devices for this purpose, and an
exhaustive review of the literature is documented in Chapter 3 to understand what are the technically validated
methods to perform gait analysis with wearable sensors.
The most common sensors implemented for measuring gait and physical activity are Inertial Measurement
Units (IMU), combining accelerometers and gyroscopes. They are particularly used in the motion analysis
field because they enable the measurement of the human body orientation. An accelerometer measures
acceleration and inclination (gravity effect) so it can be used to detect known acceleration patterns of specific
static postures and dynamic activities (Nez et al., 2016). A gyroscope measures angular velocities which can
be used for the estimation of orientation change. Eventually, by integrating the accelerometer and gyroscope
signals, it is possible to obtain information about linear and angular displacements. In addition to IMUs,
magnetometers, barometers, force sensors and Global Navigation Satellite System (GNSS) receivers can be
used to record other relevant data during gait.
As compared to the huge number of studies published in the field of movement analysis using IMUs, the CP
population was by far left aside. Table 4 reports the main studies found in the literature until mid April 2019
in three relevant databases (Pubmed, Web of science and Embase), according to the following key words:
“cerebral palsy” AND (“IMU” OR ‘inertial sensor”). A total of 74 references were selected, including abstracts
(i.e. conference communications only). This review did not intend to be exhaustive but was devised to
understand the principal trends.
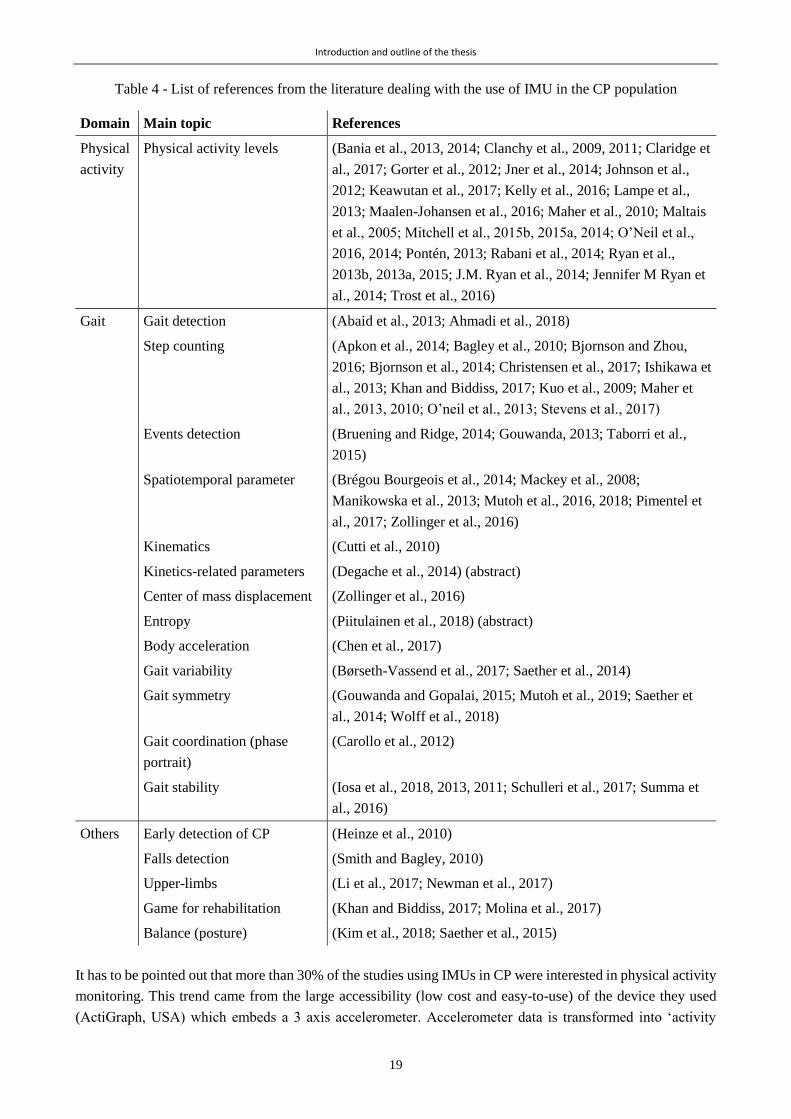
Introduction and outline of the thesis
19
Table 4 - List of references from the literature dealing with the use of IMU in the CP population
Domain Main topic References
Physical
activity
Physical activity levels (Bania et al., 2013, 2014; Clanchy et al., 2009, 2011; Claridge et
al., 2017; Gorter et al., 2012; Jner et al., 2014; Johnson et al.,
2012; Keawutan et al., 2017; Kelly et al., 2016; Lampe et al.,
2013; Maalen-Johansen et al., 2016; Maher et al., 2010; Maltais
et al., 2005; Mitchell et al., 2015b, 2015a, 2014; O’Neil et al.,
2016, 2014; Pontén, 2013; Rabani et al., 2014; Ryan et al.,
2013b, 2013a, 2015; J.M. Ryan et al., 2014; Jennifer M Ryan et
al., 2014; Trost et al., 2016)
Gait Gait detection (Abaid et al., 2013; Ahmadi et al., 2018)
Step counting (Apkon et al., 2014; Bagley et al., 2010; Bjornson and Zhou,
2016; Bjornson et al., 2014; Christensen et al., 2017; Ishikawa et
al., 2013; Khan and Biddiss, 2017; Kuo et al., 2009; Maher et
al., 2013, 2010; O’neil et al., 2013; Stevens et al., 2017)
Events detection (Bruening and Ridge, 2014; Gouwanda, 2013; Taborri et al.,
2015)
Spatiotemporal parameter (Brégou Bourgeois et al., 2014; Mackey et al., 2008;
Manikowska et al., 2013; Mutoh et al., 2016, 2018; Pimentel et
al., 2017; Zollinger et al., 2016)
Kinematics (Cutti et al., 2010)
Kinetics-related parameters (Degache et al., 2014) (abstract)
Center of mass displacement (Zollinger et al., 2016)
Entropy (Piitulainen et al., 2018) (abstract)
Body acceleration (Chen et al., 2017)
Gait variability (Børseth-Vassend et al., 2017; Saether et al., 2014)
Gait symmetry (Gouwanda and Gopalai, 2015; Mutoh et al., 2019; Saether et
al., 2014; Wolff et al., 2018)
Gait coordination (phase
portrait)
(Carollo et al., 2012)
Gait stability (Iosa et al., 2018, 2013, 2011; Schulleri et al., 2017; Summa et
al., 2016)
Others Early detection of CP (Heinze et al., 2010)
Falls detection (Smith and Bagley, 2010)
Upper-limbs (Li et al., 2017; Newman et al., 2017)
Game for rehabilitation (Khan and Biddiss, 2017; Molina et al., 2017)
Balance (posture) (Kim et al., 2018; Saether et al., 2015)
It has to be pointed out that more than 30% of the studies using IMUs in CP were interested in physical activity
monitoring. This trend came from the large accessibility (low cost and easy-to-use) of the device they used
(ActiGraph, USA) which embeds a 3 axis accelerometer. Accelerometer data is transformed into ‘activity
Introduction and outline of the thesis
20
counts’ which determines physical activity states (from sedentary to vigorous) from empirically determined
cut-points. Besides its turnkey advantage, ActiGraph device has the major inconvenience of providing results
that are poorly linked with a real clinical meaning (Bjornson, 2019). Moreover, about 15% of the existing
literature relates step counting, using mostly pedometers or stepwatches. Almost all remaining studies
exploited raw accelerometer and gyroscope data to compute gait features such as variability (Børseth-Vassend
et al., 2017; Saether et al., 2014), symmetry (Gouwanda and Gopalai, 2015; Mutoh et al., 2019; Saether et al.,
2014; Wolff et al., 2018), coordination (Carollo et al., 2012), stability (Iosa et al., 2018, 2013, 2011; Schulleri
et al., 2017; Summa et al., 2016), entropy (Piitulainen et al., 2018), etc. which are not commonly used in the
medical practices due to their innovative nature, thus are difficult to integrate within the clinical care process.
Among studies using spatiotemporal parameters of gait, only one showed results of accuracy of their system
in the CP population (Brégou Bourgeois et al., 2014) (Chapter 3 gives more details). There is indeed a lack of
a validated system for such clinical and meaningful parameters.
Inertial sensors prove to be relevant to measure gait features outside of the laboratory, but still need to be
further explored to provide accurate and clinically meaningful parameters. Moreover, a recent systematic
review of the literature has drawn attention to the lack of studies assessing the feasibility of quantifying gait
of children with CP in real-world environments, only 3 articles met their inclusion criteria while all other
studies performed their analysis in clinical settings (Rozin Kleiner et al., 2019).
Complementary to inertial sensors, other possible equipment can be used to monitor or analyze daily activity.
Pressure insoles have recently shown their relevance in measuring loads under the subjects’ foot (Moufawad
El Achkar et al., 2016), through piezo-resistive sensors, e.g. force-sensing resistors (FSRs), or capacitive
sensors (Crea et al., 2014). Depending on the number of sensors, instrumented insoles can either be used for
activity recognition and general gait characterization, stride counting (Truong et al., 2016) or for a precise
representation of the pressure distribution under each foot (Crea et al., 2014). Pressure-sensitive insoles can be
used in addition to accelerometer and gyroscope on the foot for a more complete gait analysis (Bamberg et al.,
2008). In children with CP, plantar pressure data has been used to study the link between changing dynamics
during stance phase and the level of impairment of hemiplegic children (Femery et al., 2002; Strohrmann et
al., 2013).
Even more possibilities have been developed with E-textiles that combine several wearable sensors such as
IMU, electromyography and electrocardiography sensors and/or goniometers (1-degree-of-freedom device for
measuring angles) (Patel et al., 2012). Complete ‘smart textiles’, as reported in this review (Mečņika et al.,
2014), including innumerable various technologies to sense every biologic feature from a simple clothe, are
still in the stage of prototyping and are very costly, but could be a solution for future gait monitoring in a daily
life setting.
A torrent of different solutions is nowadays expanding particularly thanks to the telecommunication field with
the development of mobile phone applications and small wearable devices to monitor and improve consumer’s
health and sports performance. There is a great potential for new sensors on the market that enable activity
monitoring and simple movement quantification with affordable prices. Nevertheless, until now these
commercial devices and mobile applications have not been tested against a reference to ensure their validation,
and their application in healthcare has not yet been established (Del Din et al., 2016b). Indeed, in a review of
consumer wearable equipment and mobile applications, Peake et al. demonstrated that only 5% of the
technologies were formally validated (Peake et al., 2018). Furthermore, poor accuracy of such devices for
pathological movement monitoring has been evidenced (Feehan et al., 2018). Most studies, when existing,

Introduction and outline of the thesis
21
where conducted in laboratory rather than natural settings (Shin et al., 2019). Commercial wearable trackers
of activity need to be validated to be used in a clinical context, such as gait analysis of children with CP.
Finally, a major drawback with this type of equipment is the non-access to raw data.
Hence, reliable researches turn to the use of IMUs. A review of the methods to compute relevant gait
parameters is provided in Chapter 3.
1.4 Thesis objectives and outline
1.4.1 Objective
The natural course of CP can be modulated by various treatments and therapies, aiming at promoting
participation in society and general quality of life (Graham et al., 2019). These therapeutic choices depend on
the level of impairments and the etiology, so are proper to each individual given the high heterogeneity of CP
profiles. Choices are nowadays mostly decided on the basis of the assessments performed in clinical settings.
However, it is not clear whether gait assessments in clinics are representative of the daily life behaviors. In the
framework of the WHO, what an individual can do in a standardized environment (‘capacity’) and what he
does in his habitual environment (‘performance’) are two dissociated concepts, and cannot be collected in a
single assessment. Along the same line, a majority of existing studies highlight that patients with CP with
similar levels of capacity have different levels of performance. The limitation of these findings is the
subjectivity of the results, since their conclusions were mainly built on questionnaires. Hence, there is a lack
of objective information in order to make sensible and relevant comparisons.
Considering the progress in the design of wearable sensors, notably inertial sensors, being more and more
powerful and miniaturized, great enthusiasm recently arose for ambulatory monitoring. Inertial sensors have
indeed already shown high potential to perform gait assessment. Testing them in natural settings for a
pathological population such as children with CP remains to be achieved, and currently constitutes a great
challenge.
This thesis was conceived to address these issues. The primary objective was to bridge the gap between the
laboratory and real life in this population of children with CP, by comparing their gait capacity and gait
performance characteristics. The parallel was drawn between children with CP and children with TD. Two
main specific objectives were established for this purpose:
i. To propose a tool for gait assessments in daily life, based on existing methods, fitting the specific gait
deviations of children with CP. This technical objective intended to address the question ‘How to fill
the knowledge gap about gait performance?’
ii. To compare gait parameters between standardized and unsupervised walking in order to objectively
quantify the differences between gait capacity and performance. And to examine the divergences
between children with CP and children with TD. This clinical objective intended to address the
question ‘How long and how strong is the link between gait capacity and gait performance?’
The clinical goal adopted a progressive approach, starting with the comparison between standardized gait and
gait under challenging situations, such as dual tasks, in the laboratory, and ending with the actual comparison
between standardized gait and gait in real life settings.
Eventually, bridging the gap between capacity and performance in children with CP aimed at bringing new
insights into how much confidence the clinicians can have in standardized measures, with regard to their
patients’ everyday-life behavior when devising a treatment strategy. Moreover, given the high heterogeneity
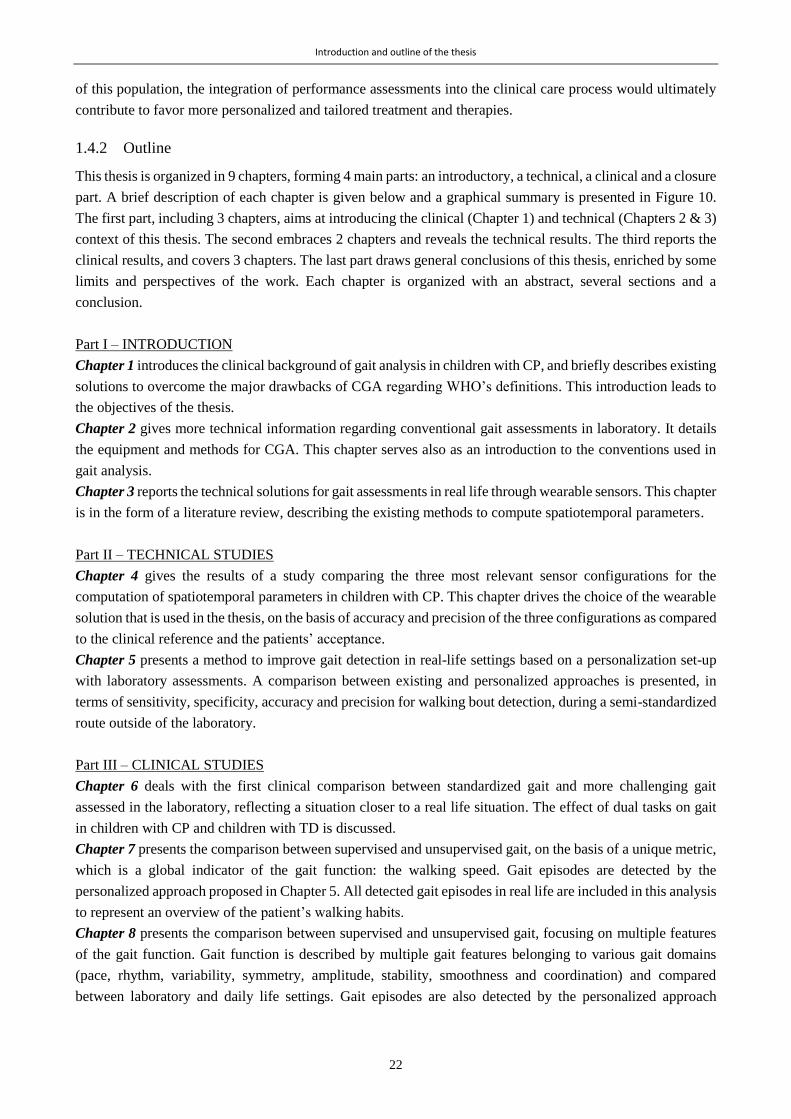
Introduction and outline of the thesis
22
of this population, the integration of performance assessments into the clinical care process would ultimately
contribute to favor more personalized and tailored treatment and therapies.
1.4.2 Outline
This thesis is organized in 9 chapters, forming 4 main parts: an introductory, a technical, a clinical and a closure
part. A brief description of each chapter is given below and a graphical summary is presented in Figure 10.
The first part, including 3 chapters, aims at introducing the clinical (Chapter 1) and technical (Chapters 2 & 3)
context of this thesis. The second embraces 2 chapters and reveals the technical results. The third reports the
clinical results, and covers 3 chapters. The last part draws general conclusions of this thesis, enriched by some
limits and perspectives of the work. Each chapter is organized with an abstract, several sections and a
conclusion.
Part I – INTRODUCTION
Chapter 1 introduces the clinical background of gait analysis in children with CP, and briefly describes existing
solutions to overcome the major drawbacks of CGA regarding WHO’s definitions. This introduction leads to
the objectives of the thesis.
Chapter 2 gives more technical information regarding conventional gait assessments in laboratory. It details
the equipment and methods for CGA. This chapter serves also as an introduction to the conventions used in
gait analysis.
Chapter 3 reports the technical solutions for gait assessments in real life through wearable sensors. This chapter
is in the form of a literature review, describing the existing methods to compute spatiotemporal parameters.
Part II – TECHNICAL STUDIES
Chapter 4 gives the results of a study comparing the three most relevant sensor configurations for the
computation of spatiotemporal parameters in children with CP. This chapter drives the choice of the wearable
solution that is used in the thesis, on the basis of accuracy and precision of the three configurations as compared
to the clinical reference and the patients’ acceptance.
Chapter 5 presents a method to improve gait detection in real-life settings based on a personalization set-up
with laboratory assessments. A comparison between existing and personalized approaches is presented, in
terms of sensitivity, specificity, accuracy and precision for walking bout detection, during a semi-standardized
route outside of the laboratory.
Part III – CLINICAL STUDIES
Chapter 6 deals with the first clinical comparison between standardized gait and more challenging gait
assessed in the laboratory, reflecting a situation closer to a real life situation. The effect of dual tasks on gait
in children with CP and children with TD is discussed.
Chapter 7 presents the comparison between supervised and unsupervised gait, on the basis of a unique metric,
which is a global indicator of the gait function: the walking speed. Gait episodes are detected by the
personalized approach proposed in Chapter 5. All detected gait episodes in real life are included in this analysis
to represent an overview of the patient’s walking habits.
Chapter 8 presents the comparison between supervised and unsupervised gait, focusing on multiple features
of the gait function. Gait function is described by multiple gait features belonging to various gait domains
(pace, rhythm, variability, symmetry, amplitude, stability, smoothness and coordination) and compared
between laboratory and daily life settings. Gait episodes are also detected by the personalized approach
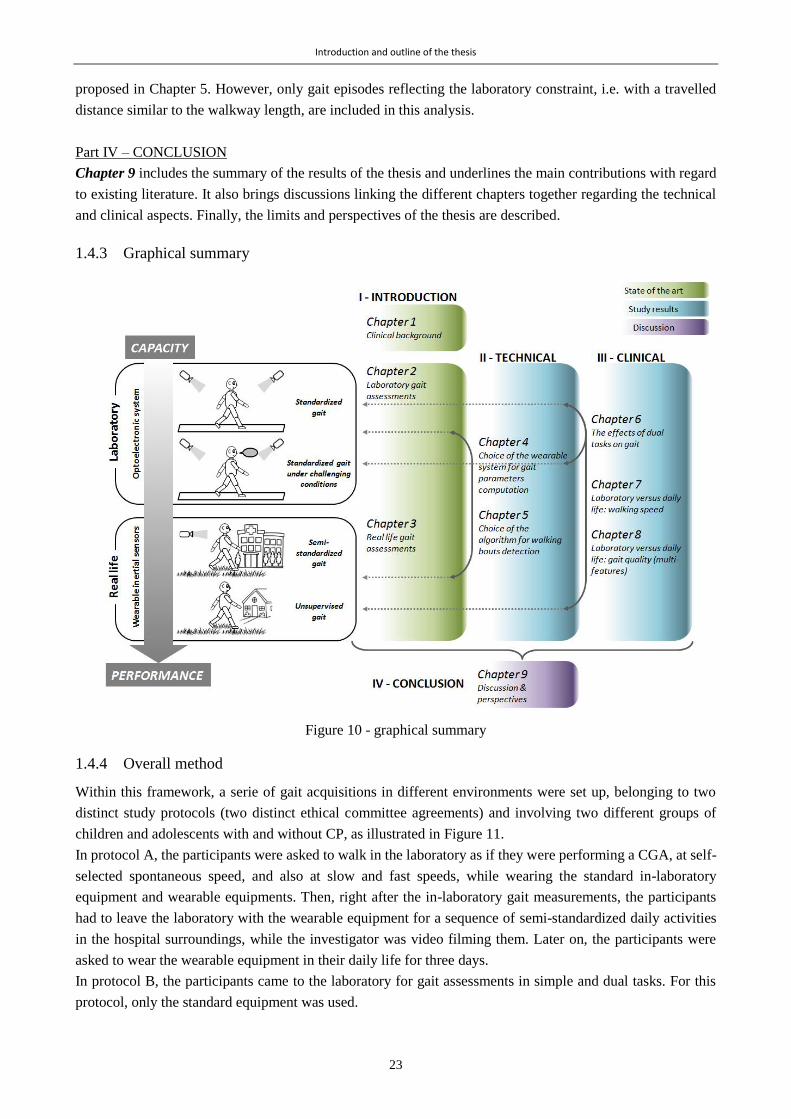
Introduction and outline of the thesis
23
proposed in Chapter 5. However, only gait episodes reflecting the laboratory constraint, i.e. with a travelled
distance similar to the walkway length, are included in this analysis.
Part IV – CONCLUSION
Chapter 9 includes the summary of the results of the thesis and underlines the main contributions with regard
to existing literature. It also brings discussions linking the different chapters together regarding the technical
and clinical aspects. Finally, the limits and perspectives of the thesis are described.
1.4.3 Graphical summary
Figure 10 - graphical summary
1.4.4 Overall method
Within this framework, a serie of gait acquisitions in different environments were set up, belonging to two
distinct study protocols (two distinct ethical committee agreements) and involving two different groups of
children and adolescents with and without CP, as illustrated in Figure 11.
In protocol A, the participants were asked to walk in the laboratory as if they were performing a CGA, at self-
selected spontaneous speed, and also at slow and fast speeds, while wearing the standard in-laboratory
equipment and wearable equipments. Then, right after the in-laboratory gait measurements, the participants
had to leave the laboratory with the wearable equipment for a sequence of semi-standardized daily activities
in the hospital surroundings, while the investigator was video filming them. Later on, the participants were
asked to wear the wearable equipment in their daily life for three days.
In protocol B, the participants came to the laboratory for gait assessments in simple and dual tasks. For this
protocol, only the standard equipment was used.

Introduction and outline of the thesis
24
Figure 11 – Overall method of the thesis, including gait assessments in various environment and conditions,
belonging to two distinct study protocols (A and B).
25
Chapter 2 *
Laboratory measurements: the Clinical Gait Analysis – State of the art
Abstract
Ensuring effective and harmonious gait for patients with neuro-musculoskeletal disorders has nowadays
become one of the main objectives of clinicians. For this purpose, the patients can perform an assessment of
their gait called “Clinical Gait Analysis” (CGA), or “3D gait Analysis” (3DGA). The goal of this clinical
examination is to obtain quantitative information on the patient’s gait that can be used to better identify and
understand his motor disorders. Although this clinical evaluation is not yet standardized among the different
laboratories around the world, common practices can be depicted. The objective of this chapter is to give an
overview of these practices, i.e. the conventional definitions, the procedures, the biomechanical principles, the
equipment needed, and the steps until clinical recommendations. The main limitations and the controversy
associated with the clinical efficacy of this examination are also presented at the end of this chapter.
* Chapter adapted from the following article:
Carcreff L., Bonnefoy-Mazure A., De Coulon G., Armand S. “Analyse quantifiée de la marche” Movement & Sport
Sciences – Science & Motricité, 2016, vol. 3, num. 93, p.7-21. doi: 10.1051/sm/2015033 – with permissions of all co-
authors
My contribution: Investigation, visualization, writing - original draft preparation, writing-review & editing

Laboratory measurements: the Clinical Gait Analysis – State of the art
26
2.1 Brief history
Even if Aristotle (384-322 BC) was the first to observe human gait, the scientific bases of movement analysis,
as it is realized today, were not set before the XVIth century (with Galileo, Newton or Descartes). The advent
of photographical techniques around the middle of the 19th century introduced by É.J. Marey (1830-1904) and
E.J. Muybridge (1830-1904) considerably helped the first two-dimensional precise description of movements
(Baker, 2007). Then, the first tools of three-dimensional measurement systems (Sutherland, 2002), force plates
(Sutherland, 2005) and electromyography (Sutherland, 2001) were born between the XIXth century and the
XXth, until the advent of modern computers which has revolutionized the world of motion analysis (Baker,
2007). Tools became more efficient so the number of computable parameters increased significantly. First, the
displacement of the center of gravity and the spatiotemporal parameters of gait were analyzed. Then, linear
displacements of each segment and angular displacements of each joint were described. And finally, kinetics,
muscular activity or plantar pressures were added.
2.2 Conventions
2.2.1 Gait cycle
By convention, gait is divided into gait cycles to ease its description. A gait cycle, also called ‘stride’, is defined
as the element starting from the initial foot contact with the ground until the subsequent contact of the same
foot (Armand et al., 2016). The key events to characterize a gait cycle are the moments when the foot contacts
the ground, called “foot strikes” (FS), or “initial contacts”, and the moment when the foot leaves the ground,
called “foot off” (FO) or “terminal contact”, as illustrated in Figure 12.
Illustration adapted from (Carcreff et al., 2016a)
Figure 12 - A gait cycle and its phase division
A step is defined between the right and left foot contacts. Two phases are defined from these events: the stance
phase (foot in contact with the ground) which contributes to about 60% of the gait cycle and the swing phase
(no contact with the ground) corresponding to the remaining 40%, for an asymptomatic person at a comfortable
speed. Also, the double support phases are characterized by both feet in contact with the ground, accounting
Stance phase Swing phase
0% 60%
Double support
Single support Double support
100%Initial contact Foot Off Terminal contactContralateral
initial contact
STEP
STRIDE (=CYCLE)
10% 50%

Laboratory measurements: the Clinical Gait Analysis – State of the art
27
for approximately 20% of the gait cycle (Figure 12). Other temporal parameters related to the gait events are
presented in the following section.
2.2.2 Anatomical planes
Gait analysis is based on the principles of biomechanics where the body is considered as a rigid poly-articulated
mechanical object, supposed non-deformable, which can be decomposed into several segments. A coordinate
system is assigned to each body segment and the description of the orientations of a system relative to another,
or relative to the global coordinate system, constitutes the principle of movement analysis. Three anatomical
planes can be defined from the coordinate system: the sagittal containing the upward and forward axes
(generally describing flexion/extension motion), the frontal or coronal plane containing the upward and lateral
axes (abduction/adduction) and the transverse plane containing the forward and the lateral axes
(internal/external rotation) (Figure 13) (Baker, 2013).
Image Adapted from a CC BY 3.0 image (https://creativecommons.org/licenses/by/3.0).
Figure 13 - Anatomical planes and axes
2.3 Conventional clinical gait analysis
2.3.1 Physical examination
The physical examination, carried out by a physiotherapist or a specialized doctor, is an inspection of the
human body in its entirety with a precise evaluation of the musculoskeletal system of the lower limbs. Possible
deficits of motor control, muscular weaknesses, retractions, spasticity, bone deformities, and pain are evaluated
in detail.
2.3.1.1 Anthropometric measurements
The weight and height of the patient, as well as lower limb lengths and widths, are measured at the beginning
of the clinical examination. This helps highlighting possible leg length discrepancy. In addition, these
measurements are used for the estimation of joint centers and inertial parameters for kinematic and kinetic data
calculation algorithms.

Laboratory measurements: the Clinical Gait Analysis – State of the art
28
2.3.1.2 Measurements of the articular amplitudes
The maximum passive mobility of each joint is measured with a goniometer (Viehweger et al., 2007). Muscle
retractions or laxities can be detected by comparing the patient’s ranges of motion with normal amplitudes. It
should be noted that goniometers have rather low precision (inter-examiner and inter-session error can reach
15°) (Mcdowell et al., 2000).
2.3.1.3 Muscle strength and selectivity assessment
Muscle strength and selectivity are evaluated using clinical scales (Florence et al., 1992; Fowler et al., 2009)
while the patient is asked to perform specific resistance movements against the evaluator. A single muscle or
muscle group should be recruited (selectivity). The understanding of the exercises is not always
straightforward, especially for a young child (under 5) or a patient with intellectual disabilities.
2.3.1.4 Assessment of muscle tone
Ashworth (5-point scale) (Bohannon and Smith, 1987) and Tardieu (report of threshold angles where the
muscle reacts to the stretch, at several predefined velocities) (Gracies et al., 2010) scales are the reference tools
for clinical assessment of spasticity. The reproducibility of these scores is low (e.g. only 42.5% of concordance
found between the scores attributed to one muscle by different experimenters (Blackburn et al., 2002)).
2.3.2 Gait assessments
2.3.2.1 Material and outcomes
Figure 14 illustrates the equipment used in gait analysis laboratories, and a description of each equipment is
given in this section.
Figure 14 - Material used in gait analysis and associated outcomes
Reflective
markers
Optoelectronic system:
Infrared cameras + reflective markers
Plantar
pressure mat
Force
plates
Video camera
EMG
electrode
A
B
C
D
E
A
A
B
C
DE
B
Spatiotemporal
parameters
Kinematics
Kinetics
EMG activity
Plantar
pressures
Videos
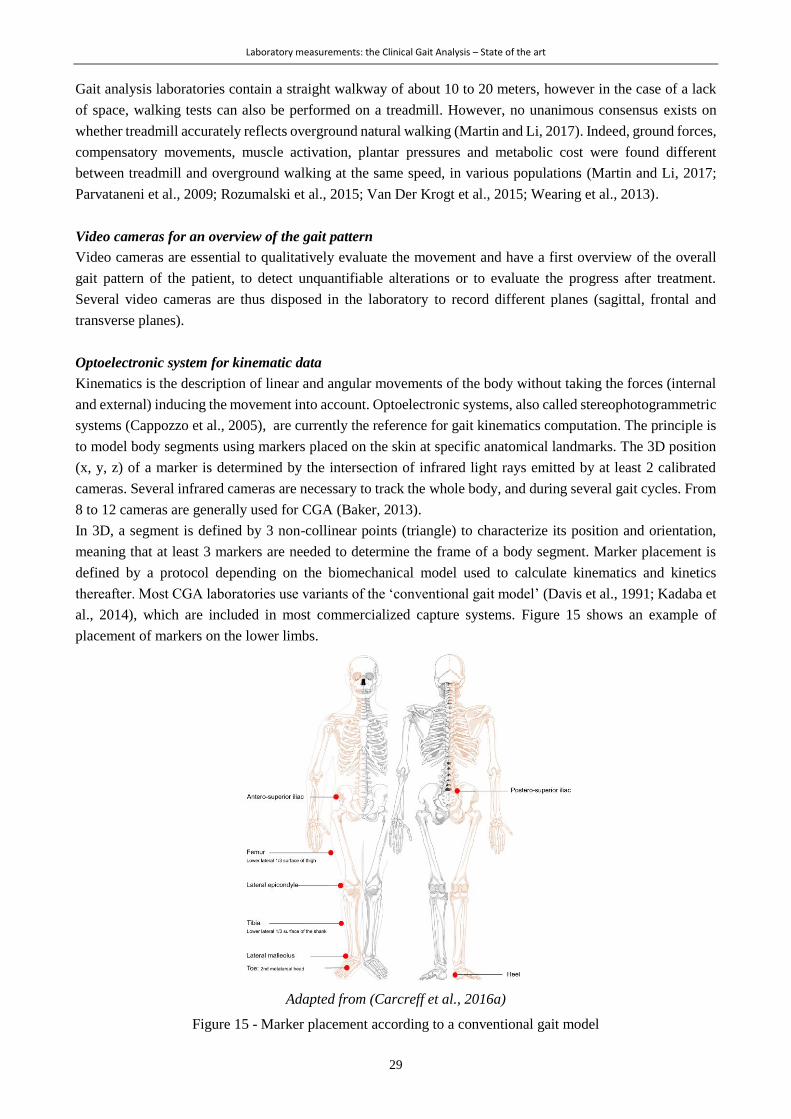
Laboratory measurements: the Clinical Gait Analysis – State of the art
29
Gait analysis laboratories contain a straight walkway of about 10 to 20 meters, however in the case of a lack
of space, walking tests can also be performed on a treadmill. However, no unanimous consensus exists on
whether treadmill accurately reflects overground natural walking (Martin and Li, 2017). Indeed, ground forces,
compensatory movements, muscle activation, plantar pressures and metabolic cost were found different
between treadmill and overground walking at the same speed, in various populations (Martin and Li, 2017;
Parvataneni et al., 2009; Rozumalski et al., 2015; Van Der Krogt et al., 2015; Wearing et al., 2013).
Video cameras for an overview of the gait pattern
Video cameras are essential to qualitatively evaluate the movement and have a first overview of the overall
gait pattern of the patient, to detect unquantifiable alterations or to evaluate the progress after treatment.
Several video cameras are thus disposed in the laboratory to record different planes (sagittal, frontal and
transverse planes).
Optoelectronic system for kinematic data
Kinematics is the description of linear and angular movements of the body without taking the forces (internal
and external) inducing the movement into account. Optoelectronic systems, also called stereophotogrammetric
systems (Cappozzo et al., 2005), are currently the reference for gait kinematics computation. The principle is
to model body segments using markers placed on the skin at specific anatomical landmarks. The 3D position
(x, y, z) of a marker is determined by the intersection of infrared light rays emitted by at least 2 calibrated
cameras. Several infrared cameras are necessary to track the whole body, and during several gait cycles. From
8 to 12 cameras are generally used for CGA (Baker, 2013).
In 3D, a segment is defined by 3 non-collinear points (triangle) to characterize its position and orientation,
meaning that at least 3 markers are needed to determine the frame of a body segment. Marker placement is
defined by a protocol depending on the biomechanical model used to calculate kinematics and kinetics
thereafter. Most CGA laboratories use variants of the ‘conventional gait model’ (Davis et al., 1991; Kadaba et
al., 2014), which are included in most commercialized capture systems. Figure 15 shows an example of
placement of markers on the lower limbs.
Adapted from (Carcreff et al., 2016a)
Figure 15 - Marker placement according to a conventional gait model
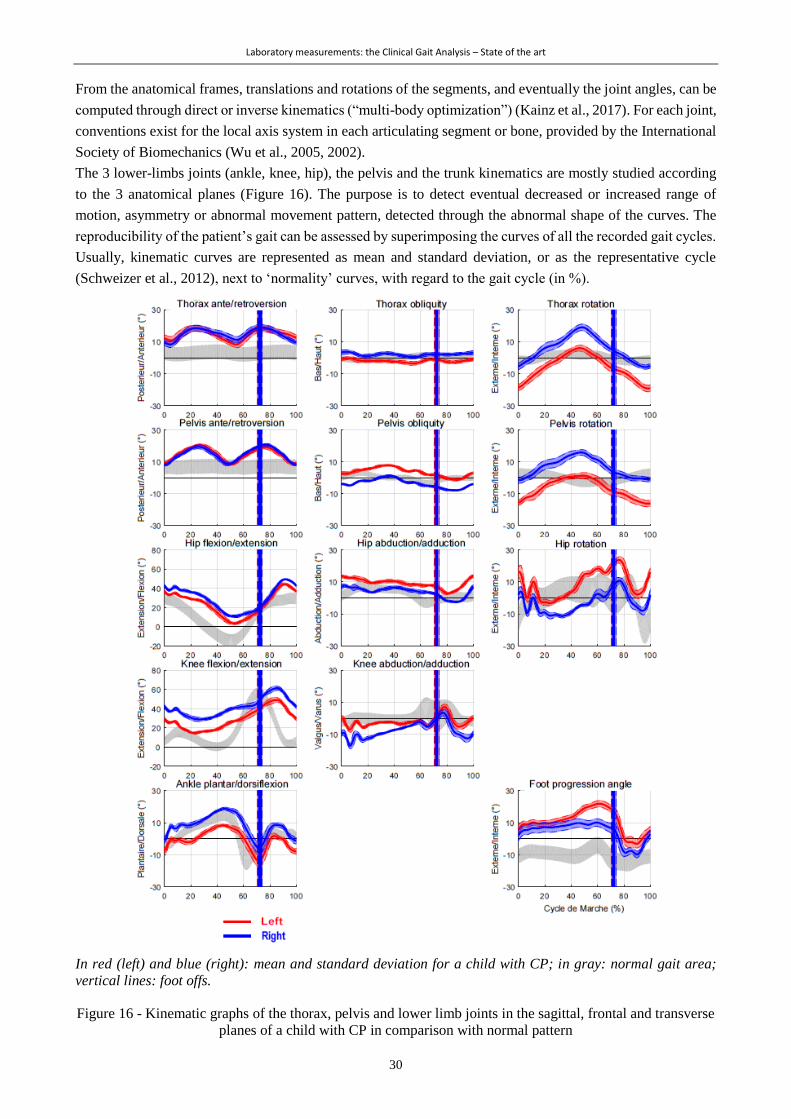
Laboratory measurements: the Clinical Gait Analysis – State of the art
30
From the anatomical frames, translations and rotations of the segments, and eventually the joint angles, can be
computed through direct or inverse kinematics (“multi-body optimization”) (Kainz et al., 2017). For each joint,
conventions exist for the local axis system in each articulating segment or bone, provided by the International
Society of Biomechanics (Wu et al., 2005, 2002).
The 3 lower-limbs joints (ankle, knee, hip), the pelvis and the trunk kinematics are mostly studied according
to the 3 anatomical planes (Figure 16). The purpose is to detect eventual decreased or increased range of
motion, asymmetry or abnormal movement pattern, detected through the abnormal shape of the curves. The
reproducibility of the patient’s gait can be assessed by superimposing the curves of all the recorded gait cycles.
Usually, kinematic curves are represented as mean and standard deviation, or as the representative cycle
(Schweizer et al., 2012), next to ‘normality’ curves, with regard to the gait cycle (in %).
In red (left) and blue (right): mean and standard deviation for a child with CP; in gray: normal gait area;
vertical lines: foot offs.
Figure 16 - Kinematic graphs of the thorax, pelvis and lower limb joints in the sagittal, frontal and transverse
planes of a child with CP in comparison with normal pattern
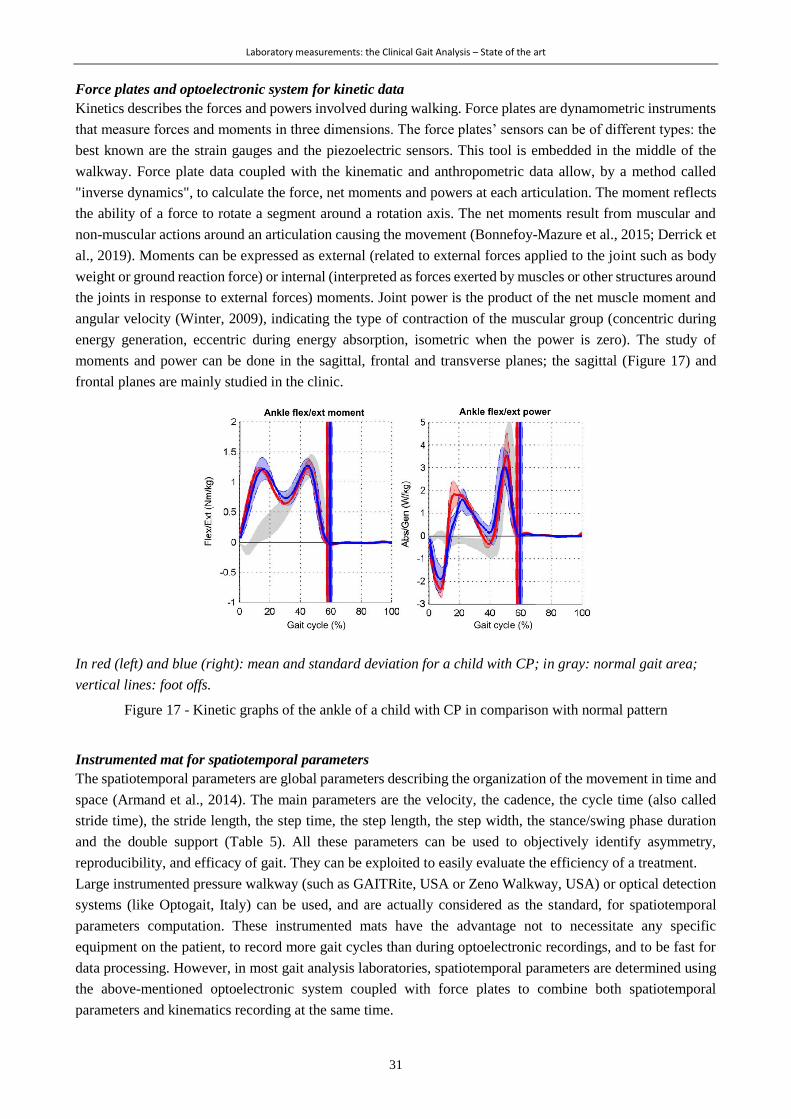
Laboratory measurements: the Clinical Gait Analysis – State of the art
31
Force plates and optoelectronic system for kinetic data
Kinetics describes the forces and powers involved during walking. Force plates are dynamometric instruments
that measure forces and moments in three dimensions. The force plates’ sensors can be of different types: the
best known are the strain gauges and the piezoelectric sensors. This tool is embedded in the middle of the
walkway. Force plate data coupled with the kinematic and anthropometric data allow, by a method called
"inverse dynamics", to calculate the force, net moments and powers at each articulation. The moment reflects
the ability of a force to rotate a segment around a rotation axis. The net moments result from muscular and
non-muscular actions around an articulation causing the movement (Bonnefoy-Mazure et al., 2015; Derrick et
al., 2019). Moments can be expressed as external (related to external forces applied to the joint such as body
weight or ground reaction force) or internal (interpreted as forces exerted by muscles or other structures around
the joints in response to external forces) moments. Joint power is the product of the net muscle moment and
angular velocity (Winter, 2009), indicating the type of contraction of the muscular group (concentric during
energy generation, eccentric during energy absorption, isometric when the power is zero). The study of
moments and power can be done in the sagittal, frontal and transverse planes; the sagittal (Figure 17) and
frontal planes are mainly studied in the clinic.
In red (left) and blue (right): mean and standard deviation for a child with CP; in gray: normal gait area;
vertical lines: foot offs.
Figure 17 - Kinetic graphs of the ankle of a child with CP in comparison with normal pattern
Instrumented mat for spatiotemporal parameters
The spatiotemporal parameters are global parameters describing the organization of the movement in time and
space (Armand et al., 2014). The main parameters are the velocity, the cadence, the cycle time (also called
stride time), the stride length, the step time, the step length, the step width, the stance/swing phase duration
and the double support (Table 5). All these parameters can be used to objectively identify asymmetry,
reproducibility, and efficacy of gait. They can be exploited to easily evaluate the efficiency of a treatment.
Large instrumented pressure walkway (such as GAITRite, USA or Zeno Walkway, USA) or optical detection
systems (like Optogait, Italy) can be used, and are actually considered as the standard, for spatiotemporal
parameters computation. These instrumented mats have the advantage not to necessitate any specific
equipment on the patient, to record more gait cycles than during optoelectronic recordings, and to be fast for
data processing. However, in most gait analysis laboratories, spatiotemporal parameters are determined using
the above-mentioned optoelectronic system coupled with force plates to combine both spatiotemporal
parameters and kinematics recording at the same time.
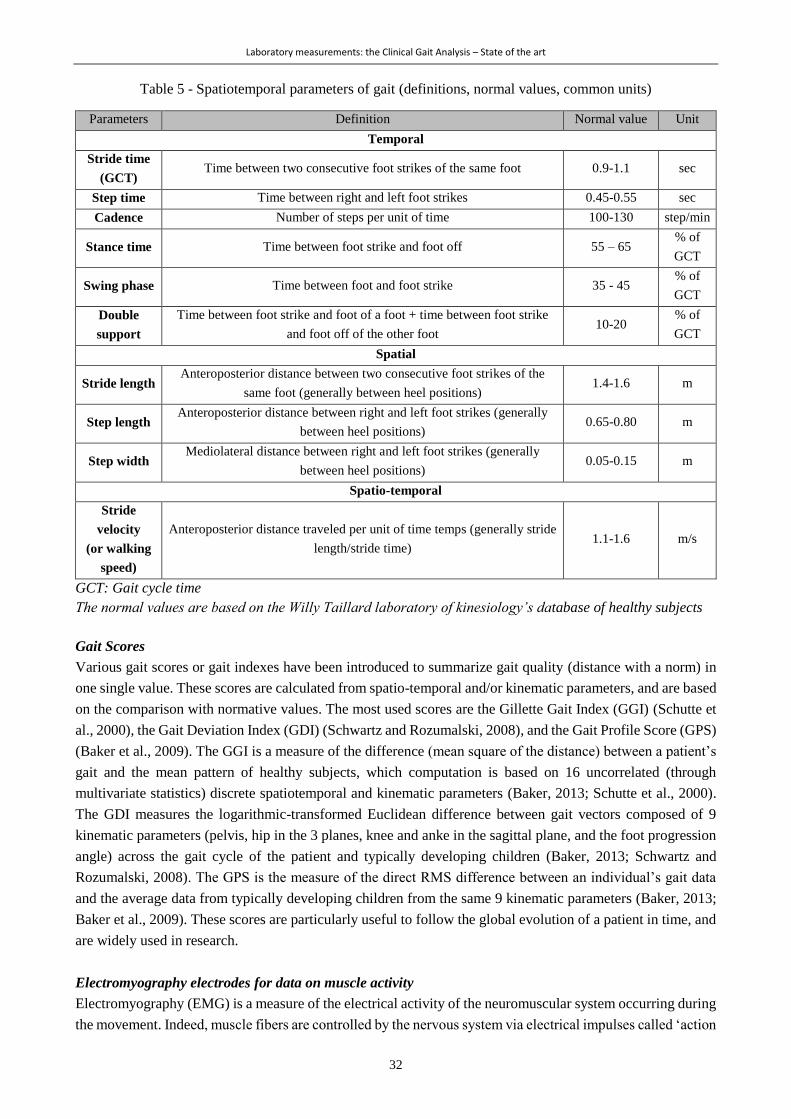
Laboratory measurements: the Clinical Gait Analysis – State of the art
32
Table 5 - Spatiotemporal parameters of gait (definitions, normal values, common units)
Parameters Definition Normal value Unit
Temporal
Stride time
(GCT) Time between two consecutive foot strikes of the same foot 0.9-1.1 sec
Step time Time between right and left foot strikes 0.45-0.55 sec
Cadence Number of steps per unit of time 100-130 step/min
Stance time Time between foot strike and foot off 55 – 65 % of
GCT
Swing phase Time between foot and foot strike 35 - 45 % of
GCT
Double
support
Time between foot strike and foot of a foot + time between foot strike
and foot off of the other foot 10-20
% of
GCT
Spatial
Stride length Anteroposterior distance between two consecutive foot strikes of the
same foot (generally between heel positions) 1.4-1.6 m
Step length Anteroposterior distance between right and left foot strikes (generally
between heel positions) 0.65-0.80 m
Step width Mediolateral distance between right and left foot strikes (generally
between heel positions) 0.05-0.15 m
Spatio-temporal
Stride
velocity
(or walking
speed)
Anteroposterior distance traveled per unit of time temps (generally stride
length/stride time) 1.1-1.6 m/s
GCT: Gait cycle time
The normal values are based on the Willy Taillard laboratory of kinesiology’s database of healthy subjects
Gait Scores
Various gait scores or gait indexes have been introduced to summarize gait quality (distance with a norm) in
one single value. These scores are calculated from spatio-temporal and/or kinematic parameters, and are based
on the comparison with normative values. The most used scores are the Gillette Gait Index (GGI) (Schutte et
al., 2000), the Gait Deviation Index (GDI) (Schwartz and Rozumalski, 2008), and the Gait Profile Score (GPS)
(Baker et al., 2009). The GGI is a measure of the difference (mean square of the distance) between a patient’s
gait and the mean pattern of healthy subjects, which computation is based on 16 uncorrelated (through
multivariate statistics) discrete spatiotemporal and kinematic parameters (Baker, 2013; Schutte et al., 2000).
The GDI measures the logarithmic-transformed Euclidean difference between gait vectors composed of 9
kinematic parameters (pelvis, hip in the 3 planes, knee and anke in the sagittal plane, and the foot progression
angle) across the gait cycle of the patient and typically developing children (Baker, 2013; Schwartz and
Rozumalski, 2008). The GPS is the measure of the direct RMS difference between an individual’s gait data
and the average data from typically developing children from the same 9 kinematic parameters (Baker, 2013;
Baker et al., 2009). These scores are particularly useful to follow the global evolution of a patient in time, and
are widely used in research.
Electromyography electrodes for data on muscle activity
Electromyography (EMG) is a measure of the electrical activity of the neuromuscular system occurring during
the movement. Indeed, muscle fibers are controlled by the nervous system via electrical impulses called ‘action
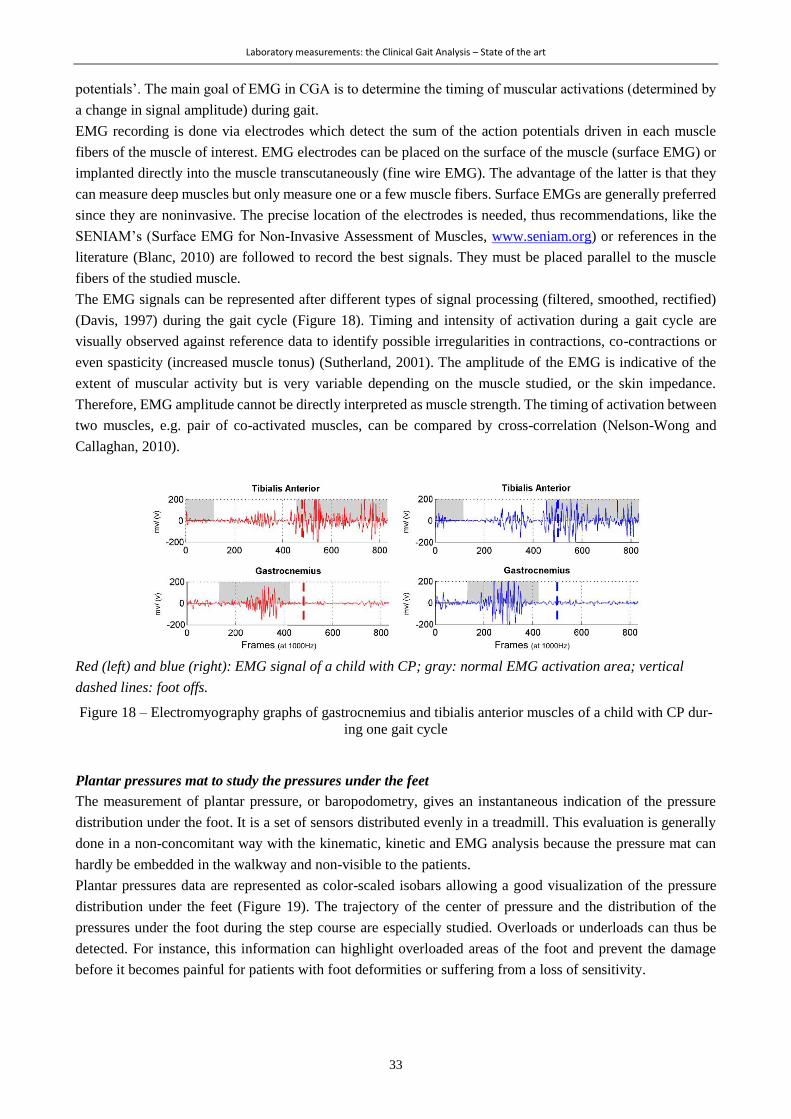
Laboratory measurements: the Clinical Gait Analysis – State of the art
33
potentials’. The main goal of EMG in CGA is to determine the timing of muscular activations (determined by
a change in signal amplitude) during gait.
EMG recording is done via electrodes which detect the sum of the action potentials driven in each muscle
fibers of the muscle of interest. EMG electrodes can be placed on the surface of the muscle (surface EMG) or
implanted directly into the muscle transcutaneously (fine wire EMG). The advantage of the latter is that they
can measure deep muscles but only measure one or a few muscle fibers. Surface EMGs are generally preferred
since they are noninvasive. The precise location of the electrodes is needed, thus recommendations, like the
SENIAM’s (Surface EMG for Non-Invasive Assessment of Muscles, www.seniam.org) or references in the
literature (Blanc, 2010) are followed to record the best signals. They must be placed parallel to the muscle
fibers of the studied muscle.
The EMG signals can be represented after different types of signal processing (filtered, smoothed, rectified)
(Davis, 1997) during the gait cycle (Figure 18). Timing and intensity of activation during a gait cycle are
visually observed against reference data to identify possible irregularities in contractions, co-contractions or
even spasticity (increased muscle tonus) (Sutherland, 2001). The amplitude of the EMG is indicative of the
extent of muscular activity but is very variable depending on the muscle studied, or the skin impedance.
Therefore, EMG amplitude cannot be directly interpreted as muscle strength. The timing of activation between
two muscles, e.g. pair of co-activated muscles, can be compared by cross-correlation (Nelson-Wong and
Callaghan, 2010).
Red (left) and blue (right): EMG signal of a child with CP; gray: normal EMG activation area; vertical
dashed lines: foot offs.
Figure 18 – Electromyography graphs of gastrocnemius and tibialis anterior muscles of a child with CP dur-
ing one gait cycle
Plantar pressures mat to study the pressures under the feet
The measurement of plantar pressure, or baropodometry, gives an instantaneous indication of the pressure
distribution under the foot. It is a set of sensors distributed evenly in a treadmill. This evaluation is generally
done in a non-concomitant way with the kinematic, kinetic and EMG analysis because the pressure mat can
hardly be embedded in the walkway and non-visible to the patients.
Plantar pressures data are represented as color-scaled isobars allowing a good visualization of the pressure
distribution under the feet (Figure 19). The trajectory of the center of pressure and the distribution of the
pressures under the foot during the step course are especially studied. Overloads or underloads can thus be
detected. For instance, this information can highlight overloaded areas of the foot and prevent the damage
before it becomes painful for patients with foot deformities or suffering from a loss of sensitivity.

Laboratory measurements: the Clinical Gait Analysis – State of the art
34
Figure 19 - Isobars with a color-scale representing the pressures under the feet of a child with CP during the
gait cycle and lines representing the trajectory of the center of pressures
The measures of energy expenditure
Walking is, like any physical activity, an exercise that requires energy. The synthesis of muscle-usable energy
molecules (ATP) is a process that consumes oxygen and produces heat and carbon dioxide. Energy expenditure
can be estimated by measuring oxygen consumption (by pneumotachometer or spirometers), heat production
(by thermometer) or heart rate (by heart rate monitor). The evaluation of energy expenditure allows
appreciating the efficiency of a patient's walk (Robert et al., 1999).
2.3.2.2 Conduct of an examination
Before each visit, calibration of the optoelectronic system, i.e. determining the position and orientation of the
cameras between themselves as well as the position and orientation of the force plate(s), is necessary. For this
purpose, a calibration wand incorporating reflective markers at known fixed distances one to the others is
waved in the laboratory corresponding to the capture volume (Baker, 2013). A capture with a similar
calibration wand placed on the force plates allows the former relative camera calibration to be aligned with the
global laboratory coordinate system (Baker, 2013).
When the patient comes, first of all, an anamnesis (medical history and history of the disease) is made in order
to have good knowledge of the case and the reasons for the examination. The doctor's prescription letter is also
of great help to guide the examiners.
Once the patient is equipped with the markers and EMG electrodes, a static recording is generally performed
which will later be used to define axes and joint centers and, for some motion analysis systems, to automatically
recognize markers by the processing software (auto-labeling). Then, the patient walks barefoot back and forth
along the walkway, the number of times necessary to acquire enough valid passages. Valid passages include
entire feet on the force plates and a natural walk. The more trials recorded; the better the evaluation of the
reproducibility of gait. The number of trials also depends on the patient's ability to walk. For highly affected
patients, only one or two trials can be performed. In general, approximately 10 walking cycles are used to
characterize a patient’s gait. For the evaluation of plantar pressures, it is also recommended to take at least 3
valid measurements for each foot (foot at the center of the pressure mat).
Depending on the case, some additional recordings can be made. Such as walking with orthosis, running,
balance, etc.
2.3.3 Data processing
The first phase of data processing consists of recognizing the markers on the three-dimensional view, and then
filling the gaps in marker trajectories resulting from occlusions. The second step is the identification of gait
events (FS and FO). Their identification can be done manually, thanks to force plate data or by automatic
detection from kinematic data. Commercial or opensource softwares, such as Mokka (Motion Kinematic &
Kinetic Analyzer) (Barré and Armand, 2014), allow viewing the 3D reconstruction of the markers and can be
used to manually define the event times. Force plate data allow the identification of FS and FO using force

Laboratory measurements: the Clinical Gait Analysis – State of the art
35
thresholds (Boutaayamou et al., 2014; Veilleux et al., 2016). The inconvenient of using force data only is the
need of a large number of trials with entire foot contact on the surface of the platform (Veilleux et al., 2016).
Besides, for patients using walking aids or having drag foot, force plate data turns erroneous (Lempereur et
al., 2019). For these reasons, multiple algorithms have been developped for the automatic detection of gait
events using kinematic data (Boutaayamou et al., 2014; Bruening and Ridge, 2014; Zeni et al., 2008) or
combining kinematic and force plate data (Stanhope et al., 1990). More recently, deep learning approaches
were developed and prove to out-perform any previously-mentioned kinematic-based models for pathological
gaits (Kidzińskiid et al., 2019; Lempereur et al., 2019). Anyway, visual validation of gait events detection is
strongly recommended at the end of this data processing step. Low-pass filtering is applied to the marker
trajectories and the EMG signal to remove any movement artifacts in the data. Spatio-temporal parameters,
joint angles, moments and powers are calculated by commercial software (Vicon, USA or C-Motion, USA),
open-source packages (Leboeuf et al., 2019, 2016), or algorithms internally developed, from the marker
trajectories, anthropometric data, and force plates data.
2.3.4 Interpretations
A multidisciplinary team consisting of at least one physician and the person who was in charge of the data
acquisition is needed to interpret the results. Ideally, a person who regularly follows the patient as a
physiotherapist joins the interpretation session. The team reviews all the available data: videos are watched
carefully to observe the general way of walking. Gait scores give the team an idea of the patient's general
impairment. Spatiotemporal, kinematic, kinetic, EMG and plantar pressure parameters are described in detail.
Relationships between the various sources of data (from CGA, but also imaging, physical examination, etc.)
are established. The objective is to distinguish between the primary elements of the pathology and the
compensatory elements (Davids, 2006; Romkes and Brunner, 2007). Guidelines exist to help the identification
of abnormal gait features on the data, the grouping of information, the reporting and the elaboration of
recommendations, such as the one of R. Baker with his ‘Impairments Focus Interpretation’ (Baker, 2013). In
summary, the heart of CGA data interpretation is linking clinical and biomechanical data to lead to the
identification and understanding of a patient's gait disorders. These results are integrated into the patient’s
medical file, and sent to the medical doctor or therapist to guide the therapeutic choices.
2.3.5 Limitations
Equipment
First of all, the reconstruction of the markers’ position in three dimensions is closely linked to the accuracy of
the equipment. The number of cameras, their resolution, their optical quality or their position in the laboratory
play a crucial role. The marker size and the number of cameras will determine the amount of obstruction
(marker flickering) that will occur, especially during arm and leg swinging or due to assistive devices (Chiari
et al., 2005). Besides, algorithms for marker imaged processing can generate reconstruction error (Chiari et
al., 2005). The mean absolute error of the optoelectronic system (Vicon) evaluated with a rigid structure with
markers attached at known locations and angles was found less than 2mm and 1.7° in dynamic situations (Di
Marco et al., 2017; Merriaux et al., 2017), indicating excellent precision when markers are attached to a rigid
body (Colyer et al., 2018). However, the performances decrease when 3D joint center positions are estimated
from markers located on the skin (Colyer et al., 2018).
Soft tissue artifact
Soft tissue artifact is the consequence of the movement of the marker relative to the underlying bone due to
skin deformation and displacement during walking. It constitutes the most critical source of error in 3D gait
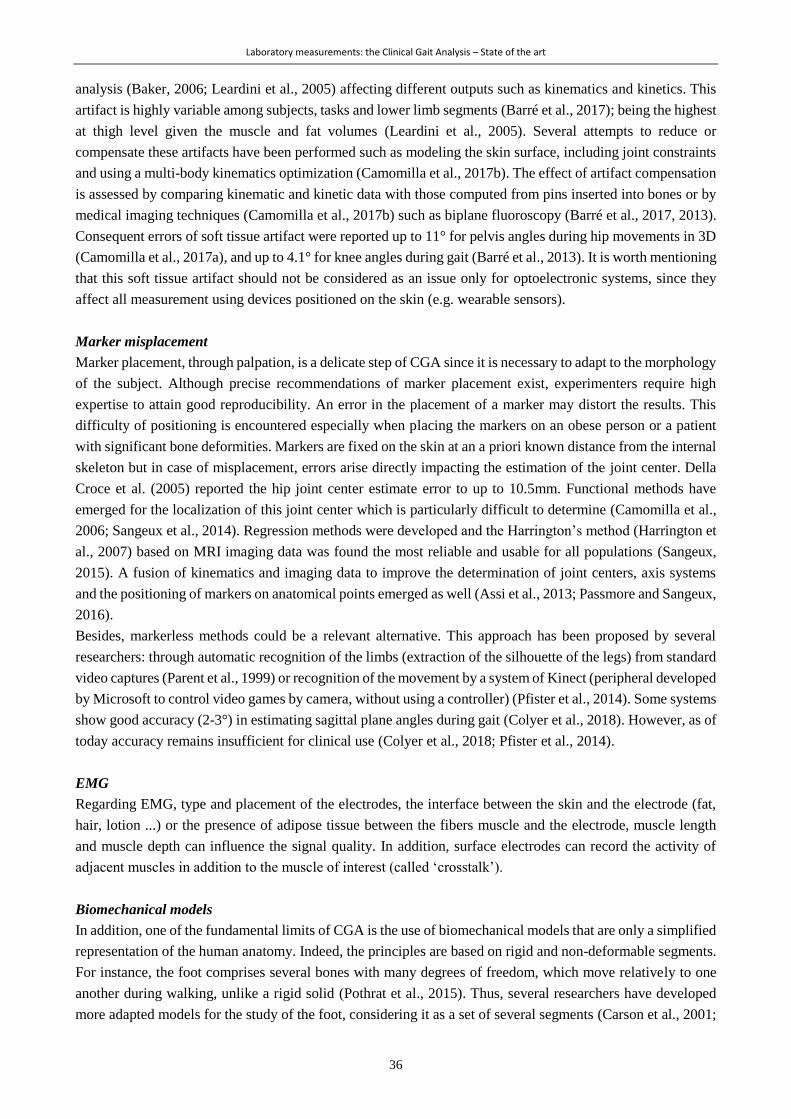
Laboratory measurements: the Clinical Gait Analysis – State of the art
36
analysis (Baker, 2006; Leardini et al., 2005) affecting different outputs such as kinematics and kinetics. This
artifact is highly variable among subjects, tasks and lower limb segments (Barré et al., 2017); being the highest
at thigh level given the muscle and fat volumes (Leardini et al., 2005). Several attempts to reduce or
compensate these artifacts have been performed such as modeling the skin surface, including joint constraints
and using a multi-body kinematics optimization (Camomilla et al., 2017b). The effect of artifact compensation
is assessed by comparing kinematic and kinetic data with those computed from pins inserted into bones or by
medical imaging techniques (Camomilla et al., 2017b) such as biplane fluoroscopy (Barré et al., 2017, 2013).
Consequent errors of soft tissue artifact were reported up to 11° for pelvis angles during hip movements in 3D
(Camomilla et al., 2017a), and up to 4.1° for knee angles during gait (Barré et al., 2013). It is worth mentioning
that this soft tissue artifact should not be considered as an issue only for optoelectronic systems, since they
affect all measurement using devices positioned on the skin (e.g. wearable sensors).
Marker misplacement
Marker placement, through palpation, is a delicate step of CGA since it is necessary to adapt to the morphology
of the subject. Although precise recommendations of marker placement exist, experimenters require high
expertise to attain good reproducibility. An error in the placement of a marker may distort the results. This
difficulty of positioning is encountered especially when placing the markers on an obese person or a patient
with significant bone deformities. Markers are fixed on the skin at an a priori known distance from the internal
skeleton but in case of misplacement, errors arise directly impacting the estimation of the joint center. Della
Croce et al. (2005) reported the hip joint center estimate error to up to 10.5mm. Functional methods have
emerged for the localization of this joint center which is particularly difficult to determine (Camomilla et al.,
2006; Sangeux et al., 2014). Regression methods were developed and the Harrington’s method (Harrington et
al., 2007) based on MRI imaging data was found the most reliable and usable for all populations (Sangeux,
2015). A fusion of kinematics and imaging data to improve the determination of joint centers, axis systems
and the positioning of markers on anatomical points emerged as well (Assi et al., 2013; Passmore and Sangeux,
2016).
Besides, markerless methods could be a relevant alternative. This approach has been proposed by several
researchers: through automatic recognition of the limbs (extraction of the silhouette of the legs) from standard
video captures (Parent et al., 1999) or recognition of the movement by a system of Kinect (peripheral developed
by Microsoft to control video games by camera, without using a controller) (Pfister et al., 2014). Some systems
show good accuracy (2-3°) in estimating sagittal plane angles during gait (Colyer et al., 2018). However, as of
today accuracy remains insufficient for clinical use (Colyer et al., 2018; Pfister et al., 2014).
EMG
Regarding EMG, type and placement of the electrodes, the interface between the skin and the electrode (fat,
hair, lotion ...) or the presence of adipose tissue between the fibers muscle and the electrode, muscle length
and muscle depth can influence the signal quality. In addition, surface electrodes can record the activity of
adjacent muscles in addition to the muscle of interest (called ‘crosstalk’).
Biomechanical models
In addition, one of the fundamental limits of CGA is the use of biomechanical models that are only a simplified
representation of the human anatomy. Indeed, the principles are based on rigid and non-deformable segments.
For instance, the foot comprises several bones with many degrees of freedom, which move relatively to one
another during walking, unlike a rigid solid (Pothrat et al., 2015). Thus, several researchers have developed
more adapted models for the study of the foot, considering it as a set of several segments (Carson et al., 2001;
Laboratory measurements: the Clinical Gait Analysis – State of the art
37
Levinger et al., 2010; Myers et al., 2004; Scott and Winter, 1993). These models are however slightly used in
the clinic because of the time required to place all the markers and also due to the difficulty of interpretation.
Dissemination and representativeness
Besides limitations regarding accuracy and reproducibility, CGA has two major issues. The first one is the
difficulty of dissemination. Indeed, CGA requires a dedicated laboratory including advanced equipment and
also qualified and multidisciplinary personnel, which contribute to its high cost. Even in developed countries,
few clinical gait analysis laboratories exist (about 5 in Switzerland, 23 in France, 50 in USA for instance),
obliging families with a child with disabilities to travel sometimes far for repetitive CGA during several years
of childhood. Even if the prices of such commercial systems decrease regularly due to concurrence, the devices
and software packages remain unaffordable for many institutions (costs for a motion capture system between
$50’000 and $300’000). Furthermore, more courses are needed to train professionals, especially clinicians and
therapists in order to be able to understand the “gait report” which can be lengthy and complex for novices
(Simon, 2004). More training would lead to increasing the number of laboratories. Finally, CGA suffers from
a lack of standardization. Yet, several organizations like, for example in Europe, the European Society of
Motion Analysis in Children and Adults (ESMAC), the Clinical Movement Analysis Society of UK and Ireland
(CMAS), the Italian Society of Clinical Movement Analysis (SIAMOC), the Societé Francophone d’Analyse
du Mouvement chez l’Enfant et l’Adulte, exist and tend to bring consensual practices regarding laboratory
management, instrumental issues, clinical appropriateness, etc. (Benedetti et al., 2017).
The second issue comes down to the drawbacks highlighted in Chapter 1, regarding the lack of
representativeness of the measures. As explained, walking in a laboratory surrounded by cameras and
caregivers is not likely to reflect the way of walking in daily life. These two concerns are major topics
nowadays in the field of gait analysis and they both bring the need for new tools, which would have to be low
cost, easy to use, and wearable outside of the laboratory in daily life situations.
2.3.6 Clinical efficacy of CGA in CP – Pros and Cons
2.3.6.1 A great benefit for children with CP
CGA has shown its effectiveness to improve the understanding of motor impairments for patients with
orthopeadic troubles (Wren et al., 2011b). Actually, the evaluation of patients with serious gait disorders, like
children with CP, has changed dramatically over the past 50 years, thanks to the advent of motion capture
laboratories, as reported by Gage J. R., an orthopedic surgeon and strong international advocate of CGA (Gage
et al., 2009). Indeed, at the end of the 1970s, a patient was assessed only by reviewing his clinical history and
a simple examination including rapid observation of his way of walking and some routine x-rays. Knowledge
about locomotor control was precarious at that time (Gage et al., 2009). The surgical procedures were based
on empirical methods. Results of the surgery were not always beneficial for the patients, and the surgeons had
no way to get feedback on their procedures, so they could not improve their practices. Technological advances
of the following years allowed providing motion analysis platforms to the clinics, revolutionizing the
evaluation of patients with CP. In fact, these movement analysis laboratories have given therapists the
possibility to obtain precise evaluations before and after surgery and thus to alter their decision making (Bell
et al., 2002; Cook et al., 2003). Indeed, CGA permitted to decrease the number of patients recommended for
surgery and to change the level or type of surgery in 40% of the cases (Cook et al., 2003). Gait outcomes were
found to positively change in patients who received surgery as recommended by CGA (Wren et al., 2011a). A
concrete example in which CGA has proven highly beneficial is the Achilles tendon lengthening surgery that
was excessively recommended in absence of objective data in case of true equinus or jump gaits (Molenaers
et al., 2006). Post-operative CGA data have indeed highlighted the high prevalence of overcorrection evolving
Laboratory measurements: the Clinical Gait Analysis – State of the art
38
into severe crouch gait, and in certain cases, the loss of walking ability (Pilloni et al., 2019). The number of
Achilles tendon lengthening therefore significantly decreased thank to CGA (Molenaers et al., 2006). Grouping
multiple single surgical procedures into one single event multilevel surgery was also among CGA’s
contributions, reducing significantly the frequency of orthopedic surgical procedures (Molenaers et al., 2006).
CGA also contributed to increasing the age of the first surgical procedure (Molenaers et al., 2006).
2.3.6.2 « Everyone is speaking a different language »
Unlike the previously mentioned ‘Pro’ statements, some researchers have painted a gloomy picture of the
situation, putting in doubt the evidence supporting the clinical efficacy of CGA in children with CP. Wright
J.G., an orthopeadic surgeon, wrote 2 editorials a decade apart (2003 and 2015) in this direction, alarming that
« everyone is speaking a different language » (Wright and Theologis, 2015). Given the limitations presented
in the previous section (2.3.5 Limitations), reliability and validity of gait analysis seem insufficient. Key
multicenter studies (Noonan et al., 2003; Skaggs et al., 2000) indeed raised the concerns and generated a debate
(Davids, 2006; Gage, 2003; Wright, 2003) while they demonstrated that substantial differences were found in
the raw data acquired on the same patient with CP in different gait analysis institutions and that the treatment
recommendations diverged in most cases (Noonan et al., 2003; Skaggs et al., 2000). This variability among
examinations arises from the material and technician’s performances, the patients’ intrinsic variability, and the
clinicians’ understanding and reasoning (Wright, 2003). Nevertheless, it is worth mentioning that the same
variability issue can be found in therapeutic recommendations from other medical examinations. For instance,
using the same X-ray images, different treatment decisions can be made by several clinicians for the treatment
of scoliosis (Vitale et al., 2011). This evidence supporting clinical low efficacy of CGA in CP emphasized the
need to standardize the examination allowing everyone to speak the same language.
2.4 Conclusions
Despite all the limitations and the controversy, CGA is considered as the clinical standard for the quantitative
characterization of gait. The fields of investigation are multiple (kinematics, kinetics, muscular activity, plantar
pressures, etc.) which require various equipment and a multidisciplinary team. CGA allows the caregivers
identifying the gait alterations and their possible causes that will be used to develop a therapeutic plan. This
clinical evaluation has proven its clinical relevance for 20 years now and continues to progress to overcome
the remaining drawbacks. Engineers and clinicians, whose collaboration has contributed to this success, do not
lack inspiration and motivation to generate solutions for better medical care of patients with gait disorders.
The good knowledge of CGA procedure has driven the choices along this doctoral work, i.e. efforts were
indeed made to give an overview of the children’s gait through multiple variables that are used in CGA and
well understood by the clinicians. Hence, the focus of this project was to keep as close as possible from current
clinical habits, in order to end up with reasonable and realistic propositions.
39
Chapter 3 *
Real-life measurement: Spatiotemporal gait parameters assessment us-
ing wearable technology – State of the art
Abstract
Methods for the estimation of spatiotemporal parameters of gait using wearable devices have emerged for
nearly 30 years now. Several computational approaches have been developed, using different configurations
of sensors. This chapter aims at reporting a global overview of the mostly used systems, in a technical review
format. Published articles were exported from five relevant databases. Full-length articles published in English,
including studies using wearable systems to estimate one or several spatiotemporal parameters in pathological
or non-pathological populations were considered. Included articles were classified into two groups depending
on if the article described a new method or used an existing method. Articles describing a new method were
discussed regarding the sensor configurations, the computational approaches, the performance of the system,
in three distinct sections namely, temporal, spatial and spatiotemporal parameters. This chapter ends with a
section dedicated to the use of such methods in the particular case of children with cerebral palsy.
* Part of this chapter intended for a future publication with the following co-authors:
Carcreff L., Scott K., Soltani A., Bonci T., Kuederle A., Mico E., Ullrich M., Cereatti A., Del Din S., Eskofier B., Mazza
C., Ionescu A., Aminian K.
My contributions: Conceptualization, methodology, paper selection, part of screening, data extraction, writing – original
draft preparation

Real-life measurement: Spatiotemporal gait parameters assessment using wearable technology – State of the art
40
3.1 Introduction
Quantification of gait parameters is highly prized for clinicians caring patients with gait disorders.
Traditionally, the gold standards for gait parameters computation are specific cutting-edge equipment
(described in Chapter 2) which have limited accessibility due to their high cost, the need of a dedicated room
(gait analysis laboratory), the need of qualified and dedicated personnel, and the time required for patient
preparation, data acquisition, processing, and interpretation (Petraglia et al., 2019). Furthermore, limited space
entails that patients are evaluated along short walking distances, and only a few steps are assumed to be a good
reflection of their usual gait (Aminian et al., 2002). To overcome these limitations, researchers have begun to
take advantage of accelerometer allowing ambulatory monitoring since the 1970s. Later with the progress of
Micro-Electro-Mechanical Systems (MEMS) the use of such sensors has increased with the combination of
accelerometer and gyroscope and according to the rapid development of microcontroller power, memory card
capacity, and battery size and autonomy (Kumar Mishra et al., 2019).
Inertial sensors, magnetometers and force and pressure sensors are the most used wearable sensors nowadays
(Tao et al., 2012). ‘Inertial’ refers to the ability of sensors to measure their movement, or the movement of a
rigid body to which it is attached, exploiting the reluctance of an internal free mass to move (inertia) while
being accelerated or rotated by an external force (Picerno, 2017). Inertial sensors also called ‘Inertial
Measurement Units’ (IMU), include accelerometers, sensing linear acceleration along a sensitive axis, and
gyroscopes, sensing angular velocity about a sensitive axis (Picerno, 2017). Nowadays, most IMUs comprise
3D accelerometer and 3D gyroscope with 3 orthogonal sensitive axes. The extended appellation ‘Magneto-
Inertial Measurement Units’ (MIMU) encompasses a magnetometer, measuring the earth's magnetic field
orientation, in addition to the IMU components (Petraglia et al., 2019). Pressure sensors and force-sensitive
resistors (FSR), measuring pressure and force respectively, have the potential to quantify plantar pressures and
the distributed vertical component of the ground reaction force (Hegde et al., 2016). Finally, barometric
pressure sensors can be used to estimate the sensor elevation (Moufawad el Achkar et al., 2016).
These sensors properties allow computing gait parameters such as spatiotemporal parameters (STP),
kinematics and kinetics. Methods to estimate gait parameters from inertial sensor data have been developed
since 1990 (Fong and Chan, 2010; Picerno, 2017; Yang and Li, 2012a). In fact, abundant studies providing
methods for ambulant gait analysis have ensued. Systems providing 3D gait kinematics and kinetics developed
massively and were found accurate and reliable with regard to the optoelectronic system when used in clinical
and standardized settings for healthy subjects (Hegde et al., 2016; Petraglia et al., 2019). Appropriate and
precise movements of calibration are often required, implying, at least, the supervision of an investigator each
time the sensors are mounted. In addition, 3D kinematic parameters may rely on the use of a magnetometer
which has the inherent risk to sense a locally disturbed magnetic field (Picerno, 2017). This means that such
system may suffer from inaccuracies in unsupervised real-life settings upon regular contact with ferromagnetic
disturbances. On the other hand, STP computation can rely on sensor orientations in 1D, simplifying the
calibration procedures (Picerno, 2017). Temporal analysis using the cyclical property of gait can be done by
detecting periodic features on acceleration and angular velocity signals (Yang and Li, 2012a). Spatial
parameters and STP are explored through numerical integration, biomechanical models or abstraction models
(Yang and Li, 2012a). So far, STP might be more exploitable in real-life settings than kinematics or kinetics
with wearable sensors due to the possibility to consider 1D signals.
Gait speed and step length reduction, stance time and cadence augmentation are common features related to a
decrease in activity level and participation. STP constitute indeed good predictors of disability (Petraglia et al.,
Real-life measurement: Spatiotemporal gait parameters assessment using wearable technology – State of the art
41
2019). Precise and reliable measures of these fundamental gait parameters are thus of major clinical interest,
i.e. for therapy planning and management (Washabaugh et al., 2017). The gold standard systems for the
measurement of STP, described in Chapter 2, as well as low-cost instruments such as Kinect or a single RGB
camera (Yagi et al., 2019), have the inconvenience of providing only restricted capture volume. Wearable
systems have the great advantage to enable the measurement of almost an unlimited number of steps in various
environments (Washabaugh et al., 2017). Currently, among all the published methods, variable levels of
accuracy are reported depending on the methodological approach and the sensor location (Pacini Panebianco
et al., 2018; Petraglia et al., 2019). The purpose of this chapter is to review existing approaches for STP
assessment using wearable systems, mostly IMUs, regarding computational methods, sensor configurations,
accuracy against a reference, studied population and assessment settings, in order to report the current general
trends.
3.2 Method
3.2.1 Articles identification
Although the whole present technical review was not meant to be systematic, the most relevant clinical and
technical databases were consulted using specific keywords. Articles were selected from PubMed (Medline),
Embase, Web of Science, Scopus and IEEE Xplore databases in February 2019. Full-length articles published
in English, including studies using wearable systems to estimate one or several gait STP in humans (with or
without pathology) were considered. The logical search equation was: (( walking OR gait ) AND ( "inertial
sensor" OR "kinematic sensor" OR "miniaturized sensor" OR "body fixed sensor" OR "body worn sensor" OR
"inertial device" OR "wearable device" OR "kinematic device" OR "body fixed device" OR "body worn
device" OR "inertial system" OR "wearable system" OR "inertial measurement unit" OR "imu" OR “mimus”
OR “imus” OR "miniaturized inertial measurement unit" OR "mimu" OR "GPS" OR " global navigation
satellite system" OR accelerometer OR gyroscope OR "angular rate" OR "angular velocity" OR "mobile
phone" OR "cell phone" OR smartphone ) AND (“speed” OR “gait velocity” OR “walking velocity” OR
“cadence” OR “spatiotemporal” OR “spatio-temporal” OR “gait parameter” OR “gait parameters”) AND (
algorithm OR assessment OR measurement OR technique ) AND NOT ( "Animal" OR "Animals")). The
search was based on the title, abstract and keywords.
3.2.2 Studies selection
After duplicates removal, using the Mendeley reference management software (https://www.mendeley.com),
and exclusion of records based on keywords, the titles, and abstracts of the remaining records were read to
exclude irrelevant results according to the following exclusion criteria. Articles were excluded if (1) they were
not an original article (i.e. case reports, reviews, conference proceedings commentaries, letters to the editor or
theses), (2) they were not related to the assessment of human gait, (3) only one subject was assessed (poor
level of evidence), (4) the monitoring system used was not wearable or non-independent from a non-wearable
device, (5) the monitoring system was not usable indoor or outdoor, (6) none of the following STP was
computed: number of steps, cadence, stride time, stride length, stride velocity and gait phases duration, (7) the
computational method was not described or referenced, (8) any validation measure was reported (if the
computational method was described), and (9) the article was not written or translated in English. Included
records were separated in 2 groups depending if the article was describing a new method or using an existing
method. For this chapter, and for the purpose of the intended publication, we only focused on the first group
to have a technical overview of the methods. However, at the end of this chapter, a section is dedicated to the
use of these methods in the particular case of children with CP.
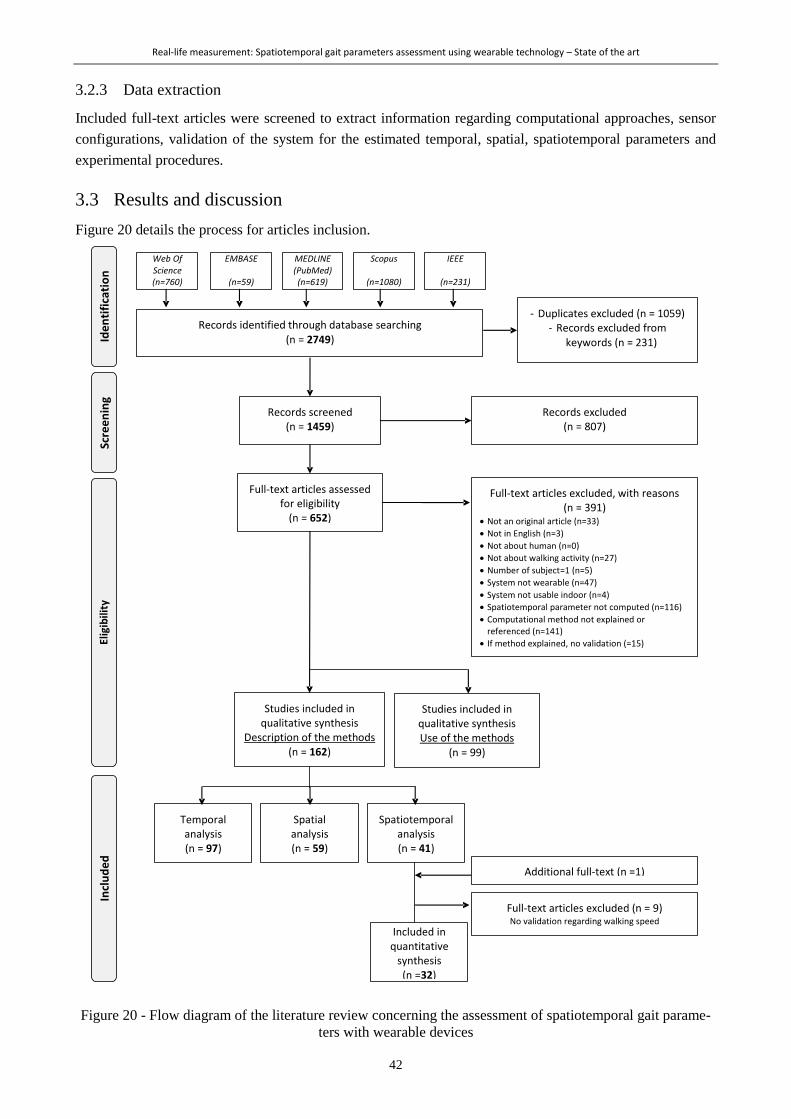
Real-life measurement: Spatiotemporal gait parameters assessment using wearable technology – State of the art
42
3.2.3 Data extraction
Included full-text articles were screened to extract information regarding computational approaches, sensor
configurations, validation of the system for the estimated temporal, spatial, spatiotemporal parameters and
experimental procedures.
3.3 Results and discussion
Figure 20 details the process for articles inclusion.
Figure 20 - Flow diagram of the literature review concerning the assessment of spatiotemporal gait parame-
ters with wearable devices

Real-life measurement: Spatiotemporal gait parameters assessment using wearable technology – State of the art
43
From a total of 2’749 articles identified through the database search, 162 were included as a description of a
new method, and 99 were included as an evaluation of an existing method. Among the studies describing a
new method, 97 were dedicated to estimating temporal parameters, 59 estimated spatial parameters and 41
estimated walking speed. The latter category of results was the primary focus of the intended publication (cf
first page of the Chapter, page 39) so a more exhaustive data extraction was carried out. Nine articles within
this subselection did not provide any validation metrics regarding walking speed since it was computed as the
ratio between the time and the estimated traveled distance. These 9 papers were excluded for further analysis.
Result articles were published between 1992 and February 2019.
3.3.1 Temporal parameters
Ninety-seven studies were reviewed for the estimation of temporal parameters which include gait events foot
strike (FS), foot off (FO)), number of steps, cadence, stride time and gait phases duration. Gait events detection
is mostly discussed since stride time and gait phases duration depends on the accuracy of gait events timing.
3.3.1.1 Sensor configurations
Figure 21 illustrates the main sensor configurations found for temporal gait parameters estimation.
In (a) only the number of studies of the most reported multiple-sensor configurations (Feet, Shanks and
Shanks and Thighs) are represented for clarity reasons.
Figure 21 – Existing sensor locations used in multiple (a) or single (b) configurations for temporal gait
analysis with the number of studies found for the corresponding sensor location
Most of the studies used a sensor located on the lower back, generally at the 4th or 5th lumbar vertebrae level
(L4-L5), close to the subject’s center of mass (COM) to detect temporal features of gait. This location is very
convenient since it can be worn on a belt. The two other commonly used configurations are the shanks-
configuration and the feet-configuration which necessitate two sensors. The placement of the sensors on the
feet varies a lot across the studies (on the top of the shoes (Lee et al., 2018; Mariani et al., 2013a; Patterson
and Caulfield, 2011), on the medial side (Anwary et al., 2018a) or at the heel level (Misu et al., 2014; Razak
et al., 2018; Rebula et al., 2013). Other, less common, configurations include upper trunk (sternum pendant)
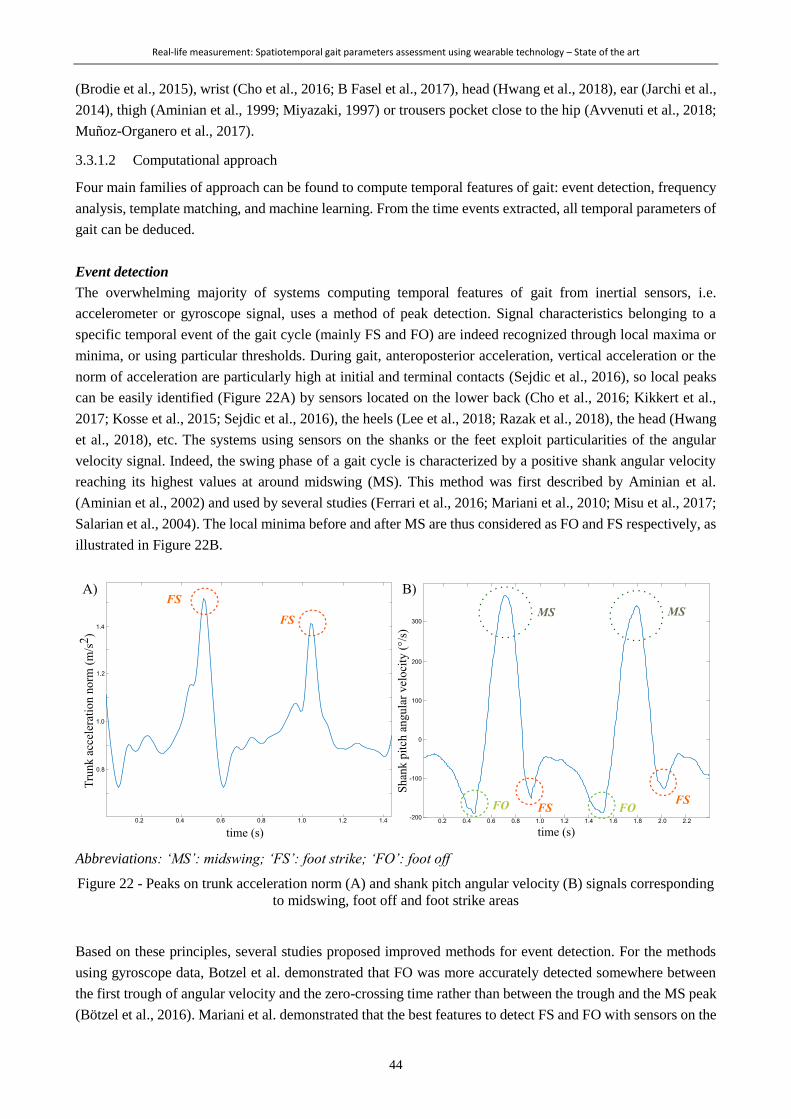
Real-life measurement: Spatiotemporal gait parameters assessment using wearable technology – State of the art
44
(Brodie et al., 2015), wrist (Cho et al., 2016; B Fasel et al., 2017), head (Hwang et al., 2018), ear (Jarchi et al.,
2014), thigh (Aminian et al., 1999; Miyazaki, 1997) or trousers pocket close to the hip (Avvenuti et al., 2018;
Muñoz-Organero et al., 2017).
3.3.1.2 Computational approach
Four main families of approach can be found to compute temporal features of gait: event detection, frequency
analysis, template matching, and machine learning. From the time events extracted, all temporal parameters of
gait can be deduced.
Event detection
The overwhelming majority of systems computing temporal features of gait from inertial sensors, i.e.
accelerometer or gyroscope signal, uses a method of peak detection. Signal characteristics belonging to a
specific temporal event of the gait cycle (mainly FS and FO) are indeed recognized through local maxima or
minima, or using particular thresholds. During gait, anteroposterior acceleration, vertical acceleration or the
norm of acceleration are particularly high at initial and terminal contacts (Sejdic et al., 2016), so local peaks
can be easily identified (Figure 22A) by sensors located on the lower back (Cho et al., 2016; Kikkert et al.,
2017; Kosse et al., 2015; Sejdic et al., 2016), the heels (Lee et al., 2018; Razak et al., 2018), the head (Hwang
et al., 2018), etc. The systems using sensors on the shanks or the feet exploit particularities of the angular
velocity signal. Indeed, the swing phase of a gait cycle is characterized by a positive shank angular velocity
reaching its highest values at around midswing (MS). This method was first described by Aminian et al.
(Aminian et al., 2002) and used by several studies (Ferrari et al., 2016; Mariani et al., 2010; Misu et al., 2017;
Salarian et al., 2004). The local minima before and after MS are thus considered as FO and FS respectively, as
illustrated in Figure 22B.
Abbreviations: ‘MS’: midswing; ‘FS’: foot strike; ‘FO’: foot off
Figure 22 - Peaks on trunk acceleration norm (A) and shank pitch angular velocity (B) signals corresponding
to midswing, foot off and foot strike areas
Based on these principles, several studies proposed improved methods for event detection. For the methods
using gyroscope data, Botzel et al. demonstrated that FO was more accurately detected somewhere between
the first trough of angular velocity and the zero-crossing time rather than between the trough and the MS peak
(Bötzel et al., 2016). Mariani et al. demonstrated that the best features to detect FS and FO with sensors on the
Real-life measurement: Spatiotemporal gait parameters assessment using wearable technology – State of the art
45
feet were the local minimum and maximum peaks of the norm of acceleration respectively, as compared to
zero crossing, threshold surpassing or using gyroscope data (Mariani et al., 2013b). Instead of using raw inertial
signals, some methods use computed angles or other processed signals to detect temporal features (Bussmann
et al., 2004).
During a gait cycle, the foot is supposed to be flat and static during midstance. Zero acceleration or velocity
can thus help to determine temporal events of gait with sensors on the feet (Fourati, 2015; Mariani et al., 2010;
Qiu et al., 2016; Rebula et al., 2013). Similarly, shank angular velocity during midstance neighbors zero and
can also be used for stride segmentation (Li et al., 2010; Yang et al., 2013). This approach has, however, the
drawback to be inappropriate for some pathological gaits like those of toe walkers or patients with crouch gait.
Frequency analysis
Since gait is a cyclical activity, frequency analysis is also commonly used to determine the cadence. Fast
Fourier Transform (FFT) is thus performed on one axis or the norm of acceleration (Demonceau et al., 2015).
The fundamental frequency is chosen and refers to the stride or the step frequency depending on if the sensor
is located on body extremities (upper or lower limbs), e.g. the wrist (B Fasel et al., 2017), or the central part
of the body (i.e. trunk and head) (Nagai et al., 2014; A Paraschiv-Ionescu et al., 2019; Punt et al., 2014)
respectively.
FS and FO events can be well identified in the time domain but also in the frequency domain thus wavelet
transformation is adapted for their identification, followed by a peak detection method. Indeed, wavelet
processing allows enhancing FS and FO through iterative decompositions and this eases the peak detection.
This approach has been proposed in several studies (Aminian et al., 2002; Hickey et al., 2017a; Majumder et
al., 2019).
Template matching
A minority of studies proposed a template matching method based on the detection of all periodic intervals
from a signal resembling in shape and magnitude to a predefined template (Micó-Amigo et al., 2016; Muñoz-
Organero et al., 2017). This approach seems to be valid for short duration monitoring (Micó-Amigo et al.,
2016).
Machine learning
Last but not least, machine learning approaches are exploited for step detection as well as gait events
identifications. Hidden Markov-based method (Mannini et al., 2014), signal vector magnitude (Hsu et al.,
2014), Bayesian inference (Martinez-Hernandez and Dehghani-Sanij, 2018) or fuzzy inference (Senanayake
and Senanayake, 2010) systems have been developed for specific populations and applications. Inputs of these
models are mostly acceleration and/or angular velocity features, such as the variance of the signal vector
magnitude of acceleration or angular velocity (Hsu et al., 2014), the vector of stride-normalized angular
velocity (Mannini et al., 2014), or the fundamental frequency of accelerations (Yuwono et al., 2014), but joint
angles and FSR inputs were also used (Senanayake and Senanayake, 2010). Indeed, the inconvenient of these
approaches is the generalization since a subset of data is used to train the models. Furthermore, a large amount
of training data is needed which is sometimes difficult to find, especially in pathological populations.
With sensors other than MIMU
A few records reviewed used other types of sensors. FSR and some pressure sensors have the possibility to be
freely worn under the feet, hence they have been used for temporal events detection during gait over long
distance. These sensors were often reported as reference systems to validate IMU systems in real-life

Real-life measurement: Spatiotemporal gait parameters assessment using wearable technology – State of the art
46
environments (Aminian et al., 1999; Avvenuti et al., 2018; Chang et al., 2016; Figueiredo et al., 2018; Han et
al., 2019; Lee and Park, 2011; Misu et al., 2017; Sabatini et al., 2005). The approach with those sensors is to
detect when the signal (force or pressure) passes a certain threshold corresponding to the instant of FS and
when the signal passes below the same or another threshold corresponding to the foot leaving the ground (TO)
(Arafsha et al., 2018; Djurić-Jovičić et al., 2014). Infrared time-of-flight distance sensors can be used as well
to count the number of steps. When placed on the medial side of the feet, these sensors return a distance
indication when the feet face each other, i.e. at each step. Step detection is thus possible by directly counting
the non-zero distance values (Bertuletti et al., 2019). This system has the advantage of providing additional
gait parameters such as step length and stride width as mentioned in section 3.3.5. meaning that it can constitute
a valid alternative to IMUs for real-life measurements. Microphone sensors were also reported in a study
(Wang et al., 2016) collecting footstep sounds during walking. The temporal parameters were thus estimated
from acoustic signals.
Nevertheless, all these sensors have the drawback to be dependent on shoe-wearing leading to the potential
missing of a large part of home-based locomotion activities.
3.3.1.3 Performance of the systems
Accuracy of the systems is mostly evaluated against FSR, optoelectronic system, force plates or pressure mat
(such as GaitRite, CIR Systems Inc., PA, USA) in laboratory settings. Reported results of accuracy
(relative/absolute mean error, root mean square error, correlation coefficient, t-test p-value, etc.) vary a lot
across the studies, hence it is very difficult to compare the performances of the methods based only on the
publications. Among the articles that reported relative errors for FS and FO detections, between 5 and 20ms
error was found mostly in healthy participants (Bejarano et al., 2015; Greene et al., 2010; Hanlon and
Anderson, 2009; Hundza et al., 2013; Lee et al., 2010; Sejdic et al., 2016). This is in line with a recent review
of Pacini Panebianco et al. who tested 17 existing algorithms on a single data set of 35 healthy adults walking
with 5 IMUs (Pacini Panebianco et al., 2018). They concluded, in agreement with other authors (Iosa et al.,
2016; Washabaugh et al., 2017), that the closer the sensor is to the ground the better performances will be
found for gait event detection. The peak detection method was found the most accurate, independently from
the sensor location. Finally, they found that there was no influence of the sensor configuration for FS detection
and that the feet-configuration conferred higher accuracy for FO detection (Pacini Panebianco et al., 2018).
Overall, IMU-based gait event detection demonstrated a delay for FS and anticipation for FO, which had thus
no consequence on stride time computation (<0.1s) but quite large consequences on stance time estimation (up
to 0.2s) (Pacini Panebianco et al., 2018).
Several studies proposed to validate their system in semi-controlled settings, such as during a sequence of
daily-life-like activities (e.g. inclined walking, indoor, outdoor, staircase …). Figueiredo et al. for instance
used FSR as a reference for gait event detection in such simulated real-life situations with healthy adults
(Figueiredo et al., 2018). Good accuracy was reported for every gait event computed in such conditions with
their system (>90% among all conditions and events). Very few studies reported the validation of temporal
parameter estimation in real-life settings. Hickey et al. put a GoPro camera (GoPro Inc, CA, USA) attached to
the participant’s chest as a reference system for step detection during almost 20h of unscripted free-living
activities (Hickey et al., 2017). Excellent relative agreement and no bias were found between their wearable
system and the camera (Hickey et al., 2017). Derungs et al. used a manual stride annotation completed by an
external observer in a day-care therapy center as a reference for stride duration, cadence and stride count in
hemiplegic patients during 9.3 days on average, 8h per day (Derungs et al., 2018). Average relative errors were
reported below 6% between this manual annotation and the wearable system (sensors on wrist, arms, and
thighs).
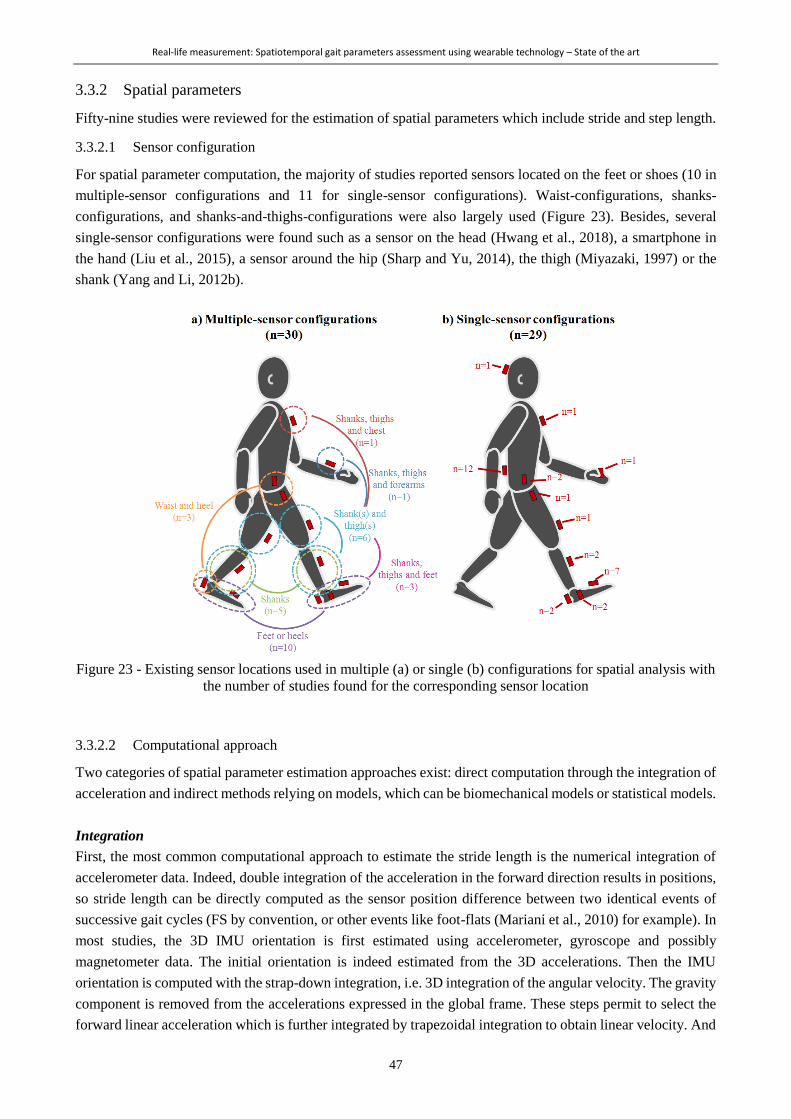
Real-life measurement: Spatiotemporal gait parameters assessment using wearable technology – State of the art
47
3.3.2 Spatial parameters
Fifty-nine studies were reviewed for the estimation of spatial parameters which include stride and step length.
3.3.2.1 Sensor configuration
For spatial parameter computation, the majority of studies reported sensors located on the feet or shoes (10 in
multiple-sensor configurations and 11 for single-sensor configurations). Waist-configurations, shanks-
configurations, and shanks-and-thighs-configurations were also largely used (Figure 23). Besides, several
single-sensor configurations were found such as a sensor on the head (Hwang et al., 2018), a smartphone in
the hand (Liu et al., 2015), a sensor around the hip (Sharp and Yu, 2014), the thigh (Miyazaki, 1997) or the
shank (Yang and Li, 2012b).
Figure 23 - Existing sensor locations used in multiple (a) or single (b) configurations for spatial analysis with
the number of studies found for the corresponding sensor location
3.3.2.2 Computational approach
Two categories of spatial parameter estimation approaches exist: direct computation through the integration of
acceleration and indirect methods relying on models, which can be biomechanical models or statistical models.
Integration
First, the most common computational approach to estimate the stride length is the numerical integration of
accelerometer data. Indeed, double integration of the acceleration in the forward direction results in positions,
so stride length can be directly computed as the sensor position difference between two identical events of
successive gait cycles (FS by convention, or other events like foot-flats (Mariani et al., 2010) for example). In
most studies, the 3D IMU orientation is first estimated using accelerometer, gyroscope and possibly
magnetometer data. The initial orientation is indeed estimated from the 3D accelerations. Then the IMU
orientation is computed with the strap-down integration, i.e. 3D integration of the angular velocity. The gravity
component is removed from the accelerations expressed in the global frame. These steps permit to select the
forward linear acceleration which is further integrated by trapezoidal integration to obtain linear velocity. And
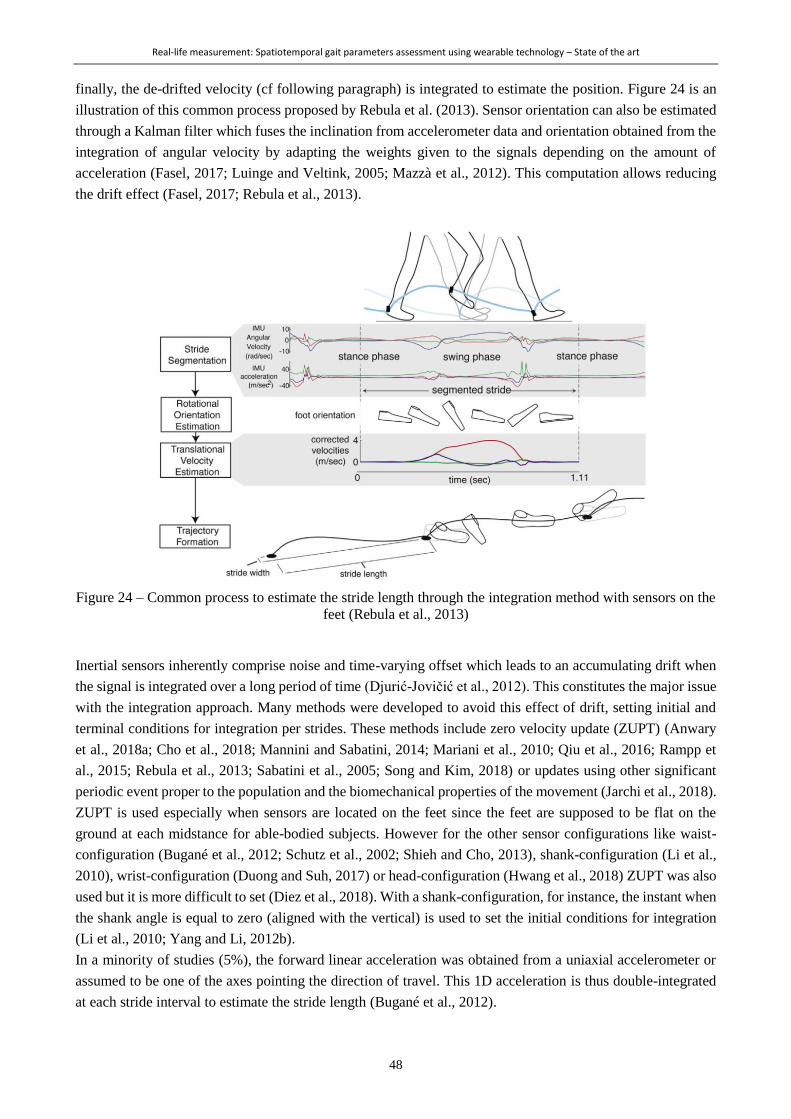
Real-life measurement: Spatiotemporal gait parameters assessment using wearable technology – State of the art
48
finally, the de-drifted velocity (cf following paragraph) is integrated to estimate the position. Figure 24 is an
illustration of this common process proposed by Rebula et al. (2013). Sensor orientation can also be estimated
through a Kalman filter which fuses the inclination from accelerometer data and orientation obtained from the
integration of angular velocity by adapting the weights given to the signals depending on the amount of
acceleration (Fasel, 2017; Luinge and Veltink, 2005; Mazzà et al., 2012). This computation allows reducing
the drift effect (Fasel, 2017; Rebula et al., 2013).
Figure 24 – Common process to estimate the stride length through the integration method with sensors on the
feet (Rebula et al., 2013)
Inertial sensors inherently comprise noise and time-varying offset which leads to an accumulating drift when
the signal is integrated over a long period of time (Djurić-Jovičić et al., 2012). This constitutes the major issue
with the integration approach. Many methods were developed to avoid this effect of drift, setting initial and
terminal conditions for integration per strides. These methods include zero velocity update (ZUPT) (Anwary
et al., 2018a; Cho et al., 2018; Mannini and Sabatini, 2014; Mariani et al., 2010; Qiu et al., 2016; Rampp et
al., 2015; Rebula et al., 2013; Sabatini et al., 2005; Song and Kim, 2018) or updates using other significant
periodic event proper to the population and the biomechanical properties of the movement (Jarchi et al., 2018).
ZUPT is used especially when sensors are located on the feet since the feet are supposed to be flat on the
ground at each midstance for able-bodied subjects. However for the other sensor configurations like waist-
configuration (Bugané et al., 2012; Schutz et al., 2002; Shieh and Cho, 2013), shank-configuration (Li et al.,
2010), wrist-configuration (Duong and Suh, 2017) or head-configuration (Hwang et al., 2018) ZUPT was also
used but it is more difficult to set (Diez et al., 2018). With a shank-configuration, for instance, the instant when
the shank angle is equal to zero (aligned with the vertical) is used to set the initial conditions for integration
(Li et al., 2010; Yang and Li, 2012b).
In a minority of studies (5%), the forward linear acceleration was obtained from a uniaxial accelerometer or
assumed to be one of the axes pointing the direction of travel. This 1D acceleration is thus double-integrated
at each stride interval to estimate the stride length (Bugané et al., 2012).

Real-life measurement: Spatiotemporal gait parameters assessment using wearable technology – State of the art
49
Biomechanical models
Due to the mechanical property of human gait, geometrical relations between the length and orientations of
body segments and the stride length can be established. Various biomechanical models, making different
simplifications or assumptions, have thus been developed (Diez et al., 2018). Two main types of models are
currently used: the single pendulum models, mainly called “inverted pendulum”, and the double pendulum
models. The former assumes that the COM rotates as an inverted pendulum with a length equals to the leg
length about the ankle during the single stance phase, followed by horizontal displacement during the double
support phase. The displacement during the double support phase can be approximated in different ways, for
example by a constant or by another vertical displacement of the COM (Zijlstra and Hof, 2003). The step
length can thus be estimated only from the vertical displacement of the COM and the leg length (Figure 25a).
Several models with various levels of complexity and various calibration parameters have been developed
(Diez et al., 2018). COM displacement is commonly measured from an accelerometer located at lumbar region
such as L4-L5 level (Zijlstra and Hof, 2003). Shanks and thighs angular velocities were later exploited by some
authors to indirectly estimate the COM displacement (Aich and Kim, 2018; Allseits et al., 2018). The double
pendulum model initially proposed by Aminian et al. is based on two pendulums with the length of the shank
and thigh rotating around the hip and knee during the swing phase and an inverted double pendulum rotating
around the ankle and knee during the stance phase. Shank and thigh rotation in sagittal plane are computed
during stance and swing phases from gyroscope sensors to estimate the stride length (Figure 25b) (Aminian et
al., 2002). For these biomechanical model approaches, numerical integration of acceleration or angular velocity
is also required. However, the integration is usually performed in sagittal plane over short time intervals for
the drift effect to be negligible.
a) b)
L: leg length
Δy: vertical COM displacement estimated by
double integration of vertical acceleration
L1: thigh length
L2: shank length
d1 and d3: estimated distances in the swing pendulum
d2: estimated distance in the stance pendulum
Figure 25 - Biomechanical models for step or stride length estimation: the inverted pendulum (a) (Zijlstra
and Hof, 1997), and the double pendulum (b) (Aminian et al., 2002)
Statistical models and machine learning techniques
The simplest statistical model is the linear regression between step or stride length and step or stride frequency,
from what leg length, height or a tunable constant can be added (De Silva et al., 2018). More recently,
regression models estimated stride length exploiting its relationship with the root mean square (RMS) of the
raw acceleration for instance (Punt et al., 2014). Machine learning techniques are more and more used to

Real-life measurement: Spatiotemporal gait parameters assessment using wearable technology – State of the art
50
estimate stride length from a variety of different gait features like time (e.g. stride time, gait phases duration),
frequency (e.g. cadence) or amplitude features (e.g. median, minimum, maximum, standard deviation of the
amplitude of the signal or at specific instants of the gait cycle, covariance between two signals) collected from
accelerometers, gyroscopes and/or constants such as anthropometric data (Aminian et al., 1995a; Liu et al.,
2015; Mannini and Sabatini, 2014). Neural network (Aminian et al., 1995b, 1995a; Hannink et al., 2017; Liu
et al., 2015) is the most reported method.
3.3.2.3 Performance of the systems
Authors reported using fixed distances or fixed step lengths over ground or on a treadmill as reference to
validate their systems (about 45% of the screened articles). The other most reported reference systems for
spatial parameter estimation were the optoelectronic system (33%) and instrumented mat (11%). Similar to
articles including temporal parameters, the type of validation metrics are very heterogeneous to draw direct
conclusions about the best systems. Vezocnik et al. (2019) have evaluated the performance of 13 representative
average step length estimation methods on healthy subjects with a Smartphone at different locations. They
have determined that regardless of the computational approach and the sensor location, the error was found
between 5 and 10% of the step length, being in average between 3.6 and 7.2cm, for wide ranges of speed (from
0.5 to 2.0m/s). Regarding biomechanical models, the performances can depend on the complexity of the model,
i.e. the inclusion of pelvic rotation (Hu et al., 2013) or feet length (González et al., 2007).
The large majority of studies reported validation under controlled settings, in a laboratory. However, similar
to the section on temporal parameters, semi-standardized routes were also employed. In these case, the
reference was a fixed distance to travel, e.g. along the hospital corridors, in a hallway, on the street or on an
athletic field (Djurić-Jovičić et al., 2014; Liu et al., 2015; Yun et al., 2012; Zhao et al., 2019). No study reported
actual real-life settings.
3.3.3 Spatiotemporal parameter
Thirty-one studies were found to give validation measures about walking speed. An additional study (Soltani
et al., 2019), which was published after February 2019, was added to the selection since it met all the inclusion
criteria and was relevant to the review. This section about walking speed estimation constituted the main focus
of the intended publication. Figure 26 summarizes the configurations, the computational methods, the sensor
modalities and the reference systems used for the validation of the methods included. The performances of the
systems are indicated when they were reported as a percentage of the walking speed. Three studies (Mannini
and Sabatini, 2014; McGinnis et al., 2017; Schimpl et al., 2011) developed several methods or used several
sensor configurations, and compared them in their publication, so all of their methods were considered
separately in Figure 27.
3.3.3.1 Sensor configurations
The repartition between single and multiple sensor configurations was found to be about 50-50%. Regarding
multiple sensor configurations, the shanks configuration was the most used (Aich et al., 2018; Dobkin et al.,
2011; Doheny et al., 2010; Li et al., 2010; Salarian et al., 2013; Yang et al., 2013), followed by the shank(s)-
and-thigh(s) configurations (Allseits et al., 2018; Aminian et al., 2002; McGinnis et al., 2017; Motoi et al.,
2012; Salarian et al., 2004). Regarding single sensor configurations, the waist configuration was by far the
most reported (Bonomi and Salati, 2010; Bugané et al., 2012; Hu et al., 2013; McGinnis et al., 2017; Perrin et
al., 2000; Schimpl et al., 2011; Supratak et al., 2018; Zijlstra and Hof, 2003). The foot configuration was also
often reported (Brzostowski, 2018; Mannini and Sabatini, 2014; Sabatini et al., 2005; Song and Kim, 2018).
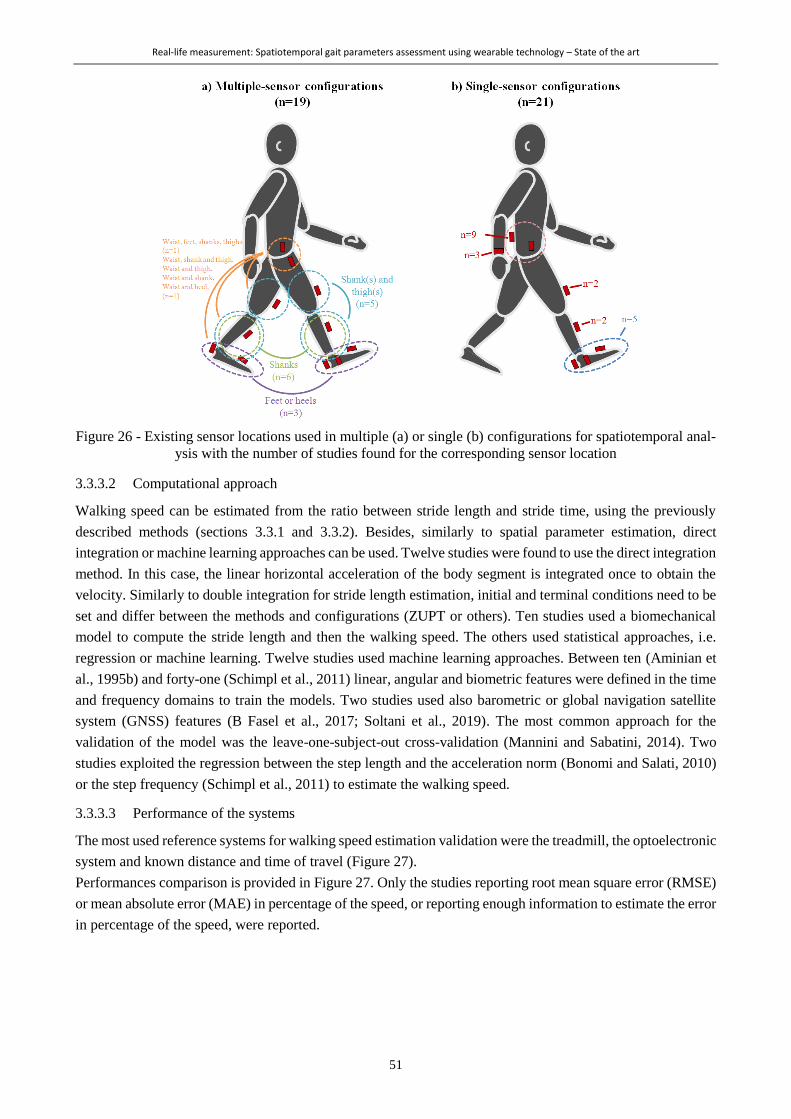
Real-life measurement: Spatiotemporal gait parameters assessment using wearable technology – State of the art
51
Figure 26 - Existing sensor locations used in multiple (a) or single (b) configurations for spatiotemporal anal-
ysis with the number of studies found for the corresponding sensor location
3.3.3.2 Computational approach
Walking speed can be estimated from the ratio between stride length and stride time, using the previously
described methods (sections 3.3.1 and 3.3.2). Besides, similarly to spatial parameter estimation, direct
integration or machine learning approaches can be used. Twelve studies were found to use the direct integration
method. In this case, the linear horizontal acceleration of the body segment is integrated once to obtain the
velocity. Similarly to double integration for stride length estimation, initial and terminal conditions need to be
set and differ between the methods and configurations (ZUPT or others). Ten studies used a biomechanical
model to compute the stride length and then the walking speed. The others used statistical approaches, i.e.
regression or machine learning. Twelve studies used machine learning approaches. Between ten (Aminian et
al., 1995b) and forty-one (Schimpl et al., 2011) linear, angular and biometric features were defined in the time
and frequency domains to train the models. Two studies used also barometric or global navigation satellite
system (GNSS) features (B Fasel et al., 2017; Soltani et al., 2019). The most common approach for the
validation of the model was the leave-one-subject-out cross-validation (Mannini and Sabatini, 2014). Two
studies exploited the regression between the step length and the acceleration norm (Bonomi and Salati, 2010)
or the step frequency (Schimpl et al., 2011) to estimate the walking speed.
3.3.3.3 Performance of the systems
The most used reference systems for walking speed estimation validation were the treadmill, the optoelectronic
system and known distance and time of travel (Figure 27).
Performances comparison is provided in Figure 27. Only the studies reporting root mean square error (RMSE)
or mean absolute error (MAE) in percentage of the speed, or reporting enough information to estimate the error
in percentage of the speed, were reported.
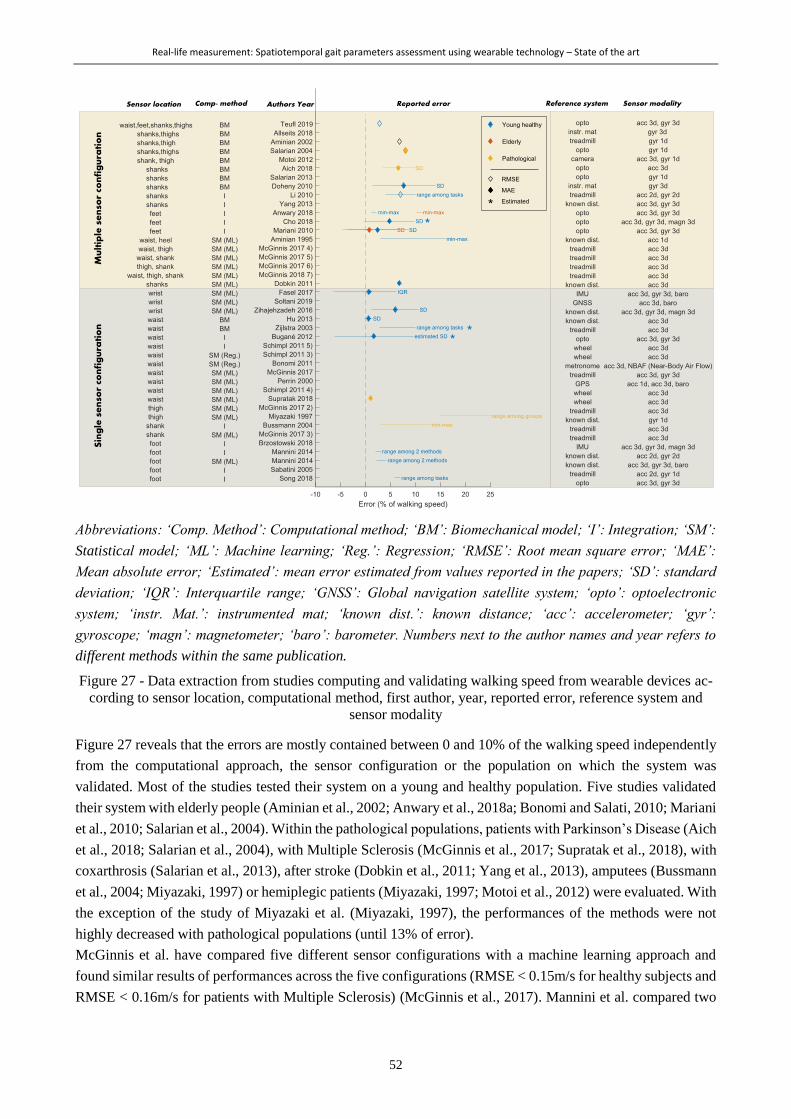
Real-life measurement: Spatiotemporal gait parameters assessment using wearable technology – State of the art
52
Abbreviations: ‘Comp. Method’: Computational method; ‘BM’: Biomechanical model; ‘I’: Integration; ‘SM’:
Statistical model; ‘ML’: Machine learning; ‘Reg.’: Regression; ‘RMSE’: Root mean square error; ‘MAE’:
Mean absolute error; ‘Estimated’: mean error estimated from values reported in the papers; ‘SD’: standard
deviation; ‘IQR’: Interquartile range; ‘GNSS’: Global navigation satellite system; ‘opto’: optoelectronic
system; ‘instr. Mat.’: instrumented mat; ‘known dist.’: known distance; ‘acc’: accelerometer; ‘gyr’:
gyroscope; ‘magn’: magnetometer; ‘baro’: barometer. Numbers next to the author names and year refers to
different methods within the same publication.
Figure 27 - Data extraction from studies computing and validating walking speed from wearable devices ac-
cording to sensor location, computational method, first author, year, reported error, reference system and
sensor modality
Figure 27 reveals that the errors are mostly contained between 0 and 10% of the walking speed independently
from the computational approach, the sensor configuration or the population on which the system was
validated. Most of the studies tested their system on a young and healthy population. Five studies validated
their system with elderly people (Aminian et al., 2002; Anwary et al., 2018a; Bonomi and Salati, 2010; Mariani
et al., 2010; Salarian et al., 2004). Within the pathological populations, patients with Parkinson’s Disease (Aich
et al., 2018; Salarian et al., 2004), with Multiple Sclerosis (McGinnis et al., 2017; Supratak et al., 2018), with
coxarthrosis (Salarian et al., 2013), after stroke (Dobkin et al., 2011; Yang et al., 2013), amputees (Bussmann
et al., 2004; Miyazaki, 1997) or hemiplegic patients (Miyazaki, 1997; Motoi et al., 2012) were evaluated. With
the exception of the study of Miyazaki et al. (Miyazaki, 1997), the performances of the methods were not
highly decreased with pathological populations (until 13% of error).
McGinnis et al. have compared five different sensor configurations with a machine learning approach and
found similar results of performances across the five configurations (RMSE < 0.15m/s for healthy subjects and
RMSE < 0.16m/s for patients with Multiple Sclerosis) (McGinnis et al., 2017). Mannini et al. compared two
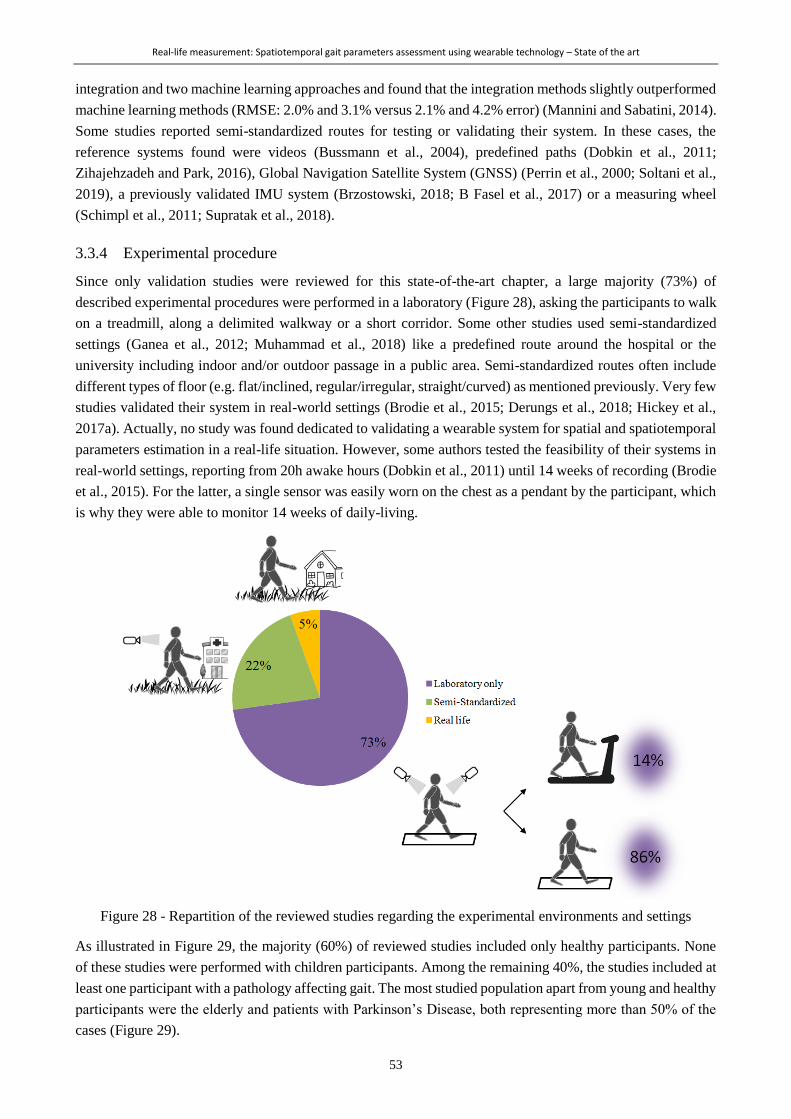
Real-life measurement: Spatiotemporal gait parameters assessment using wearable technology – State of the art
53
integration and two machine learning approaches and found that the integration methods slightly outperformed
machine learning methods (RMSE: 2.0% and 3.1% versus 2.1% and 4.2% error) (Mannini and Sabatini, 2014).
Some studies reported semi-standardized routes for testing or validating their system. In these cases, the
reference systems found were videos (Bussmann et al., 2004), predefined paths (Dobkin et al., 2011;
Zihajehzadeh and Park, 2016), Global Navigation Satellite System (GNSS) (Perrin et al., 2000; Soltani et al.,
2019), a previously validated IMU system (Brzostowski, 2018; B Fasel et al., 2017) or a measuring wheel
(Schimpl et al., 2011; Supratak et al., 2018).
3.3.4 Experimental procedure
Since only validation studies were reviewed for this state-of-the-art chapter, a large majority (73%) of
described experimental procedures were performed in a laboratory (Figure 28), asking the participants to walk
on a treadmill, along a delimited walkway or a short corridor. Some other studies used semi-standardized
settings (Ganea et al., 2012; Muhammad et al., 2018) like a predefined route around the hospital or the
university including indoor and/or outdoor passage in a public area. Semi-standardized routes often include
different types of floor (e.g. flat/inclined, regular/irregular, straight/curved) as mentioned previously. Very few
studies validated their system in real-world settings (Brodie et al., 2015; Derungs et al., 2018; Hickey et al.,
2017a). Actually, no study was found dedicated to validating a wearable system for spatial and spatiotemporal
parameters estimation in a real-life situation. However, some authors tested the feasibility of their systems in
real-world settings, reporting from 20h awake hours (Dobkin et al., 2011) until 14 weeks of recording (Brodie
et al., 2015). For the latter, a single sensor was easily worn on the chest as a pendant by the participant, which
is why they were able to monitor 14 weeks of daily-living.
Figure 28 - Repartition of the reviewed studies regarding the experimental environments and settings
As illustrated in Figure 29, the majority (60%) of reviewed studies included only healthy participants. None
of these studies were performed with children participants. Among the remaining 40%, the studies included at
least one participant with a pathology affecting gait. The most studied population apart from young and healthy
participants were the elderly and patients with Parkinson’s Disease, both representing more than 50% of the
cases (Figure 29).
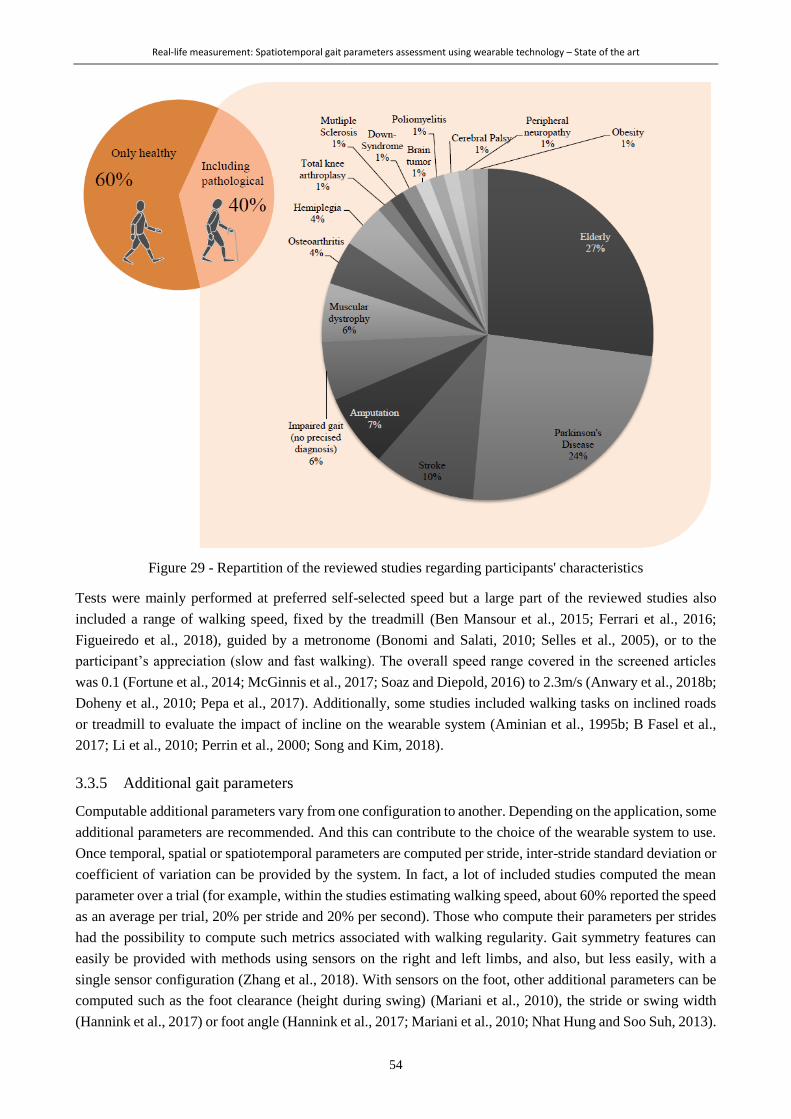
Real-life measurement: Spatiotemporal gait parameters assessment using wearable technology – State of the art
54
Figure 29 - Repartition of the reviewed studies regarding participants' characteristics
Tests were mainly performed at preferred self-selected speed but a large part of the reviewed studies also
included a range of walking speed, fixed by the treadmill (Ben Mansour et al., 2015; Ferrari et al., 2016;
Figueiredo et al., 2018), guided by a metronome (Bonomi and Salati, 2010; Selles et al., 2005), or to the
participant’s appreciation (slow and fast walking). The overall speed range covered in the screened articles
was 0.1 (Fortune et al., 2014; McGinnis et al., 2017; Soaz and Diepold, 2016) to 2.3m/s (Anwary et al., 2018b;
Doheny et al., 2010; Pepa et al., 2017). Additionally, some studies included walking tasks on inclined roads
or treadmill to evaluate the impact of incline on the wearable system (Aminian et al., 1995b; B Fasel et al.,
2017; Li et al., 2010; Perrin et al., 2000; Song and Kim, 2018).
3.3.5 Additional gait parameters
Computable additional parameters vary from one configuration to another. Depending on the application, some
additional parameters are recommended. And this can contribute to the choice of the wearable system to use.
Once temporal, spatial or spatiotemporal parameters are computed per stride, inter-stride standard deviation or
coefficient of variation can be provided by the system. In fact, a lot of included studies computed the mean
parameter over a trial (for example, within the studies estimating walking speed, about 60% reported the speed
as an average per trial, 20% per stride and 20% per second). Those who compute their parameters per strides
had the possibility to compute such metrics associated with walking regularity. Gait symmetry features can
easily be provided with methods using sensors on the right and left limbs, and also, but less easily, with a
single sensor configuration (Zhang et al., 2018). With sensors on the foot, other additional parameters can be
computed such as the foot clearance (height during swing) (Mariani et al., 2010), the stride or swing width
(Hannink et al., 2017) or foot angle (Hannink et al., 2017; Mariani et al., 2010; Nhat Hung and Soo Suh, 2013).

Real-life measurement: Spatiotemporal gait parameters assessment using wearable technology – State of the art
55
With sensors on the shanks and thighs, knee angle can be computed (Salarian et al., 2004). And finally, with
sensors on the trunk, metrics related to upper-body stability during gait can be computed (Belluscio et al.,
2019; Kosse et al., 2015). IMUs do not offer the possibility to compute the step width whereas this is clinically
relevant in numerous pathological populations. However, infrared time-of-flight distance sensors (Bertuletti et
al., 2019) or ultrasound sensors (Weenk et al., 2015) can be used for this purpose as they can estimate the
distance between an emitter and a receiver placed on each foot, i.e. estimating the step width.
3.4 Overview and application to cerebral palsy
This review revealed that a large number of studies have been investigating the computation of STP using
wearable devices for 27 years. More work has been proposed for the temporal parameters due to lower
difficulties to estimate them from accelerometer or gyroscope signals. The overwhelming majority of methods
exploited the detection of particular features on the signals, corresponding to specific instant of the gait cycle.
This method revealed to be very promising since it is simple to implement and fits almost every possible sensor
configurations (Figure 21). High accuracy was indeed found with most of the population assessed, which were
mainly young healthy adults. Great challenges are however linked with the estimation of spatial parameters
with wearable devices. A lot of different approaches were then proposed, including integration, biomechanical
models and statistical approaches. Integration methods have the advantage to make a direct computation of the
parameter but are limited by the sensor’s noise and bias (Diez et al., 2018) inducing drift in the estimated
continuous metrics. Integration methods may thus be recommended for short walks or for subjects having
typical and regular gait patterns for which assumptions like the ‘zero velocity’ assumption at each step can be
made to compensate the drift. This approach is also suitable for a variety of sensor configurations.
Biomechanical models approach rests upon assumptions and simplifications about the body segments’
displacement during gait and achieves good accuracies also for typical gait patterns. This approach is thus
advocated for well defined and similar use cases and sensor configurations (Diez et al., 2018). Finally,
statistical approaches have the great advantage to be suitable for any sensor configuration since many signal
features that show correlation with the spatial parameter of interest can be used. However, the main drawback
of these methods is the need for a large amount and a great variety of data for training to ensure good accuracy
of the model. Additionally, when extensive machine learning techniques are used, no direct link can be made
between the inputs and the results (black-box). Statistical approaches should thus be advised in cases where a
lot of data is available and flexibility in sensor configuration is needed (Diez et al., 2018). The same concerns
are related to walking speed (spatiotemporal) estimation.
We realize that none of these computational methods actually fits the cases of children with CP. Indeed, they
present atypical and irregular gait patterns that prevent using assumptions necessary to reduce the drift in the
integration method. Some of them present bone deformities and muscle contractures that preclude them from
extending the knee for instance. Using biomechanical models simplifying the leg as a single pendulum is thus
precarious. They have limited endurance as well as limited weekly availabilities to perform gait assessments
so restricted amount of data is available for each patient.
Within 162 articles included in the category “description of methods”, only one proposed a customized method
for atypical gait patterns of patients with CP (A Paraschiv-Ionescu et al., 2019). And this study was actually
from our research group, using the data generated during this doctoral work. This implies that no method has
been developed or customized for this specific population prior to this thesis. However, three papers about
children with CP were found within our selection of 99 studies in the category “evaluation of existing methods”
(Brégou Bourgeois et al., 2014; Saether et al., 2014; Zollinger et al., 2016). Bregou-Bourgeois et al. (2014)
used the method developed by Mariani et al. (2010) with two sensors on the feet (integration method) to assess

Real-life measurement: Spatiotemporal gait parameters assessment using wearable technology – State of the art
56
the performance of the system in children with CP (Brégou Bourgeois et al., 2014). They found a 95% level
of agreement for walking speed of about 0.1m/s against an optoelectronic system. Saether et al. (2014)
evaluated the difference between children with CP and with typical development regarding STP and balance
parameters using the method of Moe-Nilssen et al. (1998) with a sensor at the lower back. The method used
was a regression approach exploiting the quadratic relation between acceleration RMS relative to walking
speed (Moe-Nilssen, 1998). No validation metrics were reported by Saether et al. (2014). Zollinger et al. (2016)
measured temporal parameters using the method of Jasiewicz et al. (2006) (event detection method using
anteroposterior and mediolateral acceleration signals) through two sensors, one on the waist and one on the
foot, and deduced spatial parameters during a treadmill and overground tasks at fixed speed. No validation
metrics were reported by Zollinger et al. (2016). Four other papers were found within our excluded articles
since they did not reference the method they used, as they were mostly using commercial device and software
packages. Mackey et al. assessed the reliability and validity of the intelligent device for energy expenditure
and activity (‘IDEEA’, Minisun LLC, Fresno, CA), including five sensors located on the trunk, thighs, and
feet, for the estimation of STP in children with CP. They found that the 95% limit of agreement in subject with
CP was ± 0.58m/s (Mackey et al., 2008). Sivarajah et al. (2018) assessed the feasibility of the mobility-lab
(APDM, Inc., Portland, OR), including 6 sensors located on the wrists, the trunk, the lower back and the
shanks, to discriminate children with CP from typically developing children regarding STP. Mutoh et al. (2019,
2016) and Manikowska et al. (2013) assessed the effect of hippotherapy on STP using a sensor on the waist.
In total, prior to this doctoral work, only two studies evaluated the accuracy of their system in the CP population
(Brégou Bourgeois et al., 2014; Mackey et al., 2008) and they had divergent results. There is indeed a lack of
validated system for the computation of gait parameters as essential as STP in the population of individuals
with CP.
3.5 Limitations
An attempt of systematic literature review was carried out to present the existing methods to compute gait
parameters with a wearable system. Due to large inclusion criteria, too many studies were included in this
review. Thus, quality assessment of the papers was not undertaken, meaning that papers with low quality may
have been included. To preclude from including papers with a very low level of significance and poor details
in the description of their method, we chose to exclude case report papers and conference proceedings.
Furthermore, considering the large amount of full text to read, cross-screening was not contemplated. Finally,
cross-referencing was not contemplated either. All these aspects weaken the power of the review, which is
why it was not considered systematic.
Additionally, several keywords could have been added in the search equation such as 'stride length', 'stride
time', 'stance/swing phase' to enable absolute exhaustiveness of the review regarding temporal and spatial
parameters. The choice of the equation was made in accordance with the intended publication about walking
speed estimation. However, a fair and almost exhaustive overview of the previous and current practices to
compute gait parameters using wearable devices was presented.
3.6 Conclusion
From 1992 to now, thousands of studies have been dedicated to the estimation of STP of gait using a wearable
device, with the perspective of allowing gait analysis outside of the laboratories. Efforts were indeed made to
find the most accurate solutions to compute gait STP, exploiting the IMUs’ resources. We have underlined a
lack of harmonization between studies regarding experimental procedures and performance evaluations. We
have also highlighted the lack of validation studies in semi-free or free settings. Advantages and disadvantages
of each type of approach (generalization, biomechanical assumptions, simplifications, associated sensor
Real-life measurement: Spatiotemporal gait parameters assessment using wearable technology – State of the art
57
configuration, etc.) are however well described and have to be considered carefully when choosing a system
for a particular application. Using these methods on pathological populations such as children with CP
constitutes a major challenge considering their great gait deviations. Hence, very few studies have been so far
dedicated to this. Comparative studies are thus needed to be aware of the possibilities to use such devices in
clinical care.

58

59
TECHNICAL STUDIES
Part II

60
This part includes two chapters regarding our first specific objective: To propose a tool for gait assessments in
daily life fitting the specific gait deviations of children with CP in order to fill the knowledge gap about their
gait performance. The choice of the system (device configuration and associated algorithms) for the assessment
of gait parameters in daily life for children with CP and with TD is thus addressed in two technical studies.
The first (Chapter 4) presents the comparison of three relevant sensor configurations for the computation of
spatiotemporal parameters in children with CP. This chapter drives the choice of the wearable solution that is
further used in the thesis, on the basis of accuracy and precision of the three configurations as compared to the
clinical reference, and patients’ acceptance.
The second (Chapter 5) presents a method for gait detection in real-life settings based on a personalization set-
up. A comparison between existing and personalized approaches is presented, in terms of sensitivity,
specificity, accuracy and precision for walking bout detection, during a semi-standardized route outside of the
laboratory.

61
Chapter 4 *
The choice of wearable sensors configuration to measure spatiotemporal
gait parameters in children with cerebral palsy
Abstract
Wearable inertial devices have recently been used to evaluate spatiotemporal parameters of gait in daily life
situations. Given the heterogeneity of gait patterns in children with cerebral palsy (CP), the sensor placement
and analysis algorithm may influence the validity of the results. This study aimed at comparing the
spatiotemporal measurement performances of three wearable configurations defined by different sensor
positioning on the lower limbs: (1) shanks and thighs, (2) shanks, and (3) feet. The three configurations were
selected based on their potential to be used in daily life for children with CP and typically developing (TD)
controls. For each configuration, dedicated gait analysis algorithms were used to detect gait events and
compute spatiotemporal parameters. Fifteen children with CP and 11 TD controls were included. Accuracy,
precision, and agreement of the three configurations were determined in comparison with an optoelectronic
system as a reference. The three configurations were comparable for the evaluation of TD children and children
with a low level of disability (CP-GMFCS I) whereas the shank-and-thigh-based configuration was more
robust regarding children with a higher level of disability (CP-GMFCS II–III).
* Chapter published as:
Carcreff L., Gerber C.N., Paraschiv-Ionescu A., De Coulon G., Newman C.J., Armand S., and Aminian K. “ What is the
Best Configuration of Wearable Sensors to Measure Spatiotemporal Gait Parameters in Children with Cerebral Palsy?”,
Sensors, 2018, vol. 18, num. 2 . doi: 10.3390/s18020394 – with permissions of all co-authors.
My contributions: Methodology, recruitement, investigation, software, data curation, visualization, formal analysis,
writing – original draft, writing-review & editing
The choice of wearable sensors configuration to measure spatiotemporal gait parameters in children with cerebral palsy
62
4.1 Introduction
Cerebral palsy (CP) is the most frequent motor disorder in children with a prevalence of 1.8:1000 births in
Europe (Sellier et al., 2016). For the majority of children with CP who achieve community ambulation, an
objective evaluation of their gait is necessary to accurately identify and understand gait impairments, in order
to provide adequate and efficient treatment (Armand et al., 2016). Such assessments are usually performed in
laboratory settings, during standardized clinical gait analysis (CGA). Numerous gait parameters including
spatiotemporal parameters (STP), kinematics, kinetics, and muscle activity can be quantified using an
optoelectronic (3D motion capture) system, force plates, and an electromyography system (Carcreff et al.,
2016a).
During gait, foot strikes (FS) and foot offs (FO) succeed each other and constitute the base for gait cycle
segmentation and the computation of STP. Gait events can be computed from a single force plate, restricting
the measure to one step at a time. With the combination of several force plates and an optoelectronic system,
it is possible to determine these events over several steps (Sutherland, 2002). The advantage of this method is
to calculate spatial parameters, such as the stride length, directly from the marker positions. Despite its wide
use in CGA (Bruening and Ridge, 2014; Desailly et al., 2009; Di Marco et al., 2017; Ghoussayni et al., 2004),
the optoelectronic system has some unavoidable limitations. It suffers from inaccuracies linked to instrumental
errors, soft tissue artefacts (the relative displacement between the markers and the underlying bone), and
marker misplacement due to anatomical landmark palpation difficulties (Di Marco et al., 2017). Since STP
estimation is mainly based on the tracking of markers located on the heels and toes, soft tissue artefacts and
marker misplacement are not likely to induce major errors. Therefore, instrumental errors are the main sources
of inaccuracy in this situation. In 2005, a review reported mean errors for marker distance estimates between
0.1 mm and 5.3 mm depending on the systems (Chiari et al., 2005). Thanks to the improvement in camera
resolution, these errors were expected to decrease. Recently, Di Marco et al. reported that the number of
cameras, the calibration volume, and the calibration procedure can induce errors in the marker trajectories
reconstruction between 0.2 mm and 1.7 mm (Di Marco et al., 2017, 2015). Moreover, the optoelectronic system
restrains the measurement volume to the laboratory and thus may hinder the patient’s natural gait. As a result,
gait parameters obtained through CGA are not fully representative of the usual and daily walking habits
(described as ‘performance’ (World Health Organization, 2002)) of children with CP (Holsbeeke et al., 2009;
Smits et al., 2014; Van Eck et al., 2009). Performance can currently be estimated through questionnaires and
clinical observations which have the inherent drawback of being subjective and evaluator-dependent, and thus
associated with potential bias (Keawutan et al., 2014; Olivier et al., 2015). Therefore, there is a need to
objectively assess gait performance in daily-life conditions in order to complement CGA, thus enhancing
therapeutic choices for children with CP based on real-life data. Wearable inertial sensors can be used to fulfill
this need.
Inertial sensors are microelectromechanical systems, including accelerometers and gyroscopes, contained in
small casings that can be carried by the patient without restrictions for several hours of measurements. A
wearable sensor-based gait analysis system relies on a sensor configuration and an associated algorithm. Many
sensor configurations have been tested for STP estimation varying in numbers of sensors (single or multiple),
type (single or triaxial), and location on the body (Yang and Li, 2012a). As, in human gait, most body motion
comes from the lower limbs, sensors are commonly fixed on the lower limbs (Yang and Li, 2012a). Gait events
are detected according to specific features appearing on accelerometer and gyroscope signals in the time and
frequency domains (Aminian et al., 2002; Boutaayamou et al., 2017; Khandelwal and Wickström, 2017).
Spatial parameters are computed from these signals through methods dependent on the sensor location
(Aminian et al., 2002; Yang and Li, 2012a). Yang et al. defined three categories of algorithms: the abstraction
The choice of wearable sensors configuration to measure spatiotemporal gait parameters in children with cerebral palsy
63
models where the spatial parameter is estimated from a black box model building the relationship between the
sensor measurements and the output (e.g., artificial neural networks, third-order polynomial model, etc.); the
human gait models which use the geometric properties of the lower limbs to estimate stride length; and the
direct integrations which consist of integrating the acceleration in the global frame between two specific points
of the gait cycle in order to calculate stride velocity (simple integration) and stride length (double integration).
The validity of gait event detection and STP computation from wearable devices has been studied in healthy
adults, adults with disease, or elderly population, but scarcely in children (Esser et al., 2011; Mansour et al., 2015;
Trojaniello et al., 2014; Zijlstra and Hof, 2003). Lanovaz et al. found that, in healthy children, a system of six
inertial sensors was valid for temporal detection but showed consistent bias for spatial parameters estimation with
the gait model method (Clifton et al., 1982). In children with CP, a protocol named “Outwalk” has been developed
to measure trunk and lower-limb 3D kinematics using an inertial and magnetic measurement system, but the
authors did not assess STP (Cutti et al., 2010; Van Den Noort et al., 2013). Laudanski et al. observed that gait
analysis based on sensors on the feet bring more error than shank-mounted sensors, especially for abnormal gait
pattern such as toe-out walking (Laudanski et al., 2011). In children with CP with low to mild gait impairments,
Bregou-Bourgeois et al. used two foot-worn inertial sensors and the direct integration method to estimate STP
and showed good accuracy, precision, and agreement against an optoelectronic system for the estimation of stride
length, walking speed, and foot angles with regard to the ground (Brégou Bourgeois et al., 2014). These previous
studies pointed out the difficulty of assessing gait in children with CP with inertial sensors since these children
cannot achieve the expected movement properly (i.e., full foot contact during gait (Brégou Bourgeois et al., 2014),
good alignment in static, or pure flexion/extension of the knee for functional calibration of the sensor axes (Van
Den Noort et al., 2013)). Considering these challenges and since gait patterns are very heterogeneous among
patients with CP who are able to walk (Armand et al., 2016), the usability of other sensor set-ups deserves
exploration in order to determine which is the most appropriate one. Furthermore, children with a higher level of
impairment should be considered as they may benefit even more from the assessment of their gait performance.
The aim of this study was to evaluate and compare the measurement performance of three wearable
configurations and to identify the most appropriate set-up for gait assessment of children with CP. For this
purpose, a standard optoelectronic system was used as a reference to evaluate event detection and STP
computation.
4.2 Materials and methods
This study was an observational case-control validation study with a single center setup.
4.2.1 Participants
Fifteen children and adolescents with CP and eleven age- and sex-matched typically developing (TD) controls
were evaluated in the laboratory of kinesiology within Geneva University Hospitals (HUG). Participants of
the CP group were recruited from the patients followed at the HUG pediatric orthopedics unit if they met the
following inclusion criteria: (a) aged between 8 and 20 years; (b) diagnosis of CP; (c) ability to walk in the
community with or without mechanical walking aids; and (d) with a level of Gross Motor Function
Classification System (GMFCS) (Palisano et al., 1997) between I and III. For the control group, children were
recruited among collaborators’ or patients’ acquaintances. The exclusion criteria for both groups were those
that precluded adequate participation in the measurement sessions (mental age <8 years, severe visual disorder,
attention deficit, and other significant behavioral issues). All participants provided written consent, and the
protocol was approved by the hospital’s institutional ethical committee (CCER-15-176).
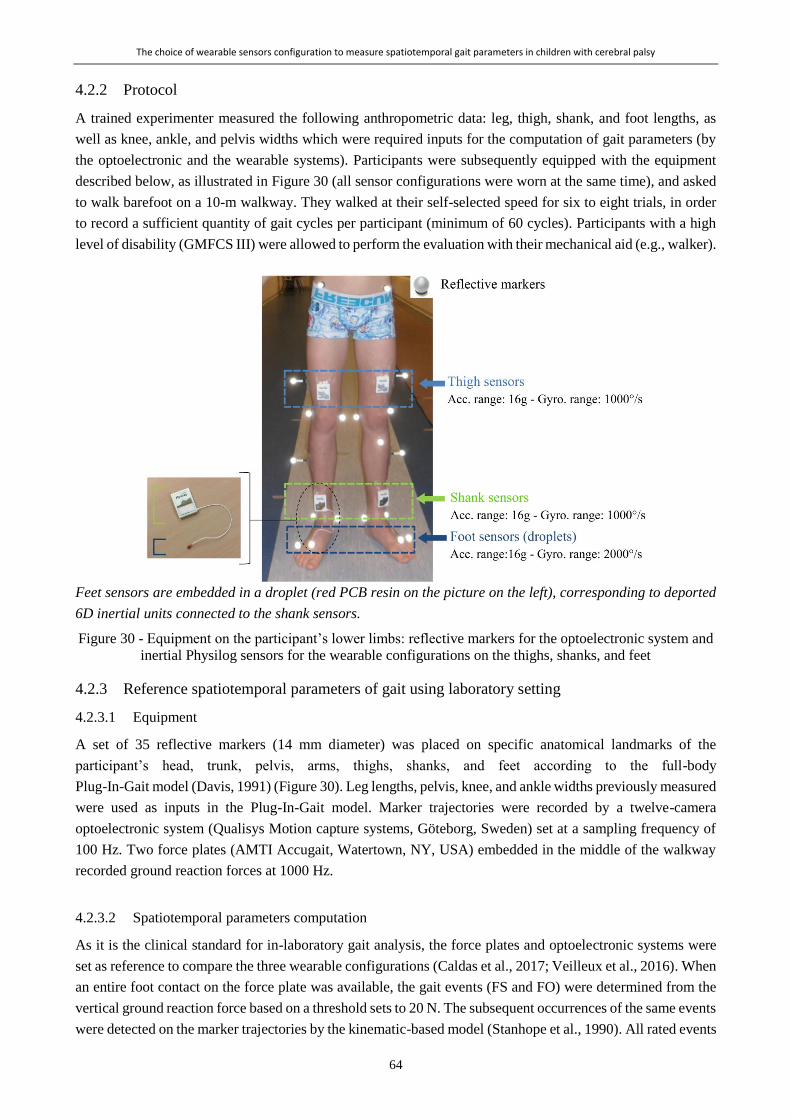
The choice of wearable sensors configuration to measure spatiotemporal gait parameters in children with cerebral palsy
64
4.2.2 Protocol
A trained experimenter measured the following anthropometric data: leg, thigh, shank, and foot lengths, as
well as knee, ankle, and pelvis widths which were required inputs for the computation of gait parameters (by
the optoelectronic and the wearable systems). Participants were subsequently equipped with the equipment
described below, as illustrated in Figure 30 (all sensor configurations were worn at the same time), and asked
to walk barefoot on a 10-m walkway. They walked at their self-selected speed for six to eight trials, in order
to record a sufficient quantity of gait cycles per participant (minimum of 60 cycles). Participants with a high
level of disability (GMFCS III) were allowed to perform the evaluation with their mechanical aid (e.g., walker).
Feet sensors are embedded in a droplet (red PCB resin on the picture on the left), corresponding to deported
6D inertial units connected to the shank sensors.
Figure 30 - Equipment on the participant’s lower limbs: reflective markers for the optoelectronic system and
inertial Physilog sensors for the wearable configurations on the thighs, shanks, and feet
4.2.3 Reference spatiotemporal parameters of gait using laboratory setting
4.2.3.1 Equipment
A set of 35 reflective markers (14 mm diameter) was placed on specific anatomical landmarks of the
participant’s head, trunk, pelvis, arms, thighs, shanks, and feet according to the full-body
Plug-In-Gait model (Davis, 1991) (Figure 30). Leg lengths, pelvis, knee, and ankle widths previously measured
were used as inputs in the Plug-In-Gait model. Marker trajectories were recorded by a twelve-camera
optoelectronic system (Qualisys Motion capture systems, Göteborg, Sweden) set at a sampling frequency of
100 Hz. Two force plates (AMTI Accugait, Watertown, NY, USA) embedded in the middle of the walkway
recorded ground reaction forces at 1000 Hz.
4.2.3.2 Spatiotemporal parameters computation
As it is the clinical standard for in-laboratory gait analysis, the force plates and optoelectronic systems were
set as reference to compare the three wearable configurations (Caldas et al., 2017; Veilleux et al., 2016). When
an entire foot contact on the force plate was available, the gait events (FS and FO) were determined from the
vertical ground reaction force based on a threshold sets to 20 N. The subsequent occurrences of the same events
were detected on the marker trajectories by the kinematic-based model (Stanhope et al., 1990). All rated events

The choice of wearable sensors configuration to measure spatiotemporal gait parameters in children with cerebral palsy
65
were manually checked frame by frame on the sagittal view of the heel and toe markers in the MOKKA
software (Barré and Armand, 2014). The stride time was calculated as the time difference between two
successive FS, the stride length was computed as the distance separating the heel markers at two successive
FS times, and the stride velocity was calculated as the stride length divided by the stride time for each gait
cycle (Hollman et al., 2011).
4.2.4 Spatiotemporal parameters of gait using wearable setting
4.2.4.1 Equipment
Six synchronized inertial sensors (Physilog4®, Gait Up, Renens, Switzerland) were used in this study.
Physilog4® is a standalone device (dimensions: 50 mm × 37 mm × 9.2 mm, weight: 19 g) comprising a triaxial
accelerometer, triaxial gyroscope, triaxial magnetometer, and barometer with adjustable ranges, battery, a
memory unit, and microcontroller. The magnetometer and barometer were disabled. The sampling frequency
was set at 100 Hz. Sensors were fixed on the participant’s thighs, shanks, and feet bilaterally using a
hypoallergenic adhesive film (Opsite Flexigrid, Smith & Nephew Medical, Hull, UK), as shown in Figure 30.
Sensors on the feet were embedded in a droplet (a small deported 6D sensor unit containing the 3D
accelerometer and 3D gyroscope) in order to be appropriate for measuring activities in daily life settings: either
barefoot or with shoes. Shank and thigh sensors were always oriented in the same way relating to the thigh and
the shank, as shown in Figure 30.
The optoelectronic and wearable systems were synchronized using an additional Physilog4® receiving a trigger
signal from one camera for every trial start and stop. The synchronization was performed in post-treatment
according to the pulse train recorded by the additional sensor.
4.2.4.2 Sensor configuration and associated algorithm
Three configurations were chosen, which all have the following in common: (1) algorithms described in
research studies with high number of subject (n > 800) (Dadashi et al., 2013; Rochat et al., 2010; Seematter-
Bagnoud et al., 2011), (2) commercially available sensors, (3) easy to setup sensors and possibility of long-
term measurements in daily-life, and (4) validation against laboratory system in adult populations (healthy or
with disease). The three configurations use different sensor locations: first, the ‘Shanks and Thighs’ (ShTh)
with four sensors fixed on both thighs and shanks; second, the ‘Shanks’ (Sh) with only one sensor on each
shank; and finally, the ‘Feet’ with one sensor on each foot. The algorithms associated to the three above-
mentioned configurations were used in this study: the double pendulum gait model in ShTh (Salarian et al.,
2004) and Sh, with a reduced number of sensors in Sh (Salarian et al., 2013), and the direct integration method
in Feet (Mariani et al., 2013b, 2010). The ShTh and Sh methods have the same algorithm for gait event
detection. Table 6 provides details about the three configurations regarding sensor location, algorithms, event
detection, output gait parameters, and information about validation of the algorithms.
4.2.5 Data analysis
Two gait events, FS and FO, as well as three STP, stride time, stride length, and stride velocity, were extracted
from the three wearable configurations for each participant and each side, and compared cycle by cycle with
the same outputs extracted from the reference (optoelectronic system). These parameters were selected as they
are fundamental descriptors of gait and the computation of other STP parameters is based on them.
For TD participants, the parameters extracted from left and right sides were congregated since there was no
difference between limbs. For children with CP-GMFCS I, the parameters were separated into paretic and non-

The choice of wearable sensors configuration to measure spatiotemporal gait parameters in children with cerebral palsy
66
paretic limbs according to their clinical profiles. Children with CP-GMFCS II and III were all bilaterally affected
and, therefore, left and right sides were congregated and reported as paretic limbs.
The number of non-detected gait cycles, resulting from irregularities in the signal pattern (mostly due to
pathological gait), was reported for each method. In cases where gait events were detected but no associated STP
was computed, the cycle was not considered and reported as non-detected.
4.2.6 Statistical analysis
We conducted descriptive analyses to evaluate the consistency of the three configurations with regard to the
reference system. To that purpose, error (mean and standard deviation of the difference with the reference)
was determined for each configuration. Regarding gait event detection, positive/negative values stand for
late/early gait event detection, respectively, and over/underestimation of STP. The analyses were performed
for the subgroups of TD, CP-GMFCS I (subdivided into paretic and non-paretic sides), and CP-GMFCS II and
III in order to observe the influence of the impairment level on the error.
Spearman’s correlation coefficients (r) were used to evaluate the linear association between each configuration
and the reference for the three STP in each subgroup. Furthermore, to quantify the agreements between each
configuration and the reference system and visually represent the distribution of the errors, a graphical analysis
through Bland–Altman plots was performed for each configuration for the three STP for each group.

The choice of wearable sensors configuration to measure spatiotemporal gait parameters in children with cerebral palsy
67
Tab
le 6
- D
escr
ipti
on o
f th
e th
ree
wea
rable
confi
gura
tions:
Shan
ks-
and
-Thighs (‘ShTh’), Shan
ks (‘Sh’), an
d Fee
t ac
cord
ing to the se
nso
rs place
men
t an
d associ-
ated
alg
ori
thm
s
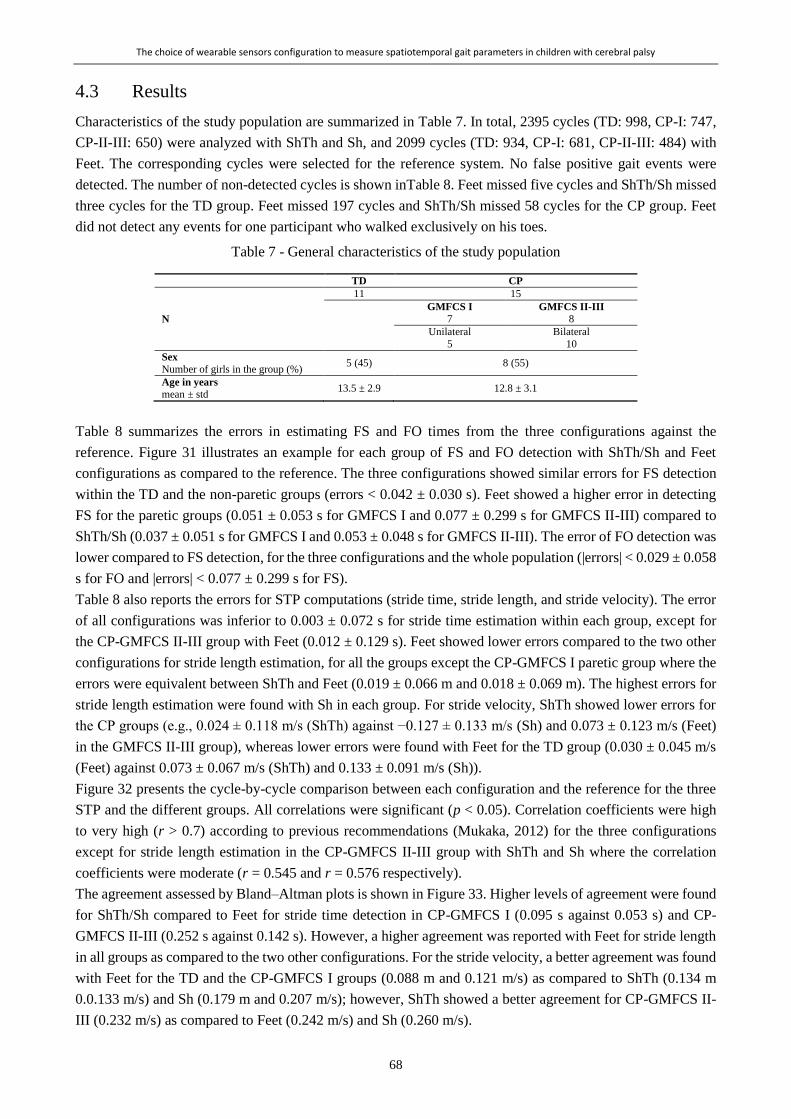
The choice of wearable sensors configuration to measure spatiotemporal gait parameters in children with cerebral palsy
68
4.3 Results
Characteristics of the study population are summarized in Table 7. In total, 2395 cycles (TD: 998, CP-I: 747,
CP-II-III: 650) were analyzed with ShTh and Sh, and 2099 cycles (TD: 934, CP-I: 681, CP-II-III: 484) with
Feet. The corresponding cycles were selected for the reference system. No false positive gait events were
detected. The number of non-detected cycles is shown inTable 8. Feet missed five cycles and ShTh/Sh missed
three cycles for the TD group. Feet missed 197 cycles and ShTh/Sh missed 58 cycles for the CP group. Feet
did not detect any events for one participant who walked exclusively on his toes.
Table 7 - General characteristics of the study population
TD CP
N
11 15
GMFCS I GMFCS II-III 7 8
Unilateral Bilateral
5 10
Sex
Number of girls in the group (%) 5 (45) 8 (55)
Age in years
mean ± std 13.5 ± 2.9 12.8 ± 3.1
Table 8 summarizes the errors in estimating FS and FO times from the three configurations against the
reference. Figure 31 illustrates an example for each group of FS and FO detection with ShTh/Sh and Feet
configurations as compared to the reference. The three configurations showed similar errors for FS detection
within the TD and the non-paretic groups (errors < 0.042 ± 0.030 s). Feet showed a higher error in detecting
FS for the paretic groups (0.051 ± 0.053 s for GMFCS I and 0.077 ± 0.299 s for GMFCS II-III) compared to
ShTh/Sh (0.037 ± 0.051 s for GMFCS I and 0.053 ± 0.048 s for GMFCS II-III). The error of FO detection was
lower compared to FS detection, for the three configurations and the whole population (|errors| < 0.029 ± 0.058
s for FO and |errors| < 0.077 ± 0.299 s for FS).
Table 8 also reports the errors for STP computations (stride time, stride length, and stride velocity). The error
of all configurations was inferior to 0.003 ± 0.072 s for stride time estimation within each group, except for
the CP-GMFCS II-III group with Feet (0.012 ± 0.129 s). Feet showed lower errors compared to the two other
configurations for stride length estimation, for all the groups except the CP-GMFCS I paretic group where the
errors were equivalent between ShTh and Feet (0.019 ± 0.066 m and 0.018 ± 0.069 m). The highest errors for
stride length estimation were found with Sh in each group. For stride velocity, ShTh showed lower errors for
the CP groups (e.g., 0.024 ± 0.118 m/s (ShTh) against −0.127 ± 0.133 m/s (Sh) and 0.073 ± 0.123 m/s (Feet)
in the GMFCS II-III group), whereas lower errors were found with Feet for the TD group (0.030 ± 0.045 m/s
(Feet) against 0.073 ± 0.067 m/s (ShTh) and 0.133 ± 0.091 m/s (Sh)).
Figure 32 presents the cycle-by-cycle comparison between each configuration and the reference for the three
STP and the different groups. All correlations were significant (p < 0.05). Correlation coefficients were high
to very high (r > 0.7) according to previous recommendations (Mukaka, 2012) for the three configurations
except for stride length estimation in the CP-GMFCS II-III group with ShTh and Sh where the correlation
coefficients were moderate (r = 0.545 and r = 0.576 respectively).
The agreement assessed by Bland–Altman plots is shown in Figure 33. Higher levels of agreement were found
for ShTh/Sh compared to Feet for stride time detection in CP-GMFCS I (0.095 s against 0.053 s) and CP-
GMFCS II-III (0.252 s against 0.142 s). However, a higher agreement was reported with Feet for stride length
in all groups as compared to the two other configurations. For the stride velocity, a better agreement was found
with Feet for the TD and the CP-GMFCS I groups (0.088 m and 0.121 m/s) as compared to ShTh (0.134 m
0.0.133 m/s) and Sh (0.179 m and 0.207 m/s); however, ShTh showed a better agreement for CP-GMFCS II-
III (0.232 m/s) as compared to Feet (0.242 m/s) and Sh (0.260 m/s).

The choice of wearable sensors configuration to measure spatiotemporal gait parameters in children with cerebral palsy
69
Po
siti
ve/n
egati
ve v
alu
es s
tan
d f
or
late
/ea
rly
ga
it e
vent
det
ecti
on r
espec
tive
ly a
nd o
ver/
under
esti
mati
on o
f S
TP
. R
efer
ence
va
lues
are
in
bo
ld.
Tab
le 8
- N
um
ber
of
no
n-d
etec
ted c
ycl
es, m
ean v
alues
(an
d s
tandar
d d
evia
tion),
mea
n e
rrors
(an
d s
tandar
d d
evia
tio
n)
agai
nst
the
opto
elec
tro
nic
syst
em f
or
gai
t
even
t (F
oot
stri
ke
and
Fo
ot
off
) det
ecti
on a
nd s
pat
iote
mpora
l par
amet
ers
(str
ide
tim
e, s
trid
e le
ngth
, an
d s
trid
e vel
oci
ty)
com
pu
tati
on
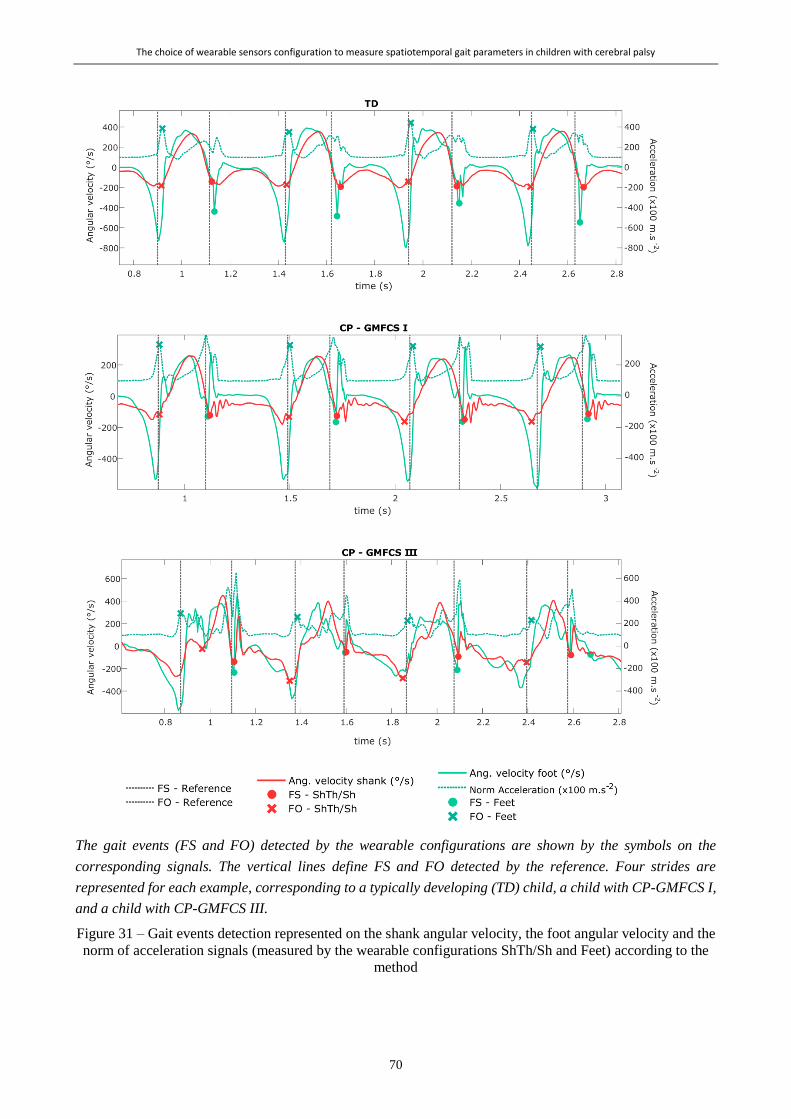
The choice of wearable sensors configuration to measure spatiotemporal gait parameters in children with cerebral palsy
70
The gait events (FS and FO) detected by the wearable configurations are shown by the symbols on the
corresponding signals. The vertical lines define FS and FO detected by the reference. Four strides are
represented for each example, corresponding to a typically developing (TD) child, a child with CP-GMFCS I,
and a child with CP-GMFCS III.
Figure 31 – Gait events detection represented on the shank angular velocity, the foot angular velocity and the
norm of acceleration signals (measured by the wearable configurations ShTh/Sh and Feet) according to the
method
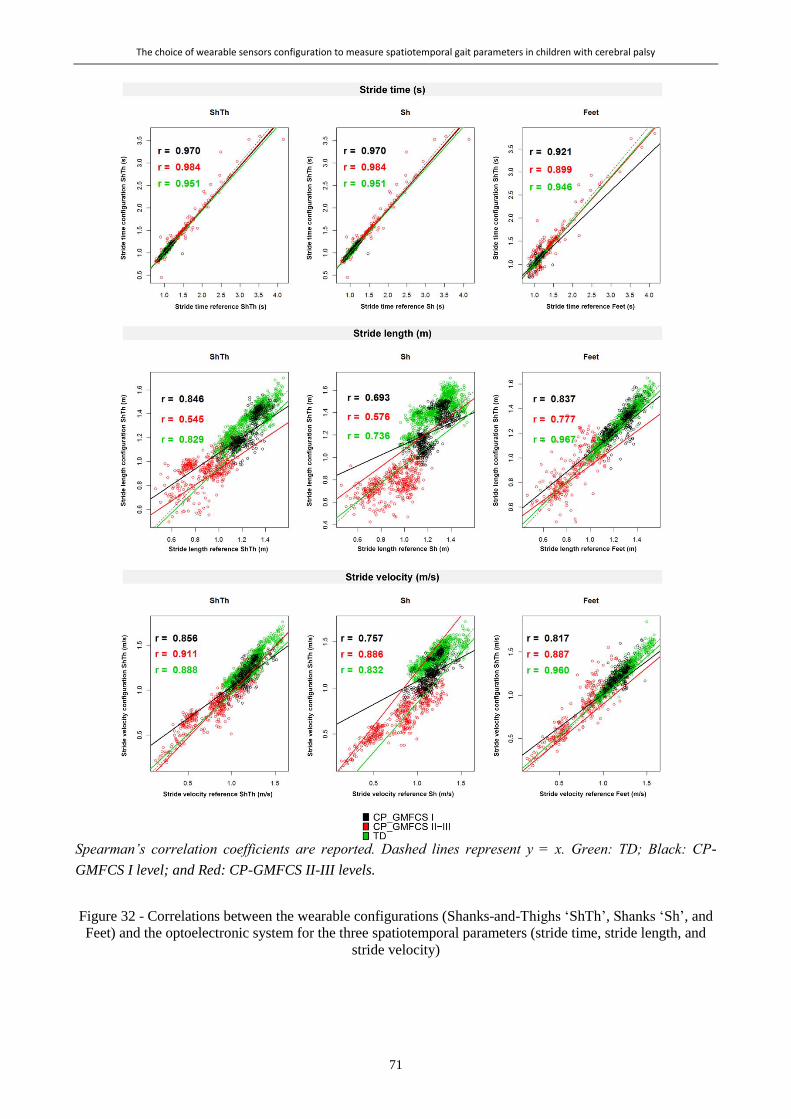
The choice of wearable sensors configuration to measure spatiotemporal gait parameters in children with cerebral palsy
71
Spearman’s correlation coefficients are reported. Dashed lines represent y = x. Green: TD; Black: CP-
GMFCS I level; and Red: CP-GMFCS II-III levels.
Figure 32 - Correlations between the wearable configurations (Shanks-and-Thighs ‘ShTh’, Shanks ‘Sh’, and
Feet) and the optoelectronic system for the three spatiotemporal parameters (stride time, stride length, and
stride velocity)
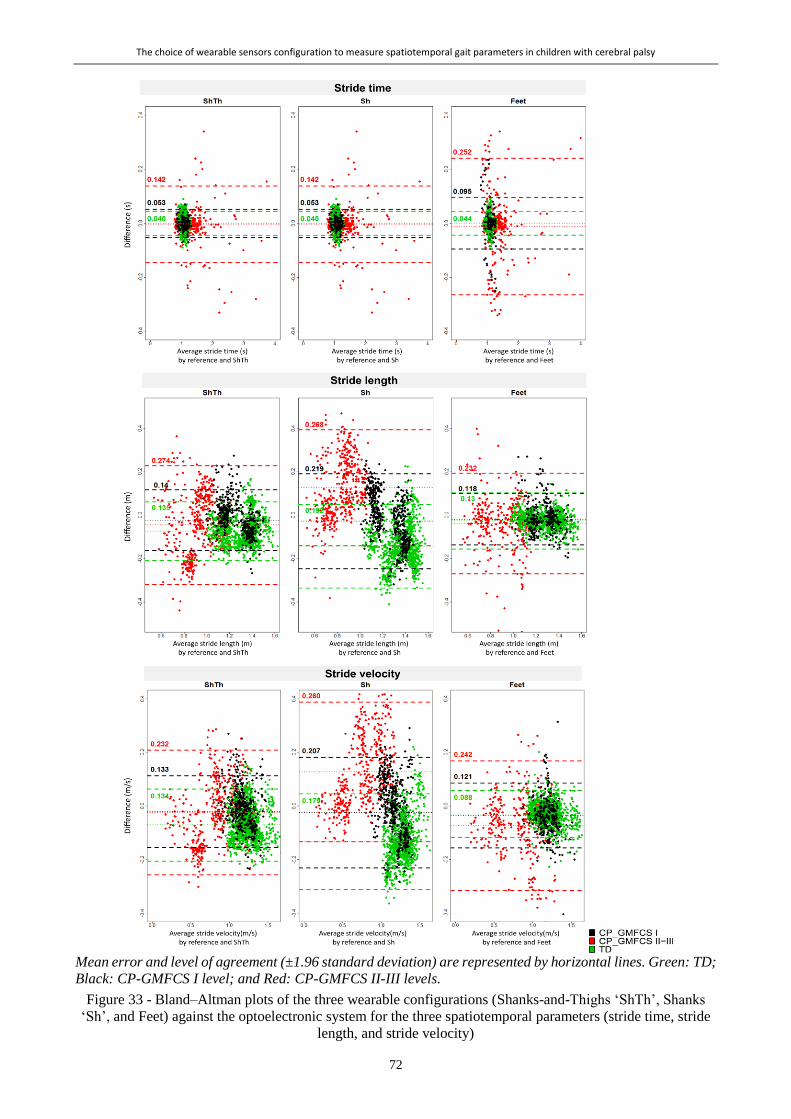
The choice of wearable sensors configuration to measure spatiotemporal gait parameters in children with cerebral palsy
72
Mean error and level of agreement (±1.96 standard deviation) are represented by horizontal lines. Green: TD;
Black: CP-GMFCS I level; and Red: CP-GMFCS II-III levels.
Figure 33 - Bland–Altman plots of the three wearable configurations (Shanks-and-Thighs ‘ShTh’, Shanks
‘Sh’, and Feet) against the optoelectronic system for the three spatiotemporal parameters (stride time, stride
length, and stride velocity)
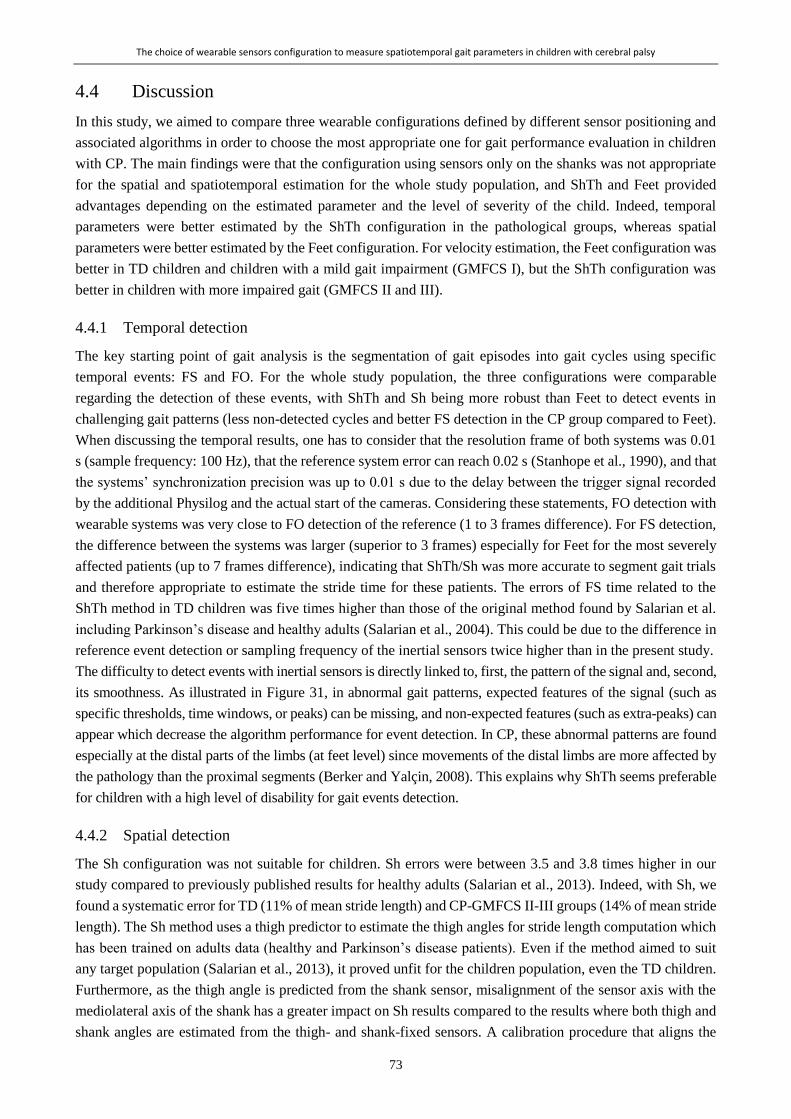
The choice of wearable sensors configuration to measure spatiotemporal gait parameters in children with cerebral palsy
73
4.4 Discussion
In this study, we aimed to compare three wearable configurations defined by different sensor positioning and
associated algorithms in order to choose the most appropriate one for gait performance evaluation in children
with CP. The main findings were that the configuration using sensors only on the shanks was not appropriate
for the spatial and spatiotemporal estimation for the whole study population, and ShTh and Feet provided
advantages depending on the estimated parameter and the level of severity of the child. Indeed, temporal
parameters were better estimated by the ShTh configuration in the pathological groups, whereas spatial
parameters were better estimated by the Feet configuration. For velocity estimation, the Feet configuration was
better in TD children and children with a mild gait impairment (GMFCS I), but the ShTh configuration was
better in children with more impaired gait (GMFCS II and III).
4.4.1 Temporal detection
The key starting point of gait analysis is the segmentation of gait episodes into gait cycles using specific
temporal events: FS and FO. For the whole study population, the three configurations were comparable
regarding the detection of these events, with ShTh and Sh being more robust than Feet to detect events in
challenging gait patterns (less non-detected cycles and better FS detection in the CP group compared to Feet).
When discussing the temporal results, one has to consider that the resolution frame of both systems was 0.01
s (sample frequency: 100 Hz), that the reference system error can reach 0.02 s (Stanhope et al., 1990), and that
the systems’ synchronization precision was up to 0.01 s due to the delay between the trigger signal recorded
by the additional Physilog and the actual start of the cameras. Considering these statements, FO detection with
wearable systems was very close to FO detection of the reference (1 to 3 frames difference). For FS detection,
the difference between the systems was larger (superior to 3 frames) especially for Feet for the most severely
affected patients (up to 7 frames difference), indicating that ShTh/Sh was more accurate to segment gait trials
and therefore appropriate to estimate the stride time for these patients. The errors of FS time related to the
ShTh method in TD children was five times higher than those of the original method found by Salarian et al.
including Parkinson’s disease and healthy adults (Salarian et al., 2004). This could be due to the difference in
reference event detection or sampling frequency of the inertial sensors twice higher than in the present study.
The difficulty to detect events with inertial sensors is directly linked to, first, the pattern of the signal and, second,
its smoothness. As illustrated in Figure 31, in abnormal gait patterns, expected features of the signal (such as
specific thresholds, time windows, or peaks) can be missing, and non-expected features (such as extra-peaks) can
appear which decrease the algorithm performance for event detection. In CP, these abnormal patterns are found
especially at the distal parts of the limbs (at feet level) since movements of the distal limbs are more affected by
the pathology than the proximal segments (Berker and Yalçin, 2008). This explains why ShTh seems preferable
for children with a high level of disability for gait events detection.
4.4.2 Spatial detection
The Sh configuration was not suitable for children. Sh errors were between 3.5 and 3.8 times higher in our
study compared to previously published results for healthy adults (Salarian et al., 2013). Indeed, with Sh, we
found a systematic error for TD (11% of mean stride length) and CP-GMFCS II-III groups (14% of mean stride
length). The Sh method uses a thigh predictor to estimate the thigh angles for stride length computation which
has been trained on adults data (healthy and Parkinson’s disease patients). Even if the method aimed to suit
any target population (Salarian et al., 2013), it proved unfit for the children population, even the TD children.
Furthermore, as the thigh angle is predicted from the shank sensor, misalignment of the sensor axis with the
mediolateral axis of the shank has a greater impact on Sh results compared to the results where both thigh and
shank angles are estimated from the thigh- and shank-fixed sensors. A calibration procedure that aligns the
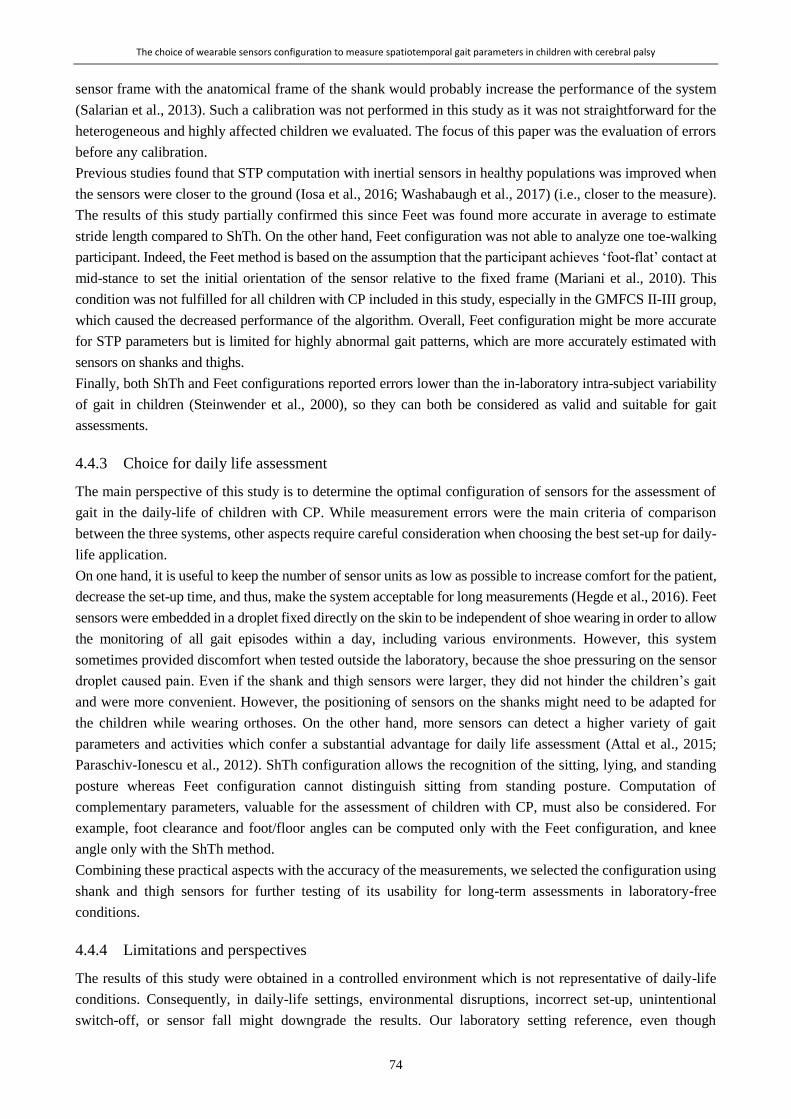
The choice of wearable sensors configuration to measure spatiotemporal gait parameters in children with cerebral palsy
74
sensor frame with the anatomical frame of the shank would probably increase the performance of the system
(Salarian et al., 2013). Such a calibration was not performed in this study as it was not straightforward for the
heterogeneous and highly affected children we evaluated. The focus of this paper was the evaluation of errors
before any calibration.
Previous studies found that STP computation with inertial sensors in healthy populations was improved when
the sensors were closer to the ground (Iosa et al., 2016; Washabaugh et al., 2017) (i.e., closer to the measure).
The results of this study partially confirmed this since Feet was found more accurate in average to estimate
stride length compared to ShTh. On the other hand, Feet configuration was not able to analyze one toe-walking
participant. Indeed, the Feet method is based on the assumption that the participant achieves ‘foot-flat’ contact at
mid-stance to set the initial orientation of the sensor relative to the fixed frame (Mariani et al., 2010). This
condition was not fulfilled for all children with CP included in this study, especially in the GMFCS II-III group,
which caused the decreased performance of the algorithm. Overall, Feet configuration might be more accurate
for STP parameters but is limited for highly abnormal gait patterns, which are more accurately estimated with
sensors on shanks and thighs.
Finally, both ShTh and Feet configurations reported errors lower than the in-laboratory intra-subject variability
of gait in children (Steinwender et al., 2000), so they can both be considered as valid and suitable for gait
assessments.
4.4.3 Choice for daily life assessment
The main perspective of this study is to determine the optimal configuration of sensors for the assessment of
gait in the daily-life of children with CP. While measurement errors were the main criteria of comparison
between the three systems, other aspects require careful consideration when choosing the best set-up for daily-
life application.
On one hand, it is useful to keep the number of sensor units as low as possible to increase comfort for the patient,
decrease the set-up time, and thus, make the system acceptable for long measurements (Hegde et al., 2016). Feet
sensors were embedded in a droplet fixed directly on the skin to be independent of shoe wearing in order to allow
the monitoring of all gait episodes within a day, including various environments. However, this system
sometimes provided discomfort when tested outside the laboratory, because the shoe pressuring on the sensor
droplet caused pain. Even if the shank and thigh sensors were larger, they did not hinder the children’s gait
and were more convenient. However, the positioning of sensors on the shanks might need to be adapted for
the children while wearing orthoses. On the other hand, more sensors can detect a higher variety of gait
parameters and activities which confer a substantial advantage for daily life assessment (Attal et al., 2015;
Paraschiv-Ionescu et al., 2012). ShTh configuration allows the recognition of the sitting, lying, and standing
posture whereas Feet configuration cannot distinguish sitting from standing posture. Computation of
complementary parameters, valuable for the assessment of children with CP, must also be considered. For
example, foot clearance and foot/floor angles can be computed only with the Feet configuration, and knee
angle only with the ShTh method.
Combining these practical aspects with the accuracy of the measurements, we selected the configuration using
shank and thigh sensors for further testing of its usability for long-term assessments in laboratory-free
conditions.
4.4.4 Limitations and perspectives
The results of this study were obtained in a controlled environment which is not representative of daily-life
conditions. Consequently, in daily-life settings, environmental disruptions, incorrect set-up, unintentional
switch-off, or sensor fall might downgrade the results. Our laboratory setting reference, even though

The choice of wearable sensors configuration to measure spatiotemporal gait parameters in children with cerebral palsy
75
considered a ‘gold standard’, can reach 0.02 s in timing error (Stanhope et al., 1990) and a mean accuracy of
5.3 mm for marker trajectory estimates (Chiari et al., 2005). The errors reported can, therefore, be a
combination of errors of both systems. Furthermore, only configurations using sensors on the lower limbs have
been tested in this study. Other configurations including those using sensors on the wrists, the chest, or the
pelvis exist (Benedikt Fasel et al., 2017; Zijlstra and Hof, 2003) but were not tested as we wished to analyze
the paretic and non-paretic limbs separately. Finally, we evaluated a limited number of subjects and, since CP
gait patterns are very heterogeneous, a larger number of participants, especially in the CP group with a high
level of disability (GMFCS II-III), would permit to strengthen the conclusions. Besides this, an increased
number of participants would allow subgroup analysis within the GMFCS II-III group according to what
algorithms could then be refined to be more versatile and flexible enough to fulfill the requirements of every
individual clinical picture.
4.5 Conclusions
We compared three configurations of wearable sensors able to compute STP in children with CP and TD
children on the base of the comparison with an optoelectronic system in the laboratory. The results showed
that the configuration using sensors on both feet was more accurate for typical and regular gait patterns (i.e.,
for of TD children), while sensors located on the shanks and thighs performed better for moderate to severely
impaired gait patterns (CP with GMFCS levels II and III). Overall, the results of this study indicate that inertial
sensors proved promising for an objective evaluation of gait in daily-life. Such evaluations have the potential
to shed light on patients’ daily difficulties.

76

77
Chapter 5 *
A Personalized approach to improve walking detection in real-life settings
Abstract
Although many methods have been developed to detect walking by using body-worn inertial sensors, their
performances decline when gait patterns become abnormal, as seen in children with cerebral palsy (CP). The
aim of this study was to evaluate if fine-tuning an existing walking bouts (WB) detection algorithm by various
thresholds, customized at the individual or group level, could improve WB detection in children with CP and
typical development (TD). Twenty children (10 CP, 10 TD) wore 4 inertial sensors on their lower limbs during
laboratory and out-laboratory assessments. Features extracted from the gyroscope signals recorded in the
laboratory were used to tune thresholds of an existing walking detection algorithm for each participant
(individual-based personalization: Indiv) or for each group (population-based customization: Pop). Out-of-
laboratory recordings were analyzed for WB detection with three versions of the algorithm (i.e., original fixed
thresholds and adapted thresholds based on the Indiv and Pop methods), and the results were compared against
video reference data. The clinical impact was assessed by quantifying the effect of WB detection error on the
estimated walking speed distribution. The two customized Indiv and Pop methods both improved WB
detection (higher, sensitivity, accuracy and precision), with the individual-based personalization showing the
best results. Comparison of walking speed distribution obtained with the best of the two methods showed a
significant difference for 8 out of 20 participants. The personalized Indiv method excluded non-walking
activities that were initially wrongly interpreted as extremely slow walking with the initial method using fixed
thresholds. Customized methods, particularly individual-based personalization, appear more efficient to detect
WB in daily-life settings.
* Chapter published as:
Carcreff L., Paraschiv-Ionescu A., Gerber C.N., Newman C.J., Armand S. and Aminian K. “A Personalized Approach to
Improve Walking Detection in Real-Life Set-tings: Application to Children with Cerebral Palsy”, Sensors, 2019, vol. 19,
num. 5316. doi: 10.3390/s19235316 – with permissions of all co-authors.
My contributions: Methodology, recruitement, investigation, software, data curation, visualization, formal analysis,
writing – original draft, writing-review and editing

A Personalized approach to improve walking detection in real-life settings
78
5.1 Introduction
Wearable inertial devices have gained increasing popularity in recent years to monitor physical activity and
gait-related parameters in real-life settings for clinical purposes (Chen et al., 2016; Jarchi et al., 2018).
Continuous and long-term assessment of gait parameters in the community (corresponding to gait
‘Performance’ as defined by the World Health Organization (World Health Organization, 2002)) contributes
to provide clinicians a better representation of a patient’s abilities in the context of every-day life (Gosselin et
al., 2018). The time spent walking, number of steps per day, maximum number of consecutive steps, mean
walking speed, their variability and other ambulatory related-parameters during the day constitute precious
data about a patient’s performance, and can inform about activity and participation (Gosselin et al., 2018).
However, accurate gait assessment in real-life settings is challenging (Anisoara Paraschiv-Ionescu et al., 2019).
Daily-life activities consist of a great variety of tasks, movements and body postures that are modulated in
intensity and quality throughout the day, depending on a multitude of environmental and personal factors
(Oberhauser et al., 2014). The detection of walking within this array of daily activities and also, the distinction
between walking and non-walking types of locomotion (i.e. stair climbing and running) can prove complex.
One of the conventional methods for gait detection, i.e. walking bout (WB) detection, is based on the
identification of consecutive steps, each step being identified from specific temporal gait events (Lee et al.,
2015). Gait is a periodic activity consisting of successive gait cycles, formed by two (left and right) steps. By
convention in clinical gait analysis, the cycle is divided in two phases: the stance phase where the foot is in
contact with the ground and the swing phase where it is not. Body segments’ acceleration and velocity have
distinct properties during these two phases. Numerous gait recognition methods have used these specific
features on accelerometer and/or gyroscope signals (Aminian et al., 2002; Hickey et al., 2017a; Muñoz-
Organero et al., 2017; Pham et al., 2017). Commonly, peaks of shank angular velocity during the swing phase
(Aminian et al., 2002; Salarian et al., 2004), or peaks of trunk or waist acceleration at foot contacts (Fortino et
al., 2015; Anisoara Paraschiv-Ionescu et al., 2019; Zijlstra and Hof, 2003) are used to detect steps due to their
simplicity (Kong et al., 2016), accuracy and repeatability (Pacini Panebianco et al., 2018). In most methods,
fixed thresholds are defined for peak detection, limiting the use of the algorithm for a specific population
(mostly healthy adults or elderly people with or without disability (Feldhege et al., 2015; Micó-Amigo et al.,
2016; Pham et al., 2017; Salarian et al., 2004)), and in specific settings (mostly laboratory settings). Therefore,
the performance of such algorithms decreases when the gait patterns are unusual such as in slow and/or
impaired walking (Bertuletti et al., 2019; Fortino et al., 2015; Muñoz-Organero et al., 2017; Sanjay K. Prajapati
et al., 2011) like in children with cerebral palsy (CP), and also when they are assessed in different settings
(Pham et al., 2017; Sessa et al., 2015) and footwear (Anwary et al., 2018a). Adaptive thresholds throughout
the assessment can also be set, giving the opportunity to adapt to the inter-steps variability within the
monitoring (Fortino et al., 2015; Kheirkhahan et al., 2017; Lee et al., 2015). One disadvantage of this type of
approach is that every non-gait activity presenting similar periodicity (such as horse riding or legs swinging
while seated) will trigger false step detection (Anwary et al., 2018a; Sanjay K. Prajapati et al., 2011).
CP is a group of motor disorders resulting from damage of the developing brain, affecting about 1.8:1000
newborns (Sellier et al., 2016). Children with CP are characterized by heterogeneous impairments of the
musculoskeletal system, with unilateral or bilateral body involvement. Only two thirds of children with CP
can achieve community ambulation with or without mechanical walking aids (such as crutches, tripods or a
walker), and independent walking is at the forefront of therapeutic objectives. In a previous study, we
demonstrated that inertial sensors located on the shanks and thighs were able to accurately estimate gait
parameters of children with CP and typical development (TD) in laboratory settings (Carcreff et al., 2018).
However, WB detection was not assessed in this study since the laboratory setting enabled the precise
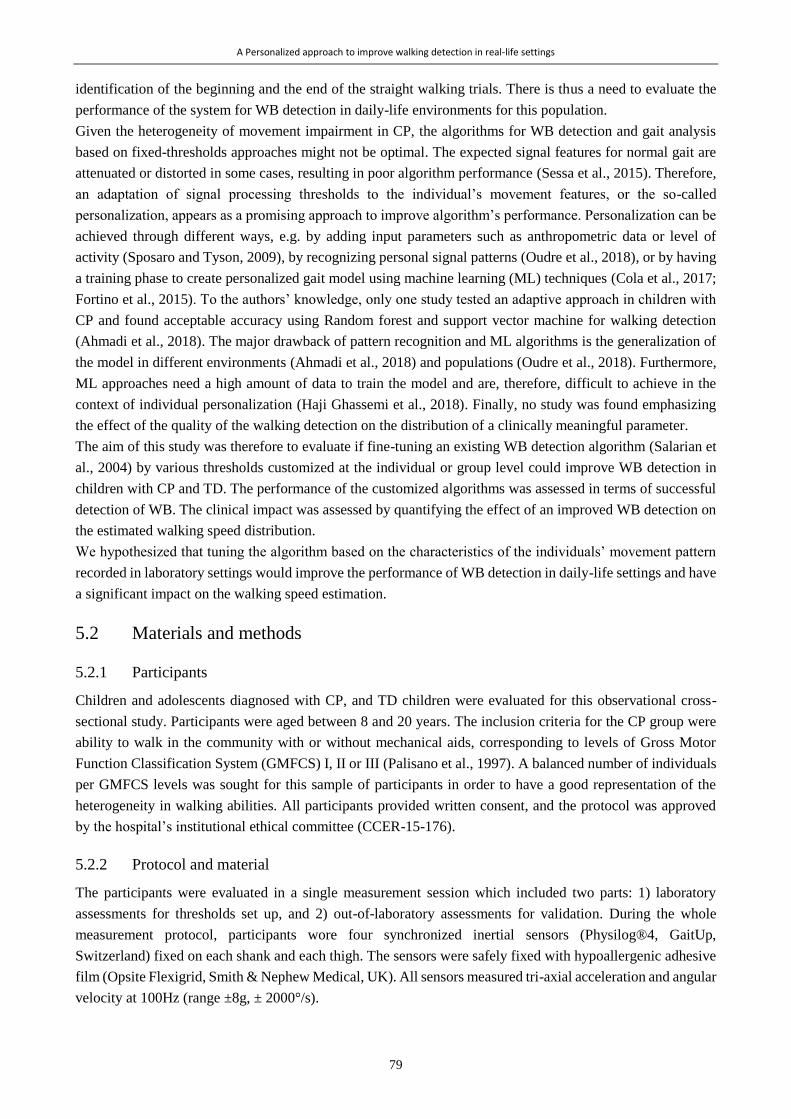
A Personalized approach to improve walking detection in real-life settings
79
identification of the beginning and the end of the straight walking trials. There is thus a need to evaluate the
performance of the system for WB detection in daily-life environments for this population.
Given the heterogeneity of movement impairment in CP, the algorithms for WB detection and gait analysis
based on fixed-thresholds approaches might not be optimal. The expected signal features for normal gait are
attenuated or distorted in some cases, resulting in poor algorithm performance (Sessa et al., 2015). Therefore,
an adaptation of signal processing thresholds to the individual’s movement features, or the so-called
personalization, appears as a promising approach to improve algorithm’s performance. Personalization can be
achieved through different ways, e.g. by adding input parameters such as anthropometric data or level of
activity (Sposaro and Tyson, 2009), by recognizing personal signal patterns (Oudre et al., 2018), or by having
a training phase to create personalized gait model using machine learning (ML) techniques (Cola et al., 2017;
Fortino et al., 2015). To the authors’ knowledge, only one study tested an adaptive approach in children with
CP and found acceptable accuracy using Random forest and support vector machine for walking detection
(Ahmadi et al., 2018). The major drawback of pattern recognition and ML algorithms is the generalization of
the model in different environments (Ahmadi et al., 2018) and populations (Oudre et al., 2018). Furthermore,
ML approaches need a high amount of data to train the model and are, therefore, difficult to achieve in the
context of individual personalization (Haji Ghassemi et al., 2018). Finally, no study was found emphasizing
the effect of the quality of the walking detection on the distribution of a clinically meaningful parameter.
The aim of this study was therefore to evaluate if fine-tuning an existing WB detection algorithm (Salarian et
al., 2004) by various thresholds customized at the individual or group level could improve WB detection in
children with CP and TD. The performance of the customized algorithms was assessed in terms of successful
detection of WB. The clinical impact was assessed by quantifying the effect of an improved WB detection on
the estimated walking speed distribution.
We hypothesized that tuning the algorithm based on the characteristics of the individuals’ movement pattern
recorded in laboratory settings would improve the performance of WB detection in daily-life settings and have
a significant impact on the walking speed estimation.
5.2 Materials and methods
5.2.1 Participants
Children and adolescents diagnosed with CP, and TD children were evaluated for this observational cross-
sectional study. Participants were aged between 8 and 20 years. The inclusion criteria for the CP group were
ability to walk in the community with or without mechanical aids, corresponding to levels of Gross Motor
Function Classification System (GMFCS) I, II or III (Palisano et al., 1997). A balanced number of individuals
per GMFCS levels was sought for this sample of participants in order to have a good representation of the
heterogeneity in walking abilities. All participants provided written consent, and the protocol was approved
by the hospital’s institutional ethical committee (CCER-15-176).
5.2.2 Protocol and material
The participants were evaluated in a single measurement session which included two parts: 1) laboratory
assessments for thresholds set up, and 2) out-of-laboratory assessments for validation. During the whole
measurement protocol, participants wore four synchronized inertial sensors (Physilog®4, GaitUp,
Switzerland) fixed on each shank and each thigh. The sensors were safely fixed with hypoallergenic adhesive
film (Opsite Flexigrid, Smith & Nephew Medical, UK). All sensors measured tri-axial acceleration and angular
velocity at 100Hz (range ±8g, ± 2000°/s).

A Personalized approach to improve walking detection in real-life settings
80
1. Laboratory: Several straight gait trials were performed by the participants on a 20m walkway, at 3
self-defined walking speeds: spontaneous, slow and fast. A total of 10 to 15 trials were recorded for
each participant.
2. Out-of-laboratory: A sequence of ‘daily-life-like’ activities was performed in the hospital corridors
and hospital surroundings including static postures of lying, sitting and standing, walking on various
surfaces (stones, grass, tarmac), along straight or curved trajectories, up and down stairs, and other
free activities of the participant’s choice such as running, jumping or playing on swings. The sequence
of activities lasted about 20 min and always started with a predefined body posture (lying on the back
on a medical table). During the out-of-laboratory assessment, and for validation purpose, the evaluator
was equipped with a camera (GoPro Hero+, USA) on his chest wearing a harness. The camera captured
the participant during the entire sequence of daily-life-like activities.
5.2.3 Data processing
The following sections describe the data processing flow as shown in Figure 34.
Abbreviations: WB: Walking bouts; WS: Walking speed; Sens: sensitivity; Spec: specificity; Acc: accuracy;
Prec: precision; ωz_Shank: pitch angular velocity of shanks
Figure 34 – Data processing workflow diagram
5.2.3.1 Pre-processing
The inertial sensors and camera were manually synchronized by detecting the first lying posture on both the
IMU signals and the video. Videos were labeled by the investigator using an open source software (BORIS)
(Friard and Gamba, 2016). The type and timing of activities were exported in a csv file and were used as
“ground truth” for WB validation. Data was processed and analyzed using Matlab R2017 software
(Mathworks, USA). IMU data recorded in laboratory was cut into trials. Out-of-laboratory IMU data was
recorded continuously from the first lying posture, easily recognizable on the acceleration signals (constant
value of about 1g during at least 3sec), until the end of the recordings. For calibration, principal component
analysis was performed on the 3-axis angular velocity signals of each shank to align the pitch (around the
medio-lateral axis) angular velocity (ωz_Shank) with the principal axis of movement during walking (Mcgrath et
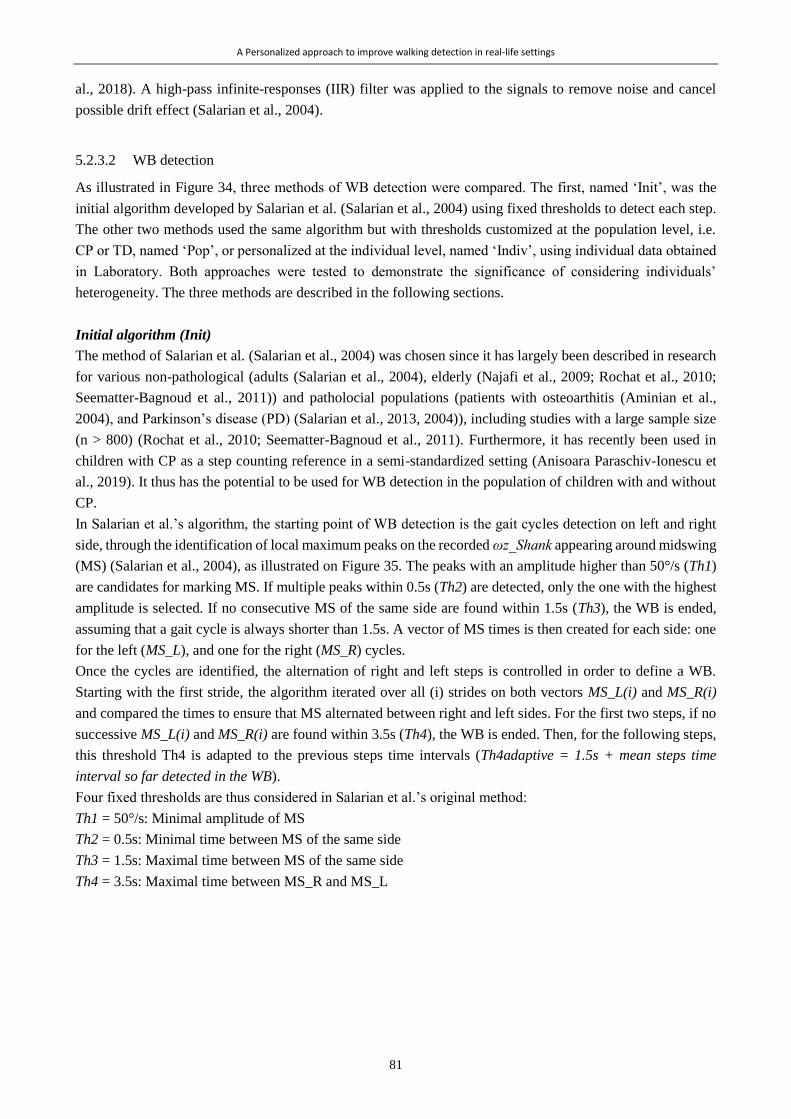
A Personalized approach to improve walking detection in real-life settings
81
al., 2018). A high-pass infinite-responses (IIR) filter was applied to the signals to remove noise and cancel
possible drift effect (Salarian et al., 2004).
5.2.3.2 WB detection
As illustrated in Figure 34, three methods of WB detection were compared. The first, named ‘Init’, was the
initial algorithm developed by Salarian et al. (Salarian et al., 2004) using fixed thresholds to detect each step.
The other two methods used the same algorithm but with thresholds customized at the population level, i.e.
CP or TD, named ‘Pop’, or personalized at the individual level, named ‘Indiv’, using individual data obtained
in Laboratory. Both approaches were tested to demonstrate the significance of considering individuals’
heterogeneity. The three methods are described in the following sections.
Initial algorithm (Init)
The method of Salarian et al. (Salarian et al., 2004) was chosen since it has largely been described in research
for various non-pathological (adults (Salarian et al., 2004), elderly (Najafi et al., 2009; Rochat et al., 2010;
Seematter-Bagnoud et al., 2011)) and patholocial populations (patients with osteoarthitis (Aminian et al.,
2004), and Parkinson’s disease (PD) (Salarian et al., 2013, 2004)), including studies with a large sample size
(n > 800) (Rochat et al., 2010; Seematter-Bagnoud et al., 2011). Furthermore, it has recently been used in
children with CP as a step counting reference in a semi-standardized setting (Anisoara Paraschiv-Ionescu et
al., 2019). It thus has the potential to be used for WB detection in the population of children with and without
CP.
In Salarian et al.’s algorithm, the starting point of WB detection is the gait cycles detection on left and right
side, through the identification of local maximum peaks on the recorded ωz_Shank appearing around midswing
(MS) (Salarian et al., 2004), as illustrated on Figure 35. The peaks with an amplitude higher than 50°/s (Th1)
are candidates for marking MS. If multiple peaks within 0.5s (Th2) are detected, only the one with the highest
amplitude is selected. If no consecutive MS of the same side are found within 1.5s (Th3), the WB is ended,
assuming that a gait cycle is always shorter than 1.5s. A vector of MS times is then created for each side: one
for the left (MS_L), and one for the right (MS_R) cycles.
Once the cycles are identified, the alternation of right and left steps is controlled in order to define a WB.
Starting with the first stride, the algorithm iterated over all (i) strides on both vectors MS_L(i) and MS_R(i)
and compared the times to ensure that MS alternated between right and left sides. For the first two steps, if no
successive MS_L(i) and MS_R(i) are found within 3.5s (Th4), the WB is ended. Then, for the following steps,
this threshold Th4 is adapted to the previous steps time intervals (Th4adaptive = 1.5s + mean steps time
interval so far detected in the WB).
Four fixed thresholds are thus considered in Salarian et al.’s original method:
Th1 = 50°/s: Minimal amplitude of MS
Th2 = 0.5s: Minimal time between MS of the same side
Th3 = 1.5s: Maximal time between MS of the same side
Th4 = 3.5s: Maximal time between MS_R and MS_L
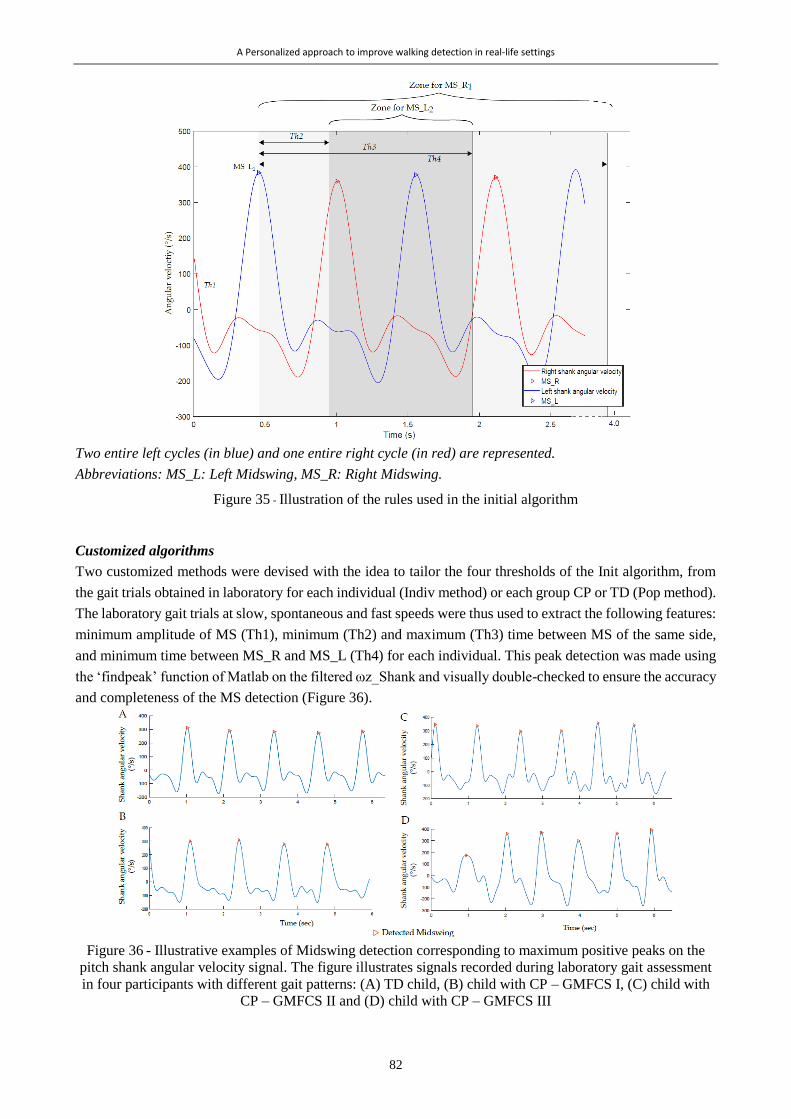
A Personalized approach to improve walking detection in real-life settings
82
Two entire left cycles (in blue) and one entire right cycle (in red) are represented.
Abbreviations: MS_L: Left Midswing, MS_R: Right Midswing.
Figure 35 - Illustration of the rules used in the initial algorithm
Customized algorithms
Two customized methods were devised with the idea to tailor the four thresholds of the Init algorithm, from
the gait trials obtained in laboratory for each individual (Indiv method) or each group CP or TD (Pop method).
The laboratory gait trials at slow, spontaneous and fast speeds were thus used to extract the following features:
minimum amplitude of MS (Th1), minimum (Th2) and maximum (Th3) time between MS of the same side,
and minimum time between MS_R and MS_L (Th4) for each individual. This peak detection was made using
the ‘findpeak’ function of Matlab on the filtered ωz_Shank and visually double-checked to ensure the accuracy
and completeness of the MS detection (Figure 36).
Figure 36 - Illustrative examples of Midswing detection corresponding to maximum positive peaks on the
pitch shank angular velocity signal. The figure illustrates signals recorded during laboratory gait assessment
in four participants with different gait patterns: (A) TD child, (B) child with CP – GMFCS I, (C) child with
CP – GMFCS II and (D) child with CP – GMFCS III
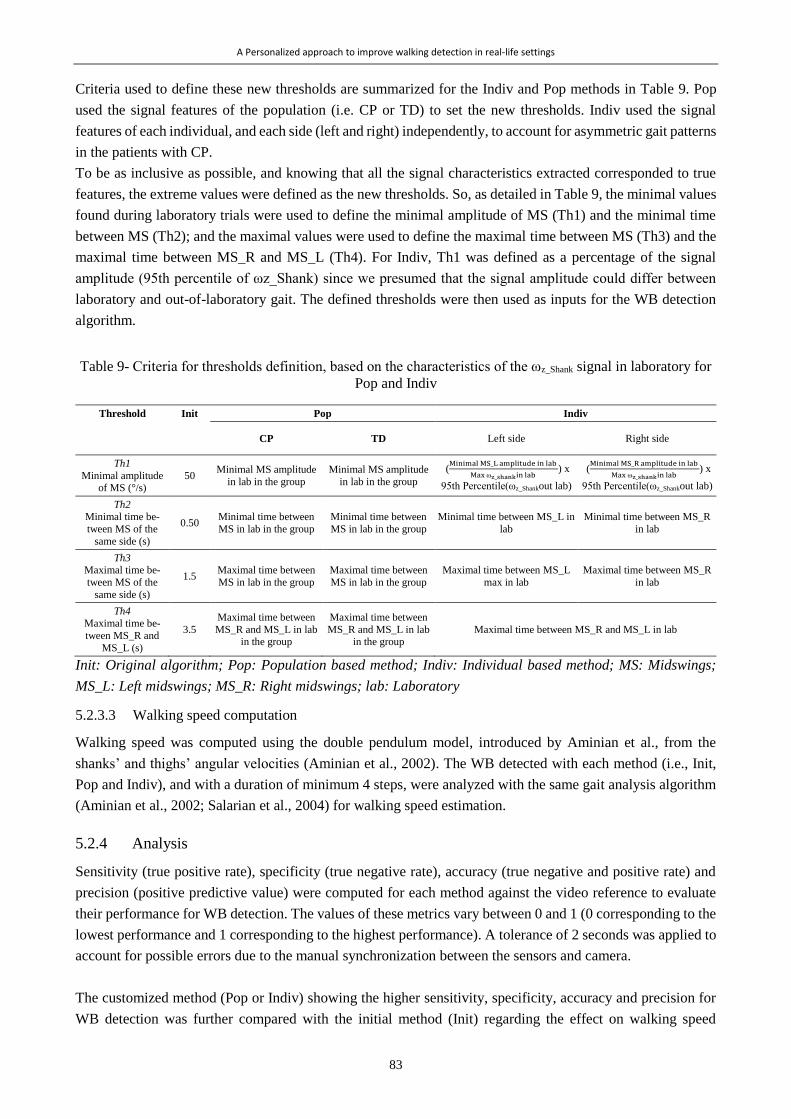
A Personalized approach to improve walking detection in real-life settings
83
Criteria used to define these new thresholds are summarized for the Indiv and Pop methods in Table 9. Pop
used the signal features of the population (i.e. CP or TD) to set the new thresholds. Indiv used the signal
features of each individual, and each side (left and right) independently, to account for asymmetric gait patterns
in the patients with CP.
To be as inclusive as possible, and knowing that all the signal characteristics extracted corresponded to true
features, the extreme values were defined as the new thresholds. So, as detailed in Table 9, the minimal values
found during laboratory trials were used to define the minimal amplitude of MS (Th1) and the minimal time
between MS (Th2); and the maximal values were used to define the maximal time between MS (Th3) and the
maximal time between MS_R and MS_L (Th4). For Indiv, Th1 was defined as a percentage of the signal
amplitude (95th percentile of ωz_Shank) since we presumed that the signal amplitude could differ between
laboratory and out-of-laboratory gait. The defined thresholds were then used as inputs for the WB detection
algorithm.
Table 9- Criteria for thresholds definition, based on the characteristics of the ωz_Shank signal in laboratory for
Pop and Indiv
Threshold Init Pop Indiv
CP TD Left side Right side
Th1
Minimal amplitude of MS (°/s)
50 Minimal MS amplitude
in lab in the group
Minimal MS amplitude
in lab in the group
(Minimal MS_L amplitude in lab
Max ωz_shankin lab ) x
95th Percentile(ωz_Shankout lab)
(Minimal MS_R amplitude in lab
Max ωz_shankin lab ) x
95th Percentile(ωz_Shankout lab)
Th2 Minimal time be-
tween MS of the
same side (s)
0.50 Minimal time between
MS in lab in the group
Minimal time between
MS in lab in the group
Minimal time between MS_L in
lab
Minimal time between MS_R
in lab
Th3 Maximal time be-
tween MS of the
same side (s)
1.5 Maximal time between
MS in lab in the group
Maximal time between
MS in lab in the group
Maximal time between MS_L
max in lab
Maximal time between MS_R
in lab
Th4 Maximal time be-
tween MS_R and
MS_L (s)
3.5
Maximal time between
MS_R and MS_L in lab in the group
Maximal time between
MS_R and MS_L in lab in the group
Maximal time between MS_R and MS_L in lab
Init: Original algorithm; Pop: Population based method; Indiv: Individual based method; MS: Midswings;
MS_L: Left midswings; MS_R: Right midswings; lab: Laboratory
5.2.3.3 Walking speed computation
Walking speed was computed using the double pendulum model, introduced by Aminian et al., from the
shanks’ and thighs’ angular velocities (Aminian et al., 2002). The WB detected with each method (i.e., Init,
Pop and Indiv), and with a duration of minimum 4 steps, were analyzed with the same gait analysis algorithm
(Aminian et al., 2002; Salarian et al., 2004) for walking speed estimation.
5.2.4 Analysis
Sensitivity (true positive rate), specificity (true negative rate), accuracy (true negative and positive rate) and
precision (positive predictive value) were computed for each method against the video reference to evaluate
their performance for WB detection. The values of these metrics vary between 0 and 1 (0 corresponding to the
lowest performance and 1 corresponding to the highest performance). A tolerance of 2 seconds was applied to
account for possible errors due to the manual synchronization between the sensors and camera.
The customized method (Pop or Indiv) showing the higher sensitivity, specificity, accuracy and precision for
WB detection was further compared with the initial method (Init) regarding the effect on walking speed
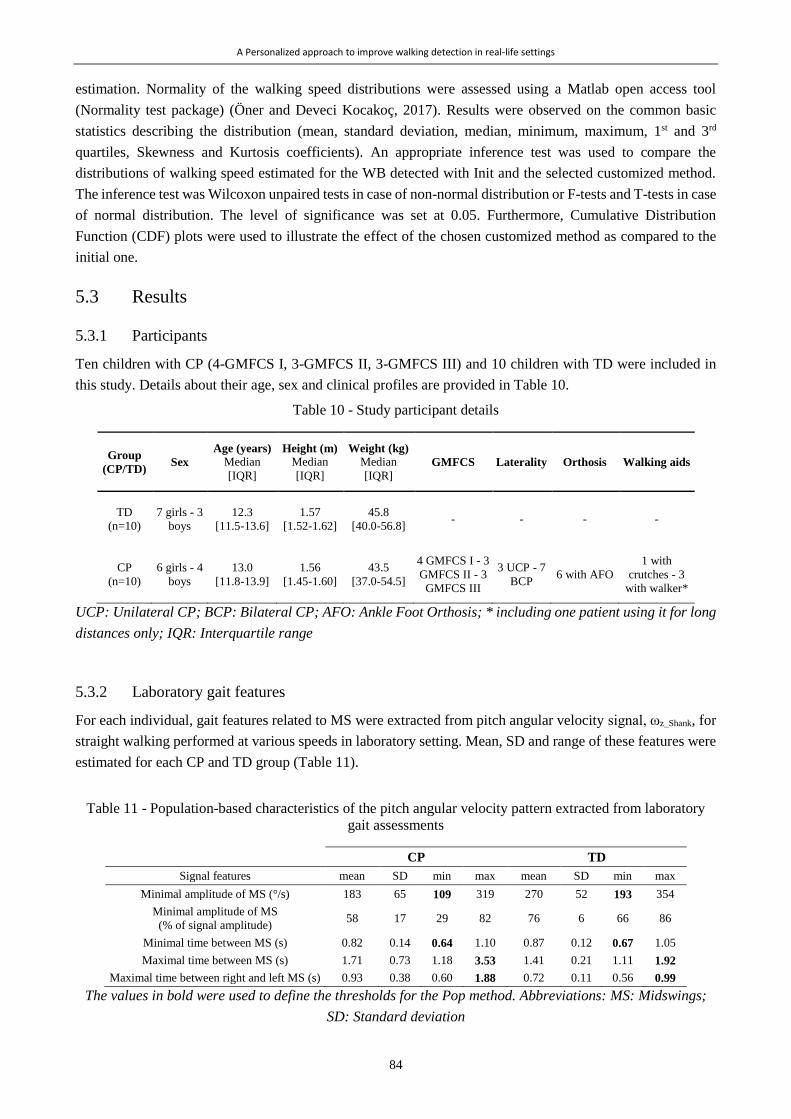
A Personalized approach to improve walking detection in real-life settings
84
estimation. Normality of the walking speed distributions were assessed using a Matlab open access tool
(Normality test package) (Öner and Deveci Kocakoç, 2017). Results were observed on the common basic
statistics describing the distribution (mean, standard deviation, median, minimum, maximum, 1st and 3rd
quartiles, Skewness and Kurtosis coefficients). An appropriate inference test was used to compare the
distributions of walking speed estimated for the WB detected with Init and the selected customized method.
The inference test was Wilcoxon unpaired tests in case of non-normal distribution or F-tests and T-tests in case
of normal distribution. The level of significance was set at 0.05. Furthermore, Cumulative Distribution
Function (CDF) plots were used to illustrate the effect of the chosen customized method as compared to the
initial one.
5.3 Results
5.3.1 Participants
Ten children with CP (4-GMFCS I, 3-GMFCS II, 3-GMFCS III) and 10 children with TD were included in
this study. Details about their age, sex and clinical profiles are provided in Table 10.
Table 10 - Study participant details
Group
(CP/TD) Sex
Age (years)
Median
[IQR]
Height (m)
Median
[IQR]
Weight (kg)
Median
[IQR] GMFCS Laterality Orthosis Walking aids
TD
(n=10)
7 girls - 3
boys
12.3
[11.5-13.6]
1.57
[1.52-1.62]
45.8
[40.0-56.8] - - - -
CP
(n=10)
6 girls - 4
boys
13.0
[11.8-13.9]
1.56
[1.45-1.60]
43.5
[37.0-54.5]
4 GMFCS I - 3
GMFCS II - 3
GMFCS III
3 UCP - 7
BCP 6 with AFO
1 with
crutches - 3
with walker*
UCP: Unilateral CP; BCP: Bilateral CP; AFO: Ankle Foot Orthosis; * including one patient using it for long
distances only; IQR: Interquartile range
5.3.2 Laboratory gait features
For each individual, gait features related to MS were extracted from pitch angular velocity signal, ωz_Shank, for
straight walking performed at various speeds in laboratory setting. Mean, SD and range of these features were
estimated for each CP and TD group (Table 11).
Table 11 - Population-based characteristics of the pitch angular velocity pattern extracted from laboratory
gait assessments
CP TD
Signal features mean SD min max mean SD min max
Minimal amplitude of MS (°/s) 183 65 109 319 270 52 193 354
Minimal amplitude of MS
(% of signal amplitude) 58 17 29 82 76 6 66 86
Minimal time between MS (s) 0.82 0.14 0.64 1.10 0.87 0.12 0.67 1.05
Maximal time between MS (s) 1.71 0.73 1.18 3.53 1.41 0.21 1.11 1.92
Maximal time between right and left MS (s) 0.93 0.38 0.60 1.88 0.72 0.11 0.56 0.99
The values in bold were used to define the thresholds for the Pop method. Abbreviations: MS: Midswings;
SD: Standard deviation

A Personalized approach to improve walking detection in real-life settings
85
5.3.3 WB detection
Estimated sensitivity, specificity, accuracy and precision for WB detection using each method are indicated
inTable 12. The method Init had maximum sensitivity (1.00), indicating that all actual WBs were detected by
the algorithm. This was also the case for the customized methods with sensitivity values of 1.00 and 0.98 for
Pop and Indiv, respectively. Specificity, accuracy and precision values were lower than the sensitivity for the
method Init which means that some of the detected WB did not correspond to real WB. These performance
metrics increased with method Pop, and even more with the method Indiv, for both groups and for the whole
study population (Table 12, next page).

A Personalized approach to improve walking detection in real-life settings
86
Tab
le 1
2 -
Sen
siti
vit
y, sp
ecif
icit
y, ac
cura
cy a
nd p
reci
sion o
f w
alkin
g b
outs
det
ecti
on f
or
each
met
ho
d (
bas
ed o
n t
he
algo
rith
m d
evel
op
ed b
y S
alar
ian
et
al.
wit
h f
ixed
th
resh
old
s—In
it, w
ith
po
pula
tion
-bas
ed c
ust
om
ized
thre
shold
s—P
op, an
d w
ith i
ndiv
idu
al-b
ased
per
son
aliz
ed t
hre
shold
s—In
div
), f
or
each
gro
up a
nd a
ll t
he
par
tici
pan
ts
Valu
es a
re p
rese
nte
d a
s m
edia
ns
[Inte
rquart
ile
range]
.

A Personalized approach to improve walking detection in real-life settings
87
The most important improvement was observed for specificity, indicating that Indiv, provided better results
for detection of true negatives, as illustrated in Figure 37.
On the reference, orange strips correspond to straight, regular and flat-surface walking and yellow strips
correspond to other type of walking such as slower, faster, on stones, on grass, on inclined-surfaces, along a
curved trajectory. Green strips correspond to non-walking activities such as climbing or descending stairs,
jumping, playing on the swings, running or playing around. The values of sensitivity (‘sens’), specificity
(‘spec’), accuracy (‘acc’) and precision (‘prec’) are reported for each method. The gray strips corresponding
to the detected walking bouts and the shank angular velocity signals with marks on detected midswing instants
are presented superposed.
Figure 37 - Example of walking bouts detection for one patient with CP by the three methods (Init, Pop and
Indiv) in comparison with the reference
In the illustrative example shown in Figure 37, the activity recorded between 650s and 750s, classified as
‘other activity’ on the reference video (green color), corresponded to playing on swings. The three methods
detected MS during this activity because the amplitude of peaks was higher than the defined thresholds (Th1).
However, unlike Init and Pop, the method Indiv managed to exclude most of these false positive WB, thanks
to the adapted temporal thresholds between MSs.
5.3.4 Walking speed estimation
Since Indiv showed better performances for WB detection, this method was compared with the method Init
regarding the walking speed distribution. The basic statistics describing the distribution are reported
comparatively for the two methods and each participant in Table 13. Four illustrative examples of the
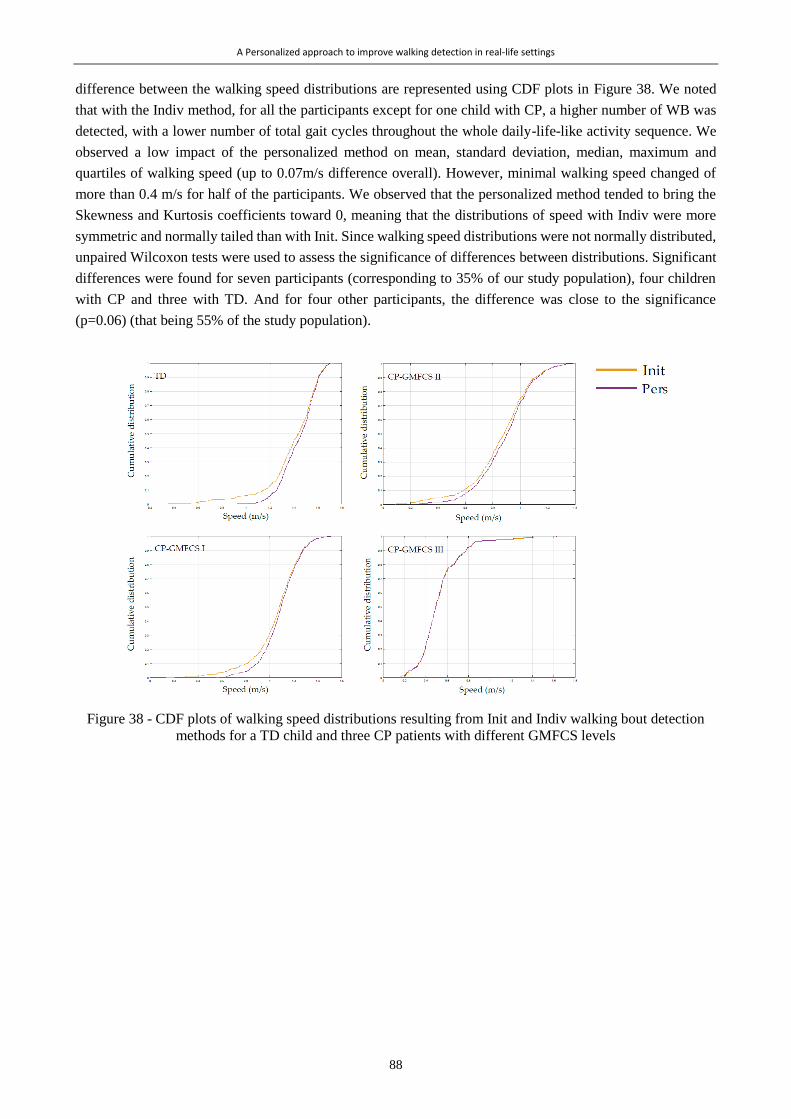
A Personalized approach to improve walking detection in real-life settings
88
difference between the walking speed distributions are represented using CDF plots in Figure 38. We noted
that with the Indiv method, for all the participants except for one child with CP, a higher number of WB was
detected, with a lower number of total gait cycles throughout the whole daily-life-like activity sequence. We
observed a low impact of the personalized method on mean, standard deviation, median, maximum and
quartiles of walking speed (up to 0.07m/s difference overall). However, minimal walking speed changed of
more than 0.4 m/s for half of the participants. We observed that the personalized method tended to bring the
Skewness and Kurtosis coefficients toward 0, meaning that the distributions of speed with Indiv were more
symmetric and normally tailed than with Init. Since walking speed distributions were not normally distributed,
unpaired Wilcoxon tests were used to assess the significance of differences between distributions. Significant
differences were found for seven participants (corresponding to 35% of our study population), four children
with CP and three with TD. And for four other participants, the difference was close to the significance
(p=0.06) (that being 55% of the study population).
Figure 38 - CDF plots of walking speed distributions resulting from Init and Indiv walking bout detection
methods for a TD child and three CP patients with different GMFCS levels
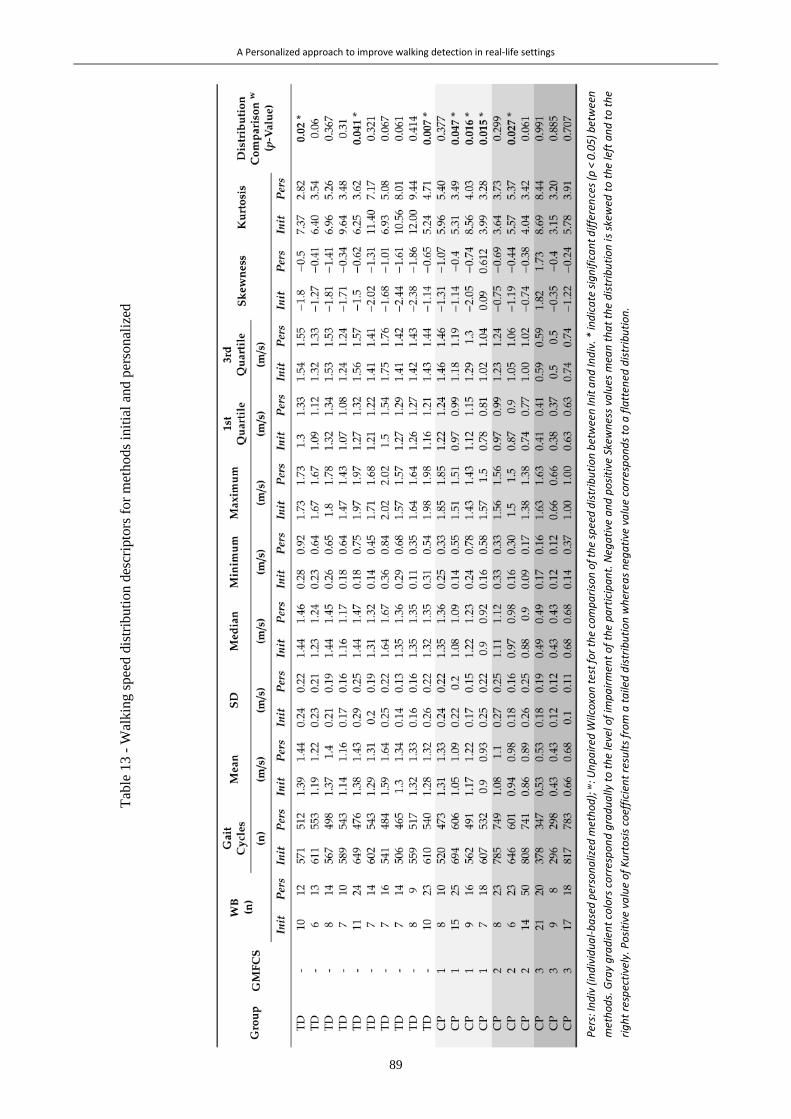
A Personalized approach to improve walking detection in real-life settings
89
Per
s: In
div
(in
div
idu
al-
ba
sed
per
son
aliz
ed m
eth
od
); w
: Un
pa
ired
Wilc
oxo
n t
est
for
the
com
pa
riso
n o
f th
e sp
eed
dis
trib
uti
on
bet
wee
n In
it a
nd
Ind
iv. *
ind
ica
te s
ign
ific
an
t d
iffe
ren
ces
(p <
0.0
5)
bet
wee
n
met
ho
ds.
Gra
y g
rad
ien
t co
lors
co
rres
po
nd
gra
du
ally
to
th
e le
vel o
f im
pa
irm
ent
of
the
pa
rtic
ipa
nt.
Neg
ati
ve a
nd
po
siti
ve S
kew
nes
s va
lues
mea
n t
ha
t th
e d
istr
ibu
tio
n i
s sk
ewed
to
th
e le
ft a
nd
to
th
e
rig
ht
resp
ecti
vely
. Po
siti
ve v
alu
e o
f K
urt
osi
s co
effi
cien
t re
sult
s fr
om
a t
aile
d d
istr
ibu
tio
n w
her
ea
s n
ega
tive
va
lue
corr
esp
on
ds
to a
fla
tten
ed d
istr
ibu
tio
n.
Tab
le 1
3 -
Wal
kin
g s
pee
d d
istr
ibuti
on d
escr
ipto
rs f
or
met
hods
init
ial
and
per
son
aliz
ed

A Personalized approach to improve walking detection in real-life settings
90
5.4 Discussion
This study aimed to evaluate if customized thresholds associated with methods using wearable inertial sensors
can improve gait detection for children with or without CP. The main findings were that while both methods
(Pop and Indiv) improved WB detection, Indiv provided best performance particularly in the detection of true
negatives. Additionally, the clinical impact of such an improvement was investigated with the walking speed
distribution over a 20-minutes sequence of daily-life-like activities. The results showed that the proposed
individual-based personalized method had an effect on the distribution of walking speed for 35% of the
participants. These findings could therefore meet clinicians since trustworthy data about the patient’s
performances in daily life is required for therapeutic decisions.
The fixed thresholds of the initial method used in this study were designed and validated in laboratory settings
for elderly people suffering from PD (Salarian et al., 2004). Two main reasons motivated us to evaluate the
potential efficiency of new, more adaptive thresholds. First, children with CP demonstrate gait patterns that
are much more unusual and heterogeneous than PD patients (Armand et al., 2016) and this was shown to be a
criterion for decreasing performances of WB detection algorithms based on peak identification (Bertuletti et
al., 2019; Muñoz-Organero et al., 2017). The second was the assessment environment which did not represent
a daily-life situation. Wearable inertial sensors are meant to be used in daily-life environments where gait
variability is higher (Tamburini et al., 2018). Thus, validation of the system for the population of children with
CP in out-of-laboratory settings was required.
The proposed personalized method increased the number of detected WB as compared to the initial method
(Table 13) since it cuts long WB detected by the Init method into several shorter ones, excluding hesitations
and turnings. Furthermore, non-walking activities were more likely to be excluded from the analysis with the
individual-based personalized method since the signal pattern (amplitude and/or timing of MS) was different
from those of real gait trials. While high sensitivity is decisive to detect all WBs and to quantify the daily
ambulatory activity, high specificity is necessary for effective qualification of gait impairments, i.e. computing
relevant gait parameters. For example, walking cadence can be the forefront parameter for an individualized
intervention in a natural environment (Slaght et al., 2017). In this case, estimated cadence should effectively
correspond to actual walking cadence, and not to running or stair climbing cadence, to avoid misinterpretations
(Sanjay K. Prajapati et al., 2011). The customized methods allowed us to improve the specificity while keeping
high sensitivity; therefore, we can conclude that the system is relevant for both, assessment of physical
behavior (e.g. WB duration, distribution and frequency) and gait impairment analysis (e.g. speed, cadence,
stride length). Consequently, a positive impact on the reliability of single-day physical activity and walking
performance, previously reported by Gerber et al. (Gerber et al., 2019), could be expected. However, it is worth
mentioning that to assess other aspect of gait such as endurance, continuous WBs including turnings and/or
short breaks may be of interest. Since our proposed methods broke these WBs into many shorter WBs, gait
endurance may be underestimated (Del Din et al., 2016b).
The method using thresholds customized at the population level (Pop) proved to be less specific and accurate
than the personalization at the individual level (Indiv) (Table 12). This can be explained by the inter-subject
variability in both groups, but especially in the group of children with CP. These results emphasized the
relevance to consider not only the populations but the individuals to reach better performance of walking
detection.
The distribution of computed gait parameters should be different if some false WB were excluded. This was
mainly observed for the minimal walking speeds for most of participants, and actually half of them had more
than 0.40m/s difference. This can have a significant impact on the interpretations since the minimal clinically
important difference regarding walking speed in CP is reported to be 0.10m/s (Moreau et al., 2016).
A Personalized approach to improve walking detection in real-life settings
91
Furthermore, we previously found that the minimal detectable changes comparing walking speed estimation
during two days of daily life in children with CP and TD were less than 0.22m/s (Gerber et al., 2019), meaning
that a change of 0.40m/s would have a clinical impact for a real life assessment. Unexpectedly, the customized
methods were effective not only for children with CP but also for children with TD (Table 12). As far as the
three patients with GMFCS III level are concerned, no significant difference was observed in walking speed
distributions (Table 13), which may be explained by the fact that they chose to stay sitting on a bench during
the ‘free activity of their choice’ because of the fatigue induced by the protocol’s activities. Indeed, the
participants who benefitted the most from the customization of the method were those who performed
unexpected activities during the ‘free activity of their choice’ part of the out-of-laboratory sequence such as
playing on the swings. We expect that the differences might be more important for long-term real-life
measurements, since the children would perform much more of these unanticipated activities (e.g. cycling,
skating, horse-riding, skiing). Additionally, the impact on other gait parameters was not tested in this study but
a greater difference could be expected especially for the knee range of motion since the knees flex and extend
more during swinging on the swings than during walking.
The basic idea of customization proposed in this study was to fine-tune real-life gait analysis algorithm for an
individual or a group of subjects by specific gait data obtained in laboratory from the same individual or group.
This approach may be applied to many other situations where wearable systems are used to analyze abnormal
gait or monitor activities such as postural transitions (sit-stand, stand-sit) in real-world situations, provided
that the algorithm relies on specific signal features previously characterized in the laboratory controlled
situation. Actually, in many situations, patients come to clinics for diagnosis, evaluations, regular checkups
and/or therapy. These visits constitute good opportunities to record a few gait trials along a straight corridor
path using inertial sensors and/or other instrument such as a camera or instrumented walkway, from which
personalized thresholds or parameters of interest can be defined.
Many machine learning methods have been implemented for activity recognition or gait event detection and
have shown good classification accuracy in (mostly healthy) adults (Attal et al., 2015; Caldas et al., 2017).
Recently, a data-driven method for foot contact events was developed in children with various pathologies,
including CP, and concluded that the accuracy of their approach was sufficient for most clinical and research
applications in the pediatric population (Kidzińskiid et al., 2019). Ahmadi et al. also found acceptable accuracy
for walking detection in children with a low level of CP using Random forest, support vector machine, and
binary decision tree classifiers (between 90.3 and 96.5% in average) (Ahmadi et al., 2018). The accuracy
achieved with the customized methods was within Ahmadi et al.’s range (90% for Pop and 95% for Indiv).
The advantage of the method proposed in our study, with regard to the Ahmadi et al.’s method, is its
personalization at the individual basis, thus its generalization to all type of pathologies. In addition, a notable
strength of the individualization of the method through individual-based thresholds is the side independency.
Indeed, in a population of unilaterally affected patients, distinguishing the more and less affected sides is
relevant since the gait patterns can differ (Anwary et al., 2018a).
Although in this study the amplitude and timing of MS were the only values considered from the laboratory
trials to tune the customized methods, the current findings underlined the potential for further, more
sophisticated adaptive algorithms. Several additional characteristics, like the shape, amplitude or frequency of
the signal, could be examined to further improve the customization. The signal pattern of the whole gait cycle
could be used to detect gait cycles within long term monitoring by correlation (Oudre et al., 2018). Filtering
often results in attenuation of the sharpness of specific signal features (Paraschiv-Ionescu et al., 2004) so, in
some cases, it can mask the information of interest. Personalized filters can improve gait event detection
(Anisoara Paraschiv-Ionescu et al., 2019), especially in the CP population whose gait patterns can be noisy
due to spastic movements, or drag feet (Armand et al., 2016). Moreover, the proposed approach was designed
A Personalized approach to improve walking detection in real-life settings
92
for WB detection based on peak identification as proposed in the initial method (Salarian et al., 2004). Other
methods could have been explored to adapt thresholds such as a moving window computing the root mean
square (RMS) or the coefficient of variation of the signal to detect changes of signal amplitude (Kheirkhahan
et al., 2017). Furthermore, a personalized approach has recently been proposed in a healthy population (30
young adults) using the signal itself to extract features (periodicity, energy, posture, etc.) to tune a step length
model (online learning) (Soltani et al., 2019). This could be a relevant solution to test, to avoid the in-laboratory
phase that we proposed for feature extraction. Indeed, good correlation was found between cadence and Th2,
Th3 and Th4 (5.6 Supplementary information, Figure 39). Instantaneous cadence roughly estimated by a
method such as Fast Fourier Transform could thus directly determine the personalized thresholds, without any
prior in-laboratory phase. Further work comparing the performance of such methods with the proposed
personalized method should be undertaken.
The main limitation of this study was the modest sample size and the results should be confirmed with a larger
population. Regarding the method, several limitations can be mentioned. The thresholds for both customized
methods were defined to be as inclusive as possible since they corresponded to the extreme values of the
overall supervised gait cycles at several walking speeds. First, various percentages of these extreme values
could have been tested to determine if our choice was optimal. Second, we did not evaluate the repeatability
of the definition of these thresholds even though intra and inter-day variability of gait exists, especially in
patients with neurological disease. A future repeatability study could emphasize the performance of our
approach. Next, the amplitude of the angular velocity peaks highly depends on the sensor alignment. The
principle of axis alignment using PCA relies on the assumption that the principal axis of movement is the
medio-lateral axis (sagittal plane). However, in children with CP with a high level of disability (GMFCS III),
frontal and transverse components can be higher than normal, which may weaken the assumption for PCA
alignment. In our case, the sensors were not removed between laboratory and out-of-laboratory assessments.
However, since in real life the sensors may move among days, particular attention must be paid to the axis
alignment. Finally, the interpretation of ‘spontaneous’, ‘slow’ and ‘fast’ walking may differ according to the
participant and can lead to limited range of speed change, in laboratory trials, necessary to threshold fine-
tuning and therefore decrease the performance of WB detection in real-life measurement settings.
5.5 Conclusions
Three methods of gait detection using inertial sensors were compared; the first with fixed thresholds (Salarian
et al., 2004), the second with population-based (CP-TD) thresholds, and the third with individual-based
personalized thresholds. The third method was found to better improve WB detection, especially by excluding
non-walking activities that were wrongly interpreted as extremely slow walking by the initial method. These
findings are particularly relevant for real-life gait assessments to get a true representation of the patients’
performances. As far as the patient has the possibility to perform a quick in-laboratory or in-clinic gait
measurement, the proposed approach is simple to set up, simple to implement and not specific to a pathology.
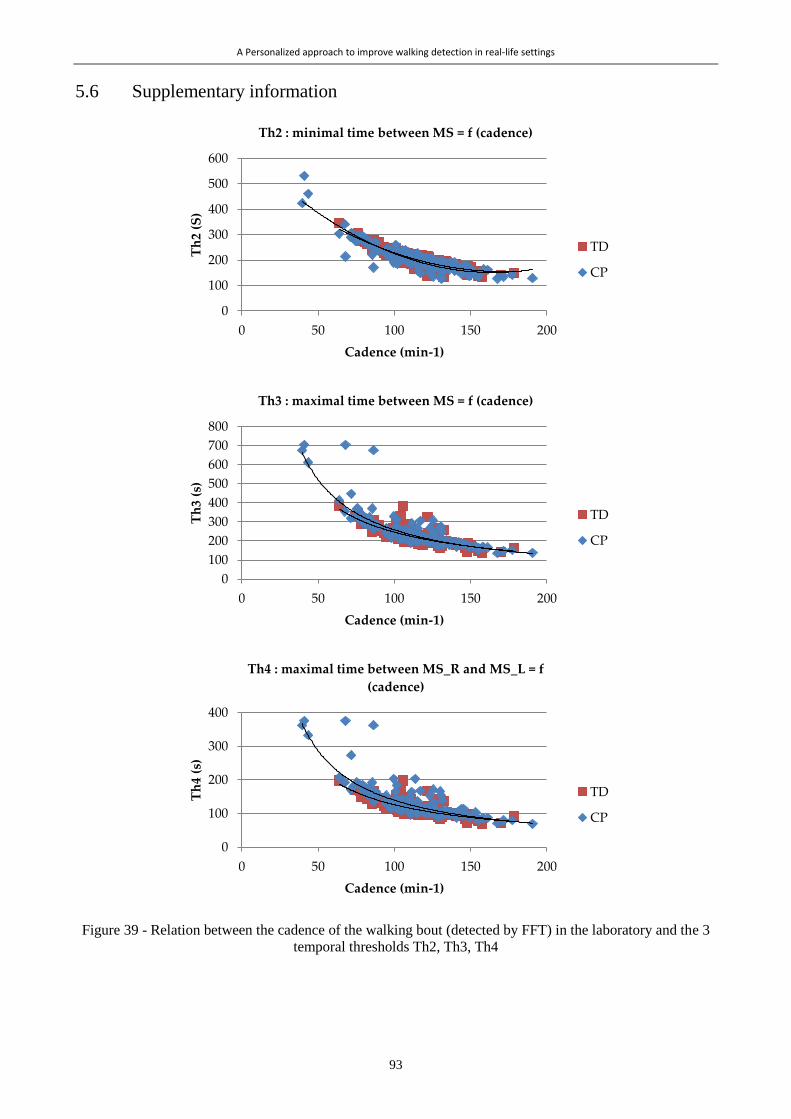
A Personalized approach to improve walking detection in real-life settings
93
5.6 Supplementary information
Figure 39 - Relation between the cadence of the walking bout (detected by FFT) in the laboratory and the 3
temporal thresholds Th2, Th3, Th4
0
100
200
300
400
500
600
0 50 100 150 200
Th
2 (S
)
Cadence (min-1)
Th2 : minimal time between MS = f (cadence)
TD
CP
0
100
200
300
400
500
600
700
800
0 50 100 150 200
Th
3 (s
)
Cadence (min-1)
Th3 : maximal time between MS = f (cadence)
TD
CP
0
100
200
300
400
0 50 100 150 200
Th
4 (s
)
Cadence (min-1)
Th4 : maximal time between MS_R and MS_L = f
(cadence)
TD
CP

94
95
CLINICAL STUDIES
Part III
IIIIII

96
This clinical part presents the three observational studies conducted to address our second specific objective
which is: to compare gait parameters between standardized and unsupervised walking, in order to objectively
quantify the differences between gait capacity and performance, and to examine the divergences between
children with CP and children with TD. Three corresponding chapters are presented.
The first (Chapter 6) deals with the comparison between standardized gait and challenging gait under dual
tasks, assessed in laboratory. The question addressed was:
How different are gait characteristics under dual tasks as compared to spontaneous walking in the laboratory?
The second (Chapter 7) presents the comparison between supervised and unsupervised gait, on the basis of a
unique metric: the walking speed. The question addressed was:
To what extend spontaneous walking speed in the laboratory is representative of daily-life walking speed?
In this case, all gait episodes in real life, detected by the individual-based personalization method, were
included to represent an overview of the patient’s walking habits.
The third (Chapter 8) presents the comparison between supervised and unsupervised gait, focusing on multiple
features of the gait function. Gait function is described by multiple gait characteristics belonging to various
gait domains (pace, rhythm, variability, symmetry, amplitude, stability, smoothness and coordination) and
compared between laboratory and daily life settings. The question addressed was:
Are gait characteristics assessed in daily life different from, and associated to, gait characteristics assessed
in the laboratory?
Only gait episodes, detected by the individual-based personalization method, reflecting the laboratory
constraint, i.e. with a travelled distance similar to the laboratory walkway length, were included in this analysis.
A direct comparison between the results in Chapter 6 and the results in Chapters 7 and 8 was not possible since
different groups of children were involved. However, this is discussed in the final Chapter of this thesis (Part
IV).
97
Chapter 6 *
Comparison between standardized gait and gait under challenging dual
task conditions
Abstract
This study aimed to assess the gait and cognitive performances of children with cerebral palsy (CP) during
dual tasks (DT) in comparison to typically developing (TD) children.
Method: This prospective, observational, case-control study included 18 children with CP (7 girls, 11 boys;
median age 12 [10:13] years and 19 controls (9 girls, 10 boys; median age 12 [10:13y6mo] years).
Performances were recorded during a simple walking task, 5 DT (walking+cognitive tasks with increasing
cognitive load), and 5 simple cognitive tasks (while sitting). Gait parameters were computed using an
optoelectronic system during walking tasks. Six parameters were selected for analysis by a principal
component analysis. Cognitive performance was measured for each cognitive task. The dual-task cost (DTC)
was calculated for each DT.
Results: Gait performance decreased in both groups as DT cognitive load increased (e.g., walking speed
normalized by leg length, in simple task: 1.25 [1.15:1.46] s-1 for CP, 1.53 [1.38:1.62] s-1 for TD; DT with
highest load: 0.64 [0.53:0.80] s-1 for CP, 0.95 [0.75:1.08] s-1 for TD). The CP group performed significantly
worse than TD group in every task (including the simple task), but DTC were similar in both groups. A task
effect was found for the majority of the gait parameters.
Interpretation: The reduced gait performance induced by DT may generate underestimated difficulties for
children with CP in daily-life situations, where DT are common. This should be considered in clinical
assessments.
* Chapter published as:
Carcreff L., Fluss J., Allali G., Valenza N., Aminian K., Newman C.J., Armand S.;. 2019. “The effects of dual tasks on
gait in children with cerebral palsy” Gait and Posture, 2019, vol. 70, p.148-155. doi: 10.1016/j.gaitpost.2006.11.014 –
with permissions of all co-authors.
My contributions: Methodology, recruitement, investigation, software, data curation, visualization, formal analysis,
writing – original draft, writing-review & editing
Comparison between standardized gait and gait under challenging dual task conditions
98
6.1 Introduction
Cerebral palsy (CP) is the most frequent motor disability in childhood, affecting 1.8:1000 births in Europe
(Sellier et al., 2016). CP affects motor control and frequently cognitive functions. Up to 65% of children with
CP have executive, visuospatial, and attention deficits as well as learning disabilities (Sumnima and
Jayashankar Reddy, 2013). These impairments, combined with motor limitations, can lead to increased
difficulties in circumstances where cognitive and motor tasks are performed simultaneously (Schaefer, 2014),
since both tasks compete for the brain’s resources (Tramontano et al., 2016). While motor assessments are
largely used to guide therapeutic decisions, cognitive-motor interferences are rarely taken into account.
The dual task (DT) paradigm - performing a motor task and a cognitive task simultaneously - has been widely
used to study cognitive–motor interferences (Al-Yahya et al., 2011; Woollacott and Shumway-Cooke, 2002).
DT protocols have been used to investigate the risk of falls among older adults (Lundin-Olsson et al., 1997)
and patients with neurological disorders, such as Alzheimer’s disease or multiple sclerosis (Allali et al., 2014;
Maquet et al., 2010). They have rarely been studied in pediatric populations. DT assessments are appropriate
to investigate the automaticity of motor control in children with and without developmental disorders
(Houwink et al., 2011; Huang et al., 2003; Hung and Meredith, 2014; Manicolo et al., 2017). The underlying
concept is that when a motor task is adequately learned the dedicated attentional resources are low, which
allows a second task to be executed concurrently (Houwink et al., 2011). In children with CP, few studies have
assessed performances during DT despite the fact that they might be relevant to understand their difficulties in
daily life. Reilly et al. showed an increase of body sway in children with CP during a DT in standing, greater
than in TD children (Reilly et al., 2008). Three studies concluded that a DT induces a decrease in walking
speed in small samples of children with CP (≤15) (Hung and Meredith, 2014; Katz-Leurer et al., 2014;
Tramontano et al., 2016). Step length, step time, and their variability changed significantly under two DT
(number memorization and sound recognition) in comparison to a simple walking task (Katz-Leurer et al.,
2014). The common limitations reported by the authors concerned the baseline differences between groups
and the degree of cognitive demand, unadjusted to the simple task abilities of the participants (Katz-Leurer et
al., 2014). The dual-task cost (DTC), which expresses change between the simple task and the DT (Kelly et
al., 2010; Schaefer, 2014), is used to overcome this limitation. Considering the small sample sizes and
heterogeneity of motor and cognitive tasks in previous studies, further exploration of the impact of DT in
children with CP is essential. This could improve the understanding of their everyday-life difficulties (Reilly
et al., 2008) leading to improvements of therapeutic strategies (Elhinidi et al., 2016).
Although walking speed is the first-line parameter to describe an individual’s overall gait performance (Al-
Yahya et al., 2011), it does not describe gait completely (Thingstad et al., 2015). Children with CP are also
affected by problems of gait symmetry, regularity, stability, and coordination (Tugui and Antonescu, 2013),
thus complementary parameters should be used to evaluate gait in this population. Pace, rhythm, asymmetry,
variability, and postural control have previously been identified as five independent domains relevant for
describing gait in the elderly (Lord et al., 2013) and adults with hip fracture (Thingstad et al., 2015). These
domains are relevant to characterize the effects of DTs in children with CP.
This study aimed to assess the effects of DTs (using increasing cognitive loads) on gait and cognitive
parameters in children with CP compared with TD controls. We hypothesized that 1) the performances of both
groups would decrease under DT conditions, and 2) children with CP would experience a greater decrease due
to motor and cognitive impairments resulting in higher DTCs.

Comparison between standardized gait and gait under challenging dual task conditions
99
6.2 Method
6.2.1 Participants
This prospective, observational, case-control study included 18 children diagnosed with CP followed in a
pediatric neuro-orthopedic clinic of a tertiary hospital. Eligibility criteria were: 1) age 8–16 years old, 2) ability
to walk 50 meters without mechanical walking aids (canes, tripods, walker) and/or orthoses, 3) Gross Motor
Function Classification System (GMFCS) level I or II (Palisano et al., 1997), and 4) regular school curriculum.
Twenty controls with equivalent ages and sex proportions, recruited via hospital employees and patients’
acquaintances, were also included. Participants were excluded in cases of borderline or low intellectual ability
(IQ<80) and/or behavioral symptoms which might affect participation in the protocol. No exclusion criteria
were specified regarding treatments, but none of the children had surgery or botulinum toxin injections during
the year prior to the assessment. Informed consent was obtained from each participant and their parents. The
hospital’s institutional ethics committee approved the study protocol (CCER-15-203).
6.2.2 Protocol
Each participant was evaluated once in the hospital’s motion analysis laboratory. Participants were asked to
walk along a straight 10-meter walkway (simple motor task: SmT) and then to repeat this while performing
five successive cognitive tasks, thus creating DT. Each task was performed once to avoid any anticipation
effect of the DT (Ewolds et al., 2017). After a short rest, participants were asked to sit comfortably on a chair
with armrests and a backrest and to perform the same cognitive tasks in the time taken to perform that task
while walking 10 meters (simple cognitive tasks: ScT). Figure 40 illustrates the experimental protocol.
Figure 40 - Experimental protocol including the simple motor task (SmT), the dual tasks (DT), and the sim-
ple cognitive tasks (ScT)
The cognitive tasks were: counting forward from zero (‘Forward’), counting backward from 50 (‘Backward’),
enumerating animal names (‘Animals’), enumerating fruit names (‘Fruits’), and alternatively enumerating
animal and fruit names (‘Animals/Fruits’). These tasks were selected as they were of short duration and could
be performed orally (out loud), while walking and sitting, close to natural conditions. The tasks’ level of
complexity was considered to increase with the required attentional load, as follows:
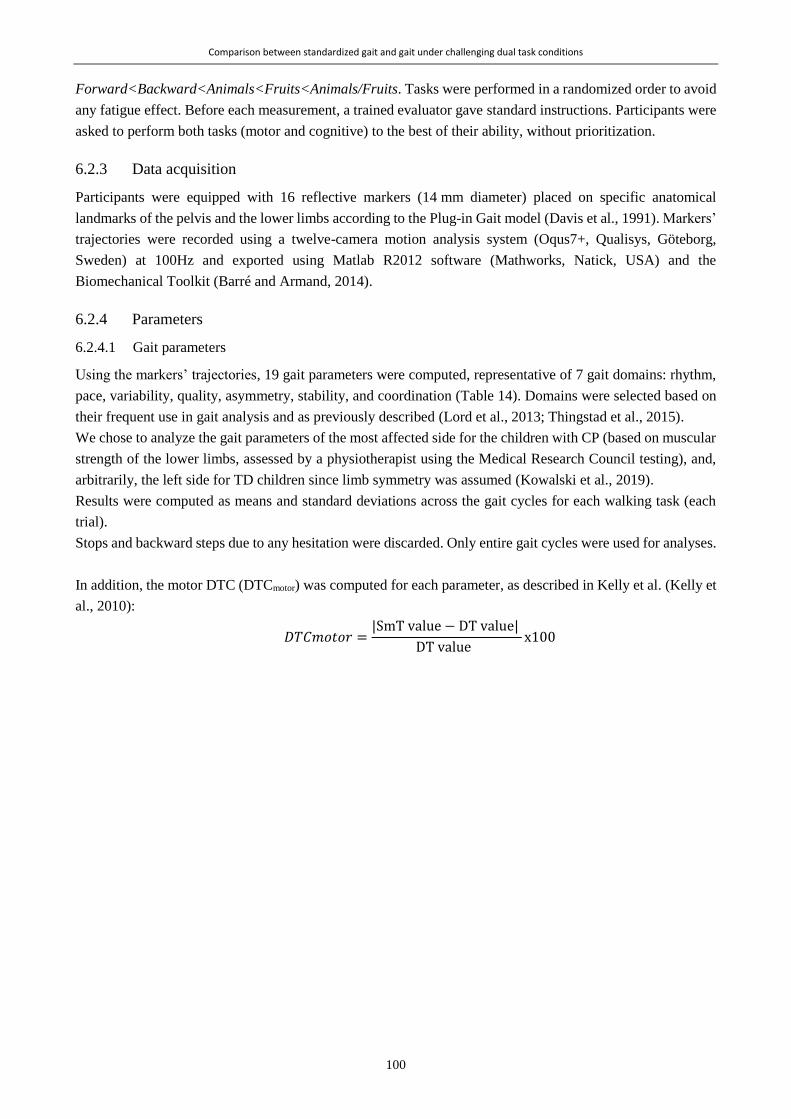
Comparison between standardized gait and gait under challenging dual task conditions
100
Forward<Backward<Animals<Fruits<Animals/Fruits. Tasks were performed in a randomized order to avoid
any fatigue effect. Before each measurement, a trained evaluator gave standard instructions. Participants were
asked to perform both tasks (motor and cognitive) to the best of their ability, without prioritization.
6.2.3 Data acquisition
Participants were equipped with 16 reflective markers (14 mm diameter) placed on specific anatomical
landmarks of the pelvis and the lower limbs according to the Plug-in Gait model (Davis et al., 1991). Markers’
trajectories were recorded using a twelve-camera motion analysis system (Oqus7+, Qualisys, Göteborg,
Sweden) at 100Hz and exported using Matlab R2012 software (Mathworks, Natick, USA) and the
Biomechanical Toolkit (Barré and Armand, 2014).
6.2.4 Parameters
6.2.4.1 Gait parameters
Using the markers’ trajectories, 19 gait parameters were computed, representative of 7 gait domains: rhythm,
pace, variability, quality, asymmetry, stability, and coordination (Table 14). Domains were selected based on
their frequent use in gait analysis and as previously described (Lord et al., 2013; Thingstad et al., 2015).
We chose to analyze the gait parameters of the most affected side for the children with CP (based on muscular
strength of the lower limbs, assessed by a physiotherapist using the Medical Research Council testing), and,
arbitrarily, the left side for TD children since limb symmetry was assumed (Kowalski et al., 2019).
Results were computed as means and standard deviations across the gait cycles for each walking task (each
trial).
Stops and backward steps due to any hesitation were discarded. Only entire gait cycles were used for analyses.
In addition, the motor DTC (DTCmotor) was computed for each parameter, as described in Kelly et al. (Kelly et
al., 2010):
𝐷𝑇𝐶𝑚𝑜𝑡𝑜𝑟 =|SmT value − DT value|
DT value x100

Comparison between standardized gait and gait under challenging dual task conditions
101
Table 14 - Gait domains, gait parameters, definitions, and units
Domain Parameter Definition Unit
Rhythm
Stride Time Time between 2 successive foot strikes s
Stance Duration Stance duration % of GC 1
Cadence Number of steps/min step.min-1
Pace
Stride Length Stride length normalized by leg length [-]
Step Length Step length normalized by leg length [-]
Walking Speed Walking speed normalized by leg length s-1
Variability
Gait SD
Kinematic variability based on 9 kinematic
waveforms: pelvic tilt, obliquity, and
rotation, hip flexion, abduction, and rotation,
knee flexion, ankle dorsiflexion, and foot
progression angle (Sangeux et al., 2016)
°
Stride-Time CV 2 Stride-time variability %
Stride-Length CV 2 Stride-length variability %
Quality
Pelvis ROM 3 Maximum–minimum pelvic obliquity °
Hip ROM 3 Maximum hip flexion–maximum hip
extension °
Knee ROM 3 Maximum knee flexion–maximum knee
extension °
Ankle ROM 3 Maximum dorsiflexion–maximum
plantarflexion °
Gait Profile Score
(GPS)
Index of overall kinematic deviation based
on 9 joint angles: pelvic tilt, obliquity, and
rotation, hip flexion, abduction, and rotation,
knee flexion, ankle dorsiflexion, and foot
progression angle (Baker et al., 2009)
°
Asymmetry
Step-Length
Asymmetry Index (AI)
100*(|left step length - right step length|)/
((left step length + right step length) * 0.5) %
Step-Time AI 100*(|left step time - right step time|)/ ((left
step time + right step time) * 0.5) %
Stability
Step Width Distance between heels normalized by pelvis
width at initial contact [-]
Heel Clearance
Maximum heel height during swing with
respect to minimum during stance (Begg et
al., 2007)
m
Coordination Walk Ratio Ratio step length/cadence (Sekiya and
Nagasaki, 1998) min.step-1
1 GC = Gait Cycle
2 CV = Coefficient of Variation
3 ROM = Range Of Motion
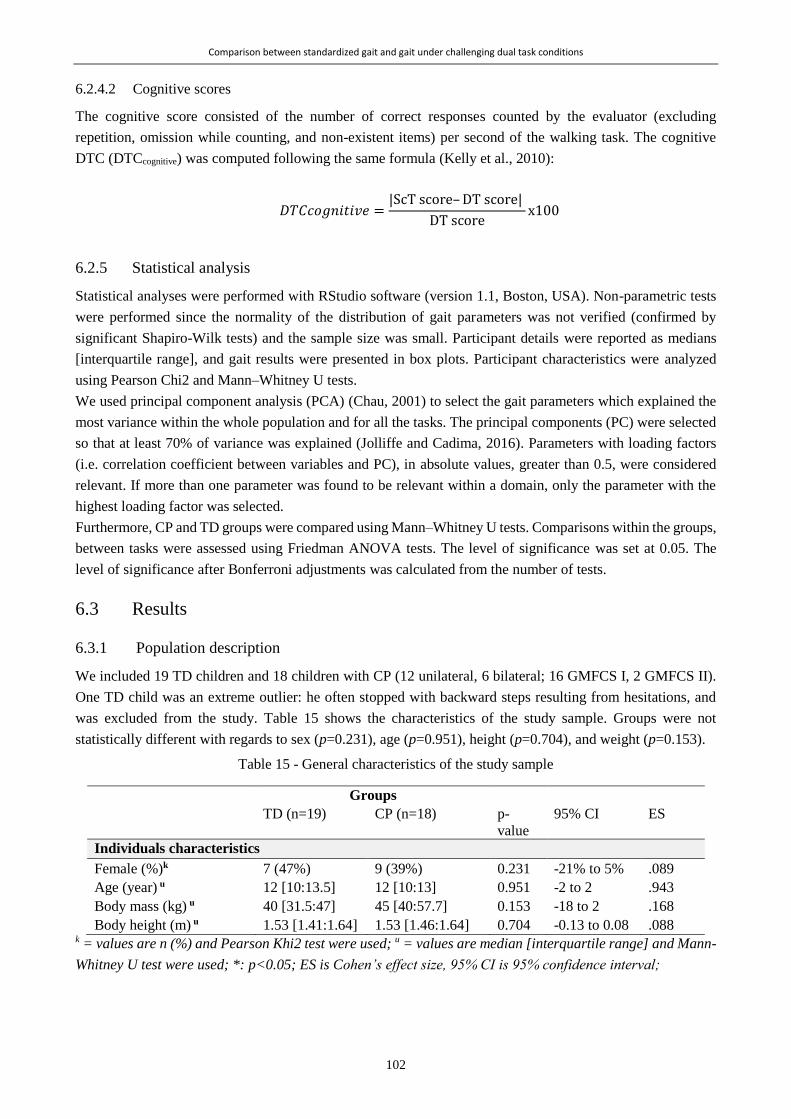
Comparison between standardized gait and gait under challenging dual task conditions
102
6.2.4.2 Cognitive scores
The cognitive score consisted of the number of correct responses counted by the evaluator (excluding
repetition, omission while counting, and non-existent items) per second of the walking task. The cognitive
DTC (DTCcognitive) was computed following the same formula (Kelly et al., 2010):
𝐷𝑇𝐶𝑐𝑜𝑔𝑛𝑖𝑡𝑖𝑣𝑒 =|ScT score– DT score|
DT scorex100
6.2.5 Statistical analysis
Statistical analyses were performed with RStudio software (version 1.1, Boston, USA). Non-parametric tests
were performed since the normality of the distribution of gait parameters was not verified (confirmed by
significant Shapiro-Wilk tests) and the sample size was small. Participant details were reported as medians
[interquartile range], and gait results were presented in box plots. Participant characteristics were analyzed
using Pearson Chi2 and Mann–Whitney U tests.
We used principal component analysis (PCA) (Chau, 2001) to select the gait parameters which explained the
most variance within the whole population and for all the tasks. The principal components (PC) were selected
so that at least 70% of variance was explained (Jolliffe and Cadima, 2016). Parameters with loading factors
(i.e. correlation coefficient between variables and PC), in absolute values, greater than 0.5, were considered
relevant. If more than one parameter was found to be relevant within a domain, only the parameter with the
highest loading factor was selected.
Furthermore, CP and TD groups were compared using Mann–Whitney U tests. Comparisons within the groups,
between tasks were assessed using Friedman ANOVA tests. The level of significance was set at 0.05. The
level of significance after Bonferroni adjustments was calculated from the number of tests.
6.3 Results
6.3.1 Population description
We included 19 TD children and 18 children with CP (12 unilateral, 6 bilateral; 16 GMFCS I, 2 GMFCS II).
One TD child was an extreme outlier: he often stopped with backward steps resulting from hesitations, and
was excluded from the study. Table 15 shows the characteristics of the study sample. Groups were not
statistically different with regards to sex (p=0.231), age (p=0.951), height (p=0.704), and weight (p=0.153).
Table 15 - General characteristics of the study sample
Groups
TD (n=19) CP (n=18) p-
value
95% CI ES
Individuals characteristics
Female (%)k 7 (47%) 9 (39%) 0.231 -21% to 5% .089
Age (year) u 12 [10:13.5] 12 [10:13] 0.951 -2 to 2 .943
Body mass (kg) u 40 [31.5:47] 45 [40:57.7] 0.153 -18 to 2 .168
Body height (m) u 1.53 [1.41:1.64] 1.53 [1.46:1.64] 0.704 -0.13 to 0.08 .088 k = values are n (%) and Pearson Khi2 test were used; u = values are median [interquartile range] and Mann-
Whitney U test were used; *: p<0.05; ES is Cohen’s effect size, 95% CI is 95% confidence interval;
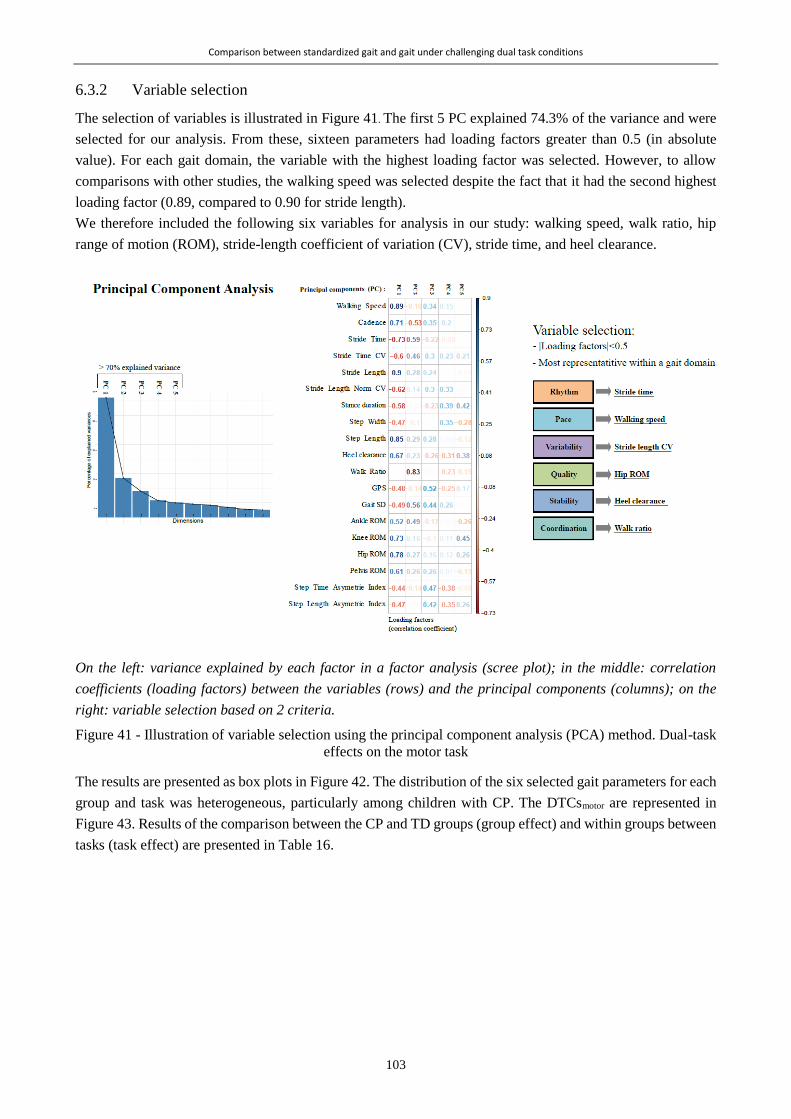
Comparison between standardized gait and gait under challenging dual task conditions
103
6.3.2 Variable selection
The selection of variables is illustrated in Figure 41. The first 5 PC explained 74.3% of the variance and were
selected for our analysis. From these, sixteen parameters had loading factors greater than 0.5 (in absolute
value). For each gait domain, the variable with the highest loading factor was selected. However, to allow
comparisons with other studies, the walking speed was selected despite the fact that it had the second highest
loading factor (0.89, compared to 0.90 for stride length).
We therefore included the following six variables for analysis in our study: walking speed, walk ratio, hip
range of motion (ROM), stride-length coefficient of variation (CV), stride time, and heel clearance.
On the left: variance explained by each factor in a factor analysis (scree plot); in the middle: correlation
coefficients (loading factors) between the variables (rows) and the principal components (columns); on the
right: variable selection based on 2 criteria.
Figure 41 - Illustration of variable selection using the principal component analysis (PCA) method. Dual-task
effects on the motor task
The results are presented as box plots in Figure 42. The distribution of the six selected gait parameters for each
group and task was heterogeneous, particularly among children with CP. The DTCsmotor are represented in
Figure 43. Results of the comparison between the CP and TD groups (group effect) and within groups between
tasks (task effect) are presented in Table 16.

Comparison between standardized gait and gait under challenging dual task conditions
104
* indicate significant differences (p<0.050) between groups,
Figure 42 - Gait parameter representation for each task (vertical facets: simple cognitive task (ScT) and dual tasks (DT))
and each group (cerebral palsy (CP), typically developing (TD))

Comparison between standardized gait and gait under challenging dual task conditions
105
* indicate significant differences (p<0.050) between groups, assessed by Mann-Whitney U test
Figure 43 - Dual task costs representation for each task (vertical facets: dual tasks (DT)) and each group (cerebral
palsy (CP), typically developing (TD))

Comparison between standardized gait and gait under challenging dual task conditions
106
Table 16 - Task effect and group effect results on gait parameters and motor dual-task costs (DTCmotor)
Group Simple Forward
counting
Backward
counting Animals Fruits
Animals/
fruits
Group effect
p-value between groups
Task effect p-value be-
tween tasks
Walking Speed TD
0.006 0.031 0.034 0.010 0.010 0.020 < 0.001
CP < 0.001
Walk Ratio TD
0.685 0.066 0.075 0.029 0.075 0.001 0.014
CP 0.061
Stride-Length CV TD
0.558 0.031 0.233 0.730 0.578 0.480 < 0.001
CP 0.014
Hip ROM TD
0.017 0.022 0.039 0.022 0.011 0.049 < 0.001
CP < 0.001
Stride Time TD
0.574 0.915 0.845 0.620 0.518 0.438 < 0.001
CP < 0.001
Heel Clearance TD
0.034 0.046 0.029 0.024 0.007 0.014 < 0.001
CP < 0.001
MOTOR DUAL TASK COSTS (DTCmotor):
Walking Speed
DTCmotor
TD / 0.313 0.940 0.374 0.343 0.199
< 0.001
CP < 0.001
Walk Ratio DTCmotor TD
/ 0.066 0.258 0.046 0.014 0.042 0.454
CP 0.272
Stride-Length CV
DTCmotor
TD / 0.730 0.671 1.000 0.578 0.584
0.032
CP 0.042
Hip ROM DTCmotor TD
/ 0.538 0.098 0.480 0.358 0.855 0.002
CP < 0.001
Stride-Time DTCmotor TD
/ 0.964 1.000 0.753 0.796 0.578 < 0.001
CP < 0.001
Heel Clearance
DTCmotor
TD / 0.213 0.869 0.284 0.105 0.538
< 0.001
CP < 0.001
Between-group p-values were obtained using Mann–Whitney U tests; between-task p-values were obtained
using Friedman ANOVA tests. Significant p-values (< 0.050) are presented in bold, and significant p-values
after Bonferroni correction (< 0.001 between groups, and < 0.004 between tasks) are presented in bold and
italic. CP and TD stand for cerebral palsy and typically developing, respectively.
6.3.2.1 Within-group comparisons: task effects
Decreasing gait performances were observed in both groups as the cognitive load of the tasks increased:
walking speed, heel clearance, and hip ROM decreased; walk ratio, stride-length CV, and stride time increased.
A significant task effect was found within both groups and for all parameters except the walk ratio in the CP
group. A significant difference between tasks was also found for the DTCmotor except for the walk ratio DTCmotor
in both groups.

Comparison between standardized gait and gait under challenging dual task conditions
107
6.3.2.2 Between-group comparisons: group effects
Children with CP walked with lower walking speed, heel clearance, and hip ROM, and higher walk ratio,
stride-length CV, and stride time than the TD children. For each task, including the simple tasks, the CP and
TD groups showed significant differences in walking speed, hip ROM and heel clearance. The walk-ratio was
significantly different between CP and TD groups in the DT-Animals and Animals/Fruits. The stride length
CV showed significant difference for the DT-Backward.
The CP and TD groups did not show any significant differences in their DTCmotor except for the walk ratio in
the 3 most difficult DT (Animals, Fruits, and Animals/Fruits).
6.3.3 Dual-task effects on cognitive performance
6.3.3.1 Within-group comparisons: task effects
A significant task effect was found in the TD group for Forward and Backward counting (p=0.02 and 0.04,
respectively): TD children enumerated more items in ScT than in DT. No task effects were found for the TD
group’s other tasks or for any of CP group’s tasks (p > 0.173).
6.3.3.2 Between-group comparisons: group effects
No group effects were found for Forward and Backward tasks (p>0.331). A significant group effect was found
in the scores for verbal fluency tasks (Animals, Fruits, and Animals/Fruits) in both ScT and DT: TD children
enumerated more items than children with CP in those tasks. However, no significant differences between the
groups were found for DTCcognitive.
6.4 Discussion
We aimed to assess the effects of DT on the gait and cognitive parameters of children with CP. The main
finding was the validation of our first hypothesis, since both populations (participants with CP and TD controls)
showed decreased performances in DT conditions, although these were not statistically significant for
cognitive performance. Furthermore, we demonstrated that children with CP performed worse than their TD
counterparts across all tasks, including the simple task, especially for the walking speed, hip ROM and heel
clearance. These results were in line with previous reports which showed a significant difference between
groups in spatiotemporal parameters while walking with a concurrent task: digit memorization and sound
recognition (Katz-Leurer et al., 2014) and carrying a box (Hung and Meredith, 2014). Similarly to their studies,
our group of children with CP exhibited significantly worse gait performances than TD children in the simple
walking task. Further analysis of the DTCmotor revealed that the group effect was mainly associated with the
difference in the simple task, except for the walk-ratio in the verbal fluency tasks. Our second hypothesis was
thus not validated, because the costs between DT and simple tasks (whether SmT or ScT) were not significantly
higher in children with CP than in TD children for the majority of parameters and all the DT.
Considering that DTC is related to the recruitment of shared cortical resources for both tasks (Schaefer, 2014),
our findings may in fact indicate that CP gait is not more dependent on cortical resources than TD gait during
DT. Through cortical activation measures, children with CP have been shown to recruit more cortical area
while walking than TD children, leading to automatization defects (Kurz et al., 2014; Sukal-Moulton et al.,
2018). In literature on aging, this mechanism is known as the « dedifferentiation theory » reflecting the
difficulty in recruiting specialized neural mechanisms (Heuninckx et al., 2008). We can hypothesize that, while
in SmT the brain resources are not equal between the groups, in DT, both groups saturate equally their baseline
resources, leading to an absence of DTC difference. Studies using fNIRS in CP population under DT might
help the understanding on this topic.
Comparison between standardized gait and gait under challenging dual task conditions
108
Even though the DTC was not significantly different between groups, children with CP experienced greater
gait difficulties when dealing with DT situations than their TD peers. For example, the median walking speed
of children with CP in DT-Backward corresponded to the median walking speed of TD children in DT-
Animals/Fruits. For the more complex DT, children with CP demonstrated very low gait performances. They
systematically performed lower than TD children, regardless of the task or the parameter.
We observed a progressive effect of DT on gait parameters, depending on the task’s cognitive load. This task
effect was found for both groups, in agreement with Katz-Leurer et al. (Katz-Leurer et al., 2014) but in contrast
with Hung et al. (Hung and Meredith, 2014), who did not find any task effect in the TD group. This can be
related to the choice of the secondary task: carrying a box while walking being less challenging than our
cognitive tasks. The task effects on DTCmotor revealed that cognitive tasks did not affect gait parameters equally
(Friedman p-values below the level of significance even after Bonferroni correction), except for the walk ratio
in the CP group for which no significant task effects was found.
The walk ratio is the ratio between step length and cadence, which is supposed to reflect the spatiotemporal
coordination of gait and be invariant in spontaneous gait (Sekiya and Nagasaki, 1998). The walk ratio of TD
children increased in DT, which was mostly due to a notable decrease of their cadence whereas their stride
length decreased only slightly. Among children with CP, however, both parameters decreased significantly,
leading to more constant walk ratios. Although DT affected both spatial and temporal parameters in children
with CP, TD children were better able to maintain their stride length.
Although the participants were asked to perform the DT without task prioritization, it appeared that they
prioritized the cognitive task. Gait performances decreased, whereas cognitive scores did not change
significantly from ScT to DT. This “cognitive-first” strategy, as opposed to “posture-first”, has been described
in studies on aging (Corp et al., 2018; Mazaheri et al., 2015) or patients with Parkinson’s disease (Bloem et
al., 2006), causing gait instability and falling. Although not extensively studied in children, the “cognitive-
first” strategy may reflect a child-specific behavior in DT, since falling is not a major issue in comparison to
older adults. We believe that this adopted strategy was also partly due to the nature of the proposed DT: the
participants were constrained by the motor task (an imposed distance to walk) and had freedom in the cognitive
task.
Six parameters belonging to distinct gait domains were selected on the basis of a multivariate analysis of our
data. Besides the domains previously described in the literature (pace, rhythm, variability, asymmetry, and
postural control), parameters relating to gait quality, such as joint angles, were added to the analysis because
they provide substantial information about the gait disorders of children with CP (Armand et al., 2016), are
frequently analyzed in gait analysis and were computable using our optoelectronic system. We highlighted the
decrease in hip ROM and heel clearance in DT among children with CP and TD children. The present study
was the first to use such an approach to assess DT effects, and we believe that it provided a more complete
description of gait deviations than previous studies (Huang et al., 2003; Katz-Leurer et al., 2014). The method
of parameter selection included arbitrary choices of thresholds (70% of variance explained, |loading
factors|>0.5) which are debatable, but the conclusions would have been similar with other thresholds.
This study’s main limitations were its cohort’s heterogeneity. The wide age range includes an age that is a
turning point regarding the maturity of gait and attentional resources, which may influence the results (Olivier
et al., 2010). A complementary analysis, available in supplementary data (Figure 44 and Figure 45), supported
the idea that the age heterogeneity could be one explanation for the absence of DTC difference between CP
and TD groups since the youngest and oldest TD children did not show the same behavior regarding DT.
Furthermore, even though this study focused on the functional impact of CP, we are aware of the heterogeneous
clinical profiles between unilateral (UCP) and bilateral CP (BCP). A complementary sub-analysis, available
Comparison between standardized gait and gait under challenging dual task conditions
109
in supplementary data (Figure 46), comparing children with UCP and BCP did not show any differences
regarding DTC, but the number of participants was insufficient within each group to draw a conclusion. Further
analysis is needed to provide more specific evidence of the DT effect in the UCP and BCP populations. The
power and the generalization of our analyses are limited in light of the small sample size. Another important
limitation was the motion analysis system’s limited capture volume, which weakens the relevance of certain
gait parameters, such as the variability parameters. Additionally, assessment in laboratory settings (in
underwear, walking barefoot, etc.) may not reflect real-life situations. To overcome these two last limitations,
the use of wearable sensors in daily-life conditions could constitute a relevant alternative.
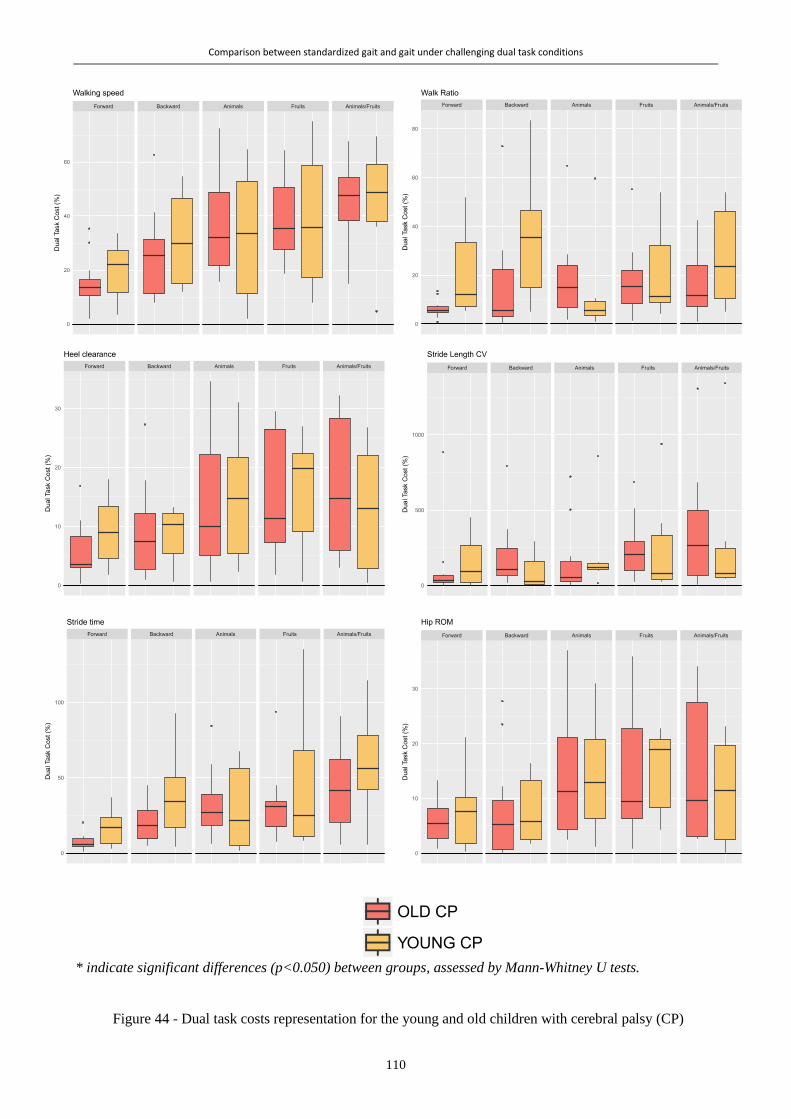
Comparison between standardized gait and gait under challenging dual task conditions
110
* indicate significant differences (p<0.050) between groups, assessed by Mann-Whitney U tests.
Figure 44 - Dual task costs representation for the young and old children with cerebral palsy (CP)
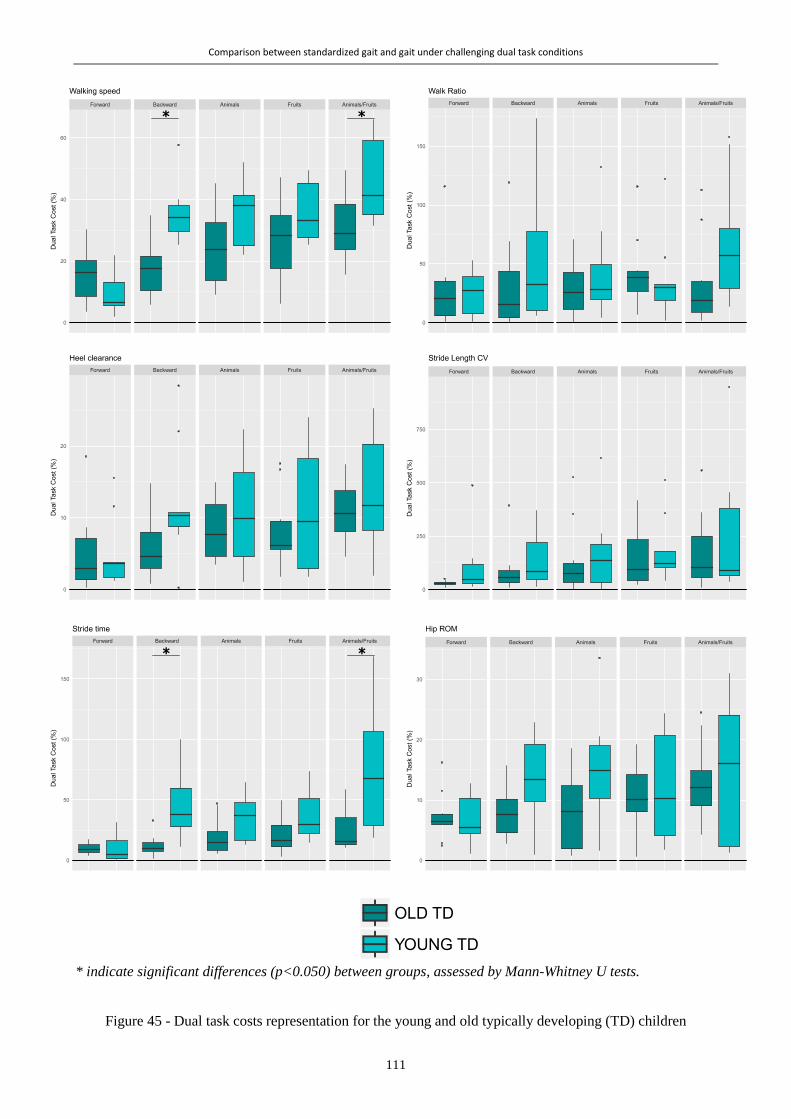
Comparison between standardized gait and gait under challenging dual task conditions
111
* indicate significant differences (p<0.050) between groups, assessed by Mann-Whitney U tests.
Figure 45 - Dual task costs representation for the young and old typically developing (TD) children

Comparison between standardized gait and gait under challenging dual task conditions
112
* indicate significant differences (p<0.050) between groups, assessed by Mann-Whitney U tests.
Figure 46 - Dual task costs representation for the children with unilateral and bilateral cerebral palsy (UCP and BCP)

Comparison between standardized gait and gait under challenging dual task conditions
113
Clinical implications:
This study emphasized the importance of assessing gait in DT conditions in order to better understand
limitations on the activities of children with CP. In children with mild levels of motor impairment, difficulties
due to cognitive–motor interferences might be underestimated whereas they should be taken into account when
devising therapeutic strategies and discussing specific adaptations at home or in school. For instance, therapists
and teachers may adapt environments and instructions in such ways that they are more appropriate for a child’s
motor, but also cognitive abilities (Huang et al., 2003). Our study supports that training programs should
integrate DT exercises (Elhinidi et al., 2016; Tramontano et al., 2016). Since daily life is not isolated from
cognitive constraints, the difficulties revealed in this study are likely to influence everyday walking situations
in patients’ real lives.
6.5 Conclusion
Interferences between motor and cognitive tasks have significant effects on walking performance in children
with and without CP. Failing to account for the effects of dual tasking in daily life may lead to an
underestimation of the difficulties encountered by children with CP, including those with mild impairments.
The cost of dual tasks should therefore be considered in clinical assessments and treatment planning.

114

115
Chapter 7 *
Laboratory versus daily life: the walking speed
Abstract
The purpose of this study was to compare walking speed, an important component of gait, in the laboratory
and daily life, in children with cerebral palsy (CP) and with typical development (TD), and to quantify to what
extent gait observed in clinical settings compares to gait in real life.
Fifteen children with CP (6 GMFCS I, 2 GMFCS II and 7 GMFCS III) and 14 with TD were included. They
wore 4 synchronized inertial sensors on their shanks and thighs while walking at their spontaneous self-selected
speed in the laboratory, and then during 2 week-days and 1 weekend day in their daily environment. Walking
speed was computed from shank angular velocity signals using a validated algorithm. The median of the speed
distributions in the laboratory and daily life were compared at the group and individual levels using Wilcoxon
tests and Spearman’s correlation coefficients. The corresponding percentile of daily life speed equivalent to
the speed in the laboratory was computed and observed at the group level.
Daily-life walking speed was significantly lower compared to the laboratory for the CP group (0.91 [0.58-
1.23] m/s vs 1.07 [0.73-1.28] m/s, p=0.015), but not for TD (1.29 [1.24-1.40] m/s vs 1.29 [1.20-1.40] m/s,
p=0.715). Median speeds correlated highly in CP (p<0.001, rho=0.89), but not in TD. In children with CP,
60% of the daily life walking activity was at a lower speed than in-laboratory (corresponding percentile=60).
On the contrary, almost 60% of the daily life activity of TD was at a higher speed than in-laboratory
(corresponding percentile=42.5). Nevertheless, highly heterogeneous behaviors were observed within both
populations and within subgroups of GMFCS level.
At the group level, children with CP tend to under-perform during natural walking as compared to walking in
a clinical environment. The heterogeneous behaviors at the individual level indicate that real-life gait
performance cannot be directly inferred from in-laboratory capacity. This emphasizes the importance of
completing clinical gait analysis with data from daily life, to better understand the overall function of children
with CP and enhance their clinical care according to their specific needs.
* Chapter submitted as:
Carcreff L., Gerber C.N., Paraschiv-Ionescu A., De Coulon G., Aminian K., Newman C.J., and Armand S. « Walking
speed of children with cerebral palsy: laboratory versus daily life », to the Journal of NeuroEngineering and Rehabilita-
tion, in December 2019
My contributions: Methodology, recruitement, investigation, software, data curation, visualization, formal analysis,
writing – original draft, writing-review & editing

Laboratory versus daily life: the walking speed
116
7.1 Introduction
The World Health Organization (WHO) has emphasized the need to consider both capacity, defined as what a
person can do in a standardized environment, and performance, defined as what a person does in his/her
habitual environment, to describe a person’s activity (World Health Organization, 2002). Since the usual
environment includes the overall societal context, performance takes external and personal factors into
account, unlike capacity which focuses only on functional abilities. Walking capacity and performance can
thus be interpreted as walking in clinical (laboratory) and daily life settings, respectively (Bjornson, 2019).
In children with cerebral palsy (CP), gait capacity assessments are a mainstay of clinical evaluation (Gerber et
al., 2019). These children, who present lifelong motor disabilities (O’Shea, 2008), are regularly assessed in
clinical settings through diverse functional tests, such as the Gross Motor Function Measure (GMFM) (Alotaibi
et al., 2014) and the 6-Minute Walk Test (Enright, 2003), or through an exhaustive assessment of gait
deviations by means of 3D clinical gait analysis (Armand et al., 2016; Carcreff et al., 2016b). This data on gait
capacity is used to identify, quantify and understand the motor disorders, and serves as a support for the
management of gait deviations (Armand et al., 2016). However, walking under the supervision of the clinician
in a laboratory may not always be representative of usual walking (Gosselin et al., 2018). The patient’s capacity
is usually overestimated as he/she shows the best of him/herself to please the care providers (Toosizadeh et
al., 2015), a phenomenon often referred to as the 'Hawthorne effect' (Berthelot et al., 2011). Additional
information about the patient’s unsupervised walking (i.e. daily life-based gait performance) could improve
the understanding of the patient’s overall gait difficulties, and hence could enhance clinical decision-making
and improve medical care (Bjornson et al., 2013; Young et al., 1996).
In children with CP, gait performance is mostly assessed by self- or proxy-report questionnaires which are
inherently biased by subjectivity and misrepresentation (Capio et al., 2010). Since the advent of new
assessment tools like accelerometer-based pedometers, actimeters or, more generally, inertial measurement
units (IMU) based activity monitors, objective data can be collected from a patient’s daily activity, and direct
comparisons with data measured in the laboratory can be performed.
Gait capacity and performance assessed by questionnaires are positively associated in children with CP (Van
Eck et al., 2009), capacity exceeding performance (Young et al., 1996). However, this relationship is not
constant in time and depends on the level of impairment (classified by the Gross Motor Function Classification
System- GMFCS (Palisano et al., 1997)) (Ho et al., 2017). Indeed, Van Gorp et al. have recently shown that
performance keeps developing after the ceiling of capacity is reached (Van Gorp et al., 2018). Recent studies
using objective performance data have highlighted weak correlations of laboratory-based spatiotemporal and
kinematic parameters with daily ambulatory activities of children with CP (Guinet and Desailly, 2017; Mitchell
et al., 2015b; Nicholson et al., 2018; Wilson et al., 2015; Wittry et al., 2018). Although the comparisons were
based on dissimilar metrics (i.e. Gait Deviation Index (Schwartz and Rozumalski, 2008) versus step count per
day, for instance), all these findings seem to indicate that gait performance cannot be predicted directly from
gait capacity (Guinet and Desailly, 2017). Using a unique metric to compare gait in the laboratory and in daily
life could provide new insights into this field by quantifying the difference between both environments.
Walking speed is referred to as the sixth vital sign (Fritz and Lusardi, 2009) since it is a powerful indicator of
mobility efficiency (Bjornson and Lennon, 2017; Van Ancum et al., 2019). This gait parameter constitutes the
most reported outcome measure of interventions whose aim is to improve gait function (Bjornson and Lennon,
2017). It can reliably be estimated using IMUs, by direct integration, biomechanical modeling or machine
learning methods (Yang and Li, 2012a). We have recently demonstrated the satisfactory accuracy and
reliability of speed estimation in children with CP with low to moderate levels of motor disability (GMFCS
levels I to III), using a configuration of sensors on the shanks and thighs (Carcreff et al., 2018; Gerber et al.,
2019).

Laboratory versus daily life: the walking speed
117
Recent studies have found that clinic-based speed corresponded to the highest speeds measured in daily
conditions in community-dwelling older adults (Takayanagi et al., 2019; Van Ancum et al., 2019), in patients
with Parkinson’s disease (Del Din et al., 2016a; Toosizadeh et al., 2015) and patients with multiple sclerosis
(Supratak et al., 2018). This has not been explored in CP.
The aim of this study was to compare the walking speed, global indicator of the gait function, of children with
CP in daily life and in the laboratory. Our three specific research questions were: (1) Is spontaneous walking
speed in the laboratory different from daily life?; (2) Is there an association between speed in the laboratory
and in daily life?; (3) How much does walking speed in the laboratory represent speed in daily life?. Analyses
were also performed in healthy controls with typical development (TD) since daily-life assessments of gait
function are novel in this population with a need for reference data in order to draw potential conclusions (Del
Din et al., 2016b). Analyses were performed at the group level, and at the individual level, to account for the
heterogeneity of the CP population.
7.2 Method
7.2.1 Study design
This was a cross-sectional study.
7.2.2 Recruitment
Children with CP were recruited from the pediatric orthopedic unit of Geneva University Hospitals using the
following inclusion criteria: aged between 8 and 20 years, diagnosis of CP, ability to walk in the community
with or without mechanical walking aids, i.e. with a GMFCS level (Palisano et al., 1997) between I and III. A
group of children with TD, homogeneous in age and sex with the CP group, were recruited among
collaborators’ or patients’ acquaintances. Children of both groups were excluded if they had additional
impairments that limited their participation in the measurements (mental age <8years, severe visual
impairment, attention deficit and/or other significant behavioral issues). All participants provided written
consent, and the protocol was approved by and carried out in accordance with the hospital’s institutional ethical
committee.
7.2.3 Protocol
A trained investigator measured anthropometric data (shank and thigh lengths) and lower limb muscle strength.
The GMFM (66-item version) (Alotaibi et al., 2014) was assessed for the children with CP by a trained
evaluator to score their functional capacity (from 0 to 100, 100 being the highest capacity).
Children were equipped with wearable inertial sensors and reflective markers (optoelectronic system). They
were asked to walk barefoot at a natural self-selected pace (with the instruction to walk “as usual, as you walk
in the street”), back and forth on a 10-meter walkway within the gait laboratory, following a standard protocol
of clinical gait analysis (Baker, 2013). A total of 4 to 10 trials were recorded for each participant, depending
on their capacity and fatigue.
Next, the participants were asked to wear the sensors in their daily life, for a minimum of 10 waking hours per
day, during 3 consecutive days including two week-days (school days) and one weekend day. The sensors
were placed at the beginning and recharged at the end of each day of measurement by a parent, a caregiver or
the participant him/herself. Previously, they received a practical training by the investigator on how to handle
the sensors, i.e. turning on, fixing on body segments, turning off, charging, etc. A guide was also given to
support them at home. The participants were asked to complete a diary reporting their physical activities and
the eventual issues encountered with the sensors.
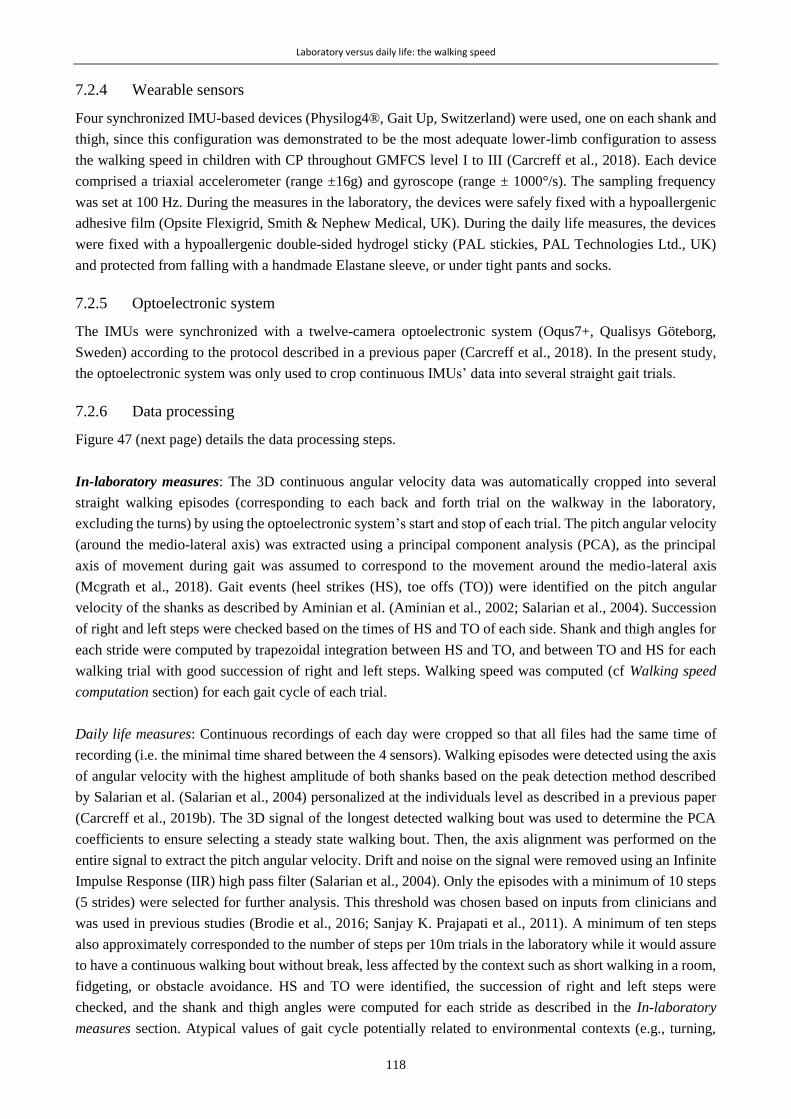
Laboratory versus daily life: the walking speed
118
7.2.4 Wearable sensors
Four synchronized IMU-based devices (Physilog4®, Gait Up, Switzerland) were used, one on each shank and
thigh, since this configuration was demonstrated to be the most adequate lower-limb configuration to assess
the walking speed in children with CP throughout GMFCS level I to III (Carcreff et al., 2018). Each device
comprised a triaxial accelerometer (range ±16g) and gyroscope (range ± 1000°/s). The sampling frequency
was set at 100 Hz. During the measures in the laboratory, the devices were safely fixed with a hypoallergenic
adhesive film (Opsite Flexigrid, Smith & Nephew Medical, UK). During the daily life measures, the devices
were fixed with a hypoallergenic double-sided hydrogel sticky (PAL stickies, PAL Technologies Ltd., UK)
and protected from falling with a handmade Elastane sleeve, or under tight pants and socks.
7.2.5 Optoelectronic system
The IMUs were synchronized with a twelve-camera optoelectronic system (Oqus7+, Qualisys Göteborg,
Sweden) according to the protocol described in a previous paper (Carcreff et al., 2018). In the present study,
the optoelectronic system was only used to crop continuous IMUs’ data into several straight gait trials.
7.2.6 Data processing
Figure 47 (next page) details the data processing steps.
In-laboratory measures: The 3D continuous angular velocity data was automatically cropped into several
straight walking episodes (corresponding to each back and forth trial on the walkway in the laboratory,
excluding the turns) by using the optoelectronic system’s start and stop of each trial. The pitch angular velocity
(around the medio-lateral axis) was extracted using a principal component analysis (PCA), as the principal
axis of movement during gait was assumed to correspond to the movement around the medio-lateral axis
(Mcgrath et al., 2018). Gait events (heel strikes (HS), toe offs (TO)) were identified on the pitch angular
velocity of the shanks as described by Aminian et al. (Aminian et al., 2002; Salarian et al., 2004). Succession
of right and left steps were checked based on the times of HS and TO of each side. Shank and thigh angles for
each stride were computed by trapezoidal integration between HS and TO, and between TO and HS for each
walking trial with good succession of right and left steps. Walking speed was computed (cf Walking speed
computation section) for each gait cycle of each trial.
Daily life measures: Continuous recordings of each day were cropped so that all files had the same time of
recording (i.e. the minimal time shared between the 4 sensors). Walking episodes were detected using the axis
of angular velocity with the highest amplitude of both shanks based on the peak detection method described
by Salarian et al. (Salarian et al., 2004) personalized at the individuals level as described in a previous paper
(Carcreff et al., 2019b). The 3D signal of the longest detected walking bout was used to determine the PCA
coefficients to ensure selecting a steady state walking bout. Then, the axis alignment was performed on the
entire signal to extract the pitch angular velocity. Drift and noise on the signal were removed using an Infinite
Impulse Response (IIR) high pass filter (Salarian et al., 2004). Only the episodes with a minimum of 10 steps
(5 strides) were selected for further analysis. This threshold was chosen based on inputs from clinicians and
was used in previous studies (Brodie et al., 2016; Sanjay K. Prajapati et al., 2011). A minimum of ten steps
also approximately corresponded to the number of steps per 10m trials in the laboratory while it would assure
to have a continuous walking bout without break, less affected by the context such as short walking in a room,
fidgeting, or obstacle avoidance. HS and TO were identified, the succession of right and left steps were
checked, and the shank and thigh angles were computed for each stride as described in the In-laboratory
measures section. Atypical values of gait cycle potentially related to environmental contexts (e.g., turning,
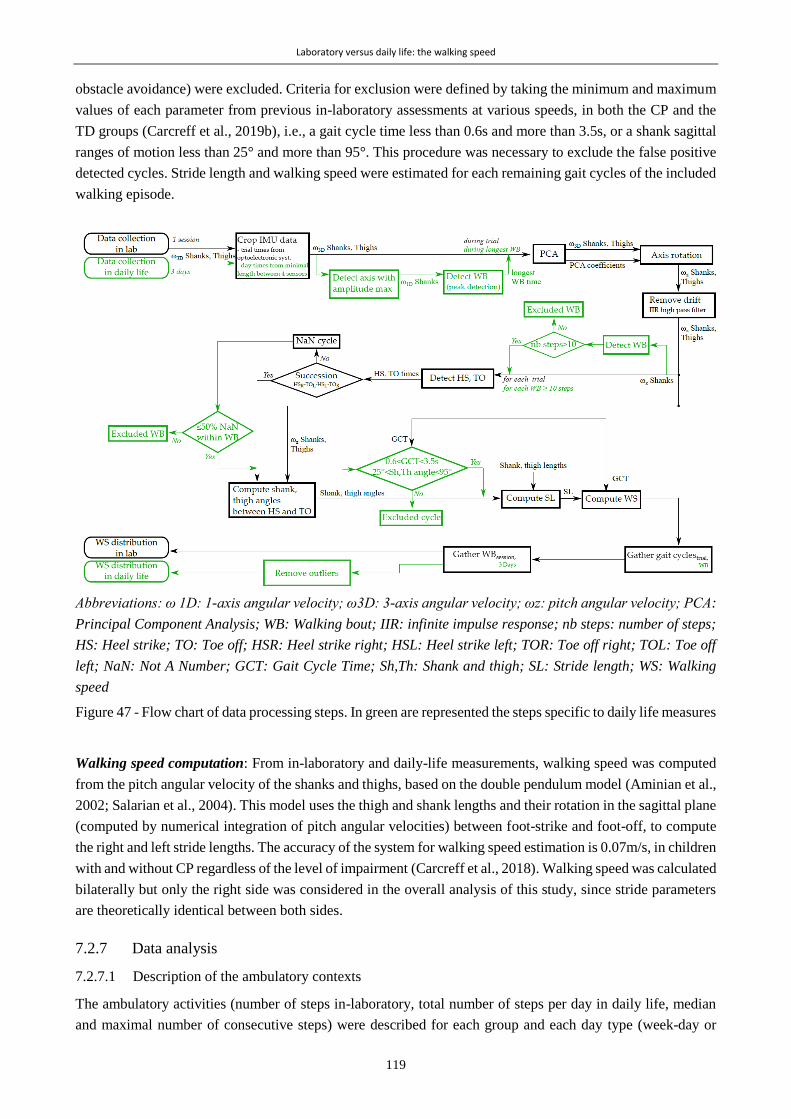
Laboratory versus daily life: the walking speed
119
obstacle avoidance) were excluded. Criteria for exclusion were defined by taking the minimum and maximum
values of each parameter from previous in-laboratory assessments at various speeds, in both the CP and the
TD groups (Carcreff et al., 2019b), i.e., a gait cycle time less than 0.6s and more than 3.5s, or a shank sagittal
ranges of motion less than 25° and more than 95°. This procedure was necessary to exclude the false positive
detected cycles. Stride length and walking speed were estimated for each remaining gait cycles of the included
walking episode.
Abbreviations: ω 1D: 1-axis angular velocity; ω3D: 3-axis angular velocity; ωz: pitch angular velocity; PCA:
Principal Component Analysis; WB: Walking bout; IIR: infinite impulse response; nb steps: number of steps;
HS: Heel strike; TO: Toe off; HSR: Heel strike right; HSL: Heel strike left; TOR: Toe off right; TOL: Toe off
left; NaN: Not A Number; GCT: Gait Cycle Time; Sh,Th: Shank and thigh; SL: Stride length; WS: Walking
speed
Figure 47 - Flow chart of data processing steps. In green are represented the steps specific to daily life measures
Walking speed computation: From in-laboratory and daily-life measurements, walking speed was computed
from the pitch angular velocity of the shanks and thighs, based on the double pendulum model (Aminian et al.,
2002; Salarian et al., 2004). This model uses the thigh and shank lengths and their rotation in the sagittal plane
(computed by numerical integration of pitch angular velocities) between foot-strike and foot-off, to compute
the right and left stride lengths. The accuracy of the system for walking speed estimation is 0.07m/s, in children
with and without CP regardless of the level of impairment (Carcreff et al., 2018). Walking speed was calculated
bilaterally but only the right side was considered in the overall analysis of this study, since stride parameters
are theoretically identical between both sides.
7.2.7 Data analysis
7.2.7.1 Description of the ambulatory contexts
The ambulatory activities (number of steps in-laboratory, total number of steps per day in daily life, median
and maximal number of consecutive steps) were described for each group and each day type (week-day or
Laboratory versus daily life: the walking speed
120
weekend day) in order to set the context of the measurements. Cumulative Distribution Function (CDF) plots
were used to visualize the speed distribution in-laboratory (CDFLab) and during each day of daily life (CDFDL)
on the same figure, in order to make direct visual comparisons between the distributions. CDF plots were
preferred to histograms for better readability in the superposition of the distributions.
7.2.7.2 Comparisons between laboratory and daily life speeds
The results obtained from the 3 days recorded data were gathered in order to have a single daily life distribution
representing both week-days and weekend days. Outlier values (∉[Q1-1.5*IQR:Q3+1.5*IQR] with Q1:1st
quartile; Q3:3rd quartile and IQR: interquartile range) were excluded from this single distribution (Figure 47).
The level of significance for the following statistical tests was set at p < 0.05.
Difference between speed in laboratory and speed in daily life
Median of speed distributions in laboratory and in daily life were compared for each group (group level) and
subgroups of GMFCS using the nonparametric paired Wilcoxon tests (indicated for small sample size). The
speed distribution in the laboratory was also compared to the daily life distribution for each participant
(individual level) using unpaired Wilcoxon tests. Effect size was computed by dividing the Wilcoxon test
statistic by the square root of the number of observations, as suggested by Pallant et al. (Pallant, 2013).
Association between speed in laboratory and speed in daily life
The correlation between median speed in the laboratory and median speed in daily life was assessed by using
Spearman’s rank correlation coefficient (rho). Altman’s guidelines were used to interpret the correlation as:
poor if rho<0.2; fair if 0.21<rho<0.40; moderate if 0.41<rho<0.60; good if 0.61<rho<0.80; and very good if
rho>0.81 (Altman and Altman, 1999).
Speed in the laboratory representative of speed in daily life
The percentile from the daily life distribution that corresponded to the median speed in laboratory was
calculated, according to the method of Van Ancum et al. (Van Ancum et al., 2019). As an example, if the
median speed in daily life equals the median speed in laboratory, the corresponding percentile would be 50.
7.3 Results
7.3.1.1 Description of the study population and the ambulatory contexts
Fifteen children with CP and 14 with TD were included in this study. The details about the CP population are
provided in Table 17 and the characteristics of each group are presented in Table 18.

Laboratory versus daily life: the walking speed
121
Table 17 - Description of the CP population
Age Sex GMFCS GMFM Topography More
affected side1
Walking aid in
laboratory Walking aid in DL
13.7 F I 86.5 Uni L
12.3 F I 89.7 Uni R
15.6 M I 88.0 Uni R
20.1 M I 88.0 Bi R
13.2 M I 100.0 Bi L
12.3 F I 100.0 Bi R
12.8 M II 78.3 Bi L
10.3 F II 65.6 Bi R wheelchair for long distances
9.3 F II 67.4 Bi L
14 F III 68.5 Bi L walker
15.8 F III 54.1 Bi R walker walker or wheelchair
8.3 M III 57.9 Bi R walker walker
11.3 M III 54.9 Bi L walker walker
11.6 F III 63.6 Bi L crutches crutches or wheelchair
17.5 F III 37.4 Bi R walker walker 1: based on lower limb muscle strength testing; Uni: Unilaterally affected; Bi: Bilaterally affected; R: Right;
L: Left. Gray gradient colors correspond gradually to the level of impairment of the participants.
For participants with CP, the dominant clinical pattern was spastic diplegia (n=12). Therefore, the majority
was affected on both sides, and half of the patients needed a walking aid for outdoor walking. The GMFM
scores ranged between 37.4 and 100. One child with CP - GMFCS III did not walk enough during 2 days since
she largely used her wheelchair to move, so no walking episode with more than 10 steps was detected, hence
only one day (week-day) was considered for this participant. One adolescent with TD forgot to wear the sensors
during the third day (weekend day). Two children with CP (GMFCS I and III) did not follow the instruction
to wear the sensors on a weekend day, thus 3 week-days were assessed for them. Table 18 gives an overview
of the detected ambulatory activities in each group in laboratory and daily life. In general, children with CP
took fewer steps than children with TD. The number of steps taken, as well as the time spent walking during
weekend days was lower compared with the week-days for both groups. Especially, the median number of
consecutive steps during weekend days represented only 8% and 3% of the median number of consecutive
steps during week-days in children with CP and TD, respectively. One child with TD took more than 10’000
steps and this during a week-day.
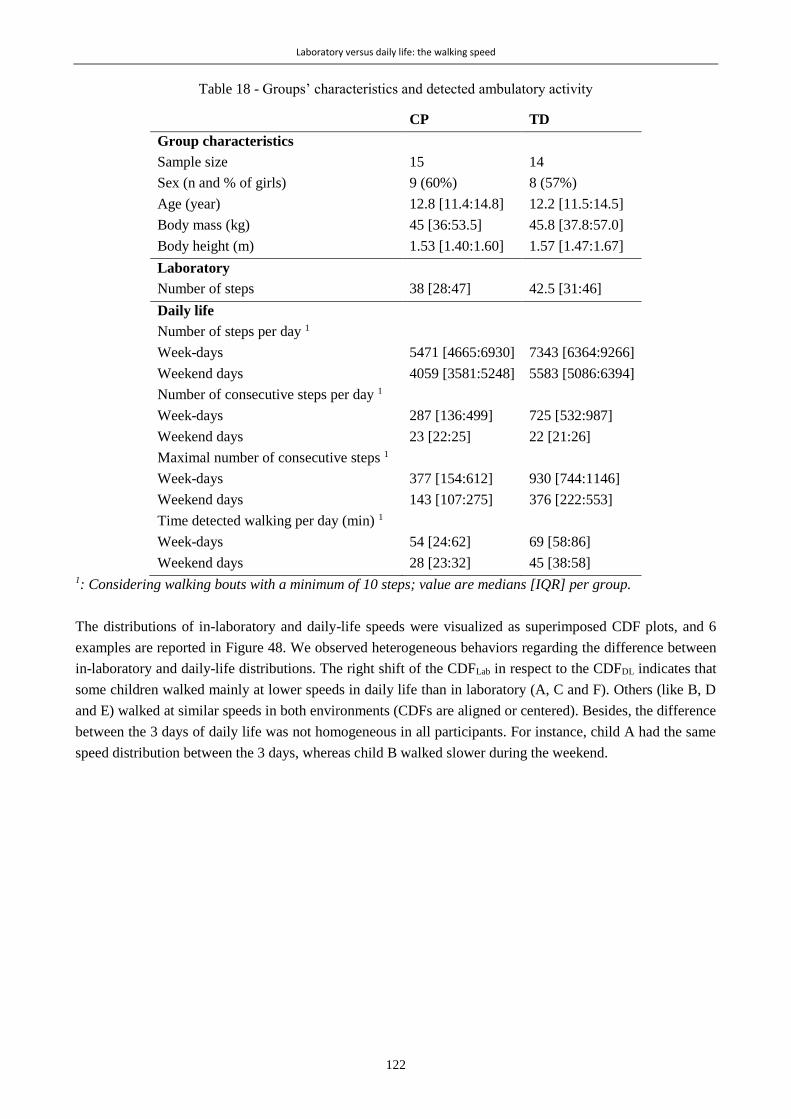
Laboratory versus daily life: the walking speed
122
Table 18 - Groups’ characteristics and detected ambulatory activity
CP TD
Group characteristics
Sample size 15 14
Sex (n and % of girls) 9 (60%) 8 (57%)
Age (year) 12.8 [11.4:14.8] 12.2 [11.5:14.5]
Body mass (kg) 45 [36:53.5] 45.8 [37.8:57.0]
Body height (m) 1.53 [1.40:1.60] 1.57 [1.47:1.67]
Laboratory
Number of steps 38 [28:47] 42.5 [31:46]
Daily life
Number of steps per day 1
Week-days
Weekend days
5471 [4665:6930]
4059 [3581:5248]
7343 [6364:9266]
5583 [5086:6394]
Number of consecutive steps per day 1
Week-days
Weekend days
287 [136:499]
23 [22:25]
725 [532:987]
22 [21:26]
Maximal number of consecutive steps 1
Week-days
Weekend days
377 [154:612]
143 [107:275]
930 [744:1146]
376 [222:553]
Time detected walking per day (min) 1
Week-days
Weekend days
54 [24:62]
28 [23:32]
69 [58:86]
45 [38:58] 1: Considering walking bouts with a minimum of 10 steps; value are medians [IQR] per group.
The distributions of in-laboratory and daily-life speeds were visualized as superimposed CDF plots, and 6
examples are reported in Figure 48. We observed heterogeneous behaviors regarding the difference between
in-laboratory and daily-life distributions. The right shift of the CDFLab in respect to the CDFDL indicates that
some children walked mainly at lower speeds in daily life than in laboratory (A, C and F). Others (like B, D
and E) walked at similar speeds in both environments (CDFs are aligned or centered). Besides, the difference
between the 3 days of daily life was not homogeneous in all participants. For instance, child A had the same
speed distribution between the 3 days, whereas child B walked slower during the weekend.

Laboratory versus daily life: the walking speed
123
Abbreviations: ‘F’: female, ‘M’: male.
Figure 48 - Six examples of speed distributions (as Cumulative Distribution Function plots) in laboratory
(‘Lab’) and 3 days of daily life: 2 week-days (‘Day 1’, ‘Day 2’), and 1 weekend day
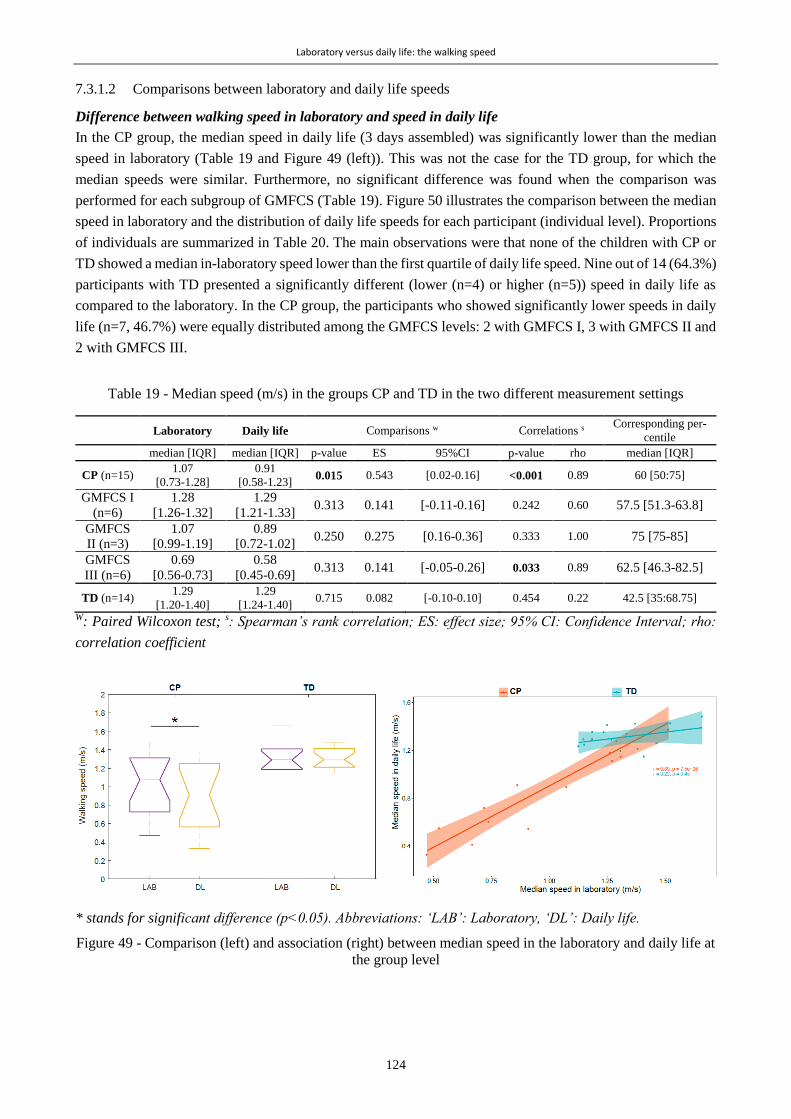
Laboratory versus daily life: the walking speed
124
7.3.1.2 Comparisons between laboratory and daily life speeds
Difference between walking speed in laboratory and speed in daily life
In the CP group, the median speed in daily life (3 days assembled) was significantly lower than the median
speed in laboratory (Table 19 and Figure 49 (left)). This was not the case for the TD group, for which the
median speeds were similar. Furthermore, no significant difference was found when the comparison was
performed for each subgroup of GMFCS (Table 19). Figure 50 illustrates the comparison between the median
speed in laboratory and the distribution of daily life speeds for each participant (individual level). Proportions
of individuals are summarized in Table 20. The main observations were that none of the children with CP or
TD showed a median in-laboratory speed lower than the first quartile of daily life speed. Nine out of 14 (64.3%)
participants with TD presented a significantly different (lower (n=4) or higher (n=5)) speed in daily life as
compared to the laboratory. In the CP group, the participants who showed significantly lower speeds in daily
life (n=7, 46.7%) were equally distributed among the GMFCS levels: 2 with GMFCS I, 3 with GMFCS II and
2 with GMFCS III.
Table 19 - Median speed (m/s) in the groups CP and TD in the two different measurement settings
Laboratory Daily life Comparisons w Correlations s Corresponding per-
centile
median [IQR] median [IQR] p-value ES 95%CI p-value rho median [IQR]
CP (n=15) 1.07
[0.73-1.28]
0.91
[0.58-1.23] 0.015 0.543 [0.02-0.16] <0.001 0.89 60 [50:75]
GMFCS I
(n=6)
1.28
[1.26-1.32]
1.29
[1.21-1.33] 0.313 0.141 [-0.11-0.16] 0.242 0.60 57.5 [51.3-63.8]
GMFCS
II (n=3)
1.07
[0.99-1.19]
0.89
[0.72-1.02] 0.250 0.275 [0.16-0.36] 0.333 1.00 75 [75-85]
GMFCS
III (n=6)
0.69
[0.56-0.73]
0.58
[0.45-0.69] 0.313 0.141 [-0.05-0.26] 0.033 0.89 62.5 [46.3-82.5]
TD (n=14) 1.29
[1.20-1.40]
1.29
[1.24-1.40] 0.715 0.082 [-0.10-0.10] 0.454 0.22 42.5 [35:68.75]
W: Paired Wilcoxon test; s: Spearman’s rank correlation; ES: effect size; 95% CI: Confidence Interval; rho:
correlation coefficient
* stands for significant difference (p<0.05). Abbreviations: ‘LAB’: Laboratory, ‘DL’: Daily life.
Figure 49 - Comparison (left) and association (right) between median speed in the laboratory and daily life at
the group level

Laboratory versus daily life: the walking speed
125
Stars at the bottom of the box plots stand for significant difference between distributions, tested by unpaired
Wilcoxon tests (*‾: Lab > Daily life; *+: Lab < Daily life) for each study participant.
Figure 50 - Intra-subject comparisons between laboratory and daily life. Daily life speed distribution is repre-
sented by the box plots
Table 20 - Proportion of individuals in the categories comparing speed in laboratory and speed in daily life
In-lab median speed <
[DL speed range]
In-lab median speed ∈
[DL speed range]
In-lab median speed >
[DL speed range]
In-lab speed significantly dif-
ferent from DL speed (*)
Proportion of individuals in the group (%)
CP (n=15) 0.0 66.7 33.3 46.7
TD (n=14) 0.0 85.7 14.3 64.3
DL: Daily life; In-lab: in-laboratory;
Association between speed in laboratory and speed in daily life
A significant very good correlation was found between the median speed in laboratory and in daily life for the
CP group (rho=0.89, p<0.001) (Table 19 and Figure 49 (right)). No correlation was found for the TD group
(rho=0.22, p<0.454). A very good correlation was found for the GMFCS III-subgroup only (rho=0.89,
p=0.033).
Speed in laboratory representative of the speed in daily life
For the CP group, the speed in the laboratory represented the 60th percentile of the speed distribution in daily
life (Table 19). Thus, the majority of children with CP walked at a lower speed during unconstrained walking.
For the TD group, the corresponding percentile was 42.5, meaning that the speed in laboratory was between
the 40th and the 45th percentiles of the daily life distribution of speed. Children with TD walked mostly at a
higher speed during unconstrained walking. The median correspond percentile for the GMFCS-level
subgroups were 57.5, 75, and 62.5 for GMFCS I, II, and III respectively.
7.4 Discussion
The aim of this study was to compare in-laboratory and daily-life walking speeds in children with CP and TD,
in order to gain new insights regarding the difference between gait capacity and performance in the CP
Laboratory versus daily life: the walking speed
126
population. Walking speed was considered to be a good indicator of the overall gait function (Middleton, A.;
Fritz, S. L.; Lusardi, 2015) and knowing its distribution over 3 real-life days constituted a relevant first step to
understand the difference between the global level of performance and capacity. At the group level, children
with CP showed a lower walking speed in daily life as compared to the laboratory. This was not the case for
children with TD. Nevertheless, at the individual level, children with CP and with TD showed highly
heterogeneous behaviors, and also among the GMFCS-level subgroups. Furthermore, in contrast to controls,
a high correlation was found between median speeds in laboratory and daily life for children with CP (for the
whole CP group and the GMFCS III subgroup). The speed adopted by children with CP during supervised
walking corresponded mostly to their higher speeds in daily life: 60% of their daily walking activity was at a
lower speed than in the laboratory. On the contrary, the speed adopted by the group of children with TD during
supervised walking corresponded to the lower speeds in daily life: 60% of their daily walking activity was at
a higher speed than in the laboratory.
Description of the ambulatory contexts
The description of the participant’s ambulatory activities showed great differences between the groups. The
number of steps taken by children with CP and TD was about 5’000 and 7’000 respectively during week-days,
and 4’000 and 6’000 during weekend days. This was in agreement with the results of Bjornson et al. which
showed that children with TD take more steps than children with CP on a daily basis (Bjornson et al., 2007).
Furthermore, this indicates that our study participants did not reach the recommendations of 10’000 to 15’000
steps per day for children and adolescents (Tudor-Locke et al., 2011), with the exception of one child with TD.
Several studies have pointed out this issue, which can be explained by the current tendency of children and
adolescents to be more sedentary because of screen-based activities (Wu et al., 2017). However, since the focus
of the current study was not to quantify physical activity but rather to qualify walking performances within
meaningful walking bouts, many short walking bouts (<10 steps) were excluded from the analysis. In natural
walking, most walking bouts are short (Orendurff et al., 2008) and we most likely overestimated sedentary
behaviors by the excluding short bouts.
Considerations at the group level
The results found for children with CP have important clinical implications and are not in total accordance
with previous studies that used dissimilar metrics to compare gait performance with gait capacity. The slower
walking speed in daily life as compared to the clinical environment was expected. It can be the result of several,
and most probably, combined, reasons. Firstly, the so called ‘Hawthorne effect’ (doing better when observed)
(Berthelot et al., 2011) may have been verified here: children with CP walked mostly faster during the clinic-
based assessments. Secondly, the external factors present in the real-life environment may have played an
important role in decreasing gait velocity during daily life measurements. Indeed, slowing down could reflect
the difficulty when dealing with uneven surfaces and obstacles (Toosizadeh et al., 2015), decreased
concentration (Brodie et al., 2016; Sanjay K. Prajapati et al., 2011), and also fatigue and cognitive-motor
interferences which are two major difficulties associated with CP (Brunton and Rice, 2012; Carcreff et al.,
2019a; Katz-Leurer et al., 2014). Information about the context of walking in daily life was not available as
this is difficult to obtain in real-world condition unless the use of an additional system such as Global
Navigation Satellite System (GNSS) (for location, indoor, outdoor) (Wang and Adamczyk, 2019) or an
embedded camera (Hickey et al., 2017a). However, the use of such additional devices is problematic in our
population due to their age and privacy issue. As an attempt to limit the effect of the context, only walking
bouts longer than 10 steps were included. Moreover, median values as well as the whole distribution of the
walking speed were considered for analysis (Wilcoxon tests, CDF plots, and corresponding percentiles). The
Laboratory versus daily life: the walking speed
127
high correlation between in-laboratory and daily life gait speeds was unexpected. Indeed, in previous studies,
only low to moderate correlations were found, implying that gait performance cannot be predicted by capacity
(Gosselin et al., 2018; Guinet and Desailly, 2017; Wittry et al., 2018). Our results suggested that, for children
with CP, capacity is associated to and exceeds performance (Young et al., 1996). Considering the results found
in each GMFCS level, this might be especially true for the more affected children (GMFCS III). This is in
contrast with the behavior of healthy controls, and probably higher functioning children with CP, for whom
no correlation and no significant differences were found. This can be explained by the difference in speed
ranges for children with CP and TD. Indeed, higher range of speeds in CP favored better correlation. This also
meant that the capacity-performance relation can be in both directions for TD: underperforming or
outperforming their capacity in daily life. This can be attributed to their ability to vary their pace depending
on the context, i.e. to ‘respond to unpredictability’, as described by Gosselin et al. (Gosselin et al., 2018).
Children with CP have less motor and attentional reserve for adaptability than their TD peers (Gosselin et al.,
2018; Houwink et al., 2011), which may lead to quasi-systematic lower performances.
Recent studies which addressed this ‘lab. versus free-living’ clinical issue in adult and elderly populations
agreed that clinic-based gait parameters were higher, and actually corresponded to the highest level of natural
walking, i.e. to the ‘best performance’ (Brodie et al., 2017, 2016; Van Ancum et al., 2019). Even for high
functioning people, the time spent walking at the level (speed or cadence) of in-laboratory walking is rare
(Tudor-Locke et al., 2013). Our findings were not fully aligned with these statements. We found that walking
speed in the laboratory did not systematically match with the best performance, i.e. the highest speeds in daily
life. The corresponding percentile was 60 for children with CP. Children with TD did not demonstrate the
same behavior as healthy older adults either, since the corresponding percentile was 42.5. This divergence of
results with the adult population can be due to the more active lifestyles of children and their lower fear of
falling.
This study was the first to explore the link between gait capacity and performance based on a unique and
clinically-representative gait metric in children with CP. The divergence with previous results may thus be
explained by the difference of outcomes. While other studies used the Gait Deviation Index to represent
capacity and the daily number of steps to represent performance (Guinet and Desailly, 2017; Nicholson et al.,
2018; Wilson et al., 2015), we compared the distribution of the same metric, the walking speed, in two different
settings as reflections of the overall capacity and performance.
Considerations at the individual level
The results described at the group level need to be interpreted with caution since heterogeneous behaviors were
found for individuals with CP, as well as those with TD, nuancing the previously mentioned group results. We
found that only 46.7% of children with CP had a significant difference between supervised and unsupervised
walking speed, while at the group level, the median speeds were highly significantly different. This is likely
due to the small sample size and the high inter-subject variability. Indeed, the corresponding percentile ranged
between 25 and 95, picturing completely different inter-subject behaviors. For children with TD, 64.3% did
not follow the group results and the corresponding percentile ranged between 25 and 80. These intra-group
heterogeneities are most likely due to dissimilar day-to-day lifestyles and dissimilar demonstrations of the
spontaneous in-laboratory gait. Indeed, children’s daily activities are very variable. Depending on the school
program, physical activities differ highly between days. Also, external factors, such as the weather, were
inherently not controlled during the unsupervised assessments. The protocol should have included more days
of measurement, as suggested by Ischikawa et al. (Ishikawa et al., 2013) (a minimum of 6 days for the higher
functioning children, and 4 days for the most affected children), to obtain more stable measures of habitual
ambulatory activity. A compromise had to be found though, to decrease the risk of patients’ refusing to wear
Laboratory versus daily life: the walking speed
128
the sensors in their daily environment, as encountered for three children of our cohort. Moreover, family
situations, geographic location, and the physical activity habits vary significantly across participants. All these
factors could have contributed to the heterogeneity of the results. In addition, the in-laboratory behaviors may
differ among children. First, although we used modified verbal commands (Nascimento et al., 2012) to instruct
for ‘spontaneous’ speed (“walk as usual, as you were in the street”), the understanding of the instruction may
have differed. A demonstration or a systematic training phase to let the participant find his spontaneous speed
could have been considered (Nascimento et al., 2012). Second, the Hawthorne effect may have resulted in two
different outcomes: walking faster or improving the gait pattern quality to the detriment of walking speed.
It should be noted that the heterogeneity within the CP group was not the result of the heterogeneous levels of
impairments, since different results were found for the same gross motor function (GMFCS and GMFM) levels
(Figure 50). This was in line with previous questionnaire-based results showing that for the same levels of
capacity, different performances were observed (Holsbeeke et al., 2009). Accounting for the described
individual heterogeneity, this study brought new insights, based on objective assessments, into the relevance
of assessing both capacity and performance. Even if for the group with CP performance was highly associated
with laboratory-based walking, the exact level of an individual’s performance cannot be estimated from the
laboratory.
Clinical implications
Nowadays almost all lab-based performance measures such as standardized tests, including 3D gait analysis,
serve clinical-decision making, when real-life outcomes are actually the most important for the children and
their families. The extent to what gait characteristics measured during 3D gait analysis correlates with
unconstrained daily-life walking is still unknown (Supratak et al., 2018). It is fundamental to fill this gap in
order to appreciate the meaningfulness of the clinic-based measures for the patient (Supratak et al., 2018). This
study has the merit to address this issue thanks to the walking speed, a clinically meaningful parameter
considered as the sixth vital sign (Fritz and Lusardi, 2009), in opposition to arbitrarily defined levels of physical
activity through ‘activity counts’.
This study emphasized that ecological assessments of gait should be considered in clinical routine, as a
complement to in-laboratory 3D gait analysis, to obtain realistic information about motor performance, i.e. to
capture an additional construct of the gait function (Van Ancum et al., 2019). This information about gait
performance is highly valuable for clinicians when devising a treatment plan such as adjusting a surgery.
Furthermore, thanks to such assessments, clinicians could verify that the effect of a treatment ultimately
generalizes into the child’s daily life. Alternatives to the direct assessment of gait performance in daily life
conditions, such as dual-task walking (Carcreff et al., 2019a; Katz-Leurer et al., 2014), or walking in semi-
standardized or virtual reality environments (van der Krogt et al., 2014) can also be advised. Finally, therapists
could also integrate day-to-day performance data into their training program plans in addition to body
structures and functions.
Feedbacks on the feasibility of daily-life gait analysis
Although good acceptability of the measures was reported by participants and their families overall, daily-life
assessments entail potential pitfalls. Indeed, a number of issues related to long-term measurements were
reported in the diary or identified after data collection. The participants did not always follow the instructions
to wear an Elastane sleeve or tight pants or socks to cover the sensors. The sensor fixation (PAL stickies, PAL
Technologies Ltd., UK) alone was not sufficient. This problem was reported in 27% of the cases and was
generally fixed by the participants with additional medical tape provided by the investigator. This should have
been recommended from the beginning, as suggested previously (Del Din et al., 2016c). In the cases where the

Laboratory versus daily life: the walking speed
129
sensor fell and was re-placed in a different orientation (i.e. visible by a change in the signs of the signals), the
PCA calibration was repeated for the corresponding part of the data. Surprisingly, no issue was reported by
the parents or the caregivers who were in charge of handling the sensors every evening and morning. Errors
were found a posteriori, such as interruption of the measurement before reaching 10h of recording (7h50 in the
worst case) most probably due to the child’s timetable (13.1% of the recordings), and bad switch-off at the end
of the day (3.6% of the recordings). Finally, 9.5% of the measurements were interrupted because of battery
loss of at least one sensor (6h30 in the worst case). In any case, data was cut at the minimal time shared between
the 4 sensors, resulting in an average of 11±2h of analyzed recordings per day. Globally, the feasibility of such
assessments has been confirmed but several improvements need to be carried out, such as the sensor fixation,
to enhance the usability of IMUs.
Study limitations
Additional study limitations need to be acknowledged. First, the sample size was low, only 29 participants,
and may have weakened the statistical power of the analyses. However, the effect found in the CP group for
the comparison between in-laboratory and daily life median speeds showed a medium substantial difference
(effect size = 0.543) (Sullivan and Feinn, 2012) which is satisfactory for confidence in the results. Next, the
description of the participant’s ambulatory activities showed great differences between week-days and
weekend days activities in both groups. This has previously been demonstrated for children with and without
CP (Rowlands et al., 2008; van Wely et al., 2012). We chose to gather week-days and weekend days to have
a global representation of daily life. Besides, limits related to the use of inertial sensors should be mentioned.
Firstly, the calibration method based on PCA is not the most accurate approach from a biomechanical point of
view. This method was adopted as an optimal solution since an approach based on functional calibration (Favre
et al., 2009) using a pre-defined set of movements was difficult to be envisaged for children with functional
disabilities, especially in the home environment without the supervision of the investigator. The PCA method
is based on the assumption that the pitch angular velocity is maximal in the sagittal plane during forward
walking. This assumption may have induced potential errors, with an impact on the computation of shank and
thigh angles, hence on the walking speed estimation (Aminian et al., 2002), especially for the children with a
high level of impairment, with higher frontal and transverse components at shank and thigh levels during
walking. Second, precautionary measures were applied to avoid the inclusion of non-walking activity into the
analysis. However, we cannot exclude erroneous inclusion of false positives, which can be responsible for the
outliers in the speed distribution (Figure 50). Furthermore, the double pendulum model proposed by Aminian
et al. (Aminian et al., 2002) relies on precise leg dimension (thigh and shank segment lengths) measurements
that can be challenging with patients with bone deformities and joint contractures (Sabharwal and Kumar,
2008). This was also a potential source of errors. Only the right side was arbitrarily chosen, instead of the mean
between the right and left sides, in order to avoid any erroneous calculation coming from right and left values
belonging to non-successive steps. However, the results would have been similar with both methods since right
and left strides parameters are theoretically identical. Last but not least, while walking speed in laboratory is
estimated under same controlled conditions, walking speed in real-life condition is affected by the context
changing the locomotion, e.g. due to crowd, weather, or path properties (Wang and Adamczyk, 2019).
Moreover the power law distribution of walking bouts (Orendurff et al., 2008), involves much more short
walking bouts in daily life corresponding mostly to indoor walking or walking in a room. This study lacks on
context-related information to estimate the speed. This was partly compensated by the fact that only walking
bout more that 10 steps were considered for comparison with laboratory trials. But 10 steps may represent
more than the maximum number of steps taken in a row in the laboratory.

Laboratory versus daily life: the walking speed
130
Perspectives for capacity vs performance comparison
The sensor configuration used in this study was more cumbersome than other single sensor configurations,
such as trunk, waist or wrist-mounted sensors (Anisoara Paraschiv-Ionescu et al., 2019; Soltani et al., 2019;
Zijlstra and Hof, 2003), but was chosen because it was demonstrated to be the most accurate system for walking
speed estimation in children with CP (Carcreff et al., 2018). Furthermore, this configuration has the potential
to quantify various other gait parameters that are of high interest to describe gait deviations like those of
children with CP (Armand et al., 2016). The investigation of gait capacity versus performance based on
multiple parameters constitutes a relevant perspective of this study in order to have a more detailed vision of
the differences between clinical and daily life settings. Moreover, for a direct comparison between parameters
assessed in the laboratory and in daily life, several approaches could be considered such as: including walking
bouts with similar characteristics (distance, time or number of steps) to walking bouts in the laboratory, since
bout length has an impact on gait characteristics (Del Din et al., 2016a); including frequently repeated walking
bouts to eliminate unique behaviors or events from the analysis (Wang and Adamczyk, 2019); using
technological developments such as multimodal sensing (e.g., GNSS, barometric pressure, microphone,
weather records, etc.) to be more precise regarding the contexts, e.g. discriminate between indoor and outdoor,
even and irregular surface, or straight and curved path, detect load carriage, a surrounding crowd or weather
conditions (Wang and Adamczyk, 2019).
7.5 Conclusion
Walking speed was lower during natural walking as compared to laboratory-based walking in the group of
children with CP. Speeds were also highly correlated which means that these children tended to under-use their
gait capacity during daily life walking. In contrast, no difference was found between supervised and
unsupervised walking in controls. Nevertheless, highly heterogeneous behaviors were observed at individual
levels in both groups, and within GMFCS level sub-groups, which indicated that gait performance cannot be
directly estimated from gait capacity. Overall, this study emphasizes the relevance of assessing natural walking
as a complement to current capacity evaluations. Both assessments bring different and complementary
information, which are valuable for clinicians, in the process of treatment planning and follow-up care.

131
Chapter 8 *
Laboratory versus daily life: multifeatures of gait
Abstract
Gait assessments in standardized settings, as part of the clinical follow-up of children with cerebral palsy (CP),
may not represent gait in daily life. This study aimed at comparing gait characteristics in laboratory and real
life settings on the basis of multiple parameters in children with CP and with typical development (TD). Fifteen
children with CP and 14 with TD wore 5 inertial sensors (chest, thighs and shanks) during in-laboratory gait
assessments and during 3 days of daily life. Sixteen parameters belonging to 8 distinct domains were computed
from the angular velocities and/or accelerations. Each parameter measured in the laboratory was compared to
the same parameter measured in daily life for walking bouts defined by a travelled distance similar to the
laboratory, using Wilcoxon paired tests and Spearman’s correlations. Most gait characteristics differed
between both environments in both groups. Numerous high correlations were found between laboratory and
daily life gait parameters for the CP group, whereas fewer correlations were found in the TD group. These
results demonstrated that children with CP perform better in clinical settings. Such quantitative evidence may
enhance clinicians’ understanding of the gap between capacity and performance in children with CP and
improve their decision-making.
* Chapter published as:
Carcreff L., Gerber C.N., Paraschiv-Ionescu A., De Coulon G., Newman C.J., Aminian K. and Armand S. « Comparison
of gait characteristics between clinical and daily life settings in children with cerebral palsy », Scientific Reports, 2020,
vol. 10, num. 2019. doi: 10.1038/s41598-020-59002-6 – with permission of all co-authors
My contributions: Methodology, recruitement, investigation, software, data curation, visualization, formal analysis,
writing – original draft, writing-review & editing

Laboratory versus daily life: multifeatures of gait
132
8.1 Introduction
Cerebral palsy (CP) describes a group of motor disorders resulting from early damage to the developing brain
(Baxter et al., 2007). It is the most frequent motor disability in children, with a prevalence of 1.8 per 1000 live
births in Europe (Sellier et al., 2016). Children with CP have heterogeneous clinical profiles and are classified
into five levels of severity with the Gross Motor Function Classification System (I: independent walker; II:
independent walker with limitations; III: ambulate with walking aids; IV: ambulate with powered mobility;
and V: dependent for all mobility) (Novak, 2014; Palisano et al., 1997). In CP, gait disorders are among the
leading limitations, with a negative impact on participation and self-perception (Frisch and Msall, 2013).
Current management of gait deviations is largely based on assessments of body structures and body functions
of individuals measured in clinical settings (Gerber et al., 2019). ‘Clinical gait analysis’ (CGA) measures
multiple gait parameters in order to identify and understand the main causes of gait deviations (Armand et al.,
2016). Although CGA has become a widely accepted tool in clinical practice, it is not clear whether in-
laboratory assessments reflect the usual walking performance of the patients in daily life. Patients are often
considered to perform better when walking under clinical supervision to please caregivers (Toosizadeh et al.,
2015), known as the ‘Hawthorne effect’ (Berthelot et al., 2011), and thanks to improved concentration in the
absence of external distractors requiring additional attention (Gosselin et al., 2018). Integrating unsupervised
assessments of the patients’ daily walking into the clinical process could improve clinicians’ understanding of
their real behavior and overall difficulties, beyond the observation of functional limitations in a purely clinical
setting (Gosselin et al., 2018).
The link between capacity (what an individual can do in a standardized environment) and performance (what
an individual does do in his usual environment) (World Health Organization, 2002) remains a largely unsolved
question (Holsbeeke et al., 2009). Various interpretations of capacity can be found in the literature. Capacity
can be seen as the best possible level of functioning during short tasks (e.g. assessed by the Gross Motor
Function Measure (GMFM) (Alotaibi et al., 2014) in CP), as the level of functioning during an endurance task
(e.g assessed by the 1- or 6-Minute-Walk Test (1MWT or 6MWT) (Enright, 2003)) or as the spontaneous level
of functioning during CGA (Wilson et al., 2014). For the latter, compound kinematic parameters, such as the
Gait Deviation Index (GDI) or Gait Profile Score (GPS) (Schwartz and Rozumalski, 2008), were mostly
reported (Guinet and Desailly, 2017; Nicholson et al., 2018; Wilson et al., 2015). Performance has mostly been
assessed by self- or parent-report questionnaires about daily life mobility (Graham et al., 2004; Palisano et al.,
1997), physical activity habits and activity limitations(Haley et al., 2010; Young et al., 2000). Thanks to the
increasing availability of wearable motion sensors, objective data about performance is now accessible
(Bjornson, 2019). Daily number of steps, time spent inactive and time spent in moderate-to-vigorous physical
activities (MVPA) are common metrics used to quantify motor performance. Considering this high variety of
metrics and definitions, no consensus has been found on the link between capacity and performance in children
with CP. Capacity seems to exceed performance (Young et al., 1996), however this relationship is not constant
over time and across all GMFCS levels (Ho et al., 2017; Van Gorp et al., 2018). Low to moderate correlations
between capacity and performance were found in the majority of studies (Guinet and Desailly, 2017; Mitchell
et al., 2015b; Nicholson et al., 2018; Wilson et al., 2015; Wittry et al., 2018).
Gait characteristics are measured in the context of a walking activity which can be performed in a standardized
environment, e.g. during CGA, then called walking capacity, or in a usual environment, then called walking
performance. Gait characteristics are related to the body functions (gait pattern functions as classified in the
ICF, WHO (Bertuletti et al., 2019)), in opposition to gait quantity which is rather associated with the amount
and intensity of the ambulatory activity. The previously-mentioned studies essentially demonstrated that gait
characteristics (GDI, GPS, walking speed) measured in the laboratory cannot predict gait quantity in daily life
Laboratory versus daily life: multifeatures of gait
133
(Brandes et al., 2008). To date, data on gait characteristics in daily life settings is lacking, and could bring
additional valuable insights into the motor performance of children with CP.
Gait can be described by multiple features since it involves various physiological systems (Bonnefoy-Mazure
et al., 2015). Distinct domains can depict gait function such as pace, rhythm, variability, asymmetry, postural
control, amplitude, etc. (Ben Mansour et al., 2017; Lord et al., 2013; Thingstad et al., 2015). In the context of
CGA, spatiotemporal, kinematic, kinetic parameters, among others, are commonly assessed. Motion sensors
such as Inertial measurement units (IMU) can quantify several of these gait parameters with a good level of
accuracy in pathological populations (Jarchi et al., 2018; Petraglia et al., 2019; Vienne et al., 2017). In children
with CP, few sensor configurations have been tested. Foot placement accurately estimates spatiotemporal
parameters in children with a low level of disability (Brégou Bourgeois et al., 2014), while sensors on the
lower limbs (shanks and thighs) demonstrated better accuracy for speed estimation in children with higher
levels of disability (GMFCS III) (Carcreff et al., 2018). A sensor located on the trunk was also found to
appropriately measure parameters of postural control (Chen et al., 2017; Saether et al., 2014) and to accurately
estimate cadence (Anisoara Paraschiv-Ionescu et al., 2019). IMUs have the potential to assess gait
characteristics in real life settings and to enable direct comparisons with gait measured in the laboratory.
The purpose of this study was to compare gait characteristics between laboratory and real life settings on the
basis of multiple features representing different aspects of gait, in children with CP and typical development
(TD). The comparisons were based on the evaluation of the difference and the association between parameters
in both environments at the group level.
8.2 Method
8.2.1 Participants
This observational cross-sectional study included a convenience sample of patients diagnosed with CP and
followed at the Geneva University Hospitals, aged between 8 and 20 years and with a level of gross motor
function (GMFCS) between I and III, meaning that they were able to walk independently with or without
mechanical assistance. A group of TD children were also recruited, similar in age and sex. The exclusion
criteria for both groups were the standard criteria that preclude adequate participation to the requested tasks,
such as significant behavioral issues, severe visual disorders, attention deficit or mental age inferior to 8 years.
The protocol was approved by and carried out in accordance with the hospital’s institutional ethical committee
(Cantonal Commission for Research Ethics of Geneva - CCER-15-176). Informed consent was obtained from
a parent, a legal guardian or the participant him/herself (if older than 18 years).
8.2.2 Measurement protocol
This study protocol was twofold. First, the participants performed barefoot standard gait assessments in the
laboratory with the instruction to “walk as usual, as if you were in the street”, as in a CGA protocol. Several
(between 4 and 10) back and forth walking trials over a 10-meter walkway were performed. Second, the
participants were monitored during 3 days including 2 school days and one day of the weekend, for at least 10
consecutive hours. During both assessments, five synchronized IMU-based devices (Physilog4®, GaitUp,
Switzerland) were fixed on the lower limbs (shanks and thighs) and on their chest (Figure 51). Each IMU
comprised a triaxial accelerometer (range ±16g), and triaxial gyroscope (range ± 1000°/s) with a sampling
frequency of 100 Hz. For the in-laboratory measurements, the IMUs were fixed by the investigatorwith
hypoallergenic adhesive films (Opsite Flexigrid, Smith & Nephew Medical, UK). At the beginning of each
day of daily life measures, the IMUs were placed by the parents or caregivers, who received practical training
Laboratory versus daily life: multifeatures of gait
134
(as well as a user guide to support them at home) from the investigator for the IMUs management and
placement, with hypoallergenic double-sided hydrogel stickies (PAL stickies, PAL Technologies Ltd., UK).
The IMUs were also protected from falling with a handmade Elastane sleeve, or under tight pants and socks.
At the beginning of the first (laboratory) assessment, a trained investigator measured anthropometric values
(shank and thigh lengths) and lower limb muscle strength (using the Medical Research Council testing
(Florence et al., 1992)) for each participant. The delay between the two assessments was of 7±3 months, since
the laboratory measurements were performed within an initial technical validation study (Carcreff et al., 2018)
and daily life measurements in subsequent reliability (Gerber et al., 2019) and interventional studies,
constrained by school holidays and logistic issues (number of available sensors). None of the children
underwent surgery or intensive therapy between both measurements.
8.2.3 Pre-processing
Laboratory measures: IMU data recorded continuously by all devices was automatically cropped into several
walking episodes (corresponding to each back and forth trial on the walkway in the laboratory, i.e. excluding
turns). To guaranty reproducible measure and be independent of the IMU location on each segment, lower
limbs sensors were automatically aligned with the functional axis of the movement. To this end, assuming that
the main angular rotation during gait occurs around the medio-lateral axis of each segment, principal
component analysis (PCA) was applied on angular velocity to assess the pitch component of the shanks and
thighs rotation (Falbriard et al., 2018; Mcgrath et al., 2018). For each trial, the norm of acceleration of the
chest was computed, to preclude wrong axis selection resulting from potential misalignment of the sensor with
regard to the chest.
Daily-life measures: Walking episodes were detected within the continuous daily recording using the pitch
angular velocity of both shanks based on the method described by Salarian et al. (2004). The 3D signal of the
longest detected walking bout (WB) was used to determine the PCA coefficients; then, axis alignment was
performed on the entire signal to extract the pitch angular velocity, as for the laboratory assesment. The norm
of acceleration of the chest was also computed for each WB. Only WBs with a minimum of 8 steps were
considered for the next steps, to preclude from the inclusion of too short WB.
8.2.4 Walking bout selection
Since in the laboratory the instruction was to walk continuously along a 10-meter walkway, in this study we
included daily life WBs with a travelled distance corresponding to approximately 10 m (from 5 to 15 m),
without breaks or aberrant gait cycles (resulting from false positive detected gait cycles), in order to represent
similar conditions.
Thresholds for break and aberrant gait cycle definitions were set based on data collected during the standard
laboratory assessment at various speeds, with the same study participants. Details are provided in the
Appendix.
Included WBs were then further characterized as described in the next section, and compared with the WBs in
the laboratory. An overview of data processing is presented in Figure 51.
8.2.5 Walking bout characterization
This study sought to characterize gait function through several aspects, called ‘domains’. For each domain, a
very large number of variables could have been considered so we chose the ones that were the most used in
the literature, and we applied some ‘rules’. The common rules for parameters inclusion were: to avoid
duplication of parameters from one domain to another, and to avoid redundancy of parameters within the same
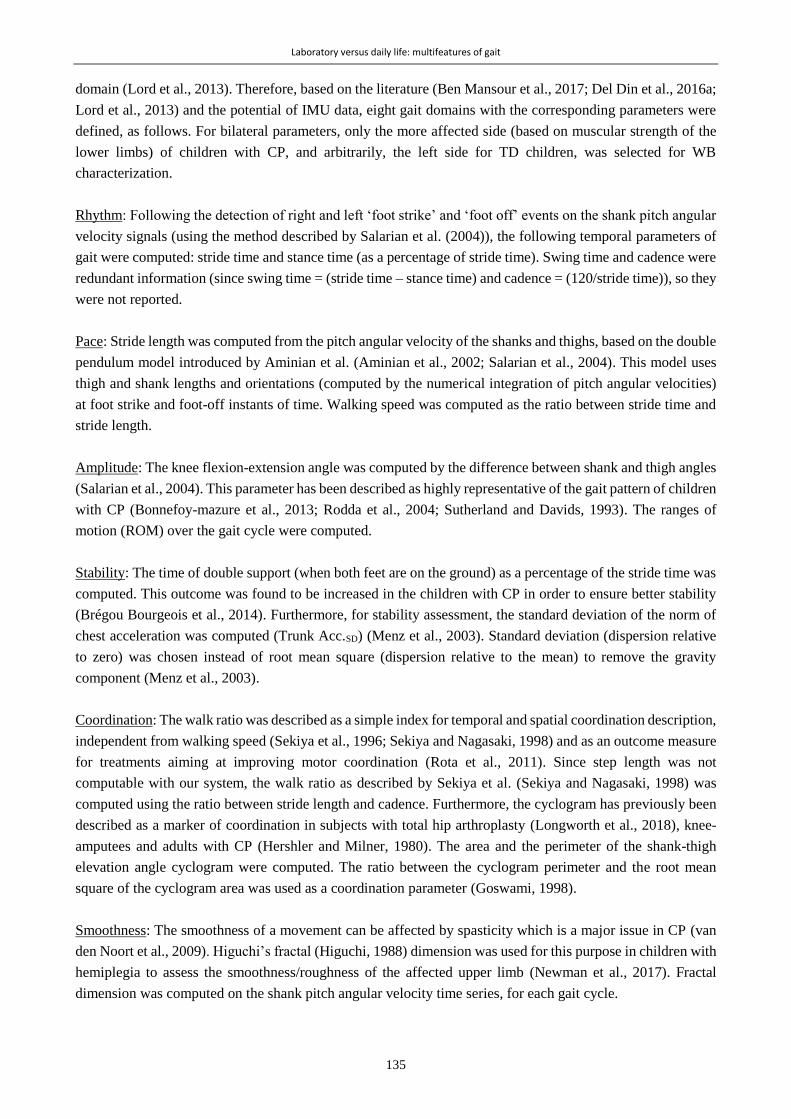
Laboratory versus daily life: multifeatures of gait
135
domain (Lord et al., 2013). Therefore, based on the literature (Ben Mansour et al., 2017; Del Din et al., 2016a;
Lord et al., 2013) and the potential of IMU data, eight gait domains with the corresponding parameters were
defined, as follows. For bilateral parameters, only the more affected side (based on muscular strength of the
lower limbs) of children with CP, and arbitrarily, the left side for TD children, was selected for WB
characterization.
Rhythm: Following the detection of right and left ‘foot strike’ and ‘foot off’ events on the shank pitch angular
velocity signals (using the method described by Salarian et al. (2004)), the following temporal parameters of
gait were computed: stride time and stance time (as a percentage of stride time). Swing time and cadence were
redundant information (since swing time = (stride time – stance time) and cadence = (120/stride time)), so they
were not reported.
Pace: Stride length was computed from the pitch angular velocity of the shanks and thighs, based on the double
pendulum model introduced by Aminian et al. (Aminian et al., 2002; Salarian et al., 2004). This model uses
thigh and shank lengths and orientations (computed by the numerical integration of pitch angular velocities)
at foot strike and foot-off instants of time. Walking speed was computed as the ratio between stride time and
stride length.
Amplitude: The knee flexion-extension angle was computed by the difference between shank and thigh angles
(Salarian et al., 2004). This parameter has been described as highly representative of the gait pattern of children
with CP (Bonnefoy-mazure et al., 2013; Rodda et al., 2004; Sutherland and Davids, 1993). The ranges of
motion (ROM) over the gait cycle were computed.
Stability: The time of double support (when both feet are on the ground) as a percentage of the stride time was
computed. This outcome was found to be increased in the children with CP in order to ensure better stability
(Brégou Bourgeois et al., 2014). Furthermore, for stability assessment, the standard deviation of the norm of
chest acceleration was computed (Trunk Acc.SD) (Menz et al., 2003). Standard deviation (dispersion relative
to zero) was chosen instead of root mean square (dispersion relative to the mean) to remove the gravity
component (Menz et al., 2003).
Coordination: The walk ratio was described as a simple index for temporal and spatial coordination description,
independent from walking speed (Sekiya et al., 1996; Sekiya and Nagasaki, 1998) and as an outcome measure
for treatments aiming at improving motor coordination (Rota et al., 2011). Since step length was not
computable with our system, the walk ratio as described by Sekiya et al. (Sekiya and Nagasaki, 1998) was
computed using the ratio between stride length and cadence. Furthermore, the cyclogram has previously been
described as a marker of coordination in subjects with total hip arthroplasty (Longworth et al., 2018), knee-
amputees and adults with CP (Hershler and Milner, 1980). The area and the perimeter of the shank-thigh
elevation angle cyclogram were computed. The ratio between the cyclogram perimeter and the root mean
square of the cyclogram area was used as a coordination parameter (Goswami, 1998).
Smoothness: The smoothness of a movement can be affected by spasticity which is a major issue in CP (van
den Noort et al., 2009). Higuchi’s fractal (Higuchi, 1988) dimension was used for this purpose in children with
hemiplegia to assess the smoothness/roughness of the affected upper limb (Newman et al., 2017). Fractal
dimension was computed on the shank pitch angular velocity time series, for each gait cycle.

Laboratory versus daily life: multifeatures of gait
136
Variability: Gait variability is known to be higher in children with CP than TD peers in a clinical context
(Brégou Bourgeois et al., 2014; Steinwender et al., 2000). Inter-cycle variability was computed as the standard
deviation for the rhythm and pace parameters (Morris et al., 2017). The standard deviation was preferred to
the coefficient of variation (=standard deviation/mean x 100) for better interpretability and to avoid extreme
values due to low means (Lord et al., 2011).
Asymmetry: Symmetry is a good indicator of gait efficiency (Ben Mansour et al., 2017) and is particularly
impaired in the population with unilateral CP (Saether et al., 2014). The symmetry index (Blazkiewicz et al.,
2014) was computed for the stance time and knee angle since they represent step parameters (in opposition
with stride parameters which combine right and left sides). The symmetry index was chosen since it was
demonstrated to be the most sensitive to detect gait asymmetry from spatiotemporal parameters in healthy
subjects, and the most commonly used in studies reporting symmetry (Blazkiewicz et al., 2014). The limp,
representing the difference between the initial and terminal double support, was also computed (Salarian et al.,
2004)
8.2.6 Data analysis
Non-parametric tests were used in light of the small sample size. Paired Wilcoxon tests were used to compare
the medians of laboratory and daily-life gait parameters. Spearman’s correlation coefficients (rho) were
computed between the laboratory and the daily-life gait parameters. Altman’s guidelines were used to interpret
the correlation: poor, if rho<0.20; fair, if 0.20≤ rho<0.40; moderate, if 0.40≤ rho<0.60; good, if 0.60≤
rho<0.80; and very good, if rho≥0.80 (Altman and Altman, 1999). Alpha was set at 0.05, and the results with
Bonferroni’s correction were also presented. Effect size was computed by dividing the Wilcoxon test statistic
by the square root of the number of observations, as suggested by Pallant et al. (2013).
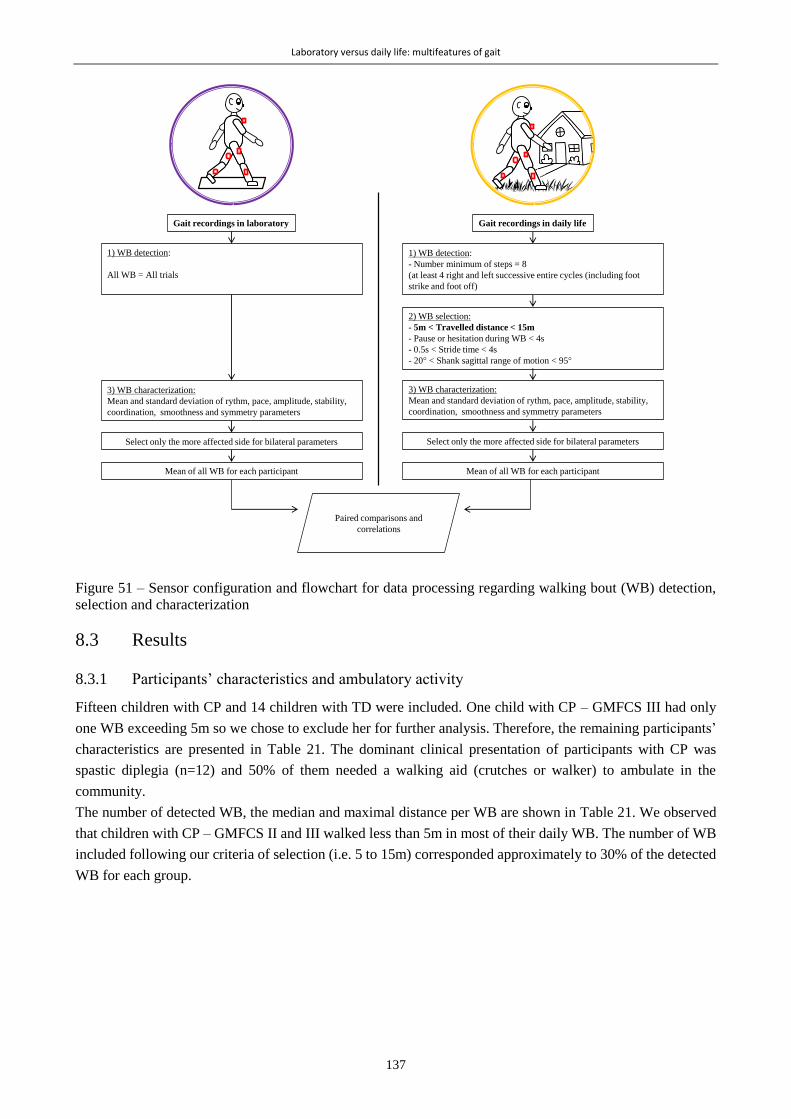
Laboratory versus daily life: multifeatures of gait
137
Figure 51 – Sensor configuration and flowchart for data processing regarding walking bout (WB) detection,
selection and characterization
8.3 Results
8.3.1 Participants’ characteristics and ambulatory activity
Fifteen children with CP and 14 children with TD were included. One child with CP – GMFCS III had only
one WB exceeding 5m so we chose to exclude her for further analysis. Therefore, the remaining participants’
characteristics are presented in Table 21. The dominant clinical presentation of participants with CP was
spastic diplegia (n=12) and 50% of them needed a walking aid (crutches or walker) to ambulate in the
community.
The number of detected WB, the median and maximal distance per WB are shown in Table 21. We observed
that children with CP – GMFCS II and III walked less than 5m in most of their daily WB. The number of WB
included following our criteria of selection (i.e. 5 to 15m) corresponded approximately to 30% of the detected
WB for each group.
Gait recordings in laboratory Gait recordings in daily life
1) WB detection:
- Number minimum of steps = 8
(at least 4 right and left successive entire cycles (including foot
strike and foot off)
3) WB characterization:
Mean and standard deviation of rythm, pace, amplitude, stability,
coordination, smoothness and symmetry parameters
2) WB selection:
- 5m < Travelled distance < 15m
- Pause or hesitation during WB < 4s
- 0.5s < Stride time < 4s
- 20 < Shank sagittal range of motion < 95
Select only the more affected side for bilateral parameters
Paired comparisons and
correlations
Mean of all WB for each participant
1) WB detection:
All WB = All trials
3) WB characterization:
Mean and standard deviation of rythm, pace, amplitude, stability,
coordination, smoothness and symmetry parameters
Select only the more affected side for bilateral parameters
Mean of all WB for each participant

Laboratory versus daily life: multifeatures of gait
138
Table 21– Participants characteristics and proportion of included daily life WB
CP (n=14) TD (n=14)
Age (years) 12.6 [11.4-13.9] 12.3 [11.5-14.5]
Height (m) 1.51 [1.38-1.60] 1.57 [1.47-1.66]
Weight (kg) 43.5 [36.0-50.5] 45.7 [37.7-57.0]
Sex (number of girls) 8 8
ALL (n=14) GMFCS I (n=6) GMFCS II (n=3) GMFCS III (n=5)
Number of detected WB 211 [113-238] 237 [224-271] 183 [139-279.5] 113 [90-113] 335 [265.5-499]
Median distance travelled / WB (m) 6.4 [4.9-7.3] 13 [12-14] 4.9 [4-7] 5.0 [4.1-5.4] 12 [12-14]
Maximal distance / WB (m) 209.4 [48.8-433.1] 420.9 [363.4-464] 322.4 [185.5-505.7] 47.6 [37.7-50.0] 558.7 [375.6-658.3]
Number of included WB (% of detected WB) 30.3 [28.6-35.6] 31.7 [29.7-36.4] 28.5 [20.6-30.6] 30.0 [28.9-36.3] 31.5 [27.4-34.3]
Results are presented as medians [IQR] of the group
8.3.2 Laboratory versus daily life
The results of the comparisons between gait parameters in laboratory and in daily life are presented in Table
22 and illustrated in Figure 52Figure 51 with radar plots for each group. Scatterplots for each parameter, with
the distinction of the 2 groups (CP and TD) and the GMFCS levels can be found in Figure 53. There was a
high inter-subject heterogeneity within the CP group for both settings as represented on Figure 52.
In both groups, all the parameters belonging to the pace and variability domains were significantly (p<0.011)
different between the laboratory and daily life measures; the variability being higher in daily life while the
speed was lower. The difference was more pronounced for TD where also rhythm and asymmetry domains
were significantly (p<0.035) different between the two settings. In both groups, no difference was found for
the amplitude, smoothness and coordination domains, while only double support was found increased in the
stability domain.
In CP, most of the assessed gait parameters across all domains in daily life had good to very good correlations
with the parameters in the laboratory (12/16 parameters with rho≥). The highest correlations (rho≥0.80)
were found for speed, stride length, stride time variability, trunk acc.SD and fractal dimension. In TD however,
correlations were less manifest and fewer parameters were correlated (5/16 parameters with rho≥0.60) between
the laboratory and the daily life. No significant correlation was found in the amplitude, asymmetry, variability,
and smoothness domains.

Laboratory versus daily life: multifeatures of gait
139
Table 22– Laboratory and daily-life based gait parameters for each group
Laboratory Daily life Paired comparison Correlation Variable median IQR [Q1:Q3] median IQR [Q1:Q3] p.value es 95% CI rho p.value
CP
(n
=14
)
RYTHM
Stride time (s) 1.03 [0.98:1.18] 1.25 [1.18:1.32] 0.004 0.501 [-0.25:-0.09] 0.72 0.005
Stance time (%) 58.95 [56.83:62.77] 62.52 [58.13:65.21] 0.119 0.223 [-5.51:0.48] 0.53 0.057
PACE
Speed (m.s-1) 1.15 [0.84:1.27] 0.91 [0.65:1.01] 0.002* 0.553 [0.09:0.26] 0.85 <0.001*
Stride length (m) 1.09 [0.93:1.30] 1.12 [0.79:1.14] 0.011 0.435 [0.03:0.18] 0.88 <0.001*
AMPLITUDE
Knee angle (°) 53.97 [45.78:64.25] 60.19 [52.28:63.6] 0.296 0.101 [-7.76:3.12] 0.75 0.003*
ASYMMETRY
Stance time asy. (%) 4.34 [2.66:5.62] 6.05 [4.41:7.88] 0.194 0.163 [-4.5:0.53] -0.05 0.868
Knee angle asy. (%) 9.89 [7.61:27.5] 12.47 [9.16:14.39] 0.903 0.246 [-4.37:8.2] 0.56 0.042
Limp (%) 4.43 [3.43:6.97] 8.76 [4.26:11.75] 0.002* 0.535 [-4.74:-1.15] 0.65 0.014
VARIABILITY
Stride time var. (s) 0.03 [0.02:0.06] 0.21 [0.12:0.33] <0.001* 0.693 [-0.22:-0.1] 0.90 <0.001*
Stance time var. (%) 2.90 [1.51:3.78] 6.17 [3.74:7.26] <0.001* 0.659 [-4.09:-2.16] 0.74 0.004
Stride length var. (m) 0.04 [0.03:0.05] 0.14 [0.12:0.16] <0.001* 0.693 [-0.12:-0.08] 0.03 0.928
STABILITY
Double support (%) 22.49 [15.62:26.1] 25.94 [20.05:35.59] 0.035 0.342 [-9.5:-0.24] 0.64 0.017
Trunk Acc.SD (m.s-2) 0.24 [0.20:0.26] 0.2317 [0.20:0.27] 0.626 0.061 [-0.02:0.01] 0.91 <0.001*
SMOOTHNESS
Fractal dimension (-) 1.28 [1.21:1.33] 1.28 [1.20:1.30] 0.903 0.246 [-0.02:0.02] 0.93 <0.01
COORDINATION
Walk ratio (x10-2 m.min.step-1) 1.01 [0.88:1.19] 1.1 [0.94:1.17] 0.855 0.2 [-0.09:0.11] 0.74 0.004
Cyclogram (-) 4.58 [4.11:5.30] 4.49 [4.36:5.10] 0.808 0.164 [-0.54:0.53] 0.74 0.004
TD
(n
=14
)
RYTHM
Stride time (s) 1.07 [0.98:1.11] 1.12 [1.08:1.21] 0.001* 0.573 [-0.12:-0.05] 0.75 0.003*
Stance time (%) 58.14 [57.05:60.46] 59.43 [58.64:60.78] 0.035 0.342 [-1.87:-0.23] 0.78 0.002*
PACE
Speed (m.s-1) 1.28 [1.18:1.38] 1.15 [1.11:1.19] 0.001* 0.573 [0.08:0.24] 0.29 0.318
Stride length (m) 1.38 [1.25:1.49] 1.26 [1.20:1.30] 0.001* 0.573 [0.06:0.16] 0.87 <0.001*
AMPLITUDE
Knee angle (°) 66.18 [62.63:66.81] 66.97 [63.44:68.71] 0.542 0.02 [-4.34:2.78] 0.28 0.325
ASYMMETRY
Stance time asy. (%) 1.69 [1.46:2.25] 3.65 [2.90:3.92] 0.011 0.435 [-1.94:-0.84] 0.42 0.141
Knee angle asy. (%) 3.33 [2.89:3.56] 7.40 [5.00:8.05] 0.005 0.484 [-4.71:-1.54] 0.15 0.605
Limp (%) 2.03 [1.62:2.57] 3.49 [3.20:4.017] 0.002* 0.535 [-2.07:-0.95] 0.29 0.318
VARIABILITY
Stride time var. (s) 0.02 [0.02:0.03] 0.10 [0.10:0.11] <0.001* 0.693 [-0.09:-0.08] 0.07 0.820
Stance time var. (%) 1.83 [0.83:2.56] 4.52 [4.16:4.83] <0.001* 0.693 [-3.28:-1.96] 0.20 0.483
Stride length var. (m) 0.03 [0.03:0.04] 0.15 [0.13:0.17] <0.001* 0.693 [-0.13:-0.10] 0.35 0.215
STABILITY
Double support (%) 16.48 [14.56:20.05] 18.79 [17.04:21.02] 0.020 0.387 [-3.45:-0.38] 0.78 0.001*
Trunk Acc.SD (m.s-2) 0.23 [0.21:0.26] 0.25 [0.22:0.26] 0.808 0.164 [-0.04:0.03] 0.35 0.221
SMOOTHNESS
Fractal dimension (-) 1.20 [1.18:1.21] 1.20 [1.19:1.21] 0.54 0.02 [-0.02:0.01] 0.49 0.075
COORDINATION
Walk ratio (x10-2 m.min.step-1) 1.22 [1.10:1.31] 1.13 [1.00:1.29] 0.07 0.282 [0.00:0.11] 0.81 0.001*
Cyclogram (-) 4.64 [4.54:5.14] 4.88 [4.73:5.00] 0.39 0.052 [-0.29:0.13] 0.58 0.033
Var: variability; Asy: Asymmetry; Acc: acceleration; SD: standard deviation; es: effect size, P-values in bold are
<0.05, and a * is indicated if the level of significance after Bonferroni correction (0.003) is reached.
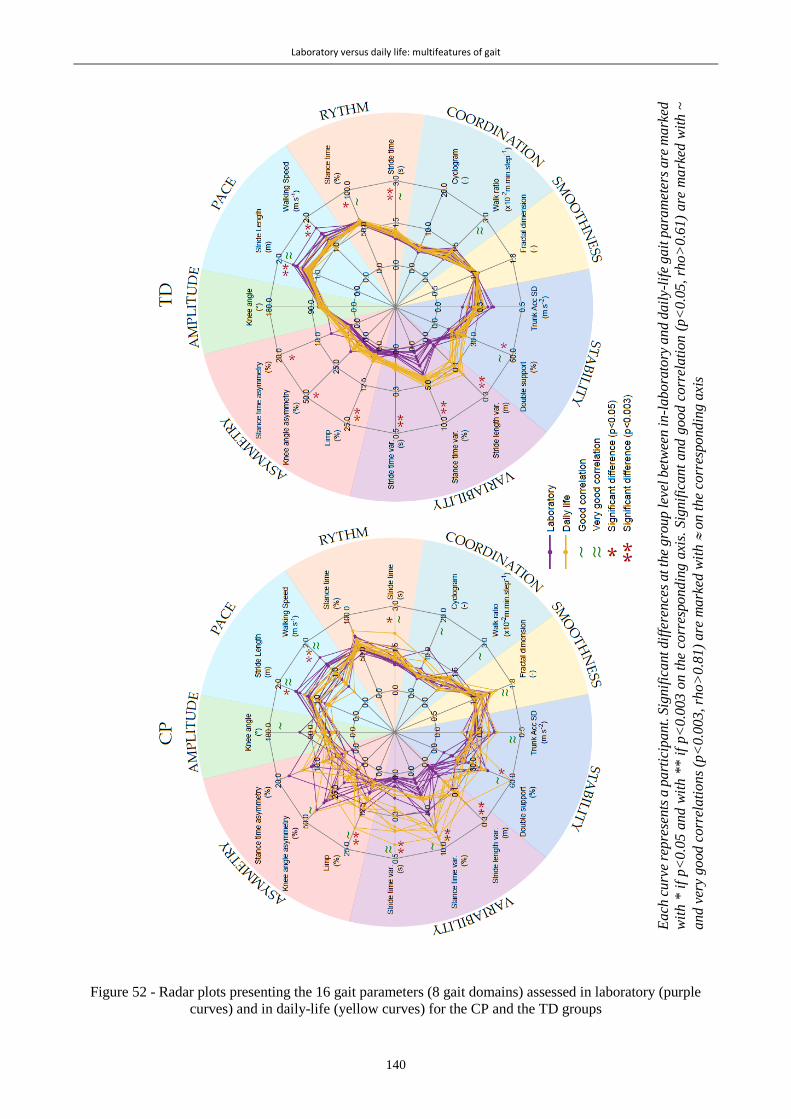
Laboratory versus daily life: multifeatures of gait
140
Figure 52 - Radar plots presenting the 16 gait parameters (8 gait domains) assessed in laboratory (purple
curves) and in daily-life (yellow curves) for the CP and the TD groups
Ea
ch c
urv
e re
pre
sents
a p
art
icip
ant.
Sig
nif
icant dif
fere
nce
s at th
e gro
up lev
el b
etw
een
in
-lab
ora
tory
an
d d
ail
y-li
fe g
ait
pa
ram
eter
s are
ma
rked
wit
h *
if
p<
0.0
5 a
nd
wit
h *
* i
f p<
0.0
03 o
n t
he
corr
espondin
g a
xis.
Sig
nif
icant
and g
oo
d c
orr
ela
tio
n (
p<
0.0
5,
rho
>0
.61
) a
re m
ark
ed w
ith
~
an
d v
ery
go
od
co
rrel
ati
on
s (p
<0.0
03,
rho>
0.8
1)
are
mark
ed w
ith
on t
he
corr
espon
din
g a
xis

Laboratory versus daily life: multifeatures of gait
141
Figure 53 - Scatterplots representing the relationships between gait parameters measured in daily life and in
laboratory for children with cerebral palsy (CP) and typical development (TD)

Laboratory versus daily life: multifeatures of gait
142
8.4 Discussion
The objective of this study was to compare multiple gait parameters between two distinct environments: the
laboratory where the participant is sought to demonstrate the best of himself (Berthelot et al., 2011) (which
can be seen as ‘walking capacity’), and real life where the actual walking habits (‘walking performance’) can
be observed. The main findings were that 1) in contrast to TD, most of the gait parameters of children with CP
were correlated between both environments, and 2) for both groups substantial differences were found between
the settings for most of the parameters, capacity exceeding performance.
While previous studies also emphasized differences between capacity and performance when comparing
laboratory and daily life assessments, our findings suggest a certain correlation between gait parameters
obtained in laboratory and daily life conditions, which is in contrast to previous findings (Guinet and Desailly,
2017; Mitchell et al., 2015b; Nicholson et al., 2018; Wilson et al., 2015; Wittry et al., 2018). The discrepancy
can be explained by the dissimilar definitions and metrics used to reflect walking capacity and performance.
When gait characteristics evaluated in the laboratory at highest or spontaneous level of functioning was
compared to gait quantity in daily life (e.g. total number of daily steps, % spent in MVPA), no correlation was
found, involving that CGA cannot be used to estimate daily life quantity of activity (Brandes et al., 2008). The
strength of our study was to compare (i) the exact same metrics of gait and (ii) during similar length of WB in
both environments, and high correlations for the majority of parameters in CP were found. This indicates that
a child with CP showing higher values in gait parameters measured in the laboratory most probably shows
higher values in the same gait parameters in daily life.
As compared to the CP group, children with TD had fewer correlations between gait parameters in the
laboratory and daily life. First, this can be due to the values’ heterogeneity in the CP group, favoring
correlations, as illustrated in supplementary Fig. S1 (for example, walking speed ranged between 0.65 and 1.27
m/s in CP, whereas it ranged between 1.10 and 1.38 m/s in TD). Second, this can be the reflection of better
capability of children with TD to adapt their gait to the context. This is in agreement with Gosselin et al. who
stated that individuals with decreased capacity may have difficulties to efficiently respond to unpredictability
(Gosselin et al., 2018).
In general, gait function of children with CP and children with TD changed in the same direction, i.e. for
instance, higher variability, lower speed, higher asymmetry, and lower stability in daily life. However, there
where less gait parameters with significant differences between the laboratory and daily life in children with
CP compared to the TD group. This was mostly due to the heterogeneity among children with CP. In fact,
greater variations of the parameters were found in the CP group, than in the TD group. As an example, the
stance duration increased by 3.6% but was not significant (p=0.119) at the CP group level, as compared to
1.3% which was significant (p=0.035) at the TD group level.
This study was the first to compare laboratory versus daily life gait characteristics using identical metrics
belonging to various domains in children. Although mostly correlated, not all the gait characteristics in children
with CP revealed to be different between both contexts of walking. The results showed that the amplitude,
smoothness and coordination domains were similar between both environments for both groups. High
correlations were also found in these domains in children with CP, implying that these domains are inherent
to their gait pattern independently of the walking context. Van der Krogt et al. had similar findings when
simulating an external environment with virtual reality (VR) (van der Krogt et al., 2014), and comparing
kinematic parameters (amplitude domain) of gait during VR and CGA protocols. The variability and
asymmetry of gait were higher in daily life in both groups. This was expected since the environment and tasks
Laboratory versus daily life: multifeatures of gait
143
are more variable in daily life (curved trajectories, inclined or uneven surfaces, obstacles, dual tasking, etc).
However, asymmetry of gait in children with CP did not increase as much as for TD children, so they might
have stayed on safer and more regular paths. The stability tended to decrease in daily life in both groups but
not as significantly as the variability. This was in line with the study of Tamburini et al. which showed that the
regularity of gait was highly altered by the testing conditions and environments, whereas the stability was not
(Tamburini et al., 2018). Finally, pace and rhythm were influenced by the real life context, especially in the
TD group with highly significant increases of stride time and stance duration and decreases of speed and stride
length. The decrease of speed was due to both decreased stride length and increased stride time (i.e. decreased
cadence) in TD, while in CP increase of stride time (i.e. decreased cadence) was the main cause of slower
speed. Results in the rhythm domain were also verified in a recent study of Bisi et al. assessing children with
TD between 6 and 25 years-old in natural and tandem, reflecting challenging walking (Bisi et al., 2019).
This was the first study to select daily life WB according to the distance travelled. Indeed, the original purpose
was to use comparable conditions, using similar metrics. Several previous studies attempted to compare gait
parameters in clinical with free-living settings but did not take the WB properties into account. However,
regardless of pathology, WB length has a high impact on gait parameters (Del Din et al., 2016a; Orendurff et
al., 2008). In a study with patients with Parkinson’s Disease, Del Din et al. described that gait characteristics
in free-living conditions approximated the values of laboratory setting when the duration of the WB
corresponded to the time of the laboratory testing protocol (Del Din et al., 2016a), whereas, for other WB
lengths, substantial differences and low to moderate correlations for all gait parameters (14 parameters) were
found. Selection of WBs may thus be of high importance when comparing laboratory and daily life gait
characteristics. Removing curved gait from the WB selection should also be considered in future studies. In
this study, only the pitch axis of the gyroscope was aligned with the mediolateral anatomical axis, since
functional calibration tasks were difficult to ask to the children, parents or caregivers during the daily-life
measurements. The signals in the two other dimensions, which could have been used to determine turning gait,
were not used.
Considering the distance criteria for WB inclusions, about 30% of daily life WBs was found to represent the
laboratory conditions (standard for all laboratories performing CGA (Baker, 2013)) in each group. Our results
also indicated that these 30% of WBs might represent the longest (in distance) WBs for children with CP,
especially those with a higher level of disability (GMFCS II and III), whereas they could represent the median
WB distance for children with TD and for children with CP with a low level of disability (GMFCS I). This is
in agreement with previous studies stating that children with TD are more active on a daily basis (Bjornson et
al., 2007).
The findings of this study should be interpreted in light of its limitations. First, a low number of participants
were included, lowering the statistical power of the analyses. To help the readers to interpret the significance
of the results, effect sizes were reported and the interpretation of p-values can be adjusted according to
Bonferroni corrections. Increasing the sample size could have strengthened the conclusions and allowed to
divide the CP group into subgroups of severity of the disability (GMFCS levels or laterality of the
impairments). In addition, non-parametric tests were performed due to the low sample size. Confounding
parameters such as age, sex, height, and weight, which were not adjusted for the model, may have influenced
the correlations. Further work investigating this aspect on a bigger cohort should be undertaken.
Laboratory and daily-life assessments were performed months apart. Even if gait is supposed to be stable at
this age, this could have introduced bias due to limited changes in morphology which could induce minor
changes in the gait pattern.

Laboratory versus daily life: multifeatures of gait
144
Next, in this study, only WBs with similar length than laboratory walking were analyzed. This was the chosen
solution to make reasonable comparisons of gait characteristics between two contexts of walking. However,
clinicians might not only be interested in « short » WBs, especially for children with GMFCS I. Hence, this
kind of assessment is intended to be complementary to gait quantity evaluation. Knowing the qualitative
parameters that limit gait quantity on a daily basis could indeed be of high interest, especially for the therapists.
This could inform them about which gait characteristics should be improved to potentially augment walking
quantity.
Regarding IMUs use, the sensor frame alignment was only based on PCA and no conventional functional
calibration was performed since the parents or the caregivers mounted the system during the home-based
measurements. The PCA axis alignment may have introduced a small bias especially for the children with
GMFCS III where transverse and frontal components in the gait pattern are higher than for non-pathological
gait. This may have influenced the results of gait parameters in the amplitude, pace, coordination and
asymmetry domains for which the angular velocity rate was used for their computation. In addition, the double
pendulum model proposed by Aminian et al. (Aminian et al., 2002) relies on precision of leg dimensions (thigh
and shank segments lengths) measurements. Although such a measurement with a tape has proven acceptable
validity and reliability, potential sources of error can arise when doing the measures on patients with bone
deformities and joint contractures (Sabharwal and Kumar, 2008).
Finally, through this study, the feasibility of using IMUs to measure objective parameters of gait function in
daily life settings have been confirmed. Children showed an overall good acceptability of wearing the sensors
since they did not report major issues. However, among all days of measurements, in 27% of the cases, at least
one sensor fixation (PAL stickies, PAL Technologies Ltd., UK) was reported deficient. The problem was fixed
by the participants with additional medical tape provided by the investigator. The parents and the caregivers
did not report any troubles handling the sensors. Among the total days of measurement, 13.1% were interrupted
before reaching 10h of recording (7h50 in the worst case) by the parent or the caregiver, 9.5% of the
measurements were interrupted because of battery loss of at least one sensor (6h30 in the worst case), and
3.6% of the measurements had at least one sensor wrongly switched off at the end of the day. In all of these
cases, we cut the data at the minimal time between the 5 sensors, resulting in an average of 11±2h of analyzed
recordings per day. Several improvements need to be carried out to maximize the potential of IMUs, e.g. by
minimizing the number of sensors and improving the sensor fixation to increase acceptability and performing
a complete sensor calibration to compute absolute angles.
This study highlighted the relevance of wearable gait analysis to improve clinical decision making by
considering free-living parameters. Clinical decision making is indeed mainly based on 3D motion analysis
performed in laboratory settings, when real-life outcomes are the most determinant for children and their
families. Tracking gait function in daily-life thanks to IMUs ensures that the effects of clinical decisions
ultimately generalize into daily settings. Moreover, IMUs are nowadays close to provide data equivalent to
optoelectronic systems, especially kinematics (Cutti et al., 2010), but need more validations in pathological
populations like CP. IMUs have thus the potential to provide a fast, cost-efficient and especially accessible
CGA, which are for now restricted to small selection of clinicians due to high costs in material and resources.
To conclude, IMUs are now ready to complement 3D gait analysis, and may eventually replace optoelectronic
systems once more validation studies will demonstrate their ability to compute kinematics and kinetics. This
will open the possibility to perform CGA not only in gait laboratories but also in local medical care settings.

Laboratory versus daily life: multifeatures of gait
145
8.5 Conclusion
Gait characteristics assessed in a clinical context appeared highly associated with gait characteristics in a daily
life context in children with CP, which was less evident for children with TD. Most gait characteristics
differered between both environments (laboratory vs daily life) in both groups. Parameters assessed in the
laboratory exceeded the parameters measured in daily life (increased stride time, decreased speed, increased
asymmetry, etc.). The present results proved with objective and quantitative evidence that children with CP
perform better in clinical settings. Overall, these exploratory findings emphasized the importance of
performance considerations in future clinical research to improve clinicians’ understanding of the gap between
capacity and performance in children with CP.
8.6 Appendix
Previous collected data to define thresholds
As part of a larger protocol, gait trials at slow and fast self-selected speeds were recorded in addition to
spontaneous gait trials in the laboratory. The extremes values within all participants and all groups (CP and
TD) were used to define the thresholds.
Minimal time to consider a break in WB, was determined as the maximal time found between 2 strides (most
probably during the slow trials)
Aberrant gait cycles were defined from aberrant stride times and shanks sagittal ranges of motion (ROM).
Bounds for aberrant stride times were determined from the minimal (most probably during fast trials) and
maximal (most probably during slow trials) values of stride time. Similarly, bounds for aberrant shank ROM
were determined from the minimal (most probably during slow trials) and maximal (most probably during fast
trials) values of stride time. Values are reported in this table:
Table 23 – Thresholds for break and aberrant gait cycles recognition, defined by data recorded in the labora-
tory
Minimal stride time 0.6s Bounds used for aberrant gait
cycle time Maximal stride time 4s
Thresholds used for break
definition
Minimal shank ROM 25° Bounds used for aberrant
shank ROM Maximal shank ROM 95°
8.7 Additionnal results
Associations between the selected gait characteristics and performance quantity measures such as median and
maximum number of steps have been performed to complement our analysis and replicate the results found in
the literature concerning the link between laboratory-based parameters and performance quantity metrics
(Guinet and Desailly, 2017; Mitchell et al., 2015b; Nicholson et al., 2018; Wilson et al., 2015; Wittry et al.,
2018) (Table 24). While comparing performance characteristics and performance quantity, no correlation was
found except for moderate correlations between the stance duration and the stride length variability with the
maximum number of steps. While comparing capacity characteristics and performance quantity, no correlation
was mostly found. However, moderate correlations were found for the stride time variability, stance duration
variability and the stride length with the maximum number of steps. Besides, two good correlations were found

Laboratory versus daily life: multifeatures of gait
146
indicating that the stance phase duration I positively associated with the median number of steps in dialy life,
and that the limp is negatively associated with the maximum number of steps in daily life.
Table 24 - Associations between gait function and gait quantity (median and maximal number of consecutive
steps) parameters measured in daily life for children with CP
Median Steps Max Steps Median Steps Max Steps
DAILY LIFE
(Performance quantity)
DAILY LIFE
(Performance quantity)
Norm trunk acceleration SD (m.s-2)
DA
ILY
LIF
E
(Per
form
ance
ch
arac
teri
stic
s)
0.43 -0.08
LA
BO
RA
TO
RY
(Cap
acit
y c
har
acte
rist
ics)
-0.03 0.32
Cyclogram perimeter/area ratio (-) 0.15 0.08 -0.05 -0.44
Double support (%) -0.21 -0.40 0.42 -0.47
Stride time (s) -0.09 -0.15 0.26 -0.23
Stride time SD (s) -0.30 -0.46 -0.04 -0.63 *
Knee ROM asy index (%) 0.13 -0.13 -0.09 0.23
Knee ROM (°) 0.20 0.04 0.43 0.44
Limp (%) -0.15 -0.38 0.08 -0.75 **
Shank fractal dimension (-) -0.19 -0.46 -0.17 -0.50
Speed (m/s) 0.15 0.34 0.11 0.64 *
Stance duration asy index (%) 0.09 0.23 -0.05 0.17
Stance duration (%) -0.41 -0.56 * 0.68 ** -0.25
Stance duration SD (%) 0.05 -0.29 -0.31 -0.55 *
Stride length (m) 0.12 0.37 0.24 0.56 *
Stride length SD (m) 0.54 0.59 * 0.05 -0.38
Walk ratio (x10-2 m.min.step-1) 0.11 0.34 0.40 0.22
*: p-value <0.05; **: p-value <0.01; ROM: Range of motion; SD: Standard deviation; Asy: asymmetry
Total, these results were mostly in accordance with previous studies since the majority of our parameters
assessed in the laboratory were not associated with the quantity of walking in daily life. However, we
underlined some good correlations which could be relevant axes for further investigations.

147
CONCLUSION
Part IV
IIIIII

148
149
Chapter 9
General discussion and perspectives
Abstract
This final chapter proposes an overall discussion regarding the doctoral work. First, the main contributions of
the studies included in this thesis are reported. Then, several methodological and clinical aspects are discussed,
linking various chapters with one another. Subsequently, the main limitations are reported, after what some
technical and clinical perspectives are presented.
General discussion and perspectives
150
9.1 Summary of main contributions
The main objective of this thesis was to assess gait of children with CP in a daily life context and compare it
with gait in the laboratory, to gain more insight regarding the comparison between capacity and performance.
For this purpose, two thesis axes were followed. The first was to propose a valid tool for gait assessments in
daily life based on existing methods. Although plenty of tools with appropriate computational methods have
been developed, only a few of them were designed for clinical comprehensive outcomes assessments in
children with CP. Furthermore, most of the systems were not tested in natural conditions. For this technical
part, attention was paid to choose a system providing spatiotemporal parameters (STP) with the highest
possible level of accuracy, since these gait outcomes were promising clinical features to be accurately assessed
in daily life settings. The second axis was to compare gait parameters assessed in, or close to, daily-life
conditions with the same gait parameters assessed in the laboratory during standard CGA protocol. This
clinical part of the thesis adopted a progressive approach, starting with the comparison between standardized
gait and gait under challenging situations (dual tasks) in the laboratory and ending with the actual comparison
between standardized gait and gait in real-life settings. The thesis focused on the evaluation of objective,
accurate and relevant metrics, similar for both environments.
9.1.1 Wearable system for spatiotemporal parameters (Chapter 4)
To choose an appropriate system for STP estimation in children with CP, a comparison of three relevant
existing sensor configurations was undertaken. The requirements were the following:
1) To provide an accurate and precise estimation of the three main STP (stride time, length and velocity)
used in the clinic,
2) To be comfortable for long-term monitoring,
3) To be easy-to-use,
4) To allow the computation of other gait features relevant to the CP population.
The first requirement was assessed through a validation protocol, where children wore several sensor
configurations as well as reflective markers. Reference STP were thus recorded with the clinical standard
(optoelectronic system and force plates) and concurrently STP were computed from the three tested wearable
systems. Accuracy and precision were computed for temporal, spatial and spatiotemporal outcomes in the
groups of TD children, children with CP with a lower level of impairment and children with CP with a higher
level of impairment. This study highlighted variable performances of the systems depending on the sensor
configuration and the level of impairment of the children. Indeed, the configuration using sensors on both feet
was found more accurate for typical and regular gait patterns, while sensors located on the shanks and thighs
performed better for moderate to severely impaired gait patterns. The system using sensors only on the shanks,
which computational method relied on optimization based on adult data, was found not suitable for spatial
outcome estimation in children. Besides, the main inconvenient of the direct integration method, used with the
feet configuration, is that it relies on foot flat instants during midswing of each gait cycle. However, CP gait
pattern is often characterized by an absence of foot flat period.
The second, third and fourth requirements were addressed in the discussion section of the study. Comfort
assessed by informally questioning the children during the measurements. To be independent of shoe-wearing
and allow the monitoring of all gait episodes within a day, feet sensors were fixed directly on the feet, unlike
most studies where sensors were fixed on the shoe (Brégou Bourgeois et al., 2014; Dadashi et al., 2013; Hegde
et al., 2016). While testing this solution during a semi-standardized sequence outside of the laboratory (with
shoes), it proved to be inappropriate for daily life assessment, especially for children wearing Ankle Foot
Orthoses (AFO) who complained about the pain while the sensor was compressed between the foot and the
orthosis. Even if the shank-and-thigh configuration was more cumbersome, sensors were well supported; they
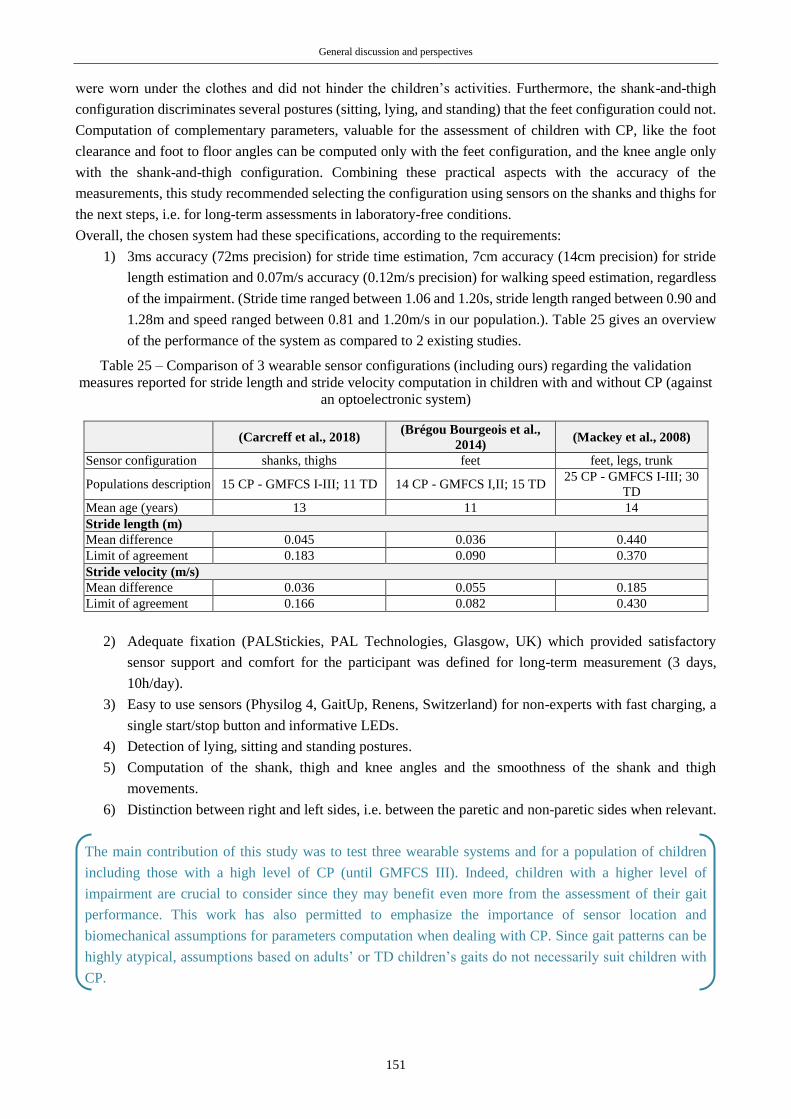
General discussion and perspectives
151
were worn under the clothes and did not hinder the children’s activities. Furthermore, the shank-and-thigh
configuration discriminates several postures (sitting, lying, and standing) that the feet configuration could not.
Computation of complementary parameters, valuable for the assessment of children with CP, like the foot
clearance and foot to floor angles can be computed only with the feet configuration, and the knee angle only
with the shank-and-thigh configuration. Combining these practical aspects with the accuracy of the
measurements, this study recommended selecting the configuration using sensors on the shanks and thighs for
the next steps, i.e. for long-term assessments in laboratory-free conditions.
Overall, the chosen system had these specifications, according to the requirements:
1) 3ms accuracy (72ms precision) for stride time estimation, 7cm accuracy (14cm precision) for stride
length estimation and 0.07m/s accuracy (0.12m/s precision) for walking speed estimation, regardless
of the impairment. (Stride time ranged between 1.06 and 1.20s, stride length ranged between 0.90 and
1.28m and speed ranged between 0.81 and 1.20m/s in our population.). Table 25 gives an overview
of the performance of the system as compared to 2 existing studies.
Table 25 – Comparison of 3 wearable sensor configurations (including ours) regarding the validation
measures reported for stride length and stride velocity computation in children with and without CP (against
an optoelectronic system)
(Carcreff et al., 2018) (Brégou Bourgeois et al.,
2014) (Mackey et al., 2008)
Sensor configuration shanks, thighs feet feet, legs, trunk
Populations description 15 CP - GMFCS I-III; 11 TD 14 CP - GMFCS I,II; 15 TD 25 CP - GMFCS I-III; 30
TD
Mean age (years) 13 11 14
Stride length (m)
Mean difference 0.045 0.036 0.440
Limit of agreement 0.183 0.090 0.370
Stride velocity (m/s)
Mean difference 0.036 0.055 0.185
Limit of agreement 0.166 0.082 0.430
2) Adequate fixation (PALStickies, PAL Technologies, Glasgow, UK) which provided satisfactory
sensor support and comfort for the participant was defined for long-term measurement (3 days,
10h/day).
3) Easy to use sensors (Physilog 4, GaitUp, Renens, Switzerland) for non-experts with fast charging, a
single start/stop button and informative LEDs.
4) Detection of lying, sitting and standing postures.
5) Computation of the shank, thigh and knee angles and the smoothness of the shank and thigh
movements.
6) Distinction between right and left sides, i.e. between the paretic and non-paretic sides when relevant.
The main contribution of this study was to test three wearable systems and for a population of children
including those with a high level of CP (until GMFCS III). Indeed, children with a higher level of
impairment are crucial to consider since they may benefit even more from the assessment of their gait
performance. This work has also permitted to emphasize the importance of sensor location and
biomechanical assumptions for parameters computation when dealing with CP. Since gait patterns can be
highly atypical, assumptions based on adults’ or TD children’s gaits do not necessarily suit children with
CP.

General discussion and perspectives
152
9.1.2 Personalized approach for walking bout detection (Chapter 5)
To evaluate gait parameters in daily life settings, specific walking bout detection is required. Performances of
methods using fixed thresholds for signal features recognition (like the one proposed by Salarian et al. (2004))
tend to decrease when the tested gait patterns are unusual such as slow and/or impaired walking (Bertuletti et
al., 2019; Muñoz-Organero et al., 2017; Sanjay K. Prajapati et al., 2011) like in children with CP, and also
when they are tested in different settings (Pham et al., 2017; Sessa et al., 2015) and footwear (Anwary et al.,
2018a). Alternative approaches were then considered to provide a high level of walking bout detection
specificity. Conventional machine learning approaches were excluded since the required high amount of data
to train the model was not available.
Given that children with CP regularly visit their clinicians (during what they are asked to walk along a short
path in the consultation room for a qualitative observation at least), the idea was to collect information about
the children’s gait pattern during these visits to customized thresholds for walking bout detection in natural
settings.
A CGA protocol followed by a semi-standardized protocol outside of the laboratory and in the hospital
surroundings was set. A sub-set of participants, presenting heterogeneous levels of impairment, were included
in this study to test this alternative walking bout detection approach. Two customized methods and the original
method using fixed thresholds were compared on the basis of sensitivity, specificity, accuracy, and precision
in walking bout detection with regard to a video recording reference during the semi-standardized route. One
customized method used thresholds set for the populations (CP or TD separately), the other used thresholds
set for each individual. The findings were that population-based customization improved walking bout
detection as compared to the original method and that an individual-based personalization improved it even
more, especially with better performance in the detection of true negatives. A certain clinical impact of such
an improvement was demonstrated since the walking speed distribution over a 20-minutes sequence of daily-
life-like activities was found slightly changed: the minimal walking speeds detected increased with the
personalized method. The explanation came from the higher specificity of the method. Indeed, thanks to
adjusted thresholds, non-expected cyclical activities performed in real life such as playing on swings were
more likely excluded. This alternative gait detection method was thus beneficial, not only for patients but for
all the participants. Hence, the individual-based personnalisation was applied in the following clinical studies
(Chapters 7 & 8).
The main contribution of this study was the preliminary investigation of a personalized approach for gait
detection in children with CP. Given inherent inter-individual heterogeneity, the personalization of any data
processing may be beneficial. Furthermore, this personalized approach can be adapted for multiple purposes
and multiple populations.
9.1.3 Standardized gait in laboratory versus gait under dual tasks (Chapter 6)
To begin with the investigations regarding the comparison between gait in laboratory and gait in daily life, a
transitional protocol was set, including the evaluation of gait in the laboratory under challenging, reflecting
ecological situations. Study participants were exposed to cognitive-motor interferences induced by dual task
walking. Walking under dual task is indeed thought to be more representative of daily life walking than
traditional CGA protocols, since cognitive demands constantly arise in real-life situations (physical obstacle,
people talking, street indications, etc.). When increasing the difficulty of the cognitive tasks, we found that
gait abilities decreased, i.e. walking speed, heel clearance and hip range of motion decreased and walk ratio,
stride time and stride length variability increased. These observations were not more pronounced for children

General discussion and perspectives
153
with CP than with TD, since the dual task costs (DTCs) were not higher. However, children with CP did have
poorer capacities in simple task, so they were actually more penalized during dual tasks.
Although this study confirmed the negative effects of dual task while walking in both populations, the main
contributions of this study as compared to existing literature were the findings that DTCs were comparable
in children with and without CP. Interestingly, the same conclusions were drawn later on (November 2019)
by another research group (Palluel et al., 2019). This brought new hypotheses for the underlying mechanism
of cognitive-motor interferences in children. Children with TD may saturate equally their baseline brain
resources during dual tasks. Moreover, the added value of this study was the diversity of outcomes
measured during dual tasks. Not only STP parameters but also kinematics was impacted by the dual tasks.
9.1.4 Standardized gait in laboratory versus gait in daily life (Chapters 7 & 8)
The two last chapters were devoted to the direct comparison between gait assessed in the laboratory and gait
assessed in daily life. The first study intended to understand how fast the children with CP and TD walk in
their daily life as compared to what they show to the clinicians or investigators during clinical assessments.
Using the wearable devices and associated algorithms previously chosen (Chapter 4), walking speed
distribution throughout 3 days was computed. Although at the individual level, children with CP showed
heterogeneous behaviours, at the group level, they showed a lower walking speed in daily life as compared to
the laboratory. Furthermore, a positive high correlation was found between speeds in the laboratory and daily
life for children with CP. Neither significant difference nor correlation was found for children with TD.
The second study focused only on the daily-life walking bouts with a traveled distance equal to the laboratory
walkway length, to compare more equivalent walking contexts. Sixteen parameters, belonging to several gait
domains, were computed and compared. Most of the gait parameters of children with CP were highly correlated
between both environments and the significant differences found were in the way that capacity exceeded
performance. However, these observations were not as obvious and significant for children with TD.
Additionally, weak associations were found between parameters of the gait function assessed in daily life and
indicators of gait quantity like the median and the maximal number of consecutive steps in daily life, which
was more in line with previous literature.
The main contribution of these studies as compared to previous research was the selection of objective and
identical metrics to compare gait in the laboratory, related to capacity, and gait in daily life, related to
performance. Contrary to recent literature, high correlations were highlighted in children with CP between
capacity and performance. The findings indicated that the gait function assessed in the laboratory was a
good indicator of the gait function in real life for children with CP. As compared to children with CP,
children with TD seemed to be more able to adapt their gait to the context as no such correlation was found.
Furthermore, the added value of these studies was the number and the nature of the gait outcomes. To the
candidate’s knowledge, no existing study has assessed gait performance on the base of spatial,
spatiotemporal and angular parameters, and no existing study has selected the daily life WB according to
the traveled distance.
In addition to scientific contributions, these studies had the merit to be the first to evaluate gait function
characteristics in the children’s daily life. They have thus brought useful practical information on the
feasibility of such assessments for future similar protocols.

General discussion and perspectives
154
9.2 Discussion
9.2.1 Wearable system for gait analysis in children with CP
9.2.1.1 Challenge using inertial sensors in CP
CP describes a heterogeneous population characterized by motor disorders affecting variable body parts and
with variable intensities. Children with CP demonstrate thus atypical and variable gait patterns. Even if some
classical patterns have been described in the literature, such as crouch gait, jump knee or true equinus
(Papageorgiou et al., 2019; Rodda and Graham, 2001; Rodda et al., 2004), mixed and atypical disorders can
be found, resulting in unique ways of walking. This is why the assessment of gait with inertial sensors in
children with CP constitutes a major challenge. Indeed, using IMUs for gait analysis entails making
generalizations about expected features to detect (Fasel, 2017). For instance, during gait we expect that the
supporting leg is fully extended during mid-stance so this property can be used to cut the gait cycle. IMUs
measure physical quantity in the local coordinate frame and have the particularity to be subject to drift when
position, speed or orientation are targeted (Kluge et al., 2017). Biomechanical assumptions, based on the
specificity of the monitored activity and population are generally exploited to determine the sensor frame’s
orientation with respect to the body segment’s frame, and to overcome the drift issue (Fasel, 2017). This has
been highlighted in the first study of this thesis (Chapter 4). The common assumption of foot-flat during stance,
used as ‘motionless’ instants for the initialization of acceleration integration (Mariani et al., 2010), is not
achieved by nearly 50% of the CP cases, according to Rodda et al. (2004). Similarly, active or passive limbs
movements used in several methods to align the sensor frame with the body segment’s frame, called ‘functional
calibration’ (Favre et al., 2009), cannot be well achieved by nearly all the patients with CP since they
practically all have joint contractures or bone deformities (Gage et al., 2009), preventing from reaching full
extension of certain joints. New and individualized rules need to be determined for gait analysis in CP. Indeed,
the heterogeneous characteristic of CP leads to personalized, patient-tailored approaches. This idea was
succinctly developed in the second study of this thesis (Chapter 5) and revealed to be relevant. Further works
in this direction are recommended.
9.2.1.2 Sensor configuration: compromises between accuracy, inconvenience, and relevance
For daily life monitoring, the idea is to record motion in the long term. Therefore, on one hand, the wearable
system has to be the least disturbing for the patient (small sensors, low number of sensors, light and painless
fixation, high autonomy, etc.). On the other hand, the system should allow detecting diverse activities and
posture in order to allow drawing a true picture of the subject’s panel of activities within a day. Similarly, for
motion capture, systems allowing the measurement of a higher number of features for the computation of
comprehensible and relevant outcomes confer a substantial advantage for gait analysis (Attal et al., 2015;
Paraschiv-Ionescu et al., 2012). Obviously, increasing the number of sensors lowers the comfort for the
participant but strengthens the performance of the algorithms and increases the number of additional outcomes
and features detectable. A smart compromise needs then to be found between accuracy, the number of
outcomes and inconvenience for the patient. The choice of the most appropriate wearable system (Chapter 4)
was indeed made in accordance with this compromise.
A single trunk sensor configuration was further proposed by our research team for walking bout and cadence
detection in children with CP and TD (Anisoara Paraschiv-Ionescu et al., 2019). Despite its higher convenience
and the overall good accuracy (up to 2%) and precision (up to 9%) for cadence estimation, this sensor
configuration permitted only the detection of a single temporal parameter. Further work is indeed necessary to
increase the potential of single-senor configurations.
General discussion and perspectives
155
A compromise between the accuracy of the system and the clinical relevance of the assessment is to be found
too. The study in chapter 4 has also emphasized a decrease of algorithm performances with regard to the level
of impairment of the child. However, children with a higher level of impairment, i.e. who walk very slowly
with small steps, constitute the target population of high interest for measurement of community-based walking
in order to plan an intervention (Bjornson, 2019).
Universal recommendations cannot be suggested. Every clinical application should drive its choice of sensor
configuration (Del Din et al., 2016c), sensor fixation and expected performance.
9.2.1.3 Clinical meaning of wearable’s outcomes
Clinicians and therapists are interested in knowing more about how their patients behave outside of the clinic.
Investigations were only carried out through questionnaires until the advent of technological solutions which
provided objective outcomes. Pedometers and accelerometers, which detect impacts during locomotion, were
extensively used in clinical research to evaluate physical activity (Yang and Hsu, 2010). The majority of
existing literature on the use of wearable devices in children with CP concerned pedometers and accelerometers
with limited outcomes like the number of steps, intensity, and frequency of physical activity (section 1.3.3.3,
Chapter 1, (Hsu et al., 2018)). A well known and highly-used commercial accelerometer (Actigraph, USA)
converts the magnitude of acceleration into ‘activity counts’ representing the estimated intensity of activity
during a period of time (called epoch). Although activity counts appear, at first, very simple to understand for
non-experienced users, their computation relies on empirical thresholds, which makes difficult the comparison
between studies (Banda et al., 2016). Furthermore, researchers and clinicians using such accessible devices
can be confused. Bjornson K. (2019) has pointed out that some can mix physical activity and walking.
Similarly, according to Palisano R.J. (2012), authors may give inappropriate recommendations to increase
physical activity by increasing their total daily number of steps whereas joint protection has to be considered
for some patients like those with CP. Physical and clinical meanings of wearable’s outcomes need to be
considered intelligently to take the best advantage of them.
In this thesis, we chose to compute CGA-like parameters, i.e. reflecting gait characteristics, so that there will
be higher chances to be understood and properly used by the clinicians.
Several studies took advantage of acceleration and angular velocity raw data to compute some clinical indexes
(Chen et al., 2017; Menz et al., 2003; Rueterbories et al., 2013). The movement smoothness is also commonly
studied with IMU data (Brach et al., 2011; Chen et al., 2017; Menz et al., 2003; Newman et al., 2017) and we
actually computed it in the last study of this thesis. It revealed to be a discriminative parameter between
children with CP and with TD, since very good correlation was found between the laboratory and the real life
in children with CP but no correlation in children with TD. The principal drawback of these new parameters
is the lack of representativeness. The collection of a high amount of data from healthy participants is then
needed to set normative values in order to help the understanding of the index or the new metric. Such
parameters, that are unusual in clinical practices today, could constitute tomorrow’s common gait parameters.
To conclude, IMUs can provide many outcomes possibilities and offer new pieces of information about
patients’ gait or physical activity that are relevant for clinicians. However, it is necessary to work on data
presentation for clinical considerations.
9.2.1.4 Wearable’s validity for clinical purposes
Very affordable mainstream gadgets like fitness trackers or pedometer application for smartphones, have
overwhelmed the market over the past few years and still continue (Shin et al., 2019). Shin et al. reported that
the overall market of commercial wearable activity trackers, such as Fitbit (Fitbit inc., USA), Xiaomi (Xiaomi
inc, China) and Apple Watch (Apple, USA) is expected to grow from 113.2 million units sold in 2017, to 222.3
million in 2021, according to the International Data Corporation Worldwide Quarterly Wearable Device (Shin
General discussion and perspectives
156
et al., 2019). Beyond the mainstream use, such consumer wearable pieces of equipment and mobile
applications are of high interest for clinical applications. However, the drawback of this new fashion
phenomenon is that devices are developed but are rarely validated against a gold standard (only 5% formally
validated (Peake et al., 2018)). For instance, the accuracy of step counting of one of the most popular fitness
trackers (Fitbit Flex, USA) was assessed on healthy adults in controlled and free-living settings (Feehan et al.,
2018). Accurate measures (i.e. within ±3% for the laboratory conditions and within ±10% for the free-living
conditions) were provided by the device only in 50% of the cases. While certain users of such commercial
device can show a poor interest in device accuracy (Shin et al., 2019), clinicians certainly seek for the most
accurate devices. Their validity (accuracy, precision, repeatability) needs to be carefully considered for clinical
applications such as gait analysis in children with impairment, from what therapeutic decisions can arise. One
can observe that the results found regarding the difference between spatiotemporal parameters assessed in the
laboratory and the daily life (Chapter 8) were borderline with our system’s precision. This is typically crucial
information to give to the clinicians before any interpretation of the results any the case of a real clinical
application.
9.2.1.5 Challenges related to measures in daily life
Measurements in daily life, i.e. real-world situations, are by essence not controlled which constitutes the major
advantage from a clinical point of view but also the major drawback from a methodological point of view (Del
Din et al., 2016a). Several aspects of real-world assessments were addressed in this doctoral work concerning
the methodological feasibility. Apart from the sensor configuration which is more specific to the population
and the application (section 9.2.1.2), sensor fixation, sensor autonomy, and easiness of use are crucial criteria
for the success of any real-life measurements. The sensor fixation determines the convenience to wear the
sensors and the consistency of the recordings, e.g. if the sensor fixation is not appropriate, the sensor can fall
off obliging the participant to relocate it. A large proportion of studies used an elastic belt to fix a sensor
located at the lower back (Van Ancum et al., 2019) but relative displacements of the sensor with regard to the
body is expected with such a system. The main solutions reported in the literature for other sensor
configurations are adhesive tape, surgical tape, elastic straps or Velcro straps which prevent from relative
movements (Fong and Chan, 2010). We opted for a double-sided hydrogel (PALsticky, PALtechnology) which
conferred the substantial advantage to be pain-free and re-usable. This solution was adopted by other research
groups (Del Din et al., 2016c, 2016b; Morris et al., 2017; Tang et al., 2013), covered with an additional
adhesive film. However, wearing adhesive tape or sticky for about a week of measurement may cause skin
irritations (Stanton et al., 2014) especially for patients who suffer from hyper-sensibilities like children with
CP. This is why Elastane sleeves were designed for protection to avoid using an additional adhesive tape but
several participants reported that one sensor fell or was about to fall. Quite a few cases (27%) were concerned
by this issue. Thus, the perfect sensor fixation is still to be found to ease as much as possible patient’s long
term monitoring. The sensor battery autonomy determines the number of times that the participant needs to
handle the sensors (turning off, charging, changing fixation, turning on, etc.). It can be considered that the less
the participant has to touch the sensor, the better. For this purpose, single accelerometer located at the lower
back shows to be the best option, if the battery can last about a week or more (Del Din et al., 2016a; Morris et
al., 2017; Supratak et al., 2018; Van Ancum et al., 2019). In our case, the sensor autonomy was around 10 to
15 hours due to the enabled gyroscope, the sampling frequency set at 100Hz and the synchronization between
sensors. Families had to take care of sensor recharging and repositioning everyday day, increasing the risk of
technical problems. Lastly, the easiness of use determines the amount of missing data. If the sensors are
difficult to turn on and off, there is more chance that at least one sensor does not record properly. In this
doctoral project, 3.6% of the data were concerned about this issue. A compromise has to be found also between
comfort and consistency of the recordings.
General discussion and perspectives
157
9.2.1.6 Knowledge of the context
Another aspect addressed in this thesis related to the challenge of daily life measures is the absence of
knowledge of the context of walking. Indeed, while monitoring a patient in his daily life, information about
the context of walking is not available as this is difficult to obtain unless using an additional system such as a
GPS (Wang and Adamczyk, 2019) or an embedded camera (Hickey et al., 2017a). The use of such additional
devices is however problematic due to privacy issue, especially in children. To minimize the lack of knowledge
of the context, various solutions have been proposed. First, a minimal number of steps per walking bout is
usually set to avoid the inclusion of non-purposeful walking (Del Din et al., 2016c; Hickey et al., 2017b).
However, such minimal threshold is difficult to define. Several approaches proposed in the literature relied on
the inclusion of prolonged walking bouts (>60 seconds for instance) to capture steady-state walking (Del Din
et al., 2016b; Hickey et al., 2017b). However, it has been demonstrated that short walking bouts constitute the
majority of ambulatory activities (Orendurff et al., 2008). Especially in pathological populations such as
children with CP who have very limited walking abilities, e.g. who cannot walk more than 20 steps in a row,
it is not relevant to apply this cut-off. In our study (Chapter 7), we chose to include walking bouts longer than
10 steps and took the whole gait characteristic distribution into account. In addition, inclined and curved paths
can be detected with appropriate machine learning techniques (Aminian et al., 1995a) and 3D sensor
alignement (Mariani et al., 2010) using the different IMU modalities. Finally, multimodal devices (e.g., Global
Navigation Satellite System (GNSS), barometric pressure, microphone, weather records, etc.) could be
considered for more information regarding the contexts (Wang and Adamczyk, 2019). This is discussed in the
following perspectives section (9.4.1.4).
9.2.2 Gait in laboratory versus daily life
9.2.2.1 ICF model
The ICF model (World Health Organization, 2002) was initially set to move the focus from the pragmatic
impairments of individuals with a disability to the impact of their impairments on their personal and social
aspects (Fauconnier et al., 2009).
Functions, activity and participation
The ICF proposed reciprocal relations between body structures and functions, activity, participation
(involvement in a life situation), and personal and external environmental factors (Bjornson et al., 2013) as
described in the introduction of this thesis (section 1.3.2.1). However, those relations may not be equally
balanced. Fauconnier et al. have shown with a cohort of 818 children with CP across Europe, that gross and
fine motor disorders, intellectual disability, communication issues, and pain were significantly associated with
lower participation, whereas sociodemographic, i.e. external and personal factors were not (Fauconnier et al.,
2009). In fact, activity is at the center of the latest definition of CP (Bjornson et al., 2013; Rosenbaum and
Dan, 2019): “a group of permanent disorders of the development of movement and posture, causing activity
limitation, that are attributed to non-progressive disturbances that occurred in the developing fetal or infant
brain.” (Bax et al., 2005). Activity and participation are tightly interlinked. However, capacity (what the
individual can do in a standardized environment) and performance (what an individual does in his actual
environment), which are both qualifiers of activity, may not act equally on participation. Bjornson et al. have
indeed demonstrated that the relation between capacity and the overall frequency and diversity of participation,
assessed through questionnaires, is mediated by the performance (Bjornson et al., 2013). Ultimately, regardless
of the motor functions and activity limitations, participation is at the forefront of clinicians’ and therapists’
concerns (Bjornson et al., 2013) since it is associated with well being (Omura et al., 2018). This is why
performance assessment have gained that much interest.
General discussion and perspectives
158
Proposition of an adapted ICF model fitting the walking activity in children with CP
This thesis aimed to integrate ICF concepts to try better understanding the discrepancy between both constructs
of activity: capacity and performance. We tried to propose an adaptation of the ICF components to the CP
condition integrating the notions previously discussed (Figure 54).
The ‘Body Function and Structure’ of interest is thus the ‘gait pattern function’ (b770) defined in the ICF as
“Functions of movement patterns associated with walking” (Schiariti, 2014) appertaining to the
‘Neuromusculoskeletal and movement-related functions’ (b7) (Schiariti et al., 2014b). The gait pattern
function is recruited for the ‘walking’ (d450) activity defined as “Moving along a surface on foot, step by step,
so that one foot is always on the ground” (Schiariti, 2014). Walking has been divided into gait capacity and
performance, as suggested by the ICF. To complement this model we divided them into ‘characteristics’ and
‘quantity’, which can be associated with the recently proposed terminologies ‘micro’ and ‘macro’ structure of
gait (where ‘micro’ structure refers to discrete gait characteristics contained in walking bouts and ‘macro’
structure refers to the volume, i.e. the quantity of gait) (McArdle et al., 2018). In our proposed terminology,
gait capacity quantity refers to walking endurance in a standardized environment (e.g. under the instruction to
“walk as long as possible” or during the 6MWT (Maher et al., 2008)). This aspect was not evaluated in this
thesis, but was found poorly associated with gait capacity characteristics (assessed through GDI) in some
studies (Maanum et al., 2012; Wilson et al., 2015). Gait performance quantity refers to the amount of
ambulatory activity detected in the children’s daily life (e.g. step count) and was found not associated to gait
performance characteristics, with the exception of few moderate correlations (additional results in Chapter 8).
The study in chapter 8 has pointed out that gait characteristics measured in clinical conditions, which constitute
the current standard condition for gait evaluation in CP, are highly associated with the gait characteristics in
daily life. This was not verified previously in the literature when comparing gait characteristics in the
laboratory with gait quantity in daily life (Guinet and Desailly, 2017; Nicholson et al., 2018; Wilson et al.,
2015). Figure 54 illustrates this adapted model of the ICF highlighting the associations found in previous
studies and in the current doctoral studies. The generic scheme of the ICF is provided in Chapter 1, page 16.
Given the set-up used in this thesis, further relevant work could be now to determine the predictors of the gait
performance quantity or characteristics that can be measured in the laboratory (i.e. gait capacity predictors).
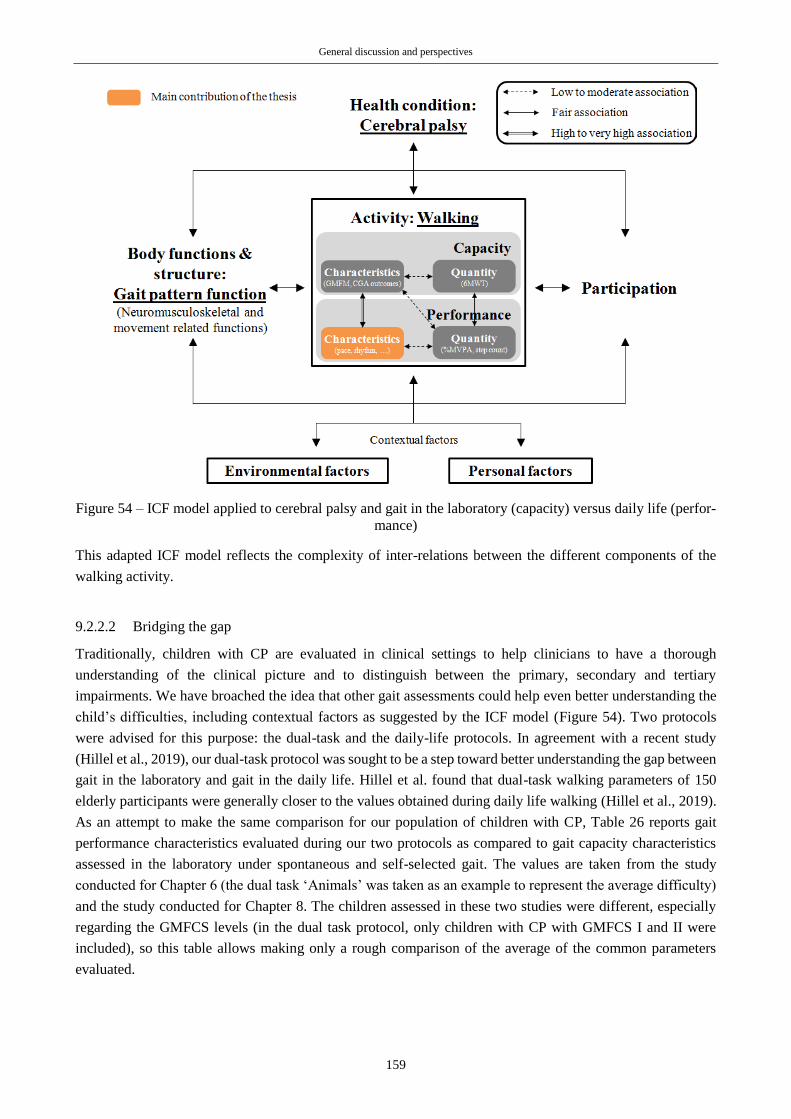
General discussion and perspectives
159
Figure 54 – ICF model applied to cerebral palsy and gait in the laboratory (capacity) versus daily life (perfor-
mance)
This adapted ICF model reflects the complexity of inter-relations between the different components of the
walking activity.
9.2.2.2 Bridging the gap
Traditionally, children with CP are evaluated in clinical settings to help clinicians to have a thorough
understanding of the clinical picture and to distinguish between the primary, secondary and tertiary
impairments. We have broached the idea that other gait assessments could help even better understanding the
child’s difficulties, including contextual factors as suggested by the ICF model (Figure 54). Two protocols
were advised for this purpose: the dual-task and the daily-life protocols. In agreement with a recent study
(Hillel et al., 2019), our dual-task protocol was sought to be a step toward better understanding the gap between
gait in the laboratory and gait in the daily life. Hillel et al. found that dual-task walking parameters of 150
elderly participants were generally closer to the values obtained during daily life walking (Hillel et al., 2019).
As an attempt to make the same comparison for our population of children with CP, Table 26 reports gait
performance characteristics evaluated during our two protocols as compared to gait capacity characteristics
assessed in the laboratory under spontaneous and self-selected gait. The values are taken from the study
conducted for Chapter 6 (the dual task ‘Animals’ was taken as an example to represent the average difficulty)
and the study conducted for Chapter 8. The children assessed in these two studies were different, especially
regarding the GMFCS levels (in the dual task protocol, only children with CP with GMFCS I and II were
included), so this table allows making only a rough comparison of the average of the common parameters
evaluated.
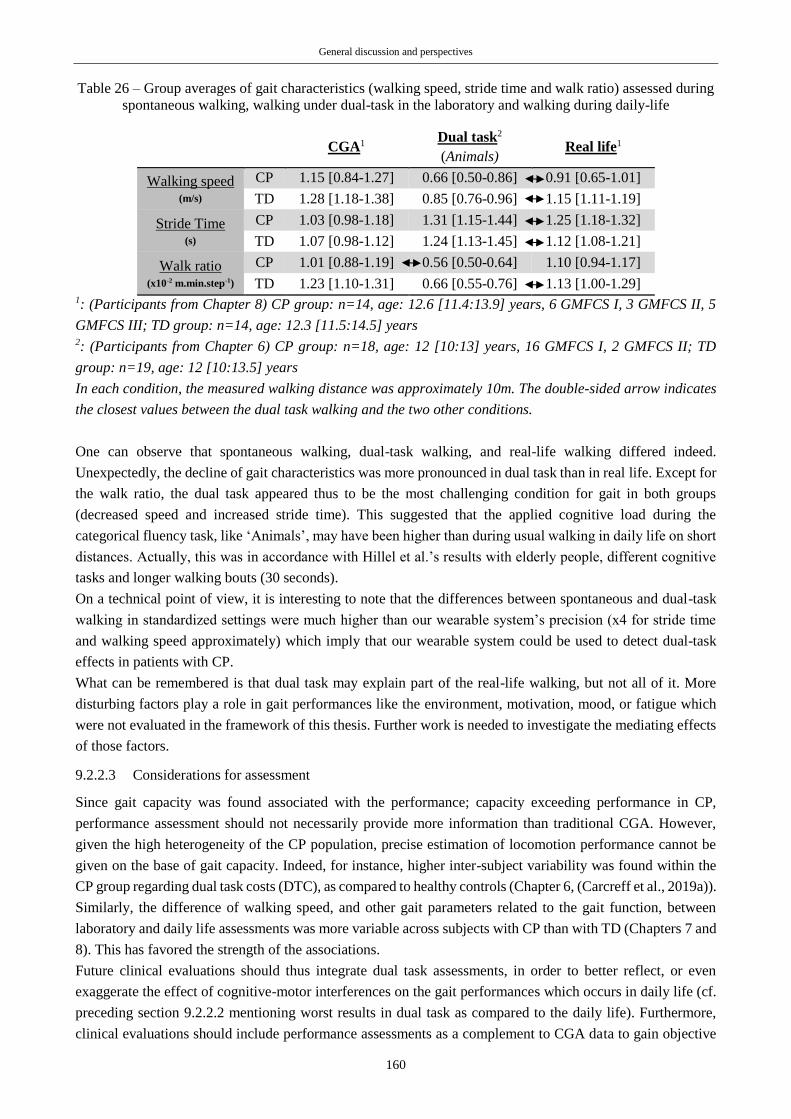
General discussion and perspectives
160
Table 26 – Group averages of gait characteristics (walking speed, stride time and walk ratio) assessed during
spontaneous walking, walking under dual-task in the laboratory and walking during daily-life
CGA1 Dual task2
(Animals) Real life1
Walking speed (m/s)
CP 1.15 [0.84-1.27] 0.66 [0.50-0.86] 0.91 [0.65-1.01]
TD 1.28 [1.18-1.38] 0.85 [0.76-0.96] 1.15 [1.11-1.19]
Stride Time (s)
CP 1.03 [0.98-1.18] 1.31 [1.15-1.44] 1.25 [1.18-1.32]
TD 1.07 [0.98-1.12] 1.24 [1.13-1.45] 1.12 [1.08-1.21]
Walk ratio (x10-2 m.min.step-1)
CP 1.01 [0.88-1.19] 0.56 [0.50-0.64] 1.10 [0.94-1.17]
TD 1.23 [1.10-1.31] 0.66 [0.55-0.76] 1.13 [1.00-1.29] 1: (Participants from Chapter 8) CP group: n=14, age: 12.6 [11.4:13.9] years, 6 GMFCS I, 3 GMFCS II, 5
GMFCS III; TD group: n=14, age: 12.3 [11.5:14.5] years 2: (Participants from Chapter 6) CP group: n=18, age: 12 [10:13] years, 16 GMFCS I, 2 GMFCS II; TD
group: n=19, age: 12 [10:13.5] years
In each condition, the measured walking distance was approximately 10m. The double-sided arrow indicates
the closest values between the dual task walking and the two other conditions.
One can observe that spontaneous walking, dual-task walking, and real-life walking differed indeed.
Unexpectedly, the decline of gait characteristics was more pronounced in dual task than in real life. Except for
the walk ratio, the dual task appeared thus to be the most challenging condition for gait in both groups
(decreased speed and increased stride time). This suggested that the applied cognitive load during the
categorical fluency task, like ‘Animals’, may have been higher than during usual walking in daily life on short
distances. Actually, this was in accordance with Hillel et al.’s results with elderly people, different cognitive
tasks and longer walking bouts (30 seconds).
On a technical point of view, it is interesting to note that the differences between spontaneous and dual-task
walking in standardized settings were much higher than our wearable system’s precision (x4 for stride time
and walking speed approximately) which imply that our wearable system could be used to detect dual-task
effects in patients with CP.
What can be remembered is that dual task may explain part of the real-life walking, but not all of it. More
disturbing factors play a role in gait performances like the environment, motivation, mood, or fatigue which
were not evaluated in the framework of this thesis. Further work is needed to investigate the mediating effects
of those factors.
9.2.2.3 Considerations for assessment
Since gait capacity was found associated with the performance; capacity exceeding performance in CP,
performance assessment should not necessarily provide more information than traditional CGA. However,
given the high heterogeneity of the CP population, precise estimation of locomotion performance cannot be
given on the base of gait capacity. Indeed, for instance, higher inter-subject variability was found within the
CP group regarding dual task costs (DTC), as compared to healthy controls (Chapter 6, (Carcreff et al., 2019a)).
Similarly, the difference of walking speed, and other gait parameters related to the gait function, between
laboratory and daily life assessments was more variable across subjects with CP than with TD (Chapters 7 and
8). This has favored the strength of the associations.
Future clinical evaluations should thus integrate dual task assessments, in order to better reflect, or even
exaggerate the effect of cognitive-motor interferences on the gait performances which occurs in daily life (cf.
preceding section 9.2.2.2 mentioning worst results in dual task as compared to the daily life). Furthermore,
clinical evaluations should include performance assessments as a complement to CGA data to gain objective
General discussion and perspectives
161
information on the gait function in the actual real life of the patient. This has been recently highlithed in a
recent review published in the Lancet Neurology (Warmerdam et al., 2020), where it is stated that data
collected in ecological environnements can indeed help capture long term, fluctuating or rare occurring events
which have the high potential to support clinical decision making. The authors of this review proposed a
comparison of various parameters related to gait and posture between the supervised and unsupervised
environments in the elderly population, and pathological populations of patients with PD and Multiple
Sclerosis. In accordance with our results in children with CP, substantial differences were found (Warmerdam
et al., 2020).
For now, wearable systems present several limitations that preclude to measure as many gait parameters and
as accurate as in laboratory settings. Therefore, performance assessment, i.e. the assessment of the gait function
in a natural environment, and laboratory-based assessment like CGA complement one another. Integrating
ecological protocols into the clinical routine should then be advised in addition to CGA.
The evaluation of surgery outcomes through the measure of quantity of walking activity was proposed by
Nicholson et al. (2018), but they found weak correlations between the change in gait capacity characteristics
(assessed by the GDI) and the change in gait performance quantity (daily number of strides). We suggest that
surgery outcomes, as well as the outcomes from other type of interventions, such as intensive physiotherapy,
electrostimulation, medication or orthosis, could also be explored in daily life through gait characteristics
evaluation.
9.2.2.4 Considerations for interventions
Traditionally, clinicians focused on body functions and structures reinforcement in clinical settings and
assumed that the benefits will be transferred to real life. Our findings indeed suggested that gait function
disorders can be trained or corrected in standardized settings to help the child to improve his gait function in
daily life. But we have also highlighted the gap between activity constructs, capacity and performance. More
and more therapeutic programs aim at minimizing this gap, which means finding strategies allowing children
to fully exploit their capacity in daily life.
Dual-task protocols have great potential for this purpose. Benefits of dual-task training have indeed recently
been demonstrated in several populations (Conradsson and Halvarsson, 2019; Liu et al., 2017; Wollesen et al.,
2017; Yang et al., 2019), and also in children with unilateral CP (Elhinidi et al., 2016). The training protocol
proposed by Wollesen et al. (2017) draws particular attention since it is very detailed and complete. It consisted
of two phases with increasing difficulty, during which patients were asked to perform tasks in conditions
mimicking those of daily living. Meanwhile, the investigator provided strategies to deal with the disturbances.
This kind of program could indeed constitute a very relevant training for children with CP who experience
great difficulties dealing with cognitive-motor interferences.
Furthermore, performance-based training at home can be considered. Home-based training has already been
tested and has shown good results to improve upper-body function (Hung et al., 2018; Lorentzen et al., 2015),
balance (Katz-Leurer et al., 2009), walking abilities and daily activities (Bilde et al., 2011; Lorentzen et al.,
2015) in children with CP. Indeed, this improvement can be due, on one hand, to the child and the family’s
responsibility-taking in the training process while doing exercises at home (Bilde et al., 2011; Hung et al.,
2018) and on the other hand, to the time extension of training as compared to physiotherapy sessions only
(Bilde et al., 2011). Furthermore, these therapies are ‘task-oriented’; hence they allow the child training in
practical and realistic situations. A fair analogy with sport training was proposed by Bjornson K. (Bjornson et
al., 2013). Although stationary exercises, treadmill sessions and weight workouts are necessary for the athlete’s
preparation, the actual practice of the activity in a real environment (e.g. road, swimming pool or snow tracks)
is essential to achieve the best outcomes during competitions (Bjornson et al., 2013). Likewise, tracking gait
function in daily-life settings ensures that the effects of a treatment or a therapy ultimately generalize into daily
General discussion and perspectives
162
settings. The main drawback of home-based rehabilitation and training is the decrease of motivation with time
(Lorentzen et al., 2015). Several strategies to maintain the child’s motivation have been proposed, like internet-
based exercises (Bilde et al., 2011; Lorentzen et al., 2015). Wearing IMUs could be a solution for portable,
accurate and cost efficient body tracking, and could constitute a great source of motivation for the children,
especially if some serious games can be associated to it (Tannous et al., 2016).
In summary, to exploit capacity at best, the child needs to bring exercises home and train on a daily basis. This
suggests that interventions should focus on what the child is used to do in his real life to improve performance
(Bjornson et al., 2013). Indeed, performance assessment is clearly in the perspective of tailored intervention
programs, in order to have better and longer results. The use of IMUs has the potential to guide therapists in
setting such personalized intervention programs.
9.3 Limitations
These thesis contributions have to be considered in light of their limitations which have been discussed for
each study in the respective chapters. Nevertheless, several global or recurrent limitations, and trails for
improvement can be reformulated here.
9.3.1 Regarding the study participants
As reported for each study, the main limitation was the sample size. Given the heterogeneity of the CP
population, this limitation was critical. The sample size was however calculated at the initiation of the projects
in order to suit the research questions. For studies in chapters 4, 7 and 8, sample size aimed to suit averages
comparison of children with CP and TD based on previous data using wearable sensors (Brégou Bourgeois et
al., 2014). Sample sizes of 5 participants per group were computed. Hence, in order to obtain a representation
of all levels of motor impairment throughout GMFCS I-III, 5 children with CP of each level (15 in total) were
elected and 15 controls. In the end, 16 children with CP (7 GMFCS I, 3 GMFCS II and 6 GMFCS III) and 15
children with TD were recruited. Due to one withdrawal (TD) and one exclusion (CP), 15 children with CP (6
GMFCS I, 3 GMFCS II and 6 GMFCS III) and 14 children with TD were effectively included in the analysis.
The imbalanced repartition across GMFCS levels was due to the patients’ characteristics in the Geneva area.
Indeed, patients with CP were recruited from one site, Geneva University Hospitals (HUG), which limited the
number of eligible participants.
For the study presented in Chapter 6 (dual tasks), the sample size was computed to suit average comparison of
the walking speed between simple and dual tasks based on previous data in CP (Katz-Leurer et al., 2014). The
sample size of 6 participants per group was initially computed, and to obtain a representation of all levels of
motor impairment throughout GMFCS I-III, we elected a sample of 18 children with CP plus 2 children for
security. In the end, 20 children with CP (16 GMFCS I, 2 GMFCS II, 1 GMFCS III and 1 GMFCS IV) and 20
children with TD were effectively recruited for this study. Due to an even greater imbalanced repartition across
GMFCS levels, we decided to analyze only children with GMFCS levels I and II, i.e. 18 children with CP (16
GMFCS I and 2 GMFCS II). One TD participant was an extreme outlier and was excluded from the analysis.
‘Extra’ inclusions (to compensate the exclusions) were not feasible due to recruitment difficulties. Indeed,
despite a 30 to 50CHF shop voucher was given to each participant, about 30% of the eligible participants did
not agree to integrate or to complete the study they were included in. Considering that 2 hours were needed
for each protocol, the main reasons were the child’s and/or parents’ unavailability or unwillingness, especially
for children who were already busy on a weekly basis with school and medical appointments (physiotherapist,
logopedist, etc.). To increase the sample size, a multisite study needs to be carried out.
The difficulty in scoring the GMFCS level has to be mentioned. Level descriptions are not very precise
(Palisano et al., 1997) which implies that in some cases, a child can belong to two level descriptions. This can

General discussion and perspectives
163
be a reason for such an imbalanced repartition of children across the GMFCS levels, especially the small
GMFCS level II representation, as compared to other studies (Schwartz and Munger, 2018).
Low sample sizes obliged to perform non-parametric tests, which limited the statistical power of the analyses.
It should be noticed that the effect size, which does not depend on sample size, was reported when possible in
addition to p-values (Sullivan and Feinn, 2012). The validity of the PCA approach proposed in Chapter 6 for
the selection of our variables may have also been limited due the low sample size.
In addition, our cohort was heterogeneous in terms of age. Children and adolescents were between 8 and 20
years old. Motor and cognitive functions present turning points in this period of development (Olivier et al.,
2010). In Chapter 6, we have indeed observed that younger children (with or without CP) presented higher
DTCs than older children. However, the lower sample size of the other studies of this thesis did not allow
performing investigations on subgroups of age.
9.3.2 Regarding the wearable system
9.3.2.1 Leg length measurement
The double pendulum model proposed by Aminian et al. (2002) relies on leg length dimensions (thigh and
shank segments lengths) measurements and assumes that the right and left legs have the same length. However,
children with CP commonly present leg length discrepancy due to angular and torsional bone deformities or
joint contractures (Riad et al., 2010; Sabharwal and Kumar, 2008). The main difference in leg length between
the affected and non-affected side of a hemiplegic child occurs at the shank level (Riad et al., 2010).
Furthermore, leg length measurement can be challenging with bone deformities and joint contractures
(Sabharwal and Kumar, 2008). These combined, one can understand that potential bias is introduced due to
the model for stride length estimation. As an illustration of the error induced by erroneous leg length
measurement, stride length of a healthy control subject have been computed with two different shank lengths:
the measured shank length and a simulated false shank length 1cm away from the measured one (representing
1.3% of the subject’s leg length). The induced error was 2cm (1.7% of the original stride length) for stride
length estimation.
9.3.2.2 Sensor to body segment alignment
A calibration method based on PCA was adopted as an optimal solution since a classic approach based on
functional calibration (Favre et al., 2009) using a pre-defined set of movements was difficult to be envisaged
for children with functional disabilities, especially in a home environment without the supervision of the
investigator. PCA alignment method is based on the assumption that the pitch angular velocity is maximal in
the sagittal plane during forward walking. This assumption may have induced potential errors especially for
the children with a high level of impairment, with higher frontal and transverse components at shank and thigh
levels during walking. These errors may have biased shank and thigh angles computation; hence the walking
speed and other gait characteristics parameters estimation for which the angular velocity rate was used to be
computed. Nevertheless, a quick experiment has proven that the angular velocity signal shape was well restored
after PCA alignment as compared to a sensor manually aligned on the segment’s longitudinal axis and the
angular velocity computed from the shank orientation with the optoelectronic system (Figure 55).
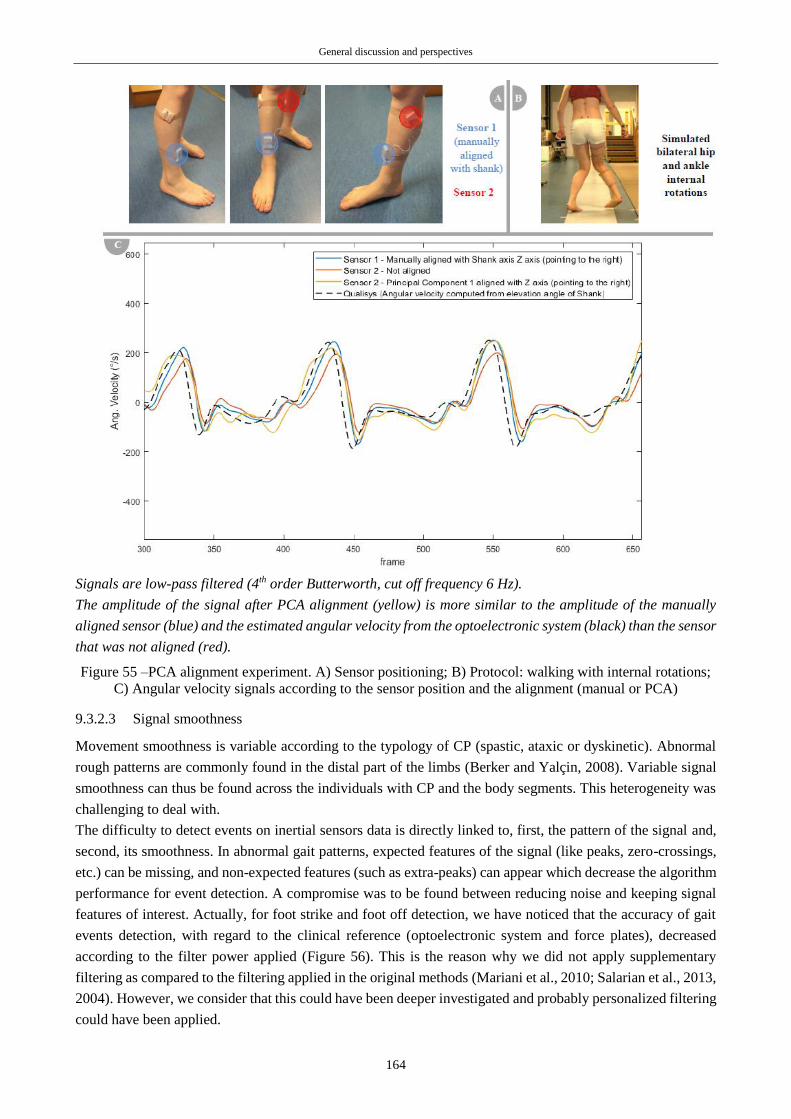
General discussion and perspectives
164
Signals are low-pass filtered (4th order Butterworth, cut off frequency 6 Hz).
The amplitude of the signal after PCA alignment (yellow) is more similar to the amplitude of the manually
aligned sensor (blue) and the estimated angular velocity from the optoelectronic system (black) than the sensor
that was not aligned (red).
Figure 55 –PCA alignment experiment. A) Sensor positioning; B) Protocol: walking with internal rotations;
C) Angular velocity signals according to the sensor position and the alignment (manual or PCA)
9.3.2.3 Signal smoothness
Movement smoothness is variable according to the typology of CP (spastic, ataxic or dyskinetic). Abnormal
rough patterns are commonly found in the distal part of the limbs (Berker and Yalçin, 2008). Variable signal
smoothness can thus be found across the individuals with CP and the body segments. This heterogeneity was
challenging to deal with.
The difficulty to detect events on inertial sensors data is directly linked to, first, the pattern of the signal and,
second, its smoothness. In abnormal gait patterns, expected features of the signal (like peaks, zero-crossings,
etc.) can be missing, and non-expected features (such as extra-peaks) can appear which decrease the algorithm
performance for event detection. A compromise was to be found between reducing noise and keeping signal
features of interest. Actually, for foot strike and foot off detection, we have noticed that the accuracy of gait
events detection, with regard to the clinical reference (optoelectronic system and force plates), decreased
according to the filter power applied (Figure 56). This is the reason why we did not apply supplementary
filtering as compared to the filtering applied in the original methods (Mariani et al., 2010; Salarian et al., 2013,
2004). However, we consider that this could have been deeper investigated and probably personalized filtering
could have been applied.
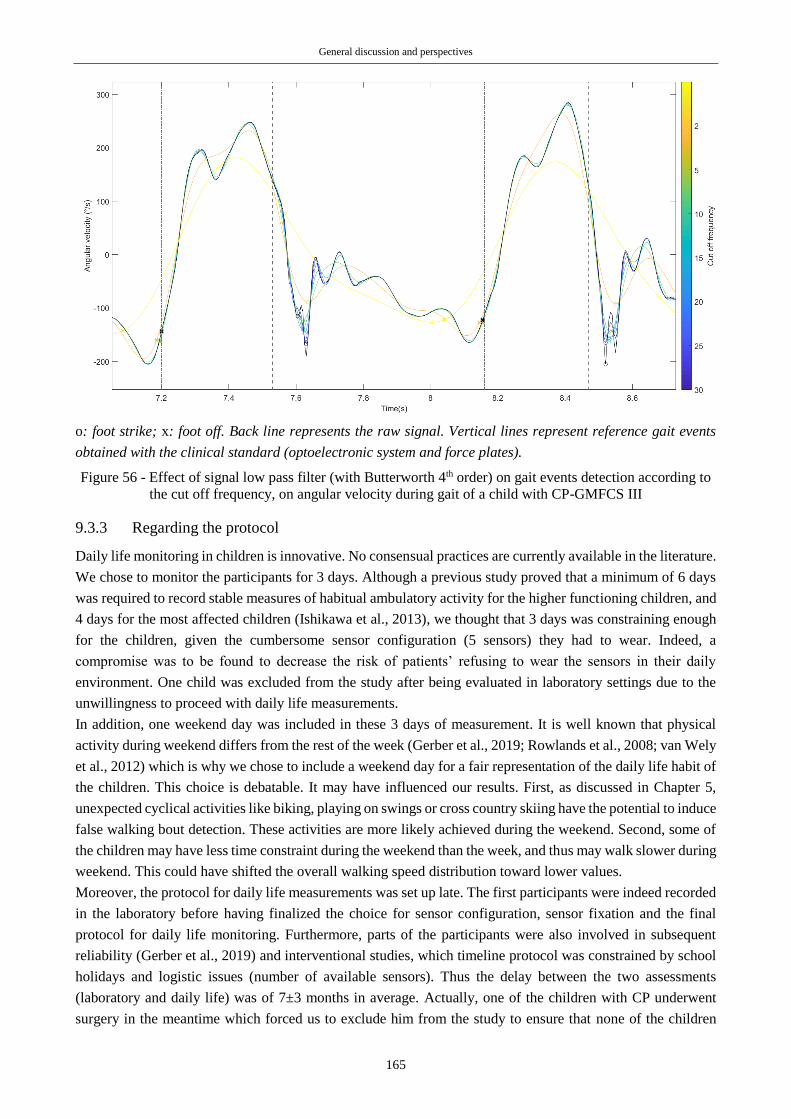
General discussion and perspectives
165
o: foot strike; x: foot off. Back line represents the raw signal. Vertical lines represent reference gait events
obtained with the clinical standard (optoelectronic system and force plates).
Figure 56 - Effect of signal low pass filter (with Butterworth 4th order) on gait events detection according to
the cut off frequency, on angular velocity during gait of a child with CP-GMFCS III
9.3.3 Regarding the protocol
Daily life monitoring in children is innovative. No consensual practices are currently available in the literature.
We chose to monitor the participants for 3 days. Although a previous study proved that a minimum of 6 days
was required to record stable measures of habitual ambulatory activity for the higher functioning children, and
4 days for the most affected children (Ishikawa et al., 2013), we thought that 3 days was constraining enough
for the children, given the cumbersome sensor configuration (5 sensors) they had to wear. Indeed, a
compromise was to be found to decrease the risk of patients’ refusing to wear the sensors in their daily
environment. One child was excluded from the study after being evaluated in laboratory settings due to the
unwillingness to proceed with daily life measurements.
In addition, one weekend day was included in these 3 days of measurement. It is well known that physical
activity during weekend differs from the rest of the week (Gerber et al., 2019; Rowlands et al., 2008; van Wely
et al., 2012) which is why we chose to include a weekend day for a fair representation of the daily life habit of
the children. This choice is debatable. It may have influenced our results. First, as discussed in Chapter 5,
unexpected cyclical activities like biking, playing on swings or cross country skiing have the potential to induce
false walking bout detection. These activities are more likely achieved during the weekend. Second, some of
the children may have less time constraint during the weekend than the week, and thus may walk slower during
weekend. This could have shifted the overall walking speed distribution toward lower values.
Moreover, the protocol for daily life measurements was set up late. The first participants were indeed recorded
in the laboratory before having finalized the choice for sensor configuration, sensor fixation and the final
protocol for daily life monitoring. Furthermore, parts of the participants were also involved in subsequent
reliability (Gerber et al., 2019) and interventional studies, which timeline protocol was constrained by school
holidays and logistic issues (number of available sensors). Thus the delay between the two assessments
(laboratory and daily life) was of 7±3 months in average. Actually, one of the children with CP underwent
surgery in the meantime which forced us to exclude him from the study to ensure that none of the children
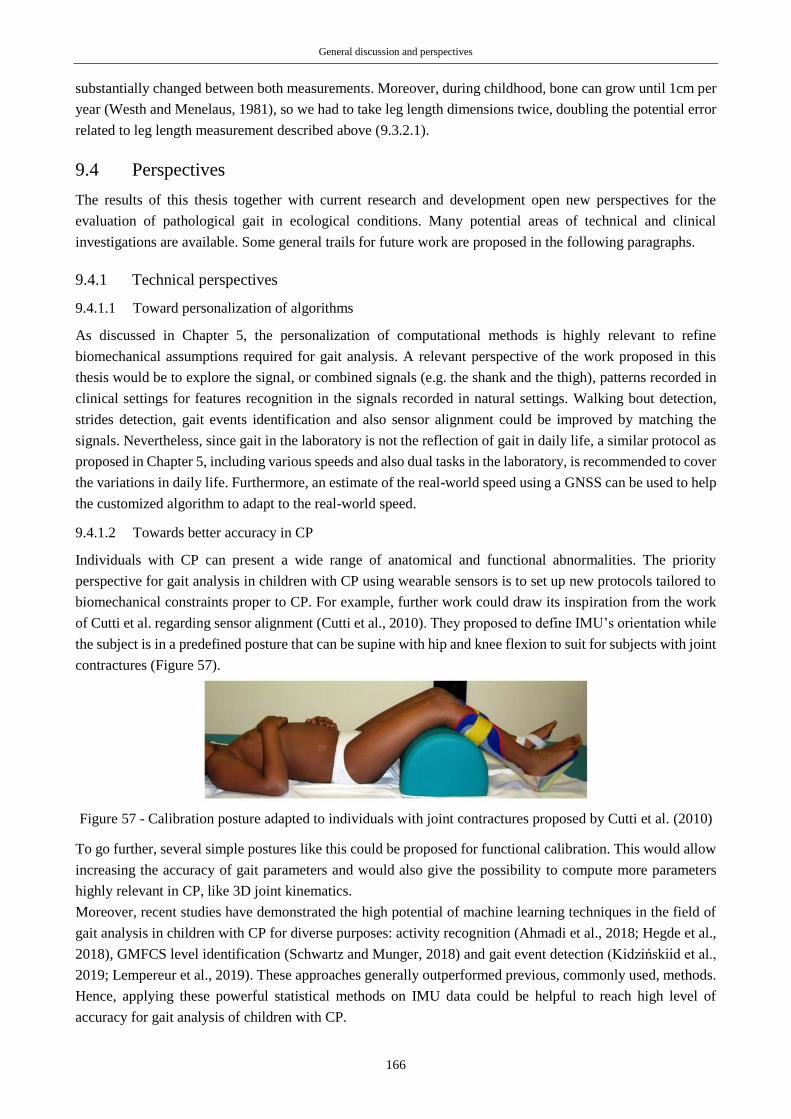
General discussion and perspectives
166
substantially changed between both measurements. Moreover, during childhood, bone can grow until 1cm per
year (Westh and Menelaus, 1981), so we had to take leg length dimensions twice, doubling the potential error
related to leg length measurement described above (9.3.2.1).
9.4 Perspectives
The results of this thesis together with current research and development open new perspectives for the
evaluation of pathological gait in ecological conditions. Many potential areas of technical and clinical
investigations are available. Some general trails for future work are proposed in the following paragraphs.
9.4.1 Technical perspectives
9.4.1.1 Toward personalization of algorithms
As discussed in Chapter 5, the personalization of computational methods is highly relevant to refine
biomechanical assumptions required for gait analysis. A relevant perspective of the work proposed in this
thesis would be to explore the signal, or combined signals (e.g. the shank and the thigh), patterns recorded in
clinical settings for features recognition in the signals recorded in natural settings. Walking bout detection,
strides detection, gait events identification and also sensor alignment could be improved by matching the
signals. Nevertheless, since gait in the laboratory is not the reflection of gait in daily life, a similar protocol as
proposed in Chapter 5, including various speeds and also dual tasks in the laboratory, is recommended to cover
the variations in daily life. Furthermore, an estimate of the real-world speed using a GNSS can be used to help
the customized algorithm to adapt to the real-world speed.
9.4.1.2 Towards better accuracy in CP
Individuals with CP can present a wide range of anatomical and functional abnormalities. The priority
perspective for gait analysis in children with CP using wearable sensors is to set up new protocols tailored to
biomechanical constraints proper to CP. For example, further work could draw its inspiration from the work
of Cutti et al. regarding sensor alignment (Cutti et al., 2010). They proposed to define IMU’s orientation while
the subject is in a predefined posture that can be supine with hip and knee flexion to suit for subjects with joint
contractures (Figure 57).
Figure 57 - Calibration posture adapted to individuals with joint contractures proposed by Cutti et al. (2010)
To go further, several simple postures like this could be proposed for functional calibration. This would allow
increasing the accuracy of gait parameters and would also give the possibility to compute more parameters
highly relevant in CP, like 3D joint kinematics.
Moreover, recent studies have demonstrated the high potential of machine learning techniques in the field of
gait analysis in children with CP for diverse purposes: activity recognition (Ahmadi et al., 2018; Hegde et al.,
2018), GMFCS level identification (Schwartz and Munger, 2018) and gait event detection (Kidzińskiid et al.,
2019; Lempereur et al., 2019). These approaches generally outperformed previous, commonly used, methods.
Hence, applying these powerful statistical methods on IMU data could be helpful to reach high level of
accuracy for gait analysis of children with CP.

General discussion and perspectives
167
9.4.1.3 Towards reduced sensor configuration
Single sensor configurations like trunk, waist or wrist-mounted sensors (Anisoara Paraschiv-Ionescu et al.,
2019; Soltani et al., 2019; Zijlstra and Hof, 2003), have been developed but were not chosen in this work since
fewer gait parameters were computable with these for children with CP. Minimizing the number of sensors is
however needed to increase acceptability and compliance. Future work in this direction is indeed required to
enable increasing the number of monitoring days. One idea should be to estimate a non-sensed body segment
position or orientation from a sensor placed on another body segment. Lower limb (ankle, knee and hip)
kinematics can indeed be considered as a chain where one joint is coupled with the others (Dejnabadi et al.,
2008). For example, excessive knee flexion is necessarily associated with hip and ankle flexion to ensure
sufficient stability in standing up. Biomechanical, statistical and machine learning approaches should be
appropriate to do so (Dejnabadi et al., 2008; Kutilek and Viteckova, 2012).
9.4.1.4 Towards new sensors
We have addressed in a previous section the absence of knowledge of the walking context (e.g. outdoor/indoor,
location, curved path, surface, etc.) which constitutes a major drawback in daily-life monitoring. The addition
of new sensors could thus help getting more information about the contexts. For instance, a GNSS receiver
can give appropriate estimation of the location and information about the environment can thus be deduced
(indoor, outdoor, park, street, home, school, etc.). This idea was exploited by various authors and notably
Wang and Adamczyk (2019), who used GNSS data to identify frequently repeated paths in order to include
only frequently repeated walking bouts. Barometric pressure, embedded in insoles could also be advised to
estimate load carriage (e.g. schoolbag). A microphone can identify if the subject walks in a crowded or empty
environment (Wang and Adamczyk, 2019). Weather records could also be relevant to integrate weather
conditions to the analysis. Besides, other sensors could be relevant to add, to record more gait parameters such
as muscle and cardiac activities with EMG and electrocardiography sensors. Keeping in mind the need of a
reduced sensor configuration, smart textiles integrating multimodal sensors constitute a potential relevant
solution (Mečņika et al., 2014).
9.4.2 Clinical perspectives
9.4.2.1 Integrating performance assessment into the clinical process
First, the clinical perspective resulting from this work is the integration of dual task protocols during CGA.
This has proven to be a simple way to reflect challenging situations, and underestimated difficulties may
become apparent during dual tasks. Second, the main clinical perspective of this work is to evaluate the
feasibility of using an ambulatory system in a clinical process. This perspective was actually applied in
rehabilitation during the clinical trial of the Leenaards project (project to which this thesis was integrated to,
cf. Preamble of the thesis) at CHUV in which I took part. We aimed at knowing how well physiotherapists can
be guided by daily-life outputs in setting up a performance-based rehabilitation program, and can the effect of
a rehabilitation program be reflected by ambulatory analysis outputs. A pilot interventional study was carried
out for this purpose. A multiple single-case A-B-A study design was set as follows.
A. Baseline: each participant underwent an initial 10-consecutive-hour assessment of performance metrics
with the wearable system from what were extracted performance metrics related to the gait function and
physical activity. A standardized physical examination (GMFM 66) was also performed by a trained research
physiotherapist. Based on the extracted metrics, a home-based individualized training program aiming at
increasing daily performance was devised by the physiotherapist. Specific aims of the program were thus
oriented on daily-life tasks.

General discussion and perspectives
168
B. Intervention: after the run-in period a second assessment with the wearable system took place 4 weeks later.
At this stage, the training program was instructed to the participant. The participant received an individualized
list of objectives and exercises. The training was implemented for 4 weeks with a weekly video- or phone-call
appointment with the physiotherapist to discuss progress and difficulties.
A. Reversal: at the end of the intervention, a third assessment took place, followed by a 4-week wash-out and
a final assessment.
Fourteen children with CP have been included in this study. Positive feedbacks have been collected from the
physiotherapists, the families, and the children. However, several drawbacks surfaced so conclusions regarding
the integration of daily-life data into the clinical process were difficult to set. The major drawbacks were the
following.
- The robustness of sensors was insufficient for such a protocol. Problems occurred on several occasions with
the sensors (e.g. not turning on) that consequently had to be repaired (reboot of the sensor’s software) or
replaced, which disrupted the strict time trial schedule of some of the patients.
- The extracted metrics from baseline measurement were not patient-specific, they did not vary according to
the child’s level of impairment or the child’s needs.
- Physiotherapists did not always follow the instructions for devising the training objectives. Some of the
objectives were not specific, measurable, achievable, relevant, or time-bound (SMART criteria) and some
others were not daily-life oriented.
- Families’ motivation varied a lot. Children who lived in an environment where the parents and the
caregivers pushed them to complete their objectives had better results than the others.
Overall, according to these issues, it was difficult to prove the effect of ambulatory analysis outputs in
rehabilitation at the group level. However, several observations were done at individual levels. For instance,
three participants with GMFCS level III increased significantly their percentage of time walking per day,
beyond the minimal detectable change previously documented (Gerber et al., 2019), after the individualized
treatment (comparison between pre and post-intervention phases). Analyses are still ongoing but may result in
weak conclusions given the heterogeneity of the children, of the physiotherapists’ understanding and method
during the study. The above-listed drawbacks constitute the main axes of improvement for a future clinical
trial of this type. For instance:
- More robust sensors should be used (e.g. new generation of Physilogs (GaitUp, Renens, Switzerland)),
- The investigator should set the goals with the physiotherapist to ensure that they are SMART and
performance-oriented,
- The extracted metrics should be in accordance with the training program’s goals,
- The investigator should be informed about the daily environment and family situation, through
questionnaires and/or interviews,
- A control group (children with CP without intensive training) should also be considered
9.4.2.2 Application to other clinical purposes in CP
Gait was the central focus of the doctoral work but, as mentioned in the introduction chapter, one-third of the
children with CP cannot walk. Information about the habitual physical activity of these children may also be
of high clinicians’ interest, in order to highlight the relation between movement and well-being. Consensus
exists on the link between physical activity and quality of life but is mainly based on indirect measures of
physical activity only and focused on ambulatory children with CP (Mann et al., 2016; Omura et al., 2018).
Further work examining the link between physical activity, continuously measured by wearable sensors, and
objective and subjective data on quality of life and participation of children with CP with highly limited motor
functions (GMFCS IV and V) could then constitute a concrete perspective of the current work. This study
could take the form of an observational cross-sectional study with the following specific objectives: to quantify

General discussion and perspectives
169
the time spent in sedentary and in motor behaviors (passive or active), to quantify the intensity of motion and
activity, and to quantify the diversity of postures (lying, sitting, standing) during children’s daily life. A
barcode of activity intensity such as the one proposed by Paraschiv-Ionescu et al. (2012) could be relevant for
this application. The secondary objective would be to link these quantities to subjective data on well-being and
global health (questionnaires). A reduced sensor configuration should be used as compared to the configuration
proposed in the thesis. This project was actually submitted to the Science for Smiles foundation (Villeneuve,
Switzerland) but has not been supported yet.
9.4.2.3 Application to other populations
Performance (daily-life) assessment as realized during this thesis can be relevant for many other pathologies.
As a precise example, patients recovering from a total knee arthroplasty would beneficiate as much as patients
with CP from the chosen sensor configuration, given the possibility to directly compute the knee range of
motion. Indeed, as compared to healthy people, patients who underwent a total knee arthroplasty show
functional deficits such as reduced walking speed, stride length and knee range of motion, inducing
compensatory patterns in involved joints (Komnik et al., 2015). Ambulatory monitoring of their recovery may
thus be highly helpful for the clinicians in order to nail the eventual persistence of functional deficits and
prevent their definitive establishment. This project is actually supported by the HUG research foundation
(‘Projets de recherche et developpement’) and is running since October 2019.
Clearly, a lot of other pathologies could beneficiate from objective performance assessment. In recent
publications, elderly people, patients with neurological pathologies, such as PD, Multiple Sclerosis, and
Stroke, have begun to be monitored in daily life for clinical research purposes (Brodie et al., 2015; Del Din et
al., 2016a; S K Prajapati et al., 2011; Supratak et al., 2018; Takayanagi et al., 2019; Toosizadeh et al., 2015;
Tudor-Locke et al., 2013; Warmerdam et al., 2020).
9.5 Final conclusion
This doctoral work aimed to study the gap between gait capacity and gait performance in the population of
children with CP. We have adopted a progressive approach consisting of, first, assessing children’s gait in the
laboratory under challenging situations, and, second, assessing the children’s gait in their daily life. This
project was ambitious given the little methodological evidence accessible at the beginning of the thesis
regarding gait monitoring of children with CP outside of the laboratories. This is why two methodological
studies were undertaken at the beginning. Several obstacles were faced in relation to the atypical and
heterogeneous characteristics of children with CP, resulting in various choices and approximations which
should be of interest for future researches. The relevance of the personalization of data processing was also
underlined. On a clinical point of view, the objective comparison of gait characteristics in various contexts has
brought new knowledge about the difficulties of children with CP. It appeared that the challenging situations
induced by dual tasks greatly penalize the children with CP. In contrast to recent studies establishing the link
between capacity and performance on the basis of different metrics, the results of this thesis demonstrated
thigh links between both activity constructs when they are evaluated with similar metrics. But this represented
one single stone among all those necessary to build the bridge between the laboratory and real life. Several
other studies must be undertaken to confirm these and bring new findings.

General discussion and perspectives
170

171
References
Abaid, N., Cappa, P., Palermo, E., Petrarca, M., Porfiri, M., 2013. Gait Detection in Children with and without
Hemiplegia Using Single-Axis Wearable Gyroscopes. PLoS ONE 8, 1–8.
doi:10.1371/journal.pone.0073152
Ahmadi, M., O’Neil, M., Fragala-Pinkham, M., Lennon, N., Trost, S., 2018. Machine learning algorithms for
activity recognition in ambulant children and adolescents with cerebral palsy. Journal of
NeuroEngineering and Rehabilitation 15. doi:10.1186/s12984-018-0456-x
Aich, S., Kim, H.C., 2018. Auto detection of Parkinson’s disease based on objective measurement of gait
parameters using wearable sensors. International Journal of Advanced Science and Technology 117, 103–
112. doi:10.14257/ijast.2018.117.09
Aich, S., Pradhan, P.M., Park, J., Sethi, N., Vathsa, V.S.S., Kim, H.-C., 2018. A Validation Study of Freezing
of Gait (FoG) Detection and Machine-Learning-Based FoG Prediction Using Estimated Gait
Characteristics with a Wearable Accelerometer. Sensors 18. doi:10.3390/s18103287
Aisen, M.L., Kerkovich, D., Mast, J., Mulroy, S., Wren, T.A.L., Kay, R.M., Rethlefsen, S.A., 2011. Cerebral
palsy: Clinical care and neurological rehabilitation. The Lancet Neurology 10, 844–852.
doi:10.1016/S1474-4422(11)70176-4
Al-Yahya, E., Dawes, H., Smith, L., Dennis, A., Howells, K., Cockburn, J., 2011. Cognitive motor interference
while walking: A systematic review and meta-analysis. Neuroscience and Biobehavioral Reviews 35,
715–728. doi:10.1016/j.neubiorev.2010.08.008
Allali, G., Laidet, M., Assal, F., Armand, S., Lalive, P.H., 2014. Walking while talking in patients with multiple
sclerosis: The impact of specific cognitive loads. Neurophysiologie Clinique / Clinical Neurophysiology
44, 87–93. doi:10.1016/j.neucli.2013.10.136
Allseits, E., Agrawal, V., Lučarević, J., Gailey, R., Gaunaurd, I., Bennett, C., 2018. A practical step length
algorithm using lower limb angular velocities. Journal of Biomechanics 66, 137–144.
doi:10.1016/j.jbiomech.2017.11.010
Alotaibi, M., Long, T., Kennedy, E., Bavishi, S., 2014. The efficacy of GMFM-88 and GMFM-66 to detect
changes in gross motor function in children with cerebral palsy (CP): a literature review. Disability and
Rehabilitation 36, 617–627. doi:10.3109/09638288.2013.805820
Altman, D.G., Altman, E., 1999. Practical statistics for medical research, Chapman. ed.
Aminian, K., Najafi, B., Büla, C., Leyvraz, P.-F., Robert, P., 2002. Spatio-temporal parameters of gait
measured by an ambulatory system using miniature gyroscopes. Journal of Biomechanics 35, 689–699.
doi:10.1016/S0021-9290(02)00008-8
Aminian, K., Rezakhanlou, K., De Andres, E., Fritsch, C., Leyvraz, P.-F.F., Robert, P., 1999. Temporal
features estimation during walking using miniature accelerometers: an analysis of gait improvement after
hip arthroplasty. Medical and Biological Engineering and Computing 37, 686–691.
Aminian, K., Robert, P., Jequier, E., Schutz, Y., Jéquier, E., Schutz, Y., 1995a. Incline, speed, and distance
assessment during unconstrained walking. Medicine and Science in Sports and Exercise 27, 226–234.
doi:10.1249/00005768-199502000-00012
Aminian, K., Robert, P., Jequier, E., Schutz, Y., Jéquier, E., Schutz, Y., 1995b. Estimation of speed and incline
of walking using neural network. IEEE Transactions on Instrumentation and Measurement 44, 743–746.
doi:10.1109/19.387322
Aminian, K., Trevisan, C., Najafi, B., Dejnabadi, H., Frigo, C., Pavan, E., Telonio, A., Cerati, F., Marinoni,
E.C., Robert, P., Leyvraz, P.F., 2004. Evaluation of an ambulatory system for gait analysis in hip
osteoarthritis and after total hip replacement. Gait and Posture 20, 102–107. doi:10.1016/S0966-
6362(03)00093-6
Anwary, A.R., Yu, H., Vassallo, M., 2018a. An Automatic gait feature extraction method for identifying gait
asymmetry using wearable sensors. Sensors 18. doi:10.3390/s18020676
Anwary, A.R., Yu, H., Vassallo, M., 2018b. Optimal Foot Location for Placing Wearable IMU Sensors and
Automatic Feature Extraction for Gait Analysis. IEEE Sensors Journal 18, 2555–2567.
doi:10.1109/JSEN.2017.2786587
Apkon, S., Ness, K., Parisi, M., Christensen, A., Bjornson, K.F., 2014. Influence of activity on bone health in
cerebral palsy. Developmental Medicine and Child Neurology 56, 100. doi:10.1111/dmcn.12540
Arafsha, F., Hanna, C., Aboualmagd, A., Fraser, S., El Saddik, A., Arafsha, F., Hanna, C., Aboualmagd, A.,
Fraser, S., El Saddik, A., 2018. Instrumented Wireless SmartInsole System for Mobile Gait Analysis: A

172
Validation Pilot Study with Tekscan Strideway. Journal of Sensor and Actuator Networks 7, 36.
doi:10.3390/jsan7030036
Armand, S., Bonnefoy, A., Sagawa, Y., Turcot, K., Bonnefoy Mazure, A., Sagawa, Y., Turcot, K., 2014.
Analyse du mouvement dans un contexte clinique, in: Manuel Pratique de Chirurgie Orthopédique.
Elsevier Masson, pp. 3–34. doi:10.1016/B978-2-294-71373-6.00001-4
Armand, S., De Coulon, G., Bonnefoy-Mazure, A., 2016. Gait analysis in children with cerebral palsy. EFORT
Open Reviews 1, 448–460. doi:10.1302/2058-5241.1.000052
Assi, A., Chaibi, Y., Presedo, A., Dubousset, J., Ghanem, I., Skalli, W., 2013. Three-dimensional
reconstructions for asymptomatic and cerebral palsy children’s lower limbs using a biplanar X-ray
system: a feasibility study. European Journal of Radiology 82, 2359–2364.
doi:10.1016/j.ejrad.2013.07.006
Attal, F., Mohammed, S., Dedabrishvili, M., Chamroukhi, F., Oukhellou, L., Amirat, Y., 2015. Physical
Human Activity Recognition Using Wearable Sensors. Sensors 15, 31314–38. doi:10.3390/s151229858
Avvenuti, M., Carbonaro, N., Cimino, M.G.C.A., Cola, G., Tognetti, A., Vaglini, G., 2018. Smart shoe-assisted
evaluation of using a single trunk/pocket-worn accelerometer to detect gait phases. Sensors 18.
doi:10.3390/s18113811
Bagley, A., Oeffinger, D., Gorton, G., Romness, M., Nicholson, D., Hassani, S., Abel, M., Tylkowski, C.,
2010. I6 - Daily step count in children with cerebral palsy: Relation to clinical function tests.
Developmental Medicine and Child Neurology 52, 55–56. doi:10.1111/j.1469-8749.2010.03759.x
Baker, R., 2013. Measuring walking: A handbook of Clinical Gait Analysis, Mac Keith. ed. Mac Keith.
Baker, R., 2007. The history of gait analysis before the advent of modern computers. Gait and Posture 26,
331–42. doi:10.1016/j.gaitpost.2006.10.014
Baker, R., 2006. Gait analysis methods in rehabilitation. Journal of NeuroEngineering and Rehabilitation 3.
doi:10.1186/1743-0003-3-4
Baker, R., McGinley, J.L., Schwartz, M.H., Beynon, S., Rozumalski, A., Graham, H.K., Tirosh, O., 2009. The
gait profile score and movement analysis profile. Gait and Posture 30, 265–269.
doi:10.1016/j.gaitpost.2009.05.020
Balaban, B., Tok, F., 2014. Gait Disturbances in Patients With Stroke. PM&R 6, 635–642.
doi:10.1016/j.pmrj.2013.12.017
Bamberg, S.J.M., Benbasat, A.Y., Scarborough, D.M., Krebs, D.E., Paradiso, J.A., 2008. Gait analysis using
a shoe-integrated wireless sensor system. IEEE Transactions on Information Technology in Biomedicine
12, 413–423. doi:10.1109/TITB.2007.899493
Banda, J.A., Farish Haydel, K., Davila, T., Desai, M., Bryson, S., Haskell, W.L., Matheson, D., Robinson,
T.N., Pappalardo, F., 2016. Effects of Varying Epoch Lengths, Wear Time Algorithms, and Activity Cut-
Points on Estimates of Child Sedentary Behavior and Physical Activity from Accelerometer Data. PLoS
ONE 11, 150534. doi:10.1371/journal.pone.0150534
Bania, T., Taylor, N., Dodd, K., 2013. Habitual physical activity levels of adolescents and young adults with
diplegic cerebral palsy. Developmental Medicine and Child Neurology 55, 37–38.
doi:10.1111/dmcn.12259
Bania, T.A., Taylor, N.F., Baker, R.J., Graham, H.K., Karimi, L., Dodd, K.J., 2014. Gross motor function is
an important predictor of daily physical activity in young people with bilateral spastic cerebral palsy.
Developmental Medicine and Child Neurology 56, 1163–1171. doi:10.1111/dmcn.12548
Bar-Haim, S., Aviram, R., Shkedy Rabani, A., Amro, A., Nammourah, I., Al-Jarrah, M., Raanan, Y., Loeppky,
J.A., Harries, N., 2019. Effects of Exercise Interventions on Habitual Physical Activity and Sedentary
Behavior in Adolescents With Cerebral Palsy. Pediatric exercise science 1–9. doi:10.1123/pes.2018-0254
Barré, A., Aissaoui, R., Aminian, K., Dumas, R., 2017. Assessment of the lower limb soft tissue artefact at
marker-cluster level with a high-density marker set during walking. Journal of Biomechanics 62, 21–26.
doi:10.1016/j.jbiomech.2017.04.036
Barré, A., Armand, S., 2014. Biomechanical ToolKit: Open-source framework to visualize and process
biomechanical data. Computer Methods and Programs in Biomedicine 114, 80–87.
doi:10.1016/j.cmpb.2014.01.012
Barré, A., Thiran, J.P., Jolles, B.M., Theumann, N., Aminian, K., 2013. Soft tissue artifact assessment during
treadmill walking in subjects with total knee arthroplasty. IEEE Transactions on Biomedical Engineering
60, 3131–3140. doi:10.1109/TBME.2013.2268938
Bax, M., Goldstein, M., Rosenbaum, P., Leviton, A., Paneth, N., 2005. Proposed definition and classification
of cerebral palsy. Developmental Medicine and Child Neurology 47, 571–576.
doi:10.1017/S001216220500112X

173
Baxter, P., Morris, C., Rosenbaum, P., Paneth, N., Leviton, A., Goldstein, M., Bax, M., Colver, A., Damiano,
D., Graham, H.K., Brien, G.O., Shea, T.M.O., 2007. The Definition and Classification of Cerebral Palsy.
Developmental Medicine and Child Neurology 48, 1–44. doi:http://dx.doi.org/10.1111/j.1469-
8749.2007.00001.x
Beckung, E., Hagberg, G., 2002. Neuroimpairments, activity limitations, and participation restrictions in
children with cerebral palsy. Developmental Medicine and Child Neurology 44, 309–316.
doi:10.1111/j.1469-8749.2002.tb00816.x
Beckung, E., Hagberg, G., Uldall, P., Cans, C., 2008. Probability of walking in children with cerebral palsy in
Europe. Pediatrics 121, 187–192. doi:10.1542/peds.2007-0068
Begg, R., Best, R., Dell’Oro, L., Taylor, S., 2007. Minimum foot clearance during walking: Strategies for the
minimisation of trip-related falls. Gait and Posture 25, 191–198. doi:10.1016/j.gaitpost.2006.03.008
Bejarano, N.C., Ambrosini, E., Pedrocchi, A., Ferrigno, G., Monticone, M., Ferrante, S., 2015. A novel
adaptive, real-time algorithm to detect gait events from wearable sensors. IEEE Transactions on Neural
Systems and Rehabilitation Engineering 23, 413–422. doi:10.1109/TNSRE.2014.2337914
Bell, K., Õunpuu, S., Deluca, P.A., Romness, M.J., 2002. Natural Progression of Gait in Children With
Cerebral Palsy. Journal of Pediatric Orthopaedics 22, 677–682.
doi:10.1097/01.BPO.0000023143.69745.A9
Belluscio, V., Bergamini, E., Salatino, G., Marro, T., Gentili, P., Iosa, M., Morelli, D., Vannozzi, G., 2019.
Dynamic balance assessment during gait in children with Down and Prader-Willi syndromes using
inertial sensors. Human Movement Science 63, 53–61. doi:10.1016/j.humov.2018.11.010
Ben Mansour, K., Gorce, P., Rezzoug, N., 2017. The Multifeature Gait Score: An accurate way to assess gait
quality. PLoS ONE 12, 1–12. doi:10.1371/journal.pone.0185741
Ben Mansour, K., Rezzoug, N., Gorce, P., 2015. Foot side detection from lower lumbar spine acceleration.
Gait and Posture 42, 386–389. doi:10.1016/j.gaitpost.2015.05.021
Benedetti, M.G., Beghi, E., De Tanti, A., Cappozzo, A., Basaglia, N., Cutti, A.G., Cereatti, A., Stagni, R.,
Verdini, F., Manca, M., Fantozzi, S., Mazzà, C., Camomilla, V., Campanini, I., Castagna, A., Cavazzuti,
L., Del Maestro, M., Croce, U. Della, Gasperi, M., Leo, T., Marchi, P., Petrarca, M., Piccinini, L.,
Rabuffetti, M., Ravaschio, A., Sawacha, Z., Spolaor, F., Tesio, L., Vannozzi, G., Visintin, I., Ferrarin,
M., 2017. SIAMOC position paper on gait analysis in clinical practice: General requirements, methods
and appropriateness. Results of an Italian consensus conference. Gait and Posture 58, 252–260.
doi:10.1016/j.gaitpost.2017.08.003
Berker, A.N., Yalçin, M.S., 2008. Cerebral Palsy: Orthopedic Aspects and Rehabilitation. Pediatric Clinics of
North America 55, 1209–1225. doi:10.1016/j.pcl.2008.07.011
Berthelot, J.-M., Le Goff, B., Maugars, Y., 2011. The Hawthorne effect: Stronger than the placebo effect?
Joint Bone Spine 78, 335–336. doi:10.1016/j.jbspin.2011.06.001
Bertuletti, S., Della Croce, U., Cereatti, A., 2019. A wearable solution for accurate step detection based on the
direct measurement of the inter-foot distance. Journal of Biomechanics 84, 274–277.
doi:10.1016/j.jbiomech.2018.12.039
Biering-Sørensen, F., Nielsen, J.B., Klinge, K., 2006. Spasticity-assessment: a review. Spinal cord 44, 708–
722. doi:10.1038/sj.sc.3101928
Bilde, P.E., Kliim-Due, M., Rasmussen, B., Petersen, L.Z., Petersen, T.H., Nielsen, J.B., 2011. Individualized,
home-based interactive training of cerebral palsy children delivered through the Internet. BMC
Neurology 11. doi:10.1186/1471-2377-11-32
Bisi, M.C., Tamburini, P., Stagni, R., 2019. A ‘Fingerprint’ of locomotor maturation: Motor development
descriptors, reference development bands and data-set. Gait and Posture 68, 232–237.
doi:10.1016/j.gaitpost.2018.11.036
Bjornson, K., Zhou, C., 2016. Differential influence of unilateral and bilateral motor impairment on habitual
walking activity in cerebral palsy. Developmental Medicine and Child Neurology 58, 40.
doi:10.1111/dmcn.51_13224
Bjornson, K.F., 2019. Measurement of community based walking activity in cerebral palsy. Developmental
Medicine and Child Neurology 1. doi:10.1111/dmcn.14226
Bjornson, K.F., Belza, B., Kartin, D., Logsdon, R., McLaughlin, J.F., 2007. Ambulatory Physical Activity
Performance in Youth With Cerebral Palsy and Youth Who Are Developing Typically. Physical Therapy
87, 248–257. doi:10.2522/ptj.20060157
Bjornson, K.F., Lennon, N., 2017. Handbook of Human Motion. doi:10.1007/978-3-319-30808-1
Bjornson, K.F., Zhou, C., Stevenson, R., Christakis, D., Rashid, S.H., 2014. Community walking activity in
cerebral palsy: Do orthoses help? Developmental Medicine and Child Neurology 56, 6–7.
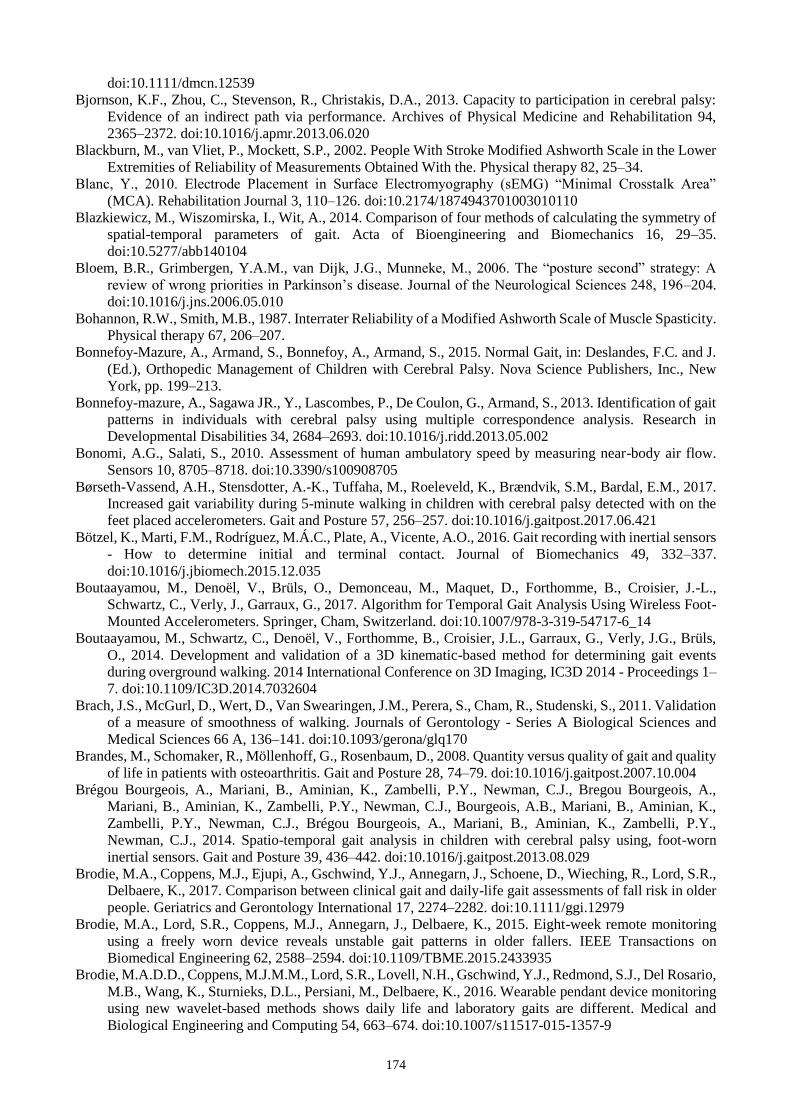
174
doi:10.1111/dmcn.12539
Bjornson, K.F., Zhou, C., Stevenson, R., Christakis, D.A., 2013. Capacity to participation in cerebral palsy:
Evidence of an indirect path via performance. Archives of Physical Medicine and Rehabilitation 94,
2365–2372. doi:10.1016/j.apmr.2013.06.020
Blackburn, M., van Vliet, P., Mockett, S.P., 2002. People With Stroke Modified Ashworth Scale in the Lower
Extremities of Reliability of Measurements Obtained With the. Physical therapy 82, 25–34.
Blanc, Y., 2010. Electrode Placement in Surface Electromyography (sEMG) “Minimal Crosstalk Area”
(MCA). Rehabilitation Journal 3, 110–126. doi:10.2174/1874943701003010110
Blazkiewicz, M., Wiszomirska, I., Wit, A., 2014. Comparison of four methods of calculating the symmetry of
spatial-temporal parameters of gait. Acta of Bioengineering and Biomechanics 16, 29–35.
doi:10.5277/abb140104
Bloem, B.R., Grimbergen, Y.A.M., van Dijk, J.G., Munneke, M., 2006. The “posture second” strategy: A
review of wrong priorities in Parkinson’s disease. Journal of the Neurological Sciences 248, 196–204.
doi:10.1016/j.jns.2006.05.010
Bohannon, R.W., Smith, M.B., 1987. Interrater Reliability of a Modified Ashworth Scale of Muscle Spasticity.
Physical therapy 67, 206–207.
Bonnefoy-Mazure, A., Armand, S., Bonnefoy, A., Armand, S., 2015. Normal Gait, in: Deslandes, F.C. and J.
(Ed.), Orthopedic Management of Children with Cerebral Palsy. Nova Science Publishers, Inc., New
York, pp. 199–213.
Bonnefoy-mazure, A., Sagawa JR., Y., Lascombes, P., De Coulon, G., Armand, S., 2013. Identification of gait
patterns in individuals with cerebral palsy using multiple correspondence analysis. Research in
Developmental Disabilities 34, 2684–2693. doi:10.1016/j.ridd.2013.05.002
Bonomi, A.G., Salati, S., 2010. Assessment of human ambulatory speed by measuring near-body air flow.
Sensors 10, 8705–8718. doi:10.3390/s100908705
Børseth-Vassend, A.H., Stensdotter, A.-K., Tuffaha, M., Roeleveld, K., Brændvik, S.M., Bardal, E.M., 2017.
Increased gait variability during 5-minute walking in children with cerebral palsy detected with on the
feet placed accelerometers. Gait and Posture 57, 256–257. doi:10.1016/j.gaitpost.2017.06.421
Bötzel, K., Marti, F.M., Rodríguez, M.Á.C., Plate, A., Vicente, A.O., 2016. Gait recording with inertial sensors
- How to determine initial and terminal contact. Journal of Biomechanics 49, 332–337.
doi:10.1016/j.jbiomech.2015.12.035
Boutaayamou, M., Denoël, V., Brüls, O., Demonceau, M., Maquet, D., Forthomme, B., Croisier, J.-L.,
Schwartz, C., Verly, J., Garraux, G., 2017. Algorithm for Temporal Gait Analysis Using Wireless Foot-
Mounted Accelerometers. Springer, Cham, Switzerland. doi:10.1007/978-3-319-54717-6_14
Boutaayamou, M., Schwartz, C., Denoël, V., Forthomme, B., Croisier, J.L., Garraux, G., Verly, J.G., Brüls,
O., 2014. Development and validation of a 3D kinematic-based method for determining gait events
during overground walking. 2014 International Conference on 3D Imaging, IC3D 2014 - Proceedings 1–
7. doi:10.1109/IC3D.2014.7032604
Brach, J.S., McGurl, D., Wert, D., Van Swearingen, J.M., Perera, S., Cham, R., Studenski, S., 2011. Validation
of a measure of smoothness of walking. Journals of Gerontology - Series A Biological Sciences and
Medical Sciences 66 A, 136–141. doi:10.1093/gerona/glq170
Brandes, M., Schomaker, R., Möllenhoff, G., Rosenbaum, D., 2008. Quantity versus quality of gait and quality
of life in patients with osteoarthritis. Gait and Posture 28, 74–79. doi:10.1016/j.gaitpost.2007.10.004
Brégou Bourgeois, A., Mariani, B., Aminian, K., Zambelli, P.Y., Newman, C.J., Bregou Bourgeois, A.,
Mariani, B., Aminian, K., Zambelli, P.Y., Newman, C.J., Bourgeois, A.B., Mariani, B., Aminian, K.,
Zambelli, P.Y., Newman, C.J., Brégou Bourgeois, A., Mariani, B., Aminian, K., Zambelli, P.Y.,
Newman, C.J., 2014. Spatio-temporal gait analysis in children with cerebral palsy using, foot-worn
inertial sensors. Gait and Posture 39, 436–442. doi:10.1016/j.gaitpost.2013.08.029
Brodie, M.A., Coppens, M.J., Ejupi, A., Gschwind, Y.J., Annegarn, J., Schoene, D., Wieching, R., Lord, S.R.,
Delbaere, K., 2017. Comparison between clinical gait and daily-life gait assessments of fall risk in older
people. Geriatrics and Gerontology International 17, 2274–2282. doi:10.1111/ggi.12979
Brodie, M.A., Lord, S.R., Coppens, M.J., Annegarn, J., Delbaere, K., 2015. Eight-week remote monitoring
using a freely worn device reveals unstable gait patterns in older fallers. IEEE Transactions on
Biomedical Engineering 62, 2588–2594. doi:10.1109/TBME.2015.2433935
Brodie, M.A.D.D., Coppens, M.J.M.M., Lord, S.R., Lovell, N.H., Gschwind, Y.J., Redmond, S.J., Del Rosario,
M.B., Wang, K., Sturnieks, D.L., Persiani, M., Delbaere, K., 2016. Wearable pendant device monitoring
using new wavelet-based methods shows daily life and laboratory gaits are different. Medical and
Biological Engineering and Computing 54, 663–674. doi:10.1007/s11517-015-1357-9

175
Bruening, D.A., Ridge, S.T., 2014. Automated event detection algorithms in pathological gait. Gait and Posture
39, 472–477. doi:10.1016/j.gaitpost.2013.08.023
Brunton, L.K., Rice, C.L., 2012. Fatigue in cerebral palsy : A critical review. Developmental
neurorehabilitation 1, 54–62. doi:10.3109/17518423.2011.629633
Brzostowski, K., 2018. Toward the unaided estimation of human walking speed based on sparse modeling.
IEEE Transactions on Instrumentation and Measurement 67, 1389–1398.
doi:10.1109/TIM.2018.2800198
Bugané, F., Benedetti, M.G., Casadio, G., Attala, S., Biagi, F., Manca, M., Leardini, A., 2012. Estimation of
spatial-temporal gait parameters in level walking based on a single accelerometer: Validation on normal
subjects by standard gait analysis. Computer Methods and Programs in Biomedicine 108, 129–137.
doi:10.1016/j.cmpb.2012.02.003
Bussmann, J.B.J., Culhane, K.M., Horemans, H.L.D., Lyons, G.M., Stam, H.J., 2004. Validity of the prosthetic
activity monitor to assess the duration and spatio-temporal characteristics of prosthetic walking. IEEE
Transactions on Neural Systems and Rehabilitation Engineering 12, 379–386.
doi:10.1109/TNSRE.2004.840495
Caldas, R., Mundt, M., Potthast, W., Neto, F.B.D., Markert, B., Buarque, F., Neto, D.L., 2017. A systematic
review of gait analysis methods based on inertial sensors and adaptive algorithms. Gait and Posture 57,
204–210. doi:10.1016/j.gaitpost.2017.06.019
Camomilla, V., Bonci, T., Cappozzo, A., 2017a. Soft tissue displacement over pelvic anatomical landmarks
during 3-D hip movements. Journal of Biomechanics 62, 14–20. doi:10.1016/j.jbiomech.2017.01.013
Camomilla, V., Cereatti, A., Vannozzi, G., Cappozzo, A., 2006. An optimized protocol for hip joint centre
determination using the functional method. Journal of Biomechanics 39, 1096–1106.
doi:10.1016/j.jbiomech.2005.02.008
Camomilla, V., Dumas, R., Cappozzo, A., 2017b. Human movement analysis: The soft tissue artefact issue.
Journal of Biomechanics 62, 1–4. doi:10.1016/j.jbiomech.2017.09.001
Cans, C., De-la-Cruz, J., Mermet, M.A., 2008. Epidemiology of cerebral palsy. Paediatrics and Child Health
18, 393–398. doi:10.1016/j.paed.2008.05.015
Capio, C.M., Sit, C.H.P., Abernethy, B., Rotor, E.R., 2010. Physical activity measurement instruments for
children with cerebral palsy: A systematic review. Developmental Medicine and Child Neurology 52,
908–916. doi:10.1111/j.1469-8749.2010.03737.x
Cappozzo, A., Della Croce, U., Leardini, A., Chiari, L., 2005. Human movement analysis using
stereophotogrammetry. Part 1: theoretical background. Gait and Posture 21, 186–96.
doi:10.1016/j.gaitpost.2004.01.010
Carcreff, L., Bonnefoy-mazure, A., De Coulon, G., Armand, S., 2016a. Analyse quantifiée de la marche.
Movement & sport sciences 3, 7–21. doi:10.1051/sm/2015033
Carcreff, L., Bonnefoy-Mazure, A., De Coulon, G., Armand, S., 2016b. Clinical gait analysis. Movement and
Sports Sciences - Science et Motricite. doi:10.1051/sm/2015033
Carcreff, L., Fluss, J., Allali, G., Valenza, N., Aminian, K., Newman, C.J., Armand, S., 2019a. The effect of
dual tasks on gait in children with cerebral palsy. Gait and Posture 70, 148–155.
doi:10.1016/j.gaitpost.2006.11.014
Carcreff, L., Gerber, C.N., Paraschiv-Ionescu, A., De Coulon, G., Newman, C.J., Armand, S., Aminian, K.,
2018. What is the Best Configuration of Wearable Sensors to Measure Spatiotemporal Gait Parameters
in Children with Cerebral Palsy? Sensors 18. doi:10.3390/s18020394
Carcreff, L., Paraschiv-ionescu, A., Gerber, C.N., Newman, C.J., Armand, S., Aminian, K., 2019b. A
Personalized Approach to Improve Walking Detection in Real-Life Settings : Application to Children
with Cerebral Palsy. Sensors 19, 1–17.
Carollo, J., Worster, K., Pan, Z., Chang, F., Valvano, J., 2012. Changes in inter-segmental coordination and
gait performance after the rectus femoris transfer procedure in children with cerebral palsy. Gait and
Posture 36, S28–S29. doi:10.1016/j.gaitpost.2011.10.227
Carson, M.C., Harrington, M.E., Thompson, N., O’Connor, J.J., Theologis, T.N., 2001. Kinematic analysis of
a multi-segment foot model for research and clinical applications: A repeatability analysis. Journal of
Biomechanics 34, 1299–1307. doi:10.1016/s0021-9290(01)00101-4
Cavagna, G.A., Thys, H., Zamboni, A., 1976. The source of external work in level walking and running.
Journal of physiology 262, 639–657.
Chabrier, S., Pouyfaucon, M., Chatelin, A., Bleyenheuft, Y., Fluss, J., Gautheron, V., Newman, C.J., Sébire,
G., Van Bogaert, P., Vuillerot, C., Brochard, S., Dinomais, M., 2019. From congenial paralysis to post-
early brain injury developmental condition: Where does cerebral palsy actually stand? Annals of Physical
176
and Rehabilitation Medicine 1–8. doi:10.1016/j.rehab.2019.07.003
Chang, F.M., Rhodes, J.T., Flynn, K.M., Carollo, J.J., 2010. The role of gait analysis in treating gait
abnormalities in cerebral palsy. Orthopedic Clinics of North America 41, 489–506.
doi:10.1016/j.ocl.2010.06.009
Chang, H.C., Hsu, Y.L., Yang, S.C., Lin, J.C., Wu, Z.H., 2016. A wearable inertial measurement system with
complementary filter for gait analysis of patients with stroke or Parkinson’s disease. IEEE Access 4,
8442–8453. doi:10.1109/ACCESS.2016.2633304
Chau, T., 2001. A review of analytical techniques for gait data. Part 1: fuzzy, statistical and fractal methods.
Gait and Posture 13, 49–66. doi:10.1016/S0966-6362(00)00094-1
Chen, S., Lach, J., Lo, B., Yang, G.-Z., 2016. Toward Pervasive Gait Analysis With Wearable Sensors: A
Systematic Review. IEEE Journal of Biomedical and Health Informatics 20, 1521–1537.
doi:10.1109/JBHI.2016.2608720
Chen, X., Liao, S., Cao, S., Wu, D., Zhang, X., 2017. An Acceleration-Based Gait Assessment Method for
Children with Cerebral Palsy. Sensors 17, 1002. doi:10.3390/s17051002
Chiari, L., Della Croce, U., Leardini, A., Cappozzo, A., 2005. Human movement analysis using
stereophotogrammetry. Part 2: instrumental errors. Gait and Posture 21, 197–211.
doi:10.1016/j.gaitpost.2004.04.004
Cho, Y., Cho, H., Kyung, C., 2016. Design and Implementation of Practical Step Detection Algorithm for
Wrist-Worn Devices. IEEE Sensors Journal 16, 7720–7730. doi:10.1109/JSEN.2016.2603163
Cho, Y.S., Jang, S.H., Cho, J.S., Kim, M.J., Lee, H.D., Lee, S.Y., Moon, S.B., 2018. Evaluation of validity
and reliability of inertial measurement unit-based gait analysis systems. Annals of Rehabilitation
Medicine 42, 872–883. doi:10.5535/arm.2018.42.6.872
Christensen, C., Haddad, A., Maus, E., 2017. Validity of an Accelerometer Used to Measure Step Count in
Children With Idiopathic Toe Walking. Pediatric Physical Therapy 29, 153–157.
doi:10.1097/PEP.0000000000000364
Clanchy, K., Tweedy, S., Boyd, R., Stewart, T., 2009. Validation of accelerometry for physical activity
measurment in ambulant adolescents with cerebral palsy. Developmental Medicine and Child Neurology
51, 33. doi:10.1111/j.1469-8749.2009.03452-1.x
Clanchy, K.M., Tweedy, S.M., Boyd, R.N., Trost, S.G., 2011. Validity of accelerometry in ambulatory
children and adolescents with cerebral palsy. European journal of applied physiology 111, 2951–2959.
doi:10.1007/s00421-011-1915-2
Claridge, E.A., Van Der Stam, N., Horemans, H.L.D., Bussmann, J.B.J., Tang, A., Timmons, B.W., Gorter,
J.W., Van Den Berg-Emons, H.J.G., 2017. Validation of the Activ8 accelerometer: Detection of body
postures and movements in adults with cerebral palsy. Developmental Medicine and Child Neurology
59, 17. doi:10.1111/dmcn.13455
Clifton, J.R., Beausoliel, R.W., Meese, W.J., 1982. Effects of Thermal Insulation Penetrating Electrical Boxes.
ASTM Special Technical Publication 51, 241–261. doi:10.1016/j.gaitpost.2016.09.021
Cola, G., Avvenuti, M., Musso, F., Vecchio, A., 2017. Personalized gait detection using a wrist-worn
accelerometer. 2017 IEEE 14th International Conference on Wearable and Implantable Body Sensor
Networks, BSN 2017 173–177. doi:10.1109/BSN.2017.7936035
Colyer, S.L., Evans, M., Cosker, D.P., Salo, A.I.T., 2018. A Review of the Evolution of Vision-Based Motion
Analysis and the Integration of Advanced Computer Vision Methods Towards Developing a Markerless
System. Sports Medicine - Open 4. doi:10.1186/s40798-018-0139-y
Conradsson, D., Halvarsson, A., 2019. The effects of dual-task balance training on gait in older women with
osteoporosis: A randomized controlled trial. Gait and Posture 68, 562–568.
doi:10.1016/j.gaitpost.2019.01.005
Cook, R.E., Schneider, I., Hazlewood, M.E., Hillman, S.J., Robb, J.E., 2003. Gait analysis alters decision-
making in cerebral palsy. Journal of pediatric orthopedics 23, 292–295. doi:10.1097/01241398-
200305000-00004
Corp, D.T., Youssef, G.J., Clark, R.A., Gomes-Osman, J., Yücel, M.A., Oldham, S.J., Aldraiwiesh, S., Rice,
J., Pascual-Leone, A., Rogers, M.A., 2018. Reduced motor cortex inhibition and a ‘cognitive-first’
prioritisation strategy for older adults during dual-tasking. Experimental Gerontology 113, 95–105.
doi:10.1016/j.exger.2018.09.018
Courtine, G., Papaxanthis, C., Schieppati, M., 2006. Coordinated modulation of locomotor muscle synergies
constructs straight-ahead and curvilinear walking in humans. Experimental Brain Research 170, 320–
335. doi:10.1007/s00221-005-0215-7
Crea, S., Donati, M., De Rossi, S.M.M., Oddo, C.M., Vitiello, N., 2014. A wireless flexible sensorized insole

177
for gait analysis. Sensors 14, 1073–1093. doi:10.3390/s140101073
Cuomo, A. V, Gamradt, S.C., Kim, C.O., Pirpiris, M., Gates, P.E., Mccarthy, J.J., Otsuka, N.Y., 2007. Health-
Related Quality of Life Outcomes Improve After Multilevel Surgery in Ambulatory Children With
Cerebral Palsy 27, 653–657.
Cutti, A.G., Ferrari, Alberto, Garofalo, P., Raggi, M., Cappello, A., Ferrari, Adriano, 2010. “Outwalk”: A
protocol for clinical gait analysis based on inertial and magnetic sensors. Medical and Biological
Engineering and Computing 48, 17–25. doi:10.1007/s11517-009-0545-x
Dadashi, F., Mariani, B., Rochat, S., Büla, C.J., Santos-Eggimann, B., Aminian, K., 2013. Gait and foot
clearance parameters obtained using shoe-worn inertial sensors in a large-population sample of older
adults. Sensors 14, 443–457. doi:10.3390/s140100443
Dang, V.M., 2012. Déterminants de la participation chez les adolescents avec paralysie cérébrale: une étude
longitudinale européenne.
Davids, J.R., 2006. Quantitative Gait Analysis in the Treatment of Children With Cerebral Palsy. Journal of
Pediatric Orthopaedics 26, 557–559.
Davis, R.B., 1997. Reflections on clinical gait analysis. Journal of Electromyography and Kinesiology 7, 251–
257.
Davis, R.B., Õunpuu, S., Tyburski, D., Gage, J.R., 1991. A gait analysis data collection and reduction
technique. Human Movement Science 10, 575–587. doi:http://dx.doi.org/10.1016/0167-9457(91)90046-
Z
De Silva, A.H.T.E., Sampath, W.H.P., Sameera, N.H.L., Amarasinghe, Y.W.R., Mitani, A., 2018.
Development of a novel telecare system, integrated with plantar pressure measurement system.
Informatics in Medicine Unlocked 12, 98–105. doi:10.1016/j.imu.2018.07.001
Degache, F., Zollinger, M., Currat, D., Pochon, L., Peyrot, N., Newmans, C., Malatesta, D., 2014. Mechanics
of overground and treadmill walking in children. Annals of Physical and Rehabilitation Medicine 57,
e168. doi:10.1016/j.rehab.2014.03.607
Dejnabadi, H., Jolles, B.M., Aminian, K., 2008. A new approach for quantitative analysis of inter-joint
coordination during gait. IEEE Transactions on Biomedical Engineering 55, 755–764.
doi:10.1109/TBME.2007.901034
Del Din, S., Godfrey, A., Galna, B., Lord, S., Rochester, L., 2016a. Free-living gait characteristics in ageing
and Parkinson’s disease: Impact of environment and ambulatory bout length. Journal of
NeuroEngineering and Rehabilitation 13, 1–12. doi:10.1186/s12984-016-0154-5
Del Din, S., Godfrey, A., Mazza, C., Lord, S., Rochester, L., Mazzà, C., Lord, S., Rochester, L., 2016b. Free-
living monitoring of Parkinson’s disease: Lessons from the field. Movement Disorders 31, 1293–1313.
doi:10.1002/mds.26718
Del Din, S., Hickey, A., Ladha, C., Stuart, S., Bourke, A.K., Esser, P., Rochester, L., Godfrey, A., 2016c.
Instrumented gait assessment with a single wearable: an introductory tutorial. F1000Research 5, 2323.
doi:10.12688/f1000research.9591.1
Della Croce, U., Leardini, A., Chiari, L., Cappozzo, A., 2005. Human movement analysis using
stereophotogrammetry. Part 4: assessment of anatomical landmark misplacement and its effects on joint
kinematics. Gait and Posture 21, 226–237. doi:10.1016/j.gaitpost.2004.05.003
Demonceau, M., Donneau, A.F., Croisier, J.L., Skawiniak, E., Boutaayamou, M., Maquet, D., Garraux, G.,
2015. Contribution of a trunk accelerometer system to the characterization of Gait in patients with mild-
to-moderate Parkinson’s disease. IEEE Journal of Biomedical and Health Informatics 19, 1803–1808.
doi:10.1109/JBHI.2015.2469540
Derrick, T.R., van den Bogert, A.J., Cereatti, A., Dumas, R., Fantozzi, S., Leardini, A., 2019. ISB
recommendations on the reporting of intersegmental forces and moments during human motion analysis.
Journal of Biomechanics. doi:10.1016/j.jbiomech.2019.109533
Derungs, A., Schuster-Amft, C., Amft, O., 2018. Longitudinal Walking Analysis in Hemiparetic Patients
Using Wearable Motion Sensors: Is There Convergence Between Body Sides? Frontiers in
Bioengineering and Biotechnology 6. doi:10.3389/fbioe.2018.00057
Desailly, E., Daniel, Y., Sardain, P., Lacouture, P., 2009. Foot contact event detection using kinematic data in
cerebral palsy children and normal adults gait. Gait and Posture 29, 76–80.
doi:10.1016/j.gaitpost.2008.06.009
Di Marco, R., Rossi, S., Castelli, E., Patanè, F., Mazzà, C., Cappa, P., 2017. Effects of the calibration procedure
on the metrological performances of stereophotogrammetric systems for human movement analysis.
Measurement: Journal of the International Measurement Confederation 101, 265–271.
doi:10.1016/j.measurement.2016.01.008
178
Di Marco, R., Rossi, S., Patanè, F., Cappa, P., 2015. Technical quality assessment of an optoelectronic system
for movement analysis. Journal of Physics: Conference Series 588, 1–6. doi:10.1088/1742-
6596/588/1/012030
Diez, L.E., Bahillo, A., Otegui, J., Otim, T., 2018. Step Length Estimation Methods Based on Inertial Sensors:
A Review. IEEE Sensors Journal 18, 6908–6926. doi:10.1109/JSEN.2018.2857502
Dixon, P.C., Stebbins, J., Theologis, T., Zavatsky, A.B., 2016. The use of turning tasks in clinical gait analysis
for children with cerebral palsy. Clinical Biomechanics 32, 286–294.
doi:10.1016/j.clinbiomech.2015.10.010
Djurić-Jovičić, M.D., Jovičić, N.S., Popović, D.B., Djordjević, A.R., 2012. Nonlinear optimization for drift
removal in estimation of gait kinematics based on accelerometers. Journal of Biomechanics 45, 2849–
2854. doi:10.1016/j.jbiomech.2012.08.028
Djurić-Jovičić, M.D., Jovičić, N.S., Radovanović, S.M., Kresojević, N.D., Kostić, V.S., Popović, M.B., 2014.
Quantitative and qualitative gait assessments in Parkinson’s disease patients. Vojnosanitetski Pregled 71,
809–816. doi:10.2298/VSP130422012D
Dobkin, B.H., Xu, X., Batalin, M., Thomas, S., Kaiser, W., 2011. Reliability and validity of bilateral ankle
accelerometer algorithms for activity recognition and walking speed after stroke. Stroke 42, 2246–2250.
doi:10.1161/STROKEAHA.110.611095
Doheny, E.P., Foran, T.G., Greene, B.R., 2010. A single gyroscope method for spatial gait analysis. 2010
Annual International Conference of the IEEE Engineering in Medicine and Biology Society, EMBC’10
2010, 1300–1303. doi:10.1109/IEMBS.2010.5626397
Duong, H.T., Suh, Y.S., 2017. Walking Parameters Estimation Based on a Wrist-Mounted Inertial Sensor for
a Walker User. IEEE Sensors Journal 17, 2100–2108. doi:10.1109/JSEN.2017.2658618
Elbaz, A., Carcaillon, L., Kab, S., Moisan, F., 2016. Epidemiology of Parkinson’s disease. Revue neurologique
172, 14–26. doi:10.1007/s00702-017-1686-y
Elhinidi, E.I.M., Ismaeel, M.M.I., El-Saeed, T.M., 2016. Effect of dual-task training on postural stability in
children with infantile hemiparesis. Journal of Physical Therapy Science 28, 875–880.
doi:10.1589/jpts.28.875
Enright, P.L., 2003. The Six-Minute Walk Test. Respiratory Care 48, 783–785.
Esser, P., Dawes, H., Collett, J., Feltham, M.G., Howells, K., 2011. Assessment of spatio-temporal gait
parameters using inertial measurement units in neurological populations. Gait and Posture 34, 558–560.
doi:10.1016/j.gaitpost.2011.06.018
Ewolds, H.E., Bröker, L., de Oliveira, R.F., Raab, M., Künzell, S., 2017. Implicit and explicit knowledge both
improve dual task performance in a continuous pursuit tracking task. Frontiers in Psychology 8.
doi:10.3389/fpsyg.2017.02241
Fairhurst, C., 2012. Cerebral palsy: The whys and hows. Archives of Disease in Childhood: Education and
Practice Edition 97, 122–131. doi:10.1136/edpract-2011-300593
Falbriard, M., Meyer, F., Mariani, B., Millet, G.P., Aminian, K., 2018. Accurate estimation of running
temporal parameters using foot-worn inertial sensors. Frontiers in Physiology 9.
doi:10.3389/fphys.2018.00610
Fasel, B., 2017. Drift Reduction for Inertial Sensor Based Orientation and Position Estimation in the Presence
of High Dynamic Variability During Competitive Skiing and Daily-Life Walking PAR 7803.
Fasel, Benedikt, Duc, C., Dadashi, F., Bardyn, F., Savary, M., Farine, P.-A.A., Aminian, K., 2017. A wrist
sensor and algorithm to determine instantaneous walking cadence and speed in daily life walking.
Medical and Biological Engineering and Computing 55, 1773–1785. doi:10.1007/s11517-017-1621-2
Fasel, B, Duc, C., Dadashi, F., Bardyn, F., Savary, M., Farine, P.A., Aminian, K., 2017. A wrist sensor and
algorithm to determine instantaneous walking cadence and speed in daily life walking. Medical and
Biological Engineering and Computing 55, 1773–1785. doi:10.1007/s11517-017-1621-2
Fatmehsari, Y.R., Bahrami, F., 2010. Assessment of Parkinson’s disease: Classification and complexity
analysis. 2010 17th Iranian Conference of Biomedical Engineering (ICBME) 1–4.
doi:10.1109/ICBME.2010.5704930
Fauconnier, J., Dickinson, H.O., Beckung, E., Marcelli, M., McManus, V., Michelsen, S.I., Parkes, J.,
Parkinson, K.N., Thyen, U., Arnaud, C., Colver, A., 2009. Participation in life situations of 8-12 year old
children with cerebral palsy: Cross sectional European study. BMJ (Online) 338, 1116–1121.
doi:10.1136/bmj.b1458
Favre, J., Aissaoui, R., Jolles, B.M., Guise, J.A. De, Aminian, K., 2009. Functional calibration procedure for
3D knee joint angle description using inertial sensors. Journal of Biomechanics 42, 2330–2335.
doi:10.1016/j.jbiomech.2009.06.025

179
Feehan, L.M., Geldman, J., Sayre, E.C., Park, C., Ezzat, A.M., Yoo, J.Y., Hamilton, C.B., Li, L.C., 2018.
Accuracy of fitbit devices: Systematic review and narrative syntheses of quantitative data. Journal of
Medical Internet Research 20. doi:10.2196/10527
Feldhege, F., Mau-Moeller, A., Lindner, T., Hein, A., Markschies, A., Zettl, U.K., Bader, R., 2015. Accuracy
of a custom physical activity and knee angle measurement sensor system for patients with neuromuscular
disorders and gait abnormalities. Sensors 15, 10734–10752. doi:10.3390/s150510734
Femery, V., Moretto, P., Renaut, H., Thévenon, A., Lensel, G., 2002. Measurement of plantar pressure
distribution in hemiplegic children: Changes to adaptative gait patterns in accordance with deficiency.
Clinical Biomechanics 17, 406–413. doi:10.1016/S0021-9290(02)00063-5
Ferrari, A., Ginis, P., Hardegger, M., Casamassima, F., Rocchi, L., Chiari, L., 2016. A mobile Kalman-filter
based solution for the real-time estimation of spatio-temporal gait parameters. IEEE Transactions on
Neural Systems and Rehabilitation Engineering 24, 764–773. doi:10.1109/TNSRE.2015.2457511
Figueiredo, J., Félix, P., Costa, L., Moreno, J.C., Santos, C.P., Felix, P., Costa, L., Moreno, J.C., Santos, C.P.,
2018. Gait Event Detection in Controlled and Real-Life Situations: Repeated Measures From Healthy
Subjects. IEEE Transactions on Neural Systems and Rehabilitation Engineering 26, 1945–1956.
doi:10.1109/TNSRE.2018.2868094
Florence, J.M., Pandya, S., King, W.M., Robison, J.D., Baty, J., Miller, J.P., Schierbecker, J., Signore, L.C.,
1992. Intrarater Reliability of Manual Muscle Test (Medical Research Council scale) Grades in
Duchenne’s Muscular Dystrophy. Physical therapy 72, 115–122.
Fong, D.T.P., Chan, Y.Y., 2010. The use of wearable inertial motion sensors in human lower limb
biomechanics studies: A systematic review. Sensors 10, 11556–11565. doi:10.3390/s101211556
Fortino, G., Gravina, R., Li, W., Ma, C., 2015. Using cloud-assisted body area networks to track people
physical activity in mobility, in: BodyNets International Conference on Body Area Networks.
doi:10.4108/eai.28-9-2015.2261424
Fortune, E., Lugade, V., Morrow, M., Kaufman, K., 2014. Validity of using tri-axial accelerometers to measure
human movement - Part II: Step counts at a wide range of gait velocities. Medical Engineering and
Physics 36, 659–669. doi:10.1016/j.medengphy.2014.02.006
Fourati, H., 2015. Heterogeneous data fusion algorithm for pedestrian navigation via foot-mounted inertial
measurement unit and complementary filter. IEEE Transactions on Instrumentation and Measurement
64, 221–229. doi:10.1109/TIM.2014.2335912
Fowler, E.G., Staudt, L.A., Greenberg, M.B., Oppenheim, W.L., 2009. Selective Control Assessment of the
Lower Extremity (SCALE): development, validation, and interrater reliability of a clinical tool for
patients with cerebral palsy. Developmental Medicine and Child Neurology 51, 607–614.
doi:10.1111/j.1469-8749.2008.03186.x
Friard, O., Gamba, M., 2016. BORIS: a free, versatile open-source event-logging software for video/audio
coding and live observations. Methods in Ecology and Evolution 7, 1325–1330. doi:10.1111/2041-
210X.12584
Frisch, D., Msall, M.E., 2013. Health, functioning, and participation of adolescents and adults with cerebral
palsy: A review of outcomes research. Developmental Disabilities Research Reviews 18, 84–94.
doi:10.1002/ddrr.1131
Fritz, S., Lusardi, M., 2009. White paper: “walking speed: the sixth vital sign”: Journal of Geriatric Physical
Therapy 32, 2–5.
Gage, J.R., 2003. Con: Interobserver variability of gait analysis. Journal of Pediatric Orthopaedics 23, 290–
291. doi:10.1097/01241398-200305000-00003
Gage, J.R., Schwartz, M.H., Koop, S.E., Novacheck, T.F., 2009. The identification and treatment of gait
problems in cerebral palsy, 2nd edition, Clinics in Developmental Medicine.
doi:10.1001/archpedi.1965.02090030355031
Ganea, R., Jeannet, P.Y., Paraschiv-Ionescu, A., Goemans, N.M., Piot, C., Van Den Hauwe, M., Aminian, K.,
Hauwe, M. Van Den, Aminian, K., Van Den Hauwe, M., Aminian, K., 2012. Gait assessment in children
with duchenne muscular dystrophy during long-distance walking. Journal of Child Neurology 27, 30–38.
doi:10.1177/0883073811413581
Gerber, C.N., Carcreff, L., Paraschiv-Ionescu, A., Armand, S., Newman, C.J., Gerber, C.N., Carcreff, L.,
Paraschiv-Ionescu, A., Armand, S., Newman, C.J., 2019. Reliability of single-day walking performance
and physical activity measures using inertial sensors in children with cerebral palsy. Annals of Physical
and Rehabilitation Medicine 2–7. doi:10.1016/j.rehab.2019.02.003
Ghoussayni, S., Stevens, C., Durham, S., Ewins, D., 2004. Assessment and validation of a simple automated
method for the detection of gait events and intervals. Gait and Posture 20, 266–272.
180
doi:10.1016/j.gaitpost.2003.10.001
González, R.C., Alvarez, D., López, A.M., Alvarez, J.C., 2007. Modified pendulum model for mean step length
estimation. Annual International Conference of the IEEE Engineering in Medicine and Biology -
Proceedings 2007, 1371–1374. doi:10.1109/IEMBS.2007.4352553
Gorter, J.W., Noorduyn, S.G., Obeid, J., Timmons, B.W., 2012. Accelerometry: A Feasible Method to
Quantify Physical Activity in Ambulatory and Nonambulatory Adolescents with Cerebral Palsy.
International Journal of Pediatrics 2012, 1–6. doi:10.1155/2012/329284
Gosselin, D., Wright, A., Sole, G., Girolami, G., Taylor, J., Baxter, G.D., 2018. Maximizing Participation
During Walking in Children With Disabilities: Is response to unpredictability important? Pediatric
Physical Therapy 31, 122–127. doi:10.1097/pep.0000000000000575
Goswami, A., 1998. A new gait parameterization technique by means of cyclogram moments: Application to
human slope walking. Gait and Posture 8, 15–36.
Gouelle, A., 2012. Développement d’un score de stabilité chez les personnes présentant des pathologies
d’origine neurologique entraînant des troubles de la marche et/ou de l’équilibre.
Gouwanda, D., 2013. Comparison of gait symmetry indicators in overground walking and treadmill walking
using wireless gyroscopes. Journal of mechanics in medicine and biology 14.
doi:10.1142/S0219519414500067
Gouwanda, D., Gopalai, A.A., 2015. A robust real-time gait event detection using wireless gyroscope and its
application on normal and altered gaits. Medical Engineering and Physics 37, 219–225.
doi:10.1016/j.medengphy.2014.12.004
Gracies, J.-M., Burke, K., Clegg, N.J., Browne, R., Fehlings, D., Matthews, D., Tilton, A., Delgado, M.R.,
2010. Reliability of the Tardieu Scale for assessing spasticity in children with cerebral palsy. Archives
of Physical Medicine and Rehabilitation 91, 421–428. doi:10.1016/j.apmr.2009.11.017
Gracies, J.M., 2005a. Pathophysiology of spastic paresis. I: Paresis and soft tissue changes. Muscle and Nerve
31, 535–551. doi:10.1002/mus.20284
Gracies, J.M., 2005b. Pathophysiology of spastic paresis. II: Emergence of muscle overactivity. Muscle and
Nerve 31, 552–571. doi:10.1002/mus.20285
Graham, D., Paget, S.P., Wimalasundera, N., 2019. Current thinking in the health care management of children
with cerebral palsy. The Medical journal of Australia 210, 129–135. doi:10.5694/mja2.12106
Graham, H.K., Harvey, A., Rodda, J., Nattrass, G.R., Pirpiris, M., 2004. The Functional Mobility Scale (FMS).
Journal of pediatric orthopedics 24, 514–520. doi:10.1097/01241398-200409000-00011
Graham, H.K., Rosenbaum, P., Paneth, N., Dan, B., Lin, J.-P., Damiano, D.L., Becher, J.G., Gaebler-Spira,
D., Colver, A., Reddihough, D.S., Crompton, K.E., Lieber, R.L., 2016. Cerebral palsy. Nature reviews,
disease primers 2, 323–336. doi:10.1016/B978-0-444-63916-5.00020-3
Greene, B.R., McGrath, D., O’Neill, R., O’Donovan, K.J., Burns, A., Caulfield, B., 2010. An adaptive
gyroscope-based algorithm for temporal gait analysis. Medical and Biological Engineering and
Computing 48, 1251–1260. doi:10.1007/s11517-010-0692-0
Guinet, A.-L., Desailly, E., 2017. Is physical activity of children with cerebral palsy correlated with clinical
gait analysis or physical examination parameters? Computer Methods in Biomechanics and Biomedical
Engineering 20, 99–100. doi:10.1080/10255842.2017.1382880
Hadders-Algra, M., Boxum, A.G., Hielkema, T., Hamer, E.G., 2017. Effect of early intervention in infants at
very high risk of cerebral palsy: a systematic review. Developmental Medicine and Child Neurology 59,
246–258. doi:10.1111/dmcn.13331
Haji Ghassemi, N., Hannink, J., Martindale, C.F., Gaßner, H., Müller, M., Klucken, J., Eskofier, B.M.B.M.,
Haji Ghassemi, N., Hannink, J., Martindale, C.F., Gaßner, H., Müller, M., Klucken, J., Eskofier,
B.M.B.M., Gassner, H., Muller, M., Klucken, J., Eskofier, B.M.B.M., Gaßner, H., Müller, M., Klucken,
J., Eskofier, B.M.B.M., 2018. Segmentation of gait sequences in sensor-based movement analysis: A
comparison of methods in Parkinson’s disease. Sensors 18, 1–15. doi:10.3390/s18010145
Haley, S.M., Coster, W.I., Kao, Y.-C., Dumas, H.M., Fragala-Pinkham, M.A., Kramer, J.M., Ludlow, L.H.,
Moed, R., 2010. Lessons from use of the Pediatric Evaluation of Disability Inventory: where do we go
from here? Pediatric physical therapy 22, 69–75. doi:10.1097/PEP.0b013e3181cbfbf6
Han, Y.C., Wong, K.I., Murray, I., 2019. Gait Phase Detection for Normal and Abnormal Gaits using IMU.
IEEE Sensors Journal 1. doi:10.1109/JSEN.2019.2894143
Hanlon, M., Anderson, R., 2009. Real-time gait event detection using wearable sensors. Gait and Posture 30,
523–527. doi:10.1016/j.gaitpost.2009.07.128
Hanna, S.E., Rosenbaum, P.L., Bartlett, D.J., Palisano, R.J., Walter, S.D., Avery, L., Russell, D.J., 2009.
Stability and decline in gross motor function among children and youth with cerebral palsy aged 2 to 21

181
years. Developmental Medicine and Child Neurology 51, 295–302. doi:10.1111/j.1469-
8749.2008.03196.x
Hannink, J., Kautz, T., Pasluosta, C.F., Gasmann, K.G., Klucken, J., Eskofier, B.M., 2017. Sensor-Based Gait
Parameter Extraction with Deep Convolutional Neural Networks. IEEE Journal of Biomedical and Health
Informatics 21, 85–93. doi:10.1109/JBHI.2016.2636456
Harrington, M.E., Zavatsky, A.B., Lawson, S.E.M., Yuan, Z., Theologis, T.N., 2007. Prediction of the hip
joint centre in adults, children, and patients with cerebral palsy based on magnetic resonance imaging.
Journal of Biomechanics 40, 595–602. doi:10.1016/j.jbiomech.2006.02.003
Hausdorff, J.M., Alexander, N.B., 2005. Gait disorders, Evaluation and management.
Hegde, N., Bries, M., Sazonov, E., 2016. A Comparative Review of Footwear-Based Wearable Systems.
Electronics 5, 48. doi:10.3390/electronics5030048
Hegde, N., Zhang, T., Uswatte, G., Taub, E., Barman, J., McKay, S., Taylor, A., Morris, D.M., Griffin, A.,
Sazonov, E.S., 2018. The Pediatric SmartShoe: Wearable Sensor System for Ambulatory Monitoring of
Physical Activity and Gait. IEEE Transactions on Neural Systems and Rehabilitation Engineering 26,
477–486. doi:10.1109/TNSRE.2017.2786269
Heinze, F., Hesels, K., Breitbach-Faller, N., Schmitz-Rode, T., Disselhorst-Klug, C., 2010. Movement analysis
by accelerometry of newborns and infants for the early detection of movement disorders due to infantile
cerebral palsy. Medical and Biological Engineering and Computing 48, 765–772. doi:10.1007/s11517-
010-0624-z
Hershler, C., Milner, M., 1980. Angle-angle diagrams in above-knee amputee and cerebral palsy gait.
American journal of physical medicine 59, 165–183.
Heuninckx, S., Wenderoth, N., Swinnen, S.P., 2008. Systems Neuroplasticity in the Aging Brain: Recruiting
Additional Neural Resources for Successful Motor Performance in Elderly Persons. Journal of
Neuroscience 28, 91–99. doi:10.1523/jneurosci.3300-07.2008
Hickey, A., Del Din, S., Rochester, L., Godfrey, A., 2017a. Detecting free-living steps and walking bouts:
Validating an algorithm for macro gait analysis. Physiological Measurement 38, 1–15. doi:10.1088/1361-
6579/38/1/N1
Hickey, A., Stuart, S., O’Donovan, K., Godfrey, A., 2017b. Walk on the wild side: The complexity of free-
living mobility assessment. Journal of Epidemiology and Community Health 71, 624–624.
doi:10.1136/jech-2016-208752
Higuchi, T., 1988. Approach to an irregular time series on the basis of the fractal theory. Physica D 31, 277–
283.
Hillel, I., Gazit, E., Nieuwboer, A., Avanzino, L., Rochester, L., Cereatti, A., Croce, U. Della, Rikkert, M.O.,
Bloem, B.R., Pelosin, E., Del Din, S., Ginis, P., Giladi, N., Mirelman, A., Hausdorff, J.M., 2019. Is every-
day walking in older adults more analogous to dual-task walking or to usual walking? Elucidating the
gaps between gait performance in the lab and during 24/7 monitoring. European Review of Aging and
Physical Activity 16, 1–12. doi:10.1186/s11556-019-0214-5
Ho, P.-C., Chang, C.-H., Granlund, M., Hwang, A.-W., 2017. The Relationships Between Capacity and
Performance in Youths With Cerebral Palsy Differ for GMFCS Levels. Pediatric Physical Therapy 29,
23–29. doi:10.1097/PEP.0000000000000332
Hollman, J.H., McDade, E.M., Pertersen, R.C., 2011. Normative Spatiotemporal Gait Parameters in Older
Adults. Gait and Posture 34, 111–118. doi:10.1007/s11103-011-9767-z.Plastid
Holsbeeke, L., Ketelaar, M., Schoemaker, M.M., Gorter, J.W., 2009. Capacity, Capability, and Performance:
Different Constructs or Three of a Kind? Archives of Physical Medicine and Rehabilitation 90, 849–855.
doi:10.1016/j.apmr.2008.11.015
Houwink, A., Aarts, P.B.M., Geurts, A.C.H., Steenbergen, B., 2011. A neurocognitive perspective on
developmental disregard in children with hemiplegic cerebral palsy. Research in Developmental
Disabilities 32, 20157–2163. doi:10.1016/j.ridd.2011.07.012
Hsu, W.-C., Sugiarto, T., Lin, Y.-J., Yang, F.-C., Lin, Z.-Y., Sun, C.-T., Hsu, C.-L., Chou, K.-N., 2018.
Multiple-Wearable-Sensor-Based Gait Classification and Analysis in Patients with Neurological
Disorders. Sensors 18, 3397. doi:10.3390/s18103397
Hsu, Y.L., Chung, P.C., Wang, W.H., Pai, M.C., Wang, C.Y., Lin, C.W., Wu, H.L., Wang, J.S., 2014. Gait
and balance analysis for patients with Alzheimer’s disease using an inertial-sensor-based wearable
instrument. IEEE Journal of Biomedical and Health Informatics 18, 1822–1830.
doi:10.1109/JBHI.2014.2325413
Hu, J.S., Sun, K.C., Cheng, C.Y., 2013. A kinematic human-walking model for the normal-gait-speed
estimation using tri-axial acceleration signals at waist location. IEEE Transactions on Biomedical
182
Engineering 60, 2271–2279. doi:10.1109/TBME.2013.2252345
Huang, H.-J., Mercer, V.S., Thorpe, D.E., 2003. Effects of different concurrent cognitive tasks on temporal-
distance gait variables in children. Pediatric physical therapy 105–113.
doi:10.1097/01.PEP.0000067886.96352.6B
Hundza, S., Hook, W., Harris, C., 2013. Accurate and reliable gait cycle detection in Parkinson ’ s disease.
IEEE transactions on neural systems and rehabilitation engineering 22, 127–137.
Hung, Y.C., Ferre, C.L., Gordon, A.M., 2018. Improvements in Kinematic Performance After Home-Based
Bimanual Intensive Training for Children with Unilateral Cerebral Palsy. Physical and Occupational
Therapy in Pediatrics 38, 370–381. doi:10.1080/01942638.2017.1337663
Hung, Y.C., Meredith, G.S., 2014. Influence of dual task constraints on gait performance and bimanual
coordination during walking in children with unilateral Cerebral Palsy. Research in Developmental
Disabilities 35, 755–760. doi:10.1016/j.ridd.2014.01.024
Hwang, T.H., Reh, J., Effenberg, A.O., Blume, H., 2018. Real-Time Gait Analysis Using a Single Head-Worn
Inertial Measurement Unit. IEEE Transactions on Consumer Electronics 64, 240–248.
doi:10.1109/TCE.2018.2843289
Iosa, M., De Sanctis, M., Summa, A., Bergamini, E., Morelli, D., Vannozzi, G., 2018. Usefulness of
magnetoinertial wearable devices in neurorehabilitation of children with cerebral palsy. Applied Bionics
and Biomechanics 2018. doi:10.1155/2018/5405680
Iosa, M., Marro, T., Paolucci, S., Morelli, D., 2011. Stability and harmony of gait in children with cerebral
palsy. Developmental Medicine and Child Neurology 53, 20–21. doi:10.1111/j.1469-8749.2011.04003.x
Iosa, M., Morelli, D., Marro, T., Paolucci, S., Fusco, A., 2013. Ability and stability of running and walking in
children with cerebral palsy. Neuropediatrics 44, 147–154. doi:10.1055/s-0033-1336016
Iosa, M., Picerno, P., Paolucci, S., Morone, G., 2016. Wearable inertial sensors for human movement analysis.
Expert Review of Medical Devices 13, 641–659. doi:10.1080/17434440.2016.1198694
Ishikawa, S., Kang, M., Bjornson, K.F., Song, K., 2013. Reliably measuring ambulatory activity levels of
children and adolescents with cerebral palsy. Archives of Physical Medicine and Rehabilitation 94, 132–
137. doi:10.1016/j.apmr.2012.07.027
Ivanenko, Y.P., Dominici, N., Lacquaniti, F., 2007. Development of independent walking in toddlers. Exercise
and Sport Sciences Reviews 35, 67–73. doi:10.1249/JES.0b013e31803eafa8
Jarchi, D., Pope, J., Lee, T.K.M., Tamjidi, L., Mirzaei, A., Sanei, S., 2018. A Review on Accelerometry-Based
Gait Analysis and Emerging Clinical Applications. IEEE Reviews in Biomedical Engineering 11, 177–
194. doi:10.1109/RBME.2018.2807182
Jarchi, D., Wong, C., Kwasnicki, R.M., Heller, B., Tew, G.A., Yang, G.Z., 2014. Gait parameter estimation
from a miniaturized ear-worn sensor using singular spectrum analysis and longest common subsequence.
IEEE Transactions on Biomedical Engineering 61, 1261–1273. doi:10.1109/TBME.2014.2299772
Jasiewicz, J.M., Allum, J.H.J., Middleton, J.W., Barriskill, A., Condie, P., Purcell, B., Li, R.C.T., 2006. Gait
event detection using linear accelerometers or angular velocity transducers in able-bodied and spinal-
cord injured individuals. Gait and Posture 24, 502–509. doi:10.1016/j.gaitpost.2005.12.017
Jner, al, Nooijen, C.F.J., Slaman, J., Stam, H.J., Roebroeck, M.E., van den Berg-Emons, R.J., Grp, L.R., 2014.
Inactive and sedentary lifestyles amongst ambulatory adolescents and young adults with cerebral palsy.
Journal of NeuroEngineering and Rehabilitation 11, 1–7. doi:10.1186/1743-0003-11-49
Johnson, A. (Surveillance of C.P. in E., 2002. Prevalence and characteristics of children with cerebral palsy in
Europe. Developmental Medicine and Child Neurology 44, 633–640.
Johnson, D., Truscott, L., Collins, E., Johnston, L.M., 2012. Physical activity at school-do children with
cerebral palsy meet the guidelines? Developmental Medicine and Child Neurology 54, 17–18.
doi:10.1111/j.1469-8749.2012.04289.x
Jolliffe, I.T., Cadima, J., 2016. Principal component analysis: a review and recent developments. Philosophical
transactions. Series A, Mathematical, physical, and engineering sciences 374, 1–16.
doi:10.1098/rsta.2015.0202
Kadaba, M.P., Ramakrishnan, H.K., Wootten, M.E., 2014. Measurement of lower extremity kinematics during
level walking. Journal of orthopaedic research 8, 397–398. doi:10.1007/978-1-4471-5451-8_100
Kainz, H., Carty, C.P., Lloyd, D.G., Modenese, L., Maine, S., Walsh, H.P.J., 2017. Effects of hip joint centre
mislocation on gait kinematics of children with cerebral palsy calculated using patient-specific direct and
inverse kinematic models. Gait and Posture 57, 154–160. doi:10.1016/j.gaitpost.2017.06.002
Kark, L., Vickers, D., McIntosh, A., Simmons, A., 2012. Use of gait summary measures with lower limb
amputees. Gait and Posture 35, 238–243. doi:10.1016/j.gaitpost.2011.09.013
Katz-Leurer, M., Rotem, H., Keren, O., Meyer, S., 2009. The effects of a “home-based” task-oriented exercise

183
programme on motor and balance performance in children with spastic cerebral palsy and severe
traumatic brain injury. Clinical Rehabilitation 23, 714–724. doi:10.1177/0269215509335293
Katz-Leurer, M., Rotem, H., Meyer, S., 2014. Effect of concurrent cognitive tasks on temporo-spatial
parameters of gait among children with cerebral palsy and typically developed controls. Developmental
Neurorehabilitation 17, 363–367. doi:10.3109/17518423.2013.810676
Keawutan, P., Bell, K., Davies, P.S.W., Boyd, R.N., 2014. Systematic review of the relationship between
habitual physical activity and motor capacity in children with cerebral palsy. Research in Developmental
Disabilities 35, 1301–1309. doi:10.1016/j.ridd.2014.03.028
Keawutan, P., Bell, K.L., Oftedal, S., Davies, P.S.W., Ware, R.S., Boyd, R.N., 2017. Habitual Physical
Activity in Children With Cerebral Palsy Aged 4 to 5 Years Across All Functional Abilities. Pediatric
Physical Therapy 29, 8–14. doi:10.1097/PEP.0000000000000327
Kelly, G., Shinners, A., Finn, G., McMahon, V., Gordon, H., Grant, A., 2016. A comparison of physical
activity levels in commonly encountered paediatric disability populations. Physiotherapy 102, e259–
e260. doi:10.1016/j.physio.2016.10.326
Kelly, V.E., Janke, A.A., Shumway-Cook, A., 2010. Effects of instructed focus and task difficulty on
concurrent walking and cognitive task performance in healthy young adults. Experimental Brain
Research 207, 65–73. doi:10.1007/s00221-010-2429-6
Khan, A., Biddiss, E., 2017. Musical Stairs: A motivational therapy tool for children with disabilities featuring
automated detection of stair-climbing gait events via inertial sensors. Medical Engineering and Physics
40, 95–102. doi:10.1016/j.medengphy.2016.12.009
Khandelwal, S., Wickström, N., 2017. Novel methodology for estimating Initial Contact events from
accelerometers positioned at different body locations. Gait and Posture.
doi:10.1016/j.gaitpost.2017.07.030
Kheirkhahan, M., Chen, Z., Corbett, D.B., Wanigatunga, A.A., Manini, T.M., Ranka, S., 2017. Adaptive walk
detection algorithm using activity counts. 2017 IEEE EMBS International Conference on Biomedical
and Health Informatics, BHI 2017 161–164. doi:10.1109/BHI.2017.7897230
Kidzińskiid, Ł., Delp, S., Schwartz, M., 2019. Automatic real-time gait event detection in children using deep
neural networks. PLoS ONE 14, 1–11. doi:10.1371/journal.pone.0211466
Kikkert, L.H.J., de Groot, M.H., van Campen, J.P., Beijnen, J.H., Hortobagyi, T., Vuillerme, N., Lamoth,
C.C.J., 2017. Gait dynamics to optimize fall risk assessment in geriatric patients admitted to an outpatient
diagnostic clinic. PLoS ONE 12, e0178615. doi:10.1371/journal.pone.0178615
Kim, D.-H., An, D.-H., Yoo, W.-G., 2018. Changes in trunk sway and impairment during sitting and standing
in children with cerebral palsy. TECHNOLOGY AND HEALTH CARE 26, 761–768. doi:10.3233/THC-
181301
Kluge, F., Gaßner, H., Hannink, J., Pasluosta, C., Klucken, J., Eskofier, B.M.B.M., Gassner, H., Hannink, J.,
Pasluosta, C., Klucken, J., Eskofier, B.M.B.M., Gaßner, H., Hannink, J., Pasluosta, C., Klucken, J.,
Eskofier, B.M.B.M., 2017. Towards mobile gait analysis: {Concurrent} validity and test-retest reliability
of an inertial measurement system for the assessment of spatio-temporal gait parameters. Sensors 17.
doi:10.3390/s17071522
Ko, J., 2014. Sensitivity to functional improvements of GMFM-88, GMFM-66, and PEDI mobility scores in
young children with cerebral palsy. Perceptual and Motor Skills 119, 305–319.
doi:10.2466/03.25.PMS.119c14z1
Komnik, I., Weiss, S., Fantini Pagani, C.H., Potthast, W., 2015. Motion analysis of patients after knee
arthroplasty during activities of daily living--a systematic review. Gait and Posture 41, 370–7.
doi:10.1016/j.gaitpost.2015.01.019
Kong, W., Lin, J., Waaning, L., Sessa, S., Cosentino, S., Magistro, D., Zecca, M., Kawashima, R., Takanishi,
A., 2016. Comparison of gait event detection from shanks and feet in single-task and multi-task walking
of healthy older adults. 2016 IEEE International Conference on Robotics and Biomimetics, ROBIO 2016
2063–2068. doi:10.1109/ROBIO.2016.7866633
Kosse, N.M., Caljouw, S., Vervoort, D., Vuillerme, N., Lamoth, C.J.C., 2015. Validity and Reliability of Gait
and Postural Control Analysis Using the Tri-axial Accelerometer of the iPod Touch. Annals of
Biomedical Engineering 43, 1935–1946. doi:10.1007/s10439-014-1232-0
Kowalski, E., Catelli, D.S., Lamontagne, M., 2019. Side does not matter in healthy young and older individuals
– Examining the importance of how we match limbs during gait studies. Gait and Posture 67, 133–136.
doi:10.1016/j.gaitpost.2018.10.008
Kumar Mishra, M., Dubey, V., Mishra, P.M., Khan, I., 2019. MEMS Technology: A Review. Journal of
Engineering Research and Reports 4, 1–24. doi:10.9734/JERR/2019/v4i116891

184
Kuo, Y.-L., Culhane, K.M., Thomason, P., Tirosh, O., Baker, R., 2009. Measuring distance walked and step
count in children with cerebral palsy: An evaluation of two portable activity monitors. Gait and Posture
29, 304–310. doi:10.1016/j.gaitpost.2008.09.014
Kurz, M.J., Wilson, T.W., Arpin, D.J., 2014. An fNIRS exploratory investigation of the cortical activity during
gait in children with spastic diplegic cerebral palsy. Brain and Development 36, 870–877.
doi:10.1016/j.braindev.2014.01.003
Kutilek, P., Viteckova, S., 2012. Prediction of lower extremity movement by cyclograms. Acta Polytechnica
52, 51–60.
Lampe, R., Mitternacht, J., Merdanovic, E., Salzmann, M., Pilge, H., 2013. [Determination of activity levels
in patients with cerebral palsy]. Zeitschrift fur Orthopadie und Unfallchirurgie 151, 248–256.
doi:10.1055/s-0032-1328492
Laudanski, A., Yang, S., Li, Q., 2011. A concurrent comparison of inertia sensor-based walking speed
estimation methods, in: Proceedings of the Annual International Conference of the IEEE Engineering in
Medicine and Biology Society, EMBS. Boston; MA; USA, United States, pp. 3484–3487.
doi:10.1109/IEMBS.2011.6090941
Leardini, A., Chiari, L., Della Croce, U., Cappozzo, A., 2005. Human movement analysis using
stereophotogrammetry. Part 3. Soft tissue artifact assessment and compensation. Gait and Posture 21,
212–225. doi:10.1016/j.gaitpost.2004.05.002
Leboeuf, F., Armand, S., Arnaud, B., 2016. OpenMA: A new open source library for working and altering the
Conventional Gait Model. Gait and Posture 49, 260. doi:10.1016/j.gaitpost.2016.07.314
Leboeuf, F., Baker, R., Barré, A., Reay, J., Jones, R., Sangeux, M., 2019. The conventional gait model, an
open-source implementation that reproduces the past but prepares for the future. Gait and Posture 69,
235–241. doi:10.1016/j.gaitpost.2019.04.015
Lee, H., Choi, S., Lee, M., 2015. Step Detection Robust against the Dynamics of Smartphones. Sensors 15,
27230–27250. doi:10.3390/s151027230
Lee, J.A., Cho, S.H., Lee, Y.J., Yang, H.K., Lee, J.W., 2010. Portable activity monitoring system for temporal
parameters of gait cycles. Journal of Medical Systems 34, 959–966. doi:10.1007/s10916-009-9311-8
Lee, J.K., Park, E.J., 2011. Quasi real-time gait event detection using shank-attached gyroscopes. Medical and
Biological Engineering and Computing 49, 707–712. doi:10.1007/s11517-011-0736-0
Lee, M., Youm, C., Jeon, J., Cheon, S.M., Park, H., 2018. Validity of shoe-type inertial measurement units for
Parkinson’s disease patients during treadmill walking. Journal of NeuroEngineering and Rehabilitation
15. doi:10.1186/s12984-018-0384-9
Lempereur, M., Rousseau, F., Rémy-Néris, O., Pons, C., Houx, L., Quellec, G., Brochard, S., 2019. A new
deep learning-based method for the detection of gait events in children with gait disorders: Proof-of-
concept and concurrent validity. Journal of Biomechanics 98. doi:10.1016/j.jbiomech.2019.109490
Leray, E., Moreau, T., Fromont, A., Edan, G., 2016. Epidemiology of Multiple Sclerosis. Revue neurologique
172, 3–13. doi:10.1016/j.ncl.2016.06.016
Levinger, P., Murley, G.S., Barton, C.J., Cotchett, M.P., Mcsweeney, S.R., Menz, H.B., 2010. A comparison
of foot kinematics in people with normal- and flat-arched feet using the Oxford Foot Model. Gait and
Posture 32, 519–523. doi:10.1016/j.gaitpost.2010.07.013
Li, Q., Young, M., Naing, V., Donelan, J.M., 2010. Walking speed estimation using a shank-mounted inertial
measurement unit. Journal of Biomechanics 43, 1640–1643. doi:10.1016/j.jbiomech.2010.01.031
Li, Y., Zhang, X., Gong, Y., Cheng, Y., Gao, X., Chen, X., 2017. Motor Function Evaluation of Hemiplegic
Upper-Extremities Using Data Fusion from Wearable Inertial and Surface EMG Sensors. Sensors 17.
doi:10.3390/s17030582
Liu, Y., Chen, Y., Shi, L., Tian, Z., Zhou, M., Li, L., 2015. Accelerometer based joint step detection and
adaptive step length estimation algorithm using handheld devices. Journal of Communications 10, 520–
525. doi:10.12720/jcm.10.7.520-525
Liu, Y.C., Yang, Y.R., Tsai, Y.A., Wang, R.Y., 2017. Cognitive and motor dual task gait training improve
dual task gait performance after stroke - A randomized controlled pilot trial. Scientific Reports 7, 1–8.
doi:10.1038/s41598-017-04165-y
Longworth, J.A., Chlosta, S., Foucher, K.C., 2018. Inter-joint coordination of kinematics and kinetics before
and after total hip arthroplasty compared to asymptomatic subjects. Journal of Biomechanics 72, 180–
186. doi:10.1016/j.jbiomech.2018.03.015
Lord, S., Galna, B., Verghese, J., Coleman, S., Burn, D., Rochester, L., 2013. Independent domains of gait in
older adults and associated motor and nonmotor attributes: Validation of a factor analysis approach.
Journals of Gerontology - Series A Biological Sciences and Medical Sciences 68, 820–827.
185
doi:10.1093/gerona/gls255
Lord, S., Howe, T., Greenland, J., Simpson, L., Rochester, L., 2011. Gait variability in older adults: A
structured review of testing protocol and clinimetric properties. Gait and Posture 34, 443–450.
doi:10.1016/j.gaitpost.2011.07.010
Lorentzen, J., Greve, L.Z., Kliim-Due, M., Rasmussen, B., Bilde, P.E., Nielsen, J.B., 2015. Twenty weeks of
home-based interactive training of children with cerebral palsy improves functional abilities. BMC
Neurology 15, 1–12. doi:10.1186/s12883-015-0334-0
Luinge, H.J., Veltink, P.H., 2005. Measuring orientation of human body segments using miniature gyroscopes
and accelerometers. Medical and Biological Engineering and Computing 43, 273–282.
doi:10.1007/BF02345966
Lundin-Olsson, L., Nyberg, L., Gustafson, Y., Himbert, D., Seknadji, P., Karila-cohen, D., 1997. “ Stops
walking when talking ” as a predictor of falls in elderly people, in: The Lancet. p. 617.
Maalen-Johansen, I.K., Bardal, E.M., Brændvik, S.M., Roeleveld, K., 2016. The use of activity monitors for
the estimation of energy expenditure during walking in children with cerebral palsy. Gait and Posture 49,
16. doi:10.1016/j.gaitpost.2016.07.083
Maanum, G., Jahnsen, R., Stanghelle, J.K., Sandvik, L., Larsen, K.L., Keller, A., 2012. Face and construct
validity of the Gait Deviation Index in adults with spastic cerebral palsy. Journal of Rehabilitation
Medicine 44, 272–275. doi:10.2340/16501977-0930
Maathuis, K.G.B., van der Schans, C.P., van Iperen, A., Rietman, H.S., Geertzen, J.H.B., 2005. Gait in children
with cerebral palsy. Observer Reliability of Physician Rating Scale and Edinburgh Visual Gait Analysis
Interval Testing Scale. journal pediatric orthopedic 25, 268–272. doi:10.5222/mmj.2015.114
Mackey, A.H., Stott, N.S., Walt, S.E., 2008. Reliability and validity of an activity monitor (IDEEA) in the
determination of temporal-spatial gait parameters in individuals with cerebral palsy. Gait and Posture 28,
634–639. doi:10.1016/j.gaitpost.2008.04.012
Maher, C. a., Williams, M.T., Olds, T.S., 2008. The six-minute walk test for children with cerebral palsy.
International Journal of Rehabilitation Research 31, 185–188. doi:10.1097/MRR.0b013e32830150f9
Maher, C., Kenyon, A., McEvoy, M., Sprod, J., 2013. The reliability and validity of a research-grade
pedometer for children and adolescents with cerebral palsy. Developmental Medicine and Child
Neurology 55, 827–833. doi:10.1111/dmcn.12181
Maher, C.A., Williams, M.T., Olds, T., Lane, A.E., 2010. An internet-based physical activity intervention for
adolescents with cerebral palsy: a randomized controlled trial. Developmental Medicine and Child
Neurology 52, 448–455. doi:10.1111/j.1469-8749.2009.03609.x
Majumder, S., Mondal, T., Deen, M.J., 2019. A Simple, Low-cost and Efficient Gait Analyzer for Wearable
Healthcare Applications. IEEE Sensors Journal 1. doi:10.1109/JSEN.2018.2885207
Maltais, D.B., Pierrynowski, M.R., Galea, V.A., Matsuzaka, A., Bar-Or, O., 2005. Habitual physical activity
levels are associated with biomechanical walking economy in children with cerebral palsy. American
Journal of Physical Medicine and Rehabilitation 84, 36–45. doi:10.1097/01.PHM.0000146502.25542.4E
Mandaleson, A., Lee, Y., Kerr, C., Kerr Graham, H., 2015. Classifying Cerebral Palsy: Are We Nearly There?
Journal of Pediatric Orthopaedics 35, 162–166.
Manicolo, O., Grob, A., Hagmann-von Arx, P., 2017. Gait in children with attention-deficit hyperactivity
disorder in a dual-task paradigm. Frontiers in Psychology 8, 1–8. doi:10.3389/fpsyg.2017.00034
Manikowska, F., Jozwiak, M., Idzior, M., Chen, P.-J.B., Tarnowski, D., 2013. The effect of a hippotherapy
session on spatiotemporal parameters of gait in children with cerebral palsy - pilot study. Ortopedia,
traumatologia, rehabilitacja 15, 253–257. doi:10.5604/15093492.1058420
Mann, K., Tsao, E., Bjornson, K.F., 2016. Physical activity and walking performance: Influence on quality of
life in ambulatory children with cerebral palsy (CP). Journal of Pediatric Rehabilitation Medicine 9, 279–
286. doi:10.3233/PRM-160395
Mannini, A., Genovese, V., Sabatini, A.M., 2014. Online decoding of hidden markov models for gait event
detection using foot-mounted gyroscopes. IEEE Journal of Biomedical and Health Informatics 18, 1122–
1130. doi:10.1109/JBHI.2013.2293887
Mannini, A., Sabatini, A.M., 2014. Walking speed estimation using foot-mounted inertial sensors: Comparing
machine learning and strap-down integration methods. Medical Engineering and Physics 36, 1312–1321.
doi:10.1016/j.medengphy.2014.07.022
Mansour, K. Ben, Rezzoug, N., Gorce, P., Ben Mansour, K., Rezzoug, N., Gorce, P., 2015. Analysis of several
methods and inertial sensors locations to assess gait parameters in able-bodied subjects. Gait and Posture
42, 409–414. doi:10.1016/j.gaitpost.2015.05.020
Maquet, D., Lekeu, F., Warzee, E., Gillain, S., Wojtasik, V., Salmon, E., Petermans, J., Croisier, J.L., 2010.
186
Gait analysis in elderly adult patients with mild cognitive impairment and patients with mild Alzheimer’s
disease: Simple versus dual task: A preliminary report. Clinical Physiology and Functional Imaging 30,
51–56. doi:10.1111/j.1475-097X.2009.00903.x
Marey, E.-J., 1868. Du mouvement dans les fonctions de la vie, Germer Bai. ed. Paris.
Mariani, B., Hoskovec, C., Rochat, S., Büla, C., Penders, J., Aminian, K., Bula, C., Penders, J., Aminian, K.,
Büla, C., Penders, J., Aminian, K., 2010. 3D gait assessment in young and elderly subjects using foot-
worn inertial sensors. Journal of Biomechanics 43, 2999–3006. doi:10.1016/j.jbiomech.2010.07.003
Mariani, B., Jiménez, M.C., Vingerhoets, F.J.G., Aminian, K., 2013a. On-shoe wearable sensors for gait and
turning assessment of patients with parkinson’s disease. IEEE Transactions on Biomedical Engineering
60, 155–158. doi:10.1109/TBME.2012.2227317
Mariani, B., Rouhani, H., Crevoisier, X., Aminian, K., 2013b. Quantitative estimation of foot-flat and stance
phase of gait using foot-worn inertial sensors. Gait and Posture 37, 229–234.
doi:10.1016/j.gaitpost.2012.07.012
Martin, J.P., Li, Q., 2017. Overground vs. treadmill walking on biomechanical energy harvesting: An
energetics and EMG study. Gait and Posture 52, 124–128. doi:10.1016/j.gaitpost.2016.11.027
Martinez-Hernandez, U., Dehghani-Sanij, A.A., 2018. Adaptive {Bayesian} inference system for recognition
of walking activities and prediction of gait events using wearable sensors. Neural Networks 102, 107–
119. doi:10.1016/j.neunet.2018.02.017
Mazaheri, M., Hoogkamer, · Wouter, Potocanac, Z., Verschueren, · Sabine, Roerdink, M., Peter, ·, Beek, J.,
Peper, · C E, Duysens, J., 2015. Effects of aging and dual tasking on step adjustments to perturbations in
visually cued walking. Experimental Brain Research 233, 3467–3474. doi:10.1007/s00221-015-4407-5
Mazzà, C., Donati, M., McCamley, J., Picerno, P., Cappozzo, A., 2012. An optimized Kalman filter for the
estimate of trunk orientation from inertial sensors data during treadmill walking. Gait and Posture 35,
138–142. doi:10.1016/j.gaitpost.2011.08.024
McArdle, R., Morrisa, R., Hickey, A.A., Del Din, S., Koychev, I., Gunn, R.N., Lawson, J., Zamboni, G., Ridha,
B., Sahakian, B.J., Rowe, J.B., Thomas, A., Zetterberg, H., MacKay, C., Lovestone, S., Rochester, L.,
Mc Ardle, R., Morris, R., Hickey, A.A., Del Din, S., Koychev, I., Gunn, R.N., Lawson, J., Zamboni, G.,
Ridha, B., Sahakian, B.J., Rowe, J.B., Thomas, A., Zetterberg, H., MacKay, C., Lovestone, S., Rochester,
L., Study, D.& F.P., 2018. Gait in mild Alzheimer’s disease: Feasibility of multi-center measurement in
the clinic and home with body-worn sensors: A pilot study. Journal of Alzheimer’s Disease 63, 1557.
doi:10.3233/JAD-189003
Mcdowell, B.C., Hewitt, V., Nurse, A., Weston, T., Baker, R., 2000. The variability of goniometric
measurements in ambulatory children with spastic cerebral palsy. Gait and Posture 12, 114–121.
McGinnis, R.S., Mahadevan, N., Moon, Y., Seagers, K., Sheth, N., Wright, J.A., DiCristofaro, S., Silva, I.,
Jortberg, E., Ceruolo, M., Pindado, J.A., Sosnoff, J., Ghaffari, R., Patel, S., 2017. A machine learning
approach for gait speed estimation using skin-mounted wearable sensors: From healthy controls to
individuals with multiple sclerosis. PLoS ONE 12, e0178366. doi:10.1371/journal.pone.0178366
Mcgrath, T., Fineman, R., Stirling, L., Mcgrath, T., Fineman, R., Stirling, L., 2018. An Auto-Calibrating Knee
Flexion-Extension Axis Estimator Using Principal Component Analysis with Inertial Sensors. Sensors
18, 1–17. doi:10.3390/s18061882
Mečņika, V., Hoerr, M., Krievins, I., Schwarz, A., 2014. Smart textiles for healthcare : applications and
technologies. Rural Environment, Education, Personality 150–161.
Menz, H.B., Lord, S.R., Fitzpatrick, R.C., 2003. Acceleration patterns of the head and pelvis when walking on
level and irregular surfaces. Gait and Posture 18, 35–46.
Merriaux, P., Dupuis, Y., Boutteau, R., Vasseur, P., Savatier, X., 2017. A study of vicon system positioning
performance. Sensors 17, 1–18. doi:10.3390/s17071591
Micó-Amigo, M.E., Kingma, I., Ainsworth, E., Walgaard, S., Niessen, M., Van Lummel, R.C., Van Dieën,
J.H., 2016. A novel accelerometry-based algorithm for the detection of step durations over short episodes
of gait in healthy elderly. Journal of NeuroEngineering and Rehabilitation 13, 1–12. doi:10.1186/s12984-
016-0145-6
Middleton, A.; Fritz, S. L.; Lusardi, M., 2015. Walking Speed: The Functional Vital Sign. Journal of Aging
and Physical Activity 23, 314–322. doi:10.1123/japa.2013-0236.Walking
Misu, S., Asai, T., Ono, R., Sawa, R., Tsutsumimoto, K., Ando, H., Doi, T., 2017. Development and validity
of methods for the estimation of temporal gait parameters from heel-attached inertial sensors in younger
and older adults. Gait and Posture 57, 295–298. doi:10.1016/j.gaitpost.2017.06.022
Misu, S., Doi, T., Asai, T., Sawa, R., Tsutsumimoto, K., Nakakubo, S., Yamada, M., Ono, R., 2014.
Association between toe flexor strength and spatiotemporal gait parameters in community-dwelling older

187
people. Journal of NeuroEngineering and Rehabilitation 11. doi:10.1186/1743-0003-11-143
Mitchell, L.E., Ziviani, J., Boyd, R.N., 2015a. Variability in measuring physical activity in children with
cerebral palsy. Medicine and Science in Sports and Exercise 47, 194–200.
doi:10.1249/MSS.0000000000000374
Mitchell, L.E., Ziviani, J., Boyd, R.N., 2015b. Characteristics associated with physical activity among
independently ambulant children and adolescents with unilateral cerebral palsy. Developmental Medicine
and Child Neurology 57, 167–174. doi:10.1111/dmcn.12560
Mitchell, L.E., Ziviani, J., Boyd, R.N., 2014. Test-retest reliability of the ActiGraph® accelerometer in
children and adolescents with congenital hemiplegia: How much more activity is needed? Developmental
Medicine and Child Neurology 56, 49–50. doi:10.1111/dmcn.12368
Miyazaki, S., 1997. Long-term unrestrained measurement of stride length and walking velocity utilizing a
piezoelectric gyroscope. IEEE Transactions on Biomedical Engineering 44, 753–759.
doi:10.1109/10.605434
Moe-Nilssen, R., 1998. A new method for evaluating motor control in gait under real-life environmental
conditions. Part 2: Gait analysis. Clinical Biomechanics 13, 328–335. doi:10.1016/S0268-
0033(98)00090-4
Moissenet, F., Armand, S., 2015. Qualitative and quantitative methods of assessing gait disorders. Orthopedic
Management of Children with Cerebral Palsy: A Comprehensive Approach 215–240.
Molenaers, G., Desloovere, K., Fabry, G., De Cock, P., 2006. The effects of quantitative gait assessment and
botulinum toxin A on musculoskeletal surgery in children with cerebral palsy. Journal of Bone and Joint
Surgery - Series A 88, 161–170. doi:10.2106/JBJS.C.01497
Molina, A., Guerrero, J., Gomez, I., Merino, M., 2017. A new multisensor software architecture for movement
detection: Preliminary study with people with cerebral palsy. International Journal of Human Computer
Studies 97, 45–57. doi:10.1016/j.ijhcs.2016.08.003
Montero-Odasso, M., Verghese, J., Beauchet, O., Hausdorff, J.M., 2012. Gait and Cognition: A
Complementary Approach to Understanding Brain Function and the Risk of Falling. Journal of the
American Geriatrics Society 60, 2127–2136. doi:10.1111/j.1532-5415.2012.04209.x
Moon, Y., McGinnis, R.S., Seagers, K., Motl, R.W., Sheth, N., Wright, J.A.J., Ghaffari, R., Sosnoff, J.J., 2017.
Monitoring gait in multiple sclerosis with novel wearable motion sensors. PLoS ONE 12, 1–19.
doi:10.1371/journal.pone.0171346
Moreau, N.G., Bodkin, A.W., Bjornson, K., Hobbs, A., Soileau, M., Lahasky, K., Moreau, N.G., Bodkin,
A.W., Bjornson, K., Hobbs, A., Soileau, M., Lahasky, K., 2016. Effectiveness of Rehabilitation
Interventions to Improve Gait Speed in Children With Cerebral Palsy: Systematic Review and Meta-
analysis. Physical therapy 96, 1938–1954. doi:10.2522/ptj.20150401
Morgan, C., Darrah, J., Gordon, A.M., Harbourne, R., Spittle, A., Johnson, R., Fetters, L., 2016. Effectiveness
of motor interventions in infants with cerebral palsy: a systematic review. Developmental Medicine and
Child Neurology 58, 900–909. doi:10.1111/dmcn.13105
Morris, R., Hickey, A.A., Del Din, S., Godfrey, A., Lord, S., Rochester, L., 2017. A model of free-living gait:
A factor analysis in Parkinson’s disease. Gait and Posture 52, 68–71. doi:10.1016/j.gaitpost.2016.11.024
Motoi, K., Taniguchi, S., Baek, M., Wakugawa, M., Sonoda, T., Yuji, T., Higashi, Y., Fujimoto, T., Ogawa,
M., Tanaka, S., Yamakoshi, K., 2012. Development of a Wearable Gait Monitoring System for
Evaluating Efficacy of Walking Training in Rehabilitation. Sensors and Materials 24, 359–373.
Moufawad el Achkar, C., Lenoble-Hoskovec, C., Paraschiv-Ionescu, A., Major, K., Büla, C., Aminian, K.,
2016. Instrumented shoes for activity classification in the elderly. Gait and Posture 44, 12–17.
doi:10.1016/j.gaitpost.2015.10.016
Moufawad El Achkar, C., Lenoble-Hoskovec, C., Paraschiv-Ionescu, A., Major, K., Büla, C., Aminian, K.,
2016. Physical behavior in older persons during daily life: Insights from instrumented shoes. Sensors 16,
1–18. doi:10.3390/s16081225
Muhammad, M.N., Salcic, Z., Wang, K.I.K., 2018. Indoor Pedestrian Tracking Using Consumer-Grade Inertial
Sensors with PZTD Heading Correction. IEEE Sensors Journal 18, 5164–5172.
doi:10.1109/JSEN.2018.2833118
Mukaka, M.M., 2012. Statistics corner: A guide to appropriate use of correlation coefficient in medical
research. Malawi Medical Journal 24, 69–71. doi:10.1016/j.cmpb.2016.01.020
Muñoz-Organero, M., Ruiz-Blázquez, R., Muñoz-Organero, M., Ruiz-Blázquez, R., 2017. Detecting Steps
Walking at very Low Speeds Combining Outlier Detection, Transition Matrices and Autoencoders from
Acceleration Patterns. Sensors 17, 2274. doi:10.3390/s17102274
Mutoh, T.T., Mutoh, T.T., Takada, M., Doumura, M., Ihara, M.M., Taki, Y., Tsubone, H., Ihara, M.M., 2016.

188
Application of a tri-axial accelerometry-based portable motion recorder for the quantitative assessment
of hippotherapy in children and adolescents with cerebral palsy. Journal of Physical Therapy Science 28,
2970–2974. doi:10.1589/jpts.28.2970
Mutoh, T.T., Mutoh, T.T., Tsubone, H., Takada, M., Doumura, M., Ihara, M.M., Shimomura, H., Taki, Y.,
Ihara, M.M., 2019. Effect of hippotherapy on gait symmetry in children with cerebral palsy: A pilot study.
Clinical and Experimental Pharmacology and Physiology 46, 506–509. doi:10.1111/1440-1681.13076
Mutoh, Tomoko, Mutoh, Tatsushi, Tsubone, H., Takada, M., Doumura, M., Ihara, Masayo, Shimomura, H.,
Taki, Y., Ihara, Masahiro, 2018. Impact of serial gait analyses on long-term outcome of hippotherapy in
children and adolescents with cerebral palsy. Complementary Therapies in Clinical Practice 30, 19–23.
doi:10.1016/j.ctcp.2017.11.003
Myers, K.A., Wang, M., Marks, R.M., Harris, G.F., 2004. Validation of a multi-segment foot and ankle
kinematic model for pediatric gait. Neural Systems and Rehabilitation Engineering 12, 122–130.
doi:10.1109/TNSRE.2003.822758
Nagai, K., Aoyama, T., Yamada, M., Izeki, M., Fujibayashi, S., Takemoto, M., Nishiguchi, S., Tsuboyama,
T., Neo, M., 2014. Quantification of changes in gait characteristics associated with intermittent
claudication in patients with lumbar spinal stenosis. Journal of Spinal Disorders and Techniques 27,
E136-42. doi:10.1097/BSD.0b013e3182a2656b
Najafi, B., Helbostad, J.L., Moe-Nilssen, R., Zijlstra, W., Aminian, K., 2009. Does walking strategy in older
people change as a function of walking distance? Gait and Posture 29, 261–266.
doi:10.1016/j.gaitpost.2008.09.002
Narres, M., Kvitkina, T., Claessen, H., Droste, S., Schuster, B., Morbach, S., Rümenapf, G., Van Acker, K.,
Icks, A., 2017. Incidence of lower extremity amputation in the diabetic compared to the non-diabetic
population: A systematic review protocol. PLoS ONE 12, 1–28.
Nascimento, L.R., Caetano, L.C.G., Freitas, D.C.M.A., Morais, T.M., Polese, J.C., Teixeira-Salmela, L.F.,
2012. Different instructions during the ten-meter walking test determined significant increases in
maximum gait speed in individuals with chronic hemiparesis. Brazilian Journal of Physical Therapy 16,
122–127. doi:10.1590/s1413-35552012005000008
National Collaborating Centre for Chronic Conditions, 2008. Osteoarthritis: National clinical guideline for
care and management in adults, Royal college of physicians. Royal College of Physicians, London.
Nelson-Wong, E., Callaghan, J.P., 2010. Is muscle co-activation a predisposing factor for low back pain
development during standing? A multifactorial approach for early identification of at-risk individuals.
Journal of Electromyography and Kinesiology 20, 256–263. doi:10.1016/j.jelekin.2009.04.009
Newman, C.J., Bruchez, R., Roches, S., Gygax, M.J., Duc, C., Dadashi, F., Masse, F., Aminian, K., Jequier
Gygax, M., Duc, C., Dadashi, F., Massé, F., Aminian, K., 2017. Measuring upper limb function in
children with hemiparesis with 3D inertial sensors. Childs Nervous System 33, 2159–2168.
doi:10.1007/s00381-017-3580-1
Nez, A., Fradet, L., Laguillaumie, P., Monnet, T., Lacouture, P., 2016. Comparison of calibration methods for
accelerometers used in human motion analysis. Medical Engineering and Physics 38, 1289–1299.
doi:10.1016/j.medengphy.2016.08.004
Nhat Hung, T., Soo Suh, Y., 2013. Inertial sensor-based two feet motion tracking for gait analysis. Sensors 13,
5614–5629. doi:10.3390/s130505614
Nicholson, K., Lennon, N., Church, C., Miller, F., 2018. Gait Analysis Parameters and Walking Activity Pre-
and Postoperatively in Children with Cerebral Palsy. Pediatric Physical Therapy 30, 203–207.
doi:10.1097/PEP.0000000000000512
Noonan, K.J., Halliday, S., Browne, R., O’Brien, S., Kayes, K., Feinberg, J., 2003. Interobserver variability of
gait analysis in patients with cerebral palsy. Journal of Pediatric Orthopaedics 23, 279–287.
Novak, I., 2014. Evidence-Based Diagnosis, Health Care, and Rehabilitation for Children With Cerebral Palsy.
Journal of Child Neurology 29, 1141–1156. doi:10.1177/0883073814535503
O’neil, M.E., Fragala-Pinkham, M., Forman, J., Lennon, N., George, A., Trost, S., 2013. Measuring physical
activity in youth with cerebral palsy who are ambulatory. Developmental Medicine and Child Neurology
55, 41. doi:10.1111/dmcn.12247
O’Neil, M.E., Fragala-Pinkham, M., Lennon, N., George, A., Forman, J., Trost, S.G., 2016. Reliability and
Validity of Objective Measures of Physical Activity in Youth With Cerebral Palsy Who Are Ambulatory.
Physical therapy 96, 37–45. doi:10.2522/ptj.20140201
O’Neil, M.E., Fragala-Pinkham, M.A., Forman, J.L., Trost, S.G., 2014. Measuring reliability and validity of
the ActiGraph GT3X accelerometer for children with cerebral palsy: A feasibility study. Journal of
Pediatric Rehabilitation Medicine 7, 233–240. doi:10.3233/PRM-140292
189
O’Shea, M., 2008. Cerebral palsy. Seminars in Perinatology 35–41. doi:10.1016/S0140-6736(13)61835-8
Oberhauser, C., Cieza, A., Bostan, C., Stucki, G., Bickenbach, J., 2014. Which environmental factors are
associated with performance when controlling for capacity? Journal of Rehabilitation Medicine 46, 806–
813. doi:10.2340/16501977-1839
Olivier, I., Baker, C., Cordier, J., Thomann, G., Nougier, V., 2015. Cognitive and motor aspects of a
coincidence-timing task in Cerebral Palsy children. Neuroscience Letters 602, 33–37.
doi:10.1016/j.neulet.2015.06.043
Olivier, I., Cuisinier, R., Vaugoyeau, M., Nougier, V., Assaiante, C., My Cuisinier, R., Vaugoyeau, M.,
Nougier, V., Assaiante, C., 2010. Age-related differences in cognitive and postural dual-task
performance. Gait and Posture 32, 494–499. doi:10.1016/j.gaitpost.2010.07.008
Omura, J., Fuentes, M., Bjornson, K., 2018. Participation in Daily Life: Influence on Quality of Life in
Ambulatory Children with Cerebral Palsy. PM&R. doi:10.1016/j.pmrj.2018.05.010
Öner, M., Deveci Kocakoç, İ., 2017. JMASM 49: A Compilation of Some Popular Goodness of Fit Tests for
Normal Distribution: Their Algorithms and MATLAB Codes (MATLAB). Journal of Modern Applied
Statistical Methods 16, 547–575. doi:10.22237/jmasm/1509496200
Orendurff, M.S., Schoen, J.A., Bernatz, G.C., Segal, A.D., Klute, G.K., 2008. How humans walk: Bout
duration, steps per bout, and rest duration. The Journal of Rehabilitation Research and Development 45,
1077–1090. doi:10.1682/JRRD.2007.11.0197
Oudre, L., Barrois-Müller, R., Moreau, T., Truong, C., Vienne-Jumeau, A., Ricard, D., Vayatis, N., Vidal,
P.P., 2018. Template-based step detection with inertial measurement units. Sensors 18, 1–17.
doi:10.3390/s18114033
Pacini Panebianco, G., Bisi, M.C., Stagni, R., Fantozzi, S., 2018. Analysis of the performance of 17 algorithms
from a systematic review: Influence of sensor position, analysed variable and computational approach in
gait timing estimation from IMU measurements. Gait and Posture 66, 76–82.
doi:10.1016/j.gaitpost.2018.08.025
Palisano, R., Rosenbaum, P., Walter, S., Russell, D., Wood, E., Galuppi, B., 1997. Development and reliability
of a system to classify gross motor function in children with cerebral palsy. Developmental Medicine and
Child Neurology 39, 214–223. doi:10.1111/j.1469-8749.1997.tb07414.x
Palisano, R.J., 2012. Physical activity of children with cerebral palsy: What are the considerations?
Developmental Medicine and Child Neurology 54, 390–391. doi:10.1111/j.1469-8749.2012.04270.x
Pallant, J., 2013. SPSS Survival Manual: A Step by Step Guide to Data Analysis Using SPSS. 5th Edition,
McGraw Hil. ed. New York.
Palluel, E., Chauvel, G., Bourg, V., Commare, M., Prado, C., Farigoule, V., Nougier, V., Olivier, I., 2019.
Effects of dual tasking on postural and gait performances in children with cerebral palsy and healthy
children. International Journal of Developmental Neuroscience 79, 54–64.
doi:10.1016/j.ijdevneu.2019.10.008
Papageorgiou, E., Nieuwenhuys, A., Vandekerckhove, I., Van Campenhout, A., Ortibus, E., Desloovere, K.,
2019. Systematic review on gait classifications in children with cerebral palsy: An update. Gait and
Posture 69, 209–223. doi:10.1016/j.gaitpost.2019.01.038
Papavasiliou, A.S., 2009. Management of motor problems in cerebral palsy: A critical update for the clinician.
European Journal of Paediatric Neurology 13, 387–396. doi:10.1016/j.ejpn.2008.07.009
Paraschiv-Ionescu, A., Buchser, E.E.E., Rutschmann, B., Najafi, B., Aminian, K., 2004. Ambulatory system
for the quantitative and qualitative analysis of gait and posture in chronic pain patients treated with spinal
cord stimulation. Gait and Posture 20, 113–125. doi:10.1016/j.gaitpost.2003.07.005
Paraschiv-Ionescu, A, Newman, C., Carcreff, L., Gerber, C.N., Armand, S., Aminian, K., 2019. Locomotion
and cadence detection using a single trunk-fixed accelerometer: validity for children with cerebral palsy
in daily life-like conditions. Journal of NeuroEngineering and Rehabilitation 16, 24. doi:10.1186/s12984-
019-0494-z
Paraschiv-Ionescu, Anisoara, Newman, C., Carcreff, L., Gerber, C.N., Armand, S., Aminian, K., 2019.
Locomotion and cadence detection using a single trunk-fixed accelerometer: validity for children with
cerebral palsy in daily life-like conditions. Journal of NeuroEngineering and Rehabilitation 16, 16–24.
doi:10.1186/s12984-019-0494-z
Paraschiv-Ionescu, A., Perruchoud, C., Buchser, E., Aminian, K., 2012. Barcoding human physical activity to
assess chronic pain conditions. PLoS ONE 7, 1–12. doi:10.1371/journal.pone.0032239
Parent, R., Johnson, K., Chang, J., Fu, X., Varadarajan, S., 1999. Modeling Human Motion from Video for
Use in Gait Analysis. Proceedings of the AMIA Symposium 1134, 8280.
Parvataneni, K., Ploeg, L., Olney, S.J., Brouwer, B., 2009. Kinematic, kinetic and metabolic parameters of
190
treadmill versus overground walking in healthy older adults. Clinical Biomechanics 24, 95–100.
doi:10.1016/j.clinbiomech.2008.07.002
Passmore, E., Sangeux, M., 2016. Defining the medial-lateral axis of an anatomical femur coordinate system
using freehand 3D ultrasound imaging. Gait and Posture 45, 211–216.
doi:10.1016/j.gaitpost.2016.02.006
Patel, S., Park, H., Bonato, P., Chan, L., Rodgers, M., 2012. A review of wearable sensors and systems with
application in rehabilitation. Journal of NeuroEngineering and Rehabilitation 9, 21. doi:10.1186/1743-
0003-9-21
Patterson, M., Caulfield, B., 2011. Using a shoe mounted tri-axial accelerometer to detect kinematic changes
during stiff ankle walking. Proceedings of the Annual International Conference of the IEEE Engineering
in Medicine and Biology Society, EMBS 2011, 3492–3495. doi:10.1109/IEMBS.2011.6090943
Peake, J.M., Kerr, G., Sullivan, J.P., 2018. A critical review of consumer wearables, mobile applications, and
equipment for providing biofeedback, monitoring stress, and sleep in physically active populations.
Frontiers in Physiology 9, 1–19. doi:10.3389/fphys.2018.00743
Pepa, L., Verdini, F., Spalazzi, L., 2017. Gait parameter and event estimation using smartphones. Gait and
Posture 57, 217–223. doi:10.1016/j.gaitpost.2017.06.011
Perrin, O., Terrier, P., Ladetto, Q., Merminod, B., Schutz, Y., 2000. Improvement of walking speed prediction
by accelerometry and altimetry, validated by satellite positioning. Medical and Biological Engineering
and Computing 38, 164–168. doi:10.1007/BF02344771
Perry, J., Burnfield, J.M., 2010. Gait analysis - Normal and pathological function, Slack Inco. ed.
Petraglia, F., Scarcella, L., Pedrazzi, G., Brancato, L., Puers, R., Costantino, C., 2019. Inertial sensors versus
standard systems in gait analysis: A systematic review and meta-analysis. European Journal of Physical
and Rehabilitation Medicine 55, 265–280. doi:10.23736/S1973-9087.18.05306-6
Pfister, A., West, A.M., Bronner, S., Noah, J.A., 2014. Comparative abilities of Microsoft Kinect and Vicon
3D motion capture for gait analysis. Journal of medical engineering & technology 38, 274–280.
doi:10.3109/03091902.2014.909540
Pham, M.H., Elshehabi, M., Haertner, L., Del Din, S., Srulijes, K., Heger, T., Synofzik, M., Hobert, M.A.,
Faber, G.S., Hansen, C., Salkovic, D., Ferreira, J.J., Berg, D., Sanchez-Ferro, A., van Dieen, J.H., Becker,
C., Rochester, L., Schmidt, G., Maetzler, W., Sanchez-Ferro, álvaro, van Dieën, J.H., Becker, C.,
Rochester, L., Schmidt, G., Maetzler, W., 2017. Validation of a step detection algorithm during straight
walking and turning in Patients with Parkinson’s disease and older adults using an inertial measurement
unit at the lower back. Frontiers in Neurology 8, 457. doi:10.3389/fneur.2017.00457
Picerno, P., 2017. 25 years of lower limb joint kinematics by using inertial and magnetic sensors: A review of
methodological approaches. Gait and Posture 51, 239–246. doi:10.1016/j.gaitpost.2016.11.008
Piitulainen, H., Rantalainen, T., Kulmala, J.P., MäenpääH., 2018. P 042 - Gait complexity quantified using
inertial measurement units in children with cerebral palsy. Gait and Posture 65, 305–306.
doi:10.1016/j.gaitpost.2018.06.197
Pilloni, G., Pau, M., Costici, F., Condoluci, C., Galli, M., 2019. Use of 3D gait analysis as predictor of Achilles
tendon lengthening surgery outcomes in children with cerebral palsy. European Journal of Physical and
Rehabilitation Medicine 55, 250–257. doi:10.23736/S1973-9087.18.05326-1
Pimentel, R., Sauer, C., Carollo, J., 2017. Validation of gait cycle timing using wearable sensors in individuals
with cerebral palsy. Archives of Physical Medicine and Rehabilitation 98, e129–e130.
doi:10.1016/j.apmr.2017.08.421
Pirker, W., Katzenschlager, R., 2017. Gait disorders in adults and the elderly: A clinical guide. Wiener
Klinische Wochenschrift 129, 81–95. doi:10.1007/s00508-016-1096-4
Plotnik, M., Giladi, N., Hausdorff, J.M., 2007. A new measure for quantifying the bilateral coordination of
human gait: Effects of aging and Parkinson’s disease. Experimental Brain Research 181, 561–570.
doi:10.1007/s00221-007-0955-7
Pontén, E., 2013. Botulinum toxin injections in lower extremities increase physical activity in upper
extremities in children with cerebral palsy. Developmental Medicine and Child Neurology 55, 10.
doi:10.1111/dmcn.12247
Pothrat, C., Authier, G., Viehweger, E., Berton, E., Rao, G., 2015. One- and multi-segment foot models lead
to opposite results on ankle joint kinematics during gait: Implications for clinical assessment. Clinical
Biomechanics 30, 493–499. doi:10.1016/j.clinbiomech.2015.03.004
Prajapati, S K, Gage, W.H., Brooks, D., Black, S.E., McIlroy, W.E., 2011. A novel approach to ambulatory
monitoring: Investigation into the quantity and control of everyday walking in patients with subacute
stroke. Neurorehabilitation and Neural Repair 25, 6–14. doi:10.1177/1545968310374189

191
Prajapati, Sanjay K., Gage, W.H., Brooks, D., Black, S.E., McIlroy, W.E., Black, S.E., Prajapati, S.K., Brooks,
D., 2011. A Novel Approach to Ambulatory Monitoring. Neurorehabilitation and Neural Repair 25, 6–
14. doi:10.1177/1545968310374189
Punt, M., van Alphen, B., van de Port, I.G., van Dieen, J.H., Michael, K., Outermans, J., Wittink, H., 2014.
Clinimetric properties of a novel feedback device for assessing gait parameters in stroke survivors.
Journal of NeuroEngineering and Rehabilitation 11, 30. doi:10.1186/1743-0003-11-30
Qiu, S., Wang, Z., Zhao, H., Hu, H., 2016. Using Distributed Wearable Sensors to Measure and Evaluate
Human Lower Limb Motions. IEEE Transactions on Instrumentation and Measurement 65, 939–950.
doi:10.1109/TIM.2015.2504078
Rabani, A.S., Harries, N., Namoora, I., Al-Jarrah, M.D., Karniel, A., Bar-haim, S., Harries, N., Namoora, I.,
Al-Jarrah, M.D., Bar-haim, S., Shkedy Rabani, A., Harries, N., Namoora, I., Al-Jarrah, M.D., Karniel,
A., Bar-haim, S., 2014. Duration and patterns of habitual physical activity in adolescents and young
adults with cerebral palsy. Developmental Medicine and Child Neurology 56, 673–680.
doi:10.1111/dmcn.12394
Rampp, A., Barth, J., Schülein, S., Gaßmann, K., Klucken, J., Eskofier, B.M., 2015. Inertial Sensor-Based
Stride Parameter Calculation From Gait Sequences in Geriatric Patients. IEEE Transactions on
Biomedical Engineering 62, 1089–1097. doi:10.1109/TBME.2014.2368211
Razak, A.H.A., Aruwa, M.M.M., Johnny, L.A., Al Junid, S.A.M., Idros, M.F.M., Halim, A.K., Tahir, N.M.,
2018. Real Time Mobile and Wireless Integration of Inertial Measurement Unit for Stride Length and
Angular Rate of Gait Evaluation. National Academy of Managerial Staff of Culture and Arts Herald 661–
667.
Rebula, J.R., Ojeda, L. V., Adamczyk, P.G., Kuo, A.D., 2013. Measurement of foot placement and its
variability with inertial sensors. Gait and Posture 38, 974–980. doi:10.1016/j.gaitpost.2013.05.012
Reid, B., Willoughby, K., Harvey, A., Graham, K., 2015. GMFCS E & R: Descriptors and illustrations.
Reilly, D.S., Woollacott, M.H., van Donkelaar, P., Saavedra, S., 2008. The Interaction Between Executive
Attention and Postural Control in Dual-Task Conditions: Children With Cerebral Palsy. Archives of
Physical Medicine and Rehabilitation 89, 834–842. doi:10.1016/j.apmr.2007.10.023
Riad, J., Finnbogason, T., Broström, E., 2010. Leg Length Discrepancy in Spastic Hemiplegic Cerebral Palsy:
A Magnetic Resonance Imaging Study. journal pediatric orthopedic 30, 846–850.
Robert, L., Waters, R.L., Mulroy, S., 1999. The energy expenditure of normal and pathologic gait. Gait and
Posture 9, 207–231.
Rochat, S., Büla, C.J., Martin, E., Seematter-Bagnoud, L., Karmaniola, A., Aminian, K., Piot-Ziegler, C.,
Santos-Eggimann, B., 2010. What is the Relationship Between Fear of Falling and Gait in Well-
Functioning Older Persons Aged 65 to 70 Years? Archives of Physical Medicine and Rehabilitation 91,
879–884. doi:10.1016/j.apmr.2010.03.005
Rodda, J., Graham, H.K., 2001. Classification of gait patterns in spastic hemiplegia and spastic diplegia:a basis
for a management algorithm. European Journal of Neurology 8, 98–108. doi:10.1046/j.1468-
1331.2001.00042.x
Rodda, J.M., Graham, H.K., Carson, L., Galea, M.P., Wolfe, R., Graham, H.K.E., 2004. Sagittal gait patterns
in spastic diplegia. The Journal of Bone and Joint Surgery 86, 251–259. doi:10.1302/0301-620X.86B2
Romkes, J., Brunner, R., 2007. An electromyographic analysis of obligatory (hemiplegic cerebral palsy) and
voluntary (normal) unilateral toe-walking. Gait and Posture 26, 577–586.
Rosenbaum, P., Paneth, N., Leviton, A., Goldstein, M., Damiano, D., Dan, B., Jacobsson, B., 2006. A report:
the definition and classification of cerebral palsy April 2006. Developmental Medicine and Child
Neurology 49, 8–14. doi:10.1111/j.1469-8749.2007.tb12610.x
Rosenbaum, P.L., Dan, B., 2019. The Continuing Evolution of “Cerebral Palsy.” Annals of Physical and
Rehabilitation Medicine 94–95. doi:10.1016/j.rehab.2019.09.008
Rota, V., Perucca, L., Simone, A., Tesio, L., 2011. Walk ratio (step length/cadence) as a summary index of
neuromotor control of gait. International Journal of Rehabilitation Research 34, 265–269.
doi:10.1097/MRR.0b013e328347be02
Rowlands, A. V., Pilgrim, E.L., Eston, R.G., 2008. Patterns of habitual activity across weekdays and weekend
days in 9-11-year-old children. Preventive Medicine 46, 317–324. doi:10.1016/j.ypmed.2007.11.004
Rozin Kleiner, A.F., Belgamo, A., Souza Pagnussat, A., de Athayde Costa e Silva, A., Sforza, C., Cicuto
Ferreira Rocha, N.A., 2019. Wearable sensors, cerebral palsy and gait assessment in everyday
environments: is it a reality? - A systematic review. Functional Neurology 34, 85–91.
Rozumalski, A., Novacheck, T.F., Griffith, C.J., Walt, K., Schwartz, M.H., 2015. Treadmill vs. overground
running gait during childhood: A qualitative and quantitative analysis. Gait and Posture 41, 613–618.
192
doi:10.1016/j.gaitpost.2015.01.006
Rueterbories, J., Spaich, E.G., Andersen, O.K., 2013. Characterization of gait pattern by 3D angular
accelerations in hemiparetic and healthy gait. Gait and Posture 37, 183–189.
doi:10.1016/j.gaitpost.2012.06.029
Ryan, J., Mcgahey, A., Mcloughlin, B., Walsh, M., Gormley, J., 2013a. Validity of the RT3 accelerometer at
measuring physical activity intensity in adults and children with cerebral palsy. Developmental Medicine
and Child Neurology 55, 17. doi:10.1111/dmcn.12247
Ryan, J., Mcgahey, A., Mcloughlin, B., Walsh, M., Gormley, J., 2013b. An investigation into the ability of
three accelerometry-based devices to detect the increased energy cost of locomotion in ambulatory adults
and children with cerebral palsy. Developmental Medicine and Child Neurology 55, 17–18.
doi:10.1111/dmcn.12247
Ryan, J.M., Hensey, O., McLoughlin, B., Lyons, A., Gormley, J., 2015. Associations of Sedentary Behaviour,
Physical Activity, Blood Pressure and Anthropometric Measures with Cardiorespiratory Fitness in
Children with Cerebral Palsy. PLOS ONE 10. doi:10.1371/journal.pone.0123267
Ryan, J.M., O’Donovan, C., Hussey, J., Gormley, J., 2014. Ambulant children with cerebral palsy participate
in reduced levels of vigorous physical activity compared to their peers with typical development.
Developmental Medicine and Child Neurology 56, 66. doi:10.1111/dmcn.12540
Ryan, Jennifer M, Walsh, M., Gormley, J., 2014. A comparison of three accelerometry-based devices for
estimating energy expenditure in adults and children with cerebral palsy. Journal of NeuroEngineering
and Rehabilitation 11. doi:10.1186/1743-0003-11-116
Sabatini, A.M., Martelloni, C., Scapellato, S., Cavallo, F., 2005. Assessment of walking features from foot
inertial sensing. IEEE Transactions on Biomedical Engineering 52, 486–494.
doi:10.1109/TBME.2004.840727
Sabharwal, S., Kumar, A., 2008. Methods for assessing leg length discrepancy. Clinical Orthopaedics and
Related Research 466, 2910–2922. doi:10.1007/s11999-008-0524-9
Saether, R., Helbostad, J., Adde, L., Braendvik, S., Lydersen, S., Vik, T., 2014. Gait characteristics in children
and adolescents with cerebral palsy assessed with a trunk-worn accelerometer. Research in
Developmental Disabilities 35, 1773–1781. doi:10.1016/j.ridd.2014.02.011
Saether, R., Helbostad, J.L., Adde, L., Braendvik, S., Lydersen, S., Vik, T., 2015. The relationship between
trunk control in sitting and during gait in children and adolescents with cerebral palsy. Developmental
Medicine and Child Neurology 57, 344–350. doi:10.1111/dmcn.12628
Salarian, A., Burkhard, P.R., Vingerhoets, F.J.G., Jolles, B.M., Aminian, K., 2013. A novel approach to
reducing number of sensing units for wearable gait analysis systems. IEEE Transactions on Biomedical
Engineering 60, 72–77. doi:10.1109/TBME.2012.2223465
Salarian, A., Russmann, H., Vingerhoets, F.J.G., Dehollain, C., Blanc, Y., Burkhard, P.R., Aminian, K., 2004.
Gait assessment in Parkinson’s disease: Toward an ambulatory system for long-term monitoring. IEEE
Transactions on Biomedical Engineering 51, 1434–1443. doi:10.1109/TBME.2004.827933
Sangeux, M., 2015. On the implementation of predictive methods to locate the hip joint centres. Gait and
Posture 42, 402–405. doi:10.1016/j.gaitpost.2015.07.004
Sangeux, M., Passmore, E., Graham, H.K., Tirosh, O., 2016. The gait standard deviation, a single measure of
kinematic variability. Gait and Posture 46, 194–200. doi:10.1016/j.gaitpost.2016.03.015
Sangeux, M., Pillet, H., Skalli, W., 2014. Which method of hip joint centre localisation should be used in gait
analysis? Gait and Posture 40, 20–25. doi:10.1016/j.gaitpost.2014.01.024
Schaefer, S., 2014. The ecological approach to cognitive-motor dual-tasking: findings on the effects of
expertise and age. Frontiers in psychology 5, 1167. doi:10.3389/fpsyg.2014.01167
Schiariti, V., 2014. Comprehensive ICF core set for children & youth with cerebral palsy from birth to 18 years
of age. Developmental Medicine and Child Neurology 1–10.
Schiariti, V., Klassen, A.F., Cieza, A., Sauve, K., O’Donnell, M., Armstrong, R., Mâsse, L.C., 2014a.
Comparing contents of outcome measures in cerebral palsy using the international classification of
functioning (ICF-CY): A systematic review. European Journal of Paediatric Neurology 18, 1–12.
doi:10.1016/j.ejpn.2013.08.001
Schiariti, V., Sauve, K., Klassen, A.F., O’Donnell, M., Cieza, A., Mâsse, L.C., 2014b. “He does not see himself
as being different”: The perspectives of children and caregivers on relevant areas of functioning in
cerebral palsy. Developmental Medicine and Child Neurology 56, 853–861. doi:10.1111/dmcn.12472
Schimpl, M., Lederer, C., Daumer, M., 2011. Development and validation of a new method to measure walking
speed in free-living environments using the actibelt® platform. PLoS ONE 6, e23080.
doi:10.1371/journal.pone.0023080
193
Schulleri, K.H., Burfeind, F., Hoss-Zenker, B., Feketene Szabo, E., Herzig, N., Ledebt, A., Johannsen, L.,
2017. Deliberately Light Interpersonal Contact Affects the Control of Head Stability During Walking in
Children and Adolescents With Cerebral Palsy. Archives of physical medicine and rehabilitation 98,
1828–1835. doi:10.1016/j.apmr.2017.01.026
Schutte, L.M., Narayanan, U., Stout, J.L., Selber, P., Gage, J.R., Schwartz, M.H., 2000. An index for
quantifying deviations from normal gait. Gait and Posture 11, 25–31. doi:10.1016/S0966-
6362(99)00047-8
Schutz, Y., Weinsier, S., Terrier, P., Durrer, D., 2002. A new accelerometric method to assess the daily walking
practice. International Journal of Obesity 26, 111–118. doi:10.1038/sj/ijo/0801856
Schwartz, M.H., Munger, M.E., 2018. ESMAC BEST PAPER 2017: Using machine learning to overcome
challenges in GMFCS level assignment. Gait and Posture 63, 290–295.
doi:10.1016/j.gaitpost.2018.04.017
Schwartz, M.H., Rozumalski, A., 2008. The Gait Deviation Index: a new comprehensive index of gait
pathology. Gait and Posture 28, 351–357. doi:10.1016/j.gaitpost.2008.05.001
Schweizer, K., Cattin, P.C., Brunner, R., Muller, B., Huber, C., Romkes, J., Müller, B., Huber, C., Romkes, J.,
2012. Automatic selection of a representative trial from multiple measurements using Principle
Component Analysis. Journal of Biomechanics 45, 2306–2309. doi:10.1016/j.jbiomech.2012.06.012
Scott, S.H., Winter, D., 1993. Biomechanical model of the human foot: kinematics and kinetics during the
stance phase of walking. Journal of Biomechanics 26, 1091–1104.
Seematter-Bagnoud, L., Santos-Eggimann, B., Rochat, S., Martin, E., Karmaniola, A., Aminian, K., Piot-
Ziegler, C., Büla, C.J., 2011. Vulnerability in high-functioning persons aged 65 to 70 years: the
importance of the fear factor. Aging Clinical and Experimental Research 22, 485–486.
doi:10.3275/6705.Aging
Sejdic, E., Lowry, K.A., Bellanca, J., Perera, S., Redfern, M.S., Brach, J.S., Sejdić, E., Lowry, K.A., Bellanca,
J., Perera, S., Redfern, M.S., Brach, J.S., 2016. Extraction of Stride Events From Gait Accelerometry
During Treadmill Walking. IEEE Journal of Translational Engineering in Health and Medicine 4, 1–11.
doi:10.1109/JTEHM.2015.2504961
Sekiya, N., Nagasaki, H., 1998. Reproducibility of the walking patterns of normal young adults: test-retest
reliability of the walk ratio(step-length/step-rate). Gait and Posture 7, 225–227. doi:10.1016/S0966-
6362(98)00009-5
Sekiya, N., Nagasaki, H., Ito, H., Furuna, T., 1996. The invariant relationship between step length and step
rate during free walking. Journal of Human Movement Studies 30, 241–257.
Selles, R.W., Formanoy, M.A.G., Bussmann, J.B.J., Janssens, P.J., Stam, H.J., 2005. Automated estimation of
initial and terminal contact timing using accelerometers; development and validation in transtibial
amputees and controls. IEEE Transactions on Neural Systems and Rehabilitation Engineering 13, 81–88.
doi:10.1109/TNSRE.2004.843176
Sellier, E., Platt, M.J., Andersen, G.L., Krägeloh-Mann, I., De La Cruz, J., Cans, C., Cans, C., Van Bakel, M.,
Arnaud, C., Delobel, M., Chalmers, J., McManus, V., Lyons, A., Parkes, J., Dolk, H., Himmelmann, K.,
Pahlman, M., Dowding, V., Colver, A., Pennington, L., Horridge, K., Kurinczuk, J., Surman, G., Platt,
M.J., Udall, P., Rackauskaite, G., Torrioli, M.G., Marcelli, M., Andersen, G.L., Julsen Hollung, S.,
Bottos, M., Gaffney, G., De La Cruz, J., Pallas, C., Neubauer, D., Jekovec-Vrhovšek, M., Virella, D.,
Andrada, M., Greitane, A., Hollody, K., Sigurdardottir, S., Einarsson, I., Honold, M., Rostasy, K.,
Mejaski-Bosnjak, V., 2016. Decreasing prevalence in cerebral palsy: A multi-site European population-
based study, 1980 to 2003. Developmental Medicine and Child Neurology 58, 85–92.
doi:10.1111/dmcn.12865
Senanayake, C.M., Senanayake, S.M.N.A., 2010. Computational Intelligent Gait-Phase Detection System to
Identify Pathological Gait. IEEE transactions on information technology in biomedicine : a publication
of the IEEE Engineering in Medicine and Biology Society 14, 1173–1179.
doi:10.1109/TITB.2010.2058813
Sessa, S., Zecca, M., Bartolomeo, L., Takashima, T., Fujimoto, H., Takanishi, A., 2015. Reliability of the step
phase detection using inertial measurement units: pilot study. Healthcare technology letters 2, 58–63.
doi:10.1049/htl.2014.0103
Sharp, I., Yu, K., 2014. Sensor-based dead-reckoning for indoor positioning. Physical Communication 13, 4–
16. doi:10.1016/j.phycom.2013.11.013
Shieh, W.Y., Cho, H.H., 2013. Smart belt-using dual-accelerometers for gait analysis. Journal of Medical
Imaging and Health Informatics 3, 65–71. doi:10.1166/jmihi.2013.1144
Shin, G., Jarrahi, M.H., Fei, Y., Karami, A., Gafinowitz, N., Byun, A., Lu, X., 2019. Wearable activity trackers,
194
accuracy, adoption, acceptance and health impact: A systematic literature review. Journal of Biomedical
Informatics 93. doi:10.1016/j.jbi.2019.103153
Simon, S.R., 2004. Quantification of human motion: gait analysis-benefits and limitations to its application to
clinical problems. Journal of Biomechanics 37, 1869–1880. doi:10.1016/j.jbiomech.2004.02.047
Simon, S.R., Deutsch, S.D., Nuzzo, R.M., Mansour, M.J., Jackson, J.L., Koskinen, M., Rosenthal, R.K., 1978.
Genu Recurvatum in Spastic Cerebral Palsy. The Journal of Bone and Joint Surgery 60-A, 882–894.
Sivarajah, L., Kane, K.J., Lanovaz, J., Bisaro, D., Oates, A., Ye, M., Musselman, K.E., 2018. The Feasibility
and Validity of Body-Worn Sensors to Supplement Timed Walking Tests for Children with Neurological
Conditions. Physical and Occupational Therapy in Pediatrics 38, 280–290.
doi:10.1080/01942638.2017.1357066
Skaggs, D.L., Rethlefsen, S.A., Kay, R.M., Dennis, S.W., Reynolds, R.A., Tolo, V.T., 2000. Variability in
Gait Analysis Interpretation. Journal of Pediatric Orthopaedics: 20, 759–764.
Slaght, J., Senechal, M., Bouchard, D.R., 2017. Impact of Walking Cadence Prescription to Reach the Global
Physical Activity Recommendations in Older Adults. Journal of Aging and Physical Activity 25, 604–
611. doi:10.1123/japa.2016-0079
Smith, W.D., Bagley, A., 2010. A miniature, wearable activity/fall monitor to assess the efficacy of mobility
therapy for children with cerebral palsy during everyday living. Conference proceedings : ... Annual
International Conference of the IEEE Engineering in Medicine and Biology Society. IEEE Engineering
in Medicine and Biology Society. Annual Conference 2010, 5030–5033.
doi:10.1109/IEMBS.2010.5627079
Smits, D.-W., Gorter, J.W., Van Schie, P.E., Dallmeijer, A.J., Ketelaar, M., 2014. How Do Changes in Motor
Capacity, Motor Capability, and Motor Performance Relate in Children and Adolescents With Cerebral
Palsy? Archives of Physical Medicine and Rehabilitation 95, 1577–1584.
doi:10.1016/j.apmr.2014.04.013
Soaz, C., Diepold, K., 2016. Step Detection and Parameterization for Gait Assessment Using a Single Waist-
Worn Accelerometer. IEEE Transactions on Biomedical Engineering 63, 933–942.
doi:10.1109/TBME.2015.2480296
Soltani, A., Dejnabadi, H., Savary, M., Aminian, K., 2019. Real-world gait speed estimation using wrist sensor:
A personalized approach. IEEE Journal of Biomedical and Health Informatics 2194, 1–1.
doi:10.1109/jbhi.2019.2914940
Song, M., Kim, J., 2018. An Ambulatory Gait Monitoring System with Activity Classification and Gait
Parameter Calculation Based on a Single Foot Inertial Sensor. IEEE Transactions on Biomedical
Engineering 65, 885–893. doi:10.1109/TBME.2017.2724543
Speers, R.A., Ashton-Miller, J.A., Schultz, A.B., Alexander, N.B., 1998. Age differences in abilities to perform
tandem stand and walk tasks of graded difficulty. Gait and Posture 7, 207–213. doi:10.1016/S0966-
6362(98)00006-X
Sposaro, F., Tyson, G., 2009. iFall: An android application for fall monitoring and response. Proceedings of
the 31st Annual International Conference of the IEEE Engineering in Medicine and Biology Society:
Engineering the Future of Biomedicine, EMBC 2009 6119–6122. doi:10.1109/IEMBS.2009.5334912
Stanhope, S.J., Kepple, T.M., McGuire, D.A., Roman, N.L., 1990. Kinematic-based technique for event time
determination during gait. Medical and Biological Engineering and Computing 28, 355–360.
Stanton, R., Guertler, D., Duncan, M.J., Vandelanotte, C., 2014. Validation of a pouch-mounted activPAL3
accelerometer. Gait and Posture 40, 688–693. doi:10.1016/j.gaitpost.2014.07.024
Steinwender, G., Saraph, V., Scheiber, S., Zwick, E.B., Uitz, C., Hackl, K., 2000. Intrasubject repeatability of
gait analysis data in normal and spastic children. Clinical Biomechanics 15, 134–139.
doi:10.1016/S0268-0033(99)00057-1
Stevens, W.R.J., Tulchin-Francis, K., Stevens Jr., W.R., Tulchin-Francis, K., 2017. Interval setting selection
affects ambulatory activity outputs in children with cerebral palsy. Gait and Posture 57, 69–73.
doi:10.1016/j.gaitpost.2017.05.020
Strohrmann, C., Patel, S., Mancinelli, C., Deming, L.C., Chu, J.J., Greenwald, R., Tröster, G., Bonato, P.,
2013. Automated assessment of gait deviations in children with cerebral palsy using a sensorized shoe
and Active Shape Models. IEEE International Conference on Body Sensor Networks.
doi:10.1109/BSN.2013.6575486
Sukal-Moulton, T., Carolina De Campos, A., Alter, K.E., Huppert, T.J., Damiano, D.L., 2018. Relationship
between sensorimotor cortical activation as assessed by functional near infrared spectroscopy and lower
extremity motor coordination in bilateral cerebral palsy. NeuroImage: Clinical 20, 275–285.
doi:10.1016/j.nicl.2018.07.023

195
Sullivan, G.M., Feinn, R., 2012. Using Effect Size - or Why the P Value Is Not Enough. Journal of graduate
medical education 4, 279–82. doi:10.4300/JGME-D-12-00156.1
Summa, A., Vannozzi, G., Bergamini, E., Iosa, M., Morelli, D., Cappozzo, A., 2016. Multilevel upper body
movement control during gait in children with cerebral palsy. PLoS ONE 11, e0151792.
doi:10.1371/journal.pone.0151792
Sumnima, Jayashankar Reddy, K., 2013. Cognitive function deficits in cerebral palsy: a comprehensive
review. International Journal of Current Research 5, 2931–2933.
Supratak, A., Datta, G., Gafson, A.R., Nicholas, R., Guo, Y., Matthews, P.M., 2018. Remote monitoring in the
home validates clinical gait measures for multiple sclerosis. Frontiers in Neurology 9.
doi:10.3389/fneur.2018.00561
Sutherland, D.H., 2005. The evolution of clinical gait analysis part III--kinetics and energy assessment. Gait
and Posture 21, 447–461. doi:10.1016/j.gaitpost.2004.07.008
Sutherland, D.H., 2002. The evolution of clinical gait analysis Part II Kinematics. Gait and Posture 16, 159–
179.
Sutherland, D.H., 2001. The evolution of clinical gait analysis part 1: Kinesiological EMG. Gait and Posture
14, 61–70. doi:10.1016/S0966-6362(01)00100-X
Sutherland, D.H., Davids, J.R., 1993. Common gait abnormalities of the knee in cerebral palsy. Clinical
Orthopaedics Related Research 288, 139–147.
Sutherland, D.H., Olshen, R., Cooper, L., Woo, S.L.-Y., 1980. The Development of Mature Walking. The
Journal of Bone & Joint Surgery 72, 1118. doi:10.2106/00004623-199072070-00031
Švehlík, M., Steinwender, G., Lehmann, T., Kraus, T., 2016. Predictors of outcome after single-event
multilevel surgery in children with cerebral palsy: A retrospective ten-year follow-up study. Bone and
Joint Journal 98B, 278–281. doi:10.1302/0301-620X.98B2.35959
Taborri, J., Scalona, E., Palermo, E., Rossi, S., Cappa, P., 2015. Validation of inter-subject training for hidden
markov models applied to gait phase detection in children with Cerebral Palsy. Sensors 15, 24514–24529.
doi:10.3390/s150924514
Tadano, S., Takeda, R., Sasaki, K., Fujisawa, T., Tohyama, H., 2016. Gait characterization for osteoarthritis
patients using wearable gait sensors (H-Gait systems). Journal of Biomechanics 49, 684–690.
doi:10.1016/j.jbiomech.2016.01.017
Takakusaki, K., 2013. Neurophysiology of gait: From the spinal cord to the frontal lobe. Movement Disorders
28, 1483–1491. doi:10.1002/mds.25669
Takayanagi, N., Sudo, M., Yamashiro, Y., Lee, S., Kobayashi, Y., Niki, Y., Shimada, H., 2019. Relationship
between Daily and In-laboratory Gait Speed among Healthy Community-dwelling Older Adults.
Scientific Reports 9, 2–3. doi:10.1038/s41598-019-39695-0
Tamburini, P., Storm, F., Buckley, C., Bisi, M.C., Stagni, R., Mazzà, C., 2018. Moving from laboratory to real
life conditions: Influence on the assessment of variability and stability of gait. Gait and Posture 59, 248–
252. doi:10.1016/j.gaitpost.2017.10.024
Tang, K.T., Richardson, A.M., Maxwell, D., Spence, W.D., Stansfield, B.W., 2013. Evaluation of an activity
monitor for the objective measurement of free-living physical activity in children with cerebral palsy.
Archives of Physical Medicine and Rehabilitation 94, 2549–2558. doi:10.1016/j.apmr.2013.07.019
Tannous, H., Istrate, D., Benlarbi-Delai, A., Sarrazin, J., Gamet, D., Ho Ba Tho, M.C., Dao, T.T., 2016. A new
multi-sensor fusion scheme to improve the accuracy of knee flexion kinematics for functional
rehabilitation movements. Sensors 16. doi:10.3390/s16111914
Tao, W., Liu, T., Zheng, R., Feng, H., 2012. Gait analysis using wearable sensors. Sensors 12, 2255–2283.
doi:10.3390/s120202255
Theadom, A., Rodrigues, M., Roxburgh, R., Balalla, S., Higgins, C., Bhattacharjee, R., Jones, K.,
Krishnamurthi, R., Feigin, V., 2014. Prevalence of muscular dystrophies: A systematic literature review.
Neuroepidemiology 43, 259–268. doi:10.1159/000369343
Thingstad, P., Egerton, T., Ihlen, E.F., Taraldsen, K., Moe-Nilssen, R., Helbostad, J.L., 2015. Identification of
gait domains and key gait variables following hip fracture. BMC Geriatrics 15, 150. doi:10.1186/s12877-
015-0147-4
Thomason, P., Tan, A., Donnan, A., Rodda, J., Graham, H.K., Narayanan, U., 2018. The Gait Outcomes
Assessment List (GOAL): validation of a new assessment of gait function for children with cerebral
palsy. Developmental Medicine and Child Neurology 60, 618–623. doi:10.1111/dmcn.13722
Tinetti, M.E., Richman, D., Powell, L., 1990. Falls efficacy as a measure of fear of falling. Journal of
gerontology 45, P239–P243. doi:10.1093/geronj/45.6.P239
Tinetti, M.E., Speechley, M., Ginter, S.F., 1988. Risk factor for falls among elderly persons living in the

196
community. The new england journal of medicine 319, 1701–1707.
doi:10.1056/NEJM197107222850421
Toosizadeh, N., Mohler, J., Lei, H., Parvaneh, S., Sherman, S., Najafi, B., 2015. Motor performance
assessment in Parkinson’s disease: Association between objective in-clinic, objective in-home, and
subjective/semi-objective measures. PLoS ONE 10, 1–15. doi:10.1371/journal.pone.0124763
Tramontano, M., Morone, G., Curcio, A., Temperoni, G., Medici, A., Morelli, D., Caltagirone, C., Paolucci,
S., Iosa, M., 2016. Maintaining gait stability during dual walking task: effects of age and neurological
disorders. European journal of physical and rehabilitation medicine 53, 7–13. doi:10.23736/S1973-
9087.16.04203-9
Trojaniello, D., Cereatti, A., Della Croce, U., 2014. Accuracy, sensitivity and robustness of five different
methods for the estimation of gait temporal parameters using a single inertial sensor mounted on the
lower trunk. Gait and Posture 40, 487–492. doi:10.1016/j.gaitpost.2014.07.007
Troje, N.F., 2002. Decomposing biological motion: A framework for analysis and synthesis of human gait
patterns. Journal of Vision 2, 2. doi:10.1167/2.5.2
Trost, S.G., Fragala-Pinkham, M., Lennon, N., O’Neil, M.E., 2016. Decision trees for detection of activity
intensity in youth with cerebral palsy. Medicine and Science in Sports and Exercise 48, 958–966.
doi:10.1249/MSS.0000000000000842
Truong, P.H., Lee, J., Kwon, A.-R.R., Jeong, G.-M.M., 2016. Stride Counting in Human Walking and Walking
Distance Estimation Using Insole Sensors. Sensors 16, 1–15. doi:10.3390/s16060823
Tudor-Locke, C., Craig, C.L., Beets, M.W., Belton, S., Cardon, G.M., Duncan, S., Hatano, Y., Lubans, D.R.,
Olds, T.S., Raustorp, A., Rowe, D.A., Spence, J.C., Tanaka, S., Blair, S.N., 2011. How many steps/day
are enough? For children and adolescents. International Journal of Behavioral Nutrition and Physical
Activity 8, 78. doi:10.1186/1479-5868-8-78
Tudor-Locke, C.E., Barreira, T. V., Brouillette, R.M., Foil, H.C., Keller, J.N., Foil, H.C., Tudor-Locke, C.E.,
2013. Preliminary Comparison of Clinical and Free-Living Measures of Stepping Cadence in Older
Adults. Journal of Physical Activity and Health 10, 1175–1180. doi:10.1123/jpah.10.8.1175
Tugui, R.D., Antonescu, D., 2013. Cerebral Palsy Gait, Clinical Importance. Maedica 8, 388–393.
Van Ancum, J.M., van Schooten, K.S., Jonkman, N.H., Huijben, B., van Lummel, R.C., Meskers, C.G.M.M.,
Maier, A.B., Pijnappels, M., 2019. Gait speed assessed by a 4-m walk test is not representative of daily-
life gait speed in community-dwelling adults. Maturitas 121, 28–34. doi:10.1016/j.maturitas.2018.12.008
Van Den Noort, J.C., Ferrari, A., Cutti, A.G., Becher, J.G., Harlaar, J., 2013. Gait analysis in children with
cerebral palsy via inertial and magnetic sensors. Medical and Biological Engineering and Computing 51,
377–386. doi:10.1007/s11517-012-1006-5
van den Noort, J.C., Scholtes, V.A., Harlaar, J., 2009. Evaluation of clinical spasticity assessment in Cerebral
palsy using inertial sensors. Gait and Posture 30, 138–143. doi:10.1016/j.gaitpost.2009.05.011
Van Der Krogt, M.M., Sloot, L.H., Buizer, A.I., Harlaar, J., 2015. Kinetic comparison of walking on a treadmill
versus over ground in children with cerebral palsy. Journal of Biomechanics 48, 1–7.
doi:10.1016/j.jbiomech.2015.07.046
van der Krogt, M.M., Sloot, L.H., Harlaar, J., 2014. Overground versus self-paced treadmill walking in a
virtual environment in children with cerebral palsy. Gait and Posture 40, 587–593.
doi:10.1016/j.gaitpost.2014.07.003
Van Eck, M., Dallmeijer, A.J., Voorman, J.M., Becher, J.G., 2009. Longitudinal study of motor performance
and its relation to motor capacity in children with cerebral palsy. Developmental Medicine and Child
Neurology 51, 303–310. doi:10.1111/j.1469-8749.2008.03263.x
Van Gorp, M., Roebroeck, M.E., Swan Tan, S., De Groot, V., Gorter, J.W., Smits, D.-W., Schmidt, A.K.,
Dallmeijer, A.J., 2018. Activity Performance Curves of Individuals With Cerebral Palsy. Pediatrics 142.
van Wely, L., BECHER, J.G., Balemans, A.C.J., Dallmeijer, A.J., 2012. Ambulatory activity of children with
cerebral palsy: Which characteristics are important? Developmental Medicine and Child Neurology 54,
436–442. doi:10.1111/j.1469-8749.2012.04251.x
Veilleux, L.-N., Raison, M., Rauch, F., Robert, M., Ballaz, L., 2016. Agreement of spatio-temporal gait
parameters between a vertical ground reaction force decomposition algorithm and a motion capture
system. Gait and Posture 43, 257–264. doi:10.1016/j.gaitpost.2015.10.007
Vezočnik, M., Juric, M.B., 2019. Average Step Length Estimation Models’ Evaluation Using Inertial Sensors:
A Review. IEEE Sensors Journal 19, 396–403. doi:10.1109/JSEN.2018.2878646
Viehweger, E., Bérard, C., Berruyer, A., Simeoni, M.-C.C., 2007. Testing range of motion in cerebral palsy.
Annales de réadaptation et de médecine physique 50, 258–265. doi:10.1016/j.annrmp.2007.02.004
Vienne, A.A., Barrois, R.P.R.P., Buffat, S.S., Vidal, R.D., Ricard, D., Vidal, P.-P.P., Vidal, R.D., Ricard, D.,
197
Vidal, P.-P.P., 2017. Inertial sensors to assess gait quality in patients with neurological disorders: A
systematic review of technical and analytical challenges. Frontiers in Psychology 8, 817.
doi:10.3389/fpsyg.2017.00817
Vitale, M.G., Gomez, J.A., Matsumoto, H., Roye, D.P., Betz, R.R., Campbell, R.M., Emans, J.B., Flynn, J.M.,
Ramirez-Lluch, N., Snyder, B., Sturm, P.F., Song, K.M., Smith, J.T., Shilt, J.S., 2011. Variability of
expert opinion in treatment of early-onset scoliosis. Clinical Orthopaedics and Related Research 469,
1317–1322. doi:10.1007/s11999-010-1540-0
Wang, C., Wang, X., Long, Z., Yuan, J., Qian, Y., Li, J., 2016. Estimation of temporal gait parameters using
a wearable microphone-sensor-based system. Sensors 16. doi:10.3390/s16122167
Wang, W., Adamczyk, P.G., 2019. Analyzing gait in the real world using wearable movement sensors and
frequently repeated movement paths. Sensors 19. doi:10.3390/s19081925
Warmerdam, E., Hausdorff, J.M., Atrsaei, A., Zhou, Y., Mirelman, A., Aminian, K., Espay, A.J., Hansen, C.,
Evers, L.J.W., Keller, A., Lamoth, C., Pilotto, A., Rochester, L., Schmidt, G., Bloem, B.R., Maetzler,
W., 2020. Long-term unsupervised mobility assessment in movement disorders. Lancet Neurology 1–9.
doi:10.1016/S1474-4422(19)30397-7
Washabaugh, E.P., Kalyanaraman, T., Adamczyk, P.G., Claflin, E.S., Krishnan, C., 2017. Validity and
repeatability of inertial measurement units for measuring gait parameters. Gait and Posture 55, 87–93.
doi:10.1016/j.gaitpost.2017.04.013
Wearing, S.C., Reed, L.F., Urry, S.R., 2013. Agreement between temporal and spatial gait parameters from an
instrumented walkway and treadmill system at matched walking speed. Gait and Posture 38, 380–384.
doi:10.1016/j.gaitpost.2012.12.017
Weenk, D., Roetenberg, D., Van Beijnum, B.J.J.F., Hermens, H.J., Veltink, P.H., 2015. Ambulatory estimation
of relative foot positions by fusing ultrasound and inertial sensor data. IEEE Transactions on Neural
Systems and Rehabilitation Engineering 23, 817–826. doi:10.1109/TNSRE.2014.2357686
Westh, R.N., Menelaus, M.B., 1981. A Simple Calculation for the Timing of Arrest. British Editorial Society
of Bone and Joint Surgery 63, 117–119.
Wilson, N.C., Mackey, A.H., Stott, N.S., Wilson, N.C., Mackey, A.H., Stott, N.S., 2014. How does the
functional mobility scale relate to capacity-based measures of walking ability in children and youth with
cerebral palsy? Physical and occupational therapy in pediatrics 34, 185–196.
doi:10.3109/01942638.2013.791917
Wilson, N.C., Signal, N., Naude, Y., Taylor, D., Stott, N.S., 2015. Gait Deviation Index Correlates with Daily
Step Activity in Children with Cerebral Palsy. Archives of Physical Medicine and Rehabilitation 96,
1924–1927. doi:10.1016/j.apmr.2015.05.024
Wimalasundera, N., Stevenson, V.L., 2016. Cerebral palsy. Practical Neurology 16, 184–194.
doi:10.1136/practneurol-2015-001184
Winter, D., 2009. Biomechanics and motor control of human movement, Wiley. John Wiley & Sons, Hoboken,
New-Jersey. doi:10.1002/9780470549148
Winters, T.F., Gage, J.R., Hicks, R., 1987. Gait patterns in spastic hemiplegia in children and young adults.
Journal of Bone and Joint Surgery - Series A 69, 437–441. doi:10.2106/00004623-198769030-00016
Wittry, S., Tsao, E., Bjornson, K., 2018. Are clinic-based walking measures associated with community
walking activity in children with cerebral palsy? Journal of Pediatric Rehabilitation Medicine 11, 23–30.
doi:10.3233/PRM-160425
Wolff, A., Daluiski, A., Lenhoff, M., 2018. The role of wearable wrist inertial sensors to quantify arm
asymmetry during gait in unilateral spastic cerebral palsy (USCP). Developmental Medicine and Child
Neurology 60, 79. doi:10.1111/dmcn.03_14018
Wollesen, B., Mattes, K., Schulz, S., Bischoff, L.L., Seydell, L., Bell, J.W., von Duvillard, S.P., 2017. Effects
of dual-task management and resistance training on gait performance in older individuals: A randomized
controlled trial. Frontiers in Aging Neuroscience 9. doi:10.3389/fnagi.2017.00415
Woollacott, M.J., Shumway-Cooke, A., 2002. Attention and the control of posture and gain: A review of an
emerging area of research. Gait and Posture 1–14.
World Health Organization, 2002. Towards a Common Language for Functioning , Disability and Health : ICF
The International Classification of Functioning, Disability and Health. Geneva.
doi:WHO/EIP/GPE/CAS/01.3
Wren, T.A.L., Gorton 3rd, G.E., Ounpuu, S., Tucker, C.A., Gorton, G.E., Õunpuu, S., Tucker, C.A., 2011a.
Efficacy of clinical gait analysis: A systematic review. Gait and Posture 34, 149–153.
doi:10.1016/j.gaitpost.2011.03.027
Wren, T.A.L., Otsuka, N.Y., Bowen, R.E., Scaduto, A.A., Chan, L.S., Sheng, M., Hara, R., Kay, R.M., 2011b.
198
Influence of gait analysis on decision-making for lower extremity orthopaedic surgery: Baseline data
from a randomized controlled trial. Gait and Posture 34, 364–369. doi:10.1016/j.gaitpost.2011.06.002
Wright, J.G., 2003. Pro: Interobserver variability of gait analysis. Journal of Pediatric Orthopaedics 23, 288–
289. doi:10.1097/01241398-200305000-00002
Wright, J.G., Theologis, T.N., 2015. Is 3-D gait analysis essential? Gait and Posture 42, 227–229.
doi:10.1016/j.gaitpost.2015.05.018
Wu, G., van der Helm, F.C.T.T., Veeger, H.E.J., Makhsous, M., Van Roy, P., Anglin, C., Nagels, J., Karduna,
A.R., McQuade, K., Wang, X., Werner, F.W., Buchholz, B., 2005. ISB recommendation on definitions
of joint coordinate systems of various joints for the reporting of human joint motion—Part II: shoulder,
elbow, wrist and hand. Journal of Biomechanics 38, 981–992. doi:10.1016/j.jbiomech.2004.05.042
Wu, G., van der Helm, F.C.T.T., Veeger, H.E.J., Makhsous, M., Van Roy, P., Anglin, C., Nagels, J., Karduna,
A.R., McQuade, K., Wang, X., Werner, F.W., Buchholz, B., 2002. ISB recommendation on definitions
of joint coordinate systems of various joints for the reporting of human joint motion—Part I: ankle, hip,
and spine. Journal of Biomechanics 35, 543–548. doi:10.1016/j.jbiomech.2004.05.042
Wu, X.Y., Han, L.H., Zhang, J.H., Luo, S., Hu, J.W., Sun, K., 2017. The influence of physical activity,
sedentary behavior on health-related quality of life among the general population of children and
adolescents: A systematic review. PLoS ONE 12, 1–29. doi:10.1371/journal.pone.0187668
Yagi, K., Sugiura, Y., Hasegawa, K., Saito, H., 2019. Gait measurement at home isung a single RGB camera.
Gait and Posture 127065. doi:10.1016/j.snb.2019.127065
Yang, C.-C.C., Hsu, Y.-L.L., 2010. A review of accelerometry-based wearable motion detectors for physical
activity monitoring. Sensors 10, 7772–7788. doi:10.3390/s100807772
Yang, S., Li, Q., 2012a. Inertial sensor-based methods in walking speed estimation: A systematic review.
Sensors 12, 6102–6116. doi:10.3390/s120506102
Yang, S., Li, Q., 2012b. IMU-based ambulatory walking speed estimation in constrained treadmill and
overground walking. Computer Methods in Biomechanics and Biomedical Engineering 15, 313–322.
doi:10.1080/10255842.2010.534465
Yang, S., Zhang, J.T., Novak, A.C., Brouwer, B., Li, Q., 2013. Estimation of spatio-temporal parameters for
post-stroke hemiparetic gait using inertial sensors. Gait and Posture 37, 354–358.
doi:10.1016/j.gaitpost.2012.07.032
Yang, Y.R., Cheng, S.J., Lee, Y.J., Liu, Y.C., Wang, R.Y., 2019. Cognitive and motor dual task gait training
exerted specific training effects on dual task gait performance in individuals with Parkinson’s disease: A
randomized controlled pilot study. PLoS ONE 14, 1–12. doi:10.1371/journal.pone.0218180
Young, N.L., Williams, J.I., Yoshida, K.K., Bombardier, C., Wright, J.G., 1996. The context of measuring
disability: Does it matter whether capability or performance is measured? Journal of Clinical
Epidemiology 49, 1097–1101. doi:10.1016/0895-4356(96)00214-4
Young, N.L., Williams, J.I., Yoshida, K.K., Wright, J.G., 2000. Measurement properties of the Activities Scale
for Kids. Journal of Clinical Epidemiology 53, 125–137. doi:10.1016/S0895-4356(99)00113-4
Yun, X., Calusdian, J., Bachmann, E.R., McGhee, R.B., 2012. Estimation of human foot motion during normal
walking using inertial and magnetic sensor measurements. IEEE Transactions on Instrumentation and
Measurement 61, 2059–2072. doi:10.1109/TIM.2011.2179830
Yuwono, M., Su, S.W., Guo, Y., Moulton, B.D., Nguyen, H.T., 2014. Unsupervised nonparametric method
for gait analysis using a waist-worn inertial sensor. Applied Soft Computing Journal 14, 72–80.
doi:10.1016/j.asoc.2013.07.027
Zeni, J. a., Richards, J.G., Higginson, J.S., Zeni Jr., J.A., Richards, J.G., Higginson, J.S., Zeni, J. a., Richards,
J.G., Higginson, J.S., 2008. Two simple methods for determining gait events during treadmill and
overground walking using kinematic data. Gait and Posture 27, 710–714.
doi:10.1016/j.gaitpost.2007.07.007
Zhang, W., Smuck, M., Legault, C., Ith, M.A., Muaremi, A., Aminian, K., 2018. Gait symmetry assessment
with a low back 3d accelerometer in post-stroke patients. Sensors 18, 8–10. doi:10.3390/s18103322
Zhao, H., Wang, Z., Qiu, S., Shen, Y., Zhang, L., Tang, K., Fortino, G., 2019. Heading Drift Reduction for
Foot-Mounted Inertial Navigation System via Multi-Sensor Fusion and Dual-Gait Analysis. IEEE
Sensors Journal 1. doi:10.1109/JSEN.2018.2866802
Zihajehzadeh, S., Park, E.J., 2016. Regression model-based walking speed estimation using wrist-worn inertial
sensor. PLoS ONE 11, 1–16. doi:10.1371/journal.pone.0165211
Zijlstra, W., Hof, A.L., 2003. Assessment of spatio-temporal gait parameters from trunk accelerations during
human walking. Gait and Posture 18, 1–10. doi:10.1016/S0966-6362(02)00190-X
Zijlstra, W., Hof, A.L., 1997. Displacement of the pelvis during human walking: experimental data and model
199
predictions. Gait and Posture 6, 249–262. doi:10.2307/3178617
Zollinger, M., Degache, F., Currat, G., Pochon, L., Peyrot, N., Newman, C.J., Malatesta, D., 2016. External
mechanical work and pendular energy transduction of overground and treadmill walking in adolescents
with unilateral cerebral palsy. Frontiers in Physiology 7, 1–10. doi:10.3389/fphys.2016.00121

200

201
Curriculum Vitae
Education
2016 –2020 Lausanne/Ge-neva, Switzerland
PhD at Laboratory of Movement Analysis and Measurement, Biotechnology and Bioengineering doctoral school, “Ecole Polytechnique Fédérale de Lausanne”. Su-pervisors: Prof. Aminian K. and Dr. Armand S. (defended on 5th February 2020) Thesis: “Gait analysis of children with cerebral palsy: bridging the gap between the laboratory and real life”
2009 - 2014 Compiègne, France
Biological engineering studies (Master of Science) at the French top school “Uni-versité de Technologie de Compiègne”, specialization in biomechanics and bio-materials
Professional experience
2018 - 2019 Lausanne, Switzer-land
Research assistant at the pediatric Neurology and Neurorehabilitation Unit under the supervision of Dr. Newmann C.J. - Clinical trial project management: Feasibility to use inertial sensors in rehabili-
tation programs. Collaborations: GaitUp SA (Switzerland), EPFL, HUG - Supervision of 2 master students
2015- 2019 Geneva, Switzer-land
Research assistant at Willy Taillard laboratory of kinesiology under the supervi-sion of Dr. Armand A. - Lead of several clinical research projects on gait analysis (mostly with inertial
sensors). Collaborations: GaitUp SA (Switzerland), EPFL, CHUV - Supervision of 2 master students - Clinical Gait Analysis (CGA) activity: data acquisition, treatment and interpre-
tation
2014 –2015 Coubert, France
Engineer mission head of the Laboratory of Movement Analysis of Coubert reha-bilitation center under the supervision of Dr. Kocer S. - CGA activity: data acquisition, treatment and interpretation - Team management, project management, protocol set up, data organization
Feb.-August 2014 Geneva, Switzerland
End-of-studies internship at Willy Taillard laboratory of kinesiology under the su-pervion of Dr. Armand S. and Prof. Marin F.
Feb.-August 2013 Waterloo, Canada
Internship at the Center for Contact Lens Research, University of Waterloo under the supervision of Prof. Gorbet M.
Miscellaneous
Research contribu-tions
10 oral and poster presentations in national and European conferences; 3 publications as first author, 2 publications as co-author in peer-reviewed journals, Papers reviewing, Grants applications (1 accepted – 20’000 CHF)
Awards Jury’s “coup de Coeur” award – Hackathon of the Geneva University Hospitals 2018 Awards of Best poster (PEM 2016, Nancy), Best student presentation (SOFAMEA 2019, Grenoble)
Trainings Good Clinical Practice, Gait analysis course (ESMAC 2016, Sevilla), Statistic methods, Scientific writing
CARCREFF Lena
French, 28 years old [email protected]
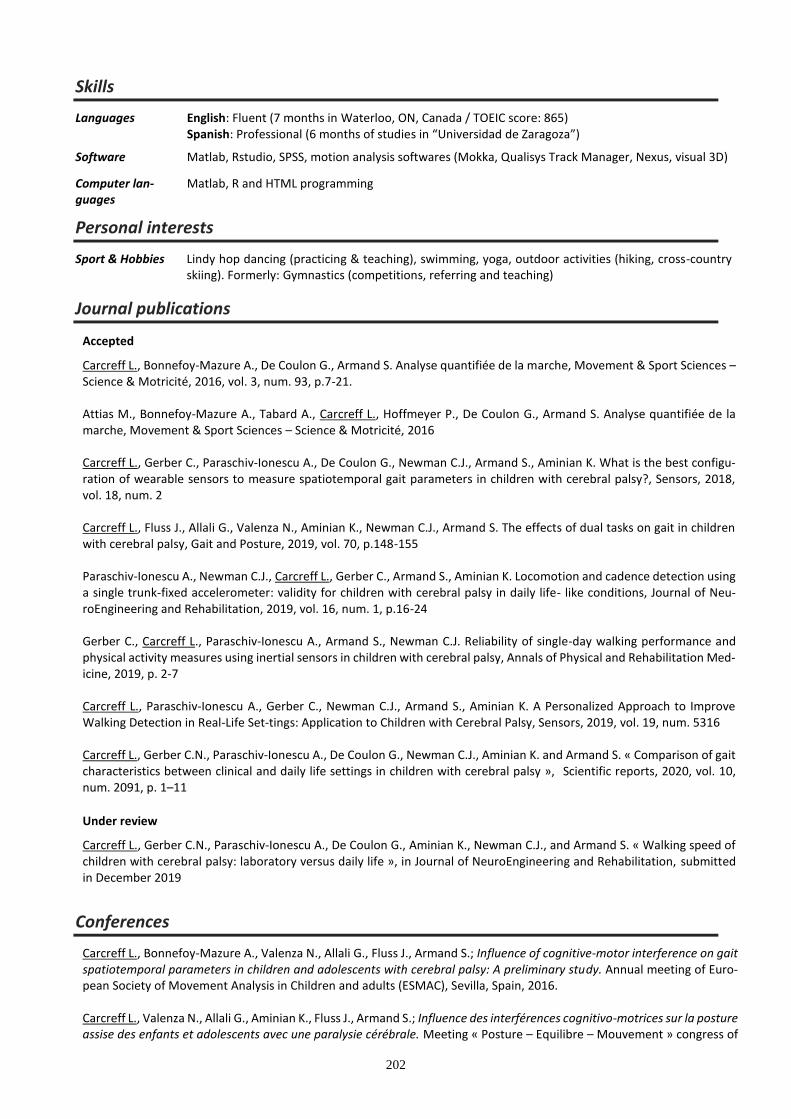
202
Skills
Languages English: Fluent (7 months in Waterloo, ON, Canada / TOEIC score: 865) Spanish: Professional (6 months of studies in “Universidad de Zaragoza”)
Software Matlab, Rstudio, SPSS, motion analysis softwares (Mokka, Qualisys Track Manager, Nexus, visual 3D)
Computer lan-guages
Matlab, R and HTML programming
Personal interests
Sport & Hobbies Lindy hop dancing (practicing & teaching), swimming, yoga, outdoor activities (hiking, cross-country skiing). Formerly: Gymnastics (competitions, referring and teaching)
Journal publications
Accepted
Carcreff L., Bonnefoy-Mazure A., De Coulon G., Armand S. Analyse quantifiée de la marche, Movement & Sport Sciences – Science & Motricité, 2016, vol. 3, num. 93, p.7-21. Attias M., Bonnefoy-Mazure A., Tabard A., Carcreff L., Hoffmeyer P., De Coulon G., Armand S. Analyse quantifiée de la marche, Movement & Sport Sciences – Science & Motricité, 2016 Carcreff L., Gerber C., Paraschiv-Ionescu A., De Coulon G., Newman C.J., Armand S., Aminian K. What is the best configu-ration of wearable sensors to measure spatiotemporal gait parameters in children with cerebral palsy?, Sensors, 2018, vol. 18, num. 2 Carcreff L., Fluss J., Allali G., Valenza N., Aminian K., Newman C.J., Armand S. The effects of dual tasks on gait in children with cerebral palsy, Gait and Posture, 2019, vol. 70, p.148-155 Paraschiv-Ionescu A., Newman C.J., Carcreff L., Gerber C., Armand S., Aminian K. Locomotion and cadence detection using a single trunk-fixed accelerometer: validity for children with cerebral palsy in daily life- like conditions, Journal of Neu-roEngineering and Rehabilitation, 2019, vol. 16, num. 1, p.16-24 Gerber C., Carcreff L., Paraschiv-Ionescu A., Armand S., Newman C.J. Reliability of single-day walking performance and physical activity measures using inertial sensors in children with cerebral palsy, Annals of Physical and Rehabilitation Med-icine, 2019, p. 2-7 Carcreff L., Paraschiv-Ionescu A., Gerber C., Newman C.J., Armand S., Aminian K. A Personalized Approach to Improve Walking Detection in Real-Life Set-tings: Application to Children with Cerebral Palsy, Sensors, 2019, vol. 19, num. 5316 Carcreff L., Gerber C.N., Paraschiv-Ionescu A., De Coulon G., Newman C.J., Aminian K. and Armand S. « Comparison of gait characteristics between clinical and daily life settings in children with cerebral palsy », Scientific reports, 2020, vol. 10, num. 2091, p. 1–11
Under review
Carcreff L., Gerber C.N., Paraschiv-Ionescu A., De Coulon G., Aminian K., Newman C.J., and Armand S. « Walking speed of children with cerebral palsy: laboratory versus daily life », in Journal of NeuroEngineering and Rehabilitation, submitted in December 2019
Conferences
Carcreff L., Bonnefoy-Mazure A., Valenza N., Allali G., Fluss J., Armand S.; Influence of cognitive-motor interference on gait spatiotemporal parameters in children and adolescents with cerebral palsy: A preliminary study. Annual meeting of Euro-pean Society of Movement Analysis in Children and adults (ESMAC), Sevilla, Spain, 2016. Carcreff L., Valenza N., Allali G., Aminian K., Fluss J., Armand S.; Influence des interférences cognitivo-motrices sur la posture assise des enfants et adolescents avec une paralysie cérébrale. Meeting « Posture – Equilibre – Mouvement » congress of

203
the Société Francophone Posture Equilibre, Locomotion (SOFPEL), European Society for Clinical Evaluation of Balance Di-sorders (ESCEBD) and Société Francophone d’Analyse du Mouvement chez l’Enfant et l’Adulte (SOFAMEA), Nancy, France, 2016. (best poster award) Carcreff L., Valenza N., Allali G., Aminian K., Fluss J., Armand S.; Influence of cognitive-motor interference on sitting posture of children and adolescent with cerebral palsy. Annual meeting of the European Academy of Childhood Disability (EACD), Amsterdam, The Netherlands, 2017. Carcreff L., Paraschiv-Ionescu A., Gerber C., De Coulon G., Aminian K., Newman C.J., Armand S.; Assessment of the spatio-temporal gait parameters of children with cerebral palsy in daily-life settings: comparison between wearable systems using different sensor location. Annual meeting of European Society of Movement Analysis in Children and adults (ESMAC), Trondheim, Norway, 2017. Carcreff L., Paraschiv-Ionescu A., Gerber C., De Coulon G., Aminian K., Newman C.J., Armand S.; Assessment of the spatio-temporal gait parameters of children with cerebral palsy in daily-life settings: comparison between wearable systems using different sensor location. BioEngineering day at EPFL, Lausanne, Switzerland, 2017. Carcreff L., Paraschiv-Ionescu A., Gerber C., De Coulon G., Aminian K., Newman C.J., Armand S.; Better understand locomo-tor difficulties encountered in daily-life by children with cerebral palsy: sensor configuration and measurement accuracy. Annual meeting of the Swiss Academy of Childhood Disability (SACD), Aarau, Switzerland, 2017. Carcreff L., Paraschiv-Ionescu A., Gerber C., De Coulon G., Aminian K., Newman C.J., Armand S.; Assessment of the spatio-temporal gait parameters of children with cerebral palsy in daily-life settings: comparison between wearable systems using different sensor location. Annual research day of the Département Femme-mère-enfant of the Centre Hospitalier Univer-sitaire Vaudois (CHUV), Lausanne, Switzerland, 2018. Carcreff L., Valenza N., Allali G., Aminian K., Newman C.J., Fluss J., Armand S.; Influence des tâches cognitives sur la marche des enfants et adolescents avec une paralysie cérébrale. Annual meeting of the Société Francophone d’Analyse du Mouve-ment chez l’Enfant et l’Adulte (SOFAMEA), Toulouse, France, 2018. Carcreff L., Gerber C., Ionescu A., Aminian K., Newman C., Armand S. ; Comparaison entre la capacité et la performance de marche chez les enfants atteints de paralysie cérébrale, basée sur la vitesse de marche. Annual meeting of the Société Francophone d’Analyse du Mouvement chez l’Enfant et l’Adulte (SOFAMEA), Grenoble, France, 2019. (best student pre-sentation award)
Carcreff L., Gerber C., Ionescu A., Aminian K., Newman C., Armand S. ; La vitesse de marche des enfants atteints de para-
lysie cérébrale : vie quotidienne versus laboratoire. Annual research day of the Département Femme-mère-enfant of the
Centre Hospitalier Universitaire Vaudois (CHUV), Lausanne, Switzerland, 2019. Carcreff L., Ionescu A., Gerber C., De Coulon G., Aminian K., Newman C., Armand S. Walking speed in children with cerebral palsy: Laboratory versus daily-life. Annual meeting of the European Academy of Childhood Disability (EACD), Paris, France, 2019.