Cortical morphometry and IQ in VLBW children without cerebral palsy born in 2003–2007
9
Cortical morphometry and IQ in VLBW children without cerebral palsy born in 2003–2007 Anne Elisabeth Sølsnes a, *, Kristine H. Grunewaldt a,b , Knut J. Bjuland a , Elisabeth M. Stavnes a , Irén A. Bastholm a , Synne Aanes a , Heidi F. Østgård a , Asta Håberg c , Gro C.C. Løhaugen a,d , Jon Skranes a,d , Lars M. Rimol a a Department of Laboratory Medicine, Children3s and Women3s Health, Trondheim, Norway b Department of Pediatrics, St. Olav University Hospital, Trondheim, Norway c Department of Neuroscience, Norwegian University of Science and Technology, Trondheim, Norway d Department of Pediatrics, Sørlandet Hospital, Arendal, Norway abstract article info Article history: Received 5 January 2015 Received in revised form 19 March 2015 Accepted 7 April 2015 Available online 14 April 2015 Keywords: Preterm birth Very low birth weight Cortical surface area Cortical thickness MRI Full IQ Children born prematurely with very low birth weight (VLBW: bw ≤ 1500 g) have an increased risk of preterm perinatal brain injury, which may subsequently alter the maturation of the brain, including the cerebral cortex. The aim of study was to assess cortical thickness and surface area in VLBW children compared with term-born controls, and to investigate possible relationships between cortical morphology and Full IQ. In this cross- sectional study, 37 VLBW and 104 term children born between the years 2003–2007 were assessed cognitively at 5–10 years of age, using age appropriate Wechsler tests. The FreeSurfer software was used to obtain estimates of cortical thickness and surface area based on T1-weighted MRI images at 1.5 Tesla. The VLBW children had smaller cortical surface area bilaterally in the frontal, temporal, and parietal lobes. A thicker cortex in the frontal and occipital regions and a thinner cortex in posterior parietal areas were observed in the VLBW group. There were significant differences in Full IQ between groups (VLBW M = 98, SD = 9.71; controls M = 108, SD = 13.57; p b 0.001). There was a positive relationship between IQ and surface area in both groups, albeit significant only in the larger control group. In the VLBW group, reduced IQ was associated with frontal cortical thickening and temporo-parietal thinning. We conclude that cortical deviations are evident in childhood even in VLBW children born in 2003–2007 who have received state of the art medical treatment in the perinatal period and who did not present with focal brain injuries on neonatal ultrasonography. The cortical deviations were associated with reduced cognitive functioning. © 2015 The Authors. Published by Elsevier Inc. This is an open access article under the CC BY-NC-ND license (http://creativecommons.org/licenses/by-nc-nd/4.0/). 1. Introduction Children born before week 32 with very-low-birth weight (VLBW: birth weight ≤ 1500 g) are more likely to need medical treatment dur- ing the perinatal period, and their immature nervous and cardiovascular systems render these children prone to focal brain injuries such as intra- ventricular hemorrhages and periventricular leukomalacia (PVL) (Volpe, 2009). Volpe (2009) has suggested that the complex of enceph- alopathy of prematurity includes both destructive and developmental disturbances, and primary white matter injury could have secondary ef- fects on cortical and gray matter nuclei development. Although perina- tal care and medical treatment in the neonatal intensive care unit (NICU) have improved radically during the last decades with reduced incidence of focal brain injury, the immature brain and exposure to the harsh extra-uterine environment in the NICU are still believed to in- crease the risk of disrupted brain development in very preterm born survivors. The consequences of such developmental disruptions in an extremely sensitive period of brain growth may be profound alterations of subcortical and cortical morphology that may affect brain function. Previous studies have reported abnormal cerebral white matter in VLBW infants as the most common pathological finding, manifested as reduced fractional anisotropy on diffusion tensor images at 27–46 weeks of gestation (Ball et al., 2013), in adolescents (Skranes et al., 2007) and in young adults aged 18–22 years (Eikenes et al., 2011). However, changes in cortical and subcortical gray matter have also been demonstrated in children with VLBW as reduced brain cortical surface area at term-equivalent age; (Ajayi-Obe et al., 2000; Kapellou et al., 2006), in toddlers 18–22 months old (Phillips et al., 2011), in chil- dren at the age of 10 years (Grunewaldt et al., 2014), and in adolescents and young adults (Frye et al., 2010; Skranes et al., 2013). Both regional thinning and thickening of the cerebral cortex have been reported in children 7–12 years of age (Grunewaldt et al., 2014; Mürner-Lavanchy NeuroImage: Clinical 8 (2015) 193–201 * Corresponding author. Tel.: +47 922 13 155. E-mail address: [email protected] (A.E. Sølsnes). http://dx.doi.org/10.1016/j.nicl.2015.04.004 2213-1582/© 2015 The Authors. Published by Elsevier Inc. This is an open access article under the CC BY-NC-ND license (http://creativecommons.org/licenses/by-nc-nd/4.0/). Contents lists available at ScienceDirect NeuroImage: Clinical journal homepage: www.elsevier.com/locate/ynicl
Transcript of Cortical morphometry and IQ in VLBW children without cerebral palsy born in 2003–2007
NeuroImage: Clinical 8 (2015) 193–201
Contents lists available at ScienceDirect
NeuroImage: Clinical
j ourna l homepage: www.e lsev ie r .com/ locate /yn ic l
Cortical morphometry and IQ in VLBW children without cerebral palsyborn in 2003–2007
Anne Elisabeth Sølsnesa,*, Kristine H. Grunewaldta,b, Knut J. Bjulanda, Elisabeth M. Stavnesa, Irén A. Bastholma,Synne Aanesa, Heidi F. Østgårda, Asta Håbergc, Gro C.C. Løhaugena,d, Jon Skranesa,d, Lars M. Rimola
aDepartment of Laboratory Medicine, Children3s and Women3s Health, Trondheim, NorwaybDepartment of Pediatrics, St. Olav University Hospital, Trondheim, NorwaycDepartment of Neuroscience, Norwegian University of Science and Technology, Trondheim, NorwaydDepartment of Pediatrics, Sørlandet Hospital, Arendal, Norway
* Corresponding author. Tel.: +47 922 13 155.E-mail address: [email protected] (A.E. Sølsnes)
http://dx.doi.org/10.1016/j.nicl.2015.04.0042213-1582/© 2015 The Authors. Published by Elsevier Inc
a b s t r a c t
a r t i c l e i n f oArticle history:Received 5 January 2015Received in revised form 19 March 2015Accepted 7 April 2015Available online 14 April 2015
Keywords:Preterm birthVery low birth weightCortical surface areaCortical thicknessMRIFull IQ
Children born prematurely with very low birth weight (VLBW: bw ≤ 1500 g) have an increased risk of pretermperinatal brain injury, which may subsequently alter the maturation of the brain, including the cerebral cortex.The aim of study was to assess cortical thickness and surface area in VLBW children compared with term-borncontrols, and to investigate possible relationships between cortical morphology and Full IQ. In this cross-sectional study, 37 VLBW and 104 term children born between the years 2003–2007 were assessed cognitivelyat 5–10 years of age, using age appropriateWechsler tests. The FreeSurfer software was used to obtain estimatesof cortical thickness and surface area based on T1-weighted MRI images at 1.5 Tesla. The VLBW children hadsmaller cortical surface area bilaterally in the frontal, temporal, and parietal lobes. A thicker cortex in the frontaland occipital regions and a thinner cortex in posterior parietal areas were observed in the VLBW group. Therewere significant differences in Full IQ between groups (VLBW M = 98, SD = 9.71; controls M = 108, SD =13.57; p b 0.001). There was a positive relationship between IQ and surface area in both groups, albeit significantonly in the larger control group. In the VLBW group, reduced IQ was associated with frontal cortical thickeningand temporo-parietal thinning.We conclude that cortical deviations are evident in childhood even in VLBW children born in 2003–2007 whohave received state of the art medical treatment in the perinatal period and who did not present with focalbrain injuries on neonatal ultrasonography. The cortical deviations were associated with reduced cognitivefunctioning.
© 2015 The Authors. Published by Elsevier Inc. This is an open access article under the CC BY-NC-ND license(http://creativecommons.org/licenses/by-nc-nd/4.0/).
1. Introduction
Children born before week 32 with very-low-birth weight (VLBW:birth weight≤ 1500 g) are more likely to need medical treatment dur-ing the perinatal period, and their immature nervous and cardiovascularsystems render these children prone to focal brain injuries such as intra-ventricular hemorrhages and periventricular leukomalacia (PVL)(Volpe, 2009). Volpe (2009) has suggested that the complex of enceph-alopathy of prematurity includes both destructive and developmentaldisturbances, and primarywhitematter injury could have secondary ef-fects on cortical and gray matter nuclei development. Although perina-tal care and medical treatment in the neonatal intensive care unit(NICU) have improved radically during the last decades with reducedincidence of focal brain injury, the immature brain and exposure to
.
. This is an open access article under
the harsh extra-uterine environment in the NICU are still believed to in-crease the risk of disrupted brain development in very preterm bornsurvivors. The consequences of such developmental disruptions in anextremely sensitive period of brain growthmay be profound alterationsof subcortical and cortical morphology that may affect brain function.
Previous studies have reported abnormal cerebral white matterin VLBW infants as the most common pathological finding, manifestedas reduced fractional anisotropy on diffusion tensor images at27–46 weeks of gestation (Ball et al., 2013), in adolescents (Skraneset al., 2007) and in young adults aged 18–22 years (Eikenes et al.,2011). However, changes in cortical and subcortical gray matter havealso been demonstrated in childrenwith VLBW as reduced brain corticalsurface area at term-equivalent age; (Ajayi-Obe et al., 2000; Kapellouet al., 2006), in toddlers 18–22 months old (Phillips et al., 2011), in chil-dren at the age of 10 years (Grunewaldt et al., 2014), and in adolescentsand young adults (Frye et al., 2010; Skranes et al., 2013). Both regionalthinning and thickening of the cerebral cortex have been reported inchildren 7–12 years of age (Grunewaldt et al., 2014; Mürner-Lavanchy
the CC BY-NC-ND license (http://creativecommons.org/licenses/by-nc-nd/4.0/).
194 A.E. Sølsnes et al. / NeuroImage: Clinical 8 (2015) 193–201
et al., 2014) and in adolescents at the age of 19 (Bjuland et al., 2014). Pos-sible mechanisms underlying these cerebral changes in the VLBW popu-lation may include injuries that affect neuronal migration and therebycortical development (Volpe, 2009).
The aim of the present study was to investigate cortical thicknessand cortical surface area in 5–10 year old children born preterm withVLBW and term-born controls. To our knowledge, no previous studyhas explored regional cortical morphology using continuous corticalsurface maps in VLBW children as young as 5–10 years of age. Usingcontinuous maps of cortical thickness and surface area increases bothsensitivity and specificity compared to volumetric methods (Rimolet al., 2012).
In addition, the present study explores the relationship between re-gional measures of cortical morphology and Full IQ as an overall mea-sure of cognitive functioning. Cognitive abilities have been shown tobe reduced in the VLBW population (Aarnoudse-Moens et al., 2009;Anderson et al., 2004; Lohaugen et al., 2010; Nosarti et al., 2007;Taylor et al., 2004), and reduced cognitive performance has been relatedto reduced cortical volume in 14–15 year old VLBW adolescents(Nosarti et al., 2014). Finally, previous studies of VLBW young adultshave shown negative correlations between IQ and cortical thickness(Bjuland et al., 2013), and positive correlations with surface area(Skranes et al., 2013). However, these VLBW young adults were bornin 1986–1988, and it is unclearwhether the same relationships betweencortical morphology and cognitive function exist for school aged VLBWchildren born after year 2000, who have received modern neonatal in-tensive care.
2. Material and methods
2.1. Participants
2.1.1. VLBW groupThe children born prematurely with very low birth weight (VLBW)
(birth weight ≤ 1500 g) were recruited based on admittance to theNeonatal Intensive Care Unit (NICU) at St. Olav University Hospital inTrondheim, Norway between 2003 and 2007. Sixty-three non-CPchildren were invited and 57 agreed to participate in the study (31 fe-males). One child (a twin sibling to a VLBW child) with birth weight at2090 g was included in the data analysis, and post-hoc analysis showedsimilar brain morphology and IQ scores for this child as for the VLBWcohort.
2.1.2. Control subjectsThe control subjects were recruited from the national Norwegian
Mother and Child Cohort Study (MoBa)managed by theNorwegian In-stitute of Public Health (Magnus et al., 2006), with ages rangingbetween 4 and 11 years (n = 143, 70 females). The participantsincluded in the current analysis were living in the same geographicalarea as the VLBW participants (Nord- and Sør-Trøndelag) and had nor-mal vision and hearing. The exclusion criteriawere a history of injury ordisease known to affect the central nervous system (CNS) function, in-cluding neurological or psychiatric illness and serious head trauma. Fur-thermore, if the child was under psychiatric treatment, usedpsychoactive drugs known to affect CNS functioning, had a birthweightbelow 2500 g, or had any known MRI contraindications, they were ex-cluded from participation in the current study.
2.2. MR imaging
2.2.1. Image acquisitionMRI data were collected using a 12-channel head coil on a 1.5 T
Siemens Avanto scanner (Siemens Medical Solutions). The pulsesequence used for morphometric analyses was one 3D T1-weightedmagnetization prepared rapid acquisition gradient echo (MPRAGE)scan with the following parameters: repetition time (TR), 2400 ms;echo time (TE), 3.61 ms; inversion time (TI), 1000 ms; flip angle, 8°,
FOV 240 × 240 and acquisition duration of 4 min and 18 s. Each volumeconsisted of 160 sagittal sliceswith voxel sizes of 1.25× 1.25× 1.20mm.The total scan time was on average 30 min. Raw datasets were de-identified and transferred to Linux work-stations for processing. EachMPRAGE was visually inspected and only scans with no or minimalmovement artifacts were included in the analyses.
2.2.2. Morphometric image analysisCortical reconstruction was performed with the FreeSurfer 5.3.0
image analysis suite, which is documented and freely available fordownload online (http://surfer.nmr.mgh.harvard.edu/). The technicaldetails of these procedures are described in other publications (Daleet al., 1999; Dale and Sereno, 1993; Fischl et al., 2004a; Fischl andDale, 2000; Fischl et al., 2001). Briefly, this includes motion correctionand averaging (Reuter et al., 2010) of multiple volumetric T1 weightedimages, removal of non-brain tissue using a hybrid watershed/surfacedeformation procedure (Ségonne et al., 2004), automated Talairachtransformation, intensity normalization (Sled and Pike, 1998), tessella-tion of the gray and white matter boundary, automated topology cor-rection (Fischl et al., 2001; Ségonne et al., 2007), and surfacedeformation following intensity gradients to optimally place the gray/white and gray/cerebrospinal fluid (CSF) borders at the locationwhere the greatest shift in intensity defines the transition to the othertissue class (Dale et al., 1999; Dale and Sereno, 1993; Fischl and Dale,2000). Once the cortical models are complete, a number of deformableprocedures can be performed for further data processing and analysisincluding surface inflation (Fischl et al., 1999), registration to a sphericalatlaswhich is based on individual cortical folding patterns tomatch cor-tical geometry across subjects (Fischl et al., 1999), parcellation of the ce-rebral cortex into units with respect to the gyral and sulcal structures(Desikan et al., 2006; Fischl et al., 2004b), and creation of a variety ofsurface based data. This method uses both intensity and continuity in-formation from the entire three-dimensional MR volume in the seg-mentation and deformation procedures to produce representations ofcortical thickness, calculated as the closest distance from the gray/white boundary to the gray/CSF boundary at each vertex on the tessel-lated surface (Fischl and Dale, 2000). Themaps are created using spatialintensity gradients across tissue classes and are therefore not simply re-liant on absolute signal intensity.
The two cerebral hemispheres were processed separately. Thesurfaces were smoothed with a full-width-half-maximum Gaussiankernel of 30 mm (662 iterations). Each surface consisted of approxi-mately 160,000 vertices arranged in a triangular grid, and estimatesof the cortical area were obtained by computing the area of each tri-angle in the standardized, spherical atlas space surface tessellationwhen mapped into the individual subject space. Vertex-wise esti-mates of cortical area were then computed by assigning one-thirdof the area of each triangle to each of its vertices (Rimol et al.,2012). The cortical surface of each subject was automaticallyparcellated using defined gyri and sulci as landmarks, and the sur-face was divided into 34 anatomical regions for each brain hemi-sphere defined in FreeSurfer (Desikan et al., 2006; Fischl et al.,2004a), which were used to anatomically identify the affected re-gions after significance testing.
In the VLBW group, analyses were conducted based on MR-imagesfrom 37 children (21 females). Of the 57 who were eligible for MR-scanning, 10 children did not want to be scanned and had cognitive as-sessment only, and 10 imageswere excluded due tomovement artifactsor disrupted scanning. In the control group we were able to attain 104MPRAGE images of good quality (54 females). A total of 143 childrenwere invited to MR imaging, 22 children did not want to participateand 17 of the images had to be excluded due to movement artifacts ordisrupted scanning. The youngest participants (5–6 years of age) inboth groups were most likely to decline MRI scanning or be excludeddue to movement artifacts.

195A.E. Sølsnes et al. / NeuroImage: Clinical 8 (2015) 193–201
2.3. Cognitive measures
2.3.1. VLBW groupIn the VLBW group, children b6 years of age were assessed with
the age-appropriate, complete version of the Wechsler Preschooland Primary Scale of Intelligence, 3rd edition (WPPSI-III)(Wechsler, 2002), whereas children ≥ 6 years were assessed withWechsler Intelligence Scale for Children, 4th edition (WISC- IV)(Wechsler, 2003). WPPSI-III provides three IQ indices: Full Scale IQ,Verbal IQ and Performance IQ, whileWISC-IV comprises four indices:Verbal Comprehension Index, Perceptual Reasoning Index, WorkingMemory Index and Processing Speed Index, and Full Scale IQ.
2.3.2. Control groupCognitive abilities in the controls who were ≥ 6.5 years of age were
assessed with the Wechsler Abbreviated Scale of Intelligence (WASI)(Wechsler, 1999). The WASI is a validated screening test that is usedto assess the following aspects of intelligence: verbal knowledge, visualinformation processing, spatial and nonverbal reasoning, and generalintelligence. Three IQ scores can be extracted using the WASI: a VerbalIQ (VIQ) score (subtests: vocabulary and similarities) and a Perfor-mance IQ (PIQ) score (subtests: block design and matrices), whichwhen combined provide an estimated Full-scale IQ (FSIQ) score.The controls who were younger than 6.5 years of age completed ashort form of the Wechsler Preschool and Primary Scale of Intelli-gence, 3rd edition (WPPSI-III) (Wechsler, 2003), including similarsubtests: vocabulary, similarities, block design and matrices, andVerbal IQ (VIQ), Performance IQ (PIQ) and Full-scale IQ (FSIQ)were calculated.
Table 1Demographic and clinical characteristics.
VLBW/Controlnumber
VLBWMean(SD/median)
ControlsMean(SD)
p value
Age (years) 37/104 7.8 (1.73) 8.2 (1.02) 0.352b
Gender (boys/girls) 37/104 16/21 50/54 0.616
2.3.3. Statistical analysisIBMSPSS Statistics 19 editionwas used for the analysis of the clinical
and cognitive measurements by independent samples t-tests and non-parametric tests. Data with non-equal variances were analyzed withnon-parametric testing. Matlab 2011b was used for statistical analysesof morphometry data. To examine group differences, a general linearmodel was fitted with cortical surface area or cortical thickness as de-pendent variable and group, sex and age at MRI scan as independentvariables in each vertex across the cortical surface. The regression ofIQ on cortical morphology was tested with the same GLM with Full IQas an added continuous predictor. Appropriate contrast vectors wereset in order to perform the various significance tests. The hemisphereswere analyzed separately, and effect size and p-maps were generated.Effect size is reported as Cohen3s d for group comparisons and r = F /(F + df) for the continuous predictors (IQ and birth weight). The p-maps were thresholded and multiple comparisons were corrected forwith a 5% false discovery rate (FDR) that was applied co-jointly acrossthe hemispheres. Significance tests were performed to investigate dif-ferences in cortical morphology between the groups. For the clinicalvariables birth weight, gestational age, and days on ventilator generallinearmodels were fitted in each vertex across the surface, with corticalsurface area or cortical thickness as the dependent variable and one ofthe clinical variables as a covariate, and adjusted for sex and age atMRI scan. These analyseswere performed in the VLBWgroup exclusive-ly. Findings on any of these clinical variables were followed upwith fur-ther exploratory analyses.
Birth weight (grams) 37/104 1050 (358) 3657(484)
b0.001
Gestational age(weeks)
37 28.5 (28) na
SES 34/85 3.9 (0.9 ) 4.3 (0.8) 0.021Full IQ 37/104 98 (10) 108 (14) b0.001a
Abbreviations: VLBW: very low birthweight; SES: socio-economic status; SD: standard de-viation; na: not available.
a Adjusted for socio-economic status.b Non-parametric due to non-equal variance.
2.3.4. Imputation of missing dataMissing data in the independent variables (Full IQ and birth weight)
were dealt with by multiple imputations. Pattern analysis was per-formed, showing that we had below 5% missing data and that wecould assume that data were missing at random. Seven Full IQ dataand two birth weights were imputed and pooled imputations wereused in further analyses.
2.3.5. Socio-economic statusHollingshead3s (1975) two factor index of social position based on
education and occupation of one parent or the mean index of bothwas used to calculate socio-economic status (SES).
2.3.6. EthicsThe Regional Committee for Medical Research Ethics approved the
study protocol (project number: 2010/2359), and written informedconsent was obtained from the parent/guardian of all participants.
3. Results
3.1. Group characteristics
Demographic and clinical characteristics of the study groups areshown in Table 1. In the VLBW group, mean birth weight was 1048 gand mean gestational age was 28.5 weeks. Detailed perinatal data forthe VLBW children are presented in Appendix Table A1. There was nosignificant group difference in age at examination; however, the con-trols had higher mean socioeconomic status (SES) than the VLBWgroup. The VLBW group had significantly lower scores than controlson Full IQ, also after adjusting for socioeconomic status (n = 34/85).
3.2. Structural MRI
3.2.1. Cortical surface area group differencesThere were significant differences in cortical surface area between
the VLBW and the control group. The VLBW group showed bilateralreduction in cortical surface area in the frontal, temporal, and parietallobes (Fig. 1). The effect size of the group difference ranged from d =0.4 to 0.8 in most cortical regions (see Appendix Fig. A1). Table 2 listsall cortical regions with significant group differences in surface area asdetermined by the GLM (after 5% FDR correction), where 20 out of 35regions had ≥90% reduction of cortical surface area in the VLBWgroup compared with controls.
3.2.2. Cortical surface area and IQIn the control group, there were widespread cortical regions in both
hemispheres showing a significant relationship between Full IQ scoresand cortical surface area (see Appendix Fig. A2 and Table A2). In theVLBW group, the relationship between Full IQ scores and cortical sur-face area did not reach statistical significance. However, the correlationcoefficients were 0.2–0.4 in several cortical regions in both groups, andashigh as 0.6 in some regions in theVLBWgroup (Fig. 2). The lack of sta-tistical significance in these analyses is readily explained by loss of sta-tistical power due to the smaller sample size.
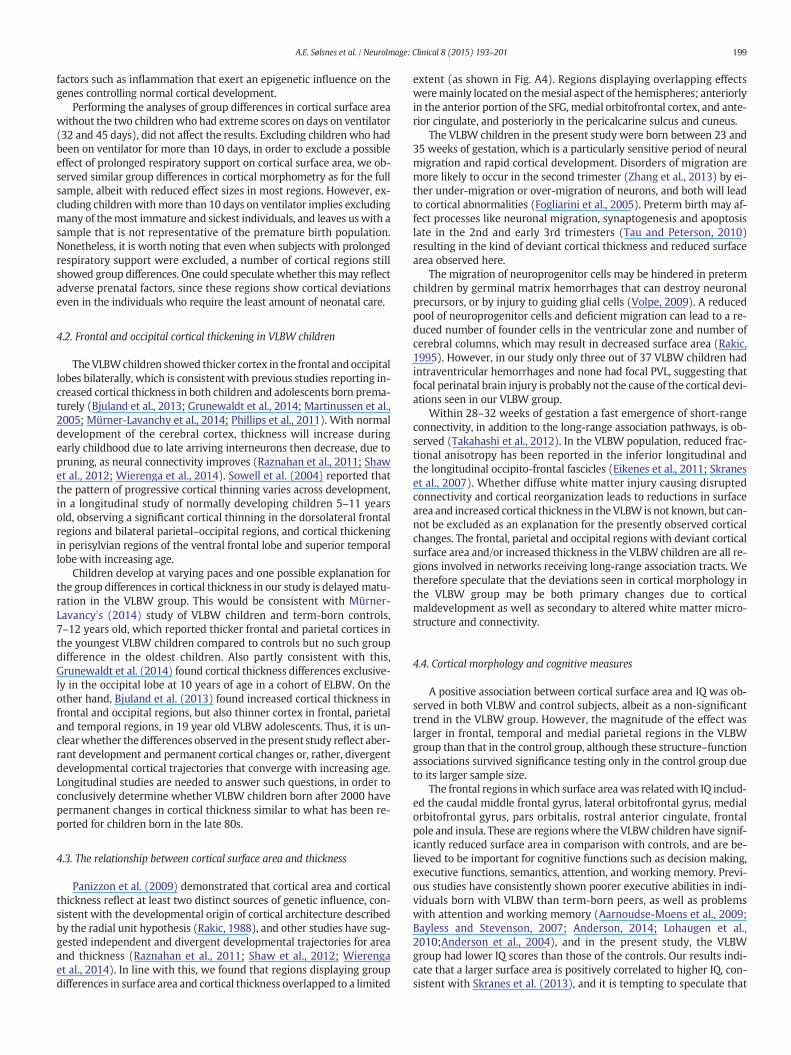
3.2.3. Cortical thickness group differencesThe VLBW group showed significantly thicker cortex in the frontal
(medial orbitofrontal gyrus, rostral anterior cingulate, frontal pole)
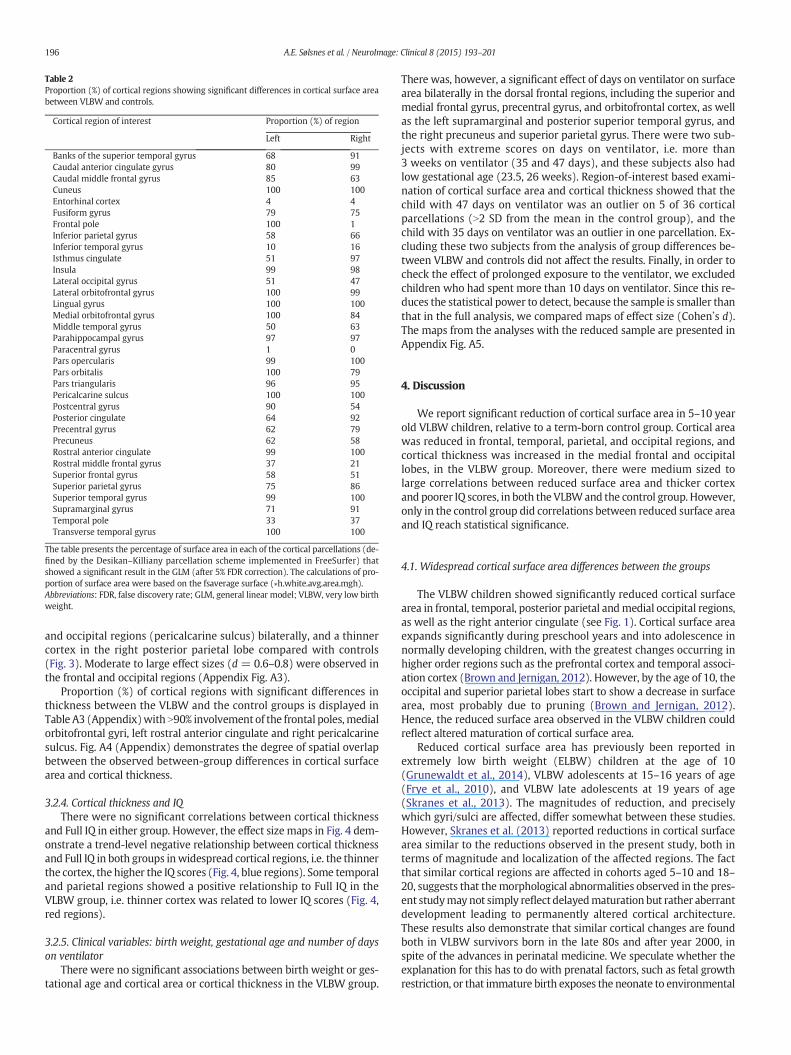
Table 2Proportion (%) of cortical regions showing significant differences in cortical surface areabetween VLBW and controls.
Cortical region of interest Proportion (%) of region
Left Right
Banks of the superior temporal gyrus 68 91Caudal anterior cingulate gyrus 80 99Caudal middle frontal gyrus 85 63Cuneus 100 100Entorhinal cortex 4 4Fusiform gyrus 79 75Frontal pole 100 1Inferior parietal gyrus 58 66Inferior temporal gyrus 10 16Isthmus cingulate 51 97Insula 99 98Lateral occipital gyrus 51 47Lateral orbitofrontal gyrus 100 99Lingual gyrus 100 100Medial orbitofrontal gyrus 100 84Middle temporal gyrus 50 63Parahippocampal gyrus 97 97Paracentral gyrus 1 0Pars opercularis 99 100Pars orbitalis 100 79Pars triangularis 96 95Pericalcarine sulcus 100 100Postcentral gyrus 90 54Posterior cingulate 64 92Precentral gyrus 62 79Precuneus 62 58Rostral anterior cingulate 99 100Rostral middle frontal gyrus 37 21Superior frontal gyrus 58 51Superior parietal gyrus 75 86Superior temporal gyrus 99 100Supramarginal gyrus 71 91Temporal pole 33 37Transverse temporal gyrus 100 100
The table presents the percentage of surface area in each of the cortical parcellations (de-fined by the Desikan–Killiany parcellation scheme implemented in FreeSurfer) thatshowed a significant result in the GLM (after 5% FDR correction). The calculations of pro-portion of surface area were based on the fsaverage surface (∗h.white.avg.area.mgh).Abbreviations: FDR, false discovery rate; GLM, general linear model; VLBW, very low birthweight.
196 A.E. Sølsnes et al. / NeuroImage: Clinical 8 (2015) 193–201
and occipital regions (pericalcarine sulcus) bilaterally, and a thinnercortex in the right posterior parietal lobe compared with controls(Fig. 3). Moderate to large effect sizes (d = 0.6–0.8) were observed inthe frontal and occipital regions (Appendix Fig. A3).
Proportion (%) of cortical regions with significant differences inthickness between the VLBW and the control groups is displayed inTable A3 (Appendix)with N90% involvement of the frontal poles,medialorbitofrontal gyri, left rostral anterior cingulate and right pericalcarinesulcus. Fig. A4 (Appendix) demonstrates the degree of spatial overlapbetween the observed between-group differences in cortical surfacearea and cortical thickness.
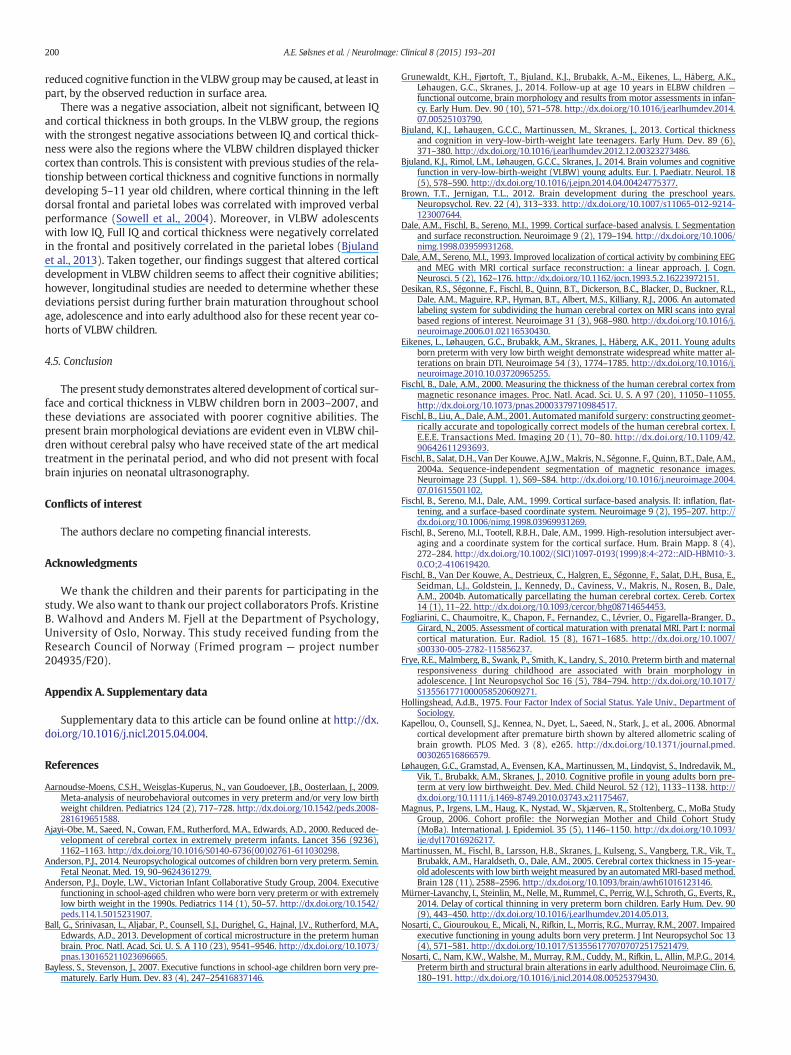
3.2.4. Cortical thickness and IQThere were no significant correlations between cortical thickness
and Full IQ in either group. However, the effect size maps in Fig. 4 dem-onstrate a trend-level negative relationship between cortical thicknessand Full IQ in both groups inwidespread cortical regions, i.e. the thinnerthe cortex, the higher the IQ scores (Fig. 4, blue regions). Some temporaland parietal regions showed a positive relationship to Full IQ in theVLBW group, i.e. thinner cortex was related to lower IQ scores (Fig. 4,red regions).
3.2.5. Clinical variables: birth weight, gestational age and number of dayson ventilator
There were no significant associations between birth weight or ges-tational age and cortical area or cortical thickness in the VLBW group.
There was, however, a significant effect of days on ventilator on surfacearea bilaterally in the dorsal frontal regions, including the superior andmedial frontal gyrus, precentral gyrus, and orbitofrontal cortex, as wellas the left supramarginal and posterior superior temporal gyrus, andthe right precuneus and superior parietal gyrus. There were two sub-jects with extreme scores on days on ventilator, i.e. more than3 weeks on ventilator (35 and 47 days), and these subjects also hadlow gestational age (23.5, 26 weeks). Region-of-interest based exami-nation of cortical surface area and cortical thickness showed that thechild with 47 days on ventilator was an outlier on 5 of 36 corticalparcellations (N2 SD from the mean in the control group), and thechild with 35 days on ventilator was an outlier in one parcellation. Ex-cluding these two subjects from the analysis of group differences be-tween VLBW and controls did not affect the results. Finally, in order tocheck the effect of prolonged exposure to the ventilator, we excludedchildren who had spent more than 10 days on ventilator. Since this re-duces the statistical power to detect, because the sample is smaller thanthat in the full analysis, we compared maps of effect size (Cohen3s d).The maps from the analyses with the reduced sample are presented inAppendix Fig. A5.
4. Discussion
We report significant reduction of cortical surface area in 5–10 yearold VLBW children, relative to a term-born control group. Cortical areawas reduced in frontal, temporal, parietal, and occipital regions, andcortical thickness was increased in the medial frontal and occipitallobes, in the VLBW group. Moreover, there were medium sized tolarge correlations between reduced surface area and thicker cortexand poorer IQ scores, in both the VLBWand the control group. However,only in the control group did correlations between reduced surface areaand IQ reach statistical significance.
4.1. Widespread cortical surface area differences between the groups
The VLBW children showed significantly reduced cortical surfacearea in frontal, temporal, posterior parietal andmedial occipital regions,as well as the right anterior cingulate (see Fig. 1). Cortical surface areaexpands significantly during preschool years and into adolescence innormally developing children, with the greatest changes occurring inhigher order regions such as the prefrontal cortex and temporal associ-ation cortex (Brown and Jernigan, 2012). However, by the age of 10, theoccipital and superior parietal lobes start to show a decrease in surfacearea, most probably due to pruning (Brown and Jernigan, 2012).Hence, the reduced surface area observed in the VLBW children couldreflect altered maturation of cortical surface area.
Reduced cortical surface area has previously been reported inextremely low birth weight (ELBW) children at the age of 10(Grunewaldt et al., 2014), VLBW adolescents at 15–16 years of age(Frye et al., 2010), and VLBW late adolescents at 19 years of age(Skranes et al., 2013). The magnitudes of reduction, and preciselywhich gyri/sulci are affected, differ somewhat between these studies.However, Skranes et al. (2013) reported reductions in cortical surfacearea similar to the reductions observed in the present study, both interms of magnitude and localization of the affected regions. The factthat similar cortical regions are affected in cohorts aged 5–10 and 18–20, suggests that themorphological abnormalities observed in the pres-ent studymaynot simply reflect delayedmaturation but rather aberrantdevelopment leading to permanently altered cortical architecture.These results also demonstrate that similar cortical changes are foundboth in VLBW survivors born in the late 80s and after year 2000, inspite of the advances in perinatal medicine. We speculate whether theexplanation for this has to do with prenatal factors, such as fetal growthrestriction, or that immature birth exposes the neonate to environmental
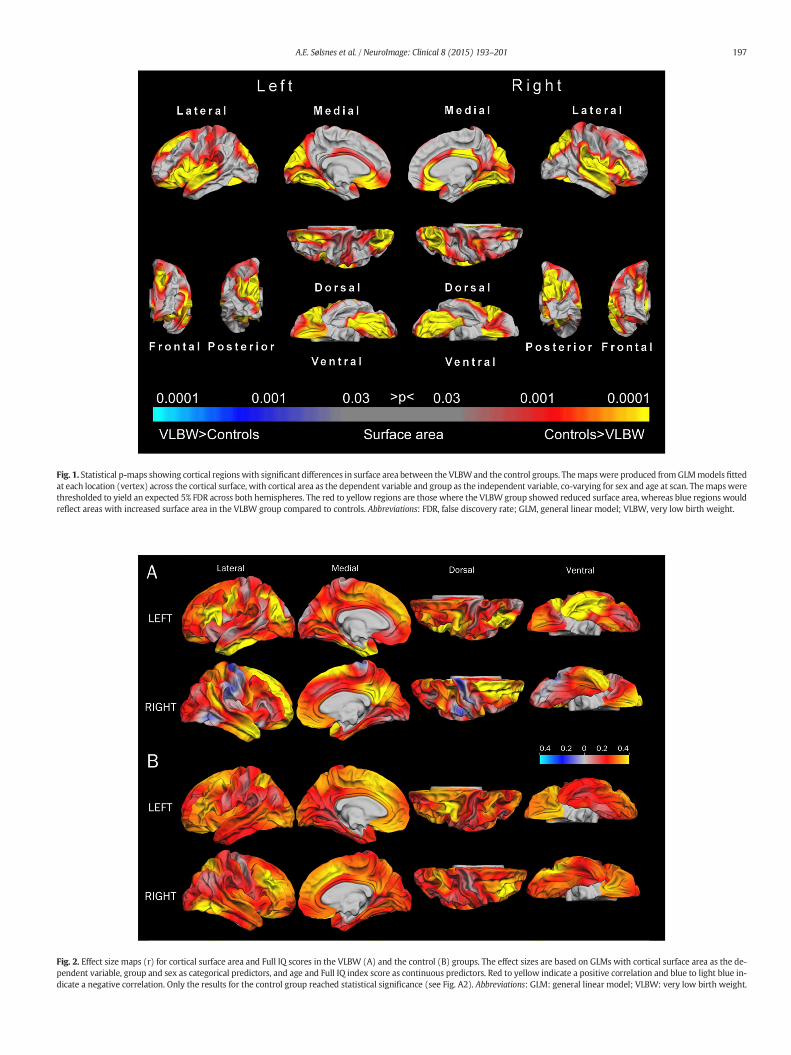
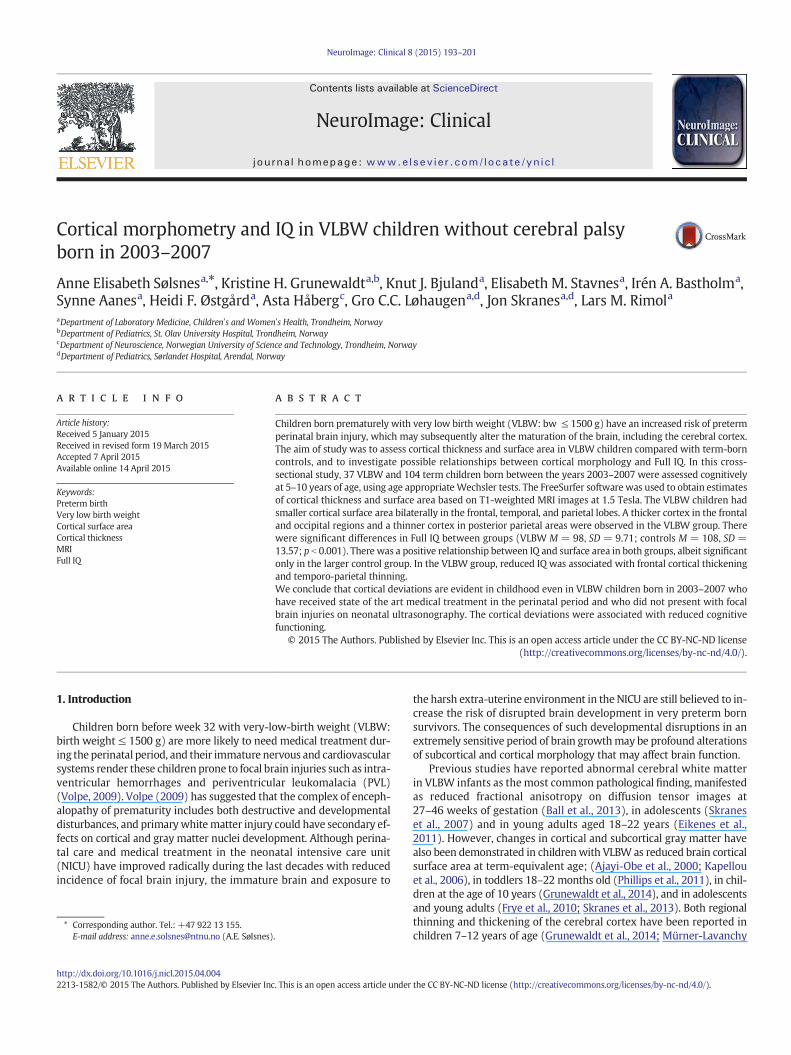
Fig. 2. Effect size maps (r) for cortical surface area and Full IQ scores in the VLBW (A) and the control (B) groups. The effect sizes are based on GLMs with cortical surface area as the de-pendent variable, group and sex as categorical predictors, and age and Full IQ index score as continuous predictors. Red to yellow indicate a positive correlation and blue to light blue in-dicate a negative correlation. Only the results for the control group reached statistical significance (see Fig. A2). Abbreviations: GLM: general linear model; VLBW: very low birth weight.
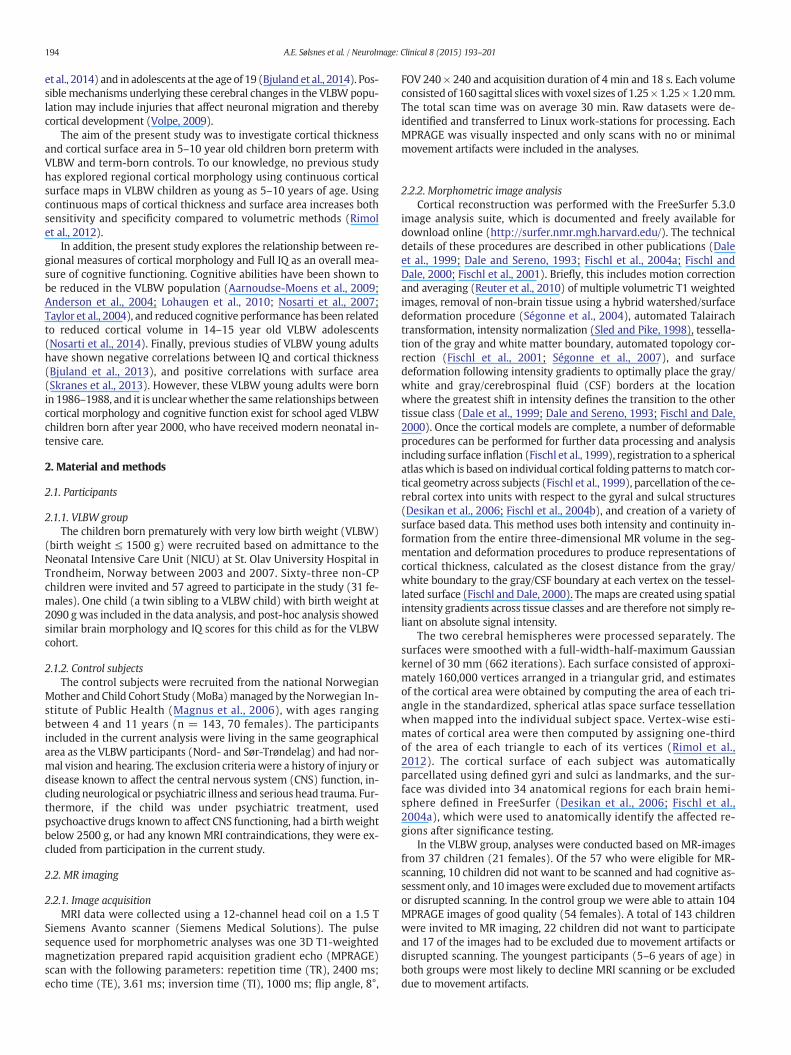
Fig. 1. Statistical p-maps showing cortical regions with significant differences in surface area between the VLBWand the control groups. Themapswere produced fromGLMmodels fittedat each location (vertex) across the cortical surface, with cortical area as the dependent variable and group as the independent variable, co-varying for sex and age at scan. Themapswerethresholded to yield an expected 5% FDR across both hemispheres. The red to yellow regions are those where the VLBWgroup showed reduced surface area, whereas blue regions wouldreflect areas with increased surface area in the VLBW group compared to controls. Abbreviations: FDR, false discovery rate; GLM, general linear model; VLBW, very low birth weight.
197A.E. Sølsnes et al. / NeuroImage: Clinical 8 (2015) 193–201
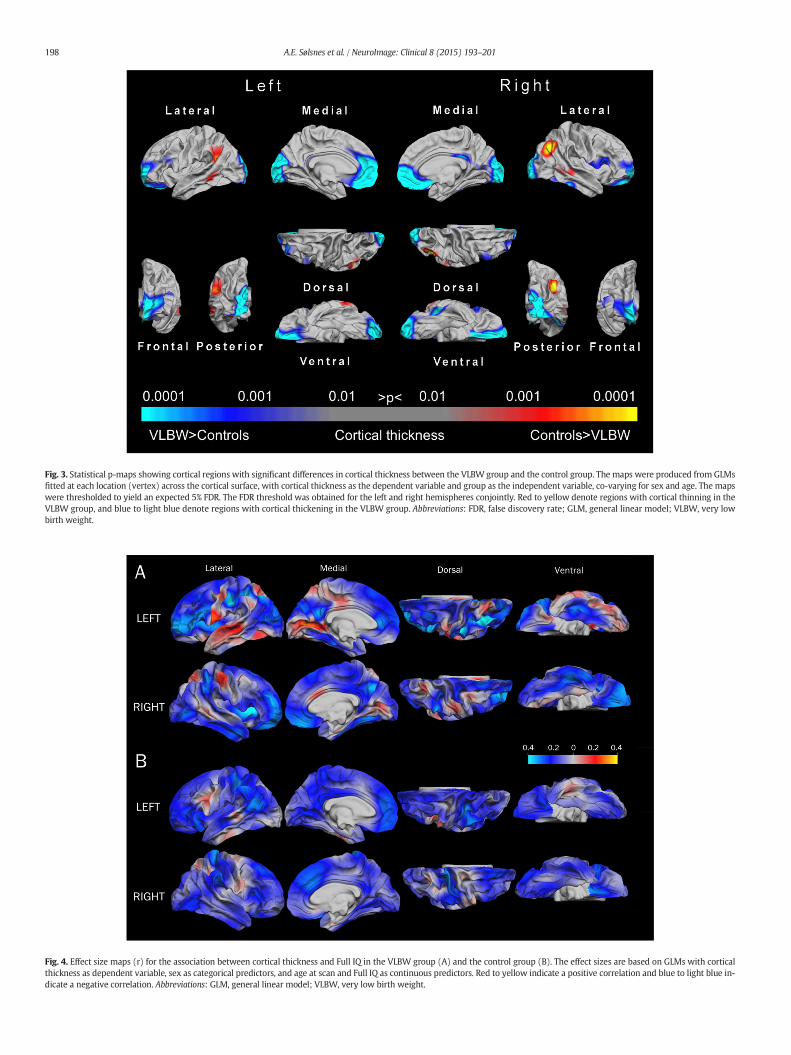
Fig. 4. Effect size maps (r) for the association between cortical thickness and Full IQ in the VLBW group (A) and the control group (B). The effect sizes are based on GLMs with corticalthickness as dependent variable, sex as categorical predictors, and age at scan and Full IQ as continuous predictors. Red to yellow indicate a positive correlation and blue to light blue in-dicate a negative correlation. Abbreviations: GLM, general linear model; VLBW, very low birth weight.
Fig. 3. Statistical p-maps showing cortical regions with significant differences in cortical thickness between the VLBW group and the control group. The maps were produced from GLMsfitted at each location (vertex) across the cortical surface, with cortical thickness as the dependent variable and group as the independent variable, co-varying for sex and age. The mapswere thresholded to yield an expected 5% FDR. The FDR threshold was obtained for the left and right hemispheres conjointly. Red to yellow denote regions with cortical thinning in theVLBW group, and blue to light blue denote regions with cortical thickening in the VLBW group. Abbreviations: FDR, false discovery rate; GLM, general linear model; VLBW, very lowbirth weight.
198 A.E. Sølsnes et al. / NeuroImage: Clinical 8 (2015) 193–201
199A.E. Sølsnes et al. / NeuroImage: Clinical 8 (2015) 193–201
factors such as inflammation that exert an epigenetic influence on thegenes controlling normal cortical development.
Performing the analyses of group differences in cortical surface areawithout the two childrenwho had extreme scores on days on ventilator(32 and 45 days), did not affect the results. Excluding children who hadbeen on ventilator for more than 10 days, in order to exclude a possibleeffect of prolonged respiratory support on cortical surface area, we ob-served similar group differences in cortical morphometry as for the fullsample, albeit with reduced effect sizes in most regions. However, ex-cluding childrenwithmore than 10 days on ventilator implies excludingmany of themost immature and sickest individuals, and leaves uswith asample that is not representative of the premature birth population.Nonetheless, it is worth noting that even when subjects with prolongedrespiratory support were excluded, a number of cortical regions stillshowed group differences. One could speculate whether this may reflectadverse prenatal factors, since these regions show cortical deviationseven in the individuals who require the least amount of neonatal care.
4.2. Frontal and occipital cortical thickening in VLBW children
TheVLBWchildren showed thicker cortex in the frontal andoccipitallobes bilaterally, which is consistent with previous studies reporting in-creased cortical thickness in both children and adolescents born prema-turely (Bjuland et al., 2013; Grunewaldt et al., 2014; Martinussen et al.,2005; Mürner-Lavanchy et al., 2014; Phillips et al., 2011). With normaldevelopment of the cerebral cortex, thickness will increase duringearly childhood due to late arriving interneurons then decrease, due topruning, as neural connectivity improves (Raznahan et al., 2011; Shawet al., 2012; Wierenga et al., 2014). Sowell et al. (2004) reported thatthe pattern of progressive cortical thinning varies across development,in a longitudinal study of normally developing children 5–11 yearsold, observing a significant cortical thinning in the dorsolateral frontalregions and bilateral parietal–occipital regions, and cortical thickeningin perisylvian regions of the ventral frontal lobe and superior temporallobe with increasing age.
Children develop at varying paces and one possible explanation forthe group differences in cortical thickness in our study is delayedmatu-ration in the VLBW group. This would be consistent with Mürner-Lavancy3s (2014) study of VLBW children and term-born controls,7–12 years old, which reported thicker frontal and parietal cortices inthe youngest VLBW children compared to controls but no such groupdifference in the oldest children. Also partly consistent with this,Grunewaldt et al. (2014) found cortical thickness differences exclusive-ly in the occipital lobe at 10 years of age in a cohort of ELBW. On theother hand, Bjuland et al. (2013) found increased cortical thickness infrontal and occipital regions, but also thinner cortex in frontal, parietaland temporal regions, in 19 year old VLBW adolescents. Thus, it is un-clearwhether the differences observed in the present study reflect aber-rant development and permanent cortical changes or, rather, divergentdevelopmental cortical trajectories that converge with increasing age.Longitudinal studies are needed to answer such questions, in order toconclusively determine whether VLBW children born after 2000 havepermanent changes in cortical thickness similar to what has been re-ported for children born in the late 80s.
4.3. The relationship between cortical surface area and thickness
Panizzon et al. (2009) demonstrated that cortical area and corticalthickness reflect at least two distinct sources of genetic influence, con-sistent with the developmental origin of cortical architecture describedby the radial unit hypothesis (Rakic, 1988), and other studies have sug-gested independent and divergent developmental trajectories for areaand thickness (Raznahan et al., 2011; Shaw et al., 2012; Wierengaet al., 2014). In line with this, we found that regions displaying groupdifferences in surface area and cortical thickness overlapped to a limited
extent (as shown in Fig. A4). Regions displaying overlapping effectsweremainly located on themesial aspect of the hemispheres; anteriorlyin the anterior portion of the SFG, medial orbitofrontal cortex, and ante-rior cingulate, and posteriorly in the pericalcarine sulcus and cuneus.
The VLBW children in the present study were born between 23 and35 weeks of gestation, which is a particularly sensitive period of neuralmigration and rapid cortical development. Disorders of migration aremore likely to occur in the second trimester (Zhang et al., 2013) by ei-ther under-migration or over-migration of neurons, and both will leadto cortical abnormalities (Fogliarini et al., 2005). Preterm birth may af-fect processes like neuronal migration, synaptogenesis and apoptosislate in the 2nd and early 3rd trimesters (Tau and Peterson, 2010)resulting in the kind of deviant cortical thickness and reduced surfacearea observed here.
The migration of neuroprogenitor cells may be hindered in pretermchildren by germinal matrix hemorrhages that can destroy neuronalprecursors, or by injury to guiding glial cells (Volpe, 2009). A reducedpool of neuroprogenitor cells and deficient migration can lead to a re-duced number of founder cells in the ventricular zone and number ofcerebral columns, which may result in decreased surface area (Rakic,1995). However, in our study only three out of 37 VLBW children hadintraventricular hemorrhages and none had focal PVL, suggesting thatfocal perinatal brain injury is probably not the cause of the cortical devi-ations seen in our VLBW group.
Within 28–32 weeks of gestation a fast emergence of short-rangeconnectivity, in addition to the long-range association pathways, is ob-served (Takahashi et al., 2012). In the VLBW population, reduced frac-tional anisotropy has been reported in the inferior longitudinal andthe longitudinal occipito-frontal fascicles (Eikenes et al., 2011; Skraneset al., 2007). Whether diffuse white matter injury causing disruptedconnectivity and cortical reorganization leads to reductions in surfacearea and increased cortical thickness in the VLBW is not known, but can-not be excluded as an explanation for the presently observed corticalchanges. The frontal, parietal and occipital regions with deviant corticalsurface area and/or increased thickness in the VLBW children are all re-gions involved in networks receiving long-range association tracts. Wetherefore speculate that the deviations seen in cortical morphology inthe VLBW group may be both primary changes due to corticalmaldevelopment as well as secondary to altered white matter micro-structure and connectivity.
4.4. Cortical morphology and cognitive measures
A positive association between cortical surface area and IQ was ob-served in both VLBW and control subjects, albeit as a non-significanttrend in the VLBW group. However, the magnitude of the effect waslarger in frontal, temporal and medial parietal regions in the VLBWgroup than that in the control group, although these structure–functionassociations survived significance testing only in the control group dueto its larger sample size.
The frontal regions inwhich surface areawas relatedwith IQ includ-ed the caudal middle frontal gyrus, lateral orbitofrontal gyrus, medialorbitofrontal gyrus, pars orbitalis, rostral anterior cingulate, frontalpole and insula. These are regionswhere the VLBWchildren have signif-icantly reduced surface area in comparison with controls, and are be-lieved to be important for cognitive functions such as decision making,executive functions, semantics, attention, and working memory. Previ-ous studies have consistently shown poorer executive abilities in indi-viduals born with VLBW than term-born peers, as well as problemswith attention and working memory (Aarnoudse-Moens et al., 2009;Bayless and Stevenson, 2007; Anderson, 2014; Lohaugen et al.,2010;Anderson et al., 2004), and in the present study, the VLBWgroup had lower IQ scores than those of the controls. Our results indi-cate that a larger surface area is positively correlated to higher IQ, con-sistent with Skranes et al. (2013), and it is tempting to speculate that
200 A.E. Sølsnes et al. / NeuroImage: Clinical 8 (2015) 193–201
reduced cognitive function in the VLBWgroupmay be caused, at least inpart, by the observed reduction in surface area.
There was a negative association, albeit not significant, between IQand cortical thickness in both groups. In the VLBW group, the regionswith the strongest negative associations between IQ and cortical thick-ness were also the regions where the VLBW children displayed thickercortex than controls. This is consistent with previous studies of the rela-tionship between cortical thickness and cognitive functions in normallydeveloping 5–11 year old children, where cortical thinning in the leftdorsal frontal and parietal lobes was correlated with improved verbalperformance (Sowell et al., 2004). Moreover, in VLBW adolescentswith low IQ, Full IQ and cortical thickness were negatively correlatedin the frontal and positively correlated in the parietal lobes (Bjulandet al., 2013). Taken together, our findings suggest that altered corticaldevelopment in VLBW children seems to affect their cognitive abilities;however, longitudinal studies are needed to determine whether thesedeviations persist during further brain maturation throughout schoolage, adolescence and into early adulthood also for these recent year co-horts of VLBW children.
4.5. Conclusion
The present study demonstrates altered development of cortical sur-face and cortical thickness in VLBW children born in 2003–2007, andthese deviations are associated with poorer cognitive abilities. Thepresent brain morphological deviations are evident even in VLBW chil-dren without cerebral palsy who have received state of the art medicaltreatment in the perinatal period, and who did not present with focalbrain injuries on neonatal ultrasonography.
Conflicts of interest
The authors declare no competing financial interests.
Acknowledgments
We thank the children and their parents for participating in thestudy. We also want to thank our project collaborators Profs. KristineB. Walhovd and Anders M. Fjell at the Department of Psychology,University of Oslo, Norway. This study received funding from theResearch Council of Norway (Frimed program — project number204935/F20).
Appendix A. Supplementary data
Supplementary data to this article can be found online at http://dx.doi.org/10.1016/j.nicl.2015.04.004.
References
Aarnoudse-Moens, C.S.H., Weisglas-Kuperus, N., van Goudoever, J.B., Oosterlaan, J., 2009.Meta-analysis of neurobehavioral outcomes in very preterm and/or very low birthweight children. Pediatrics 124 (2), 717–728. http://dx.doi.org/10.1542/peds.2008-281619651588.
Ajayi-Obe, M., Saeed, N., Cowan, F.M., Rutherford, M.A., Edwards, A.D., 2000. Reduced de-velopment of cerebral cortex in extremely preterm infants. Lancet 356 (9236),1162–1163. http://dx.doi.org/10.1016/S0140-6736(00)02761-611030298.
Anderson, P.J., 2014. Neuropsychological outcomes of children born very preterm. Semin.Fetal Neonat. Med. 19, 90–9624361279.
Anderson, P.J., Doyle, L.W., Victorian Infant Collaborative Study Group, 2004. Executivefunctioning in school-aged children who were born very preterm or with extremelylow birth weight in the 1990s. Pediatrics 114 (1), 50–57. http://dx.doi.org/10.1542/peds.114.1.5015231907.
Ball, G., Srinivasan, L., Aljabar, P., Counsell, S.J., Durighel, G., Hajnal, J.V., Rutherford, M.A.,Edwards, A.D., 2013. Development of cortical microstructure in the preterm humanbrain. Proc. Natl. Acad. Sci. U. S. A 110 (23), 9541–9546. http://dx.doi.org/10.1073/pnas.130165211023696665.
Bayless, S., Stevenson, J., 2007. Executive functions in school-age children born very pre-maturely. Early Hum. Dev. 83 (4), 247–25416837146.
Grunewaldt, K.H., Fjørtoft, T., Bjuland, K.J., Brubakk, A.-M., Eikenes, L., Håberg, A.K.,Løhaugen, G.C., Skranes, J., 2014. Follow-up at age 10 years in ELBW children —functional outcome, brain morphology and results from motor assessments in infan-cy. Early Hum. Dev. 90 (10), 571–578. http://dx.doi.org/10.1016/j.earlhumdev.2014.07.00525103790.
Bjuland, K.J., Løhaugen, G.C.C., Martinussen, M., Skranes, J., 2013. Cortical thicknessand cognition in very-low-birth-weight late teenagers. Early Hum. Dev. 89 (6),371–380. http://dx.doi.org/10.1016/j.earlhumdev.2012.12.00323273486.
Bjuland, K.J., Rimol, L.M., Løhaugen, G.C.C., Skranes, J., 2014. Brain volumes and cognitivefunction in very-low-birth-weight (VLBW) young adults. Eur. J. Paediatr. Neurol. 18(5), 578–590. http://dx.doi.org/10.1016/j.ejpn.2014.04.00424775377.
Brown, T.T., Jernigan, T.L., 2012. Brain development during the preschool years.Neuropsychol. Rev. 22 (4), 313–333. http://dx.doi.org/10.1007/s11065-012-9214-123007644.
Dale, A.M., Fischl, B., Sereno, M.I., 1999. Cortical surface-based analysis. I. Segmentationand surface reconstruction. Neuroimage 9 (2), 179–194. http://dx.doi.org/10.1006/nimg.1998.03959931268.
Dale, A.M., Sereno, M.I., 1993. Improved localization of cortical activity by combining EEGand MEG with MRI cortical surface reconstruction: a linear approach. J. Cogn.Neurosci. 5 (2), 162–176. http://dx.doi.org/10.1162/jocn.1993.5.2.16223972151.
Desikan, R.S., Ségonne, F., Fischl, B., Quinn, B.T., Dickerson, B.C., Blacker, D., Buckner, R.L.,Dale, A.M., Maguire, R.P., Hyman, B.T., Albert, M.S., Killiany, R.J., 2006. An automatedlabeling system for subdividing the human cerebral cortex on MRI scans into gyralbased regions of interest. Neuroimage 31 (3), 968–980. http://dx.doi.org/10.1016/j.neuroimage.2006.01.02116530430.
Eikenes, L., Løhaugen, G.C., Brubakk, A.M., Skranes, J., Håberg, A.K., 2011. Young adultsborn preterm with very low birth weight demonstrate widespread white matter al-terations on brain DTI. Neuroimage 54 (3), 1774–1785. http://dx.doi.org/10.1016/j.neuroimage.2010.10.03720965255.
Fischl, B., Dale, A.M., 2000. Measuring the thickness of the human cerebral cortex frommagnetic resonance images. Proc. Natl. Acad. Sci. U. S. A 97 (20), 11050–11055.http://dx.doi.org/10.1073/pnas.20003379710984517.
Fischl, B., Liu, A., Dale, A.M., 2001. Automatedmanifold surgery: constructing geomet-rically accurate and topologically correct models of the human cerebral cortex. I.E.E.E. Transactions Med. Imaging 20 (1), 70–80. http://dx.doi.org/10.1109/42.90642611293693.
Fischl, B., Salat, D.H., Van Der Kouwe, A.J.W., Makris, N., Ségonne, F., Quinn, B.T., Dale, A.M.,2004a. Sequence-independent segmentation of magnetic resonance images.Neuroimage 23 (Suppl. 1), S69–S84. http://dx.doi.org/10.1016/j.neuroimage.2004.07.01615501102.
Fischl, B., Sereno, M.I., Dale, A.M., 1999. Cortical surface-based analysis. II: inflation, flat-tening, and a surface-based coordinate system. Neuroimage 9 (2), 195–207. http://dx.doi.org/10.1006/nimg.1998.03969931269.
Fischl, B., Sereno, M.I., Tootell, R.B.H., Dale, A.M., 1999. High-resolution intersubject aver-aging and a coordinate system for the cortical surface. Hum. Brain Mapp. 8 (4),272–284. http://dx.doi.org/10.1002/(SICI)1097-0193(1999)8:4b272::AID-HBM10N3.0.CO;2-410619420.
Fischl, B., Van Der Kouwe, A., Destrieux, C., Halgren, E., Ségonne, F., Salat, D.H., Busa, E.,Seidman, L.J., Goldstein, J., Kennedy, D., Caviness, V., Makris, N., Rosen, B., Dale,A.M., 2004b. Automatically parcellating the human cerebral cortex. Cereb. Cortex14 (1), 11–22. http://dx.doi.org/10.1093/cercor/bhg08714654453.
Fogliarini, C., Chaumoitre, K., Chapon, F., Fernandez, C., Lévrier, O., Figarella-Branger, D.,Girard, N., 2005. Assessment of cortical maturation with prenatal MRI. Part I: normalcortical maturation. Eur. Radiol. 15 (8), 1671–1685. http://dx.doi.org/10.1007/s00330-005-2782-115856237.
Frye, R.E., Malmberg, B., Swank, P., Smith, K., Landry, S., 2010. Preterm birth and maternalresponsiveness during childhood are associated with brain morphology inadolescence. J Int Neuropsychol Soc 16 (5), 784–794. http://dx.doi.org/10.1017/S135561771000058520609271.
Hollingshead, A.d.B., 1975. Four Factor Index of Social Status. Yale Univ., Department ofSociology.
Kapellou, O., Counsell, S.J., Kennea, N., Dyet, L., Saeed, N., Stark, J., et al., 2006. Abnormalcortical development after premature birth shown by altered allometric scaling ofbrain growth. PLOS Med. 3 (8), e265. http://dx.doi.org/10.1371/journal.pmed.003026516866579.
Løhaugen, G.C., Gramstad, A., Evensen, K.A., Martinussen, M., Lindqvist, S., Indredavik, M.,Vik, T., Brubakk, A.M., Skranes, J., 2010. Cognitive profile in young adults born pre-term at very low birthweight. Dev. Med. Child Neurol. 52 (12), 1133–1138. http://dx.doi.org/10.1111/j.1469-8749.2010.03743.x21175467.
Magnus, P., Irgens, L.M., Haug, K., Nystad, W., Skjærven, R., Stoltenberg, C., MoBa StudyGroup, 2006. Cohort profile: the Norwegian Mother and Child Cohort Study(MoBa). International. J. Epidemiol. 35 (5), 1146–1150. http://dx.doi.org/10.1093/ije/dyl17016926217.
Martinussen, M., Fischl, B., Larsson, H.B., Skranes, J., Kulseng, S., Vangberg, T.R., Vik, T.,Brubakk, A.M., Haraldseth, O., Dale, A.M., 2005. Cerebral cortex thickness in 15-year-old adolescents with low birthweightmeasured by an automatedMRI-basedmethod.Brain 128 (11), 2588–2596. http://dx.doi.org/10.1093/brain/awh61016123146.
Mürner-Lavanchy, I., Steinlin, M., Nelle, M., Rummel, C., Perrig, W.J., Schroth, G., Everts, R.,2014. Delay of cortical thinning in very preterm born children. Early Hum. Dev. 90(9), 443–450. http://dx.doi.org/10.1016/j.earlhumdev.2014.05.013.
Nosarti, C., Giouroukou, E., Micali, N., Rifkin, L., Morris, R.G., Murray, R.M., 2007. Impairedexecutive functioning in young adults born very preterm. J Int Neuropsychol Soc 13(4), 571–581. http://dx.doi.org/10.1017/S135561770707072517521479.
Nosarti, C., Nam, K.W., Walshe, M., Murray, R.M., Cuddy, M., Rifkin, L., Allin, M.P.G., 2014.Preterm birth and structural brain alterations in early adulthood. Neuroimage Clin. 6,180–191. http://dx.doi.org/10.1016/j.nicl.2014.08.00525379430.
201A.E. Sølsnes et al. / NeuroImage: Clinical 8 (2015) 193–201
Panizzon, M.S., Fennema-Notestine, C., Eyler, L.T., Jernigan, T.L., Prom-Wormley, E., Neale,M., Jacobson, K., Lyons, M.J., Grant, M.D., Franz, C.E., Xian, H., Tsuang, M., Fischl, B.,Seidman, L., Dale, A., Kremen, W.S., 2009. Distinct genetic influences on cortical sur-face area and cortical thickness. Cereb. Cortex 19 (11), 2728–2735. http://dx.doi.org/10.1093/cercor/bhp02619299253.
Phillips, J.P., Montague, E.Q., Aragon, M., Lowe, J.R., Schrader, R.M., Ohls, R.K., Caprihan, A.,2011. Prematurity affects cortical maturation in early childhood. Pediatr. Neurol. 45(4), 213–219. http://dx.doi.org/10.1016/j.pediatrneurol.2011.06.00121907880.
Rakic, P., 1988. Specification of cerebral cortical areas. Science 241 (4862), 170–176.http://dx.doi.org/10.1126/science.32911163291116.
Rakic, P., 1995. A small step for the cell, a giant leap for mankind: a hypothesis of neocor-tical expansion during evolution. Trends Neurosci. 18 (9), 383–388. http://dx.doi.org/10.1016/0166-2236(95)93934-P7482803.
Raznahan, A., Shaw, P., Lalonde, F., Stockman, M., Wallace, G.L., Greenstein, D., Clasen, L.,Gogtay, N., Giedd, J.N., 2011. How does your cortex grow? J. Neurosci. 31 (19),7174–7177. http://dx.doi.org/10.1523/JNEUROSCI.0054-11.201121562281.
Reuter, M., Rosas, H.D., Fischl, B., 2010. Highly accurate inverse consistent registration: arobust approach. Neuroimage 53 (4), 1181–1196. http://dx.doi.org/10.1016/j.neuroimage.2010.07.02020637289.
Rimol, L.M., Nesvåg, R., Hagler Jr, D.J., Bergmann, O., Fennema-Notestine, C., Hartberg, C.B.,Haukvik, U.K., Lange, E., Pung, C.J., Server, A., Melle, I., Andreassen, O.A., Agartz, I.,Dale, A.M., 2012. Cortical volume, surface area, and thickness in schizophrenia and bi-polar disorder. Biol. Psychiatry 71 (6), 552–560. http://dx.doi.org/10.1016/j.biopsych.2011.11.02622281121.
Ségonne, F., Dale, A.M., Busa, E., Glessner, M., Salat, D., Hahn, H.K., Fischl, B., 2004. A hybridapproach to the skull stripping problem in MRI. Neuroimage 22 (3), 1060–1075.http://dx.doi.org/10.1016/j.neuroimage.2004.03.03215219578.
Ségonne, F., Pacheco, J., Fischl, B., 2007. Geometrically accurate topology-correction of cor-tical surfaces using nonseparating loops. I. E.E.E. Transactions Med. Imaging 26 (4),518–529. http://dx.doi.org/10.1109/TMI.2006.88736417427739.
Shaw, P., Malek, M., Watson, B., Sharp, W., Evans, A., Greenstein, D., 2012. Development ofcortical surface area andgyrification in attention-deficit/hyperactivity disorder. Biol. Psy-chiatry 72 (3), 191–197. http://dx.doi.org/10.1016/j.biopsych.2012.01.03122418014.
Skranes, J., Løhaugen, G.C.C., Martinussen, M., Håberg, A., Brubakk, A.M., Dale, A.M., 2013.Cortical surface area and IQ in very-low-birth-weight (VLBW) young adults. Cortex49 (8), 2264–2271. http://dx.doi.org/10.1016/j.cortex.2013.06.00123845237.
Skranes, J., Vangberg, T.R., Kulseng, S., Indredavik, M.S., Evensen, K.A.I., Martinussen, M.,Dale, A.M., Haraldseth, O., Brubakk, A.M., 2007. Clinical findings and white matter ab-normalities seen on diffusion tensor imaging in adolescents with very low birthweight. Brain 130 (3), 654–666. http://dx.doi.org/10.1093/brain/awm00117347255.
Sled, J.G., Pike, G.B., 1998. Standing-wave and RF penetration artifacts caused by ellipticgeometry: an electrodynamic analysis of MRI. I. E.E.E. Transactions Med. Imaging 17(4), 653–662. http://dx.doi.org/10.1109/42.7304099845320.
Sowell, E.R., Thompson, P.M., Leonard, C.M., Welcome, S.E., Kan, E., Toga, A.W., 2004. Lon-gitudinal mapping of cortical thickness and brain growth in normal children.J. Neurosci. 24 (38), 8223–8231. http://dx.doi.org/10.1523/JNEUROSCI.1798-04.200415385605.
Takahashi, E., Folkerth, R.D., Galaburda, A.M., Grant, P.E., 2012. Emerging cerebral connec-tivity in the human fetal brain: an MR tractography study. Cereb. Cortex 22 (2),455–464. http://dx.doi.org/10.1093/cercor/bhr12621670100.
Tau, G.Z., Peterson, B.S., 2010. Normal development of brain circuits. Neuro-psychopharmacology 35 (1), 147–168. http://dx.doi.org/10.1038/npp.2009.11519794405.
Taylor, H.G., Minich, N.M., Klein, N., Hack, M., 2004. Longitudinal outcomes of very lowbirth weight: neuropsychological findings. J Int Neuropsychol Soc 10 (2), 149–163.http://dx.doi.org/10.1017/S135561770410203815012835.
Volpe, J.J., 2009. Brain injury in premature infants: a complex amalgam of destructive anddevelopmental disturbances. Lancet Neurol. 8 (1), 110–124. http://dx.doi.org/10.1016/S1474-4422(08)70294-119081519.
Wechsler, D., 1999. Wechsler Abbreviated Scale of Intelligence. Pearson, San Antonio.Wechsler, D., 2002. Wechsler Preschool and Primary Scale of Intelligence— Third Edition
Norwegian version, 2008 edition. Pearson, San Antonio.Wechsler, D., 2003. Wechsler Intelligence Scale for Children fourth edition. Pearson,
London (Norweigan version, 2009 Ed.).Wierenga, L.M., Langen, M., Oranje, B., Durston, S., 2014. Unique developmental trajecto-
ries of cortical thickness and surface area. Neuroimage 87, 120–126. http://dx.doi.org/10.1016/j.neuroimage.2013.11.01024246495.
Zhang, J., Zhang, J., Zhou, Y., Wu, Y.J., Ma, L., Wang, R.J., Huang, S.Q., Gao, R.R., Liu, L.H.,Shao, Z.H., Shi, H.J., Cheng, L.M., Yu, L., 2013. Novel cerebellum-enriched miR-592may play a role in neural progenitor cell differentiation and neuronal maturationthrough regulating Lrrc4c and Nfasc in rat. Curr. Mol. Med. 13 (9), 1432–1445.http://dx.doi.org/10.2174/1566524011313999007223971736.