Business models for distributed generation in a liberalized market environment
18
1 Business Models for Distributed Generation In a Liberalized Market Environment Jaap Gordijn and Hans Akkermans Free University Amsterdam VUA Faculty of Sciences, Business Informatics FEW/BI De Boelelaan 1081a NL-1081 HV Amsterdam The Netherlands Submission to the Electric Power Systems Research journal, July 2004 Corresponding author: Jaap Gordijn, [email protected] , Tel. +31 20 444 7769/7718 Abstract. The analysis of the potential of emerging innovative technologies calls for a systems-theoretic approach that takes into account technical as well as socio-economic factors. This paper reports the main findings of several business case studies of different future applications in various countries of distributed power generation technologies, all based on a common methodology for networked business modeling and analysis. Keywords: distributed generation, technological innovation, networked business modeling and analysis. 1 Introduction The successful introduction into society of innovative technologies generally depends on a wide variety of technological as well as socio-economic factors [1]. Accordingly, there is a consensus now in many areas of complex systems engineering that requirements specification and analysis should take into account both technical and business requirements [2-5]. Emerging distributed power generation technologies, variously referred to as Distributed Generation (DG) or Distributed Energy Resources (DER), are no exception to this rule. The analysis of their future potential calls for a systems-theoretical approach that involves analysis of their general technical characteristics [6], consideration of the broader strategic contexts and scenarios in which technologies will function [7, 8], and of the business models [9] that are to make innovative technologies economically sustainable beyond their research and development stage. The contribution of this paper is to consider the economic side of the introduction of new DG technologies, by investigating business requirements and models for different forms and applications of DG. Like many industries, the power and utility sector is no longer characterized by a linear value chain [10] – from generation, transmission, and distribution to the final customer. Instead, value chains are now becoming more complex value constellations in which enterprises are collaborating and competing in networks [9, 11]. In the power sector this is caused by a combination of factors, including the steady progress of distributed generation technologies, the increasing penetration of advanced information and communication systems and technologies (that, like the Internet and Web, are usually also distributed and tend to lead to decentralization) to manage an increasingly complex grid, and on top of this the ongoing industry restructuring and market liberalization in many countries. As a result, DG
Transcript of Business models for distributed generation in a liberalized market environment

1
Business Models for Distributed Generation
In a Liberalized Market Environment
Jaap Gordijn and Hans Akkermans
Free University Amsterdam VUA Faculty of Sciences, Business Informatics FEW/BI
De Boelelaan 1081a NL-1081 HV Amsterdam
The Netherlands
Submission to the Electric Power Systems Research journal, July 2004 Corresponding author: Jaap Gordijn, [email protected], Tel. +31 20 444 7769/7718
Abstract. The analysis of the potential of emerging innovative technologies calls for a systems-theoretic approach that takes into account technical as well as socio-economic factors. This paper reports the main findings of several business case studies of different future applications in various countries of distributed power generation technologies, all based on a common methodology for networked business modeling and analysis. Keywords: distributed generation, technological innovation, networked business modeling and analysis.
1 Introduction The successful introduction into society of innovative technologies generally depends on a wide variety of technological as well as socio-economic factors [1]. Accordingly, there is a consensus now in many areas of complex systems engineering that requirements specification and analysis should take into account both technical and business requirements [2-5]. Emerging distributed power generation technologies, variously referred to as Distributed Generation (DG) or Distributed Energy Resources (DER), are no exception to this rule. The analysis of their future potential calls for a systems-theoretical approach that involves analysis of their general technical characteristics [6], consideration of the broader strategic contexts and scenarios in which technologies will function [7, 8], and of the business models [9] that are to make innovative technologies economically sustainable beyond their research and development stage. The contribution of this paper is to consider the economic side of the introduction of new DG technologies, by investigating business requirements and models for different forms and applications of DG. Like many industries, the power and utility sector is no longer characterized by a linear value chain [10] – from generation, transmission, and distribution to the final customer. Instead, value chains are now becoming more complex value constellations in which enterprises are collaborating and competing in networks [9, 11]. In the power sector this is caused by a combination of factors, including the steady progress of distributed generation technologies, the increasing penetration of advanced information and communication systems and technologies (that, like the Internet and Web, are usually also distributed and tend to lead to decentralization) to manage an increasingly complex grid, and on top of this the ongoing industry restructuring and market liberalization in many countries. As a result, DG

2
technologies must be economically analyzed in terms of networked business models that are sustainable in a liberalized market environment. We have developed a systematic methodology for constructing and assessing such new networked business models [5, 9, 12-14], called BusMod, and applied this to a number of different case studies and scenarios where DG technologies may be successfully applied in the future. The present paper discusses the key findings of these studies, which cover the economic potential of DG for dynamic demand response at peak hours packaged as a new business service, the market feasibility of small-scale local producers of renewable power, the usage of DG in grid balancing services, and in the active management of distribution networks. In Sections 2-5 we present the major, qualitative and quantitative, results from four different case studies on DG business models from, respectively, Spain, Norway, The Netherlands, and the United Kingdom. In Section 6, we outline some of the methodological background of the employed BusMod methodology for networked business modeling and analysis. Section 7 summarizes the key socio-economic conclusions for DG and some suggestions for further research.
2 Case Study A: Distributed Generation Energy Services to Shift Demand In Peak Hours
2.1 Case Introduction The Spanish electricity market is fully liberalized since the 1st of January 2003. This liberalization resulted in 40,000 small customers changing supplier over the whole of 2003. Moreover, a strong increase of customers changing supplier took place during the first two months of 2004, which resulted in 60,000 additional customers changing supplier. So, 100,000 customers changed their supplier in just over one year since the liberalization of the market took off. The energy consumption in Spain has experienced an accumulated increase of 34% between 1996 and 2002, and this trend is expected to continue for several years to come, at about a 4% increase per year. The currently installed electricity generation capacity is 56,000 MW, but the available peak capacity is 35,000 MW. This situation, together with the increase in consumption, resulted in some days in 2003 in which the demand was equal to the available generation capacity, so that some curtailment actions had to take place. Several alternatives exist to solve the power shortage problem, such as increasing the generation capacity, reducing the consumption by increasing the efficiency of the equipment, managing the demand, or a combination of these mechanisms. In Spain, this trend has led to installment of additional generation capacity: 40,000 MW of combined cycle power plants and 50,000 MW of additional wind generation. However, the combined cycle plants increase the external dependency on gas, and wind generation faces the well-known problems of intermittence and of forecasting difficulties. Therefore, it is of interest to investigate alternative business scenarios that aim to influence the demand in a market-compatible fashion. The business idea here is that the electricity bill that a customer has to pay can be reduced by shifting part of the demand to low price periods, and furthermore by using own generation when the prices of the electricity are high. At the same time, this load shifting will yield the additional benefit of reducing the needed capacity that must be available at peak periods.

3
2.2 Business Scenario The success of this demand management scenario requires the involvement of several different actors. First of all, there should be an aggregator, a supplier that within this scenario has several responsibilities and roles: − Grouping customers and participating in the wholesale market to get the lowest possible
prices. − Shifting and managing the movable loads of the customers to hours with a low electricity
price. − Planning the use of the Distributed Generators when the associated cost is lower than the
market prices. Thus, the key role of the aggregator is that it acts not just as an electricity supplier, but as a company that provides a bundle of services to the final customers, with the objective of achieving lower prices for them. Second, as major actors (actually a market segment) we have the customers, who in this business scenario are enterprises that not only consume electricity at the planned hours, but also own and maintain local distributed generation capacity. Finally, other actors are necessary to complete the scenario, in order of importance: a regulator, the Distribution System Operator (DSO), the Transmission System Operator (TSO), the Conventional Generator (CG) and the Market Operator (MO). Our studies show that the regulator is another key actor in this DG/DER scenario, being in charge of collecting the taxes related to the promotion of distributed generation, renewables and demand-oriented measures. The demand shifting scenario itself is general and applicable to many regions and countries. For numerical calculations of the feasibility of the business model, however, it has to be specialized to a specific situation, in the present case to the framework for electricity regulation in the Spanish market and its status of full liberalization.
The Spanish market, although fully liberalized, currently does not show a reduction in the price of the energy generation market (unlike the UK and other countries). As a consequence, the profit margin for the suppliers is small. This may be due to the short time elapsed since full liberalization was put into operation, and to the fact that most generation in Spain is controlled by just a few companies, thus reducing the possibilities for competition. This situation of low price volatility reduces the opportunities for load shifting at this moment in Spain compared to other countries, but even under these conditions our business analysis shows the potential of the scenario.
2.3 Business Analysis The analysis has taken into account three different types of DG technologies that could be used for generating electricity: MicroHydraulic, PhotoVoltaic and MicroTurbine. Every one of these has different characteristics, such as investment cost, expected lifetime, and availability. The data used for the base case of the scenario are those shown in Table 1. Table 1: Data for analyzing shifts in peak demands. Number of tariff customers 100,000Number of retail customers 10,000Average capacity 3.3 kWAverage consumption 10.606 kWh/dayOver-price of retail (%) 10%Scheduling price 1 €/monthControl price 1 €/monthCost of metering database 1 €/monthO&M ICT 1 €/monthScenario specific characteristics Scenario Hydro PV MicroturbineCapacity (kW) 10 5 25

4
Availability (%) 40% 21% 94%Premium (€/kWh) 0.029464 0.360610 0.021276Efficiency (%) - - 30%O&M costs (€/kWh) 0.013327 0.050064 0.002
Based on the above business model characteristics, we performed calculations concerning the expected feasibility of the demand shifting scenario as a potential energy service. One result of these calculations is that load shifting will reduce the electricity bill of a final customer by 15%, taking into account the current situation of the Spanish market. These savings are expected to be higher with a more mature electricity market. The reduction in the electricity bill, nonetheless, is on average not enough to fully pay the planning and control services to be provided by the aggregator. This means that a demand shifting service should not be independently positioned as a key income source; rather, the revenue of the aggregator is to be claimed from the complete bundle of services offered: electricity supply, aggregation, scheduling and metering.
The use of DG to cover own consumption in peak hours is not in itself profitable for the customer due to the under-utilization of the equipment and the current characteristics of the regulatory regime in Spain. Customers’ ownership of distributed generators becomes profitable, if the energy generated is sold to the market or to the DSO. In the case of microturbines, to obtain financial benefits from their use, the thermal energy generated has to be used too. Within the three alternatives of energy generation analysed in this scenario (MicroHydraulic, PhotoVoltaic and MicroTurbine) the greatest Interest Rate of Return is obtained by using MicroHydraulics, followed by PhotoVoltaics and finally MicroTurbines (see Figure 1, that gives Net Present Value (NPV) calculations for these DG technologies).
Comparison of different technologies
-100,000,000
-50,000,000
0
50,000,000
100,000,000
150,000,000
200,000,000
250,000,000
300,000,000
350,000,000
400,000,000
0 1 2 3 4 5 6 7 8 9 10 11 12 13 14 15 16 17 18 19 20 21 22 23 24 25 26 27 28 29 30
Year
Acc
umul
ated
NPV
Hydro Reduced CapacityHydro SalesPV Reduced CapacityPV SalesMicroturbine
Figure 1: Financial comparison of different DG technologies Another general conclusion with respect to the business scenario of demand shifting services concerns the regulator and the regulation policies in place. The scenario shows that currently there are regulatory measures favoring the deployment of Distributed Generation: those measures are based on taxes paid in Spain by the energy consumption of tariff customers. The

5
recovery of DG investments takes many years under the current conditions. Hence, any customer willing to invest in Distributed Generation needs a stable regulatory regime that will help create confidence that it will be possible to recoup the investments. Right now such a stable regulatory regime does not yet exist. In sum, our business analysis of demand response scenarios in Spain shows that significant savings at the customer side can be obtained, but it should be possible that the DG-generated power is sold on the market. Further, a stable regulatory framework is needed as it will support market confidence in the long-term commercial prospects of Distributed Generation. This section has only presented the key findings of this case study. Further data and in-depth analyses are found in [15].
3 Case Study B: Small-Scale Hydropower Plants
3.1 Case Introduction
The Norwegian national power system is nearly fully based on hydropower. This has historically contributed to low electricity prices, and to a large share of electricity in the national energy consumption. After the implementation of the Energy Act in 1991 that deregulated the power industry, the installation of the new generation capacity has been very limited: the estimated figure is only 5 TWh, while the increase in the electricity consumption in the same period is 18 TWh. The growing shortage of electricity generation, especially in dry years, is compensated for by electricity imports, usually originating from thermal power plants in Denmark.
Growing energy consumption in service and residential sectors is the main driving force for increased electricity demand. Construction of new hydropower-based generation capacity in Norway that can meet the growing electricity demand is complicated by: − Growing environmental concerns within the population and Non-Governmental
Organizations opposing the construction of new big water dams; − The limited potential for construction of new big-scale generation sites.
Considering all these factors, small-scale hydropower today seems to be a viable alternative in Norway. The estimated potential for construction of small-scale hydropower is 7 TWh and 3 TWh for mini- and micro-hydropower. Terrain in several parts of Norway creates very favorable conditions for small-scale hydropower installations, creating strong interests from the landowners. Small-scale hydropower is well established in Norway today, with several interest organizations, a number of suppliers of equipment, and contractors for planning and construction of power plants.
Practice however shows that construction of DG power plants based on technical and hydrological assessments only, is not sufficient to become economically feasible and to sustain the very high competition on the Norwegian power market. The deregulation of the Norwegian power market has placed DG in a multi-actor business network, creating possibilities for alternative business models, but whereby mainstream investment analysis is not conclusive enough as it insufficiently factors in factors due to the dynamic external network context.
3.2 Business Scenario
Development of a ‘base-case’ business scenario for local DG production in Norway, according to the BusMod methodology [12-14], involves modeling a DG plant within a total, deregulated market environment. This includes demand, regulatory framework and taxation in Norway.

6
The main business idea here is that final Customers (person or a legal entity) own generating facilities and produce electricity essentially for their own consumption, while the surplus electricity production output is sold on the power market. This scenario is currently the most widespread one in Norway: there are several agricultural farms and forests that use their own DG plants for own consumption and to sell electricity to the market. The central actors in this DG business model are the Local Producers. They generate electricity and sell the electricity output to the Electricity Supplier, using distribution and metering services provided by the local Distribution System Operator. The Local Producer receives payment from the Supplier for the electricity output, according to the metered data. The Local Producer pays a network tariff for feeding electricity into the Distribution System Operator’s grid and also for distribution and metering services. Local Producers with generation capacity larger than a certain level are required to deliver a generation forecast to the Transmission System Operator (TSO). This is usually done via an Electricity Supplier, which has a balancing agreement with the TSO. If we visualize this business network in a single picture according to the developed BusMod methodology, with the value exchanges made explicit between all actors, we obtain a value network as shown in Figure 2.
Figure 2: Networked business model for local DG production in Norway.
7
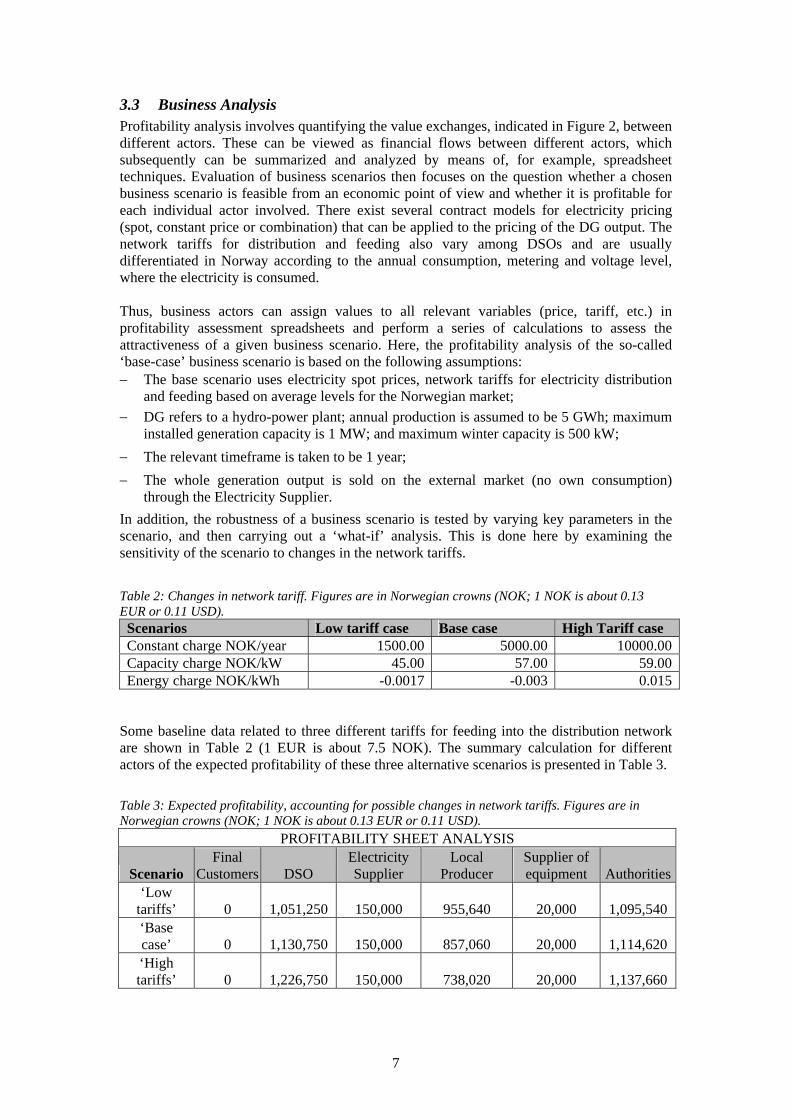
3.3 Business Analysis Profitability analysis involves quantifying the value exchanges, indicated in Figure 2, between different actors. These can be viewed as financial flows between different actors, which subsequently can be summarized and analyzed by means of, for example, spreadsheet techniques. Evaluation of business scenarios then focuses on the question whether a chosen business scenario is feasible from an economic point of view and whether it is profitable for each individual actor involved. There exist several contract models for electricity pricing (spot, constant price or combination) that can be applied to the pricing of the DG output. The network tariffs for distribution and feeding also vary among DSOs and are usually differentiated in Norway according to the annual consumption, metering and voltage level, where the electricity is consumed. Thus, business actors can assign values to all relevant variables (price, tariff, etc.) in profitability assessment spreadsheets and perform a series of calculations to assess the attractiveness of a given business scenario. Here, the profitability analysis of the so-called ‘base-case’ business scenario is based on the following assumptions: − The base scenario uses electricity spot prices, network tariffs for electricity distribution
and feeding based on average levels for the Norwegian market; − DG refers to a hydro-power plant; annual production is assumed to be 5 GWh; maximum
installed generation capacity is 1 MW; and maximum winter capacity is 500 kW; − The relevant timeframe is taken to be 1 year; − The whole generation output is sold on the external market (no own consumption)
through the Electricity Supplier. In addition, the robustness of a business scenario is tested by varying key parameters in the scenario, and then carrying out a ‘what-if’ analysis. This is done here by examining the sensitivity of the scenario to changes in the network tariffs.
Table 2: Changes in network tariff. Figures are in Norwegian crowns (NOK; 1 NOK is about 0.13 EUR or 0.11 USD). Scenarios Low tariff case Base case High Tariff case Constant charge NOK/year 1500.00 5000.00 10000.00Capacity charge NOK/kW 45.00 57.00 59.00Energy charge NOK/kWh -0.0017 -0.003 0.015
Some baseline data related to three different tariffs for feeding into the distribution network are shown in Table 2 (1 EUR is about 7.5 NOK). The summary calculation for different actors of the expected profitability of these three alternative scenarios is presented in Table 3.
Table 3: Expected profitability, accounting for possible changes in network tariffs. Figures are in Norwegian crowns (NOK; 1 NOK is about 0.13 EUR or 0.11 USD).
PROFITABILITY SHEET ANALYSIS
Scenario Final
Customers DSO Electricity Supplier
Local Producer
Supplier of equipment Authorities
‘Low tariffs’ 0 1,051,250 150,000 955,640 20,000 1,095,540 ‘Base case’ 0 1,130,750 150,000 857,060 20,000 1,114,620 ‘High tariffs’ 0 1,226,750 150,000 738,020 20,000 1,137,660

8
Clearly, for all actors involved, the small-scale DG Local Producer business model is profitable. Moreover, the analyzed sensitivity of parameters within this DG business model shows that it is robust and sustainable also when changes in the network tariffs occur. Further information and extensive data on this business case study is found in [16].
4 Case Study C: Distributed Balancing Services
4.1 Case Introduction As a result of re-regulation, investment in massive reserve power generation capacity is decreasing in The Netherlands. Typically, reserve power generation installations require an investment time horizon of twenty to fifty years. However, it is no longer possible to estimate future cash-flows for such generation facilities accurately, due to alternatives such as cheap reserve power from abroad, subsidized renewable power, as well as strategic selling and buying behaviour by generators and consumers. Additionally, due to reductions in generation capacity investments, the risk of grid disturbances and demand and supply mismatch increases. It is estimated that in The Netherlands from 2005 onwards the reserve capacity will be below 10%, whereas 20% is regarded as a safe level. Similar developments are taking place in other European markets (e.g. Scandinavia) as well. Stagnation of reserve capacity will finally lead to high peak prices on the power markets. For example, in summer 2003 the electricity price at the Amsterdam Power Exchange (APX) reached a peak of €1800.00/MWh. Approximately 10 to 15 % of total electricity demand in The Netherlands is currently traded on the APX market. Peaks in power prices open the door for smart, ICT-enabled, energy management services, such as a day-ahead power planning service for demand or supply side management for distributed generators. A trading company then operates additional ‘control power’ to minimize imbalance between the day-ahead contracted amount of electricity and the real-time realization. This type of energy management service may further result in lower peak prices, leading to a smaller installed base of required peak reserve capacity. A specific example of such a management service is a distributed balancing service that exploits the use of DG technologies and equipment to minimize imbalances.
4.2 Business Scenario A business idea worthwhile to investigate is a DG distributed balancing service, resulting in smoothening of the electricity tariff fluctuations. A balancing service may become an alternative both for conventional balancing using central generation units and for energy storage. A competitive advantage of distributed balancing services is that additional investment is needed only for control and not for production or storage. The potential of distributed balancing services in The Netherlands depends on: (1) a control system that performs balancing services within customer preferences, (2) communication systems that link the control system to the balancing market and to the generation and consumption applications, and (3) various forms of controllable distributed generation (CHP, emergency generators) and controllable consumption (cooling, heating) and their interfaces to the control. The above criteria lead to several market segments, in which distributed balancing services could be applied. For instance, large cold storages and office buildings have a substantial thermal buffer capacity. If the cooling production is switched off it takes a while before the consumer notices this. This time span enables a larger flexibility in production and sales of electricity. Greenhouses and gardeners have similar flexibility in power production and consumption. A relatively large percentage of power in this market segment is generated by combined heat and power (CHP) installations. These installations are driven by heat demand,

9
which depends on the primary process (realizing a certain temperature in a greenhouse or a building section). The electricity produced is used for assimilation illumination. If a CHP has a capacity for heat buffering available or could distribute the heat in the local environment (e.g. heat demanding company), distributed balancing services are possible by means of switching off the illumination and sell the produced electricity, simultaneously. So, one novel DG business idea is to provide an ICT-enabled, power market-driven distributed balancing service for greenhouse market gardeners using an already existing CHP installation, which is owned and maintained by an energy supplier. The energy supplier uses the distributed balancing service as day-ahead prediction tool. Gardeners are important actors in this DG business model. For them, the distributed balancing service implies switching off or shifting illumination processes in time in green houses for one hour on a profitable APX time as well as producing electricity that same hour in the illumination periods (autumn, winter, spring). In non-illumination periods (summer) electricity is also produced on profitable moments and the excess heat is stored or used in the local environment of the greenhouse. The gardener receives a fee from the energy supplier for his crops losses due to reduction of light by switching off the illumination. Other involved actors are the Distribution System Operator, the Market Operator and the Energy Service Company (provider of the needed ICT hardware and software). The gardener typically has an electricity demand of 8,800 kW (~ 110,000 m2 illumination surface), which is generated by the CHP installation of the Energy Supplier. The value network according to the BusMod methodology is shown in Figure 3; exchanges that are obligatory due to regulations (VAT and subsidies) have also been included. The core actors are the energy supplier, the Gardener and the ICT supplier. For these actors, the financial effects of implementing the distributed balancing services have been assessed. Specifically, the net cash flows directly resulting from the service are considered. The next step then is to obtain an understanding of the net cash flows that directly result from the value exchanges and related investments for all the actors involved in the business model.
Figure 3: Value model for a DG-supported distributed balancing service.

10
4.3 Business Analysis In summer, the Energy Supplier could produce 24 hours a day and sell it to the APX power exchange market, but this would not deliver an optimal profit (see Figure 4). The optimum production period lies between 9:00 and 19:00. Not all heat produced could be stored or used in the local surroundings of the gardener in this period. In this scenario the production in summer will also be 1 hour like in the other seasons.
Revenue per hour of the Energy Supplier selling to APX in the Summer (capacity 8800 kW)
-400 €-200 €
0 €200 €400 €600 €800 €
1,000 €1,200 €1,400 €
1:002:0
03:0
04:0
05:0
06:0
07:0
08:0
09:0
010
:0011
:0012
:0013
:0014
:0015
:0016
:0017
:0018
:0019
:0020
:0021
:0022
:0023
:000:00
Cost
s (€
)
Revenue (Per hour) Income APX sales CHP costs - subsidy
Figure 4: Supplier revenues in the balancing services business model for DG. Table 4 presents the estimated revenues for the energy supplier in case of one hour production per day at peak moments. Table 4: Estimated revenues for the energy supplier.
Season Peak hour Revenue per day (€) Revenue per season (€) Summer1 12:00 808 72,720 Autumn 11:00 637 57,330 Winter 12:00 398 35,820 Spring 12:00 418 37,620 Annual 203,490
In practice, several factors affect the revenue of the energy supplier such as the gas price, the spot price itself and the subsidy. So, a sensitivity analysis is carried out to better understand these factors, and how they influence the sustainability of the DG business idea. In this specific case, three parameters are changed. Table 5 presents the estimated profitability for all core actors. In the first row the base scenario ‘one hour production per day’ is shown. The second row shows the alternative scenario ‘30% increase of the gas price’, followed by ‘30% lower market prices’; and finally the scenario ‘the cut-off of the subsidy’. Table 5: Estimated profitability for all core actors.
PROFITABILITY SHEET ANALYSIS Turnover Profit Profit Profit Scenario Energy Supplier Energy Supplier Gardener (33%) ESCO Base Scenario 203,490 82,338 67,152 54,00030% increase of gas price 166,860 57,796 55,064 54,00030% decrease of APX price 142,443 41,437 47,006 54,000
1 In the case of 10h production the revenue in the summer period would be € 452,700.

11
No CHP subsidy 183,141 68,704 60,437 54,000 Table 6 shows the calculated net present value (NPV) for the base scenario. Investments for the CHP installation itself are not included in the calculation, since it is assumed that the choice for a CHP installation has already been made (as is actually the case in the studied situation). Table 6: Net Present Value for the base scenario.
Year 2004 2005 2006 2007 2008 2009 2010 Turnover (k€) 204 204 204 204 204 204 204 Costs -91 -91 -91 -91 -91 -91 -91 Net Cash Flow 113 113 113 113 113 113 113 Present value of flows 608 Investment -30 Net Present value 578
In sum, the business idea of Distributed Balancing Services for greenhouse market gardeners using an (existing) CHP installation owned by the energy supplier is a profitable one for the core actors. Important influencing factors are the spot prices during the seasons and the gardener’s fee. The gas price, the CHP subsidy and the initial ICT investments exert relatively less influence. This DG business case study is described in more detail in [17].
5 Case Study D: Active Management of Distribution Networks
5.1 Case Introduction As a result of the Kyoto Protocol on climate change and of an agreement between European member states, the UK has to reduce its greenhouse emissions by 12.5% below 1990 levels by 2008-2012. In order to achieve this target, the UK government established two domestic climate change programs. The first one is that 10% of electricity supply in the UK should be provided from renewable sources by year 2010, and the second is that 10 GWe of Combined Heat and Power (CHP) should be installed by that same date. Achievement of these targets requires a large amount of distributed generation (DG) to be connected to existing distribution networks. This will require a paradigm shift in planning, operation and control of electrical networks involving technical and commercial integration of distributed generation into distribution networks. At the core of technical integration of DG into distribution networks is a concept now commonly referred to as “active management of distribution networks”. Active management (AM) enables the distribution network operator (DNO) to maximize the use of the existing circuits by integrated control of transformer taps and any reactive compensation devices as well as active and reactive generator dispatch. Present distribution networks are generally operated independently of distributed generation. This results in inefficient use of the distribution network assets (e.g. cables, lines and transformers) as well as severely limiting the capacity of distributed generation that may be connected to the network. Studies have shown that with active management of distribution networks the amount of DG that can be connected to existing distribution networks can be increased by a factor of 3 to 5 without requiring network reinforcement.
5.2 Business Scenario For active management of distribution networks, it is assumed that the current UK renewable obligation policy will continue. The renewable obligation places an obligation on suppliers to purchase a specified percentage of electricity sold to their customers from renewable sources.

12
Failure to comply attracts a penalty. The fundamental business idea is that the DNO offers a voltage management service to the renewable distributed generator (RDG) allowing the RDG to maximize connected capacity and generated electricity (see Figure 5). In return the DNO receives payment from the RDG for providing the service. To enable active management, some additional exchanges between actors are required. Both the RDG and the Central Generators (CGs) need to have access to the distribution network and pay a fee for this. Also, the sell electricity to the supplier obtains a fee for the electricity. The supplier uses a revenue collection service from the distribution network operator and pays a fee. Finally, the supplier delivers the electricity to the customer and receives and electricity fee in return. Notice that the customer pays for the use of system to the electricity supplier who in turn passes the revenue to the DNO. In general, the supplier is not involved in the arrangements or payments for connecting customers to the network. The involved actors as well as the objects of value they exchange are presented in Figure 5.
Figure 5: Value exchanges between market parties in active management of distribution networks.
5.3 Business Analysis The key business question is whether active management is really an attractive service from a commercial point of view. Consequently, profitability and sensitivity analysis is done using the cash flows indicated in Figure 5 as a starting point. Base data used in the analysis of the active management scenario are given in Table 7. Table 7: Base data for analysis of the active management scenario.
Total number of demand customers 10,000 System peak load at 45% load factor 8,371 kW Total capacity of RDG without active management 750 kW Load factor of RDG with/without AM 0.22/0.25 Investment in RDG (wind farm) 1,320,300 €/MW Retail tariff 0.104 €/kWh Wholesale tariff 0.051 €/kWh Network use of system tariff 0.034 €/kWh
13
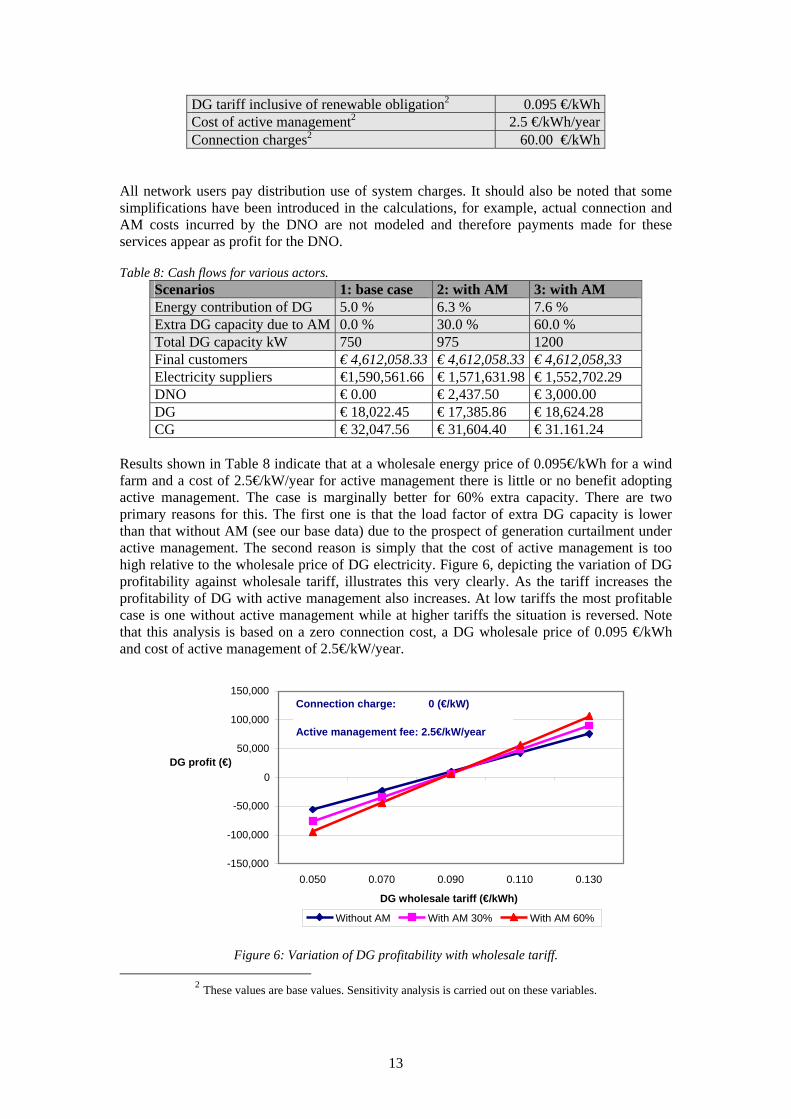
DG tariff inclusive of renewable obligation2 0.095 €/kWh Cost of active management2 2.5 €/kWh/year Connection charges2 60.00 €/kWh
All network users pay distribution use of system charges. It should also be noted that some simplifications have been introduced in the calculations, for example, actual connection and AM costs incurred by the DNO are not modeled and therefore payments made for these services appear as profit for the DNO. Table 8: Cash flows for various actors.
Scenarios 1: base case 2: with AM 3: with AM Energy contribution of DG 5.0 % 6.3 % 7.6 % Extra DG capacity due to AM 0.0 % 30.0 % 60.0 % Total DG capacity kW 750 975 1200 Final customers € 4,612,058.33 € 4,612,058.33 € 4,612,058,33 Electricity suppliers €1,590,561.66 € 1,571,631.98 € 1,552,702.29 DNO € 0.00 € 2,437.50 € 3,000.00 DG € 18,022.45 € 17,385.86 € 18,624.28 CG € 32,047.56 € 31,604.40 € 31.161.24
Results shown in Table 8 indicate that at a wholesale energy price of 0.095€/kWh for a wind farm and a cost of 2.5€/kW/year for active management there is little or no benefit adopting active management. The case is marginally better for 60% extra capacity. There are two primary reasons for this. The first one is that the load factor of extra DG capacity is lower than that without AM (see our base data) due to the prospect of generation curtailment under active management. The second reason is simply that the cost of active management is too high relative to the wholesale price of DG electricity. Figure 6, depicting the variation of DG profitability against wholesale tariff, illustrates this very clearly. As the tariff increases the profitability of DG with active management also increases. At low tariffs the most profitable case is one without active management while at higher tariffs the situation is reversed. Note that this analysis is based on a zero connection cost, a DG wholesale price of 0.095 €/kWh and cost of active management of 2.5€/kW/year.
Figure 6: Variation of DG profitability with wholesale tariff.
2 These values are base values. Sensitivity analysis is carried out on these variables.
-150,000
-100,000
-50,000
0
50,000
100,000
150,000
0.050 0.070 0.090 0.110 0.130 DG wholesale tariff (€/kWh)
DG profit (€)
Without AM With AM 30% With AM 60%
Connection charge: 0 (€/kW)
Active management fee: 2.5€/kW/year

14
It is interesting to note that when the cost of active management is varied (Figure 7) holding the wholesale price of energy and connection cost constant at 0.095 €/kWh and 60 €/kW respectively, the profitability of DG with active management decreases as cost of active management increases.
02,0004,0006,0008,000
10,00012,00014,00016,00018,00020,000
0.0 2.0 4.0 6.0 8.0 10.0 12.0
cost of active management (€/kW of installed capacity)
DG
pro
fit (€
)
Without AM With AM 30% With AM 60%
DG wholesale tariff: 0.095 €/kWh
DG connection charge: 60 €/kW of DG installed capacity
Figure 7: Variation of DG profitability with cost of active management. The impact of connection costs on the relative merits of cases with and without active management is in this case not that interesting, because the model assumes that extra capacity due to active management does not attract extra connection charges. Instead an active management fee is paid which is smaller than the connection charge. This explains why in Figure 8 the profitability in all three cases falls at the same rate with increasing connection charges.
02,0004,0006,0008,000
10,00012,00014,00016,00018,00020,000
0.0 10.0 20.0 30.0 40.0 50.0 60.0
Connection charge (€/kW of installed DG capacity)
DG
pro
fit €
)
Without AM With AM 30% With AM 60%
DG wholesale tariff: 0.095€/kWh
Cost of active management: 2.5€/kW/year
Figure 8: Variation of DG profitability with connection charge. While acknowledging that the case studies and scenarios presented are based on assumptions that may not be valid in all cases, the general conclusions drawn are nevertheless interesting and could be used to inform policy formulation on renewable DG with regard to active management. The main conclusions can be summarized as follows:

15
− Profitability of RDG is sensitive to wholesale energy tariff of renewable DG. This is due to high investment cost of wind technology and low load factors associated with intermittent sources. It should however be noted that the investment cost of wind technology is forecast to come down in future.
− Profitability of RDG is sensitive to cost of active management. It is therefore important to seek cost effective solutions in the implementation of active management.
Depending on voltage level of connection, connection charges are also critical as is the associated policy on these charges, i.e., deep or shallow. With regard to price of renewable energy, regulatory certainty is very important to guarantee long-term commercial viability. For further data on this DG business case study, see [18].
6 BusMod: Brief Note on Methodological Aspects Above we discussed the main findings of several different business case studies concerning different future applications of DG in different countries. Although these case studies are very different in nature, they have in common that they were all carried out employing the same systematic methodology for constructing and assessing networked business models. We have argued the need for such an interdisciplinary systems-oriented approach in Section 1. Accordingly, the studies presented in this paper have been systematically looking for answers to the following key questions: − What precisely is the market offering, and which actors are involved? − What are the goals, and who ‘own’ these? − What DG/DER technology is (to be) used? − What is the business case: How do the actors create and exchange value? And how can
they act to make a profit? − What are estimates on cash flow, operational and ICT expenses, and investments? − What-if analysis: for example, what is the impact of existing or emerging regulation on
the business model? The BusMod methodology [12-14] has been developed with this purpose in mind, and it has a number of novel and unique features: − It represents and helps explain the business model of the entire value network in a concise
diagrammatic form (cf. Figure 2 , Figure 3, and Figure 5); − It provides a complete checklist for DG business models; − It offers easy-to-use steps and tools to create and assess business models. It is beyond the scope of this paper to discuss the methodology of networked business modeling and analysis in any adequate depth. However, a few remarks and pointers to the scientific literature are in order. The BusMod methodology has its foundation in generic conceptual modeling (in our case, for networked business models [5,9]), known as metamodel or ontology [14, 19]. Conceptual modeling has a long tradition in Computer Science, Artificial Intelligence and Information Systems, and comprises the activity of formally defining aspects of the physical and social world around us for the purpose of (both human and computer) understanding and communication; formal in this context means the abstraction, structuring, and representation of knowledge in a way that enables to computationally reason about this knowledge [2, 3]. In addition to a business ontology, the BusMod methodology consists of a series of process steps to be performed by DG business developers. Each step is described by a number of tasks to perform, questions to ask to stakeholders, and guidelines for practical use. An overview of these business modeling steps is given in Figure 9. Also, the methodology contains goal and DG technology taxonomies and a library of value model fragments, specifically for the DG

16
domain, to aid business developers in constructing the business model and assessing the business case. Further examples, with open-source software tools, and diagrammatic and algorithmic techniques, are discussed in [14].
Figure 9: BusMod is a stepwise, ontology-based methodology for networked business modeling and analysis.
7 Conclusion This paper has systematically investigated different case studies for DG business models that are sustainable in a liberalized market environment. These studies focused on the situation of different countries and highlighted the potential of various novel business ideas. Key findings are: • In a competitive market, the electricity bill that a customer has to pay can be reduced
significantly by shifting part of the demand to low price periods. Demand response services may reduce the electricity bill of a final customer with DG capacity by over 15%.

17
• Under current market and regulatory conditions, a demand shifting service should not be independently positioned as a key income source; revenue derives from a well-designed bundle of services (cf. also [19]).
• The small-scale Local Producer business model for renewable DG is profitable for all actors involved – even when changes in the network tariffs occur.
• Due to deregulation, massive reserve power generation capacity is decreasing in many countries. This creates new business opportunities for DG.
• DG has a strong potential to play a role in future distributed grid balancing services, for instance via CHP employed in horticulture, and in active management of distribution networks.
Our studies have revealed some economic factors that seem to be more generally valid across different case studies: 1. The business case for DG generally improves if local DG producers are able to sell and
trade directly on a power exchange market. 2. An important and general finding is that regulatory policies directly impact the feasibility
and attractiveness of DG business models. Whatever its specific nature, a stable regulatory framework must be in place: regulatory certainty increases market confidence in long-term commercial viability of new business models.
These results indicate some interesting future research lines for studies in this domain: (1) the modeling of the design and interplay of regulatory frameworks with new business models for DG and other technologies; (2) the role of future retail and market aggregators for DG/DER, and their relation to emerging concepts such as virtual power plants. Acknowledgements. This paper summarizes results and findings of the EU Project BusMod. This project has been partially supported by the European Commission under contract no. NNE5/2001/256 (2002-2004). Many individuals and organizations contributed to this paper, including Ignacio García-Bosch, Eduardo Navarro (Iberdrola, Spain), Iñaki Laresgoiti, Carlos Madina, Luis Pedrosa, Ángel Díaz (Labein, Spain) Andrei Z. Morch, Björn Grinden (SINTEF Energy Research, Norway), Marcel Elswijk, Josco Kester, René Kamphuis, Rashid Sohrabkhan (ECN, The Netherlands), Joseph Mutale, Goran Strbac (UMIST, United Kingdom), Vera Kartseva, Jasper Soetendal, Joost Schildwacht (Free University Amsterdam, The Netherlands), Luc Hamilton, Victor Iosif (Enersearch, Sweden).
References [1] E.M. Rogers, Diffusion of Innovations, fifth edition, The Free Press, New York, 2003.
[2] P. Loucopoulos and V. Karakostas, System Requirements Engineering, McGraw-Hill, Berkshire, UK, 1995.
[3] J. Mylopoulos, L. Chung, E. Yu, From Object-Oriented to Goal-Oriented Requirements Analysis, Communications of the ACM 42:1 (1999), 31—37.
[4] R.J.A. Buhr, Use Case Maps as Architectural Entities for Complex Systems, IEEE Transactions on Software Engineering 24 (1999), 1131—1155.
[5] J. Gordijn and J.M. Akkermans, Value-Based Requirements Engineering: Exploring Innovative e-Commerce Ideas, Requirements Engineering 8 (2003), 114—134.
[6] G. Strbac, J. Mutale, T. Bopp, BusMod EU Project Deliverable D1.2: Analysis of Distributed Generation Business Characteristics, 2002. Technical Report available from http://busmod.e3value.com.
[7] K. van der Heijden, Scenarios: The Art of Strategic Conversation, John Wiley & Sons, New York, 1996.

18
[8] I. García-Bosch, I. Laresgoiti, C.Madina, E. Zabala, L. Pedrosa, Á. Diaz, J. Kester, A.Z. Morch, V. Iosif, P. Sweet, L. Hamilton, BusMod EU Project Deliverable D 2.1: Arising Scenarios in Distributed Generation Businesses, 2003. Technical Report available from http://busmod.e3value.com.
[9] J. Gordijn and J.M. Akkermans, Design and Evaluation of E-Business Models, IEEE Intelligent Systems 16:4 (2001), 11–17.
[10] M.E. Porter, Competitive Advantage, The Free Press, New York, 1985.
[11] D. Tapscott, D. Ticoll, A. Lowy, Digital Capital - Harnessing the Power of Business Webs, Nicholas Brealy Publishing, London, 2000.
[12] V. Kartseva, J. Soetendal, J. Gordijn, J.M. Akkermans, J. Schildwacht, BusMod EU Project Deliverable D5.1: Methodology Design for Distributed Generation Business Modeling, 2004. Technical Report available from http://busmod.e3value.com.
[13] I. García-Bosch, I. Laresgoiti, C. Madina, A.Z. Morch, J. Gordijn, V. Kartseva, Distributed Generation Business Modelling, in Proceedings of CIGRE-2004 (to appear).
[14] J.M. Akkermans, Z. Baida, J. Gordijn, N. Peña, A. Altuna, I. Laresgoiti, Value Webs: Ontology-Based Bundling of Real-World Services, IEEE Intelligent Systems 19:4 (2004) 23–32.
[15] I. Laresgoiti, C. Madina, L. Pedrosa, Á. Díaz, BusMod EU Project Deliverable D4.4: DG Business Model Case Study: Energy Services, 2004. Technical Report available from http://busmod.e3value.com.
[16] A.Z. Morch and B. Grinden, BusMod EU Project Deliverable D4.3: DG Business Model Case Study: Consumers and Suppliers Alliance, 2004. Technical Report available from http://busmod.e3value.com.
[17] M. Elswijk, R. Sohrabkhan, R. Kamphuis, J. Kester, BusMod EU Project Deliverable D4.1: DG Business Model Case Study: Distributed Balancing Services, 2004. Technical Report available from http://busmod.e3value.com.
[18] J. Mutale, G. Strbac, BusMod EU Project Deliverable D4.2: DG Business Model Case Study: Active Management of Distribution Networks, 2004. Technical Report available from http://busmod.e3value.com.
[19] W.N. Borst, J.M. Akkermans, and J.L. Top, Engineering Ontologies, Int. J. Human-Computer Studies 46 (1997), 365 – 406.