
DISTRIBUTED GENERATION TECHNOLOGIES – STATE OF THE ART AND PERSPECTIVES
20
International Journal of Computational Science, Information Technology and Control Engineering (IJCSITCE) Vol.1, No.3, October 2014 1 DISTRIBUTED GENERATION TECHNOLOGIES – STATE OF THE ART AND PERSPECTIVES Priyadarshi 1 Samina Elyas Mubeen 2 Rajneesh Karn 3 12 Department of Electrical and Electronics Engineering Radharaman Engineering College Bhopal 3 Department of Electrical and Electronics Engineering SAM College of Engineering and Technology Bhopal Abstract This paper is based on the observation that there is a improved interest in small scale electricity generation. The paper covers a survey of existing small scale commonly called distributed generation technologies and then move on a discussion of the major advantages and issues of distributed electricity generation. Different technologies are summarized on the basis of their advantages and disadvantages. Small-scale generation is also commonly called on-site generation, dispersed generation, embedded generation or decentralised generation. And in conclusion, an attempt is made to define the distributed generation concepts more precisely and its application in Rural Electrification to electrify those area where grid is not available. Index Terms Distributed Generation, Rural Electrification, Solar photovoltaics, wind energy generation. 1. INTRODUCTION As population of world growing with an effective economic arises and hence there will be some improving living standards that have led to a balanced growth in her need for the energy services of best quality and quantity. For generation of energy mostly fossil fuels are used like coal, oil, natural gases. But as these non renewable energy resources are used in a huge amount there will be a shortage of these resources in coming time. And this will make a huge impact on the generation of energy. Also with increase of power generation by fossil fuels world energy-related carbon dioxide emissions increase from 31.2 billion metric tons in 2010 to 36.4 billion metric tons in 2020 and 45.5 billion metric tons in 2040 that will affect environmental condition of the earth. The limited, expensive Non-renewable energy resources pollute the world’s environment. By understanding the nature of global energy crisis public and policymakers should have a positive reception of the fundamental science. Increased world population and integrated global economy contribute to larger demands of electricity. Many countries are still heavily dependent on oil and gas, which will eventually get depleted within next few decades, and the cost of extraction will skyrocket for the remaining oil deposits. The energy report of IEO (International Energy Outlook) published in 2013 reveals that the World energy consumption across the globe increases from 524 quadrillion Btu in 2010 to 630 quadrillion Btu in 2020 and 820 quadrillion Btu in 2040. More than 85% of the increase in global
-
Upload
independent -
Category
Documents
-
view
6 -
download
0
Transcript of DISTRIBUTED GENERATION TECHNOLOGIES – STATE OF THE ART AND PERSPECTIVES

International Journal of Computational Science, Information Technology and Control Engineering (IJCSITCE) Vol.1, No.3, October 2014
1
DISTRIBUTED GENERATION
TECHNOLOGIES – STATE OF THE ART AND
PERSPECTIVES
Priyadarshi1 Samina Elyas Mubeen
2 Rajneesh Karn
3
12Department of Electrical and Electronics Engineering Radharaman Engineering College Bhopal
3Department of Electrical and Electronics Engineering SAM College of Engineering and
Technology Bhopal
Abstract
This paper is based on the observation that there is a improved interest in small scale electricity
generation. The paper covers a survey of existing small scale commonly called distributed generation
technologies and then move on a discussion of the major advantages and issues of distributed electricity
generation. Different technologies are summarized on the basis of their advantages and disadvantages.
Small-scale generation is also commonly called on-site generation, dispersed generation, embedded
generation or decentralised generation. And in conclusion, an attempt is made to define the distributed
generation concepts more precisely and its application in Rural Electrification to electrify those area
where grid is not available.
Index Terms
Distributed Generation, Rural Electrification, Solar photovoltaics, wind energy generation.
1. INTRODUCTION
As population of world growing with an effective economic arises and hence there will be some
improving living standards that have led to a balanced growth in her need for the energy services
of best quality and quantity. For generation of energy mostly fossil fuels are used like coal, oil,
natural gases. But as these non renewable energy resources are used in a huge amount there will be
a shortage of these resources in coming time. And this will make a huge impact on the generation
of energy. Also with increase of power generation by fossil fuels world energy-related carbon
dioxide emissions increase from 31.2 billion metric tons in 2010 to 36.4 billion metric tons in
2020 and 45.5 billion metric tons in 2040 that will affect environmental condition of the earth. The
limited, expensive Non-renewable energy resources pollute the world’s environment. By
understanding the nature of global energy crisis public and policymakers should have a positive
reception of the fundamental science. Increased world population and integrated global economy
contribute to larger demands of electricity. Many countries are still heavily dependent on oil and
gas, which will eventually get depleted within next few decades, and the cost of extraction will
skyrocket for the remaining oil deposits.
The energy report of IEO (International Energy Outlook) published in 2013 reveals that the World
energy consumption across the globe increases from 524 quadrillion Btu in 2010 to 630
quadrillion Btu in 2020 and 820 quadrillion Btu in 2040. More than 85% of the increase in global

International Journal of Computational Science, Information Technology and Control Engineering (IJCSITCE) Vol.1, No.3, October 2014
2
energy demand driven by strong economic growth and expanding population from 2010 to 2040
[1].
World Energy Comsumptionaccording to fule Types
in Quadrillion Btu
Years
2010 2015 2020 2025 2030 2035 2040
Wo
rld
En
erg
y C
om
su
mp
tio
n
0
50
100
150
200
250
Nuclear
Renewables
Natural Gas
Coal
Liquids
Fig. 1. World energy consumption rate up to 2040
The energy consumption around the world according the fuels classification in Quadrillion Btu
shown in figure 1 above and energy consumption around the world in coming years shown in
figure 2.
Fig. 2. World energy consumption scenario
In a report of IEA 2013, 93 % electricity generates in the whole world and rises from 20.2 trillion
kilowatt-hours in 2010 to 39.0 trillion kilowatt-hours till 2040. Electricity provisions a rising share
of total energy demand and is the world’s fastest-growing form of delivered energy. World’s
electricity delivered to consumers rises by 2.2 percent per year from 2010 to 2040, as compared
with average growth of 1.4 percent per year for all delivered energy sources.

International Journal of Computational Science, Information Technology and Control Engineering (IJCSITCE) Vol.1,
In the report of MNRE (Ministry of New and Renewable Energy, India) September 2013 in
coming years as the economy expands the energ
is going to grow further. Renewable energy is the best option to fulfil the growing energy demand
as they are non-exhaustible and relatively clean and resolves the problem related with Non
renewable fuels for power generation.
In report of MNRE 11th Five Year Plan realized the major role of renewable energy to improve
the domestic energy supply options as well as to broaden the energy sources [2]. With addition in
capacity in solar energy, wind energy, small
development that will be done on the Renewable energy sector in the 12th Five Year plan with a
large number of renewable energy projects in coming years in India.
Fig. 3.
The Integrated Energy Policy, 2006 had projected that in the most optimistic scenario, by 2031
India will have 30,000 MW of wind and 10,000 MW of solar power. The policy had put its faith in
the biomass sector and had projected installation of
plantations and production of 15 million tonnes of bio
The expert group that wrote this report projected 11 future energy scenarios for the country and
estimated that renewable energy would contribute only 0.1
consumption in the country by 2031
an increase in the installation of renewable power by 2021
reaching 100,000 MW by 2022, the share of renewable in total commercial energy use will remain
under 2% in 2021–2022. According to the plan document, the share of renewable in electricity
generation will rise from around 6 % in 2012 to 9 % in 2017 and 16 % in 203
Different projects are implemented by the countries to reduce GHG emissions. For the projects
developed countries would be donate financing, technology transfer, and other essential support.
By the incrimination of renewable energy resources for d
sustainable development, whereas at the same time minimizing the global GHG emissions. DG
might be a feasible scheme to support on the whole developing countries. Modern study have
shown that extensive acceptance of distr
Coal
147568.3
9
Oil
1199.75
Nuclear
International Journal of Computational Science, Information Technology and Control Engineering (IJCSITCE) Vol.1, No.3, October 2014
In the report of MNRE (Ministry of New and Renewable Energy, India) September 2013 in
coming years as the economy expands the energy usage will increased and the demand of energy
is going to grow further. Renewable energy is the best option to fulfil the growing energy demand
exhaustible and relatively clean and resolves the problem related with Non
power generation.
In report of MNRE 11th Five Year Plan realized the major role of renewable energy to improve
the domestic energy supply options as well as to broaden the energy sources [2]. With addition in
capacity in solar energy, wind energy, small hydro power and biomass there will be some
development that will be done on the Renewable energy sector in the 12th Five Year plan with a
large number of renewable energy projects in coming years in India.
Fig. 3. India’s Installed Power Capacity by Source (MW)
The Integrated Energy Policy, 2006 had projected that in the most optimistic scenario, by 2031
India will have 30,000 MW of wind and 10,000 MW of solar power. The policy had put its faith in
the biomass sector and had projected installation of 50,000 MW biomass power based on
plantations and production of 15 million tonnes of bio-diesel and ethanol every year, by 2031
The expert group that wrote this report projected 11 future energy scenarios for the country and
rgy would contribute only 0.1–5.6 % of the total primary energy
consumption in the country by 2031-2032. The 12th Five Year Plan (FYP) document has planned
an increase in the installation of renewable power by 2021-22. But even with renewable power
g 100,000 MW by 2022, the share of renewable in total commercial energy use will remain
2022. According to the plan document, the share of renewable in electricity
generation will rise from around 6 % in 2012 to 9 % in 2017 and 16 % in 2030 [3].
Different projects are implemented by the countries to reduce GHG emissions. For the projects
developed countries would be donate financing, technology transfer, and other essential support.
By the incrimination of renewable energy resources for developing countries to carry their
sustainable development, whereas at the same time minimizing the global GHG emissions. DG
might be a feasible scheme to support on the whole developing countries. Modern study have
shown that extensive acceptance of distributed generation (DG) technologies in power systems be
Coal
147568.3
Nuclear
4780
Hydro
40661.4
Small
Hydro
3803.68
Wind
Power
21136.4
Biomass
4120.13
Solar
Power
2631.93RES
31692.14
ALL INDIA INSTALLED CAPACITY (IN MW) OF
POWER STATIONS (As 31/05/2014)
No.3, October 2014
3
In the report of MNRE (Ministry of New and Renewable Energy, India) September 2013 in
y usage will increased and the demand of energy
is going to grow further. Renewable energy is the best option to fulfil the growing energy demand
exhaustible and relatively clean and resolves the problem related with Non-
In report of MNRE 11th Five Year Plan realized the major role of renewable energy to improve
the domestic energy supply options as well as to broaden the energy sources [2]. With addition in
hydro power and biomass there will be some
development that will be done on the Renewable energy sector in the 12th Five Year plan with a
The Integrated Energy Policy, 2006 had projected that in the most optimistic scenario, by 2031-32,
India will have 30,000 MW of wind and 10,000 MW of solar power. The policy had put its faith in
50,000 MW biomass power based on
diesel and ethanol every year, by 2031-32.
The expert group that wrote this report projected 11 future energy scenarios for the country and
5.6 % of the total primary energy
2032. The 12th Five Year Plan (FYP) document has planned
22. But even with renewable power
g 100,000 MW by 2022, the share of renewable in total commercial energy use will remain
2022. According to the plan document, the share of renewable in electricity
Different projects are implemented by the countries to reduce GHG emissions. For the projects
developed countries would be donate financing, technology transfer, and other essential support.
eveloping countries to carry their
sustainable development, whereas at the same time minimizing the global GHG emissions. DG
might be a feasible scheme to support on the whole developing countries. Modern study have
ibuted generation (DG) technologies in power systems be

International Journal of Computational Science, Information Technology and Control Engineering (IJCSITCE) Vol.1, No.3, October 2014
4
able to cooperate in making clean, consistent energy with significant environmental and other
reimbursement. In 1999, a British investigate approximate reduction of co2 emissions upto 41%
with a combined heat and power based DG technology. In the report of Danish power system,
30% greenhouse gas emissions minimize from 1998 to 2001, with DG technologies[32]. In recent
times, distributed generation technologies have inward much global interest; and fuelling this
interest have been the possibilities of intercontinental agreements to condense greenhouse gas
emissions, electricity sector reformation, high power consistency needs for assured performance,
and concern on moderation transmission and distribution capability bottlenecks and congestion,
among others.
2. DISTRIBUTED ENERGY GENERATION TECHNOLOGIES
The distributed generation definition varies time to time according to generation and utilization. It
is defined as the power capacity of any source directly connected to the distribution network where
consumers utilize the electrical energy. Different types of DG system developed in our world and
that are:-
• Photovoltaic systems (PVs)
• Wind energy
• Bio-mass energy
• Fuel cells
• Gas turbines
• Small hydropower
• Geothermal Energy
2.1 Photovoltaic systems
In these systems the solar energy converts into electrical energy. This technology was invented in
1930. These systems are also known as solar panels. The PV systems consist of series or parallel
cells which is connected together and these cells absorb the light radiation to convert into electrical
energy.
Fig. 4. V-I Characteristic of Solar PV
The PV systems power depends on the surface area of the cells and footprint sizes. So the PV
system required large size of footprint moderately about 0.02kW/m2. The figure 3 shows the V-I
International Journal of Computational Science, Information Technology and Control Engineering (IJCSITCE) Vol.1, No.3, October 2014
5
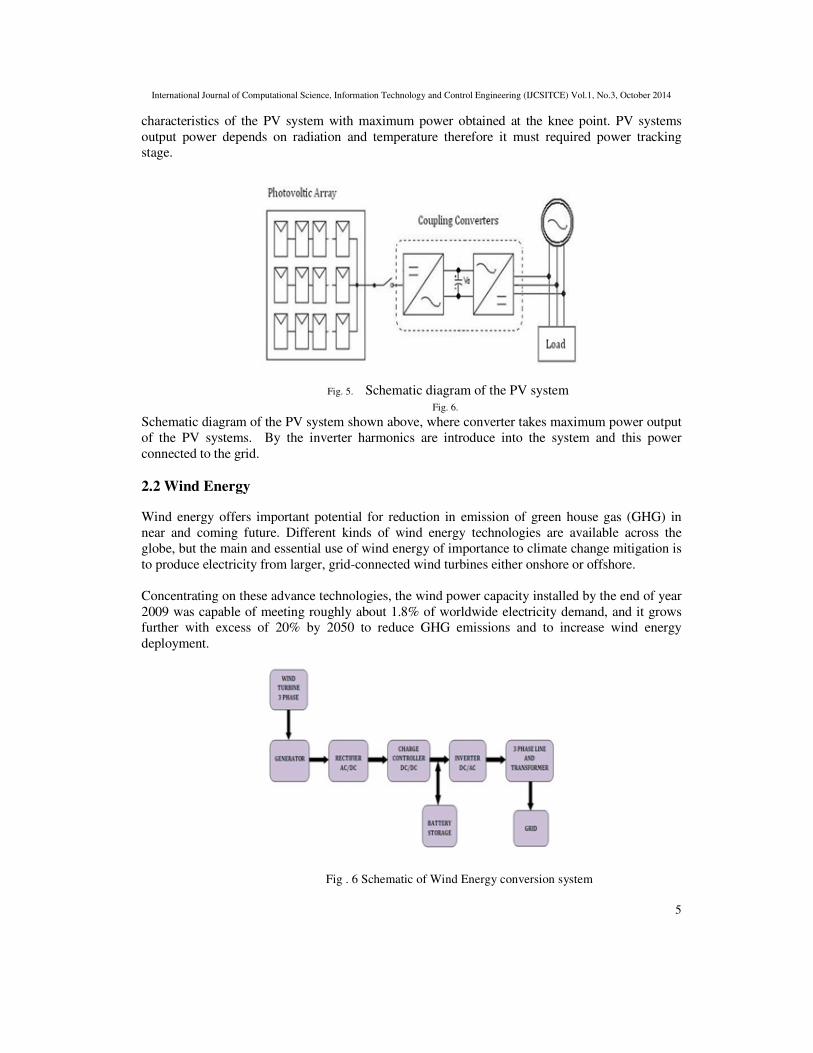
characteristics of the PV system with maximum power obtained at the knee point. PV systems
output power depends on radiation and temperature therefore it must required power tracking
stage.
Fig. 5. Schematic diagram of the PV system
Fig. 6.
Schematic diagram of the PV system shown above, where converter takes maximum power output
of the PV systems. By the inverter harmonics are introduce into the system and this power
connected to the grid.
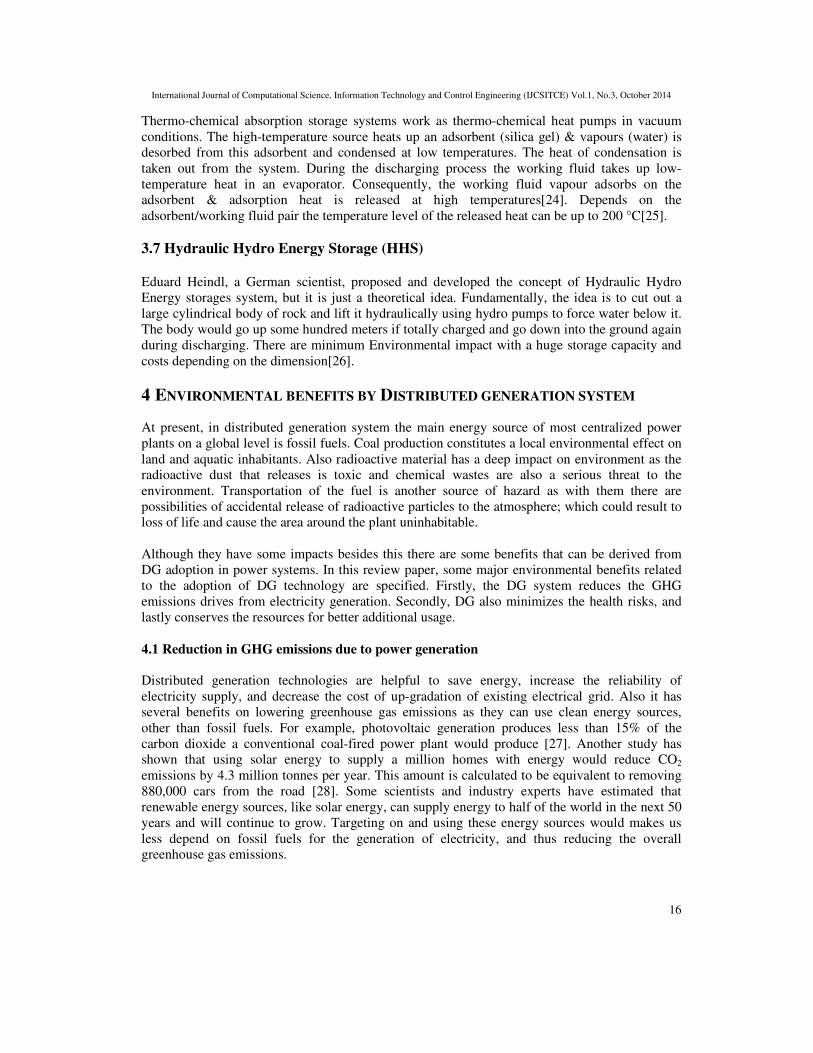
2.2 Wind Energy
Wind energy offers important potential for reduction in emission of green house gas (GHG) in
near and coming future. Different kinds of wind energy technologies are available across the
globe, but the main and essential use of wind energy of importance to climate change mitigation is
to produce electricity from larger, grid-connected wind turbines either onshore or offshore.
Concentrating on these advance technologies, the wind power capacity installed by the end of year
2009 was capable of meeting roughly about 1.8% of worldwide electricity demand, and it grows
further with excess of 20% by 2050 to reduce GHG emissions and to increase wind energy
deployment.
Fig . 6 Schematic of Wind Energy conversion system

International Journal of Computational Science, Information Technology and Control Engineering (IJCSITCE) Vol.1, No.3, October 2014
6
Fig. 7. Wind power installed capacity in India
For generation of electricity, it is essential that wind speed should be 4 to 25 m/s or more [4].
During last two decades the work is done on the size of wind turbine blades. Wind turbine size has
been increased rapidly with the leading units now being about 4 MW compared to the 1970s unit
sizes which is below 20 kW. For wind turbines above 1.0MW size to overcome mechanical
stresses, they are equipped with a variable speed system incorporating power electronics. Single
units can normally be integrated to the distribution grid of 10–20 kV, though the present trend is
that wind power is being located off shore in larger parks that are connected to high voltage levels,
even to the transmission system. As of 2010, turbines stand on towers more than 80 m in height,
with three-bladed rotors that go beyond 80 m in diameter; machinery with rotor diameters and
tower heights in excess of 125 m are operating commercially, and even larger machines are under
development. Wind power plants are generally placed on land known as ‘onshore’ by the end of
2009, but with the help of new technologies small proportion of wind power plants may also
installed in sea and as the technology advances, offshore wind energy is likely to become a more
important source of overall wind energy supply. Continuous advancement in onshore and offshore
wind energy technology is expected in future, however, further reducing the cost of wind energy
and improving wind energy’s GHG emissions reduction potential.
Beyond the use of large, modern wind turbines for electricity supply, a number of additional wind
energy applications and technologies are currently employed such as Small wind turbines.
Smaller-scale wind turbines are used in a wide range of applications. Though it do not benefit from
the economies of scale that have helped reduce the cost of larger wind turbines, providing
electricity services to meet a wide variety of household or community energy needs [6]. For rural
electrification or isolated areas, small wind turbines can be used on a stand-alone basis for battery
charging or can be combined with other supply options (e.g., solar and/or diesel) in hybrid
systems. Small wind turbines are also employed in grid-connected applications for both residential
and commercial electricity customers.
2.3 Biomass Energy
For future aspect Biomass is consider to be one of the most important renewable energy source.
With the help of plants and animals Biomass is produced which is also known as organic material.
The stored energy from sun is contained in biomass. In the process of photosynthesis, plant absorb
the sun light and convert them into chemical energy and when this plants are taken by animals then

International Journal of Computational Science, Information Technology and Control Engineering (IJCSITCE) Vol.1, No.3, October 2014
7
the residue of those animals are used as biomass energy. When biomass is burnt, the chemical
energy is unconfined as heat, which is further used for electricity production. The unused
remainder of forestry and agriculture, like corn stovers, rice husks, wood waste and pressed sugar
cane are recycled using this energy.
Fig. 8. Biomass Energy Sources
In the report of International Energy Agency, Biomass is responsible for 11% of the world’s
energy including heat and power. From this report it can be easily acknowledged biomass is of
great use in fulfilling the world energy demand. When biomass is burn in air at the rate of 4-5 kg
of air per kg of biomass then this process is termed as combustion of biomass. For thermal
applications the combustion on small-scale is used and on large scale is used for power generation.
About 32% of the total primary energy used in the country is still derived from biomass and more
than 70% of the country’s population depends upon it for its energy needs. Since February 2012,
1142 MW of biomass based generation capacity has been installed in India [7]. The global
installed capacity for Biomass power and heat stood at 62,000 MW in 2010. According to
the MNRE (Ministry for New and Renewable Energy in India), India’s share stood at 2665 MW
with the bulk of it (1666 MW) coming from sugarcane bagasse cogeneration projects and only 999
MW coming from biomass power plants.

International Journal of Computational Science, Information Technology and Control Engineering (IJCSITCE) Vol.1, No.3, October 2014
8
Fig. 9. Schematic Diagram of Biomass Energy process
2.4 Fuel cells
A fuel cell is like a battery that generates electricity from an electrochemical reaction. Both
batteries and fuel cells convert chemical energy into electrical energy with heat as a by-product.
However, a battery stores energy within and once this is depleted the battery must be discarded, or
it must be recharged by electricity as an external supply to drive the electrochemical reaction in the
reverse direction.
On the other hand, a fuel cell uses an external supply of chemical energy and can run for an
indefinite period, till hydrogen and oxygen (air) supplied as a source in it. The hydrogen source in
general referred to as the fuel and this gives the name fuel cell, although combustion process is not
involved in this. Oxidation of the hydrogen instead takes place electrochemically in an efficient
mode. As hydrogen atoms react with oxygen atoms to form water, the electrons are released and
flow through an external circuit as an electric current. All fuel cells are based around a central
design using two electrodes separated by a solid or liquid electrolyte that carries electrically
charged particles between them. A catalyst is often used to speed up the reactions at the electrodes.
Fuel cell types are generally characterized by the material and nature of electrolyte used. Each type
requires particular materials and fuels and is suitable for different applications. Mainly there are
six major types of fuel cells exist classified as:
Proton Exchange Membrane Fuel Cell (PEMFC)
Direct Methanol Fuel Cells (DMFC)
Alkaline Fuel Cell (AFC)
Phosphoric Acid Fuel Cell (PAFC)
Solid Oxide Fuel Cell (SOFC)
Molten Carbonate Fuel Cell (MCFC)
Although AFC is not suitable for DG application as the CO2 and CO constituents in the fuel are
high. To obtain AC current from fuel cell technology, power conditioning equipment is required to
invert the generated DC current into AC current that is essential to be integrated with the
distribution network. Generally a fuel cell plant consists of three major parts, as shown in

International Journal of Computational Science, Information Technology and Control Engineering (IJCSITCE) Vol.1, No.3, October 2014
9
Figure__: a fuel processor that removes fuel impurities and may enhance concentration of
hydrogen in the fuel; a power section which consists of a set of stacks containing catalytic
electrodes, generating the electricity; and a power conditioner that converts the direct cycle current
produced in the power section into alternating cycle current to be connected to the grid [8].
Fig. 10. Block diagram of Fuel Cell Plant
2.5 Gas Turbines
A gas turbine, or else known as a combustion turbine, is a rotary engine that extracts energy from a
flow of combustion gas. Gas turbine consists of a combustion chamber in-between the upstream
compressor attached to a downstream turbine. Gas turbines are generally classified into three main
categories as: heavy frame, aero derivative, and micro-turbine. This technology is mainly based
upon aircraft auxiliary power units and automotive technique turbo chargers [9].
Fig. 11. Block diagram of Gas turbine plant
In gas turbine technology the combustor is the place where ignition of mixture takes place which
consist of air and fuel. Because of this an addition of the energy to the gas stream is done. There is
an abrupt boost in the temperature, velocity and gas flow volume due to Combustion process. This
is focussed through a nozzle over the turbine’s blades, rotating the turbine and powering the
compressor. In the form of shaft power, compressed air and thrust energy is extracted which
finally used to power aircraft, trains, ships, generators etc [10].

International Journal of Computational Science, Information Technology and Control Engineering (IJCSITCE) Vol.1, No.3, October 2014
10
Micro turbines (MT) are become mostly used for distributed power, combined heat and power
applications as they can setup in motion quickly. Micro turbines technology is one of the most
enriched and useful technologies for powering hybrid electric vehicles. Generally micro turbine
systems range from 30 kW to 400 kW, while conventional gas turbines range from 500 kW to
more than 300MW [11].
The working principle of the Micro-turbines is based on the thermodynamic cycle known as the
Brayton cycle [12]. In the working process the compressor drawn air with the help of inlet pipe
and then it is pressurized and forced into the recuperator, where it is first heated up and then enters
into the combustion chamber. The heated air and fuel are mixed together and burnt. The energy
liberated from this mixture, expands through the turbine that is used to drive the turbine with the
seed of 96,000 rpm, as this has been attached to the shaft of the generator. Thus the generator
produces high frequency alternating cycle (AC) power that is converted to power frequency with
the help of power electronic devices.
For decades to generate power Combustion Turbines (CT) are mostly has been used, which consist
of a heavy frame and aero derivatives and they are generally used in major industrialized and
utility generation stations.
2.6 Small Hydropower
For the generation of hydroelectricity at small power levels ‘‘Small hydro’’ installations are
define. Generally, the power generated from these small hydro plant installations are categorised in
two ways; for ‘‘micro hydroelectric’’ power stations the range can be in 5 kW to 100 kW, and for
mini hydro-power stations it can be in between 500 kW and 10MW.
These plants have heads within the range of 1.5 m to 400 m with flows ranging from several
hundreds of litres per second to several tens of cubic meters per second [6]. The benefits of these
plants are that they can provide a constant supply of electricity throughout the year. Another
important approach to hydropower is that there is no requirement of water storage; this only
depends on the stream’s natural flow. Usually they are also known as “run-of-river” plants as it
depends on the stream’s natural flow, and are capable to make use of smaller water flow volumes
without the requirement of large reservoirs. In these systems, water flow through the pipe to rotate
the turbine blades before returning into the stream. The amount of generated electricity depends on
the flow and the elevation difference between the water’s surface and the turbine-generator. They
have a capacity of less than 30 MW, and the power produced can be used locally or sold into a
distribution grid [13, 14].
TABLE I. POWER CAPACITY
Plant type Hydra
ulic head
Power
capacity (MW)
Micro hydro
power
< 30
feet
Upto 100
KW
Mini hydro
power
< 30
feet
100 KW to
2 MW
Small hydro
power
>30
feet
2 MW to 25
MW

International Journal of Computational Science, Information Technology and Control Engineering (IJCSITCE) Vol.1, No.3, October 2014
11
Fig. 12. Small hydro power plant
(Source: Veolia Group of companies)
Electromechanical solutions should be adopted in a small hydro-power station to make it simple,
strong, with less maintenance and assuring profitability of the investments. On depend upon these;
many turbine manufacturers have developed units for small hydroelectric systems. Their designs
are mainly based on the following: the optimum use of the latest research into turbine machines;
the delivery of the electromechanical apparatus in a compact easy to install and easy to operate
form; and simple hydraulic design. This approach is appropriate to powers between 100 and 2000
kW range [15].
2.7 Geothermal
Geothermal power is one of the most usable renewable energy sources that exist on the planet
earth today. Geothermal energy is simply the heat generated inside the planet earth. This heat is
utilised for the production of energy at a large scale with the help of geothermal power plants.
More than 6000 MW installed generation capacity is in 21 countries across the globe [16]. The
biggest geothermal plant at present in operation is found in an area called The Geysers, in north
San Francisco. The hot water springs and hot rock found a few miles below the earth’s surface and
in more deep down the extremely high temperatures of molten rock known as magma are the main
resources of geothermal energy.
Deep holes are drilled into the earth to discover a significant geothermal hot spot to harness the
energy. After discovering the heat source, a pipe is attached deep down inside the hole, which
allows hot steam to flow from deep within the earth’s crust to the earth surface. The pressurized
steam goes towards the turbine section, which make turbine blades to turn with the large force of
the steam. The turbine is coupled to the generator which in turns begins to rotate and leads to
generation of electricity. After this a stream of cold water is pumped down using a new pipe which
is heated by the earth and sent back with first pipe to repeat the process.

International Journal of Computational Science, Information Technology and Control Engineering (IJCSITCE) Vol.1, No.3, October 2014
12
(Source: geothermal.id.doe.gov)
Fig. 13. Geothermal Power plant
Geothermal power plant are mainly categorized in two category, these are Binary stem power plant
and Flash Steam power plant. Binary steam power plant uses Iso-Butane for heat exchange and its
vapors to rotate turbine to generate electricity. On the other hand Flash Steam power plant simply
uses water to generate electricity.
Geothermal power plant has some advantages; firstly geothermal system is extremely environment
friendly. Even though, release some gases from inside the earth, which may be harmful, but these
can be contained quite easily. Secondly, the cost of the land for geothermal power plant is usually
less expensive than the construction of oil, gas, coal, or nuclear power plant. As there is no carbon
emission, this makes geothermal energy very clean and therefore there are no environmental bills
or quotas to comply with the countries carbon emission scheme.
However, some of the disadvantages include non-availability of geothermal hot spots in the land of
interest. Even when found, the following questions are usually of concern during a survey: is the
rock soft enough to drill through? Do the rocks deep down contain sufficient heat? Will this heat
be sustainable for a significant amount of time? Is the environment fit for a power plant? [17].

International Journal of Computational Science, Information Technology and Control Engineering (IJCSITCE) Vol.1, No.3, October 2014
13
3 ELECTRICAL ENERGY STORAGE TECHNOLOGY
Today world climate is changing because resources are running low, pollution is increasing. In
the coming year fossil fuels are shortage for production and demand of electrical energy. For this
we should have to find substitutes that will assurance our wealth and further growth on a long
term. Like wind turbines, photovoltaic cells, biomass plants and more are that alternatives which
fulfil the above demand. Compared to conventional power plants they generate smaller amounts
of electricity and main problematic issues are irregularity of the production. Electricity demand is
huge of the globe at present time and it’s increasing 3.6 percent yearly.
Government are concerned to improve efficiencies and lower the costs of renewable energy
sources technologies with the rising importance of this technology. At the power grid flow of
electricity is always on the same level to avoid blackout and damage to the grid. Irregularity of
electricity production problems came out because the sun isn’t shining nor is the wind always
blowing. Therefore Storage technology came into market to balance out the demand of energy.
Storing energy technology plays a key role between distributor and consumer. Its fulfil the energy
demand of consumers when renewable energy sources are not in working condition.
Different types of energy storage technology are described below:-
3.1 Flywheels
Disks are attached to a rotor in modern high tech flywheels in standing position so that the gravity
influence is prohibited. In the method of discharging they perform as generator when simply
charged by electric motor.
The friction should be minimum as much as possible so that the efficiency of the flywheel is
more. This can be easily done by following two methods:
� To reduce air friction the disk should be rotate in the vacuum.
� To make rotor in floating condition it should be allowed to spin on the permanent and
electromagnetic bearings.
The modern single flywheel has a spinning speed of 16.000 rpm and capacity of 25kilowatt hours
(kWh)[18].
The motor or generator is present in rotor in order to translate energy among the forms of
electrical and mechanical. To store energy steel rotor systems are depend on mass and composite
flywheels are depend on the speed of the rotor. When speed of the flywheel is increased electric
current flow through the motor in the process of charging and in discharging process system has
been slow down the wheel when the generator produces current flow out. At the maximum speed
of the flywheel optimization of energy-to-mass ratio is possible. To minimize air resistance
frictionless bearings and vacuum are used that will help to maintain rundown time for 6 months.
For performing critical tasks flywheels are used as uninterruptible power supply (UPS) systems.
Advantages
� Flywheels are more capable and rapid in storing and releasing a huge amount of power as
compare to batteries.
� The technology of flywheels has a life span of about 20-30 years without any maintenance.

International Journal of Computational Science, Information Technology and Control Engineering (IJCSITCE) Vol.1, No.3, October 2014
14
� Memory effect does not cause any problem to flywheels.
� Under a high range of environment circumstances and temperatures they can be easily
operable.
� The amount of energy that is stored in flywheels can be simply recognized by calculating
the speed of rotation.
Challenges
� Due to load the threat of explosive crushing occur which troubled the use of flywheel
accumulators.
� The tensile strength of the rotor’s material is among the crucial confines in designing the
flywheel.
3.2 Superconducting Magnetic Energy Storage (SMES)
Superconducting magnetic energy storage (SMES) systems are based on the principle of electro
dynamic. Due to flow of direct current in a superconducting coil, magnetic fields are created
which stores the energy. In earlier days superconducting materials operate at 4 °K but to increase
the storage capacity today they can operate at 100 °K. The coil made of superconducting material
is the main element of this type of storage system. Power conditioning equipment and a
cryogenically cooled refrigeration system are the supplementary parts of this system[19].
The power which is requested is provided very quickly due to the fast response time. On the
whole the round-trip efficiency of the system is 85 % - 90 %. The refrigeration system is
responsible for the consistency of the SMES.
The energy demand of the refrigeration system results in less storage times. For high-energy
physics experiments and nuclear fusion the SMES systems in which the power is more than
10MW are used to detect the particles. To control the quality of power small SMES goods, that
are present commercially, in plants manufacturing like microchip fabrication facilities.
3.3 Pumped Storage
In the entire world 99% pumped hydro storage power plants installed with 120 GW electrical
storage capacities, which is about 3 % of global generation capacity. In charging process two
water reservoirs installed at dissimilar elevations to pump water during off peak hours from the
lower to the upper reservoir. At the time of demand, the water provided from the upper to the
lower reservoir for powering a turbine with a generator to generate electricity that is discharging
process. For the upper and lower reservoirs, high dams, swamped mine shafts, other underground
cavities and the open sea are used for the pumped storage technology. First Sea water pumped
hydro plant was build in Japan with 30 MW capacities in 1999[20].
Discharge times for pumped hydro storage are some hours to a few days. Pumped hydro storage
plants have an efficiency of 70 % to 85 %. It has basically infinite cycle stability and in standby
for very long lifetime. Dependency on topographical conditions and big land uses shows its
drawbacks [21].
3.3 Compressed Air Energy Storage (CAES)
In the 19th century Compressed air energy storage technology is invented for different
applications. In this technology air is used as a storage media. For storage of energy an

International Journal of Computational Science, Information Technology and Control Engineering (IJCSITCE) Vol.1, No.3, October 2014
15
underground structure are created with the help of pipes where air is compressed by electrical
energy. When needed the compressed air is assorted with natural gas, burned and expanded in a
modified gas turbine. The air has to be reheated earlier to expansion in the turbine. If the heat has
no storage and is dissipated by cooling during compression process. This method is known as
diabatic CAES and results in low round-trip efficiencies of less than 50 %. Diabatic technology is
well verified; the diabatic CAES plants are highly reliable and are capable of starting without
extraneous power [21].
3.4 Battery energy storage system (BESS)
The major function of the battery energy storage system (BESS) is to offer energy spinning
reserve when there is any power plant or transmission line equipment fails. For Battery energy
storage systems, to store electricity in form of chemical energy, rechargeable batteries are used.
To meet the requirements, the battery must be of high energy density, high power, high charge
efficiency, good cycling capability, long life and low initial cost. The existing battery storage
systems are made up of lead-acid cells, as found in automobile batteries. The difference in battery
systems is depends upon the materials used as electrodes and electrolyte.
The technologies have been used for energy storage applications classified as: Lead- Acid based
batteries, Nickel based batteries and lithium based batteries.
A new technology known as Sodium Sulphur (NaS) technology has been developed with good
potentials to be applied in micro grid applications for power regulations. China has declared an
installation of the first industrial NaS battery station (100/800kWh) in the world Expo 2010
Shanghai. Another NaS energy storage technology is in the island of Graciosa in the Canary
Islands, where a stand-alone renewable energy network is currently being developed. The sodium
nickel chloride battery is better known as the ZEBRA battery. This technology has mostly been
used in electric vehicles and submarines [22].
3.6 Thermal energy storage
Thermal energy storage systems provided heat by different ways in an insulated repository for
later use in different industrial and residential applications like space cooling or heating,
electricity generation and hot water production. Thermal storage systems are deployed to
overcome the inequality between supply and demand of thermal energy and thus they are
essential for the integration of renewable energy sources.
Thermal storage further classified into different technologies: Latent heat storage, Sensible heat
storage and thermo-chemical absorption storage.
Latent heat storage is done by means of phase change materials (PCMs) as storage media. There
are organic and inorganic PCMs used for this kind of storage systems. Latent heat is the “Hidden
Heat”, which is the energy exchange during a phase change just like the melting of ice as an
example as there is no change in temperature during energy transfer. Ice coolers are the best
examples of Latent heat cold storage systems[23].
The sensible heat storage is the well known and broad spread technologies such as domestic hot
water tank. The storage medium may be a liquid, thermo-oil or a solid such as concrete. Thermal
energy is stored exclusively with a change in temperature of the storage medium. The storage
system capacity is defined by the specific heat capacity and the medium mass used.
International Journal of Computational Science, Information Technology and Control Engineering (IJCSITCE) Vol.1, No.3, October 2014
16
Thermo-chemical absorption storage systems work as thermo-chemical heat pumps in vacuum
conditions. The high-temperature source heats up an adsorbent (silica gel) & vapours (water) is
desorbed from this adsorbent and condensed at low temperatures. The heat of condensation is
taken out from the system. During the discharging process the working fluid takes up low-
temperature heat in an evaporator. Consequently, the working fluid vapour adsorbs on the
adsorbent & adsorption heat is released at high temperatures[24]. Depends on the
adsorbent/working fluid pair the temperature level of the released heat can be up to 200 °C[25].
3.7 Hydraulic Hydro Energy Storage (HHS)
Eduard Heindl, a German scientist, proposed and developed the concept of Hydraulic Hydro
Energy storages system, but it is just a theoretical idea. Fundamentally, the idea is to cut out a
large cylindrical body of rock and lift it hydraulically using hydro pumps to force water below it.
The body would go up some hundred meters if totally charged and go down into the ground again
during discharging. There are minimum Environmental impact with a huge storage capacity and
costs depending on the dimension[26].
4 ENVIRONMENTAL BENEFITS BY DISTRIBUTED GENERATION SYSTEM
At present, in distributed generation system the main energy source of most centralized power
plants on a global level is fossil fuels. Coal production constitutes a local environmental effect on
land and aquatic inhabitants. Also radioactive material has a deep impact on environment as the
radioactive dust that releases is toxic and chemical wastes are also a serious threat to the
environment. Transportation of the fuel is another source of hazard as with them there are
possibilities of accidental release of radioactive particles to the atmosphere; which could result to
loss of life and cause the area around the plant uninhabitable.
Although they have some impacts besides this there are some benefits that can be derived from
DG adoption in power systems. In this review paper, some major environmental benefits related
to the adoption of DG technology are specified. Firstly, the DG system reduces the GHG
emissions drives from electricity generation. Secondly, DG also minimizes the health risks, and
lastly conserves the resources for better additional usage.
4.1 Reduction in GHG emissions due to power generation
Distributed generation technologies are helpful to save energy, increase the reliability of
electricity supply, and decrease the cost of up-gradation of existing electrical grid. Also it has
several benefits on lowering greenhouse gas emissions as they can use clean energy sources,
other than fossil fuels. For example, photovoltaic generation produces less than 15% of the
carbon dioxide a conventional coal-fired power plant would produce [27]. Another study has
shown that using solar energy to supply a million homes with energy would reduce CO2
emissions by 4.3 million tonnes per year. This amount is calculated to be equivalent to removing
880,000 cars from the road [28]. Some scientists and industry experts have estimated that
renewable energy sources, like solar energy, can supply energy to half of the world in the next 50
years and will continue to grow. Targeting on and using these energy sources would makes us
less depend on fossil fuels for the generation of electricity, and thus reducing the overall
greenhouse gas emissions.
International Journal of Computational Science, Information Technology and Control Engineering (IJCSITCE) Vol.1,
Fig. 15.
Indonasia2
.3
Germany
2.23
Korea
1.76
Canada
1.58
European
Country wise data for CO
0
5
10
15
20
25
30
35
GH
G E
mis
sio
n i
n %
International Journal of Computational Science, Information Technology and Control Engineering (IJCSITCE) Vol.1, No.3, October 2014
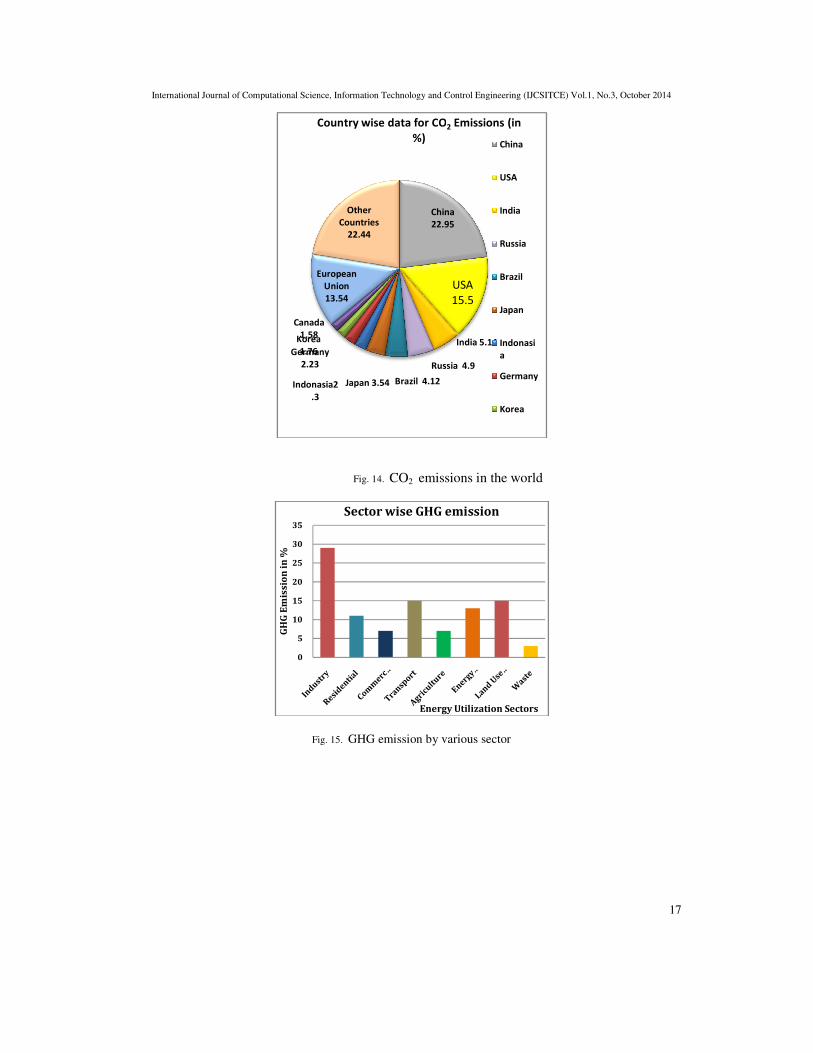
Fig. 14. CO2 emissions in the world
Fig. 15. GHG emission by various sector
China
22.95
USA
15.5
India 5.14
Russia 4.9
Brazil 4.12Japan 3.54Indonasia2
Germany
Korea
Canada
European
Union
13.54
Other
Countries
22.44
Country wise data for CO2 Emissions (in
%)China
USA
India
Russia
Brazil
Japan
Indonasi
a
Germany
Korea
Energy Utilization Sectors
Sector wise GHG emission
No.3, October 2014
17

International Journal of Computational Science, Information Technology and Control Engineering (IJCSITCE) Vol.1, No.3, October 2014
18
Fig. 16. GHG emission by energy resources
4.2 Minimizes damage to health
Distributed generation technologies are able to tone down climate change and as a result reduce
health risks. DG is capable of achieving this in two ways. Firstly, the reduction of dependency on
the central grid enables less power losses, and hence minimum power is produced from the
conventional plants. Secondly, the patterns of emissions from outdoor pollutants like NOx, SO2,
and others from clean DG units are less hazardous. Due to these two factors, the quality of air is
being conserved from man-made pollutants, which in turn means reduction in health damage.
5 RURAL ELECTRIFICATION BY DISTRIBUTED GENERATION
Adjacent to the electricity needs for industrial development, much more needed to satisfy
domestic energy consumption. At present, around 2 billion of populations around the world live
without access to electricity and about 98% of them dwelling in developing countries. In
developing countries rural areas are the major victims. Rural electricity supply in India is
suffering both in terms of availability for measured number of hours & penetration level. Out of
the 27 Indian States, more than 24 States have more than 25% of their rural households yet to
have an access to electricity [29]. A major blockage in the growth of the power sector is the poor
economic state of the State electricity boards (SEBs), which can be attributed to the lack of
satisfactory revenues & high Transmission &Distribution losses to the tune of over 25 %. Due to
high T&D losses and low collection effectiveness state utilities have very little incentive to
supply electricity to rural areas. This condition of energy deficiency intensely justifies the socio-
economic inequality between industrialized and developing countries on wider geographical
range.
Distributed power generation, based on locally existing energy resources and supply of this
additional electricity into the rural electricity grid, can be an significant part of the solution to
deliver reliable electricity supply to rural population [30]. In few years, an increased
environmental concern has driven DG to become a clean and efficient choice to the conventional
electric energy sources [31].
0
5
10
15
20
25
30
35
40
Coal Natural
Gas
Oil Direct
Emissions
Waste
GH
G E
mis
sio
n i
n %
Energy Resourses
Resource wise GHG emission

International Journal of Computational Science, Information Technology and Control Engineering (IJCSITCE) Vol.1, No.3, October 2014
19
Fig. 17. Projected Generation of electricity in Billion KWh
(Source EIA AEO 2013)
6 CONCLUSION
The recent attention paid to distributed generation is not surprising, in-depth study of the
electricity market scenario and characteristics of distributed generation confirmed, distributed
generation can consider becoming an alternative also it can overcome considerable obstacles also
there is various application like Rural Electrification in country like India.
REFERENCES
[1] EnergyInformationAdministration(EIA),http://www.eia.gov/ieo/and
http://www.eia.gov/forecasts/aeo/
[2] Developmental Impacts and Sustainable Governance Aspects of Renewable Energy Projects, Ministry
of New and Renewable Energy (MNRE), India, September 2013.
[3] Mendez VH, Rivier J, Fuente JI, Gomez T, Arceluz J, Marin J, et al. Impact of distributed generation
on distribution investment deferral. International Journal of Electrical Power and Energy Systems
2006;28:244–52.
[4] http://www.downtoearth.org.in/content/growth-renewable-energy-india#.
[5] Wiser, R., Z. Yang, M. Hand, O. Hohmeyer, D. Infield, P. H. Jensen, V. Nikolaev, M. O’Malley, G.
Sinden, A. Zervos, 2011: Wind Energy. In IPCC Special Report on Renewable Energy Sources and
Climate Change Mitigation, Cambridge University Press, Cambridge, United Kingdom and New
York, NY, USA.
[6] Byrne, J., A. Zhou, B. Shen, and K. Hughes (2007). Evaluating the potential of small-scale renewable
energy options to meet rural livelihoods needs: A GIS-and lifecycle cost-based assessment of Western
China’s options. Energy Policy, 35, pp. 4391-4401.
[7] www.intelligent-energy.com: Green Solutions for Telecom Towers: Part I
[8] Hatziargyriou N, Donnelly M, Papathanassiou S, Pecas Lopes JA, Takasaki M, Chao H, et al. CIGRE
technical brochure on modeling new forms of generation and storage. CIGRE TF38.01.10 2000.
[9] Willis HL, Scott WG. Distributed power generation: planning and evaluation. Marcel Dekker; 2000.
[10] Microturbines. Retrieved 8th July 2009 from http://enwikipediaorg/wiki/Gas_turbine#cite_note-6.
[11] Mudathir Funsho Akorede, Hashim Hizam, Edris Pouresmaeil, “Distributed energy resources and
benefits to the environment”, Electrical & Electronic Engineering Department, Faculty of
Engineering, Universiti Putra Malaysia, 43400 UPM Serdang, Selangor, Malaysia
[12] Goldstein L, Hedman B, Knowles D, Freedman SI, Woods R, Schweizer T. Gasfired distributed
energy resource technology characterizations. National Renewable Energy Laboratory; 2003,
NREL/TP-620-34783.

International Journal of Computational Science, Information Technology and Control Engineering (IJCSITCE) Vol.1, No.3, October 2014
20
[13] The Opportunities for Distributed Renewable Energy in Kentucky :Rory McIlmoil, Nathan Askins,
Jason Clingerman
[14] Steady growth in small hydro power; Anjan Ghosh,Sabyasachi Majumdar,Avneet Kaur:ICRA Rating
Feature
[15] CIGREWG37-23, Impact of increasing contribution of dispersed generation on the power system –
Final Report. Electra, September 1998.
[16] Fridleifsson IB. Geothermal energy for the benefit of the people. Renewable and Sustainable Energy
Reviews 2001;5:299–312.
[17] Disadvantages of geothermal energy. http://www.clean-
energyideas.com/articles/disadvantages_of_geothermal_energy.html.
[18] Andreas Oberhofer, Peter Meisen: Global Energy Network Institute (GENI)http://www.geni.org:
Energy Storage Technologies & Their Role in Renewable Integration,July 2012
[19] International Energy Agency: Prospects for Large Scale Energy Storage in Decarbonised Grids,
Report, 2009.
[20] T. Fujihara, et al.: Development of pump turbine for seawater pumped-storage power plant, Hitachi
Review 47 (5), pp. 199-202, 1998.
[21] International Electrotechnical Commission;www.iec.ch: Electrical Energy Storage,Dec2011.
[22] Neetu Meena, Vishakha Baharawani, Alka Dubey, Urmila Brighu and Jyotirmay Mathur, “Need and
Comparison of Energy Storage Technologies – A Review”, International Journal of Applied
Engineering Research. ISSN 0973-4562, Volume 9, Number 2 (2014) pp. 177-184
[23] P.Fairley:http://spectrum.ieee.org/energy/environment/largest-solar-thermal-storageplant-to-start-up,
Article 2008, Accessed 27 July 2011
[24] D. Jähnig, et al.: Thermo-chemical storage for solar space heating in a single-family house,10th
International Conference on Thermal Energy Storage: Ecostock 2006, 31 May - 2 June 2006, New
Jersey, USA
[25] P. Schossig: Thermal Energy Storage, 3rd International Renewable Energy Storage Conference,
Berlin/Germany, 24-25 November 2008
[26] Source: http://www.lageenergiespeicher.de/en/concept-and-design.html
[27] Boedecker E, Cymbalsky J, Wade S: Modeling distributed electricity generation in the NEMS
buildings models. Washington, DC: EIA: 2000
[28] Green Power in Montana National Centre for
AppropriateTechnology.http://www.montanagreenpower.com/greenpower/index.html
[29] ERNST & YOUNG, “Models of Rural Electrification Report to forum of Indian regulators,” pp.16
[30] World Bank,“Empowering rural India: Expanding electricity access by mobilizing local resources,”
2010,pp.6.
[31] T.Ackermann , G. Andersson, L. So¨der, “Distributed generation: a definition, Electric Power System
Research,” 57 (2001) 195-204
[32] Distributed Generation Education Modules. http://www.dg.history.vt.edu/ index.html; October, 2008
[33] EIA AEO 2013 Electric Power Sector Electricity Supply, Renewable Energy Generation by Fuel and
EIA MER Table 7.2b
[34] http://www.veoliawater2energy.com/en/references/micro-hydro-power-plants/
[35] http://geothermal.id.doe.gov/what-is.shtml