
Asynchronous Reconfiguration with Byzantine Failures - arXiv
Upload
independentCategory
view
2download
0
IEEE TRANSACTIONS ON POWER SYSTEMS, VOL. 28, NO. 1, FEBRUARY 2013 317
Power Loss Minimization in Distribution SystemUsing Network Reconfiguration in thePresence of Distributed Generation
R. Srinivasa Rao, K. Ravindra, K. Satish, and S. V. L. Narasimham
Abstract—This paper presents a new method to solve the net-work reconfiguration problem in the presence of distributed gen-eration (DG) with an objective of minimizing real power loss andimproving voltage profile in distribution system. A meta heuristicHarmony Search Algorithm (HSA) is used to simultaneously re-configure and identify the optimal locations for installation of DGunits in a distribution network. Sensitivity analysis is used to iden-tify optimal locations for installation of DG units. Different sce-narios of DG placement and reconfiguration of network are con-sidered to study the performance of the proposed method. Theconstraints of voltage and branch current carrying capacity areincluded in the evaluation of the objective function. The methodhas been tested on 33-bus and 69-bus radial distribution systemsat three different load levels to demonstrate the performance andeffectiveness of the proposed method. The results obtained are en-couraging.
Index Terms—Distributed generation, distribution system, Har-mony Search Algorithm, real power loss, reconfiguration, voltageprofile.
NOMENCLATUREReal power flowing out of bus .
Reactive power flowing out of bus .
Real power flowing out of bus afterreconfiguration.
Reactive power flowing out of bus afterreconfiguration.
Real load power at bus .
Reactive load power at bus .
Real power supplied by DG.
Reactive power supplied by DG.
Total effective active power supplied beyondthe bus “ ”.
Total effective reactive power suppliedbeyond the bus “ ”.
Manuscript received October 09, 2011; revised February 23, 2012; acceptedApril 13, 2012. Date of publication May 30, 2012; date of current version Jan-uary 17, 2013. Paper no. TPWRS-00949-2011.R. S. Rao, K. Ravindra, and K. Satish are with the Department of Elec-
trical and Electronics Engineering, J.N.T. University, Kakinada, India (e-mail:[email protected]; [email protected]; [email protected]).S. V. L. Narasimham is with the Computer Science and Engineering Depart-
ment, School of Information Technology, J.N.T. University, Hyderabad, India(e-mail: [email protected]).Color versions of one or more of the figures in this paper are available online
at http://ieeexplore.ieee.org.Digital Object Identifier 10.1109/TPWRS.2012.2197227
Total length of the feeder from source to busin km.
Distance from source to the DG location inkm.
Total number of lines sections in the system.
Shunt admittance at any bus .
Resistance per km of the line section betweenbuses and .
Resistance of the line section between busesand .
Reactance of the line section between busesand .
Loss in the line section connecting busesand .
Total power loss of the feeder.
Total power loss of the feeder afterreconfiguration.
Voltage at bus .
Voltage at bus after reconfiguration.
Maximum bus voltage.
Minimum bus voltage.
Current in line section between buses and.
Maximum current limit of line sectionbetween buses and .
A Bus incidence matrix.
I. INTRODUCTION
D UE to uncertainty of system loads on different feeders,which vary from time to time, the operation and control
of distribution systems is more complex particularly in the areaswhere load density is high. Power loss in a distributed networkwill not be minimum for a fixed network configuration for allcases of varying loads. Hence, there is a need for reconfigura-tion of the network from time to time. Network reconfigurationis the process of altering the topological structure of feeders bychanging open/closed status of sectionalizing and tie switches.In general, networks are reconfigured to reduce real power lossand to relieve overload in the network. However, due to dy-namic nature of loads, total system load is more than its gen-eration capacity that makes relieving of load on the feeders not
0885-8950/$31.00 © 2012 IEEE

318 IEEE TRANSACTIONS ON POWER SYSTEMS, VOL. 28, NO. 1, FEBRUARY 2013
possible and hence voltage profile of the system will not be im-proved to the required level. In order to meet required level ofload demand, DG units are integrated in distribution network toimprove voltage profile, to provide reliable and uninterruptedpower supply and also to achieve economic benefits such asminimum power loss, energy efficiency and load leveling. Todate, network reconfiguration and DG placement in distribu-tion networks are considered independently. However, in theproposed method, network reconfiguration and DG installationare dealt simultaneously for improved loss minimization andvoltage profile.Since network reconfiguration is a complex combinatorial,
non-differentiable constrained optimization problem, many al-gorithms are proposed in the past. Merlin and Back [1] first pro-posed network reconfiguration problem and they used a branch-and-bound-type optimization technique. The drawbackwith thistechnique is the solution proved to be very time consuming asthe possible system configurations are , where is line sec-tions equipped with switches. Based on the method of Merlinand Back [1], a heuristic algorithm has been suggested by Shir-mohammadi and Hong [2]. The drawback with this algorithmis simultaneous switching of the feeder reconfiguration is notconsidered. Civanlar et al. [3] suggested a heuristic algorithm,where a simple formula was developed to determine changein power loss due to a branch exchange. The disadvantage ofthis method is only one pair of switching operations is consid-ered at a time and reconfiguration of network depends on theinitial switch status. Das [4] presented an algorithm based onthe heuristic rules and fuzzy multi-objective approach for opti-mizing network configuration. The disadvantage in this is cri-teria for selecting membership functions for objectives are notprovided. Nara et al. [5] presented a solution using a genetic al-gorithm (GA) to look for the minimum loss configuration in dis-tribution system. Zhu [6] presented a refined genetic algorithm(RGA) to reduce losses in the distribution system. In RGA,the conventional crossover and mutation schemes are refinedby a competition mechanism. Rao et al.[7] proposed HarmonySearch Algorithm (HSA) to solve the network reconfigurationproblem to get optimal switching combinations simultaneouslyin the network to minimize real power losses in the distributionnetwork.Deregulation of electricity markets in many countries world-
wide brings new perspectives for distributed generation of elec-trical energy using renewable energy sources with small ca-pacity. Typically 5-kW to 10-MW capacities of DG units areinstalled nearer to the end-user to provide the electrical power.Since selection of the best locations and sizes of DG units is alsoa complex combinatorial optimization problem, many methodsare proposed in this area in the recent past. Rosehart and Now-icki [8] presented a Lagrangian based approach to determineoptimal locations for placing DG in distribution systems con-sidering economic limits and stability limits. Celli et al. [9]presented a multi-objective algorithm using GA for sitting andsizing of DG in distribution system. Wang and Nehrir [10] pro-posed an analytical method to determine optimal location toplace a DG in distribution system for power loss minimization.Agalgaonkar et al. [11] discussed placement and penetrationlevel of the DGs under the SMD framework.
Fig. 1. Single-line diagram of a main feeder.
In this paper, HSA [12] has been proposed to solve the distri-bution system network reconfiguration problem in the presenceof distributed generation. The algorithm is tested on 33- and69-bus systems and results obtained are compared with othermethods available in the literature.The rest of this paper is organized as follows: Section II gives
the problem formulation, Section III provides sensitivity anal-ysis for DG allocation, Section IV gives the overview of pro-posed optimization algorithm, Section V explains the applica-tion of HSA to network reconfiguration problem in the pres-ence of distributed generation, Section VI presents results, andSection VII outlines conclusions.
II. PROBLEM FORMULATION
A. Power Flow Equations
Power flows in a distribution system are computed by the fol-lowing set of simplified recursive equations [13] derived fromthe single-line diagram shown in Fig. 1:
(1)
(2)
(3)
The power loss in the line section connecting buses andmay be computed as
(4)
The total power loss of the feeder, , may then be de-termined by summing up the losses of all line sections of thefeeder, which is given as
(5)

RAO et al.: POWER LOSS MINIMIZATION IN DISTRIBUTION SYSTEM USING NETWORK RECONFIGURATION 319
Fig. 2. Distribution system with DG installation at an arbitrary location.
B. Power Loss Using Network Reconfiguration
The network reconfiguration problem in a distribution systemis to find a best configuration of radial network that gives min-imum power loss while the imposed operating constraints aresatisfied, which are voltage profile of the system, current ca-pacity of the feeder and radial structure of distribution system.The power loss of a line section connecting buses between and
after reconfiguration of network can be computed as
(6)
Total power loss in all the feeder sections, , may thenbe determined by summing up the losses in all line sections ofnetwork, which is written as
(7)
C. Loss Reduction Using Network Reconfiguration
Net power loss reduction, , in the system is the dif-ference of power loss before and after reconfiguration, that is(5)–(7) and is given by
(8)
D. Power Loss Reduction Using DG Installation
Installation of distribution generation units in optimal loca-tions of a distribution system results in several benefits. Theseinclude reduction of line losses, improvement of voltage profile,peak demand shaving, relieving the overloading of distributionlines, reduced environmental impacts, increased overall energyefficiency, and deferred investments to upgrade existing gener-ation, transmission, and distribution systems. The power losswhen a DG is installed at an arbitrary location in the network asshown in Fig. 2, is given by
(9)
Net power loss reduction, , in the system is the dif-ference of power loss before and after installation of DG unit,that is (9)–(14) and is given by
(10)The positive sign of indicates that the system loss
reduces with the installation of DG. In contrast, the negativesign of implies that DG causes the higher system loss.
E. Objective Function of the Problem
The objective function of the problem is formulated to max-imize the power loss reduction in distributed system, which isgiven by
(11)
(12)
(13)
III. SENSITIVITY ANALYSIS FOR DG INSTALLATION
Sensitivity analysis is used to compute sensitivity factors [14]of candidate bus locations to install DG units in the system.Estimation of these candidate buses helps in reduction of thesearch space for the optimization procedure.Consider a line section consisting an impedance of
and a load of connected between andbuses as given below.
Active power loss in the th-line between and busesis given by
(14)
Now, the loss sensitivity factor (LSF) can be obtained withthe equation
(15)
Using (15), LSFs are computed from load flows and valuesare arranged in descending order for all buses of the givensystem. It is worth to note that LSFs decide the sequence inwhich buses are to be considered for DG unit installation. Thesize of DG unit at candidate bus is calculated using HSA.
320 IEEE TRANSACTIONS ON POWER SYSTEMS, VOL. 28, NO. 1, FEBRUARY 2013
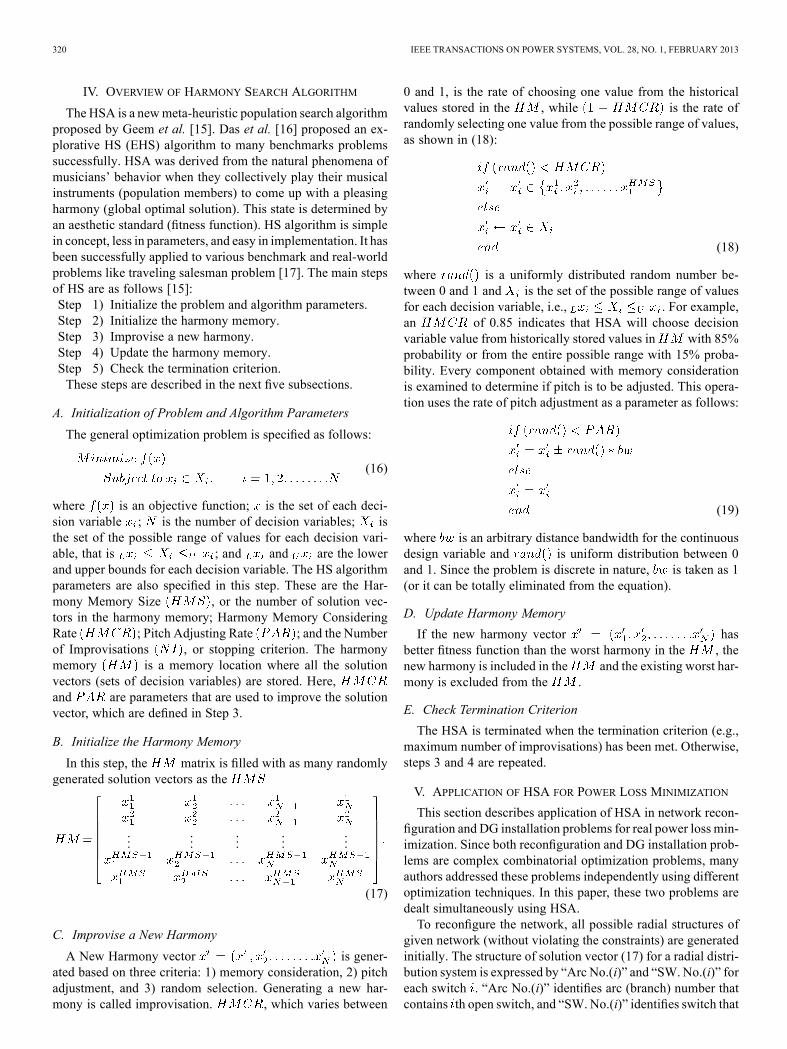
IV. OVERVIEW OF HARMONY SEARCH ALGORITHM
The HSA is a newmeta-heuristic population search algorithmproposed by Geem et al. [15]. Das et al. [16] proposed an ex-plorative HS (EHS) algorithm to many benchmarks problemssuccessfully. HSA was derived from the natural phenomena ofmusicians’ behavior when they collectively play their musicalinstruments (population members) to come up with a pleasingharmony (global optimal solution). This state is determined byan aesthetic standard (fitness function). HS algorithm is simplein concept, less in parameters, and easy in implementation. It hasbeen successfully applied to various benchmark and real-worldproblems like traveling salesman problem [17]. The main stepsof HS are as follows [15]:Step 1) Initialize the problem and algorithm parameters.Step 2) Initialize the harmony memory.Step 3) Improvise a new harmony.Step 4) Update the harmony memory.Step 5) Check the termination criterion.These steps are described in the next five subsections.
A. Initialization of Problem and Algorithm Parameters
The general optimization problem is specified as follows:
(16)
where is an objective function; is the set of each deci-sion variable ; is the number of decision variables; isthe set of the possible range of values for each decision vari-able, that is ; and and are the lowerand upper bounds for each decision variable. The HS algorithmparameters are also specified in this step. These are the Har-mony Memory Size , or the number of solution vec-tors in the harmony memory; Harmony Memory ConsideringRate ; Pitch Adjusting Rate ; and the Numberof Improvisations , or stopping criterion. The harmonymemory is a memory location where all the solutionvectors (sets of decision variables) are stored. Here,and are parameters that are used to improve the solutionvector, which are defined in Step 3.
B. Initialize the Harmony Memory
In this step, the matrix is filled with as many randomlygenerated solution vectors as the
......
......
...
(17)
C. Improvise a New Harmony
A New Harmony vector is gener-ated based on three criteria: 1) memory consideration, 2) pitchadjustment, and 3) random selection. Generating a new har-mony is called improvisation. , which varies between
0 and 1, is the rate of choosing one value from the historicalvalues stored in the , while is the rate ofrandomly selecting one value from the possible range of values,as shown in (18):
(18)
where is a uniformly distributed random number be-tween 0 and 1 and is the set of the possible range of valuesfor each decision variable, i.e., . For example,an of 0.85 indicates that HSA will choose decisionvariable value from historically stored values in with 85%probability or from the entire possible range with 15% proba-bility. Every component obtained with memory considerationis examined to determine if pitch is to be adjusted. This opera-tion uses the rate of pitch adjustment as a parameter as follows:
(19)
where is an arbitrary distance bandwidth for the continuousdesign variable and is uniform distribution between 0and 1. Since the problem is discrete in nature, is taken as 1(or it can be totally eliminated from the equation).
D. Update Harmony Memory
If the new harmony vector hasbetter fitness function than the worst harmony in the , thenew harmony is included in the and the existing worst har-mony is excluded from the .
E. Check Termination Criterion
The HSA is terminated when the termination criterion (e.g.,maximum number of improvisations) has been met. Otherwise,steps 3 and 4 are repeated.
V. APPLICATION OF HSA FOR POWER LOSS MINIMIZATION
This section describes application of HSA in network recon-figuration and DG installation problems for real power loss min-imization. Since both reconfiguration and DG installation prob-lems are complex combinatorial optimization problems, manyauthors addressed these problems independently using differentoptimization techniques. In this paper, these two problems aredealt simultaneously using HSA.To reconfigure the network, all possible radial structures of
given network (without violating the constraints) are generatedinitially. The structure of solution vector (17) for a radial distri-bution system is expressed by “Arc No.(i)” and “SW.No.(i)” foreach switch . “Arc No.(i)” identifies arc (branch) number thatcontains th open switch, and “SW. No.(i)” identifies switch that

RAO et al.: POWER LOSS MINIMIZATION IN DISTRIBUTION SYSTEM USING NETWORK RECONFIGURATION 321
Fig. 3. 33-bus radial distribution system for .
is normally open on Arc No.(i). For large distribution networks,it is not efficient to represent every arc in the string, as its lengthwill be very long. Therefore, to memorize the radial configura-tion, it is enough to number only open switch positions [6].In order to simplify the selection of candidate buses for instal-
lation of DG units a priori, sensitiveness of buses to the changein active power loss with respect to change in active power in-jection at various buses are computed. Then buses are sortedaccording to their sensitivity factors and buses that are moresensitive are picked to install DG units.Application of HSA for loss minimization problem with re-
configuration and DG installation is illustrated with the help ofstandard 33-bus radial distribution system. In 33-bus system,there are five open tie switches with branch numbers 33, 34,35, 36, and 37, respectively, which forms five loops to(if formed) as shown in Fig. 3. Further, assume that candidatebuses for optimal installation of DG units are 8, 20, and 24 asshown in Fig. 3. The ratings of units will vary in discrete stepsat specified location during optimization process.In order to represent an optimal network topology, only posi-
tions of open switches in the distribution network need to beknown. Suppose the number of normally open switches (tieswitches) is N, then length of a first part of solution vector forreconfiguration problem is N. Similarly, length of second partof solution vector is the number of candidate buses chosen forDG units installation. Thus, the solution vector using re-configuration and DG installation is formed as follows:
where , , , , and are open switches in the loopsto corresponding to tie switches 33, 34, 35, 36, and 37,, , and are sizes of DG units in kW installed at candidate
buses 8, 20, and 24, respectively.
Fig. 4. 33-bus radial distribution system for .
Second solution vector is randomly generated withopen switches 19, 13, 21, 30, and 24 in same loops and DGunits at same locations with different ratings is formed as
where , , , , and are open switches corre-sponding to tie switches 19, 13, 21, 30, and 24 in loops of Fig. 4,, , and are sizes of DG units in installed at candi-
date buses 8, 20, and 24, respectively.Similarly, all other possible solution vectors are generated
without violating radial structure or non-isolation of any loadin the network. Total number of solution vectors gen-erated are less than or equal to the highest numbers of switchesin any individual loop.Total Harmony Matrix randomly generated is shown in (20).
For each solution vector of , the objective function is evalu-ated and HM vector is sorted in descending order based on theircorresponding objective function values:
(20)
The new solution vectors are generated and updated using(18). Using new solution vectors, inferior vectors of previousiteration will be replaced with a new randomly generated vectorselected from the population that has lesser objective functionvalue. This procedure is repeated until termination criteria issatisfied. The flow chart of proposed method is shown in Fig. 5.
VI. TEST RESULTS
In order to demonstrate the effectiveness of the proposedmethod (simultaneously reconfiguring the network and instal-

322 IEEE TRANSACTIONS ON POWER SYSTEMS, VOL. 28, NO. 1, FEBRUARY 2013
Fig. 5. Flow chart of the proposed method.
lation of DG units) using HSA, it is applied to two test systemsconsisting of 33 and 69 buses. In the simulation of network,five scenarios are considered to analyze the superiority of theproposed method.
Scenario I: The system is without reconfiguration and dis-tributed generators (Base case);Scenario II: same as Scenario I except that system is recon-figured by the available sectionalizing and tie switches;Scenario III: same as Scenario I except that DG units areinstalled at candidate buses in the system;Scenario IV: DG units are installed after reconfiguration ofnetwork;Scenario V: System with simultaneous feeder reconfigura-tion and DG allocation.
All scenarios are programmed in MATLAB, and simulationsare carried on a computer with Pentium IV, 3.0 GHz, 1 GBRAM.
A. Test System 1
This test system is a 33-bus radial distribution system [18]with five tie-switches and 32 sectionalizing switches. In thenetwork, sectionalize switches (normally closed) are numberedfrom 1 to 32, and tie-switches (normally open) are numberedfrom 33 to 37. The line and load data of network are taken from[7], and the total real and reactive power loads on the system are3715 kW and 2300 kVAR. The parameters of HSA algorithmused in the simulation of network are ,
, and Number of iterations, ,Number of runs, .Using sensitivity analysis [14] sensitivity factors are com-
puted to install the DG units at candidate bus locations for sce-narios III, IV, and V. After computing sensitivity factors at all
TABLE IRESULTS OF 33-BUS SYSTEM
buses, they are sorted and ranked. Only top three locations areselected to install DG units in the system. The limits of DG unitsizes chosen for installation at candidate bus locations are 0 to2 MW. The candidate locations for scenarios III, IV, and V aregiven in Table I. To assess the performance, the network is sim-ulated at three load levels: 0.5 (light), 1.0 (nominal), and 1.6(heavy) and simulation results are presented in Table I.It is observed from Table I, at light load, base case power
loss (in kW) in the system is 47.06 which is reduced to 33.27,23.29, 23.54, and 17.78 using scenarios II, III, IV, and V, re-spectively. The percentage loss reduction for scenario II to Vis 29.3, 50.5, 49.98, and 62.22, respectively. Similarly the per-centage loss reduction for scenarios II to V at nominal and heavyload conditions is 31.88, 52.26, 52.07, and 63.96; 33.86, 54.63,54.87, and 66.23, respectively. This shows that for all the threeload levels, power loss reduction using scenario V (proposedmethod) is highest, which elicits the superiority of the proposed

RAO et al.: POWER LOSS MINIMIZATION IN DISTRIBUTION SYSTEM USING NETWORK RECONFIGURATION 323
Fig. 6. Optimal network structure after simultaneous reconfiguration and DGinstallation.
method over the others. However, as load increases from lightto heavy, improvement in percentage loss reduction in all sce-narios is almost the same.From Table I, it is seen that improvement in power loss reduc-
tion and voltage profile for scenario V are higher when com-pared to scenario IV. This implies that DG Installation afterreconfiguration (scenario IV) does not yield desired results ofmaximizing power loss reduction and improved voltage profile.The percentage improvement in minimum voltage of the
system for scenario II to V at light, medium, and heavy loadis {1.2, 2.52, 2.20, 3.33}, {2.23, 5.60, 3.67, 5.87}, and {4.88,9.62, 6.68, 10.37}, respectively. From this, it is seen thatimprovement in minimum voltage of the system for scenario Vis the highest. Further, it is also observed that fall in minimumvoltage with increase of load from light to peak is least in caseof scenario V.The optimal structure of network after simultaneous recon-
figuration and DG installation for scenario V is shown in Fig. 6.The voltage profile curves of all scenarios at light, nominal,
and heavy load conditions are shown in Fig. 7(a)–(c), respec-tively. The shapes of voltage profiles at all three load levelsfor five scenarios are almost the same except minor change involtage magnitude.To study the effect of number of DG installation locations on
power loss for scenario V, DGs are installed at optimal candidatebus locations in sequence and results are presented in Table II.By sensitivity analysis, candidate bus locations considered forDG installations are 32, 31, 33, and 30. From the Table II, atlight load, it is seen that the percentage power loss reduction im-proves as the number of DG installation locations are increasingfrom one to four, but rate of improvement is decreasing. Similarconclusions may be drawn from Table II with respect to otherload levels. Though power loss is reduced when four DGs are
Fig. 7. Voltage profiles of 33-bus system at light, nominal, and heavy loadconditions.
TABLE IIEFFECT OF NUMBER OF DG INSTALLATIONS ON POWER LOSS
installed, the impact of adding fourth DG on power loss is mar-ginal. Thus, three DG installation gives near optimal power losswith near optimal size compared to other installations.

324 IEEE TRANSACTIONS ON POWER SYSTEMS, VOL. 28, NO. 1, FEBRUARY 2013
TABLE IIICOMPARISON OF SIMULATION RESULTS OF 33-BUS SYSTEM
To compare the performance of HSA, all the scenarios aresimulated with GA [5] and RGA [6] (only at nominal load) andresults are provided in Table III.The population size, crossover rate, and mutation rate are se-
lected as 50, 0.8, and 0.05 for GA and an adaptive mutation rateis applied in the iterative process for RGA. From the table, it isobserved that the performance of the HSA is better compared toGA and RGA in terms of the quality of solutions in all scenarios.
B. Test System 2
This is a 69-bus large-scale radial distribution system with 68sectionalizing and five tie switches. Configuration, line, load,and tie line data are taken from [19].Total system loads for base configuration are 3802.19 kW and
2694,06 kVAr. The sectionalizing switches are labeled from 1 to68 and tie switches from 69 to 73, respectively. HSA parametersof the algorithm used to simulate this test system are same as testsystem 1.Similar to test systems 1, this test system is also simulated for
five scenarios at three load levels and results are presented in theTable IV. The limits of DG unit sizes chosen for installation atcandidate bus locations are same as test case 1.The base case power loss (in kW) at light, nominal, and heavy
load conditions is 55.61, 225.00, and 655.23, respectively. FromTable IV, it is observed that scenario V is more effective inimproving minimum voltage and reducing power loss comparedto other scenarios.The effect of number of locations of DG installations on
power loss at all three load levels is studied and results areprovided in Table V.The candidate bus locations considered for DG installations
are 61, 60, 62, and 63. Similar to case I, it is seen that the re-duction in power loss is minuscule for the fourth DG and henceonly three DGs are enough which gives the near optimal powerloss with near optimal size compared to other installations.Scenarios II to V for nominal load condition are simulated
using GA and RGA to compare with the results obtained by
TABLE IVRESULTS OF 69-BUS SYSTEM
TABLE VEFFECT OF NUMBER OF DG INSTALLATIONS ON POWER LOSS
HSA. From Table VI, it is observed that the performance of theHSA is better compared to GA and RGA in terms of the qualityof solutions in all scenarios.
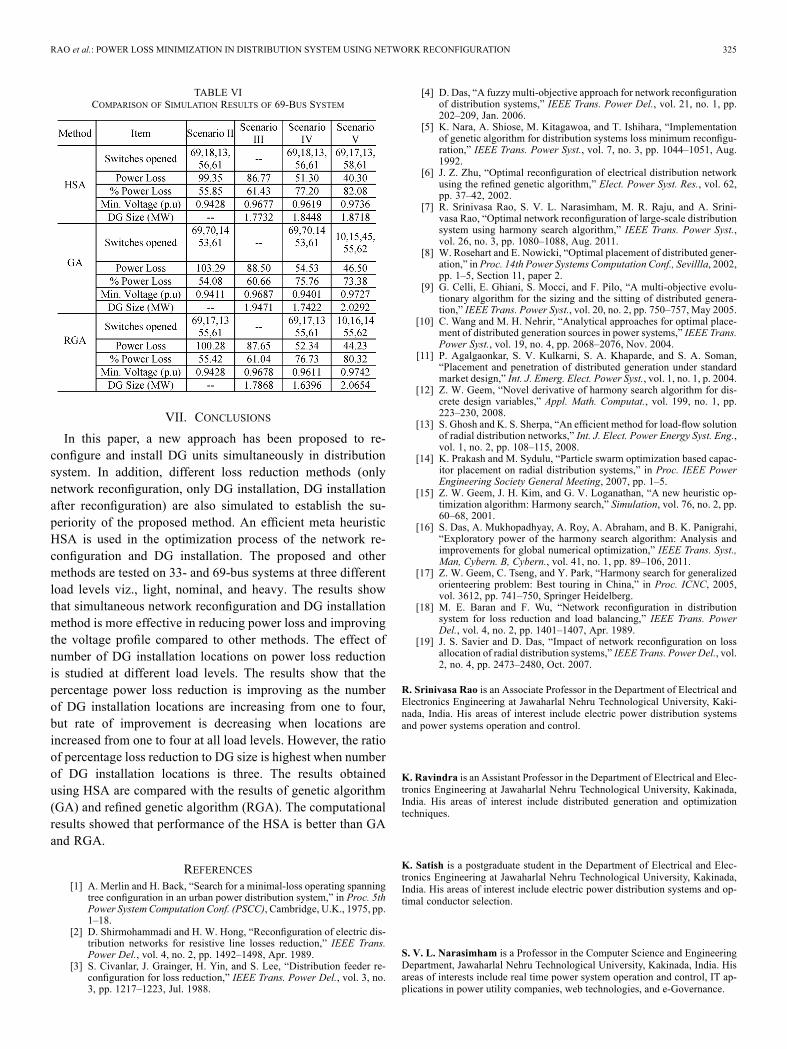
RAO et al.: POWER LOSS MINIMIZATION IN DISTRIBUTION SYSTEM USING NETWORK RECONFIGURATION 325
TABLE VICOMPARISON OF SIMULATION RESULTS OF 69-BUS SYSTEM
VII. CONCLUSIONS
In this paper, a new approach has been proposed to re-configure and install DG units simultaneously in distributionsystem. In addition, different loss reduction methods (onlynetwork reconfiguration, only DG installation, DG installationafter reconfiguration) are also simulated to establish the su-periority of the proposed method. An efficient meta heuristicHSA is used in the optimization process of the network re-configuration and DG installation. The proposed and othermethods are tested on 33- and 69-bus systems at three differentload levels viz., light, nominal, and heavy. The results showthat simultaneous network reconfiguration and DG installationmethod is more effective in reducing power loss and improvingthe voltage profile compared to other methods. The effect ofnumber of DG installation locations on power loss reductionis studied at different load levels. The results show that thepercentage power loss reduction is improving as the numberof DG installation locations are increasing from one to four,but rate of improvement is decreasing when locations areincreased from one to four at all load levels. However, the ratioof percentage loss reduction to DG size is highest when numberof DG installation locations is three. The results obtainedusing HSA are compared with the results of genetic algorithm(GA) and refined genetic algorithm (RGA). The computationalresults showed that performance of the HSA is better than GAand RGA.
REFERENCES[1] A. Merlin and H. Back, “Search for a minimal-loss operating spanning
tree configuration in an urban power distribution system,” in Proc. 5thPower System Computation Conf. (PSCC), Cambridge, U.K., 1975, pp.1–18.
[2] D. Shirmohammadi and H. W. Hong, “Reconfiguration of electric dis-tribution networks for resistive line losses reduction,” IEEE Trans.Power Del., vol. 4, no. 2, pp. 1492–1498, Apr. 1989.
[3] S. Civanlar, J. Grainger, H. Yin, and S. Lee, “Distribution feeder re-configuration for loss reduction,” IEEE Trans. Power Del., vol. 3, no.3, pp. 1217–1223, Jul. 1988.
[4] D. Das, “A fuzzy multi-objective approach for network reconfigurationof distribution systems,” IEEE Trans. Power Del., vol. 21, no. 1, pp.202–209, Jan. 2006.
[5] K. Nara, A. Shiose, M. Kitagawoa, and T. Ishihara, “Implementationof genetic algorithm for distribution systems loss minimum reconfigu-ration,” IEEE Trans. Power Syst., vol. 7, no. 3, pp. 1044–1051, Aug.1992.
[6] J. Z. Zhu, “Optimal reconfiguration of electrical distribution networkusing the refined genetic algorithm,” Elect. Power Syst. Res., vol. 62,pp. 37–42, 2002.
[7] R. Srinivasa Rao, S. V. L. Narasimham, M. R. Raju, and A. Srini-vasa Rao, “Optimal network reconfiguration of large-scale distributionsystem using harmony search algorithm,” IEEE Trans. Power Syst.,vol. 26, no. 3, pp. 1080–1088, Aug. 2011.
[8] W. Rosehart and E. Nowicki, “Optimal placement of distributed gener-ation,” in Proc. 14th Power Systems Computation Conf., Sevillla, 2002,pp. 1–5, Section 11, paper 2.
[9] G. Celli, E. Ghiani, S. Mocci, and F. Pilo, “A multi-objective evolu-tionary algorithm for the sizing and the sitting of distributed genera-tion,” IEEE Trans. Power Syst., vol. 20, no. 2, pp. 750–757, May 2005.
[10] C. Wang and M. H. Nehrir, “Analytical approaches for optimal place-ment of distributed generation sources in power systems,” IEEE Trans.Power Syst., vol. 19, no. 4, pp. 2068–2076, Nov. 2004.
[11] P. Agalgaonkar, S. V. Kulkarni, S. A. Khaparde, and S. A. Soman,“Placement and penetration of distributed generation under standardmarket design,” Int. J. Emerg. Elect. Power Syst., vol. 1, no. 1, p. 2004.
[12] Z. W. Geem, “Novel derivative of harmony search algorithm for dis-crete design variables,” Appl. Math. Computat., vol. 199, no. 1, pp.223–230, 2008.
[13] S. Ghosh and K. S. Sherpa, “An efficient method for load-flow solutionof radial distribution networks,” Int. J. Elect. Power Energy Syst. Eng.,vol. 1, no. 2, pp. 108–115, 2008.
[14] K. Prakash and M. Sydulu, “Particle swarm optimization based capac-itor placement on radial distribution systems,” in Proc. IEEE PowerEngineering Society General Meeting, 2007, pp. 1–5.
[15] Z. W. Geem, J. H. Kim, and G. V. Loganathan, “A new heuristic op-timization algorithm: Harmony search,” Simulation, vol. 76, no. 2, pp.60–68, 2001.
[16] S. Das, A. Mukhopadhyay, A. Roy, A. Abraham, and B. K. Panigrahi,“Exploratory power of the harmony search algorithm: Analysis andimprovements for global numerical optimization,” IEEE Trans. Syst.,Man, Cybern. B, Cybern., vol. 41, no. 1, pp. 89–106, 2011.
[17] Z. W. Geem, C. Tseng, and Y. Park, “Harmony search for generalizedorienteering problem: Best touring in China,” in Proc. ICNC, 2005,vol. 3612, pp. 741–750, Springer Heidelberg.
[18] M. E. Baran and F. Wu, “Network reconfiguration in distributionsystem for loss reduction and load balancing,” IEEE Trans. PowerDel., vol. 4, no. 2, pp. 1401–1407, Apr. 1989.
[19] J. S. Savier and D. Das, “Impact of network reconfiguration on lossallocation of radial distribution systems,” IEEE Trans. Power Del., vol.2, no. 4, pp. 2473–2480, Oct. 2007.
R. Srinivasa Rao is an Associate Professor in the Department of Electrical andElectronics Engineering at Jawaharlal Nehru Technological University, Kaki-nada, India. His areas of interest include electric power distribution systemsand power systems operation and control.
K. Ravindra is an Assistant Professor in the Department of Electrical and Elec-tronics Engineering at Jawaharlal Nehru Technological University, Kakinada,India. His areas of interest include distributed generation and optimizationtechniques.
K. Satish is a postgraduate student in the Department of Electrical and Elec-tronics Engineering at Jawaharlal Nehru Technological University, Kakinada,India. His areas of interest include electric power distribution systems and op-timal conductor selection.
S. V. L. Narasimham is a Professor in the Computer Science and EngineeringDepartment, Jawaharlal Nehru Technological University, Kakinada, India. Hisareas of interests include real time power system operation and control, IT ap-plications in power utility companies, web technologies, and e-Governance.
Copyright © 2022 FDOKUMEN