The Organization of the Liberalized Rice Market in Vietnam
249
University of Groningen The organization of the liberalized rice market in Vietnam Hai, L.T.D. IMPORTANT NOTE: You are advised to consult the publisher's version (publisher's PDF) if you wish to cite from it. Please check the document version below. Document Version Publisher's PDF, also known as Version of record Publication date: 2003 Link to publication in University of Groningen/UMCG research database Citation for published version (APA): Hai, L. T. D. (2003). The organization of the liberalized rice market in Vietnam. s.n. Copyright Other than for strictly personal use, it is not permitted to download or to forward/distribute the text or part of it without the consent of the author(s) and/or copyright holder(s), unless the work is under an open content license (like Creative Commons). The publication may also be distributed here under the terms of Article 25fa of the Dutch Copyright Act, indicated by the “Taverne” license. More information can be found on the University of Groningen website: https://www.rug.nl/library/open-access/self-archiving-pure/taverne- amendment. Take-down policy If you believe that this document breaches copyright please contact us providing details, and we will remove access to the work immediately and investigate your claim. Downloaded from the University of Groningen/UMCG research database (Pure): http://www.rug.nl/research/portal. For technical reasons the number of authors shown on this cover page is limited to 10 maximum. Download date: 18-07-2022
-
Upload
khangminh22 -
Category
Documents
-
view
0 -
download
0
Transcript of The Organization of the Liberalized Rice Market in Vietnam

University of Groningen
The organization of the liberalized rice market in VietnamHai, L.T.D.
IMPORTANT NOTE: You are advised to consult the publisher's version (publisher's PDF) if you wish to cite fromit. Please check the document version below.
Document VersionPublisher's PDF, also known as Version of record
Publication date:2003
Link to publication in University of Groningen/UMCG research database
Citation for published version (APA):Hai, L. T. D. (2003). The organization of the liberalized rice market in Vietnam. s.n.
CopyrightOther than for strictly personal use, it is not permitted to download or to forward/distribute the text or part of it without the consent of theauthor(s) and/or copyright holder(s), unless the work is under an open content license (like Creative Commons).
The publication may also be distributed here under the terms of Article 25fa of the Dutch Copyright Act, indicated by the “Taverne” license.More information can be found on the University of Groningen website: https://www.rug.nl/library/open-access/self-archiving-pure/taverne-amendment.
Take-down policyIf you believe that this document breaches copyright please contact us providing details, and we will remove access to the work immediatelyand investigate your claim.
Downloaded from the University of Groningen/UMCG research database (Pure): http://www.rug.nl/research/portal. For technical reasons thenumber of authors shown on this cover page is limited to 10 maximum.
Download date: 18-07-2022

The Organization of the Liberalized Rice Market in Vietnam
Luu Thanh Duc Hai
ISBN 90-367-1835-X


Rijksuniversiteit Groningen
The Organization of the Liberalized Rice Market in Vietnam
Proefschrift
ter verkrijging van het doctoraat in de Economische Wetenschappen
aan de Rijksuniversiteit Groningen op gezag van de
Rector Magnificus, dr. F. Zwarts, in het openbaar te verdedigen op
donderdag 3 juli 2003 om 16.00 uur
door
Luu Thanh Duc Hai
geboren op 13 september 1964 te An Giang
Vietnam

Promotor : Prof.dr. ir. C. Schweigman Co-promotor : Dr. C. H. M. Lutz Beoordelingscommissie : Prof. Dr. N. M. Wijnberg Prof. Dr. J. W. Gunning Prof. Dr. H. H. van Ark

Preface and Acknowledgements The process of market liberalization in Vietnam over the past 20 years has cre-ated a rapid growth in agriculture in general as well as in rice production in par-ticular. The market reform has resulted in drastic changes in the rice market structure, the conduct, and the performance of the major rice production area in the South of Vietnam – the Mekong River Delta. The justification for this spe-cific study of the rice market follows primarily from the importance of this product for both domestic and export markets. Rice is the staple food in Vietnam and produced by the majority of the farmers. This study was performed at the Faculty of Economics, the University of Gron-ingen in the Netherlands. I owe much gratitude to many people for their help and friendship during my years in Groningen. Many people contributed to this book in one way or another, and I would like to take the opportunity to mention several of them. First of all, I am greatly indebted to my supervisors – Prof. Dr. Caspar Schweigman and Dr. Clemens Lutz who have been of great help to me by giving many valuable and apt comments and advice on the text and the pro-gress of my research. I would like to express my gratitude to all members of the MHO co-operation program, the University of Groningen in the Netherlands and the University of Cantho in Vietnam, which provided me the scholarship. Also, I am indebted to the board and staff members of the Faculty of Economics of the University of Groningen and the School of Economics and Business Administration of the University of Cantho who supported me during the study and research time. I especially thank Madeleine Gardeur, Anita Veltmaat, Gonny Lakerveld, Erik Haarbrink and Wiebe Zijlstra, from the Office for International Relations; Pieter Boele and Arthur de Boer from the Centre for Development Studies for all their help and support. While conducting this study, I also obtained special help from Dr. Kees Praag-man from the Department of Econometrics in the University of Groningen; Dr. Nguyen Tri Khiem, Blaine A. Thacker from the University of Cantho. I would like to thank all for what they have done for me. And, I really would like to thank all my colleagues at the School of Economics and Business Administra-tion of Cantho University for helping to cover my duties while I was away. I wish to express my sincere thanks to my parents, Luu Thanh Hai and Ly Thi Dep for their continual encouragement, love, and prayers for my progress and success. Finally I am greatly indebted to my wife, Pham Thi Ngoc Bich and my

The Organization of the Liberalized Rice Market in Vietnam
ii
lovely daughters: Luu Pham Anh Thi and Luu Pham Anh Thu for all their love, moral support, understanding and great encouragement. Groningen, 25th May 2002.
Luu Thanh Duc Hai

Contents Preface and Acknowledgments i
Contents iii
List of figures vii
List of tables viii List of abbreviations x Chapter 1: Introduction 1 1.1 Exploration of the problem 1 1.2 Research problem and objectives 3 1.3 Limitations of the scope of the study 5 1.4 Outline of the thesis 6 Chapter 2: Theoretical Framework and Methodology 7 2.1 Basic concepts 7
2.1.1 The market 7 2.1.2 Marketing and agricultural marketing 8 2.1.3 Marketing channels 9 2.1.4 Arbitrage and market integration 10 2.1.5 Marketing intermediaries 11 2.1.6 Marketing functions 15
2.2 Industrial organization 16 2.2.1 Markets and industry 16 2.2.2 Structure, conduct, performance approach 17 2.2.3 Competition 18
2.3 Institutional economics 21 2.3.1 Theory of institutional economics 21 2.3.2 Transaction cost analysis 23
2.4 Research methodology 25 2.4.1 Integration of the SCP approach and the theory of institutional economics 25 2.4.2 Measurement of effectiveness of the marketing system 28 2.4.3 Measurement of efficiency of the marketing system 29 2.4.4 Method of data collection 32

The Organization of the Liberalized Rice Market in Vietnam
iv
Chapter 3: Vietnam’s Rice Market 35
3.1 Introduction 35 3.2 Overview of Vietnam’s rice economy 35 3.3 Rice production system 38
3.3.1 The description of the rice growing seasons 38 3.3.2 Irrigated lowland rice and irrigation systems 41 3.3.3 The upland rice production system 44 3.3.4 Production and marketing activities of rice farmers 45
3.4 Policy reforms and rice productivity 48 3.4.1 The period before policy reforms (before 1981) 48 3.4.2 “Contract system” of production – 1981 50 3.4.3 The “latest reform” in 1988 53 3.4.4 Rice market liberalization –1989 54
3.5 Trend in rice production 58 3.5.1 The Red River Delta 59 3.5.2 The Mekong River Delta 60
3.6 World rice production and trading 61 3.6.1 World rice production, consumption and trade 61 3.6.2 Major rice exporting countries 64 3.6.3 Major rice importing countries 66
Chapter 4: Structure of the Rice Market 69
4.1 Introduction 69 4.2 Steps in the paddy to rice process 69 4.3 Intermediaries involved in rice marketing system 70
4.3.1 Merchants 70 4.3.2 Brokers 74 4.3.3 State farms 75 4.3.4 Facilitators 75
4.4 Competition in the Mekong Delta rice market 75 4.4.1 Barriers to entry into the rice market 76 4.4.2 Degree of buyer and seller concentration 79 4.4.3 The assortment of paddy/rice qualities 82 4.4.4 Distribution of market information 85
4.5 Rice marketing channels in the Mekong River Delta 87 4.5.1 Marketing channel for rice farmers 87 4.5.2 Marketing channels for different marketing agents 88 4.5.3 Rice marketing channels of State Farms in the Mekong River Delta 95
4.6 The process of rice price formation 97 4.7 Government policy, regulations and informal trade organizations in the rice market 100
4.7.1 The role of the government 100 4.7.2 Major policy changes to promote rice trading 100 4.7.3 Informal trade organizations 102
4.8 Conclusions 103

Table of Contents
v
Chapter 5: Rice Trader Conduct in the Market 105
5.1 Introduction 105 5.2 The characteristics of rice traders 105
5.2.1 Profile of rice traders in the Mekong River Delta 105 5.2.2 Other characteristics of rice traders 107
5.3 The buying and selling strategy of rice traders 109 5.3.1 Choice of product 109 5.3.2 Buying and selling strategy 110
5.4 Marketing functions performed by rice traders 120 5.4.1 Transportation and storage activity 120 5.4.2 The negotiation process of rice traders 124 5.4.3 Paddy/rice processing 127 5.4.4 Access to information in the market 130 5.4.5 The credit constraints and financial relationships between rice traders 131
5.5 Conclusions 135 Chapter 6: Rice Market Performance Analysis 137
6.1 Introduction 137 6.2 The effectiveness of rice marketing channels 137 6.3 Marketing cost and margins analysis 140
6.3.1 Marketing costs of different rice traders 141 6.3.2 Marketing margins analysis 146
6.4 An analysis of paddy and rice price patterns 149 6.4.1 Trends in paddy and rice prices 150 6.4.2 The variability of paddy and rice prices 152 6.4.3 Seasonal price fluctuations 154
6.5 Market integration analysis 155 6.5.1 The data and model specification 156 6.5.2 Applying the Johansen methodology to test for co-integration: four steps procedure 160 6.5.3 Rice price integration between Vietnam and Thailand 164
6.6 Conclusions 167 Chapter 7: The Market Process 169
7.1 Introduction 169 7.2 The process of competition in the rice market system 169 7.3 Changes in market institutions 172 7.4 Practical problems in the rice marketing system 177 7.5 Conclusions 180 7.6 An improved channel format 182 7.7 Some recommendations for policy makers 186
References 189

The Organization of the Liberalized Rice Market in Vietnam
vi
Appendices 199 Appendix 4.1 Average monthly turnover of rice traders 199 Appendix 4.2 Processing capacity of some State Owned Enterprises 199 Appendix 4.3 Lorenz Curves and GINI Ratio 200 Appendix 4.4 Computing the GINI ratio of rice wholesalers 201 Appendix 4.5 Computing the GINI ratio of rice millers 203 Appendix 4.6 Relative importance of rice distribution 205
Appendix 5.1 Volume of paddy and rice bought and sold by local assemblers, distance assemblers, and wholesalers 206 Appendix 5.2 Volume of paddy and rice bought by rice millers 206 Appendix 5.3 Volume of rice sold by rice millers and rice retailers 207
Appendix 6.1a Production cost of paddy by different rice crops 208 Appendix 6.1b Drying cost by using drying machines 208 Appendix 6.2 Exchange rate from US Dollar to Vietnamese Dong 209 Appendix 6.3 Selling price of paddy from farmers 210 Appendix 6.4 Selling price of paddy from assemblers 210 Appendix 6.5 Selling price of rice from millers 213 Appendix 6.6 Wholesale price of rice 214 Appendix 6.7 Retail price of rice 215 Appendix 6.8 Computing 12 months moving average of paddy prices 216 Appendix 6.9 Computing the adjusted seasonal index of paddy prices 217 Appendix 6.10 Computing 12 months moving average of retail rice prices 219 Appendix 6.11 Computing the adjusted seasonal index of retail rice prices 221 Appendix 6.12 Vector Auto-regression Estimates 222 Appendix 6.13 Johansen Co-integration Test 224 Appendix 6.14 Vector Error Correction Estimates 225 Appendix 6.15 Results of market integration analysis: the case of Vietnam and Thailand 227 Summary (in English and Dutch) 229

List of figures Figure 2.1 Marketing agents in the market 14 Figure 2.2 Economic Institutions 22 Figure 2.3 Dynamic model derived from the Structure-Conduct-Performance approach 26 Figure 3.1 Rice cropping system in the South of Vietnam 40 Figure 3.2 Rice cropping system in the North of Vietnam 40 Figure 3.3 The trend of rice production and rice area in Vietnam, 1976-2000 52 Figure 3.4 From single to double rice cropping in the Mekong River Delta, 1976-1995 59 Figure 4.1 Step in the paddy to rice process 70 Figure 4.2 Lorenz curve of rice wholesalers in the Mekong River Delta 81 Figure 4.3 Lorenz curve of rice millers in the Mekong River Delta 81 Figure 4.4 Distribution channel for paddy in the Mekong River Delta, Vietnam 87 Figure 4.5 Paddy and rice marketing channels in the Mekong River Delta, Vietnam 89 Figure 4.6 Distribution channel for rice in the Mekong River Delta 94 Figure 4.7 Rice marketing channels for export by CODOFARM, 1999 96 Figure 4.8 Rice marketing channels for domestic market by CODOFARM, 1999 97
Figure 5.1 Milling process and the “rate of return” from paddy to white rice 129 Figure 6.1 Trends in paddy and rice prices in Vietnam, 1989-2000 151 Figure 6.2 Real prices of paddy and rice in Vietnam, 1989-2000 152 Figure 6.3 Coefficient of variation of monthly paddy and rice prices in Vietnam, 1989-2000 153 Figure 6.4 Adjusted seasonal index of paddy and rice prices in Vietnam 155 Figure 6.5 Export rice prices of Vietnam and Thailand 1998 - 2001 167 Figure 7.1 The improved marketing channels 185
The Organization of the Liberalized Rice Market in Vietnam
viii
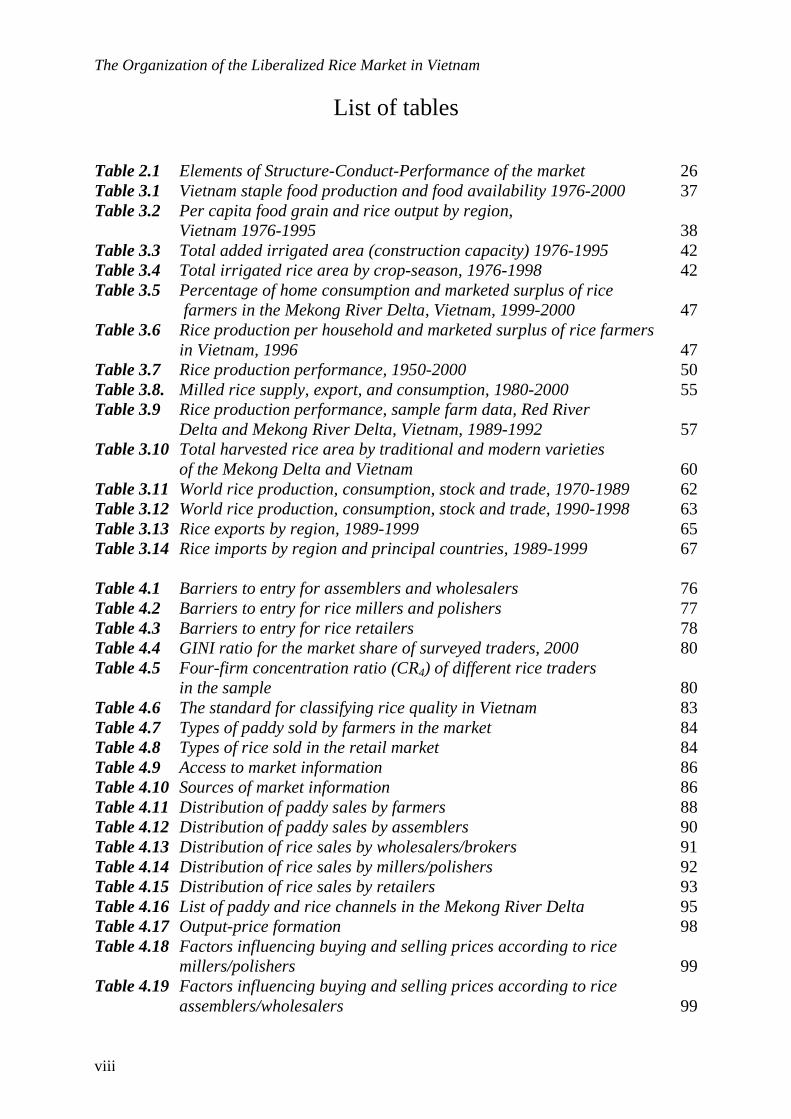
List of tables Table 2.1 Elements of Structure-Conduct-Performance of the market 26 Table 3.1 Vietnam staple food production and food availability 1976-2000 37 Table 3.2 Per capita food grain and rice output by region, Vietnam 1976-1995 38 Table 3.3 Total added irrigated area (construction capacity) 1976-1995 42 Table 3.4 Total irrigated rice area by crop-season, 1976-1998 42 Table 3.5 Percentage of home consumption and marketed surplus of rice farmers in the Mekong River Delta, Vietnam, 1999-2000 47 Table 3.6 Rice production per household and marketed surplus of rice farmers in Vietnam, 1996 47 Table 3.7 Rice production performance, 1950-2000 50 Table 3.8. Milled rice supply, export, and consumption, 1980-2000 55 Table 3.9 Rice production performance, sample farm data, Red River Delta and Mekong River Delta, Vietnam, 1989-1992 57 Table 3.10 Total harvested rice area by traditional and modern varieties of the Mekong Delta and Vietnam 60 Table 3.11 World rice production, consumption, stock and trade, 1970-1989 62 Table 3.12 World rice production, consumption, stock and trade, 1990-1998 63 Table 3.13 Rice exports by region, 1989-1999 65 Table 3.14 Rice imports by region and principal countries, 1989-1999 67 Table 4.1 Barriers to entry for assemblers and wholesalers 76 Table 4.2 Barriers to entry for rice millers and polishers 77 Table 4.3 Barriers to entry for rice retailers 78 Table 4.4 GINI ratio for the market share of surveyed traders, 2000 80 Table 4.5 Four-firm concentration ratio (CR4) of different rice traders in the sample 80 Table 4.6 The standard for classifying rice quality in Vietnam 83 Table 4.7 Types of paddy sold by farmers in the market 84 Table 4.8 Types of rice sold in the retail market 84 Table 4.9 Access to market information 86 Table 4.10 Sources of market information 86 Table 4.11 Distribution of paddy sales by farmers 88 Table 4.12 Distribution of paddy sales by assemblers 90 Table 4.13 Distribution of rice sales by wholesalers/brokers 91 Table 4.14 Distribution of rice sales by millers/polishers 92 Table 4.15 Distribution of rice sales by retailers 93 Table 4.16 List of paddy and rice channels in the Mekong River Delta 95 Table 4.17 Output-price formation 98 Table 4.18 Factors influencing buying and selling prices according to rice millers/polishers 99 Table 4.19 Factors influencing buying and selling prices according to rice assemblers/wholesalers 99

Table of Contents
ix
Table 4.20 Factors influencing buying and selling prices according to rice retailers 99 Table 5.1 Key personal profile of rice traders 106 Table 5.2 Key commercial profile of rice traders 106 Table 5.3 Other business activities of rice traders 107 Table 5.4 Average marketing investment of rice traders 108 Table 5.5 Purchased & sold volumes of paddy/rice by assemblers/ wholesalers 111 Table 5.6 Average number of suppliers and buyers that the rice assemblers and wholesalers are dealing with each month 111 Table 5.7 Location of wholesaler’s buyers and suppliers 112 Table 5.8 Common types of contract used by assemblers and wholesalers 113 Table 5.9 Purchased and sold volumes of paddy/rice by rice millers 114 Table 5.10 Average number of suppliers and buyers that rice millers are dealing with each month 115 Table 5.11 Location of supplier and buyer in the market of rice millers 115 Table 5.12 Common types of contract used by rice millers 116 Table 5.13 Volume of rice sold by rice retailers 117 Table 5.14 Average number of suppliers and buyers that rice retailers are dealing with each month 117 Table 5.15 Location of supplier and buyer in the market of rice retailers 118 Table 5.16 Common types of contract used by rice retailers 118 Table 5.17 Average transportation cost for different rice traders 121 Table 5.18 Main reasons of storage paddy/rice by different rice traders 123 Table 5.19 Information about storage by different rice traders 124 Table 5. 20 Main issues that assemblers and wholesalers pay attention to when they perform their business negotiation 125 Table 5. 21 Main issues that rice millers pay attention to when they perform their business negotiation 126 Table 5.22 Main issues that rice retailers pay attention to when they perform their business negotiation 127 Table 5.23 General information on the surveyed rice millers 128 Table 5.24 The impact of different processing machines on the “conversion ratio”, The case of Meko-Food Cantho, Vietnam, 1998 130 Table 5.25 Sources of funds for rice traders 131 Table 5.26 Amounts borrowed by rice traders 132 Table 5.27 Condition for borrowing 133 Table 5.28 Information on financial relationships between rice traders 134 Table 6.1 Major rice characteristics to be preferred by rice consumers in Cantho 138 Table 6.2 Major rice varieties marketed by rice retailers in Cantho 139 Table 6.3 Average marketing cost of rice assemblers in the MKD 142 Table 6.4 Average marketing cost of rice wholesalers in the MKD 143 Table 6.5 Average marketing cost of rice retailers in the Mekong River Delta 144 Table 6.6 Average processing cost of rice millers in the Mekong River Delta 145

The Organization of the Liberalized Rice Market in Vietnam
x
Table 6.7 Marketing costs and gross margins of Farmers, Assemblers, Millers, Wholesalers and Retailers in the Mekong River Delta, 1999 – 2000 147 Table 6.8 Total Profit margins of different rice traders in the Mekong River Delta, 1999 – 2000 149 Table 6.9 Paddy and rice prices in Vietnam, 1989-2000 150 Table 6.10 Coefficient of variation of monthly farm gate paddy and retail prices by year in Vietnam, 1989 – 2000 153 Table 6.11 Unit root test on rice price series in different market places 160 Table 6.12 VAR analysis on rice price series in different market places 161 Table 6.13 The λtrace and λmax tests 162 Table 6.14 Estimate the dynamics in the short-run by using VECM 164 Table 6.15 Estimate the dynamics in the short-run between Vietnam and Thai’s price (Co-integration restrictions) 166
List of abbreviations CLRRI: Cuulong Rice Research Institute CPI: Consumer Price Index CTV: University of Cantho ECM: Error Correction Model IRRI: International Rice Research Institute MKD: Mekong River Delta RRD: Red River Delta SCP: Structure Conduct Performance SEBA: School of Economics and Business Administration SOEs: State Owned Enterprises TCA: Transaction Cost Analysis UNDP: United Nation Development Program USDA: United State Department of Agriculture VAR: Vector Auto-regressive Model VAT: Value Added Tax VFA: Vietnamese Food Association

Chapter 1. Introduction 1.1 Exploration of the problem
Over the past 20 years, market liberalization has been a dominant feature of economic reforms in most developing countries. In line with this trend, continu-ous reforms have been carried out in Vietnam. Starting in 1986, agriculture and more particularly the rice economy in Vietnam has been liberalized. The deci-sive shift towards a market-based economy which marked the 1988-89 reforms and the period since, has transformed Vietnam from a net rice importer to the world’s third largest rice exporter after the US and Thailand. In particular, the Mekong River Delta is considered to be the rice basket of Vietnam.
The transition from a centrally controlled economy to a market economy in the rice sector has stimulated the farmers to plant more rice crops each year and to improve cropping practices by using proper inputs. With strong support of the Ministry of Agriculture and Rural Development of Vietnam, farmers have adopted many different new high-yielding and pest-resistant rice varieties. Addi-tionally, new irrigation systems in Vietnam have made a large contribution to the increase in rice productivity. As the market liberalization process continues, Vietnam faces the challenge of formulating and implementing an economic growth strategy which is politically viable. Vital in this growth strategy is the role of agriculture and, within agriculture, the development of an efficient and flexible rice marketing system. Since the present rice marketing system in Viet-nam (after market liberalization) is very young, and entirely different from the former government-controlled market systems1, not all market mechanisms are expected to be operational.
The functioning of the rice markets is constrained by various problems and obstacles: imperfect market information for buying and selling rice; lack of cash and credit availability to finance short-run inventories and processing opera-tions; insufficient facilities for storage and transportation; no uniform system of common grade standards to facilitate trading at a distance; lack of management skills; and unsuitable legal codes to enforce contracts. 2 Therefore, analyzing the channels of rice distribution and the functioning of the rice markets is an impor-tant issue.
As mentioned above, the rice market in Vietnam was controlled for a dec-ade by marketing parastatals before it started the liberalization of its agricultural markets more than 20 years ago. This liberalization has been a gradual process but the transition period seems to be coming to an end as the government has decided that the last parastatals involved in agricultural activities will be com-
1 See also Section 3.4.4 in Chapter 3 for further explanation. 2 The report on Rice Production and Rice Market of Vietnam, 1995; Saigon Times Vol.16, 1996.

The Organization of the Liberalized Rice Market in Vietnam
2
pletely privatized. 3 However, to date export activities are still dominated by the large state owned food companies. The liberalization of the economy is still a hotly debated issue in Vietnam. Hence, it makes sense to analyze the functioning of the market.
Three issues are important in this study: arbitrage in time (storage), in space (transport), and in form (processing/rice quality). Storage of paddy/rice will ensure that enough rice will be available during the off-season. Transport is a service to transfer paddy/rice from surplus areas to deficit regions in the coun-try. Finally, processing provides different kinds of finished product (brown or white rice, instant noodle, etc.) to meet the diversified demands of final consum-ers. Price differences may reflect market functioning. Arbitrage in time, space, and form increases the value of the product. In the coming years, at the macro level, some of the developmental goals of the Vietnamese government are: 4
(i) To increase and stabilize the availability of food for Vietnam’s popula-tion;
(ii) To finalise the transition to more market-oriented regulations by devel-oping private marketing channels;
(iii) To obtain an efficient method of food crop marketing at all times and at reasonable prices;
(iv) To improve the channels of distribution at regional, interregional, and in-ternational levels; and
(v) To look for a reasonable solution to increase the volume of rice exports as well as improve rice quality and maintain stable food supply for do-mestic consumption.
To achieve the above-mentioned goals, there is a need for adequate information on the market structure, conduct, and performance of the rice market in Viet-nam, especially on rice marketing channels, the traders’ behavior, and the proc-ess of competition in the market. This knowledge will be useful for policy mak-ers who prepare policies to develop markets, and in particular its rules, regula-tions, and services. Moreover, the information may also facilitate the decision making process of private traders and farmers, as their initiatives will determine the success or failure of the privatization process. This study of the rice market-ing system offers a unique opportunity to address several issues in the debate concerning strategies for the medium and long term, the role of government policies, and the role of the state and private sector in the market. The aim of this study is to look for improvements in the existing rice marketing channels and to make the distribution channels more efficient. 3 Agricultural development policy in Vietnam, Nhandan Newspaper, Jun 1994 (Khiem and Pingali, 1994). 4 Strategy for rice production in Vietnam, Saigon Times, Vol. 25, 1997, Vietnam

Chapter 1: Introduction
3
1.2 Research problem and objectives As mentioned in the previous section, the turnaround in the Vietnamese rice sec-tor can be largely attributed to the policy reforms initiated two decades ago. Af-ter the economic reforms, the rice traders’ behaviour with respect to various as-pects of trading (e.g. the buying and selling activities, transport and storage etc) was changed. Furthermore, at the macro level, the transition from a central plan-ning to a market economy led to a change in institutions, which had a strong im-pact on different organizations and actors in the markets. 1.2.1 Objective of the study. This study examines the current rice marketing system and the channels of rice distribution in Vietnam. It focuses on the domestic market structure as well as the relationships between the different actors in the rice market and attempts to assess the effectiveness and efficiency of the market services supplied. More-over, this study will also provide recommendations for establishing suitable marketing strategies, trade policies, regulations, institutions and services to pro-mote private and cooperative rice production. This will assist the Government and the private sector in achieving the transition from direct public interventions to more market-oriented interventions and stimulate a policy dialogue between the private rice sector and the Government. The specific objectives of this study are the following:
(1) To review the rice marketing situation in Vietnam from the central plan-ning period to the present free market economy;
(2) To examine the domestic market structure, conduct and performance of rice marketing in the Mekong River Delta;
(3) To describe and analyze the organization of rice distribution channels from rice farmers to final consumers;
(4) To estimate the marketing costs, profits, and price margins of various in-termediaries;
(5) To evaluate the effectiveness and efficiency of rice marketing. Effec-tiveness indicates how well the commercial channel meets the demand for services by its rice consumers and producers/farmers. Efficiency measures whether the services are supplied at reasonable marketing mar-gins and assesses market integration across different locations (prov-inces) and for different time periods;
(6) To analyze the market process and identify incentives that facilitate channel improvements in the future;
(7) Finally, to identify the key policy issues related to the promotion of the rice industry and provide recommendations for developing feasible mar-

The Organization of the Liberalized Rice Market in Vietnam
4
keting strategies/trade policies to improve the economic efficiency of the rice marketing system.
This study could make a contribution to the long-run process of transition to-ward a market economy by assisting in: (i) Identifying the main obstacles to the formation of competitive rice mar-
keting systems; (ii) Finding strategies to eliminate these obstacles and to promote low-cost
local marketing systems; (iii) Promoting policies to accelerate the process of transformation from the
command-based and self-sufficiency oriented agricultural system to a competitive and commercially oriented agricultural sector;
(iv) Strengthening the local capacities to guide and monitor the process of transition from the state-run to competitive marketing systems.
1.2.2 Justification of this study The justification for this study is based primarily on the importance of rice for the farmers, traders, state owned companies and consumers in Vietnam. Rice is a main food crop produced by the majority of the farmers, particularly in the Mekong River Delta. Establishing a proper rice-marketing channel is highly sig-nificant, not only for rice production but also for the rice export sector.
Kim, H.M. (1993) and Trung and Duc-Hai, N.M. (1995), in their studies on rice marketing in Vinhlong and Hanoi indicated that the marketing costs of rice trading in both domestic and foreign markets are high and a considerable part of the consumer price consists of remuneration for marketing services. The studies indicate that most of the rice traders and middlemen lack management skills, insufficient facilities for storage and transportation, and cash and credits to finance inventories and processing operations. They have to pay a high inter-est rate when borrowing working capital or cash from private sources. Further-more, the rice marketing channels seem to be inefficient because they include many intermediaries in the channel with a large margin for each member. The result of these problems is that they charge high prices to consumers and offer low prices to farmers.
Most rice farmers sell at least part of their paddy. An efficient rice market is important to promote rice production. At the same time enough rice supplies have to be guaranteed to consumers at reasonable prices. Therefore, improve-ment of the rice market system is in the interest of both farmers and consumers and will increase economic welfare. The varying supply and demand conditions on the local rice markets in Vietnam make this issue most important. During the main harvest period, there is a surplus of paddy rice in the rural markets. The farmers not only receive a low selling price but also face difficulties to find an

Chapter 1: Introduction
5
outlet. They lack proper information about the rice markets and they also lack negotiating skills in contacts with traders for selling rice. However, during this period they need money to pay back all input supplies that they have got in ad-vance, such as fertilizers and pesticides, for land preparation, and to repay bank loans (Kim, H.M. 1993).
The long-distance between the North and the South of Vietnam draws at-tention to the issue of spatial price movements across the country. Therefore, rice market integration is studied to provide more details about the extent of price transmission across different locations within the country and some main cities that are located in the North and the South.
Information on rice marketing channels is also important to policy mak-ers. Despite the significance of rice in the Vietnamese economy, it is only re-cently that more in-depth studies have been published on rice marketing: Goletti and Minot, 1996; Kim, 1993; Trung and Duc-Hai, 1995. However, most of these studies have focused on production and macro policies, and were limited to a specific region (e.g. Vinhlong province in the South and Hanoi in the North of Vietnam - Kim, 1993 and Trung and Duc-Hai, 1995). Systematic and adequate information on the process of market competition (after market liberalization); on market structure, conduct, performance; on changes in market institutions; and on the existing rice marketing channels, are not available. In fact, this is the first study that attempts to examine carefully the competitive process in the mar-ket; to analyze in more detail the existing marketing channels in order to identify opportunities for improvement. 1.3 Limitations of the scope of the study The study is limited to the domestic rice market. However, many aspects of rice market behaviour will resemble other food commodity markets (potato, maize, cassava, and sweet potato, etc), which is evident in view of the fact that many rice traders are also active in other food commodity markets.
The market structure, conduct and performance approach as well as the marketing channel approach are adopted to examine and describe the domestic rice trading activities. This implies that the problem is examined from the view-point of a commodity. It concerns the internal functioning of the market and the relationships between the actors within the marketing channels. The analysis fo-cuses on marketing functions such as exchange functions (assembly and distri-bution), physical functions (transport, storage and processing), and facilitating functions (grading and financing). Storage of paddy rice during long periods of time is not important because most paddy/rice is sold directly to the rice traders after harvesting. In this way they safeguard the high quality of milled rice to meet the requirements of consumers. Particularly, in the Mekong River Delta, there are three rice crops per year so the paddy supply in the market is abundant

The Organization of the Liberalized Rice Market in Vietnam
6
during the year. Short-term storage for ordering and processing is part of this study.
The fieldwork was carried out at regional market places in the South of Vietnam, the Mekong River Delta. We also consider the rice market at a na-tional level, as secondary data were available to complete the primary data. No primary price data were collected at the village rice markets. This was inevitable considering the expensive and time-consuming process of data collection. How-ever, it is assumed that the regional markets dominate the local price formation process, as distances are limited. A major limitation concerns our focus on the domestic trade relationships. We acknowledge that exports are important for the Mekong River Delta, but the organization of these transactions differs from the organization of domestic trade. Moreover, a study of demand and supply rela-tionships on the world rice market justifies a separate Ph.D research project. Therefore, we concluded that it would be wise to limit the scope of the study and to start with a thorough analysis of domestic trade relationships.
As the rice market in Vietnam evolves rather quickly, a major limitation concerns the period under study. The fieldwork was carried out from April 1999 to May 2000 – the cropping year of Summer-Autumn, Autumn-Winter, and Winter-Spring rice crop (See Section 3.3.1 in Chapter 3). 1.4 Outline of the thesis The present study is organized into 7 Chapters. This introductory chapter pre-sents a statement of the research problem and the objectives of the study. Chap-ter 2 will cover the theoretical background and methodology of the study. Three main approaches used in this study are presented; the theory of institutional eco-nomics; the structure, conduct, and performance approach; the marketing chan-nel approach. Chapter 3 gives an overview and history of rice trading in Viet-nam before and after the market reforms. This information will help to summa-rize the process of market liberalization. Chapter 4 analyses in more detail the main characteristics of the structure of the rice market and the rice marketing channels. In Chapter 5 the behaviour of various rice traders in the given market structure is characterized. Buying and selling strategies, as well as trader behav-iour in relation to storage, transport, financing, negotiation and information are dealt with. The analysis of rice market performance is presented in Chapter 6. In this chapter the effectiveness of supplied services; product suitable in relation to consumer preferences; marketing costs; seasonal price and market integration analysis, are discussed carefully in order to measure the effectiveness and mar-ket efficiency. The market process analysis and in particular the identification of incentives for further channel improvements, is conducted in Chapter 7. Finally, some conclusions and some policy recommendations are derived.
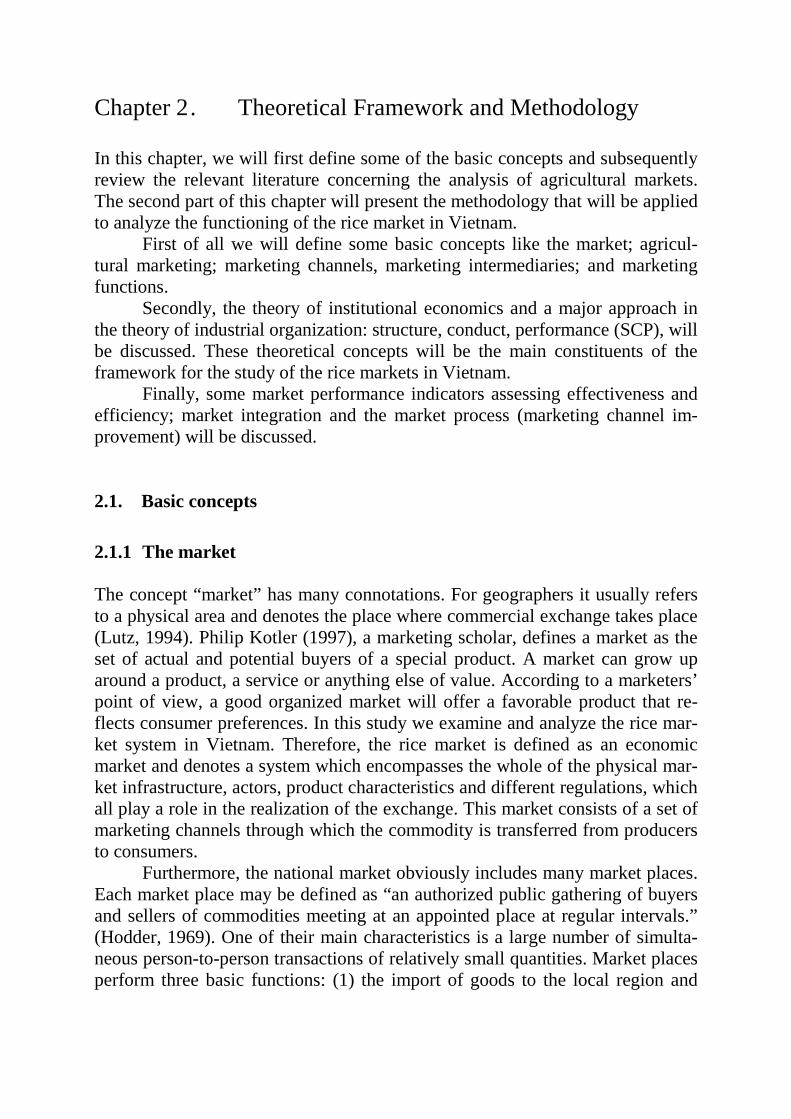
Chapter 2 . Theoretical Framework and Methodology
In this chapter, we will first define some of the basic concepts and subsequently review the relevant literature concerning the analysis of agricultural markets. The second part of this chapter will present the methodology that will be applied to analyze the functioning of the rice market in Vietnam.
First of all we will define some basic concepts like the market; agricul-tural marketing; marketing channels, marketing intermediaries; and marketing functions.
Secondly, the theory of institutional economics and a major approach in the theory of industrial organization: structure, conduct, performance (SCP), will be discussed. These theoretical concepts will be the main constituents of the framework for the study of the rice markets in Vietnam.
Finally, some market performance indicators assessing effectiveness and efficiency; market integration and the market process (marketing channel im-provement) will be discussed.
2.1. Basic concepts
2.1.1 The market The concept “market” has many connotations. For geographers it usually refers to a physical area and denotes the place where commercial exchange takes place (Lutz, 1994). Philip Kotler (1997), a marketing scholar, defines a market as the set of actual and potential buyers of a special product. A market can grow up around a product, a service or anything else of value. According to a marketers’ point of view, a good organized market will offer a favorable product that re-flects consumer preferences. In this study we examine and analyze the rice mar-ket system in Vietnam. Therefore, the rice market is defined as an economic market and denotes a system which encompasses the whole of the physical mar-ket infrastructure, actors, product characteristics and different regulations, which all play a role in the realization of the exchange. This market consists of a set of marketing channels through which the commodity is transferred from producers to consumers.
Furthermore, the national market obviously includes many market places. Each market place may be defined as “an authorized public gathering of buyers and sellers of commodities meeting at an appointed place at regular intervals.” (Hodder, 1969). One of their main characteristics is a large number of simulta-neous person-to-person transactions of relatively small quantities. Market places perform three basic functions: (1) the import of goods to the local region and
The Organization of the Liberalized Rice Market in Vietnam
8
their retail distribution; (2) the bulking and export of goods from the local re-gion; (3) the exchange of goods within the local region.
2.1.2 Marketing and agricultural marketing Agricultural marketing encompasses everything that happens between the farm-gate and the consumer, including food processing. Indeed the size of the market-ing sector is sometimes defined in terms of the difference between farm-gate re-ceipts and consumer expenditure on food (Wollen and Turner, 1970). Bateman (1976), in his review of marketing theory showed that the study of ag-ricultural marketing in Britain derived much of its impetus between the two world wars from the problem of low farm prices. The low prices were believed to be associated with inefficiencies in the distribution of agricultural produce from farmer to consumer, with farmers’ inadequate bargaining power and with the lack of grading of agricultural produce. The solution was considered to lie in the hands of the government rather than of the farmers themselves and institu-tional means such as Marketing Boards were seen as the appropriate lines of in-tervention. Thus, agricultural marketing was strongly oriented towards logistics and towards policy. The view that marketing problems are synonymous with low farm prices and with rapacious or inefficient middlemen and that the gov-ernment should do something about it is still prevalent amongst farmers. Those results made clear that in order to improve the channels of distribution in the market the role of government policy is important. Wills G. (1974), Kotler and Zaltman (1971) stated that in an economic context, the government could be regarded as having two main functions. One is to sup-ply some goods and services (health, education, agricultural research and exten-sion, etc.) of public interest and the other is to act as a regulator of the efficiency with which private businesses supply goods and services. In both roles, the gov-ernment, just as much as business itself, is faced with the problem of finding out what the consumer wants and ensuring that proper consideration is given to product planning, promotion, physical distribution and pricing. Meulenberg (1986), criticizes this point of view and according to him marketing of agricultural products needs a marketing management approach that focuses on an analysis of decisions related to the marketing mix (product, price, place of selling, and promotion). The issues of marketing of agricultural commodities re-sembles the issues at stake in the marketing of industrial commodities. However, in the case of a limited marketing firm, when many small enterprises supply homogenous products, the capacity to develop a marketing policy will be lim-ited. This corresponds with the situation on the rice market in Vietnam: the rice

Chapter 2: Theoretical Framework and Methodology
9
product is quite homogenous and the number of rice traders/actors in the market is considerable. In these circumstances there is not much room for rice traders to experiment with the marketing mix.
Taken into account the complexity of food markets in developing coun-tries we propose to use a mix of different approaches. The effectiveness and the efficiency with which the market is carrying out its function will be analyzed. At the same time the organization of the marketing channels will be scrutinized. The marketing channels approach, which focuses on the degree to which the marketing functions are executed, is an appropriate starting point for this study.
2.1.3 Marketing channels To consider the link between actors, involved in moving the product from pro-ducer to consumer we discuss the concept of marketing channels or channels of distribution.
The marketing channel links producers and final consumers. According to Stern et al. (1996, p.1) “Marketing channels can be viewed as sets of interde-pendent organizations involved in the process of making a product or service available for consumption or use”. The complexity of these channels depends upon the distance between the producers and the consumers, the availability of marketing facilities, the size of farms, and the time available for the farmer to do the marketing. In the case of Vietnam’s rice market we will focus on analyzing all important intermediaries, institutions that operate in different channels of dis-tribution as well as the availability of marketing facilities such as infrastructure, transportation, storage, etc. Kohls and Uhl (1990, p.529) define marketing channels as “alternative routes of product flows from producers to consumers”. They focus on the mar-keting of agricultural products, as does this study. Their marketing channel starts at the farm’s gate and ends at the consumer’s front door. The marketing channel approach focuses on firm’s selling strategies to satisfy consumer preferences. The performance of a marketing channel is related to its structure and the strate-gies (conduct) of the actors operating in these channels. A major distinction with respect to its structure concerns whether the organization functions in conven-tional or vertical marketing channels. According to Stern et al. (1996, p.315), “A conventional marketing channel can frequently be described as a piecemeal coa-lition of independently owned and managed institutions, each of which is prompted by the profit motive with little concern about what goes on before or after it in the sequence”. In conventional marketing channels, actors tend to be pre-occupied with cost, volume and investment relationships at a single stage of the marketing process. It is relatively easy to enter the channel, and coordination

The Organization of the Liberalized Rice Market in Vietnam
10
among channel members is primarily achieved through bargaining and negotia-tion (Lutz, 1994).
As opposed to conventional marketing channels, vertical marketing sys-tems can be described as: “professionally managed and centrally programmed networks pre-engineered to achieve operating economies and maximum market impact. Vertical marketing systems are rationalized and capital intensive net-works designed to achieve technological, managerial, and promotional econo-mies through the integration, coordination, and synchronization of marketing flows from points of production to points of ultimate use” (McCammon, 1970). Theoretically, three types of vertical marketing system are classified: adminis-tered systems, contractual systems, and corporate systems. 5 Vertical marketing systems attempt to capitalize on programmed organization, economies of scale, and economies of standardization. Implicit within the concept of a vertical mar-keting system is the notion that competition takes place between marketing channels.
Referring to the description of the rice market in Vietnam that was men-tioned in the introductory section, we emphasize that the conventional marketing channel is widespread, because the system relies mainly on formal markets where paddy and rice are traded on markets without major exit or entry barriers. However, there is some room for vertical marketing systems based on informal collaboration concerning exchange of information and financial arrangements between the rice traders.
2.1.4 Arbitrage and market integration Rural assembly and urban distribution markets are expected to develop under free market conditions. A market place concentrates supply and demand, so buyers need not to travel all over the production area to meet suppliers. Sellers come to the market place when their commodities are ready for exchange (Al-derson 1967). Thus, an assembly market potentially increases the efficiency of a marketing channel by decreasing transport costs to buyers. In addition, it may increase channel efficiency by decreasing suppliers’ and buyers’ transaction costs. The concentration of supply and demand makes price developments more transparent. Such transparency may be expected to lower the costs of informa-tion (a transaction cost). In sum, assembly markets reduce transport and/or in-formation costs at the assembling stage.
5 “Administered systems” are defined as informal collaboration on programs developed by one or a limited numbers of traders/agencies. “Contractual systems” are defined as formal-ized agreements as a means for achieving control. “Corporate systems” exist when channel members on different levels of distribution are owned and operated by one organization (Stern et al., 1996).

Chapter 2: Theoretical Framework and Methodology
11
To rice farmers who offer small quantities for sale, the assembly rice market may ensure a price for paddy and/or rice that more or less reflects current supply and demand conditions. The market thus reduces farmers’ costs of imper-fect information. When farmers sell their products at the farm, such costs can run quite high. The trader who comes to buy the products is usually the only one with up-to-date information on price developments in the urban markets. This gives him a decisive edge in price negotiations. However, in most agricultural markets arbitrage guarantees that prices reflect supply and demand conditions. In general, arbitrage and market integration are two highly linked but different notions, very often used as synonyms. In this study, we define arbitrage as the process of exchange between rice traders on the market with the objective of taking advantage of price differences that exceed transaction costs. As such the arbitrage process encompasses all aspects of the structure, the conduct, and the performance of the rice market. Market integration implies that different mar-kets, or market segments, are linked as a result of the arbitrage process. This, in such a way that (1) actors are operating in the same institutional environment: e.g. absence of entry or exit barriers, equal standards (measures, grades, price formation), equal trade habits (credit, terms of payment); and (2) price integra-tion is achieved as a result of arbitrage, guaranteeing that price differences are reduced to the level of transaction costs. 2.1.5 Marketing intermediaries The analysis of marketing channels is intended to provide a systematic knowl-edge of the flow of the goods and services from their origin to their final destination. This knowledge is acquired by studying the “participants” or marketing intermediaries in the process, i.e., those who perform physical marketing functions in order to obtain economic benefits. In general, three groups of marketing intermediaries can be distinguished: mer-chants, agents/brokers and facilitating intermediaries. The merchants take title of the merchandise, the brokers and agents carry out marketing functions on com-mission, and the facilitating intermediaries assist the merchants in their market-ing activities. Figure 2.1 shows a distinction between intermediaries and other actors on the market.
Some traditionally accepted definitions help to identify and classify par-ticipants in the marketing process. In the real world, these classifications are by no means mutually exclusive.

The Organization of the Liberalized Rice Market in Vietnam
12
The merchants Assembler: Sometimes also known as the trader/transporter, he is the first link between the farmer and other middlemen. He takes title and collects several smaller lots of scattered rural production by his own capital and combines them into a single load at one location. In so doing, he typically classifies these di-verse lots into fewer types. To the extent he arranges for or provides shipping, the key function the assembler provides in addition to assembly is transport. Wholesaler: He concentrates the various loads and puts the product into large, uniform units. These activities all contribute to price formation. In so doing, the wholesaler provides information to suppliers (e.g., farmers, rural assemblers) and assumes to a varying degree the risks associated with the transfer of prop-erty rights attached to the goods and services being bought and sold. He also fa-cilitates mass and specialized storage operations, transportation and, in general, the subsequent distribution operations involving retailers.
The distinction between wholesaler and retailer is well known: wholesal-ing is concerned with the activities of those persons which sell to retailers and other merchants and commercial users, but do not sell in significant amounts to final consumers (Kotler, 1997, p.107). In some of the studies on food marketing in developing countries, wholesale traders are subdivided into rural assembling traders, collecting wholesalers and distributing wholesalers (Lutz, 1994 and Dijkstra 1997). Rural assembling traders accumulate products in the production areas to sell to collecting wholesalers, who carry the commodities to large towns. On arrival, they sell to distributing wholesalers, who in turn sell to retail-ers. Retailers: The main function of the retailer is to buy wholesale agricultural pro-duce and sell to consumers at convenient locations and times in various forms and quantities. In general, retailers can be found on the markets of agricultural products: retailer-assemblers involved in buying to complement their stock and retailer-distributors involved in selling from their stock. In town, retailers often buy from wholesaler-distributors or their brokers and resell to the consumers. They may also travel to assemble in agricultural production areas. At harvest time in particular, when the villages in the vicinity of the market hold surpluses, retailers may prefer to purchase directly from the millers. In addition, the retail-ers may have a fixed base: a stall, a shop or a place on the ground, or they may be hawkers, who carry their products around. Millers/Food processing companies: Enterprises that use agricultural commodi-ties as raw material. In the case of rice business, processors or rice mill-ers/polishers have a very important role in the marketing channel. They change the form of the product (from paddy rice to milled rice). The quality of rice in

Chapter 2: Theoretical Framework and Methodology
13
the market mostly depends on the quality of rice processing. Depending on the availability of rice polishing machines, rice millers are usually classified into three groups: pure millers, polishers, and miller-polishers. Pure millers are mill-ers without any polishing machines. Polishers are rice processors engaged only in polishing activities and do not mill paddy into raw rice. They buy raw rice from other mills and process it further. The third group of miller-polishers con-sists of those millers who have also polishing machines. These are the most technologically complete mills, able to process paddy into a polished rice of high quality suitable for export. Moreover, processors or rice millers not only provide the milling services but sometimes they also are rice trad-ers/wholesalers. They can buy paddy directly from the farmers or rural assem-blers, after milling they sell the milled rice to SOEs, wholesalers, and retailers. Exporters/State Owned Enterprises (SOEs): In general, these are companies that mostly buy and sell agricultural products in foreign markets. These products vary from those freshly harvested to those that have gone through various stages of processing. Considering rice trading, rice exporters mainly are the SOEs or government companies. Commission agent – Broker These agents work for a commission on behalf of other participants. They oper-ate at all levels of the marketing channel. Typically, they work for either a flat rate or percentage (of the selling price) commission. Brokers bring buyers and sellers together and assist in negotiations on a more ad hoc basis. Some brokers may operate as auctioneers, auctioning products on behalf of collecting whole-salers.
Purchasing agents are most common. They generally have a long-standing relationship with buyers and make purchases for them. In addition to purchasing agents, also selling agents are found. Brokers do not invest in trade, nor do they take any price- risks. They provide an insight into the functioning of the market as they are relatively better informed than wholesalers. Moreover the existence of commission agents or brokers permits wholesalers to devote their energy to the commercial functions for which they have a comparative advantage. Facilitators Traders not only use brokers but also facilitating intermediaries. Kotler (1997) refers to three types of facilitators: first, physical distribution firms, including warehousing firms and transportation firms; second, marketing service compa-nies, including marketing research firms, advertising agencies, media firms, and marketing consultancy firms; and other firms that help finance and/or insure risks associated with the buying and selling of goods.

The Organization of the Liberalized Rice Market in Vietnam
14
With regard to the rice market in Vietnam, warehousing firms and trans-portation firms are considered as important facilitators in the market. Other gov-ernment institutions or private agencies, also involved in the marketing chain are: porters, bag-sewers, banks, money-changers, agents for market regulation like quality control, tax agent, market authority, etc. In sum, the above classifi-cation of marketing agents is useful for our study. They will be applied for ana-lyzing in more detail all types of actors/agents that perform different marketing functions in the rice marketing channels in Vietnam.
Source: Compiled by the author
Figure 2.1 Marketing agents in the market
Actor
Merchant
Brokers
Facilitators
Assembler
Wholesaler
Retailer
Miller
Exporter/SOEs
Buying agent
Transporter
Porter
Bag-sewer
Banks
Store manager
Agent for market regulation (quality control, tax agent, market authority, etc.)
Selling agent
Chapter 2: Theoretical Framework and Methodology
15
2.1.6 Marketing functions Manufacturers, wholesalers, and retailers as well as other channel members are involved in channel arrangements to perform one or more of the following ge-neric functions: carrying of inventory; demand generation, or selling; physical distribution; after-sale service; and extending credit to customers. In getting goods to end-users, a manufacturer must either assume all these functions or shift some or all of them to channel intermediaries. Stern et al. (1996) defined that a flow in marketing channels is a set of functions performed in sequence by channel members. The term flow is used to stress that movement is part of all marketing functions.
Discussing marketing functions, Kotler (1997) delineates nine functions:
1. Information collection and dissemination of market information 2. Promotion development and dissemination of persuasive communications about
offers 3. Negotiation attempts to reach final agreement on price and other items of the offers 4. Ordering backward communication of intentions to buy 5. Financing acquisition and allocation of funds required to finance the carrying of
inventory 6. Risk taking assumption of risks in connection with carrying out channel work 7. Physical successive storage, processing and movement of physical products,
possession (products possession flow) 8. Payment payment of bills 9. Ownership actual transfer of title Rice has to be transferred to many market places within the country during the year, particularly from the Mekong River Delta (surplus region) to other regions (deficit regions). Providing rice products in time and at different places in the market is very necessary. Therefore, transportation and storage are important functions in the channels of distribution. Financing and risk cause many difficulties to rice traders. Lack of investment capital and price volatility are important barriers to entry for large traders (Duc-Hai and Hiep, 1998). According to Goletti and Minot (1997, p.9) credit con-straints are common to all types of rice marketing agents in both private and public sectors. Thus, financing and risk taking should be taken into account in this study. Ordering is subordinate to negotiation. Both functions are performed by the same market intermediaries. However, negotiation is the more important of the

The Organization of the Liberalized Rice Market in Vietnam
16
two, because a successful negotiation process will almost inevitably lead to the immediate placement of an order. Processing and market information should be considered carefully in this study. The rice processing procedure will directly effect the quality of milled rice in the market. Market information is very important to rice traders, since it will help them to perform the arbitrage function. Market information will help them choose relevant places, time and prices to buy and sell rice efficiently. The banking system in Vietnam is not as developed as in Western countries. Most private rice traders are not familiar with payment by money transfers through the banks. Payments by cash are very common.
Finally, rice is considered as a simple and homogenous product. It is a staple food where low prices are the major driving force for customers, therefore the promotion (advertising) function is not too important and will not be taken into account in this study. 2.2 Industrial Organization 2.2.1 Markets and industry The marketing channel approach is related to the theory of Industrial Organiza-tion, however the latter study object is broader and encompasses production and marketing activities. According to Ferguson (1992, p.32), an industry is defined as comprising firms which have the ability to produce, relatively rapidly, the products of any of the firms in the group. Following Ferguson, a distinction between a market and an industry can be made. Markets group together firms trading commodities which are close substitutes from the buyers’ viewpoint, while an industry groups to-gether commodities which are close substitutes from the suppliers’ viewpoint. These are usually broader grouping than markets. Despite this distinction the theory of industrial organization is helpful in channel analysis, especially when performance standards have to be developed. Standards for market performance included the neo-classical standard (based on the so-called ‘potential Pareto im-provement criterium’) and the contestable market standard (See Section 2.2.3 for further explanation). The theory of industrial organization was developed to understand the conduct of firms in markets for manufactured products, but can also be applied to mar-kets for services as well as agricultural products.

Chapter 2: Theoretical Framework and Methodology
17
2.2.2 Structure, conduct, performance approach Structure, conduct, and performance (SCP) analysis was developed by Bain (1959, 1968), Clodius and Mueller (1961), Slater (1968), and Bateman (1976). This theory tells us that the market structure (the environment) determines mar-ket conduct (the behavior of economic agents within the environment) and thereby sets the level of market performance. It is an attempt to compromise be-tween formal structures of economic theory and empirical observations of or-ganizational experience in imperfect markets. It is a standard tool for market analysis.
The definition of structure, conduct and performance differs from one au-thor to the other, depending on the sector and region being studied and the per-ception of the researcher. The key words used here are relevant to the agricul-tural sector in developing countries and are based on Clodius & Mueller (1961), Van Tilburg (1988) and Lutz and Van Tilburg (1992).
Market structure is defined as “the characteristics of the organization of a mar-ket which seem to influence strategically the nature of the competition and pric-ing within the market” (Bain, 1959). Market structure also means the organiza-tional characteristics that determine the relation of sellers established in the market to other actual or potential suppliers of goods including potential new firms that may enter the market. In general, market structure can be studied in terms of the degree of seller and buyer concentration, the degree of product dif-ferentiation, the existence of entry and exit barriers, and the power distribution. Clodius and Mueller (1961) add the distribution of market information and its adequacy in sharpening price and quality comparisons and in reducing risk. From an institutional viewpoint, market structure also encompasses all formal rules and/or regulations that coordinate market exchange. Every trader has to follow these rules, which we call the rules of the game (See Section 2.3.1).
Market conduct refers to the set of competitive strategies that a trader or a group of traders use to run their business. Those strategies include the methods to de-termine prices and output; their behaviour towards grading, sorting, customer relationships and adoption of innovations; the means by which price and product policies of competing traders are coordinated and adapted to each other; and the extent to which predatory and exclusionary tactics are directed against estab-lished rivals or potential entrants. In other words, market conduct focuses on traders’ behaviour with respect to various aspects of trading strategies such as buying, selling, transport, storage, information and financial strategy. In line with the literature on institutional economics, these are called the rules that de-fine the play of the game (See Section 2.3.1).

The Organization of the Liberalized Rice Market in Vietnam
18
Market performance according to Stern et al.(1996) is a multi-dimensional con-cept, the performance of marketing channels and institutions therefore can be assessed by considering a number of dimensions including effectiveness, equity, productivity, and profitability. Market performance refers to economic results: product suitability in relation to consumer preferences (effectiveness); rate of profits in relation to marketing costs and margins; price seasonality and price in-tegration between markets (efficiency). In sum, market performance refers to the impact of structure and conduct as measured in terms of variables such as prices, costs, and volume of output (Bressler and King, 1979). By analyzing the level of marketing margins and their cost components, it is possible to evaluate the im-pact of the structure and conduct characteristics on market performance (Bain, 1968). Many researchers applied the SCP method for conducting their study on agricul-tural markets in developing countries. Interesting SCP studies on agricultural marketing in developing countries include Jones (1972), Van Tilburg (1988), Lutz and Van Tilburg (1992), Tollens (1992), Goossens (1994) and Dijkstra (1997). However, the SCP method has been subject to criticism, Scherer (1990) stated that the SCP model is too deterministic to understand the functioning of imperfect markets. As most agricultural markets are imperfect markets, we need to develop more dynamic models showing how structure, conduct and perform-ance interact. It means that market structure and market conduct determines market performance. In turn, market performance will influence market struc-ture and market conduct in the long run. In this study, the dynamic SCP model will be used as a framework for analyzing the rice market, consisting of a set of marketing channels. The paradigm is not used as a stylized model but serves as a benchmark to construct a classification of the different aspects that play a role in the functioning of the market. It is a useful instrument to order the myriad of market features. 2.2.3 Competition Perfect and imperfect markets With the help of the SCP approach, many researchers have studied the perform-ance of food markets and tried to measure to what extent the conditions of a per-fect market were fulfilled. In particular, the following conditions are disputed in the literature: market access, concentration, and information. However, in prac-tice markets are always less than perfect as only rarely are all the conditions ful-filled simultaneously. Therefore, the concept of the conditions for a perfectly competitive market is useful in determining why a market is inefficient, but is not very helpful in determining how inefficient a market is (Jones, 1974).

Chapter 2: Theoretical Framework and Methodology
19
Due to the absence of a perfect market, many studies are forced to draw ambiguous conclusions like “the markets are reasonably competitive” (Harriss, 1979). This shows that the positive conditions of a perfect market are given a normative interpretation. The ambiguousness results partly from the fact that the operationalized conditions of concentration and market integration are not ex-plicitly specified by the theory. The importance of contestable markets More recently the theory of contestable markets was developed by Baumol (1988). It concerns a partial generalization of the theory of perfect competition and shows that an optimum can be attained under less restrictive conditions than the properties of a perfect market. A market is said to be contestable if there are no barriers of entry or exit, implying that in perfectly contestable markets new enterprises bear the same cost structure as already existing ones, while exiting actors do not face depreciation costs. Consequently, perfectly contestable mar-kets have the following properties: - The potential entrants can serve the same market demands and use the same
productive techniques as those available to the incumbent firms. - The potential entrants evaluate the profitability of entry in accordance with
the market demand curves implying that an expansion of industry outputs leads to lower prices. It is assumed that entry is not impeded by fear of re-taliatory price alternations.
Lutz (1994) stated that unlike perfect competition, perfect contestability can provide a standard for the performance of markets in which concentration is in-evitable because of the nature of the production technology. The relevant con-cept takes into account the sustainable industry structure. If the number of firms, needed for efficient production, is large, then the industry is defined as being naturally competitive. If the relevant cost-minimizing number of firms is small, then the industry is a natural oligopoly. In a contestable market, a natural oli-gopolist must operate in an efficient manner and earn no more than a normal rate of return on its capital investment, because of the threat of potential entry. Due to the fact that the conditions of contestability are supposed to be fulfilled, the market is not necessarily hampered by the existence of economics of scale.
An entry barrier is expressed by “the advantage of established sellers in an industry over potential entrant sellers, these advantages being reflected in the ex-tent to which established sellers can persistently raise their prices above a com-petitive level without attracting new firms to enter the industry” (Bain 1968, p.31). Stigler (1968, p.67) defined the concept as follows: “a barrier to entry is a cost of producing, which must be borne by a firm which seeks to enter an indus-try but is not borne by the firms already in the industry”. A third definition of
The Organization of the Liberalized Rice Market in Vietnam
20
entry barriers is given by Von Weizsacker (1980, p.400): “entry-barriers can be defined to be socially undesirable limitations of entry, which are attributable to the protection of resource owners already in the industry”. The strength of this definition – its explicit focus on the normative consequences of entry – is also the source of its major weakness. It is difficult enough to measure barriers to en-try without adding an additional layer of normative complexity. Finally, the dy-namic market should be taken into account, as was stated by the Austrian School. According to them barriers are only viewed as impediments to the mar-ket process if they cannot be overcome through time. In this study no explicit choice is made for any one of the definitions. All of them are exploited in order to trace the influences of observed entry and exit barriers. In this study, the contestable market theory is useful as the characteristics of the Mekong Delta rice market indicate that the conditions for a perfect contestable market are met to a large extent: no formal entry or exit barriers exist; the large number of rice traders in a market for homogenous products suggest that the market is naturally competitive. Therefore, the standard of the theory of contest-able markets is an important benchmark for this analysis of market structure. Competition and the market process According to Kirzner (1973), markets are not necessarily evolving to an equilib-rium but markets should be seen as a process where decisions of individual par-ticipants in the market interact to generate the market forces which compel changes in prices, in outputs, and in methods of production and the allocation of resources. The market process requires a notion of competition. We have seen the market during different periods as made up decisions of market participants. Consumers’ decisions to buy depend on the decisions of producers to sell. Deci-sions of resource owners to sell depend on the decisions of producers to buy and vice versa. In this sense, the market process is inherently competitive. Knowing that markets do not attain a stationary equilibrium, and that information is al-ways imperfect (See Kirzner, 1973), the market is driven by entrepreneurship. It is a process where actors adapt their decisions in time as a consequence of the availability of new information due to experience. Therefore, channel improve-ment becomes an indicator for efficiency. It is important to verify whether the process leading to channel improvement is not hampered. This competitive process will influence the market outcome. Competition is forcing the market to look for improved production and distribution on the basis of past experiences. This leads to new channel formats in the market systems. Therefore, analysing market competition in relation with the market process will help to examine whether the process of competition promotes channel improvements.

Chapter 2: Theoretical Framework and Methodology
21
2.3 Institutional economics
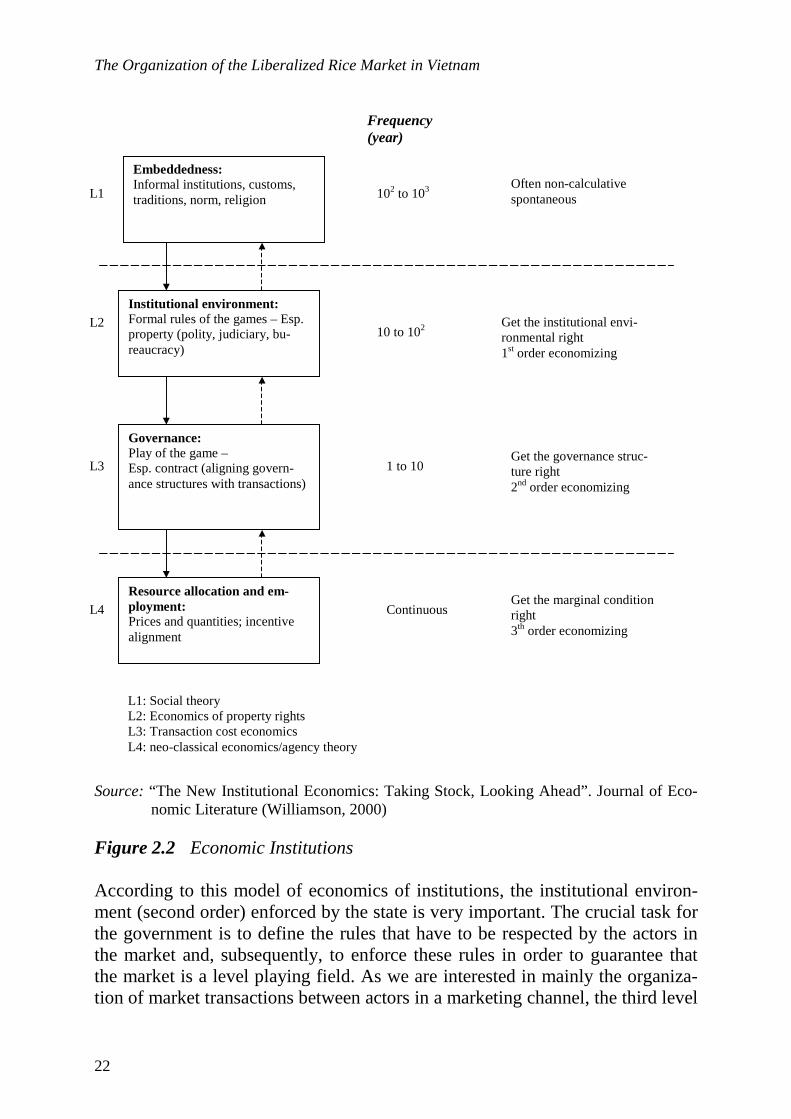
2.3.1 Theory of institutional economics Institutions are the humanly devised constraints that structure political, economic and social interaction (North, 1989). They consist of both informal constraints (sanctions, taboos, customs, traditions and codes of conduct) and formal rules (constitutions, laws, property rights). Lutz (1994) also stated that institutions form the incentive structure of a society and can be interpreted as a set of rules. Eco-nomic institutions are the underlying determinants of economic performance and shape the organisation of market transactions. Williamson (2000) distinguishes 4 types of institutions that shape transactions and play an important role in understanding economic behaviour (See Figure 2.2)
• Level 1 consists of institutions embedded in the social context like customs and religion. Economists take these rules often as exogenous factors in their analysis. These rules change only slowly. However, they are important and influence the nature of economic transactions.
• Level 2, concerns institutions that define the rules of the game. In particular the economics of property rights addresses these type of issues. It concerns the formal rules of the game, imposed on the market and often enforced by the government. Economists are highly involved in this field as these rules should facilitate economic transactions and have to be respected by all actors in the market. Therefore, level 2 also influences the rules that are elaborated on lower levels in the hierarchy of the economics of institutions. These rules should lead to efficient transactions from a societal point of view.
• The institutions on level 3 define the play of the game. These are the specific rules defined by the actors involved in a transaction, in bilateral formal or in-formal (oral) contracts. The institutions on this level define the governance structures for transactions through markets while taking into account the rules defined at higher levels. These rules facilitate market exchange between the actors involved in a transaction.
• Finally, the institutions on level 4 co-ordinate internal allocation, or transac-tions inside the firm.
The Organization of the Liberalized Rice Market in Vietnam
22
Source: “The New Institutional Economics: Taking Stock, Looking Ahead”. Journal of Eco-
nomic Literature (Williamson, 2000) Figure 2.2 Economic Institutions According to this model of economics of institutions, the institutional environ-ment (second order) enforced by the state is very important. The crucial task for the government is to define the rules that have to be respected by the actors in the market and, subsequently, to enforce these rules in order to guarantee that the market is a level playing field. As we are interested in mainly the organiza-tion of market transactions between actors in a marketing channel, the third level
Embeddedness: Informal institutions, customs, traditions, norm, religion
Institutional environment: Formal rules of the games – Esp. property (polity, judiciary, bu-reaucracy)
Governance: Play of the game – Esp. contract (aligning govern-ance structures with transactions)
Resource allocation and em-ployment: Prices and quantities; incentive alignment
L1
L2
L3
L4
L1: Social theory L2: Economics of property rights L3: Transaction cost economics L4: neo-classical economics/agency theory
Frequency (year)
Often non-calculative spontaneous
Get the institutional envi-ronmental right 1st order economizing
Get the governance struc-ture right 2nd order economizing
Get the marginal condition right 3th order economizing
102 to 103
10 to 102
1 to 10
Continuous

Chapter 2: Theoretical Framework and Methodology
23
is the most important group of institutions that shape the transactions in market-ing channels. Here we find the concrete contracts that define the conditions on which the transaction is based and the responsibilities of the partners involved. These contracts differ in time and space and between types of intermediaries. The contracts specify the functions that have to be executed by the partners in-volved (Lutz, 2002). In conventional marketing channels this is relatively straightforward, however more complex contracts will be developed when it concerns vertical marketing relationships. For example, a futures contract be-tween a rice miller and a farmer is more complex than a contract based on im-mediate delivery and cash payment. Existing marketing channels should be able to co-ordinate both types of transactions in an efficient way and should be flexi-ble in the sense that they adapt easily to new opportunities in the market. In this study explicit attention will be paid to existing institutions. The rules of the game are part of the market structure, while the rules that define the play of the game express the behaviour of traders in the market. 2.3.2 Transaction cost analysis As mentioned before, institutions are the humanly devised constraints that struc-ture political, economic and social interaction. However, institutions do not only define the rules, but implicitly also determine the costs of transactions through the allocation of property rights and the influence on the organisation of market-ing channels. It is here that the economics of transaction costs becomes interest-ing (Williamson, 2000).
Ronald Coase (1960) claims that there are different kinds of cost that are related to the exchange process, for example, the cost of discovering what the relevant prices are, and the costs of negotiating and concluding a separate con-tract which takes place on a market. In short, what are involved here are the costs of obtaining relevant information before concluding a contract (contact), the cost of bargaining and making decisions or negotiating the contract (con-tract), and finally the costs of policing and enforcing contracts (control). All these costs are considered as transaction costs. In more detail, transaction costs include both the direct costs of managing relationships and the possible oppor-tunity costs of making inferior governance decisions. Thus transaction costs can be defined as the costs of running the market system.
The structure of transaction costs is examined by the so-called transaction cost analysis (TCA). The basic premise is that if transaction costs are low, eco-nomic actors will favor market governance. If these costs are high, firms will fa-vor internal organization. The efficient outcome is to minimise the sum of pro-duction and transaction costs for the product or service concerned.
The most common applications of TCA focus on the vertical integration decision. Many researchers typically use TCA to examine forward vertical inte-

The Organization of the Liberalized Rice Market in Vietnam
24
gration and explore manufacturers’ use of direct (i.e., through employees) versus indirect (i.e., through commission agents) channels of distribution. In more detail, Williamson (1989) indicated that there are three attributes that determine the transaction costs: (1) the importance of asset specificity, (2) the degree and type of uncertainty facing both actors (the sellers and the buyers), and (3) the frequency of interaction between channel members.
• Asset specificity refers to the extent to which the resources used in a transac-tion have a value therein that is higher than in any other use or to any other users. Highly specific assets are ones whose values elsewhere are compara-tively low and, consequently, whose owners have a strong interest in continu-ing the transaction because the high quasi-rents they receive. This concept has a relation to the notion of sunk cost. One expects durability to be a hall-mark of highly specific assets. Asset specificity takes a variety of forms - physical assets, human assets, site specificity, dedicated assets, brand name capital, and temporal specificity 6 - to which individuated governance struc-ture responses accrue. Asset specific investments encourage partners in-volved in a transaction to develop a vertically integrated trade relationship.
• The second relevant attribute of a transaction is uncertainty about the envi-ronment in which it is to be executed. Here, we focus on two types of uncer-tainty: primary and secondary uncertainty. Primary uncertainty arises from random acts of nature or unpredictable change in consumers’ preferences. Secondary uncertainty arises from lack of communication or the impossibil-ity to control whether tasks are carried out in line with the defined contract. 7 Williamson expects a positive relation between uncertainty and vertical inte-gration.
• Frequency simply refers to the frequency of transaction that traders recur (numbers of business transaction that traders have done in a given time such as a week or a month). The greater the frequency of a transaction, the more justifiable is an expensive governance structure that brings about large saving in transaction costs: the frequency of transaction is positively correlated with the degree of vertical integration.
In this study, we will use the theory of transaction costs to explain several forms of vertical integration. These vertically integrated trade relationships coexistent with conventional marketing channels.
In the literature marketing costs and transaction costs are regularly mixed up. However, there are some differences that should be distinguished to prevent confusion. Various marketing functions such as transport, storage, processing, assembly, distribution, negotiation, payment, distribution of risk, financing, and 6 See Williamson, 1989: Transaction cost economics, p. 143 7 See Koopmans, 1957: The state of economic science, p. 162-163

Chapter 2: Theoretical Framework and Methodology
25
enforcement of transactions all entail marketing costs. North and Wallis (1994, p.612) make a distinction between transformation and transaction costs. Trans-formation costs refer to all costs that are used to physically transform inputs into outputs. Transaction costs include all costs that are used to transfer property rights from one person to another. Consequently, transport, storage, processing are treated as transformation costs and assembly, distribution, negotiation, pay-ment, distribution of risk, financing, and enforcement of transactions are related to transaction costs. Since, those functions are all related to the transfer of prop-erty rights.
2.4 Research Methodology
2.4.1 Integration of the SCP approach and the theory of institutional economics
In this study the SCP approach will be integrated with the marketing channel approach and the theory of institutional economics. Those approaches are used as a guideline, to identify the different aspects of the problem. Many researchers criticized the SCP approach for being too deterministic to understand the func-tioning of imperfect markets. 8 Therefore, more dynamic models have been de-veloped, showing that the three levels may interact when competition is imper-fect.
In a dynamic model, we assume that there is a simultaneous relationship between market structure, conduct and performance. Market structure and mar-ket conduct influence market performance. In turn, market performance will in-fluence market structure and market conduct in the long run (See Figure 2.3 be-low). It is clear that performance in particular industries or markets is said to de-pend upon the conduct of sellers and buyers with regard to pricing policies, product line, investment in production facilities, and so on. Conduct depends in turn upon the structure of the relevant market, embracing such features as the number and size distribution of sellers and buyers, the type of marketing chan-nels, the degree of product differentiation, the presence or absence of barriers to the entry, etc.
8 Since, only in a perfectly competitive market is the conduct of the traders determined by at-omistic competition, which may be viewed as a result of the market structure and, as such, represents the deterministic model. Only in this special case do all the actors have to follow the competition laws prescribed by the market structure. However, in an imperfect market some liberty exists in the conduct of the traders which influences not only the market per-formance but also the structure in the future.

The Organization of the Liberalized Rice Market in Vietnam
26
Figure2.3 Dynamic model derived from the Structure-Conduct-Performance approach
As the bold arrows in this figure suggest, we will be concerned primarily with relationships or tendencies involving a causal flow from market structure to conduct and performance. That is, we seek theories that permit us to predict ul-timate market performance from the observation of structure and conduct. There are also feedback effects (broken lines in this figure). For example, the policies pursued by sellers in coordinating their mutual price interactions may either raise or lower barriers to entry affecting market structure.
Most researchers have applied SCP analysis for studies of the functioning of markets. Moreover, this methodology is also used in the agricultural sector and studies on the functioning of food markets. The method can be applied to investigate the functioning of a market-place in particular, but it is also useful for the analysis of the market for a commodity (such as rice). Therefore, in this study the SCP approach will be used as a framework for analyzing Vietnam’s rice market, consisting of a set of marketing channels. This approach will help to consider in-depth how market processes direct the activities of producers from producing/processing raw products to delivery of the final products to consum-ers. In general, there are three main levels that should be taken into account when applying SCP analysis: (1) the structure of the market, (2) the conduct of the market, and (3) the performance of the market. We integrated some concepts of the theory of institutional economics and the marketing channel approach in our analysis. Table 2.1 presents the principal aspects that will be dealt with. Table 2.1 Elements of Structure-Conduct-Performance
Elements of structure Elements of conduct Elements of performance - Intermediaries involved in
the marketing system - Barriers to entry and exit - Buyer and seller concen-
tration - The assortment of product
quality - Distribution of market
information - Structure of marketing
channels - Price formation process - Rules and/or regulations that
coordinate market exchange. the rules of the game
Conduct with respect to: - Buying - Selling - Transport - Storage - Negotiation - Processing - Information - Finance/risks bearing - General trading strategies that
traders conducted in order to follow market rules and in-crease marketing efficiency (reduce transaction costs) the play of the game
- Effectiveness of supplied services; product suitability in relation to con-sumer preferences
- Efficiency of supplied services + rate of profit in relation to market-ing costs and price margins (arbi-trage in time, space and form). +transaction cost analysis (market searching; negotiating & concluding a contract; enforcing a contract) + analysis of price differences and seasonal price fluctuation + market integration
- Dynamic analysis of the market process
Source: Compiled by the author
Market structure
Market conduct
Market performance

Chapter 2: Theoretical Framework and Methodology
27
With respect to market structure, first of all we pay attention to the ac-tors/intermediaries involved in the rice market. This information will define the general picture of the channel systems. Secondly, we focus on competitiveness by using four major criteria such as barriers to entry and exit, buyer and seller concentration, the assortment of product quality and distribution of market in-formation.
• Barriers to entry and exit reflect the competitive relationship between firms and potential entrants. If the barriers to entry and exit are minimal, new firms can easily enter into and exit from the rice markets and compete with estab-lished firms. However, with the presence of very high barriers to entry and exit, established firms become well protected from potential rivals.
• Degree of buyer and seller concentration is an indicator for competitiveness and depends on the number of buyers and sellers in the market. The Lorenz curve and GINI ratio will be used to measure the degree of buyer and seller concentration. 9
• The assortment of product quality examines the extent to which buyers dif-ferentiate, distinguish or express their specific preferences among competing products of the various sellers. Factors such as product quality, packaging and seller marketing promotion strategies are common attributes of product differentiation. In the case of rice, product differentiation both at the farmers’ and the traders’ level will be examined in terms of different varie-ties/qualities; degree of broken rice, color (brown, white rice) and humidity.
• The distribution of market information refers to the availability of relevant market information. This could be expressed by assessing the producers’ awareness of the market price, the manner by which price information is dis-seminated among producers. The distribution of market information shows how market information is disseminated to producers and traders, what/who are the sources of market information, and the adequacy of this information in terms of reducing risks.
The most important issue of market structure analysis is to sketch the channels of distribution. Marketing channels are defined as the flow of products from the place of production to the place of ultimate consumption. The structure of mar-keting channels will help to determine the relationships between different actors in the markets. Both private and state owned channels will be sketched. The process of price formation is determined by the following elements: market power, bargaining skills, and some transaction specific characteristics like qual-ity of product, volume of sales per transaction, and sales location. In general, a trader who is considered as a leader usually has high market power on setting 9 See Appendix 4.3 for further explanation.

The Organization of the Liberalized Rice Market in Vietnam
28
prices in the market. Quality of product is related to consumers’ preferences. Volume of sales expresses the difference between wholesale and retail prices. This difference signifies the bearing of assembly or distribution costs by those involved. Finally, sales location will directly effect the price of a product as transport costs may be significant. From an institutional viewpoint, to examine the rice market structure we also analyze the rules that are defined by organizations active in the market. Every trader in the market has to follow these rules which we call the rules of the game. Regarding to elements of market conduct, we describe the trading strategies (buying, selling, transport, storage, market information, finance, and risk bear-ing) of different actors in the channels of distribution and analyze how existing formal institutions influence their behaviour (rules of the game). We also discuss how traders develop additional rules (play of the game) in order to reduce trans-action costs and increase marketing efficiency. Analyzing market performance we focus on the degree of effectiveness and effi-ciency of the marketing system. Section 2.4.2 and 2.4.3 will present in more de-tail the procedure of measuring effectiveness and efficiency of the marketing system. 2.4.2 Measurement of effectiveness of the marketing system Effectiveness means that marketing channels should offer proper service outputs or the right services in relation to consumer preferences. It means that the distri-bution channel has to meet the demand for services expressed by consumers. The marketing channel has to provide the following generic services: exchange functions (assembling and distribution), physical functions (storage, processing, transport), and facilitating functions (grading, financing). In more detail, con-sumers usually prefer to deal with a marketing channel that provides a higher level of spatial, time and/or form convenience (that related to three major func-tions: transport, storage, and processing). Thus, the rice marketing channel evolves because rice consumers demand more convenience – in other words, a higher service output. In the long run, an effective channel will simulate latent demand.
The spatial convenience factor of the service output mainly refers to the distribution of wholesale and retail shops as well as the availability of transpor-tation services. According to gravity models used in marketing research, the at-tractiveness of wholesale and retail shops to consumers is related to its location. In the case of rice, wholesalers and retailers usually build up their shops at a

Chapter 2: Theoretical Framework and Methodology
29
place that can offer some convenience for transport, loading and un-loading the product (space for parking, near the main roads or canals), or at a central place that customers can easily visit in order to attract more customers.
For the domestic rice market, time convenience (storage) is not a big is-sue, as rice farmers in Vietnam can produce three rice crops per year. It means that rice is supplied continuously through the year. However, time convenience becomes an important issue in the case of exporting rice to foreign markets. Since, rice assemblers, millers, and export companies usually have to provide their product in time to fulfil the required schedule of the rice importers.
Form convenience is the last factor that effects the level of satisfaction of consumers in the market. Rice is a relatively homogenous product, thus, at the retail market, form convenience refers largely to quality.
2.4.3 Measurement of efficiency of the marketing system The main objective of this study is to analyze the channels of distribution and assess their efficiency. A channel of distribution is considered to be efficient when all services of this channel are supplied at normal rates of return.
This section will present some important indicators that are used to reflect the degree of efficiency of the marketing system. There are three main indica-tors: (1) rate of profit in relation to marketing costs and price margins, (2) price differences and degree of market integration, and (3) existence of incentives for further market improvements (process). Marketing costs and margins analysis
Primary data are collected to estimate marketing costs and marketing margins of various rice traders. From these results, total marketing costs of various market-ing channels will be calculated. Direct marketing costs include costs for trans-portation, storage, processing, financing will also be taken into account. Thus the percent share of each cost item for each type of rice trader will be computed.
Secondly, economic efficiency will be evaluated in terms of the profit margin, which measures the rate of return on gross sales after all costs in render-ing marketing services have been deducted. The profit margin will be calculated as follows:
Profit margin Total marketing margin Variable marketing cost of each type = of each type - of each type
of trader of trader of trader

The Organization of the Liberalized Rice Market in Vietnam
30
A comparison between the marketing cost for each distribution channel will be made to determine which channel is the most efficient. Moreover, the profit margins for each type of rice trader will be examined. Temporal price and market integration analysis
First of all, in order to examine pricing behaviour we focus on temporal price analysis: trends and seasonal price fluctuation will be examined. Secondly, a model is developed to analyze market integration. In this study we apply the Johansen procedure to test for long run and short run price integration between different market places. The most common procedure is to estimate a vector auto-regressive model (VAR). This model tries to assess the price adjustment process between markets, in the long-run and short-run. In this type of model, market prices of a particular product are explained by its own lagged prices and lagged prices on other market places. Co-integration analysis is used to check for the relationship among prices in different locations. When a long-run linear relation exists among different price series, these series are said to be co-integrated.
In addition, to make a clear distinction between short-run and long-run in-tegration we also use an Error Correction Model (ECM). This allows us to de-rive the speed of price transmission from one location to another. Within the context of market integration, it is important to consider the speed of adjustment as one dimension of integration. The model specification and the procedure ap-plied to compute co-integration coefficients, and the speed of adjustment, will be presented in more detail in Chapter 6. In sum, three steps are distinguished:
(1) Testing stationarity of the price series (2) Testing long-term price integration with co-integration analysis (3) Testing short-run integration: measuring speed of adjustment An analysis of the market process and the identification of incentives for fur-ther channel improvements The market is shaped by a dynamic process as experiences and changes in the environment (technological, cultural, etc.), lead to new channel formats. Through time, each market participant tries to adjust their methods of production and distribution strategy in order to adapt to new conditions in the market. In the case of the rice market in Vietnam, the process of market liberalization has en-couraged many private traders to enter the business. Competition is the driving force in the dynamic process, of which, entry barriers; trade concentration; as-

Chapter 2: Theoretical Framework and Methodology
31
sortment of product quality; and market information, are four major aspects (See also Section 2.2.3 and Section 2.4.1). These aspects of competition are analyzed in order to scrutinize whether the competitive process is hampered by a lack of competitive forces. From an institutional economics viewpoint, through time, the existing marketing channels are also influenced by changing economic institutions. This is an im-portant issue as the transition from a centrally controlled economy to a market economy in Vietnam implies that new economic institutions are developed. The market participants adjust their trading activities in line with the new rules coor-dinating market exchange. They are expected to look for the best solution to minimize their transaction costs. Put differently, proper institutions are needed to settle problems concerning: (1) asset specificity; (2) uncertainty; and (3) fre-quency. Establishing vertically integrated trading networks is one of the ways to improve the organization of trade (See Section 2.3.2). Therefore, new institu-tions lead to new channel formats. Based on the results of market performance analysis, some prospective effects on market conduct and structure will be examined (See Section 2.4.1). The si-multaneous relationship between market structure, conduct, and performance al-lows us to identify some obstacles and/or opportunities for the future. In a dy-namic perspective, a market operates effectively and efficiently (good perform-ance), if it creates proper incentives to improve channels of distribution (struc-ture) and to solve observed deficiencies in the market. In theory, every rice trader should try to look for the best organization of distribution in order to meet consumer demand. In practice, the crucial question is whether the marketing channel provides the right incentives for change in order to solve the observed problem and to realize optimal results in the future. In sum, three crucial criteria will be used to assess the market process: (1) exis-tence of sustained competition, (2) availability of facilitating institutions, and (3) incentives to solve observed deficiencies:
- First of all, we focus on competition in the market. From this, we can derive which problems or obstacles may create negative effects that hamper compe-tition in the future.
- Secondly, we pay attention to the changing process of institutions/regulations (rules of the game and play of the game) in order to verify whether proper in-stitutions exist that facilitate the market process.
- Finally, we examine whether the market process provides incentives to solve observed problems in the market. Thus, we search for the dynamic process that results in an improved marketing channel.

The Organization of the Liberalized Rice Market in Vietnam
32
2.4.4 Method of data collection In this study, data were obtained from two sources: primary and secondary sources. Secondary data were obtained from the Bureau of Agricultural Eco-nomics, Food-exporting Companies and also from the Ministry of Agriculture and Rural Development. Secondary data included historical data on rice produc-tion, marketed surplus of rice, weekly and monthly average prices of some ma-jor rice markets in the Mekong River Delta. Those data are necessary for sum-marizing the recent situation of rice production and marketing problems in Viet-nam. Primary data were gathered through personal interviews using prepared inter-view schedules. Primary sources included interviews with farmers; traders (as-semblers, wholesalers, retailers), millers, state owned enterprises and some other knowledgeable persons involved. A multistage sampling method was adopted in this study. Five major rice pro-duction provinces, located in the Mekong River Delta, were pre-selected (Soc-trang, Cantho, Angiang, Vinhlong, and Tiengiang – See Map of the Mekong River Delta). Subsequently, two districts from each province, one near the main road and the other less accessible, were chosen for data collection: in total 62 rice farmers, 18 rice assemblers, 49 rice wholesalers, 30 rice retailers, 53 rice millers/polishers, and 8 state owned enterprises were selected for this study. The main objective of this survey is to obtain reliable qualitative data to inter-pret the functioning of the market. A stratified sample of assemblers, wholesal-ers, millers, and retailers was taken. With all categories, similar questions re-garding the behaviour of the traders were discussed. This survey focused on some specific aspects: buying and selling strategies, organization of transport and storage, investment and financing, entry and exit barriers, trade relation-ships, processing (particular for rice millers and/ or polishers) and changes in the market organization. The survey of rice farmers was carried out in rural regions surrounding the se-lected market places. We just wanted to collect some general information about farmers’ behaviour in the market: their selling activities, organization of storage, information gathering, and their relationships with various rice traders. Regarding the SOEs, in each selected province we tried to contact at least one State Owned Enterprise for collecting suitable data on their buying and selling activities, trade relationships, and export activities.
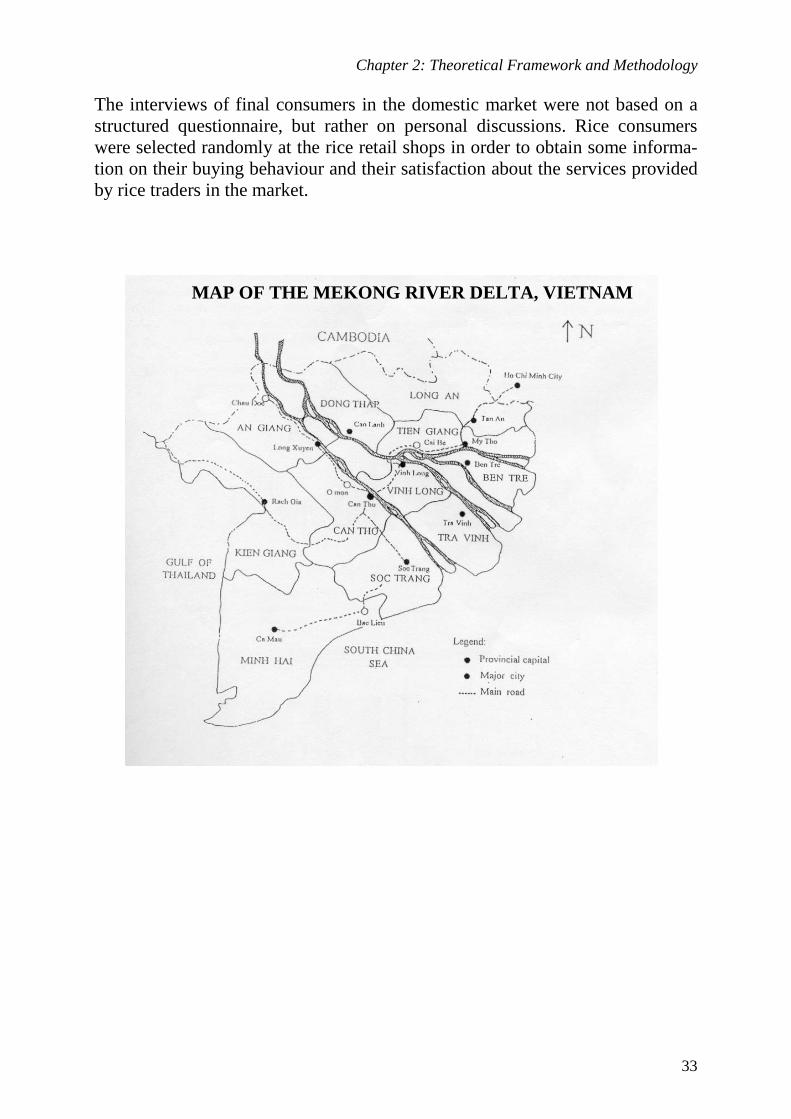
Chapter 2: Theoretical Framework and Methodology
33
The interviews of final consumers in the domestic market were not based on a structured questionnaire, but rather on personal discussions. Rice consumers were selected randomly at the rice retail shops in order to obtain some informa-tion on their buying behaviour and their satisfaction about the services provided by rice traders in the market.
MAP OF THE MEKONG RIVER DELTA, VIETNAM


Chapter 3. Vietnam’s Rice Market 3.1 Introduction
This chapter will provide some major information about Vietnam’s rice market. First of all we need to study in more detail the history of Vietnam’s rice econ-omy, and analyze the progress of agricultural reform (Doimoi) in Vietnam. This chapter will summarize the progress of rice market liberalization including a de-scription of the rice cropping and production system; changes in rice productiv-ity after policy reform; the operation of the rice market system; and behavior of rice farmers and consumers. Finally, this chapter gives an overview of world rice production and trading in order to discover the impact of the world rice market on the performance of Vietnam’s rice market. The methodology used in this chapter involves the analysis of secondary data of the rice industry in Vietnam. Moreover a survey of rice farmers in selected prov-inces in the Mekong River Delta was designed to retrieve recent data on market-ing behavior of farmers. 3.2 Overview of Vietnam’s rice economy
Vietnam's agriculture occupies 28.4 percent of the country's natural land area of 32.9 million hectares (2001). Vietnam has an extremely small area of arable land per capita (1,073 square meters per person); it has two main granaries - the Me-kong River Delta in the South and the Red River Delta in the North. The soil and topography of the country make it suitable for the cultivation of tropical as well as subtropical crops. However, agriculture has always been dominated by wet rice cultivation. Among the other foods, maize, cassava, and sweet potato are most important.
Vietnam’s food crop production, more than 85 per cent of which consists of rice, continues to be the largest share of the gross agricultural output and the focus of agricultural policy concerns. More than 70 per cent of the rural popula-tion depends on food production for their main source of income. On average, the value of gross agricultural output - including animal and fishery products - contributes 49 percent of GDP and 42 percent of the current total export value.
Facing persistent low productivity and food deficits, the Vietnamese gov-ernment initiated a series of policy reform measures (See the following sections below) in the 1980s aiming at boosting production incentives, which resulted in a doubling of paddy output (26.4 million tons in 1996 compared with 12.4 mil-lion tons in 1981, Table 3.1).
The Organization of the Liberalized Rice Market in Vietnam
36
The 1981 and 1988 economic reforms in Vietnam’s agriculture have been widely recognized as the factor underlying the recent boost in rice production and exports. Rice yield per hectare and total rice production, which had almost stagnated in the period 1976-80, turned to have annual growth rates of 3.23 and 3.14 respectively in the period 1981-87, and 2.80 and 5.19 respectively in the period 1988-96 (Table 3.3). Annual per capita rough rice output remained at al-most the same level of 270 kg in the period 1976-81 but increased by approxi-mately 30 kg and 40 kg in five and seven years of the periods 1981-85 and 1988-96 respectively (Table 3.1). Economic reforms in agriculture in Vietnam (which will be discussed in detail in Section 3.4) consisted of a shift from a collectivized agricultural production sys-tem to an individual-oriented contract system and later on to the complete liber-alization of input and output markets, allowing individual farm households to make decisions on resource allocation, crop choices and crop management. The increase in rice productivity (in terms of rice yield per hectare) in the period 1982-1987 and the subsequent rice export boom in 1989 reflect the farmer’s re-sponse to policy change. Climatic and soil conditions as well as the level of development differ substan-tially among regions in Vietnam. Rice is the main food crop in all the regions but its contribution to regional total food crop output varies. Table 3.2 shows that the northern mountains and midlands, the northern central coast, the central highlands, and the southeastern region have per capita food crop outputs below 250 kilograms; the figure of the Mekong delta was 775 kilograms in 1994. Per capita rice output of the above regions was below 200 kilograms while per cap-ita rice output of the Mekong delta was 799 kilograms in 1995. The pattern of rice consumption also differs across regions. While rice is the staple food for the Vietnamese, the proportion of other complementary food crops in the everyday diet varies between regions. The population in the northern mountains and mid-lands and the northern central coast uses more corn and other root crops to sup-plement their daily diet, especially during slack seasons of rice harvest.

Chapter 3: Vietnam’s Rice Market
37
Table 3.1 Vietnam staple food production and food availability 1976-2000 Total
production Per capita production
Per capita avail-ability (4)
Grain (1) Rice
Rice cul-tivated area (2)
Rice yield (3)
Popu-lation
Grain Rice
Rice import
Rice export
Food grain
import Grain Rice
Year
(1,000 tons) (1,000 ha) (Kg/ha) (Mil.) (Kg) (1,000 tons) (Kg) 1976 13,493 11,827 5,297 2,233 49.2 274 241 148 0 634 194 159 1977 12,622 10,597 5,469 1,938 50.4 250 210 196 0 1,096 188 158 1978 12,265 9,790 5,463 1,792 51.4 239 190 285 0 1,395 187 129 1979 13,984 11,363 5,485 2,072 52.5 267 217 320 0 1,576 209 146 1980 14,406 11,647 5,600 2,080 53.7 268 217 210 33 890 194 144 1981 15,005 12,415 5,652 2,197 55.0 273 226 12 0 452 185 146 1982 16,829 14,390 5,711 2,520 56.2 300 256 197 0 370 204 169 1983 16,986 14,743 5,611 2,628 57.4 296 257 42 0 85 194 167 1984 17,800 15,506 5,675 2,732 58.7 303 264 140 0 359 205 171 1985 18,200 15,875 5,704 2,783 59.9 304 265 336 59 422 209 176 1986 18,379 16,003 5,689 2,813 61.1 301 262 482 125 528 210 176 1987 17,563 15,103 5,589 2,702 62.4 281 242 323 120 469 193 160 1988 19,583 17,000 5,726 2,969 63.7 307 267 465 91 464 212 179 1989 21,516 18,996 5,896 3,222 64.7 334 295 55 1,372 183 198 170 1990 21,489 19,225 6,028 3,189 66.2 324 290 20 1,478 168 189 164 1991 21,990 19,622 6,301 3,114 67.6 324 289 6 1,061 255 199 172 1992 24,215 21,590 6,423 3,361 69.3 349 312 0 1,953 282 203 174 1993 25,501 22,836 6,559 3,482 71.0 359 321 0 1,649 265 212 184 1994 26,198 23,528 6,598 3,566 72.5 361 324 0 1,962 260 211 184 1995 27,571 24,926 6,766 3,684 73.9 372 337 0 2,025 na(5) 225 191 1996 29,218 26,397 7,021 3,760 75.2 388 351 0 3,047 na 232 198 1997 30,618 27,524 7,100 3,880 76.7 399 359 0 3,682 0 235 202 1998 31,853 29,142 7,362 3,990 78.1 408 373 0 3,793 0 238 205 1999 34,524 31,390 7,465 4,205 79.5 434 395 0 4,550 0 241 208 2000 35,625 32,554 7,655 4,253 80.9 440 402 0 3,500 0 240 207
Note: (1) Grain: included rice, maize, wheat. (2) Cultivated area: total area that yielded two or three rice crops per year. (3) Yield: average rice yield per hectare of cultivated area. (4) Per capita availability: per capita production minus reserved stock variation for food security program. (5) Not available.
Source: General Statistic Office, Hanoi, 2001.

The Organization of the Liberalized Rice Market in Vietnam
38
Table 3.2 Per capita food grain and rice output by region, Vietnam 1976-1995
Region I II III IV V VI VII
Per capita total food grain output (Kilograms)
1976 243 273 216 207 270 130 455 1980 225 223 185 243 298 155 453 1985 249 255 229 304 290 156 512 1990 230 294 226 274 224 123 658 1991 205 261 222 289 225 129 703 1992 239 347 234 258 221 116 727 1993 261 390 236 235 217 130 721 1994 239 328 237 269 222 150 775 1995 238 355 254 258 212 145 809
Per capita total rice output (Kilograms)
1976 187 255 175 170 180 93 437 1980 155 178 125 174 163 84 436 1985 186 233 183 247 180 110 503 1990 170 260 186 235 149 100 649 1991 137 229 180 249 160 101 695 1992 170 303 191 220 153 89 719 1993 190 350 193 199 152 101 713 1994 178 293 197 237 150 105 765 1995 179 323 213 227 136 100 799
Note: I: Northern Mountainous & Midlands; II: Red River Delta; III: Northern Central; IV: Southern Central; V: Central Highlands; VI: Eastern Mekong Delta; VII: Mekong Delta. Source: General Statistic Office, Hanoi, 1997. 3.3 Rice production system In this section, an overview of the rice production system in different regions of the country will be presented. Additionally, we also describe some main characteristics of rice farmers in the Mekong River Delta. 3.3.1 The description of rice growing seasons Due to the long length of the country and the resulting weather differences, rice-growing seasons vary from the North to the South. However, the large irrigating network blurs the boundaries between seasons in the South. Rice growing seasons in the South In the South, there are two seasons: the wet and the dry season. The wet season runs from May to November. In the wet season, the monsoon gradually begins in April, sharply increases in late May and remains heavy in June – October. Rainfall

Chapter 3: Vietnam’s Rice Market
39
levels are relatively high, but diminish in November (the majority of the 2,000 mm of rainfall occurs between June and November). The dry season runs from December through late May - early June. Depending on the ecosystem (irrigated or rainfed), there are two rice cropping patterns during the wet season in the South of Vietnam: (1) In the irrigated areas, the farmer produces both a “Summer-Autumn” and an “Autumn-Winter” rice crop
• The “Summer-Autumn” rice crop or early rainy season crop (“He thu”) is planted in April-early June and harvested in July-early August; it is planted on irrigated areas with high yield varieties.
• The “Autumn-Winter” or late rainy season crop (“Thu dong”) is transplanted in August and is harvested in November – December; it is also planted on irrigated areas with high yield varieties.
(2) In the rainfed areas, the farmer produces the “main wet season” crop (“Mua
crop”). This is a rainfed lowland crop planted with traditional varieties in July - August. They have various growing durations: early (harvested in late-October - early November); medium (harvested in late November - December); and late (harvested January - February).
During the dry season, in the irrigated areas, the farmers grow “Winter-Spring” or dry season crop (“Dong xuan”). It is planted in November - December and harvested in February - April with the bulk of the crop cut in February. In sum, in the South, in the irrigated areas there are three rice crops per year: “Summer-Autumn”; “Autumn-Winter”; and “Winter-Spring”. In the rainfed lowland areas there is only one rice crop per year – “Main wet season”, which is planted with traditional varieties (See Figure 3.1).

The Organization of the Liberalized Rice Market in Vietnam
40
Jan Feb Mar Apr May Jun Jul Aug Sep Oct Nov Dec
Summer-Autumn Rice Autumn-Winter Rice
Winter-Spring Rice Main Wet season rice
Jan Feb Mar Apr May Jun Jul Aug Sep Oct Nov Dec
Summer-Autumn rice Winter rice Main season rice
Figure 3.1 Rice growing seasons in the South of Vietnam
Figure 3.2 Rice growing seasons in the North of Vietnam
Source: Department of Agriculture and Rural Development of Cantho -Vietnam
Source: Department of Agriculture and Rural Development of Cantho -Vietnam

Chapter 3: Vietnam’s Rice Market
41
Rice growing seasons in the North In the North, which usually has a rice deficit, double cropping is the norm. Northern Vietnam has four rather distinct seasons, although it is influenced also by the Southwest monsoon. The monsoon begins in the North in mid-April and reaches a peak in August - September. Rainfall levels fall sharply in October - November as the monsoon ends in late-October/early-November. The dry season is from November to early-April. December to March is cool with short cold spells; Northern and central Vietnam are particularly vulnerable to typhoons in the July- October period, especially in the beginning and ending months of this 120-day period. Based on the characteristics of the weather as mentioned, the cropping pattern in the North is as follows: (See also Figure 3.2). The “Winter crop” (“Chiem xuan”) is equivalent to the South's “Winter-Spring” crop. It is transplanted in February and is harvested in June. These same areas are replanted with the “Main season crop” (“Mua crop”) in July and harvested in late October-November. In some minor areas of the North, the “Summer-Autumn” crop (“He thu”) or early rainy season is planted instead of the main season crop in order to free the land soon enough for planting a cash crop. Overall, however, the amounts produced of the “Summer-Autumn” crop are small in the North. 3.3.2 Irrigated lowland rice and irrigation systems Irrigated lowland rice represents the most important ecological rice production system in Vietnam; it is concentrated in the two deltas, the Red River Delta (RRD) in the North and the Mekong River Delta (MKD) in the South. 10 Government investment in irrigation occupied the largest outlay of total public investment. About one half of the outlay was borne by the central gov-ernment and the other half came from provincial government budgets. In addi-tion, from 1988 to 1992, foreign aid provided about 45 million US dollars for irrigation projects, equivalent to approximately 50 percent of government irriga-tion budget of the period 1986-90. Currently, Vietnam has an irrigation system to support 2 million ha of year-round agriculture and 400 thousand ha for one crop per year. Some 850 thousand ha are serviced by drainage schemes and 450 thousand ha are drained by electric pumping. Of the irrigated land, 20 percent is in the RRD and 40 per-cent in the MKD. On average, the irrigated area increased by 122 thousand ha per year in 1976-80, 62 thousand ha in 1981-85, 70 thousand ha in 1986-90 and 10 Rice output of the two deltas accounts for 69 percent of the country output. Eighty percent of rice areas in the RRD are irrigated while this figure in the MKD is about 40 percent (Go-letti and Minot, 1996).
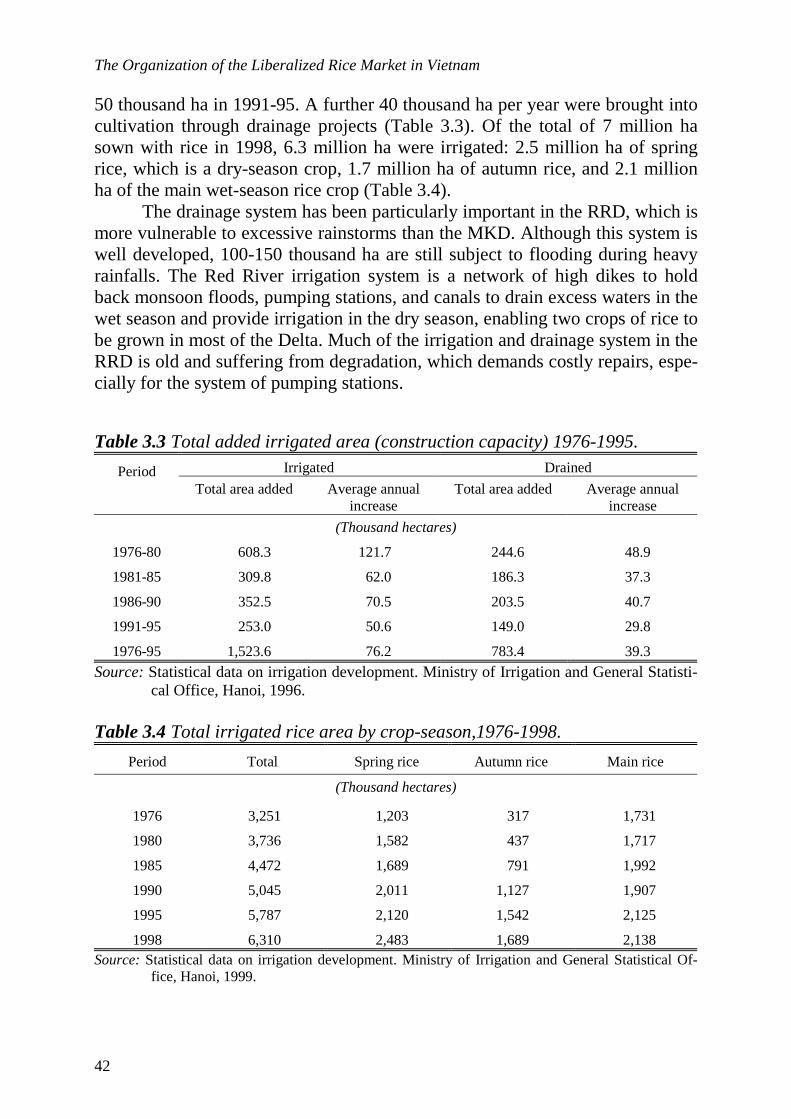
The Organization of the Liberalized Rice Market in Vietnam
42
50 thousand ha in 1991-95. A further 40 thousand ha per year were brought into cultivation through drainage projects (Table 3.3). Of the total of 7 million ha sown with rice in 1998, 6.3 million ha were irrigated: 2.5 million ha of spring rice, which is a dry-season crop, 1.7 million ha of autumn rice, and 2.1 million ha of the main wet-season rice crop (Table 3.4).
The drainage system has been particularly important in the RRD, which is more vulnerable to excessive rainstorms than the MKD. Although this system is well developed, 100-150 thousand ha are still subject to flooding during heavy rainfalls. The Red River irrigation system is a network of high dikes to hold back monsoon floods, pumping stations, and canals to drain excess waters in the wet season and provide irrigation in the dry season, enabling two crops of rice to be grown in most of the Delta. Much of the irrigation and drainage system in the RRD is old and suffering from degradation, which demands costly repairs, espe-cially for the system of pumping stations.
Table 3.3 Total added irrigated area (construction capacity) 1976-1995.
Irrigated Drained Period Total area added Average annual
increase Total area added Average annual
increase
(Thousand hectares)
1976-80 608.3 121.7 244.6 48.9
1981-85 309.8 62.0 186.3 37.3
1986-90 352.5 70.5 203.5 40.7
1991-95 253.0 50.6 149.0 29.8
1976-95 1,523.6 76.2 783.4 39.3
Source: Statistical data on irrigation development. Ministry of Irrigation and General Statisti-cal Office, Hanoi, 1996.
Table 3.4 Total irrigated rice area by crop-season,1976-1998.
Period Total Spring rice Autumn rice Main rice
(Thousand hectares)
1976 3,251 1,203 317 1,731
1980 3,736 1,582 437 1,717
1985 4,472 1,689 791 1,992
1990 5,045 2,011 1,127 1,907
1995 5,787 2,120 1,542 2,125
1998 6,310 2,483 1,689 2,138 Source: Statistical data on irrigation development. Ministry of Irrigation and General Statistical Of-
fice, Hanoi, 1999.

Chapter 3: Vietnam’s Rice Market
43
The existing system in the MKD operates mainly as an irrigation source, with transport of water to the fields being the responsibility of the farmer. The canals serve a dual purpose: as an irrigation-drainage system and for transport. After 1975, a plan was developed to build a series of large pumping stations similar to the pattern in the RRD; however, it soon became inappropriate. A system of ca-nals and dikes to bring irrigation water and control floodwater is being devel-oped. Farmers in the MKD construct minor canals and dikes to control water in their fields. The opportunities for a substantial increase in the irrigation infrastructure are limited in both the Red River and the Mekong Delta. In the Red River Delta, there is little land suitable for irrigation that has not already been developed. Land available for reclamation usually suffers from poor drainage, and requires pumping. Subsidies on electric power for pumping are being phased out, making the reclamation of inferior land unprofitable (IBRD, 1993). The priority for irri-gation development in the Red River Delta will be mainly in the rehabilitation of existing systems rather than adding new areas. In the case of the Mekong Delta, expansion of the irrigated area is con-strained by prolonged and extensive flooding in the Southern parts of the Delta and the prevalence of acid sulfate soils. The best opportunities for expanding ir-rigated rice production are in the deepwater areas, where a double crop of irri-gated rice could be grown using pump irrigation. Even in the latter case the ar-eas involved would not be more than 500 thousand hectares. Further conversion of deepwater rice areas to irrigated double rice cropping is constrained by grow-ing environmental concerns about expansion in the irrigated area, and by the relatively higher profitability of rice-aquaculture systems that typify flood-prone environments.
Central Vietnam has the largest potential for expansion of the irrigated area. The government estimates that 400 thousand hectares of rice lands can be irrigated through the development of gravity irrigation systems. However, the developmental and environmental costs of such projects could be very high (IBRD, 1993). Irrigation fees paid by farmers varied greatly across regions and across irrigation stations. The average fee collected by district irrigation stations oper-ating on electric pumps was 140-kg paddy per hectare. If the irrigation station only provides water and the task of bringing water to the fields is left to farmers; the average fee was 63 kg paddy per hectare. The average fees collected by pro-vincial irrigation companies were much higher, 212 and 137 kg of paddy per hectare respectively. 11
11 Irrigation fees were mostly paid in cash.
The Organization of the Liberalized Rice Market in Vietnam
44
3.3.3 The upland rice production system Arraudeau and Xuan (1995) stated that in Vietnam, in 1993 450,000 hectares were cultivating upland rice 12. It is planted mainly as a major food crop in the humid forest zones by more than 50 ethnic groups, most of which are nomadic and practice shifting cultivation. The total affected area is about 8 million ha, where some 3 million ethnic people are living. The annual rainfall varies from 1,300 to more than 2,000 mm, but the usual range is 1,400 - 1,800 mm. It is very erratic and droughts are common every-where. The rainy season starts in April - May, or even as late as early June, gen-erally peaks in July - August, and ends in October - December. It is more uni-form in the center and in the south and varies greatly in the north, even over short distances, where a range in elevation of 1,000 - 2,000 m over a few kilo-meters can be found. Temperatures range from 15-25oC in high-lying areas to 34-36oC in low-lying areas during the cropping season. Slash-and-burn with shifting cultivation is the predominant system. In the past, the fallow period was usually 12 - 15 years or more; however, it is now only 3-10 years because of increasing population pressure. Land degradation is an in-creasingly serious problem almost everywhere, but particularly in the north. For example, in the province of Cao Bang, most of the land is denuded, with only poor stands of grass and scattered forest remaining. Land ownership is rare, rep-resenting less than 5 percent of the area - lease holding is usual. Long-term lease was recently granted in some areas. The area planted with upland rice is generally declining. Since the increase in 1980-85 because of food shortages, there has been a progressive decline. In the province of Bac Thai, 4,500 ha were reported in 1990, then 3,900 in 1991 and 3,700 in 1992, which is less than 0.5 percent of the total provincial area. In the province of Tuyen Quang, upland rice represents less than 1 percent of the total area of the province. It is more important in some provinces, such as LaiChau, but rarely exceeds 2 percent of the total area. However, the impact on the envi-ronment is much greater. Rough estimates give a total impact of 7-10 times more than the actual area of rice because of the slash-and-burn system with fal-low rotation. Therefore, from 5 to 20 percent of the provincial areas is in fact concerned. The slash-and-burn system involves cutting the vegetation in Mach-April, then burning. Rice is planted using a stick with 5-10 seeds/hole and holes 20-30 cm apart. No fertilizers at all are used and weeding is the only form of field man-agement. A single weeding, taking 10-40 person-day/ha (usually about 20-25) is
12 lua ray in southern Vietnam, lua can in the center, lua nuong in the north

Chapter 3: Vietnam’s Rice Market
45
done. Farmers rarely do more, even when weeds are becoming serious. Harvest-ing is by hand, using sickles or small knives, or by stripping the panicles and the harvest is stored on-farm in traditional granaries. The yield varies from about 0.6 up to 2 tons/ha and declines rapidly after the first year. After 2 or rarely 3 years, the farmers abandon the land, which then lies fallow, and restart the cycle else-where.
In the slash-and-burn system, traditional cultivators are exclusively planted and it is estimated that there are probably more than 400 varieties in the country. Most of them are sticky varieties, with low amylose contents; some are nep, meaning glutinous, and are mostly used for producing liquor. They appear to belong predominantly to the upland tropical japonica group - panicles are long to very long; grains are medium to large, relatively low in number, and fre-quently awed; tillering is low; and the maturity period is mostly 100 - 160 days. Several varieties are sometimes mixed in the same field, but usually they are grown more or less pure. Inter-cropping with a different crop is infrequent, al-though maize is sometimes planted. The major yield-limiting factors reported everywhere are poor soils and drought, weeds, diseases, and pests - mainly various species of insects, depending on the area – are also noted.
3.3.4 Production and marketing activities of rice farmers Rice producers interviewed in this study were only private farmers who pro-duced paddy on their own lands (in the Mekong River Delta, private farmers are the majority, it was more than 75 percent of the total 13). The farmers of the ag-ricultural co-operatives were not considered. In this study area, more than 30 percent of the farmers grow two rice crops per year, while others grow three crops on the field with good water control. The ex-isting three alternative rice cropping systems are:
- Winter-Spring and Summer-Autumn crop - Winter-Spring, Summer-Autumn and Autumn-Winter crop - Summer-Autumn and “Mua” crop.
Beside rice cultivation, farmers in this surveyed area have also cultivated some other crops such as corn, sweet potato, soya-bean, and vegetables during the off-rice seasons (ex the break time between two rice crops). However, these crops were cultivated only on minor areas where no three rice crops per year can grow.
13 Vietnam, Agricultural Statistical Year books 1999

The Organization of the Liberalized Rice Market in Vietnam
46
According to the farmers interviewed, there were more than 10 different high yielding varieties to be used in this study areas namely, IR64, IR62032, OM404, OM504, MTL99, MTL250, AS996, CS2000, Tai nguyen, Ham trau, Dai lo, Mot bui, Lun cam 14, etc. On irrigated land, most of farmers planted a hybrid rice variety in both dry and wet season. Normally, almost all high yield-ing rice varieties were supplied by the Farming System Research Center of Can-tho University and The Cuulong Rice Research Institute (CLRRI). The rice farmers can receive new varieties through the Agricultural Extension Center of each province. In general, after harvesting, most of the farmers will dry their paddy by sun-dry in the dry season (Winter-Spring crop), or using a drying machine in the wet season (Summer-Autumn crop). Then they keep a reasonable amount of paddy for their home consumption, animal feeding, and sell the rest to rice trad-ers/millers. However, in this study, there were exceptional cases that some farm-ers directly sell “fresh-paddy” on their field after threshing (the case of farmers in Soctrang province). In the case of selling “fresh-paddy”, there were two main reasons. First, during the wet season the weather is not favorable for sun-dry, the farmers have to use machines for drying their paddy and they have to pay drying costs 15. In the case of poor farmers that produced small quantities of paddy, it is better to sell “fresh paddy” in order to receive cash instead of to bear drying costs. Secondly, some farmers that lack capital, they prefer to sell “fresh-paddy” directly after harvest because they need to pay back the input supplies that they have got from traders. To give an impression about home consumption and selling activities of rice farmers in the Mekong River Delta, Table 3.5 will show some data.
14 Of which, IR64, Mot bui, Tai nguyen, IR62032, OM404, OM504, are considered as the most popular varieties that rice farmers grow in the Mekong River Delta (from Nguyen Van Luat, CLRRI). 15 In the dry season, most of farmers can dry their paddy by sun-dry with no drying costs. In the wet season, if using a dryer, the drying cost is around 70,000 to 80,000 VND per ton of paddy. According to the report of DANIDA project in 2000, more than 70 percent paddy in the wet season is dried by dry machine. However, only 25 percent of rice farmers has their own dryer, since for one normal dryer they have to invest from 35 – 40 millions VND.

Chapter 3: Vietnam’s Rice Market
47
Table 3.5 Percentage of home consumption and marketed surplus of rice farmers in the Mekong River Delta, Vietnam, 1999 - 2000
Province Percentage of home consumption(*)
Percentage of marketed surplus
1. Tiengiang 27.80 [0.576] 72.20 [0.274]
2. Angiang 16.02 [0.747] 83.98 [0.196]
3. Vinhlong 23.50 [0.445] 76.50 [0.144]
4. Cantho 16.84 [0.690] 83.16 [0.163]
5. Soctrang 22.20 [1.086] 77.80 [0.339]
Average for whole surveyed areas
21.12 [0.723] 78.88 [0.232]
Note: (*) Volume of paddy keep as home consumption included also paddy use for feeding livestock and poultry, and reserve for seeding on next crop.
The figures in […] are coefficients of variation. Source: Own survey, 62 farmers in the Mekong River Delta, 1999 – 2000
Table 3.6 Rice production per household and marketed surplus of rice farm-
ers in Vietnam, 1996
Home consumption Marketed surplus Province Rice production/ household
(Kg)
Amount (Kg)
Percent of production
(%)
Amount (Kg)
Percent of production
(%) Northern Upland 640 563 88.0 77 12.0 Red River Delta 971 368 38.0 603 62.0 Northern Central Coast 752 504 67.0 248 33.0 South Central Coast 941 593 63.0 348 37.0 Central Highlands 547 300 55.0 247 45.0 Southeast 879 396 45.0 483 55.0 Mekong River Delta 3,105 870 28.0 2,235 72.0 Vietnam 1,316 474 36.0 842 64.0
Sources: (1) Rice production per household: from Agricultural Statistics Year books of Vietnam, 1998 (2)Home consumption and marketed surplus: from Vietnam Living Standards Survey and
IFPRI 1996.
If we compare Table 3.5 and Table 3.6, the percentage of rice production that is used for home consumption in this study was lower than in 1996 (21.12 percent as compared with 28 percent). Most of the surveyed farmers preferred to sell their paddy after harvesting, they don’t keep it to feed livestock. Because nowa-days feeding livestock and poultry like pig, chicken, duck …is very risky and raises low benefits. Some other changes in the behavior of farmers are observed. They prefer to sell all of their paddy after harvesting, since this is high quality rice that is used for export with a higher price, and they will buy back cheaper rice (usually 25 percent broken rice) in the retail market for their home con-

The Organization of the Liberalized Rice Market in Vietnam
48
sumption instead of preserving their own paddy. In sum, the percentage of rice production that was marketed is higher than in the previous period. This finding is interesting for our study. 3.4 Policy reforms and rice productivity
3.4.1 The period before policy reforms (before 1981) In 1956, after the liberation of the North, the new revolutionary government adopted the slogan “land to the tillers” thus ending the feudal era. In fact, land reform started in 1945 with the expropriation of feudal and colonial owners. The expropriation phase was followed up by the collectivisation phase from 1959, the nationalisation phase from 1980, then the privatisation phase from 1987. The process of collectivisation started in the North in the mid-1950s. As early as 1955 pilot schemes had been conducted and co-operatives were scattered over the entire countryside of North Vietnam. Almost in every case the pilot scheme for setting up co-operatives was preceded by the work of the mutual aid teams in agricultural production. In 1959, the land was collectivised and many People’s Committees were created in the North. In turn, the People’s Committees transferred the land to communes, to be cultivated by the agricultural co-operative movement. In the end of 1960, over 40,000 agricultural producers’ co-operatives were formed by 2.4 million households. Also in 1960, more than 90 percent of the agricultural co-operatives represented the elementary type of the agricultural producers’ co-operative. Land was used collectively. Out of the proceeds of co-operatives, farmers were compensated for the land, animals, and farm implements that they had contributed. The members were paid for their labour, and the surplus was put back into community services such as education and health after government dues had been deducted. In the following decade, the agricultural producers’ co-operatives were directly influenced by the 1965-1975 war. Co-operatives had to contribute money and products in order to maintain the armed forces. So, during wartime the co-operatives mainly aimed at distributing an average food ratio to everybody, thus abandoning the principle of distributing surplus according to supplied labour. By 1975, the year of unification with the South, 95 percent of Northern rural households were members of agricultural producers’ co-operatives cultivating 95 percent of agricultural lands and producing 92 percent of total agricultural output. The government started the mobilisation campaign for the “organization of the agricultural production towards socialist large-scale production”. Many co-operatives enlarged their size of membership and land under cultivation through amalgamation processes, thereby reducing the number from over 40,000 co-

Chapter 3: Vietnam’s Rice Market
49
operatives to less than 20,000 co-operatives. Because of the lack of technical skills in agriculture and a weak management, they did not achieve the expected results. Instead of economies of scale, social diseconomies of scale were the result. After 1975, several attempts were made to introduce collectivisation and forced co-operation in the South. To support this movement, land in Vietnam was nationalised in 1980. By 1980, around 1,750 co-operatives as well as 18,800 production teams were set up in the South. These units accounted for 50 percent of rural families and 36 percent of the cultivated area. Finally, all attempts proved to be largely unsuccessful. Often agricultural co-operatives were only created on paper, while members continued to organise the individual use of land supported within mutual help groups or work-exchanged teams. In the Mekong River Delta, these work-exchange teams included some 80 percent of all agricultural households. In sum, during the period before 1981, the farmer income was independent of land: land belonged to the state. A co-operative management board controlled the co-operative. All farming activities of co-operatives were done by production teams, decision-making was done by the planning department of the Council Committee at National, Provincial, or District levels. All input distribution was centralised and controlled by a top-down approach. Based on this system, each worker was assigned “work-points” or “credit points” for the quality and quantity of work done each day, and payment at the end of the season was based on the number of work-points accumulated (This was called a “work-based contract system”). The policy system created some problems. The number of working hours did not reflect the difference in quality of work; it was hard to judge the actual quantity of working hours and this led to conflicts among team members. The input supply system resulted in highly administrative overhead adding to the costs of input and in untimely input supply. Moreover “the work-based contract system” did not encourage farmers to work effectively; they paid more attention to their household economy. The food shortage became serious because rice production was low. In order to solve the above disadvantages of the “work-based contract system”, the directive No.100 was issued in 1981 by the government, which is the starting point of policy reforms in the agricultural sector in Vietnam.
Two sets of policy reforms were behind the recent rice export boom in Vietnam. The first set, initiated two decades ago, involved the switch from a col-lectivized agricultural production system to a household-oriented “contract sys-tem” of production. The second set of policy reforms, initiated in 1988, helped to further liberalize the agricultural sector and restore producer incentives. A de-tailed account of the policy reforms and their impact can be found in Pingali and Xuan (1992).
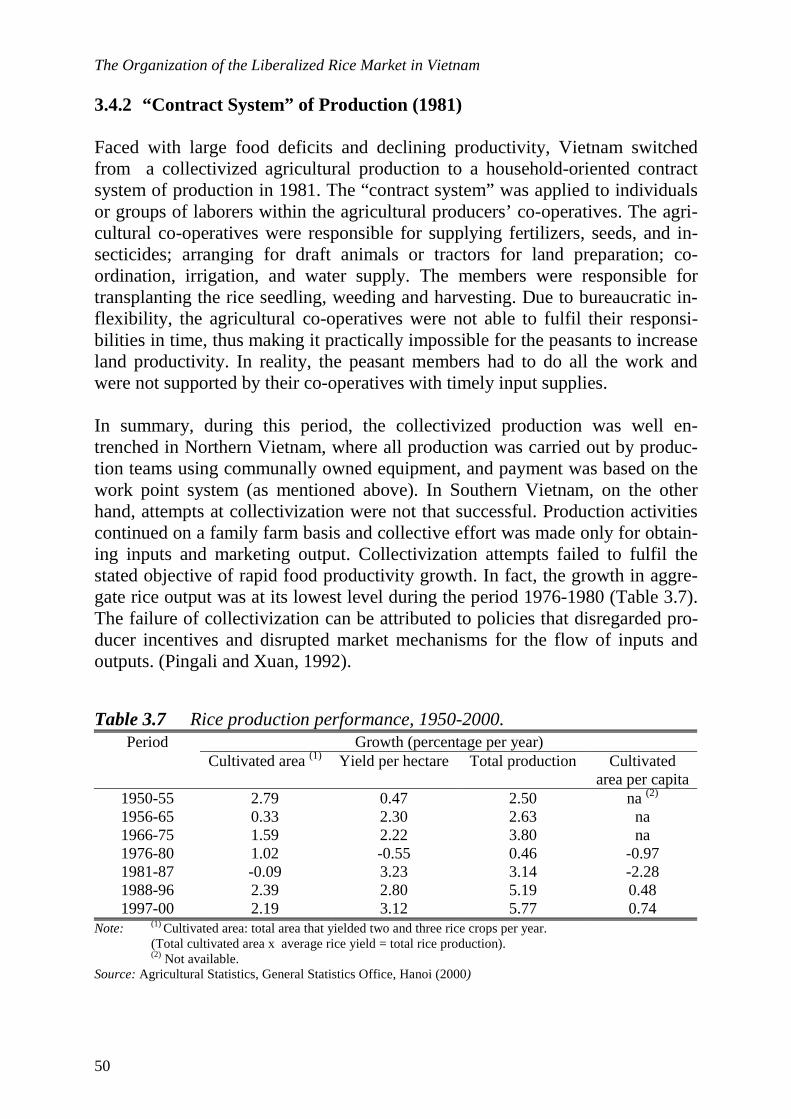
The Organization of the Liberalized Rice Market in Vietnam
50
3.4.2 “Contract System” of Production (1981) Faced with large food deficits and declining productivity, Vietnam switched from a collectivized agricultural production to a household-oriented contract system of production in 1981. The “contract system” was applied to individuals or groups of laborers within the agricultural producers’ co-operatives. The agri-cultural co-operatives were responsible for supplying fertilizers, seeds, and in-secticides; arranging for draft animals or tractors for land preparation; co-ordination, irrigation, and water supply. The members were responsible for transplanting the rice seedling, weeding and harvesting. Due to bureaucratic in-flexibility, the agricultural co-operatives were not able to fulfil their responsi-bilities in time, thus making it practically impossible for the peasants to increase land productivity. In reality, the peasant members had to do all the work and were not supported by their co-operatives with timely input supplies. In summary, during this period, the collectivized production was well en-trenched in Northern Vietnam, where all production was carried out by produc-tion teams using communally owned equipment, and payment was based on the work point system (as mentioned above). In Southern Vietnam, on the other hand, attempts at collectivization were not that successful. Production activities continued on a family farm basis and collective effort was made only for obtain-ing inputs and marketing output. Collectivization attempts failed to fulfil the stated objective of rapid food productivity growth. In fact, the growth in aggre-gate rice output was at its lowest level during the period 1976-1980 (Table 3.7). The failure of collectivization can be attributed to policies that disregarded pro-ducer incentives and disrupted market mechanisms for the flow of inputs and outputs. (Pingali and Xuan, 1992).
Table 3.7 Rice production performance, 1950-2000.
Growth (percentage per year) Period Cultivated area (1) Yield per hectare Total production Cultivated
area per capita 1950-55 2.79 0.47 2.50 na (2)
1956-65 0.33 2.30 2.63 na 1966-75 1.59 2.22 3.80 na 1976-80 1.02 -0.55 0.46 -0.97 1981-87 -0.09 3.23 3.14 -2.28 1988-96 2.39 2.80 5.19 0.48 1997-00 2.19 3.12 5.77 0.74
Note: (1) Cultivated area: total area that yielded two and three rice crops per year. (Total cultivated area x average rice yield = total rice production).
(2) Not available. Source: Agricultural Statistics, General Statistics Office, Hanoi (2000)
Chapter 3: Vietnam’s Rice Market
51
The contract system of production was designed to improve producer incentives and thereby increase productivity. In this system, individual households enter into a contract with the collective to produce a certain level of output on their land. The contracted output had to be sold to the state at a fixed price. All output beyond the contracted amount could be kept for home consumption or sold to private traders.
The introduction of the contract system of production had a significant impact on food output growth between the years 1981 to 1987 when it started to level off. Aggregate rice output grew annually at the rate of 3.14 percent during 1981-87 as compared to 0.46 percent for the 1976-80 time period (Table 3.7). Most of the output growth can be attributed to an increase in yields per hectare per crop rather than an expansion in area cultivated. This result was suitable with the real situation in practice. After the war, during the period from 1976-80, the farmers were encouraged to produce more rice in terms of increasing rice area (quantity factor). Therefore, most of the available land was used to produce rice. As a result of the policy reforms (contract system as mentioned above), bet-ter conditions were created for rice production: availability of improved tech-nology for rice cultivation, an improved irrigation system, availability of new high yielding rice varieties, etc. So, during this period an increase of rice yield (quality factor) was the main factor that led to the growth of rice production. In the Southern provinces aggregate rice output grew by over 2.5 million tons from 1980 to 1987. For the same period, the corresponding increase in the northern provinces was around two million tons (Khiem 1995).
Pingali and Xuan (1992) provide an econometric estimate of the produc-tivity impact of switching from collectivized agricultural production to the con-tract system. The switch to the contract system was estimated to have resulted in a productivity jump of 12 percent and 16 percent respectively for the Northern and Southern provinces. By 1989 Vietnam was producing 91 percent of its food requirements as compared to 73 percent in 1980 (UNDP, 1989). Figure 3.3 show the trend in Vietnam's rice production from 1976 to 2000 (as presented in Table 3.1). This figure illustrates that the contract system of production had a signifi-cant impact on rice output growth between the years 1981 to 1987.

The Organization of the Liberalized Rice Market in Vietnam
52
Figure 3.3 The trend of rice production and rice area in Vietnam, 1976-2000 Source: General Statistic Office, Hanoi 2001. The success of the contract system could not be sustained over the long term due to the following reasons. a) Land use and crop choice decisions were still being done by the State Planning Commission in the traditional top-down approach, without consideration of farmer preferences and local market conditions; b) the government often failed to collect all of the contracted grain at harvest time due to financial difficulties; c) as a consequence of (b), seasonal surpluses at the farm gate led to a crash in the private rice price in several regions, which, while benefiting the urban poor, had severe disincentive effects on the farmers; d) the persistence of centralized input supplies resulted in inadequate and untimely provision of inputs to the farmers; and e) lack of land tenure security resulted in inadequate farm level investments for maintaining long term land productivity. To overcome those shortcoming mentioned above, in 1988 the government re-leased resolution No. 10 – “the latest reform in 1988”. The new policy contains three major issues as follows
0
5000
10000
15000
20000
25000
30000
35000
76 78 80 82 84 86 88 90 92 94 96 98 2000Year
Th
ou
san
d t
on
s an
d h
ecta
re
Rice production(000' Tons)Rice area (ha)

Chapter 3: Vietnam’s Rice Market
53
3.4.3 The “latest reform” in 1988
Land allocation The resolution number 10, assigned land to the farmer for 10-15-20 year’s terms on the basis of a renewable lease. The assignment of land to the family, rather than to an individual, implies that land remains within the family. The farmer cannot be displaced from his land without his consent and without fair compensation for the cost of land development. They are now free to decide what to produce, how to produce it and how to market their farm products. The role of the co-operatives has also changed. Their functions are limited to services like irrigation management, technical know-how transfer etc. Production teams were replaced by peasant households which became the basic units of agricultural production. Privatisation of output markets and introduction of the land tax Starting in 1989, farmers no longer are required to sell a quota amount of rice to the State. The individual family will have the right to own all products generated by it after subtracting taxes and commission to the board of collectives to pay for their services. Farmers are required to pay a tax based on the assessed value of their land. Private traders have equal rights to purchase rice from the farmers, the food grain prices now are equal in the government supply stores and in the free markets. In practice, the state companies have a high demand of paddy for processing for export and for the national food security program.
Decentralisation of input supplies Prior to 1988, retail traders in agricultural inputs had been controlled by the state trading corporations and the input buying and selling co-operatives. The total supply of inputs was never enough to meet demand. In the later half of 1988, input supplies were being handled by the provincial authorities rather than the central government, this also included imports of inputs. Several provinces in the South had started importing fertilizers by using their own export earnings or through bilateral programs. Farmers with financial resources were also allowed to own mechanical equipment and draft animals. Ordinance number 193 issued on 23rd December 1988 indicated that individual traders could also handle input marketing. However, input-import procurements had still to be done by the state import-export agencies and foreign exchange allo-cations were still highly controlled by the state.
The Organization of the Liberalized Rice Market in Vietnam
54
3.4.4 Rice Market Liberalization (1989) Some of the shortcomings discussed above were corrected through a series of reforms introduced in 1989. The most important reforms were: i) assigning farmers long term, inheritable leases on their land; ii) replacement of the con-tract system by a land tax system, which meant that farmers were no longer re-quired to sell a large part of their output to the state at a low price; iii) privatiza-tion of the agricultural output market; iv) decentralization of input supplies; and v) removal of the food grain subsidy given to government employees and the army. Immediate Impact: These reforms resulted in a sudden and massive increase in rice exports. In early 1989, when the food grain subsidy was removed, the price of rice in the government stores was the same as the private market price. The quality of rice sold in government stores however was much poorer than pri-vately sold rice, since farmers traditionally met their quota obligations through lower quality grain. Since there was no longer a price advantage, the former re-cipients of food grain subsidies quickly moved to purchasing grain from the pri-vate market. Government stocks were then put on the international market by mid-1989. Between June to December 1989, approximately 1.3 million tons of rice were exported out of Vietnam; the exports for the entire year of 1988 were only 108 thousand tons (IRRI, 1991) (See also Table 3.8).

Chapter 3: Vietnam’s Rice Market
55
Table 3.8. Milled rice supply, export, and consumption, 1980-2000 (Thousand tons)
1980 1987 1988 1989 1990 1991 1992 1993 1994 1995 1996 1997 1998 1999 2000
Total supply (1)
Import (+) or Export (-)
Reserved stock variation (2)
Available for consumption
Population (mil. Persons)
Per capita availability (kg)
4,871
177
5,048
53.7
94.0
6,128
203
159
6,490
62.4
104.0
7,308
347
-293
7,389
63.7
116.0
8,179
-1,317
320
7,182
64.7
111.0
8,388
-1,458
153
7,083
66.2
107.0
8,788
-1,055
-163
7,570
67.6
112.0
9,645
-1,953
138
7,830
69.3
113.0
10,242
-1,649
na (3)
8,520
71.0
120.0
10,662
-1,962
na
8,700
72.5
120.0
11,189
-2,025
na
9,164
73.9
124.0
12,747
-3,047
na
9,700
75.2
129.0
13,112
-3,682
na
9,430
76.7
123.0
13,874
-3,793
na
10,081
78.1
129.0
14,942
-4,550
na
10,392
79.5
131.0
15,495
-3,500
na
11,995
80.9
148.0
Note: (1) Total paddy output minus 30 percent accounted for post harvest losses, seed and other uses of household farmers (food for animal) The conversion ratio from paddy to milled rice was 65 percent on average. (2) Volume of paddy rice stored at national warehouses for food security program. (3) Not available.
Source: Ministry of Agriculture and Rural Development (2000)

The Organization of the Liberalized Rice Market in Vietnam
56
The private market price of rice rose rapidly due to the sudden shift in demand and due to the large scale de-stocking of publicly held rice. The domestic rice price, which in early 1989 was USD 125/ton lower than the world market price16, equaled the world price by mid-1990 and was substantially higher than the world price through August 1991 (Khiem and Pingali 1995). Since the pur-chase of food grains from farmers was also privatized in 1989, the farm-gate price rose rapidly in response to the exports-induced shift in demand. In the South, the farm gate price for the wet season harvest rose from USD 5.80 per 100 kilograms of paddy in 1989 to USD 7.50 per 100 kilograms in 1990 and has leveled off at USD 8.50 per 100 kg in 1991 and 1992. Rice sales by the Southern households responded predictably, rising from 2.7 tons/year in 1989 to 6 tons/year in 1990 and 7.5 tons/year in 1992 (Table 3.9). Total sales rose from 40 percent of total production in 1989 to 66 percent in 1992. Even in the North, rice sales though modest went up from 95 kilograms per household in 1989 to 162 kilograms per household in 1992.
Did the additional export volume come from an increase in rice produc-tion or at the cost of consumption? In the first and second year of market liber-alization (1989-90), rice exports may have come at the expense of domestic con-sumption, especially in traditionally food deficit areas such as Northern and Central Vietnam. This can be concluded from the substantially higher prices in Northern Vietnam relative to the price in Ho Chi Minh City in the early years. Since 1991 however, regional price differences, after accounting for transport costs, were not significantly different (Barker, 1994). Policy reforms and the restoration of producer incentives have resulted in sig-nificant shifts in yield in both the Red River and the Mekong Delta areas. Under the contract system, farmers obtained 30 percent higher yields than under the collective system. Further liberalization of the rice market lead to additional yield gains of 54 percent. Yield gains have occurred mainly in the irrigated envi-ronments where modern rice varieties are widely used. (Khiem and Pingali, 1995) Land policy: Land reallocation and promulgation of the new land law is the most important component of policy reforms in agriculture. It is recalled that in 1981, the contract system replaced the collective system as farmlands were allo-cated to households with the obligation to turn over to the state a contracted level of output at a fixed price. Although this shift from a fixed wage to a fixed rent system (tax system) of production increased efficiency in management deci-sions and work efforts, the lack of tenure security, low output price, and inade-quate input supplies constrained further growth in productivity.
16 The world market price of rice was calculated based on Thailand’s export price.

Chapter 3: Vietnam’s Rice Market
57
Table 3.9 Rice production performance, sample farm data, Red River Delta and Mekong River Delta, Vietnam, 1989-1992.
Northern Vietnam Southern Vietnam
1990 1991 1992 1989 1990 1991 1992
No. of farms Wet season 207 167 171 100 90 100 102 Dry season 184 158 158 102 85 102 104
Ave. yield (*) (t/ha) Wet season 3.70 3.98 3.74 4.02 4.08 3.96 4.53 Dry season 4.43 2.40 4.42 4.91 5.18 5.40 5.68
Ave. land area per household (ha)
0.25 0.25 0.25 1.00 1.20 1.24 1.20
Rice cropping intensity 1.59 1.66 1.66 1.47 1.74 1.84 1.85
Rice prod./ household (kg)/year
2,033 1,595 2,040 8,920 9,260 9,360 10,210
Rice sold per household (kg)
95 112 162 2,659 5,918 5,475 7,555
Net prod. (kept for con-sumption, seed,..)
1,938 1,483 1,878 6,261 3,342 3,885 2,655
Average farm gate price (USD/100 kg)
Wet season 9.20 14.60 9.80 5.80 7.50 8.30 8.60 Dry season 9.70 16.90 11.40 8.10 9.70 8.80 9.50
Note: (*) Average yield: annual production per hectare. (The data in 1998 in Northern Vietnam are not available) Source: Farm survey 1989-93, International Rice Research Institute, Los Banos, Philippines, CanTho University
and HaNoi Agricultural University – IRRI, Annual Report 1994. By 1988, long-term cultivation rights from 15-25 years and transferable within the family were granted to households. However, the prohibition of private land transfer and the limitation of the tenure period discouraged market transactions of land and reduced incentives for private investments for land conservation and improvement. In order to overcome these problems, regulations on land tenure were revised in the Land Law of 1993 (approved by the National Assembly in July 1993). The Law allows the holders of land use titles five rights: “exchange, transfer, inheritance, lease and mortgage”, conditional to the payments of tax for such transfers. The 1993 Land Law represents a major advancement on the re-form of land property institutions for promoting market-oriented economic de-velopment. If this Law is appropriately administered, household land-use rights may become, in effect, essentially the same as private property rights in devel-oped market economies even though state ownership is maintained (Hayami, 1994). To insure the titling of land use rights to individual households, land-use certificates are being issued based on cadastral surveys.

The Organization of the Liberalized Rice Market in Vietnam
58
Even prior to the enactment of the Land Law of 1993, de-facto transactions of lands were carried out, especially by farmers in the Mekong Delta. Farmer to farmer land transactions took one of the following forms. Outright purchase of lands conducted with written contracts witnessed by another villager but without legal sanction. Short-term land mortgage commonly arranged between farmers under the terms that the mortgage giver obtains a share of the output from lands as interest. Mortgage amount is always valued in gold equivalence, a way to in-sure against the risk of inflation. Land leasing was also possible - seasonal or permanent - under fixed rent arrangement. Land has also been used as collateral in the informal credit market. 3.5 Trend in rice production Table 3.7 in the previous section has summarized the growth of area and yield of rice from 1950 to 2000. Although the rice cultivated area increased at the rate of 1 percent from 1976 to 1980, the total production stagnated at the level of 11 million tons (Table 3.1). Rice production in the period 1981-87 was marked by a sharp increase in yield and in output (3.23 and 3.14 percent per annum respec-tively). Total rice production increased at 5 percent yearly in the period 1988-96 of which area accounted for nearly 2.4 percent and yield 2.8 percent of the rate. In the latest period 1997-2000, total rice production continuously increased at 5.77 percent per year, of which the growth in rice yield also contributed more than the cultivated area. Figure 3.3 (page 53, Section 3.4.2) shows the produc-tion and area trend of rough rice for the period 1976-2000. Expansion of rice ar-eas of the period came mainly from the conversion of single to double rice crop-ping in the Mekong River Delta (Table 3.10 and Figure 3.4). Reclamation of marginal land in the delta since 1975 has increased arable land by only 10 per-cent, but area planted to short duration, high-yielding rice varieties has increased more than three times. Rice area in the Mekong River Delta increased 583 thou-sands hectares from 1987 to 1992 (Table 3.10), in which 183 thousands hectares were from clearing new land and 400 thousands hectares from shifting of crop-ping practice.
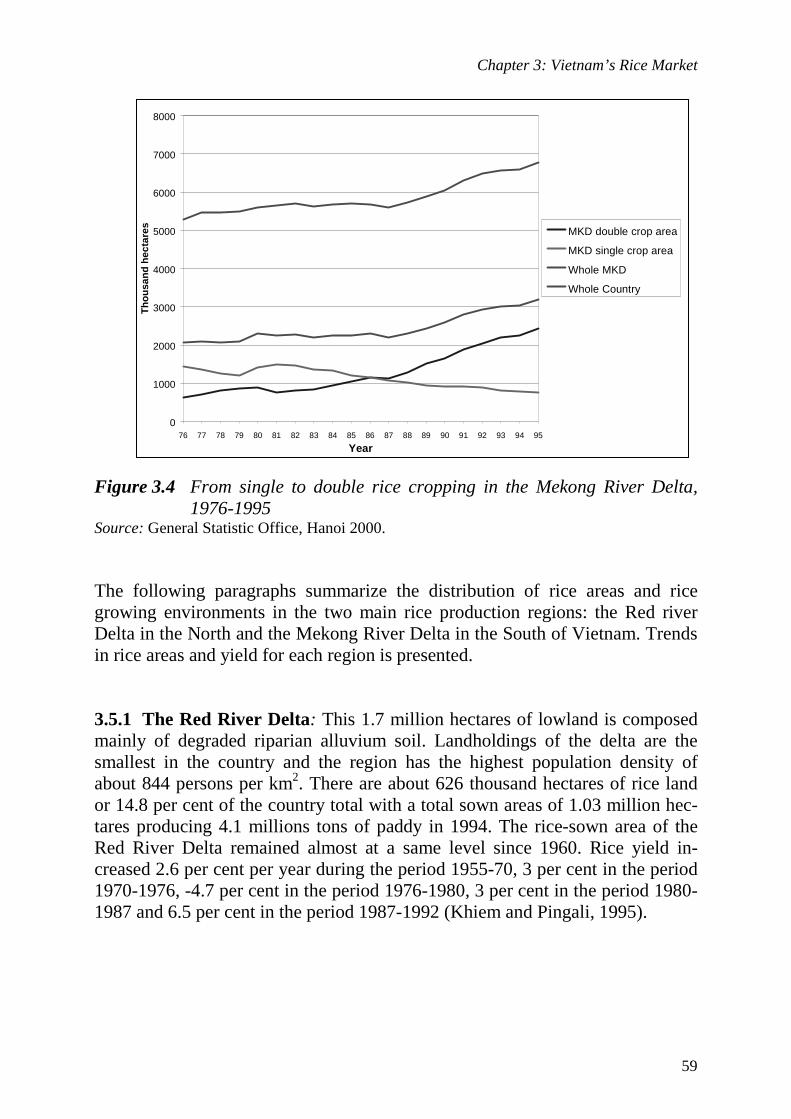
Chapter 3: Vietnam’s Rice Market
59
Figure 3.4 From single to double rice cropping in the Mekong River Delta,
1976-1995
Source: General Statistic Office, Hanoi 2000. The following paragraphs summarize the distribution of rice areas and rice growing environments in the two main rice production regions: the Red river Delta in the North and the Mekong River Delta in the South of Vietnam. Trends in rice areas and yield for each region is presented. 3.5.1 The Red River Delta: This 1.7 million hectares of lowland is composed mainly of degraded riparian alluvium soil. Landholdings of the delta are the smallest in the country and the region has the highest population density of about 844 persons per km2. There are about 626 thousand hectares of rice land or 14.8 per cent of the country total with a total sown areas of 1.03 million hec-tares producing 4.1 millions tons of paddy in 1994. The rice-sown area of the Red River Delta remained almost at a same level since 1960. Rice yield in-creased 2.6 per cent per year during the period 1955-70, 3 per cent in the period 1970-1976, -4.7 per cent in the period 1976-1980, 3 per cent in the period 1980-1987 and 6.5 per cent in the period 1987-1992 (Khiem and Pingali, 1995).
0
1000
2000
3000
4000
5000
6000
7000
8000
76 77 78 79 80 81 82 83 84 85 86 87 88 89 90 91 92 93 94 95
Year
Th
ou
san
d h
ecta
res
MKD double crop area
MKD single crop area
Whole MKD
Whole Country
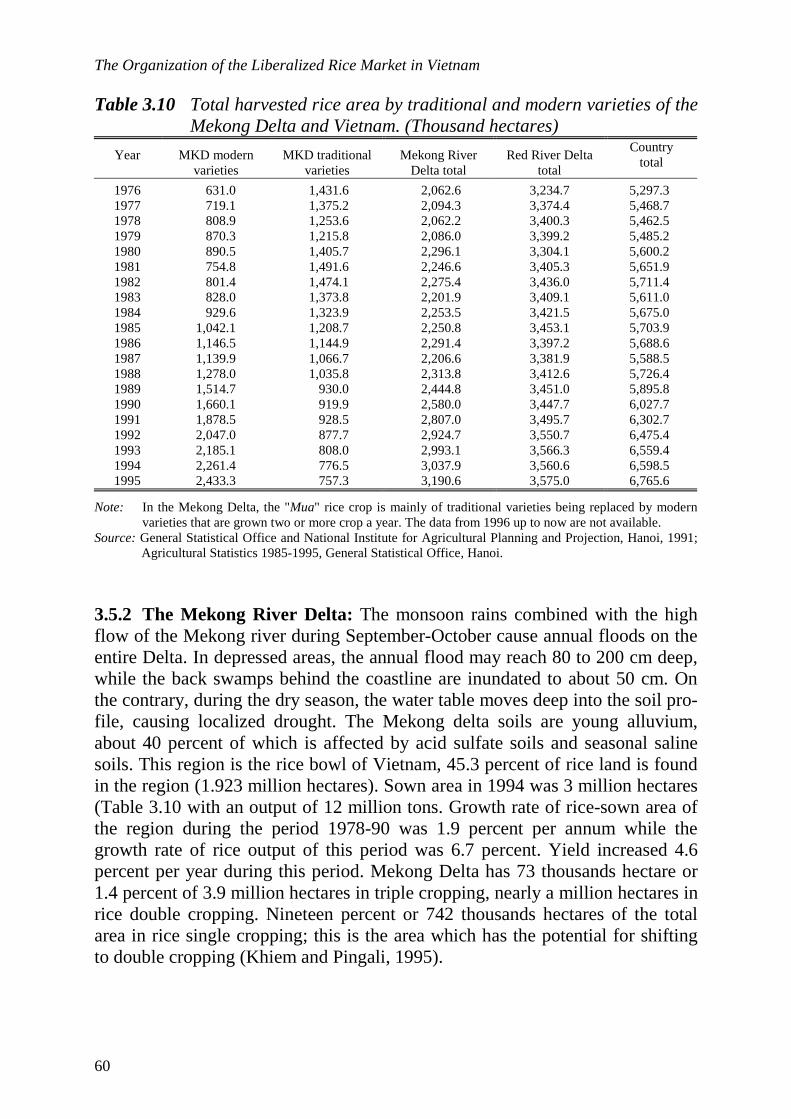
The Organization of the Liberalized Rice Market in Vietnam
60
Table 3.10 Total harvested rice area by traditional and modern varieties of the Mekong Delta and Vietnam. (Thousand hectares)
Year MKD modern varieties
MKD traditional varieties
Mekong River Delta total
Red River Delta total
Country total
1976 631.0 1,431.6 2,062.6 3,234.7 5,297.3 1977 719.1 1,375.2 2,094.3 3,374.4 5,468.7 1978 808.9 1,253.6 2,062.2 3,400.3 5,462.5 1979 870.3 1,215.8 2,086.0 3,399.2 5,485.2 1980 890.5 1,405.7 2,296.1 3,304.1 5,600.2 1981 754.8 1,491.6 2,246.6 3,405.3 5,651.9 1982 801.4 1,474.1 2,275.4 3,436.0 5,711.4 1983 828.0 1,373.8 2,201.9 3,409.1 5,611.0 1984 929.6 1,323.9 2,253.5 3,421.5 5,675.0 1985 1,042.1 1,208.7 2,250.8 3,453.1 5,703.9 1986 1,146.5 1,144.9 2,291.4 3,397.2 5,688.6 1987 1,139.9 1,066.7 2,206.6 3,381.9 5,588.5 1988 1,278.0 1,035.8 2,313.8 3,412.6 5,726.4 1989 1,514.7 930.0 2,444.8 3,451.0 5,895.8 1990 1,660.1 919.9 2,580.0 3,447.7 6,027.7 1991 1,878.5 928.5 2,807.0 3,495.7 6,302.7 1992 2,047.0 877.7 2,924.7 3,550.7 6,475.4 1993 2,185.1 808.0 2,993.1 3,566.3 6,559.4 1994 2,261.4 776.5 3,037.9 3,560.6 6,598.5 1995 2,433.3 757.3 3,190.6 3,575.0 6,765.6
Note: In the Mekong Delta, the "Mua" rice crop is mainly of traditional varieties being replaced by modern varieties that are grown two or more crop a year. The data from 1996 up to now are not available.
Source: General Statistical Office and National Institute for Agricultural Planning and Projection, Hanoi, 1991; Agricultural Statistics 1985-1995, General Statistical Office, Hanoi.
3.5.2 The Mekong River Delta: The monsoon rains combined with the high flow of the Mekong river during September-October cause annual floods on the entire Delta. In depressed areas, the annual flood may reach 80 to 200 cm deep, while the back swamps behind the coastline are inundated to about 50 cm. On the contrary, during the dry season, the water table moves deep into the soil pro-file, causing localized drought. The Mekong delta soils are young alluvium, about 40 percent of which is affected by acid sulfate soils and seasonal saline soils. This region is the rice bowl of Vietnam, 45.3 percent of rice land is found in the region (1.923 million hectares). Sown area in 1994 was 3 million hectares (Table 3.10 with an output of 12 million tons. Growth rate of rice-sown area of the region during the period 1978-90 was 1.9 percent per annum while the growth rate of rice output of this period was 6.7 percent. Yield increased 4.6 percent per year during this period. Mekong Delta has 73 thousands hectare or 1.4 percent of 3.9 million hectares in triple cropping, nearly a million hectares in rice double cropping. Nineteen percent or 742 thousands hectares of the total area in rice single cropping; this is the area which has the potential for shifting to double cropping (Khiem and Pingali, 1995).

Chapter 3: Vietnam’s Rice Market
61
Rice production performance observed for two groups of rice farmers in the Red River and the Mekong Deltas are presented in Table 3.10. Sample rice farms have been monitored for five consecutive years since the start of liberalization policy in 1989. Yield trends from farm data confirm observed regional trends. Areas planted to rice in the RRD remain at the same level during the last twenty years while shifting from traditional rice to modern varieties and from single to double or triple cropping in the MKD resulted in rapid expansion of rice sown areas. In summary, the above sections have reviewed rice production as well as the progress of rice market liberalization in Vietnam. This information is used as a necessary background for developing the suitable methodology to analyze the rice marketing in Vietnam. 3.6 World rice production and trading Rice exports from Vietnam are often cited as the success story of agricultural policy reforms. Since 1989, Vietnam has been exporting one to two million tons of rice, making it the third largest exporting country in the world. Vietnam’s re-acquired status as a rice exporter came as a surprise since it had been a net im-porter of rice since 1968. Therefore, in analyzing Vietnam’s rice market, we ought to consider and examine briefly the world rice markets, including world rice production, consumption, and Vietnam’s rice competitors. The information on the world rice markets will help the Vietnamese government develop a suit-able rice export strategy and also manage the domestic rice markets efficiently. 3.6.1 World rice production, consumption and trade
Period of 1970-1989 As shown in Table 3.11, world rice production fell in 1973 by more than 3 per-cent while consumption of the same year fell less than 2 percent. Fortunately, world rice production recovered quickly in the following year, increasing by 9.09 percent while world consumption increased by only 4.69 percent leading to stockpile of 5 million tons - nearly 20 percent of the world rice stock in the early 1970s (Table 3.11). During the rest of the 1970s, world rice production ex-ceeded world consumption in most years making world rice stock double in 1980 as compared to 1970 (from 26.4 million tons in 1970 to 53.7 in 1980).

The Organization of the Liberalized Rice Market in Vietnam
62
Table 3.11 World rice production, consumption, stock and trade, 1970-1989 Year Production
(million tons)
Annual growth rate
(%)
Consump-tion (mil-lion tons)
Annual growth rate
(%)
Trade (mil-lion tons)
Annual growth rate
(%)
Stock (million
tons)
1970 210 - 199 - 8.2 - 26.4 1971 213 1.43 211 6.03 8.6 4.65 28.8 1972 216 1.41 217 2.84 8.7 1.16 28.0 1973 209 - 3.24 213 - 1.84 8.4 - 3.45 23.8 1974 228 9.09 223 4.69 7.7 - 8.33 28.8 1975 276 1.05 227 1.79 7.3 - 5.19 28.0 1976 243 - 11.96 232 2.20 8.4 15.07 38.8 1977 236 - 2.88 237 2.16 10.6 26.19 37.8 1978 251 6.36 244 2.95 9.6 - 9.43 44.2 1979 262 4.38 253 3.69 11.9 23.96 54.1
Average 70-79
234 2.48 226 2.70 8.9 4.20 33.9
1980 257 - 1.91 257 1.58 12.5 5.04 53.7 1981 270 5.06 275 7.00 12.7 1.60 48.5 1982 278 2.96 283 2.91 11.5 - 9.45 43.3 1983 285 2.52 285 0.71 11.5 0.00 43.6 1984 307 7.72 303 6.32 11.5 0.00 47.9 1985 317 3.26 309 1.98 10.7 - 6.96 55.6 1986 318 0.32 319 3.24 11.7 9.35 54.4 1987 316 - 0.63 320 0.31 12.8 9.40 50.7 1988 315 - 0.32 321 0.31 11.2 - 12.50 44.7 1989 331 5.08 327 1.87 13.9 24.11 48.8
Average 80-89
299 2.85 300 2.71 12.0 1.18 49.1
Average 70-89
254.2 1.66 250.2 1.36 9.9 4.98 39.5
Note: Annual growth rate (previous year = 100 %). Average growth rate for 20 year period (1970 –1989) Source: Ministry of Trade of Vietnam, World Rice Production, Consumption and Stock, 1999.
The 1980s witnessed a slight increase in rice production with a growth rate of 2.85 percent per year on average compared to 2.48 percent per year on average during the previous decade. However, during 1980-1989 the average annual growth rate of world rice consumption was 2.71 percent, almost the same as production growth rate (2.85 percent). World rice stocks during the 1980s re-mained at higher levels (45 –50 million tons) than in the previous decade. There-fore, it can be said that the world produced enough rice to meet its growing con-sumption demand in the 1980s. The above overview of the world rice supply and demand conditions during the 1970-1989 period allow us to conclude that world rice production not only caught up with world rice consumption but also allowed for an increase in world rice stocks.

Chapter 3: Vietnam’s Rice Market
63
Period of 1990-1998 Table 3.12 shows that world rice production growth rates slowed down to only 1.39 percent per year during 1990-1998 period. The reasons for such slowdown were slow yield growth, and almost no area expansion. 17 During the same pe-riod, world rice consumption also slowed down to 1.6 percent compared with the previous period but to a lesser extent than world rice production. Compared to the beginning of the decade, world rice stocks declined considerably from roughly 16 percent of world consumption in 1990 to 13.6 percent in 1998 (calculated from Table 3.12). Thus, during 1990s, although world rice production still continued to increase, world consumption increased at a faster rate leading to shortfalls of rice during the decade. Table 3.12 World rice production, consumption, stock and trade, 1990-1998.
Year Produc-tion (mil-lion tons)
Annual growth
rate (%)
Consump-tion (mil-lion tons)
Annual growth
rate (%)
Trade (million
tons)
Annual growth
rate (%)
Stock (million
tons)
1990 344 - 338 - 11.4 - 54.3 1991 352 2.33 347 2.66 12.1 6.14 58.9 1992 355 0.85 356 2.59 14.1 16.53 57.2 1993 356 0.28 358 0.56 15.1 7.09 55.0 1994 356 0.00 359 0.28 16.7 10.60 51.9 1995 365 2.53 367 2.23 21.0 25.75 50.1 1996 372 1.92 371 1.09 19.5 - 7.14 49.9 1997 380 2.15 377 1.62 19.0 - 2.56 50.6 1998 384 1.05 384 1.86 27.5 44.74 52.3
Average 90-98
362.7 1.39 361.9 1.61 17.4 11.64 53.4
Note: Annual growth rate (previous year = 100 %). Average growth rate for 9 year period (1990–1998) Source: Ministry of Trade of Vietnam: World Rice Production, Consumption and Stock, 1999.
It is interesting to note that during this decade, world rice trade increased much faster than in the previous period. At the same time, world rice trade seemed to fluctuate much more than in the previous period (See Tables 3.11 and 3.12). The year 1998 was an outstanding phenomenon. During that year, the El Nino caused unfavorable weather in many countries, such as Indonesia, the Philip-pines, Bangladesh, and Brazil, which substantially reduced rice production in those countries. Nonetheless, many other countries, such as China, India, Viet-nam, and Thailand, enjoyed good harvests in 1998 and increased their rice pro-duction. World rice production, therefore, did not decline but instead increased by 4 million tons allowing the world to meet its substantial increase in rice con-sumption in this year. Rice trade in 1998, therefore, rose to a record high level of 27.5 million tons. Because the weather has become normal for most part of the
17 USDA, 1998.

The Organization of the Liberalized Rice Market in Vietnam
64
world in early 1999, rice trade in 1999 is expected to reduce to its normal level of 22 million ton. 18 Prospects of world rice market Total world rice area harvested is projected to increase only slightly to 148 mil-lion hectares by 2003 from a 1992 base of 145 million hectares. The world aver-age yield of rice was about 2.42 tons per hectare in 1992, and is projected to be 2.74 tons per hectare by 2003. Consequently, total production is projected to in-crease from 351 million tons in 1992 to 405 million tons by 2003. 19 Total world consumption is projected to increase at the same rate as total production, from 354 million tons in 1992 to 407 million tons by 2003. For some Asian countries, rice has become an inferior good, while for other coun-tries including some industrialized market economies it is still a normal good. Ending stocks are projected to decline from 51.4 million tons in 1992 to 43.8 million tons by 2003. World rice net trade is projected to increase only marginally from 11.6 million tons in 1992 to 14.6 million tons by 2003. Net trade as a percentage of total production is projected to increase slightly from 3.3 percent in 1992 to 3.6 percent by 2003. The international rice market is projected to remain thin. 20 In summary, the past trends of world rice supply and demand and the above pre-dictions on future demand and supply allow us to say that in the near future, the world may face difficulties in meeting its rising demand for rice. However, whether this will turn into a “food crisis” 21 or “the world can feed twice as many in twenty years” depends heavily on the changes in supply and demand determinants. 22 Given the volatile nature of both supply and demand in the world market, it becomes more and more difficult to give projections on changes in the world rice market. However, if investments in agriculture are promoted, prospects for the rice market in the longer-run will be optimistic. 3.6.2 Major rice-exporting countries The figures from Table 3.13 show the volume of rice exported from different re-gions of the world during the 1989-1999 period. This table indicates that Asia has been the most important source of rice export of the world. In Asia, there are
18 USDA, 1999. 19 Wailes and Cramer, 1994. 20 International Baseline Projections, Arkansas Rice model, Wailes and Cramer, 1994. 21 Pingali, P.L., et al., 1997. 22 Mitchell, D.O., et al., 1997.

Chapter 3: Vietnam’s Rice Market
65
at least 10 countries that have appeared in the world rice market as either usual or occasional rice exporters. On average, Asia exported 70 percent of total world rice export. Most of the world’s leading rice exporters, such as Thailand, Viet-nam, India, Pakistan, Burma, are situated in the Asian region.
Table 3.13 Rice exports by region, 1989-1999 (Million tons)
Regions 1989 1990 1991 1992 1993 1994 1995 1996 1997 1998 1999
Asia 9.4 7.4 8.3 9.7 10.5 11.8 15.5 14.4 13.8 21.5 15.8
America 3.5 3.3 3.5 3.3 3.6 3.8 4.3 4.0 4.0 4.6 4.6
Oceania 0.3 0.3 0.3 0.4 0.5 0.5 0.5 0.6 0.6 0.6 0.7
Africa 0.2 0.2 0.2 0.2 0.2 0.2 0.3 0.3 0.4 0.5 0.3
Europe 0.2 0.2 0.2 0.2 0.2 0.3 0.3 0.2 0.2 0.2 0.2
World 13.9 11.4 12.1 14.1 15.1 16.7 21.0 19.5 18.9 27.5 21.6
Source: F.A.O – Food Outlook Statistics Supplement, 1999.
The following paragraphs will provide some basic information of major export-ing countries Thailand: Thailand has been exporting rice for more than a century and has a very large market of 125 countries all over the world. Recently, Thailand ex-ported 5-6 million tons of rice to the world market, taking the highest rank. Thai rice competes in all segments of the rice market: high, medium, and low quality. In the near future, the harvested area is expected to increase from 9.4 million hectares in 1992 to 9.9 million hectares by 2003. Yields forecasted in Thailand are determined by further adoption of high-yielding varieties, costs of produc-tion, and weather factors. Total per capita rice use in Thailand was 149 kilo-grams in 1992 and is projected to decline steadily to 136 kilograms by 2003 as per capita incomes rise and dietary habits change. Thailand is projected to main-tain its status as the largest rice exporting country; total rice export is projected to increase to 5.0 million tons by 2003. India: Since 1995, India exported considerable amounts of rice to the world market and ranked second among the world’s leading rice exporters twice in 1995 and 1998. However, increase in domestic consumption, already tight stocks and a slight drop in production is resulted in smaller exports in 1999. In-dia is a major parboiled rice exporter, its main rice export market is the Middle East. However, in the low and medium quality rice markets, India’s rice is not as price competitive as Vietnam because of India’s high transportation cost and lower quality rice (USDA, 1999). Despite these difficulties, India is expected to sustain its position as a major rice exporter at least several years from now and will remain an important competitor of Vietnam.
The Organization of the Liberalized Rice Market in Vietnam
66
The United States: produces only 11.5 percent of total world rice production but has always been an important exporter in the world rice market for many dec-ades. The United States has a good reputation for the export of high quality long and medium grain rice. Rice yield of this country is projected to increase from 4.32 tons per hectare in 1993 to 4.79 tons by 2003. As a result, rice production in the US is projected to increase from 4.95 million tons in 1993 to 6.23 million tons by 2003. Domestic food consumption of rice is projected to increase sub-stantially, from 2.19 million tons in 1992 to 2.96 million tons by 2003, mainly due to income and population effects. Exports are projected to remain at least approximately 5.62 million tons, and imports are projected to increase from 0.19 million tons in 1992 to 0.38 million tons by 2003 (Wailes and Cramer, 1994). China: is the world’s largest rice producer. China produces about 35 percent of total world rice output in 1998. However, because of its large population, China sometimes still has to import rice. This country comes to the world rice market as both exporter and importer. China exports Japonica rice to high-income mar-ket, mostly are Japan and European countries, and imports medium and low quality rice for domestic use. Government policies significantly regulate the Chinese rice economy. However, under the ongoing economic reforms, farmers determine their rice acreage not only on the basis of government procurement prices but also on free market prices, and the adoption of new technologies. Rice yields in China are influenced by the free market price and the flow of new technologies as well as by government price policies. Projected yields increase from 3.87 tons per hectare in 1993 to 3.95 tons per hectare by 2003. Total pro-duction in 1992 was 130 million tons, but it is projected to increase steadily to 139 by 2003. Annual net rice exports from China are projected to decline from 1.35 million tons in 1993 to 0.86 million tons by 2003. 3.6.3 Major rice-importing countries As shown in Table 3.14, we can see that Asia has been not only the most impor-tant rice exporter but also the largest rice importer in the world over the past ten years. Importing countries in Asia accounted for about 50 percent, on average, of total rice import of the world (computed from Table 3.14). Among these Asian countries, Indonesia, Bangladesh and the Philippines have been the most important rice importers in recent years. These three countries have been among the ten leading rice producing and consuming countries of the world. They all have large populations and depend on rice as the major foodstuff. In recent years, by the effect of bad weather, they have become more dependent on the world market to fill the gap between domestic production and consumption. Most of the other countries in Asia imported less than 1 million tons a year.

Chapter 3: Vietnam’s Rice Market
67
Africa is the second largest rice importing region of the world. Every year, Africa accounted for slightly more than 20 percent of the world’s total rice import. It is necessary to note that most of the African rice importers are low in-come countries and thus had to depend on both rice aid and rice imports. There-fore, high demand for rice imports, low income levels and limited foreign ex-change are worth noting if Vietnam is to exploit these markets further. Table 3.14 also indicates that while Asia, Africa and Latin America show up-ward trends for rice imports, Europe and the Oceania are stable importers during the period 1989-1999. Table 3.14 Rice imports by region and principal countries, 1989-1999
(Million tons)
Regions and Countries
1989 1990 1991 1992 1993 1994 1995 1996 1997 1998 1999
ASIA 7.20 4.90 4.40 5.80 6.40 8.10 12.60 9.70 9.20 17.40 12.20
Indonesia 0.40 0.05 0.20 0.60 0.03 0.60 3.20 1.60 1.00 6.00 2.50
Bangladesh 0.30 0.01 0.04 0.03 0.01 0.20 1.30 0.50 - 2.50 1.30
Philippines 0.20 0.60 0.10 0.20 0.50 - 0.30 0.90 0.90 2.20 1.20
Saudi Arabia 0.70 0.60 0.70 0.80 0.90 1.00 1.10 1.00 1.00 0.80 0.80
Japan 0.20 0.10 0.20 0.20 0.20 2.30 0.20 0.50 0.60 0.60 0.70
Malaysia 0.40 0.30 0.40 0.60 0.40 0.30 0.40 0.60 0.60 0.60 0.70
Iran 0.80 0.90 0.70 0.80 1.10 0.50 1.30 1.30 0.90 0.50 0.70
China 1.20 0.06 0.07 0.10 0.10 0.80 2.00 1.10 0.60 0.50 0.90
AFRICA 3.20 2.90 3.30 2.80 3.70 3.40 3.30 3.70 4.30 4.10 4.10
Sub-Sa. Africa 3.10 2.90 3.20 2.70 3.50 3.20 3.20 3.60 4.10 3.90 3.90
North Africa 0.10 - 0.10 0.10 0.20 0.20 0.10 0.10 0.20 0.20 0.20
AMERICAS 1.50 1.60 2.20 2.60 2.70 2.90 3.10 3.20 3.40 4.20 3.50
South America 0.50 0.70 1.10 1.30 1.30 1.40 1.30 1.40 1.40 2.20 1.50
Central America 0.70 0.60 0.80 1.00 1.00 1.10 1.30 1.30 1.40 1.40 1.40
North America 0.30 0.30 0.30 0.30 0.40 0.40 0.50 0.50 0.60 0.60 0.60
EUROPE 1.10 1.00 1.10 1.20 1.20 1.30 1.10 1.00 1.20 1.10 1.10
OCEANIA 0.20 0.20 0.20 0.20 0.30 0.30 0.30 0.30 0.30 0.30 0.30
WORLD 13.9 11.4 12.1 14.1 15.1 16.7 21.0 19.5 18.9 27.5 21.6
Source: F.A.O – Food Outlook Statistics Supplement, 1999.
In the near future, the demand of rice import of some major countries are pro-jected as follows:
The Organization of the Liberalized Rice Market in Vietnam
68
European community: the EC is important both as an importing and an export-ing region. Total production is projected to increase from 1.5 million tons in 1993 to nearly 1.7 million tons by 2003. Total consumption also is projected grow from 1.8 million tons in 1993 to 2.0 million tons by 2003. Net imports are projected to remain in the range of 330 thousand tons to 380 thousand tons per year during the same period. Indonesia is projected to continue its policy of self-sufficiency, and therefore net imports are projected to be minor in future. Iran: total consumption is projected to continue demonstrating strong growth as per capita incomes rise and the population increases. Iran is projected to remain a rice importing country. Projected imports increase from 644 thousand tons in 1993 to slightly over 1.0 million tons by 2003. Saudi Arabia: since Saudi Arabia has virtually no rice production, its rice sup-plies come from imports. Total consumption is projected to increase steadily from 680 thousand tons in 1993 to slightly over 1.0 million tons by 2003. Saudi Arabia is expected to continue importing nearly all of its rice requirement. The Rest of the World is a net importer. Consumption is responsive to the world rice price (Thai FOB), income growth, and taste changes. Total harvested area is projected to remain constant, while yields are projected to grow from 1.94 tons per hectare in 1993 to 2.36 tons per hectare by 2003. Total production is pro-jected to increase from 58.2 million tons to 70.9 million tons during the same period. Total consumption is projected to increase from 67.1 million tons in 1993 to 82.5 million tons by 2003. Hence, the rest of the world is projected to increase its net imports from 9.5 million tons in 1993 to 11.7 million tons by 2003. The above features of rice importers give us a relatively clear picture of the de-mand side of the international rice market. Asia has been the largest rice export-ing and importing region of the world. At the same time, Asia has also been the major source of fluctuations in world rice trade over the past ten years. The large number of importers and the instability of their import need indicate that none of the deficit countries dominate demand in the world market. Besides, increasing rice import means that countries in the world are becoming more and more de-pendent on the international rice market. We conclude that the international market provides opportunities for the Viet-namese exporters. However, the market is volatile and competition is fierce. Vietnam needs to develop a proper export strategy in order to be successful in this market in the long run. We recall that this study focuses on the domestic market. Further studies are needed to develop such a strategy.

Chapter 4. Structure of the Rice Market 4.1 Introduction This chapter presents the different elements of market structure (See Table 2.1). First of all, we give a short description about the process of paddy/rice process-ing and try to describe different types of intermediaries/actors, and introduce the key marketing agents, traders, millers and the SOEs (State Owned Enterprises) involved in the rice marketing system. Secondly, we focus on analyzing the competitive process in the market (by measuring the degree of buyer and seller concentration; the degree of product differentiation: quality and variety; barriers to entry and exit; and extent of market knowledge). In order to obtain the whole picture of the rice market organization, we continue to explore the marketing channel and the spatial network of various marketing agents: from farmers, the paddy/rice distribution channels will be traced up to the final consumers. Some other elements of market structure like the process of price formation, the effects of government interventions/regulations and other informal associations/private trading networks will also be addressed. 4.2 Steps in the paddy to rice process Figure 4.1 describes in detail the process of paddy/rice processing in the Me-kong River Delta. In general, there are seven different steps in the process from paddy to rice. The first step is checking the standard requirement on moisture degree, 23 and the grain length of paddy. Secondly, the paddy is then sorted ac-cording to C1 and C2 standard quality. After sorting, some paddy that contains a high moisture degree will be dried by the dryer or sun-dry. The well-dried paddy then will be stored in the warehouse. The next step is rice processing. The paddy will be put into the processing chains for milling into brown or white rice. In the case of producing rice for export, the brown rice will be polished into polished rice before weighing and packaging. Finally, the finished products will be stored in the warehouse till it will be sold on the market.
23 Usually the moisture degree should be 170 – 180: that was measured by humidity level
(Source: from Mekofood Cantho, 2000).

The Organization of the Liberalized Rice Market in Vietnam
70
Source: Own survey in the Mekong River Delta, 1999 – 2000
Figure 4.1 Steps in the paddy to rice process 4.3 Intermediaries involved in the rice marketing system There are three groups of participants in rice marketing in the Mekong River Delta, namely: 1) Merchants; 2) Commission agents/brokers; and 3) Facilitators (See Section 2.1.6 in Chapter 2). Merchants, such as rice assemblers, wholesal-ers, millers/polisher, retailers, and middleman/brokers are the main actors in the market. In general, more than 7 million tons of paddy from the Mekong River Delta were marketed every year, passing through the hands of assemblers, mill-ers, wholesalers, transporters, and retailers. At least 2 million tons were trans-ferred to deficit regions within Vietnam, and more than 3.5 million tons were exported. 24
A study has been made of these actors in five major market places in the Mekong River Delta (Tiengiang, Angiang, Vinhlong, Cantho, and Soctrang). In fact 53 rice millers/polishers, 18 assemblers, 49 wholesalers, and 30 retailers were interviewed in this area.
These data were gathered by students of the School of Economics and Business Administration (SEBA) – The University of Cantho (CTU), under the project collaboration between MHO2 and SEBA from April 1999 to September 2000. 4.3.1 Merchants Assemblers Normally, there are two types of assemblers such as local assemblers and as-sembler-wholesalers.
24 Report from Ministry of Agriculture and Rural Development of Vietnam - Dec, 1999
Checking Sorting Drying Storing Milling
Polishing Packaging Storing Selling
P ADD Y
Export
(Brown rice)
(White rice)
(Polished rice) (Polished rice)
Domestic market
(White rice)

Chapter 4: Structure of the Rice Market
71
• Local assemblers They are usually local people, who have an in-depth knowledge of cropping pat-terns, quality of different rice varieties and the production traditions of local farmers. The assemblers may be farmers located in the village. Normally, they have a small boat (valued from 2 million to 5 million VND) used for transporta-tion and a small working capital (around 1 – 2 million VND) at their disposal. They purchase paddy from farmers and transport it to millers, SOEs or sell it at local trading places (less than 30 km distance). 25 • Assemblers-wholesalers They are middlemen, which are usually located near the good market places (for example, along the road, or near the river/canal where they easily can load and unload their products). The assembler-wholesalers usually own a medium or big boat/truck (around 5 – 15 tons for boats, and 8 –12 tons for trucks), but they do not own stalls in the market. They buy the paddy and ship large amounts to the rice millers. Sometimes, they ask millers for milling their paddy which they later sell to wholesalers or private agencies, usually in larger volumes as compared to the local assemblers. 26 Private wholesalers These private traders own stalls or warehouses that are usually located along the canal, river, and main road or near rice millers. They perform the wholesale functions. They usually have a long experience with paddy/rice trading, strong relationships with other traders and good knowledge on rice quality and market prices. They buy a large amount of brown rice or milled rice from private rice millers and polishers and directly sell to SOEs or ship large amounts of milled rice to other provinces (deficit rice regions) through so-called long-distance buy-ing-selling. 27 Private rice millers and or polishers They are middlemen who are usually located near the town or market centers, purchasing paddy from farmers, assemblers, or wholesalers and are engaged in 25 That is why we call them “local assemblers” 26 The monthly turnover of assemblers-wholesaler were 25.6 million VND as compared with 15 million VND in the case of local assemblers (See Appendix 4.1). 27 On average, they buy and sell from 1,500 to 3,000 tons per year (this figure was computed from the data of our survey 2000).

The Organization of the Liberalized Rice Market in Vietnam
72
milling/polishing activities and delivering milled rice to other polishers, whole-salers or SOEs, and retailers in the market centers. Sometimes they do not pur-chase the product, but just mill paddy or polish the brown rice (in terms of pro-viding processing services to traders) and they receive the payment as process-ing costs from rice traders. According to the survey of this study, there were three types of millers/polishers: large, medium, and small scale. Small-scale millers/polishers having a small processing capacity; about 5 - 20 ton per day. Large-scale millers/polishers, on the other hand, can process over 20 ton per day. In this study we give most attention to medium and large-scale private mill-ers/polishers, since their business has a strong influence on the domestic rice market, particularly in the Mekong River Delta. Private retailers They are sellers at the retail market. Private retailers are usually local people, who have an in-depth knowledge of consumer demand (quality of rice, which places and at which price consumers usually to buy…).
In this study, private rice retailers were classified into two groups: small and large-scale retailers. 28 Most of the surveyed retailers were small (88 percent of the total), and only 12 percent were large-scale retailers. They usually buy white rice from wholesalers or private millers, who were located near their own places (less than 15 km, with free delivery cost). State Owned Enterprises (SOEs)/rice export companies State Owned Enterprises/Companies engaged in the rice marketing system are mainly the Food Companies, which exist at the provincial level. In this study area, there were five SOEs: MEKOFOOD Cantho, TIGIFOOD, ANGIFOOD, Vinhlong Food Stuff Company, and Soctrang Food Trading Company. They are the big rice traders that purchase paddy and rice from farmers, wholesalers, miller-wholesalers, private wholesalers or agencies and perform storage, and ini-tial processing and later sell out of the province for domestic consumption and/or exports.
The SOEs usually include several divisions/sections such as procurement store, rice milling/polishing, retailing and exporting. Normally, they perform different activities such as procurement, milling, polishing, selling, etc. Particu-larly, in every province of the Mekong River Delta, there are at least one or two
28 Based on total value of asset and working capital invested in their business:
+ Small scale: < 25 Millions VND; + Large scale: > 25 Million VND

Chapter 4: Structure of the Rice Market
73
state-owned food trading companies that are under control of the provincial government. After the market reform (1986), the SOEs became more independ-ent in their trading. They now use their own capital and assets to do business. The last decade the SOEs did not receive direct subsidies from the government. 29
Despite the liberalization policy, the SOEs still control the channels of rice exports. 30 According to the report of the Vietnamese Food Association (VFA), in 2000 there were a total of 47 companies, which have a license to ex-port rice: of which there are 39 SOEs and only 8 private enterprises. The domes-tic market is dominated by private rice traders. The SOEs cover around 25 per-cent - 30 percent of the domestic market. 31 They transfer rice from surplus to deficit regions in Vietnam (long distance trade in the framework of the policy of national food security) and they also have a retail function. • Procurement stores Their business mostly depends on the SOEs: they receive working capital from the SOEs and prices are set by the SOEs. They own their stalls, normally used for buying and storage of paddy for a short time at a rural area. They have their own transportation facilities or hire private boats from outside to transfer paddy to the rice mills of SOEs. The SOEs have to bear all expenses of the procure-ment stores. Their business is to contact farmers or local assemblers; negotiate the price of paddy or the payment condition; sign a contract for hiring private boats; and monitor the process of transport paddy to their companies. During the main har-vest season, their businesses are easier than in the off-season, because there are a lot of suppliers selling paddy. The procurement store is an important actor in the Government channel distribution, since they provide most of the raw material – paddy for SOEs in the marketing chains.
• Miller/polisher of the SOEs They are rice-processing factories to produce brown rice, milled rice or just pol-ish the brown rice. They carry out the processing, they are not involved in buy-ing and selling rice. In general, every SOE has three or four rice processing fac-
29 However, during the main harvest season, the SOEs can receive financial support from the government in terms of borrowing money at a low interest rate from the State Banks in order to buy paddy for reservation and to keep a floor price of paddy in the market (See also Section 4.7.2 for further explanation). 30 See also Section 4.5.2 of this chapter for further explanation. 31 Report from VINAFOOD No. 1, 1999

The Organization of the Liberalized Rice Market in Vietnam
74
tories located at major rice areas in the province. MEKOFOOD Cantho has six rice-processing factories, with 10 milling machines and 24 polishing machines that can produce totally more than 85 tons milled rice per hour. Vinhlong Food Stuff Company has five factories including 20 milling and polishing machines, and the total processing capacity is more than 60 tons/hour. Soctrang Food Trad-ing Company has three processing factories with 17 rice processing machines that can produce on average 50 tons milled rice per hour. Tiengiang Food Com-pany has two processing factories, of which there are 15 polishing machines and 2 milling machines that can produce more than 50 tons milled rice per hour. 32 In general, each SOE of every province in The Mekong River Delta can produce 150,000 to 200,000 tons of milled rice per year. More than 65 percent of this volume are used for export.
• Retail selling units of the SOEs As mentioned in the previous section, most of the SOEs don’t act as retailers. However, recently, in order to diversify rice trading, some of the SOEs started to have a retail function. State owned retailers may have a medium sized store in the market. They sell various types of milled rice of their company, but usually are “second grade rice” that can not reach the quality for export. Their main consumers are medium and low-income households. In this study, there were three out of five SOEs that have acted as a retailer (the case of Cantho, Soctrang, and Tiengiang food company). 4.3.2 Brokers Some private rice traders in this study operate as brokers/commission agents. Since they just get commission for their selling activities. In Vietnamese, we usually call them “Chu Vua”. The brokers do not own the products, they just have a favorable place, good knowledge/experience, reputation, and many con-nections with other rice traders. They act as an intermediary offering some trad-ing services such as negotiation, bargaining, and other facilities to traders. 33
32 See Appendix 4.2 for further explanation 33 Weighting scale, package, loading and unloading service, machine that used for measuring the moisture degree, broken level of rice, and even providing transportation services.

Chapter 4: Structure of the Rice Market
75
4.3.3 State farms
In this study we also distinguish the “Agricultural State Farm”. In the Mekong River Delta, there are two Agricultural State Farms: SOHAFARM and CODOFARM in which SOHAFARM is the biggest and a famous one in Viet-nam. 34 In SOHAFARM there are 5,600 ha used for producing paddy and total paddy production is around 60,000 tons/year. According to the Vietnamese Food Association, in 1999, SOHAFARM has contributed more than 200,000 tons of rice for export occupying more than 8 percent of total amount of rice export of the Mekong River Delta. CODOFARM produced more than 50,000 tons of paddy per year, and provided more than 85,000 tons of rice for domestic and foreign markets.
In general, State Farms manage and control their own business from pro-ducing paddy to milling and marketing their finished products. After the market reform (1986) they have not received any subsidies from the government. Usu-ally, they have their own channel of distribution to transfer the product to con-sumers or directly export it to foreign markets. They are also active as middle-man or rice trader in the domestic market. They also buy paddy from farmers outside the farm, purchase brown rice for polishing to white rice used for export and own wholesale/agency for selling their product in the domestic market. 4.3.4 Facilitators There are several types of facilitators operating in the rice market. They provide different services that are necessary to rice traders. Usually, they are groups of private transporters to provide transport facilities (mostly transport by boat and truck). They may be operating as warehousing firms to provide good storage services to traders. Nowadays, both warehousing firms and transportation firms are considered as the most important facilitators in the market. Other facilitators are involved in function like: money suppliers, banks, quality control service, tax office, and other agents for market regulation. 4.4 Competition in the Mekong Delta rice market As mentioned in previous chapters, to examine the structure of the market and analyze the competitive process in the market, we mainly use four criteria: (1) entry barriers, (2) buyer and seller concentration, (3) assortment of product qual-ity, and (4) distribution of market information.
34 See Web-site: http://vietnamopenmarket.com/member/Foodstuff/Sohafarm.htm.
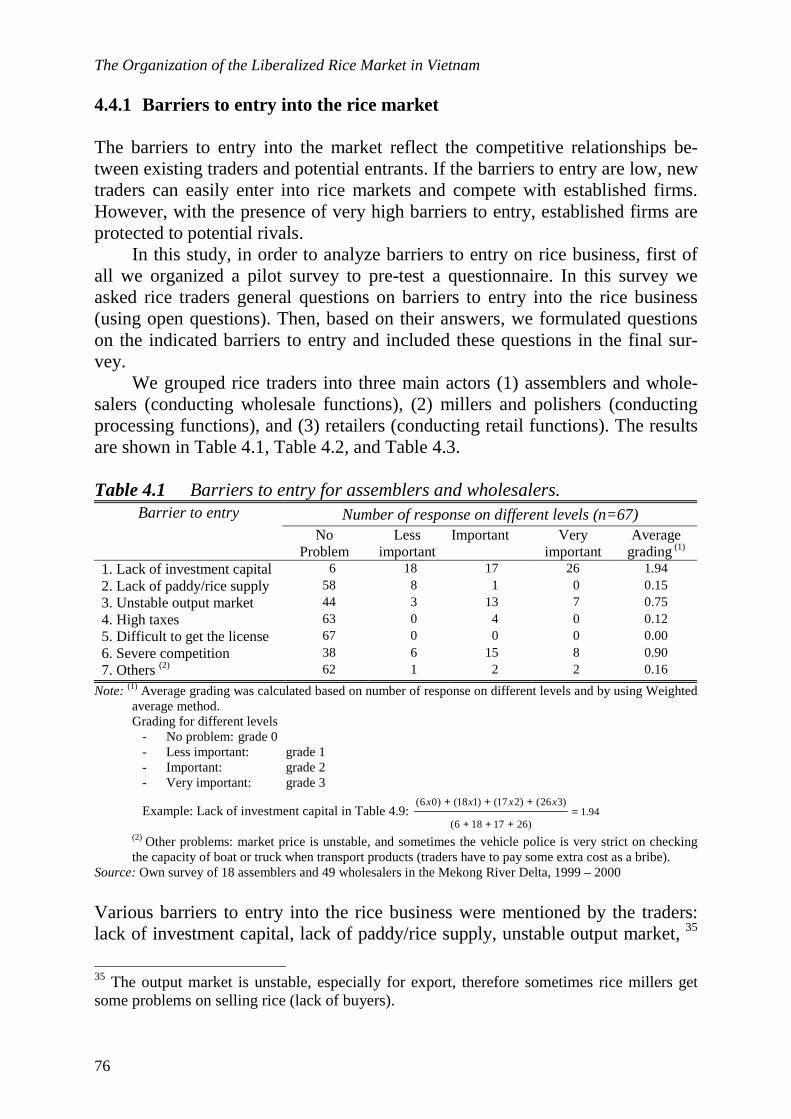
The Organization of the Liberalized Rice Market in Vietnam
76
4.4.1 Barriers to entry into the rice market The barriers to entry into the market reflect the competitive relationships be-tween existing traders and potential entrants. If the barriers to entry are low, new traders can easily enter into rice markets and compete with established firms. However, with the presence of very high barriers to entry, established firms are protected to potential rivals.
In this study, in order to analyze barriers to entry on rice business, first of all we organized a pilot survey to pre-test a questionnaire. In this survey we asked rice traders general questions on barriers to entry into the rice business (using open questions). Then, based on their answers, we formulated questions on the indicated barriers to entry and included these questions in the final sur-vey.
We grouped rice traders into three main actors (1) assemblers and whole-salers (conducting wholesale functions), (2) millers and polishers (conducting processing functions), and (3) retailers (conducting retail functions). The results are shown in Table 4.1, Table 4.2, and Table 4.3.
Table 4.1 Barriers to entry for assemblers and wholesalers.
Number of response on different levels (n=67) Barrier to entry No
Problem Less
important Important Very
important Average
grading (1)
1. Lack of investment capital 6 18 17 26 1.94 2. Lack of paddy/rice supply 58 8 1 0 0.15 3. Unstable output market 44 3 13 7 0.75 4. High taxes 63 0 4 0 0.12 5. Difficult to get the license 67 0 0 0 0.00 6. Severe competition 38 6 15 8 0.90 7. Others (2) 62 1 2 2 0.16
Note: (1) Average grading was calculated based on number of response on different levels and by using Weighted average method. Grading for different levels
- No problem: grade 0 - Less important: grade 1 - Important: grade 2 - Very important: grade 3
Example: Lack of investment capital in Table 4.9: 94.1)2617186(
)326()217()118()06(=
+++
+++ xxxx
(2) Other problems: market price is unstable, and sometimes the vehicle police is very strict on checking the capacity of boat or truck when transport products (traders have to pay some extra cost as a bribe).
Source: Own survey of 18 assemblers and 49 wholesalers in the Mekong River Delta, 1999 – 2000 Various barriers to entry into the rice business were mentioned by the traders: lack of investment capital, lack of paddy/rice supply, unstable output market, 35
35 The output market is unstable, especially for export, therefore sometimes rice millers get some problems on selling rice (lack of buyers).

Chapter 4: Structure of the Rice Market
77
high taxes, difficult to get the business license, and severe competition. For as-semblers and wholesalers, the most important barrier to entry was lack of in-vestment capital (average grading is 1.94 - See Table 4.1), they seemly had less problems with taxes and the business license. Some rice assemblers and whole-salers have mentioned certain barriers such as high competition and unstable demand of the output market. We conclude that according to the perception of assemblers and wholesalers entry into the rice business is not blocked by strong barriers, other than the lack of access to capital. Table 4.2 Barriers to entry for rice millers and polishers.
Number of response on different levels (n=53) Barrier to entry No
problem Less
important Important Very
important Average grading(1)
1. Lack of investment capital 16 12 16 9 1.34 2. Problem on milling technology 26 3 9 15 1.25 3. Lack of paddy/rice supply 48 1 3 1 0.19 4. Unstable output market 29 4 8 12 1.06 5. High taxes 42 5 4 2 0.36 6. Difficult to get license 52 0 1 0 0.04 7. Severe competition 21 2 13 17 1.49 8. Others (2) 50 0 1 2 0.15
Note: (1) Average grading was calculated in the same way as in Table 4.1. (2) Other problems: market price is unstable, some problems on auditing from Financial De-partment, and quality control from VINACONTROL.
Source: Own survey of 53 rice millers and polishers in the Mekong River Delta, 1999 – 2000 Table 4.2 shows that, lack of capital is a major constraint for rice millers (aver-age grading is 1.34). The unstable output market and high competition are also perceived as important barriers for rice millers (average grading of competition is very high, 1.49). Most of the large rice millers/polishers state that when start-ing the rice business, the problem of access to proper processing technology is important. Experience with milling technology and high quality processing ma-chines are important instruments to create competitive advantage. Only if the milling technology is good, rice millers/polishers can compete in terms of offer-ing high prices when buying and low prices when selling their product. The rice millers face some obstacles on their output market. The SOEs and/or rice export companies are dependent on the international market. During the harvest season, a lot of paddy with high quality is available for milling, but the demand of rice for export is usually low.
Due to the market liberalization in Vietnam, the private rice millers face no difficulties when they apply for their business license. Tax laws, 36 are not considered to be important.
Table 4.2 also indicates that most of the rice millers/polishers have no difficulty in buying paddy/rice from assemblers and wholesalers (average grading is low, 0.19). This result is consistent with the analysis of barriers to 36 Applying value added tax (VAT) since 1999.

The Organization of the Liberalized Rice Market in Vietnam
78
is low, 0.19). This result is consistent with the analysis of barriers to entry for rice assemblers and wholesalers in the previous section and indicates that there are many rice assemblers and wholesalers operating in the assembling market.
On the whole, as compared to assemblers and wholesalers, rice mill-ers/polishers complain more often about severe competition and access to proper technology. Lack of access to capital is the major problem that constrains their business.
Table 4.3 Barriers to entry for rice retailers in the Mekong River Delta, 2000.
Number of response on different levels (n=30) Barrier to entry No
problem Less
important Important Very
important Average
grading (1)
1. Lack of investment capital 12 4 7 7 1.30
2. Lack of paddy/rice supply 29 1 0 0 0.03
3. Unstable output market 18 1 7 4 0.90
4. High taxes 21 1 6 2 0.63
5. Difficult to get license 30 0 0 0 0.00
6. Severe competition 9 2 7 12 1.73
7. Others (2) 29 0 1 0 0.07
Note: (1) Average grading was calculated in the same way as in Table 4.1. (2) Other problem: market price is usually unstable.
Source: Own survey of 30 rice retailers in the Mekong River Delta, 1999 – 2000.
Finally, as shown in Table 4.3, competition is fierce among rice retailers. New rice retail-shops find it difficult to compete with existing retail-shops (av-erage grading reach to 1.73). Advantages concerning competition that rice re-tailers often make use are: offering good rice quality; setting low price; main-taining good relationships with consumers; and good location of retail shop.
Rice retailers also face the problem of limited access to investment capi-tal. Like assemblers, wholesalers, and millers, the rice retailers face no difficul-ties in tax payment and applying for their business license.
In summary, after market liberalization, competition among rice traders seems to be fierce as many of them indicate that it is difficult to beat existing competitors. This implies that it will be impossible for established rice traders to raise their prices above the normal market level. Competition is perceived as a problem by individual traders, however, for economists this complaint can be taken as an indicator for market functioning. The most important barrier to entry concerns access to capital, an unstable output market and proper milling tech-nology. The first factor limits the scale and scope of the enterprises and indicates that access to credit should be improved. The second factor has to do with vola-tile demand conditions in the export market, while the third problem is related to technological development. However, we also conclude that the major problems perceived by traders would not be considered as entry barriers by Bain, Stigler or von Weizsacker (See Section 2.2.3). None of the perceived problems implies

Chapter 4: Structure of the Rice Market
79
that established sellers can raise their prices above a competitive level without attracting new firms. This indicates that the market is competitive and contest-able.
4.4.2 Degree of buyer and seller concentration The degree of buyer and seller concentration refers to the number of rice traders in the rice market. This concentration ratio can be interpreted as an indicator for the degree of competitiveness among rice traders. As discussed in Chapter 2, the Lorenz curve and the GINI ratio were used to measure the degree of buyer and seller concentration (See also Appendix 4.3). In order to compute the GINI ratio, the volume of paddy/rice sold by farmers and bought/sold by traders is ranked from highest to lowest, while their respective market shares will be computed by getting the percentage of the total sales/purchases handled by each trader group.
In this section we use the sample data for analyzing buyer and seller con-centration (See Appendix 4.4 and 4.5). The sample size of rice millers/polishers in this study is around 10 percent of the total population, and in the case of rice assemblers and wholesalers the sample size is around 2 percent.37 As the traders were selected at random we expect that the sample is representative for the trader population. Therefore, we are able to generalize the results for the popula-tion of assemblers/wholesalers and millers/polishers. We did not calculate this figure for retailers as the region of their economic market is expected to be much smaller than the Mekong River Delta. The economic market for wholesalers and millers concerns a larger area and is expected to correspond to the whole Me-kong River Delta. As consumers travel only limited distances to buy their rice this assumption is invalid for retailers.
Appendix 4.4, and Appendix 4.5 describe in detail the GINI ratio (Gr) for rice assemblers/wholesalers and millers/polishers. The results are summarized in Table 4.4. The figures in this table indicate that the GINI ratio is highest for rice assemblers and wholesalers: GrA = 0.7249. The GINI ratio for rice mill-ers/polishers is GrM = 0.6244. These results indicate that the market shares among millers/polishers and assembler/wholesalers differ. The question is whether this hampers the functioning of the market. With regard to assemblers and wholesalers we know that they carry out different tasks in the market and that the optimum scale of operation will differ among these traders as local as-sembly implies a smaller business scale than regional assembly. The same ap- 37 According to Vietnam Economy Times (5/5/2000), in the 1999 annual conference was hold by 12 Industrial Departments of each province in the Mekong Delta, in the whole region we have totally 7,454 rice processing factories: of which 626 state owned enterprises. In Thotnot market place (Cantho province) there were 90 rice millers and 41 rice polishers. In Caibe market place (Tien giang province) there were 220 private rice processing factories (Thotnot and Caibe market place are considered as the most biggest rice market in MKD). On average, in every province of MKD we have around 100 pri-vate rice millers/polishers. Total population of rice millers/polishers in 5 major market places in this study is around 650. There are around 3,500 assemblers/wholesalers.

The Organization of the Liberalized Rice Market in Vietnam
80
plies to the scale of operation for polishers and millers. In particular polishers have to deal with large quantities as most of their product is exported. Table 4.4 GINI ratio for the market share of surveyed traders
Type of trader Concentration ratio (GINI)
Assembler and wholesaler 0.7249
Miller and polisher 0.6244
Source: The figures in this table were computed from Appendix 4.4, and 4.5
The crucial question is whether some wholesalers or millers/polishers are able to dominate the market. In order to shed some light on this it is useful to calculate the “four-firm” concentration ratio (CR4). This is the market share of the top four traders in the market. As show in Table 4.5, the CR4 of rice mill-ers/polishers is lower than the CR4 of assembler/wholesaler (35.40 < 63.88). However, before proper conclusions can be drawn a correction has to be made for the fact that only a sample of traders is taken into account. As mentioned in the previous section, the sample size of rice millers in this study is around 10 percent of the total population, and in the case of rice assemblers/wholesalers this is around 2 percent. Therefore, in the case of millers/polishers, the estima-tion of the sample CR4 may be used as an indicator for the population CR40 and, in the case of assemblers/wholesalers the sample CR4 concerns the population CR200. Accordingly, Table 4.5 can be interpreted as follows: the 40 biggest rice millers are estimated to handle a 35 percent market share (the 4 largest rice mill-ers have a 3.5 percent market share). Similarly, in the case of rice wholesalers we can generalize that the 200 biggest wholesalers control 60 percent of the market (or the 4 largest wholesalers are estimated to control only 1.27 percent of the market).
These results are in line with the conclusions about competitive forces in the market in the last Section. Therefore we conclude that in general, rice traders in the Mekong River Delta operate in a competitive market. Their market shares are low and the degree of competition is high. Table 4.5 Four-firm concentration ratio of different rice traders in the sample
Cumulative percentage (%) Level Miller/polisher Assembler/wholesaler
Largest 11.42 24.87 Largest 4 35.40 63.88 Largest 8 56.71 72.32 Largest 12 70.03 76.56 Estimation of CR4 for the population 3.54 1.27
Note: As mentioned above, the estimation of CR4 for the population in the case of rice miller/polisher is CR40 and in the case of assembler/wholesaler is CR200. Based on that mean-ing, we can compute the estimation of CR4 for the population.
Source: The figures in this table were computed from Appendix 4.4, and 4.5.
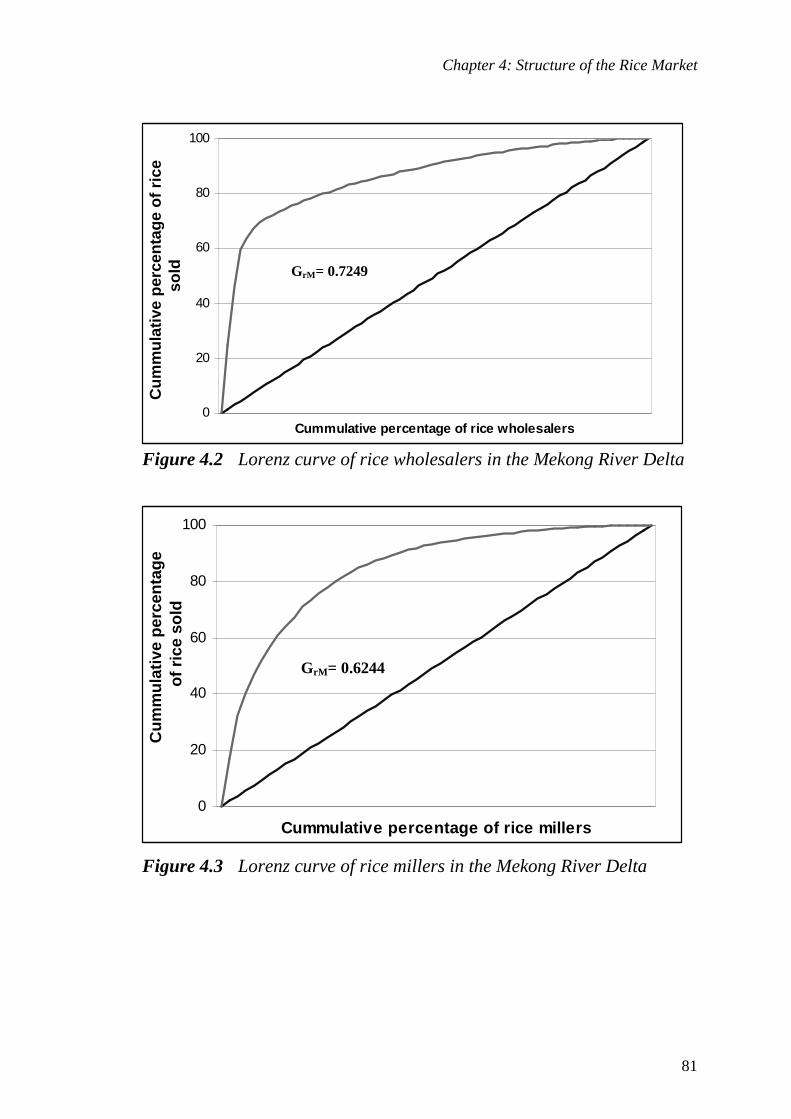
Chapter 4: Structure of the Rice Market
81
Figure 4.2 Lorenz curve of rice wholesalers in the Mekong River Delta
Figure 4.3 Lorenz curve of rice millers in the Mekong River Delta
GrA= 0.7249
0
20
40
60
80
100
Cummulative percentage of rice wholesalers
Cu
mm
ula
tive
per
cen
tag
e o
f ri
ce
sold
0
20
40
60
80
100
Cummulative percentage of rice millers
Cu
mm
ula
tive
per
cen
tag
e o
f ri
ce s
old
GrM= 0.6244
GrM= 0.7249

The Organization of the Liberalized Rice Market in Vietnam
82
4.4.3 The assortment of paddy/rice qualities The assortment of paddy/rice qualities measures the extent to which buyers dis-tinguish or differentiate their specific preferences among competing types of rice. In the case of rice, factors such as rice quality/variety, degree of broken rice, color, humidity, form of packaging, and seller marketing promotion strate-gies are used to determine the degree of rice differentiation. In this study the de-gree of rice differentiation in the market was examined both at the farmers’ and rice traders’ level. • Standard for differentiating rice qualities According to IRRI, nowadays, there are over 6,000 varieties of rice, most of them can be classified into two types. Indica rice is grown in tropical areas such as south and Southeast Asia and Southern China. Japonica is grown in temper-ate regions such as Korea, Japan, Europe, the United States, and Australia.
In general, there is a broad range of rice qualities available in the market place in the Mekong River Delta, Vietnam. The difference in the qualities are based on the rice variety, the way of milling the rice influences to what extent the grains are broken (broken level), the period the rice has been in storage, and the purity of the rice. 38
The surveyed farmers cultivated more than 10 types of different varieties (See also Chapter 3). They usually classify the paddy in two qualities: (1) “Lua dai” – long grain paddy, and (2) “Lua tron” – medium/short paddy. Based on those criteria of paddy sold, most of rice traders often classify paddy quality into C1 (long grain) and C2 (medium/short grain) type of paddy, respectively the higher and lower quality.
Depending on the type of market demand (foreign and domestic rice mar-ket), millers can mill paddy into different rice qualities (broken levels). The type of milling leads to a different rice quality and to a different percentage of loss, which is reflected in the price. Especially domestic consumers consider older paddy, coming out of storage, to have a higher quality than the paddy coming fresh from the field, because old rice is able to absorb more water when cooked. At different periods during the season different qualities of rice are found.
38 The indicators such as percentage of yellow and damaged kernel in Table 4.6 reflects the length of time that paddy/rice has been in storage. In general, if storing paddy/rice more than 2 or 3 months, the percentage of yellow and damaged kernel will increase.

Chapter 4: Structure of the Rice Market
83
Table 4.6 The standard for classifying rice quality in Vietnam Length level (%) Grain standard Rice class
(Broken level)
Long >7mm
Short < 6 mm
Broken rice length (mm)
Entire rice grain
(%)
Broken rice (%)
Small broken
(%)
Degree of impurity
(%)
Degree of yellow kernel
(%)
Degree of damage kernel
(%) I. Long-rice + 0–2% ≥10 ≤10 0.50 – 0.80 ≥60 ≤4.5 ≤0.1 ≤0.05 ≤0.20 ≤0.50 + 5% ≥5 ≤15 0.35 – 0.75 ≥60 5±2 ≤0.2 ≤0.10 ≤0.50 ≤0.75 + 10% ≥5 ≤15 0.35 – 0.70 ≥55 10±2 ≤0.3 ≤0.20 ≤0.75 ≤1.00 + 15% <30 0.35 – 0.65 ≥50 15±2 ≤0.5 ≤0.20 ≤1.00 ≤1.25 + 20% <50 0.25 – 0.60 ≥45 20±2 ≤1.0 ≤0.30 ≤1.00 ≤1.50 + 25% <50 0.20 – 0.50 ≥40 25±2 ≤2.0 ≤0.50 ≤1.00 ≤2.00 + 30% <50 0.20 – 0.50 ≥32 30±2 ≤2.0 ≤0.50 ≤1.50 ≤2.00 + > 30% <50 0.20 – 0.50 ≥28 35±2 ≤3.0 ≤0.50 ≤1.50 ≤2.50
II. Short-rice + 5% 0.35 – 0.75 >60 5±2 ≤0.2 ≤0.10 ≤0.50 ≤0.75 + 10% >75 0.35 – 0.70 55 10±2 ≤0.3 ≤0.20 ≤0.75 ≤1.00 + 15% 0.35 – 0.65 50 15±2 ≤0.5 ≤0.20 ≤1.00 ≤1.25 + 20% >70 0.25 – 0.60 45 20±2 ≤1.0 ≤0.30 ≤1.00 ≤1.50 + 25% 0.25 – 0.50 40 25±2 ≤2.0 ≤0.50 ≤1.00 ≤2.00 + 30% 0.25 – 0.50 32 30±2 ≤2.0 ≤0.50 ≤1.50 ≤2.00 + > 30% 0.25 – 0.50 28 35±2 ≤3.0 ≤0.50 ≤1.50 ≤2.50
Source: Standard of rice quality of Vietnam, VINACONTROL - TCVN 1998 In general, the quality of rice selling in the market can be differentiated based on three major criteria: length of rice grain, broken rice level and different kinds of varieties. Of which, the percentage of broken rice is a main indicator. The gen-eral standard for classifying rice quality by broken level is presented in Table 4.6 above. There are different levels: 5 percent, 10 percent, 15 percent, 20 per-cent, 25 percent, 30 percent and over 30 percent broken rice. Technically, the people from VINACONTROL pay attention to the entire grain: the degree of yellow kernel and damage kernel. However, this quality standard is not opera-tional in practice, because it is too complicated. In practice, rice traders in Viet-nam just use a simple standard to breakdown rice quality into “ordinary rice” (C2), and “luxury rice” (C1). 39 “Ordinary rice” is low/medium quality rice, 20 percent to 25 percent broken rice. “Luxury rice” is high quality rice, 5 percent to 10 percent broken rice. 40
39 This standard of classification is applied in the whole country when buying and selling paddy/rice on the domestic market (Most of national and provincial TV or radio stations in Vietnam usually announce the information on paddy/rice price based on C1 and C2 quality). 40 For export, there are two main rice qualities: 5 percent and 25 percent broken rice.

The Organization of the Liberalized Rice Market in Vietnam
84
• Types of paddy/rice sold at the farm gate and different market places in the Mekong Delta As mentioned in the previous section, there are two groups of paddy/rice in the market, namely “luxury rice” (C1), and “ordinary rice” (C2). The survey data of this study indicate that more C1 paddy was marketed more than C2 (See Table 4.7 below). Nowadays, in order to fulfil export requirements and to supply good quality rice for domestic consumption, most rice farmers in the Mekong River Delta try to grow good varieties. Specially, in Angiang and Cantho province, farmers have a favorable environment for producing C1 paddy. There about 60 percent long grain paddy and 40 percent short/medium grain paddy was sold at farm gate (See Table 4.7).
In contrast, at the retail market the situation is completely the opposite. Because of the low income of most domestic consumers, C2 rice was marketed much more than C1 rice (See Table 4.8). Long grain rice is luxury rice mainly produced for export markets. Medium and short grain rice is sold to the domes-tic market to provision the low income consumers.
Table 4.7 Types of paddy sold by farmers in the market Provinces Percentage of
Long grain paddy (C1) Percentage of medium/short grain
padddy (C2)
1. Tiengiang 54.3 45.7
2. Angiang 62.9 37.1
3. Vinhlong 58.5 41.5
4. Cantho 60.9 39.1
5. Soctrang 56.7 43.3
Whole surveyed areas 60.8 39.2
Note: The figures in this table were computed based on the volume of different types of paddy sold in the market by the surveyed farmers located in different surveyed provinces.
Source: Own survey of 62 farmers in the Mekong River Delta, 1999 – 2000
Table 4.8 Types of rice sold in the retail market Market places Percentage of
long grain rice (C1) Percentage of medium/short grain
rice (C2)
1. Tiengiang 43.5 56.5
2. Angiang 48.2 51.8
3. Vinhlong 38.4 61.6
4. Cantho 46.8 53.2
5. Soctrang 36.7 63.3
Whole surveyed areas 43.7 56.3
Note: The figures in this table were computed based on the volume of different types of rice sold in the market by the surveyed retailers located in different surveyed provinces.
Source: Own survey of 30 retailers in the Mekong River Delta, 1999 – 2000

Chapter 4: Structure of the Rice Market
85
• Rice sale promotion activities Very few rice traders have a strategy for sales promotion. Of the total 67 re-spondents, there are only 12 traders who gave an answer on the question about sales promotion. In general, they just offer a favorable quality with a fair price; weigh exactly; deliver in time, and discount for buying large volume (more than 50 kg: 2 percent discount in the case of retail). Some experienced traders re-vealed that they usually try to keep a close relationship with the consumers; al-ways give hospitality to them when negotiating. In the case of wholesalers, providing credit is a very important instrument for sales promotion. Normally, wholesalers will get the money back after one or two weeks. The relationship is based on trust and reputation. On the whole, the sales promotion activity of rice traders in the Mekong River Delta is very modest. No one has a separate promotion strategy for his or her own business. They just of-fer good conditions when they negotiate with consumers and try to maintain a close relationship with them. The results of the analysis in this section show that the rice sold in the domestic market is quite homogeneous. Product differentiation is limited as most con-sumers are not willing to pay the price premium for long grain rice. Sales pro-motion and packaging are also of minor importance in the selling strategy of traders. Therefore we conclude that product differentiation is not expected to be a barrier for competition. 4.4.4 Distribution of market information The distribution of market information refers to the availability of relevant mar-ket information to farmers, rice traders, and millers. Table 4.9 indicates that around 80 percent of rice millers, assemblers, retailers, and farmers find it very easy to obtain market information. Very few traders complain about the source of information: only less than 2 percent of the interviewed traders found it very difficult to get information. Those results reveal that a lack of access to market information is not a barrier to enter the market, since most of the information re-lated to rice trading such as qualities, form of packaging, buying-selling prices, consumer behavior, regulation, etc…are easy to obtain.

The Organization of the Liberalized Rice Market in Vietnam
86
Table 4.9 Access to market information
Percentage of response to different levels (%) Rice traders Easy
to obtain Sometimes
difficult Very
difficult 1. Farmer (n=62) 88.70 9.67 1.63 2. Assembler/wholesaler (n=67) 79.10 19.40 1.50 3. Miller/polisher (n=53) 81.10 17.00 1.90 4. Retailer (n=30) 80.00 20.00 0.00
Source: Own survey among rice producers and traders in the Mekong River Delta, 1999 – 2000 Table 4.10 Sources of market information
Percentage of response to different sources (%) Source of information
Farmer Assembler Wholesaler
Miller Polisher
Retailer
1. News paper, radio and TV 29.0 7.8 24.3 4.0 2. Information from SOEs 2.6 25.5 32.7 20.8 3. From private traders or inter-
mediaries of the channel 20.5
54.0
30.3
58.4
4. From relatives, friends 43.5 4.0 9.2 10.4 5. Others (*) 4.4 8.7 3.5 6.4
Total 100.0 100.0 100.0 100.0
Note: Rice assemblers, wholesalers, and millers/polishers can obtain other sources of information from telephone and internet.
Source: Own survey in the Mekong River Delta, 1999 – 2000.
Sources of market information are described in Table 4.10. Most of the farmers obtained market information from their neighbors and relatives (43.5 percent); some of them read newspapers, listen to the radio and/or receive information from middlemen. In case of assemblers, they obtained market information mainly through other traders in the channel of distribution (54 percent). Some-time, they collect the news from the SOEs. Rice retailers and assem-blers/wholesalers also obtain the information mostly from the middlemen and the SOEs. Particularly, rice millers/polishers had a strong relationship with the SOEs (32.7 percent). Other sources are the telephone and the internet. Internet is quite popular among the SOEs as well as big private rice millers/polishers. Some Web-sites provide information about the rice market day by day. Rice traders can obtain the information on export prices of rice, domestic prices at different major market places, business activities of the SOEs and/or the Viet-namese Food Association, new government policies on rice production and ex-port, etc. On the whole, both state owned and private rice traders appreciate the internet. Some expressed their wish to develop it is order to link them with for-eign customers/companies. However, a negative consequence of the many
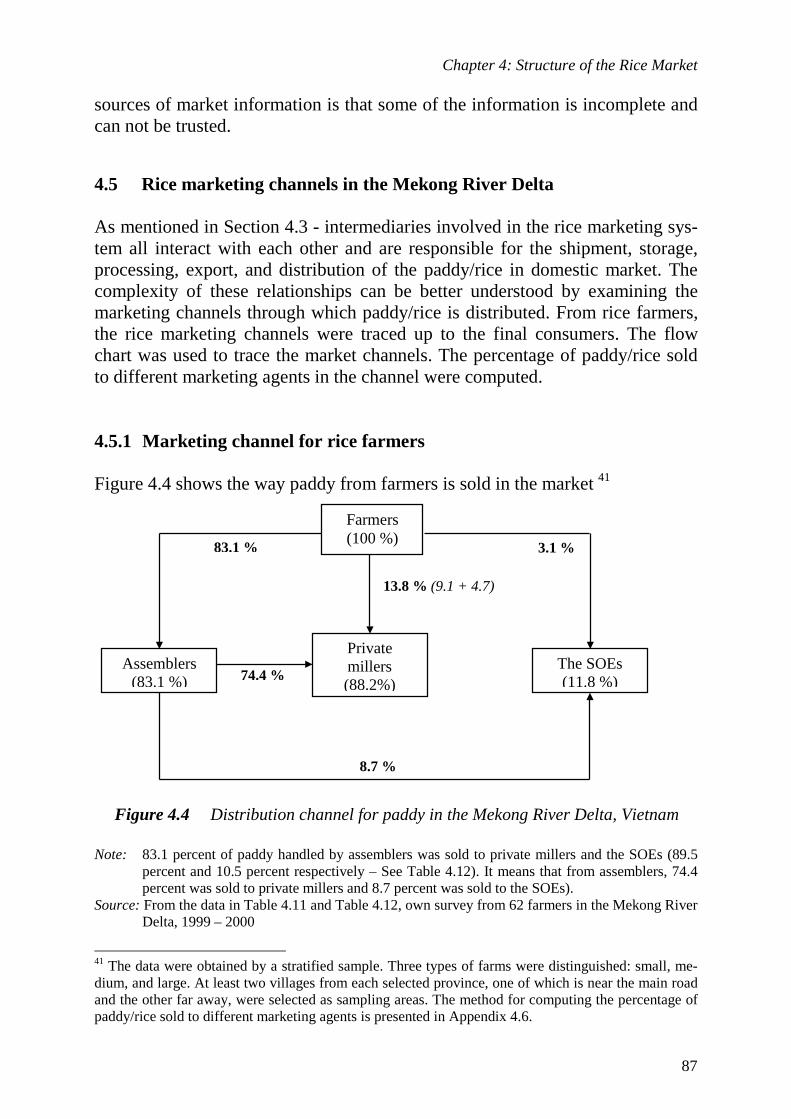
Chapter 4: Structure of the Rice Market
87
sources of market information is that some of the information is incomplete and can not be trusted.
4.5 Rice marketing channels in the Mekong River Delta As mentioned in Section 4.3 - intermediaries involved in the rice marketing sys-tem all interact with each other and are responsible for the shipment, storage, processing, export, and distribution of the paddy/rice in domestic market. The complexity of these relationships can be better understood by examining the marketing channels through which paddy/rice is distributed. From rice farmers, the rice marketing channels were traced up to the final consumers. The flow chart was used to trace the market channels. The percentage of paddy/rice sold to different marketing agents in the channel were computed. 4.5.1 Marketing channel for rice farmers Figure 4.4 shows the way paddy from farmers is sold in the market 41
Note: 83.1 percent of paddy handled by assemblers was sold to private millers and the SOEs (89.5
percent and 10.5 percent respectively – See Table 4.12). It means that from assemblers, 74.4 percent was sold to private millers and 8.7 percent was sold to the SOEs).
Source: From the data in Table 4.11 and Table 4.12, own survey from 62 farmers in the Mekong River Delta, 1999 – 2000
41 The data were obtained by a stratified sample. Three types of farms were distinguished: small, me-dium, and large. At least two villages from each selected province, one of which is near the main road and the other far away, were selected as sampling areas. The method for computing the percentage of paddy/rice sold to different marketing agents is presented in Appendix 4.6.
Farmers (100 %)
Assemblers (83.1 %)
Private millers (88.2%)
The SOEs (11.8 %)
83.1 %
13.8 % (9.1 + 4.7)
3.1 %
8.7 %
74.4 %
Figure 4.4 Distribution channel for paddy in the Mekong River Delta, Vietnam
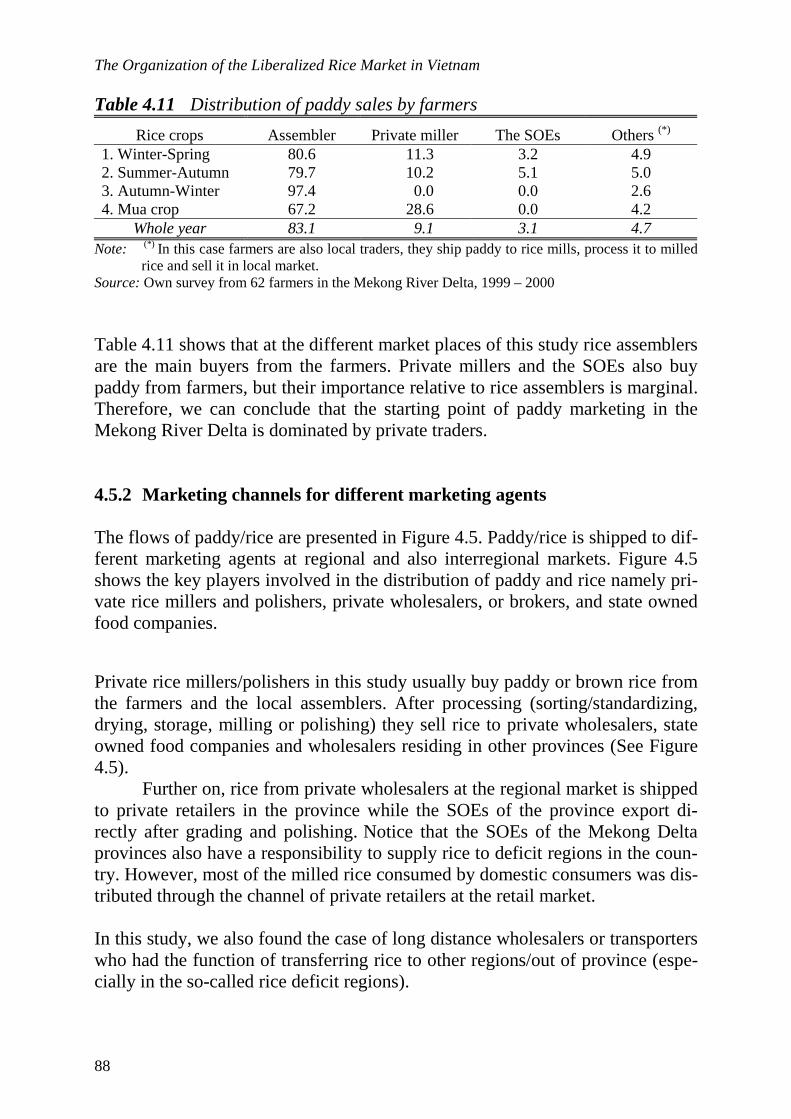
The Organization of the Liberalized Rice Market in Vietnam
88
Table 4.11 Distribution of paddy sales by farmers
Rice crops Assembler Private miller The SOEs Others (*) 1. Winter-Spring 80.6 11.3 3.2 4.9 2. Summer-Autumn 79.7 10.2 5.1 5.0 3. Autumn-Winter 97.4 0.0 0.0 2.6 4. Mua crop 67.2 28.6 0.0 4.2
Whole year 83.1 9.1 3.1 4.7 Note: (*) In this case farmers are also local traders, they ship paddy to rice mills, process it to milled
rice and sell it in local market. Source: Own survey from 62 farmers in the Mekong River Delta, 1999 – 2000 Table 4.11 shows that at the different market places of this study rice assemblers are the main buyers from the farmers. Private millers and the SOEs also buy paddy from farmers, but their importance relative to rice assemblers is marginal. Therefore, we can conclude that the starting point of paddy marketing in the Mekong River Delta is dominated by private traders. 4.5.2 Marketing channels for different marketing agents The flows of paddy/rice are presented in Figure 4.5. Paddy/rice is shipped to dif-ferent marketing agents at regional and also interregional markets. Figure 4.5 shows the key players involved in the distribution of paddy and rice namely pri-vate rice millers and polishers, private wholesalers, or brokers, and state owned food companies.
Private rice millers/polishers in this study usually buy paddy or brown rice from the farmers and the local assemblers. After processing (sorting/standardizing, drying, storage, milling or polishing) they sell rice to private wholesalers, state owned food companies and wholesalers residing in other provinces (See Figure 4.5).
Further on, rice from private wholesalers at the regional market is shipped to private retailers in the province while the SOEs of the province export di-rectly after grading and polishing. Notice that the SOEs of the Mekong Delta provinces also have a responsibility to supply rice to deficit regions in the coun-try. However, most of the milled rice consumed by domestic consumers was dis-tributed through the channel of private retailers at the retail market. In this study, we also found the case of long distance wholesalers or transporters who had the function of transferring rice to other regions/out of province (espe-cially in the so-called rice deficit regions).
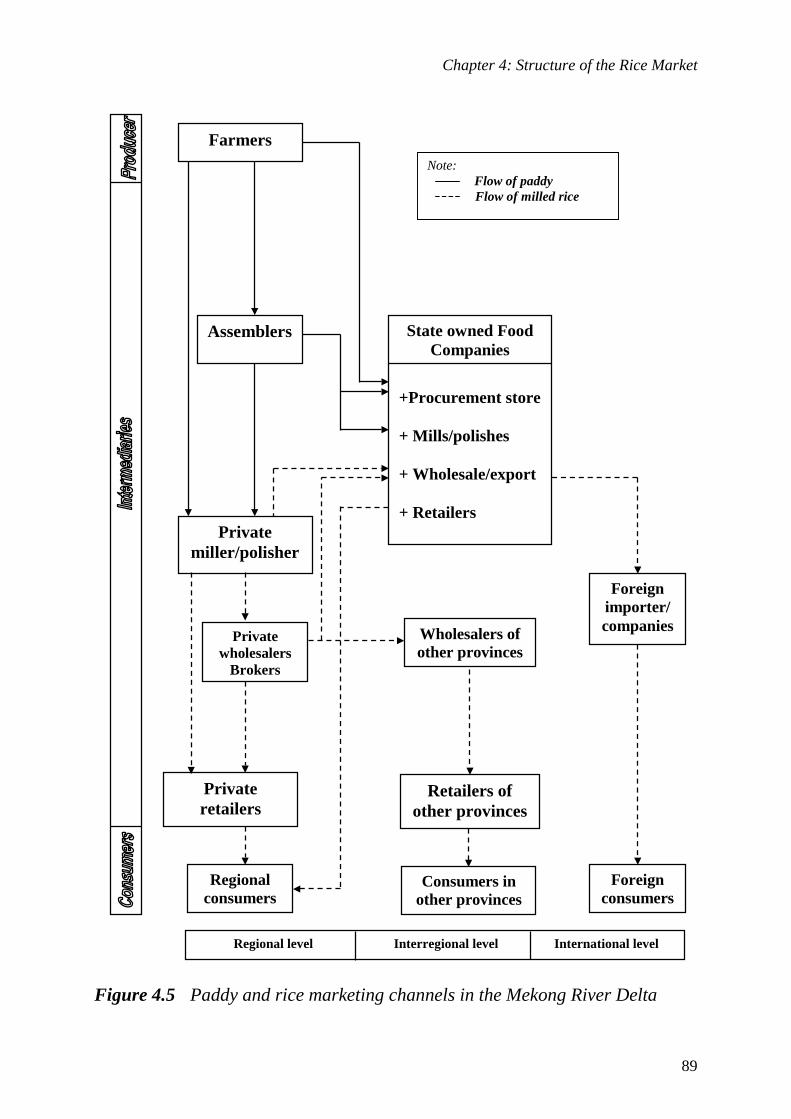
Chapter 4: Structure of the Rice Market
89
Figure 4.5 Paddy and rice marketing channels in the Mekong River Delta
Note: Flow of paddy Flow of milled rice
Regional level Interregional level International level
Farmers
Assemblers
Private retailers
Regional consumers
State owned Food Companies
+Procurement store + Mills/polishes + Wholesale/export + Retailers
Wholesalers of other provinces
Consumers in other provinces
Retailers of other provinces
Foreign importer/ companies
Foreign consumers
Private miller/polisher
Private wholesalers
Brokers

The Organization of the Liberalized Rice Market in Vietnam
90
In total 39 state owned food companies control the channel of rice export. Since the SOEs have the advantage of receiving export quota from the government; they handle more than 600 rice processing factories with high capacity and mill-ing quality (they manage more than 40 percent of the total milling capacity); they also receive financing support from the government. 42 Moreover, in the last decade the SOEs accumulated quite some experience in the international business. They can export rice directly to foreign importers/companies or through the Vietnamese Food Association, VINAFOOD No.1, and VINAFOOD No.2. In the year of 2000, there were also some big private millers who obtained export quota.43 However, they are just a new group with a small export capacity. They supply only 6.5 percent of total rice exports (Vietnamese Food Associa-tion, 2001) and they lack experience and reputation in the international business. Most of the private rice traders in the Mekong River Delta have to export indi-rectly through the SOEs of the province. To consider in more detail the flows of paddy/rice in different marketing chan-nels, the percentage of the paddy/rice sold to different marketing agents in the channel are presented in Table 4.12 to Table 4.15 follows. Table 4.12 Distribution of paddy sales by assemblers
Winter-Spring Summer-Autumn Autumn-Winter Type of rice trader
Long grain (C1)
Short grain (C2)
Long grain (C1)
Short grain (C2)
Long grain (C1)
Short grain (C2)
Whole year
1. Procurement store of the SOEs 12.0 9.9 5.7 7.5 36.4 21.4 10.5
2. Private miller 88.0 90.1 94.3 92.5 63.6 78.6 89.5
Total 100.0 100.0 100.0 100.0 100.0 100.0 100.0 Source: Own survey of this study in the Mekong River Delta, 1999 – 2000 Table 4.12 shows that most of the paddy from assemblers is shipped to private rice millers. Especially the Summer-Autumn crops sold to the private rice mill-ers. Bad weather in this season strongly affects the quality of paddy. Therefore, it is milled into rice for domestic use. The SOEs buy around 10 percent to 20 percent of total paddy sold by assemblers. Most assemblers prefer to sell paddy to private millers because they can get higher prices as compared with the SOEs and they also have close relationships with private millers as regular clients in rice trading. 42 The SOEs receive indirect subsidy from the government under the terms of obtaining credit from the state banks with a zero interest rate. This financial subsidy encourages the SOEs to purchase paddy from the farmers at floor prices during the harvest period. 43 In 2000, in total 47 companies obtained an export licence of the government: 39 SOEs and only 8 private enterprises/joint-venture companies.

Chapter 4: Structure of the Rice Market
91
Table 4.13 Distribution of rice sales by wholesalers/brokers
Winter-Spring Summer-Autumn Autumn-Winter Type of rice trader
Long grain (C1)
Short grain (C2)
Long grain (C1)
Short grain (C2)
Long grain (C1)
Short grain (C2)
Whole year
1. Private Miller/polisher (1)
44.6 23.2 30.7 10.1 22.4 0.9 22.7
2. State owned Com-pany
29.4 27.7 33.8 42.5 47.6 29.0 24.4
3. Private Wholesaler of other provinces
15.0 15.1 26.2 25.8 20.0 35.8 30.6
4. Private Retailer
10.6 33.8 8.6 21.5 10.0 34.2 22.0
5. Final Consumer
0.4 0.2 0.7 0.1 0.0 0.1 0.3
Total 100.0 100.0 100.0 100.0 100.0 100.0 100.0
Note: (1) We notice that the product supplied by wholesalers in this table is milled rice as well as brown rice (See Figure 5.1 in Chapter 5 for further explanation about the distinction between brown rice and white rice), therefore some volumes of brown rice were sold to private polishers. Secondly, in this surveyed area, some rice millers also operate as wholesalers, they try to obtain milled rice for reselling in domes-tic market (the case of millers in Tiengiang). This means that from wholesalers/brokers 22.7 % of rice (included both brown and milled rice) was sold to private millers/polishers.
Source: Own survey in the Mekong River Delta, 1999 – 2000.
In Table 4.13 we attempt to quantify the distribution of rice sales by wholesalers and/or brokers. The figures in this table indicate that there are three main types of intermediaries: (1) procurement store of the SOEs, (2) private miller/polisher, and (3) private wholesaler. The private millers/polishers handle most of the C1 rice, especially the Winter-Spring crop (44.6 percent). In contrast, a large per-centage of the Summer-Autumn C2 rice is handled by the procurement store of the SOEs (42.5 percent). Due to bad weather, paddy in Summer-Autumn has low quality. It is very difficult for drying and storage. Then the domestic prices of paddy usually go down. The government intervenes and instructs the SOEs to purchase large volumes of paddy at the floor price (in terms of temporary reser-vation) in order to support rice farmers. 44
Table 4.13 also reveals that during the Summer-Autumn season, the pri-vate wholesalers purchase large amounts of rice: more than 25 percent for both long grain and short grain rice. This amount of milled rice usually is sold to long-distance wholesalers that supply other regions outside of the province (deficit rice areas).
44 See Section 4.7- Government policy and regulation in this Chapter for further explanation.

The Organization of the Liberalized Rice Market in Vietnam
92
Table 4.14 Distribution of rice sales by millers/polishers
Broken level Type of rice trader
5% 10%-15% 20%-25% 35%
Total
1. Private wholesaler 0.0 8.6 18.2 19.6 16.6
2. Long distance buyer-seller 14.2 18.1 24.6 31.4 24.2
3. Other miller/polisher 10.3 16.0 12.9 20.4 16.9
4. SOEs/ procurement store 70.8 47.0 32.5 21.2 32.6
5. Private retailer 0.0 4.1 5.1 5.4 4.9
6. Others (*) 4.7 6.2 6.7 2.0 4.8
Total 100.0 100.0 100.0 100.0 100.0
Note: (*) They mostly are brokers – “Chu vua” in Vietnamese terms. Source: Own survey, 53 rice millers/polishers in the Mekong River Delta, 1999 – 2000 At miller level, rice products are classified by broken level. Table 4.14 indicates that milled rice from rice mills was distributed to different types of rice traders. The state owned companies handled a large volume of rice as compared to other rice traders in the market, especially for 5 percent broken rice (70.8 percent), and 10-15 percent broken rice (47.8 percent). 45 The procurement store of the SOEs has an important role in collecting quite large amounts of rice from pri-vate rice millers/polishers. With respect to 35 percent broken rice (low rice qual-ity), Table 4.14 shows that private rice traders (including private wholesaler, long distance buyer-seller, other miller/polisher) control almost 79 percent of 35 percent broken rice that sold to domestic market. The remaining 21 percent of 35 percent broken rice is handled by the procurement store of the SOEs (this kind of product is sold to domestic market as well). This result indicates that both private rice traders and the procurement store of the SOEs have important role in the domestic channel of distribution. They contribute on distributing rice to regional and interregional markets. At the retail level, the rice marketing channel is simple. As Table 4.15 shows, about 80 percent of milled rice from the retailer is sold directly to final consum-ers. Other channel of selling rice is indirectly through small retailers. They are retailers that sell small quantities to poor people living in the downtown area. Finally, at retail level, small quantities of rice are also supplied to other consum-ers such as restaurants, hotels, universities or schools.
45 The 5 percent and 10 percent broken rice are high quality rice use for export.
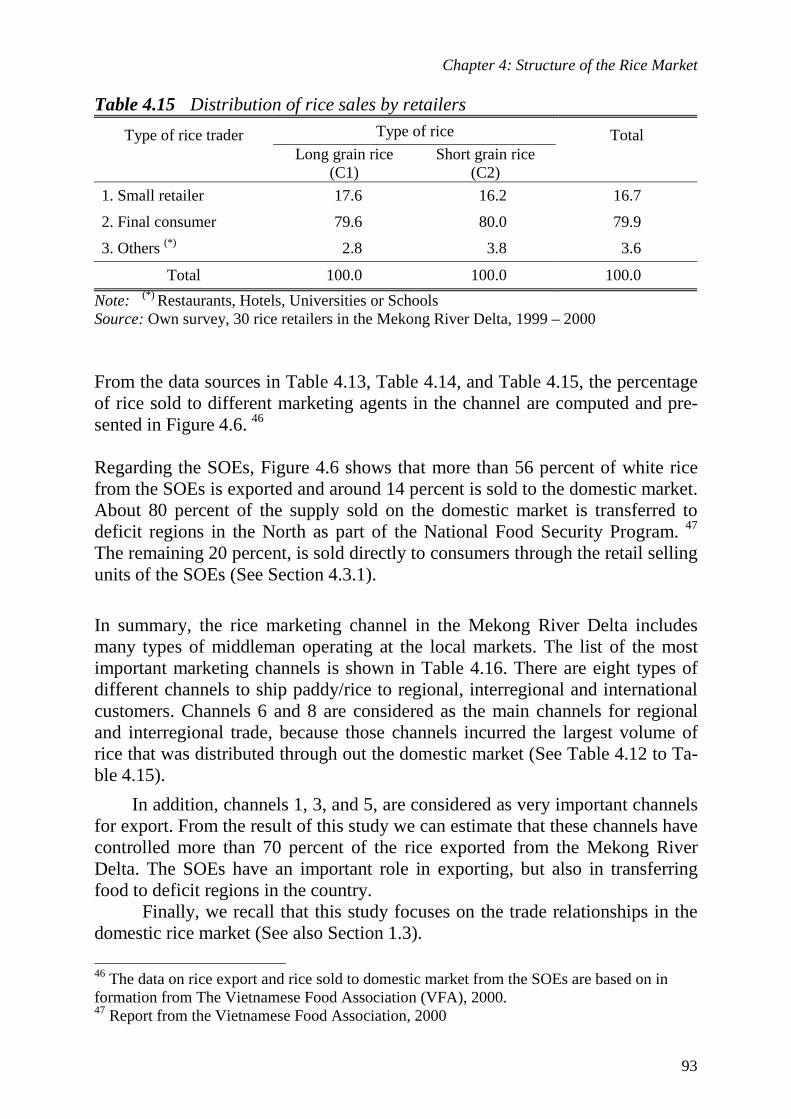
Chapter 4: Structure of the Rice Market
93
Table 4.15 Distribution of rice sales by retailers
Type of rice Type of rice trader Long grain rice
(C1) Short grain rice
(C2)
Total
1. Small retailer 17.6 16.2 16.7
2. Final consumer 79.6 80.0 79.9
3. Others (*) 2.8 3.8 3.6
Total 100.0 100.0 100.0
Note: (*) Restaurants, Hotels, Universities or Schools Source: Own survey, 30 rice retailers in the Mekong River Delta, 1999 – 2000 From the data sources in Table 4.13, Table 4.14, and Table 4.15, the percentage of rice sold to different marketing agents in the channel are computed and pre-sented in Figure 4.6. 46 Regarding the SOEs, Figure 4.6 shows that more than 56 percent of white rice from the SOEs is exported and around 14 percent is sold to the domestic market. About 80 percent of the supply sold on the domestic market is transferred to deficit regions in the North as part of the National Food Security Program. 47 The remaining 20 percent, is sold directly to consumers through the retail selling units of the SOEs (See Section 4.3.1).
In summary, the rice marketing channel in the Mekong River Delta includes many types of middleman operating at the local markets. The list of the most important marketing channels is shown in Table 4.16. There are eight types of different channels to ship paddy/rice to regional, interregional and international customers. Channels 6 and 8 are considered as the main channels for regional and interregional trade, because those channels incurred the largest volume of rice that was distributed through out the domestic market (See Table 4.12 to Ta-ble 4.15).
In addition, channels 1, 3, and 5, are considered as very important channels for export. From the result of this study we can estimate that these channels have controlled more than 70 percent of the rice exported from the Mekong River Delta. The SOEs have an important role in exporting, but also in transferring food to deficit regions in the country.
Finally, we recall that this study focuses on the trade relationships in the domestic rice market (See also Section 1.3).
46 The data on rice export and rice sold to domestic market from the SOEs are based on in formation from The Vietnamese Food Association (VFA), 2000. 47 Report from the Vietnamese Food Association, 2000
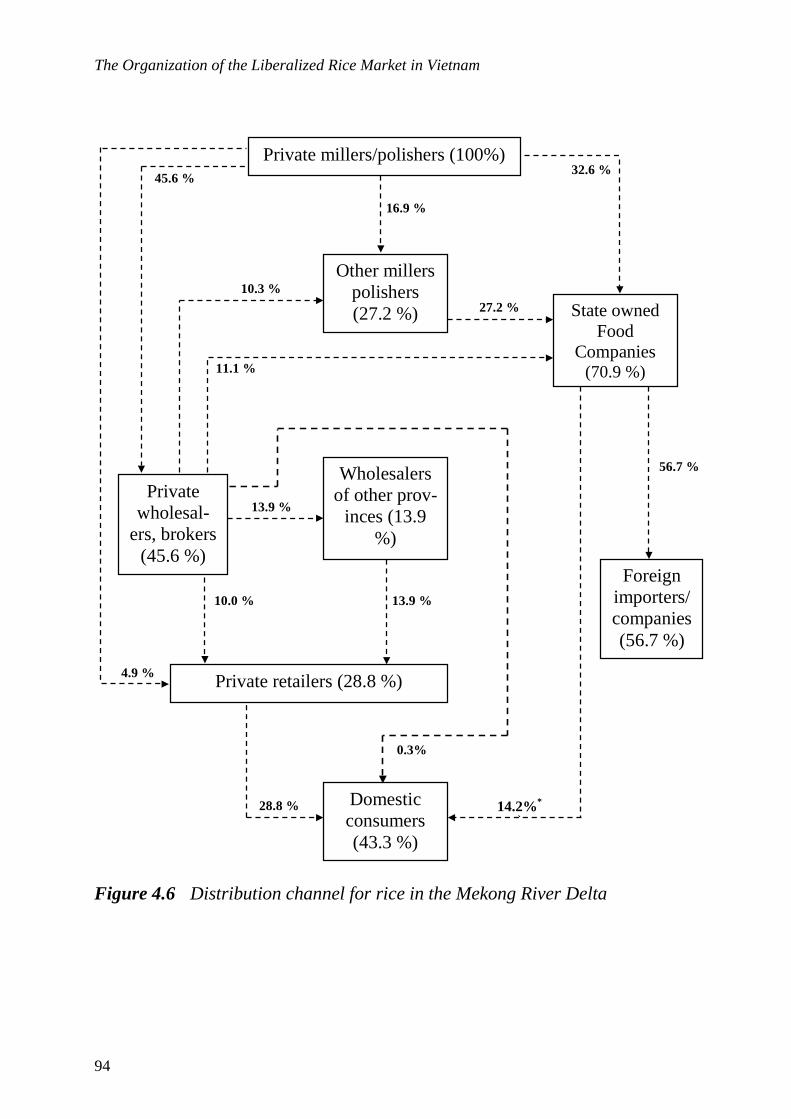
The Organization of the Liberalized Rice Market in Vietnam
94
Figure 4.6 Distribution channel for rice in the Mekong River Delta
32.6 % Private millers/polishers (100%)
Private wholesal-
ers, brokers (45.6 %)
Other millers polishers (27.2 %) State owned
Food Companies
(70.9 %)
Wholesalers of other prov-
inces (13.9 %)
Private retailers (28.8 %)
Foreign importers/ companies (56.7 %)
Domestic consumers (43.3 %)
45.6 %
16.9 %
10.3 % 27.2 %
11.1 %
56.7 %
13.9 %
13.9 % 10.0 %
4.9 %
28.8 % 14.2%*
)
0.3%

Chapter 4: Structure of the Rice Market
95
Table 4.16 List of paddy and rice channels in the Mekong River Delta.
CHANNELS
1. Farmers – State owned food companies – Out/export
2. Farmers – State owned food companies – Domestic consumer
3. Farmers – Assemblers – State owned food companies – Out/export
4. Farmers – Assemblers – Private millers – State owned food companies – Out/export
5. Farmers – Assemblers – Private millers – Private wholesalers – State owned food companies – Out/export
6. Farmers – Assemblers – Private millers – Private wholesalers – Private retailers – Domestic consumers
7. Farmers – Private millers – Private wholesalers – Private retailers – Domestic consumers
8. Farmers – Assemblers – Private millers – Private wholesalers –Wholesalers of other provinces – Retailers of other provinces – Interregional Consumers
4.5.3 Rice marketing channels of State Farms in the Mekong River Delta
As discussed in the previous section, State Farms have their own distribution channel to market their product and assume all marketing functions. State farms also buy extra paddy or brown rice from outside the farm in order to meet the requirements of the concluded export contracts.
We studied two State Farms, SOHAFARM and CODOFARM. Specially, SOHAFARM has a strong collaboration with many agricultural cooperatives in Cantho, Angiang, and Soctrang province. They have invested their money in ag-ricultural cooperatives in terms of distributing inputs in advance such as fertil-izer, pesticides, seeds of new varieties and services for land preparation or irri-gation. At harvest time, agricultural cooperatives repay their debts to SO-HAFARM in kind: by paddy. SOHAFARM also has a good relationship with VINAFOOD No.II in HOCHIMINH City and the Vietnamese Food Association in order to export large amounts of rice. According to the report of Vietnamese Food Association, at the end of 1999, SOHAFARM has exported more than 200,000 tons, equivalent to more than 38 percent of the total rice export of Can-tho province and was ranked at number 6 of the top 10 rice export companies in Vietnam.
The rice marketing channels of State farms are quite simple. There are two separate channel systems: a channel for export and one for selling to the domes-tic market. Figure 4.7 and Figure 4.8 below illustrate the flow of different chan-nels of distribution of CODOFARM. According to the report of CODOFARM,
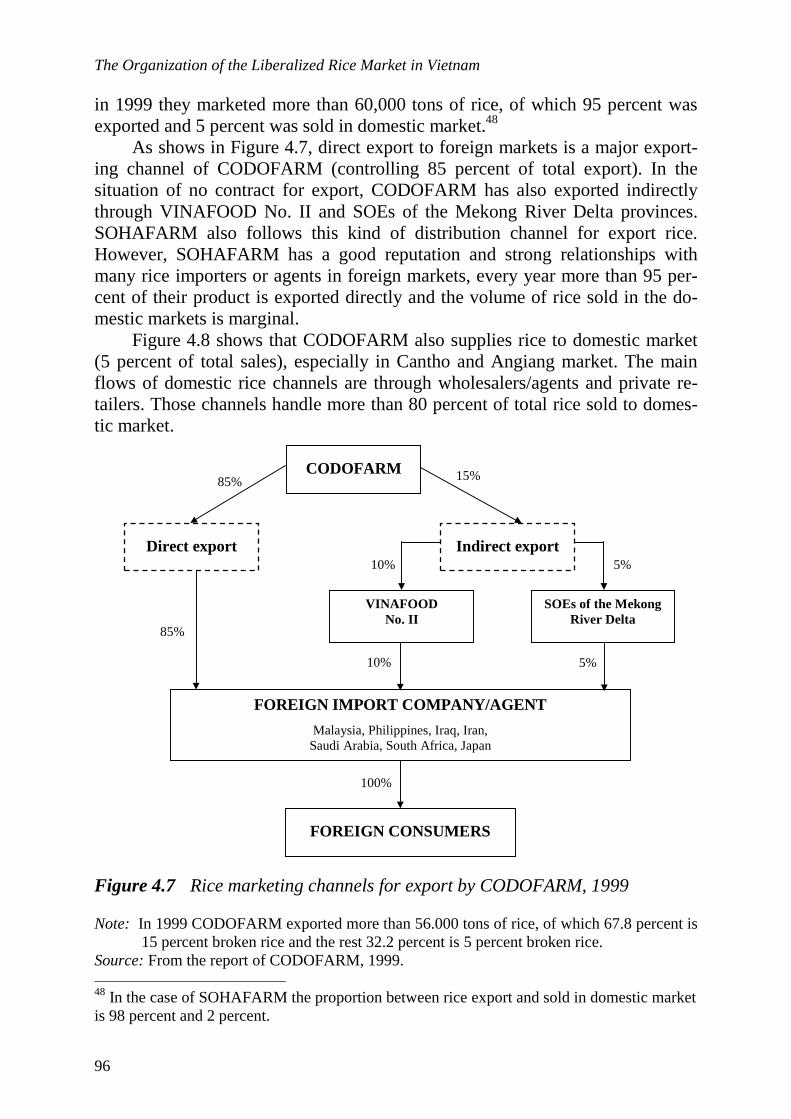
The Organization of the Liberalized Rice Market in Vietnam
96
in 1999 they marketed more than 60,000 tons of rice, of which 95 percent was exported and 5 percent was sold in domestic market.48
As shows in Figure 4.7, direct export to foreign markets is a major export-ing channel of CODOFARM (controlling 85 percent of total export). In the situation of no contract for export, CODOFARM has also exported indirectly through VINAFOOD No. II and SOEs of the Mekong River Delta provinces. SOHAFARM also follows this kind of distribution channel for export rice. However, SOHAFARM has a good reputation and strong relationships with many rice importers or agents in foreign markets, every year more than 95 per-cent of their product is exported directly and the volume of rice sold in the do-mestic markets is marginal.
Figure 4.8 shows that CODOFARM also supplies rice to domestic market (5 percent of total sales), especially in Cantho and Angiang market. The main flows of domestic rice channels are through wholesalers/agents and private re-tailers. Those channels handle more than 80 percent of total rice sold to domes-tic market.
Figure 4.7 Rice marketing channels for export by CODOFARM, 1999 Note: In 1999 CODOFARM exported more than 56.000 tons of rice, of which 67.8 percent is
15 percent broken rice and the rest 32.2 percent is 5 percent broken rice. Source: From the report of CODOFARM, 1999. 48 In the case of SOHAFARM the proportion between rice export and sold in domestic market is 98 percent and 2 percent.
CODOFARM
Indirect export
Direct export
FOREIGN IMPORT COMPANY/AGENT
Malaysia, Philippines, Iraq, Iran, Saudi Arabia, South Africa, Japan
VINAFOOD No. II
SOEs of the Mekong River Delta
FOREIGN CONSUMERS
85% 15%
85%
10% 5%
10% 5%
100%

Chapter 4: Structure of the Rice Market
97
Figure 4.8 Rice marketing channels for the domestic market, CODOFARM, 1999
Source: From the report of CODOFARM, 1999 In 1999, CODOFARM has had a new strategy to penetrate further in the domes-tic market in order to enter new market segments: supplying to restaurants, uni-versities, schools, and final consumers through farm retail store. This is a good potential market. 4.6 The process of rice price formation Since more than 30 percent of rice supply in the Mekong River Delta is ex-ported,49 the domestic price strongly depends on international prices. Normally, at different times in the year, using information on the world rice prices, the Ministry of Trade and the Ministry of Agriculture and Rural Development to-gether with VINAFOOD and VFA (the Vietnamese Food Association) recom-mend obligatory/minimum export prices. Based on this price level (so-called “floor price”), every SOE negotiates with foreign importers. The domestic rice market price is more or less derived from this ‘floor price: first, from the infor-mation about the floor price for export of the VFA, and VINAFOOD, the buying price of rice for export is fixed by the SOEs; based on this buying price, private rice millers, and assemblers/wholesalers derive their buying prices. Next to this source of price information, rice traders also use the public information about paddy/rice prices that is announced by radio or television as references for set-ting prices in domestic markets.
49 From 1995 to 1999, every year, the Mekong River Delta contributes 2.2 – 2.7 million tons of rice for export, about 30 percent –35 percent of total rice production of the whole Delta.
C O D O
F A R M
C O N S U M E R
WHOLESALER
PRIVATE RETAILER
RESTAURANT/SCHOOL
FARM RETAIL STORE
57%
25%
11%
7%
57%
82%
11%
7%

The Organization of the Liberalized Rice Market in Vietnam
98
Table 4.17 Output-price formation Percentage of response by different rice traders Price formation
Miller (n=53)
Ass. and Whole-saler (n=67)
Retailer (n=30)
1. Buyer 35.8 59.7 3.3
2. Supplier 15.1 3.0 80.0
3. Negotiation bet. buyer - supplier 32.1 23.9 6.7
4. Based on market price 17.0 13.4 10.0
Total 100.0 100.0 100.0
Source: Own survey among rice traders in the Mekong River Delta, 1999 – 2000 Table 4.17 shows the perception of rice traders with regard to the question “who is setting the price”. The figures in this table indicate that the private rice millers do not think that they have a strong position in price setting at the output market (15.1 percent). The majority accepts the price that is fixed by the buyers (the SOEs or export agents) – 35.8 percent, and 32.1 percent is based on the process of bargaining between the millers and buyers. The situation is almost the same in the case of assemblers/wholesalers. They are often price followers: 59.7 per-cent of the wholesalers accepted the price proposed by the buyers. Only 3 per-cent of the wholesalers can fix their selling price. In contrast, at the retail market most of rice retailers fix the selling price: 80 percent. On the whole, at the wholesale market the buyers seemly have more power in setting prices than the sellers. Conversely, at the retail market rice consumers usually have to follow the prices fixed by retailers. With regard to bargaining, the process of bargaining in the rice market usually concerns negotiation on prices per unit. As shown in the above table, the price per unit is fixed by most retailers (80 percent). Final consumers do not bargain. At the wholesale market, bargaining is more important. First of all, the suppliers offer a selling price, then the buyers are free to bargain and small discounts are accepted. However, in the case of regular clients, in order to save time on each transaction, the suppliers usually offer the fixed price and there is no bargaining. On the whole, bargaining is not too important in the rice market as price levels are mainly determined by the export ‘floor price’. Table 4.18, Table 4.19, and Table 4.20 present some transaction specific charac-teristics that influence the price of rice in the market. In general, the difference in quality of paddy/rice is the main factor that influences the price in the market. Buying in large or small volumes and the distance of transportation is not a big problem to rice traders. The results also show that the moisture degree of paddy/rice cannot be neglected in the price formation process to the buyers

Chapter 4: Structure of the Rice Market
99
when they set the price. In sum, product quality is an important characteristic that most rice traders take into account when they perform price negotiation.
Table 4.18 Factors influencing buying and selling prices according to rice millers/polishers.
Number of response on different levels (n=53) Influenced factor Not
important Less
important Important Very
important Average
grading (*)
1. Differences in quality (varieties, %broken) 1 1 11 40 2.698
2. Differences in moisture content 5 37 11 0 1.113
3. Buying in large or small volume 43 6 4 0 0.264
4. Long or short distance of transport 39 5 9 0 0.434
Note: (*) Average grading was computed by using weighted average method (The computed procedure is the same as Table 4.1)
Source: Own survey, 53 rice millers in the Mekong River Delta, 1999 – 2000.
Table 4.19 Factors influencing buying and selling prices according to rice as-semblers/wholesalers.
Number of response on different levels (n=67) Influenced factor Not
important Less
important Important Very
important Average
grading (*)
1. Differences in quality (varieties, %broken) 1 0 13 53 2.761
2. Differences in moisture content 12 48 7 0 0.926
3. Buying in large or small volume 56 1 10 0 0.313
4. Long or short distance of transport 48 8 11 0 0.448
Note: (*) Average grading was computed by using weighted average method (The computed procedure is the same as Table 4.1.)
Source: Own survey, 67 assemblers/wholesalers in the Mekong River Delta, 1999 – 2000
Table 4.20 Factors influencing buying and selling prices according to rice
retailers.
Number of response on different levels (n=30) Influenced factor Not
important Less
important Important Very
important Average
grading (*)
1. Differences in quality (varieties, %broken) 0 0 8 22 2.734
2. Differences in moisture content 6 21 3 0 0.900
3. Buying in large or small volume 24 2 4 0 0.334
4. Long or short distance of transport 28 1 0 1 0.134
Note: (*) Average grading was computed by using weighted average method (The computed procedure is the same as Table 4.1.)
Source: Own survey, 30 rice retailers in the Mekong River Delta, 1999 – 2000
The Organization of the Liberalized Rice Market in Vietnam
100
4.7 Government policy, regulations and informal trade organizations in the rice market.
4.7.1 The role of the government According to the report of Vietnam Economy News (July 2, 2001), in a closing speech to a meeting on the sector’s development plan for 2001 in HCMC, Viet-nam, Agriculture Minister Le Huy Ngo has emphasized that agricultural produc-tion will be shifted from output-oriented to market-directed. 50 However, taken into account the importance of the state owned food companies and the state farms, the government still influences the sector and should develop a suitable long run strategy for the agricultural output market. Moreover, the government also plays an important role in defining favorable institutions – “the rules of the game”.
4.7.2 Major policy changes to promote rice trading In the annual conference of the Vietnamese National Assembly, most of the members suggested that the government has to build up a national food strategy, determine exactly how much paddy/rice is needed for the National Food Secu-rity Program, and how much rice can be exported. Based on this strategy, the people committee of each province will set up their short run planning and rele-vant method to help and instruct the farmers, traders implementing their busi-ness plan. In more detail, other members of the Vietnam National Assembly also suggested that the government should establish the network to provide market information, market forecasting, and a consulting office to help rice traders do-ing their business in an efficient way.
In December 1986, the commitment to reform the centrally planned econ-omy to a market oriented system was announced. Since then many substantial changes were carried out. In this section we summarize some major policy changes that promoted the rice business in Vietnam.
From 1988, the domestic rice market was liberalized. Rice traders are free to deliver paddy/rice out of the province (no checking points exist anymore be-tween the border of the provinces). Especially, in September 2000, the govern-ment has decided to eliminate the transaction tax for rice traders. 51 This policy has encouraged most of the rice traders to enlarge their business in many market 50 Output-oriented only focuses on the quantity of rice supply. Market-directed is more effi-cient, since it can highly satisfy the market demands in term of providing relevant quality of product. 51 Transaction tax is a kind of tax that imposes to traders who transfer products to other places. This kind of tax counts for each shipment or commercial affair. In practice, most of transporters, assemblers or buyer-sellers usually have to bear that kind of tax.

Chapter 4: Structure of the Rice Market
101
places in the Mekong River Delta. The rice traders can reduce their marketing costs with 100,000 to 200,000 VND for one shipment. 52 The conditions to entry into rice trading now become easier than in the previous period. Some constraining regulations have been removed. The procedure for obtaining a business license has been simplified to attract more traders into the business. New procedures for registration have been implemented. At present only one form of registration is required, and needs approval of only one provin-cial office. In HCM City, the businessman can even apply for their business li-cense on the Web-site by internet. 53 The government, through the State commercial banks and/or agricultural banks, offers credit to the SOEs with zero percent interest rates. This kind of free credit encourages the SOEs to purchase paddy from the farmers at the ‘floor price’. The reason for this credit subsidy is that the government would like to guarantee the floor price. This kind of government intervention aims to support the SOEs in establishing sufficient reserves of paddy/rice for export and also for the “Buffer Stock Program”.54 In 1989, the Vietnamese Food Association (VFA) was established in order to help and support both state and private rice traders. To become a member of the VFA, rice traders have to fulfill some strict conditions: having a license for rice trading; handle good facilities and capital for processing and storing at least 500 tons of high quality rice for export (this is the most difficult requirement); hav-ing a good reputation. 41 food companies are member of the VFA. Every year, the VFA controls more than 96 percent of the total rice export of the country. In 2001, the VFA facilitated the following activities: searching for new export markets; providing relevant market information; collaborating with Thailand to control the quality of rice; striving for stable export prices. 55 Strong support to rice trade is given by the Ministry of Trade. In 2000, the new department of Trade Promotion (Viet-trade) was established. Viet-trade per-forms important functions such as creating good relationships with foreign com-panies, obtaining suitable information about international markets, working as a consultant for the rice business.
52 The Saigon Times Vol. 31 September, 2000 53 Web-site: www.HCMSTE.Gov.VN 54 The “Buffer Stock Program” is performed by the government in order to keep the price of paddy equal to the floor price. The government gives the intervention on buying paddy at floor price to sup-port rice farmers during the main harvest season or in the case of the market price of paddy become very low. The volumes of paddy buying will be reserved for national food security and export. 55 Report from the annual conference of Vietnamese Food Association (Ho Chi Minh City - Dec, 2001).

The Organization of the Liberalized Rice Market in Vietnam
102
4.7.3 Informal trade organizations It is difficult to identify all informal trade organizations. Due to their informal character and the prevailing conflict of interests, they remain relatively obscure. Moreover, some organizations are temporary and involve themselves with spe-cific problems. The informal organizations are always based on the interests of trader groups (i.e. rice millers, wholesalers) operating in the same market place.
We observed some informal trading networks in the rice market: (1) Informal networks of private rice millers/polishers. (2) Wholesale-retail networks (including local rice assemblers, long-distance
wholesalers, and retailers). (3) Private transport co-operatives/associations The informal networks of private rice millers/polishers are usually based on family-members. They usually help their members to obtain necessary informa-tion about market prices, sources of buying and selling, changes in government regulations. Secondly, the informal networks of rice millers/polishers also ex-change their experiences with new milling technology, in order to increase product quality and reduce processing costs. Every member within the network can receive a strong support from the others in terms of sharing and/or re-distributing their selling quota. For example, if a miller/polisher may not be able to deliver the required amount of rice to the SOE, other millers/polishers within the network may help to solve that problem by re-distributing their product to that miller. This type of support is the most important activity that the informal networks have performed in the market. This activity will help to reduce risks and solve the problems related to the delivery of rice for export. Those informal networks have a positive effect to the rice marketing channels.
Individual links between rice assemblers/wholesalers and retailers also ex-ist in some major market places in the Mekong River Delta. Wholesalers and re-tailers group together to create favorable conditions. They usually share market information and experiences with negotiations; they may offer fixed prices to other members (implying no bargaining when buying and selling – See Section 4.6); they may provide transport and financing facilities to each other. Those ac-tivities may increase their competitiveness in the market, since it will reduce transaction costs and risks in the business.
Operating as facilitators, most private transporters in the Mekong River Delta join together in transport co-operatives or associations. These informal groups provide a very important service to wholesalers, millers/polishers as well as the SOEs. Except some SOEs and large-scale millers/polishers, hiring trans-portation means is quite popular among private wholesalers and mill-ers/polishers. Instead of investing money in transport facilities (trucks or boats), they prefer to hire transportation means from the so-called transport co-

Chapter 4: Structure of the Rice Market
103
operative. By hiring boats or trucks, rice traders can reduce transportation costs and avoid risks on their business, since the transport co-operative can optimize shipment (transport capacity as well as distance of transportation). Moreover, using hired-transport facilities may be more convenient and safe to rice traders, as transport co-operatives usually have good experience with delivering, and avoiding risks and troubles that may happen along the road. 56 4.8 Conclusions
This chapter describes the framework within which the rice traders operate. Dif-ferent types of market intermediaries are defined and the existence of marketing channels is presented. Based on four salient aspects of market structure we can conclude that the major rice market places in our study are highly competitive. With regard to competition: (1) no barriers to entry are detected that influence the formation of prices; (2) there is no concentration of market shares in the hands of private companies; (3) product differentiation is not a major issue in the market; (4) information is accessible for traders.
This is certainly an important indicator for the evaluation of the liberaliza-tion policy. 57 An interesting result is that a major market share is still in the hands of the SOE's and State Farms. The Vietnamese market is not that private as many policy makers want us to believe.
Many kinds of rice varieties exist but consumers at the domestic market just differentiated it into C1-long grain rice, and C2-medium/short grain rice.
Important barriers to entry into the rice business were absent, especially in the case of assemblers and wholesalers. They only need a small amount of capi-tal (from 5 to 10 million VND) to start their business. The new rice traders feel free to get into rice trading. However, in the case of large-scale mill-ers/polishers, important barriers to entry concern access to capital, an unstable output market and proper milling technology.
Information on the domestic market is easy to obtain. The main sources of information are the SOEs and other traders. Some information on the domestic rice market in the Mekong River Delta is also available on internet. The structure of the marketing channel through which paddy/rice passes from farmers to final consumers is quite complex. There are many types of rice as-semblers/wholesalers (middleman) operating at the local markets. This creates a favorable condition for competition among rice traders. In the domestic rice market, private assemblers, wholesalers, brokers, and small millers, play an im-
56 Risks and troubles when delivering by boat are usually in terms of losses in quality of paddy/rice (due to wet effect) and boat sinking. 57 See also Section 3.4 in Chapter 3 for further explanation

The Organization of the Liberalized Rice Market in Vietnam
104
portant role. Regarding the export activity, the SOEs still control the export channel system. The process of price formation in the market is simple. The domestic price strongly depends on international prices. The government derives a minimum export price from international rice prices. SOEs and other large mill-ers/wholesalers derive their price levels from this minimum level. Moreover, SOEs are encouraged to guarantee a floor price to domestic producers. At the local level, the bargain process is driven by competition. The formal rules and regulations of the government are important for the rice market system. Changes in trade policy have contributed to both domestic and international rice trade. Three types of informal organizations were observed: private rice millers/polishers networks; wholesale-retail networks; and private transport co-operatives. In general, these informal trade networks contributed to the reduction of marketing costs. In summary, after 1989 the Vietnamese rice market was liberalized. The domes-tic rice market has matured step by step. The free market orientation creates a favorable environment for private rice traders. The national trade flows are completely liberalized offering many opportunities for private traders. However, the international transactions are still controlled by SOE’s and State Farms.

Chapter 5. Rice Trader Conduct in the Market 5.1 Introduction In this chapter the conduct of rice traders is analyzed. In general, conduct in the market refers to the set of competitive practices and tactics that traders use. As mentioned in Table 2.1 in Chapter 2, in order to analyze the conduct of the market or the traders’ role we focus on various aspects of trading strategies such as buying, selling, transport, storage, information and financial strategy. This chapter is structured as follows. First, we try to identify the characteristics of different types of rice traders in the Mekong River Delta. Secondly, we ana-lyze marketing strategies with regard to the form of rice and the sales promo-tions applied. In addition, some information about the source of supply and the destination of selling; the role of the trading network; and the conditions for buying and selling will be looked at. Finally, we analyze some major marketing functions such as transportation, storage, processing, information, negotiating, grading and financing. 5.2 The characteristics of rice traders. 5.2.1 Profile of rice traders in the Mekong River Delta Generally, most of the rice traders interviewed were locals whose family lineage originated from within the Mekong Delta provinces where they currently reside and where they now operate their business. Rice traders in the surveyed areas are fairly young – from 30 to 45 years old (Table 5.1). On average the rice mill-ers concern the oldest group, partly because processing is mainly asking for longer experience and requires large amounts of investment capital.
On average, a trader household consists of four to five members. Often family members are also involved in the business and usually act as accountant, technician or manager. In particular for rice millers it is important to have a good group of family members to run their business.
Table 5.1 also indicates that most owners/managers active in the whole-sale market are male: about 68 percent. In contrast, women dominate in the rice-retail trade, since the retail business is physically an easier job, can be combined with activities at home, and does not require so much travelling as compared to wholesale and rice processing.

The Organization of the Liberalized Rice Market in Vietnam
106
Table 5.1 Key personal profile of rice traders
Characteristics Assembler Wholesaler
Miller Retailer
1. Average age of the owner (years) 30 45 38
2. Number of family members 4 5 4
3. No. of family member involved in the business 2 3 1
4. The owners who are male (%) 68.7 54.8 47.0
Source: Own survey in the Mekong River Delta, 1999 - 2000 (67 assembler and wholesalers; 53 mill-ers; and 30 retailers).
As shown in Table 5.2, most rice millers have more than 14 years experience in rice trading. On average, the rice retailers just have 6 years experience and the rice wholesalers less than 8 years. Table 5.2 Commercial profile of rice traders
Characteristics of respondents Assembler wholesaler
Miller Retailer
1. Average number of years in business 8 [0.816]
14 [0.632]
6 [0.987]
2. Average Number of employees • Permanent workers • Temporary workers at peak season
2 [0.699]
5 [1.229]
8 [1.479]
25 [1.918]
1 [0.427]
1 [1.160]
3. Percentage of income from rice trading (%) (*) 78.5 [0.340]
97.6 [0.083]
77.6 [0.346]
4. Main reason cited for being involved in rice trading(%) • Living in a good place for rice trading • Profit from rice trading is nice • Continue the business from family (heritage) • Lack of land for agricultural cultivation • Others
19.4 22.4 13.4 34.3 10.5
24.5 14.3 47.2 11.3 2.7
40.0 13.3 10.0 33.4 3.3
Note: (*) Figures on percentage of income from rice trading by different traders include both paddy and rice business. These figure are computed by using Weighted average method based on the information of percentage of income from rice trading that were directly answered from the surveyed rice traders.
Figures between parentheses are coefficients of variation: CV = xn
xxi∑ − 2)(
, where i refers
the ith interviewed trader and n is the sample size. Source: Own survey of this study in the Mekong River Delta, 1999 – 2000

Chapter 5: Rice Trader Conduct in the Market
107
In general, rice trading is done on a full time basis. The majority of rice whole-salers and retailers are highly specialized in their occupation, with over 77 per-cent of their income obtained from the rice business. Rice millers tend to be more specialized than other traders, more than 97 percent of their income is from rice trading.
To run their business, rice millers need on average 8 permanent workers, and at a peak season (usually the Winter-Spring rice crop) they employ around 25 temporary workers especially for loading and unloading. Rice wholesalers employ about two permanent workers to assist them in loading and transferring paddy/rice. The rice retailers are assisted on average by only 1 permanent em-ployee. Asking for the reason why they got involved in rice trading, a major rea-son appears to be the lack of land for agricultural cultivation. At the retail level, around 40 percent of the rice retailers are involved in the rice business because they have a good place in the market for selling rice. Rice millers, continue the business of their family and indicate that they have a good location at their dis-posal. These results imply that a good location in the market, experience and knowledge are major reasons for rice traders to be involved in the business. 5.2.2 Other characteristics of rice traders Table 5.3 Other business activities of rice traders
Percentage of response (%) Types of other business Assembler wholesaler
Miller
Retailer
1. Paddy/rice cultivation 33.0 20.0 13.0
2. Growing livestock or poultry 4.5 60.0 -
3. Selling sundry goods (retailer shop) 4.2 - 62.0
4. Renting vehicle (truck, boat) 3.0 20.0 17.0
5. Selling animal food 1.5 - 8.0
6. Do not involve in other businesses 53.7 - -
Total 100.0 100.0 100.0
Source: Own survey in the Mekong River Delta, 1999 - 2000
Table 5.3 presents some other types of business that usually were done by rice traders in the Mekong River Delta. Besides milling, rice millers are interested in feeding pigs or chickens for commercial purpose (60 percent of total response) because they can use their sub-product from paddy milling such as bran, broken rice as food for the animals. The rice retailers are usually selling rice with other sundry goods in their retail shop (62 percent of total response) in order to get ex-tra profits. Relatively many assemblers/wholesalers are involved in paddy culti-
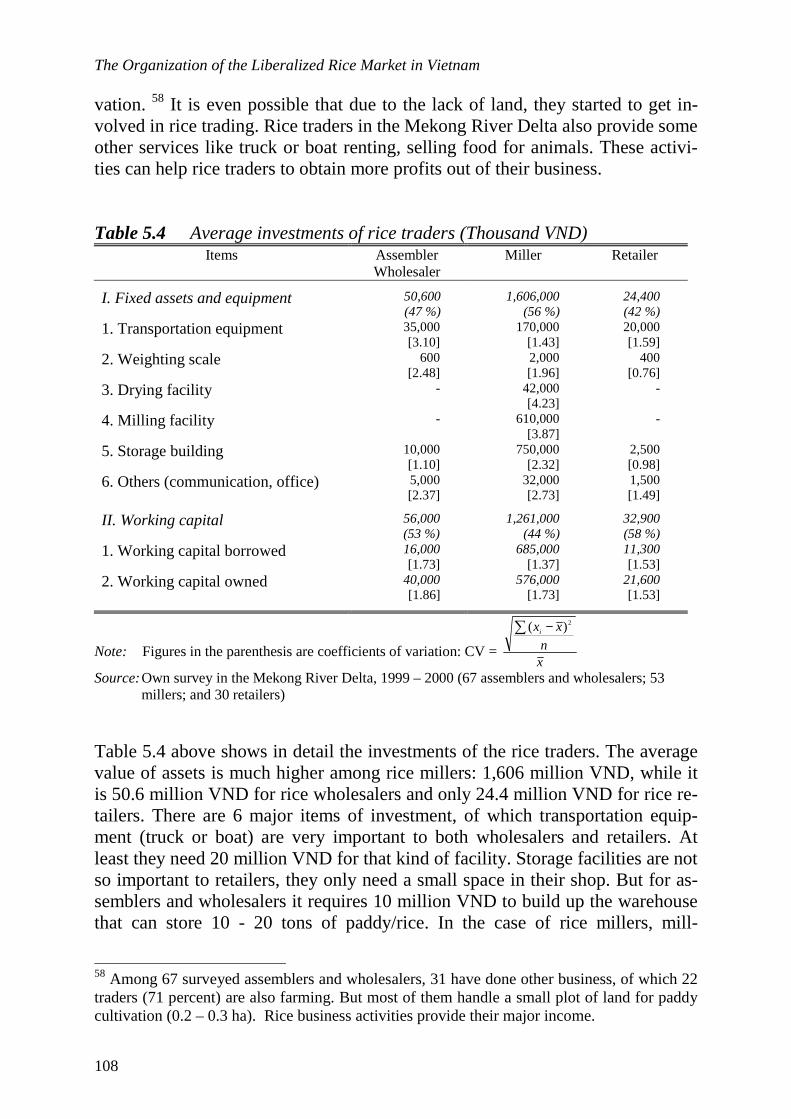
The Organization of the Liberalized Rice Market in Vietnam
108
vation. 58 It is even possible that due to the lack of land, they started to get in-volved in rice trading. Rice traders in the Mekong River Delta also provide some other services like truck or boat renting, selling food for animals. These activi-ties can help rice traders to obtain more profits out of their business. Table 5.4 Average investments of rice traders (Thousand VND)
Items Assembler Wholesaler
Miller Retailer
I. Fixed assets and equipment 50,600 (47 %)
1,606,000 (56 %)
24,400 (42 %)
1. Transportation equipment 35,000 [3.10]
170,000 [1.43]
20,000 [1.59]
2. Weighting scale 600 [2.48]
2,000 [1.96]
400 [0.76]
3. Drying facility - 42,000 [4.23]
-
4. Milling facility - 610,000 [3.87]
-
5. Storage building 10,000 [1.10]
750,000 [2.32]
2,500 [0.98]
6. Others (communication, office) 5,000 [2.37]
32,000 [2.73]
1,500 [1.49]
II. Working capital 56,000 (53 %)
1,261,000 (44 %)
32,900 (58 %)
1. Working capital borrowed 16,000 [1.73]
685,000 [1.37]
11,300 [1.53]
2. Working capital owned 40,000 [1.86]
576,000 [1.73]
21,600 [1.53]
Note: Figures in the parenthesis are coefficients of variation: CV = xn
xxi∑ − 2)(
Source: Own survey in the Mekong River Delta, 1999 – 2000 (67 assemblers and wholesalers; 53 millers; and 30 retailers)
Table 5.4 above shows in detail the investments of the rice traders. The average value of assets is much higher among rice millers: 1,606 million VND, while it is 50.6 million VND for rice wholesalers and only 24.4 million VND for rice re-tailers. There are 6 major items of investment, of which transportation equip-ment (truck or boat) are very important to both wholesalers and retailers. At least they need 20 million VND for that kind of facility. Storage facilities are not so important to retailers, they only need a small space in their shop. But for as-semblers and wholesalers it requires 10 million VND to build up the warehouse that can store 10 - 20 tons of paddy/rice. In the case of rice millers, mill-
58 Among 67 surveyed assemblers and wholesalers, 31 have done other business, of which 22 traders (71 percent) are also farming. But most of them handle a small plot of land for paddy cultivation (0.2 – 0.3 ha). Rice business activities provide their major income.

Chapter 5: Rice Trader Conduct in the Market
109
ing/polishing facilities and storage buildings are the main investment items. On average each rice mill has to invest more than 600 million VND for establishing the mill and around 750 million VND to build up a warehouse. Large rice mill-ers also need capital for a drying facility and vehicles for delivering their prod-ucts. The coefficient of variation of fixed capital investments in both drying and milling facilities are high as compared to the others (4.23 and 3.86 respectively), due to the difference in scale between large and small millers/polishers.
Table 5.4 also shows that, on average each rice mill needs around 55 per-cent of its capital to finance fixed assets and 45 percent for working capital. For wholesalers and retailers the proportion is 42 – 47 percent and 53 – 58 percent. It implies that working capital is important to rice traders. They can obtain working capital from the banks and other sources. 59 On average, rice millers use about 46 percent of their own working capital and require about 54 percent from out side. While rice wholesalers and retailers finance around 70 percent as their own working capital and borrow the rest (30 percent).
5.3 The buying and selling strategy of rice traders In this section the buying and selling activities of different types of rice traders will be treated. First, we focus on analyzing the choice of product which in-cludes the description of the form of product marketed, the form of packaging used, and the sales promotion activities. Secondly, various buying and selling strategies of different rice traders will be discussed in more detail. 5.3.1 Choice of product The Mekong Delta rice market is also characterized by the existence of different forms of paddy/rice that rice traders buy and sell on the market. As mentioned in Chapter 4, at farm level the farmers classify their paddy in two groups: (1) “Lua dai” – long grain paddy, and (2) “lua tron” – medium/short grain paddy. This kind of product differentiation is used in the whole Mekong Delta market. It means that the form of paddy in the market is fairly homogenous. In addition, traders also pay attention to the moisture content and the cover color of the paddy. 60 The latter criteria strongly influence the price of paddy of the Summer-Autumn crop. Because of the wet season, the farmers can not dry their paddy well, and sometimes they have to harvest their product early (as a consequence of floods and bad weather) then the cover color of paddy is not good compared to the Winter-Spring crop in the dry season. 59 See also Section 5.4.5 and Table 5.25. 60 The moisture degree must be low, and the cover/skin of paddy is smooth and to be more yellow
The Organization of the Liberalized Rice Market in Vietnam
110
At the wholesale market, based on the normal standard of long and short grain of paddy, most assemblers, wholesalers, and millers often differentiate their commodity into C1 (long grain) and C2 (short grain) type of rice, respec-tively the superior and inferior quality. It means that product differentiation in the wholesale market is not complicated. However at the retail market, in order to satisfy the various consumer demands, more qualities are distinguished. The rice retailers differentiate their product based on criteria like rice varieties; de-gree of whiteness; and taste. At the retail market we observed more than 10 dif-ferent types of rice. The results of this research indicate that more than 65 percent of the assemblers and wholesalers bought paddy in the un-packed form. The rest of them prefer to obtain paddy in 50-kg packages. At wholesale level, most rice traders buy and sell their product in packages of 45 – 50 kg. They usually use textile polymer bags without brand name and re-use of old packages. 61 At the retail market, al-most all the rice retailers sell their product to final consumers in the form of un-packed. They use small nylon bags, very practical for taking the rice home. Es-pecially, high quality rice (usually a traditional variety), is packed in bags (5 – 10kg) with a brand name. This kind of packed-rice was sold a lot in the domestic market during the Vietnamese New Year. Furthermore, in Vietnam rice can also be used for making some special kinds of food like rice stick, rice paper, or rice powder. Rice is also used to make a very famous kind of Vietnamese wine. 62 Such kind of food and wine are mostly used for special celebrations, wedding parties, New Year celebrations, etc…
5.3.2 Buying and selling strategy
In this section we focus on analyzing the buying and selling activities of three major groups of rice traders (assemblers and wholesalers; millers and polishers; and retailers). Some major factors such as the volume of paddy/rice bought and sold in the market; average number of suppliers and buyers; and where the sup-pliers/buyers come from, will be described. Assemblers and wholesalers Table 5.5 shows that local assemblers in this study specialize in buying and sell-ing paddy in local assembling markets. The quantity of paddy bought and sold is about 180 tons/year for each local assembler. The variation of quantities bought and sold is relatively low.
61 The rice traders also re-use the empty-fertilizer package of farmers to package their product 62 These products were made by separate industries.

Chapter 5: Rice Trader Conduct in the Market
111
Long-distance wholesalers seem to be more specialized in buying and selling rice. The average quantity of rice bought and sold by each distance wholesaler is around 1,360 tons/year and 480 tons/year, respectively. The varia-tion of rice purchased and sold in the market is high (2.975 and 1.750). This is not surprising as wholesalers assume different functions in the marketing chan-nel: supplying large mills and state owned food companies or mainly small re-tailers.
Table 5.5 Purchased and sold volumes of paddy/rice by assemblers and
wholesalers (Tons per year)
Indicator Mean Max Min Co. of
variation (1)
1. Assembler
- Purchased and sold volume of paddy per local assembler (n=8)
182.0 560 30.0 [0.992]
- Purchased and sold volume of rice per distance assembler (2) (n=9)
1,364.8 7,600 97.0 [1.750]
2. Wholesaler
- Purchased and sold volume of rice per wholesaler (n=47)
488.3 9,000 46.0 [2.975]
Note: (1) These figures were computed based on the results in Appendix 5.1. (2) Distance assemblers who distribute large volume of rice to other provinces (50 – 100 km distance)
Source: Own survey in the Mekong River Delta, 1999-2000.
Table 5.6 Average number of suppliers and buyers that the rice assemblers
and wholesalers are dealing with each month.
Number of suppliers Number of buyers Indicator
Total Regular Total Regular
Mean 15 6 7 3
Max 40 25 30 20
Min 2 2 2 0
Coefficient of variation [0.558] [0.813] [0.976] [1.487]
Source: Own survey, 67 assemblers/wholesalers in the Mekong River Delta, 1999 – 2000

The Organization of the Liberalized Rice Market in Vietnam
112
Some data on the suppliers and buyers that deal with rice wholesalers are pre-sented in Table 5.6, 5.7, and 5.8. On average, every month a wholesaler usually buys from 15 paddy/rice suppliers, 63 of which about 6 suppliers are good clients or regular suppliers who see the rice wholesalers many times a year. In the case of selling, each wholesaler has to deal with 7 customers, of which 3 are regular clients. Table 5.6 also shows that, the rice wholesalers in these surveyed areas buy from and sell to at least two clients. For selling, the variation of the number of clients is higher compared to the case of suppliers (0.976 > 0.558). It indi-cates that the number of buyers is more variable. This can be explained as some assemblers/wholesalers may prefer to sell to a miller with whom they have a permanent business relationship, or to a specific state owned food company, while other wholesalers supply a large number of small retailers. Table 5.7 Location of wholesaler’s buyers and suppliers.
Place of purchasing Selling market Different locations Number of response
Percentage of the total
Number of response
Percentage of the total
1. In the local area (less than 10 km)
18 26.9 28 41.8
2. Other province – medium dis-tance (from 10 – 100 km)
14 20.9 18 26.9
3. Other province – long dis-tance (greater than 100 km)
35 52.2 21 31.3
Total 67 100.0 67 100.0 Source: Own survey, 67 assemblers and wholesalers in the Mekong River Delta, 1999 – 2000.
More than 50 percent of the rice assemblers and wholesalers in this study obtain their paddy/rice from suppliers in other provinces (more than 100 km away). Those suppliers usually are the local assemblers, local millers or farmers at the local markets. In contrast, when the assemblers and wholesalers sell paddy/rice, most of their clients (41.8 percent) are located at their place, at about 10km dis-tance (See Table 5.7). The assemblers and wholesalers usually try to go far to other provinces to collect the paddy/rice and resell it to the rice mills or the SOEs at their home location. Table 5.8 reveals that when collecting paddy/rice, most of the assemblers and wholesalers have to get a contract with the suppliers in advance. It is just a ver-
63 This figure refers to a number of suppliers that each assembler/wholesaler deals with. For example, in each month, the assembler/wholesaler only knows that he/she bought from 10 suppliers. Most assemblers/wholesalers do not remember how many times he/she has pur-chased from those suppliers. Therefore, the total number of transactions is not mentioned here.

Chapter 5: Rice Trader Conduct in the Market
113
bal contract, but it is very important to ensure the deal between them. This type of contract is usually based on reputation and trust. 64 However, when selling paddy/rice the assemblers and wholesalers tend to be relatively free to choose. In general, assemblers and wholesalers transfer their paddy/rice by boat. Along the river they look for the private rice mill or procurement store of the SOE that offers the best price. Table 5.8 Common types of contract used by assemblers and wholesalers
When purchasing When Selling Condition Number of response
Percentage of the total
Number of response
Percentage of the total
1. Contract in advance 42 62.7 20 29.9
2. Non-contract 20 29.8 46 68.7
3. Others (*) 5 7.5 1 1.4
Total 67 100.0 67 100.0
Note: (*) Direct contact by telephone or through relatives, friends. Source: Own survey, 67 assemblers and wholesalers in the Mekong River Delta, 1999-2000 Rice millers In general, both private and state owned rice millers play an important role in the market. First, they act as processors that convert paddy to rice. The rice qual-ity highly depends on their processing technology. Secondly, they also act as wholesalers who buy paddy and/or rice from other rice traders; store the com-modity, grade and sell in the domestic market or export. Large-scale rice millers usually group together into a rice supply/export group or association. 65 They help each other to supply enough volume of rice for export at a certain day to fulfil a contract with a state owned food company.
The rice millers in this surveyed area specialize in two kinds of business: (1) buying paddy, after milling they sell brown and/or white rice, (2) buying brown rice and polish it. In order to describe in more detail the buying and sell-ing activity of rice millers, in this section the rice millers are classified into two groups based on the scale of their business. 66
64 Trust and reputation are usually based on long-term relationships between the buyers and sellers. 65 Those associations concern informal organizations including relatives or friends located at the same market place. 66 The processing capacity of a small-scale miller is less than or equal to 20 tons per day. The process-ing capacity of a large-scale miller is more than 20 tons per day.

The Organization of the Liberalized Rice Market in Vietnam
114
Table 5.9 Purchased and sold volumes of paddy/rice by rice millers (Tons/year)
Indicator Mean Max Min Co. of Variation (*)
1. Small scale
- Purchased volume of paddy per miller (n=17)
2,612 16,000 13 [1.50]
- Purchased volume of brown rice per miller (n=9)
4,505 9,500 2,000 [0.61]
- Sold volume of paddy per miller
- - - -
- Sold volume of rice per miller (n=26)
2,860 13,500 10 [1.09]
2. Large scale
- Purchased volume of paddy per miller (n=13)
9,523 38,000 1,400 [1.11]
- Purchased volume of brown rice per miller (n=16)
29,941 105,000 2,660 [1.05]
- Sold volume of paddy per miller
- - - -
- Sold volume of rice per miller (n=27)
18,880 100,000 980 [1.33]
Note: (*) These figures were computed based on the results in Appendix 5.2, and 5.3 Source: Own survey, 53 rice millers in the Mekong River Delta, 1999 – 2000 As shown in Table 5.9, on average a small miller purchases around 2,600 tons of paddy per year, however, the variation of the purchased quantity is relatively high. In the case of buying brown rice for polishing, one small rice polisher can handle around 4,500 tons of brown rice per year. The coefficient of variation is 0.61 which is relatively low. Among the 26 small millers, the maximum volume of rice sold is 13,500 tons per year. On average, each year, one rice mill proc-esses around 2,860 tons rice and sells it to the market.
Most of the large-scale producers are rice polishers (16/27). Every year each of them purchases around 30,000 tons brown rice and the biggest one can handle 105,000 tons. If we group together the millers and polishers, on average each of them sells more than 18,000 tons of rice per year.
Each rice mill has to deal on average with 30 suppliers, of which around 50 per-cent are regular clients that usually have a strong relationship with the millers. This relationship is useful to both supplier and miller. Since, they can ensure their transaction in terms of providing a certain amount of paddy/rice at a fixed time in order to fulfill the market demands. When selling, on average, each rice mill usually has to deal with at least 7 clients, of which 4 clients are regular cus-tomers (See Table 5.10).

Chapter 5: Rice Trader Conduct in the Market
115
Table 5.10 Average number of suppliers and buyers that rice millers are deal-ing with each month
Number of suppliers Number of buyers Indicator
Total Regular Total Regular
Mean 30 12 7 4
Max 80 40 50 20
Min 4 1 1 2
Coefficient of variation
[1.02] [1.16] [1.13] [0.83]
Note: The figures in this table only refer to total numbers of suppliers and buyers per month that rice millers deal with.
Source: Own survey, 53 rice millers in the Mekong River Delta, 1999 – 2000 Table 5.11 Location of suppliers and buyers in the market of rice millers
Place of purchasing Selling market Large-scale
millers Small-scale
millers Large-scale
millers Small-scale
millers
Different locations
No. of re-
sponse
% of the total
No. of re-
sponse
% of the total
No. of re-
sponse
% of the total
No. of re-
sponse
% of the total
1. At local area
( < 50 km)
2 7.4 8 30.8 1 3.7 21 80.8
2. Other province – medium distance (from 50 – 100 km)
12 44.5 16 61.5 5 18.5 3 11.5
3. Other province – long distance ( > 100 km)
13 48.1 2 7.7 21 77.8 2 7.7
Total 27 100.0 26 100.0 27 100.0 26 100.0
Source: Own survey, 53 rice millers in the Mekong River Delta, 1999 – 2000. The overall picture of a spatial network of rice millers in this study is summa-rized in Table 5.11. We can see that their trade takes place within a radius 100 km of the miller’s residence. In the case of purchasing, most large-scale millers procure their paddy/rice from medium and/or long-distance provinces (44.5 and 48.1 percent). In contrast, small-scale millers usually buy paddy/rice from local and/or medium-distance provinces (30.8 and 61.5 percent). At the output mar-ket, we have two situations: (1) small millers mostly market their product at the local area - less than 50km distance (80.8 percent), (2) large millers prefer to sell their product in provinces at a long distance - more than 100 km distance (77.8

The Organization of the Liberalized Rice Market in Vietnam
116
percent). Those figures imply that small and large rice mills in this study have different buying and selling strategies. How rice millers meet their suppliers for purchasing and clients for selling their product is presented in Table 5.12. When procuring paddy/rice, most of the rice mills prefer to negotiate with the suppliers in advance (52.8 percent deal on the basis of a contract). It is only a verbal contract, but it is very useful and efficient for their business and the planning of processing and reselling in particular. This type of contract is mostly based on reputation. The situation looks the same in the case of selling. Large numbers of rice millers (84.9 percent) are also inter-ested to sign a contract with customers. 67 Around 11 percent of the rice mills (they usually are small-scale millers) choose a random contact when they sell their product. This implies that the small-scale millers are less interested in con-tracts. In this case, those small rice millers look for large rice millers who offer higher prices. This situation exists when the small rice millers produce brown rice as raw material to supply the large millers/polishes. Since, the old milling machine of small millers can be used to produce good quality brown rice, 68 and most large millers specialize in polishing brown rice into polished rice for ex-port. Table 5.12 Common types of contract used by rice millers.
When purchasing When Selling Condition
Number of response
Percentage of the total
Number of response
Percentage of the total
1. Contract in advance 28 52.8 45 84.9
2. Non-contract 25 47.2 6 11.3
3. Others (*) 0 0.0 2 3.8
Total 53 100.0 53 100.0
Note: (*) Indirect contact through relatives, friends. Source: Own survey, 53 rice millers in the Mekong River Delta, 1999 – 2000.
67 Usually these are the SOEs and long distance wholesalers or transporters 68 To produce good quality brown rice it is not required to use modern milling machines

Chapter 5: Rice Trader Conduct in the Market
117
Rice retailers As mentioned in Chapter 4, rice retailers in this study were classified into two groups: small and large-scale based on the total capital invested in their busi-ness. The data revealed that on average, every month each small retailer sells around 2 tons of rice in the retail market (or 24 tons/year). The maximum vol-ume of rice sold can reach to 4 tons per month. However, for the smallest re-tailer, the volume of rice sold is just around 300 kg per month (or 3.6 tons/year). The average volume of rice sold by large-scale retailers is more than 10 tons per month (125 tons/year), it is a fivefold compared to a small retailer. Table 5.13 Volume of rice sold by rice retailers (Tons)
Volume of rice sold per retailer Indicator
Small scale (n=15) Large scale (n=15)
Mean 23.8 125.0
Max 48.0 360.0
Min 3.6 36.0
Coefficient of variation (*) [0.529] [0.881]
Note: (*) These figures were computed based on the results in Appendix 5.3 Source: Own survey, 30 rice retailers in the Mekong River Delta, 1999 – 2000. Table 5.14 Average number of suppliers and buyers that rice retailers is deal-
ing with each month
Number of suppliers Number of buyers Indicator
Total Regular Total Regular
Mean 6 2 24 15
Max 10 10 50 40
Min 1 0 10 4
Coefficient of variation [0.462] [1.505] [0.415] [0.768]
Note: The figures in this table only refer to total numbers of suppliers and consumers per month that rice retailers deal with.
Source: Own survey, 30 rice retailers in the Mekong River Delta, 1999 – 2000

The Organization of the Liberalized Rice Market in Vietnam
118
Table 5.15 Location of suppliers and buyers in the market of rice retailers
Place of purchasing Selling market Different locations Number of response
Percentage of the total
Number of response
Percentage of the total
1. In the local area (less than 10 km)
19 63.3 28 93.3
2. Other province – medium distance (from 10 – 100 km)
9 30.0 2 6.7
3. Other province – long dis-tance (greater than 100 km)
2 6.7 - -
Total 30 100.0 30 100.0
Source: Own survey, 30 rice retailers in the Mekong River Delta, 1999 – 2000 Table 5.16 Common types of contract used by rice retailers
When purchasing When Selling Condition Number of response
Percentage of the total
Number of response
Percentage of the total
1. Contract in advance 11 36.7 4 13.3
2. Non-contract 16 53.3 23 76.7
3. Others (*) 3 10.0 3 10.0
Total 30 100.0 30 100.0
Note: (*) Indirect contact through relatives, friends. Source: Own survey, 30 rice retailers in the Mekong River Delta, 1999 – 2000 Table 5.14, Table 5.15, and Table 5.16 present in more detail the buying and selling activities of the rice retailers. On average, the rice retailers buy rice from 6 different suppliers, of which only two are regular suppliers. More than 60 per-cent of the retailers say that they purchase most of the rice from wholesalers within a radius of 10 km. Only some large-scale retailers buy rice from whole-salers of other provinces (about 30 percent). In general, rice retailers feel free to buy rice from various suppliers. Table 5.16 shows that the way to buy from sup-pliers is mostly in terms of non-contract (53.3 percent).
The surveyed data shows that each retailer usually has at least 10 custom-ers. On average they have a total of 24 final consumers at the retail market, 69 of which, 15 are regular clients (See Table 5.14). Most of the consumers are lo-cated within a range of 10 km of the retailer’s residence (93.3 percent). More 69 The total number of transactions is not mentioned here as it was difficult for the retailers to estimate this figure.

Chapter 5: Rice Trader Conduct in the Market
119
than 76 percent of retailers randomly sell their product to consumers, only 13.3 percent of them sell to their clients on the basis of a contract. This situation ex-ists in the case of selling rice to restaurants, schools, and the university. On the whole, rice traders in the surveyed areas run their business in an open/free market. We observed some cases of rice millers/polishers who estab-lish a trading network with relatives (informal organization). They link their business to increase trading efficiency for the whole group. These cases usually exist among private rice millers or polishers who produce rice for export. They voluntarily group together and establish an informal network themselves. The members of this group usually are relatives, friends, and or family members. One group may include about 4 – 5 members located at the same market place. They can help each other with running their business in an efficient way. For example if some members within the group can’t supply enough volume of rice at a certain time to fulfil a contract with one of the SOEs, the other members in the network can help to overcome this situation by supplementing the deficit. They also exchange market information about prices, sources of buying and sell-ing products; borrowing transportation means. We also find another type of trading relationship between rice traders: so-called regular or fixed clients. That kind of clients can help the rice traders to ensure enough volume of rice supply or demand. For example, in the case of long-distance assemblers, they need to develop a good relationship with some regular local assemblers in order to ensure a stable supply. Vice-versa, the long-distance assemblers also try to retain a good relationship with some fixed rice mill-ers/polishers in order to guarantee demand for their products. Moreover, at the retail market, most of the rice retailers have established an informal network with some fixed wholesalers who are able to supply them a certain amount of rice every week/month. These wholesalers may also provide trade credit in terms of deferred payment (See also Section 5.4.5 for further explanation). In order to increase economic efficiency of the rice distribution system, trading networks or informal associations as mentioned above should be encouraged. Taking into account that the number of traders is quite large in most segments in the market, these types of cooperation do not hamper competition and therefore we conclude that these forms of inter-firm cooperation will improve market per-formance. In Chapter 6 we will show that this is an opportunity to reduce mar-keting costs.
The Organization of the Liberalized Rice Market in Vietnam
120
5.4 Marketing functions performed by rice traders Assemblers, millers, wholesalers, and retailers perform various vital marketing tasks in bringing products from the farm to the consumers. In Chapter 2 we dis-tinguished five major functions: storage/transportation, negotiation for selling, processing, market information, and financing. 70 5.4.1 Transportation and storage activity Transport is an essential element in the efficient operation of marketing systems because it enables the timely shipment of surpluses to deficit areas. A variety of modes of transportation are used to move paddy and rice, ranging from motor-cycles, cyclos (a three-wheeled pedal vehicle), to trucks, vans, and boats. Each mode selected depends on cost, geography, and timing.
In general, most of the rice traders in the Mekong River Delta do not de-pend heavily on roads to transport their products. It is very convenient to trans-port paddy/rice by boat, as there is a rich canal system in this area. Since 1998, checking points no longer exist at the borders of each province. Consequently, rice traders are free to deliver their paddy/rice everywhere they want. The road infrastructure in the Mekong Delta is being upgraded and together with the ex-isting canal system it creates a good condition for transport.
Rice traders can use their own transportation facilities or hire it. Mostly they use boats, trucks or vans to transport their products. Light to medium types of boats or trucks (capacity from 10 – 30 tons) are the most popular means of transport. Transportation by boat is cheaper than by any other means. Some marketing agents often use more than one means of transportation, especially in the Mekong River Delta where a boat and truck combination is common among the SOEs, rice millers and large-scale assemblers and wholesalers. At the retail market, some rice retailers use motorcycles to transport their products as well.
Overall, assemblers and wholesalers are the most important users of trans-portation means, while retailers are the least important. 89 percent of the surveyed assemblers and wholesalers (60/67) use some means of transportation for their business (See Table 5.17). This is not surprising since the assemblers and wholesalers’ critical task is to collect paddy/rice from different sources, while retailers are more sedentary. To transport paddy, the assemblers usually pour the paddy inside the boat, no need for package because they want to save space. However, when shipping the rice they have to make packages from 45 – 50 kg per piece, because the rice has to be protected carefully to avoid moisture and losses.
70 See Section 2.1.6 in Chapter 2 for further explanation

Chapter 5: Rice Trader Conduct in the Market
121
Table 5.17 presents in more detail the situation of paddy/rice transportation by traders. Most assemblers and wholesalers have their own transport facility and generally a boat with a capacity of 10 – 20 tons. This is the best way to organize transport as they are very flexible. Only 13 of the 53 surveyed rice millers own a boat or a truck to transport their products. In particular, large millers who pro-vide polished rice to SOEs for export usually rent transportation means from private transportation groups. In the case of rice retailers, only one third of the respondents have their own transportation facility, a small truck/van and a mo-torcycle is the main transportation means. Table 5.17 Average transportation cost for different rice traders
Indicator Unit Assembler wholesaler
Miller Retailer
1. No. of respondents who have their own transport facility
(No. of traders per total sam-
ple)
60/67
13/53 10/30
2. Means of owned transport • Boat • Truck or van • Motorcycle
(Number of responses)
54
6 0
9 4 0
0 6 4
3. Capacity of owned transport • Boat • Truck or van • Motorcycle
(Tons) 10 – 20
5 – 8 -
20 – 30
8 – 10 -
-
2 – 5 0.5 – 1
4. Average transport cost • Boat • Truck or van • Motorcycle
(Dong/ton) 32,000 50,000
-
24,000 45,000
-
-
30,000 10,000
5. Loading cost (Dong/ton) 4,000 6,000 5,000 6. Unloading cost (Dong/ton) 4,000 5,000 5,000 7. Others (*) (Dong/ton) 6,500 15,000 -
Note: - The average of transport cost, loading and unloading costs are roughly estimated based on the information from some key/representative traders in the survey. Because raw data on that kind of costs from each rice trader contained a lot of missing data. - Those kinds of costs are computed in the case of hiring transportation services from outside. (*) Other costs included losses in quantity and quality of rice; accommodation (foods, drinks,…); parking fees; extra payments for loading and un-loading groups.
Source: Own survey in the Mekong River Delta, 1999 – 2000.
As discussed in the previous section, most of the assemblers and wholesalers have to ship their paddy/rice to the market places within an average range of 100 km and the maximum distance of transportation is about 300 km. Rice retailers just provide the rice at the local market, within 10 km distance (See Table 5.15).
The transportation rates are different between long-distance shipments and local market shipments. In the case of hiring transportation services from outside, on average, between 50 –100 km distances, assemblers and wholesalers

The Organization of the Liberalized Rice Market in Vietnam
122
have to spend about 32,000 VND per ton if they transport by boat and 50,000 VND per ton if they use trucks. In the case of rice millers, the transportation costs varies from 24,000 VND to 45,000 VND per ton. 71 At the retail market, between 10 – 20 km distances, the transport cost is about 10,000 VND/ton by motorcycle and 30,000 VND/ton by van or lorry. Table 5.17 also shows some other kinds of cost that are involved in the transpor-tation activities. The loading and unloading fee is almost the same for every rice trader, it varies from 4,000 VND to 5,000 VND per ton. Specially, rice assem-blers and millers have to pay for service costs and also losses during the trans-port of their product. It is about 6,500 VND/ton for assemblers and 15,000 VND/ton for millers. The average percentage of paddy/rice losses during trans-port is about 0.1 – 0.2 percent. Another important function rice traders have, is storage. In storing, rice traders attach time utility to paddy/rice by distributing supplies evenly among many consumers over a certain period of time. With storage, rice traders try to bridge current paddy/rice production with future consumption and equalize the supply of seasonally grown crops throughout the year. Table 5.18 and Table 5.19 show that storing is done by a large majority of the interviewed rice millers. More than 67 percent of the interviewed rice millers said that they need to store paddy as well as rice while 33 percent have indicated they do not. On average, the rice millers store their product around one to three months. At the retail market, the situation looks the same. 80 percent of the rice retailers use storage in their business. In contrast, most rice assemblers and wholesalers (62.7 percent) did not store their products. The duration between buying to reselling their products is very short (one or two weeks). They only assemble before transferring paddy/rice to other traders in the market, therefore they do not pay attention on storing. Some major reasons for storage are summarized in Table 5.18. More than 50 percent of the millers said that they should store enough paddy in order to guar-antee their business running continuously throughout the year. Everyday, most rice mills need a certain amount of paddy as raw material for their processing. Roughly 20 percent of the rice millers store for speculative purpose. More than
71 The result in this study shows that, on average rice millers incur lower transportation cost per unit of product as compared with rice wholesalers (24,000 – 45,000 VND/ton compared with 32,000 – 50,000 VND/ton). The main reason is that transportation cost per unit of prod-uct highly depends on size of each shipment. In practice, rice millers usually transport large amount of rice for one shipment (around 20 – 30 ton by boat and 8 – 10 ton by truck, See Ta-ble 5.17). Therefore, they can reduce transportation cost per unit of product to lower rate as compared with wholesalers.

Chapter 5: Rice Trader Conduct in the Market
123
11 percent of the respondents, in particular large-scale millers, focus on storage, because they need to keep a certain amount of so-called “core rice” that is used for reproducing a suitable type of export rice. 72 Some rice assemblers and wholesalers focus more on speculative purposes when they store the paddy/rice (40 percent), and some of them try to store good quality of paddy/rice during the Winter-Spring crop. In contrast, rice retailers mostly use storage for reasons to reserve enough quantities of white rice for their business. As retail prices do not vary so much through time, they do not consider speculative behaviour. Table 5.18 Main reasons of storage paddy/rice by different rice traders
Assembler wholesaler
Miller Retailer Reason of storage
No. % No. % No. %
I. Number of rice traders who keep no stores 42/67 62.7 17/53 32.1 6/30 20.0
II. Number of rice traders who keep a stock with the main reason of storage:
25/67 37.3 36/53 67.9 24/30 80.0
1. Reserve in order to run the business con-tinuously
7/25 28.0 20/36 55.6 16/24 66.7
2. Speculative purpose (to expect higher price in next period)
10/25 40.0 7/36 19.4 - -
3. Storage “core rice” for mixing different types of rice
- - 4/36 11.2 - -
4. Obliged storage due to a lack of demand
- - 2/36 5.6 8/24 33.3
5. Reserve paddy/rice in a certain season to obtain good quality (Winter-Spring crop)
8/25 32.0 3/36 8.2 - -
Source: Own survey in the Mekong River Delta, 1999 – 2000 As shown in Table 5.19, rice millers own at least one storage room. Most of their warehouses are constructed of heavy material (cement or steel) with a ca-pacity of 1,000 tons on average. Particularly, there are some large millers who need to rent more extra spaces for storing their products during the peak season – usually in Winter-Spring crop. 73 The situation is different in the case of as-semblers, wholesalers and retailers, around 10 percent of them have their own warehouses, and mostly constructed of wood or light material. On average, the capacity of own storage of wholesalers and retailers is 15 tons and 5 tons, re-spectively. Most retailers (80 percent) use a room in their house, or shop, to keep their products. 72 Usually, large rice mills have to keep in storage 500 – 1,000 tons of 0 percent - 5 percent broken rice as “core rice”. This kind of “core rice” will be used to mix together with the other normal rice (25 percent to 30 percent broken rice) in order to reproduce 10 percent or 15 per-cent broken rice. 73 It is not a big problem to them. Since usually they can ask for some help from their friends and relatives who have available warehouse (free of charge). They also can rent extra spaces from state operated warehouses or private stores.
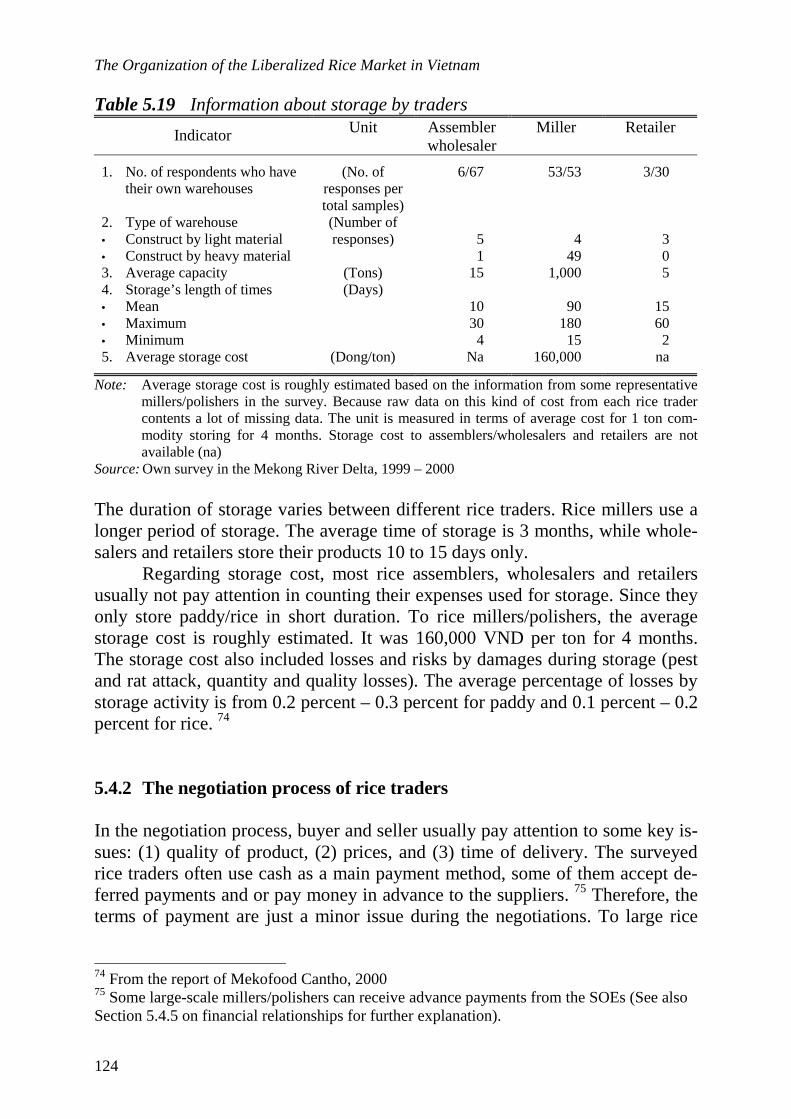
The Organization of the Liberalized Rice Market in Vietnam
124
Table 5.19 Information about storage by traders
Indicator Unit Assembler wholesaler
Miller Retailer
1. No. of respondents who have their own warehouses
(No. of responses per total samples)
6/67 53/53 3/30
2. Type of warehouse • Construct by light material • Construct by heavy material
(Number of responses)
5 1
4
49
3 0
3. Average capacity (Tons) 15 1,000 5 4. Storage’s length of times • Mean • Maximum • Minimum
(Days) 10 30 4
90
180 15
15 60 2
5. Average storage cost (Dong/ton) Na 160,000 na
Note: Average storage cost is roughly estimated based on the information from some representative millers/polishers in the survey. Because raw data on this kind of cost from each rice trader contents a lot of missing data. The unit is measured in terms of average cost for 1 ton com-modity storing for 4 months. Storage cost to assemblers/wholesalers and retailers are not available (na)
Source: Own survey in the Mekong River Delta, 1999 – 2000 The duration of storage varies between different rice traders. Rice millers use a longer period of storage. The average time of storage is 3 months, while whole-salers and retailers store their products 10 to 15 days only.
Regarding storage cost, most rice assemblers, wholesalers and retailers usually not pay attention in counting their expenses used for storage. Since they only store paddy/rice in short duration. To rice millers/polishers, the average storage cost is roughly estimated. It was 160,000 VND per ton for 4 months. The storage cost also included losses and risks by damages during storage (pest and rat attack, quantity and quality losses). The average percentage of losses by storage activity is from 0.2 percent – 0.3 percent for paddy and 0.1 percent – 0.2 percent for rice. 74
5.4.2 The negotiation process of rice traders In the negotiation process, buyer and seller usually pay attention to some key is-sues: (1) quality of product, (2) prices, and (3) time of delivery. The surveyed rice traders often use cash as a main payment method, some of them accept de-ferred payments and or pay money in advance to the suppliers. 75 Therefore, the terms of payment are just a minor issue during the negotiations. To large rice
74 From the report of Mekofood Cantho, 2000 75 Some large-scale millers/polishers can receive advance payments from the SOEs (See also Section 5.4.5 on financial relationships for further explanation).

Chapter 5: Rice Trader Conduct in the Market
125
millers/polishers and the SOEs, delivering the product in time is really important for fulfilling the export contract requirements.
The following tables present some major issues which rice traders focus on when they negotiate. In the case of assemblers and wholesalers, it is most important to offer a favorable price (average grading reaches to 2.627). Sec-ondly, they focus on the quality of paddy/rice and delivery in time. When they market their products, the assemblers and wholesalers also prefer to look for buyers who can offer a higher price and focus more on terms of negotiation (fast and easy to negotiate). Finally, for quite a large group of them close business re-lationships are important (See Table 5.20). Table 5. 20 Main issues that assemblers and wholesalers pay attention to when
they perform their business negotiations. Number of response on different levels Major issues
Not impor-
tant
Less important
Important Very important
Average grading(*)
I. Negotiating with suppliers
1. Regular clients 47 9 7 4 0.52
2. To be offered a nice price 4 1 11 51 2.63
3. To be delivered good product & in time 30 4 28 5 1.12
4. Fast and easy to communicate 51 1 11 4 0.52
II. Negotiating with buyers
1. Regular clients 38 8 7 14 0.96
2. To be offered a nice price 12 1 8 46 2.31
3. Getting money in advance 61 1 4 1 0.18
4. Fast and easy to communicate 32 6 26 3 1.00 Note: (*) Average grading was calculated based on number of response on different levels and by us-
ing Weighted average method. Grading for different levels - Not important: grade 0 - Less important: grade 1 - Important: grade 2 - Very important: grade 3 Then average grading was calculated as follows:
Example: Regular clients in Table 5.20: 523.0)47947(
)34()27()19()047(=
+++
+++ xxxx
Source: Own survey, 67 assemblers and wholesalers in the Mekong River Delta, 1999 – 2000 Continuing with the case of rice millers, Table 5.21 indicates that when collect-ing paddy/rice, close relationships with the suppliers and a good price are the main issues for the negotiations. In the case of selling, regular clients are impor-tant (1.811), second is the price level (1.623). It means that in order to increase the efficiency of their business, most of the rice millers should retain good rela-tionships with their clients. Especially, in the long run, they have to maintain at

The Organization of the Liberalized Rice Market in Vietnam
126
least 3 or 4 regular customers (mostly SOEs or private export agents) as we have seen in Section 5.3.2. Table 5. 21 Main issues that rice millers pay attention to when they perform
their business negotiations. Number of response on different levels Major issues
Not attention
Less important
Important Very important
Average grading(*)
I. Negotiating with suppliers
1. Regular clients 23 4 13 13 1.30
2. To be offered a nice price 10 2 14 27 2.09
3. To be delivered good product & in time 22 7 17 7 1.17
4. Fast and easy to communicate 40 3 9 1 0.45
II. Negotiating with buyers
1. Regular clients 15 2 14 22 1.81
2. To be offered a nice price 17 3 16 17 1.62
3. Getting money in advance 41 0 8 4 0.53
4. Fast and easy to communicate 28 13 11 1 0.72
Note: (*) Average grading was calculated as in Table 5.20. Source: Own survey, 53 rice millers in the Mekong River Delta, 1999 – 2000. Finally, the situation looks the same for rice retailers. They pay more attention to buying and selling prices (the average grading reaches to 2.167 and 2.400 – See Table 5.22). In the case of purchasing rice from the suppliers, the rice retail-ers buy regularly from the same wholesalers, in particular if they need trade credit from their wholesalers. 76 When they market their products, communica-tion skills are also important to rice retailers, because it can help them to get new customers and keep the existing clients.
76 See also Table 5.28 for further explanation.

Chapter 5: Rice Trader Conduct in the Market
127
Table 5.22 Some main issues that rice retailers pay attention to when they per-form their business negotiations
Number of response on different levels Major issues Not
attention Less
important Important Very
important Average grading(*)
I. Negotiating with suppliers
1. Regular clients 11 0 7 12 1.67
2. To be offered a nice price 4 1 11 14 2.17
3. To be delivered good product & in time 22 0 6 2 0.60
4. Fast and easy to communicate 28 0 1 1 0.17
II. Negotiating with consumers
1. Regular clients 14 7 4 5 1.00
2. Buying at fair price 3 0 9 18 2.40
3. Getting money in advance 30 0 0 0 0.00
4. Fast and easy to communicate 19 0 7 4 0.87
Note: (*) Average grading was calculated as in Table 5.20. Source: Own survey, 30 retailers in the Mekong River Delta, 1999 – 2000 5.4.3 Paddy/rice processing Assemblers and wholesalers who specialize in buying paddy and selling rice in the domestic market, usually transfer their paddy to the rice mills for milling. Most of the paddy is sold to the miller and subsequently rice is bought. Some of the paddy is milled on a commission basis. After milling they have to sort out the quality (C1 and C2) by themselves.
Rice millers/polishers fulfil the processing function. Normally, depending on the availability of rice milling or polishing machines, millers are classified into three groups: pure millers, polishers, and miller-polishers. Pure millers are millers without any polishing machines. Polishers are rice processors engaged only in polishing activities and do not mill paddy into white rice. They buy brown rice from other mills and process it further to polished rice usually for export. Moreover, polishers may receive brown rice from traders, they only process it into polished rice and collect the service cost for their activities. The polishers have an important function in the market because of the following rea-sons:
(1) During the wet season (Mua crop or Summer-Autumn crop), most paddy is processed to brown rice. This crop is suitable for storage and, therefore, part of it can be converted to polished rice later.
(2) From brown rice, a polisher can produce polished rice mainly for the export market.

The Organization of the Liberalized Rice Market in Vietnam
128
The third group of miller-polishers consists of millers having polishing ma-chines at their disposal. These are the most technologically complete mills, able to process paddy into a polished rice of high quality suitable for export.
In this study, depending on their daily processing capacity rice millers are further classified into two groups: small and large mills. Small mills have a daily processing rate less than 20 tons. Large mills have a daily processing rate over 20 tons.
As shown in Table 5.23, large mills and polishers involved in milling and polishing are older and have also older management staff with good experience on rice trading and processing. Polishers and small-scale millers entered the market more recently. Large-scale millers use more family labor to run the busi-ness. Table 5.23 General information on the surveyed rice millers
Characteristics Small scale Large scale
1. Number of millers interviewed 26 (49.1%) 27 (50.9%)
2. Average number of years in the business 8 20
3. Number of mills/polishing machines 1 – 2 3 – 4
4. Milling capacity (Tons/day) 2 – 20 50 – 150
5. Polishing capacity (Tons/day) 5 – 20 70 – 200
6. Storage capacity (Tons) 2 – 5 60 – 100
7. Permanent workers (number) 1 – 5 12 – 20
8. Family labor (number) 1 – 2 2 – 4
Source: Own survey in the Mekong River Delta, 1999 – 2000 The process of paddy/rice processing in the Mekong River Delta has been de-scribed in Chapter 4 (See Figure 4.1 in Section 4.2). Figure 5.1 below describes in more detail the process of milling and the “rate of return” or “conversion ra-tio” from paddy to white rice.
Compared to the milling process, the polishing process is easier. Most of the polishers use brown rice as raw material. They have to check the moisture degree of brown rice before polishing. During the polishing process, they can also control and adjust the machine in order to produce a certain type of broken rice and a degree of whiteness. The final product is a high quality polished rice, suitable for export.
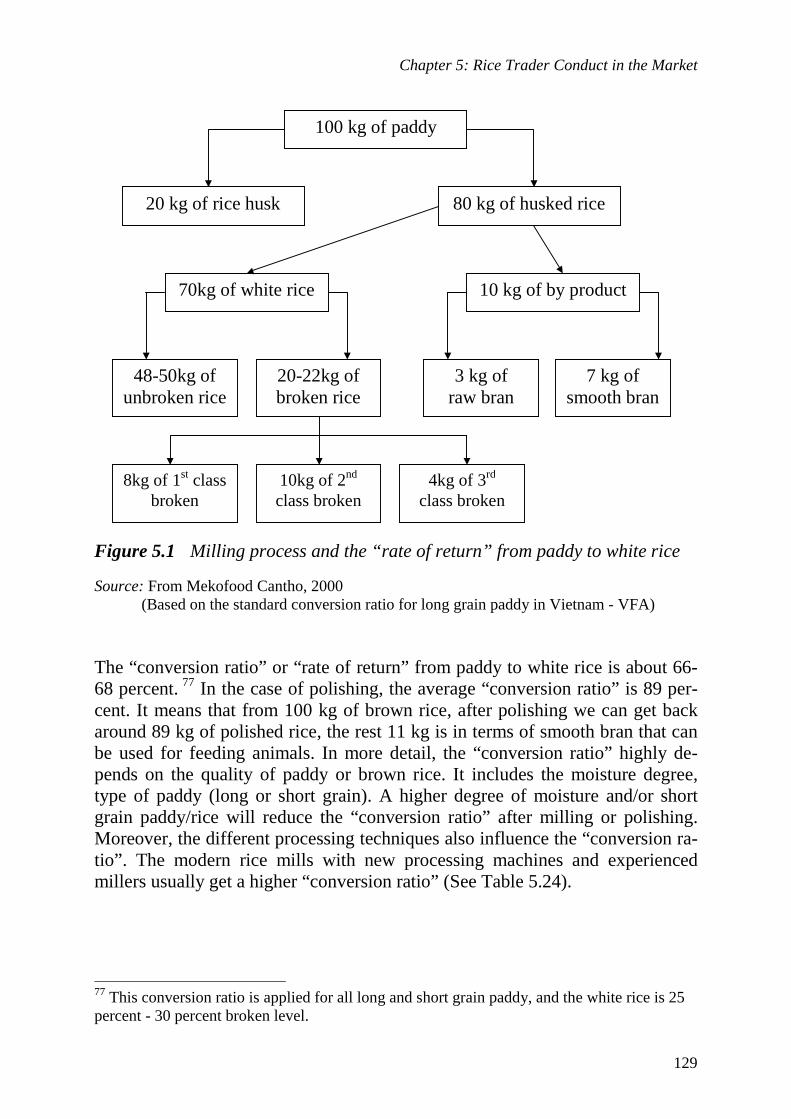
Chapter 5: Rice Trader Conduct in the Market
129
Figure 5.1 Milling process and the “rate of return” from paddy to white rice Source: From Mekofood Cantho, 2000
(Based on the standard conversion ratio for long grain paddy in Vietnam - VFA) The “conversion ratio” or “rate of return” from paddy to white rice is about 66-68 percent. 77 In the case of polishing, the average “conversion ratio” is 89 per-cent. It means that from 100 kg of brown rice, after polishing we can get back around 89 kg of polished rice, the rest 11 kg is in terms of smooth bran that can be used for feeding animals. In more detail, the “conversion ratio” highly de-pends on the quality of paddy or brown rice. It includes the moisture degree, type of paddy (long or short grain). A higher degree of moisture and/or short grain paddy/rice will reduce the “conversion ratio” after milling or polishing. Moreover, the different processing techniques also influence the “conversion ra-tio”. The modern rice mills with new processing machines and experienced millers usually get a higher “conversion ratio” (See Table 5.24).
77 This conversion ratio is applied for all long and short grain paddy, and the white rice is 25 percent - 30 percent broken level.
100 kg of paddy
20 kg of rice husk 80 kg of husked rice
70kg of white rice 10 kg of by product
7 kg of smooth bran
3 kg of raw bran
48-50kg of unbroken rice
20-22kg of broken rice
8kg of 1st class broken
10kg of 2nd class broken
4kg of 3rd class broken

The Organization of the Liberalized Rice Market in Vietnam
130
Table 5.24 The impact of different processing machines on the “conversion ratio”. The case of Meko-Food Cantho, Vietnam, 1998 (Percentage)
Number of observation Old mill Modern mill
1 35.44 50.62
2 45.99 50.04
3 50.80 53.38
4 40.00 52.32
5 33.51 49.10
6 33.81 52.90
7 40.00 51.74
8 33.69 51.05
9 31.84 50.91
10 46.06 51.22
11 39.11 48.83
12 42.47 50.50
13 47.56 49.95
Average 40.03 50.97
Source: Report of “conversion ratio” of 5 percent broken rice from the same kind of paddy, Meko Food Cantho. (From Tu, Phan Anh, SEBA, Under graduate thesis 1999).
5.4.4 Access to information in the market One of the main elements of success in marketing is access to information. To-gether with credits and access to capital, access to information is the main re-source that marketing agents need to conduct their operations. The data reveal that personal contacts are the main source of information. 78 Beside that, rice traders can get the information from radio, TV, and newspapers. Most large millers/polishers can get the information from the SOEs everyday by telephone or fax.
Different types of information are relevant to marketing agents. Undoubt-edly, information related to prices and regulations are among the most important types. When asked to indicate the most important source of information for the market prices of different kinds of paddy/rice, most rice traders still indicate per-sonal contacts. However, in the case of SOEs, and rice millers/polishers, they say that the telephone is the most important source of their information. There- 78 The direct contact between private traders or intermediaries in the channel of distribution. See also Section 4.4.4 in Chapter 4 for further explanation.

Chapter 5: Rice Trader Conduct in the Market
131
fore a great number of rice traders have telephones. As mentioned in an earlier section, some large rice millers/polishers belong to an informal rice trading or-ganization, they share the market information within their group.
As mentioned in Chapter 4, more than 70 percent of the surveyed rice traders find it very easy to get the information about the market. Very few mar-keting agents complain about the source of market information. On the whole, almost every rice trader in the Mekong River Delta has access to information about supply and demand conditions in the market. 5.4.5 The credit constraints & financial relationships between rice traders The results of our study on credit constraints show that in terms of the value of assets, there is a remarkable difference in access to credit for private companies and state-owned enterprises. Table 5.25 shows that most of assemblers, whole-salers and millers (26.8 and 32 percent respectively) obtain credit from the agri-cultural bank/state commercial bank. The second most important source is in-formal: loans from friends/relatives, moneylenders, and traders. Especially, in the case of assemblers and wholesalers, more than 25 percent of them answer that they borrow from the moneylenders. The rice retailers are mostly funded by their friends and relatives, or they receive credit from rice wholesalers. Con-versely, rice millers receive loans more frequently from the agricultural bank. Minot and Goletti (1996) claim that in general, state-owned enterprises obtain loans from the state-owned agricultural bank. However, the SOEs in the south-ern part of the country rely mostly on the state commercial banks. This can be explained by the fact that the economy of the southern part of Vietnam is more developed and state-owned enterprises are involved in export activities. Re-markably, a significant number of traders do not use any external funds to fi-nance their business. Table 5.25 Sources of funds for rice traders
Assemblers/ wholesalers
Millers Retailers Sources of funds
No. % No. % No. % 1. State commercial bank 18 26.8 17 32.0 0 0.0 2. Non-state commercial bank 3 4.5 2 3.8 1 3.4 3. Moneylenders 17 25.4 3 5.8 2 6.7 4. Friend and relatives 10 14.9 9 17.0 4 13.3 5. Trade credit (*) 2 3.0 4 7.5 3 10.0 6. No borrowing 17 25.4 18 33.9 20 66.6
Total 67 100.0 53 100.0 30 100.0
Note: (*) Trade credit includes two main types: receive money in advance and deferred payment Source: Own survey, 150 rice traders in the Mekong River Delta, 1999 – 2000

The Organization of the Liberalized Rice Market in Vietnam
132
Table 5.26 Amounts borrowed by rice traders Assemblers/ Wholesalers
Millers Retailers Sources of funds
Average amount
borrowed (Thou-sand
VND)
Monthly interest
rate (%)
Average amount
borrowed (Thou-sand
VND)
Monthly interest
rate (%)
Average amount
borrowed (Thou-sand
VND)
Monthly interest
rate (%)
1. State commercial bank
12,000 (n = 18)
0.75 196,000 (n = 17)
0.75 - -
2. Non-State com-mercial bank
7,000 (n = 3)
1.20 150,000 (n = 2)
0.85 10,000 (n = 1)
1.20
3. Moneylenders 11,400 (n = 17)
4.50 30,000 (n = 3)
2.00 2,000 (n = 2)
5.00
4. Friend and rela-tives
10,000 (n = 10)
2.00 100,000 (n = 9)
1.25 5,000 (n = 4)
2.50
Note: - The figures on average amount borrowed are roughly estimated based on some respondents of the survey. - Moneylenders are professional lending money, but friends and relatives just are amateur lend-ing money.
Source: Own survey, 150 rice traders in the Mekong River Delta, 1999 – 2000 Table 5.26 presents the amounts of money borrowed by different rice traders. Rice millers borrow quite large amounts of money (150 to 200 million VND) from state and non-state commercial banks. The amounts generally borrowed by wholesalers, assemblers and retailers are relatively small.
The monthly interest rate for borrowing from state banks and commercial banks is mostly the same, it varies from 0.75 percent to 1.20 percent, depending on the duration of the loan. In the case of borrowing from moneylenders, “hot-lending”, the interest rate can reach 10 percent. Other informal sources concern friends and relatives. They usually offer a favorable interest rate (1.75 percent to 2.5 percent). Of course this interest rate is higher than the state banks but most rice traders prefer to borrow from informal sources. Since the condition for bor-rowing is much more flexible if compared to the state banks (See Table 5.27). Most state banks and commercial banks require business plans and collateral. In contrast, the private lenders focus more on the profitability and the relationships with rice traders.
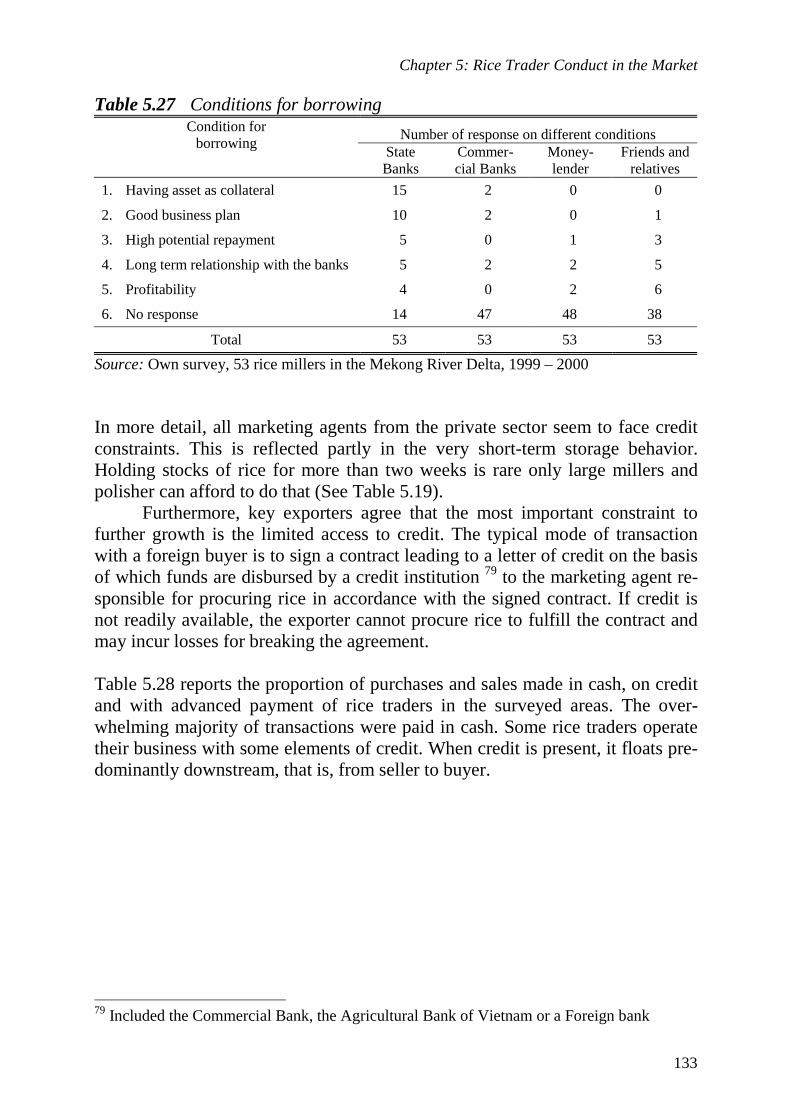
Chapter 5: Rice Trader Conduct in the Market
133
Table 5.27 Conditions for borrowing
Number of response on different conditions Condition for borrowing
State Banks
Commer-cial Banks
Money-lender
Friends and relatives
1. Having asset as collateral 15 2 0 0
2. Good business plan 10 2 0 1
3. High potential repayment 5 0 1 3
4. Long term relationship with the banks 5 2 2 5
5. Profitability 4 0 2 6
6. No response 14 47 48 38
Total 53 53 53 53
Source: Own survey, 53 rice millers in the Mekong River Delta, 1999 – 2000 In more detail, all marketing agents from the private sector seem to face credit constraints. This is reflected partly in the very short-term storage behavior. Holding stocks of rice for more than two weeks is rare only large millers and polisher can afford to do that (See Table 5.19).
Furthermore, key exporters agree that the most important constraint to further growth is the limited access to credit. The typical mode of transaction with a foreign buyer is to sign a contract leading to a letter of credit on the basis of which funds are disbursed by a credit institution 79 to the marketing agent re-sponsible for procuring rice in accordance with the signed contract. If credit is not readily available, the exporter cannot procure rice to fulfill the contract and may incur losses for breaking the agreement. Table 5.28 reports the proportion of purchases and sales made in cash, on credit and with advanced payment of rice traders in the surveyed areas. The over-whelming majority of transactions were paid in cash. Some rice traders operate their business with some elements of credit. When credit is present, it floats pre-dominantly downstream, that is, from seller to buyer.
79 Included the Commercial Bank, the Agricultural Bank of Vietnam or a Foreign bank

The Organization of the Liberalized Rice Market in Vietnam
134
Table 5.28 Information on financial relationships between rice traders
Rice marketing agent
Assemblers/ Wholesalers
Millers Retailers
Means of payments
No. of obser-vation
Percentage of total No. of observa-
tion
No. of observa-
tion
Percentage of total No. of observa-
tion
No. of observa-
tion
Percentage of total No. of observa-
tion
I. Apply when purchasing 67 100.0 53 100.0 30 100.0
1. Advanced payment
1 1.5 4 7.6 0 0.0
2. Deferred payment (1 or 2 weeks after delivery)
2 3.0 0 0.0 8 36.3
3. Payment by cash 64 95.5 49 92.4 22 63.7
II. Apply when selling 67 100.0 53 100.0 30 100.0
1. Advanced payment by buyers
2 3.0 12 22.6 0 0.0
2. Deferred payment (1 or 2 weeks after delivery)
13 19.4 1 1.9 10 33.3
3. Payment by cash 52 77.6 40 75.5 20 66.7
Source: Own survey, 150 rice traders in the Mekong River Delta, 1999 – 2000 When purchasing products, most of the assemblers and wholesalers and millers pay in cash (from 92 percent to 95 percent of the total). Only rice retailers can buy on credit from their suppliers (mostly wholesalers). This type of credit rela-tionship is popular among large retailers. Since their business is more stable, they have their own retail shops/stalls, some fixed assets, and may have a good reputation in the market. Therefore, the suppliers can easily give credit to them. When selling, around 30 percent of the rice retailers receive payment in advance from their clients (usually restaurants, schools or university, and state workers).
Table 5.28 also indicates that when selling rice to the market, around 22 percent of the rice millers can get money in advance from their clients who mostly are export agents or SOEs. This kind of credit assures that rice millers will provide products in time and retain a close relationship with their clients. In particular some large rice mills, having a good reputation, make use of these loans. Their businesses are more stable and their fixed assets are big enough to ensure repayment in case of breach of contract. Asking further about the main conditions that are important when one trader is willing to grant credit to the others, most of the surveyed traders of this study emphasize that the reputation of their regular clients is the most important condi-tion. Secondly, close relationships also play an important role as rice suppliers

Chapter 5: Rice Trader Conduct in the Market
135
virtually never grant trade credit to buyers on the first transaction. Through past transactions trust is build up gradually. We conclude that intensive financial relationships only exist in some cases of large-scale traders, owning important fixed assets and having a good reputation in the market. In particular some large millers/polishers can get credit in ad-vance from the SOEs or export agents. For them trade credit is used as quantities are large and timeliness is important. At the retail market, we also observed some large wholesalers selling on credit to retailers and, subsequently, retailers providing credit to their clients. 5.5 Conclusions The main objective of this chapter is to characterize the behaviour of various rice traders in the market. Most of the rice traders are fairly young (30 – 45 years old). The rice millers were older and more experienced (14 years on aver-age). The majority of the intermediaries are men. Women usually dominate the retail business. Most of the rice traders prefer to use their own family members in running the business, especially for management, book keeping, finance, and buying-selling activity. The degree of specialization in rice trading is high, in particular rice millers tend to be more specialized than other traders. Rice wholesalers and millers need large amounts of fixed capital for buying their own transport, storage facilities, milling, drying machines. They also need quite large amounts of working capital for their trading. The various rice traders in this study perform different marketing functions: transportation, storage, negotiation for selling, processing, market information, and financing. In particular boats are used as a preferred means of transport. The distance of transportation is within an average range of 100 km in the case of as-semblers and wholesalers. On average, rice millers/polishers transport their product more than 160 km. At the retail market, rice retailers just transport their product within 10 km distance. Most assemblers and wholesalers and more than 25 percent of the rice millers/polishers have their own transport facilities. Trad-ers also use public transport facilities (private transporters and co-operatives). Transport costs are lower for large traders as their shipments often concern large amounts. Storage is an important activity for rice millers/polishers. They store paddy or brown rice in order to guarantee regular supplies to their processing plant. Stor-age for speculative purpose seems not important to rice traders.

The Organization of the Liberalized Rice Market in Vietnam
136
In the negotiation process, most rice traders stress the importance of the quality and the price of the product. Terms of payment seem not important, because the surveyed traders normally pay cash. The negotiation process between large rice millers/polishers and SOEs is quite formal. They often have to sign a business contract. In contrast, most traders simply discuss the conditions on the spot. For some traders recurrent trade relationships are important as transaction costs may be reduced (save time and money).
In general, there are three different types of rice millers: pure millers (without polishing), polishers (specialize on polishing only), and millers-polishers. Small and large rice mills in this study specialize in different process-ing functions. The buying and selling volumes of the large rice mills are double as compared with the small rice mills. More than 50 percent of the large rice mills specialize in rice polishing, while 100 percent of the surveyed small rice mills specialize in rice milling. Small millers collect paddy from rice farmers and, after processing, brown rice is sold to large millers. Sometimes, rice millers and polishers do not own the product that they process and just collect a process-ing fee. Trade relationships between long-distance wholesalers and their clients are im-portant to guarantee regular suppliers as well as buyers. Informal trading net-works also share market information among members of the network. Personal contacts are the main source of information. Public media are also important sources. Information related to prices and market regulations are among the most important to rice traders. Financial relationships mainly exist between rice wholesalers and retailers; and between rice millers/polishers and the SOEs. The rice wholesalers can give credit to the rice retailers in terms of deferred payment. In contrast, the rice mill-ers/polishers can receive money in advance from the SOEs. In summary, rice traders in this study run their business in an open/free market. They are flexible and deliberately decide which suppliers they use and which customers they will serve. The relationship between them is mostly based on reputation and trust. Most transactions take place on the spot but others develop business relationships, however, they are fully free to establish that kind of rela-tion.
Chapter 6. Rice Market Performance Analysis 6.1 Introduction As mentioned in Chapter 2, market performance refers to economic results that include effectiveness, equity, productivity and profitability. In this chapter, rice market performance will be examined along several dimensions: (1) Measuring effectiveness of the existing marketing channels. Testing whether the existing marketing channels offer proper service outputs or the right services in relation to consumer preferences, (2) Analyzing marketing costs, price margins and prof-itability among the different rice marketing activities in order to measure the de-gree of rice marketing efficiency; and (3) Through temporal price analysis to ex-amine to what extent price patterns on different market-places cohere (See also Section 2.4.2 and Section 2.4.3 in Chapter 2).
Based on the primary and secondary data, the average price at different market levels will be estimated. Then the average price margins for different types of rice traders will be computed. The percent share of each cost item for each type of rice trader will be calculated. Market integration analysis will be used to measure the degree of price variation between different surveyed rice markets. Trend and seasonal price fluctuation are also considered.
6.2 The effectiveness of rice marketing channels The effectiveness of the marketing channel is assessed by examining how well the marketing channels meet consumers’ and producers’ demand for services in relation to their preferences. In a properly functioning market, marketing chan-nels have to guarantee that consumers can buy and producers can sell their products at reasonable prices in a market place; they have to balance supply and demand in each market segment at any time. In this study, the effectiveness of rice marketing channels is mainly assessed by different services that the chan-nels have offered in the market in order to maximize consumer satisfaction: as-sembling, distribution (exchange functions); storage, transport (physical func-tions); grading, financing (facilitating functions). Regarding the major tasks of the rice market: assembling and distribution, the results of the marketing channel analysis in Chapter 4 indicated that a number of different marketing channels exist to serve rice farmers (producers) and final consumers. Both private and government channels supply the domestic and for-eign markets. Moreover, barriers to entry that hamper the price formation proc-ess in the market were not detected.
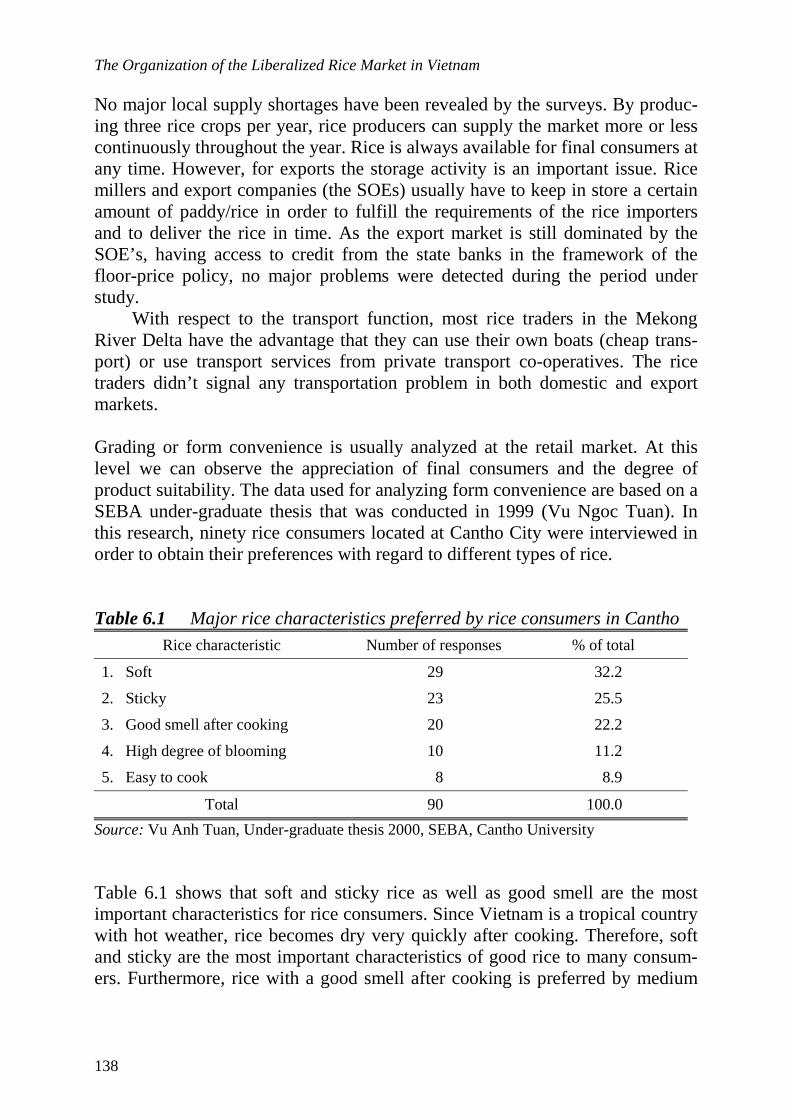
The Organization of the Liberalized Rice Market in Vietnam
138
No major local supply shortages have been revealed by the surveys. By produc-ing three rice crops per year, rice producers can supply the market more or less continuously throughout the year. Rice is always available for final consumers at any time. However, for exports the storage activity is an important issue. Rice millers and export companies (the SOEs) usually have to keep in store a certain amount of paddy/rice in order to fulfill the requirements of the rice importers and to deliver the rice in time. As the export market is still dominated by the SOE’s, having access to credit from the state banks in the framework of the floor-price policy, no major problems were detected during the period under study.
With respect to the transport function, most rice traders in the Mekong River Delta have the advantage that they can use their own boats (cheap trans-port) or use transport services from private transport co-operatives. The rice traders didn’t signal any transportation problem in both domestic and export markets. Grading or form convenience is usually analyzed at the retail market. At this level we can observe the appreciation of final consumers and the degree of product suitability. The data used for analyzing form convenience are based on a SEBA under-graduate thesis that was conducted in 1999 (Vu Ngoc Tuan). In this research, ninety rice consumers located at Cantho City were interviewed in order to obtain their preferences with regard to different types of rice. Table 6.1 Major rice characteristics preferred by rice consumers in Cantho
Rice characteristic Number of responses % of total
1. Soft
2. Sticky
3. Good smell after cooking
4. High degree of blooming
5. Easy to cook
29
23
20
10
8
32.2
25.5
22.2
11.2
8.9
Total 90 100.0
Source: Vu Anh Tuan, Under-graduate thesis 2000, SEBA, Cantho University Table 6.1 shows that soft and sticky rice as well as good smell are the most important characteristics for rice consumers. Since Vietnam is a tropical country with hot weather, rice becomes dry very quickly after cooking. Therefore, soft and sticky are the most important characteristics of good rice to many consum-ers. Furthermore, rice with a good smell after cooking is preferred by medium

Chapter 6: Rice Market Performance Analysis
139
and high income consumers. To low income consumers, high degree of bloom-ing of rice after cooking is also important (Tuan, Vu Anh 2000). Table 6.2 Major rice varieties marketed by rice retailers in Cantho
Rice quality Percentage of total sales (%)
1. Motbui
2. Tainguyen
3. IR64
4. Jacksmint
5. Nangthom
6. Others
36.6
28.3
25.2
5.8
3.1
1.0
Total 100.0
Source: Vu Anh Tuan, Under-graduate thesis 2000, SEBA, Cantho University On the supply side, the figures in Table 6.2 indicate that rice producers/farmers and traders in the market try to offer suitable types of quality rice to satisfy the consumer preferences. As mentioned in Section 3.3.4 in Chapter 3, Motbui, Tainguyen, and IR64 are the most popular varieties that rice producers/farmers grow and supply in the market. These kinds of varieties have good characteris-tics such as soft, sticky, and blooming, that satisfy the preferences of rice con-sumers (See Table 6.1). Nangthom and Jacksmint are very good rice varieties with a good smell after cooking. This meets the demand of medium and high-income consumers. By comparing Table 6.1 and Table 6.2 we can conclude that the channel of rice distribution is quite effective in providing the form and qual-ity of rice to satisfy consumer preferences. However, if we link this result with the previous discussion about the assortment of paddy/rice quality in Chapter 3 and Chapter 4 we can see that at the farm gate, wholesale, and retail level, the grading standard of paddy/rice quality is not consistent. At the farm gate, rice farmers cultivate many kinds of rice varieties (See Section 3.3.4 in Chapter 3). At the wholesale markets, rice wholesalers, millers, and exporters only classify rice into two kinds: C1 and C2 quality (See Section 4.4.3 in Chapter 4). It means that the existing wholesale grading system for rice qualities is somewhat biased. This grading system reflects the preferences of the export market. However, re-tailers sort white rice in many qualities to meet consumer preferences (as dis-cussed above). They assume their marketing functions of sorting out and as-sortment. As long as major rice varieties fulfil the preferences of consumers no problems will occur. However, if further specialization reduces the supply of these varieties a higher price premium may be necessary to encourage farmers to produce these varieties.
The Organization of the Liberalized Rice Market in Vietnam
140
In practice, rice retailers in the Mekong River Delta usually sell rice to consum-ers by kilogram without packaging. 80 Some high quality rice such as Nang huong, Nang thom, Jacksmint is sold in 5 or 10 kilogram bags. This form of product is very convenient to consumers. 81
Other rice consumers such as restaurants, schools/universities, and state organizations receive sale services from the rice wholesalers in terms of free de-livery of the product to their places. The rice wholesalers usually contact and negotiate with wholesale consumers by telephone and deliver a suitable type of rice with free transport service. Some households that consume large amounts of rice (more than 100 kg per month) also receive free transport services from the rice wholesalers and or retailers.
Finally, regarding the finance function, this study found that in particular large-scale traders face credit constraints. Most private rice traders borrow money from informal sources such as friends, relatives or private moneylenders. In sum, the rice marketing channels in Vietnam are organized quite effectively. Rice farmers and traders in the channels try to offer convenient forms of product and good services to final consumers. The effectiveness of the domestic rice marketing channels is quite satisfactory, except the constrained access to credit is a barrier for many private traders for further development of the business. 6.3 Marketing costs and margin analysis The marketing margin refers to the difference between prices at different levels in the marketing system. The total marketing margin is the difference between what the consumer pays and what the producer/farmer receives for his paddy or rice, in other words it is the difference between retail price and farm price. A wide margin means usually high prices to consumers and low prices to produc-ers. The total marketing margin may be subdivided into different components: all the costs of marketing services and the profit margins or net returns. The cost of marketing includes all the costs involved in the creation of place, time, and form utilities. Such costs should be recovered plus a reasonable return to investment. Costs vary depending upon the services rendered. The marketing costs usually include wages as return to labour; interest as return to borrowed capital; rent as return to land and buildings; and profit as return to entrepreneurship and risk capital. An analysis of marketing costs would estimate how much expenses are incurred for each marketing activity. It would also compare marketing costs in-curred by different actors in the channel of distribution. 80 Normally, it varies from 5 to 20 kilograms per transaction. 81 See also Section 5.3.1 in Chapter 5 for further explanation.
Chapter 6: Rice Market Performance Analysis
141
Paddy/rice marketing margins or profit margins are computed as follows (See also section 2.4.3):
In this study, rice marketing costs and margins incurred by different rice traders in one channel will be estimated, channel 6 in table 4.16 (Farmers – Assemblers – Millers – Wholesalers – Retailers – Consumers). This channel is the most im-portant channel in domestic rice markets (See Section 4.5.2 and Table 4.16). 6.3.1 Marketing costs of different rice traders In total 18 rice assemblers, 49 rice wholesalers, 53 rice millers/polishers, and 30 rice retailers were interviewed. Different types of marketing costs related to the latest transaction of rice assemblers, and marketing costs related to the last month of business of rice wholesalers, millers/polishers, and retailers were re-corded. This information on marketing costs allowed us to calculate the average marketing cost.82 Table 6.3 shows that the operating costs of rice assemblers are on average 46,500 or 76,000 VND/ton of paddy/rice dependent on the type of transport used. The most important cost item is transportation. It is about 65 percent to 68 percent of the total expenses. The transportation cost by truck is quite high as compared to transport by boat. The rice assemblers usually pay the costs for loading and un-loading. These costs do not vary that much: 4,000 – 6000 VND/ton. The rice assemblers also take into account some losses (quantity and quality reduction of paddy/rice) and other service costs during each shipment. 83 In case of transport by truck, the service costs are usually higher than those of transport by boat. Marketing costs of rice wholesalers are summarized in Table 6.4. On average, the total marketing costs of rice wholesalers are 115,000 VND per ton. Labour costs and material costs such as water, fuel, electricity are the highest cost items (24 – 25 percent of the total costs). Other important cost items concern transpor-tation and some other costs like interest on borrowed capital, losses and depre-ciation on equipment and the warehouse. The rice wholesalers also have to pay the business tax and a license fee. At the start of their business they have to pay
82 The average marketing cost of different rice traders in this section are computed for the same paddy/rice quality (25 percent broken). 83 It includes parking fee, fee for ferry boat, etc.
Profit margin of each type
of rice trader
Total marketing margin of each
type of rice trader
Marketing cost of each type of
rice trader =
_
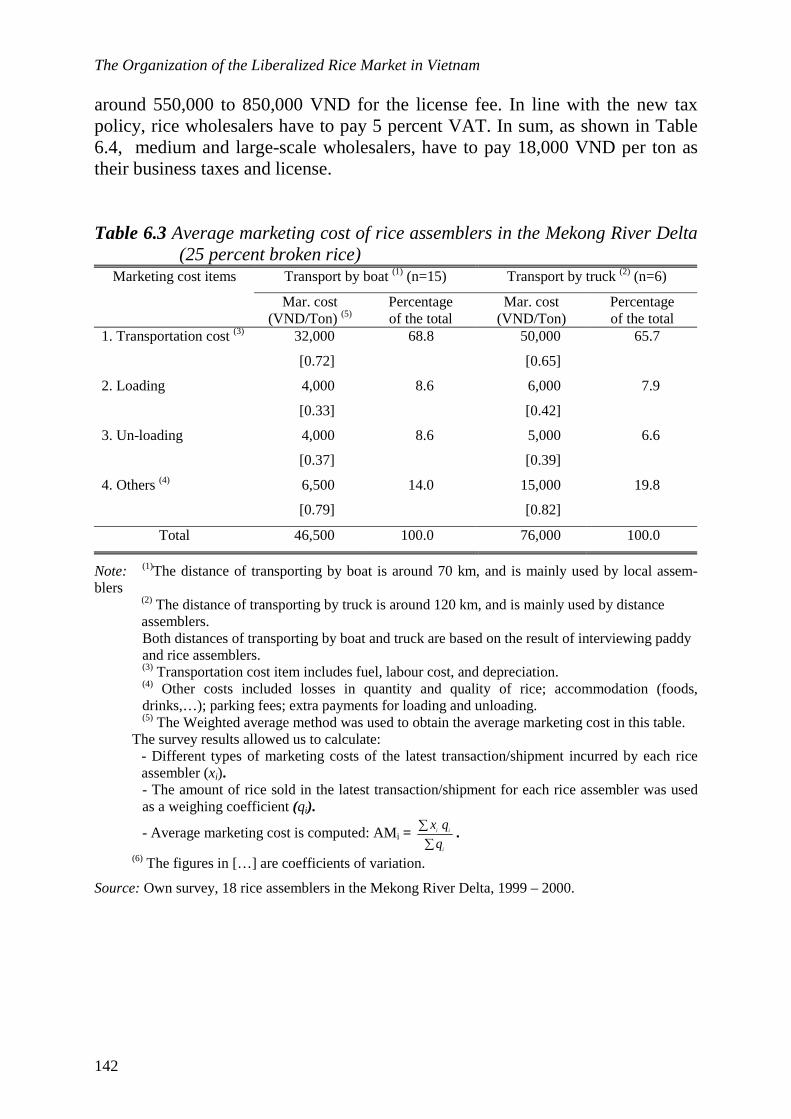
The Organization of the Liberalized Rice Market in Vietnam
142
around 550,000 to 850,000 VND for the license fee. In line with the new tax policy, rice wholesalers have to pay 5 percent VAT. In sum, as shown in Table 6.4, medium and large-scale wholesalers, have to pay 18,000 VND per ton as their business taxes and license. Table 6.3 Average marketing cost of rice assemblers in the Mekong River Delta
(25 percent broken rice) Transport by boat (1) (n=15) Transport by truck (2) (n=6) Marketing cost items
Mar. cost (VND/Ton) (5)
Percentage of the total
Mar. cost (VND/Ton)
Percentage of the total
1. Transportation cost (3) 32,000
[0.72]
68.8 50,000
[0.65]
65.7
2. Loading 4,000
[0.33]
8.6 6,000
[0.42]
7.9
3. Un-loading 4,000
[0.37]
8.6 5,000
[0.39]
6.6
4. Others (4) 6,500
[0.79]
14.0 15,000
[0.82]
19.8
Total 46,500 100.0 76,000 100.0
Note: (1)The distance of transporting by boat is around 70 km, and is mainly used by local assem-blers (2) The distance of transporting by truck is around 120 km, and is mainly used by distance
assemblers. Both distances of transporting by boat and truck are based on the result of interviewing paddy and rice assemblers. (3) Transportation cost item includes fuel, labour cost, and depreciation. (4) Other costs included losses in quantity and quality of rice; accommodation (foods, drinks,…); parking fees; extra payments for loading and unloading. (5) The Weighted average method was used to obtain the average marketing cost in this table.
The survey results allowed us to calculate: - Different types of marketing costs of the latest transaction/shipment incurred by each rice
assembler (xi). - The amount of rice sold in the latest transaction/shipment for each rice assembler was used as a weighing coefficient (qi).
- Average marketing cost is computed: AMi = ∑∑
i
ii
q
qx.
(6) The figures in […] are coefficients of variation.
Source: Own survey, 18 rice assemblers in the Mekong River Delta, 1999 – 2000.
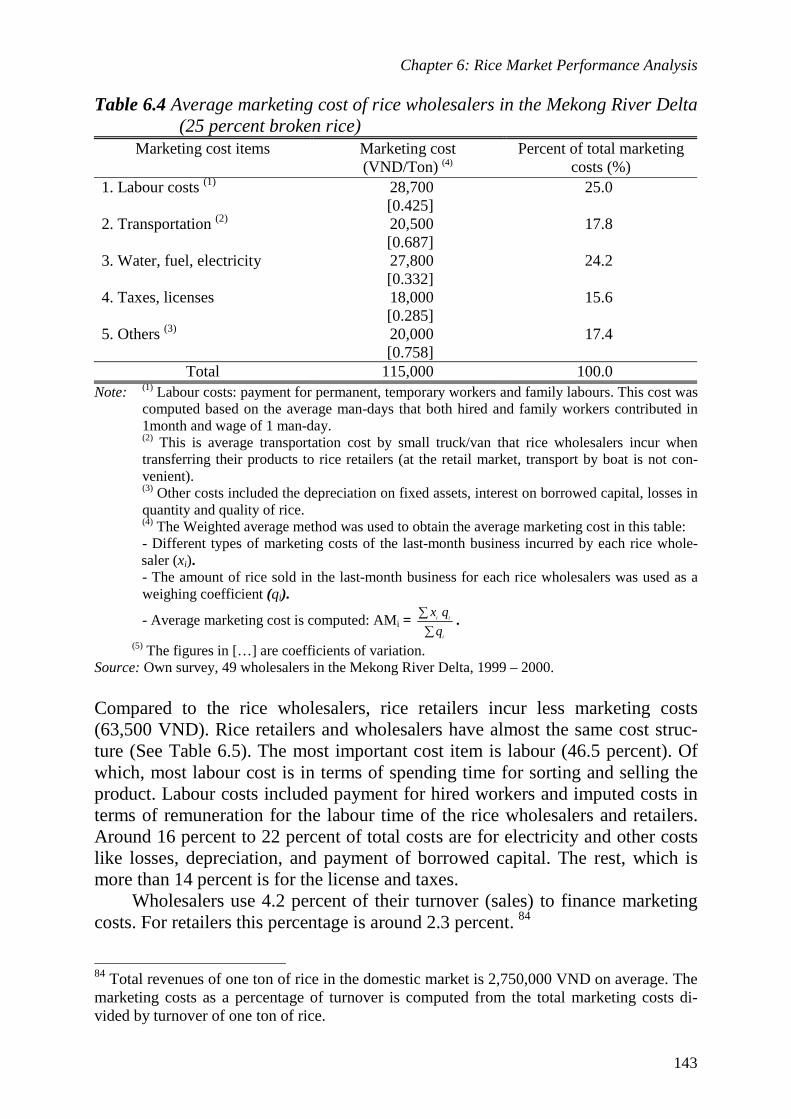
Chapter 6: Rice Market Performance Analysis
143
Table 6.4 Average marketing cost of rice wholesalers in the Mekong River Delta (25 percent broken rice)
Marketing cost items Marketing cost (VND/Ton) (4)
Percent of total marketing costs (%)
1. Labour costs (1) 28,700 [0.425]
25.0
2. Transportation (2) 20,500 [0.687]
17.8
3. Water, fuel, electricity 27,800 [0.332]
24.2
4. Taxes, licenses 18,000 [0.285]
15.6
5. Others (3) 20,000 [0.758]
17.4
Total 115,000 100.0 Note: (1) Labour costs: payment for permanent, temporary workers and family labours. This cost was
computed based on the average man-days that both hired and family workers contributed in 1month and wage of 1 man-day. (2) This is average transportation cost by small truck/van that rice wholesalers incur when transferring their products to rice retailers (at the retail market, transport by boat is not con-venient). (3) Other costs included the depreciation on fixed assets, interest on borrowed capital, losses in quantity and quality of rice. (4) The Weighted average method was used to obtain the average marketing cost in this table: - Different types of marketing costs of the last-month business incurred by each rice whole-saler (xi). - The amount of rice sold in the last-month business for each rice wholesalers was used as a weighing coefficient (qi).
- Average marketing cost is computed: AMi = ∑∑
i
ii
q
qx.
(5) The figures in […] are coefficients of variation. Source: Own survey, 49 wholesalers in the Mekong River Delta, 1999 – 2000.
Compared to the rice wholesalers, rice retailers incur less marketing costs (63,500 VND). Rice retailers and wholesalers have almost the same cost struc-ture (See Table 6.5). The most important cost item is labour (46.5 percent). Of which, most labour cost is in terms of spending time for sorting and selling the product. Labour costs included payment for hired workers and imputed costs in terms of remuneration for the labour time of the rice wholesalers and retailers. Around 16 percent to 22 percent of total costs are for electricity and other costs like losses, depreciation, and payment of borrowed capital. The rest, which is more than 14 percent is for the license and taxes.
Wholesalers use 4.2 percent of their turnover (sales) to finance marketing costs. For retailers this percentage is around 2.3 percent. 84
84 Total revenues of one ton of rice in the domestic market is 2,750,000 VND on average. The marketing costs as a percentage of turnover is computed from the total marketing costs di-vided by turnover of one ton of rice.

The Organization of the Liberalized Rice Market in Vietnam
144
Table 6.5 Average marketing cost of rice retailers in the Mekong River Delta (25 percent broken rice)
Marketing cost items Marketing cost (VND/Ton) (4)
Percent of total marketing costs (%)
1. Labor costs (1) 29,500 [0.328] (5)
46.5
2. Fuel, water and electricity (2) 14,500 [0.457]
22.8
3. Taxes, licenses 8,900 [0.425]
14.2
4. Others (3) 10,600 [0.773]
16.5
Total 63,500 100.0
Note: (1) Labour costs: payment for permanent, temporary workers and family labours. This cost was computed based on the average man-days that both hired and family workers contributed in 1month and wage of 1 man-day. (2) Fuel was used for the motorbike of the retail shop to deliver rice to final consumers.
(3) Other costs included the depreciation on fixed assets, interest on borrowed capital, losses in quantity and quality of rice.
(4) The Weighted average method was used to obtain the average marketing cost in this table: - Different types of marketing costs of the last-month business incurred by each rice retailer (xi). - The amount of rice sold in the last-month business for each rice retailer was used as a weigh-ing coefficient (qi).
- Average marketing cost is computed: AMi = ∑∑
i
ii
q
qx
(5) The figures in […] are coefficients of variation. Source: Own survey, 30 rice retailers in the Mekong River Delta, 1999 - 2000
The figures in Table 6.6 present the marketing costs of rice millers and polish-ers. On average, milling one ton of paddy (usually 25 percent broken rice) costs about 53,000VND. In the case of polishing from brown rice to polished rice, to-tal costs are 68,000 VND/ton. The major cost items are fuel and electricity used for operating the machines; payment for temporary and permanent labourers; material costs (mostly in terms of bags for packing finished products); deprecia-tion and maintenance of milling/polishing machines and equipment; taxes and license fees.
Table 6.6 also indicates that in general, the processing cost structure for both rice millers and polishers are similar. Fuel/electricity and payment for workers are the major cost items (ranging from 25 percent to 38 percent). How-ever, rice polishers have higher labour and material costs compared to rice mill-ers. The reason is that polished rice, after polishing, has to be packed in a stan-dard export package. It requires, therefore, more material and labour for process-

Chapter 6: Rice Market Performance Analysis
145
ing. Moreover, the process of rice polishing is more strict as compared to rice milling, 85 which means quite a high payment for permanent workers. Table 6.6 Average processing cost of rice millers in the Mekong River Delta
(25 percent broken rice)
Milling Polishing Cost items
Cost (VND/Ton)
Percent of total costs
(%)
Cost (VND/Ton)
Percent of total costs
(%)
1. Labor costs (1) 13,600 25.7 17,950 25.0
2. Electricity, fuel 20,400 38.5 18,700 27.5
3. Materials 3,070 5.8 15,650 23.0
4. Depreciation of machinery 5,560 10.5 5,100 7.5
5. Prepare, maintenance 2,650 5.0 2,720 4.0
6. Taxes, licenses 3,200 6.0 4,080 6.0
7. Others (2) 4,500 8.5 4,760 7.0
Total 53,000 100.0 68,000 100.0
Note: Total average processing cost is directly computed from the primary data of this survey. How-ever, the specification of cost items is based on information provided by a sub-sample of 14 millers/polishers. (1) Labour costs: payment for permanent, temporary workers and family labours (imputed cost). (2) Other costs included the interest on borrowed capital, managerial costs, telephone, extra payments as bonus for members of rice mills.
Source: Own survey from 53 rice millers/polishers in the Mekong River Delta, 1999 – 2000
In our survey of rice millers we found that some rice millers with old milling machinery face high processing costs. The conversion ratio from paddy to rice after milling is lower for old machinery as compared to modern mills (See Sec-tion 5.4.3 in Chapter 5). Moreover, old rice mills also bear high fuel costs, elec-tricity costs as well as costs of maintenance of milling machinery and equip-ment. Finally old milling machinery affects the quality of rice after milling, in particular the degree of broken rice and the degree of whiteness. According to the Ministry of Agriculture and Rural Development of Vietnam, every year the Mekong River Delta can produce around 15-16 million tons of paddy. 86 Taking into account demand for home consumption and seeds for the next crop, the supply of paddy to the market is around 14 million tons per year.
85 In terms of monitoring the polishing process and adjust the polishing machine in order to obtain the exact degree of whiteness and broken level of finished products. 86 Vietnam Economy News, Vol.16, May 2000.

The Organization of the Liberalized Rice Market in Vietnam
146
In the Mekong River Delta we have in total 7,454 rice mills which can provide a milling capacity of over 20 million tons per year. This situation leads to surplus capacity for rice processing (the surplus milling capacity is around 5-6 million tons per year). 87 This implies that some milling machines are not used effi-ciently (especially in the case of small-scale and old-rice mills). In sum, the above discussion indicates that in order to reduce marketing costs at the miller level, we have to look for reasonable solutions to solve the problem of high processing costs of local/old rice mills. 6.3.2 Marketing margin analysis Table 6.7 gives an overview of the distribution of the marketing margin among different actors in the channel. First of all we recognize that rice millers get the highest gross marketing margin (Value added): 1,008,000 VND/ton, while rice assemblers get the lowest (88,000 VND/ton). However, it can be observed that although the rice millers get the highest marketing margin, they also incur the highest marketing cost (951,000 VND/ton) in terms of payment for drying, stor-ing, manufacturing, and other service costs. Among these rice traders, assem-blers and retailers have the lowest marketing costs, 46,500 VND/ton and 63,500 VND/ton, respectively.
The last column of Table 6.7 also indicates that among different rice trad-ers, rice wholesalers obtain a relatively large profit as a percentage of the cost price (3.19 percent). The lowest one is obtained by rice retailers (2 percent). In order to analyze the total net revenues of different rice traders, we calculate the total profits per month based on their monthly turnover. 88 We conclude that the results are all in the same range. Profit rates are somewhat higher than the interest rates applied by state and/or non-state commercial banks (varying from 0.75 percent to 1.2 percent per month). The difference is interpreted as an ac-ceptable premium for risk taking by traders. This is another indicator that the market is operating quite efficiently.
87 This figure is an adjusted capacity taking into account the seasonal use of milling machines (75 percent of actual capacity is taken as a maximum) – WWW.VNEconomy.VN- Agricul-ture\Rice economy. 88 The average turnover of different rice traders that were obtained from the survey: - Assemblers: 40 tons/month - Millers: 250 tons/month - Wholesalers: 60 tons/month - Retailers: 10 tons/month

Chapter 6: Rice Market Performance Analysis
147
Table 6.7 Marketing costs and gross margins of Farmers, Assemblers, Mill-ers, Wholesalers and Retailers in the Mekong River Delta, 1999 – 2000
Profit margins (3) = (1) – (2)
Cost Items Costs and prices
VND/Ton
Gross marketing margin(*)
(1)
Total mar. cost (2)
Amount As % of cost price
I. Farmers 1. Production costs per ton(1) 2. Average selling price of paddy
per ton (2)
1,028,000 1,454,000
II. Assemblers 1. Average buying price of paddy(2) 2. Total marketing costs(3) 3. Cost price (3 = 1 + 2) 4. Average selling price(2)
1,454,000
46,500 1,500,500 1,542,000
88,000 6,500 41,500 2.77
III. Millers 1. Average buying price(2) 2. Total costs
Drying(7) Storage(8) Processing (milling) (4) Losses by conversion ratio(32%)(*)
3. Cost price (3 = 1 + 2) 4. Average selling price(2)
1,542,000
951,000 50,000 30,000 53,000
818,000
2,493,000 2,550,000
1,008,000 951,000 57,000 2.29
IV. Wholesalers 1. Average buying price(2) 2. Total marketing cost (5) 3. Cost price (3 = 1 + 2) 4. Average selling price(2)
2,550,000
115,000 2,665,000 2,750,000
200,000 115,000 85,000 3.19
V. Retailers 1. Average buying price(2) 2. Total marketing cost (6) 3. Cost price (3 = 1 + 2) 4. Average selling price(2)
2,750,000
63,500 2,813,500 2,870,000
120,000 63,500 56,500 2.00
Source: (1) Paddy production cost: Survey by Angiang Food Company. See also Appendix 6.1a (2) Average buying/selling price at different levels were based on the own survey of this study, 1999 – 2000. See Appendix 6.3, 6.4, 6.5, 6.6, and 6.7 (3), (4), (5), and (6) based on the figures from Table 6.3, 6.4, 6.5, and 6.6. (7) See Appendix 6.1b (8) Storage cost were collected from SEBA students (graduated thesis 1999 – 2000).
Note: (*)Losses 32% (based on the conversion ratio 68%) (2,550,000 x 32% = 818,000) Gross marketing margin (Value added) = Average selling price – Average buying price

The Organization of the Liberalized Rice Market in Vietnam
148
The figures in Table 6.8 indicate that rice retailers are in a less profitable situa-tion (lowest profit per month: 565,000 VND). However, this profit level is still higher than the minimum wage in Vietnam (around 300.000 – 350.000 VND per month in 2002). In contrast, rice millers obtain the highest profit per month (14,250,000 VND). However, we recall that in comparison with other traders, rice millers invest relatively large amounts of capital (See Section 5.2.2 and Ta-ble 5.4). Their profit as a percentage of own-capital investment is reasonable (1.48 percent). Rice wholesalers obtain quite a large amount of profit per month (5,100,000 VND), but also this looks reasonable if the profit is expressed as a percentage of invested own capital. Finally, the monthly profit of rice assem-blers is at a moderate level (1,660,000 VND). If we compare profit rates as a percentage of gross marketing margins (value added) then the result is that rice assemblers and retailers obtain the highest mar-gins (around 47 percent) and rice millers obtain the lowest margins (only 5.7 percent). We note that these figures are averages. In practice the margins vary. Table 6.8 presents the coefficient of variation of paddy/rice prices among differ-ent traders. These figures reflect the degree of price volatility to traders. In gen-eral, the price of paddy/rice does not vary much. The highest coefficient of variation is observed for rice assemblers, and retailers accounting to 0.148 and 0.105 respectively. The lowest coefficient of variation is observed for rice mill-ers (0.058). Those results imply that at the assembling and wholesale markets, prices are more volatile. The last row of Table 6.8 presents the total margins for the whole channel. Paddy was bought on average, at 1,454,000 VND/ton and through different marketing agents the retail price of white rice increased to 2,870,000 VND/ton. It means that the gross marketing margin captured by the marketing system (1,416,000 VND) concerns almost 49 percent of the retail price. Total marketing costs of the whole channel system reached 83.1 percent and the total profit mar-gins was 16.9 percent. The above results indicate that most rice traders in this study obtain a relatively large profit as a percentage of value added. However, this profit is reasonable if it is expressed as a percentage of invested capital. This indicates that the rice market is operating quite efficiently.

Chapter 6: Rice Market Performance Analysis
149
Table 6.8 Total Profit margins of different rice traders in the Mekong River Delta, 1999 – 2000. (Thousand VND/ton)
Traders Average buying price
Average selling price
Mar-keting. margin
(Value added)
Mar-keting.
cost
Profit margin
Total profit per
month
Mar. cost as % of value added (%)
Profit as % of value added
(%)
Profit as % of
own capital (*) (%)
1.As-semblers
1,454
[0.148 ]
1,542
[0.058 ]
88 46.5 41.5 1,660 52.8 47.2 1.23
2. Millers 1,542
[0.058 ]
2,550
[0.068]
1,008 951.0 57.0 14,250 94.3 5.7 1.48
3. Whole-salers
2,550
[0.068]
2,750
[0.105]
200 115.0 85.0 5,100 57.5 42.5 1.54
4.Retailer 2,750
[0.105]
2,870
[0.088]
120 63.5 56.5 565 53.0 47.0 0.86
Whole system
- - 1,416 1,176 240 - 83.1 16.9 -
Note: The figures in parenthesis are coefficients of variation that were computed based on Appendix 6.3 – Appendix 6.7 (*) The figures in the last column were calculated from Table 5.4 in Chapter 5 and the average turnover of different rice traders.
Source: Own survey among rice traders in the Mekong River Delta, Vietnam, 1999 –2000.
6.4 An analysis of paddy and rice price patterns The liberalization of the agricultural market still is a hotly debated issue in Viet-nam. The importance of price incentives for rice production is well known from both macroeconomic and household analysis. Prices are not only important for farmers. They are the main incentives for all the other participants in the rice marketing system including traders, millers, SOEs, and consumers. The study of price behavior is therefore critical to the understanding of the performance of the market system.
In this section, we focus on temporal price analysis and in particular on paddy and rice price evolution (including trends and seasonality) after the re-form in Vietnam. The data used in this analysis are monthly prices, provided by the Information Center of the Ministry of Agriculture and Rural Development in Hanoi. They cover the period from January 1989 to December 2000. Data on the Consumer Price Index (CPI) from 1989 to 2000 are collected from the General Statistical Office of Vietnam.

The Organization of the Liberalized Rice Market in Vietnam
150
6.4.1 Trends in paddy and rice prices Growth of paddy and rice prices during the period 1989-2000 is studied consid-ering two sub-periods: the period 1989-1991, and the period 1992-2000. The two sub-periods are easily associated with (1) after the policy shift from central planning to the market system, and (2) the consolidation of that policy after the impressive success achieved in production and export.
The trends in paddy and rice prices during the period 1989-2000 in both nominal and real terms are shown in Table 6.9 as well as Figure 6.1 and Figure 6.2. While the average annual increase in rice prices in the first three years of this period (1989-1991) was 58 percent, the annual increase fell to 6.5 percent for the remaining period (1992-2000). This result can be explained by the fall in inflation since 1991. 89 Additionally, the last two columns of Table 6.9 also indi-cate that in 1995 and 1998 the growth rate of paddy and rice prices increased suddenly because during those years there was a shock in demand of rice in the international market. Table 6.9 Paddy and rice prices in Vietnam, 1989-2000
Year Farm gate paddy price
Retail rice price
Consumer price index
Deflated paddy price
Deflated retail rice
price
Growth rate of paddy price
Growth rate of
retail rice price
(VND/kilogram) (1989=1.0) (1989 VND/kilogram) (Percent)
1989 497 771 1.0 497 771 0 0
1990 833 1,279 1.9 438 673 67.6 65.9
1991 1,404 1,924 2.8 501 687 68.5 50.4
1992 1,427 2,020 3.2 446 631 1.6 5.0
1993 1,445 2,062 3.4 425 607 1.3 2.1
1994 1,523 2,179 3.9 390 559 5.4 5.7
1995 1,939 2,761 4.4 441 628 27.3 26.7
1996 1,822 3,057 4.6 396 665 -6.0 10.7
1997 1,774 2,817 4.8 370 587 -2.6 -7.9
1998 2,198 3,516 5.2 423 676 23.9 24.8
1999 1,872 3,389 5.2 360 652 -14.8 -3.6
2000 1,708 3,032 5.1 335 595 -8.8 -10.5 Annual growth rate (%)
14.85 15.39 18.25 -2.97 -1.92
Source: (1) Annual prices of paddy and rice from Vitranet (collected by Department of Trade of Cantho, 2000) (2) Consumer price index (CPI) is computed based on Appendix 6.2
89 Until 1990, inflation was very high: between 1986 and 1987 it reached hyper-inflation levels with a peak of 650 percent in 1987 and then decreased but still was at a rather sustained level of over 50 per-cent in 1990. After 1991, the macroeconomic policy was very effective in bringing the level of infla-tion below 30 percent. In fact, during 1992 and 1993, there was a deflationary situation in Vietnam. In the latter years, inflationary pressures have started to rise again, but overall it is at levels around 20 percent (Goletti, 1996).

Chapter 6: Rice Market Performance Analysis
151
In practice, the incentives for paddy production and consumption depend, how-ever, not on nominal prices, but on the prices of paddy and rice relative to other goods. It is apparent that since 1989 both paddy and rice prices have risen more slowly than the index of consumer prices. While paddy prices have increased by an average of 14.85 percent in the 12 years period 1989-2000, consumer prices have increased by 18.25 percent, implying a decline in the real farm paddy price of 2.97 percent per year. Similar calculations show a decline in the real retail price of rice of 1.92 percent (Table 6.9). In other words, the relative prices of paddy and rice have decreased over the period. This implies a benefit for rice consumers and a disincentive for rice farmers. The basic idea is that the change in farm income depends on the path of prices, production, and cost of produc-tion. As mentioned, real paddy prices have declined 2.97 percent per year but this decline has been compensated by an increase in rice yield per hectare. 90
Figure 6.1 Trends in paddy and rice prices in Vietnam, 1989 - 2000 Source: Vitranet (collected by Department of Trade of Cantho, 2000)
90 Rice yield per hectare has grown more than 3 percent over the same period (See Table 3.7 in Chapter 3)
0
1000
2000
3000
4000
1989 1990 1991 1992 1993 1994 1995 1996 1997 1998 1999 2000
Year
Pric
e (V
ND
/kilo
gram
)
Retail rice prices
Paddy prices

The Organization of the Liberalized Rice Market in Vietnam
152
Figure 6.2. Real prices of paddy and rice in Vietnam, 1989 – 2000
6.4.2 The variability of paddy and rice prices The variability in paddy and rice prices is measured by the yearly coefficient of variation of monthly prices (Figure 6.3 and Table 6.10). In the first period, from 1989 to 1991, the average price coefficient of variation declined from a value of 0.14 to a value of 0.05 for rice and from 0.16 to 0.04 for paddy. The macroeco-nomic stability (lower inflation) that returned in the early 1990’s in Vietnam re-duced the volatility of both paddy and rice prices.
During the latter part of the period 1991-1993 the coefficient of variation of paddy and rice prices seems to be stable (See Figure 6.3). It is just at very moderate levels of 0.02 to 0.04 for paddy and 0.03 to 0.05 for rice (See Table 6.10). This means that the variability of paddy and rice prices is very much re-lated to general macroeconomic instability. From 1994 to 1997, the variability of paddy and rice prices increased again. The coefficient of variation of paddy prices varies from 0.02 to 0.13 and from 0.03 to 0.12 for rice. Those results can be explained by the fluctuation of export prices in the international market.
0
200
400
600
800
1000
1989 1990 1991 1992 1993 1994 1995 1996 1997 1998 1999 2000
Year
Pric
e (V
ND
/kilo
gram
)
Paddy price
Retail price
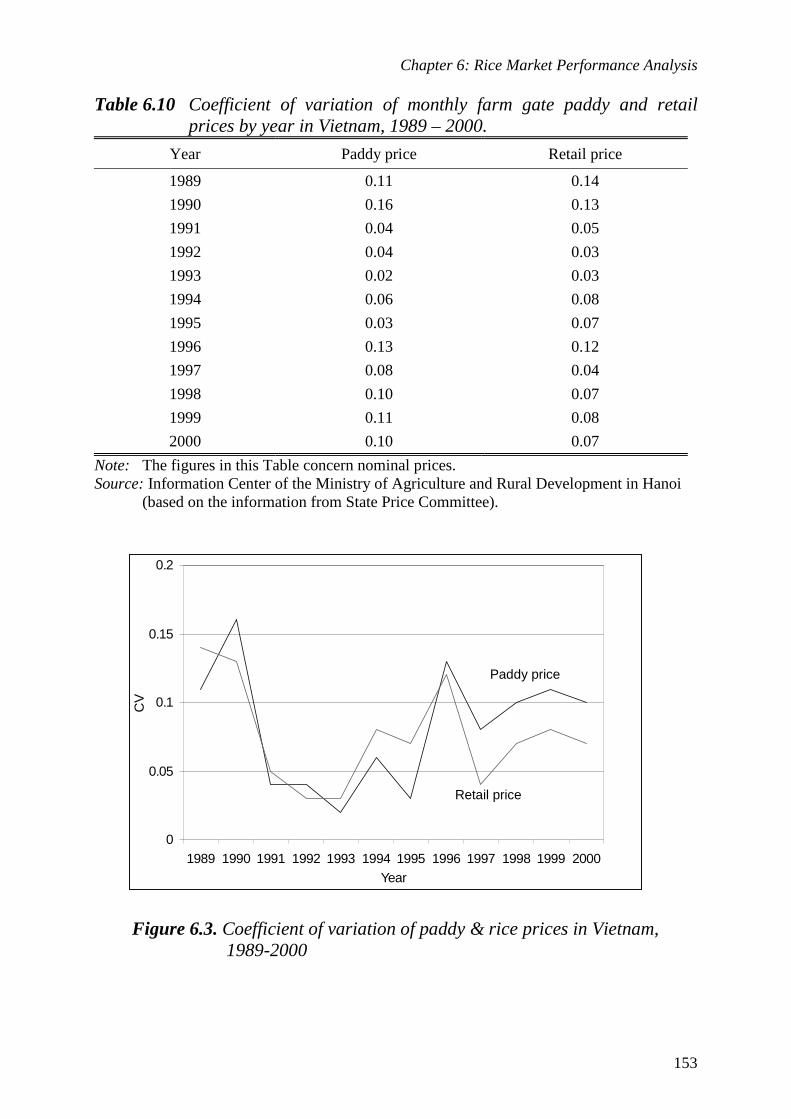
Chapter 6: Rice Market Performance Analysis
153
Table 6.10 Coefficient of variation of monthly farm gate paddy and retail prices by year in Vietnam, 1989 – 2000.
Year Paddy price Retail price
1989 0.11 0.14
1990 0.16 0.13
1991 0.04 0.05
1992 0.04 0.03
1993 0.02 0.03
1994 0.06 0.08
1995 0.03 0.07
1996 0.13 0.12
1997 0.08 0.04
1998 0.10 0.07
1999 0.11 0.08
2000 0.10 0.07
Note: The figures in this Table concern nominal prices. Source: Information Center of the Ministry of Agriculture and Rural Development in Hanoi
(based on the information from State Price Committee).
Figure 6.3. Coefficient of variation of paddy & rice prices in Vietnam,
1989-2000
0
0.05
0.1
0.15
0.2
1989 1990 1991 1992 1993 1994 1995 1996 1997 1998 1999 2000Year
CV
Paddy price
Retail price

The Organization of the Liberalized Rice Market in Vietnam
154
The last period from 1998 to 2000, the volatility of paddy and rice prices has be-come more stable again. As shown and illustrated in Table 6.10 as well as Fig-ure 6.3, the coefficient of variation of paddy prices is about 0.10 to 0.11 and in the case of rice prices, it varies from 0.07 to 0.08. However, paddy prices are still more volatile than retail prices even though the government has imposed a new policy and intervened in order to help rice farmers to sell their paddy at a floor price. 91 Demand for paddy, used for processing for the export market, highly fluctuates due to variability of export prices, while the domestic con-sumer rice demand is relatively stable.
6.4.3 Seasonal price fluctuations In the previous section, long-term movements of paddy and rice prices were studied. Another source of variability in paddy/rice prices is seasonality. In this section, the seasonal price movement is looked at. For most of the analysis in this section, monthly data from the 1996-2000 period are used. 92 First, we look at the seasonal index of paddy and rice prices. 93 Then, we discuss the stability of the seasonal movements for these products.
The seasonal index of paddy and rice prices was computed by using the 12 month-moving average method. Details of the computation of the average seasonal index, as well as the adjusted seasonal index, are presented in Appen-dix 6.8, Appendix 6.9, Appendix 6.10, and Appendix 6.11. Finally, the results of the seasonal price movements are illustrated in Figure 6.4. As shown in this fig-ure, at the aggregate level, seasonal fluctuations seem to be similar for paddy and rice. Over the period 1996-2000 the range between seasonal peak and trough is about 12 percent for paddy. It is about 9 percent for rice (Figure 6.4).
Seasonality of prices is usually a reflection of seasonality of production, with prices showing a tendency to decline during the harvest season and to in-crease during the off season. As mentioned in Chapter 3 (Figure 3.1), most rice farmers in the Mekong River Delta cultivate 3 rice crops per year: Summer-Autumn, Autumn-Winter, and Winter-Spring. Of which, Summer-Autumn and Winter-Spring are considered as major crops. As shown in Figure 6.4, both paddy and rice prices reach the highest level during March-April (the off season of the year after harvesting the Winter-Spring rice crop that usually produces the highest quality of paddy/rice) and fall down to their lowest level from August to September (the main harvest season of the Summer-Autumn rice crop with low quality of paddy/rice because of the rainy season).
91 See also Section 4.7.2 in Chapter 4 for further explanation. 92 By the limitation on data source, unfortunately the monthly data of paddy and rice prices are not available for the period before 1996. Then, this analysis just based on the monthly data of paddy and rice prices from 1996 to 2000. 93 See Appendix 6.9 for further explanation about the seasonal index of paddy and rice prices.

Chapter 6: Rice Market Performance Analysis
155
Figure 6.4 Adjusted seasonal index of paddy and rice prices in Vietnam (Based on the monthly nominal prices from the 1996-2000 trend)
In general, seasonal movements of paddy/rice prices reflect storage costs in a competitive rice market. A fundamental decision facing most marketing agents is when their products should be sold. As mentioned in the previous section, the price gap of paddy/rice between the lean and harvest period is not so high. It just varies by 10 percent. The duration from the peak to the lean season is only three to four months. Therefore, storage of paddy/rice after the harvest (peak season) and resale at the lean season is not very profitable. Storage costs and risks/losses are nearly equal or even greater than the available price margin. 94 6.5 Market integration analysis Spatial price behaviour in regional rice markets is an important indicator of overall market performance. Markets that are not integrated may convey inaccu-rate price information distorting the marketing decisions of rice producers and contributing to inefficient product movements. Therefore, an important part of market performance analysis focuses on regional price analysis and rice market integration between different market places. Several methods for measuring
94 As shown in Chapter 5, storage cost of 1 ton of paddy is 160,000 VND (Table 5.19), how-ever the price margins of 1 kg of paddy from the peak to the lean season only varies from 150 – 170 VND (Report from the Ministry of Agriculture and Rural Development of Vietnam, Oct 2001).
85.00
90.00
95.00
100.00
105.00
110.00
Jan Feb March April May June July August Sept Oct Nov Dec
Per
cent
age
Paddy
Rice
The Organization of the Liberalized Rice Market in Vietnam
156
price integration have been used beginning with simple bivariate correlation co-efficients. This is the simplest way to measure the spatial price relationships be-tween two markets. However, this method clearly has some limitations. 95
One method for measuring the degree of price integration takes the above-mentioned critique into account: the co-integration procedure. This econometric technique provides more information than the correlation procedure, as it allows for the identification of both the integration process and its direction between two markets.
Regional prices move over time because of various shocks. If in the long run they exhibit a constant linear relation, then we say that they are co-integrated. In general, the presence of co-integration between two series is in-dicative of inter-dependence. In other words, co-integration indicates non-segmentation between the two series. Co-integration analysis is a useful tool to give an answer about the existence of a relation between two economic time-series.
To test for co-integration, one can apply the Engle–Granger as well as the Johansen procedure. Although the Engle-Granger procedure is easily imple-mented, it does have several important defects. One of the serious defects of the Engle-Granger procedure is that the method has no systematic procedure for the separate estimation of the multiple co-integrating vectors. Another defect of the Engle-Granger procedure is that it relies on a two step estimator (Enders, 1998). Fortunately, several methods have been developed that avoid this problem. The Johansen (1998) and Stock and Watson (1998) maximum likelihood estimators circumvent the use of two-step estimators and can estimate and test for the pres-ence of multiple co-integrating vectors. Moreover, these tests allow the re-searcher to test restricted versions of the co-integrating vectors and the speed of adjustment parameters. This study mainly applies the Johansen procedure to test for long run and short run co-integration. To use the co-integration procedure, several steps need to be carried out on the price series: first, the Augmented Dickey Fuller test (ADF) and then the Johansen procedure. 6.5.1 The data and model specification When spatial price integration is studied, the analysis should preferably be based on day-prices or at least average week-prices. It is clear that average month-prices may be very rough estimates of day-prices. Especially during periods of changing market relationships, 96 these monthly averages may deviate substan-tially from market day-prices. Moreover, average month-prices are not the right variables to indicate the short-run price integration process. In Vietnam, day-prices are available for only a few market places and only for a short period in 95 See also Section 2.4 in Chapter 2. 96 For example at the end of the off season and the beginning of the harvest season

Chapter 6: Rice Market Performance Analysis
157
the past. Therefore, we use weekly price series, from 1998 to August 2001. Es-pecially, the price series of 25 percent broken rice are used for the analysis, since this kind of rice is popular to consumers in the domestic rice markets. Nine major market places are chosen to analyze market integration. Of these, four markets are located in the Mekong River Delta (Angiang, Cantho, Soctrang, and Tiengiang), two markets are in the middle and central high-land area (Lamdong, and Danang), and two are City markets (HCM City and Hanoi). Finally, the ma-jor export market at HCM City is also included in this analysis. The weekly price data were provided by the Cantho Trade Department, Information Center of Ministry of Agriculture and Rural Development, and the Ministry of Trade of Vietnam. Mathematically, the starting point for a model for testing market integration based on multiple co-integrating vectors is the following:
tptpptpttt xAxAxAxAx ε+++++= −−−−−− )1(12211 K (6.1)
Where: t = 1, 2,….. refer to the weeks from 1998 to August 2001 n = number of markets included in the analysis
p = integer, the volume of which is to be determined x t = the (n x 1) vector of variables (x1t, x2t,…. xnt)’: [price of n market places] Ai = an (n x n) matrix of coefficients εt = an (n x 1) vector of error terms
With: 1−−=∆ ttt xxx Equation (6.1) can be put in a more suitable form by subtracting 1+− ptp xA from
the equation:
tptpptppttt xAxAAxAxAx ε+∆−++++= −−−−−−− 1112211 )(K
and so on:
tptpptppptpppttt xAxAAxAAAxAxAx ε+∆−∆−−+++++= −−−−−−−−−−− 1212122211 )()(K
……………………………..………………………………………………
ttptptpt xAAAxAAAxAAAx ε+−∆+++−∆+++−+++= −−− KKKK 243132121 )()()(
and subtracting 1−tx for both sides
tptptptpt xAxAAAxIAAAx ε+∆−−∆+++−−+++=∆ +−−− 1132121 )()( KKK

The Organization of the Liberalized Rice Market in Vietnam
158
Finally we obtain:
∑−
=−− ++∆=∆
1
11
p
ittitit xxx εππ (6.2)
Where: I = an (n x n) identity matrix and π and πi is defined by
−= ∑
=IA
p
ii
1
π
∑+=
−=p
ijji A
1
π
Here the rank of π or (A1 – I) is equal to the number of independent co-integrating vectors. If (A1 – I) consists of all zeros, so that rank(π) = 0, clearly, the matrix is null (all elements of π equal zero) and equation (6.2) is a traditional vector auto-regression (VAR) in first differences. This implies that all the {∆xit}
sequences are unit root processes. Since there is no linear combination of the {∆xit} processes that is stationary, the variables are not co-integrated. In such circumstances, there is no error-correction representation since {∆xit} does not respond to the previous period’s deviation from a long-run equilibrium, since that equilibrium does not exist.
If instead rank (π) = n, the vector process is stationary. In intermediate cases, if rank (π) = 1, there is a single co-integrating vector and the expression πxt-1 in equation (6.2) is the error-correction factor. For other cases in which 1 < rank (π) < n, there are multiple co-integrating vectors.
If rank (π) > 0, a vector error correction model (VECM) will be used to analyze the short-run co-integration. VECM is a restricted VAR designed for use with non-stationary series that are known to be co-integrated. The vector er-ror correction has co-integration relations built into the specification so that it restricts the long-run behaviour of the endogenous variables to their co-integrating relationships while allowing for short-run adjustment dynamics. The co-integration term is known as the error correction term since the deviation from long-run equilibrium is corrected gradually through a series of partial short-run adjustments. One of the most interesting aspects of the Johansen procedure is that it al-lows for testing restricted forms of the co-integrating vectors. In order to test re-strictions on the co-integrating vector, Johansen defines the two matrices α and β, both of dimension (n x r), where r is the rank of π. The properties of α and β are such that:
π = α β’
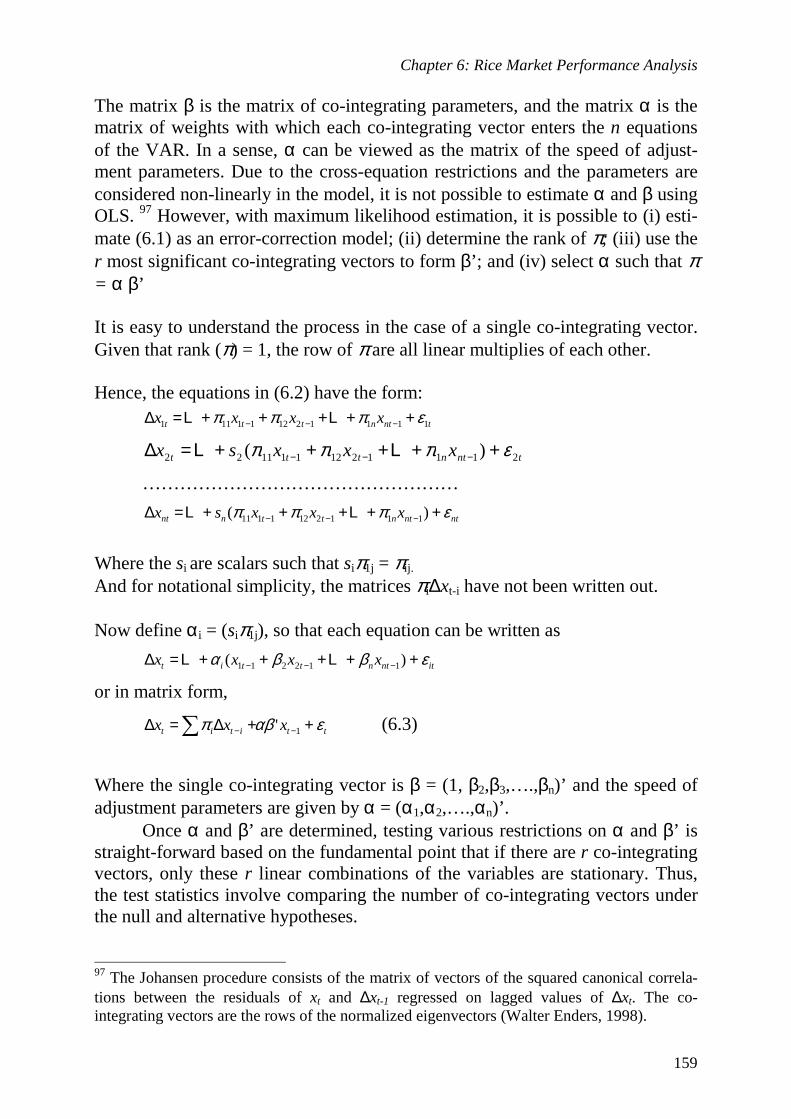
Chapter 6: Rice Market Performance Analysis
159
The matrix β is the matrix of co-integrating parameters, and the matrix α is the matrix of weights with which each co-integrating vector enters the n equations of the VAR. In a sense, α can be viewed as the matrix of the speed of adjust-ment parameters. Due to the cross-equation restrictions and the parameters are considered non-linearly in the model, it is not possible to estimate α and β using OLS. 97 However, with maximum likelihood estimation, it is possible to (i) esti-mate (6.1) as an error-correction model; (ii) determine the rank of π; (iii) use the r most significant co-integrating vectors to form β’; and (iv) select α such that π = α β’ It is easy to understand the process in the case of a single co-integrating vector. Given that rank (π) = 1, the row of π are all linear multiplies of each other. Hence, the equations in (6.2) have the form:
tntnttt xxxx 111121211111 επππ +++++=∆ −−− LL
tntnttt xxxsx 2111212111122 )( επππ +++++=∆ −−− LL
……………………………………………
ntntnttnnt xxxsx επππ +++++=∆ −−− )( 1112121111 LL
Where the si are scalars such that siπ1j = πij.
And for notational simplicity, the matrices πi∆xt-i have not been written out. Now define α i = (siπ1j), so that each equation can be written as
itntnttit xxxx εββα +++++=∆ −−− )( 112211 LL
or in matrix form,
ttitit xxx εαβπ ++∆=∆ −−∑ 1' (6.3)
Where the single co-integrating vector is β = (1, β2,β3,….,βn)’ and the speed of adjustment parameters are given by α = (α1,α2,….,αn)’. Once α and β’ are determined, testing various restrictions on α and β’ is straight-forward based on the fundamental point that if there are r co-integrating vectors, only these r linear combinations of the variables are stationary. Thus, the test statistics involve comparing the number of co-integrating vectors under the null and alternative hypotheses.
97 The Johansen procedure consists of the matrix of vectors of the squared canonical correla-tions between the residuals of xt and ∆xt-1 regressed on lagged values of ∆xt. The co-integrating vectors are the rows of the normalized eigenvectors (Walter Enders, 1998).

The Organization of the Liberalized Rice Market in Vietnam
160
6.5.2 Applying the Johansen methodology to test for co-integration: four steps procedure
Step 1: Pre-tests and lag length First of all, it is good practice to pre-test all variables to assess their order of in-tegration. The order of integration will be tested with an Augmented Dickey Fuller (ADF) test on a unit root.
Secondly, we continue to test for the lag length, because the results of the co-integration test can be quite sensitive to the lag length. The most common procedure is to estimate a vector auto-regression (VAR). The lags are specified as lags of the first differentiated terms. Begin with the longest lag length deemed reasonable and test whether the lag length can be shortened. We can use the Akaike information criteria (CIA) and Schwarz criteria (SC) to select a suitable lag length.
Using the ADF test, the results presented in Table 6.11 indicate that the price series for the nine markets under study are I(1). For all the price series the unit root test on price levels (three columns in middle of the table) shows that the coefficients are not significantly different from zero and this implies that none of the price series is stationary. Furthermore, the unit root test on first dif-ferences (three last columns in the table) confirms the opposite, which leads us to conclude that all our price series are integrated of order 1 and that the series of the first differences are integrated of order 0. This result implies that inclusion of first differences as variables in the model, instead of normal price series, will eliminate the stochastic trend to which the nominal series are exposed. Table 6.11 Unit root test on rice price series in different market places
Unit root-test on price levels Unit root-test on first differences Market place No. of observa-
tions ADF (1) δ t-value (2) ADF (1) δ t-value (2)
1. Angiang 188 ADF (2) - 0.046 - 1.634 ADF (1) - 1.517 - 13.064 2. Cantho 187 ADF (3) - 0.025 - 1.151 ADF (2) - 1.524 - 10.270 3. Danang 188 ADF (2) - 0.002 - 0.081 ADF (1) - 1.285 - 11.939 4. HCM City 188 ADF (2) - 0.045 - 1.735 ADF (1) - 1.383 - 12.486 5. Hanoi 188 ADF (2) - 0.038 - 1.600 ADF (1) - 1.414 - 12.646 6. Lamdong 185 ADF (5) - 0.021 - 0.822 ADF (4) - 1.905 - 9.195 7. Soctrang 188 ADF (2) - 0.001 - 0.389 ADF (1) - 1.339 - 12.417 8. Tiengiang 188 ADF (2) - 0.022 - 1.024 ADF (1) - 1.563 - 13.587 9. VN Export 186 ADF (1) - 0.029 - 1.431 ADF (0) - 1.315 - 18.800
Note: (1) In the column ADF the number of lags that was allowed for in the unit root test is indicated in brackets. No serial correlation was detected (5% significance level). (2) Critical value are given in Maddala 1992: t = - 2.88, 5% level of significance.
Source: Weekly paddy and rice price series from 1998 to 2001. ADF analysis was carried out in EVIEWS© 4.0
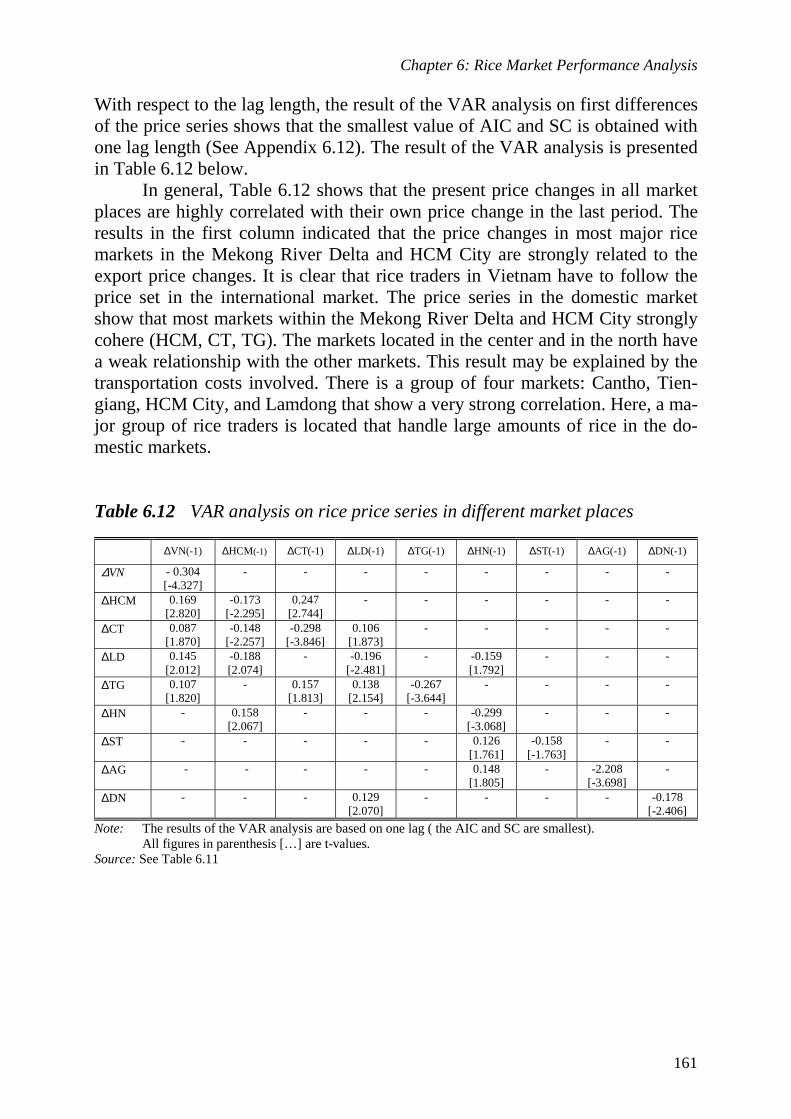
Chapter 6: Rice Market Performance Analysis
161
With respect to the lag length, the result of the VAR analysis on first differences of the price series shows that the smallest value of AIC and SC is obtained with one lag length (See Appendix 6.12). The result of the VAR analysis is presented in Table 6.12 below.
In general, Table 6.12 shows that the present price changes in all market places are highly correlated with their own price change in the last period. The results in the first column indicated that the price changes in most major rice markets in the Mekong River Delta and HCM City are strongly related to the export price changes. It is clear that rice traders in Vietnam have to follow the price set in the international market. The price series in the domestic market show that most markets within the Mekong River Delta and HCM City strongly cohere (HCM, CT, TG). The markets located in the center and in the north have a weak relationship with the other markets. This result may be explained by the transportation costs involved. There is a group of four markets: Cantho, Tien-giang, HCM City, and Lamdong that show a very strong correlation. Here, a ma-jor group of rice traders is located that handle large amounts of rice in the do-mestic markets. Table 6.12 VAR analysis on rice price series in different market places
∆VN(-1) ∆HCM(-1) ∆CT(-1) ∆LD(-1) ∆TG(-1) ∆HN(-1) ∆ST(-1) ∆AG(-1) ∆DN(-1)
∆VN - 0.304 [-4.327]
- - - - - - - -
∆HCM 0.169 [2.820]
-0.173 [-2.295]
0.247 [2.744]
- - - - - -
∆CT 0.087 [1.870]
-0.148 [-2.257]
-0.298 [-3.846]
0.106 [1.873]
- - - - -
∆LD 0.145 [2.012]
-0.188 [2.074]
- -0.196 [-2.481]
- -0.159 [1.792]
- - -
∆TG 0.107 [1.820]
- 0.157 [1.813]
0.138 [2.154]
-0.267 [-3.644]
- - - -
∆HN - 0.158 [2.067]
- - - -0.299 [-3.068]
- - -
∆ST - - - - - 0.126 [1.761]
-0.158 [-1.763]
- -
∆AG - - - - - 0.148 [1.805]
- -2.208 [-3.698]
-
∆DN - - - 0.129 [2.070]
- - - - -0.178 [-2.406]
Note: The results of the VAR analysis are based on one lag ( the AIC and SC are smallest). All figures in parenthesis […] are t-values.
Source: See Table 6.11

The Organization of the Liberalized Rice Market in Vietnam
162
Step 2: Determine number of co-integrating equations The main task of this step is to determine the rank of π and estimate the co-integrating equations. By using the Johansen co-integration test, available in EVIEWS, we got the results on the λtrace and λmax to determine rank of π as fol-lows. The results of λtrace and λmax using the Johansen co-integration test (Table 6.13) indicate that the rank of π can reach 3 (for both the λtrace and λmax tests at 95% significant level). 98 It means that there are at least three co-integrating equations in our estimation. Table 6.13 The λtrace and λmax tests
Null Hypothesis
Alternative hypothesis
95% Critical value
99% Critical value
λ trace tests r = 0 r ≤ 1 r ≤ 2 r ≤ 3 r ≤ 4
r > 0 r > 1 r > 2 r > 3 r > 4
λ trace value 249.80 184.10 134.04 88.91 54.09
175.77 141.20 109.99 82.49 59.46
187.31 152.32 119.80 90.45 66.52
λmax tests r = 0 r = 1 r = 2 r = 3 r = 4
r = 1 r = 2 r = 3 r = 4 r = 5
λmax value 65.70 50.05 45.12 34.82 23.55
53.69 47.99 41.51 36.36 30.04
59.78 53.90 47.15 41.00 35.17
Note: If λ trace and or λmax value exceeds the critical value, it is possible to reject the null hy-pothesis and accept the alternative of more co-integrating vectors.
Source: See Table 6.11 Step 3: Testing long-term price integration We focus on the long-run co-integration of price series by analyzing the normal-ized co-integrating coefficients (β). To estimate co-integrating coefficients (β) we can use the Johansen co-integration test that was carried out in EVIEWS.
The co-integrating coefficients β estimated in step 2, r = 3 are presented in Appendix 6.13. If we normalize with respect to the export price of Vietnam (VN), HCM City (HCM), and Cantho (CT), the three normalized co-integrating equations are as follows:
98 Because if we select r ≥ 4 then the λ trace and λmax value are smaller than the 95% critical value (54.09<59.46 for λ trace and 34.82<36.36 for λmax)

Chapter 6: Rice Market Performance Analysis
163
VN = + 3.598 AG – 3.243 ST + 4.250 TG – 3.568 LD – 0.265 DN + 0.497 HN (1)
[-4.387]** [3.804]** [-5.751]** [6.557]** [0.727] ns [-1.084] ns
HCM = –1.879 AG + 0.069 ST + 1.266 TG + 0.420 LD + 0.324 DN + 0.734 HN (2) [5.425]** [0.193] ns [-4.057]** [-1.829]* [-2.099]** [-3.787]*
CT = – 0.766 AG + 1.136 ST + 0.231 TG + 0.306 LD + 0.115 DN – 0.055 HN (3)
[6.501]** [-9.276]*** [-2.175]* [-3.911]** [-2.187]* [0.846] ns Note: All figures in parenthesis […] are t-values: *** = significant at 1%,
** = significant at 5%, * = significant at 10%, ns = not significant. The above significant coefficients in the co-integrating equations (1) and (2) in-dicate that in the long-run most markets in the Mekong River Delta are highly co-integrated with HCM City and especially with the export price of Vietnam. This result is consistent with the analysis of the rice market structure and con-duct in the previous chapters. Rice is a major product for export and the Mekong River Delta is the rice basket in the country. Therefore, the price formation process in this region highly depends on the world rice markets. HCM City is the major urban centre in the South of Vietnam and, therefore, was expected to be integrated with the major grain baskets in the South. Two market places, lo-cated in the Centre and the North of Vietnam: Danang and Hanoi were found not significant in the co-integrating equation (1). This result may be explained by the fact that these markets are no major surplus areas but urban consumer cen-tres. As expected, these markets are related to the price levels observed in HCM City. However, the relationship is somewhat weak, which can be explained by the long distance (transport costs). Furthermore, co-integrating equation (3) shows that all the markets in the Mekong River Delta are highly co-integrated in the long run. 99 This result clearly indicates that the rice market system in the South is strongly integrated. Step 4: Testing short-run integration with a Vector Error Correction Model When long-run integration can be imposed on the model, then it can be specified as a Vector Error Correction Model (VECM) to estimate the dynamics in the short-run. Using VECM estimation with the same price series in step 3 we ob-tain the results presented in Appendix 6.14. The dynamics in the short-run is presented in Table 6.14.
99 Except Hanoi - the consumer market located far in the North, due to the long distance, therefore, it is not significant in co-integrating equation.
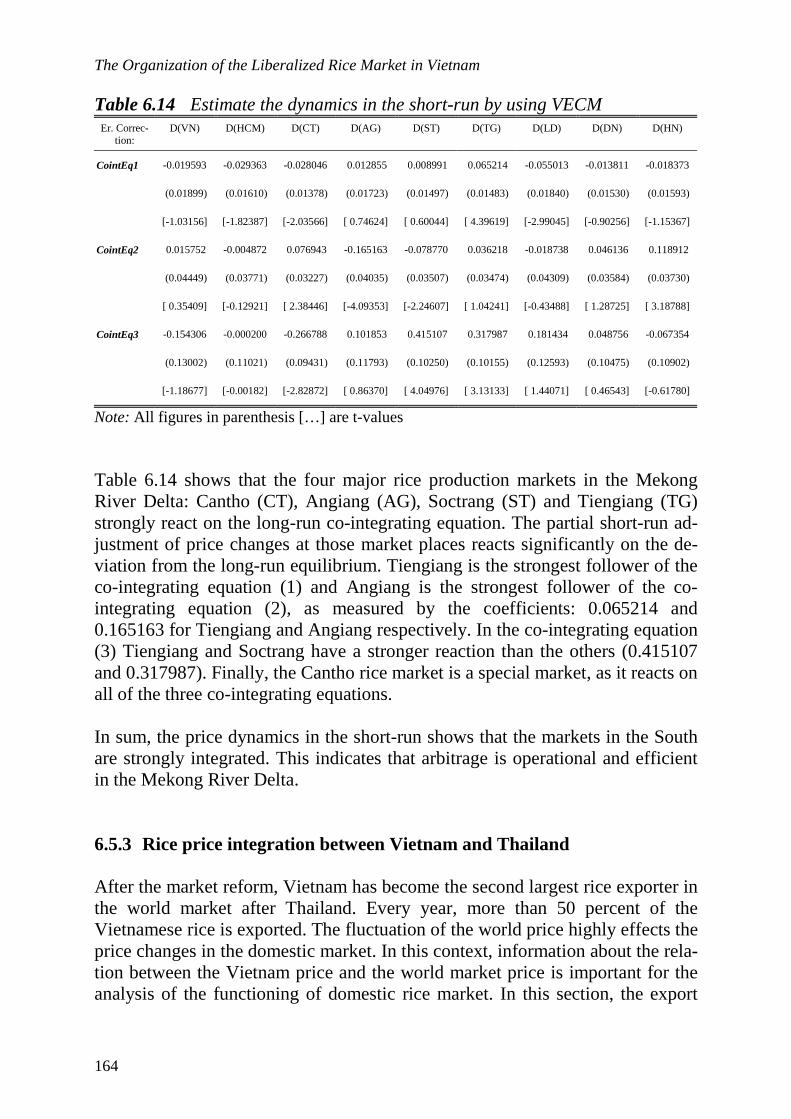
The Organization of the Liberalized Rice Market in Vietnam
164
Table 6.14 Estimate the dynamics in the short-run by using VECM Er. Correc-
tion: D(VN) D(HCM) D(CT) D(AG) D(ST) D(TG) D(LD) D(DN) D(HN)
CointEq1 -0.019593 -0.029363 -0.028046 0.012855 0.008991 0.065214 -0.055013 -0.013811 -0.018373
(0.01899) (0.01610) (0.01378) (0.01723) (0.01497) (0.01483) (0.01840) (0.01530) (0.01593)
[-1.03156] [-1.82387] [-2.03566] [ 0.74624] [ 0.60044] [ 4.39619] [-2.99045] [-0.90256] [-1.15367]
CointEq2 0.015752 -0.004872 0.076943 -0.165163 -0.078770 0.036218 -0.018738 0.046136 0.118912
(0.04449) (0.03771) (0.03227) (0.04035) (0.03507) (0.03474) (0.04309) (0.03584) (0.03730)
[ 0.35409] [-0.12921] [ 2.38446] [-4.09353] [-2.24607] [ 1.04241] [-0.43488] [ 1.28725] [ 3.18788]
CointEq3 -0.154306 -0.000200 -0.266788 0.101853 0.415107 0.317987 0.181434 0.048756 -0.067354
(0.13002) (0.11021) (0.09431) (0.11793) (0.10250) (0.10155) (0.12593) (0.10475) (0.10902)
[-1.18677] [-0.00182] [-2.82872] [ 0.86370] [ 4.04976] [ 3.13133] [ 1.44071] [ 0.46543] [-0.61780]
Note: All figures in parenthesis […] are t-values Table 6.14 shows that the four major rice production markets in the Mekong River Delta: Cantho (CT), Angiang (AG), Soctrang (ST) and Tiengiang (TG) strongly react on the long-run co-integrating equation. The partial short-run ad-justment of price changes at those market places reacts significantly on the de-viation from the long-run equilibrium. Tiengiang is the strongest follower of the co-integrating equation (1) and Angiang is the strongest follower of the co-integrating equation (2), as measured by the coefficients: 0.065214 and 0.165163 for Tiengiang and Angiang respectively. In the co-integrating equation (3) Tiengiang and Soctrang have a stronger reaction than the others (0.415107 and 0.317987). Finally, the Cantho rice market is a special market, as it reacts on all of the three co-integrating equations. In sum, the price dynamics in the short-run shows that the markets in the South are strongly integrated. This indicates that arbitrage is operational and efficient in the Mekong River Delta. 6.5.3 Rice price integration between Vietnam and Thailand After the market reform, Vietnam has become the second largest rice exporter in the world market after Thailand. Every year, more than 50 percent of the Vietnamese rice is exported. The fluctuation of the world price highly effects the price changes in the domestic market. In this context, information about the rela-tion between the Vietnam price and the world market price is important for the analysis of the functioning of domestic rice market. In this section, the export

Chapter 6: Rice Market Performance Analysis
165
price of Thailand rice in the world market was used to test for price integration with Vietnam.
Weekly data on the rice price in Thailand, obtained from the USDA, and the price in Vietnam, obtained from Vitranet, will be used for this analysis. The Johansen procedure is applied for analyzing rice price integration between Viet-nam and Thailand.
First of all, a unit root test (ADF test) was carried out and the lag length (using VAR analysis) was determined. The price series for the two markets Vietnam and Thailand are integrated of order 1, and the result of a VAR analysis on the first differences of the price series shows that the smallest value of AIC and SC is achieved for lag length 1 (Appendix 6.15).
The result of the Johansen co-integration test (EVIEWS) shows that rank of π equals 1 (for both the λtrace and λmax tests at 95% significant level). 100 Testing for long-term price integration between Vietnam and Thailand (See Ap-pendix 6.15) shows that if we normalize with respect to the export price of Viet-nam, we obtain a very high significant co-integrating equation:
Vietnam = 1.009534 Thailand – 12.57837
[-19.883] [1.195]
The above co-integrating equation implies that in the long run, the Vietnamese rice market is highly co-integrated with Thailand and the coefficient of correla-tion is not significantly different from 1. An increase (or decrease) of export prices in Thailand will be transferred directly to the Vietnamese export prices (See also Figure 6.5). The constant of this co-integrating equation, however, is not significant. It indicates that in the long run the export price of Vietnam may be equal to the export price of Thailand. We conclude that the suitable model for analyzing the process of short-run price integration should be restricted by the condition that the export price of Vietnam follows the price pattern in Thailand. Additionally, as seen in Figure 6.5, the prices in both Vietnam and Thailand have two extreme fluctuations during March and June of 1999 (due to the shock on rice demand in Indonesia and Iraq). Therefore we include two dummy vari-ables (D1 and D2) in this model. Using a Vector Error Correction Model (VECM), the speed of adjustment in the short-run between the Vietnamese and the Thai price was estimated. The result in Table 6.15 indicates that if we put the restriction that the Vietnam-ese price follows the price pattern in Thailand, the constant in the co-integrating equation of our model is highly significant. Moreover, both dummy variables
100 See Appendix 6.15

The Organization of the Liberalized Rice Market in Vietnam
166
D1 and D2 related to the extreme price fluctuations in 1999 are also significant. The co-integrating equation now becomes:
Vietnam = Thailand – 9.885348 [-4.785]
The result of the Vector Error Correction Model (VECM) at the right hand side of Table 6.15 shows that price changes in Thailand depend on the long-run co-integrating equation with Vietnam. In more detail, as shown in the table the pre-sent price changes in Thailand are strongly correlated with the price changes in Vietnam in the previous period. Table 6.15 Estimate of the dynamics in the short-run between Vietnam and
Thai’s price (Co-integration restrictions) Co-integrating
Equation Co-integration
Equation 1 Error
Correction D(VN) D(TL)
VN(-1) 1.000000 CointEq1 -0.077991 0.161120 (0.05675) (0.04240)
TL(-1) -1.000000 [-1.37418] [ 3.79967]
C 9.885348 D(VN(-1)) -0.282964 -0.192868 (2.06583) (0.07749) (0.05789) [ 4.78516] [-3.65172] [-3.33136] D(TL(-1)) 0.017457 -0.106825 (0.09313) (0.06958) [ 0.18745] [-1.53527] D(D1) -27.86632 -38.07995 (5.93343) (4.43313) [-4.69649] [-8.58986] D(D2) -64.02464 -46.32708 (5.83384) (4.35872) [-10.9747] [-10.6286]
Note: All figures in parenthesis […] are t-values

Chapter 6: Rice Market Performance Analysis
167
Note: Prices of 25 percent broken rice Source: USDA and Vitranet Figure 6.5 Export rice prices of Vietnam and Thailand 1998 - 2001 In summary, the export price of Vietnamese rice is highly co-integrated with the export price of Thai rice. Moreover, rice prices at domestic markets in the Me-kong River Delta are strongly co-integrated with the export price of Vietnam. This gives a clear picture of how price changes in both the domestic and the in-ternational markets cohere. The export price of Vietnam follows the world mar-ket price. 6.6 Conclusions In this chapter we mainly focus on analyzing market performance or the effectiveness and efficiency of the functioning of the rice market. The analysis of the effectiveness of the rice marketing channels found that rice producers/farmers and traders in the market try to offer suitable types of rice to satisfy consumer preferences (See Section 6.2). Channels of rice distribution are organized quite effectively and provide convenient services to final consumers. Marketing costs, marketing margins and profit margins of different rice traders are major indicators for the efficiency of the functioning of the rice market. The
120
160
200
240
280
320
1998 1999 2000 2001
TL VN

The Organization of the Liberalized Rice Market in Vietnam
168
results of the marketing cost and margin analysis in this chapter show that rice retailers and assemblers incurred the smallest marketing cost. Rice mill-ers/polishers bear the highest marketing costs and also get the highest gross marketing margins. The processing costs of the rice millers are still high, espe-cially for local rice millers with old milling machines. The high marketing costs imply that the final consumers have to buy rice at a relatively high price while the producers – rice farmers receive relatively low prices for paddy in the mar-ket. Despite the high marketing margins, the profit margins are only high if they are expressed as a percentage of value added. Profit margins expressed as a percent-age of invested capital are quite close to the interest rates applied by the state banks. Therefore we conclude that the markets are operating quite efficiently. The temporal price analysis found that as compared to the period from 1994 to 1997, the last period from 1998 to 2000 the volatility of paddy and rice prices has become more stable. This may be the result of the government policy (See also Section 4.7) that supports rice farmers, by setting a floor-price for paddy in the market. With respect to seasonal price fluctuations we found that prices go up during March-April (after harvesting the Winter-Spring rice crop) and fall from August to September (the main harvest season of the Summer-Autumn rice crop). The duration from peak to lean season is three to four months. The sea-sonal component in the yearly price pattern is only 10%. Therefore speculative storage of paddy/rice after harvest is not really profitable. Storage costs of 1 ton of paddy are 160,000 VND, while the price margins from peak to lean season only vary from 150,000 – 170,000 VND. 101 This is another indicator for good market performance. The results of market integration analysis showed that all major market places in the Mekong River Delta are highly integrated. Rice prices follow the export price and the prices in HCM City. Due to the long distance, markets in the North are not strongly integrated with the Mekong Delta markets. At the international level, we found that the export price of Vietnamese rice, which is controlled by the government, is highly correlated with the world price (Thailand price). The price formation process in both domestic and export rice markets cohere. This shows that the floor price policy of the government follows the price pattern in the world market. In sum we conclude that the research results are in support of the view that the price formation process in the Vietnamese rice market is quite efficient.
101 See Section 5.4.1

Chapter 7. The Market Process 7.1 Introduction As presented in Chapter 2, the analysis of competition and the data on Structure-Conduct-Performance (SCP) are used as a framework for analyzing the market process. This chapter will use all major findings of the previous chapters in or-der to assess the dynamics in the existing rice marketing channels. It is expected that, through time, changes in competitive conditions, institutions, market struc-ture, conduct and performance lead to new and more efficient channel formats. Three criteria are used to assess the market process: (1) Existence of sustained competition: even if the market is competitive at pre-
sent it is important to verify whether there are forces operating that endanger the process of competition in the future (Section 7.2).
(2) Changes in market institutions: we want to verify whether proper institutions
(rules of the game and play of the game) exist that facilitate or hamper the market process (Section 7.3).
(3) Incentives to accommodate observed deficiencies: we examine whether the
market process provides incentives to solve observed problems in the exist-ing marketing channels (Section 7.4).
Finally, in Section 7.5 we present some general conclusions concerning the functioning of the domestic rice market. Section 7.6 will present an improved channel format and Section 7.7 will discuss some policy recommendations. 7.2 The process of competition in the rice market system As described in Chapter 2 the competitive process is determined by barriers to entry; trade concentration, assortment of product quality and market informa-tion. The competitive process is a crucial element in the market dynamics and, therefore, influences the evolution of new channel formats. Entry barriers In Chapter 4 we found that there were almost no important barriers to enter the rice business, especially in the case of rice assemblers and wholesalers. We con-cluded that entry barriers do not hamper the price formation process in the do-
The Organization of the Liberalized Rice Market in Vietnam
170
mestic market. These circumstances force rice traders to offer the best marketing services to final consumers. However, new millers/polishers may face some se-rious constraints as a result of deficient milling technology, management skills/experiences, and shortage of working capital (financial constraints). Ac-cording to them, having experience with milling technology and high-quality processing machines, are important factors that determine the success of the company (See Section 4.4.1). Lack of working capital is the most difficult bar-rier to entry for millers/polishers. Large-scale millers/polishers also face “exit barriers” due to the importance of so-called “sunk costs”. For example, they have to invest large amounts of money in milling/polishing machines, storage facilities, and other fixed capital (See Section 5.2). If they exit the rice business, the resale values of these assets (mill-ing and polishing facilities), are usually lower than the operational value of the fixed capital. This arises from the fact that it is difficult to use rice-milling ma-chinery for other purposes because of its specificity. A distinction is to be made between entry in the local rice market and in the ex-port market. Private rice companies still face an entry barrier on the export mar-ket – even now, when private exporters are allowed to obtain export quota (See Section 4.5.2). This is due to formal regulations and the result of their relative disadvantage with regard to access to credit. As our study was focusing on the domestic trade relationships we did not analyze this issue in detail. However, further research is necessary to pay proper attention to this problem. In general traders do not complain about the administrative procedures that have to be followed for market entry. We observed that the government is even facili-tating the entry process. At the end of 1999, the formalities for business license applications have been simplified. In HCM, traders can obtain their business li-cense on-line through the Web-site of the Ministry. 102 Remarkably, at the retail level, severe competition is perceived as the most im-portant barrier to entry for retailers (See Section 4.4). In sum, the barriers to en-try into the rice market are not related to the traditional barriers discussed by Bain (See Section 2.2.3). After market liberalization, fierce competition among rice traders in the market avoids that established rice traders take advantage of raising prices above competitive price-levels. They have to follow the market price that is based on competitive trade negotiations (See Section 4.6 and 5.4.2). Finally, the problem related to market power of resource owners, another entry barrier stressed by Von Weizsacker (See Section 2.2.3), is not observed in the market under study, as concentration rates are low.
102 www.HCMSTE.gov.vn

Chapter 7: The Market Process
171
Buyer and seller concentration The research results show that buyer-seller concentration ratios are quite low for various segments in the domestic market (See Section 4.4.2). Competition among different rice traders is fierce and this is expected to foster the market process. As explained in the section on entry barriers, the export activity is still dominated by the SOEs. However, at present private rice traders can obtain a li-cense for exporting rice if they fulfill the conditions to become a member of the Vietnamese Food Association – See also Section 4.7.2. We recall that this analysis focuses on the domestic market. Therefore further research is needed to analyze the consequences of this concentration. The assortment of product quality With respect to the assortment of product quality we observed that the rice market is operating satisfactory. However, we also found that the existing wholesale grading system for rice qualities still has some deficiencies. At the farm gate, rice farmers cultivate many kinds of rice varieties (See Section 3.3.4). At the wholesale markets, rice wholesalers, millers, and exporters classify the rice product only into two kinds: C1 and C2 quality (See Section 4.4.3). This grading system facilitates the wholesale and export channel, but does not reflect consumer preferences in the domestic market (See Section 6.2). As long as sup-ply of preferred qualities in the local market is abundant this can be accepted. However, in order to prevent shortages of specific varieties in the future, it would be better if the national grading system would take domestic preferences into account. In addition, rice is marketed without standard package and brand names. This has negative effects to rice product quality and hampers the opportunities for rice traders to signal quality to the consumers. Access to market information As mentioned in Chapter 4, most rice traders have easy access to information about supply and demand conditions in the domestic market. There are many sources of market information that rice traders can consult. Most of the farmers obtained market information from their neighbors and relatives; some of them read newspapers, listened to the radio and/or received information from mid-dlemen. Assemblers obtained market information mainly through other traders (wholesalers or millers) in the channel of distribution. Rice retailers and whole-salers obtain the information mostly from the middlemen and the SOEs. Particu-larly, rice millers/polishers have a strong relationship with the SOEs. However,

The Organization of the Liberalized Rice Market in Vietnam
172
due to the variety of sources of market information, the available information is not always systematic and reliable (See Section 4.4.4 and Section 5.4.4). In sum, our analysis on competitiveness revealed that.
- no important entry barriers were identified that hamper the price forma-tion process
- buyer and seller concentration levels at various segments in the domestic rice market are low
- the present situation with regard to the assortment of product quality is satisfactory but in the future an operational grading system should be de-veloped that reflects the preferences of domestic consumers
- market information is available for all actors in the market but some ini-tiatives have to be taken to improve the quality of the information.
On the basis of these observations we conclude that the competitive forces in the market are strong and provide incentives to the actors to look for more efficient organizational forms to co-ordinate transactions. 7.3 Changes in market institutions The transition from a centrally controlled system to a market-oriented system in Vietnam has lead to some dramatic changes in market institutions. The analysis of institutional changes in Chapter 4 indicated that the government plays an im-portant role in this process as they define “the rules of the game”. The govern-ment imposes some key formal rules such as business laws to define the right of ownership and tax laws. Additionally, the actors in the market also define rules: “the play of the game”. On the basis of these rules new organizations or busi-ness relations are developed: private rice millers/polishers networks; wholesale-retail business relationships; and private transport co-operatives. As long as competition is strong these informal trade networks will help rice traders maxi-mize their profit, reduce marketing costs and increase the efficiency of the whole market system (See Section 4.7).
This section verifies whether available institutions facilitate exchange be-tween actors in the market. We want to assess whether the institutions are evolv-ing in a sense that they foster the market process and reduce transaction costs. Regarding transaction cost analysis, three characteristics determine the nature of a transaction: asset specificity, uncertainty, and frequency (See Section 2.3.2). The quality of the data obtained by the surveys does not allow us to quantify the transaction costs. Since, most rice traders are not able to estimate these costs per business transaction. However, we can assess to what extent asset specificity, uncertainty, and frequency may hamper the exchange process and whether insti-tutions are needed to facilitate this process.

Chapter 7: The Market Process
173
Transactions at the farm level Asset specificity: Rice farmers indicated that it was easy to find their clients in the market (usually local assemblers). It is not necessary to spend labour costs or time for searching the buyers. Asset specificity is not a problem to rice farmers and traders at this level, since they do not have to invest large amounts of specific capital when they exchange the product.
Uncertainty: Paddy is a raw and homogenous product. As long as domestic surpluses can be sold in the world market at attractive prices, no major market uncertainties affect the transaction process. The behavior uncertainty that arises from random acts of unpredictable changes in consumers’ preferences is small (See Section 2.3.2). Additionally, at farm level, paddy is usually marketed through personal contacts between farmers and assemblers/wholesalers (See Section 5.3 in Chapter 5), therefore, secondary uncertainty arising from lack of communication or the im-possibility to control the business contract is nearly absent. Frequency: Most rice farmers in the Mekong River Delta are medium and or small-scale farmers (cultivate around 0.2 – 0.5 ha) that sell only small amounts per transac-tion and only a few times per season. Therefore, the frequency of selling is not considered as a big issue at the farm level. In sum, at the farm level we have a spot market system. Only minor problems with asset specificity, uncertainty, and frequency were observed. The market system is functioning well. The available institutions seem to create a solid gov-ernance structure. This is a remarkable result as the private Vietnamese rice market became operational only recently. Transactions at the assembling level Asset specificity: Rice assemblers mainly provide transport and wholesale services in the market. As mentioned in Chapter 5, boats and trucks are main transportation means of rice assemblers. Very few rice assemblers invest money for building up the warehouse to store their products, since after buying they usually transport their products to other regions for immediate selling. Moreover, most rice assemblers use these kinds of transport and storage facilities for all transactions and other trading purposes. This means that they do not make major investments in trans-
The Organization of the Liberalized Rice Market in Vietnam
174
action specific assets. It implies that asset specificity is not a problem at the assembling level. Uncertainty: At the assembling level, rice assemblers classify rice products into only two kinds: C1 – long-grain rice, and C2 – medium/short-grain rice (See Section 4.4.3). The major quality criterion concerns the ‘broken level’. Product differen-tiation is not a major item for their clients. This implies that behavior uncertainty (changes in consumers’ preferences) is not a big issue to rice assemblers.
Due to the fact that most transactions are based on spot market exchange, no major problems were found with regard to secondary uncertainty. We also observed that some formal institutions were adapted in order to facilitate the ex-change on this level: The government has completely removed the checking points between the borders of the provinces. Nowadays, local-rice assemblers and distance assemblers/wholesalers are free to deliver their products to other market places. The government also decided to eliminate the “transaction tax” for rice assemblers and distance assemblers/wholesalers (See Section 4.7.2). In sum, uncertainty related to domestic rice trading is not a big problem at the as-sembling level.
Frequency: Assemblers can reduce search costs by establishing ongoing relationships with other rice traders and farmers in their trading networks (informal business groups). By establishing ongoing relationships they can save costs in terms of reducing search time, improve trust and realize stable supply and demand for their products. Despite the fact that most exchange takes place on the basis of spot market contracts, we observed that many traders develop ongoing business relationships in order to facilitate the search process. This indicates that traders develop the institutions necessary for efficient co-ordination of these transac-tions (the play of the game). In brief, at the assembling level, asset specificity, uncertainty as well as fre-quency are not constraining the business transactions. Some traders try to estab-lish ongoing (vertical) trading relationships. They are looking for possibilities to adapt the play of the game. As long as competition in this market segment is fierce it can be expected that this will help to minimize transaction costs and to develop more efficient marketing channels.

Chapter 7: The Market Process
175
Transactions at the wholesaling level Asset specificity: Rice wholesalers in this study mainly provide wholesale services to the market-ing channel. They buy rice mostly from millers, assemblers and sell it to rice re-tailers. As mentioned in Chapter 5, the rice wholesalers invest some money for building up warehouse capacity to store their products. They also own small trucks and motorbikes. However, these investments are used for all transactions and also for other trading purposes. This means that they do not make major in-vestments in transaction specific assets. It implies that at the wholesaling level asset specificity does not hamper the exchange process. Uncertainty: As presented in Chapter 4, at the wholesale market, rice wholesalers usually classify their products in two categories: C1 – long-grain rice, and C2 – me-dium/short-grain rice. The most important quality criterion they apply concerns the ‘broken level’. This implies that behaviour uncertainty (changes in consum-ers’ preferences) is not a major phenomenon. With regard to primary and secon-dary uncertainty the same conditions apply that were described for assemblers. Frequency: The result in Chapter 4 shows that, most rice wholesalers pay more attention to establishing ongoing relationships with assemblers, millers and retailers. Through these trading networks, rice wholesalers and other traders save search costs, build trust and guarantee stable supply and demand for their products. This indicates that suitable institutions are developed in order to co-ordinate these transactions (the play of the game). In sum, at the wholesale level, asset specificity, uncertainty and frequency do not constrain the market exchange process. Establishing good relationships with some regular clients in both buying and selling activities are important to rice wholesalers. The vertical trading networks help to reduce transaction costs and to develop more efficient marketing channels. Transactions at miller level Asset specificity: Rice millers/polishers perform processing and wholesale functions. They invest in rice-milling/polishing machinery and a drying facility. The sunk costs in-volved in the establishment of a milling facility may be important. However, these investments are not transaction specific. Therefore asset specificity is a minor problem in the co-ordination of exchange.
The Organization of the Liberalized Rice Market in Vietnam
176
Uncertainty: With respect to product quality standards, rice millers/polishers usually differen-tiate their products based on the ‘broken level’ (C1 and C2 rice quality). In the domestic rice market, the preferences of rice consumers are stable. Most private rice millers/polishers in this study face some uncertainties on the output market. This market depends heavily on export prices, export demand and export quota, as a major share of rice production in the Mekong River Delta is exported. This explains why they are actively seeking stable business relationships with the ex-porting State Owned Enterprises. Frequency: Millers usually contact their regular clients 2 –3 times a week during the peak season and once a week during the off-season. This implies that frequency in buying-selling is important. Sufficient paddy storage should guarantee the per-manent use of the milling machinery. However, we observed that the involved partners are able to adapt the play of the game to their needs. Proper institutions, e.g. ongoing business relationships with suppliers, are developed to co-ordinate the exchange process. Moreover, millers in the same network help each other if one of the partners is not able to deliver in time the required quantity. Our study found that rice millers/polishers spend time and money to obtain in-formation about prices; where to sell; which marketing services to provide at what costs; etc. In each rice mill, there is at least one person responsible for searching information and “business relations”. According to our survey, that person usually is the owner of the rice mill. He or she has to spend around 1 – 2 hours per day for searching and negotiating with clients. In sum, at the miller level, most transactions look like forward market transac-tions. Establishing ongoing relationships with regular clients is important to rice millers/polishers. The results indicate that the play of the game is adapted to the changing market conditions. No major constraints were observed that hamper this process. Therefore we conclude that asset specificity, uncertainty and fre-quency, do not hamper their business transactions. Transactions at retail level Asset specificity: Rice retailers do not invest in any transaction specific capital. Their investments mainly concern weighting scales, transportation means (small motorbike), com-munication facilities (telephone). Those facilities are used for all trading pur-poses. This implies that asset specificity is not a problem at this level.
Chapter 7: The Market Process
177
Uncertainty: At the retail level, secondary and behavior uncertainty do not hamper the ex-change process. The business institutions are stable and rice is a rather homoge-nous staple food. Frequency: Trade relationships between rice retailers and final consumers resemble the con-ditions of a spot market. Payment is mostly in cash (no financial links with cli-ents) and rice is delivered immediately. Frequency of selling to regular clients is not a major issue. We conclude that asset specificity, uncertainty, and frequency are easily accommodated in the retail market. The formal rules do not hamper the operation of the traders and the play of the game is based on spot market re-lationships. In sum, the above analysis of institutional needs indicates that the process of market liberalization in Vietnam has created favorable conditions for rice traders to operate their business in an efficient way. New market institutions in particu-lar the vertically integrated trade relationships facilitate the development of more efficient channel formats. 7.4 Practical problems in the rice marketing system In this section, the dynamic effects from market performance to market structure and conduct are analyzed. We try to verify whether the market process produces the incentives that accommodate the deficiencies. This analysis shows whether there are barriers that hamper the process of further channel improvement. Credit issue The situation of credit constraints and financial relationships in rice trading that was presented in Chapter 5 shows that all marketing agents recognized that ac-cess to credit is one of the most important constraints to their businesses. Section 4.4.1 indicated that lack of investment capital is the most difficult problem to rice millers/polishers. They have to invest quite large amounts of capital for buying transportation equipment, drying and milling facilities and warehouses. The commercial state banks can offer them money for investing in their busi-ness. However, most of them prefer to borrow from the private banks and/or moneylenders. The main obstacle is that the procedure to apply for borrowing from the commercial state banks is complicated as compared to private banks and/or moneylenders. Rice traders have to fulfill some strict requirements in or-der to get access to loans from the state banks (good business plan, collateral,

The Organization of the Liberalized Rice Market in Vietnam
178
long-term relationship with the banks - See Section 5.4.5). Moreover, the state banks offer 3, 6, or 12 month borrowing (flexible credit is not available), while rice traders regularly only need “hot borrowing”. They look for additional working capital for short periods of time - one or two weeks only. Therefore, in practice many rice traders prefer to obtain money from moneylenders and or private banks. The private trade sector provides a partial solution for the credit constraints trad-ers are facing and in particular for the need of “hot borrowing”.. The vertically integrated trading networks of rice traders offer credit to their members: ad-vanced or deferred payment. However, the major solution for long-term credit is to be found outside the rice sector. The banking system should offer trade credit on more flexible conditions (short and long-term) in order to satisfy the credit needs of the rice traders. Milling technology As discussed in Chapter 6, marketing margins of rice millers are high as com-pared to other traders. Especially local rice millers with old milling machines face high processing costs. First of all, old milling machinery leads to lower conversion ratios (See Section 5.4.3). It means that the old rice mills incur a high degree of losses as compared to other millers. Secondly, old rice mills bear high fuel costs, electricity costs as well as costs of maintenance. Finally, the quality of rice after milling is relatively low (refers to degree of broken rice and degree of whiteness).
To a certain extent the process of competition between rice millers in the market will solve the above problem on milling technology and processing costs. First of all, through competition, inappropriate milling techniques will be driven out of the market. Secondly, trade relationships between millers/polishers (See Section 5.5), may lead to segmentation in rice processing: small/old rice mills specialize in milling raw products. The intermediate product (usually brown rice) can be further processed by large/high-tech millers/polishers. Through specialization, losses can be reduced103 and rice millers/polishers also can save fuel, electricity costs as well as costs for maintenance. This implies that the market process creates incentives to accommodate this problem.
103 Small/old rice mills are suitable for processing paddy to brown rice. The quality of rice and the conversion ratio from paddy to rice, are relatively low for small/old rice mills. Moreover, processing costs for white rice of small/old rice mills is high if compared to large/high-tech rice mills (Tu, Phan Anh. 1999).

Chapter 7: The Market Process
179
Unstable output market The result of the market structure analysis in Chapter 4 indicated that large-scale millers/polishers still face a problem in the output market. During the peak sea-son a rice surplus exists in the domestic market and millers/polishers highly de-pend on export demand and the buying capacity of the SOEs. Additionally, dur-ing the peak season, the world market price of rice usually decreases. Conse-quently, most SOEs only purchase rice from their regular clients (based on an ongoing trade relationship). During the off season, shortage of rice supply oc-curs in the market. The SOEs face a problem of lack of rice supply for export. The above analysis implies that there is a need for new market institutions. For-ward contracting may be a suitable solution to solve this problem. Private mill-ers/polishers should establish close relationships with the SOEs - through so-called vertical trading networks. This kind of vertical trading network is already observed in the market, showing that the market process may create a solution. However, taken into account the importance of the export market, the develop-ment of a formal futures market where rice contracts can be traded may provide a better structural solution. To date no initiatives are taken to establish such a market. We note that part of the solution of this problem has to be found in proper governance structures for exchange relationships with the foreign im-porters. However, these relationships were not part of this study and require fur-ther research. Quota system One other important issue in rice trading is the quota for export. The quota and the control of the number of rice exporters are being loosened. Since 1999, the government allows the private sector to obtain export quota. This change has encouraged private rice traders to enter the international business. In 2001, 8 new private companies exported around 7 percent of the total rice exports. How-ever in order to receive an export quota private exporters have to fulfill the re-quirements for being a member of the Vietnamese Food Association (VFA). 104 For most private exporters it is difficult to obtain good facilities and enough capital for processing and storing more than 500 tons of high quality export rice. Another difficult requirement for them is that they have to show that they have sufficient negotiating experiences with foreign importers. Moreover, I already observed that it is more difficult for private traders than for SOE’s to get access to credit. This implies that private rice exporters still face some implicit barriers for export. 104 In order to become member traders are required to have handling facilities and capital for processing and storing at least 500 tons of high quality rice. Moreover, they need to have in-ternational negotiating experiences.
The Organization of the Liberalized Rice Market in Vietnam
180
We recall that the long-run strategy of the government is to attract more private traders to become active in the export market. In order to promote rice exports, the export tax rate was reduced from 1.5 percent in 1996 to 1 percent in 1998 and recently to zero percent. In conclusion, export quota are still important and restrict entry to a small num-ber of private companies. In the near future it will be a major challenge to ac-commodate this problem. A liberalized export market needs additional institu-tions to coordinate exchange and to guarantee sufficient supply in the domestic market. We recall that this study focuses on the domestic rice market, therefore we need further research to analyze this issue.
In summary, the above analysis on practical problems in the rice marketing sys-tem briefly presents the general picture of the changing process in the rice mar-keting system in Vietnam. We conclude that competition and the new institu-tional environment have created many incentives to improve existing channel formats. However, some problems were identified that need further attention from policy makers: credit programs of the formal banking system, the quota system and the desirability of a futures market for rice. 7.5 Conclusions 1. In recent years, economic reforms in Vietnam have created many changes in
agricultural production and have led to drastic changes in the rice market structure, conduct, and performance. The result of market structure analysis indicates that the rice market in Vietnam can be characterized by competi-tion. Important barriers to entry into the rice business are absent, the degree of trader concentration is low, rice products are marketed in a rather ho-mogenous form, and market information is easy to obtain.
2. The marketing channel through which paddy/rice passes from farmers to fi-nal consumers is quite complex. There are eight main rice marketing chan-nels. In the domestic rice market, private rice traders, including assemblers, wholesalers, brokers, and small millers, have an important role in distributing the product to regional and inter-regional consumers. Channel No. 6 and channel No. 8 are the most important channels in the domestic markets (See Table 4.16). Large millers/polishers and in particular the SOEs control the export channels (channel No. 1, channel No. 3, and channel No. 5 are the most important channels – See Table 4.16). The free market orientation in Vietnam has created a favorable environment for private rice traders. The na-tional trade flows are completely liberalized offering a good opportunity for increasing the efficiency of the marketing systems.

Chapter 7: The Market Process
181
3. With regard to rice market conduct, the major finding is that rice traders per-form different marketing functions: transportation, storage, negotiation, proc-essing, market information, and financing. Boats are the most popular means of transportation. Transportation, loading and unloading costs do not vary much among rice traders. Storage is more important to rice millers/polishers in order to guarantee supply to their milling machinery. Storage for specula-tive purpose is a minor activity for rice traders. As the seasonal price compo-nent is small (maximum of 10%) this activity is not expected to be profitable. Trade credit is relatively important for transactions between rice wholesalers and retailers; and between rice millers/polishers and the SOEs. The rice wholesalers can give credit to the rice retailers in terms of deferred payment. In contrast, the rice millers/polishers can receive money in advance from the SOEs. Operating in an open/free market, rice traders are flexible and deliber-ately decide which suppliers they use and which customers they will serve. The relationship between them is mostly based on reputation and trust. Most transactions take place on the spot but others develop business relationships, however, they fully volunteer to establish that kind of relation.
4. The analysis of market performance found that rice producers and traders in the market offer suitable types of rice quality to satisfy consumer prefer-ences. Domestic channels of rice distribution are organized quite effectively to provide the convenient form and quality of the product to final consumers. Dependent on the benchmark used, the rice assemblers and retailers may be considered as most efficient in trading as they obtained the highest percent-age of profit to gross marketing margins. In contrast, the rice mill-ers/polishers seem to be inefficient owing to their relatively higher percent-age shares of marketing cost to gross marketing margins. However, if we compare net rates of profit on invested capital the picture is completely dif-ferent: rice millers/polishers obtain the highest net rate of profit on invested capital and rice retailers the lowest one (See Section 6.3.2 and Table 6.8). We showed that they realize reasonable profit rates that are close to the bank in-terest rates. Therefore, we conclude that competitive forces in the market are operational.
5. Regarding market integration, our study found that all major market places in the Mekong River Delta are highly integrated. Rice prices in different market places follow the export price and the prices in HCM City. Due to the long distance, markets in the North are not strongly integrated with the Mekong Delta markets. At the international level, the export price of Vietnamese rice, which is controlled by the government, is highly correlated with the world price (Thailand price). The price formation process in both domestic and ex-port rice markets cohere. This implies that the floor price policy of the government follows the price pattern in the world market.

The Organization of the Liberalized Rice Market in Vietnam
182
6. In general, the process of competition and institutional development in the market has created a favorable environment to remove major obstacles to the development of an efficient and effective marketing system. This explains why the rice market in Vietnam, especially in the Mekong River Delta, be-came competitive in the world market.
7. The private sector has responded very strongly to the incentives provided by the market oriented policies. The marketing system is characterized by a mul-titude of small marketing agents involved in trading and milling. Large rice millers/polishers and wholesalers supply both domestic and international markets.
8. Both private and state marketing channels are improving step by step through the process of market liberalization. However, there is still room for further improvements of the private marketing system. We observed some minor problems with regard to barriers to entry; access to credit and finance; and access to market information.
9. Most important is our observation that the state farms and the state owned food companies, still dominate the export sector. To date, the largest share of the total marketable surplus in the rice market is finding its way to the final consumer through these organizations (in particular milling activities and dis-tribution to retailers and the export market). It shows that privatization still has a long way to go. The crucial question in the near future is to know how this can be realized without jeopardizing supply to the domestic market.
7.6 An improved channel format Taking into account the results of this study we designed a marketing channel for the near future in Vietnam. It distinguishes the different actors that play im-portant functions in rice distribution. - Vertical Trading Networks Nowadays, vertical trading relationships between rice assemblers, millers, bro-kers, long-distance buyers, wholesalers, and retailers become important (See Section 4.7.3). This kind of vertical trading networks will reduce marketing costs and credit constraints in the marketing systems. By establishing an ongo-ing relationship with the members of their business groups, traders can save costs in terms of reducing the search time when signing a contract and they also can offer credit to their members in the network (using advance or deferred payment). As a whole, this vertical trading network will create favourable condi-tions for further improvements. This implies that the creation of these networks should be supported by government policy.
Chapter 7: The Market Process
183
- State Owned food Companies The SOEs in the Mekong River Delta still have an important role to play in the processing of rice for both domestic and export markets. Through procurement stores of the SOEs, the government can influence rice supply and demand in the domestic market (keeps the product at the floor price in line with the Food Secu-rity Program – See Section 4.7). Therefore, the government should continue to support the SOEs in the Mekong River Delta. - Facilitators Financial constraints hamper procurement operations, storage activities, and in-vestment in processing machinery. Private rice traders need access to credit and State and non-state commercial banks have to facilitate this process. They should offer better services with regard to lending money (offer flexible credit, simplify borrowing procedures) for private rice traders and exporters (See Sec-tion 7.4).
Regarding the transport service, nowadays, hiring transportation means are quite popular to many rice traders. Instead of investing their own capital, most rice millers/polishers as well as wholesalers prefer to hire transportation means from the so-called transport co-operatives (See Chapter 4). This reduces the costs of transportation. Since the transport co-operatives can optimize their shipments by choosing the best solution by adapting local transport capacity to transport demand. Moreover, by using hired-transport facilities, rice traders avoid troubles that can happen on the road. The transport co-operatives should be encouraged to provide proper transport services to the rice traders.
As dicussed in Section 7.2, the existing wholesale grading system for rice qualities still has some deficiencies. This grading system facilitates the whole-sale and export channel, but does not reflect consumer preferences in the domes-tic market. Therefore, the organization of grading and quality control is impor-tant to facilitate both the domestic and the export channel system.
Regarding market information, there are many sources of market informa-tion that rice traders can consult. However, due to the variety of sources of mar-ket information, the available information is not always systematic and reliable. To solve this problem a public market information center is necessary to facili-tate rice traders.
Related to the export activity, the office of international trade promotion is important. Since, it will support both private and state export companies to advertise their trademarks and search for new export markets in the world.
- The retail market Nowadays, the process of urbanization in Vietnam is very fast. Consumers in urban market places are familiar with buying goods and commodities in super-markets. Therefore, in the near future, new channel formats including supermar-
The Organization of the Liberalized Rice Market in Vietnam
184
kets are expected to develop in order to offer a suitable retail service to urban rice consumers. - The Export Market Most private export companies in the Mekong River Delta still export indirectly through the SOEs of the province or with the support of the Vietnamese Food Association (VFA). The VFA and the SOEs play an important role in coordinat-ing and supporting the private export companies that become operational in the international markets. The VFA can support private exporters in terms of search-ing for new export markets and providing relevant market information. At this moment in time co-operation between SOEs and private exporters may reduce uncertainty and increase the efficiency of the private export channel systems. In sum, all the proposed organizations/facilitators play an important role in rice distribution and may contribute to a more efficient marketing channel.
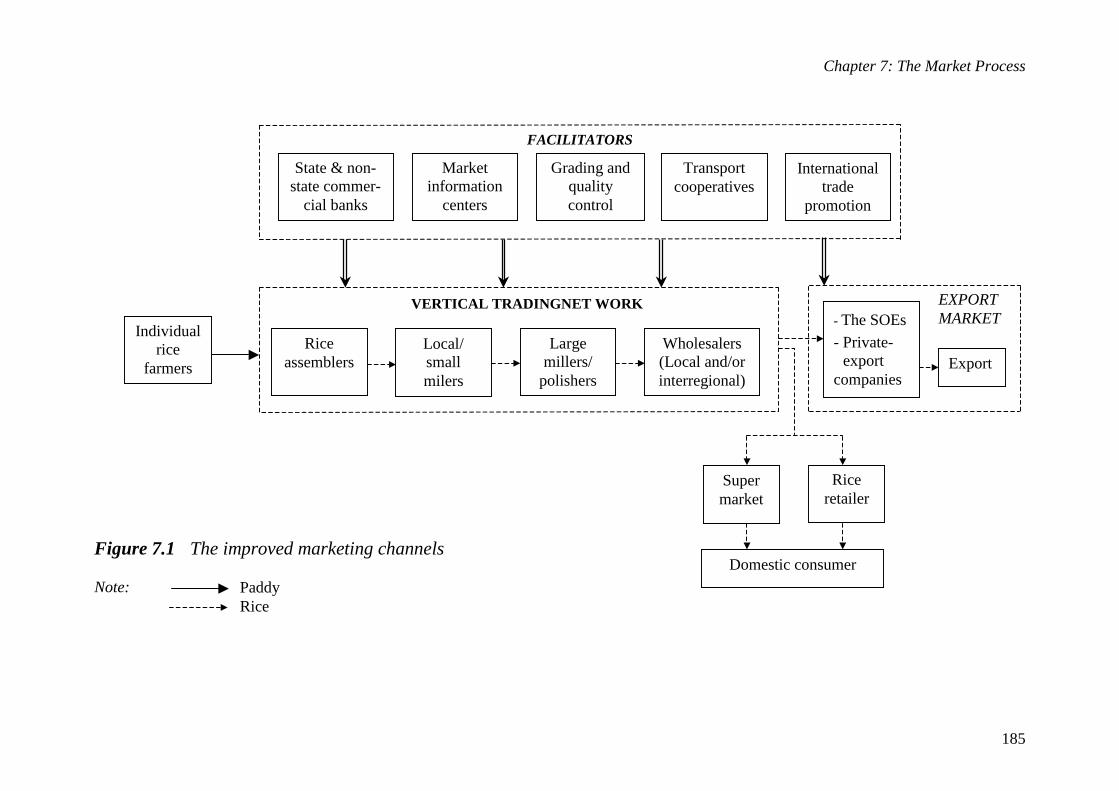
Chapter 7: The Market Process
185
Figure 7.1 The improved marketing channels
Note:
Super market
Rice retailer
Domestic consumer
- The SOEs
- Private-export
companies Export
Grading and quality control
State & non-state commer-
cial banks
Market information
centers
Transport cooperatives
FACILITATORS
International trade
promotion
EXPORT MARKET
Local/ small milers
Large millers/
polishers
Wholesalers (Local and/or interregional)
VERTICAL TRADINGNET WORK
Individual rice
farmers
Rice assemblers
Paddy Rice

The Organization of the Liberalized Rice Market in Vietnam
186
7.7 Some recommendations for policy makers
1. In co-operation with the trade organizations, the government should develop a systematic grading standard and improve quality control systems for rice (See Section 4.4.3). In the near future, Vietnamese rice should become a trade mark in both domestic and export markets. This will improve the repu-tation of Vietnam rice exporters among foreign buyers (See Section 5.3.1).
2. The government should promote rice exports. In particular the office of in-ternational trade promotion has an important role in supporting both private and state export companies. The government should assist the SOEs and pri-vate exporters to search for new export markets in the world.
3. The government should continue to remove the quota for private exporters. The competition between private traders and the SOEs are expected to lead to lower cost of marketing and improve the efficiency of the market system. However, at the same time the government should take the initiative to launch a research program to analyze how this liberalization strategy should be implemented to minimize potential negative effects on domestic rice sup-ply.
4. With respect to market information, there are many sources of information that rice traders can obtain in the market (See Chapter 4). However, a nega-tive consequence of the many sources of market information is that some of the information is incomplete and can not be trusted. Therefore, there is a need for government policy to improve the quality of information. Central to this policy is the extension of marketing information through public channels (market information center) in order to provide good and trusted information on both the export and the domestic market to rice traders.
5. The development of a futures market where rice contracts can be traded may provide a solution to the problem of the unstable output market (See Section 7.4). The government is expected to play an important role in the establish-ment of such a market place.
6. The government should focus on issuing suitable institutions/rules in order to facilitate the new channel formats. Striving for an improved access to credit, market information, transportation and grading are important objectives (See Figure 7.1).
References
Arraudeau, M.A. and Xuan, Vo-Tong (1995). “Opportunities for Upland Rice Re-search in Vietnam”, In: Denning, G.L and Xuan, Vo-Tong (ed.), Vietnam and IRRI: A Partnership in Rice Research. IRRI, Los Banos, Philippines.
Ahmed, R and Rustagi, N (1985). “Agricultural Marketing and Price Incentives: a Comparative study of African and Asian Countries”, In: Agricultural and Food Marketing in Developing Countries: Selected Readings (John Abbott). Technical Center for Agricultural and Rural Co-operation, pp.333-340.
Ahmed, R. and Bernard, A. (1989). “Rice Price Fluctuation an Approach to Price Stabilization in Bangladesh”, International Food Policy Research Institute, Re-search Report 72.
Alderson, W. (1967). “Factor Governing the Development of Marketing Channels”, In: B. Mallen (ed.) The Marketing Channel, A Conceptual view point. New York: Wiley, pp. 35-40.
Alexander, C and J. Wyeth. (1994). “Co-integration and Market Integration: An Ap-plication to The Indonesian Rice Market”, Journal of Development studies, Vol. 30, No. 2, pp. 303-328.
Anderson, W (1996). “Transaction Cost Analysis and Marketing”, In: Transaction Cost Economics and Beyond, John Groenewegen, Ed. Boston Kluwer Academic Publishers, pp. 65-83.
Bain, J.S. (1968). Industrial Organization, 2nd Edition, John Wiley, New York.
Barker, R. (1994). “Investment Priorities for Sustaining Agricultural Growth and Ru-ral Development”, In: Barker, R (ed.), Agricultural Policy Analysis for Transi-tion to Market Economy in Vietnam: Selected Issues, Rome: FAO.
Barry, K.G and Schroeder, T.C. (1991). “Co-integration Test and Spatial price Link-ages in regional Cattle Markets”, American Journal of Agricultural Economics, pp. 452-464.
Bateman, D.I. (1976). “Agricultural Marketing: A Review of The Literature of Mar-keting Theory and of Selected Application”, Journal of Agricultural Economics, Vol. 27, pp. 171-224.
Baumol, W.J., Panzar, J.C. and Willig, R.D. (1988). “Contestable Markets and the Theory of Industry Structure”, In: Rev. ed., HBJ Publishers, San Diego.
Bressler, R, G. and King, R. A. (1979). Markets, Prices and International Trade. New York: John Wiley and Sons, Inc.
Caves, R. (1982). American Industry: Structure, Conduct, Performance, 5th Edition. Englewood Cliffs, NJ, USA: Prentice Hall.
Chandan, M; White, H and Wuyts, M (1998). Econometrics and Data Analysis for Developing Countries, Prentice Hall.

The Organization of the Liberalized Rice Market in Vietnam
190
Clague, C (1997). “Institutions and Economic Development: Growth and Governance in Less-Developed and Post-Socialist Countries”. The Johns Hopkins Press. Ltd. London.
Clodius, R.L. and W.F. Mueller (1961). “Market Structure Analysis as an Orientation of Research in Agricultural Economics”. Journal of Farm Economics, 43,3, 515-553.
Coase, R.H. (1937). “The Nature of The Firm”. Economica, 4, pp. 386 – 405.
Coase, R.H. (1960). “The Problems of Social Cost” Journal of Law and Economics, 3, pp. 1 – 44.
Coughlan, A.T.; Stern, L.W., and Ansary, A.I.E. (2001). Marketing Channels, 6th Edition, Prentice Hall International.
Cramer, G. Wailes, E.J and Philips, S (1990a). “The Impact of Liberalizing Trade on the World Rice Market: A Spatial Model including Rice Quality”, Department of agricultural Economics and Rural Sociology, University of Arkansas. Staff Re-port No. 0390.
Cramer, G; Wailes, E.J; Philips, S and Gorowski, J (1990b). “The Impact of Liber-alizing Trade on the World Rice Market”. Paper presented at the American Agri-cultural Economics Association, Vancouver, British Columbia, August 1990.
Dijkstra, T. (1997). “Horticultural Marketing Channels in Kenya: Structure and de-velopment”, Ph.D. Thesis, Wageningen University, The Netherlands. 253p.
Duc-Hai, Luu-Thanh (1993). “Market Structure, Conduct, and Performance Analy-sis: The Case of Shrimp Industry in the Mekong River Delta, Vietnam”. Unpub-lished Master Thesis, University of The Philippines.
Duc-Hai, Luu-Thanh and Hiep, Phuoc Minh (1998). “Analyzing Rice Market: The Case of Cantho Province”. Research Project Funding by University of Cantho. Published in The Journal of Cantho University, 1999.
Elliot Berg (1989). “The Liberalization of Rice Marketing in Madagascar”, In: World Development, vol. 17, no. 5, pp. 719-728.
Engle, R. and Granger, C.W.J. (1987). “Co-integration and Error Correction: Repre-sentation, Estimation and Testing”, Econometrica, 55, p. 251-276.
Faminow, M.D and Benson, B.L. (1990). “Integration of Spatial Markets”. American Journal of Agricultural Economics”, pp. 49-62.
Ferguson, R.P. (1992). Industrial Economics: Issues and Perspectives. Macmillan, London.
Gary, L.F; Jammes, D.G and Sudhir, H.K. (1989). “Dealer Dependence Levels and Reciprocal Actions in a Channel of Distribution in a Developing Country”. Jour-nal of Marketing, Vol. 53, pp. 50-69.
General Statistic Office (1991). “Statistical Yearbook”, Hanoi, Vietnam.
General Statistic Office (1992). “Statistical Yearbook”, Hanoi, Vietnam.
General Statistic Office (1996). “Statistical Yearbook”, Hanoi, Vietnam.
References
191
General Statistic Office (1997). “Statistical Yearbook”, Hanoi, Vietnam.
General Statistic Office (1998). “Statistical Yearbook”, Hanoi, Vietnam.
General Statistic Office (1999). “Statistical Yearbook”, Hanoi, Vietnam.
General Statistic Office (2000). “Statistical Yearbook”, Hanoi, Vietnam.
General Statistic Office (2001). “Statistical Yearbook”, Hanoi, Vietnam
Geroski, P; Gilbert, R.J. and Jacquemin, A. (1990). Barrier to Entry and Strategic Competition. Harwood Academic Publishers, London
Goletti, F. and Elleni, C.T. (1995). “Analyzing Market Integration”, In: Price, Prod-ucts, and People: Analyzing Agricultural Markets in Developing Countries (Gregory J. Scott). International Potato Center.
Goletti F. and Minot. N. (1996). “Rice Market Monitoring and Policy Options Study”. Prepared for The Asian Development Bank by IFPRI, USA.
Goodwin, B.K. and Schroeder, T.C. (1991). “Co-integration Test and Spatial Link-ages in Regional Cattle Markets”. American Journal of Agricultural Economics, May 1991, p. 453-464.
Goossens, F. (1994). “Performance of Cassava Marketing in Zaire”. Ph.D. Thesis, Leuven: Catholic University of Leuven,.
Hanson, P. and Simmons (1995). “Measure of Buyer concentration in the Australian Wool Market”. Review of Marketing and Agricultural Economics. Vol. 63, No.2, August 1995.
Harriss, B. (1979). “There is Method in My Madness: or is it Vice Versa? Measuring Agricultural Market Performance”. In: Agricultural and Food Marketing in De-veloping Countries: Selected Readings (John Abbott), Technical Center for Agri-cultural and Rural Co-operation, pp. 34-40.
Harriss, B. (1982). “Agricultural Marketing in the Semi-arid Tropics of West Africa”. East Anglia Development Studies Paper.
Harriss, B. (1993). “Markets within Markets and no Markets at all: Maps and land-scapes of grain markets in South Asia”. Paper presented at Workshop on Meth-ods for Agricultural Marketing Research, March 1993, CIP/IARI New Delhi, In-dia, 49 p.
Hayami, Y. (1994). “Strategies for the Reform of Land Property Relation”. In: R, Barker (ed.) Agricultural Policy Analysis for Transition to a Market-Oriented Economy in Vietnam. Rome: FAO.
Heytens, P.J. (1986). “Testing Market Integration”. Food Research Institute Studies, p.25-41.
Hillman, J.S. and Robert A. R. (1988). “Agricultural Trade and Protection in Japan”, Themes Essay No. 52, Trade Policy Research Center, London.
Hodder, B.W. (1969). “Markets in Yorubaland”. In: B.W. Hodder and U.I. Ukwu (eds). Markets in West Africa. Ibadan: Ibadan University Press.

The Organization of the Liberalized Rice Market in Vietnam
192
Hung, Nguyen Tri (1995). “Rural Reforms and Food Crop Growth in Vietnam Un-published Master Thesis, University of The Philippines.
IBRD – International Bank for Reconstruction and Development (1993). “Viet-nam: Transition to the Market”. World Bank: Washington, D.C. September.
IRRI – International Rice Research Institute (1991). “World Rice Statistics 1990”. Los Banos, Laguna, Philippines.
Ito Schoichi, Wesley, E.; Peterson, F. and Grant, W.R. (1989). “Rice in Asia: Is it becoming an Inferior Good?”, American Journal of Agricultural Economics, 71(1): 32-42.
Jones, W.O. (1974). “Regional Analysis and Agricultural Marketing Research In Tropical Africa: Concepts and Experience”. Stanford Food Research Institute Studies, 13(1), p. 3-28.
John, H.; Hunter, J. and Lewis, C. (1995). “The New Institutional Economics and Third World Development”.
Khiem, Nguyen Tri and Pingali, P. (1994). “Market Reform and Food Supply Sys-tem: The case of Vietnam”. International Food Policy Research Institute. Pro-ceedings of the Third International Workshop on Projections and Implications of Long-term Rice Supply and Demand in Asia, Bangkok, Jan 20-24, 1994.
Khiem, Nguyen Tri and Pingali, P. (1995). “Supply Response for Rice and Three Food Crops in Vietnam” .In Vietnam and IRRI: A partnership in Rice Research.
Khiem, Nguyen Tri and Duc-Hai, Luu-Thanh (1995). “Commercialization of Agri-culture Input Supply System in the Mekong Delta”. Paper presented at the Work-shop on Development of Agro-Economics Structure and Co-operatives for Small Farmers in the Mekong Delta, Cantho, Vietnam.
Kim, Hong Minh (1993). “Rice Marketing Study in Vinhlong Province, Mekong Delta, Vietnam” Unpublished Master Thesis, University of The Philippines.
Kirzner, I.M. (1973). “Market Process versus Market Equilibrium”, Adapted from Kirzner I.M, Competition and Entrepreneurship, Chicago and London: Univer-sity of Chicago Press, 1973, pp. 5-29.
Koch, J.V. (1980). Industrial Organization and Prices, 2nd Edition. London, UK: Prentice/Hall International.
Kohls, R.L. and Uhl, J.N. (1990). Marketing of Agricultural Products, 7th Edition, New York, Macmillan.
Kotler, P. and Zaltman, G. (1971). “Social Marketing: An Approach to Planned So-cial Change”, Journal Market, Vol. 35, No.3, p.3-12.
Kotler, P. (1988). Marketing Management: Analysis, Planning, Implementation, and Control, 6th Edition. Upper Saddle River, NJ: Prentice Hall International.
Kotler, P. (1997). Marketing Management: Analysis, Planning, Implementation, and Control, 9th Edition. Upper Saddle River, NJ: Prentice Hall International.

References
193
Lantican, F. A. (1983). “The Structure, Conduct and Performance of the Philippines Fruits and vegetable Trucking Industry”, Unpublished Ph.D. dissertation, Colo-rado state University, Fort Collins, Colorado, USA.
Lutz, C.H.M. (1994). “The Functioning of the Maize Market in Benin: Spatial and Temporal Arbitrage on the Market of a Staple food Crop”, Ph.D. Thesis, Univer-sity of Amsterdam, The Netherlands, 255 p.
Lutz, C.H.M. and Tilburg, A (1992). “Methodology to Evaluate The Performance of Markets in The Food Marketing Channel: With an Application to Periodic Mar-kets in Benin”. Paper Presented at Workshop on Methods for Agricultural Mar-keting Research, March 1993, CIP/IARI, New Delhi, India, 24 p.
Lutz, C.H.M. (2002). “Liberalization of Food Markets in Benin. The Important of So-cial Capital and an Anti-Trust Policy”. Paper Presented at the SOM/CDS Semi-nar on Food Markets in Developing Countries, January 2002, Groningen Univer-sity, The Netherlands, 17 p.
Maddala, G.S. (1992). Introduction to Econometrics, 2nd Edition, MacMillan Publish-ing House, New York.
Mallen, B. (1977). Principal of Marketing Channel Management. Lexington, MA: Lexington Books.
Marlone, A. and Thomas, W (1987). “Modeling Coordination in Organizations and Markets” Management Science, 33 October, 1317-32.
Matthews, R.C.O. (1986). “The Economics of Institutions and Sources of Growth”. In The Economic Journal, pp. 903-918.
McCammon, B.C.Jr. (1970). “Perspectives for Distribution Programming”. In: L.P. Bucklin (ed.), Vertical Marketing Systems, Scott Foresman and Company, Illnois.
Mitchell, D.O., Ingco, M.D. and Ducan, R.C. (1997). The World Food Outlook, Cambridge University Press, Great Britain.
Meulenberg, M.T.G. (1986). “The Evolution of Agricultural Marketing Theory: To-wards better Coordination with General Marketing Theory”. Netherlands Journal of Agricultural Science, 34, 301-315.
Mudiantono (1990). “The use of Structure, Conduct and Performance of the Market to Measure the Marketing Efficiency”, A theoretical framework. MEB 2(1): 53-59.
Nielsen, C.P. (2002). “Vietnam in the International Rice Market: A Review and Evaluation of Domestic and Foreign Rice Policies”. Report No. 132, Danish Re-search Institute of Food Economics, Copenhagen.
Nielsen, C.P. (2002). “Vietnam Rice Policy: Reforms and Future Opportunities”. Working Paper No. 8/02. Danish Research Institute of Food Economics, Copen-hagen.
North, D.C. (1989). “Institutions and Economic Growth: An Historical Introduction”. World Development, Vol. 17, No. 9, p. 1319-1322.

The Organization of the Liberalized Rice Market in Vietnam
194
North, D.C. (1991). “Institutions”. Journal of Economics Perspective. Vol. 5, No. 1, p. 97-112.
North, D.C. and J.J. Wallis (1994). “Integrating Institutional Change and Technical Change in Economic History. A Transaction Cost Approach”. Journal of Institu-tional and Theoretical Economics, 145/1 – pp 609 – 624.
Padberg D.I., Ritson, C. and Albisn, L. M. (1997). “Agro-Food Marketing”. Cab In-ternational Press.
Palaskas, T.B, and Harriss, B. (1991). “Testing Market Integration: new approaches with case material from the West Bengal food Economy”, Oxford Institute of Economic Analysis.
Phuoc, Do Ngoc (1959). “Rice Marketing Channels in the South Vietnam”, Research Paper, Economic Developing Study, South Vietnam.
Pingali, P. and Xuan, Vo-Tong (1992). “Vietnam: Agricultural De-collectivization and Rice Productivity Growth”, Economic Development and Cultural Change 40: 679-718.
Pingali, P., Hossain, M., and Gerpacis, R.V. (1997). “Asian Rice Bowls: The Return-ing Crisis?”, CAB and IRRI, USA.
Pomeroy, R.S. (1989). “The Economics of Production and Marketing in a Small-scale Fishery: Matalom, Leyte, Philippines”, ICLARM.
Ravallion, M. (1985). “Method with Less Madness: Modeling Market Integration in Agriculture”, Queen Elizabeth House, Oxford University (mimeographed)
Ravallion, M. (1986). “Testing Market Integration”. American Journal of Agricultural Economics 68 (1): 102- 109.
Ravallion, M. (1987). “The Performance of Rice Markets in Bangladesh during the 1974 Famine”, in The Economic Journal, Vol. 95, pp. 15-29.
Ravallion, M. (1987). “Markets and Famines”, Clarendon Press, Oxford University, 199p.
Report No. 2 (1997). “Statistical Office of Ministry of Agriculture and Rural Devel-opment”, Vietnam.
Rindfleisch, A. and Heide, B.J. “Transaction Cost Analysis: Past, Present, and Future Applications” Journal of Marketing. Vol.61, October 1997, pp.30 – 54.
Robert, W.R, Orville, C.W and Kenneth, J.R. (1985). “The Organization of Market-ing Activities: A contingency Theory of Structure and Performance”, Journal of Marketing, Vol. 49, pp. 13-25.
Rubin, P.A, (1990). “Managing Business Transactions” New-York: The Free Press.
Saigon Times, Vol. 16, 1996, Vietnam.
Saigon Times, Vol. 18, 1997, Vietnam.
Saigon Times, Vol. 25, 1997, Vietnam.
Scherer, F.M. and Ross, D (1990). Industrial Market Structure and Economic Per-formance. Third Edition, Houghton Mifflin Company, Boston.

References
195
Sexton, R.J., Kling, C.L. and Carman, H.F. (1991). “Market Integration, Efficiency of Arbitrage, and Imperfect Competition: Methodology and application to U.S. Celery”. American Journal of Agricultural Economics, August 1991, p. 568-580.
Sherman, R.J. (1984). “Grain Markets and the Marketing behavior of Farmers: A Case Study of Mange, Upper Volta”, CRED/USAID, University of Michigan.
Sherman, R.J. (1985). “Food-Grain Marketing in Burkina Faso”. Agricultural Mar-kets in the Semi-Arid Tropics. Proceeding of the International Workshop held at ICRISAT Center, India, p. 81-95.
Siamwalla, A. and Haykin, S. (1983). “The World Rice Market: Structure, Conduct, and Performance”. International Food Policy Research Institute. Research Re-port 39.
Slater, C.C. (1968). “Marketing Processes in Developing Latin American Societies”. Journal of Marketing, July, 50-55.
Slater, C.C. (1970). “Market channel Coordination and Economic Development”, In: Agricultural and Food Marketing in Developing Countries: Selected Readings (John Abbott), Technical Center for Agricultural and Rural Co-operation, pp. 25-33.
Stern, L.W. and Ansary, A.I.E. (1988). Marketing Channels, 3th Edition. Prentice-Hall International Editions, London.
Stern, L.W., Ansary, A.I.E. and Coughlan, A.T. (1996). Marketing Channels, 5th Edition, Upper Saddle River, NJ: Prentice Hall International.
Stigler, G.J. (1968). “Barriers to Entry, Economics of Scale and Firm Size”. In: Irwin, R.D. The Organization of Industry. Homewood, Illinois.
Thrainn, E. (1990). “Economic Behavior and Institutions”. Cambridge University Press.
Tilburg, A. van. (1988). “Performance Measurement in Respect of Periodic Markets and Marketing Agents Operating at these Markets in Southwest Benin, West-Africa”. Proceedings of the European Marketing Academy Conference, Bradford (UK), p. 625-646.
Tilburg, A. van. (1989). “Aspects of Food Security in Relation to the Production and Marketing of Cereals in Rural Senegal”, Proceedings 19th Seminar of European Association of Agricultural Economists, Montpellier, Theme II.2, p. 168-190.
Tilburg, A. van. (1992). “Competition at Rural Markets in South Benin”. In: L. Cammann (ed.), Traditional Marketing Systems, German Foundation for International Development (DSE), Feldafing, p. 101-112.
Timmer, C. P. (1974). “A Model of Rice Marketing Margins in Indonesia”, Food Re-search Institute Studies Vol. 13, No. 2.
Timmer C. P., W. P. Falcon and S. R. Pearson (1983). “Food Policy Analysis”. Bal-timore, MD, USA: Johns Hopkins University Press.
Tirole. J. (1990) “The Theory of Industrial Organization”. The MIT Press, Cam-bridge, Massachusetts, London, England.
The Organization of the Liberalized Rice Market in Vietnam
196
Todd, E.P. and Eric A.M. (1980). “The Integration of the International Rice Market”, Food Research Institute Studies Vol. 17, No.3. 1980.
Tollens, E. (1992). “Cassava Marketing in Zaire: An Analysis of its Structure, Con-duct and Performance”, In L. Cammann (ed.), Traditional Marketing Systems. Feldafing: German Foundation for International Development (DSE), p. 113-127.
Trung, Nguyen Manh and Duc-Hai, Luu-Thanh (1995). “Food and Rice Marketing Channels”, Research Paper, F.A.O Project 1994-1995, Hanoi Vietnam.
Tu, Phan Anh (1999). “Analyzing the Rice Export Strategy of Meko- Food Cantho, Vietnam”, Under Graduated Thesis, SEBA, Cantho University.
Tuan, Vu Anh (2000). “The Improvement of Rice Marketing Channels of Omon Dis-trict, Cantho Province, Vietnam”, Under Graduated Thesis, SEBA, Cantho Uni-versity.
Umali, D.L. (1990). “Rice Marketing and Prices Under Philippine Government Price Stabilization”, Journal of Agricultural Economics and Development, Vol. XX.
USDA, (1998), “Rice Yearbook”, htpp:\\www.fas.usda.gov\
USDA, (1999), “World Rice Trade”, htpp:\\www.fas.usda.gov\
USDA, (1999), “Rice Outlook Report”, htpp:\\www.fas.usda.gov\
Van, Nguyen Trung (1998), “Luong Thuc Vietnam Thoi Doi Moi Huong Xuat Khau” [Vietnam’s Food-Export-oriented Reform Era], The National Political Publish-ing House. 319p.
Von Weizsacker, C.C. (1980). “A Welfare Analysis of Barriers to Entry”. Bell Jour-nal of Economics, 11, 399-420.
Wailes, E.J, Ito Shoichi and Cramer, G (1991). “Japan Rice Market - Policies and Prospects for Trade Liberalization”. Arkansas Agricultural Experiment Station. Report series 319.
Wailes, E.J and Cramer, G (1994). “Arkansas Rice Model” Department of Agricul-tural Economics and Rural Sociology - University of Arkansas.
Walker, G. and David, W. (1984). “A Transaction Cost Approach in Make-or-Buy Decisions” Administrative Science Quarterly 29 September, 373-91
Walter, E. (1995). Applied Econometric Time Series. John Wiley and Sons, Inc.
Wiens, T. and Harrison, P (1994). “Vietnam Agricultural Marketing Study” Agricul-tural and Natural Resources Operation Division - Report No. 13133 - VN.
Williamson, O. and Winter, S. T (1993). “The nature of the Firm Origins, Evolution and Development”. New York, Oxford University Press.
Williamson, O. (1998). “Transaction Cost Economics: How it works, Where it is Headed”. De Economist 146-23-58 (1998 Kluwer Academic Publishers).
Williamson, O. (2000). “The New Institutional Economics: Taking Stock, Looking Ahead”. Journal of Economic Literature, p.595-613.
Wills, G. (1974). “ Marketing’s Social Dilemma”, European Journal Market, Vol.8, p.4-14.

References
197
Wollen, G.H. and Turner, G. (1970). “The Cost of Food Marketing”, Journal of Ag-ricultural Economics, Vol.21, p.63-83.
Yasuhiko, Y. (1985). “Six Simulations for Rice Decontrol”, Japan, Echo 22 spring.


Appendices Appendix 4.1 Average monthly turnover of rice traders
Type of rice traders Number of observations
Amount (Million VND)
Coefficient of variation
1. Local assemblers 8 15.0 [0.325]
2. Assemblers-wholesalers 10 25.6 [0.729]
2. Private wholesalers 49 65.0 [0.874]
3. Small millers 26 537.0 [0.746]
4. Large millers 27 1,508.4 [1.064]
5. Retailers 30 15.7 [0.658]
Source: Own survey in the Mekong River Delta, 1999 – 2000
Appendix 4.2 Processing capacity of some State Owned Enterprises.
Processing capacity
Milling Polishing
SOE of the province
No. of ma-chine (units)
Total capacity
(Tons/hour)
No. of ma-chine (units)
Total capacity
(Tons/hour)
1. Cantho
2. Soctrang
3. Tiengiang
4. Vinhlong
10
7
2
5
18.3
21.0
12.0
15.0
24
10
15
15
66.8
30.0
38.0
45.0
Source: Secondary data from the report of the SOEs in the Mekong River Delta.
The Organization of the Liberalized Rice Market in Vietnam
200
Appendix 4.3 Lorenz Curves and GINI Ratio
Traditionally, Lorenz curves have been used for comparing income distribu-tions. They are drawn with income on the horizontal axis and the cumulative distribution function of income on the vertical axis. An egalitarian distribution corresponds to a Lorenz curve that is a straight line at 45 degrees from the ori-gin. By replacing income with number of traders and the cumulative distribution function of income with the cumulative distribution function for market share, Lorenz curves can be used to provide a graphical overview of the distribution of market shares in an industry. The 45 degree straight line corresponds to equal-sized market shares. In this study, the Lorenz curve shows the quantitative relationship between the cumulative percentage of rice traders against the cumulative percentage of the volume of rice sold in the markets. To compute the cumulative percentage, the volume of rice sold will be arranged from highest to lowest. The GINI coeffi-cient or concentration ratio will be derived from the Lorenz curve. This meas-ures the inequity in sales distribution among the different producer and trader groups. Graphically, the GINI coefficient is the ratio of the area between the di-agonal of the Lorenz curve as compared to the area of the half-square in which the curve lies. The GINI coefficient will be computed using the following formula:
Gr = 1 - [ ]))(( 1
1
11 +
−
=+ +−∑ ii
n
iii SSPP
Where: Pi: Cumulative percentage of rice traders in the ith class. Si: Cumulative percentage of the volume of rice sold in the ith class. Gr: Concentration ratio of rice traders in the market.
This ratio ranges from zero to one. - If Gr = 0, there exists perfect equality. The Lorenz curve is a 450 straight line. - If Gr = 1, there is perfect inequality. The Lorenz curve is a 900 rectangle.

Appendices
201
Appendix 4.4 Computing the GINI ratio of rice wholesalers
Number of trader
Percentage of total
Pi Sold volume % Share Si (Si + Si+1)
1 1.49 1.49 9,000.00 24.87 24.87 24.87
2 1.49 2.99 7,600.00 21.00 45.87 91.74
3 1.49 4.48 5,000.00 13.82 59.68 119.37
4 1.49 5.97 1,520.00 4.20 63.88 127.77
5 1.49 7.46 1,150.00 3.18 67.06 134.12
6 1.49 8.96 832.00 2.30 69.36 138.72
7 1.49 10.45 550.00 1.52 70.88 141.76
8 1.49 11.94 520.00 1.44 72.32 144.64
9 1.49 13.43 405.00 1.12 73.44 146.87
10 1.49 14.93 387.00 1.07 74.51 149.01
11 1.49 16.42 378.00 1.04 75.55 151.10
12 1.49 17.91 364.00 1.01 76.56 153.11
13 1.49 19.40 310.00 0.86 77.41 154.83
14 1.49 20.90 310.00 0.86 78.27 156.54
15 1.49 22.39 300.00 0.83 79.10 158.20
16 1.49 23.88 300.00 0.83 79.93 159.86
17 1.49 25.37 298.00 0.82 80.75 161.50
18 1.49 26.87 285.00 0.79 81.54 163.08
19 1.49 28.36 270.00 0.75 82.28 164.57
20 1.49 29.85 265.00 0.73 83.02 166.03
21 1.49 31.34 240.00 0.66 83.68 167.36
22 1.49 32.84 230.00 0.64 84.32 168.63
23 1.49 34.33 225.00 0.62 84.94 169.87
24 1.49 35.82 222.00 0.61 85.55 171.10
25 1.49 37.31 220.00 0.61 86.16 172.32
26 1.49 38.81 210.00 0.58 86.74 173.48
27 1.49 40.30 208.00 0.57 87.31 174.63
28 1.49 41.79 200.00 0.55 87.87 175.73
29 1.49 43.28 200.00 0.55 88.42 176.84
30 1.49 44.78 196.00 0.54 88.96 177.92
31 1.49 46.27 195.00 0.54 89.50 179.00
32 1.49 47.76 190.00 0.53 90.02 180.05
33 1.49 49.25 185.00 0.51 90.54 181.07
34 1.49 50.75 174.00 0.48 91.02 182.03
35 1.49 52.24 170.00 0.47 91.49 182.97
36 1.49 53.73 166.00 0.46 91.94 183.89
37 1.49 55.22 164.00 0.45 92.40 184.80
38 1.49 56.72 162.00 0.45 92.85 185.69
39 1.49 58.21 160.00 0.44 93.29 186.58
40 1.49 59.70 155.00 0.43 93.72 187.43
41 1.49 61.19 155.00 0.43 94.14 188.29

The Organization of the Liberalized Rice Market in Vietnam
202
Appendix 4.4 (Continued) Computing the GINI ratio of rice wholesalers
Number of trader
Percentage of total
Pi Sold volume % Share Si (Si + Si+1)
42 1.49 62.69 150.00 0.41 94.56 189.12
43 1.49 64.18 140.00 0.39 94.95 189.89
44 1.49 65.67 130.00 0.36 95.30 190.61
45 1.49 67.16 126.00 0.35 95.65 191.31
46 1.49 68.66 120.25 0.33 95.99 191.97
47 1.49 70.15 120.00 0.33 96.32 192.63
48 1.49 71.64 118.00 0.33 96.64 193.29
49 1.49 73.13 110.00 0.30 96.95 193.89
50 1.49 74.63 105.30 0.29 97.24 194.48
51 1.49 76.12 104.00 0.29 97.53 195.05
52 1.49 77.61 103.00 0.28 97.81 195.62
53 1.49 79.10 99.00 0.27 98.08 196.17
54 1.49 80.60 97.00 0.27 98.35 196.70
55 1.49 82.09 97.00 0.27 98.62 197.24
56 1.49 83.58 94.00 0.26 98.88 197.76
57 1.49 85.07 88.00 0.24 99.12 198.24
58 1.49 86.57 68.90 0.19 99.31 198.63
59 1.49 88.06 59.00 0.16 99.48 198.95
60 1.49 89.55 54.00 0.15 99.63 199.25
61 1.49 91.04 46.00 0.13 99.75 199.50
62 1.49 92.54 36.40 0.10 99.85 199.71
63 1.49 94.03 24.05 0.07 99.92 199.84
64 1.49 95.52 19.50 0.05 99.97 199.95
65 1.49 97.01 4.25 0.01 99.98 199.97
66 1.49 98.51 3.00 0.01 99.99 199.99
67 1.49 100.00 2.50 0.01 100.00 100.00
Total 11,557.00
Source: Own survey from 67 rice wholesalers in the Mekong River Delta, 1999 – 2000
Gr = 1 - [ ]))(( 1
1
11 +
−
=+ +−∑ ii
n
iii SSPP
GrA= 0.7249

Appendices
203
Appendix 4.5 Computing the GINI ratio of rice millers
Number of rice miller
Percentage of total
Pi Sold volume % Share Si (Si + Si+1)
1 1.89 1.89 45,000 11.415 11.415 11.41
2 1.89 3.77 40,000 10.146 21.561 43.12
3 1.89 5.66 30,000 7.610 29.171 58.34
4 1.89 7.55 24,500 6.215 35.385 70.77
5 1.89 9.43 24,000 6.088 41.473 82.95
6 1.89 11.32 20,000 5.073 46.546 93.09
7 1.89 13.21 20,000 5.073 51.620 103.24
8 1.89 15.09 20,000 5.073 56.693 113.39
9 1.89 16.98 15,000 3.805 60.498 121.00
10 1.89 18.87 13,500 3.424 63.922 127.84
11 1.89 20.75 12,000 3.044 66.966 133.93
12 1.89 22.64 12,000 3.044 70.010 140.02
13 1.89 24.53 11,500 2.917 72.927 145.85
14 1.89 26.41 8,800 2.232 75.159 150.32
15 1.89 28.30 8,500 2.156 77.315 154.63
16 1.89 30.19 7,000 1.776 79.091 158.18
17 1.89 32.07 7,000 1.776 80.866 161.73
18 1.89 33.96 7,000 1.776 82.642 165.28
19 1.89 35.85 6,000 1.522 84.164 168.33
20 1.89 37.73 6,000 1.522 85.686 171.37
21 1.89 39.62 5,000 1.268 86.954 173.91
22 1.89 41.51 4,400 1.116 88.070 176.14
23 1.89 43.39 4,000 1.015 89.085 178.17
24 1.89 45.28 3,300 0.837 89.922 179.84
25 1.89 47.17 3,000 0.761 90.683 181.37
26 1.89 49.05 2,700 0.685 91.368 182.74
27 1.89 50.94 2,600 0.660 92.027 184.05
28 1.89 52.83 2,500 0.634 92.662 185.32
29 1.89 54.71 2,500 0.634 93.296 186.59
30 1.89 56.60 2,500 0.634 93.930 187.86
31 1.89 58.49 2,200 0.558 94.488 188.98
32 1.89 60.37 2,000 0.507 94.995 189.99
33 1.89 62.26 1,800 0.457 95.452 190.90
34 1.89 64.15 1,800 0.457 95.908 191.82
35 1.89 66.03 1,740 0.441 96.350 192.70
36 1.89 67.92 1,680 0.426 96.776 193.55
37 1.89 69.81 1,600 0.406 97.182 194.36
38 1.89 71.69 1,500 0.380 97.562 195.12
39 1.89 73.58 1,400 0.355 97.917 195.83
40 1.89 75.47 1,400 0.355 98.273 196.55
41 1.89 77.35 1,200 0.304 98.577 197.15
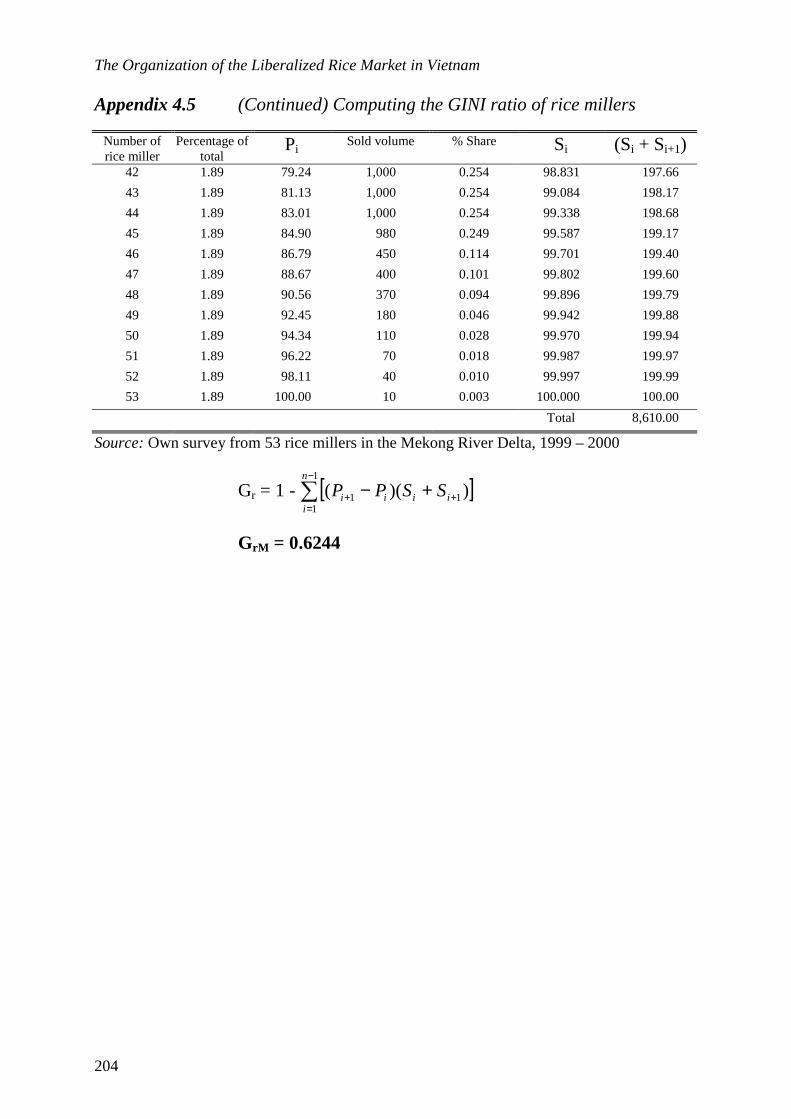
The Organization of the Liberalized Rice Market in Vietnam
204
Appendix 4.5 (Continued) Computing the GINI ratio of rice millers
Number of rice miller
Percentage of total
Pi Sold volume % Share Si (Si + Si+1)
42 1.89 79.24 1,000 0.254 98.831 197.66
43 1.89 81.13 1,000 0.254 99.084 198.17
44 1.89 83.01 1,000 0.254 99.338 198.68
45 1.89 84.90 980 0.249 99.587 199.17
46 1.89 86.79 450 0.114 99.701 199.40
47 1.89 88.67 400 0.101 99.802 199.60
48 1.89 90.56 370 0.094 99.896 199.79
49 1.89 92.45 180 0.046 99.942 199.88
50 1.89 94.34 110 0.028 99.970 199.94
51 1.89 96.22 70 0.018 99.987 199.97
52 1.89 98.11 40 0.010 99.997 199.99
53 1.89 100.00 10 0.003 100.000 100.00
Total 8,610.00
Source: Own survey from 53 rice millers in the Mekong River Delta, 1999 – 2000
Gr = 1 - [ ]))(( 1
1
11 +
−
=+ +−∑ ii
n
iii SSPP
GrM = 0.6244

Appendices
205
Appendix 4.6 Relative importance of rice distribution channels In order to describe in more detail rice marketing channels, the percentage of paddy/rice that flows through each channel will be estimated. The procedure of estimation is as follows: (1) By interviewing different rice traders, we obtained data related to the propor-
tion of paddy/rice that rice traders buy from and sell to different type of in-termediaries
(2) The percentage of paddy/rice distributed through each channel will be esti-
mated by using a weighted average method Example: There are 3 wholesalers and they sold to 3 different types of buyer such as A, B, C Wholesaler 1: Total sale volume: 1000 tons in which: A: 60%, B: 40%, C: 0% Wholesaler 2: Total sale volume: 2000 tons in which: A: 70%, B: 20%, C: 10% Wholesaler 3: Total sale volume: 500 tons in which: A: 0%, B: 30%, C: 70%
Percentage of product selling to A = )500000,2000,1(
)5000()000,270()000,160(
++++ xxx = 57%
Percentage of product selling to B = )500000,2000,1(
)50030()000,220()000,140(
++++ xxx = 27%
Percentage of product selling to C = )500000,2000,1(
)50070()000,210()000,10(
++++ xxx = 16%

The Organization of the Liberalized Rice Market in Vietnam
206
Appendix 5.1 Volume of paddy and rice bought and sold by local assemblers, distance assemblers, and wholesalers
Local assembler (Paddy)
Distance assemblers (Rice)
Wholesalers (Rice)
Count (n) 8 9 47 Mean 182 1364.8 488.3 Standard Error 63.82 796.31 211.9 Median 134 405 185 Standard Deviation 180.52 2388.95 1452.9 Coefficient of variation 0.992 1.750 2.975 Kurtosis 2.215 7.928 28.27 Skewness 1.542 2.768 5.234 Range 530 7503 8954 Minimum 30 97 46 Maximum 560 7600 9000 Sum 1456 12284 22950 Confidence Level (95.0%) 150.92 1836.31 426.59
Appendix 5.2 Volume of paddy and rice bought by rice millers
Paddy Rice
Small scale Large scale Small scale Large scale
Count (n) 17 13 9 16 Mean 2612.52 9523.07 4505.55 29941.25 Standard Error 949.14 2926.99 917.59 7862.52 Median 1450 7000 3400 14500 Standard Deviation 3913.42 10553.44 2752.76 31450.08 Coefficient of variation 1.498 1.108 0.611 1.051 Kurtosis 9.20 4.05 -0.67 2.17 Skewness 2.92 2.00 0.90 1.70 Range 15987 36600 7500 102340 Minimum 13 1400 2000 2660 Maximum 16000 38000 9500 105000 Sum 44413 123800 40550 479060 Confidence Level (95.0%) 2012.09 6377.38 2115.9 16758.5

Appendices
207
Appendix 5.3 Volume of rice sold by rice millers and rice retailers
Rice millers Rice retailers
Small scale Large scale Small scale Large scale
Count (n) 26 27 15 15 Mean 2860 18880 23.84 125.04 Standard Error 611.34 4813.68 3.26 28.44 Median 1900 11500 24 84 Standard Deviation 3117.2 25012.6 12.63 110.15 Coefficient of variation 1.089 1.325 0.529 0.881 Kurtosis 4.494 5.337 -0.40 1.11 Skewness 1.983 2.310 0.28 1.48 Range 13490 99020 44.4 324 Minimum 10 980 3.6 36 Maximum 13500 100000 48 360 Sum 74360 509760 357.6 1875.6 Confidence Level (95.0%) 1259.08 9894.68 6.99 61.00

The Organization of the Liberalized Rice Market in Vietnam
208
Appendix 6.1a Production cost of paddy by different rice crops.
Rice crop Item
Winter-Spring Summer-Autumn
Average
A. Production costs (VND)
1. Land preparation
2. Seeds (200kg/ha)
3. Fertilizer
4. Pesticide
5. Irrigation
6. Harvesting, transporting
7. Labor
8. Agricultural taxes (8%)
4,976,000
0
400,000
1,220,000
444,000
500,000
1,500,000
544,000
368,000
5,805,000
300,000
500,000
975,000
800,000
500,000
1,500,000
800,000
430,000
5,400,000
300,000
450,000
1,096,000
632,000
500,000
1,500,000
522,000
400,000
B. Yield per ha (Ton/ha) 5.50 5.00 5.25
C. Average production cost (VND/ton) (C = A/B)
905,000 1,161,000 1,028,000
Source: Vietnam Economic times, Vol. 27-10-1999 (Survey by Angiang Food company, 1999)
Appendix 6.1b Drying cost by using drying machines (*)
Cost items Amount
(VND/Ton) Percentage of total
(%)
1. Fuel (Diesel) 10,500 21.0
2. Material (rice husk for burning) 4,500 9.0
3. Labour 17,500 35.0
4. Depreciation 12,500 25.0
5. Interest on borrowed capital 5,000 10.0
Total 50,000 100.0
Note: (*) 4 tons-dry machine (SHG4) Source: Phan Hieu Hien, DANIDA project on post harvest technology, the Mekong River
Delta, 1998

Appendices
209
Appendix 6.2 Exchange rate from US Dollar to Vietnamese Dong
Month 1998 1999 2000 2001
1 12,288 13,877 14,053 14,546 2 12,975 13,891 14,055 14,565
3 12,975 13,900 14,062 14,542
4 12,982 13,904 14,065 14,564
5 12,982 13,911 14,080 14,635
6 12,982 13,922 14,082 14,842
7 12,983 13,947 14,090 14,933
8 13,907 13,960 14,115 14,989
9 13,900 13,992 14,212 14,323
10 13,900 14,008 14,360 14,323
11 13,893 14,014 14,491 14,357
12 13,890 14,025 14,512 14,370
Source: http://www. Oanda.com/convert/cheatsheet.

The Organization of the Liberalized Rice Market in Vietnam
210
Appendix 6.3 Selling price of paddy from farmers Unit: Dong/gia (1 gia = 20 kg) Winter-Spring Summer-
Autumn Average
30,000 25,000 27,500
35,000 30,000 32,500
34,000 25,000 29,500
40,000 32,000 36,000 Result of descriptive analysis (*)
40,000 35,000 37,500 Mean 29088
40,000 30,000 35,000 Standard Error 546.43
35,000 30,000 32,500 Median 28000
40,000 27,000 33,500 Mode 27500
35,000 30,000 32,500 Standard Deviation 4302.61
30,000 28,000 29,000 Coefficient of variation 0.1479
34,000 30,000 32,000 Sample Variance 18512493.3
32,000 25,000 28,500 Kurtosis -0.590
38,000 30,000 34,000 Skewness 0.23640
28,000 25,000 26,500 Range 18000
30,000 22,000 26,000 Minimum 20000
40,000 36,000 38,000 Maximum 38000
28,000 25,000 26,500 Sum 1803500
38,000 35,000 36,500 Count (n) 62
30,000 25,000 27,500 Confidence Level 95% 1092.66
30,000 20,000 25,000
32,000 30,000 31,000 1 gia = 20 kg
40,000 30,000 35,000 Mean price of 1 kg paddy
40,000 35,000 37,500 (29,088)/ 20 = 1,454 VND
28,000 25,000 26,500
26,000 20,000 23,000
25,000 20,000 22,500
20,000 20,000 20,000
35,000 20,000 27,500
35,000 22,000 28,500
28,000 22,000 25,000
23,000 25,000 24,000
35,000 25,000 30,000
35,000 25,000 30,000
30,000 20,000 25,000
Note: (*) The descriptive analysis concerns the average values of both Winter-Spring and Summer-Autumn rice crop
35,000 20,000 27,500
35,000 25,000 30,000
35,000 35,000 35,000
30,000 20,000 25,000
35,000 26,000 30,500

Appendices
211
Winter-Spring Summer-Autumn
Average
38,000 30,000 34,000
35,000 28,000 31,500
35,000 28,000 31,500
35,000 30,000 32,500
35,000 22,000 28,500
35,000 20,000 27,500
32,000 25,000 28,500
30,000 25,000 27,500
26,000 20,000 23,000
40,000 30,000 35,000
30,000 25,000 27,500
30,000 25,000 27,500
30,000 25,000 27,500
30,000 25,000 27,500
40,000 26,000 33,000
30,000 20,000 25,000
23,000 20,000 21,500
30,000 25,000 27,500
30,000 25,000 27,500
30,000 20,000 25,000
30,000 20,000 25,000
25,000 20,000 22,500
30,000 25,000 27,500
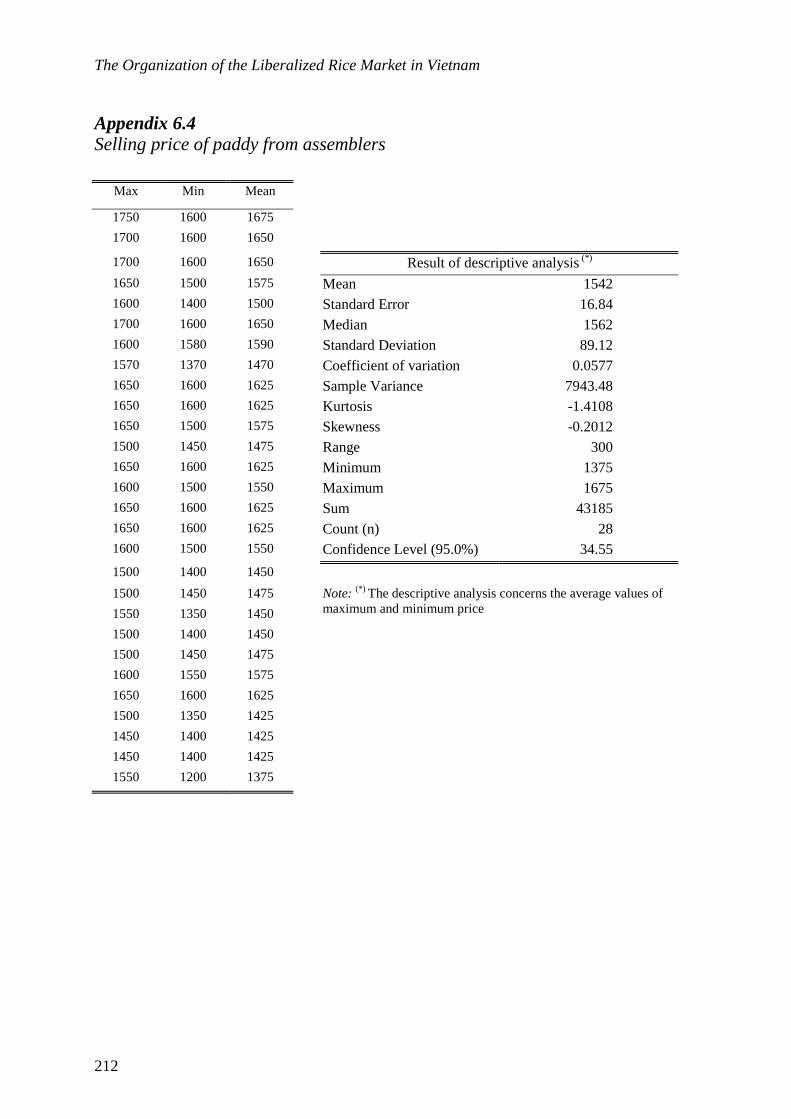
The Organization of the Liberalized Rice Market in Vietnam
212
Appendix 6.4 Selling price of paddy from assemblers
Max Min Mean
1750 1600 1675
1700 1600 1650
1700 1600 1650 Result of descriptive analysis (*)
1650 1500 1575 Mean 1542 1600 1400 1500 Standard Error 16.84 1700 1600 1650 Median 1562 1600 1580 1590 Standard Deviation 89.12 1570 1370 1470 Coefficient of variation 0.0577 1650 1600 1625 Sample Variance 7943.48 1650 1600 1625 Kurtosis -1.4108 1650 1500 1575 Skewness -0.2012 1500 1450 1475 Range 300 1650 1600 1625 Minimum 1375 1600 1500 1550 Maximum 1675 1650 1600 1625 Sum 43185 1650 1600 1625 Count (n) 28 1600 1500 1550 Confidence Level (95.0%) 34.55
1500 1400 1450
1500 1450 1475
1550 1350 1450
1500 1400 1450
1500 1450 1475
1600 1550 1575
1650 1600 1625
1500 1350 1425
1450 1400 1425
1450 1400 1425
Note: (*) The descriptive analysis concerns the average values of maximum and minimum price
1550 1200 1375

Appendices
213
Appendix 6.5 Selling price of rice from miller
Max Min Mean
2650 2500 2575
2500 2400 2450
2950 2800 2875
2500 2350 2425 Result of descriptive analysis (*)
2600 2450 2525 Mean 2549.7 2450 2300 2375 Standard Error 27.37 2450 2250 2350 Median 2575 2400 2250 2325 Standard Deviation 164.27 2450 2200 2325 Coefficient of variation 0.064 2850 2650 2750 Sample Variance 26985.6 2550 2400 2475 Kurtosis -0.83 2750 2650 2700 Skewness 0.18 2600 2550 2575 Range 600 3250 2500 2875 Minimum 2275 2500 2350 2425 Maximum 2875 2500 2400 2450 Sum 91790 2650 2400 2525 Count (n) 36 2750 2650 2700 Confidence Level (95.0%) 55.58
2650 2500 2575
2500 2400 2450
2650 2500 2575
2350 2200 2275
2800 2650 2725
2450 2270 2360
2410 2250 2330
2350 2300 2325
2650 2500 2575
2700 2600 2650
Note: (*) The descriptive analysis concerns the average values of maximum and minimum price
2650 2500 2575
2600 2550 2575
2600 2500 2550
2650 2500 2575
2850 2700 2775
2800 2650 2725
2700 2800 2750
2800 2650 2725

The Organization of the Liberalized Rice Market in Vietnam
214
Appendix 6.6 Wholesale price of rice
Max Min Mean
3000 2700 2850
2600 2300 2450
2600 2400 2500
2900 2300 2600 Result of descriptive analysis (*)
3250 3100 3175 Mean 2750 2500 2350 2425 Standard Error 53.79 2750 2400 2575 Median 2800 2600 2500 2550 Standard Deviation 289.72 2800 2300 2550 Coefficient of variation 0.105 2600 2400 2500 Sample Variance 83938.3 3250 2900 3075 Kurtosis -0.93 3150 2450 2800 Skewness -0.02 3300 3150 3225 Range 1075 2800 2500 2650 Minimum 2150 3150 2750 2950 Maximum 3225 3200 3150 3175 Sum 79755 2900 2550 2725 Count (n) 29 2500 2300 2400 Confidence Level (95.0%) 110.20
3000 2600 2800
3200 2400 2800
3250 3100 3175
2500 2200 2350
3100 2950 3025
2200 2100 2150
3100 2850 2975
Note: (*) The descriptive analysis concerns the average values of maximum and minimum price
3100 3000 3050
3210 2600 2905
3200 2500 2850
2800 2200 2500

Appendices
215
Appendix 6.7 Retail price of rice
Max Min Mean
3700 2800 3250 Result of descriptive analysis (*)
2900 2600 2750 Mean 2870 3000 2800 2900 Standard Error 46.91 3250 2700 2975 Median 2875 2850 2450 2650 Standard Deviation 252.66 2800 2200 2500 Coefficient of variation 0.088 3000 2900 2950 Sample Variance 63839.1 2750 2650 2700 Kurtosis -1.31 3100 2600 2850 Skewness 0.02 2700 2500 2600 Range 765 2800 2500 2650 Minimum 2485 3610 2850 3230 Maximum 3250 2950 2550 2750 Sum 83240 2800 2500 2650 Count (n) 29 3250 2950 3100 Confidence Level (95.0%) 96.10
3250 2900 3075
3100 2900 3000
2600 2400 2500
3400 2500 2950
3500 3000 3250
2630 2340 2485
2650 2400 2525
2700 2550 2625
Note: (*) The descriptive analysis concerns the average val-ues of maximum and minimum price
3000 2750 2875
3600 2850 3225
3450 2850 3150
3550 2800 3175
3500 2700 3100
3200 2400 2800

The Organization of the Liberalized Rice Market in Vietnam
216
Appendix 6.8 Computing 12 months moving average of paddy prices (Based on the monthly prices from the 1996-2000 trend)
Year Month Price MA 12 MA 2 SI (%) [1] [2] [3] [4=(1/3)x100]
1996 Jan 2325
Feb 2298
March 2314
April 2314
May 2229
June 2068 2010.16
July 1854 1983.55 1996.85 92.85
August 1732 1949.98 1966.77 88.09
Sept 1715 1923.82 1936.90 88.53
Oct 1710 1887.65 1905.74 89.71
Nov 1730 1852.16 1869.91 92.49
Dec 1835 1811.21 1831.69 100.18
1997 Jan 2006 1797.23 1804.22 111.17
Feb 1895 1792.43 1794.83 105.56
March 2000 1786.23 1789.33 111.76
April 1880 1782.40 1784.32 105.34
May 1803 1779.18 1780.79 101.26
June 1576 1774.31 1776.75 88.72
July 1686 1768.74 1771.53 95.18
August 1675 1770.17 1769.45 94.66
Sept 1640 1762.00 1766.08 92.88
Oct 1664 1785.83 1773.92 93.78
Nov 1691 1823.35 1804.59 93.70
Dec 1777 1900.57 1861.96 95.42

Appendices
217
Appendix 6.8 (Continued) Year Month Price MA 12 MA 2 SI (%)
[1] [2] [3] [4=(1/3)x100]
1998 Jan 1939 1936.31 1918.44 101.06
Feb 1912 2019.40 1977.86 96.66
March 1902 2078.73 2049.07 92.81
April 2166 2124.82 2101.77 103.04
May 2253 2169.18 2147.00 104.96
June 2503 2198.54 2183.86 114.61
July 2115 2220.80 2209.67 95.72
August 2672 2241.84 2231.32 119.75
Sept 2352 2244.88 2243.36 104.86
Oct 2217 2228.70 2236.79 99.10
Nov 2223 2201.11 2214.91 100.37
Dec 2129 2159.52 2180.31 97.65
1999 Jan 2206 2133.12 2146.32 102.78
Feb 2164 2058.21 2095.66 103.28
March 1938 2000.16 2029.19 95.52
April 1972 1951.49 1975.82 99.79
May 1922 1898.38 1924.93 99.86
June 2004 1872.08 1885.23 106.29
July 1798 1861.17 1866.63 96.33
August 1773 1847.23 1854.20 95.63
Sept 1656 1839.30 1843.27 89.82
Oct 1633 1819.08 1829.19 89.25
Nov 1586 1797.23 1808.16 87.71
Dec 1813 1763.41 1780.32 101.86
2000 Jan 2075 1747.72 1755.56 118.20
Feb 1997 1731.63 1739.67 114.79
March 1843 1723.98 1727.80 106.67
April 1729 1708.78 1716.38 100.74
May 1660 1715.37 1712.07 96.96
June 1598 1708.13 1711.75 93.35
July 1610
August 1580
Sept 1564
Oct 1450
Nov 1665
Dec 1727
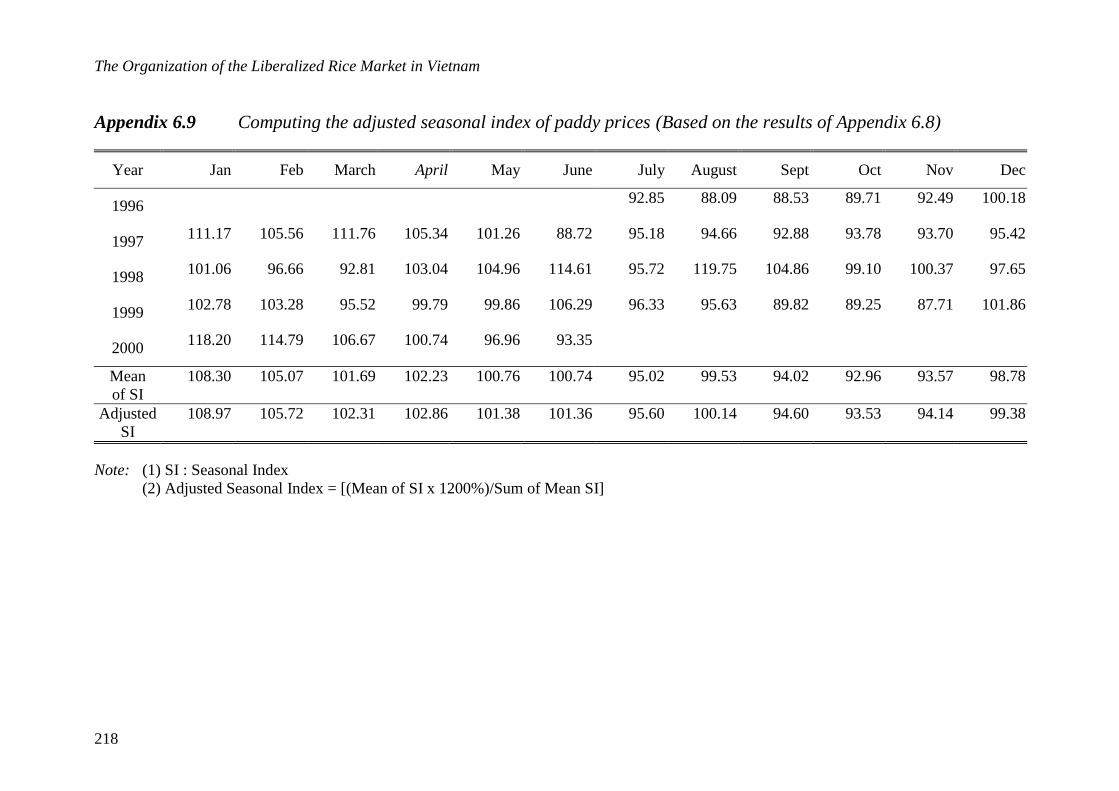
The Organization of the Liberalized Rice Market in Vietnam
218
Appendix 6.9 Computing the adjusted seasonal index of paddy prices (Based on the results of Appendix 6.8)
Year Jan Feb March April May June July August Sept Oct Nov Dec
1996 92.85 88.09 88.53 89.71 92.49 100.18
1997 111.17 105.56 111.76 105.34 101.26 88.72 95.18 94.66 92.88 93.78 93.70 95.42
1998 101.06 96.66 92.81 103.04 104.96 114.61 95.72 119.75 104.86 99.10 100.37 97.65
1999 102.78 103.28 95.52 99.79 99.86 106.29 96.33 95.63 89.82 89.25 87.71 101.86
2000 118.20 114.79 106.67 100.74 96.96 93.35
Mean of SI
108.30 105.07 101.69 102.23 100.76 100.74 95.02 99.53 94.02 92.96 93.57 98.78
Adjusted SI
108.97 105.72 102.31 102.86 101.38 101.36 95.60 100.14 94.60 93.53 94.14 99.38
Note: (1) SI : Seasonal Index (2) Adjusted Seasonal Index = [(Mean of SI x 1200%)/Sum of Mean SI]

Appendices
219
Appendix 6.10 Computing 12 months moving average of retail rice prices (Based on the monthly prices from the 1996-2000 trend)
Year Month Price MA 12 MA 2 SI (%) [1] [2] [3] [4=(1/3)x100]
1996 Jan 3585
Feb 3512
March 3515
April 3706
May 3584
June 3164 3163.90
July 3013 3094.87 3129.39 96.30
August 2761 3043.25 3069.06 89.97
Sept 2776 3009.00 3026.12 91.74
Oct 2695 2945.45 2977.23 90.51
Nov 2845 2882.02 2913.74 97.65
Dec 2810 2843.12 2862.57 98.16
1997 Jan 2757 2819.54 2831.33 97.36
Feb 2892 2812.26 2815.90 102.72
March 3104 2808.09 2810.17 110.46
April 2943 2817.98 2813.03 104.63
May 2823 2812.41 2815.19 100.27
June 2698 2816.76 2814.59 95.84
July 2731 2849.14 2832.95 96.38
August 2674 2871.09 2860.11 93.49
Sept 2726 2873.28 2872.18 94.91
Oct 2813 2909.67 2891.48 97.30
Nov 2778 2974.63 2942.15 94.43
Dec 2862 3051.39 3013.01 95.00
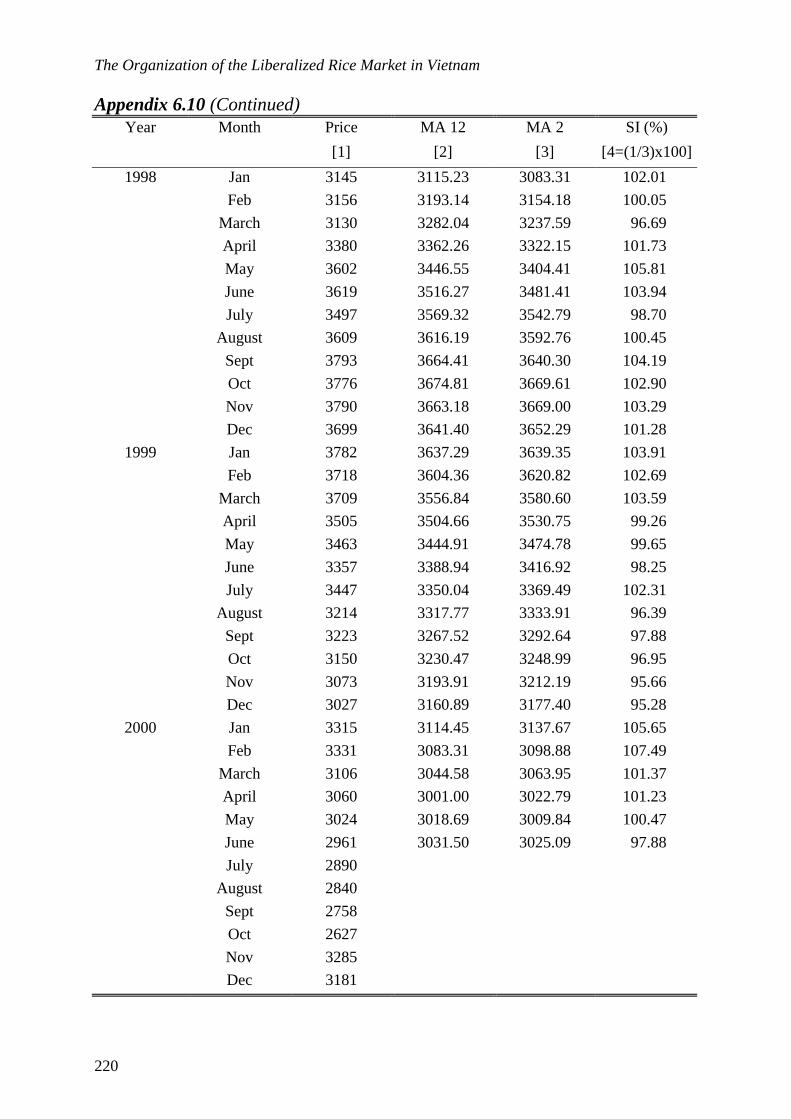
The Organization of the Liberalized Rice Market in Vietnam
220
Appendix 6.10 (Continued) Year Month Price MA 12 MA 2 SI (%)
[1] [2] [3] [4=(1/3)x100]
1998 Jan 3145 3115.23 3083.31 102.01
Feb 3156 3193.14 3154.18 100.05
March 3130 3282.04 3237.59 96.69
April 3380 3362.26 3322.15 101.73
May 3602 3446.55 3404.41 105.81
June 3619 3516.27 3481.41 103.94
July 3497 3569.32 3542.79 98.70
August 3609 3616.19 3592.76 100.45
Sept 3793 3664.41 3640.30 104.19
Oct 3776 3674.81 3669.61 102.90
Nov 3790 3663.18 3669.00 103.29
Dec 3699 3641.40 3652.29 101.28
1999 Jan 3782 3637.29 3639.35 103.91
Feb 3718 3604.36 3620.82 102.69
March 3709 3556.84 3580.60 103.59
April 3505 3504.66 3530.75 99.26
May 3463 3444.91 3474.78 99.65
June 3357 3388.94 3416.92 98.25
July 3447 3350.04 3369.49 102.31
August 3214 3317.77 3333.91 96.39
Sept 3223 3267.52 3292.64 97.88
Oct 3150 3230.47 3248.99 96.95
Nov 3073 3193.91 3212.19 95.66
Dec 3027 3160.89 3177.40 95.28
2000 Jan 3315 3114.45 3137.67 105.65
Feb 3331 3083.31 3098.88 107.49
March 3106 3044.58 3063.95 101.37
April 3060 3001.00 3022.79 101.23
May 3024 3018.69 3009.84 100.47
June 2961 3031.50 3025.09 97.88
July 2890
August 2840
Sept 2758
Oct 2627
Nov 3285
Dec 3181
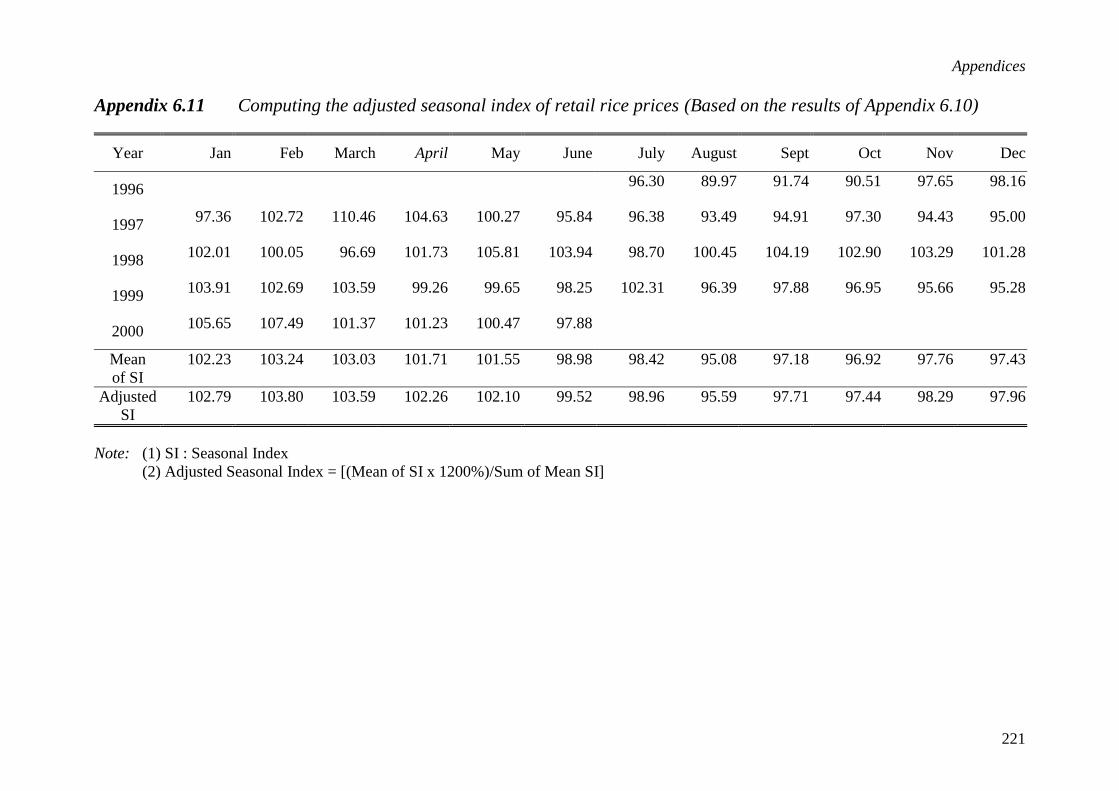
Appendices
221
Appendix 6.11 Computing the adjusted seasonal index of retail rice prices (Based on the results of Appendix 6.10)
Year Jan Feb March April May June July August Sept Oct Nov Dec
1996 96.30 89.97 91.74 90.51 97.65 98.16
1997 97.36 102.72 110.46 104.63 100.27 95.84 96.38 93.49 94.91 97.30 94.43 95.00
1998 102.01 100.05 96.69 101.73 105.81 103.94 98.70 100.45 104.19 102.90 103.29 101.28
1999 103.91 102.69 103.59 99.26 99.65 98.25 102.31 96.39 97.88 96.95 95.66 95.28
2000 105.65 107.49 101.37 101.23 100.47 97.88
Mean of SI
102.23 103.24 103.03 101.71 101.55 98.98 98.42 95.08 97.18 96.92 97.76 97.43
Adjusted SI
102.79 103.80 103.59 102.26 102.10 99.52 98.96 95.59 97.71 97.44 98.29 97.96
Note: (1) SI : Seasonal Index (2) Adjusted Seasonal Index = [(Mean of SI x 1200%)/Sum of Mean SI]
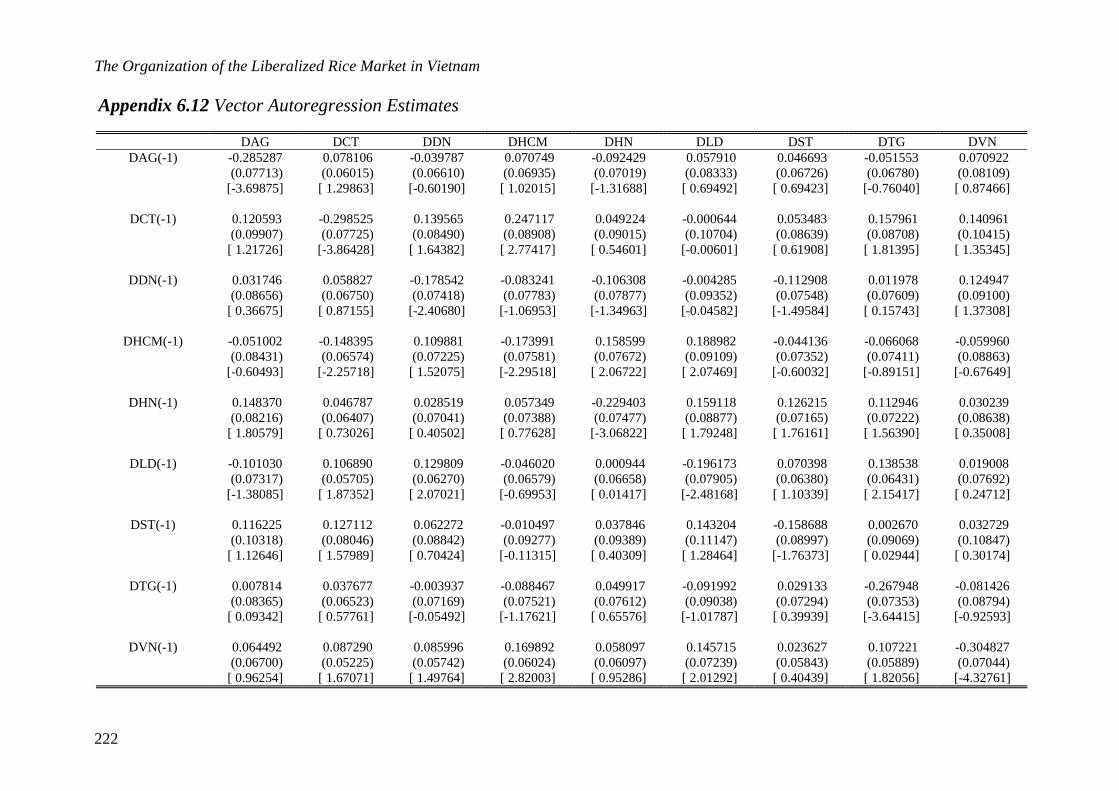
The Organization of the Liberalized Rice Market in Vietnam
222
Appendix 6.12 Vector Autoregression Estimates
DAG DCT DDN DHCM DHN DLD DST DTG DVN DAG(-1) -0.285287 0.078106 -0.039787 0.070749 -0.092429 0.057910 0.046693 -0.051553 0.070922
(0.07713) (0.06015) (0.06610) (0.06935) (0.07019) (0.08333) (0.06726) (0.06780) (0.08109) [-3.69875] [ 1.29863] [-0.60190] [ 1.02015] [-1.31688] [ 0.69492] [ 0.69423] [-0.76040] [ 0.87466]
DCT(-1) 0.120593 -0.298525 0.139565 0.247117 0.049224 -0.000644 0.053483 0.157961 0.140961 (0.09907) (0.07725) (0.08490) (0.08908) (0.09015) (0.10704) (0.08639) (0.08708) (0.10415) [ 1.21726] [-3.86428] [ 1.64382] [ 2.77417] [ 0.54601] [-0.00601] [ 0.61908] [ 1.81395] [ 1.35345]
DDN(-1) 0.031746 0.058827 -0.178542 -0.083241 -0.106308 -0.004285 -0.112908 0.011978 0.124947 (0.08656) (0.06750) (0.07418) (0.07783) (0.07877) (0.09352) (0.07548) (0.07609) (0.09100) [ 0.36675] [ 0.87155] [-2.40680] [-1.06953] [-1.34963] [-0.04582] [-1.49584] [ 0.15743] [ 1.37308]
DHCM(-1) -0.051002 -0.148395 0.109881 -0.173991 0.158599 0.188982 -0.044136 -0.066068 -0.059960 (0.08431) (0.06574) (0.07225) (0.07581) (0.07672) (0.09109) (0.07352) (0.07411) (0.08863) [-0.60493] [-2.25718] [ 1.52075] [-2.29518] [ 2.06722] [ 2.07469] [-0.60032] [-0.89151] [-0.67649]
DHN(-1) 0.148370 0.046787 0.028519 0.057349 -0.229403 0.159118 0.126215 0.112946 0.030239 (0.08216) (0.06407) (0.07041) (0.07388) (0.07477) (0.08877) (0.07165) (0.07222) (0.08638) [ 1.80579] [ 0.73026] [ 0.40502] [ 0.77628] [-3.06822] [ 1.79248] [ 1.76161] [ 1.56390] [ 0.35008]
DLD(-1) -0.101030 0.106890 0.129809 -0.046020 0.000944 -0.196173 0.070398 0.138538 0.019008 (0.07317) (0.05705) (0.06270) (0.06579) (0.06658) (0.07905) (0.06380) (0.06431) (0.07692) [-1.38085] [ 1.87352] [ 2.07021] [-0.69953] [ 0.01417] [-2.48168] [ 1.10339] [ 2.15417] [ 0.24712]
DST(-1) 0.116225 0.127112 0.062272 -0.010497 0.037846 0.143204 -0.158688 0.002670 0.032729 (0.10318) (0.08046) (0.08842) (0.09277) (0.09389) (0.11147) (0.08997) (0.09069) (0.10847) [ 1.12646] [ 1.57989] [ 0.70424] [-0.11315] [ 0.40309] [ 1.28464] [-1.76373] [ 0.02944] [ 0.30174]
DTG(-1) 0.007814 0.037677 -0.003937 -0.088467 0.049917 -0.091992 0.029133 -0.267948 -0.081426 (0.08365) (0.06523) (0.07169) (0.07521) (0.07612) (0.09038) (0.07294) (0.07353) (0.08794) [ 0.09342] [ 0.57761] [-0.05492] [-1.17621] [ 0.65576] [-1.01787] [ 0.39939] [-3.64415] [-0.92593]
DVN(-1) 0.064492 0.087290 0.085996 0.169892 0.058097 0.145715 0.023627 0.107221 -0.304827 (0.06700) (0.05225) (0.05742) (0.06024) (0.06097) (0.07239) (0.05843) (0.05889) (0.07044) [ 0.96254] [ 1.67071] [ 1.49764] [ 2.82003] [ 0.95286] [ 2.01292] [ 0.40439] [ 1.82056] [-4.32761]

Appendices
223
Appendix 6.12 (Continued)
DAG DCT DDN DHCM DHN DLD DST DTG DVN
R-squared 0.129703 0.169797 0.098184 0.125352 0.092792 0.091183 0.059097 0.127137 0.131106
Adj. R-squared 0.090367 0.132274 0.057424 0.085820 0.051788 0.050107 0.016570 0.087685 0.091834
Sum sq. resids 3720154. 2262088. 2732319. 3007630. 3080583. 4342499. 2828869. 2874320. 4111459.
S.E. equation 144.9752 113.0494 124.2450 130.3544 131.9258 156.6330 126.4212 127.4327 152.4093
F-statistic 3.297348 4.525103 2.408841 3.170885 2.263005 2.219841 1.389640 3.222613 3.338397
Log likelihood -1184.951 -1138.685 -1156.250 -1165.178 -1167.407 -1199.336 -1159.479 -1160.962 -1194.252
Akaike AIC 12.83818 12.34070 12.52957 12.62557 12.64953 12.99287 12.56429 12.58023 12.93819
Schwarz SC 12.99426 12.49679 12.68565 12.78165 12.80562 13.14895 12.72038 12.73632 13.09428
Mean dependent 0.806452 -2.150538 -0.107527 -0.376344 -0.376344 -2.849462 -0.537634 -0.806452 -4.796774
S.D. dependent 152.0060 121.3603 127.9738 136.3357 135.4806 160.7111 127.4818 133.4162 159.9295
Determinant Residual Covariance 7.33E+37
Log Likelihood (d.f. adjusted) -10483.75
Akaike Information Criteria 113.5995
Schwarz Criteria 115.0043
Note: (1) Included observations: 186. Excluded observations: 3 after adjusting endpoints. (2) Standard errors in ( ) & t-statistics in [ ]

The Organization of the Liberalized Rice Market in Vietnam
224
Appendix 6.13 Johansen Co-integration Test Normalized co-integrating coefficients (standard error in parentheses)
Co-integating equation
VN HCM CT AG ST TG LD DN HN
(1) 1.000000 0.000000 0.000000 -3.598265 3.243148 -4.250613 3.568764 0.265870 -0.497459 (0.81548) (0.84762) (0.73482) (0.54112) (0.36356) (0.45613)
(2) 0.000000 1.000000 0.000000 1.879818 -0.069662 -1.266777 -0.420700 -0.324372 -0.734023 (0.34451) (0.35809) (0.31044) (0.22861) (0.15359) (0.19270)
(3) 0.000000 0.000000 1.000000 0.766660 -1.136914 -0.231148 -0.306059 -0.115016 0.055629 (0.11724) (0.12186) (0.10565) (0.07780) (0.05227) (0.06558)
Adjustment coefficients (std.err. in parentheses)
D(VN) -0.019593 0.015752 -0.154306 (0.01889) (0.04423) (0.12928)
D(HCM) -0.029363 -0.004872 -0.000200 (0.01601) (0.03749) (0.10958)
D(CT) -0.028046 0.076943 -0.266788 (0.01370) (0.03208) (0.09378)
D(AG) 0.012855 -0.165163 0.101853 (0.01713) (0.04012) (0.11725)
D(ST) 0.008991 -0.078770 0.415107 (0.01489) (0.03487) (0.10192)
D(TG) 0.065214 0.036218 0.317987 (0.01475) (0.03455) (0.10097)
D(LD) -0.055013 -0.018738 0.181434 (0.01829) (0.04284) (0.12522)
D(DN) -0.013811 0.046136 0.048756 (0.01521) (0.03564) (0.10416)
D(HN) -0.018373 0.118912 -0.067354 (0.01584) (0.03709) (0.10840)

Appendices
225
Appendix 6.14 Vector Error Correction Estimates Error Correction: D(VN) D(HCM) D(CT) D(AG) D(ST) D(TG) D(LD) D(DN) D(HN)
CointEq1 -0.019593 -0.029363 -0.028046 0.012855 0.008991 0.065214 -0.055013 -0.013811 -0.018373 (0.01899) (0.01610) (0.01378) (0.01723) (0.01497) (0.01483) (0.01840) (0.01530) (0.01593) [-1.03156] [-1.82387] [-2.03566] [ 0.74624] [ 0.60044] [ 4.39619] [-2.99045] [-0.90256] [-1.15367]
CointEq2 0.015752 -0.004872 0.076943 -0.165163 -0.078770 0.036218 -0.018738 0.046136 0.118912 (0.04449) (0.03771) (0.03227) (0.04035) (0.03507) (0.03474) (0.04309) (0.03584) (0.03730) [ 0.35409] [-0.12921] [ 2.38446] [-4.09353] [-2.24607] [ 1.04241] [-0.43488] [ 1.28725] [ 3.18788]
CointEq3 -0.154306 -0.000200 -0.266788 0.101853 0.415107 0.317987 0.181434 0.048756 -0.067354 (0.13002) (0.11021) (0.09431) (0.11793) (0.10250) (0.10155) (0.12593) (0.10475) (0.10902) [-1.18677] [-0.00182] [-2.82872] [ 0.86370] [ 4.04976] [ 3.13133] [ 1.44071] [ 0.46543] [-0.61780]
D(VN(-1)) -0.294609 0.188498 0.098271 0.067294 0.025631 0.066463 0.182379 0.092102 0.061805 (0.07159) (0.06068) (0.05193) (0.06493) (0.05644) (0.05591) (0.06934) (0.05768) (0.06003) [-4.11520] [ 3.10634] [ 1.89240] [ 1.03640] [ 0.45414] [ 1.18867] [ 2.63023] [ 1.59685] [ 1.02960]
D(HCM(-1)) -0.063935 -0.185644 -0.188276 0.063750 -0.029706 -0.094788 0.153390 0.063733 0.070579 (0.09360) (0.07934) (0.06789) (0.08489) (0.07379) (0.07310) (0.09066) (0.07541) (0.07848) [-0.68308] [-2.33998] [-2.77312] [ 0.75096] [-0.40259] [-1.29665] [ 1.69201] [ 0.84518] [ 0.89930]
D(CT(-1)) 0.217139 0.248675 -0.170166 0.080025 -0.147447 -0.004309 -0.087135 0.113074 0.075830 (0.12229) (0.10366) (0.08871) (0.11091) (0.09641) (0.09551) (0.11844) (0.09852) (0.10254) [ 1.77561] [ 2.39905] [-1.91832] [ 0.72151] [-1.52944] [-0.04511] [-0.73566] [ 1.14768] [ 0.73952]
D(AG(-1)) 0.076027 0.009031 0.056619 -0.153626 -0.033593 -0.066194 -0.123489 -0.131050 -0.210171 (0.09410) (0.07976) (0.06826) (0.08535) (0.07418) (0.07349) (0.09114) (0.07581) (0.07890) [ 0.80793] [ 0.11322] [ 0.82949] [-1.80003] [-0.45283] [-0.90067] [-1.35491] [-1.72860] [-2.66368]
D(ST(-1)) -0.030440 0.024451 0.010702 0.158753 0.063586 0.102881 0.310611 0.105853 0.021456 (0.12586) (0.10668) (0.09129) (0.11415) (0.09922) (0.09830) (0.12190) (0.10140) (0.10553) [-0.24187] [ 0.22920] [ 0.11723] [ 1.39078] [ 0.64088] [ 1.04665] [ 2.54813] [ 1.04396] [ 0.20332]
D(TG(-1)) -0.123729 -0.143310 0.010557 -0.075967 0.040313 -0.087862 -0.178784 0.011327 0.095057 (0.09914) (0.08404) (0.07192) (0.08992) (0.07816) (0.07743) (0.09603) (0.07988) (0.08313) [-1.24798] [-1.70534] [ 0.14680] [-0.84483] [ 0.51578] [-1.13469] [-1.86183] [ 0.14181] [ 1.14346]
D(LD(-1)) 0.034156 0.006736 0.126023 -0.121752 0.106187 0.067203 -0.072786 0.164799 0.033189 (0.08228) (0.06974) (0.05968) (0.07463) (0.06487) (0.06426) (0.07969) (0.06629) (0.06899) [ 0.41511] [ 0.09658] [ 2.11148] [-1.63147] [ 1.63701] [ 1.04573] [-0.91331] [ 2.48598] [ 0.48105]
D(DN(-1)) 0.120899 -0.071055 0.050150 0.032089 -0.084295 0.010983 0.033105 -0.168120 -0.102259 (0.09176) (0.07778) (0.06656) (0.08322) (0.07234) (0.07166) (0.08887) (0.07392) (0.07694) [ 1.31760] [-0.91359] [ 0.75348] [ 0.38559] [-1.16533] [ 0.15326] [ 0.37250] [-2.27420] [-1.32911]
D(HN(-1)) 0.035225 0.036667 0.072440 0.103995 0.074258 0.137298 0.101610 0.027274 -0.204015 (0.08866) (0.07515) (0.06431) (0.08042) (0.06990) (0.06925) (0.08588) (0.07143) (0.07434) [ 0.39728] [ 0.48790] [ 1.12634] [ 1.29322] [ 1.06238] [ 1.98267] [ 1.18321] [ 0.38182] [-2.74419]

The Organization of the Liberalized Rice Market in Vietnam
226
Appendix 6.14 (Continued) D(VN) D(HCM) D(CT) D(AG) D(ST) D(TG) D(LD) D(DN) D(HN)
R-squared 0.139313 0.149082 0.213558 0.216272 0.158148 0.245581 0.200420 0.127508 0.156764
Adj. R-squared 0.084902 0.095289 0.163840 0.166726 0.104928 0.197888 0.149872 0.072350 0.103456
Sum sq. resids 4072623. 2926028. 2142851. 3350108. 2531067. 2484287. 3820543. 2643475. 2863354.
S.E. equation 152.9898 129.6775 110.9740 138.7570 120.6083 119.4885 148.1794 123.2574 128.2812
F-statistic 2.560373 2.771373 4.295410 4.365069 2.971562 5.149180 3.964942 2.311698 2.940721
Log likelihood -1193.369 -1162.620 -1133.649 -1175.207 -1149.134 -1147.399 -1187.427 -1153.175 -1160.606
Akaike AIC 12.96096 12.63032 12.31881 12.76567 12.48531 12.46666 12.89707 12.52877 12.60867
Schwarz SC 13.16907 12.83843 12.52692 12.97378 12.69343 12.67477 13.10518 12.73688 12.81678
Mean dependent -4.796774 -0.376344 -2.150538 0.806452 -0.537634 -0.806452 -2.849462 -0.107527 -0.376344
S.D. dependent 159.9295 136.3357 121.3603 152.0060 127.4818 133.4162 160.7111 127.9738 135.4806
Determinant Residual Covariance 3.60E+37
Log Likelihood -10361.80
Log Likelihood (d.f. adjusted) -10417.62
Akaike Information Criteria 113.4690
Schwarz Criteria 115.8103
Note: (1) Included observations: 186. Excluded observations: 3 after adjusting endpoints. (2) Standard errors in ( ) & t-statistics in [ ]
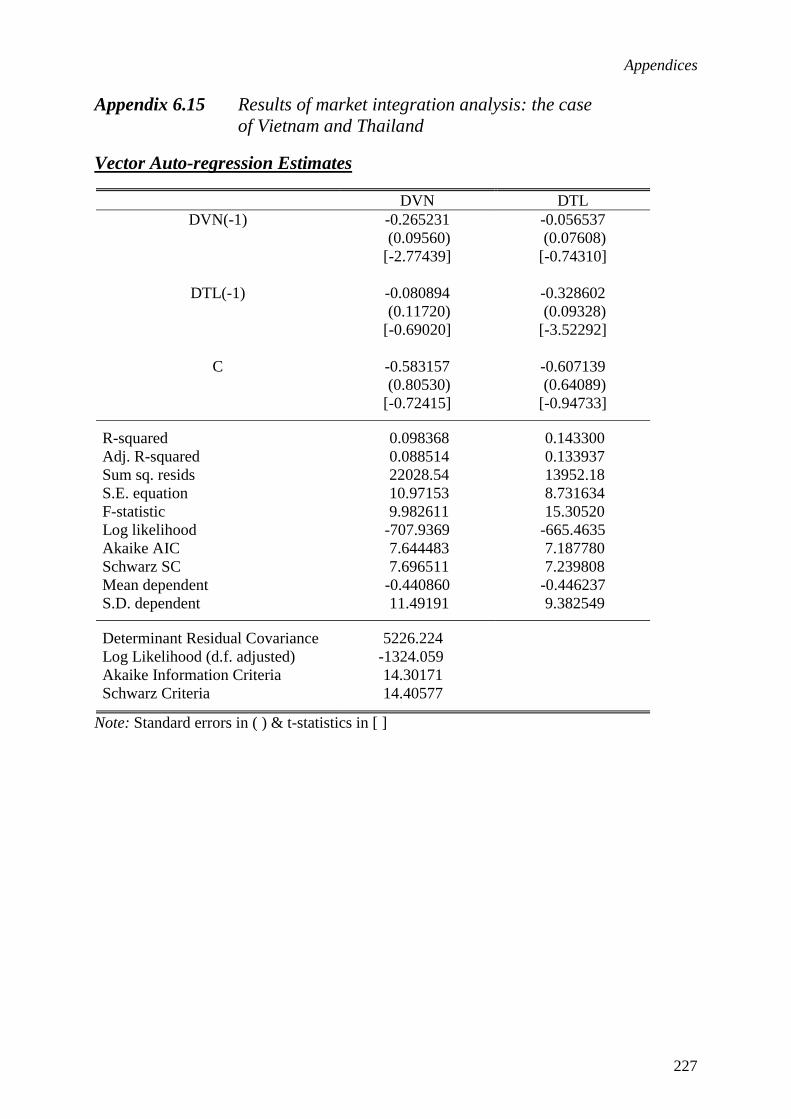
Appendices
227
Appendix 6.15 Results of market integration analysis: the case of Vietnam and Thailand
Vector Auto-regression Estimates
DVN DTL DVN(-1) -0.265231 -0.056537
(0.09560) (0.07608) [-2.77439] [-0.74310]
DTL(-1) -0.080894 -0.328602 (0.11720) (0.09328) [-0.69020] [-3.52292]
C -0.583157 -0.607139 (0.80530) (0.64089) [-0.72415] [-0.94733]
R-squared 0.098368 0.143300 Adj. R-squared 0.088514 0.133937 Sum sq. resids 22028.54 13952.18 S.E. equation 10.97153 8.731634 F-statistic 9.982611 15.30520 Log likelihood -707.9369 -665.4635 Akaike AIC 7.644483 7.187780 Schwarz SC 7.696511 7.239808 Mean dependent -0.440860 -0.446237 S.D. dependent 11.49191 9.382549
Determinant Residual Covariance 5226.224 Log Likelihood (d.f. adjusted) -1324.059 Akaike Information Criteria 14.30171 Schwarz Criteria 14.40577
Note: Standard errors in ( ) & t-statistics in [ ]

The Organization of the Liberalized Rice Market in Vietnam
228
Appendix 6.15 (Continued)
Johansen Co-integration Test (one Co-integrating equation)
Hypothesized Trace 5 Percent 1 Percent No. of CE(s) Eigen value Statistic Critical Value Critical Value
None ** 0.108413 22.37014 15.41 20.04 At most 1 0.005502 1.026243 3.76 6.65
*(**) denotes rejection of the hypothesis at the 5%(1%) level Trace test indicates 1 co-integrating equation(s) at the 5% level Trace test indicates no co-integration at the 1% level
Hypothesized Max-Eigen 5 Percent 1 Percent No. of CE(s) Eigen value Statistic Critical Value Critical Value
None ** 0.113068 22.31752 15.67 20.20 At most 1 0.008598 1.606144 9.24 12.97
*(**) denotes rejection of the hypothesis at the 5%(1%) level Max-eigen value test indicates 1 co-integrating equation(s) at both 5% and 1% levels
Unrestricted Co-integrating Coefficients (normalized by b'*S11*b=I):
VN TL C 0.094750 -0.095654 1.191803 0.003015 0.012813 -2.445058
Unrestricted Adjustment Coefficients (alpha):
D(VN) -1.506037 -0.921265 D(TL) 1.216969 -0.731774
1 Co-integrating Equation(s): Log likelihood -1310.341
Normalized co-integrating coefficients (standard error in parentheses) VN TL C
1.000000 -1.009534 12.57837 (0.05077) (10.5251)
Adjustment coefficients (standard error in parentheses)
D(VN) -0.142697 (0.07560)
D(TL) 0.115308 (0.06021)

Summary
During the first ten years after the end of the war the rice market in Vietnam was strongly controlled by the government and rice trade was dominated by market-ing parastatals. About twenty years ago a liberalization process started and rice production increased enormously. In the 80s the country still faced production deficits, but gradually Vietnam started to export and became the second rice ex-porter in the world market. These developments in the rice market were facili-tated by the government policy. At the macro level, the transition from a cen-trally planned to a market economy led to a change in institutions, which, subse-quently, had a strong impact on different actors in the market. The economic re-forms changed the strategy of traders (for example their strategies with regard to buying and selling, transport, storage, etc.). This study examines the current rice marketing system and the channels of rice distribution in Vietnam. In particular, the market structure and the relationships between the different actors in the rice market, are studied. An attempt is made to assess the effectiveness and efficiency of the supplied market services. More-over, the study also provides recommendations for establishing suitable market-ing strategies, trade policies, regulations, institutions and services to promote private and cooperative rice production. The study aims at contributing to the policy debate between the government and the private sector and to support the transition from direct public interventions to more market-oriented regulations. In this study the structure, conduct, and performance (SCP) approach and the marketing channel approach are applied, together with the insights drawn from the theory of institutional economics. Those approaches are used as a guideline, to identify the different issues of the problem. The dynamic SCP model, show-ing that the three levels may interact when competition is imperfect, is applied. This model is a useful instrument to order the myriad of market features. In this study we analyze marketing costs and marketing margins. Some tests, for short- and long–run price integration between different market places, are developed in order to measure the efficiency of the marketing system. Finally, an analysis is made of market processes, to check whether proper incentives exist for actors in the market to realize further channel improvements. The data in this study were obtained from two sources: primary and secondary sources. Secondary data included historical data on rice production, marketed surplus of rice, weekly and monthly average prices of some major rice markets in the Mekong River Delta. Primary data were gathered through structured in-terviews with farmers; traders (assemblers, wholesalers, retailers), millers, state
The Organization of the Liberalized Rice Market in Vietnam
230
owned enterprises and some other knowledgeable persons involved in the rice business. The result of the market structure analysis indicates that the rice market in Viet-nam can be characterized by competition. In general it is concluded that no im-portant barriers to entry exist; that the degree of trader concentration is low; that the rice products marketed are rather homogenous; and that market information is easy to obtain. The marketing channel, through which paddy/rice passes from farmers to final consumers, is quite complex. Eight main rice-marketing chan-nels are identified. In the domestic rice market, private rice traders, including assemblers, wholesalers, brokers, and small millers, play an important role in distributing the product at the regional and inter-regional level. The free market policy orientation in Vietnam has created a favourable environment for private rice traders. In contrast to the international trade flows, the national trade flows are completely liberalized. However, as a result of the same trade policy, a small group of selected large millers/polishers and in particular the SOEs control the export channels.
With regard to the rice market conduct, the major finding is that rice traders per-form different marketing functions: transportation, storage, negotiation, process-ing, market information, and financing. Boats are the most popular means of transportation in the Mekong River Delta. Transportation, loading and unloading costs do not vary much among rice traders. Storage is more important to rice millers/polishers in order to guarantee supply to their milling machinery. Stor-age for speculative purpose is a minor activity for rice traders. Trade credit is relatively important for transactions between rice wholesalers and retailers; and between rice millers/polishers and the SOEs. The rice wholesalers can give credit to the rice retailers in terms of deferred payment. In contrast, the rice mill-ers/polishers can receive money in advance from the SOEs. Operating in an open/free market, rice traders are flexible and deliberately decide which suppli-ers they use and which customers they will serve. Most transactions take place on the spot. However, others develop business relationships based on reputation and trust. They fully volunteer to establish that kind of relation.
The analysis of market performance shows that rice producers and traders in the market offer suitable types of rice quality to satisfy consumer preferences. Do-mestic channels of rice distribution are organized quite effectively to provide the convenient form and quality of the product to final consumers. Dependent on the benchmark used, the rice assemblers and retailers may be considered as the most efficient traders as they obtained the highest profit if expressed as a percentage of the cost price. In contrast, the rice millers/polishers seem to be inefficient as they realize a lower profit rate expressed as a percentage of the cost price. How-ever, if we compare net rates of profit on invested capital the picture is com-pletely different: rice millers/polishers obtain the highest net rate of profit on in-
Summary
231
vested capital and rice retailers the lowest one. We showed that the latter profit rates are reasonable as they are in line with the bank interest rates. Therefore, we conclude that competitive forces in the market are operational.
Regarding market integration, our study found that all major market places in the Mekong River Delta are highly integrated. Rice prices in different market places follow the export price (determined by the government) and the prices in Ho Chi Minh City. Due to the long distance, markets in the North are not strongly integrated with the Mekong Delta markets. At the international level, the government controlled export price of Vietnamese rice, is highly correlated with the world market price (Thailand price). The price formation process in both domestic and export rice markets cohere. This implies that the floor price policy of the government follows the price pattern in the world market.
In general, it is concluded that the process of competition and institutional de-velopment in the market has created a favourable environment to remove major obstacles for the further development of an efficient and effective marketing system. This explains why the rice market in Vietnam, especially in the Mekong River Delta, became competitive in the world market.
The private sector has responded very strongly to the incentives provided by the market-oriented policies. The marketing system is characterized by a multitude of small marketing agents involved in trading and milling. In particular some rice millers/polishers and wholesalers deal at a larger scale and supply both do-mestic and international markets. Both private and state marketing channels are improving gradually through the process of market liberalization. However, there are still opportunities for further improvement of the private marketing system. We observed some problems with regard to barriers to entry; access to credit and finance; and access to market information.
Most important is our observation that the state farms and the state owned food-companies, still dominate the export sector. To date, the largest share of the total marketable surplus in the rice market is finding its way to the final consumer through these organizations (in particular milling activities, distribution to retail-ers and the export market). It shows that privatisation still has a long way to go. The crucial question in the near future is to know how this can be realized with-out jeopardizing supply to the domestic market.


Samenvatting Gedurende de eerste tien jaar na afloop van de oorlog stond de rijstmarkt in Vietnam onder sterke controle van de overheid en werd de handel gedomineerd door overheidsbedrijven. Ongeveer 20 jaar geleden is een proces van liberaliser-ing in gang gezet. De rijstproductie is sterk gestegen. In de 80er jaren kende het land nog rijsttekorten, maar inmiddels is Vietnam uitgegroeid tot de tweede rijstexporteur ter wereld. Deze ontwikkelingen in de rijstmarkt zijn mede mogelijk gemaakt door het overheidsbeleid. Op macro niveau heeft de transitie van een centraal geplande economie naar een markteconomie geleid tot een ve-randering van instituties, die vervolgens grote invloed hebben gehad op het gedrag van verschillende actoren in de markt. De economische hervormingen hebben het gedrag van handelaren beïnvloed (bijvoorbeeld hun strategie ten aanzien van de aankoop, de verkoop, het transport, de opslag, etc.). Deze studie analyseert het huidige marktsysteem en de organisatie van de bin-nenlandse handelskanalen voor rijst in Vietnam. In het bijzonder zijn de marktstructuur en de relaties tussen verschillende actoren bestudeerd. Ook is getracht de effectiviteit en de efficiency van de commerciële dienstverlening te beoordelen. Tevens worden enkele aanbevelingen gedaan voor het ontwikkelen van marketing strategieën, handelspolitiek, regulering, instituties en diensten teneinde de private en coöperatieve rijstproductie verder te bevorderen. Beoogd wordt een bijdrage te leveren aan de beleidsdiscussie tussen overheid en private sector en, in het bijzonder, aan het proces van transitie van publieke interventies naar meer markt georiënteerde regels. Voor dit onderzoek is gebruikt gemaakt van de ‘Structure, Conduct, Perform-ance (SCP)’ en de ‘marketing channel’ benadering. Ook zijn de inzichten van de economische institutionele theorie toegepast. Deze benaderingen en theorieën zijn als richtsnoer gebruikt om de verschillende aspecten van het probleem te identificeren. Het dynamische SCP model, dat laat zien dat de drie onderschei-den niveaus op elkaar inwerken als de competitie imperfect is, is toegepast. Dit model is een handig instrument om de kluwen van marktkarakteristieken te ont-warren. De studie analyseert de marketing kosten en de marges. Ook is getest op lange en korte termijn marktintegratie tussen verschillende marktplaatsen, teneinde een uitspraak te kunnen doen over de efficiency van de markt. Tenslotte is geprobeerd zicht te krijgen op de aanpassingsprocessen die zich voordoen in de markt om na te gaan in hoeverre er prikkels bestaan om het huidige marktsysteem verder te verbeteren. De data voor deze studie zijn verkregen via primaire en secundaire bronnen. Het secundaire materiaal betreft historische data over de rijstproductie, verhandelde

The Organization of the Liberalized Rice Market in Vietnam
234
hoeveelheden op de markt, gemiddelde wekelijkse en maandelijkse prijzen op de belangrijkste rijstmarkten in de Mekong River Delta. Primaire data zijn ver-zameld middels gestructureerde interviews met boeren, handelaren (opkopers, groothandelaren en detaillisten), rijstmolenaars, overheidsbedrijven en enkele experts betrokken bij de rijstmarkt. Het resultaat van de marktstructuur analyse geeft aan dat de binnenlandse rijstmarkt in Vietnam gekarakteriseerd wordt door competitie. Over het alge-meen zijn er geen belangrijke toetredingsbarrières tot de rijstmarkt waarge-nomen; is de mate van concentratie van de handel gering; zijn de verschillende rijstsoorten in sterke mate homogeen; en is informatie over de markt eenvoudig te verkrijgen. Het handelskanaal waarlangs paddy/rijst zijn weg vindt van boer tot finale consument is complex. In totaal acht belangrijke handelskanalen zijn in kaart gebracht. In het binnenlandse handelscircuit spelen private rijsthande-laren, waaronder opkopers, groothandelaren, ‘brokers’ en kleine molenaars, een belangrijke rol in de rijstdistributie op lokaal en interregionaal niveau. De vrije-marktpolitiek in Vietnam heeft een aantrekkelijk klimaat geschapen voor de pri-vate rijsthandel. In tegenstelling tot de internationale transacties zijn de nation-ale handelsstromen volledig geliberaliseerd. Echter, als gevolg van de regel-geving, controleren een selecte groep grote molenaars (‘millers/polishers’) en in het bijzonder de staatsbedrijven, de export transacties. Met betrekking tot het marktgedrag laat de studie zien dat de handelaren ver-schillende functies vervullen: transport, opslag, onderhandelen, verwerking (malen), marktinformatie en financiering. De boot is het meest gebruikte trans-portmiddel in de Mekong River Delta. Kosten voor transport, laden en lossen, verschillen niet veel tussen de handelaren. Opslag is meer van belang voor de molenaars (‘millers/polishers’) teneinde aanvoer voor de rijstmolen te ga-randeren. Opslag voor speculatie is van ondergeschikt belang voor de rijsthande-laren. Handelskrediet speelt een relatief belangrijke rol voor transacties tussen groothandelaren en detaillisten en transacties tussen molenaars en staatsbedri-jven. De groothandelaren kunnen handelskrediet geven aan detaillisten middels het toestaan van uitgestelde betalingen. Daarentegen kunnen molenaars vooraf geld ontvangen van staatsbedrijven teneinde de gewenste hoeveelheden op te kopen. In het binnenlandse vrije marktsysteem zijn de handelaren flexibel en maken zij een weloverwogen keuze uit potentiële aanbieders en afnemers. De meeste transacties zijn niet gebaseerd op vaste handelsrelaties. Echter, sommige actoren ontwikkelen meer permanente handelsrelaties, gebaseerd op reputatie en vertrouwen. Deze contacten zijn aangegaan op basis van vrijwilligheid. De analyse van het marktresultaat (‘performance’) laat zien dat de rijstproducen-ten en handelaren de juiste rijstkwaliteiten in de markt aanbieden om in de pref-erenties van de consumenten te voorzien. De handelskanalen voor de bin-

Samenvatting
235
nenlandse markt zijn operationeel en bieden de gewenste commerciële diensten aan. Afhankelijk van het gebruikte criterium zouden opkopers en detaillisten als de meest efficiënte handelaren gezien kunnen worden omdat zij de hoogste winst, uitgedrukt in procenten van de kostprijs, realiseren. Daarentegen lijken molenaars inefficiënt omdat zij een lager winstpercentage op de kostprijs be-halen. Echter, als de netto winstmarges over het geïnvesteerde kapitaal worden vergeleken dan is het resultaat geheel anders: molenaars realiseren de hoogste netto winstmarge op het geïnvesteerde kapitaal en detaillisten de laagste winstvoet. De resultaten laten zien dat de laatstgenoemde winstvoeten redelijk zijn en sporen met de door de bank geheven interest op krediet. Dit wordt gezien als een indicatie dat concurrerende krachten in de markt operationeel zijn. Met betrekking tot marktintegratie laten de resultaten van het onderzoek zien dat alle marktplaatsen in de Mekong River Delta in sterke mate geïntegreerd zijn. Rijstprijzen op de binnenlandse markt volgen de prijzen in Ho Chi Minh City en de export prijzen zoals vastgesteld door de overheid. Vanwege de lange afstand zijn de markten in het noorden nauwelijks geïntegreerd met de markten in de Mekong River Delta. Voor wat betreft de internationale transacties wordt ge-concludeerd dat de export prijzen, die vastgesteld zijn door de overheid, in sterke mate samenhangen met de wereldmarktprijs voor rijst uit Thailand (de grootste exporteur op de rijstmarkt). Hieruit volgt dat het proces van prijsvorm-ing op de binnenlandse markt samenhangt met de prijsontwikkelingen op de wereldmarkt. Dit betekent ook dat de ‘floor-price policy’ van de Vietnamese overheid de prijsontwikkelingen op de wereldmarkt volgt. In het algemeen wordt geconcludeerd dat het proces van competitie en de ont-wikkeling van instituties in de markt een aantrekkelijke omgeving hebben ge-creëerd om barrières voor de verdere verbetering van de efficiëntie van de markt weg te nemen. Dit verklaart waarom de markt in Vietnam, en in het bijzonder in de Mekong River Delta, concurrerend op de wereldmarkt is geworden. De private sector heeft sterk gereageerd op de prikkels die de liberale marktpoli-tiek hen heeft gegeven. Het huidige marktsysteem wordt gekarakteriseerd door een groot aantal op kleine schaal opererende agenten. Daarnaast zijn het vooral de molenaars en groothandelaren die op grotere schaal opereren en de bin-nenlandse en internationale markten bevoorraden. Zowel bij de private als bij de door de staatsbedrijven gecontroleerde handelskanalen vindt een proces van verbetering plaats als gevolg van de liberale handelspolitiek. Echter, er zijn nog steeds mogelijkheden om verdere verbeteringen te realiseren in het private marktsysteem. Enkele problemen met betrekking tot toetredingsbarrières; toe-gang tot krediet; en toegang tot marktinformatie, zijn in de tekst besproken.

The Organization of the Liberalized Rice Market in Vietnam
236
Van belang is te constateren dat de boerderijen en de voedselbedrijven van de staat nog steeds de exportsector domineren. Tot op de dag van vandaag vindt het grootste deel van de op de markt verhandelde productie zijn weg naar de finale consument via een van deze organisaties (in het bijzonder via de door de staat beheerde molens, de bevoorrading van detaillisten en de controle op export transacties). Dit laat zien dat de privatisering nog een lange weg heeft te gaan. De cruciale vraag voor de toekomst is te weten hoe dit gerealiseerd kan worden zonder een stabiel binnenlands aanbod in gevaar te brengen.