The Analysis of Technical Trend in Islanding Operation ... - MDPI
Upload
nuardiblogspotCategory
view
2download
0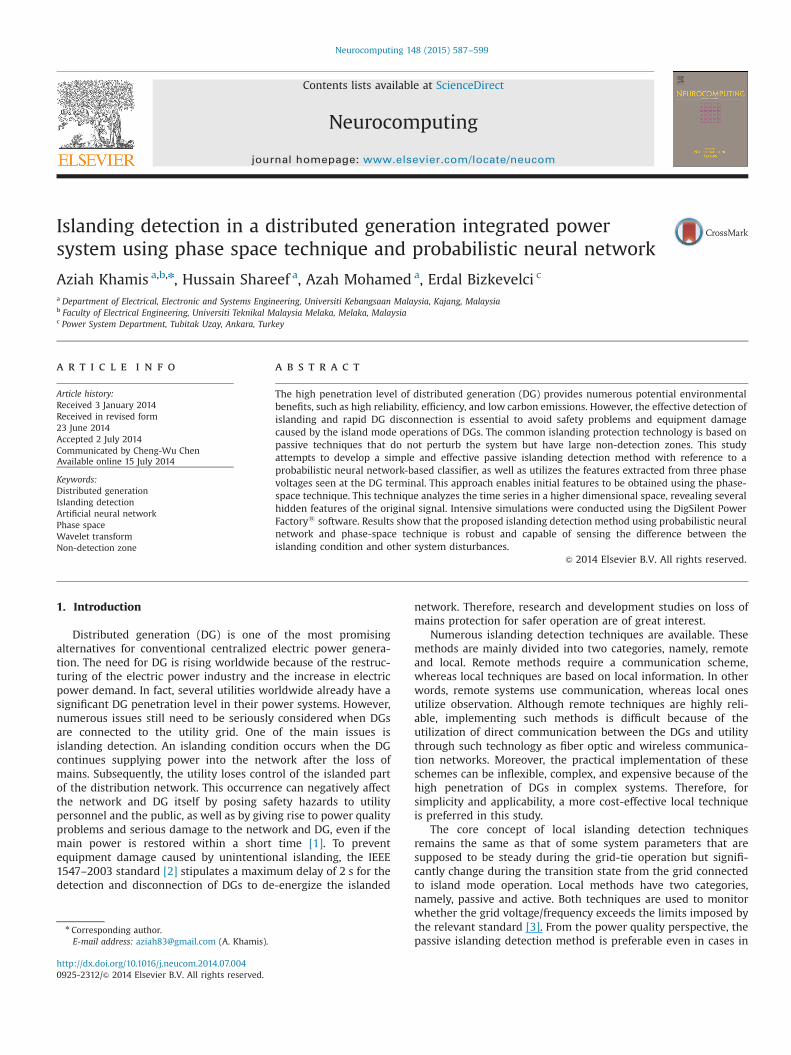
Islanding detection in a distributed generation integrated powersystem using phase space technique and probabilistic neural network
Aziah Khamis a,b,n, Hussain Shareef a, Azah Mohamed a, Erdal Bizkevelci c
a Department of Electrical, Electronic and Systems Engineering, Universiti Kebangsaan Malaysia, Kajang, Malaysiab Faculty of Electrical Engineering, Universiti Teknikal Malaysia Melaka, Melaka, Malaysiac Power System Department, Tubitak Uzay, Ankara, Turkey
a r t i c l e i n f o
Article history:Received 3 January 2014Received in revised form23 June 2014Accepted 2 July 2014Communicated by Cheng-Wu ChenAvailable online 15 July 2014
Keywords:Distributed generationIslanding detectionArtificial neural networkPhase spaceWavelet transformNon-detection zone
a b s t r a c t
The high penetration level of distributed generation (DG) provides numerous potential environmentalbenefits, such as high reliability, efficiency, and low carbon emissions. However, the effective detection ofislanding and rapid DG disconnection is essential to avoid safety problems and equipment damagecaused by the island mode operations of DGs. The common islanding protection technology is based onpassive techniques that do not perturb the system but have large non-detection zones. This studyattempts to develop a simple and effective passive islanding detection method with reference to aprobabilistic neural network-based classifier, as well as utilizes the features extracted from three phasevoltages seen at the DG terminal. This approach enables initial features to be obtained using the phase-space technique. This technique analyzes the time series in a higher dimensional space, revealing severalhidden features of the original signal. Intensive simulations were conducted using the DigSilent PowerFactorys software. Results show that the proposed islanding detection method using probabilistic neuralnetwork and phase-space technique is robust and capable of sensing the difference between theislanding condition and other system disturbances.
& 2014 Elsevier B.V. All rights reserved.
1. Introduction
Distributed generation (DG) is one of the most promisingalternatives for conventional centralized electric power genera-tion. The need for DG is rising worldwide because of the restruc-turing of the electric power industry and the increase in electricpower demand. In fact, several utilities worldwide already have asignificant DG penetration level in their power systems. However,numerous issues still need to be seriously considered when DGsare connected to the utility grid. One of the main issues isislanding detection. An islanding condition occurs when the DGcontinues supplying power into the network after the loss ofmains. Subsequently, the utility loses control of the islanded partof the distribution network. This occurrence can negatively affectthe network and DG itself by posing safety hazards to utilitypersonnel and the public, as well as by giving rise to power qualityproblems and serious damage to the network and DG, even if themain power is restored within a short time [1]. To preventequipment damage caused by unintentional islanding, the IEEE1547–2003 standard [2] stipulates a maximum delay of 2 s for thedetection and disconnection of DGs to de-energize the islanded
network. Therefore, research and development studies on loss ofmains protection for safer operation are of great interest.
Numerous islanding detection techniques are available. Thesemethods are mainly divided into two categories, namely, remoteand local. Remote methods require a communication scheme,whereas local techniques are based on local information. In otherwords, remote systems use communication, whereas local onesutilize observation. Although remote techniques are highly reli-able, implementing such methods is difficult because of theutilization of direct communication between the DGs and utilitythrough such technology as fiber optic and wireless communica-tion networks. Moreover, the practical implementation of theseschemes can be inflexible, complex, and expensive because of thehigh penetration of DGs in complex systems. Therefore, forsimplicity and applicability, a more cost-effective local techniqueis preferred in this study.
The core concept of local islanding detection techniquesremains the same as that of some system parameters that aresupposed to be steady during the grid-tie operation but signifi-cantly change during the transition state from the grid connectedto island mode operation. Local methods have two categories,namely, passive and active. Both techniques are used to monitorwhether the grid voltage/frequency exceeds the limits imposed bythe relevant standard [3]. From the power quality perspective, thepassive islanding detection method is preferable even in cases in
Contents lists available at ScienceDirect
journal homepage: www.elsevier.com/locate/neucom
Neurocomputing
http://dx.doi.org/10.1016/j.neucom.2014.07.0040925-2312/& 2014 Elsevier B.V. All rights reserved.
n Corresponding author.E-mail address: [email protected] (A. Khamis).
Neurocomputing 148 (2015) 587–599

which the negative contribution of the active techniques can beconsidered negligible. Conventional passive techniques utilize themeasurement of electrical quantities, such as voltage, current, orfrequency, to estimate the system island state using under/overvoltage (UVP/OVP), under/over frequency (UFP/OFP), and vectorshift (VS) functions. Some inverters may include any combinationof these protection schemes as built-in functions. However, theseschemes may not be acceptable as adequate interface protectionabove certain limits of installed DG capacities. Meanwhile,frequency-based schemes are widely used in passive detectionschemes to detect islanding condition involving synchronousgenerators. The frequency is constant under normal conditions.Hence, detection of the islanding condition is possible by checkingthe rate of frequency changes. The frequency relays are based onthe under- and over-frequency criteria for the calculation of thefrequency of the DG terminal voltage waveforms. Typically, theunder- and over-frequency range is set to 70.5 Hz. Three types offrequency-based relays are available for islanding detection,namely, frequency relay, rate of change of frequency relay [4], [5]and vector surge (or shift, jump) relay. However, the primaryweakness of the UVP/OVP and UFP/OFP is the difficulty in detect-ing when the load and generation in an islanded distributionsystem is nearly equal. This situation may incur the risk of largenon-detection zones (NDZ). Therefore, in the literature, someimprovements have been proposed to mitigate large NDZ pro-blems. In [6], a method is proposed to reduce the NDZs of UVP/OVP and UFP/OFP by comparing the P–V and P–Q characteristics ofinverters equipped with a constant current controller.
The scheme reported in [7] is based on the monitoring of phasedifferences between the inverter terminal voltage and outputcurrent. The method is easy to implement because it merelyrequires the modification of the phase locked loop needed byinverters for utility synchronization. Teoh and Tan [8] proposed aharmonic measurement technique for the same purpose bymonitoring the change in the total harmonic distortion (THD) atthe point of common coupling (PCC). If the THD value exceeds apre-defined threshold, the inverter disconnects the DGs from thenetwork.
The application of computational intelligence in islandingdetection is a new trend in passive islanding detection algorithms.These approaches mainly aim to estimate the off-grid operation assoon as possible by neither communicating with any other utilitycomponent nor giving any concession on power quality. In addi-tion to swift estimation, the technique provides high computa-tional efficiency with good reliability and accuracy. Some existingintelligent methods combine signal processing and neural networktechniques. For instance, fast Fourier transform (FFT) with integra-tion of the immunological principle to respond to inverter island-ing was proposed in [9]. Nonetheless, FFT is unsuitable for non-stationary signals that appear during islanding. To overcome itslimitations, FFT is replaced with wavelet features and artificialneural network (ANN) classifier for robust islanding detection, asdescribed in [10]. In the research conducted by Samantaray et al.[11], the feature vector was extracted using discrete wavelettransform (DWT) from the current signal seen at DG terminal.Various classification techniques, such as decision tree, radial basisfunction (RBF), and probabilistic neural network (PNN), were thentrained as classifiers. Samantaray et al. claim that PNN is highlyeffective in islanding detection and is more reliable than otherclassification techniques because it has already been tested withthe simulation model and real-time digital simulator.
A new technique called phase space method is becomingpopular for use in various classification and detection algorithms.The technique is based on the mathematical method, whichreconstructs the data of a time series in a higher dimensionalspace. In power system research, the technique was first utilized
for power quality detection problems in 2008 [12], [13]. Moreover,the phase space approach has also been applied to distance relays.The speed of the phase space fault detection technique was foundto be only 4 ms, which is considered suitable for real-timeimplementation. However, this technique has not been thoroughlyapplied to islanding detection. Some preliminary applications ofthe phase space technique in islanding detection were explored in[14,15].
The proposed approach is an extension of [14] and [15]. Thisapproach aims to adopt phase space and neural networks forislanding detection. The present works differ from the preliminarywork in [14,15] because of the use of enhanced phase spacefeatures, an effective classifier, and improved results with exten-sive comparative studies. The proposed method involves twomajor steps. In the first step, features are extracted using phasespace at the target DG location. This step is then compared withconventional signal processing technique, such as wavelet trans-form with six decompositions of the DWT of the voltage signalsobtained at the target DG location. The main purpose of this step isto identify the best algorithm that can be used to extract thefeatures under islanding detection conditions. In the second step, aclassification task is performed under islanding conditions usingPNN. The performance of PNN is compared with that of aconventional neural network, such as RBF, for training in differ-entiating the islanding event from other system disturbanceevents. The error measurement indices are studied to identifythe best features and classification technique to be used inislanding detection.
2. Conventional discrete wavelet based method
A commonly used DWT-based islanding detection method wasintroduced by Lidula and Rajapakse to solve the limitation ofwindowed Fourier transforms in islanding detection [16–18]. Themethod assumes that the event-specific characteristics embeddedin the transient current or voltage waveforms are not directlydistinguishable. Therefore, these characteristics have to be pre-processed to extract features that assist fast classificationresponse. DWT is used for this purpose. DWT of discrete signalf(x) is mathematically defined as follows:
DWTψ f ðm;nÞ ¼∑f ðkÞψnm;nðkÞ ð1Þwhere, Ψm,n is the discretized mother wavelet given by
ψm;nðtÞ ¼1ffiffiffiffiffiffiamo
p ψt�boamo
amo
� �ð2Þ
aoð41Þ and boð40Þ are fixed real values, and m and n are positiveintegers.
A suitable sampling frequency and mother wavelet areobtained by experimentation and trial and error. For a selectedsampling frequency of 10 kHz and mother wavelet (DB4 wavelet),the transformation is applied to six levels of decomposition toextract the detailed information of the sample voltage signal[16,17]. The six details extracted from the wavelet decompositioncontain a large amount of information to assist in islandingdetection. Therefore, the energy content of each level is obtainedto construct the feature vector. Wavelet energy is obtained byintegrating the square of wavelet coefficient over a time windowof 0.01 s. The energy content for the first detail can be calculatedby [19]
jjED1ajj ¼ ∑kd2k
" #1=2
ð3Þ
where, ED1a is the energy content of D1 for voltage signal at phase-A. dK is the kth coefficient in the first decomposition level. Once all
A. Khamis et al. / Neurocomputing 148 (2015) 587–599588
energy contents are acquired, the sum of energies of the threephases is calculated to create a six-dimensional-feature vector ateach decomposition level of the voltage waveform. This featureextraction method is illustrated in Fig. 1 along with details ofphase A. Next, two classes of events, namely, “non-islanding” and“islanding,” are considered for training the neural network classi-fier. More details on this method can be found in [16,17].
3. Proposed feature extraction algorithm
This section introduces the proposed islanding detection algo-rithm based on the phase space technique. First, the concept ofphase space technique is described. Then, the feature extractionmethod using various ANN methods is elaborated.
3.1. Overview of phase space technique
The aim of phase space method is to analyze the time series in ahigher dimensional space called phase space. In mathematics andphysics, a phase space is a space in which all possible states of thesystem are presented. In this state, each possible state of the systemcorresponds to a unique point. The use of phase space is convenientto describe dynamic systems. Each orthogonal coordinate of phasespace represents one of the system instantaneous states [20].Nonetheless, measuring the entire variability of a dynamic systemis impractical. Unintentionally, Takens has proven in [21] that phasespace can be reconstructed from a time series with a singlecomponent using the embedding theorem.
A d-dimensional dynamical system can be illustrated by d first-order differential equations. The solution to these equations,sAℜd, is a state in the corresponding phase space, where ℜindicates the Euclidean space. The measured function, x¼h(s),transforms a collection of s states to a scalar time series. A positivenumber τ is used to show the delay of this time series. FunctionFτðsiÞ ¼ siþ τ is defined to evaluate the s state at time i and thedelay coordinate. Hence, the embedding ϕ : ℜd-ℜdE is defined asfollows:
Φðh; F; τÞðsiÞ ¼ hðsiÞ;hðsiþτÞ;…;hðsiþðdE�1ÞτÞ� �
¼ xi; xi�τ ;…; xiþðdE�1Þτ� �¼ xi ð4Þ
Thus, the trajectory matrix of dimensioned dE and delay τ canbe expressed as [13], [22], [23]
X¼
x1
x2
⋮xM
26664
37775¼
x1 x1þτ ⋯ x1þðdE �1Þτx2 x2þτ ⋯ x2þðdE �1Þτ⋮ ⋮ ⋱ ⋮xM xMþ τ ⋯ xMþðdE �1Þτ
266664
377775
¼ ½ x̂1 x̂2 ⋯ x̂dE �
ð5Þ
where, τ is delayed, x̂i ði¼ 1;2;⋯; dEÞ are column vectors that formthe coordinate of each dE dimension, and the row vectorsxi ði¼ 1;2;⋯;MÞ represent individual points in the phase space[20]. The correlation dimension is defined as [24]
CðrÞ ¼ limN-1
1
N2 ∑N
i ¼ 1∑N
j ¼ 1θðr�jxi�xjjÞ ðia jÞ ð6Þ
where, xi and xj are two arbitrary points and θ (a) is the Heavisidestep function with a value of zero for negative algorithm and onefor positive algorithm
θðaÞ ¼0;1;
(if ao0if aZ0
ð7Þ
The number of pairs (xi, xj) calculated by Eq. (6) satisfies |xi�xj|or.A small r suppose that CðrÞ behaves as CðrÞαrdc , such that dc is thecorrelation dimension and estimated by
dc ¼ limr-0lg ½CðrÞ�lg r
ð8Þ
The embedding dimension is defined by 2dE ¼ ½2dcþ1�. In theproposed method, the delay is selected to demonstrate thegeometric data of the perturbation signal. In the sinusoidal wave-form given by FðtÞ ¼ A sin ðωtþφÞ, the sample signal can beexpressed by FðKÞ ¼ A sin ðωkΔtþφÞ. In this case, NS ¼2π=ðωΔtÞ is the sampling rate in each period. Embedding thesignal to a phase space of dE ¼ 3 with a delay of a quarter of itsperiod τ¼NS=4 shows that the embedded signal is an ellipse.
Using x, y and z to represent the coordinates of the phase spacex1; x2; x3, respectively, the embedded signal in the phase space canbe defined by the following equations:
xþy¼ 0
x2þy2 ¼ A2
(xþz¼ 0
y2þz2 ¼ A2
(ð9Þ
Eq. (9) in the xy-plane and yz-plane constitutes a circularwaveform with radius that is the amplitude of the original signaland center that is the source of the plane, whereas the portrait ofthe xz-plane is a line segment.
Voltage Signal
Discrete WaveletTransform (Db4)
Approximation
Detail1_a
Detail2_a
Detail3_a
Detail4_a
Detail5_a
Detail6_a
Evergy D1_a
Evergy D2_a
Evergy D3_a
Evergy D4_a
Evergy D5_a
Evergy D6_a
∑
∑
∑
∑
∑
∑
Evergy D1_bEvergy D1_c
Feature 1 (X1)
Feature 2 (X2)
Feature 3 (X3)
Feature 4 (X4)
Feature 5 (X5)
Feature 6 (X6)
0.01s
Fig. 1. Feature extraction by DWT for islanding detection [17], (a) three phase fault at DG2, (b) euclidean norm (Ex) of the fault signal in (a), (c) selected region of euclideannorm (Ex) for feature selections, (d) euclidean norm (Ex) and its features of the fault signal in (a).
A. Khamis et al. / Neurocomputing 148 (2015) 587–599 589

Euclidean norm of each point on xy-plane signifies
EðkÞ ¼ffiffiffiffiffiffiffiffiffiffiffiffiffiffiffiffiffiffiffiffix2kþx2k� τ
q. Euclidean norm for points belonging to the
normal part of the signal should be within the range of½Að1�γÞ;Að1�γÞ�, where γ is the threshold introduced to toleratethe noise corruption. Points in which E falls out of this range aredetected as disturbances. The beginning to ending samples of thedisturbances are recorded using detection schemes. In this paper,Ex is utilized to extract special features to characterize islandingand non-islanding events. The corresponding features are thenused as inputs for the neural network.
4. Phase space features extraction
Feature extraction is one of the critical tasks in developingmultiple-parameter-based islanding detection. The aim of theproposed phase space features is to identify the specific signatureof the voltage signal, which can differentiate between islandingand any other event condition. In this study, five features areextracted from the voltage signal using Euclidean norm (Ex). Theselected features are described in Table 1.
The features with a mean value of Ex during the period of faultor after a first transient period to the next transient period ofdisturbance are obtained from the following equation [14,15]:
Ex ¼∑n
x ¼ 1Ex
nð10Þ
where, n is number of the sample points. Meanwhile, feature witharea can be calculated as
Area¼Z a
bExdt ð11Þ
where, a and b are the limits indicating the beginning and the endof disturbance, respectively.
Fig. 2 shows an example of a voltage waveform during a three-phase fault at DG2 and corresponding phase space representation.The signal in Fig. 2(a) is extracted using the Euclidean norms ofphases A, B, and C, which are added up, as illustrated in Fig. 2(b).By normalizing the Ex, as shown in Fig. 2(c), the values for mean,maximum, minimum, duration, and area under curve of Ex areextracted, as depicted in Fig. 2(d). These five input features can berearranged as a vector according to Table 1.
Fig. 3 shows the samples of input features obtained forislanding and non-islanding conditions based on the abovemen-tioned procedure for DG1 and DG2, as shown in Fig. 4. Fig. 3(a) shows that the feature values for islanding events are F1, F2, F3,F4, and F5 and range from 1.58 to 1.73, 0.31 to 0.39, 0.92 to 0.98,0.14 to 0.23, and 0.27 to 0.35, respectively. These feature valuecombinations and their ranges are significantly different fromnon-islanding event feature values, such as capacitor bank switch-ing and three phase fault events, as shown in Fig. 3(b) and (c).Capacitor bank switching events feature values for F1, F2, F3, F4,
and F5 range from 1.49 to 1.55, 0.8 to 0.94, 1.03 to 1.07, 0.66 to 0.90,and 0.71 to 0.84, respectively, whereas three-phase fault eventvalues range from 0.75 to 1.00, 0.48 to 0.81, 0.95 to 1.27, 0 to 0.48,and 0.42 to 0.72, respectively. Therefore, these unique casefeatures, such as islanding and all other non-islanding events,are useful inputs for intelligent classifiers, such as neuralnetworks.
5. Distributed network with multiple DGs
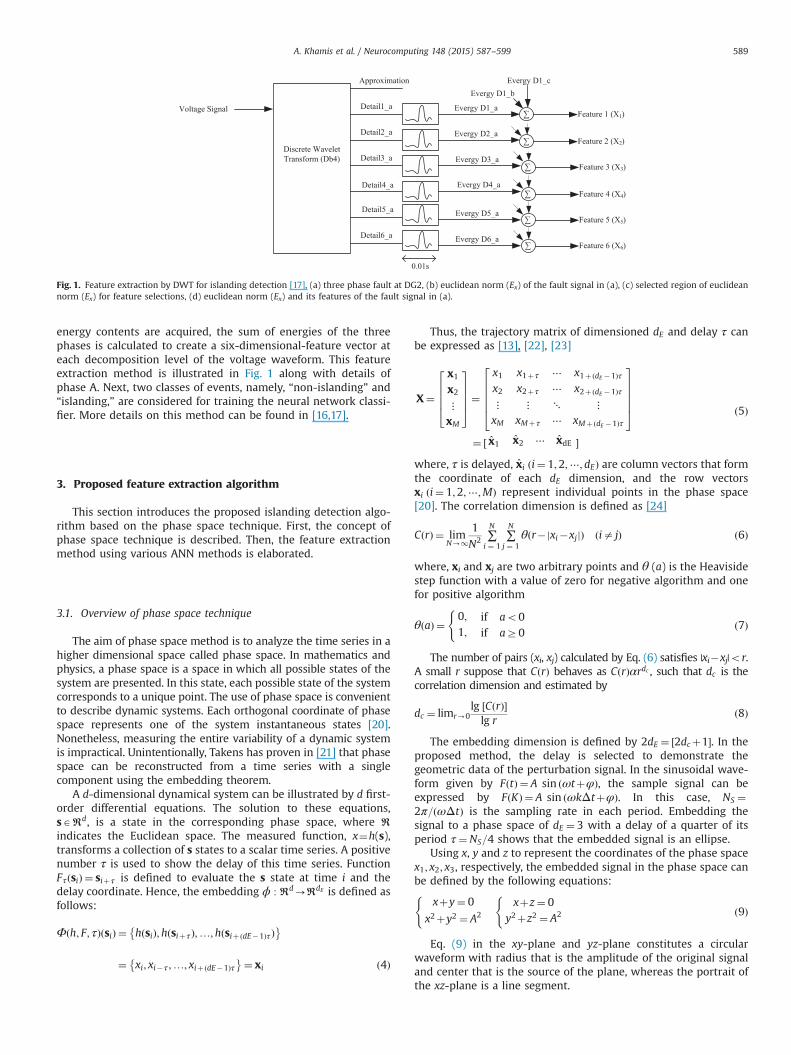
The test system model consists of radial distribution systemwith two identical DG units, which is fed by 120 kV, 1000 MVAsource at a 50 Hz frequency [14,15], [19], [25]. The DG units areplaced within a distance of 30-km with a distribution line ofπ-sections, as shown in Fig. 4. The details of the studied system aregiven in Table 2.
Using the topology shown in Fig. 4 and data in Table 2, thesystem with multiple DGs is modeled and simulated using powersystem simulation tools DigSilents. The voltage signals areretrieved at the target DG location for islanding and non-islanding conditions (other disturbances). The possible situationsof islanding and non-islanding conditions studied are given asfollows:-
� Load switching and capacitor switching at PCC point andDGs units;
� Loss of mains at the PCC bus;� Fault at PCC point, DGs units, and distribution lines;� Tripping of main circuit breaker for islanding condition;� Tripping of other DGs apart from the target one; and� Events that can trip breakers and reclosers, as well as island the
DG under study.
The above conditions are simulated under possible variations inoperating condition, such as the following:
� Normal DG loading, minimum DG loading and maximum DGloading; and
� Different operating points of the DG that causes NDZ.
The above conditions in the system, as shown in Fig. 4, canform three islands and can be tested with three possible NDZconditions, as shown in Fig. 5, by varying consumer and DGloading conditions.
5.1. Obtaining data for training and testing
For any artificially intelligent classifier, such as ANNs, obtainingthe training and testing data samples, as well as the inputparameter settings, is important. The input to the classifier canbe obtained using wavelet or phase-space features addressed inthe aforementioned sections for various disturbance events. Theclassifier output or target parameters, which can be islanding ornon-islanding conditions, can be obtained from simulation with avalue definition for each event. Table 3 shows the predefined eventclass parameters based on the type of event class.
When adopting five phase-space features, two classifiers areused to represent the features corresponding to DG1 and DG2, asillustrated in Fig. 6. Each classifier uses 3611 samples, whichcorrespond to training and testing. For training, 2166 samples(60%) are used, whereas 722 samples (20%) are applied for testingand validation. Meanwhile, for wavelet cases, six features with twoclassifiers for DG1 and DG2 are used [16], [18]. The structure ofwavelet-based ANN is shown in Fig. 7. The sample data used inphase space are again used for training and testing in the wavelet-
Table 1Selected phase space features.
Features Description
F1 Duration of disturbanceF2 Mean Ex during disturbanceF3 Maximum Ex during disturbanceF4 Minimum Ex during disturbanceF5 Area under curve
A. Khamis et al. / Neurocomputing 148 (2015) 587–599590

based ANN classifier. However, all wavelet features are pre-processedusing � log (x). This process is conducted to normalize the features inthe range between 0 and 1. Table 4 illustrates the distribution oftraining and testing data used in the development of wavelet andphase-space islanding detectionmethods. With the same data trainedand tested for both cases, the performance of the classifier type andfeature extraction method in islanding detection can be compared.
6. Artificial neural network for index prediction
ANNs are computational models of a biological process. Such amodel has several interesting and attractive features, which can beused to identify various events [26]. Among various forms of ANN,radial basis function neural network (RBFNN) and probabilisticneural network (PNN) have been selected as the classification tools
0 2000 4000 6000 8000 10000 12000 14000-1.5
-1
-0.5
0
0.5
1
1.5
Sample number
Per
unit
(p.u
.)
0 2000 4000 6000 8000 10000 12000 140000
1
2
3
Sample number
Ex
0 500 1000 1500 2000 2500 3000 35000
1
2
3
Sample number
Ex
500 1000 1500 2000 2500 30000
0.2
0.4
0.6
0.8
1
1.2
1.4
Sample number
Nor
mal
ized
Ex
Area
Min
Duration
Max
Mean
Fig. 2. Phase space feature extraction procedure, (a) grid disconnection events (islanding condition), (b) capacitor switching events (non-islanding condition), (c) three phasefault event (non-islanding condition).
A. Khamis et al. / Neurocomputing 148 (2015) 587–599 591

in this study. A brief explanation of these variants of ANNs isgiven below.
6.1. Radial basis function neural network
RBFNN is an established and convenient neural network thathas been used since the late 1980s for classification and predic-tion. For instance, RBFNN has been utilized in solving powersystem such as power transfer allocation [27], speech
recognition system [28], fault location [29], protection of trans-mission lines [30] and transient stability assessment of powersystem [31]. General architecture of RBFNN consists of threelayers namely an input layer, a hidden layer and an output layeras illustrated in Fig. 8. The input layer feeds the feature vectorvalue to each neuron in hidden layer which consists of radialbasis activation function. Finally, the output layer basically sumsthe weighted basis functions without any activation function.Assuming a single neuron at the output layer, the output of the
F1 F2 F3 F4 F5
0.0
0.4
0.8
1.2
1.6
Circuit breaker DG1
FeaturesF1 F2 F3 F4 F5
0.0
0.4
0.8
1.2
1.6
Circuit breaker DG2
Features
F1 F2 F3 F4 F5
0.0
0.4
0.8
1.2
1.6
Capacitor DG1
FeaturesF1 F2 F3 F4 F5
0.0
0.4
0.8
1.2
1.6
Capacitor DG2
Features
F1 F2 F3 F4 F5
0.0
0.4
0.8
1.2
1.6
Three phase DG1
FeaturesF1 F2 F3 F4 F5
0.0
0.4
0.8
1.2
1.6
Three phase DG2
Features
Fig. 3. Samples of selected phase space features for islanding and non-islanding events on DG1 and DG2 in the studied system. (a) Grid disconnection events (islandingcondition), (b) Capacitor switching events (non-islanding condition) and (c) Three phase fault event (non-islanding condition).
A. Khamis et al. / Neurocomputing 148 (2015) 587–599592
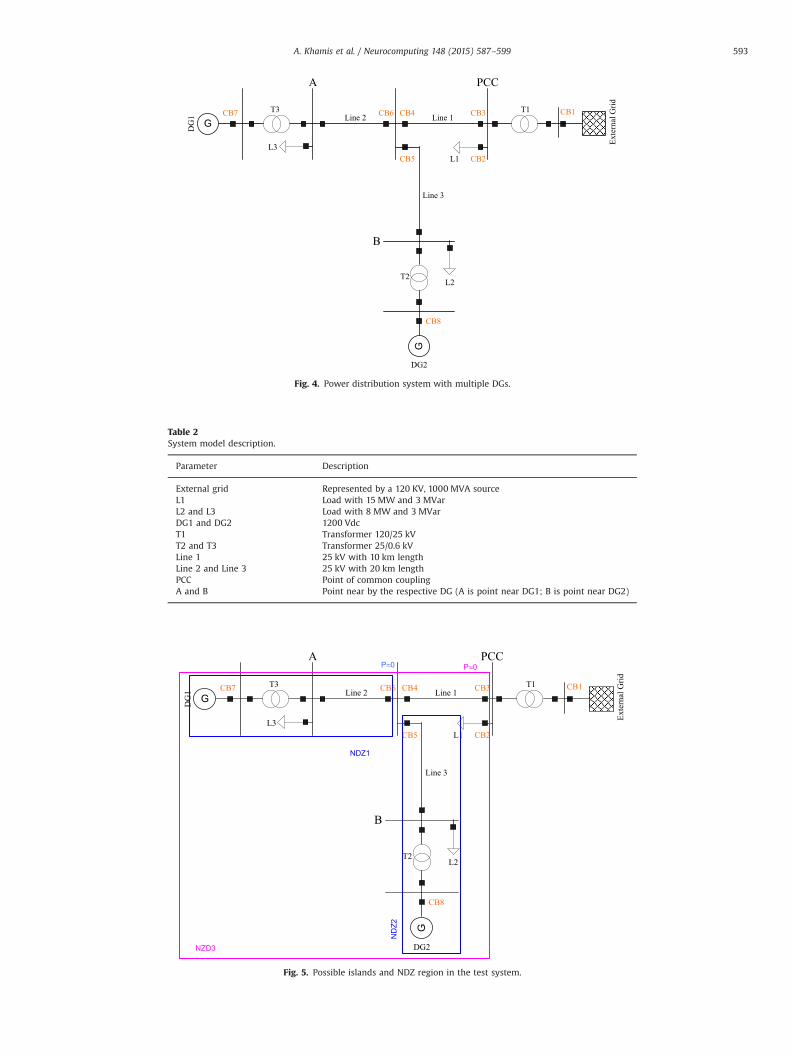
Table 2System model description.
Parameter Description
External grid Represented by a 120 KV, 1000 MVA sourceL1 Load with 15 MW and 3 MVarL2 and L3 Load with 8 MW and 3 MVarDG1 and DG2 1200 VdcT1 Transformer 120/25 kVT2 and T3 Transformer 25/0.6 kVLine 1 25 kV with 10 km lengthLine 2 and Line 3 25 kV with 20 km lengthPCC Point of common couplingA and B Point near by the respective DG (A is point near DG1; B is point near DG2)
G
G
CB1
CB2
CB3CB4
CB5
CB6CB7
CB8
A
B
Line 2 Line 1
Line 3
L1
L2
L3
DG
1
DG2
T1
T2
T3
Exte
rnal
Grid
PCC
Fig. 4. Power distribution system with multiple DGs.
NZD3
G
G
CB1
CB2
CB3CB4
CB5
CB6CB7
CB8
A
B
Line 2 Line 1
Line 3
L1
L2
L3
DG
1
DG2
T1
T2
T3
Exte
rnal
Grid
PCCP≈0
NDZ1
ND
Z2
P≈0
Fig. 5. Possible islands and NDZ region in the test system.
A. Khamis et al. / Neurocomputing 148 (2015) 587–599 593

RBFN in Fig. 8 can be calculated as
ηðx;wÞ ¼ ∑S
k ¼ 1w1kφkðjjx�Ckjj2Þ ð12Þ
where, ||x�Ck||2 represents the Euclidean distance between theinput vector x and the center Ck, φk(.) represents a basisfunction, w1k represents the weights in the output layer, Srepresents the number of neurons (and centers) in thehidden layer.
In this study, the Gaussian function is used as the RBFNN and itis given by
ϕkðjjx�Ckjj2Þ ¼ e�jjx�Ck jj22=σ2 ð13Þwhere, σ the spread parameter which controls the radius of thecluster represented by the Ck. Practically, if value of σ is too big orsmall, it will cause degradation in the performance of RBFNN.
6.2. Probabilistic neural network as model classification
PNN is a type of neural network that is popularly used forclassification, which is fundamentally developed based on Baye-sian function [32]. PNN was widely used in power systemapplications due to its fast training capability and accuracy inclassification. Mathematically, an input vector is utilized to definea category and the network classifiers are trained using data ofknown class. The PNN use the training data to develop a distribu-tion function that is used to evaluate a tendency of feature vectorwithin several given category. Basically, the Bayer formulation forthis PNN can be given by [33]
PðxjyÞ ¼ PðyjxÞ � PðxÞPðyÞ ð14Þ
where [P (x|y)] is the probability of event x while event y given, P(x) is the probability of event x, [P (y)] is the overall probability of
all events y and [P (y|x)] is the probability of event y while event xgiven. The relationship of [P (y|x)] is known as a posterior prob-ability where the probability is known only after event x itself hasbeen occurred.
Fig. 9 illustrates the structure of PNN, where it can be dividedinto four layers namely, the input layer, pattern layer, summationlayer and the output layer. The first layer is input layer thatrepresents the input features. This input layer is fully connectedto the second layer called pattern layer. Each pattern in thetraining set is connected with one neuron. These neurons executea weight sum of the receiving signal from the input layer. It is thenapplied to a nonlinear radial basis activation function to providethe neuron output. This activation function was addressed as [33]
ϕðjjxwi�1jj2Þ ¼ ejjxwi � 1jj2
σ2i ð15Þ
where, xwi is the weight input of xi to neuron and the σ is thesmoothing parameter that determines how smooth the surfaceseparating category will be. A reasonable range of σ is in between0.1 and 10. The used of the Bayesian estimating function in patternlayer neuron allowed the PNN to approximate Bayesian probabil-ities in categorizing pattern.
The third layer is the summation layers. Each pattern layerneuron transmits its output to a single summation layer neuronwhich can be formulated as;
RkðxÞ ¼ ∑k
i ¼ 1φðjjxwi�1jj2Þ; k¼ 2;3;4… ð16Þ
Each neuron in the output layer receives only two inputs fromtwo summation units. One weight is fixed with the strength ofunity and other weight is variable as in (16)
wt ¼ �½hB=hA�½lB=lA�½nB=nA� ð17Þwhere h is refers to a priori probability of patterns being incategory A or B, l is refers to loss associated with identifying apattern as being in one category when it is in reality in the othercategory, and n referred to the number of A or B pattern in thetraining set. The value of hA, hB, nA, and nB are determined by datapattern, but the losses must be based on knowledge of theapplication. Finally the output is determined as follows;
ykðxÞ ¼ argðmax RkðxÞ� �Þ ð18Þ
Due to the use of priori probability and greedy selection in theoutput layer, PNN is expected to be better for classificationcompare to RBFNN.
Table 3Classifier output definition.
Event type Target
Normal condition 1Line to ground fault 2Line to line to ground fault 3Three phase to ground fault 4Load switching 5Capacitor switching 6Islanding 7
Phase A
Feature Extraction
Va
Vb
Vc
Phase B
Phase C
DG1
Phase A
Phase B
Phase C
E
E
Feature Extraction
Va
Vb
Vc
Classifier
Classifier
Decision Making
0
1
Island
Non- Island
DG2
DG2
DG1
Fig. 6. Summary of phase space based classifier for DG1 and DG2.
A. Khamis et al. / Neurocomputing 148 (2015) 587–599594

In this study, both RBFNN and PNN algorithms are implemen-ted for islanding detection using Matlabs neural network toolboxfunctions. Table 5 shows the function names and initializationparameters used for PNN- and RBFNN-based classifiers of DG1 andDG2 in Figs. 6 and 7.
The optimum spread constants given in Table 5 are obtained bysystematically increasing the value in steps of 0.1 from 0 to 10,as well as by measuring the training goal during training. Further-more, the islanding detection algorithms developed with RBFNNand PNN can be evaluated using various error measurementindices, such as means absolute percentage error (MAPE), meanabsolute error (MAE), and root mean squared error (RMSE), asgiven in Eqs. (19), (20), and (21), respectively [34], [35].
MAPE¼ 1l∑l
i ¼ 1
Xi�Xi^
Xi
����������� 100% ð19Þ
MAE¼∑l
i ¼ 1Xi�Xi
^�� ��l
ð20Þ
RMSE¼
ffiffiffiffiffiffiffiffiffiffiffiffiffiffiffiffiffiffiffiffiffiffiffiffiffiffiffiffi∑l
i ¼ 1ðXi�Xi
^Þ2
l
vuuutð21Þ
where, i¼1,2,3…l, Xi¼original data; X4i ¼forecast data.
7. Test results
This section describes the result obtained by applying theproposed islanding detection algorithm along with the results ofthe conventional wavelet-based method. RBFNN and PNN havebeen used as a classifier with proposed phase-space input featuresand wavelet features. The performance of both of the classifier wasevaluated by analyzing the performance of error indices and theirdecision accuracy.
FeaturesExtraction(Wavelet)
DG1
DG2
Classifier
Decision Making
FeaturesExtraction(Wavelet)
Classifier
Va,Vb,Vc
Va,Vb,Vc
0
1
Island
Non-Island
Fig. 7. Summary of wavelet based classifier for DG1 and DG2.
Table 4Number of samples for training and testing.
Data types Number of sample data
Phase space Wavelet transform
Training 2166 2166Testing 722 722
x
Φ1
Σ
Input layer
Hidden layer
Output layer
1
1
1
η (x,w)Φ2
ΦS
wS
w2
w2
Fig. 8. Architecture of RBFNN.
Input Layer
PatternLayer
Summation Layer
OutputLayer
x2 x3
fAi(x) f Bi(x)
x1
yk(x)
Fig. 9. Architecture of a PNN.
Table 5Parameter settings of the RBFNN and the PNN classifiers for DG1 and DG2.
Parameter Probabilistic neural network(PNN)
Radial basis neural network(RBFNN)
Codefunction
net¼newpnn (P,T, spread) net¼newrb (P,T, spread)
Input data, P 5�2166 (for phase space) 5�2166 (for phase space)(for training) 6�2166 (for wavelet) 6�2166 (for wavelet)Target data, T 5�2166(for phase space) 5�2166(for phase space)(for training) 6�2166 (for wavelet) 6�2166 (for wavelet)Spreadconstant
0.1 (for phase space) 7 (for phase space)
0.1 (for wavelet) 6 (for wavelet)
A. Khamis et al. / Neurocomputing 148 (2015) 587–599 595

7.1. Result of RBFNN with phase space features
The performance of RBFNN with phase-space features forislanding detection and classification was evaluated by testingwith different data after being trained offline. These testing datacontain various disturbance cases, including islanding and non-islanding events at normal and NDZ conditions. RBFNN classifieroutput results are then compared with actual or known targetvalues. Regression analysis of each RBFNN corresponding to DG1and DG2 is shown in Fig. 10. The circles in Fig. 10 represent theoutput obtained from RBFNN for 722 test data, which exhibitdifferent event classes given in Table 3. The dotted line representsthe line that can be plotted when the output is equal to actualevent class, whereas the solid line represents the best linear fitthat can be obtained for the output acquired from RBFNN. In thiscase, the correlation (R) is equal to 0.9779 and 0.97812 for the DG1and DG2 classifiers, respectively, which indicates good correlationbetween predefined event class targets and output of the RBFNN.
The outputs of each of RBFNN consist of various classes ofevents, as shown in Table 3. Hence the final output decisionwhether the occurrence is an islanding or non-islanding conditionis obtained by applying additional if-then rules for the outputs ofthe individual classifier (Ydgi) as given below:
Youtput ¼0;1;
(if ðYdg1r6Þ&ðYdg2r6Þif ðYdg1 ¼ 7ÞjjðYdg2 ¼ 7Þ ð22Þ
where, Youtput represents the final output of the decision making,Ydgi represents output of the individual classifier where i¼1,2,3,…n. The symbol & and || represents “AND” and “OR” operator,respectively.
Eq. (22) implies that if both RBFNN classifier corresponding toDG1 and DG2 are less than or equal to predefined event class(target) number 6, then the occurrence is considered as non-islanding event. However, if either RBFNN classifier registers eventclass number equal to 7, then the occurrence is considered asislanding event. The accuracy of the phase space features decisionmaking and the performance comparison of the output with thetarget data are shown in Table 5. From the observation, Table 6shows that the classifier can detect 95.83% of the islanding class.Meanwhile, for non-islanding events the accuracy is 97.07%.
7.2. Result of RBFNN with wavelet features
Using the similar procedures with phase space features, aRBFNN classifier is trained and tested with wavelet features. Here,the outputs of the network are compared with the actual targetdata to the corresponding input, as shown in Fig. 11 and Table 7. Inthis case the correlation (R) value are equal to 0.07091 and 0.1234for DG1 and DG2 classifiers, respectively, which indicates poorcorrelation between predefined event class targets and output ofthe RBFNN. This result indicates that the RBFNN performance withwavelet features is inappropriate because of the low accuracy indetecting the islanding event.
7.3. Results of PNN with phase space features
The performance of RBFNN classifier, especially with waveletfeatures, is very low. Thus, the RBFNN classifier is replaced withthe PNN classifier. In this work, the two PNN classifiers are trainedand tested with phase-space features for DG1 and DG2, respec-tively. The training and testing data remain the same as those usedin the RBFNN classifier. Table 8 shows the summary of PNNclassification results using the phase-space feature. From the table,it can be noted that the classifier provides 100% accuracy in bothcases of islanding and non-islanding class.
7.4. Results of PNN with wavelet features
To improve the performance of the islanding detection algo-rithm with wavelet features, the RBFNN classifier is again replacedwith a PNN classifier by maintaining the same training and testingdata. Table 9 shows the classification result of PNN with wavelet
0 2 4 6 80
1
2
3
4
5
6
7
8Classifier DG2
ANN OutputLinear FitActual Target
0 2 4 6 80
1
2
3
4
5
6
7
8
Target
Out
put
Classifier DG1
ANN OutputLinear FitActual Target
Fig. 10. Regression analysis of RBFNN-based DG1 and DG2 classifier using phase space features.
Table 6RBFNN classification result with phase space features.
Class Classification
No of cases Correct detection Accuracy (%)
Non-islanding 650 631 97.07Islanding 72 69 95.83
A. Khamis et al. / Neurocomputing 148 (2015) 587–599596
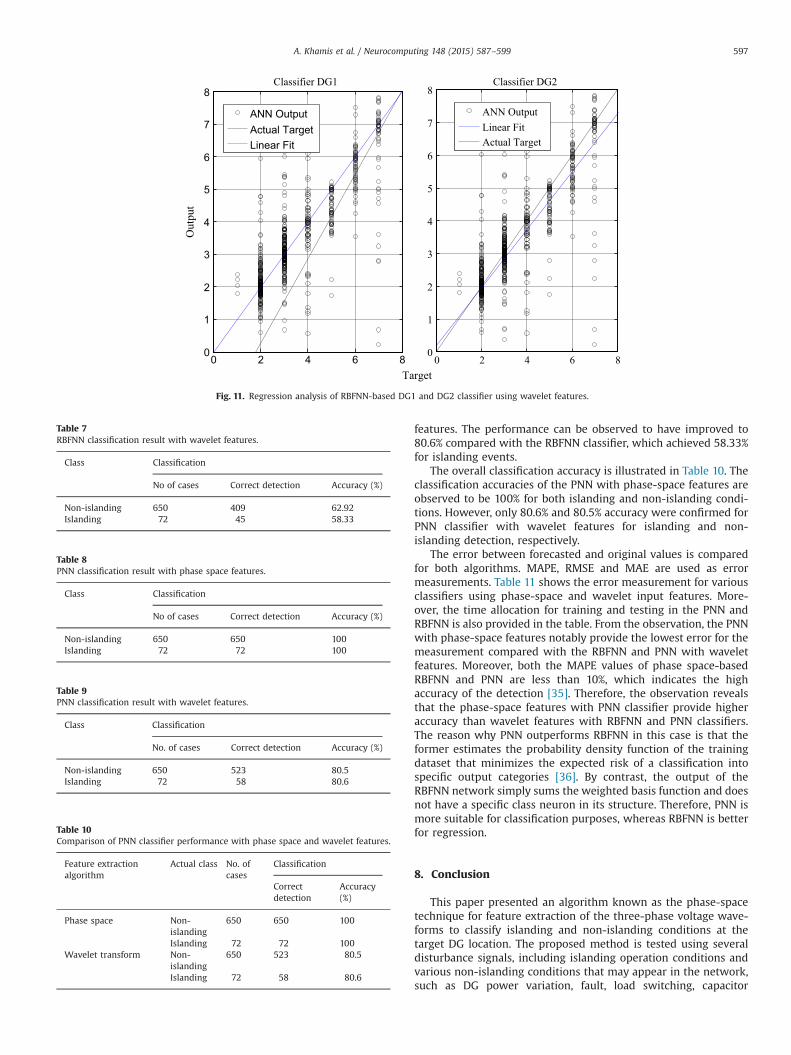
features. The performance can be observed to have improved to80.6% compared with the RBFNN classifier, which achieved 58.33%for islanding events.
The overall classification accuracy is illustrated in Table 10. Theclassification accuracies of the PNN with phase-space features areobserved to be 100% for both islanding and non-islanding condi-tions. However, only 80.6% and 80.5% accuracy were confirmed forPNN classifier with wavelet features for islanding and non-islanding detection, respectively.
The error between forecasted and original values is comparedfor both algorithms. MAPE, RMSE and MAE are used as errormeasurements. Table 11 shows the error measurement for variousclassifiers using phase-space and wavelet input features. More-over, the time allocation for training and testing in the PNN andRBFNN is also provided in the table. From the observation, the PNNwith phase-space features notably provide the lowest error for themeasurement compared with the RBFNN and PNN with waveletfeatures. Moreover, both the MAPE values of phase space-basedRBFNN and PNN are less than 10%, which indicates the highaccuracy of the detection [35]. Therefore, the observation revealsthat the phase-space features with PNN classifier provide higheraccuracy than wavelet features with RBFNN and PNN classifiers.The reason why PNN outperforms RBFNN in this case is that theformer estimates the probability density function of the trainingdataset that minimizes the expected risk of a classification intospecific output categories [36]. By contrast, the output of theRBFNN network simply sums the weighted basis function and doesnot have a specific class neuron in its structure. Therefore, PNN ismore suitable for classification purposes, whereas RBFNN is betterfor regression.
8. Conclusion
This paper presented an algorithm known as the phase-spacetechnique for feature extraction of the three-phase voltage wave-forms to classify islanding and non-islanding conditions at thetarget DG location. The proposed method is tested using severaldisturbance signals, including islanding operation conditions andvarious non-islanding conditions that may appear in the network,such as DG power variation, fault, load switching, capacitor
0 2 4 6 80
1
2
3
4
5
6
7
8
Target
Out
put
Classifier DG1
ANN OutputActual TargetLinear Fit
0 2 4 6 80
1
2
3
4
5
6
7
8Classifier DG2
ANN OutputLinear FitActual Target
Fig. 11. Regression analysis of RBFNN-based DG1 and DG2 classifier using wavelet features.
Table 7RBFNN classification result with wavelet features.
Class Classification
No of cases Correct detection Accuracy (%)
Non-islanding 650 409 62.92Islanding 72 45 58.33
Table 8PNN classification result with phase space features.
Class Classification
No of cases Correct detection Accuracy (%)
Non-islanding 650 650 100Islanding 72 72 100
Table 9PNN classification result with wavelet features.
Class Classification
No. of cases Correct detection Accuracy (%)
Non-islanding 650 523 80.5Islanding 72 58 80.6
Table 10Comparison of PNN classifier performance with phase space and wavelet features.
Feature extractionalgorithm
Actual class No. ofcases
Classification
Correctdetection
Accuracy(%)
Phase space Non-islanding
650 650 100
Islanding 72 72 100Wavelet transform Non-
islanding650 523 80.5
Islanding 72 58 80.6
A. Khamis et al. / Neurocomputing 148 (2015) 587–599 597

switching, and NDZ condition. Test results show that the proposedislanding detection algorithm with PNN and phase-space featuresis capable of correctly detecting the islanding operation. Tovalidate the performance, the method is compared with a con-ventional wavelet-based method with different classifiers, namely,RBFNN and PNN. The comparison shows that the proposeddetection method with PNN and phase-space features provides100% accuracy, whereas the method with PNN and waveletachieves 80.6% accuracy in islanding region detection. Further-more, the results also indicate that the PNN classifier outperformsthe RBFNN classifier. Moreover, the performance was evaluatedusing error measurement, and the phase-space and PNN classifierswere found to be more accurate than the wavelet technique andRBFNN classifier.
Acknowledgements
The authors’ wish to acknowledge the Ministry of Education,Malaysia and Universiti Teknikal Malaysia Melaka for supportingthis study, and Universiti Kebangsaan Malaysia for providinginfrastructure and moral support for the research work.
References
[1] S.I. Jang, A new islanding detection algorithm for distributed generationsinterconnected with utility networks, in: Eighth IEE International Conferenceon Developments in Power System Protection, 2004, 571–574.
[2] I. Standards, C. Committee, D. Generation, E. Storage, IEEE Std 1547.2-2008IEEE application guide for IEEE Std 1547, IEEE standard for interconnectingdistributed resources with electric power systems, Energy (2009).
[3] A. Timbus, A. Oudalov, C.N.M. Ho, Islanding detection in smart grids, EnergyConversion Congress and Exposition (ECCE) (2010) 3631–3637.
[4] S.P. Chowdhury, S. Chowdhury, P.a. Crossley, Islanding protection of activedistribution networks with renewable distributed generators: a comprehen-sive survey, Electr. Power Syst. Res 79 (6) (2009) 984–992.
[5] W. Xu, G. Zhang, C. Li, W. Wang, S. Member, G. Wang, J. Kliber, A power linesignaling based technique for anti-islanding protection of distributed gen-erators, Part I: Scheme and analysis 22 (3) (2007) 1758–1766.
[6] H.H. Zeineldin, E.F. El-Saadany, M.M.A. Salama, Impact of DG interface controlon islanding detection and nondetection zones, IEEE Trans. Power Delivery 21(3) (2006) 1515–1523.
[7] W. Hu, Y. Sun, A compound scheme of islanding detection according toinverter, in: Asia-Pacific Power and Energy Engineering Conference, 2009.APPEEC 2009., (2009) 1–4.
[8] W.Y. Teoh, C.W. Tan, An overview of islanding detection methods in photo-voltaic systems, World Acad. Sci. Eng. Technol. (2011) 674–682.
[9] G. Yin, A distributed generation islanding detection method based on artificialimmune system, IEEE/PES Transmission & Distribution Conference & Exposi-tion: Asia and Pacific (2005) 1–4.
[10] M.S. Elnozahy, E.F. El-saadany, M.M.A. Salama, A robust wavelet-ANN basedtechnique for islanding detection, Power and Energy Society General Meeting(2011) 1–8.
[11] S.R. Samantaray, B.C. Babu, P.K. Dash, Probabilistic neural network basedislanding detection in distributed generation, Electr. Power Compon. Syst. 39(3) (2011) 191–203.
[12] L.I. Eguiluz, M. Mariana, J. Lavandero, Disturbance classification based onthe geometrical properties of signal phase-space representation, Interna-tional Conference on Power System Technology (PowerCon) 00 (2000)1601–1604.
[13] T.Y. Ji, Q.H. Wu, L. Jiang, W.H. Tang, Disturbance detection, location andclassification in phase space, IET Gener. Transm. Distrib. 5 (2) (2011) 257.
[14] A. Khamis, H. Shareef, An effective islanding detection and classificationmethod using neuro-phase space technique, World Acad. Sci. Eng. Technol.(2013) 2067–2075.
[15] A. Khamis, H. Shareef, An effective islanding detection and classificationmethod using neuro-phase space technique, World Acad. Sci. Eng. Technol.78 (2013) 1221–1229.
[16] N.W.A. Lidula, A.D. Rajapakse, A pattern recognition approach for detectingpower islands using transient signals—Part I: Design and implementation,,IEEE Trans. Power Delivery 25 (4) (2010) 3070–3077.
[17] N.W.A. Lidula, N. Perera, A.D. Rajapakse, Investigation of a fast islandingdetection methodology using transient signals, in: Power & Energy SocietyGeneral Meeting (PES’09), (2009),1–6.
[18] N.W.A. Lidula, A.D. Ajapakse, Fast and reliable detection of power islands usingtransient signals, in: International Conference on Industrial and InformationSystems (ICIIS), (2009),493–498.
[19] Y. Fayyad, Neuro-wavelet based islanding detection technique, IEEE ElectricalPower & Energy Conference (2010) 1–6.
[20] T. Sauer, J.A. Yorke, M. Casdagli, Embedology, J. Stat. Phys 65 (3–4) (1991)579–616.
[21] F. Takens, Detecting strange attractors in turbulence, Lect. Notes Math. (1981)366–381.
[22] T.Y. Ji, Q.H. Wu, L Jiang, W.H. Tang, Disturbance detection, location andclassification.pdf, IET Gener. Transm. Distrib. 5 (2) (2010) 257–265.
[23] S.R. Samantaray, Phase-space-based fault detection in distance relaying, IEEETrans. Power Delivery 26 (1) (2011) 33–41.
[24] P. Grassberger, Estimation of Kolmogorov entropy from a chaotic signal, Phys.Rev. A: At. Mol. Opt. Phys. 28 (4) (1983) 2591–2593.
[25] M.B. Reynen, A.H. Osman, O.P. Malik, Using gold sequences to improve theperformance of correlation based islanding detection, Electr. Power Syst. Res80 (6) (2010) 733–738.
[26] T. Fukuda, T. Shibata, Theory and applications of neural networks forindustrial, IEEE Trans. Ind. Electron. 39 (6) (1992) 472–488.
[27] H Shareef, A Mohamed, S. Khalid, et al., Estimation of real power transferallocation using intelligent systems, Int. Sci. Index: World Acad. Sci. Eng.Technol. 7 (6) (2013) 1230–1238.
[28] J. Papa, A. Marana, A. Spadotto et al., Robust and fast vowel recognition usingoptimum-path forest, in: IEEE International Conference on Acoustics Speehand Signal Processing, (2010), 2190–2193.
[29] L. Lai, E. Vaseekar, H. Subasinghe, et al., Application of wavelet transform andneural networks to fault location of a teed-circuit, Simulation (2000) 3–7.
[30] P. Dash, A. Pradhan, G Pandaa, Application of minimal radial basis functionneural network to distance protection, IEEE Trans. Power Delivery 16 (2001)68–74.
[31] P Dash, S Mishra, G. Pandaa, A radial function neural network controller forUPFC, IEEE Trans. Power Syst. 15 (2000) 1293–1299.
[32] E. Parzen, On Estimation of a Probability Density Function and Mode, Annal.Math. Stat. 33 (1962) 1065–1076.
[33] L.H. Tsoukalas, R.E. Uhrig, Probabilistic Neural Networks, Fuzzy and neuralapproaches in engineering, hlm (1997) 319–324.
[34] Travis W. Gentry, Bogdan M. Wiliamowski, R. Larry, Weatherford. A Compar-ison of Traditional Forecasting Techniques and Neural Networks,, IntelligentEngineering Systems Through Artificial Neural Networks 5 (1995) 765–770.
[35] K.D. Lawrence, R.K. Klimberg, S.M Lawrance, Forecasting performance mea-surements, tracking signal and randomness tests, Fundamentals of ForecastingUsing Excel (2009) 58–61.
[36] Specht. Donald F, Probabilistic neural networks and the polynomial adaline ascomplementary techniques for classification, IEEE Trans. Neural Networks 1(1) (1990) 111–121.
Aziah Khamis received her B.Sc. from Universiti PutraMalaysia in 2006 and M.Sc. from Newcastle Universityin year 2009. Currently, she is pursuing her Ph.D. atUniversiti Kebangsaan Malaysia. She can be reached [email protected].
Table 11Comparison of MAPE, RMSE and MAE for various islanding detection methods.
Classifier Feature extraction algorithm MAPE (%) RMSE (%) MAE (%) Time (s)/classifier
RBFNN Wavelet Transform 2.7008 20.0208 4.4081 5.44Phase space 0.2078 5.8615 0.3778 3.42
PNN Wavelet transform 1.5235 13.5366 2.0151 0.21Phase space 0 0 0 0.20
A. Khamis et al. / Neurocomputing 148 (2015) 587–599598

Hussain Shareef received his B.Sc. with honours fromIIT, Bangladesh, MS degree from METU, Turkey, and Ph.D. degree from UTM, Malaysia, in 1999, 2002 and 2007,respectively. His current research interests are powersystem deregulation, power quality and power systemdistribution automation. He is currently a senior lec-turer at the Department of Electrical, Electronic andSystems Engineering, University Kebangsaan Malaysia.He can be reached at [email protected].
Azah Mohamed received her B.Sc. from University ofLondon in 1978 and M.Sc. and Ph.D. from UniversitiMalaya in 1988 and 1995, respectively. She is a profes-sor in the Department of Electrical, Electronic andSystems Engineering, Universiti Kebangsaan Malaysia.Her main research interests are power system security,power quality, artificial intelligence and renewableenergy systems. She is a senior member of IEEE. Shecan be reached at [email protected].
Erdal Bizkevelci is a senior lecturer at the PowerSystem Department, Tubitak Uzay, Ankara, Turkey. Hiscurrent research interests are large scale integration ofwind energy, design and protection of wind powerplants, design and protection of photovoltaic powerplants, effects of the electric vehicles on distributionsystem, distribution system protection, distributionsystem reliability, scada system design for distributionsystem, determination of the penetration levels ofrenewable, development of monitoring system toolsfor rural area, and smart grid.
A. Khamis et al. / Neurocomputing 148 (2015) 587–599 599
Copyright © 2022 FDOKUMEN