Blue: correcting sequencing errors using consensus and context
10
Vol. 30 no. 19 2014, pages 2723–2732 BIOINFORMATICS ORIGINAL PAPER doi:10.1093/bioinformatics/btu368 Sequence analysis Advance Access publication June 11, 2014 Blue: correcting sequencing errors using consensus and context Paul Greenfield 1,2, * , Konsta Duesing 3 , Alexie Papanicolaou 4 and Denis C. Bauer 1 1 CSIRO Computational Informatics, 2 School of IT, University of Sydney, 3 CSIRO Animal, Food and Health Sciences, Sydney, NSW 2113, and 4 CSIRO Ecosystem Sciences, Canberra, ACT 2601, Australia Associate Editor: Inanc Birol ABSTRACT Motivation: Bioinformatics tools, such as assemblers and aligners, are expected to produce more accurate results when given better quality sequence data as their starting point. This expectation has led to the development of stand-alone tools whose sole purpose is to detect and remove sequencing errors. A good error-correcting tool would be a transparent component in a bioinformatics pipeline, simply taking sequence data in any of the standard formats and producing a higher quality version of the same data containing far fewer errors. It should not only be able to correct all of the types of errors found in real sequence data (substitutions, insertions, deletions and uncalled bases), but it has to be both fast enough and scalable enough to be usable on the large datasets being produced by current sequencing technologies, and work on data derived from both haploid and diploid organisms. Results: This article presents Blue, an error-correction algorithm based on k-mer consensus and context. Blue can correct substitution, deletion and insertion errors, as well as uncalled bases. It accepts both FASTQ and FASTA formats, and corrects quality scores for cor- rected bases. Blue also maintains the pairing of reads, both within a file and between pairs of files, making it compatible with downstream tools that depend on read pairing. Blue is memory efficient, scalable and faster than other published tools, and usable on large sequencing datasets. On the tests undertaken, Blue also proved to be generally more accurate than other published algorithms, resulting in more ac- curately aligned reads and the assembly of longer contigs containing fewer errors. One significant feature of Blue is that its k-mer consensus table does not have to be derived from the set of reads being cor- rected. This decoupling makes it possible to correct one dataset, such as small set of 454 mate-pair reads, with the consensus derived from another dataset, such as Illumina reads derived from the same DNA sample. Such cross-correction can greatly improve the quality of small (and expensive) sets of long reads, leading to even better assemblies and higher quality finished genomes. Availability and implementation: The code for Blue and its related tools are available from http://www.bioinformatics.csiro.au/Blue. These programs are written in C# and run natively under Windows and under Mono on Linux. Contact: [email protected] Supplementary information: Supplementary data are available at Bioinformatics online. Received on September 16, 2013; revised on May 20, 2014; accepted on May 27, 2014 1 INTRODUCTION The introduction of the first 454 Life Sciences sequencer in 2005 marked the beginning of a revolution in biological research. Sequencing technology has continued to advance rapidly, produ- cing ever more data at a lower cost, but the quality of these data have improved at a much slower rate. A single run on an Illumina HiSeq 2500 system can now produce up to 8 billion paired-end reads, but these will still have an overall error rate of 1–2% (Minoche et al., 2011). The nature of these errors de- pends on the sequencing technology being used and its under- lying biochemistry. The single base-at-a-time ‘sequencing by synthesis’ technique used by Illumina results mostly in substitu- tion errors (Nakamura et al., 2011). Technologies based on dif- ferent chemistries, such as those used by 454 and Ion Torrent systems, are prone to misreport the length of strings of the same base (homopolymers), resulting in insertion and deletion errors (Glenn, 2011; Loman et al., 2012). The tools used to analyze sequence data are all error-tolerant to some extent. Aligners will tolerate some number of mis- matches when they are mapping reads to a reference, some of which will prove to be errors and other genuine differences between the organism being sequenced and the reference (Langmead and Salzberg, 2012; Li and Durbin, 2010). Similarly, assemblers can be built to tolerate errors to some degree, and their success at doing this is a significant factor in their overall effectiveness and accuracy (Bradnam et al., 2013). An alternative way of addressing the problem of sequencing errors is to use a stand-alone error-correction tool whose sole purpose is to take a set of reads and improve their quality by finding and fixing errors. Such tools are founded on the high levels of redundancy present in typical sequencing datasets, with each location in the sequenced genome being covered by many reads, most of which will agree about which base is actu- ally present. Yang et al. (2013) recently surveyed a number of the published error-correction tools and categorized them into three classes of algorithms: k-spectrum based, suffix tree/array based and multiple sequence alignment based. The three classes of al- gorithm differ both in how they detect errors and how these errors are corrected. We refer the reader to Yang et al., (2013) for a full discussion of these three classes of algorithms and their history. Blue is a k-spectrum algorithm that uses read context to choose between alternative replacement k-mers, with the overall goal of minimizing the number of changes needed to correct an entire read. All k-spectrum based algorithms first tile their input reads to produce a set of distinct overlapping subsequences of length ‘k’ *To whom correspondence should be addressed. ß The Author 2014. Published by Oxford University Press. All rights reserved. For Permissions, please e-mail: [email protected] 2723 by guest on June 5, 2016 http://bioinformatics.oxfordjournals.org/ Downloaded from
-
Upload
independent -
Category
Documents
-
view
1 -
download
0
Transcript of Blue: correcting sequencing errors using consensus and context
Vol. 30 no. 19 2014, pages 2723–2732BIOINFORMATICS ORIGINAL PAPER doi:10.1093/bioinformatics/btu368
Sequence analysis Advance Access publication June 11, 2014
Blue: correcting sequencing errors using consensus and contextPaul Greenfield1,2,*, Konsta Duesing3, Alexie Papanicolaou4 and Denis C. Bauer11CSIRO Computational Informatics, 2School of IT, University of Sydney, 3CSIRO Animal, Food and Health Sciences,Sydney, NSW 2113, and 4CSIRO Ecosystem Sciences, Canberra, ACT 2601, Australia
Associate Editor: Inanc Birol
ABSTRACT
Motivation: Bioinformatics tools, such as assemblers and aligners,
are expected to produce more accurate results when given better
quality sequence data as their starting point. This expectation has
led to the development of stand-alone tools whose sole purpose is
to detect and remove sequencing errors. A good error-correcting tool
would be a transparent component in a bioinformatics pipeline, simply
taking sequence data in any of the standard formats and producing a
higher quality version of the same data containing far fewer errors. It
should not only be able to correct all of the types of errors found in real
sequence data (substitutions, insertions, deletions and uncalled
bases), but it has to be both fast enough and scalable enough to be
usable on the large datasets being produced by current sequencing
technologies, and work on data derived from both haploid and diploid
organisms.
Results: This article presents Blue, an error-correction algorithm
based on k-mer consensus and context. Blue can correct substitution,
deletion and insertion errors, as well as uncalled bases. It accepts
both FASTQ and FASTA formats, and corrects quality scores for cor-
rected bases. Blue also maintains the pairing of reads, both within a
file and between pairs of files, making it compatible with downstream
tools that depend on read pairing. Blue is memory efficient, scalable
and faster than other published tools, and usable on large sequencing
datasets. On the tests undertaken, Blue also proved to be generally
more accurate than other published algorithms, resulting in more ac-
curately aligned reads and the assembly of longer contigs containing
fewer errors. One significant feature of Blue is that its k-mer consensus
table does not have to be derived from the set of reads being cor-
rected. This decoupling makes it possible to correct one dataset, such
as small set of 454 mate-pair reads, with the consensus derived from
another dataset, such as Illumina reads derived from the same DNA
sample. Such cross-correction can greatly improve the quality of small
(and expensive) sets of long reads, leading to even better assemblies
and higher quality finished genomes.
Availability and implementation: The code for Blue and its related
tools are available from http://www.bioinformatics.csiro.au/Blue.
These programs are written in C# and run natively under Windows
and under Mono on Linux.
Contact: [email protected]
Supplementary information: Supplementary data are available at
Bioinformatics online.
Received on September 16, 2013; revised on May 20, 2014; accepted
on May 27, 2014
1 INTRODUCTION
The introduction of the first 454 Life Sciences sequencer in 2005
marked the beginning of a revolution in biological research.
Sequencing technology has continued to advance rapidly, produ-
cing ever more data at a lower cost, but the quality of these data
have improved at a much slower rate. A single run on an
Illumina HiSeq 2500 system can now produce up to 8 billion
paired-end reads, but these will still have an overall error rate
of 1–2% (Minoche et al., 2011). The nature of these errors de-
pends on the sequencing technology being used and its under-
lying biochemistry. The single base-at-a-time ‘sequencing by
synthesis’ technique used by Illumina results mostly in substitu-
tion errors (Nakamura et al., 2011). Technologies based on dif-
ferent chemistries, such as those used by 454 and Ion Torrent
systems, are prone to misreport the length of strings of the same
base (homopolymers), resulting in insertion and deletion errors
(Glenn, 2011; Loman et al., 2012).
The tools used to analyze sequence data are all error-tolerant
to some extent. Aligners will tolerate some number of mis-
matches when they are mapping reads to a reference, some of
which will prove to be errors and other genuine differences
between the organism being sequenced and the reference
(Langmead and Salzberg, 2012; Li and Durbin, 2010).
Similarly, assemblers can be built to tolerate errors to some
degree, and their success at doing this is a significant factor in
their overall effectiveness and accuracy (Bradnam et al., 2013).An alternative way of addressing the problem of sequencing
errors is to use a stand-alone error-correction tool whose sole
purpose is to take a set of reads and improve their quality by
finding and fixing errors. Such tools are founded on the high
levels of redundancy present in typical sequencing datasets,
with each location in the sequenced genome being covered by
many reads, most of which will agree about which base is actu-
ally present. Yang et al. (2013) recently surveyed a number of the
published error-correction tools and categorized them into three
classes of algorithms: k-spectrum based, suffix tree/array based
and multiple sequence alignment based. The three classes of al-
gorithm differ both in how they detect errors and how these
errors are corrected. We refer the reader to Yang et al., (2013)
for a full discussion of these three classes of algorithms and their
history.Blue is a k-spectrum algorithm that uses read context to
choose between alternative replacement k-mers, with the overall
goal of minimizing the number of changes needed to correct an
entire read.
All k-spectrum based algorithms first tile their input reads to
produce a set of distinct overlapping subsequences of length ‘k’*To whom correspondence should be addressed.
� The Author 2014. Published by Oxford University Press. All rights reserved. For Permissions, please e-mail: [email protected] 2723
by guest on June 5, 2016http://bioinform
atics.oxfordjournals.org/D
ownloaded from

(‘k-mers’) together with their repetition counts. Such a set can
then be used to distinguish k-mers that come from the organism
being sequenced (and so recur many times) from those that are
derived from reads containing sequencing errors (typically only
appearing once or a few times). Figure 1 shows a k-mer repeti-
tion histogram for a set of Illumina reads derived from a typical
bacterium (Clostridium sporogenes PA3679). Those k-mers from
the error-free parts of reads will have repetition counts that lie
somewhere on the right-hand side (RHS) peak in this histogram.
Figure 2 shows a comparable histogram for a strongly heterozy-
gous diploid organism (Helicoverpa armigera) with two (overlap-
ping) peaks, one corresponding to the k-mers found on both
alleles, and the other to those k-mers found on only one.
Finally, Figure 3 shows the histogram derived from tiling four
lanes of Homo sapiens data (Illumina HiSeq from SRA
ERR091571 to ERR091574). Given such a ‘consensus’ table ofk-mers and counts, a repetition depth threshold can then be usedto identify ‘good’ k-mers, as shown in Figure 1. A simple dataset-
wide threshold is unlikely to be usable though, as uneven cover-age along a genome and the presence of repetitive regionsis likely to result in the rejection of correct k-mers in poorly
covered areas and the acceptance of sequencing errors in high-coverage areas.Blue uses a partitioned hash table to hold the k-mers corres-
ponding to the RHS peaks: the ‘consensus’ about what k-mersare really present in the genome being sequenced. The dataloaded into this table is generated by the associated tiling tool,
Tessel, which simply takes a set of reads, tiles it into overlappingk-mers and writes out a file of distinct canonical k-mers and theirrepetition counts (for each strand). Decoupling the building of
the consensus from the correction algorithm in this way makes itpossible to use Blue to ‘cross-correct’ read datasets, such as using
a large and inexpensive Illumina dataset to correct a smaller,more expensive but longer set of 454 reads. This style of cross-correction results in a 454 dataset that conforms to the consensus
found in the Illumina data, effectively generating long Illuminareads that can be used to great effect in assemblies and whenfinishing genomes.
Repetitive regions in genomes, including ribosomes, trans-posons and shared regulatory sequences, are challenging for allerror correction algorithms. Reads that cross the boundaries of
these repeated regions may be erroneously ‘corrected’, as thechange in depth of coverage at their edges may look verymuch like an error. The choice of which possible fix is correct
(including doing nothing) really depends on context, and cannotsimply be decided purely by considering a single k-mer or similarshort sequence in isolation. Blue addresses this problem by eval-
uating alternative fixes in the context of the read being corrected.The metrics computed for every alternative reflect the impact
that each one would have on the rest of the read––will this fixget us to the end of the read with no (or few) additional fixes, orwill we have to effectively rewrite much of the rest of the read? It
does this by recursively exploring the tree of potential correctedreads.The next section discusses the approach we took to testing
Blue’s performance and effectiveness, and comparing it withother published tools. Section 3 describes the Blue error correc-tion algorithm, and Section 4 discusses the results of the perform-
ance and effectiveness tests. Section 5 discusses future work andpossible improvements.
2 SYSTEM AND METHODS
The comparative performance and effectiveness studies described
in Section 4 of this article were initially based on the work re-ported in the survey paper by Yang et al. We chose the same setof tools for our evaluations, except that we dropped the poorly
ranked SOAPec (Li, 2010) and added SHREC, BLESS andRACER. The final set of tools we used in our comparisonswere BLESS (Heo et al., 2014), Coral (Salmela and Schroder,
2011), Echo (Kao et al., 2011), HiTEC (Ilie et al., 2011),HSHREC (Salmela, 2010), Quake (Kelley et al., 2010),RACER (Ilie and Molnar, 2013), Reptile (Yang et al., 2010)
and SHREC (Schroder et al., 2009).
0.0%
0.5%
1.0%
1.5%
2.0%
2.5%
3.0%
3.5%
4.0%
0 50 100 150 200
% o
f al
l 25-
mer
s
25-mer repe��on depth
Fig. 3. 25-mer repetition histogram for Homo sapiens (4 HiSeq lanes)
0.0%
0.5%
1.0%
1.5%
2.0%
2.5%
3.0%
3.5%
4.0%
4.5%
0 50 100 150 200
% o
f al
l 25-
mer
s
25-mer repe��on depth
Fig. 2. 25-mer repetition histogram for Helicoverpa armigera
0.0%
0.5%
1.0%
1.5%
2.0%
2.5%
3.0%
3.5%
4.0%
0 100 200 300 400
% o
f al
l 25-
mer
s
25-mer repe��on depth
Fig. 1. 25-mer repetition histogram for Clostridium sporogenes PA3679
2724
P.Greenfield et al.
by guest on June 5, 2016http://bioinform
atics.oxfordjournals.org/D
ownloaded from
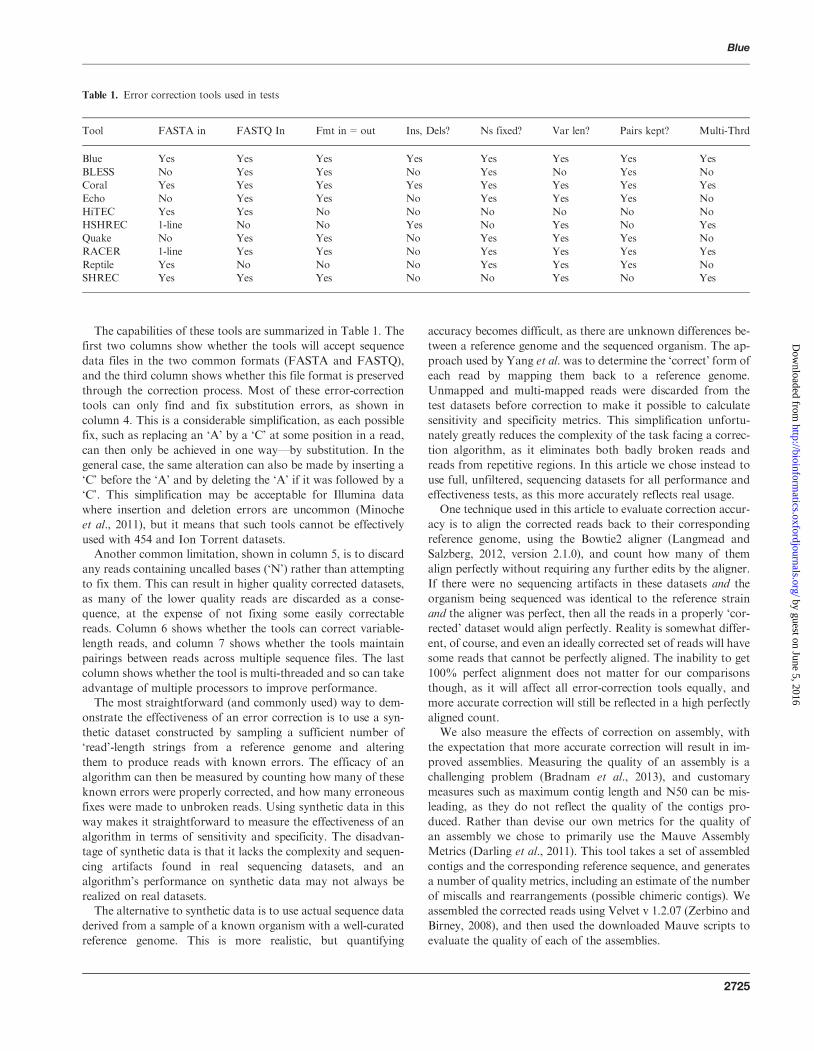
The capabilities of these tools are summarized in Table 1. The
first two columns show whether the tools will accept sequence
data files in the two common formats (FASTA and FASTQ),
and the third column shows whether this file format is preserved
through the correction process. Most of these error-correction
tools can only find and fix substitution errors, as shown in
column 4. This is a considerable simplification, as each possible
fix, such as replacing an ‘A’ by a ‘C’ at some position in a read,
can then only be achieved in one way––by substitution. In the
general case, the same alteration can also be made by inserting a
‘C’ before the ‘A’ and by deleting the ‘A’ if it was followed by a
‘C’. This simplification may be acceptable for Illumina data
where insertion and deletion errors are uncommon (Minoche
et al., 2011), but it means that such tools cannot be effectively
used with 454 and Ion Torrent datasets.Another common limitation, shown in column 5, is to discard
any reads containing uncalled bases (‘N’) rather than attempting
to fix them. This can result in higher quality corrected datasets,
as many of the lower quality reads are discarded as a conse-
quence, at the expense of not fixing some easily correctable
reads. Column 6 shows whether the tools can correct variable-
length reads, and column 7 shows whether the tools maintain
pairings between reads across multiple sequence files. The last
column shows whether the tool is multi-threaded and so can take
advantage of multiple processors to improve performance.The most straightforward (and commonly used) way to dem-
onstrate the effectiveness of an error correction is to use a syn-
thetic dataset constructed by sampling a sufficient number of
‘read’-length strings from a reference genome and altering
them to produce reads with known errors. The efficacy of an
algorithm can then be measured by counting how many of these
known errors were properly corrected, and how many erroneous
fixes were made to unbroken reads. Using synthetic data in this
way makes it straightforward to measure the effectiveness of an
algorithm in terms of sensitivity and specificity. The disadvan-
tage of synthetic data is that it lacks the complexity and sequen-
cing artifacts found in real sequencing datasets, and an
algorithm’s performance on synthetic data may not always be
realized on real datasets.The alternative to synthetic data is to use actual sequence data
derived from a sample of a known organism with a well-curated
reference genome. This is more realistic, but quantifying
accuracy becomes difficult, as there are unknown differences be-
tween a reference genome and the sequenced organism. The ap-
proach used by Yang et al. was to determine the ‘correct’ form of
each read by mapping them back to a reference genome.
Unmapped and multi-mapped reads were discarded from the
test datasets before correction to make it possible to calculate
sensitivity and specificity metrics. This simplification unfortu-
nately greatly reduces the complexity of the task facing a correc-
tion algorithm, as it eliminates both badly broken reads and
reads from repetitive regions. In this article we chose instead to
use full, unfiltered, sequencing datasets for all performance and
effectiveness tests, as this more accurately reflects real usage.One technique used in this article to evaluate correction accur-
acy is to align the corrected reads back to their corresponding
reference genome, using the Bowtie2 aligner (Langmead and
Salzberg, 2012, version 2.1.0), and count how many of them
align perfectly without requiring any further edits by the aligner.
If there were no sequencing artifacts in these datasets and the
organism being sequenced was identical to the reference strain
and the aligner was perfect, then all the reads in a properly ‘cor-
rected’ dataset would align perfectly. Reality is somewhat differ-
ent, of course, and even an ideally corrected set of reads will have
some reads that cannot be perfectly aligned. The inability to get
100% perfect alignment does not matter for our comparisons
though, as it will affect all error-correction tools equally, and
more accurate correction will still be reflected in a high perfectly
aligned count.We also measure the effects of correction on assembly, with
the expectation that more accurate correction will result in im-
proved assemblies. Measuring the quality of an assembly is a
challenging problem (Bradnam et al., 2013), and customary
measures such as maximum contig length and N50 can be mis-
leading, as they do not reflect the quality of the contigs pro-
duced. Rather than devise our own metrics for the quality of
an assembly we chose to primarily use the Mauve Assembly
Metrics (Darling et al., 2011). This tool takes a set of assembled
contigs and the corresponding reference sequence, and generates
a number of quality metrics, including an estimate of the number
of miscalls and rearrangements (possible chimeric contigs). We
assembled the corrected reads using Velvet v 1.2.07 (Zerbino and
Birney, 2008), and then used the downloaded Mauve scripts to
evaluate the quality of each of the assemblies.
Table 1. Error correction tools used in tests
Tool FASTA in FASTQ In Fmt in=out Ins, Dels? Ns fixed? Var len? Pairs kept? Multi-Thrd
Blue Yes Yes Yes Yes Yes Yes Yes Yes
BLESS No Yes Yes No Yes No Yes No
Coral Yes Yes Yes Yes Yes Yes Yes Yes
Echo No Yes Yes No Yes Yes Yes No
HiTEC Yes Yes No No No No No No
HSHREC 1-line No No Yes No Yes No Yes
Quake No Yes Yes No Yes Yes Yes No
RACER 1-line Yes Yes No Yes Yes Yes Yes
Reptile Yes No No No Yes Yes Yes No
SHREC Yes Yes Yes No No Yes No Yes
2725
Blue
by guest on June 5, 2016http://bioinform
atics.oxfordjournals.org/D
ownloaded from
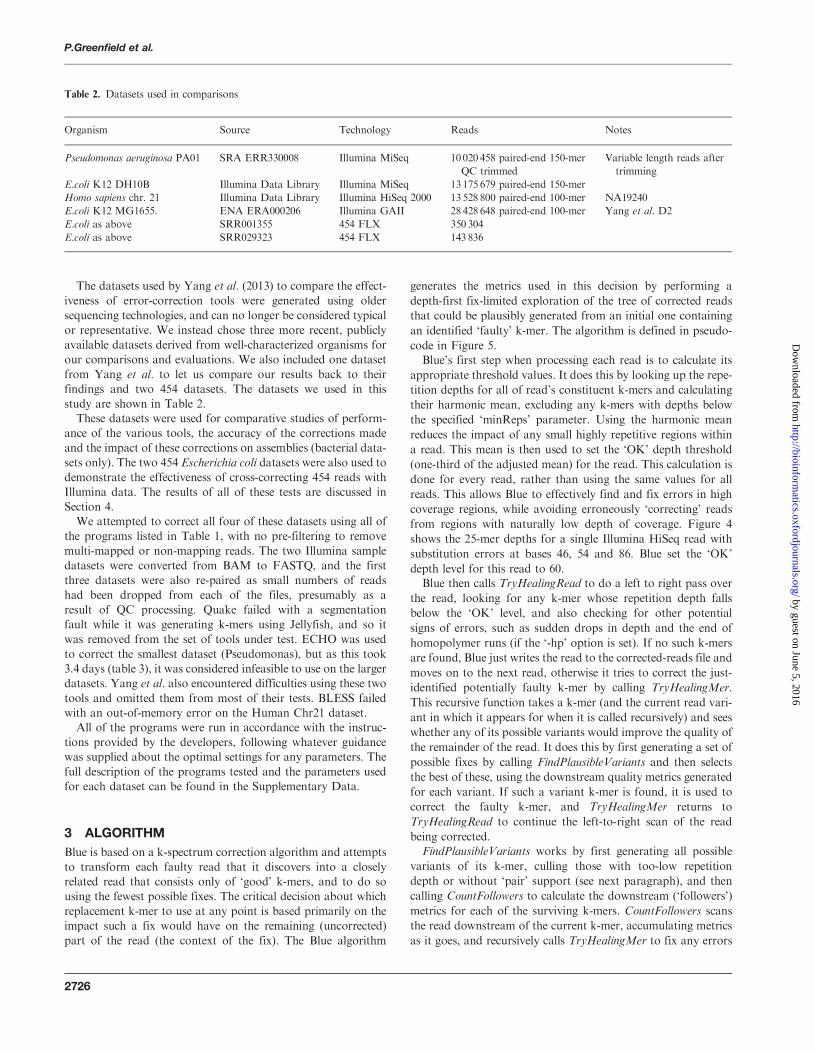
The datasets used by Yang et al. (2013) to compare the effect-
iveness of error-correction tools were generated using older
sequencing technologies, and can no longer be considered typical
or representative. We instead chose three more recent, publicly
available datasets derived from well-characterized organisms for
our comparisons and evaluations. We also included one dataset
from Yang et al. to let us compare our results back to their
findings and two 454 datasets. The datasets we used in this
study are shown in Table 2.These datasets were used for comparative studies of perform-
ance of the various tools, the accuracy of the corrections made
and the impact of these corrections on assemblies (bacterial data-
sets only). The two 454 Escherichia coli datasets were also used to
demonstrate the effectiveness of cross-correcting 454 reads with
Illumina data. The results of all of these tests are discussed in
Section 4.
We attempted to correct all four of these datasets using all of
the programs listed in Table 1, with no pre-filtering to remove
multi-mapped or non-mapping reads. The two Illumina sample
datasets were converted from BAM to FASTQ, and the first
three datasets were also re-paired as small numbers of reads
had been dropped from each of the files, presumably as a
result of QC processing. Quake failed with a segmentation
fault while it was generating k-mers using Jellyfish, and so it
was removed from the set of tools under test. ECHO was used
to correct the smallest dataset (Pseudomonas), but as this took
3.4 days (table 3), it was considered infeasible to use on the larger
datasets. Yang et al. also encountered difficulties using these two
tools and omitted them from most of their tests. BLESS failed
with an out-of-memory error on the Human Chr21 dataset.
All of the programs were run in accordance with the instruc-
tions provided by the developers, following whatever guidance
was supplied about the optimal settings for any parameters. The
full description of the programs tested and the parameters used
for each dataset can be found in the Supplementary Data.
3 ALGORITHM
Blue is based on a k-spectrum correction algorithm and attempts
to transform each faulty read that it discovers into a closely
related read that consists only of ‘good’ k-mers, and to do so
using the fewest possible fixes. The critical decision about which
replacement k-mer to use at any point is based primarily on the
impact such a fix would have on the remaining (uncorrected)
part of the read (the context of the fix). The Blue algorithm
generates the metrics used in this decision by performing a
depth-first fix-limited exploration of the tree of corrected reads
that could be plausibly generated from an initial one containing
an identified ‘faulty’ k-mer. The algorithm is defined in pseudo-
code in Figure 5.Blue’s first step when processing each read is to calculate its
appropriate threshold values. It does this by looking up the repe-
tition depths for all of read’s constituent k-mers and calculating
their harmonic mean, excluding any k-mers with depths below
the specified ‘minReps’ parameter. Using the harmonic mean
reduces the impact of any small highly repetitive regions within
a read. This mean is then used to set the ‘OK’ depth threshold
(one-third of the adjusted mean) for the read. This calculation is
done for every read, rather than using the same values for all
reads. This allows Blue to effectively find and fix errors in high
coverage regions, while avoiding erroneously ‘correcting’ reads
from regions with naturally low depth of coverage. Figure 4
shows the 25-mer depths for a single Illumina HiSeq read with
substitution errors at bases 46, 54 and 86. Blue set the ‘OK’
depth level for this read to 60.Blue then calls TryHealingRead to do a left to right pass over
the read, looking for any k-mer whose repetition depth falls
below the ‘OK’ level, and also checking for other potential
signs of errors, such as sudden drops in depth and the end of
homopolymer runs (if the ‘-hp’ option is set). If no such k-mers
are found, Blue just writes the read to the corrected-reads file and
moves on to the next read, otherwise it tries to correct the just-
identified potentially faulty k-mer by calling TryHealingMer.
This recursive function takes a k-mer (and the current read vari-
ant in which it appears for when it is called recursively) and sees
whether any of its possible variants would improve the quality of
the remainder of the read. It does this by first generating a set of
possible fixes by calling FindPlausibleVariants and then selects
the best of these, using the downstream quality metrics generated
for each variant. If such a variant k-mer is found, it is used to
correct the faulty k-mer, and TryHealingMer returns to
TryHealingRead to continue the left-to-right scan of the read
being corrected.FindPlausibleVariants works by first generating all possible
variants of its k-mer, culling those with too-low repetition
depth or without ‘pair’ support (see next paragraph), and then
calling CountFollowers to calculate the downstream (‘followers’)
metrics for each of the surviving k-mers. CountFollowers scans
the read downstream of the current k-mer, accumulating metrics
as it goes, and recursively calls TryHealingMer to fix any errors
Table 2. Datasets used in comparisons
Organism Source Technology Reads Notes
Pseudomonas aeruginosa PA01 SRA ERR330008 Illumina MiSeq 10020 458 paired-end 150-mer
QC trimmed
Variable length reads after
trimming
E.coli K12 DH10B Illumina Data Library Illumina MiSeq 13175 679 paired-end 150-mer
Homo sapiens chr. 21 Illumina Data Library Illumina HiSeq 2000 13528 800 paired-end 100-mer NA19240
E.coli K12 MG1655. ENA ERA000206 Illumina GAII 28428 648 paired-end 100-mer Yang et al. D2
E.coli as above SRR001355 454 FLX 350 304
E.coli as above SRR029323 454 FLX 143 836
2726
P.Greenfield et al.
by guest on June 5, 2016http://bioinform
atics.oxfordjournals.org/D
ownloaded from

that are encountered along the way. The effect of recursively
calling TryHealingMer in this way is a depth-first exploration
of the tree of possible reads generated by all the possible correc-
tions of the current ‘faulty’ k-mer (and any further errors en-
countered to its right).
The tree exploration is error-limited to reduce its computa-
tional cost, and only a small number of fixes (three) are allowed
along any one path before its exploration is abandoned and its
current metrics returned for comparison. A worked example of
the tree exploration process can be found in the Supplementary
Data (Section 1).Blue can also make use of k-mer ‘pairs’ to further prune non-
viable paths, improving both accuracy and performance. Pairs
are two separated shorter k-mers (currently 16-mers with a read-
length-dependent gap) and are generated by tiling a set of reads,
using the consensus k-mer table generated by Tessel to cull those
pairs containing likely errors. Pairs provide some 50-end context
for each possible replacement k-mer, and improve correction in a
few cases where a k-mer looks to be ‘correct’ but actually appears
in a different genomic context.
One effect of the sequential nature of the scanning loop in
TryHealingRead is that FindPlausibleVariants usually only has
to generate variants of the last base in its current k-mer, as
all the other variants were considered in the preceding k-mers.
This simplification greatly reduces the number of variants that
Table 3. Performance of correction algorithms under test
Dataset Tool Thrds Prep. time
(min)
Correct. time
(min)
Prep. mem
(GB)
Correct. mem
(GB)
Reads/min
(elapsed)
ERA000206 28428 648 reads Blue 8 9.2 14.4 1.6 0.4 1 205 455
BLESS 1 140.7 0.1 202 052
Coral 8 1595.6 39.0 17 817
HiTEC 1 699.0 13.4 40 670
HSHREC 8 737.1 30.5 38 568
RACER 8 30.6 2.4 929 041
Reptile 1 125.0 417.0 3.0 3.8 68 174
SHREC 8 225.1 30.0 126 293
Pseudomonas 9 859 280
reads (var len, 150bp)
Blue 8 5.4 6.3 1.3 0.4 843 876
BLESSa 1 48.3 0.1 204 126
Coral 8 437.0 11.0 22 561
Echo 1 4934.8 19.0 1998
HiTECa 1 319.4 9.9 30 868
HSHREC 8 329.0 30.0 29 967
RACER 8 16.9 1.6 583 389
Reptile 1 45.1 132.0 4.2 2.6 55 686
SHREC 8 113.7 17.0 86 691
Chr21 13 486136 reads Blue 8 6.6 6.5 2.1 2.6 1 031 576
Coral 8 132.5 11.0 101 782
HiTEC 1 414.0 12.0 32 575
RACER 8 15.8 2.6 853 553
Reptile 1 54.1 194.7 3.6 4.2 54 198
SHREC 8 113.4 21.0 118 978
DH10B 13 051484 reads Blue 8 6.7 9.3 1.3 0.3 815 548
BLESS 1 94.3 0.1 138 404
Coral 8 1223.0 12.0 10 672
HiTEC 1 510.0 9.7 25 591
RACER 8 21.9 1.2 595 958
Reptile 1 59.0 150.4 3.6 3.0 62 328
SHREC 8 146.8 21.0 88 907
a(8812148 reads, 120bp fixed len).
Fig. 4. 25-mer depths for an Illumina read
2727
Blue
by guest on June 5, 2016http://bioinform
atics.oxfordjournals.org/D
ownloaded from

need to be considered at each decision point, as only three sub-
stitutions, four insertions and one deletion are ever possible at
this last base position. Two variants are allowed in the first k-mer
to improve the chances of getting a ‘good’ k-mer to start the
sequential error correction process. If the beginning of the read
remains uncorrected after TryHealingRead has completed its ini-
tial pass, the read is reversed and TryHealingRead is called again
to try correct into the (previous) start of the read from the ‘good’
middle of the read. Another benefit of the incremental correction
loop in TryHealingRead is that any number of errors can be
corrected in a single pass over a read, even sequential errors in
most cases.
4 IMPLEMENTATION AND RESULTS
4.1 Time and space requirements
The resource requirements of the error-correction algorithms in
our panel was measured by using them all to correct each of the
four test datasets, and recording how long each one took to
complete each correction run (‘elapsed’ time), and how much
memory they required while running. The comparative perform-
ance of each of the algorithms is shown in Table 3. The numbers
shown in this table for ERA000206 correspond well to the per-
formance results shown for ‘D2’ in (Yang et al., 2013).The performance tests were run on a quad-processor Intel E5-
4640 machine with 32 cores of 2.4GHz and 512 GB of memory
running Ubuntu Linux. Blue and its associated tools were run
under Mono 2.10.8.1 (using the sgen garbage collector). All tools
were asked to run with eight threads if possible. HiTEC, BLESS
and Reptile are single-threaded, and Echo is almost entirely
single-threaded. The ‘preparation’ times shown for Reptile in-
clude the time needed to convert the original FASTQ files into
the required FASTA-like format, and the two runs of the sup-
plied ‘seq-analy’ program needed to determine the appropriate
parameter values. The ‘preparation’ times shown for Blue in-
clude the time taken to produce both the k-mer consensus
tables and histograms, and the ‘pairs’ file. Repeated runs of
Blue over the same dataset, varying the––min or––good param-
eters, can be done without rerunning these preparatory steps.
Echo was only used on the Pseudomonas dataset, due to the
limited time available to run these tests. HSHREC was not
used for all tests because of its poor results (Fig. 7). HiTEC
and BLESS can only accept fixed length reads so the
Pseudomonas tests were done using a trimmed set of 120 bp
reads, and these two tools are not reported in the
Pseudomonas alignments tests as a result.Blue’s correction speed is determined primarily by the average
number of errors per read, rather than the depth of coverage or
number of reads. Blue’s memory is primarily used to hold the
k-mer consensus and pairs tables, with smaller amounts of per-
thread memory used for buffers and working storage. Low-repe-
tition k-mers and pairs (below the depth specified by the ‘-min’
parameter) are not loaded into the tables, and as a result, the
memory needed to hold these tables is largely determined by the
length of the underlying genome, with slightly over one k-mer
and one pair typically needed for each base in the genome.
Blue’s memory requirements do not increase with the size of
the datasets being corrected. Scaling tests have shown that Blue
is capable of handling large datasets. The histogram shown in
Figure 3 came from tiling 1.7 billion Illumina HiSeq 101-mer
reads (four full lanes, ERR091571 through ERR091574), and
took 6.5h (with 16 cores) and used 84 GB of memory, with
the files on a remote NFS server. Blue was then used to correct
these same four datasets, taking 14.7 h and 67 GB of memory.Overall, these results show that Blue is both fast and highly
scalable, making it quick and effective to use on smaller datasets
and feasible to use for correcting large datasets.
4.2 Accuracy on Illumina data
As discussed in Section 2, one test we used for assessing the
accuracy of each of the correction tools was to align the cor-
rected reads against the appropriate reference sequence using the
Bowtie2 aligner, and then compare how many of the reads could
be aligned with how many alterations. The full results of aligning
the datasets resulting from correcting our four test datasets with
the tools in our panel can be found in the Supplementary Data.Figures 6–8 summarize these alignment results for three of the
datasets, showing the number of edits Bowtie2 needed to get each
corrected read to align to the reference genome, and how many
reads the correction tools discarded in getting to their set of
Fig. 5. The Blue error-correction algorithm
2728
P.Greenfield et al.
by guest on June 5, 2016http://bioinform
atics.oxfordjournals.org/D
ownloaded from

‘corrected’ reads. The floating numbers on the stacked bars show
what percentage of the reads could be aligned with no edits. This
number is our primary measure of the accuracy of the various
correction algorithms. Before any correction, �70–75% of the
starting reads from these three datasets could be aligned to their
reference genomes without Bowtie2 needing to make any edits.
All the correction tools, except for HSHREC, produced im-
provements in the overall quality of the reads, as shown by the
increases in the percentage of perfectly aligned reads. Blue gave
the best results for all four tests, with 98.6–99.4% of all reads
aligning with no mismatches for the three bacterial samples.
BLESS, HiTEC and RACER were the next most accurate on
these alignment tests.
Even with perfect correction, not all corrected reads will align
exactly, reflecting sequencing artifacts in the data (such as con-
catenated adapters and chimeric reads), and novel regions in the
sequenced organisms. The ‘good’ option in Blue attempts to im-
prove the overall quality of the corrected dataset by discarding
those reads that still have ‘poor’ k-mers after correction. The
effects of this option can be seen in the ‘g90%’ alignment results,
with 99.9% of the DH10B reads, 99.7% of the Pseudomonas
reads and 99.9% of the MG1655 reads, now aligning exactly.One benefit of using bacterial datasets for this comparison is
that it is possible to get sequence data from an organism that is
closely related to the one used to compile the corresponding
reference genome. This situation does not apply for human
data, and this is reflected in the overall lower unpaired alignment
numbers shown in Figure 8. Correction still produces an im-
provement in the number of exactly aligning reads for this data-
set, with Blue getting a 20% improvement over the uncorrected
data. There are still �15% of reads that require adjustment
before they can be aligned to the HG19 reference genome, and
some of these can be expected to reflect actual variation between
the person whose DNA was sequenced and the reference genome
sequence. We also did paired Bowtie 2 alignments for the
Pseudomonas and Human Chr 21 datasets, and the results can
be found in the Supplementary Data.
4.3 Accuracy on 454 data and cross-correction
Blue, along with Coral and HSHREC, can correct all three types
of possible errors (substitutions, insertions and deletions). We
tested this capability by correcting two 454 datasets
(SRR001355 and SRR029323) from E.coli K12 MG1655, and
then aligning the corrected reads using both Bowtie (Langmead
et al., 2009) and Bowtie 2. The full results of these tests can be
found in the Supplementary Data and Figure 9 summarises the
74.8%
99.5% 99.9% 99.9% 98.2%
85.7%
96.9%88.0%
97.1% 94.9%
0%
10%
20%
30%
40%
50%
60%
70%
80%
90%
100%
110%DiscardUnalign10+9876543210
Fig. 6. Escherichia coli K12 DH10B alignments
69.0%
83.3% 85.2% 85.5%80.0% 81.7%
75.0%81.6% 80.6%
0%
10%
20%
30%
40%
50%
60%
70%
80%
90%
100%
110%DiscardUnalign10+9876543210
Fig. 8. Human Chr 21 alignments
69.8%
98.7% 99.6% 99.7%
88.5% 87.9%
3.4%
95.2%
77.7%
91.6%
0%
10%
20%
30%
40%
50%
60%
70%
80%
90%
100%
110%DiscardUnalign10+9876543210
Fig. 7. Pseudomonas aeruginosa alignments
Fig. 9. MG1655 454 Bowtie 2 alignment (SRR029323)
2729
Blue
by guest on June 5, 2016http://bioinform
atics.oxfordjournals.org/D
ownloaded from

Bowtie 2 results for the poorer quality and smaller SRR029323
dataset. The Bowtie results are included in the Supplementary
Data to show how well the various correction algorithms handle
insertion and deletion errors, as this aligner is only capable of
making substitution adjustments when it maps a read to a refer-
ence genome, so reads with uncorrected insertion and deletion
errors will often not be aligned at all. All of the Blue 454 correc-
tion runs used the ‘-hp’ option, which increases Blue’s ability to
detect errors at the end of homopolymer runs.As discussed earlier, Blue’s recursive exploration of the tree of
potential fixes is depth-limited for performance reasons, and this
can result in the partial correction of long reads containing many
errors. Rerunning Blue over already-corrected reads will result in
better results in this case, as shown by the ‘x2’ results. Both Coral
and HSHREC already perform multiple iterations over the
reads, so these programs were not run more than once.The ability of Blue to ‘cross-correct’ reads is demonstrated by
correcting this 454 dataset with the k-mer consensus table gen-
erated from the ERA000206 Illumina dataset, using a ‘-min’ par-
ameter value derived from the Illumina data. The various ‘206’
results in the figure show how effective this cross-correction can
be, with 99.3% of the SRR029323 454 reads aligning exactly
after two rounds of correction and then discarding any remain-
ing not ‘good’ reads.
4.4 Effects on assembly
The second part of our accuracy/effectiveness testing is to meas-
ure the improvements that the various error-correction tools
have on assembly, with the expectation that higher quality
data going into an assembler would result in longer contigs
and fewer errors. As discussed in Section 2, we did this by assem-
bling the sets of corrected reads for all three bacterial datasets
(except for HSHREC), and using the Mauve Assembly Metrics
(Darling et al., 2011) to generate metrics on the quality of the
resulting contigs. These metrics were supplemented by using
NCBI BLASTN to determine the length of the largest contigu-
ous matching region when the assembled contigs were aligned
against their reference sequence. All of the sets of reads were
assembled using Velvet v1.2.07. We also ran a number of assem-
blies that combined 454 and Illumina data. For comparison, we
also generated perfect synthetic datasets for each of the bacterial
genomes by tiling their reference genomes, and ran these error-
free reads through the same assembly and comparison steps.
All assemblies were run using Velvet ‘hash_length’ values of
both 41 and 57, and the expected coverage cutoff parameters
were set after examining the k-mer histograms produced by
Tessel for the uncorrected data. The Velvet paired-end option
(‘shortPaired’) was used whenever the correction tool had not
irreparably broken the read pairing that existed in the original
datasets. The exact parameter values used for the Velvet runs can
be found in the Supplementary Data, along with the full results
from all of these tests. The ‘max align’ values in these charts and
tables is the length of the largest contiguous matching region.
The test statistics for the two MiSeq datasets are summarized in
Figures 10 and 11, and the full set of results can be found in the
Supplementary Data.The Blue-corrected reads consistently produce the best overall
assemblies, producing the longest contigs with the fewest errors,
for all the datasets. The differences in contig quality is shown by
the error density plots (in Fig. 12 and the Supplementary Data)
that show locations in the reference genome (1 kb intervals)
where the Mauve tool found at least one mismatch. Some of
these mismatches will be actual differences between the organism
being sequenced and the reference sequence, and other will reflect
artifacts introduced by either the assembler or Mauve, as evi-
denced by mismatches reported in the assemblies of the perfect
synthetic data.The benefits of cross-correcting can be seen in the results from
the combined assembly of the Blue-corrected ERA000206
(Illumina) and SRR001355 (454) reads. The lower part of the
error density plot in Figure 12 shows clearly the effect of cross-
correction on the quality of the resultant contigs, with only 16
intervals now showing mismatches.
5 DISCUSSION
The primary goal in the development of Blue was to create a
practical tool that would help biologists get more accurate results
from their sequencing datasets. Blue had to be sufficiently fast
and memory-efficient to allow it to correct today’s large datasets
using reasonable resources, and effectively transparent so it could
be used within existing analytical workflow tools such as Galaxy,
just taking in a sequencing dataset and writing it out again after
removing as many errors as possible while maintaining file for-
mats, quality scores and read pairings.
Fig. 10. Pseudomonas assembly metrics (Vk=41)
Fig. 11. Escherichia coli DH10B assembly metrics (Vk=41)
2730
P.Greenfield et al.
by guest on June 5, 2016http://bioinform
atics.oxfordjournals.org/D
ownloaded from

Our tests have shown that Blue meets these goals. It is faster
than the other algorithms tested, and its low memory require-
ments make it practical to use with current large sequencing
datasets. Blue has been shown to be more accurate than any of
the other algorithms we tested on both Illumina and 454 data.
The assembly tests showed that Blue-corrected reads consistently
produced the longest and most error-free contigs of all the tools
tested. Blue’s ability to correct insertion and deletion errors
allows it to be used with great effect on datasets generated on
the 454 and Ion Torrent platforms. Decoupling the reads being
corrected from the set of reads used to generate the k-mer con-
sensus table allows for cross-correcting long homopolymer-prone
reads with short but cheaper Illumina reads, resulting in even
better correction of these datasets.Blue has already been used to improve the assemblies for pub-
lished microbial genomes derived from pure cultures (Bradbury
et al., 2012; Rosewarne et al., 2013a). It has also been used on
metagenomic datasets to improve draft genome assemblies of the
dominant organisms in these communities (Rosewarne et al.,
2013b; Wang et al., 2011). Correcting metagenomic sequence
datasets works only when the dominant organisms are taxonom-
ically distant, and so share few k-mers (Greenfield and Roehm,
2013). In this case, correcting the reads has the useful side effect
of removing rare variants of the dominant organisms, giving
both better assemblies and improving the performance of the
assemblers themselves. Blue has also been successfully used on
diploid data, both human and insect. Blue is currently being used
on a major insect genome project, and its ability to cross-correct
long-mate-pair 454 reads with Illumina data have proven to be
useful to this team.Blue will continue to be tested and refined on new types of
sequencing data as these emerge, with an immediate focus on
PacBio. Another area of anticipated work is improving the cor-
rection of diploid data at those places where differences between
the two alleles cause difficulties for assemblers.
ACKNOWLEDGEMENTS
This work started with the support (and data) of Torsten
Thomas at the University of NSW. It has been made possible
with the support of colleagues in CSIRO Animal, Food and
Health Sciences, especially Jason Ross, Gary Hannan, David
Midgley, Phil Hendry, Nai Tran and Dongmei Li. Mike
Buckley from CSIRO Computational Informatics has provided
valuable advice on the statistical aspects of Blue’s design. The
authors thank Joel Armstrong, Bill James and Tom Walsh for
the provision of insect material for Figure 2. The underlying data
were produced by the Helicoverpa Genome Consortium and
sequenced at the Baylor College of Medicine.
Funding: This work was funded by the CSIRO Transformational
Biology Capability Platform (TBCP). The TBCP also provided
funding for the Helicoverpa genome project.
Conflict of Interest: none declared.
REFERENCES
Bradbury,M. et al. (2012) Draft genome sequence of Clostridium sporogenes PA
3679, the common nontoxigenic surrogate for proteolytic Clostridium botu-
linum. J. Bacteriol., 194, 1631–1632.
Bradnam,K.R. et al. (2013) Assemblathon 2: evaluating de novo methods of
genome assembly in three vertebrate species. GigaScience, 2, 10.
Darling,A. et al. (2011) Mauve assembly metrics. Bioinformatics, 27, 2756–2757.
Glenn,T.C. (2011) Field guide to next-generation sequencers.Mol. Ecol. Resour., 11,
759–769.
Greenfield,P. and Roehm,U. (2013) Answering biological questions by querying
k-mer databases. Concur. Comput., 25, 497–509.
Heo,Y. et al. (2014) BLESS: bloom filter-based error correction solution for high-
throughput sequencing reads. Bioinformatics, 30, 1354–1362.
Ilie,L. et al. (2011) HiTEC: accurate error correction in high-throughput sequencing
data. Bioinformatics, 27, 295–302.
Ilie,L. and Molnar,M. (2013) RACER: rapid and accurate correction of errors in
reads. Bioinformatics, 29, 2490–2493.
Kao,W.-C. et al. (2011) ECHO: a reference-free short-read error correction algo-
rithm. Genome Res., 21, 1181–1192.
Kelley,D.R. et al. (2010) Quake: quality-aware detection and correction of sequen-
cing errors. Genome Biol., 11, R116.
Langmead,B. and Salzberg,S.L. (2012) Fast gapped-read alignment with Bowtie 2.
Nat. Methods., 9, 357–359.
Langmead,B. et al. (2009) Ultrafast and memory-efficient alignment of short DNA
sequences to the human genome. Genome Biol., 10, R25.
Li,H. and Durbin,R. (2010) Fast and accurate long-read alignment with Burrows-
Wheeler transform. Bioinformatics, 26, 589–595.
Li,R. et al. (2010) De novo assembly of human genomes with massively parallel
short read sequencing. Genome Res., 20, 265–272.
Fig. 12. Error density for ERA000206 assemblies (Vk=41)
2731
Blue
by guest on June 5, 2016http://bioinform
atics.oxfordjournals.org/D
ownloaded from

Loman,N. et al. (2012) Performance comparison of benchtop high-throughput
sequencing platforms. Nat. Biotechnol., 30, 434–439.
Minoche,A.E. et al. (2011) Evaluation of genomic high-throughput sequencing data
generated on Illumina HiSeq and Genome Analyzer systems. Genome Biol., 12,
R112.
Nakamura,K. et al. (2011) Sequence-specific error profile of Illumina sequencers.
Nucleic Acids Res., 39, e90.
Rosewarne,C.P. et al. (2013a) Draft genome sequence of Clostridium sp.
Maddingley, isolated from coal seam gas formation water. Genome Announc.,
1, e00081–e000812.
Rosewarne,C.P. et al. (2013b) Draft genome sequence of Methanobacterium sp.
Maddingley, reconstructed from metagenomic sequencing of a methanogenic
microbial consortium enriched from coal-seam gas formation water. Genome
Announc., 1, e00082–e000812.
Salmela,L. (2010) Correction of sequencing errors in a mixed set of reads.
Bioinformatics, 26, 1284–1290.
Salmela,L. and Schroder,J. (2011) Correcting errors in short reads by multiple
alignments. Bioinformatics, 27, 1455–1461.
Schroder,J. et al. (2009) SHREC: a short-read error correction method.
Bioinformatics, 25, 2157–2163.
Yang,X. et al. (2010) Reptile: representative tiling or short read error correction.
Bioinformatics, 26, 2526–2533.
Yang,X. et al. (2013) A survey of error-correction methods for next-generation
sequencing. Brief. Bioinform., 14, 56–66.
Wang,X. et al. (2011) Complete genome sequence of a nonculturable methanococ-
cus maripaludis strain extracted in a metagenomic survey of petroleum reservoir
fluids. J. Bacteriol., 193, 5595.
Zerbino,D. and Birney,E. (2008) Velvet: algorithms for de novo short read assembly
using de Bruijn graphs. Genome Res., 18, 821–829.
P.Greenfield et al.
2732
by guest on June 5, 2016http://bioinform
atics.oxfordjournals.org/D
ownloaded from